Embed Size (px)
Citation preview
DRAFT ENVIRONMENTAL IMPACT
ASSESSMENT AND EMP REPORT
FOR
MOLASSES BASED 30 KLPD DISTILLERY PLANT
WITH COGENERATION POWER PLANT (1 MW)
AT
SURVEY NO. : 574, 575, 576, 579, 580, 583, 164 – 174, 179, 180 AT
POST GOLAN - DADARIYA, TAL. – VALOD, DIST. – TAPI
(394630), GUJARAT
PROJECT CATEGORY: A, 5(g) - DISTILLERIES
STUDY PERIOD: MARCH, 2019 TO MAY, 2019
PROJECT PROPONENT:
COPER CO-OPERATIVE SUGAR LIMITED
PREPARED BY:
en-VISION ENVIRO TECHNOLOGIES PVT. LTD.
3rd
Floor, Shri Ram Complex, Above Bank of India,
Near Kargil Chowk, Surat – Dumas Road,
Piplod, Surat – 395 007, Gujarat.
Phone No.: (0261) 2223003, 2224004
Email Add.: [email protected] Website: www.en-vision.in
QCI Accreditation : QCI / NABET Certificate No. NABET /EIA/1821/RA 0102
July – 2019
Report no. 190708_RP29_0
en-vιsιn
COPER CO-OPERATIVE SUGAR LTD., DADRIYA, VALOD I-1
Declaration by Experts contributing to the EIA/EMP Report
For Proposed Molasses based 30 KLPD Distillery Plant with Cogeneration power Plant (1 MW) by Coper
Co-operative Sugar Ltd. (CCSL) at Survey no. : 574, 575, 576, 579, 580, 583, 164 – 174, 179, 180 at post
Golan - Dadariya, Tal. – Valod, Dist. – Tapi (394630), Gujarat
I, hereby, certify that I was a part of the EIA team in the following capacity that developed the above EIA.
EIA Coordinator
Name : Nihar Doctor
Signature and Date :
Name of Associate EIA
coordinator
: Jignesh Patel
:
Period of involvement : February – 2019 to July – 2019
Contact information : ENVISION ENVIRO TECHNOLOGIES PVT. LTD.
3rd
Floor, Shree Ram Complex, Above Bank of India,
Near Kargil Chowk, Surat-Dumas Road,
Piplod, Surat-395007, Gujarat.
Phone No.: (0261) 2223003, 2224004
E-mail: [email protected]
Website: www.en-vision.in
Functional Area Experts
Sr.
No.
Functional
Areas
Name of the
Expert/S
Involvement
(Period Task) Signature
1 AP Nihar Doctor
Period: February – 2019 to July – 2019
Site visit; technical guidance to associate EIA
coordinator and team member, verify FAE report,
Review and comment on EIA report.
2
WP
Nihar Doctor
Period: February – 2019 to July – 2019
Site visit; technical guidance to associate EIA
coordinator and team member, verify FAE report,
Review and comment on EIA report.
3 AQ Nihar Doctor
Period: June – 2019
Based on project specific emission technical guidance
to team member to run the model. Verify model
output and its interpritation, Review and comment on
EIA report.
en-vιsιn
COPER CO-OPERATIVE SUGAR LTD., DADRIYA, VALOD I-2
Sr.
No.
Functional
Areas
Name of the
Expert/S
Involvement
(Period Task) Signature
4 SE Arif Shaikh
Period: February – 2019 to July – 2019
Site visit; Understanding of project and requirement
of SE study; socioeconomic data collection;
identification of impact, Impact aspect evaluation;
guidance to FAA for preparation of mitigative
measures of project on community, preparation of
CER plan; finalization of FAE report.
5 EB Manoj
Eledath
Period: March – 2019 to May – 2019
Site visit; EB data collection; Identification of
Impacts and suggested mitigation measures;
finalization of FAE report; preparation of
conservation
6 HG Ravikant
Sharma -- --
7 GEO Ravikant
Sharma Not utilized as per Scheme --
8 SC Dr. B. K.
Patel Not utilized as per Scheme --
9 SHW Nihar Doctor
Period: February – 2019 to July – 2019
Site visit; technical guidance to associate EIA
coordinator and team member, verify FAE report,
Review and comment on EIA report.
10 N Mayur
Harsora
Period: March – 2019 to May – 2019
Identifying possible source of noise pollution at
various stages of development & operation. Impact
identification and suggesting mitigation measures;
finalization of FAE report.
11 LU Dr. Y.
Ramamohan
March – 2019 to May – 2019
Site visit; Collection of secondary data; preparation of
land use/land cover map from the satellite image
based on site visit. Identification of impacts and
suggesting mitigation measures.
12 RH Jignesh Patel
Period: February – 2019 to July – 2019
Site visit; evaluation of technical data; Identified
potential risk due to proposed activities at various
stage of development. Suggesting safety measures.
Finalization of FAE report.
en-vιsιn
COPER CO-OPERATIVE SUGAR LTD., DADRIYA, VALOD I-3
Declaration by the Head of the accredited consultant organization/ Authorized Person
I, Nihar Doctor, hereby, confirm that the above mentioned experts prepared the EIA of proposed Molasses
based 30 KLPD Distillery Plant with Cogeneration power Plant (1 MW) by Coper Co-operative Sugar Ltd.
(CCSL). “It is certified that no unethical practice like „copy and paste‟, and used external data / text
without proper acknowledgement, while preparing this EIA report”. I also confirm that the consultant
organization shall be fully accountable for any mis-leading information mentioned in this statement.
Signature :
Name : Nihar Doctor
Designation : Director
Name of the EIA consultant
organization
: Envision Enviro Technologies Pvt. Ltd.
NABET Certificate No. & Issue
Date
: NABET/EIA/1821/RA 0102 valid up to December 06, 2020
en-vιsιn
COPER CO-OPERATIVE SUGAR LTD., DADRIYA, VALOD I-4
UNDERTAKING
en-vιsιn
COPER CO-OPERATIVE SUGAR LTD., DADRIYA, VALOD I-1
TABLE OF CONTENT
CHAPTER 1 INTRODUCTION ..................................................................................................................... 1-1
1.1 Purpose of EIA ....................................................................................................................... 1-1
1.2 Project proponent ................................................................................................................... 1-1
1.3 Identification of project ......................................................................................................... 1-1
1.4 Nature of the project .............................................................................................................. 1-2
1.5 Demand Supply Gap .............................................................................................................. 1-2
1.5.1 Imports vs. Indigenous production..................................................................................... 1-2
1.6 Need of Project ...................................................................................................................... 1-3
1.7 Regulatory Frame Work ........................................................................................................ 1-3
1.7.1 Applicable CPCB‟s Guideline ........................................................................................... 1-4
1.7.2 Applicability of EIA Notification ...................................................................................... 1-5
1.8 Scope and Methodology of EIA Study .................................................................................. 1-5
1.8.1 Baseline Study ................................................................................................................... 1-5
1.8.2 Identification of Impact and Mitigation ............................................................................. 1-7
1.8.3 Environmental Management Plan ...................................................................................... 1-7
1.8.4 Additional Studies .............................................................................................................. 1-7
1.8.5 Structure of EIA Report ..................................................................................................... 1-7
CHAPTER 2 PROJECT DESCRIPTION ......................................................................................................... 2-1
2.1 Project Proponent ................................................................................................................... 2-1
2.2 Need and Nature of Project .................................................................................................... 2-1
2.3 Project Location ..................................................................................................................... 2-2
2.3.1 Layout Plan ........................................................................................................................ 2-4
2.4 Project Site History ................................................................................................................ 2-8
2.4.1 Environmental Sensitive Receptor ..................................................................................... 2-8
2.5 Salient Features ...................................................................................................................... 2-9
2.6 Magnitude of Project ........................................................................................................... 2-10
2.7 Manufacturing Process ........................................................................................................ 2-11
2.7.1 Rectified Spirit ................................................................................................................. 2-11
2.7.2 Head Spirit ....................................................................................................................... 2-11
2.7.3 Fuel Ethanol ..................................................................................................................... 2-11
2.7.4 Fusel Oil ........................................................................................................................... 2-13
2.8 Biogas Production ................................................................................................................ 2-15
2.8.1 Anaerobic Digestion Process ........................................................................................... 2-15
2.8.2 Technical Specifications for Biogas Plant ....................................................................... 2-16
2.8.3 Bio-composting ................................................................................................................ 2-18
2.9 Raw Material ........................................................................................................................ 2-21
2.9.1 Transportation of RM ...................................................................................................... 2-21
en-vιsιn
COPER CO-OPERATIVE SUGAR LTD., DADRIYA, VALOD I-2
2.10 Resource Requirement ......................................................................................................... 2-22
2.10.1 Investment ........................................................................................................................ 2-22
2.10.2 Land ................................................................................................................................. 2-22
2.10.3 Water ................................................................................................................................ 2-23
2.10.4 Fuel .................................................................................................................................. 2-26
2.10.5 Power/electricity .............................................................................................................. 2-26
2.10.6 Steam ............................................................................................................................... 2-26
2.10.7 Manpower ........................................................................................................................ 2-27
2.10.8 Utility ............................................................................................................................... 2-27
2.11 Proposed storage facility ...................................................................................................... 2-28
2.12 Wastewater Management ..................................................................................................... 2-29
2.12.1 Spent Wash (SW) ............................................................................................................. 2-29
2.12.2 Other wastewater stream .................................................................................................. 2-31
2.13 Air Emission ........................................................................................................................ 2-35
2.14 Solid/hazardous Waste ......................................................................................................... 2-35
2.15 Existing Greenbelt Area ....................................................................................................... 2-36
2.16 Existing Rain Water Harvesting System .............................................................................. 2-37
2.17 Project Schedule .................................................................................................................. 2-37
2.18 Organization structure .......................................................................................................... 2-38
CHAPTER 3 DESCRIPTION OF ENVIRONTMENT ...................................................................................... 3-1
3.1 Introduction ............................................................................................................................ 3-1
3.1.1 Objectives of Baseline Monitoring .................................................................................... 3-1
3.1.2 Study Area and Period ....................................................................................................... 3-1
3.1.3 Data Collection Methodology ............................................................................................ 3-2
3.2 Meteorological Environment ................................................................................................. 3-2
3.2.1 Climate of Study Area ....................................................................................................... 3-2
3.3 Air Environment .................................................................................................................... 3-7
3.3.1 Sampling Methodology and Analysis ................................................................................ 3-7
3.3.2 Ambient Air Monitoring Locations ................................................................................... 3-8
3.3.3 Discussion on results and its interpretation ...................................................................... 3-13
3.4 Water Environment .............................................................................................................. 3-13
3.4.1 Sampling Methodology and Analysis .............................................................................. 3-13
3.4.2 Water Monitoring Location ............................................................................................. 3-14
3.4.3 Discussion on results and its interpretation (Ground Water) ........................................... 3-23
3.4.4 Discussion on results and its interpretation (Surface Water) ........................................... 3-24
3.5 Noise Environment .............................................................................................................. 3-25
3.5.1 Noise Monitoring Locations ............................................................................................ 3-26
3.5.2 Discussion of Noise Levels .............................................................................................. 3-29
en-vιsιn
COPER CO-OPERATIVE SUGAR LTD., DADRIYA, VALOD I-3
3.5.3 Traffic Study .................................................................................................................... 3-29
3.6 Soil Environment ................................................................................................................. 3-31
3.6.1 Sampling Methodology and Analysis .............................................................................. 3-32
3.6.2 Interpretation of Soil Data ............................................................................................... 3-36
3.7 Land Environment ............................................................................................................... 3-36
3.7.1 Methodology of Study ..................................................................................................... 3-37
3.7.2 Data Used ......................................................................................................................... 3-37
3.7.3 Land Use / Land Cover Map ............................................................................................ 3-37
3.8 Hydrology ............................................................................................................................ 3-41
3.8.1 Rainfall ............................................................................................................................ 3-41
3.8.2 Geology ............................................................................................................................ 3-42
3.8.3 Geomorphology .............................................................................................................. 3-44
3.8.4 Drainage .......................................................................................................................... 3-44
3.8.5 Topography ...................................................................................................................... 3-46
3.8.6 Seismic zone .................................................................................................................... 3-46
3.8.7 Methodology for Ground Water level Measurement ....................................................... 3-47
3.9 Geo Hydrogeology ............................................................................................................... 3-49
3.9.1 Water Level ...................................................................................................................... 3-49
3.9.2 Groundwater Quality ...................................................................................................... 3-50
3.9.3 Soil ................................................................................................................................... 3-52
3.10 Ecology and Bio-diversity ................................................................................................... 3-54
3.10.1 Biological Diversity ......................................................................................................... 3-54
3.10.2 Study Period and Study area ............................................................................................ 3-54
3.10.3 Methodology .................................................................................................................... 3-54
3.11 Biodiversity of Terrestrial Environment .............................................................................. 3-56
3.11.1 Habitats (Project Site and its Immediate Surroundings) .................................................. 3-56
3.11.2 Habitats (study area - 10 Km) .......................................................................................... 3-58
3.11.3 Floral Diversity of the Study Area ................................................................................... 3-61
3.11.4 Faunal Diversity of Study Area ....................................................................................... 3-64
3.12 Biodiversity Aquatic Environment: ..................................................................................... 3-66
3.12.1 Sampling Methodology: ................................................................................................... 3-67
3.12.2 Taxonomic evaluation: ..................................................................................................... 3-68
3.13 Socio-Economic Environment ............................................................................................. 3-69
3.13.1 Objectives ........................................................................................................................ 3-69
3.13.2 Identification of Stakeholders‟ ......................................................................................... 3-69
3.13.3 Methodology .................................................................................................................... 3-69
3.13.4 Limitations ....................................................................................................................... 3-71
3.13.5 The Project Influence Area .............................................................................................. 3-71
en-vιsιn
COPER CO-OPERATIVE SUGAR LTD., DADRIYA, VALOD I-4
3.13.6 Findings of Community Consultations ............................................................................ 3-76
3.13.7 Population Density ........................................................................................................... 3-77
3.13.8 Sex Ratio .......................................................................................................................... 3-77
3.13.9 Population Distribution (Rural & Urban) ........................................................................ 3-77
3.13.10 Quality of life ................................................................................................................... 3-80
3.13.11 People‟s Perception .......................................................................................................... 3-80
3.13.12 Conclusions Socio-Economic Survey .............................................................................. 3-83
CHAPTER 4 ANTICIPATED ENVIRONMENTAL IMPACTS AND MITIGATION MEASURES ............... 4-1
4.1 Introduction ............................................................................................................................ 4-1
4.1.1 Objective ............................................................................................................................ 4-1
4.1.2 Project Activity, Environmental Aspects and Impacts ...................................................... 4-1
4.1.3 Environmental Indices ....................................................................................................... 4-1
4.1.4 Environmental Impact Assessment .................................................................................... 4-2
4.2 Environmental Impact and mitigation ................................................................................... 4-2
4.2.1 Identification of Impacts .................................................................................................... 4-2
4.2.2 Component wise Impact and Mitigation ............................................................................ 4-2
4.3 Air Quality Modeling ........................................................................................................... 4-23
4.3.1 AERMOD ........................................................................................................................ 4-23
4.4 Projection of Traffic ............................................................................................................. 4-31
4.5 Environmental Impact Assessment ...................................................................................... 4-32
4.5.1 Impact Scoring the Overall Severity/Consequence.......................................................... 4-32
4.5.2 Probability of Impact Occurrence .................................................................................... 4-33
4.5.3 Quantifying Environmental Impact ................................................................................. 4-34
4.6 Significance of Impacts ....................................................................................................... 4-35
4.6.1 Cumulative Impact Summary .......................................................................................... 4-49
CHAPTER 5 ANALYSIS OF ALTERNATIVES (TECHNOLOGY AND SITE) ................................................. 5-1
5.1 Site Alternative ...................................................................................................................... 5-1
5.2 Technology alternative (manufacturing process) ................................................................... 5-1
5.3 Technology alternative (spent wash treatment) ..................................................................... 5-2
5.3.1 Aspects of Spent Wash Treatment ..................................................................................... 5-2
5.3.2 Spent wash treatment technology by CSIR/CSMCRI ....................................................... 5-3
5.3.3 Resource requirement ........................................................................................................ 5-7
5.3.4 Water Recovery ................................................................................................................. 5-7
5.3.5 Pollution load from technology ......................................................................................... 5-7
5.3.6 Advantages of Technology ................................................................................................ 5-7
5.3.7 Economic viability ............................................................................................................. 5-8
5.4 Comparison of technology ..................................................................................................... 5-9
CHAPTER 6 ENVIRONMENTAL MONITORING PROGRAM ....................................................................... 6-1
en-vιsιn
COPER CO-OPERATIVE SUGAR LTD., DADRIYA, VALOD I-5
6.1 Introduction ............................................................................................................................ 6-1
6.2 Environmental Monitoring Program ...................................................................................... 6-1
6.3 Environment Monitoring Budget ........................................................................................... 6-3
6.4 Documentation And Records ................................................................................................. 6-4
6.4.1 Online Monitoring System ................................................................................................. 6-4
CHAPTER 7 ADDITIONAL STUDIES ........................................................................................................... 7-1
7.1 Public Consultation ................................................................................................................ 7-1
7.2 Social Impact Assessment and R & R issues ......................................................................... 7-1
7.3 Project Description ................................................................................................................ 7-1
7.4 Risk Assessment .................................................................................................................... 7-1
7.5 Storage of Chemicals ............................................................................................................. 7-2
7.6 Regulatory Permission ........................................................................................................... 7-4
7.6.1 PESO Permission: .............................................................................................................. 7-4
7.6.2 Applicability of MSIHC Rules: ......................................................................................... 7-4
7.7 Identification of Hazard ......................................................................................................... 7-4
7.7.1 Types of Major Accidents .................................................................................................. 7-5
7.7.2 System Elements or Event That Can Lead a Major Accident ............................................ 7-6
7.8 Hazard Indices ....................................................................................................................... 7-6
7.8.1 Maximum Credible Loss Accident Scenarios .................................................................... 7-6
7.8.2 Damage Criteria ................................................................................................................. 7-6
7.9 Consequence Analysis ........................................................................................................... 7-9
7.9.1 Scenarios (Vulnerability Area Identification) .................................................................... 7-9
7.9.2 Software Used for Calculations ....................................................................................... 7-10
7.9.3 Scenario of Consequence Analysis .................................................................................. 7-11
7.10 Summary & Recommendation ............................................................................................. 7-14
7.10.1 Hazard Identification Studies to be carried out by Unit based on Risk Assessment ....... 7-15
7.11 Hazards Associated with Chemical and its control Measures ............................................. 7-15
7.11.1 Chemical Storage and Handling& it‟s Control Measures ................................................ 7-15
7.11.2 Process Hazard & it‟s Control Measures ......................................................................... 7-18
7.11.3 General hazards and its control ........................................................................................ 7-19
7.12 Salient Features of Tank Farm Area .................................................................................... 7-19
7.13 Risk Prevention .................................................................................................................... 7-20
7.14 Equipment Design ................................................................................................................ 7-20
7.14.1 Plant Layout ..................................................................................................................... 7-21
7.14.2 Safety Awareness for Key Management .......................................................................... 7-22
7.14.3 Safety Training................................................................................................................. 7-22
7.14.4 Safety Audits and Inspections .......................................................................................... 7-23
7.14.5 Standard Operating Procedures ........................................................................................ 7-24
en-vιsιn
COPER CO-OPERATIVE SUGAR LTD., DADRIYA, VALOD I-6
7.14.6 Minimization of the Manual Handling of Hazardous Substance ..................................... 7-24
7.15 Do‟s and Don‟ts ................................................................................................................... 7-24
7.16 Risk Mitigation Measures .................................................................................................... 7-26
7.16.1 Treatment of Workers Affected by Accidental Spillage of Chemicals ............................ 7-26
7.16.2 Personal Protective Equipment ........................................................................................ 7-26
7.16.3 Medical Facilities ............................................................................................................. 7-27
7.17 Fire Fighting System ............................................................................................................ 7-28
7.18 Disaster Management Plan .................................................................................................. 7-28
7.18.1 Statutory Provisions ......................................................................................................... 7-29
7.18.2 Onsite Emergency Plan .................................................................................................... 7-29
7.18.3 Offsite Emergency Preparedness Plan ............................................................................. 7-43
7.19 Occupational Health Surveillance Program ......................................................................... 7-47
7.19.1 Health Management within Unit ...................................................................................... 7-47
7.19.2 Occupational Health Monitoring ..................................................................................... 7-47
7.20 Leak Detection and Repair (LDAR) program...................................................................... 7-48
7.21 safety of general public ........................................................................................................ 7-49
CHAPTER 8 PROJECT BENEFITS ............................................................................................................... 8-1
8.1 Environmental Benefits ......................................................................................................... 8-1
8.1.1 Green Belt: ......................................................................................................................... 8-1
8.1.2 Water Conservation: .......................................................................................................... 8-1
8.1.3 Energy Conservation: ......................................................................................................... 8-1
8.1.4 Zero Liquid Discharge ....................................................................................................... 8-1
8.2 Physical Benefits .................................................................................................................... 8-1
8.3 Social Benefits ....................................................................................................................... 8-2
8.3.1 Local Employment: ............................................................................................................ 8-2
8.3.2 Employment Potential: ....................................................................................................... 8-2
8.3.3 Corporate Environment Responsibility (CER) .................................................................. 8-2
8.4 Other Tangible Benefits ......................................................................................................... 8-4
CHAPTER 9 ENVIRONMENTAL COST BENEFIT ANALYSIS ..................................................................... 9-1
CHAPTER 10 ENVIRONMENTAL MANAGEMENT PLAN ............................................................................ 10-1
10.1 Objectives of EMP ............................................................................................................... 10-1
10.2 Components of EMP ............................................................................................................ 10-1
10.3 Environment Management Plan ........................................................................................... 10-1
10.4 Fugitive Dust Control Plan ................................................................................................ 10-19
10.5 Odour Management Plan ................................................................................................... 10-19
10.5.1 Source of odor ................................................................................................................ 10-19
10.5.2 Odor Control from Area Sources ................................................................................... 10-20
10.5.3 Remedial Measures for odour control ............................................................................ 10-20
en-vιsιn
COPER CO-OPERATIVE SUGAR LTD., DADRIYA, VALOD I-7
10.6 Plan to reduce spent wash generation ................................................................................ 10-20
10.7 Rain Water Harvesting ....................................................................................................... 10-20
10.8 Action plan to control ground water pollution ................................................................... 10-21
10.9 Management of boiler ash .................................................................................................. 10-21
10.10 Resource conservation ....................................................................................................... 10-21
10.11 Environmental Management Cell (EMC) .......................................................................... 10-22
10.11.1 Reporting System ........................................................................................................... 10-23
10.12 Budget for Environment Protection ................................................................................... 10-23
CHAPTER 11 SUMMERY AND CONCLUSION ................................................................................... 11-1
11.1 Project Description .............................................................................................................. 11-1
11.2 Project Requirement ............................................................................................................ 11-1
11.2.1 Pollution Potential ............................................................................................................ 11-2
11.3 Baseline Environment .......................................................................................................... 11-2
11.3.1 Existing Environment Quality ......................................................................................... 11-2
11.4 Identification of Impact and Mitigation Measures ............................................................... 11-4
11.5 Alternative Site Study .......................................................................................................... 11-4
11.6 Monitoring Plan ................................................................................................................... 11-4
11.7 Additional Study .................................................................................................................. 11-5
11.8 Environmental Management Plan ........................................................................................ 11-5
11.9 Conclusion ........................................................................................................................... 11-5
CHAPTER 12 DISCLOSURE OF CONSULTANTS ENGAGED ....................................................................... 12-1
12.1 EIA Team ............................................................................................................................. 12-3
12.2 Laboratory Involved ............................................................................................................ 12-4
en-vιsιn
COPER CO-OPERATIVE SUGAR LTD., DADRIYA, VALOD F-1
LIST OF TABLES
Table 1-1 Regulations and concern Authority ................................................................................................. 1-3 Table 1-2 Scope of Baseline Study .................................................................................................................. 1-5 Table 2-1 Project Site Description ................................................................................................................... 2-8 Table 2-2 Environment Sensitive Receptor ..................................................................................................... 2-8 Table 2-3 Infrastructure and Environmental Setting around the PS ................................................................ 2-9 Table 2-4 Proposed Product ........................................................................................................................... 2-10 Table 2-5 Raw Material Requirement ............................................................................................................ 2-21 Table 2-6: Project Cost .................................................................................................................................. 2-22 Table 2-7: Land Bifurcation ........................................................................................................................... 2-23 Table 2-8: Water Consumption – Construction Phase ................................................................................... 2-24 Table 2-9: Water Consumption – Operation Phase........................................................................................ 2-24 Table 2-10: Fuel Consumption ...................................................................................................................... 2-26 Table 2-11: Steam Requirement .................................................................................................................... 2-26 Table 2-12 Manpower .................................................................................................................................... 2-27 Table 2-13: List of Utilities ............................................................................................................................ 2-27 Table 2-14: Common Infrastructure .............................................................................................................. 2-28 Table 2-15 Proposed Storage Facility ............................................................................................................ 2-28 Table 2-16: Wastewater from Distillery Plant ............................................................................................... 2-29 Table 2-17: Characteristic of Raw Spent Wash ............................................................................................. 2-30 Table 2-18: Distillery Plant‟s Effluent ........................................................................................................... 2-31 Table 2-19: Effluent Characteristic ................................................................................................................ 2-31 Table 2-20 Stage wise effluent characteristic ................................................................................................ 2-32 Table 2-21: Proposed ETP units .................................................................................................................... 2-35 Table 2-22: Flue Gas Emission ...................................................................................................................... 2-35 Table 2-23 Waste Management ..................................................................................................................... 2-36 Table 2-24: Species of Existing Greenbelt .................................................................................................... 2-36 Table 2-25: RWH in Sugar Plant ................................................................................................................... 2-37 Table 3-1: Summary of Site Specific Meteorological Data ............................................................................. 3-5 Table 3-2: Air – Parameters analyzed and sampling duration ......................................................................... 3-7 Table 3-3: Ambient Air Quality - Methodology .............................................................................................. 3-7 Table 3-4: Ambient Air Monitoring Locations ................................................................................................ 3-8 Table 3-5: Ambient Air Quality Status .......................................................................................................... 3-11 Table 3-6: Summery of AAQ......................................................................................................................... 3-13 Table 3-7: Sample Collection and Analysis of Water Sample ....................................................................... 3-14 Table 3-8: Monitoring Locations for Ground Water and Surface Water ....................................................... 3-14 Table 3-9: Ground Water Quality .................................................................................................................. 3-18 Table 3-10: Surface Water Quality ................................................................................................................ 3-21 Table 3-11: Summary for Ground Water Quality .......................................................................................... 3-23 Table 3-12: Summary for Surface Water Quality .......................................................................................... 3-24 Table 3-13: Noise Monitoring Methodology ................................................................................................. 3-25 Table 3-14: Ambient Noise Quality Standards for Different Areas/Zones .................................................... 3-26 Table 3-15: Noise Monitoring Locations ....................................................................................................... 3-27 Table 3-16: Noise Levels ............................................................................................................................... 3-29 Table 3-17: Noise level due to transportation ................................................................................................ 3-29 Table 3-18: Summery for Noise level ............................................................................................................ 3-29 Table 3-19: Traffic Counts (up and down) .................................................................................................... 3-31 Table 3-20: Level of Service .......................................................................................................................... 3-31 Table 3-21: Methodology of Testing of Soil Samples ................................................................................... 3-32 Table 3-22: Soil Sampling Location .............................................................................................................. 3-33 Table 3-23: Physicochemical Characteristics of the Soil ............................................................................... 3-35 Table 3-24: Summary of the Soil quality ....................................................................................................... 3-36
en-vιsιn
COPER CO-OPERATIVE SUGAR LTD., DADRIYA, VALOD F-2
Table 3-25: Land Use / Land Cover Statistics ............................................................................................... 3-38 Table 3-26 Geological Succession ................................................................................................................. 3-42 Table 3-27 Table shows the locations of water level measurement ............................................................... 3-49 Table 3-28 Ground water quality data ........................................................................................................... 3-50 Table 3-29 Soil sample for HG study ............................................................................................................ 3-52 Table 3-30 Soil sample laboratory analysis summary ................................................................................... 3-53 Table 3-31 Crops in study area ...................................................................................................................... 3-62 Table 3-32 Vulnerable and Near Threatened birds of the study area............................................................. 3-65 Table 3-33: Species provided Protection as per Wild Life Protection Act 1972 ........................................... 3-65 Table 3-34 Sampling for EB study ................................................................................................................ 3-66 Table 3-35: list of villages where Socio-economic study conducted ............................................................. 3-70 Table 3-36: List of Villages in PIA (Census 2011)........................................................................................ 3-72 Table 4-1 Environmental Aspect, Impact and Mitigation ................................................................................ 4-3 Table 4-2 Details of Stacks ............................................................................................................................ 4-24 Table 4-3: Maximum Ground Level Concentration from Proposed Source (Average 24 hourly) ................ 4-30 Table 4-4: Predicted 24 hourly Short Term Incremental Concentrations from Proposed Source ................. 4-30 Table 4-5: Proposed Traffic Load (up and down) .......................................................................................... 4-31 Table 4-6: Scoring System ............................................................................................................................. 4-32 Table 4-7: Impact scoring for Ecology and Biodiversity ............................................................................... 4-33 Table 4-8: Occurrence Frequency Assessment- Ecological ........................................................................... 4-33 Table 4-9: Occurrence Frequency Assessment-Others .................................................................................. 4-34 Table 4-10: Environmental Impact Significance Criteria .............................................................................. 4-34 Table 4-11: Environmental Risk Categorization ........................................................................................... 4-34 Table 4-12: Ecological Risk Categorization .................................................................................................. 4-35 Table 4-13 Significance of Impacts – Construction Phase ............................................................................ 4-36 Table 4-14 Significance of Impacts – Operation Phase ................................................................................. 4-40 Table 4-15 Cumulative Impact ...................................................................................................................... 4-49 Table 5-1 Material Balance for One KL of RS Production ............................................................................. 5-2 Table 5-2 Additional Products ......................................................................................................................... 5-3 Table 5-3 Material Balance .............................................................................................................................. 5-3 Table 5-4 Cost of new Technology .................................................................................................................. 5-6 Table 6-1: Environmental Monitoring Program .............................................................................................. 6-1 Table 6-2: Environmental Monitoring Plan ..................................................................................................... 6-3 Table 7-1 Details of Storage Tank, Types of Possible hazards ........................................................................ 7-2 Table 7-2 Details of Other Chemicals .............................................................................................................. 7-3 Table 7-3: Hazardous Characteristics of major chemicals ............................................................................... 7-3 Table 7-4: Threshold Storage Quantity as per MSIHC Rules .......................................................................... 7-4 Table 7-5 Probable Major Emergency ............................................................................................................. 7-5 Table 7-6: Damages to Human Life Due to Heat Radiation ............................................................................ 7-7 Table 7-7: Effects Due to Incident Radiation Intensity ................................................................................... 7-8 Table 7-8: Damage Due to Peak over Pressure ................................................................................................ 7-8 Table 7-9: Possible Accident Scenario ............................................................................................................ 7-9 Table 7-10: Summary of Consequence Analysis - Fire end points ................................................................ 7-11 Table 7-11 Details of chemicals Storage, Handling, Transportation and Its types of hazards Possible &
Control Measures ........................................................................................................................................... 7-16 Table 7-12 Details of Proposed hazardous process........................................................................................ 7-18 Table 7-13 General Hazard Associated ......................................................................................................... 7-19 Table 7-14: List of Personal Protective Equipments...................................................................................... 7-27 Table 7-15: List of Antidotes ......................................................................................................................... 7-28 Table 7-16 List of Proposed Fire Fighting Equipments ................................................................................. 7-28 Table 7-17: Offsite Action Plan ..................................................................................................................... 7-46 Table 7-18: Occupational Health Monitoring ................................................................................................ 7-48
en-vιsιn
COPER CO-OPERATIVE SUGAR LTD., DADRIYA, VALOD F-3
Table 8-1 CER Plan ......................................................................................................................................... 8-3 Table 10-1 Construction phase EMP plan ..................................................................................................... 10-2 Table 10-2 Operational phase EMP plan ....................................................................................................... 10-7 Table 10-3 Proposed RWH System ............................................................................................................. 10-21 Table 10-4: Roles and Responsibility of EMC Cell..................................................................................... 10-22 Table 10-5: Capital cost for EMS ................................................................................................................ 10-24 Table 10-6: Recurring cost for EMS ............................................................................................................ 10-24 Table 11-1 BLM Monitoring Location summery .......................................................................................... 11-2 Table 12-1 EIA Team .................................................................................................................................... 12-3 Table 12-2 Details of Laboratory ................................................................................................................... 12-4
LIST OF FIGURES
Figure 2-1: Location Map ................................................................................................................................ 2-2 Figure 2-2: Google Image showing Project Site and surrounding ................................................................... 2-3 Figure 2-3: Distillery Plant in Existing Sugar Factory..................................................................................... 2-3 Figure 2-4: Layout Plan of Existing Sugar Factory ......................................................................................... 2-5 Figure 2-5: Layout Plan of Proposed Distillery Plant ...................................................................................... 2-6 Figure 2-6: Topography Map with PS and Study area ..................................................................................... 2-7 Figure 2-7: RS Manufacturing Process Diagram ........................................................................................... 2-13 Figure 2-8: Material Balance for RS Manufacture ........................................................................................ 2-14 Figure 2-9: Water Balance Diagram – Distillery Plant .................................................................................. 2-25 Figure 2-10: Flow Sheet of Bio Gas Plant ..................................................................................................... 2-30 Figure 2-11: Schematic Flow Diagram of ETP ............................................................................................. 2-34 Figure 2-12 Existing Greenbelt Area ............................................................................................................. 2-37 Figure 2-13: Project Schedule ........................................................................................................................ 2-38 Figure 2-14 Organization Chart ..................................................................................................................... 2-39 Figure 3-1: Annual Wind Rose of Daily Surface Data (8:30 a.m.) at Surat Station (1971-2000) ................... 3-4 Figure 3-2: Annual Wind Rose of Daily Surface Data (5:30 p.m.) at Surat Station (1971-2000) ................... 3-4 Figure 3-3: Primary Wind rose Diagram (March to May 2019) ...................................................................... 3-6 Figure 3-4: Google Image Showing Ambient Air Quality Locations .............................................................. 3-9 Figure 3-5: Google Image Showing Ground Water Sampling Locations ...................................................... 3-15 Figure 3-6: Google Image Showing Surface Water Sampling Locations ...................................................... 3-16 Figure 3-7: Google Image Showing Noise Sampling Locations ................................................................... 3-27 Figure 3-8: Google Image Showing Location of Traffic Survey ................................................................... 3-30 Figure 3-9: Google Image Showing Soil Sampling Locations ...................................................................... 3-33 Figure 3-10: Land use/Land Cover Map of 10 km Radius Study Area ......................................................... 3-39 Figure 3-11: Satellite Imaginary of 10 km Radius Study Area ...................................................................... 3-40 Figure 3-12 Location Map of Tapi District .................................................................................................... 3-41 Figure 3-13 Average annual rainfall (1995 – 2016)....................................................................................... 3-42 Figure 3-14 Geological Map of Tapi District and study area ........................................................................ 3-43 Figure 3-15 Digital Elevation Model of the study area .................................................................................. 3-44 Figure 3-16: Drainage Map of study area ...................................................................................................... 3-45 Figure 3-17: Seismic Zone map – Gujarat ..................................................................................................... 3-46 Figure 3-18 Soil Map of study area ............................................................................................................... 3-47 Figure 3-19 Flow chart showing methodology adopted for the study ........................................................... 3-47 Figure 3-20 Contour Map showing Reduced Water Level ............................................................................ 3-50 Figure 3-21 Google imaginary snap shot of the project site and surroundings .............................................. 3-56 Figure 3-22: Villages in Study Area .............................................................................................................. 3-70
en-vιsιn
COPER CO-OPERATIVE SUGAR LTD., DADRIYA, VALOD F-4
Figure 4-1 Spatial Distribution of 24-Hour Average PM10 Concentration from Proposed Source on Google
Earth (μg/m3) ................................................................................................................................................. 4-24 Figure 4-2: Spatial Distribution of 24-Hour Average PM10 Concentration from Proposed Source on land
use map (μg/m3) ............................................................................................................................................. 4-25
Figure 4-3 Spatial Distribution of 24-Hour Average SO2 Concentration from Proposed Source on Google
Earth (μg/m3) ................................................................................................................................................. 4-26 Figure 4-4: Spatial Distribution of 24-Hour Average SO2 Concentration from Proposed Source on Land
use map (μg/m3) ............................................................................................................................................ 4-27
Figure 4-5 Spatial Distribution of 24-Hour Average NOx Concentration from Proposed Source on Google
Earth (μg/m3) ................................................................................................................................................. 4-28 Figure 4-6 Spatial Distribution of 24-Hour Average NOx Concentration from Proposed Source on Land
use map (μg/m3) ............................................................................................................................................ 4-29 Figure 7-1 Threat zone of Maximum Credible Accident Scenario for Ethanol – Pool Fire .......................... 7-12 Figure 7-2 Threat zone of Worst Case Scenario for Etanol – Pool Fire ........................................................ 7-12 Figure 7-3 Threat zone of Maximum Credible Accident Scenario for Rectified Spirit – Pool Fire .............. 7-13 Figure 7-4 Threat zone of Worst Case Scenario for Rectified Spirit – Pool Fire .......................................... 7-13 Figure 7-5 Organizational Set-up for Onsite Emergency Plan ...................................................................... 7-31 Figure 7-6: Off-Site Emergency Plan ............................................................................................................ 7-44 Figure 10-1: Environment Management Cell .............................................................................................. 10-23
LIST OF PHOTOGRAPHS
Photograph 2-1 Project Site Photograph .......................................................................................................... 2-4 Photograph 2-2 Existing Bio-compost Yard .................................................................................................. 2-20 Photograph 3-1 Ambient Air Quality Monitoring ......................................................................................... 3-10 Photograph 3-2 Surface & Ground Water Sampling ..................................................................................... 3-17 Photograph 3-3 Noise Monitoring ................................................................................................................. 3-28 Photograph 3-4 Soil Sampling ....................................................................................................................... 3-34 Photograph 3-5 Soil sampling by Geo Engineering Services ...................................................................... 3-52 Photograph 3-6 Ecology at and near project site ........................................................................................... 3-58 Photograph 3-7 Google imaginary snap shot of Biodiversity of the study area ............................................ 3-61 Photograph 3-8 Major Crops of the study area .............................................................................................. 3-63 Photograph 3-9 Fruit Grown within study area ............................................................................................. 3-63 Photograph 3-10 Field work for EB study ..................................................................................................... 3-67
LIST OF ANNEXURE
Annexure 1 ToR letter .......................................................................................................................... A-2 Annexure 2 CC&A copy and compliance report .................................................................................. A-3 Annexure 3 Layout plan of sugar factory ............................................................................................. A-4 Annexure 4 Layout plan of proposed distillery plant ........................................................................... A-5 Annexure 5 Land documents – distillery plant ..................................................................................... A-6 Annexure 6 CGWB Application ........................................................................................................... A-7 Annexure 7 Baseline status of Ecology and Biodiversity ..................................................................... A-8 Annexure 8 Conservation plant - Pea fowl ........................................................................................... A-9 Annexure 9 Major equipment/ machineries for Potash Manufacturing technology ............................A-10 Annexure 10 Summery of GPCB Notice details ...................................................................................A-11 Annexure 11 Health record ....................................................................................................................A-12 Annexure 12 MSDS Details ..................................................................................................................A-13 Annexure 13 Letter for availability of molasses ....................................................................................A-14 Annexure 14 Raw Air Data for 12 weeks ..............................................................................................A-15
en-vιsιn
COPER CO-OPERATIVE SUGAR LTD., DADRIYA, VALOD C-1
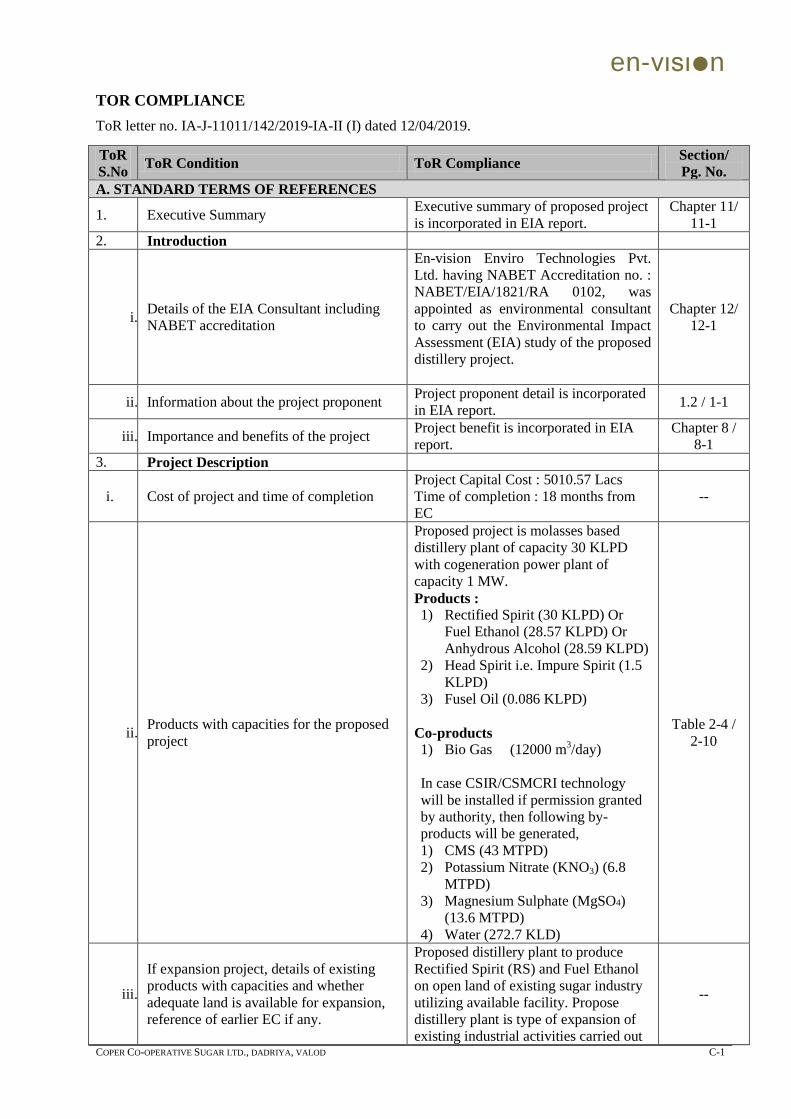
TOR COMPLIANCE
ToR letter no. IA-J-11011/142/2019-IA-II (I) dated 12/04/2019.
ToR
S.No ToR Condition ToR Compliance
Section/
Pg. No.
A. STANDARD TERMS OF REFERENCES
1. Executive Summary Executive summary of proposed project
is incorporated in EIA report.
Chapter 11/
11-1
2. Introduction
i. Details of the EIA Consultant including
NABET accreditation
En-vision Enviro Technologies Pvt.
Ltd. having NABET Accreditation no. :
NABET/EIA/1821/RA 0102, was
appointed as environmental consultant
to carry out the Environmental Impact
Assessment (EIA) study of the proposed
distillery project.
Chapter 12/
12-1
ii. Information about the project proponent Project proponent detail is incorporated
in EIA report. 1.2 / 1-1
iii. Importance and benefits of the project Project benefit is incorporated in EIA
report.
Chapter 8 /
8-1
3. Project Description
i. Cost of project and time of completion
Project Capital Cost : 5010.57 Lacs
Time of completion : 18 months from
EC
--
ii. Products with capacities for the proposed
project
Proposed project is molasses based
distillery plant of capacity 30 KLPD
with cogeneration power plant of
capacity 1 MW.
Products :
1) Rectified Spirit (30 KLPD) Or
Fuel Ethanol (28.57 KLPD) Or
Anhydrous Alcohol (28.59 KLPD)
2) Head Spirit i.e. Impure Spirit (1.5
KLPD)
3) Fusel Oil (0.086 KLPD)
Co-products
1) Bio Gas (12000 m3/day)
In case CSIR/CSMCRI technology
will be installed if permission granted
by authority, then following by-
products will be generated,
1) CMS (43 MTPD)
2) Potassium Nitrate (KNO3) (6.8
MTPD)
3) Magnesium Sulphate (MgSO4)
(13.6 MTPD)
4) Water (272.7 KLD)
Table 2-4 /
2-10
iii.
If expansion project, details of existing
products with capacities and whether
adequate land is available for expansion,
reference of earlier EC if any.
Proposed distillery plant to produce
Rectified Spirit (RS) and Fuel Ethanol
on open land of existing sugar industry
utilizing available facility. Propose
distillery plant is type of expansion of
existing industrial activities carried out
--
en-vιsιn
COPER CO-OPERATIVE SUGAR LTD., DADRIYA, VALOD C-2
ToR
S.No ToR Condition ToR Compliance
Section/
Pg. No.
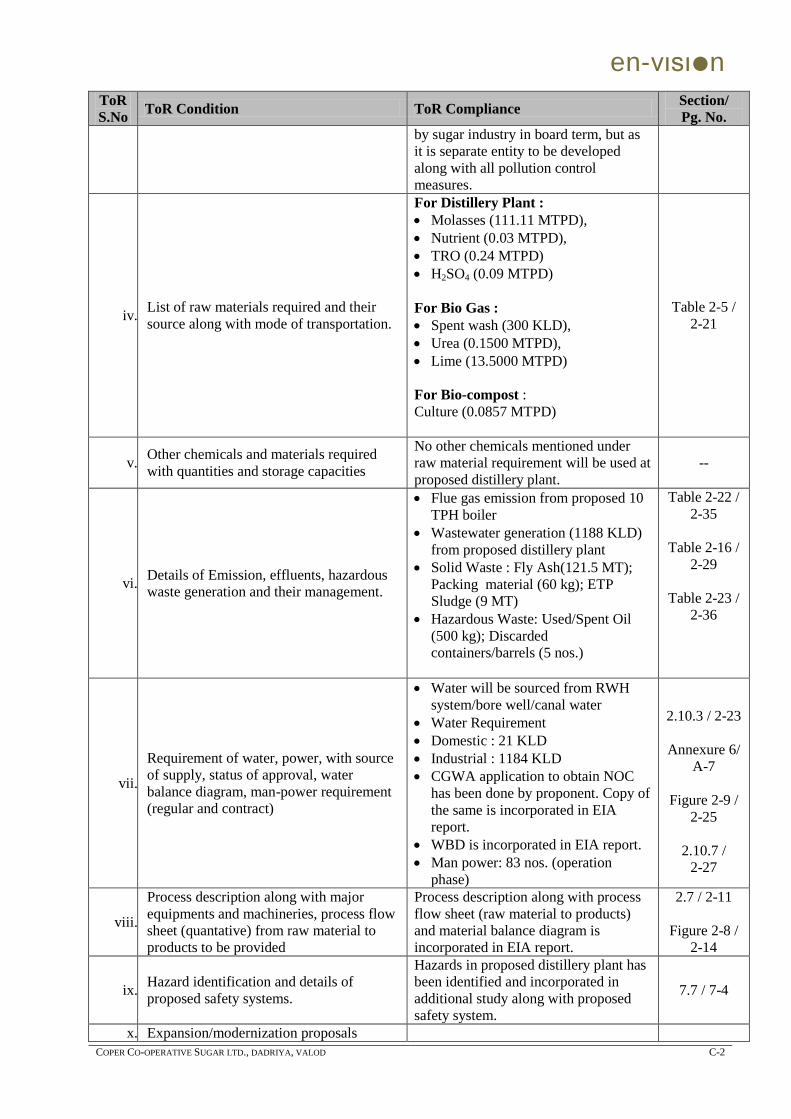
by sugar industry in board term, but as
it is separate entity to be developed
along with all pollution control
measures.
iv. List of raw materials required and their
source along with mode of transportation.
For Distillery Plant :
Molasses (111.11 MTPD),
Nutrient (0.03 MTPD),
TRO (0.24 MTPD)
H2SO4 (0.09 MTPD)
For Bio Gas :
Spent wash (300 KLD),
Urea (0.1500 MTPD),
Lime (13.5000 MTPD)
For Bio-compost :
Culture (0.0857 MTPD)
Table 2-5 /
2-21
v. Other chemicals and materials required
with quantities and storage capacities
No other chemicals mentioned under
raw material requirement will be used at
proposed distillery plant.
--
vi. Details of Emission, effluents, hazardous
waste generation and their management.
Flue gas emission from proposed 10
TPH boiler
Wastewater generation (1188 KLD)
from proposed distillery plant
Solid Waste : Fly Ash(121.5 MT);
Packing material (60 kg); ETP
Sludge (9 MT)
Hazardous Waste: Used/Spent Oil
(500 kg); Discarded
containers/barrels (5 nos.)
Table 2-22 /
2-35
Table 2-16 /
2-29
Table 2-23 /
2-36
vii.
Requirement of water, power, with source
of supply, status of approval, water
balance diagram, man-power requirement
(regular and contract)
Water will be sourced from RWH
system/bore well/canal water
Water Requirement
Domestic : 21 KLD
Industrial : 1184 KLD
CGWA application to obtain NOC
has been done by proponent. Copy of
the same is incorporated in EIA
report.
WBD is incorporated in EIA report.
Man power: 83 nos. (operation
phase)
2.10.3 / 2-23
Annexure 6/
A-7
Figure 2-9 /
2-25
2.10.7 /
2-27
viii.
Process description along with major
equipments and machineries, process flow
sheet (quantative) from raw material to
products to be provided
Process description along with process
flow sheet (raw material to products)
and material balance diagram is
incorporated in EIA report.
2.7 / 2-11
Figure 2-8 /
2-14
ix. Hazard identification and details of
proposed safety systems.
Hazards in proposed distillery plant has
been identified and incorporated in
additional study along with proposed
safety system.
7.7 / 7-4
x. Expansion/modernization proposals
en-vιsιn
COPER CO-OPERATIVE SUGAR LTD., DADRIYA, VALOD C-3
ToR
S.No ToR Condition ToR Compliance
Section/
Pg. No.
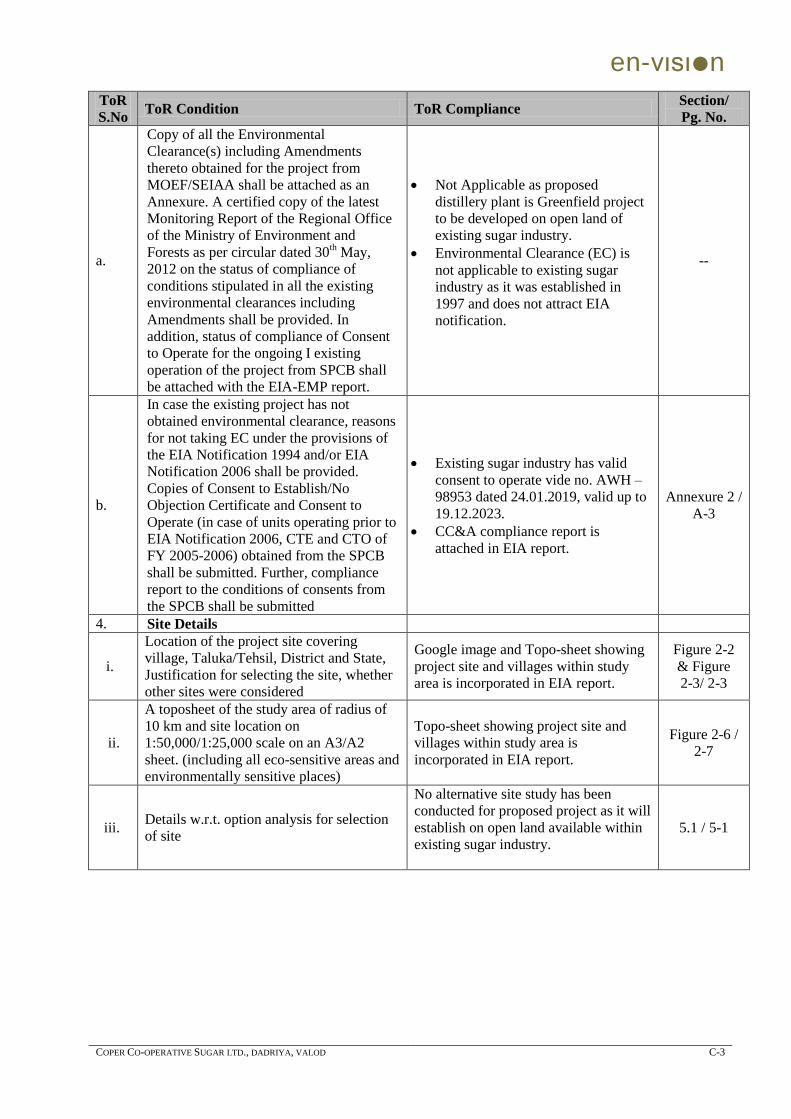
a.
Copy of all the Environmental
Clearance(s) including Amendments
thereto obtained for the project from
MOEF/SEIAA shall be attached as an
Annexure. A certified copy of the latest
Monitoring Report of the Regional Office
of the Ministry of Environment and
Forests as per circular dated 30th May,
2012 on the status of compliance of
conditions stipulated in all the existing
environmental clearances including
Amendments shall be provided. In
addition, status of compliance of Consent
to Operate for the ongoing I existing
operation of the project from SPCB shall
be attached with the EIA-EMP report.
Not Applicable as proposed
distillery plant is Greenfield project
to be developed on open land of
existing sugar industry.
Environmental Clearance (EC) is
not applicable to existing sugar
industry as it was established in
1997 and does not attract EIA
notification.
--
b.
In case the existing project has not
obtained environmental clearance, reasons
for not taking EC under the provisions of
the EIA Notification 1994 and/or EIA
Notification 2006 shall be provided.
Copies of Consent to Establish/No
Objection Certificate and Consent to
Operate (in case of units operating prior to
EIA Notification 2006, CTE and CTO of
FY 2005-2006) obtained from the SPCB
shall be submitted. Further, compliance
report to the conditions of consents from
the SPCB shall be submitted
Existing sugar industry has valid
consent to operate vide no. AWH –
98953 dated 24.01.2019, valid up to
19.12.2023.
CC&A compliance report is
attached in EIA report.
Annexure 2 /
A-3
4. Site Details
i.
Location of the project site covering
village, Taluka/Tehsil, District and State,
Justification for selecting the site, whether
other sites were considered
Google image and Topo-sheet showing
project site and villages within study
area is incorporated in EIA report.
Figure 2-2
& Figure
2-3/ 2-3
ii.
A toposheet of the study area of radius of
10 km and site location on
1:50,000/1:25,000 scale on an A3/A2
sheet. (including all eco-sensitive areas and
environmentally sensitive places)
Topo-sheet showing project site and
villages within study area is
incorporated in EIA report.
Figure 2-6 /
2-7
iii. Details w.r.t. option analysis for selection
of site
No alternative site study has been
conducted for proposed project as it will
establish on open land available within
existing sugar industry.
5.1 / 5-1
en-vιsιn
COPER CO-OPERATIVE SUGAR LTD., DADRIYA, VALOD C-4
ToR
S.No ToR Condition ToR Compliance
Section/
Pg. No.
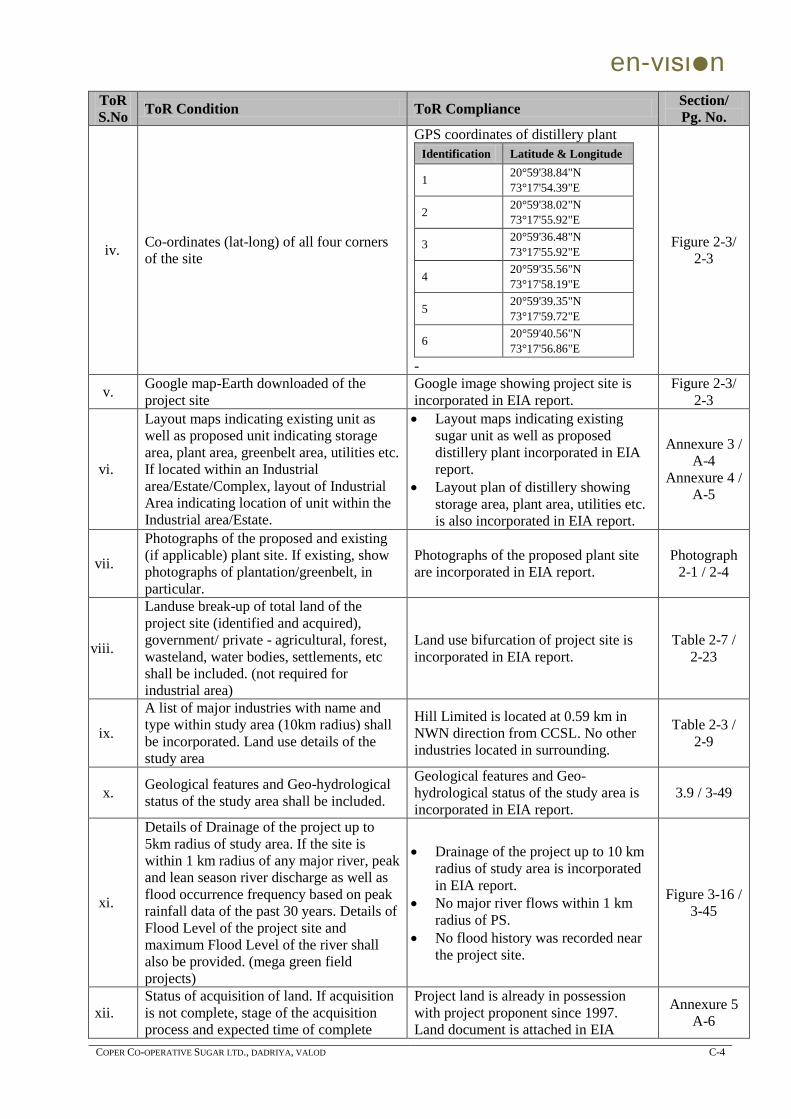
iv. Co-ordinates (lat-long) of all four corners
of the site
GPS coordinates of distillery plant
Identification Latitude & Longitude
1 20°59'38.84"N
73°17'54.39"E
2 20°59'38.02"N
73°17'55.92"E
3 20°59'36.48"N
73°17'55.92"E
4 20°59'35.56"N
73°17'58.19"E
5 20°59'39.35"N
73°17'59.72"E
6 20°59'40.56"N
73°17'56.86"E
-
Figure 2-3/
2-3
v. Google map-Earth downloaded of the
project site
Google image showing project site is
incorporated in EIA report.
Figure 2-3/
2-3
vi.
Layout maps indicating existing unit as
well as proposed unit indicating storage
area, plant area, greenbelt area, utilities etc.
If located within an Industrial
area/Estate/Complex, layout of Industrial
Area indicating location of unit within the
Industrial area/Estate.
Layout maps indicating existing
sugar unit as well as proposed
distillery plant incorporated in EIA
report.
Layout plan of distillery showing
storage area, plant area, utilities etc.
is also incorporated in EIA report.
Annexure 3 /
A-4
Annexure 4 /
A-5
vii.
Photographs of the proposed and existing
(if applicable) plant site. If existing, show
photographs of plantation/greenbelt, in
particular.
Photographs of the proposed plant site
are incorporated in EIA report.
Photograph
2-1 / 2-4
viii.
Landuse break-up of total land of the
project site (identified and acquired),
government/ private - agricultural, forest,
wasteland, water bodies, settlements, etc
shall be included. (not required for
industrial area)
Land use bifurcation of project site is
incorporated in EIA report.
Table 2-7 /
2-23
ix.
A list of major industries with name and
type within study area (10km radius) shall
be incorporated. Land use details of the
study area
Hill Limited is located at 0.59 km in
NWN direction from CCSL. No other
industries located in surrounding.
Table 2-3 /
2-9
x. Geological features and Geo-hydrological
status of the study area shall be included.
Geological features and Geo-
hydrological status of the study area is
incorporated in EIA report.
3.9 / 3-49
xi.
Details of Drainage of the project up to
5km radius of study area. If the site is
within 1 km radius of any major river, peak
and lean season river discharge as well as
flood occurrence frequency based on peak
rainfall data of the past 30 years. Details of
Flood Level of the project site and
maximum Flood Level of the river shall
also be provided. (mega green field
projects)
Drainage of the project up to 10 km
radius of study area is incorporated
in EIA report.
No major river flows within 1 km
radius of PS.
No flood history was recorded near
the project site.
Figure 3-16 /
3-45
xii.
Status of acquisition of land. If acquisition
is not complete, stage of the acquisition
process and expected time of complete
Project land is already in possession
with project proponent since 1997.
Land document is attached in EIA
Annexure 5
A-6
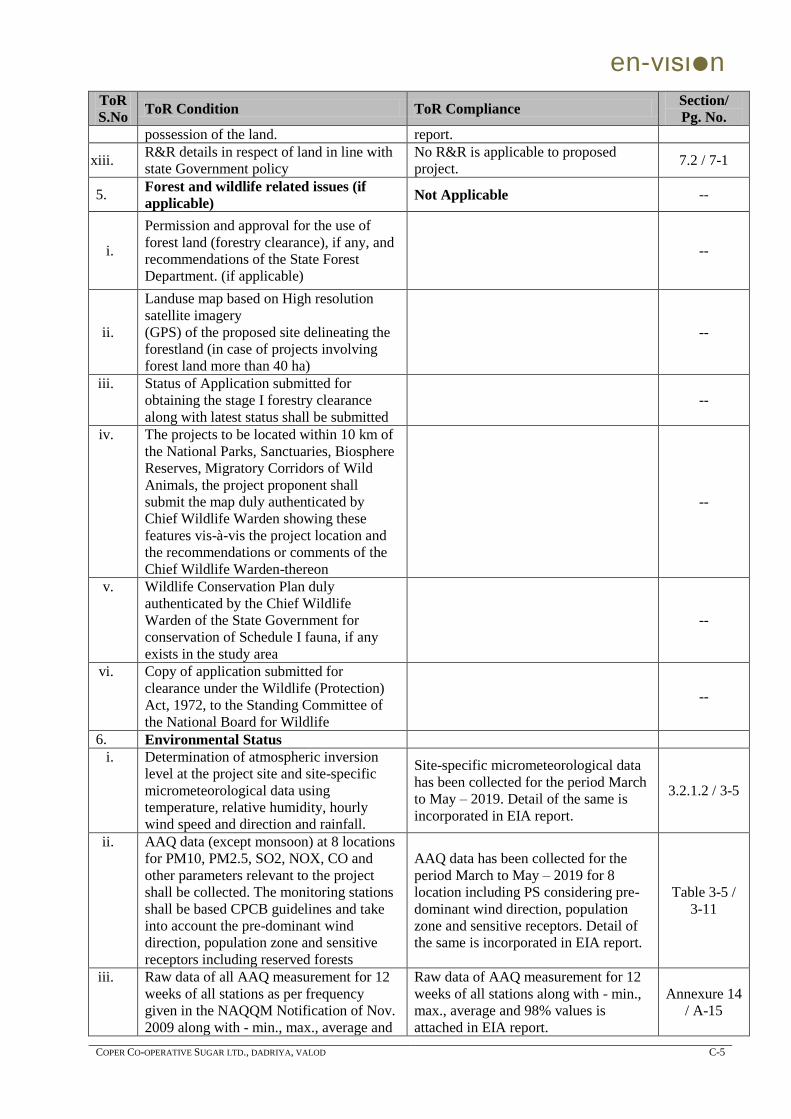
en-vιsιn
COPER CO-OPERATIVE SUGAR LTD., DADRIYA, VALOD C-5
ToR
S.No ToR Condition ToR Compliance
Section/
Pg. No.
possession of the land. report.
xiii. R&R details in respect of land in line with
state Government policy
No R&R is applicable to proposed
project. 7.2 / 7-1
5. Forest and wildlife related issues (if
applicable) Not Applicable --
i.
Permission and approval for the use of
forest land (forestry clearance), if any, and
recommendations of the State Forest
Department. (if applicable)
--
ii.
Landuse map based on High resolution
satellite imagery
(GPS) of the proposed site delineating the
forestland (in case of projects involving
forest land more than 40 ha)
--
iii. Status of Application submitted for
obtaining the stage I forestry clearance
along with latest status shall be submitted
--
iv. The projects to be located within 10 km of
the National Parks, Sanctuaries, Biosphere
Reserves, Migratory Corridors of Wild
Animals, the project proponent shall
submit the map duly authenticated by
Chief Wildlife Warden showing these
features vis-à-vis the project location and
the recommendations or comments of the
Chief Wildlife Warden-thereon
--
v. Wildlife Conservation Plan duly
authenticated by the Chief Wildlife
Warden of the State Government for
conservation of Schedule I fauna, if any
exists in the study area
--
vi. Copy of application submitted for
clearance under the Wildlife (Protection)
Act, 1972, to the Standing Committee of
the National Board for Wildlife
--
6. Environmental Status
i. Determination of atmospheric inversion
level at the project site and site-specific
micrometeorological data using
temperature, relative humidity, hourly
wind speed and direction and rainfall.
Site-specific micrometeorological data
has been collected for the period March
to May – 2019. Detail of the same is
incorporated in EIA report.
3.2.1.2 / 3-5
ii. AAQ data (except monsoon) at 8 locations
for PM10, PM2.5, SO2, NOX, CO and
other parameters relevant to the project
shall be collected. The monitoring stations
shall be based CPCB guidelines and take
into account the pre-dominant wind
direction, population zone and sensitive
receptors including reserved forests
AAQ data has been collected for the
period March to May – 2019 for 8
location including PS considering pre-
dominant wind direction, population
zone and sensitive receptors. Detail of
the same is incorporated in EIA report.
Table 3-5 /
3-11
iii. Raw data of all AAQ measurement for 12
weeks of all stations as per frequency
given in the NAQQM Notification of Nov.
2009 along with - min., max., average and
Raw data of AAQ measurement for 12
weeks of all stations along with - min.,
max., average and 98% values is
attached in EIA report.
Annexure 14
/ A-15
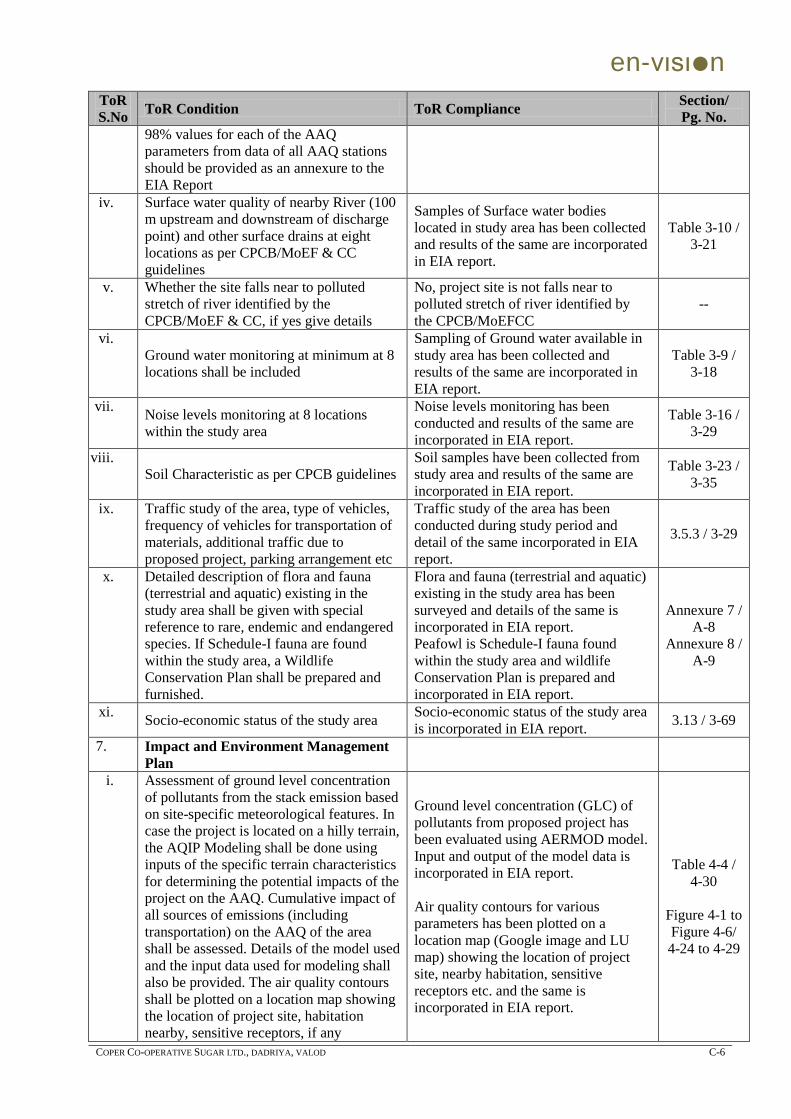
en-vιsιn
COPER CO-OPERATIVE SUGAR LTD., DADRIYA, VALOD C-6
ToR
S.No ToR Condition ToR Compliance
Section/
Pg. No.
98% values for each of the AAQ
parameters from data of all AAQ stations
should be provided as an annexure to the
EIA Report
iv. Surface water quality of nearby River (100
m upstream and downstream of discharge
point) and other surface drains at eight
locations as per CPCB/MoEF & CC
guidelines
Samples of Surface water bodies
located in study area has been collected
and results of the same are incorporated
in EIA report.
Table 3-10 /
3-21
v. Whether the site falls near to polluted
stretch of river identified by the
CPCB/MoEF & CC, if yes give details
No, project site is not falls near to
polluted stretch of river identified by
the CPCB/MoEFCC
--
vi.
Ground water monitoring at minimum at 8
locations shall be included
Sampling of Ground water available in
study area has been collected and
results of the same are incorporated in
EIA report.
Table 3-9 /
3-18
vii. Noise levels monitoring at 8 locations
within the study area
Noise levels monitoring has been
conducted and results of the same are
incorporated in EIA report.
Table 3-16 /
3-29
viii.
Soil Characteristic as per CPCB guidelines
Soil samples have been collected from
study area and results of the same are
incorporated in EIA report.
Table 3-23 /
3-35
ix. Traffic study of the area, type of vehicles,
frequency of vehicles for transportation of
materials, additional traffic due to
proposed project, parking arrangement etc
Traffic study of the area has been
conducted during study period and
detail of the same incorporated in EIA
report.
3.5.3 / 3-29
x. Detailed description of flora and fauna
(terrestrial and aquatic) existing in the
study area shall be given with special
reference to rare, endemic and endangered
species. If Schedule-I fauna are found
within the study area, a Wildlife
Conservation Plan shall be prepared and
furnished.
Flora and fauna (terrestrial and aquatic)
existing in the study area has been
surveyed and details of the same is
incorporated in EIA report.
Peafowl is Schedule-I fauna found
within the study area and wildlife
Conservation Plan is prepared and
incorporated in EIA report.
Annexure 7 /
A-8
Annexure 8 /
A-9
xi. Socio-economic status of the study area
Socio-economic status of the study area
is incorporated in EIA report. 3.13 / 3-69
7. Impact and Environment Management
Plan
i. Assessment of ground level concentration
of pollutants from the stack emission based
on site-specific meteorological features. In
case the project is located on a hilly terrain,
the AQIP Modeling shall be done using
inputs of the specific terrain characteristics
for determining the potential impacts of the
project on the AAQ. Cumulative impact of
all sources of emissions (including
transportation) on the AAQ of the area
shall be assessed. Details of the model used
and the input data used for modeling shall
also be provided. The air quality contours
shall be plotted on a location map showing
the location of project site, habitation
nearby, sensitive receptors, if any
Ground level concentration (GLC) of
pollutants from proposed project has
been evaluated using AERMOD model.
Input and output of the model data is
incorporated in EIA report.
Air quality contours for various
parameters has been plotted on a
location map (Google image and LU
map) showing the location of project
site, nearby habitation, sensitive
receptors etc. and the same is
incorporated in EIA report.
Table 4-4 /
4-30
Figure 4-1 to
Figure 4-6/
4-24 to 4-29
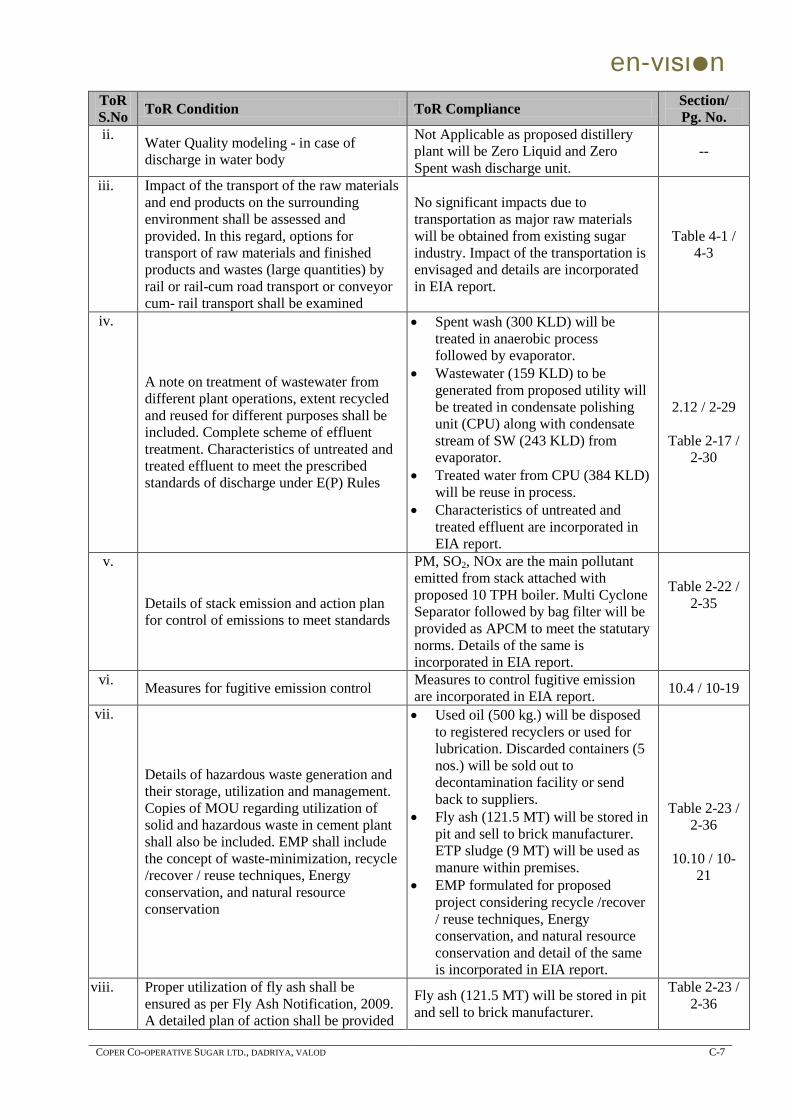
en-vιsιn
COPER CO-OPERATIVE SUGAR LTD., DADRIYA, VALOD C-7
ToR
S.No ToR Condition ToR Compliance
Section/
Pg. No.
ii. Water Quality modeling - in case of
discharge in water body
Not Applicable as proposed distillery
plant will be Zero Liquid and Zero
Spent wash discharge unit.
--
iii. Impact of the transport of the raw materials
and end products on the surrounding
environment shall be assessed and
provided. In this regard, options for
transport of raw materials and finished
products and wastes (large quantities) by
rail or rail-cum road transport or conveyor
cum- rail transport shall be examined
No significant impacts due to
transportation as major raw materials
will be obtained from existing sugar
industry. Impact of the transportation is
envisaged and details are incorporated
in EIA report.
Table 4-1 /
4-3
iv.
A note on treatment of wastewater from
different plant operations, extent recycled
and reused for different purposes shall be
included. Complete scheme of effluent
treatment. Characteristics of untreated and
treated effluent to meet the prescribed
standards of discharge under E(P) Rules
Spent wash (300 KLD) will be
treated in anaerobic process
followed by evaporator.
Wastewater (159 KLD) to be
generated from proposed utility will
be treated in condensate polishing
unit (CPU) along with condensate
stream of SW (243 KLD) from
evaporator.
Treated water from CPU (384 KLD)
will be reuse in process.
Characteristics of untreated and
treated effluent are incorporated in
EIA report.
2.12 / 2-29
Table 2-17 /
2-30
v.
Details of stack emission and action plan
for control of emissions to meet standards
PM, SO2, NOx are the main pollutant
emitted from stack attached with
proposed 10 TPH boiler. Multi Cyclone
Separator followed by bag filter will be
provided as APCM to meet the statutary
norms. Details of the same is
incorporated in EIA report.
Table 2-22 /
2-35
vi. Measures for fugitive emission control
Measures to control fugitive emission
are incorporated in EIA report. 10.4 / 10-19
vii.
Details of hazardous waste generation and
their storage, utilization and management.
Copies of MOU regarding utilization of
solid and hazardous waste in cement plant
shall also be included. EMP shall include
the concept of waste-minimization, recycle
/recover / reuse techniques, Energy
conservation, and natural resource
conservation
Used oil (500 kg.) will be disposed
to registered recyclers or used for
lubrication. Discarded containers (5
nos.) will be sold out to
decontamination facility or send
back to suppliers.
Fly ash (121.5 MT) will be stored in
pit and sell to brick manufacturer.
ETP sludge (9 MT) will be used as
manure within premises.
EMP formulated for proposed
project considering recycle /recover
/ reuse techniques, Energy
conservation, and natural resource
conservation and detail of the same
is incorporated in EIA report.
Table 2-23 /
2-36
10.10 / 10-
21
viii. Proper utilization of fly ash shall be
ensured as per Fly Ash Notification, 2009.
A detailed plan of action shall be provided
Fly ash (121.5 MT) will be stored in pit
and sell to brick manufacturer.
Table 2-23 /
2-36
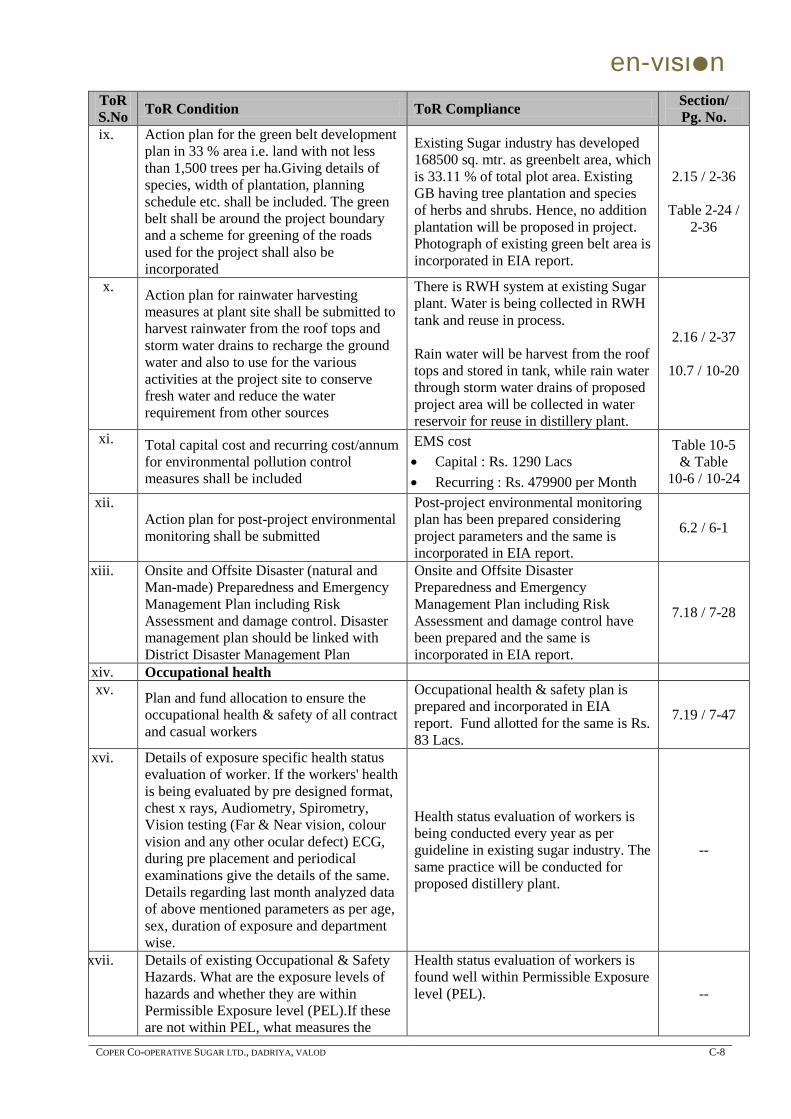
en-vιsιn
COPER CO-OPERATIVE SUGAR LTD., DADRIYA, VALOD C-8
ToR
S.No ToR Condition ToR Compliance
Section/
Pg. No.
ix. Action plan for the green belt development
plan in 33 % area i.e. land with not less
than 1,500 trees per ha.Giving details of
species, width of plantation, planning
schedule etc. shall be included. The green
belt shall be around the project boundary
and a scheme for greening of the roads
used for the project shall also be
incorporated
Existing Sugar industry has developed
168500 sq. mtr. as greenbelt area, which
is 33.11 % of total plot area. Existing
GB having tree plantation and species
of herbs and shrubs. Hence, no addition
plantation will be proposed in project.
Photograph of existing green belt area is
incorporated in EIA report.
2.15 / 2-36
Table 2-24 /
2-36
x. Action plan for rainwater harvesting
measures at plant site shall be submitted to
harvest rainwater from the roof tops and
storm water drains to recharge the ground
water and also to use for the various
activities at the project site to conserve
fresh water and reduce the water
requirement from other sources
There is RWH system at existing Sugar
plant. Water is being collected in RWH
tank and reuse in process.
Rain water will be harvest from the roof
tops and stored in tank, while rain water
through storm water drains of proposed
project area will be collected in water
reservoir for reuse in distillery plant.
2.16 / 2-37
10.7 / 10-20
xi. Total capital cost and recurring cost/annum
for environmental pollution control
measures shall be included
EMS cost
Capital : Rs. 1290 Lacs
Recurring : Rs. 479900 per Month
Table 10-5
& Table
10-6 / 10-24
xii.
Action plan for post-project environmental
monitoring shall be submitted
Post-project environmental monitoring
plan has been prepared considering
project parameters and the same is
incorporated in EIA report.
6.2 / 6-1
xiii. Onsite and Offsite Disaster (natural and
Man-made) Preparedness and Emergency
Management Plan including Risk
Assessment and damage control. Disaster
management plan should be linked with
District Disaster Management Plan
Onsite and Offsite Disaster
Preparedness and Emergency
Management Plan including Risk
Assessment and damage control have
been prepared and the same is
incorporated in EIA report.
7.18 / 7-28
xiv. Occupational health
xv. Plan and fund allocation to ensure the
occupational health & safety of all contract
and casual workers
Occupational health & safety plan is
prepared and incorporated in EIA
report. Fund allotted for the same is Rs.
83 Lacs.
7.19 / 7-47
xvi. Details of exposure specific health status
evaluation of worker. If the workers' health
is being evaluated by pre designed format,
chest x rays, Audiometry, Spirometry,
Vision testing (Far & Near vision, colour
vision and any other ocular defect) ECG,
during pre placement and periodical
examinations give the details of the same.
Details regarding last month analyzed data
of above mentioned parameters as per age,
sex, duration of exposure and department
wise.
Health status evaluation of workers is
being conducted every year as per
guideline in existing sugar industry. The
same practice will be conducted for
proposed distillery plant.
--
xvii. Details of existing Occupational & Safety
Hazards. What are the exposure levels of
hazards and whether they are within
Permissible Exposure level (PEL).If these
are not within PEL, what measures the
Health status evaluation of workers is
found well within Permissible Exposure
level (PEL).
--
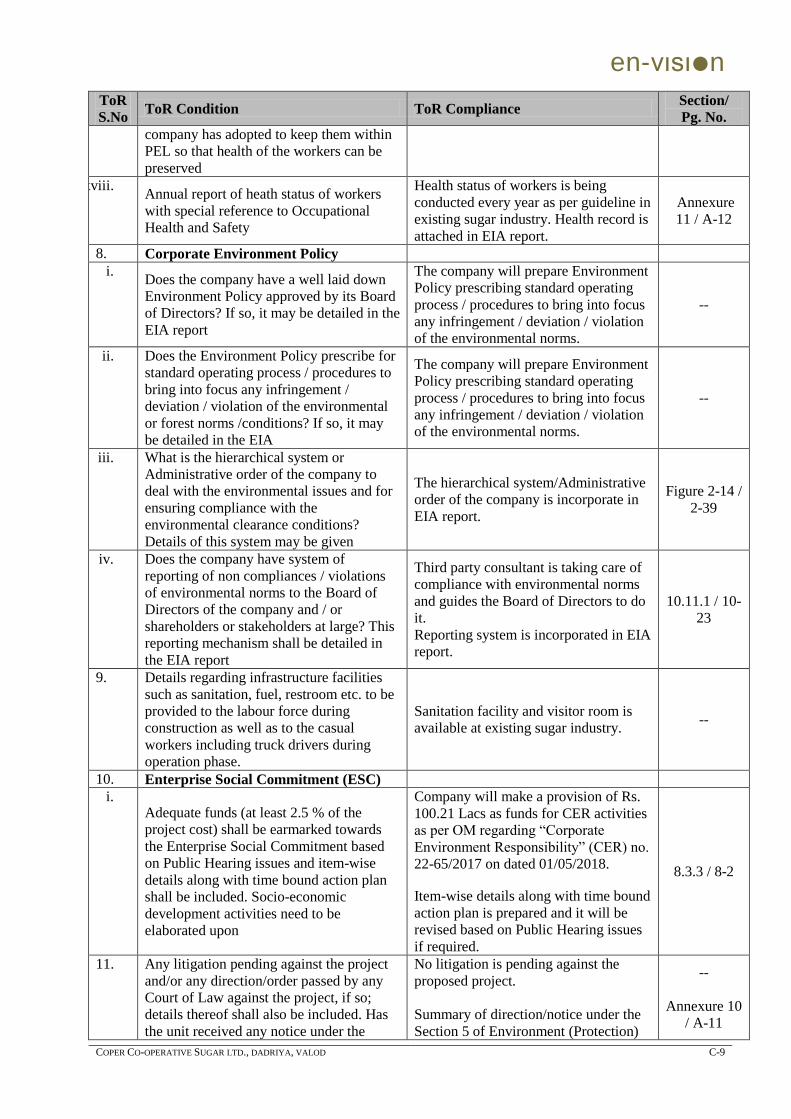
en-vιsιn
COPER CO-OPERATIVE SUGAR LTD., DADRIYA, VALOD C-9
ToR
S.No ToR Condition ToR Compliance
Section/
Pg. No.
company has adopted to keep them within
PEL so that health of the workers can be
preserved
xviii. Annual report of heath status of workers
with special reference to Occupational
Health and Safety
Health status of workers is being
conducted every year as per guideline in
existing sugar industry. Health record is
attached in EIA report.
Annexure
11 / A-12
8. Corporate Environment Policy
i. Does the company have a well laid down
Environment Policy approved by its Board
of Directors? If so, it may be detailed in the
EIA report
The company will prepare Environment
Policy prescribing standard operating
process / procedures to bring into focus
any infringement / deviation / violation
of the environmental norms.
--
ii. Does the Environment Policy prescribe for
standard operating process / procedures to
bring into focus any infringement /
deviation / violation of the environmental
or forest norms /conditions? If so, it may
be detailed in the EIA
The company will prepare Environment
Policy prescribing standard operating
process / procedures to bring into focus
any infringement / deviation / violation
of the environmental norms.
--
iii. What is the hierarchical system or
Administrative order of the company to
deal with the environmental issues and for
ensuring compliance with the
environmental clearance conditions?
Details of this system may be given
The hierarchical system/Administrative
order of the company is incorporate in
EIA report.
Figure 2-14 /
2-39
iv. Does the company have system of
reporting of non compliances / violations
of environmental norms to the Board of
Directors of the company and / or
shareholders or stakeholders at large? This
reporting mechanism shall be detailed in
the EIA report
Third party consultant is taking care of
compliance with environmental norms
and guides the Board of Directors to do
it.
Reporting system is incorporated in EIA
report.
10.11.1 / 10-
23
9. Details regarding infrastructure facilities
such as sanitation, fuel, restroom etc. to be
provided to the labour force during
construction as well as to the casual
workers including truck drivers during
operation phase.
Sanitation facility and visitor room is
available at existing sugar industry. --
10. Enterprise Social Commitment (ESC)
i. Adequate funds (at least 2.5 % of the
project cost) shall be earmarked towards
the Enterprise Social Commitment based
on Public Hearing issues and item-wise
details along with time bound action plan
shall be included. Socio-economic
development activities need to be
elaborated upon
Company will make a provision of Rs.
100.21 Lacs as funds for CER activities
as per OM regarding “Corporate
Environment Responsibility” (CER) no.
22-65/2017 on dated 01/05/2018.
Item-wise details along with time bound
action plan is prepared and it will be
revised based on Public Hearing issues
if required.
8.3.3 / 8-2
11. Any litigation pending against the project
and/or any direction/order passed by any
Court of Law against the project, if so;
details thereof shall also be included. Has
the unit received any notice under the
No litigation is pending against the
proposed project.
Summary of direction/notice under the
Section 5 of Environment (Protection)
--
Annexure 10
/ A-11
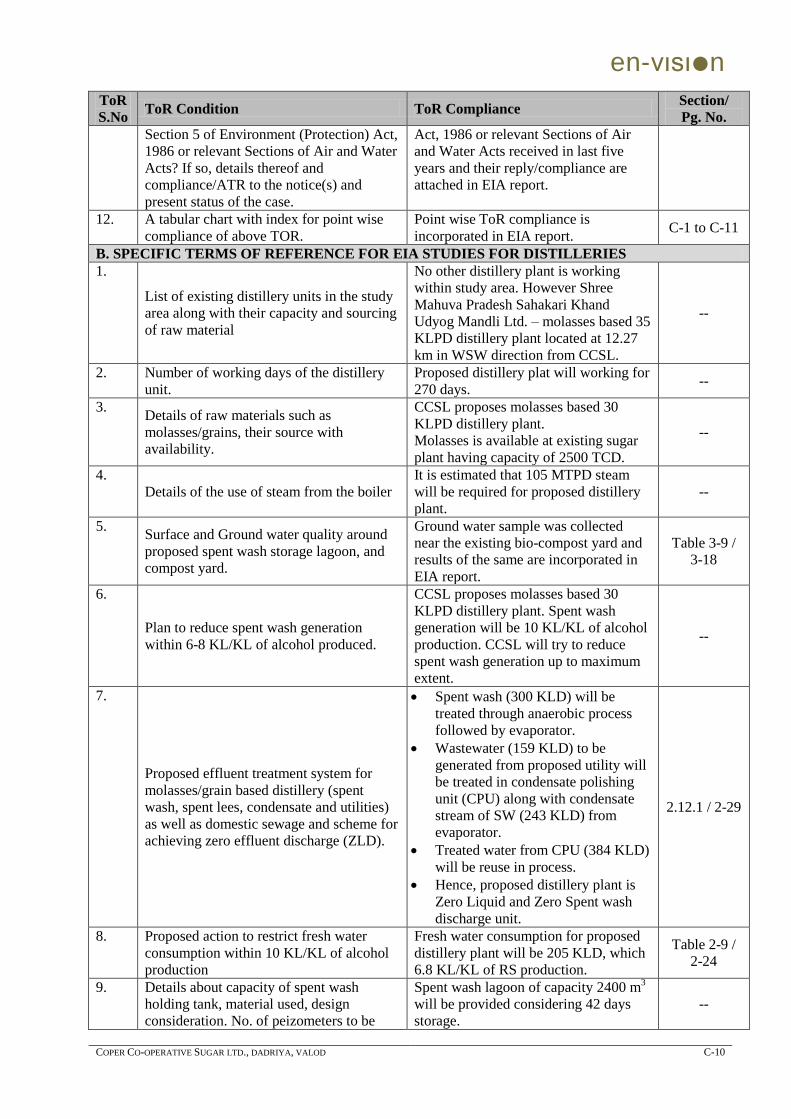
en-vιsιn
COPER CO-OPERATIVE SUGAR LTD., DADRIYA, VALOD C-10
ToR
S.No ToR Condition ToR Compliance
Section/
Pg. No.
Section 5 of Environment (Protection) Act,
1986 or relevant Sections of Air and Water
Acts? If so, details thereof and
compliance/ATR to the notice(s) and
present status of the case.
Act, 1986 or relevant Sections of Air
and Water Acts received in last five
years and their reply/compliance are
attached in EIA report.
12. A tabular chart with index for point wise
compliance of above TOR.
Point wise ToR compliance is
incorporated in EIA report. C-1 to C-11
B. SPECIFIC TERMS OF REFERENCE FOR EIA STUDIES FOR DISTILLERIES
1.
List of existing distillery units in the study
area along with their capacity and sourcing
of raw material
No other distillery plant is working
within study area. However Shree
Mahuva Pradesh Sahakari Khand
Udyog Mandli Ltd. – molasses based 35
KLPD distillery plant located at 12.27
km in WSW direction from CCSL.
--
2. Number of working days of the distillery
unit.
Proposed distillery plat will working for
270 days. --
3. Details of raw materials such as
molasses/grains, their source with
availability.
CCSL proposes molasses based 30
KLPD distillery plant.
Molasses is available at existing sugar
plant having capacity of 2500 TCD.
--
4.
Details of the use of steam from the boiler
It is estimated that 105 MTPD steam
will be required for proposed distillery
plant.
--
5. Surface and Ground water quality around
proposed spent wash storage lagoon, and
compost yard.
Ground water sample was collected
near the existing bio-compost yard and
results of the same are incorporated in
EIA report.
Table 3-9 /
3-18
6.
Plan to reduce spent wash generation
within 6-8 KL/KL of alcohol produced.
CCSL proposes molasses based 30
KLPD distillery plant. Spent wash
generation will be 10 KL/KL of alcohol
production. CCSL will try to reduce
spent wash generation up to maximum
extent.
--
7.
Proposed effluent treatment system for
molasses/grain based distillery (spent
wash, spent lees, condensate and utilities)
as well as domestic sewage and scheme for
achieving zero effluent discharge (ZLD).
Spent wash (300 KLD) will be
treated through anaerobic process
followed by evaporator.
Wastewater (159 KLD) to be
generated from proposed utility will
be treated in condensate polishing
unit (CPU) along with condensate
stream of SW (243 KLD) from
evaporator.
Treated water from CPU (384 KLD)
will be reuse in process.
Hence, proposed distillery plant is
Zero Liquid and Zero Spent wash
discharge unit.
2.12.1 / 2-29
8. Proposed action to restrict fresh water
consumption within 10 KL/KL of alcohol
production
Fresh water consumption for proposed
distillery plant will be 205 KLD, which
6.8 KL/KL of RS production.
Table 2-9 /
2-24
9. Details about capacity of spent wash
holding tank, material used, design
consideration. No. of peizometers to be
Spent wash lagoon of capacity 2400 m3
will be provided considering 42 days
storage.
--
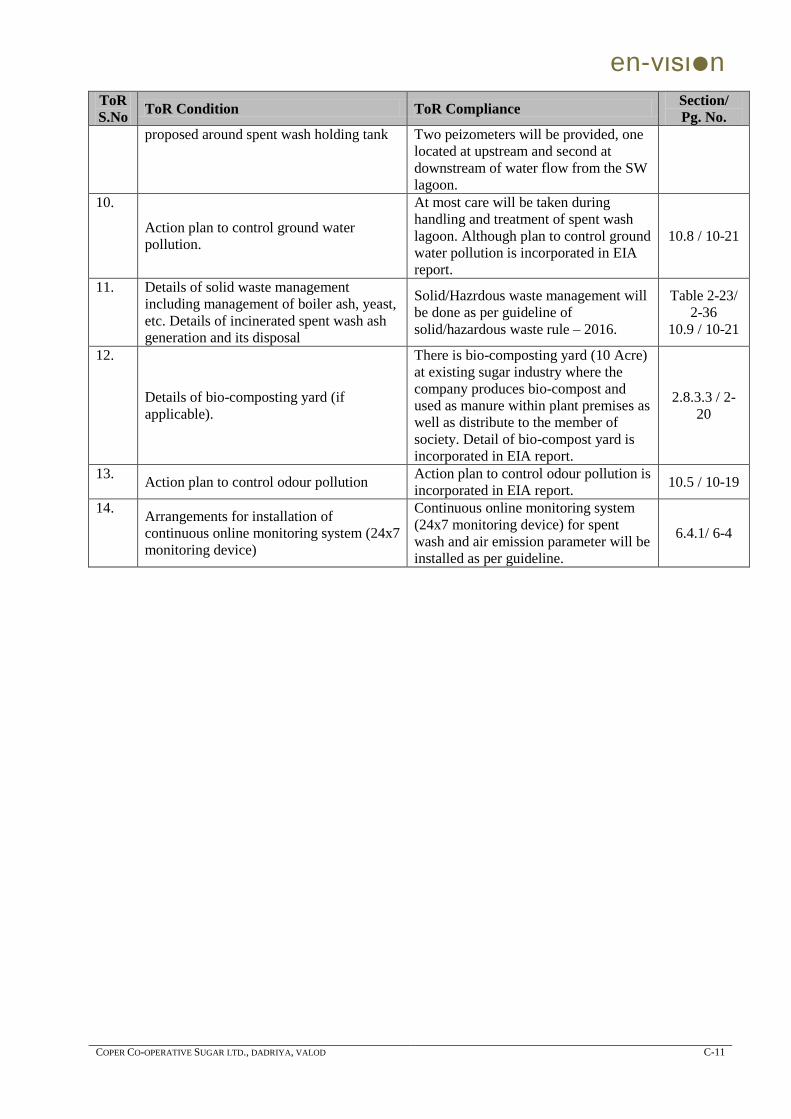
en-vιsιn
COPER CO-OPERATIVE SUGAR LTD., DADRIYA, VALOD C-11
ToR
S.No ToR Condition ToR Compliance
Section/
Pg. No.
proposed around spent wash holding tank Two peizometers will be provided, one
located at upstream and second at
downstream of water flow from the SW
lagoon.
10.
Action plan to control ground water
pollution.
At most care will be taken during
handling and treatment of spent wash
lagoon. Although plan to control ground
water pollution is incorporated in EIA
report.
10.8 / 10-21
11. Details of solid waste management
including management of boiler ash, yeast,
etc. Details of incinerated spent wash ash
generation and its disposal
Solid/Hazrdous waste management will
be done as per guideline of
solid/hazardous waste rule – 2016.
Table 2-23/
2-36
10.9 / 10-21
12.
Details of bio-composting yard (if
applicable).
There is bio-composting yard (10 Acre)
at existing sugar industry where the
company produces bio-compost and
used as manure within plant premises as
well as distribute to the member of
society. Detail of bio-compost yard is
incorporated in EIA report.
2.8.3.3 / 2-
20
13. Action plan to control odour pollution
Action plan to control odour pollution is
incorporated in EIA report. 10.5 / 10-19
14. Arrangements for installation of
continuous online monitoring system (24x7
monitoring device)
Continuous online monitoring system
(24x7 monitoring device) for spent
wash and air emission parameter will be
installed as per guideline.
6.4.1/ 6-4
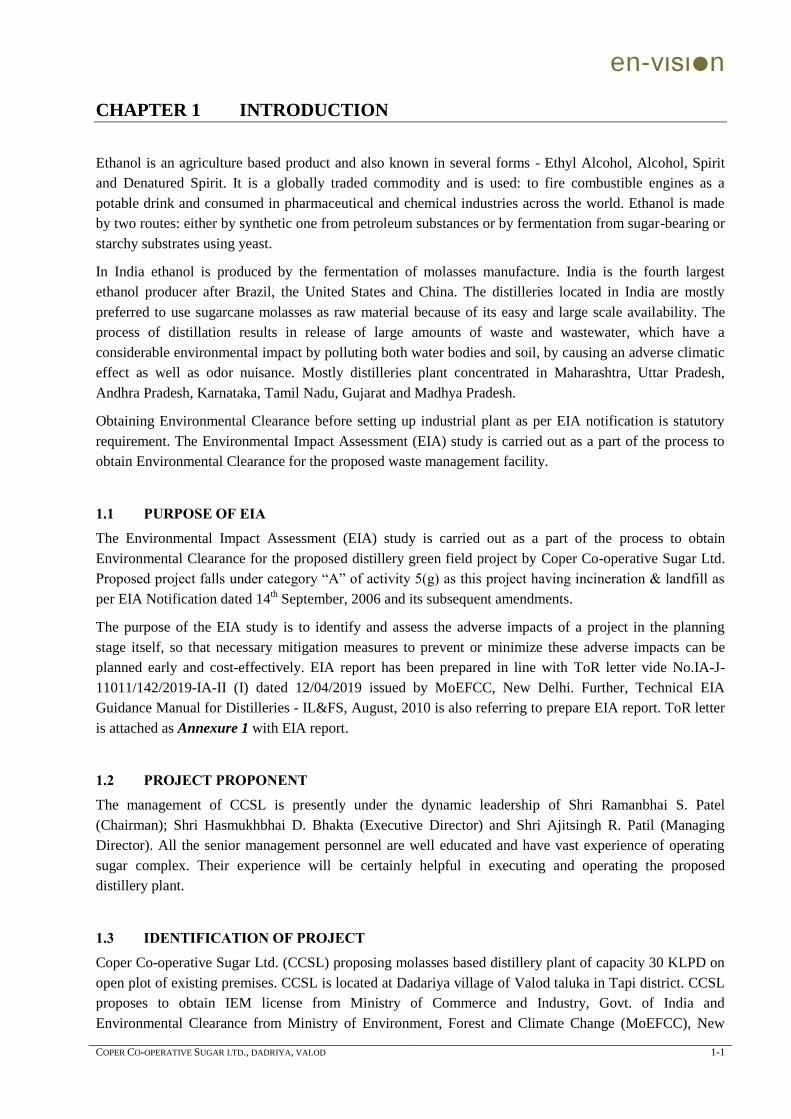
en-vιsιn
COPER CO-OPERATIVE SUGAR LTD., DADRIYA, VALOD 1-1
CHAPTER 1 INTRODUCTION
Ethanol is an agriculture based product and also known in several forms - Ethyl Alcohol, Alcohol, Spirit
and Denatured Spirit. It is a globally traded commodity and is used: to fire combustible engines as a
potable drink and consumed in pharmaceutical and chemical industries across the world. Ethanol is made
by two routes: either by synthetic one from petroleum substances or by fermentation from sugar-bearing or
starchy substrates using yeast.
In India ethanol is produced by the fermentation of molasses manufacture. India is the fourth largest
ethanol producer after Brazil, the United States and China. The distilleries located in India are mostly
preferred to use sugarcane molasses as raw material because of its easy and large scale availability. The
process of distillation results in release of large amounts of waste and wastewater, which have a
considerable environmental impact by polluting both water bodies and soil, by causing an adverse climatic
effect as well as odor nuisance. Mostly distilleries plant concentrated in Maharashtra, Uttar Pradesh,
Andhra Pradesh, Karnataka, Tamil Nadu, Gujarat and Madhya Pradesh.
Obtaining Environmental Clearance before setting up industrial plant as per EIA notification is statutory
requirement. The Environmental Impact Assessment (EIA) study is carried out as a part of the process to
obtain Environmental Clearance for the proposed waste management facility.
1.1 PURPOSE OF EIA
The Environmental Impact Assessment (EIA) study is carried out as a part of the process to obtain
Environmental Clearance for the proposed distillery green field project by Coper Co-operative Sugar Ltd.
Proposed project falls under category “A” of activity 5(g) as this project having incineration & landfill as
per EIA Notification dated 14th September, 2006 and its subsequent amendments.
The purpose of the EIA study is to identify and assess the adverse impacts of a project in the planning
stage itself, so that necessary mitigation measures to prevent or minimize these adverse impacts can be
planned early and cost-effectively. EIA report has been prepared in line with ToR letter vide No.IA-J-
11011/142/2019-IA-II (I) dated 12/04/2019 issued by MoEFCC, New Delhi. Further, Technical EIA
Guidance Manual for Distilleries - IL&FS, August, 2010 is also referring to prepare EIA report. ToR letter
is attached as Annexure 1 with EIA report.
1.2 PROJECT PROPONENT
The management of CCSL is presently under the dynamic leadership of Shri Ramanbhai S. Patel
(Chairman); Shri Hasmukhbhai D. Bhakta (Executive Director) and Shri Ajitsingh R. Patil (Managing
Director). All the senior management personnel are well educated and have vast experience of operating
sugar complex. Their experience will be certainly helpful in executing and operating the proposed
distillery plant.
1.3 IDENTIFICATION OF PROJECT
Coper Co-operative Sugar Ltd. (CCSL) proposing molasses based distillery plant of capacity 30 KLPD on
open plot of existing premises. CCSL is located at Dadariya village of Valod taluka in Tapi district. CCSL
proposes to obtain IEM license from Ministry of Commerce and Industry, Govt. of India and
Environmental Clearance from Ministry of Environment, Forest and Climate Change (MoEFCC), New
en-vιsιn
COPER CO-OPERATIVE SUGAR LTD., DADRIYA, VALOD 1-2
Delhi for proposed distillery plant to manufacture/production of Rectified spirit (Hydrous Alcohol) and
fuel Ethanol. Spent wash will be generated as wastewater from distillery plant. Biogas as co-product will
be generated from biomethanation of spent wash. Mixing of concentrated spent wash, press-mud and
bacterial culture (i.e. cow dung) under controlled condition is produced compost.
1.4 NATURE OF THE PROJECT
CCSL is proposing Greenfield 30 KLPD distillery project within open area of existing premises utilizing
available existing facility. Existing Sugar industry having all facilities like boiler, cooling tower, power
generator, treatment facility etc. required for industrial activities. Propose distillery plant is type of
expansion of existing industrial activities carried out by sugar industry in board term, but as it is separate
entity to be developed along with all pollution control measures.
1.5 DEMAND SUPPLY GAP
India has three major uses of ethanol. Of the total available ethanol, approximately 45 percent is used for
the production of drinking liquor, approximately 40 percent is used in the chemical industry based on
alcohol (as a solvent in the synthesis of other organic chemicals) and the rest is used to mix with petrol and
other purposes. Due to the growth of user industries and the use of ethanol as a fuel in the country, demand
for ethanol has continuously increased. However, ethanol production and availability remained largely
behind. India is the world's fourth largest producer of ethanol after Brazil, the United States of America
(USA) and China, producing approximately 2,000 million liters of ethanol, mainly through the
fermentation of sugarcane molasses. The amount of ethanol currently produced in India, however, is not
enough to meet domestic demand. There was a huge unmet demand from the industrial sector in the year
2008-09, which was met by imports. The world production of ethanol is expected to go up to 150 billion
Liters up to the year 2025.
Sugar industries are required to be expansion in the distillation capacity and storage facilities to achieve
ethanol procurement [Industrial+potable+E10+E10 (D)]1 of 8260 million liter. B-heavy molasses. Supply
of ethanol can be increased to 5300 million liters gradually in the next few years from the existing 2800 –
3000 million liters.
Fuel Ethanol requirement asked to OMCs of Gujarat state for the year 2015 – 16 was 146.4 million liter.
OMCs supplied 19.431 million liter fuel ethanol, which is only 13% of targeted requirement. It shows that
there is huge difference between demand and supply of proposed product i.e. Fuel Ethanol. Based on
OMCs tender for ethanol requirement from Dec. 2017 to Nov. 2018, there is 165.918 million liter ethanol
demanded in Gujarat.
1.5.1 Imports vs. Indigenous production
India has more than 300 distilleries, with a production capacity of about 3.2 billion liters of rectified spirit
per year, almost all of which is produced from sugar molasses, and not from sugar juice, food grains or
other cellulose feed stocks. The government's ethanol policy has led to over 110 distilleries modifying their
plants to include ethanol production with the total ethanol production capacity of 1.3 billion liters per year.
The current ethanol production capacity is enough to meet the estimated ethanol demand for the five
1 CCSL project report (Table 3-12), page – 28
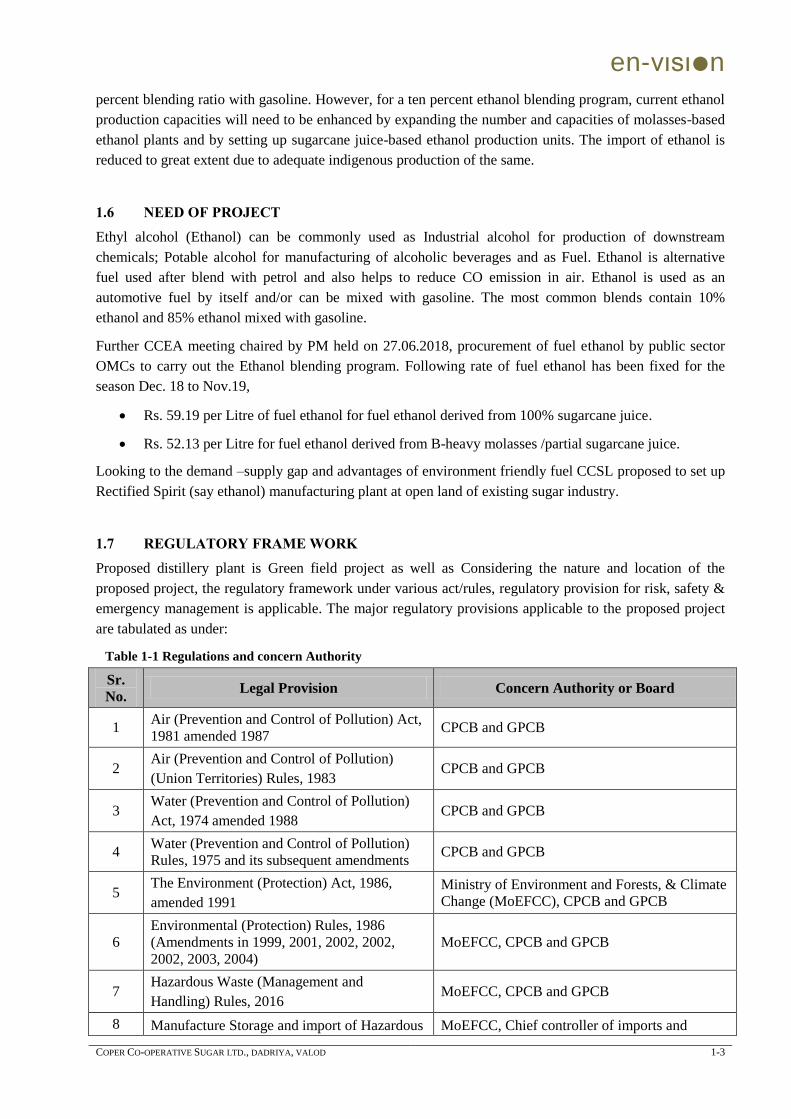
en-vιsιn
COPER CO-OPERATIVE SUGAR LTD., DADRIYA, VALOD 1-3
percent blending ratio with gasoline. However, for a ten percent ethanol blending program, current ethanol
production capacities will need to be enhanced by expanding the number and capacities of molasses-based
ethanol plants and by setting up sugarcane juice-based ethanol production units. The import of ethanol is
reduced to great extent due to adequate indigenous production of the same.
1.6 NEED OF PROJECT
Ethyl alcohol (Ethanol) can be commonly used as Industrial alcohol for production of downstream
chemicals; Potable alcohol for manufacturing of alcoholic beverages and as Fuel. Ethanol is alternative
fuel used after blend with petrol and also helps to reduce CO emission in air. Ethanol is used as an
automotive fuel by itself and/or can be mixed with gasoline. The most common blends contain 10%
ethanol and 85% ethanol mixed with gasoline.
Further CCEA meeting chaired by PM held on 27.06.2018, procurement of fuel ethanol by public sector
OMCs to carry out the Ethanol blending program. Following rate of fuel ethanol has been fixed for the
season Dec. 18 to Nov.19,
Rs. 59.19 per Litre of fuel ethanol for fuel ethanol derived from 100% sugarcane juice.
Rs. 52.13 per Litre for fuel ethanol derived from B-heavy molasses /partial sugarcane juice.
Looking to the demand –supply gap and advantages of environment friendly fuel CCSL proposed to set up
Rectified Spirit (say ethanol) manufacturing plant at open land of existing sugar industry.
1.7 REGULATORY FRAME WORK
Proposed distillery plant is Green field project as well as Considering the nature and location of the
proposed project, the regulatory framework under various act/rules, regulatory provision for risk, safety &
emergency management is applicable. The major regulatory provisions applicable to the proposed project
are tabulated as under:
Table 1-1 Regulations and concern Authority
Sr.
No. Legal Provision Concern Authority or Board
1 Air (Prevention and Control of Pollution) Act,
1981 amended 1987 CPCB and GPCB
2 Air (Prevention and Control of Pollution)
(Union Territories) Rules, 1983 CPCB and GPCB
3 Water (Prevention and Control of Pollution)
Act, 1974 amended 1988 CPCB and GPCB
4 Water (Prevention and Control of Pollution)
Rules, 1975 and its subsequent amendments CPCB and GPCB
5 The Environment (Protection) Act, 1986,
amended 1991
Ministry of Environment and Forests, & Climate
Change (MoEFCC), CPCB and GPCB
6
Environmental (Protection) Rules, 1986
(Amendments in 1999, 2001, 2002, 2002,
2002, 2003, 2004)
MoEFCC, CPCB and GPCB
7 Hazardous Waste (Management and
Handling) Rules, 2016 MoEFCC, CPCB and GPCB
8 Manufacture Storage and import of Hazardous MoEFCC, Chief controller of imports and
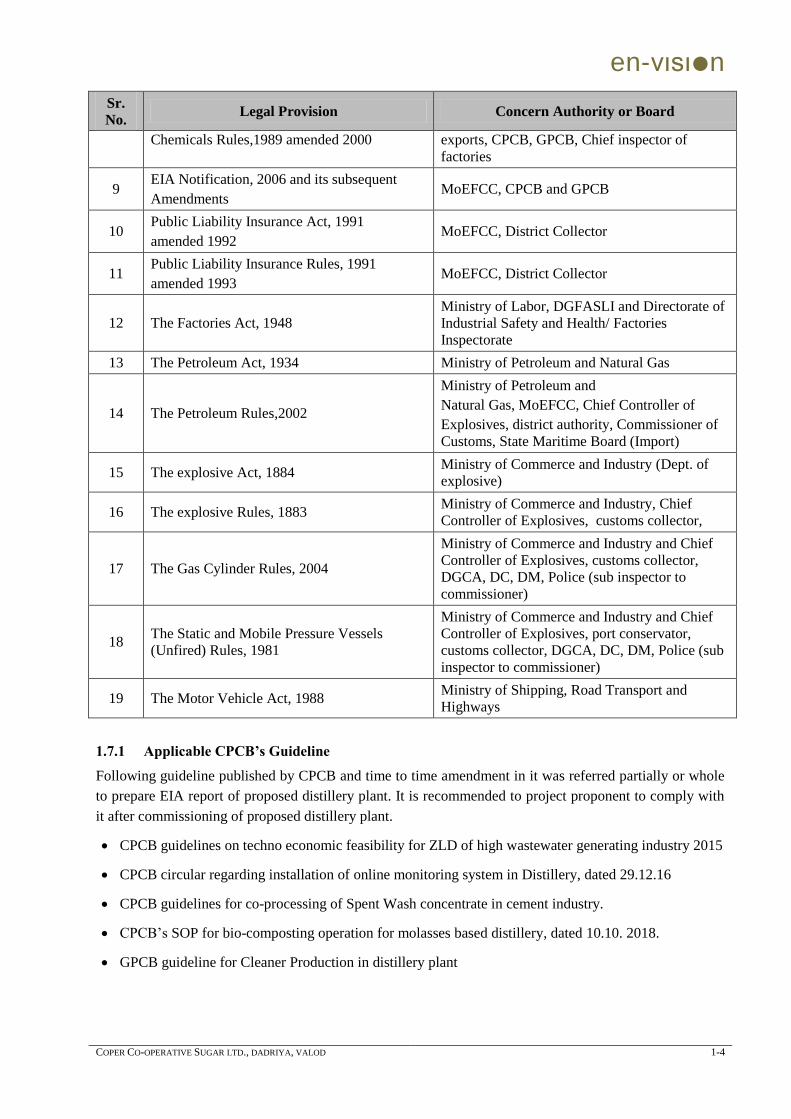
en-vιsιn
COPER CO-OPERATIVE SUGAR LTD., DADRIYA, VALOD 1-4
Sr.
No. Legal Provision Concern Authority or Board
Chemicals Rules,1989 amended 2000 exports, CPCB, GPCB, Chief inspector of
factories
9 EIA Notification, 2006 and its subsequent
Amendments MoEFCC, CPCB and GPCB
10 Public Liability Insurance Act, 1991
amended 1992 MoEFCC, District Collector
11 Public Liability Insurance Rules, 1991
amended 1993 MoEFCC, District Collector
12 The Factories Act, 1948 Ministry of Labor, DGFASLI and Directorate of
Industrial Safety and Health/ Factories
Inspectorate
13 The Petroleum Act, 1934 Ministry of Petroleum and Natural Gas
14 The Petroleum Rules,2002
Ministry of Petroleum and
Natural Gas, MoEFCC, Chief Controller of
Explosives, district authority, Commissioner of
Customs, State Maritime Board (Import)
15 The explosive Act, 1884 Ministry of Commerce and Industry (Dept. of
explosive)
16 The explosive Rules, 1883 Ministry of Commerce and Industry, Chief
Controller of Explosives, customs collector,
17 The Gas Cylinder Rules, 2004
Ministry of Commerce and Industry and Chief
Controller of Explosives, customs collector,
DGCA, DC, DM, Police (sub inspector to
commissioner)
18 The Static and Mobile Pressure Vessels
(Unfired) Rules, 1981
Ministry of Commerce and Industry and Chief
Controller of Explosives, port conservator,
customs collector, DGCA, DC, DM, Police (sub
inspector to commissioner)
19 The Motor Vehicle Act, 1988 Ministry of Shipping, Road Transport and
Highways
1.7.1 Applicable CPCB’s Guideline
Following guideline published by CPCB and time to time amendment in it was referred partially or whole
to prepare EIA report of proposed distillery plant. It is recommended to project proponent to comply with
it after commissioning of proposed distillery plant.
CPCB guidelines on techno economic feasibility for ZLD of high wastewater generating industry 2015
CPCB circular regarding installation of online monitoring system in Distillery, dated 29.12.16
CPCB guidelines for co-processing of Spent Wash concentrate in cement industry.
CPCB‟s SOP for bio-composting operation for molasses based distillery, dated 10.10. 2018.
GPCB guideline for Cleaner Production in distillery plant
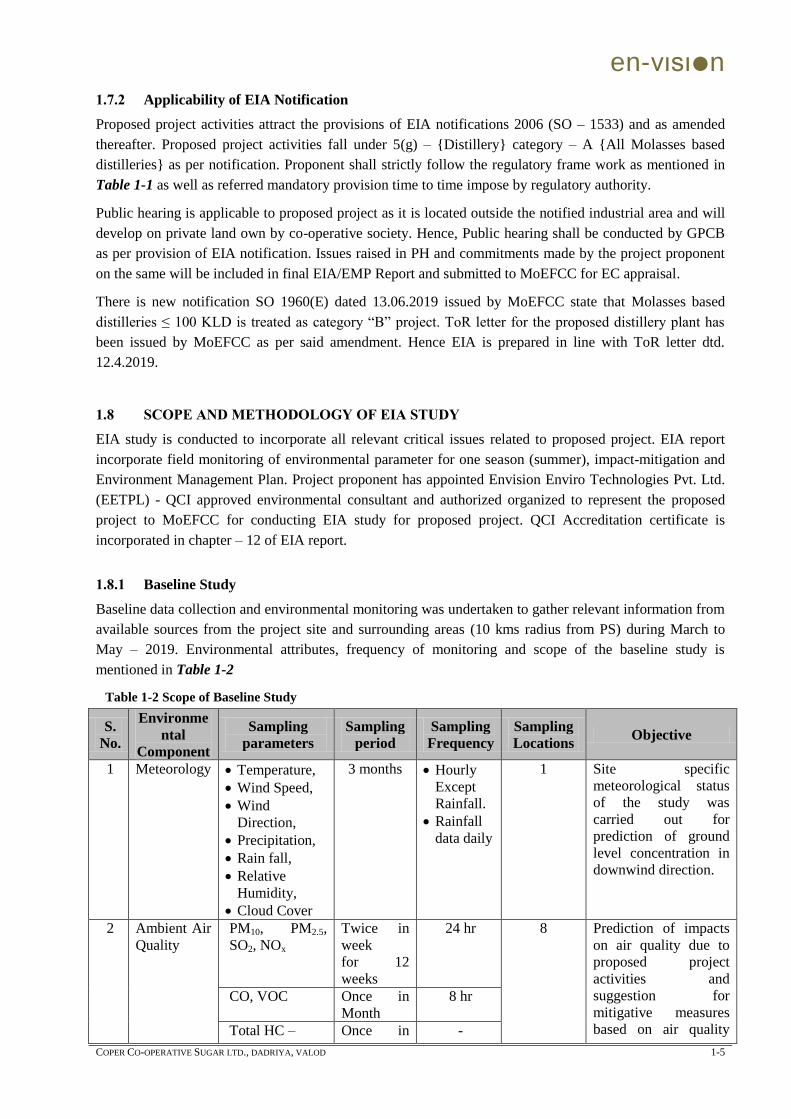
en-vιsιn
COPER CO-OPERATIVE SUGAR LTD., DADRIYA, VALOD 1-5
1.7.2 Applicability of EIA Notification
Proposed project activities attract the provisions of EIA notifications 2006 (SO – 1533) and as amended
thereafter. Proposed project activities fall under 5(g) – {Distillery} category – A {All Molasses based
distilleries} as per notification. Proponent shall strictly follow the regulatory frame work as mentioned in
Table 1-1 as well as referred mandatory provision time to time impose by regulatory authority.
Public hearing is applicable to proposed project as it is located outside the notified industrial area and will
develop on private land own by co-operative society. Hence, Public hearing shall be conducted by GPCB
as per provision of EIA notification. Issues raised in PH and commitments made by the project proponent
on the same will be included in final EIA/EMP Report and submitted to MoEFCC for EC appraisal.
There is new notification SO 1960(E) dated 13.06.2019 issued by MoEFCC state that Molasses based
distilleries ≤ 100 KLD is treated as category “B” project. ToR letter for the proposed distillery plant has
been issued by MoEFCC as per said amendment. Hence EIA is prepared in line with ToR letter dtd.
12.4.2019.
1.8 SCOPE AND METHODOLOGY OF EIA STUDY
EIA study is conducted to incorporate all relevant critical issues related to proposed project. EIA report
incorporate field monitoring of environmental parameter for one season (summer), impact-mitigation and
Environment Management Plan. Project proponent has appointed Envision Enviro Technologies Pvt. Ltd.
(EETPL) - QCI approved environmental consultant and authorized organized to represent the proposed
project to MoEFCC for conducting EIA study for proposed project. QCI Accreditation certificate is
incorporated in chapter – 12 of EIA report.
1.8.1 Baseline Study
Baseline data collection and environmental monitoring was undertaken to gather relevant information from
available sources from the project site and surrounding areas (10 kms radius from PS) during March to
May – 2019. Environmental attributes, frequency of monitoring and scope of the baseline study is
mentioned in Table 1-2
Table 1-2 Scope of Baseline Study
S.
No.
Environme
ntal
Component
Sampling
parameters
Sampling
period
Sampling
Frequency
Sampling
Locations Objective
1 Meteorology Temperature,
Wind Speed,
Wind
Direction,
Precipitation,
Rain fall,
Relative
Humidity,
Cloud Cover
3 months Hourly
Except
Rainfall.
Rainfall
data daily
1 Site specific
meteorological status
of the study was
carried out for
prediction of ground
level concentration in
downwind direction.
2 Ambient Air
Quality
PM10, PM2.5,
SO2, NOx
Twice in
week
for 12
weeks
24 hr 8 Prediction of impacts
on air quality due to
proposed project
activities and
suggestion for
mitigative measures
based on air quality
CO, VOC Once in
Month
8 hr
Total HC – Once in -
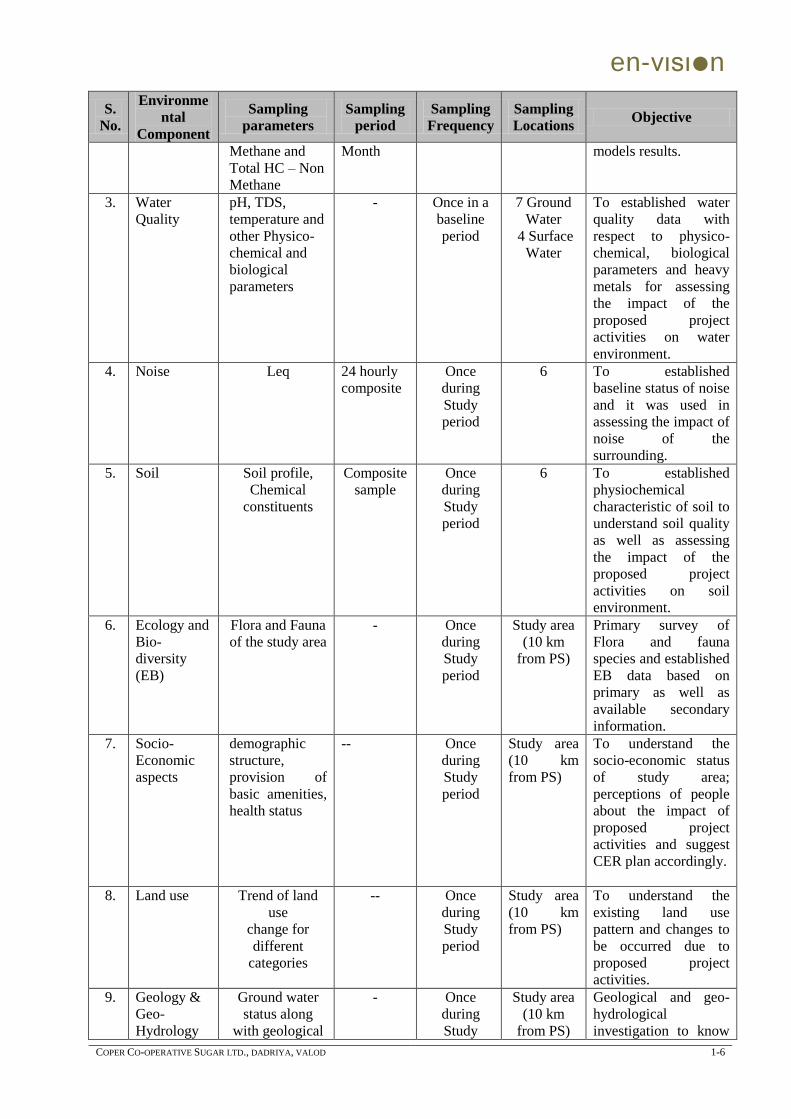
en-vιsιn
COPER CO-OPERATIVE SUGAR LTD., DADRIYA, VALOD 1-6
S.
No.
Environme
ntal
Component
Sampling
parameters
Sampling
period
Sampling
Frequency
Sampling
Locations Objective
Methane and
Total HC – Non
Methane
Month models results.
3. Water
Quality
pH, TDS,
temperature and
other Physico-
chemical and
biological
parameters
- Once in a
baseline
period
7 Ground
Water
4 Surface
Water
To established water
quality data with
respect to physico-
chemical, biological
parameters and heavy
metals for assessing
the impact of the
proposed project
activities on water
environment.
4. Noise Leq 24 hourly
composite
Once
during
Study
period
6 To established
baseline status of noise
and it was used in
assessing the impact of
noise of the
surrounding.
5. Soil Soil profile,
Chemical
constituents
Composite
sample
Once
during
Study
period
6 To established
physiochemical
characteristic of soil to
understand soil quality
as well as assessing
the impact of the
proposed project
activities on soil
environment.
6. Ecology and
Bio-
diversity
(EB)
Flora and Fauna
of the study area
- Once
during
Study
period
Study area
(10 km
from PS)
Primary survey of
Flora and fauna
species and established
EB data based on
primary as well as
available secondary
information.
7. Socio-
Economic
aspects
demographic
structure,
provision of
basic amenities,
health status
-- Once
during
Study
period
Study area
(10 km
from PS)
To understand the
socio-economic status
of study area;
perceptions of people
about the impact of
proposed project
activities and suggest
CER plan accordingly.
8. Land use Trend of land
use
change for
different
categories
-- Once
during
Study
period
Study area
(10 km
from PS)
To understand the
existing land use
pattern and changes to
be occurred due to
proposed project
activities.
9. Geology &
Geo-
Hydrology
Ground water
status along
with geological
- Once
during
Study
Study area
(10 km
from PS)
Geological and geo-
hydrological
investigation to know
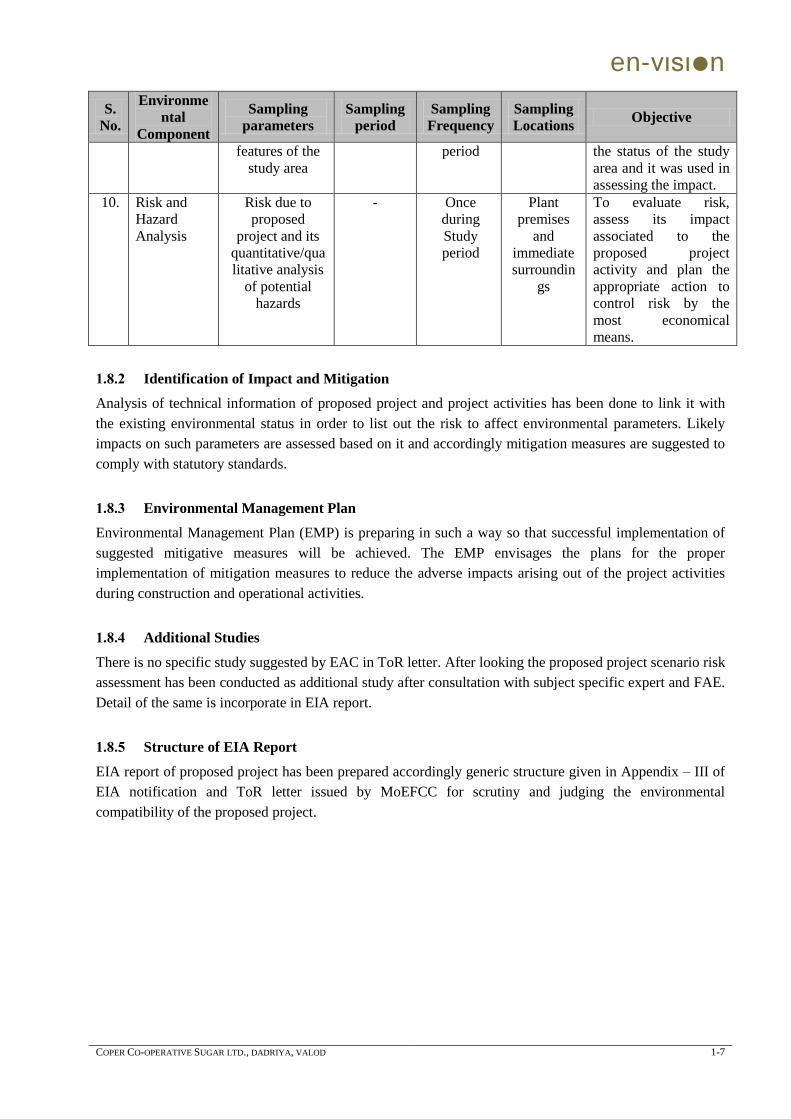
en-vιsιn
COPER CO-OPERATIVE SUGAR LTD., DADRIYA, VALOD 1-7
S.
No.
Environme
ntal
Component
Sampling
parameters
Sampling
period
Sampling
Frequency
Sampling
Locations Objective
features of the
study area
period the status of the study
area and it was used in
assessing the impact.
10. Risk and
Hazard
Analysis
Risk due to
proposed
project and its
quantitative/qua
litative analysis
of potential
hazards
- Once
during
Study
period
Plant
premises
and
immediate
surroundin
gs
To evaluate risk,
assess its impact
associated to the
proposed project
activity and plan the
appropriate action to
control risk by the
most economical
means.
1.8.2 Identification of Impact and Mitigation
Analysis of technical information of proposed project and project activities has been done to link it with
the existing environmental status in order to list out the risk to affect environmental parameters. Likely
impacts on such parameters are assessed based on it and accordingly mitigation measures are suggested to
comply with statutory standards.
1.8.3 Environmental Management Plan
Environmental Management Plan (EMP) is preparing in such a way so that successful implementation of
suggested mitigative measures will be achieved. The EMP envisages the plans for the proper
implementation of mitigation measures to reduce the adverse impacts arising out of the project activities
during construction and operational activities.
1.8.4 Additional Studies
There is no specific study suggested by EAC in ToR letter. After looking the proposed project scenario risk
assessment has been conducted as additional study after consultation with subject specific expert and FAE.
Detail of the same is incorporate in EIA report.
1.8.5 Structure of EIA Report
EIA report of proposed project has been prepared accordingly generic structure given in Appendix – III of
EIA notification and ToR letter issued by MoEFCC for scrutiny and judging the environmental
compatibility of the proposed project.
en-vιsιn
COPER CO-OPERATIVE SUGAR LTD., DADRIYA, VALOD 2-1
CHAPTER 2 PROJECT DESCRIPTION
Project description of proposed distillery plant provides us the information on project activities to be
carried out using various resources along with description of type, need, location, size or magnitude of
project operation, technology and other related project activities. Proposal for molasses based 30 KLPD
distillery plant to be installed within existing sugar industry at Dadariya village of Valod taluka in Tapi
district.
2.1 PROJECT PROPONENT
The management of CCSL is presently under the dynamic leadership of Shri Ramanbhai S. Patel
(Chairman); Shri Hasmukhbhai D. Bhakta (Executive Director) and Shri Ajitsingh R. Patil (Managing
Director). All the senior management personnel are well educated and have vast experience of operating
sugar complex. Their experience will be certainly helpful in executing and operating the proposed
distillery plant.
2.2 NEED AND NATURE OF PROJECT
CCSL proposes to set up 30 KLPD molasses based distillery plant to produce Rectified Spirit (RS) and
Fuel Ethanol on open land of existing sugar industry utilizing available facility. Propose distillery plant is
type of expansion of existing industrial activities carried out by sugar industry in board term, but as it is
separate entity to be developed along with all pollution control measures.
Existing sugar industry has 2500 TCD sugarcane crushing capacity and valid consent to operate vide no.
AWH – 98953 dated 24.01.2019, valid up to 19.12.2023. Unit is complying with conditions mentioned in
CC&A and the same is attached as Annexure 2 as well as complying with CREP guideline. Sugar industry
having all facilities like boiler, cooling tower, power generator, treatment facility etc. required for
industrial activities.
There are approx. eight co-operative distilleries and sugar plants, two stand alone distilleries in Gujarat,
having 340 KLPD productions in totally. Oil Marketing companies (OMCs) of Gujarat state asked to
supply 146.4 million liter. Fuel Ethanol in the year 2015 – 16, against it OMCs supplied 19.431 million
liter fuel ethanol, which is only 13% of targeted requirement. It shows that there is huge demand and
supply gap for Fuel Ethanol.
Fuel ethanol (renewable source of energy) has a great future as it is worldwide acceptable eco friendly
alternative fuel, helps to reduce CO emission in air and maintaining the carbon cycle of nature. Worldwide
fuel ethanol production in the year 2012 was approx. 82683 million liter. This is 108505 million liter in the
year 2018 and expected to increase 150 billion Liters. In the year 2025, 31755 million liter ethanol was
supplied by Asia, which is 29% of total production of 2018. The demand of rectified spirit (a pre-from of
ethanol) has shifted from domestic sugar mills to overseas markets including the United States and Brazil
as its landed cost on Indian ports works out to nearly 25% cheaper.
Cabinet Committee on Economic Affairs (CCEA) has imposed 5% mandatory ethanol blending with petrol
in 22.11.2012. Accordingly, a Gazette Notification was issued directing OMCs to sell ethanol blended
Petrol with percentage of ethanol up to 10% as per BIS specification to achieve 5% ethanol blending
across the country as a whole. The national bio-fuel policy, approved by the Government of India, has
plans for 20% ethanol blending programme by 2017 from the current mandated 5% blending & recently
increased to 10%, to reduce India‟s dependence on fossil fuel imports.
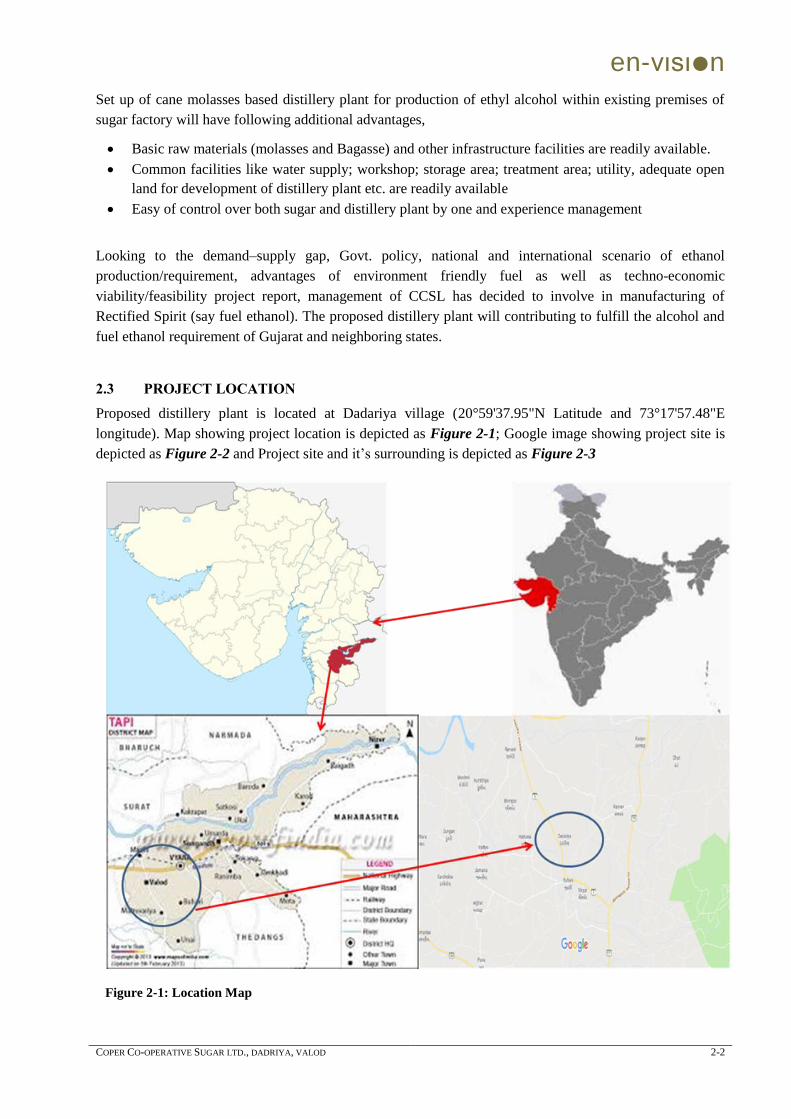
en-vιsιn
COPER CO-OPERATIVE SUGAR LTD., DADRIYA, VALOD 2-2
Set up of cane molasses based distillery plant for production of ethyl alcohol within existing premises of
sugar factory will have following additional advantages,
Basic raw materials (molasses and Bagasse) and other infrastructure facilities are readily available.
Common facilities like water supply; workshop; storage area; treatment area; utility, adequate open
land for development of distillery plant etc. are readily available
Easy of control over both sugar and distillery plant by one and experience management
Looking to the demand–supply gap, Govt. policy, national and international scenario of ethanol
production/requirement, advantages of environment friendly fuel as well as techno-economic
viability/feasibility project report, management of CCSL has decided to involve in manufacturing of
Rectified Spirit (say fuel ethanol). The proposed distillery plant will contributing to fulfill the alcohol and
fuel ethanol requirement of Gujarat and neighboring states.
2.3 PROJECT LOCATION
Proposed distillery plant is located at Dadariya village (20°59'37.95"N Latitude and 73°17'57.48"E
longitude). Map showing project location is depicted as Figure 2-1; Google image showing project site is
depicted as Figure 2-2 and Project site and it‟s surrounding is depicted as Figure 2-3
Figure 2-1: Location Map
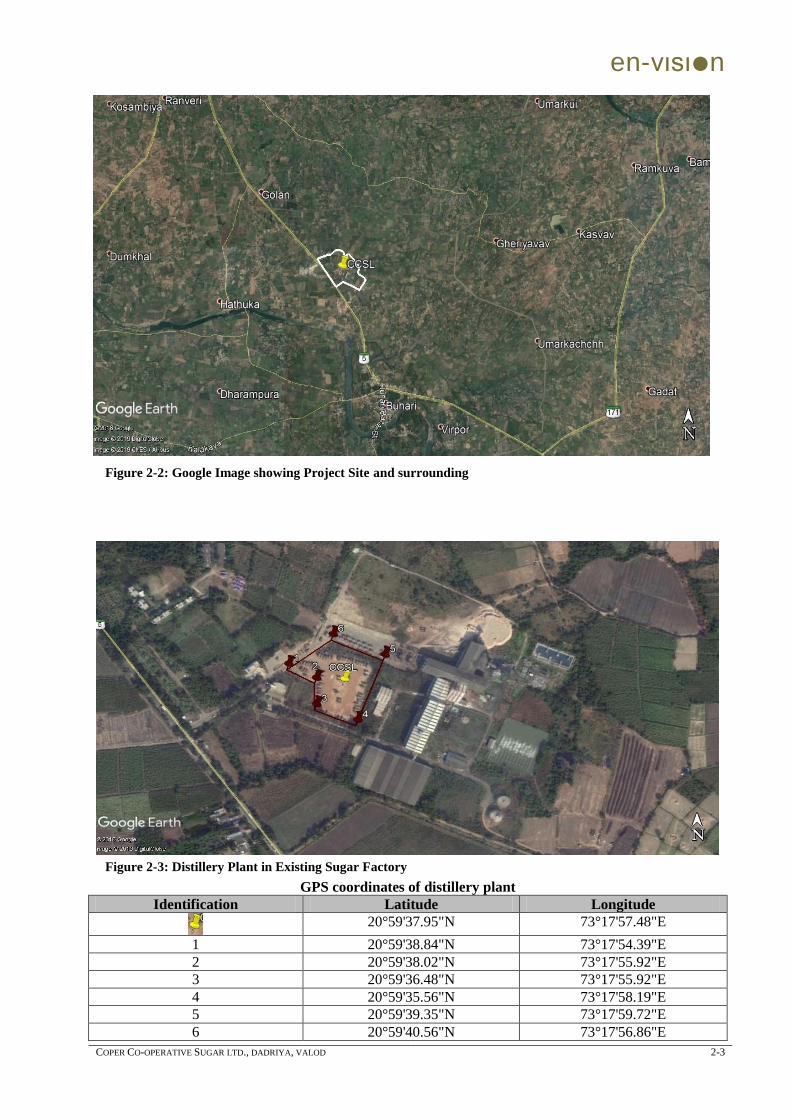
en-vιsιn
COPER CO-OPERATIVE SUGAR LTD., DADRIYA, VALOD 2-3
Figure 2-2: Google Image showing Project Site and surrounding
Figure 2-3: Distillery Plant in Existing Sugar Factory
GPS coordinates of distillery plant
Identification Latitude Longitude
20°59'37.95"N 73°17'57.48"E
1 20°59'38.84"N 73°17'54.39"E
2 20°59'38.02"N 73°17'55.92"E
3 20°59'36.48"N 73°17'55.92"E
4 20°59'35.56"N 73°17'58.19"E
5 20°59'39.35"N 73°17'59.72"E
6 20°59'40.56"N 73°17'56.86"E
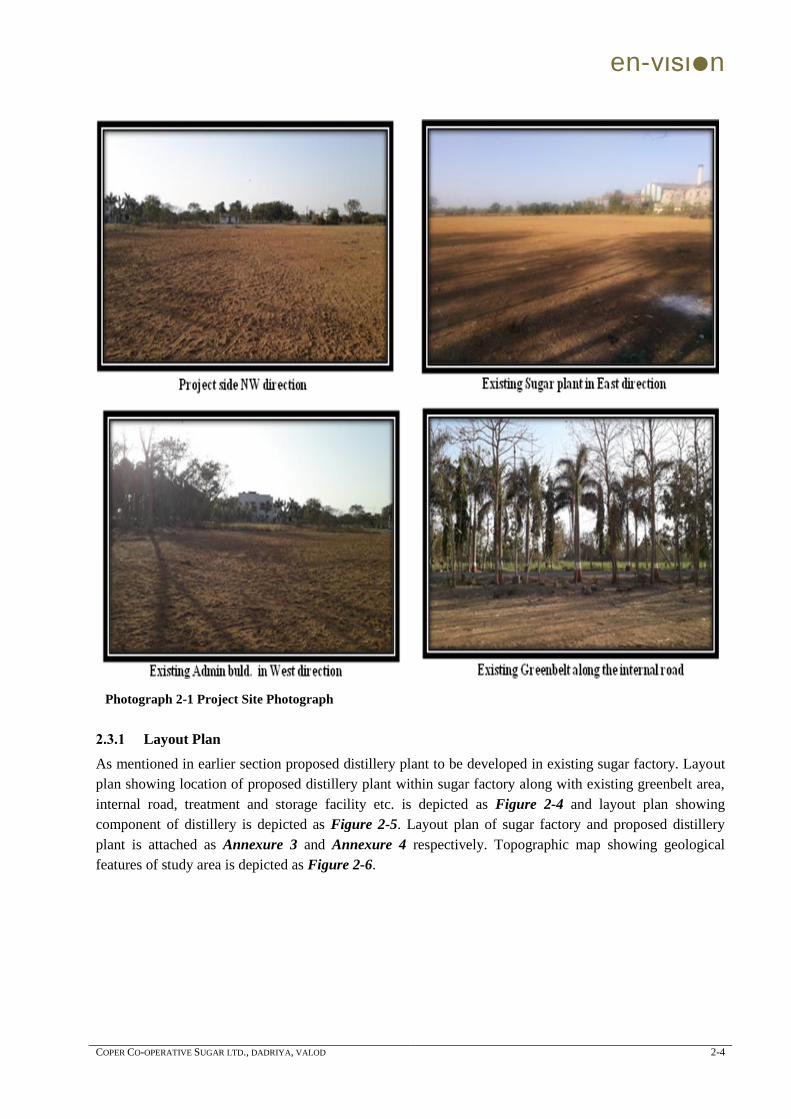
en-vιsιn
COPER CO-OPERATIVE SUGAR LTD., DADRIYA, VALOD 2-4
Photograph 2-1 Project Site Photograph
2.3.1 Layout Plan
As mentioned in earlier section proposed distillery plant to be developed in existing sugar factory. Layout
plan showing location of proposed distillery plant within sugar factory along with existing greenbelt area,
internal road, treatment and storage facility etc. is depicted as Figure 2-4 and layout plan showing
component of distillery is depicted as Figure 2-5. Layout plan of sugar factory and proposed distillery
plant is attached as Annexure 3 and Annexure 4 respectively. Topographic map showing geological
features of study area is depicted as Figure 2-6.
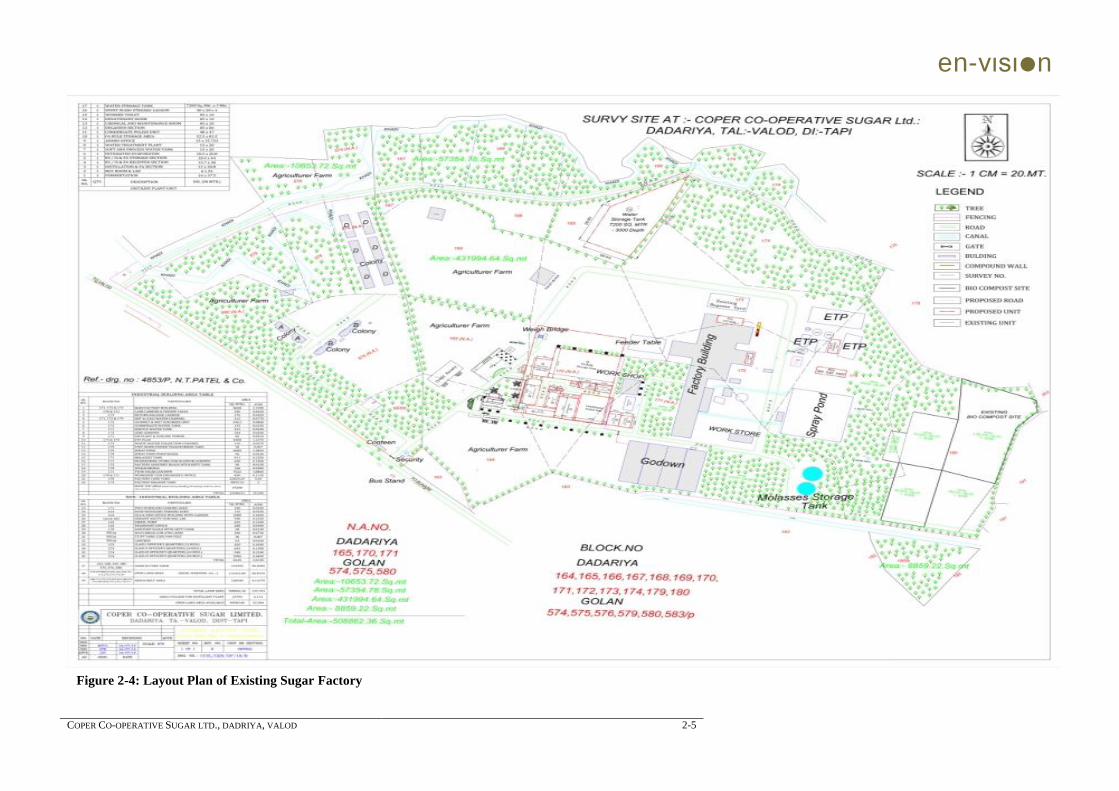
en-vιsιn
COPER CO-OPERATIVE SUGAR LTD., DADRIYA, VALOD 2-5
Figure 2-4: Layout Plan of Existing Sugar Factory
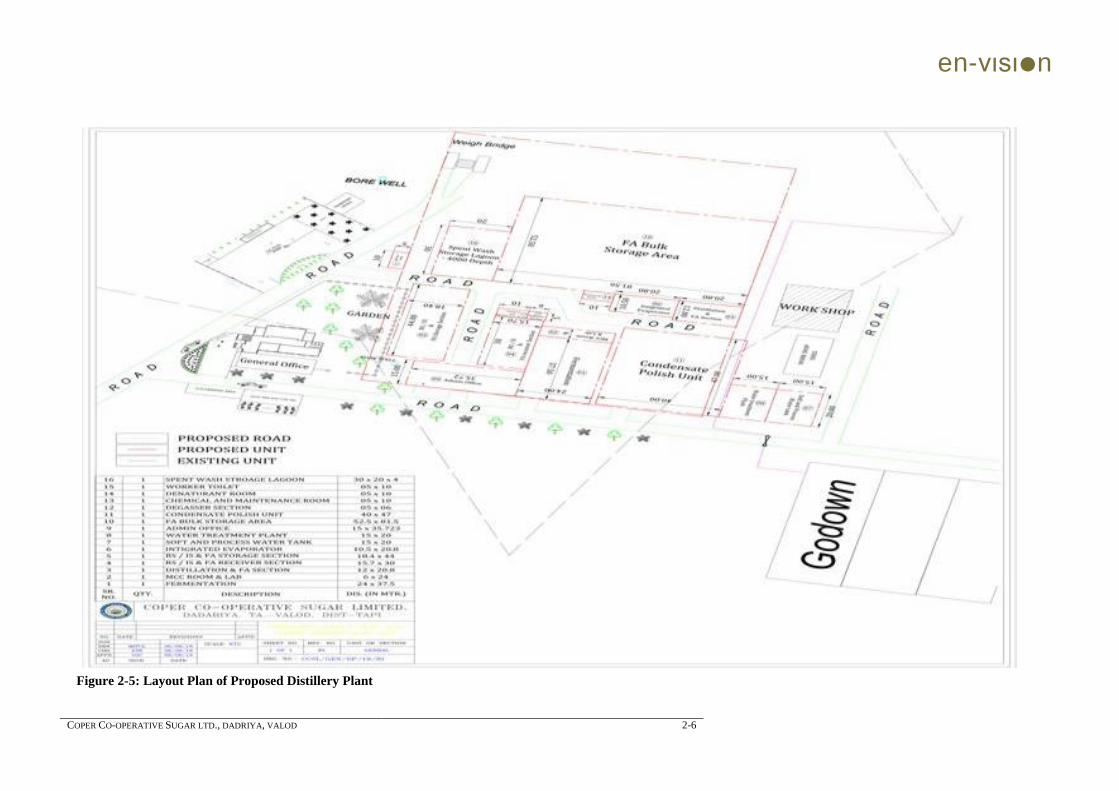
en-vιsιn
COPER CO-OPERATIVE SUGAR LTD., DADRIYA, VALOD 2-6
Figure 2-5: Layout Plan of Proposed Distillery Plant
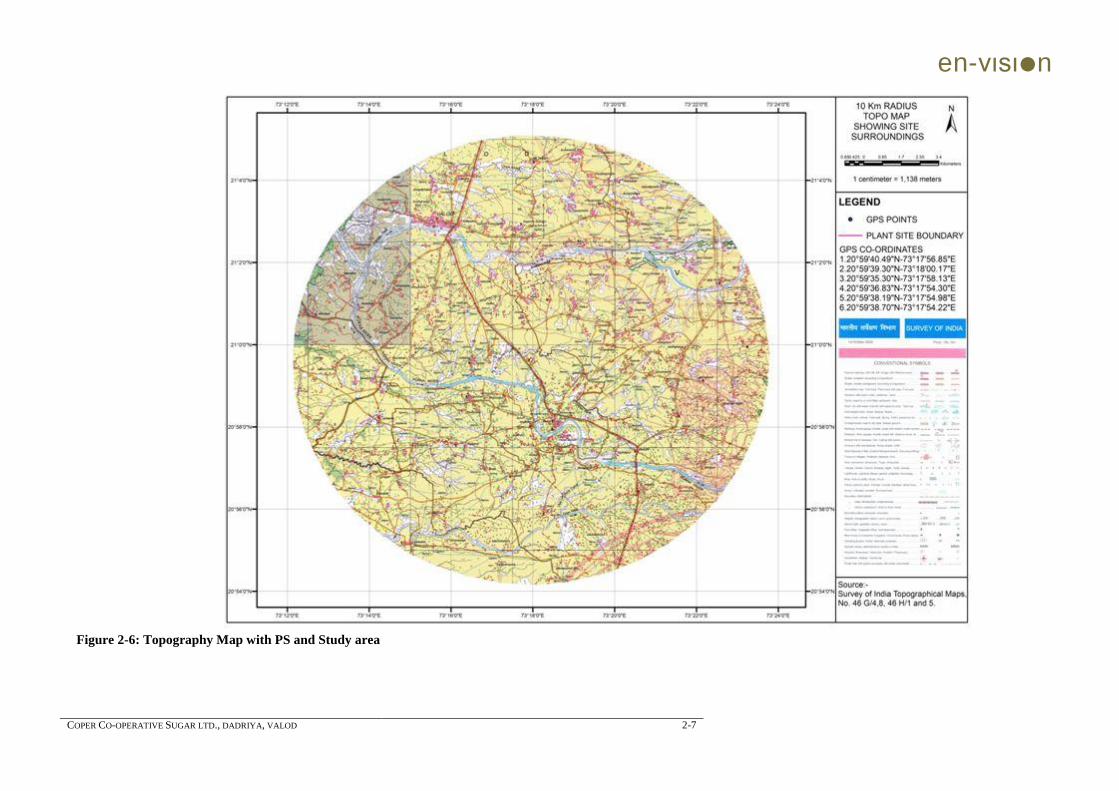
en-vιsιn
COPER CO-OPERATIVE SUGAR LTD., DADRIYA, VALOD 2-7
Figure 2-6: Topography Map with PS and Study area
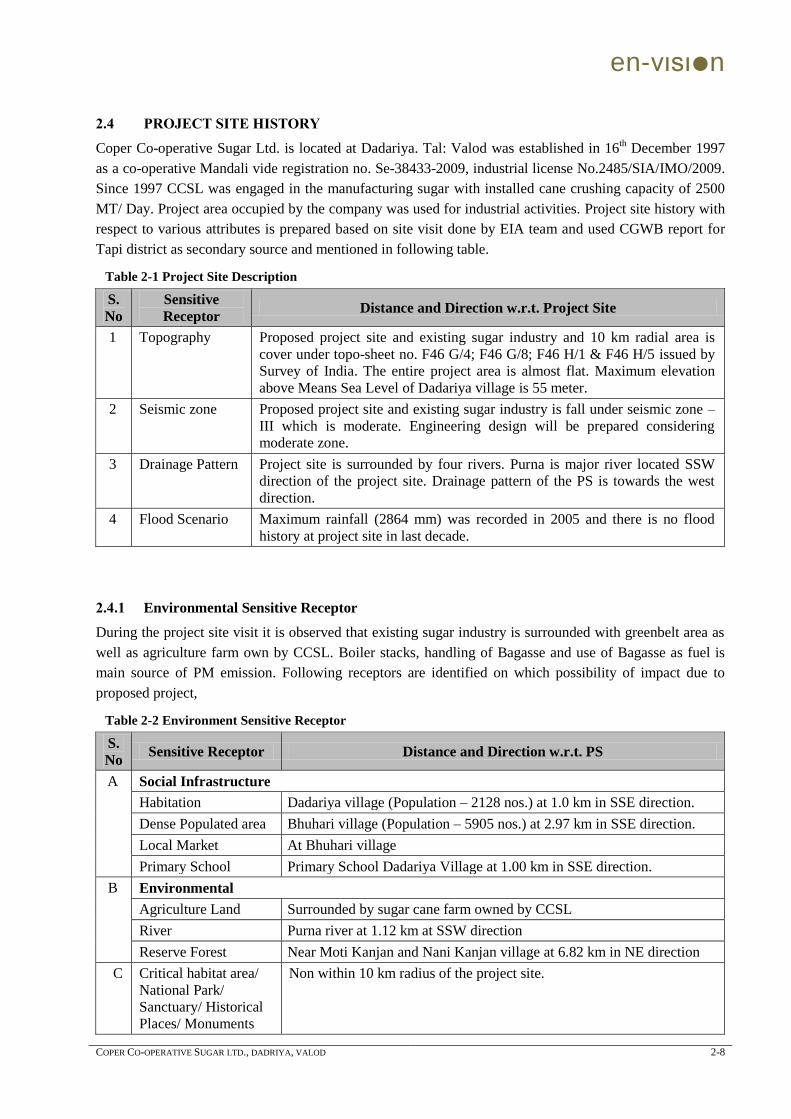
en-vιsιn
COPER CO-OPERATIVE SUGAR LTD., DADRIYA, VALOD 2-8
2.4 PROJECT SITE HISTORY
Coper Co-operative Sugar Ltd. is located at Dadariya. Tal: Valod was established in 16th December 1997
as a co-operative Mandali vide registration no. Se-38433-2009, industrial license No.2485/SIA/IMO/2009.
Since 1997 CCSL was engaged in the manufacturing sugar with installed cane crushing capacity of 2500
MT/ Day. Project area occupied by the company was used for industrial activities. Project site history with
respect to various attributes is prepared based on site visit done by EIA team and used CGWB report for
Tapi district as secondary source and mentioned in following table.
Table 2-1 Project Site Description
S.
No
Sensitive
Receptor Distance and Direction w.r.t. Project Site
1 Topography Proposed project site and existing sugar industry and 10 km radial area is
cover under topo-sheet no. F46 G/4; F46 G/8; F46 H/1 & F46 H/5 issued by
Survey of India. The entire project area is almost flat. Maximum elevation
above Means Sea Level of Dadariya village is 55 meter.
2 Seismic zone
Proposed project site and existing sugar industry is fall under seismic zone –
III which is moderate. Engineering design will be prepared considering
moderate zone.
3 Drainage Pattern Project site is surrounded by four rivers. Purna is major river located SSW
direction of the project site. Drainage pattern of the PS is towards the west
direction.
4 Flood Scenario Maximum rainfall (2864 mm) was recorded in 2005 and there is no flood
history at project site in last decade.
2.4.1 Environmental Sensitive Receptor
During the project site visit it is observed that existing sugar industry is surrounded with greenbelt area as
well as agriculture farm own by CCSL. Boiler stacks, handling of Bagasse and use of Bagasse as fuel is
main source of PM emission. Following receptors are identified on which possibility of impact due to
proposed project,
Table 2-2 Environment Sensitive Receptor
S.
No Sensitive Receptor Distance and Direction w.r.t. PS
A Social Infrastructure
Habitation Dadariya village (Population – 2128 nos.) at 1.0 km in SSE direction.
Dense Populated area Bhuhari village (Population – 5905 nos.) at 2.97 km in SSE direction.
Local Market At Bhuhari village
Primary School Primary School Dadariya Village at 1.00 km in SSE direction.
B Environmental
Agriculture Land Surrounded by sugar cane farm owned by CCSL
River Purna river at 1.12 km at SSW direction
Reserve Forest Near Moti Kanjan and Nani Kanjan village at 6.82 km in NE direction
C Critical habitat area/
National Park/
Sanctuary/ Historical
Places/ Monuments
Non within 10 km radius of the project site.
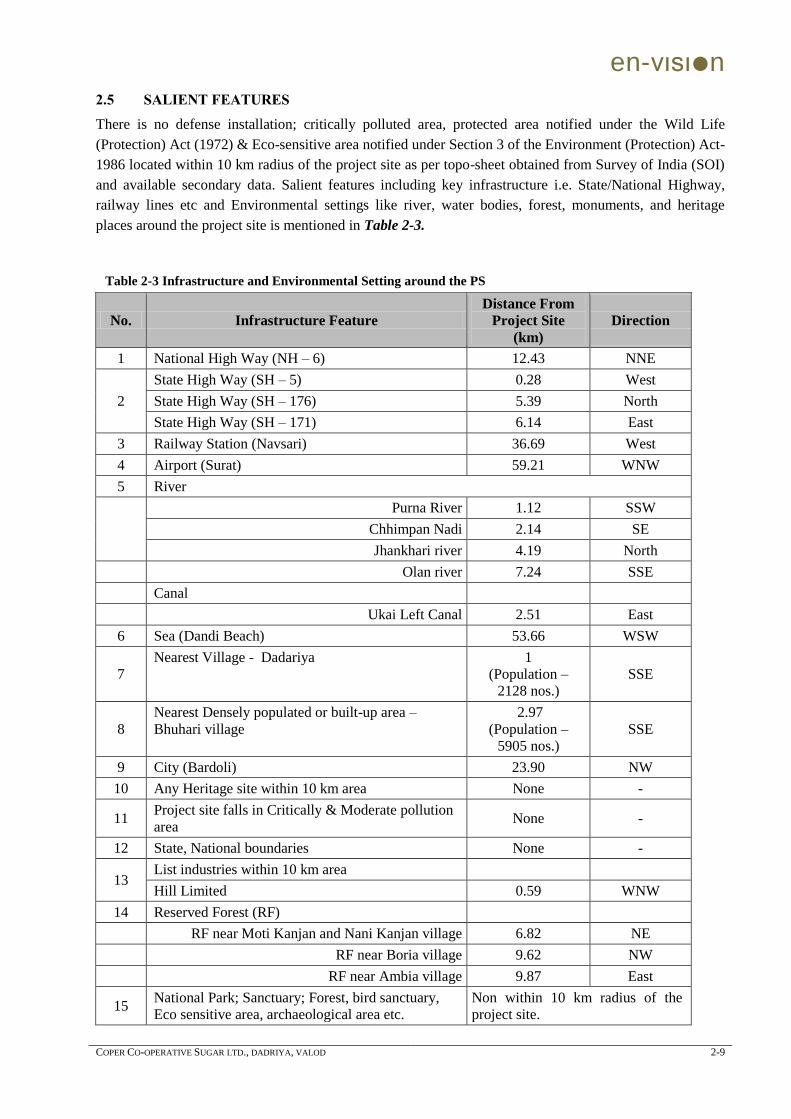
en-vιsιn
COPER CO-OPERATIVE SUGAR LTD., DADRIYA, VALOD 2-9
2.5 SALIENT FEATURES
There is no defense installation; critically polluted area, protected area notified under the Wild Life
(Protection) Act (1972) & Eco-sensitive area notified under Section 3 of the Environment (Protection) Act-
1986 located within 10 km radius of the project site as per topo-sheet obtained from Survey of India (SOI)
and available secondary data. Salient features including key infrastructure i.e. State/National Highway,
railway lines etc and Environmental settings like river, water bodies, forest, monuments, and heritage
places around the project site is mentioned in Table 2-3.
Table 2-3 Infrastructure and Environmental Setting around the PS
No. Infrastructure Feature
Distance From
Project Site
(km)
Direction
1 National High Way (NH – 6) 12.43 NNE
2
State High Way (SH – 5) 0.28 West
State High Way (SH – 176) 5.39 North
State High Way (SH – 171) 6.14 East
3 Railway Station (Navsari) 36.69 West
4 Airport (Surat) 59.21 WNW
5 River
Purna River 1.12 SSW
Chhimpan Nadi 2.14 SE
Jhankhari river 4.19 North
Olan river 7.24 SSE
Canal
Ukai Left Canal 2.51 East
6 Sea (Dandi Beach) 53.66 WSW
7
Nearest Village - Dadariya 1
(Population –
2128 nos.)
SSE
8
Nearest Densely populated or built-up area –
Bhuhari village
2.97
(Population –
5905 nos.)
SSE
9 City (Bardoli) 23.90 NW
10 Any Heritage site within 10 km area None -
11 Project site falls in Critically & Moderate pollution
area None -
12 State, National boundaries None -
13 List industries within 10 km area
Hill Limited 0.59 WNW
14 Reserved Forest (RF)
RF near Moti Kanjan and Nani Kanjan village 6.82 NE
RF near Boria village 9.62 NW
RF near Ambia village 9.87 East
15 National Park; Sanctuary; Forest, bird sanctuary,
Eco sensitive area, archaeological area etc.
Non within 10 km radius of the
project site.
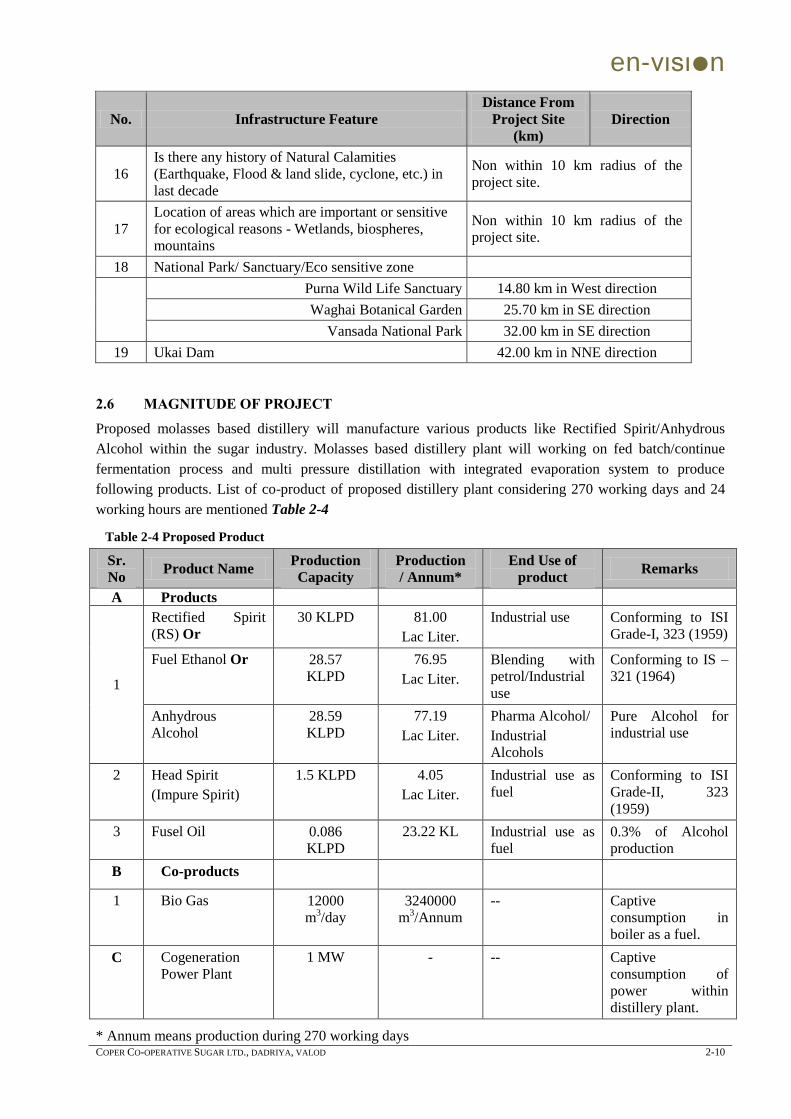
en-vιsιn
COPER CO-OPERATIVE SUGAR LTD., DADRIYA, VALOD 2-10
No. Infrastructure Feature
Distance From
Project Site
(km)
Direction
16
Is there any history of Natural Calamities
(Earthquake, Flood & land slide, cyclone, etc.) in
last decade
Non within 10 km radius of the
project site.
17
Location of areas which are important or sensitive
for ecological reasons - Wetlands, biospheres,
mountains
Non within 10 km radius of the
project site.
18 National Park/ Sanctuary/Eco sensitive zone
Purna Wild Life Sanctuary 14.80 km in West direction
Waghai Botanical Garden 25.70 km in SE direction
Vansada National Park 32.00 km in SE direction
19 Ukai Dam 42.00 km in NNE direction
2.6 MAGNITUDE OF PROJECT
Proposed molasses based distillery will manufacture various products like Rectified Spirit/Anhydrous
Alcohol within the sugar industry. Molasses based distillery plant will working on fed batch/continue
fermentation process and multi pressure distillation with integrated evaporation system to produce
following products. List of co-product of proposed distillery plant considering 270 working days and 24
working hours are mentioned Table 2-4
Table 2-4 Proposed Product
Sr.
No Product Name
Production
Capacity
Production
/ Annum*
End Use of
product Remarks
A Products
1
Rectified Spirit
(RS) Or
30 KLPD 81.00
Lac Liter.
Industrial use Conforming to ISI
Grade-I, 323 (1959)
Fuel Ethanol Or 28.57
KLPD
76.95
Lac Liter.
Blending with
petrol/Industrial
use
Conforming to IS –
321 (1964)
Anhydrous
Alcohol
28.59
KLPD
77.19
Lac Liter.
Pharma Alcohol/
Industrial
Alcohols
Pure Alcohol for
industrial use
2 Head Spirit
(Impure Spirit)
1.5 KLPD
4.05
Lac Liter.
Industrial use as
fuel
Conforming to ISI
Grade-II, 323
(1959)
3 Fusel Oil 0.086
KLPD
23.22 KL Industrial use as
fuel
0.3% of Alcohol
production
B Co-products
1 Bio Gas 12000
m3/day
3240000
m3/Annum
-- Captive
consumption in
boiler as a fuel.
C Cogeneration
Power Plant
1 MW - -- Captive
consumption of
power within
distillery plant.
* Annum means production during 270 working days
en-vιsιn
COPER CO-OPERATIVE SUGAR LTD., DADRIYA, VALOD 2-11
2.7 MANUFACTURING PROCESS
Proposed distillery plant is to be based on continue fermentation; multi-pressure vacuum and integrated
evaporation using molasses as a raw material. The continuous fermentation process involves addition of
fresh nutrient medium either continuously or intermittent withdrawal of portion of nutrient for recovery of
fermentation products. Manufacturing process of proposed products as mentioned in Table 2-4 is described
in following respective section.
2.7.1 Rectified Spirit
Multi pressure distillation system for production of Rectified Spirit consists of distillation columns namely
1. Degasifying cum analyzer column
2. Extractive Distillation column
3. Rectification Column
4. Fusel Oil Concentration column
Fermented wash is preheated in pre-heater and fed at the top of the Analyzer column, Analyzer column is
fitted with thermosyphone re-boiler. Top vapors of analyzer column are sent to extractive distillation
column. Rest of the fermented wash flows down and is taken as spent wash from analyzer column bottom.
Extractive column bottom liquid is preheated with spent-lees and fed to rectifier cum exhaust column. Low
boiling impurities are concentrated in the extractive distillation column. A top draw is taken out as impure
alcohol from the top of the extractive distillation column. The bottom of extractive distillation column is
sent to rectifier feed tank. Rectifier exhaust is operated under pressure and heats analyzer column through
reboiler. Alcohol is enriched towards the top and is drawn out as Rectified spirit. Fusel oil build-up is
avoided in the Rectifier column by withdrawing outside streams of fusel oil. These are sent to fusel oil
concentration column from where the fusel oil is sent to decanter for further separation. The fusel oil wash
water is recycled back to the column. A top draw is taken out as impure alcohol from the top of fusel oil
column & extractive distillation column.
Benefits of Pressure Multi pressure Distillation:
Following are the advantages of pressure vacuum distillation.
Since the analyzer column operates under vacuum, the formation of by- products such as acetyl
may minimize there by improvement in quality of alcohol.
The chances of scaling due to invert solubility of certain precipitating inorganic salts are
minimized in vacuum distillation.
Vacuum distillation requires low steam consumption with re-boiler i.e. 2.2 Kg/lit. of Recited Spirit
2.7.2 Head Spirit
It is either continuously or intermittent withdrawal of portion of nutrient for recovery of fermentation
products.
2.7.3 Fuel Ethanol
The continuous fermentation process proposed to manufacture of fuel ethanol is the latest and proven
technology as compared to the old batch fermentation technology. It has many advantages like continuity
of operation, higher efficiency and ease of operation. Continuous fermentation also results into consistent
performance over a long period as compared to batch fermentation.
en-vιsιn
COPER CO-OPERATIVE SUGAR LTD., DADRIYA, VALOD 2-12
Process description
Molasses after weighing is diluted and also pre-treated to an appropriate sugar concentration while
pumping through molasses broth mixer into the fermenter. The partial pre-treatment of molasses is
required to reduce scaling of the equipment due to the sludge present in the molasses, which is
separated out very easily in this pre-treatment.
The fermenters are then inoculated with culture developed in the culture vessels. This culturing with
suitable yeast is carried out only during the start-up of the plant. The culture thus developed maintains
itself in fermenters on a continuous basis.
Continuous yeast growth in yeast vessel YV03 by adding pasteurized molasses and recycling partly,
the yeast separated in yeast separator after acidification and activation treatment, which helps to avoid
contamination and maintain consistency in operation.
To help the fermentation sustain, the nitrogen is added in the medium in the form of Urea and DAP as
required. Temperature in the fermenters is maintained to an optimum level as required for efficient
reaction with the help of plate heat exchanger and recirculation pumping system. This recirculation
also helps in proper mixing of fermented wash. The retention time for the reaction is about 22 to 24
hours. Air blower is provided to supply the necessary oxygen required for the yeast and also for
agitation.
This fermentation technology use genetically marked high osmo-tolerant yeast strain.
The system optimized the cooling system to maintain fermented broth temperature to 30 0C, which
results in improve yeast cell mass activity.
The technology incorporated yeast recycle, which maintain high yeast concentration and reduced
fermentation time result in lower fermenter volume, saving in capital and operating cost.
After completion of reaction the fermented wash is delivered to yeast separation centrifugal machine
to separate the yeast cream. The technology incorporates yeast acidification and activation, which
ensure the yeast, recycle in continuous propagation vessel & fermenter is bacteria free and ensures no
contamination.
In Wash Settling Clarifier, settable solids settle down. The supernatant goes to clarified wash tank
(CWT) and sludge from bottom goes to sludge tank.
The fermented wash collected in the clarified wash tank is then pumped to stripping column for
distillation.
The CO2, which is liberated, is scrubbed in water, with the help of CO2 scrubber.
This CO2 contains ethanol, which is recovered by collecting CO2 Scrubber water into sludge
decantation.
The technology incorporated sludge decantation system, which consists of specially designed lamella
separator as against conventional, designed to settle the sludge. The
Settled sludge after dilution, from CO2 scrubber water passes through the decanter. This ensures the
clarified wash going to distillation is free from sludge, which results in clean distillation column, re-
boiler tubes and integrated spent wash evaporator tubes. This also helps to maintain consistency in
operation and avoid losses due to stoppages. Alternatively, the technology also offers pre-clarification
of molasses for high sludge/VFA content in molasses.
A closed loop cooling tower system with an induced draft-cooling tower with circulation pumps is
also provided to ensure higher cooling efficiency and to minimize water wastages.
The system incorporated mechanical ejector in place of air sparger, which results in increase the
dissolved oxygen level, facilitate better contact between yeast and fermentable sugar avoid
hydraulically dead zones, increase yeast cell mass activity for high efficiency & better yield.
The technology achieved 8-9% v/v alcohol percentage in fermented wash.
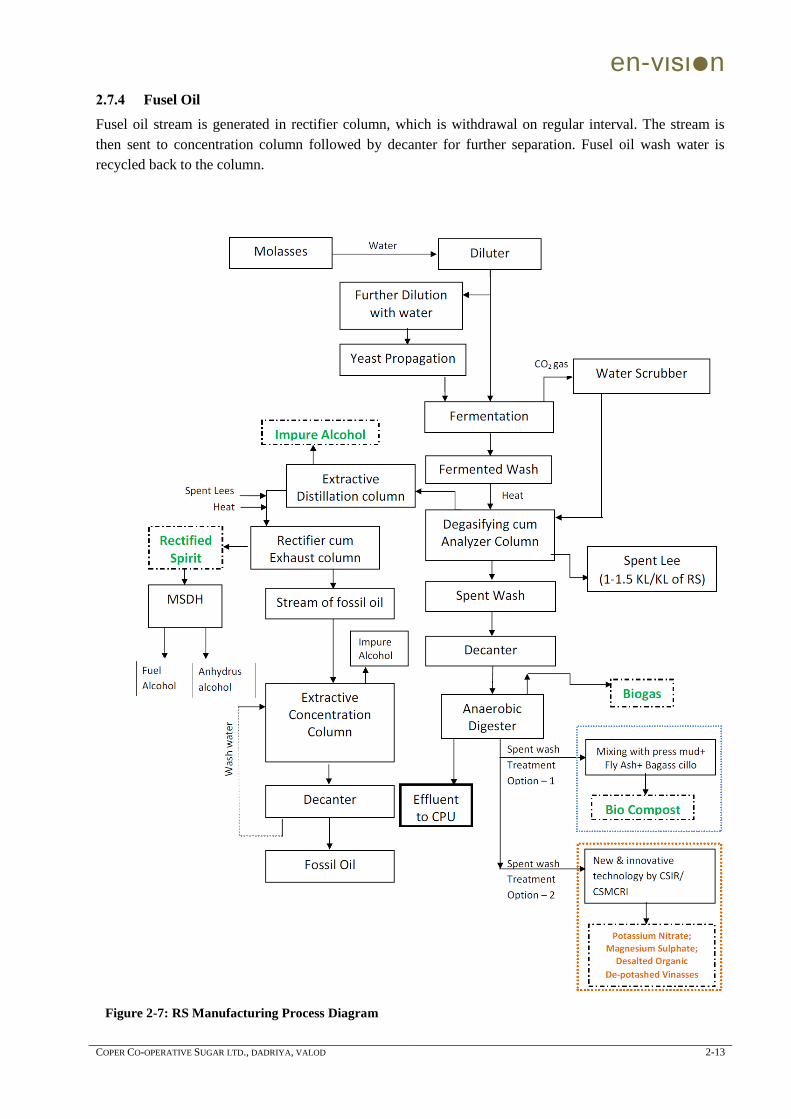
en-vιsιn
COPER CO-OPERATIVE SUGAR LTD., DADRIYA, VALOD 2-13
2.7.4 Fusel Oil
Fusel oil stream is generated in rectifier column, which is withdrawal on regular interval. The stream is
then sent to concentration column followed by decanter for further separation. Fusel oil wash water is
recycled back to the column.
Figure 2-7: RS Manufacturing Process Diagram
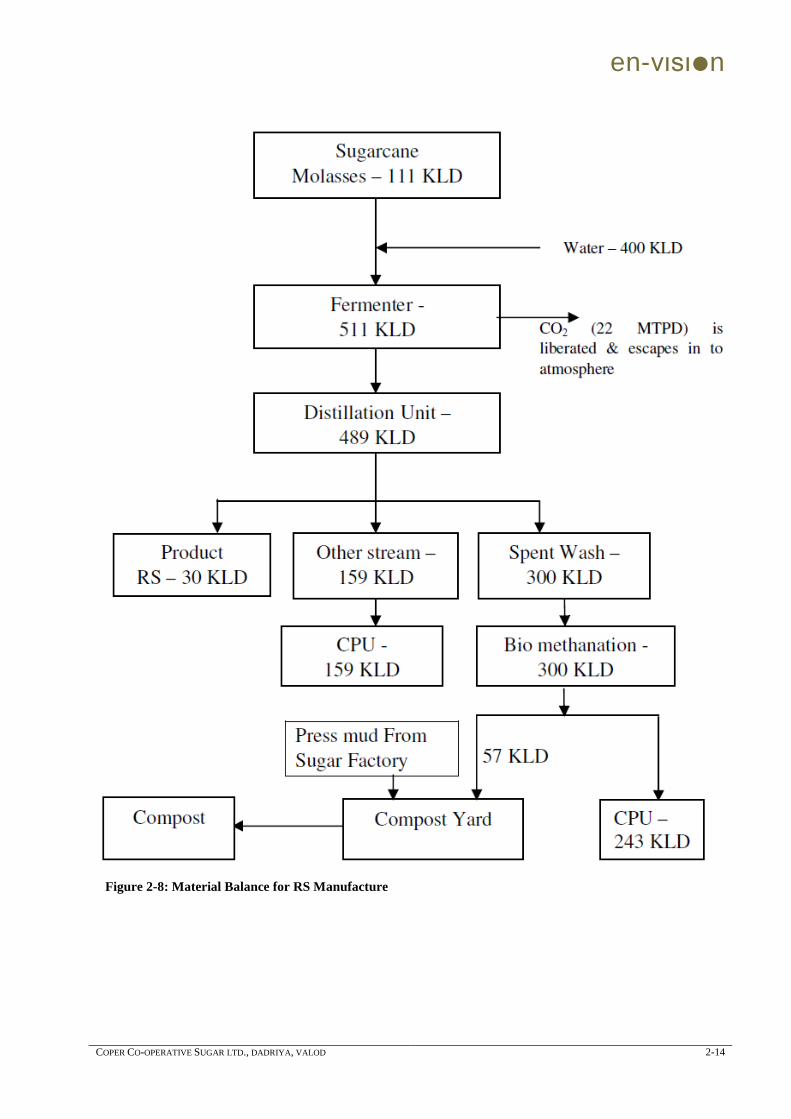
en-vιsιn
COPER CO-OPERATIVE SUGAR LTD., DADRIYA, VALOD 2-14
Figure 2-8: Material Balance for RS Manufacture
en-vιsιn
COPER CO-OPERATIVE SUGAR LTD., DADRIYA, VALOD 2-15
2.8 BIOGAS PRODUCTION
Spent wash is waste stream to be generated from distillery plant. Spent wash is colored stream having high
BOD; COD; TS and volatile solids, although pH is low. Due to biomethanation of spent wash, biogas will
be generated, which will be used either in boilers as fuel or in turbine for power generation. It ultimately
reduces use of Bagasse. Concentrated spent wash after biomethanation, will be used at bio-composting
yard.
2.8.1 Anaerobic Digestion Process
In recent years, due to escalation of energy costs and environmental concerns have increased the interest in
direct anaerobic treatment of distillery spent wash. The anaerobic method of waste treatment offers under
the present circumstances a number of significant advantages with little serious or insuperable drawbacks
over other treatment methods.
Benefits Limitations
Low production of waste biological solids Relatively long periods of time are required to start up the
process.
Low nutrient requirements It is a pre-treatment method. The treated effluent BOD
will be in the range of 5000- 8000 PPM and hence an
adequate post- treatment is usually required before the
effluent can be discharged into receiving water.
Production of methane as an Energy
Very high loading rates can be achieved
Active-anaerobic sludge can be preserved
unified for many months.
For Bio-gas, plant approximately 3000 – 4500 m2 of land and 65 to 70 HP power is required. Normally,
phosphoric acid, urea, lime etc. are required to maintain desired N & P ratio in biodegradation of organic
matter, will respect to COD and neutralization during startup of the process.
The biochemistry and microbiology of anaerobic processes is much more complicated than that of aerobic
ones. Temperature, Nutrients and Toxic substances are main environmental factors of primary importance
to anaerobic processes. Basically, the anaerobic degradation is performed by Acid producing bacteria
[Acid forming bacteria (butyric & propionic acid) Acetogenic bacteria (acetic acid & hydrogen)]
and Methane producing bacteria [Acetoacetic methane bacteria (acetophilic) Methane bacteria
(hydrogenophilic)]
The anaerobic metabolism of a complex substrate, including suspended organic matter, can be regarded as
a three-step process:
Step 1- Hydrolysis of suspended organic and soluble organic of high molecular weight.
Step 2- Degradation of small organic molecules to various volatile fatty acids, ultimately acetic acid.
Step 3- Production of methane, primarily from acetic acid but also from hydrogen and carbon dioxide.
Acid production results in formation of acetic acid or in case of instability, the higher fatty acids such as
propionic, butyric, isobutyric, valeric and iso-valeric acid. In a stable anaerobic process the concentration
of fatty acids is fairly low (0.1 – 0.3 Kg HAC/M3). Increased concentrations are indications of load
variations or a process operating near its maximum load (with a minimum safety factor). During start-up of
the anaerobic process the volatile acid concentration should be kept reasonably low (1-1.5 Kg HAC/M3)
and can be used to control the slow loading increase allowed. The hydrogen partial pressure (or redox
en-vιsιn
COPER CO-OPERATIVE SUGAR LTD., DADRIYA, VALOD 2-16
potential) regulates the production of the various acids. For digesters, operating at very short solids
retention time the concentration of propionic acid and hydrogen is increased. The use of propionic acid as
an indicator of instability has been generally accepted process control parameter all through not used much
in practice.
The acid production rate is high as compared to the methane production rate, which means that a sudden
increase in easily degradable (soluble) organic will result in increased acid production with subsequent
accumulation of the acids. This might inhibit the next step of the process the methane step. Parallel to the
acid production ammonia is released by the degradation of proteins and amino acids. The ammonia
concentrations thus established would generally not be of a magnitude that will inhibit the anaerobic
process but nitrogen rich wastes, treated in highly loaded processes, ammonia inhibition could occur.
Methane production is a slow process, in general the rate-limiting step of anaerobic degradation. Methane
is produced from acetic acid or from hydrogen and carbon dioxide. About one third of the methane has its
origin in molecular hydrogen. Small amounts of methane can be produced from methane and formic acid,
but these reactions have little practical importance. Fig. 2 depicts the main processes performed by
methane producing bacteria.
The bacteria producing methane from hydrogen and carbon dioxide are fast growing ones as compared
with the acetic acid utilizing bacteria.
2.8.1.1 Up flow Anaerobic Sludge Blanket Process
The Up-Flow Anaerobic Sludge Blanket process (UASB) operates entirely as a suspended growth system
and consequently utilizes no packing material. The reactor is initially sealed with any digester sludge and
then fed in the up-flow mode. Above the sludge, bed is a blanket zone of growth. A submerged gas
collector removes the gas bubbles produced. In the region around and above the gas separator, solid/liquid
separation takes place. Sometimes, due to prevailing operational conditions, the sludge blanket may blow
up and thereby resulting increase in SS of effluent. Thus, it needs skilled operation. The UASB reactor can
retain very high concentration of biomass and can operate at very high space loading (5-15 Kg COD / m3
/day). Full-scale sludge blanket reactors present delicate hydraulic problems in order to ensure an even
flow distribution and avoid influence by pass.
2.8.2 Technical Specifications for Biogas Plant
Sr.
No. Particulars Specification
1 Digester with assembly Quantity: 1 digester
COD loading Rate- 3 to 3.5 Kg/Cu.M/day
Material: MS
Sampling ports shall be provided at every 2 m. height. The gas
zone of dome & 1m below liquid level is to be sand blasted &
epoxy coated & surface in liquid to be sand blasted & epoxy
anticorrosive painted.
2 Central Agitator
(Shaft and impeller in SS)
One per digester, motor flame proof- Suitable HP
3 Lateral Agitator
(Shaft & impeller in SS)
3 to 4 per digester, suitable HP each
4 Gas holder (1No.) MOC: MS with polyurethane coating inside and synthetic
enamel paint outside with pressure/vacuum relief valve.
Minimum holding capacity: 300 m3
Plate thickness: Shell/top – 8/8 mm.
Basin: R.C.C. as per standards.
en-vιsιn
COPER CO-OPERATIVE SUGAR LTD., DADRIYA, VALOD 2-17
Sr.
No. Particulars Specification
5 Degasifying pond One per digester MS Sand blasting & epoxy painted 8 mm thick
6 Lamella clarifier, shell and
hopper
One per digester contact part in SS only
7 Lamella clarifier pack SS each for a lamella clarifier.
8 Equalization or buffer tank
(One day holding tank)
Masonry/brick work with impervious one using PVC lining (250
micron) and sulphate resistant cement shall be used. Since the
spent wash is highly acidic; the corrosive resistant epoxy
coatings shall be used.
9 Neutralization agent storage
tank
A suitable capacity (1/2 day equivalent of quantity required for
neutralizing agent) MS with suitable coating/RCC tank shall be
provided. The neutralizing agent of suitable concentration will
be stored in this tank. It will be provided with dosing pump,
agitator so that the pump will be actuated to release the
neutralizing solution for maintaining constant pH of influent to
biodigester.
10 Gas Flare & Equipment SS 304 burner with spark ignition facility.
11 Pressure vacuum release
device
SS 304, ON EACH DIGESTER
12 Spent wash Transfer pumps
(1+1) with valves & flow
measuring device for line
going to each digester
PUMPS: TYPE: Centrifugal non-clog type of required head and
flow as per the need of plant.
MOC of content part: SS 316 Make: KSB/Kirloskar/Aakay
MOTOR: 3 Phase, 440 V, RPM 1440 enclosure: TEFC
Make: Crompton/Siemens, suitable for pump at Sr. No.3.
13 Sludge recycling pumps
(2+1)
SS 316, one for a digester & one stand by
14 Biogas blowers (1+1)
MOC of impeller & contact parts : SS 316/SS 2205.
Twin-lobe type with flame proof motors of Crompton/ Siemens
make
15 Interconnecting piping For spent wash SS Schedule 10, for treated spent wash & for gas
HDPE 6 kg/cm2
16 Cooling Tower with pumps
(1+1) piping
Suitable capacity to reduce temperature from 850C to 370C,
Paharpur make or as specified by factory.
17 Heat exchanger for cooling
of spent wash from 850C to
370C
Type - PHE, Specify HTA
MOC - SS 316 / SS 2205
Make - Alfa-Laval /Ecoflex Gea/Dover
18 Safety Devices
Various devices to protect the plant and safety of human being
shall be flame arresters, sediment/moisture traps, high level/low
level of pressure alarms for biogas control shall be provided as per
the norms of safety and to be approved by Safety/Factory
Inspector.
Biogas pipeline (HDPE, 6 kg/cm2) with necessary supports from outlet of gas blower/ compressors
to the boiler shall be provided as per requirement by project proponent.
en-vιsιn
COPER CO-OPERATIVE SUGAR LTD., DADRIYA, VALOD 2-18
2.8.3 Bio-composting
Composting is a biological process in which organic matter is degraded under controlled conditions. It
involves microbial mineralization. The degradation gets completed in 45 days and can be divided in
to two stages,
1. About 40 days of Aerobic windrow composting and
2. About 5 days for curing in aerobic way in heaps
In the secondary evaporation system, the 12 % solids containing spent wash will be further
concentrated to 30 % solids. The mixing of the said spent wash with press-mud (50-70% moisture
and 2.5 to 3:1 proportion) is being carried out in trenches with the help of excavator- cum –loader
for mixing, turning, loading and unloading of compost material. Addition of cow dung will
provide bacterial culture required for composting. It is observed that in the first five days, fungal
activity is predominant and in subsequent days bacterial activity continues until stabilization of
organic matter into humus is accomplished.
2.8.3.1 Composting Process
Active stage when the maturation is initiated and rise in temperature which consists of first
two weeks which follows after formation of the windrows and mixing of biodegrading culture.
Maturation stage includes 2 weeks period when the temperature is maintained and the next 10
days period when the temperature starts to decline.
Curing or ripening stage allows the compost to age for four weeks until the moisture of
compost stabilizes at 30 to 35 percent.
Press mud and other filler materials (bagacillo, ash) shall be formed in windrow of size: 3.5 m width
x 1.5 m height. Windrow has to be straight, have a correct size and distance between two
windrows is 3 meter.
Using Biodegrading Culture/Inoculums: After running the machine for a day, biodegrading culture is
sprayed. It acts both as an odor reducing agent and an activator to enhance the process of raising the
temperature. Normally for every ton of press mud, 0.5 kg of culture is used. It is diluted 100 times with
effluent and sprayed on the windrows spreading over 3 days for effective results (in the 3rd
, 5th & 10
th
day). Immediately after the application of inoculums, windrows shall be aerated with mixing machine
to spread the inoculums uniformly to all parts of windrow.
Aeration: Normally mixing machine is used for mixing up the content of windrow, loosen the same
and create a situation congenial for natural aeration. When the moisture content reduces below 40%, an
addition of effluent shall restore it to 65%. If the press mud is wet (more than 70% moisture), there is
lower supply of oxygen. Moisture content shall be brought down to about 40% by giving proper
aeration. Microorganisms make use of nitrogen and carbon for their metabolic activities. The energy
required for this process is derived by aerobic decomposition. Aeration is given to raise the compost
temperature and establish an aerobic condition. The temperature shall be 60-65 C in the windrow.
Continuous spraying and aeration is done till the completion of composting cycle.
Effluent Spraying is done before aeration and quantity of effluent applied is strictly controlled so that
the windrows always have moisture content which is optimum for aerobic composting.
Merging of Windrows: Once the lumps are broken by the mixing machine and loosened, the material
gets compacted and the windrow height gets reduced due to proper degradation of organic matter with
proper aeration. After about 15 days of operation, the windrow height may reduce to about 0.5 M. At
this point, it is required to merge the two windrows in to one and continue the further processing.
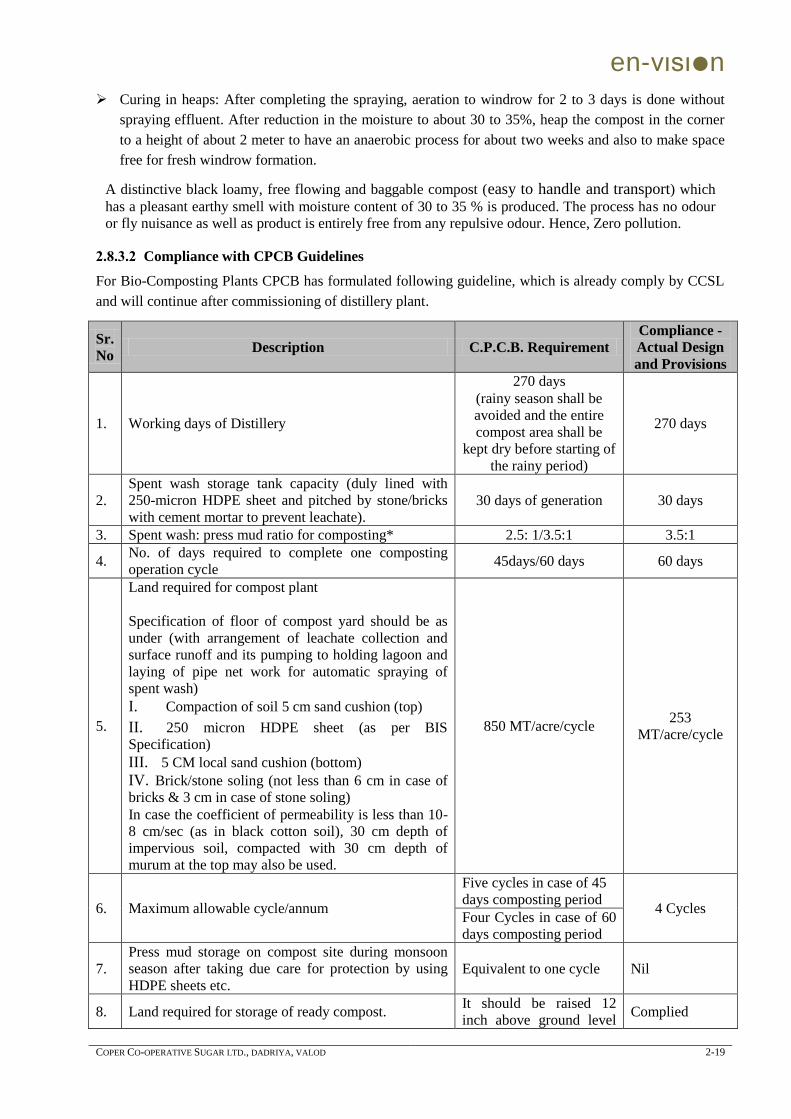
en-vιsιn
COPER CO-OPERATIVE SUGAR LTD., DADRIYA, VALOD 2-19
Curing in heaps: After completing the spraying, aeration to windrow for 2 to 3 days is done without
spraying effluent. After reduction in the moisture to about 30 to 35%, heap the compost in the corner
to a height of about 2 meter to have an anaerobic process for about two weeks and also to make space
free for fresh windrow formation.
A distinctive black loamy, free flowing and baggable compost (easy to handle and transport) which
has a pleasant earthy smell with moisture content of 30 to 35 % is produced. The process has no odour
or fly nuisance as well as product is entirely free from any repulsive odour. Hence, Zero pollution.
2.8.3.2 Compliance with CPCB Guidelines
For Bio-Composting Plants CPCB has formulated following guideline, which is already comply by CCSL
and will continue after commissioning of distillery plant.
Sr.
No Description C.P.C.B. Requirement
Compliance -
Actual Design
and Provisions
1. Working days of Distillery
270 days
(rainy season shall be
avoided and the entire
compost area shall be
kept dry before starting of
the rainy period)
270 days
2.
Spent wash storage tank capacity (duly lined with
250-micron HDPE sheet and pitched by stone/bricks
with cement mortar to prevent leachate).
30 days of generation 30 days
3. Spent wash: press mud ratio for composting* 2.5: 1/3.5:1 3.5:1
4. No. of days required to complete one composting
operation cycle 45days/60 days 60 days
5.
Land required for compost plant
Specification of floor of compost yard should be as
under (with arrangement of leachate collection and
surface runoff and its pumping to holding lagoon and
laying of pipe net work for automatic spraying of
spent wash)
I. Compaction of soil 5 cm sand cushion (top)
II. 250 micron HDPE sheet (as per BIS
Specification)
III. 5 CM local sand cushion (bottom)
IV. Brick/stone soling (not less than 6 cm in case of
bricks & 3 cm in case of stone soling)
In case the coefficient of permeability is less than 10-
8 cm/sec (as in black cotton soil), 30 cm depth of
impervious soil, compacted with 30 cm depth of
murum at the top may also be used.
850 MT/acre/cycle 253
MT/acre/cycle
6. Maximum allowable cycle/annum
Five cycles in case of 45
days composting period 4 Cycles
Four Cycles in case of 60
days composting period
7.
Press mud storage on compost site during monsoon
season after taking due care for protection by using
HDPE sheets etc.
Equivalent to one cycle Nil
8. Land required for storage of ready compost. It should be raised 12
inch above ground level Complied
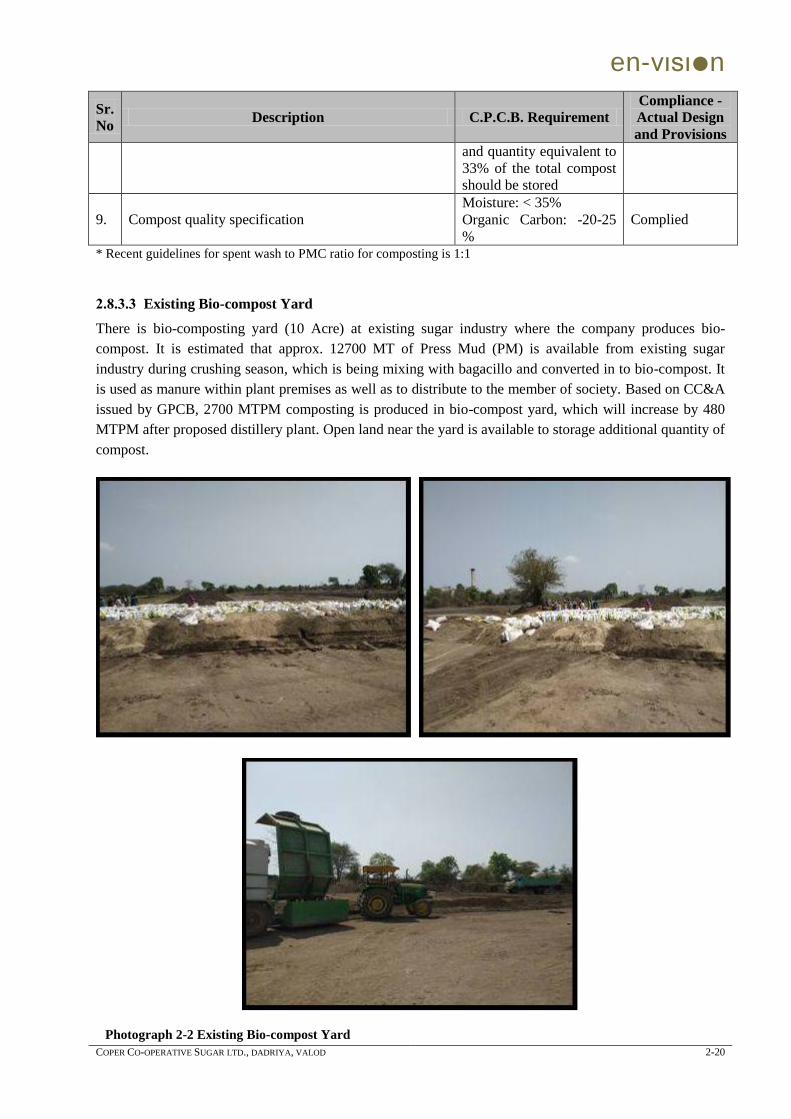
en-vιsιn
COPER CO-OPERATIVE SUGAR LTD., DADRIYA, VALOD 2-20
Sr.
No Description C.P.C.B. Requirement
Compliance -
Actual Design
and Provisions
and quantity equivalent to
33% of the total compost
should be stored
9. Compost quality specification
Moisture: < 35%
Organic Carbon: -20-25
%
Complied
* Recent guidelines for spent wash to PMC ratio for composting is 1:1
2.8.3.3 Existing Bio-compost Yard
There is bio-composting yard (10 Acre) at existing sugar industry where the company produces bio-
compost. It is estimated that approx. 12700 MT of Press Mud (PM) is available from existing sugar
industry during crushing season, which is being mixing with bagacillo and converted in to bio-compost. It
is used as manure within plant premises as well as to distribute to the member of society. Based on CC&A
issued by GPCB, 2700 MTPM composting is produced in bio-compost yard, which will increase by 480
MTPM after proposed distillery plant. Open land near the yard is available to storage additional quantity of
compost.
Photograph 2-2 Existing Bio-compost Yard
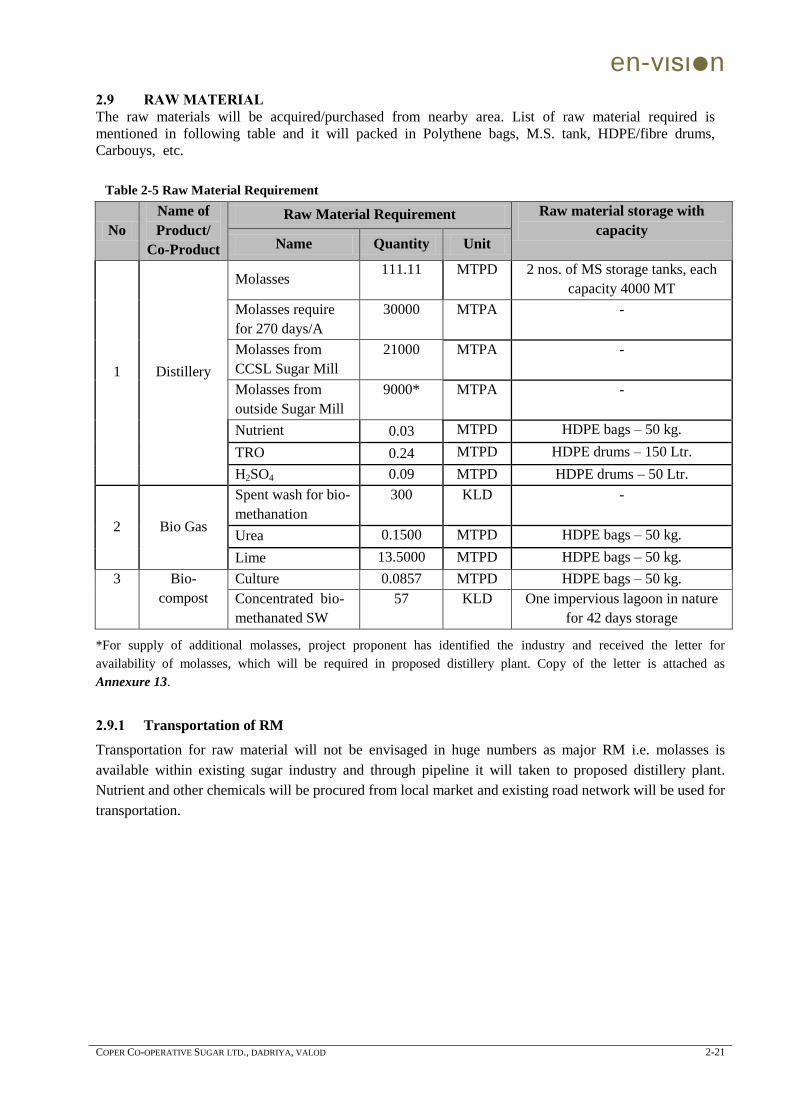
en-vιsιn
COPER CO-OPERATIVE SUGAR LTD., DADRIYA, VALOD 2-21
2.9 RAW MATERIAL
The raw materials will be acquired/purchased from nearby area. List of raw material required is
mentioned in following table and it will packed in Polythene bags, M.S. tank, HDPE/fibre drums,
Carbouys, etc.
Table 2-5 Raw Material Requirement
No
Name of
Product/
Co-Product
Raw Material Requirement Raw material storage with
capacity Name Quantity Unit
1 Distillery
Molasses 111.11 MTPD 2 nos. of MS storage tanks, each
capacity 4000 MT
Molasses require
for 270 days/A
30000 MTPA -
Molasses from
CCSL Sugar Mill
21000 MTPA -
Molasses from
outside Sugar Mill
9000* MTPA -
Nutrient 0.03 MTPD HDPE bags – 50 kg.
TRO 0.24 MTPD HDPE drums – 150 Ltr.
H2SO4 0.09 MTPD HDPE drums – 50 Ltr.
2 Bio Gas
Spent wash for bio-
methanation
300 KLD -
Urea 0.1500 MTPD HDPE bags – 50 kg.
Lime 13.5000 MTPD HDPE bags – 50 kg.
3 Bio-
compost
Culture 0.0857 MTPD HDPE bags – 50 kg.
Concentrated bio-
methanated SW
57 KLD One impervious lagoon in nature
for 42 days storage
*For supply of additional molasses, project proponent has identified the industry and received the letter for
availability of molasses, which will be required in proposed distillery plant. Copy of the letter is attached as
Annexure 13.
2.9.1 Transportation of RM
Transportation for raw material will not be envisaged in huge numbers as major RM i.e. molasses is
available within existing sugar industry and through pipeline it will taken to proposed distillery plant.
Nutrient and other chemicals will be procured from local market and existing road network will be used for
transportation.
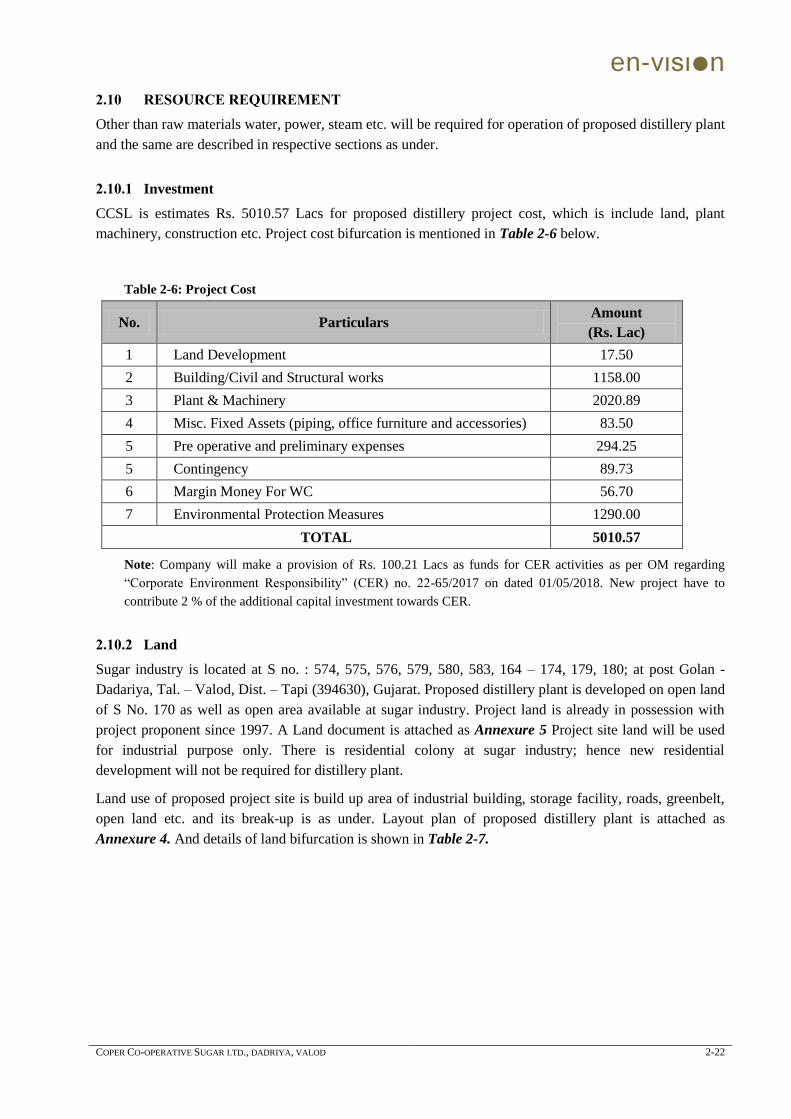
en-vιsιn
COPER CO-OPERATIVE SUGAR LTD., DADRIYA, VALOD 2-22
2.10 RESOURCE REQUIREMENT
Other than raw materials water, power, steam etc. will be required for operation of proposed distillery plant
and the same are described in respective sections as under.
2.10.1 Investment
CCSL is estimates Rs. 5010.57 Lacs for proposed distillery project cost, which is include land, plant
machinery, construction etc. Project cost bifurcation is mentioned in Table 2-6 below.
Table 2-6: Project Cost
No. Particulars Amount
(Rs. Lac)
1 Land Development 17.50
2 Building/Civil and Structural works 1158.00
3 Plant & Machinery 2020.89
4 Misc. Fixed Assets (piping, office furniture and accessories) 83.50
5 Pre operative and preliminary expenses 294.25
5 Contingency 89.73
6 Margin Money For WC 56.70
7 Environmental Protection Measures 1290.00
TOTAL 5010.57
Note: Company will make a provision of Rs. 100.21 Lacs as funds for CER activities as per OM regarding
“Corporate Environment Responsibility” (CER) no. 22-65/2017 on dated 01/05/2018. New project have to
contribute 2 % of the additional capital investment towards CER.
2.10.2 Land
Sugar industry is located at S no. : 574, 575, 576, 579, 580, 583, 164 – 174, 179, 180; at post Golan -
Dadariya, Tal. – Valod, Dist. – Tapi (394630), Gujarat. Proposed distillery plant is developed on open land
of S No. 170 as well as open area available at sugar industry. Project land is already in possession with
project proponent since 1997. A Land document is attached as Annexure 5 Project site land will be used
for industrial purpose only. There is residential colony at sugar industry; hence new residential
development will not be required for distillery plant.
Land use of proposed project site is build up area of industrial building, storage facility, roads, greenbelt,
open land etc. and its break-up is as under. Layout plan of proposed distillery plant is attached as
Annexure 4. And details of land bifurcation is shown in Table 2-7.
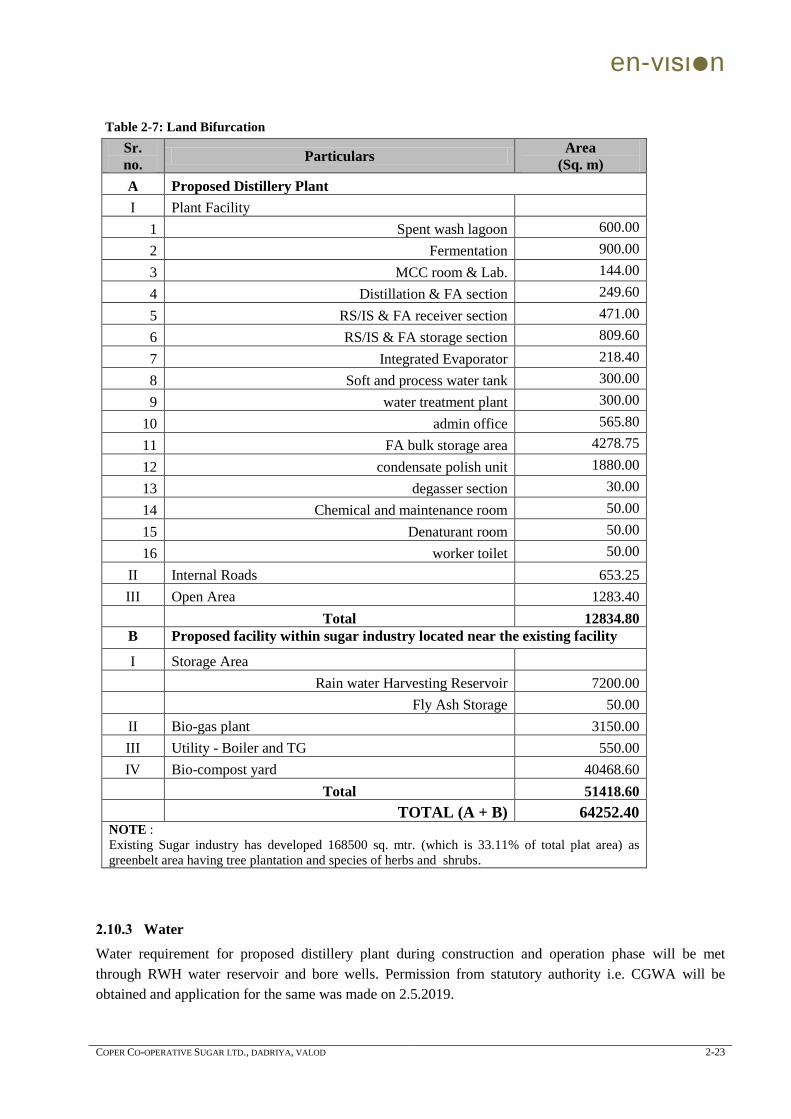
en-vιsιn
COPER CO-OPERATIVE SUGAR LTD., DADRIYA, VALOD 2-23
Table 2-7: Land Bifurcation
Sr.
no. Particulars
Area
(Sq. m)
A Proposed Distillery Plant
I Plant Facility
1 Spent wash lagoon 600.00
2 Fermentation 900.00
3 MCC room & Lab. 144.00
4 Distillation & FA section 249.60
5 RS/IS & FA receiver section 471.00
6 RS/IS & FA storage section 809.60
7 Integrated Evaporator 218.40
8 Soft and process water tank 300.00
9 water treatment plant 300.00
10 admin office 565.80
11 FA bulk storage area 4278.75
12 condensate polish unit 1880.00
13 degasser section 30.00
14 Chemical and maintenance room 50.00
15 Denaturant room 50.00
16 worker toilet 50.00
II Internal Roads 653.25
III Open Area 1283.40
Total 12834.80
B Proposed facility within sugar industry located near the existing facility
I Storage Area
Rain water Harvesting Reservoir 7200.00
Fly Ash Storage 50.00
II Bio-gas plant 3150.00
III Utility - Boiler and TG 550.00
IV Bio-compost yard 40468.60
Total 51418.60
TOTAL (A + B) 64252.40 NOTE :
Existing Sugar industry has developed 168500 sq. mtr. (which is 33.11% of total plat area) as
greenbelt area having tree plantation and species of herbs and shrubs.
2.10.3 Water
Water requirement for proposed distillery plant during construction and operation phase will be met
through RWH water reservoir and bore wells. Permission from statutory authority i.e. CGWA will be
obtained and application for the same was made on 2.5.2019.
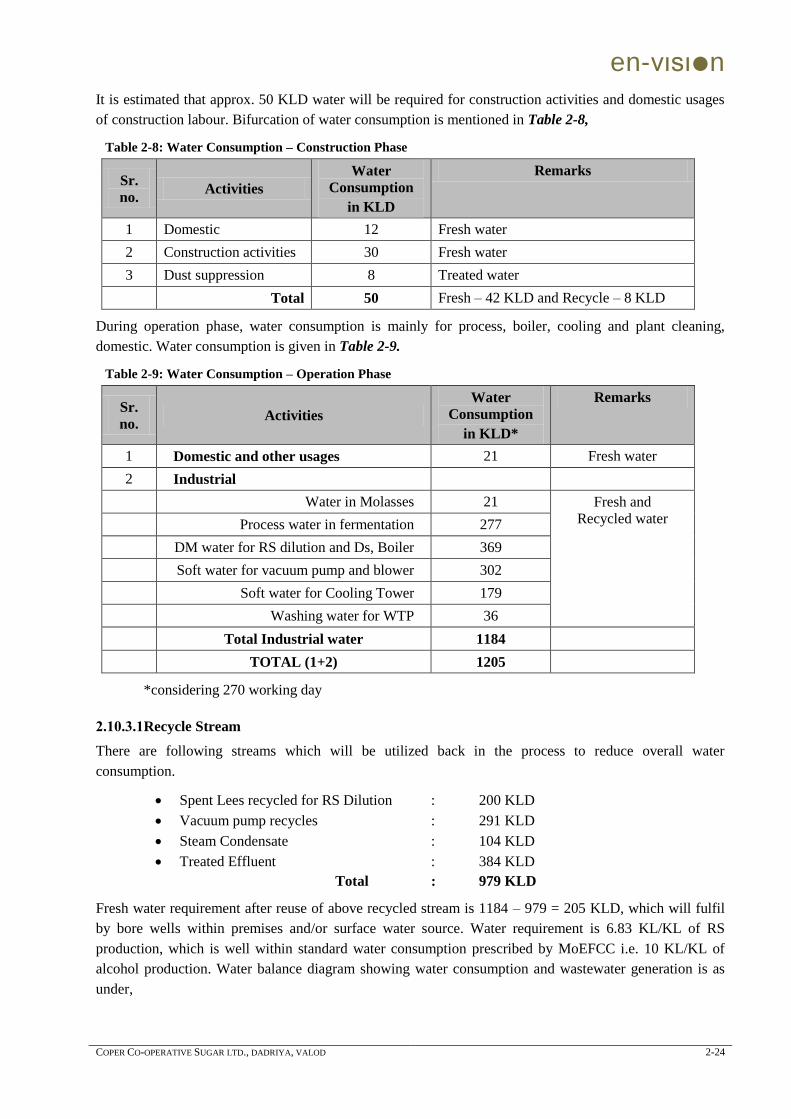
en-vιsιn
COPER CO-OPERATIVE SUGAR LTD., DADRIYA, VALOD 2-24
It is estimated that approx. 50 KLD water will be required for construction activities and domestic usages
of construction labour. Bifurcation of water consumption is mentioned in Table 2-8,
Table 2-8: Water Consumption – Construction Phase
Sr.
no. Activities
Water
Consumption
in KLD
Remarks
1 Domestic 12 Fresh water
2 Construction activities 30 Fresh water
3 Dust suppression 8 Treated water
Total 50 Fresh – 42 KLD and Recycle – 8 KLD
During operation phase, water consumption is mainly for process, boiler, cooling and plant cleaning,
domestic. Water consumption is given in Table 2-9.
Table 2-9: Water Consumption – Operation Phase
Sr.
no. Activities
Water
Consumption
in KLD*
Remarks
1 Domestic and other usages 21 Fresh water
2 Industrial
Water in Molasses 21 Fresh and
Recycled water
Process water in fermentation 277
DM water for RS dilution and Ds, Boiler 369
Soft water for vacuum pump and blower 302
Soft water for Cooling Tower 179
Washing water for WTP 36
Total Industrial water 1184
TOTAL (1+2) 1205
*considering 270 working day
2.10.3.1 Recycle Stream
There are following streams which will be utilized back in the process to reduce overall water
consumption.
Spent Lees recycled for RS Dilution : 200 KLD
Vacuum pump recycles : 291 KLD
Steam Condensate : 104 KLD
Treated Effluent : 384 KLD
Total : 979 KLD
Fresh water requirement after reuse of above recycled stream is 1184 – 979 = 205 KLD, which will fulfil
by bore wells within premises and/or surface water source. Water requirement is 6.83 KL/KL of RS
production, which is well within standard water consumption prescribed by MoEFCC i.e. 10 KL/KL of
alcohol production. Water balance diagram showing water consumption and wastewater generation is as
under,
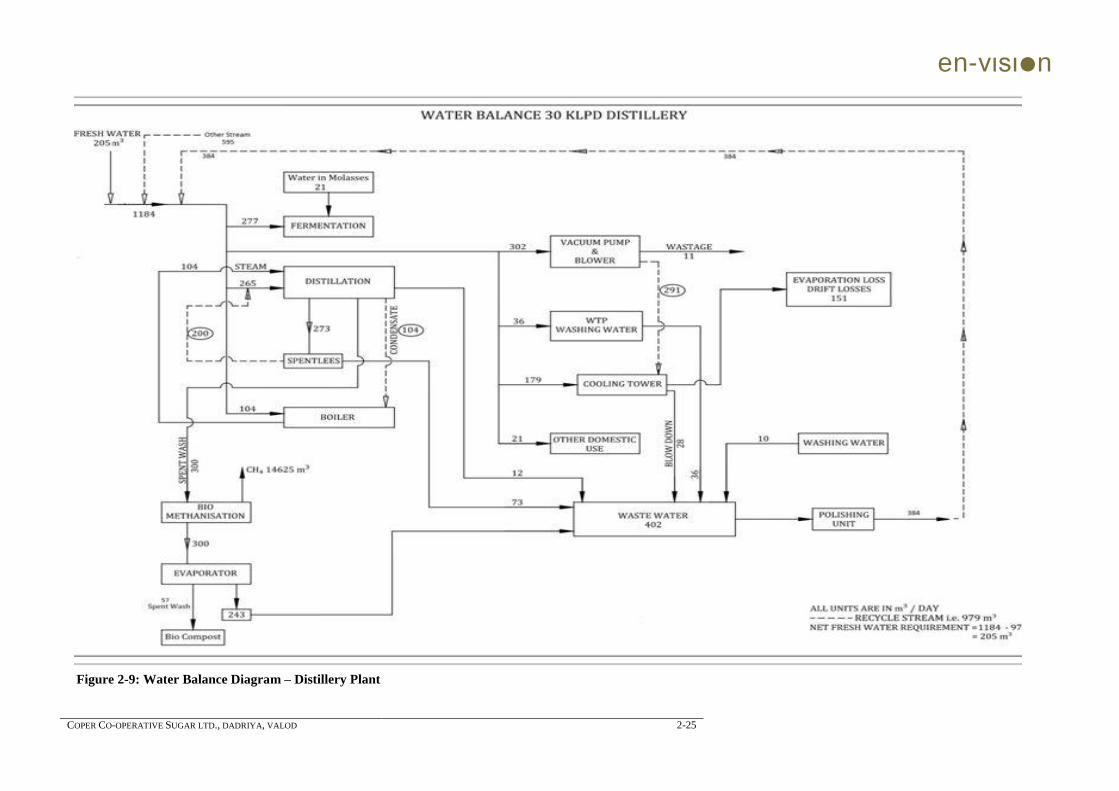
en-vιsιn
COPER CO-OPERATIVE SUGAR LTD., DADRIYA, VALOD 2-25
Figure 2-9: Water Balance Diagram – Distillery Plant
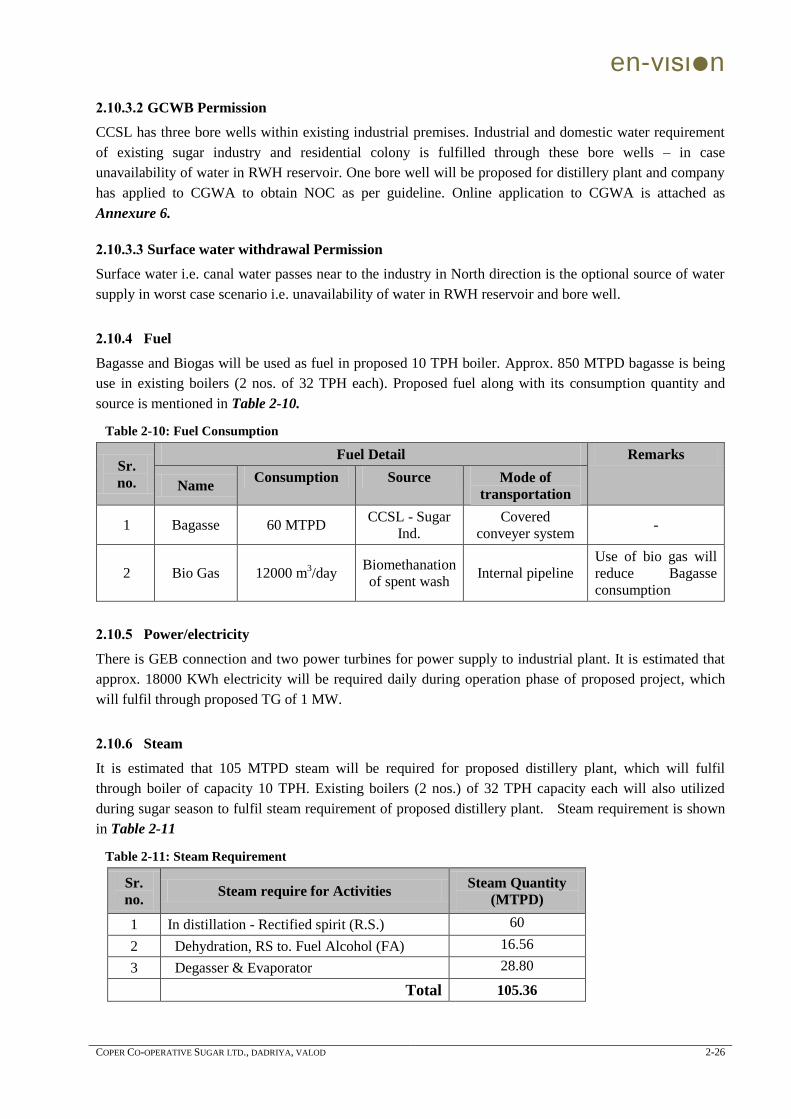
en-vιsιn
COPER CO-OPERATIVE SUGAR LTD., DADRIYA, VALOD 2-26
2.10.3.2 GCWB Permission
CCSL has three bore wells within existing industrial premises. Industrial and domestic water requirement
of existing sugar industry and residential colony is fulfilled through these bore wells – in case
unavailability of water in RWH reservoir. One bore well will be proposed for distillery plant and company
has applied to CGWA to obtain NOC as per guideline. Online application to CGWA is attached as
Annexure 6.
2.10.3.3 Surface water withdrawal Permission
Surface water i.e. canal water passes near to the industry in North direction is the optional source of water
supply in worst case scenario i.e. unavailability of water in RWH reservoir and bore well.
2.10.4 Fuel
Bagasse and Biogas will be used as fuel in proposed 10 TPH boiler. Approx. 850 MTPD bagasse is being
use in existing boilers (2 nos. of 32 TPH each). Proposed fuel along with its consumption quantity and
source is mentioned in Table 2-10.
Table 2-10: Fuel Consumption
Sr.
no.
Fuel Detail Remarks
Name Consumption Source Mode of
transportation
1 Bagasse 60 MTPD CCSL - Sugar
Ind.
Covered
conveyer system -
2 Bio Gas 12000 m3/day
Biomethanation
of spent wash Internal pipeline
Use of bio gas will
reduce Bagasse
consumption
2.10.5 Power/electricity
There is GEB connection and two power turbines for power supply to industrial plant. It is estimated that
approx. 18000 KWh electricity will be required daily during operation phase of proposed project, which
will fulfil through proposed TG of 1 MW.
2.10.6 Steam
It is estimated that 105 MTPD steam will be required for proposed distillery plant, which will fulfil
through boiler of capacity 10 TPH. Existing boilers (2 nos.) of 32 TPH capacity each will also utilized
during sugar season to fulfil steam requirement of proposed distillery plant. Steam requirement is shown
in Table 2-11
Table 2-11: Steam Requirement
Sr.
no. Steam require for Activities
Steam Quantity
(MTPD)
1 In distillation - Rectified spirit (R.S.) 60
2 Dehydration, RS to. Fuel Alcohol (FA)
16.56
3 Degasser & Evaporator
28.80
Total 105.36
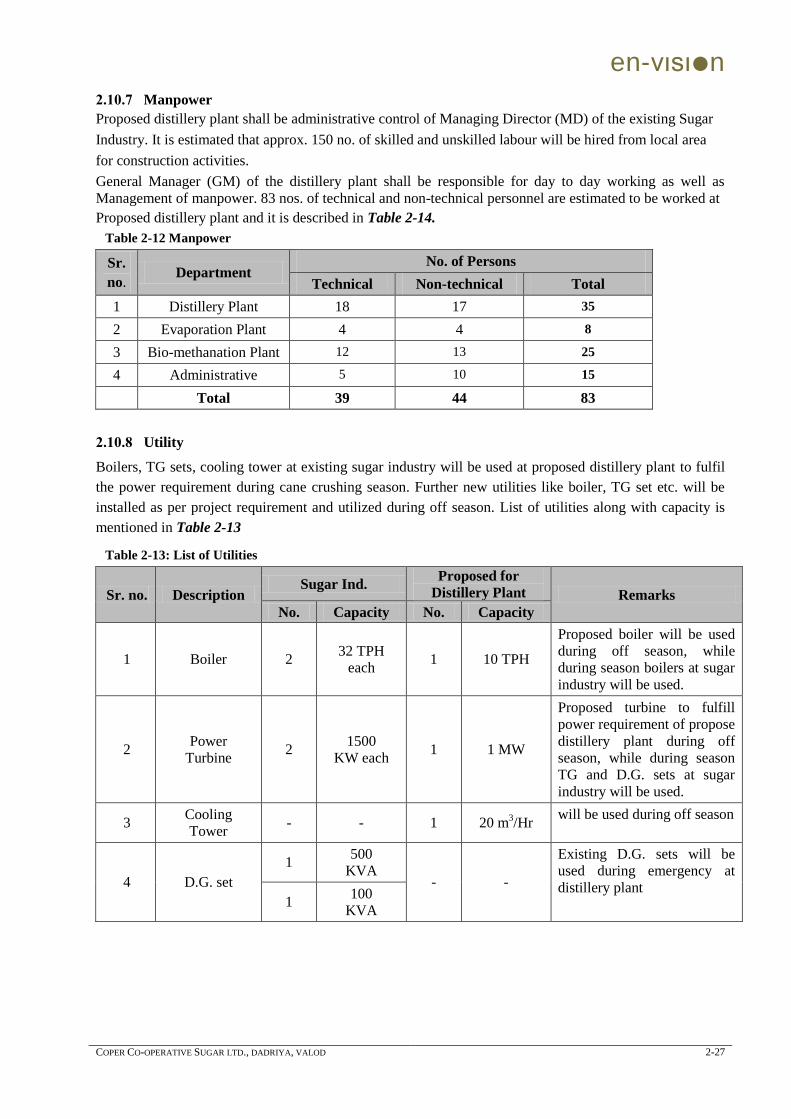
en-vιsιn
COPER CO-OPERATIVE SUGAR LTD., DADRIYA, VALOD 2-27
2.10.7 Manpower
Proposed distillery plant shall be administrative control of Managing Director (MD) of the existing Sugar
Industry. It is estimated that approx. 150 no. of skilled and unskilled labour will be hired from local area
for construction activities.
General Manager (GM) of the distillery plant shall be responsible for day to day working as well as
Management of manpower. 83 nos. of technical and non-technical personnel are estimated to be worked at
Proposed distillery plant and it is described in Table 2-14.
Table 2-12 Manpower
Sr.
no. Department
No. of Persons
Technical Non-technical Total
1 Distillery Plant 18 17 35
2 Evaporation Plant 4 4 8
3 Bio-methanation Plant 12 13 25
4 Administrative 5 10 15
Total 39 44 83
2.10.8 Utility
Boilers, TG sets, cooling tower at existing sugar industry will be used at proposed distillery plant to fulfil
the power requirement during cane crushing season. Further new utilities like boiler, TG set etc. will be
installed as per project requirement and utilized during off season. List of utilities along with capacity is
mentioned in Table 2-13
Table 2-13: List of Utilities
Sr. no. Description Sugar Ind.
Proposed for
Distillery Plant Remarks
No. Capacity No. Capacity
1 Boiler 2 32 TPH
each 1 10 TPH
Proposed boiler will be used
during off season, while
during season boilers at sugar
industry will be used.
2 Power
Turbine 2
1500
KW each 1 1 MW
Proposed turbine to fulfill
power requirement of propose
distillery plant during off
season, while during season
TG and D.G. sets at sugar
industry will be used.
3 Cooling
Tower - - 1 20 m
3/Hr
will be used during off season
4 D.G. set
1 500
KVA - -
Existing D.G. sets will be
used during emergency at
distillery plant 1
100
KVA
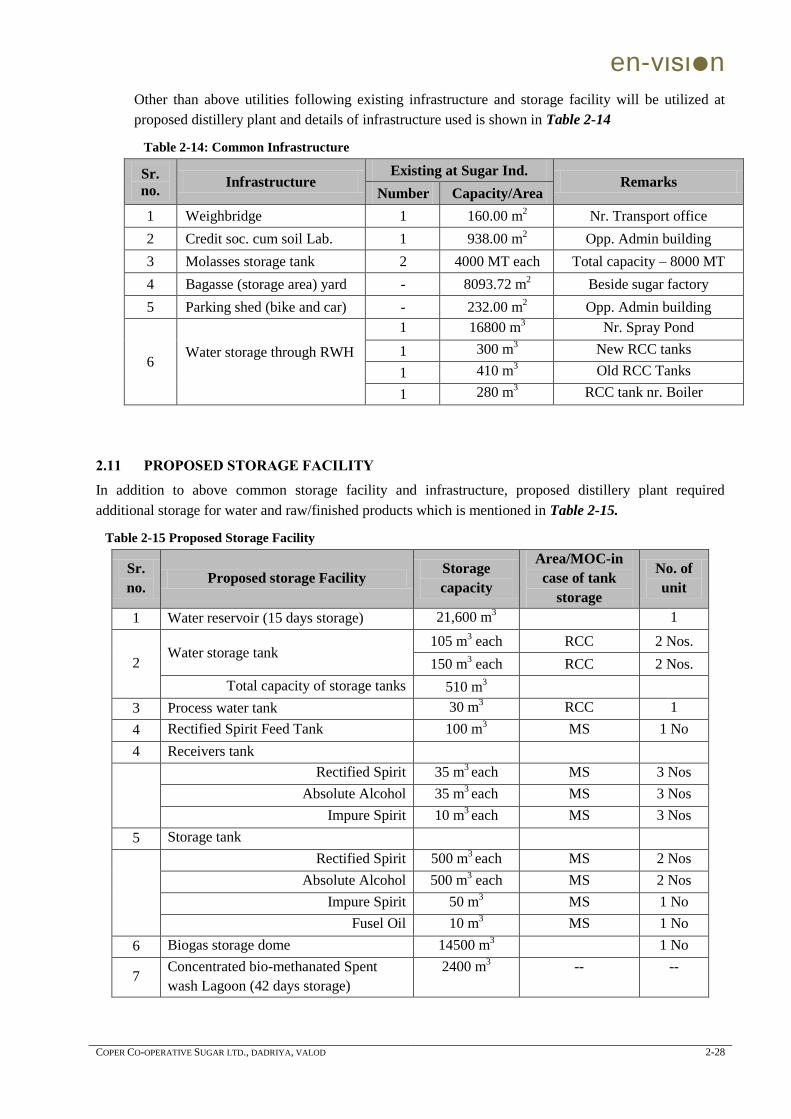
en-vιsιn
COPER CO-OPERATIVE SUGAR LTD., DADRIYA, VALOD 2-28
Other than above utilities following existing infrastructure and storage facility will be utilized at
proposed distillery plant and details of infrastructure used is shown in Table 2-14
Table 2-14: Common Infrastructure
Sr.
no. Infrastructure
Existing at Sugar Ind. Remarks
Number Capacity/Area
1 Weighbridge 1 160.00 m2 Nr. Transport office
2 Credit soc. cum soil Lab. 1 938.00 m2 Opp. Admin building
3 Molasses storage tank 2 4000 MT each Total capacity – 8000 MT
4 Bagasse (storage area) yard - 8093.72 m2 Beside sugar factory
5 Parking shed (bike and car) - 232.00 m2 Opp. Admin building
6 Water storage through RWH
1 16800 m3 Nr. Spray Pond
1 300 m3 New RCC tanks
1 410 m3 Old RCC Tanks
1 280 m3 RCC tank nr. Boiler
2.11 PROPOSED STORAGE FACILITY
In addition to above common storage facility and infrastructure, proposed distillery plant required
additional storage for water and raw/finished products which is mentioned in Table 2-15.
Table 2-15 Proposed Storage Facility
Sr.
no. Proposed storage Facility
Storage
capacity
Area/MOC-in
case of tank
storage
No. of
unit
1 Water reservoir (15 days storage) 21,600 m3 1
2 Water storage tank
105 m3 each RCC 2 Nos.
150 m3 each RCC 2 Nos.
Total capacity of storage tanks 510 m3
3 Process water tank 30 m3 RCC 1
4 Rectified Spirit Feed Tank 100 m3 MS 1 No
4 Receivers tank
Rectified Spirit 35 m3 each MS 3 Nos
Absolute Alcohol 35 m3 each MS 3 Nos
Impure Spirit 10 m3 each MS 3 Nos
5 Storage tank
Rectified Spirit 500 m3 each MS 2 Nos
Absolute Alcohol 500 m3 each MS 2 Nos
Impure Spirit 50 m3 MS 1 No
Fusel Oil 10 m3 MS 1 No
6 Biogas storage dome 14500 m3 1 No
7 Concentrated bio-methanated Spent
wash Lagoon (42 days storage)
2400 m3 -- --
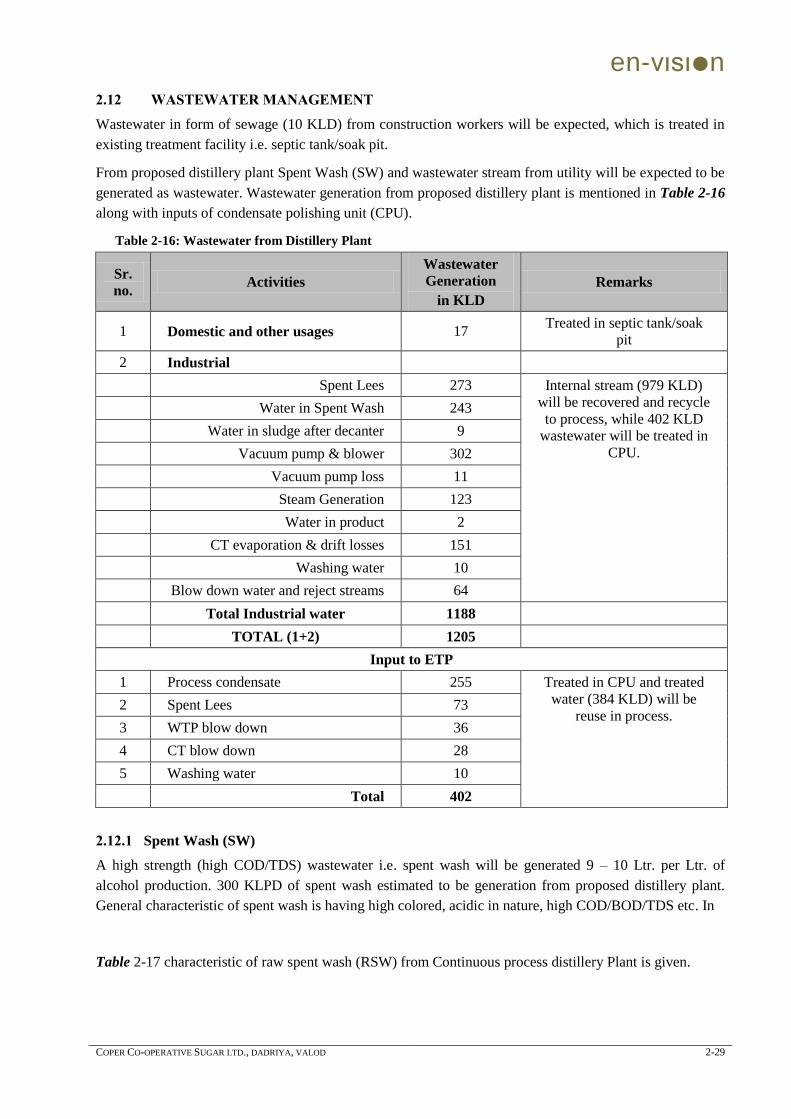
en-vιsιn
COPER CO-OPERATIVE SUGAR LTD., DADRIYA, VALOD 2-29
2.12 WASTEWATER MANAGEMENT
Wastewater in form of sewage (10 KLD) from construction workers will be expected, which is treated in
existing treatment facility i.e. septic tank/soak pit.
From proposed distillery plant Spent Wash (SW) and wastewater stream from utility will be expected to be
generated as wastewater. Wastewater generation from proposed distillery plant is mentioned in Table 2-16
along with inputs of condensate polishing unit (CPU).
Table 2-16: Wastewater from Distillery Plant
Sr.
no. Activities
Wastewater
Generation
in KLD
Remarks
1 Domestic and other usages 17 Treated in septic tank/soak
pit
2 Industrial
Spent Lees 273 Internal stream (979 KLD)
will be recovered and recycle
to process, while 402 KLD
wastewater will be treated in
CPU.
Water in Spent Wash 243
Water in sludge after decanter 9
Vacuum pump & blower 302
Vacuum pump loss 11
Steam Generation 123
Water in product 2
CT evaporation & drift losses 151
Washing water 10
Blow down water and reject streams 64
Total Industrial water 1188
TOTAL (1+2) 1205
Input to ETP
1 Process condensate 255 Treated in CPU and treated
water (384 KLD) will be
reuse in process. 2 Spent Lees 73
3 WTP blow down 36
4 CT blow down 28
5 Washing water 10
Total 402
2.12.1 Spent Wash (SW)
A high strength (high COD/TDS) wastewater i.e. spent wash will be generated 9 – 10 Ltr. per Ltr. of
alcohol production. 300 KLPD of spent wash estimated to be generation from proposed distillery plant.
General characteristic of spent wash is having high colored, acidic in nature, high COD/BOD/TDS etc. In
Table 2-17 characteristic of raw spent wash (RSW) from Continuous process distillery Plant is given.
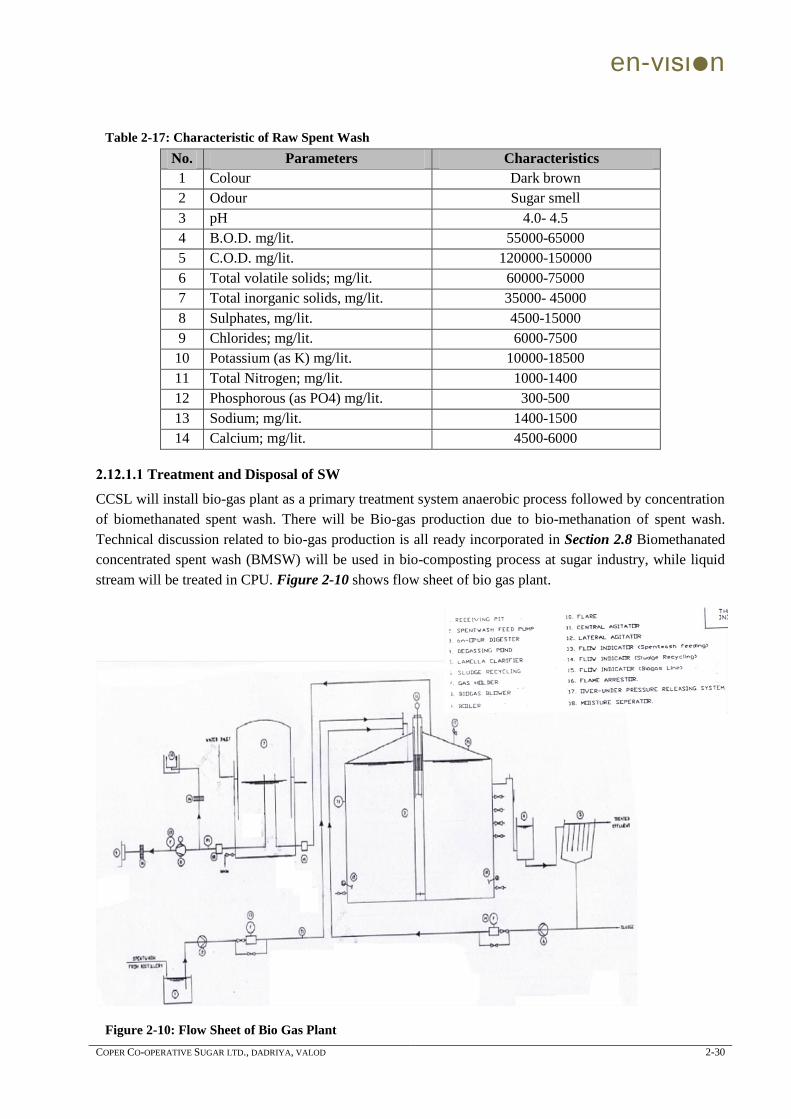
en-vιsιn
COPER CO-OPERATIVE SUGAR LTD., DADRIYA, VALOD 2-30
Table 2-17: Characteristic of Raw Spent Wash
No. Parameters Characteristics
1 Colour Dark brown
2 Odour Sugar smell
3 pH 4.0- 4.5
4 B.O.D. mg/lit. 55000-65000
5 C.O.D. mg/lit. 120000-150000
6 Total volatile solids; mg/lit. 60000-75000
7 Total inorganic solids, mg/lit. 35000- 45000
8 Sulphates, mg/lit. 4500-15000
9 Chlorides; mg/lit. 6000-7500
10 Potassium (as K) mg/lit. 10000-18500
11 Total Nitrogen; mg/lit. 1000-1400
12 Phosphorous (as PO4) mg/lit. 300-500
13 Sodium; mg/lit. 1400-1500
14 Calcium; mg/lit. 4500-6000
2.12.1.1 Treatment and Disposal of SW
CCSL will install bio-gas plant as a primary treatment system anaerobic process followed by concentration
of biomethanated spent wash. There will be Bio-gas production due to bio-methanation of spent wash.
Technical discussion related to bio-gas production is all ready incorporated in Section 2.8 Biomethanated
concentrated spent wash (BMSW) will be used in bio-composting process at sugar industry, while liquid
stream will be treated in CPU. Figure 2-10 shows flow sheet of bio gas plant.
Figure 2-10: Flow Sheet of Bio Gas Plant
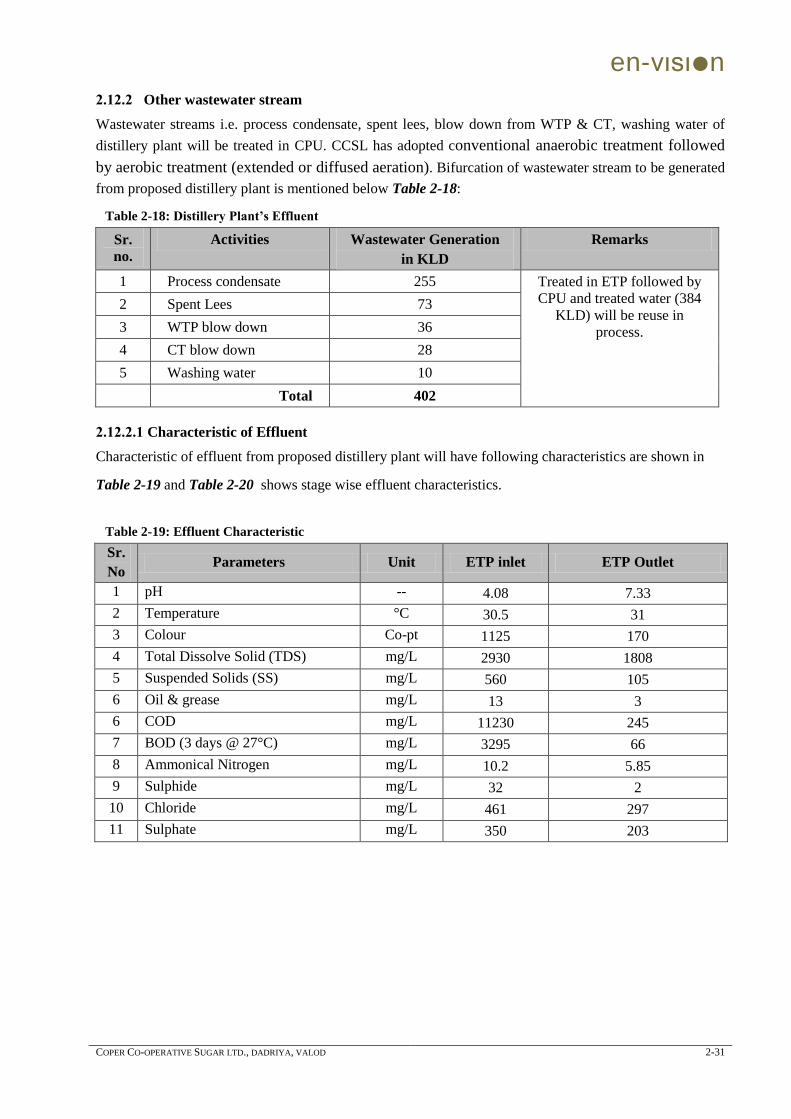
en-vιsιn
COPER CO-OPERATIVE SUGAR LTD., DADRIYA, VALOD 2-31
2.12.2 Other wastewater stream
Wastewater streams i.e. process condensate, spent lees, blow down from WTP & CT, washing water of
distillery plant will be treated in CPU. CCSL has adopted conventional anaerobic treatment followed
by aerobic treatment (extended or diffused aeration). Bifurcation of wastewater stream to be generated
from proposed distillery plant is mentioned below Table 2-18:
Table 2-18: Distillery Plant’s Effluent
Sr.
no.
Activities Wastewater Generation
in KLD
Remarks
1 Process condensate 255 Treated in ETP followed by
CPU and treated water (384
KLD) will be reuse in
process.
2 Spent Lees 73
3 WTP blow down 36
4 CT blow down 28
5 Washing water 10
Total 402
2.12.2.1 Characteristic of Effluent
Characteristic of effluent from proposed distillery plant will have following characteristics are shown in
Table 2-19 and Table 2-20 shows stage wise effluent characteristics.
Table 2-19: Effluent Characteristic
Sr.
No Parameters Unit ETP inlet ETP Outlet
1 pH -- 4.08 7.33
2 Temperature °C 30.5 31
3 Colour Co-pt 1125 170
4 Total Dissolve Solid (TDS) mg/L 2930 1808
5 Suspended Solids (SS) mg/L 560 105
6 Oil & grease mg/L 13 3
6 COD mg/L 11230 245
7 BOD (3 days @ 27°C) mg/L 3295 66
8 Ammonical Nitrogen mg/L 10.2 5.85
9 Sulphide mg/L 32 2
10 Chloride mg/L 461 297
11 Sulphate mg/L 350 203
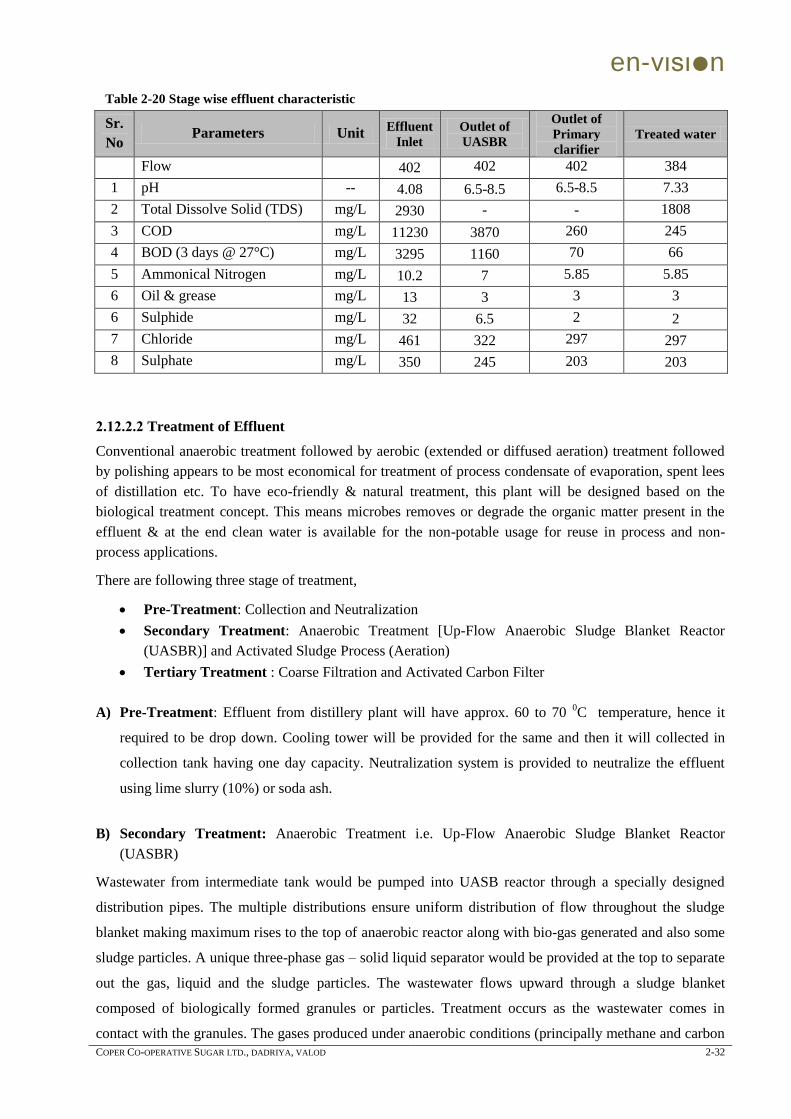
en-vιsιn
COPER CO-OPERATIVE SUGAR LTD., DADRIYA, VALOD 2-32
Table 2-20 Stage wise effluent characteristic
Sr.
No Parameters Unit
Effluent
Inlet
Outlet of
UASBR
Outlet of
Primary
clarifier
Treated water
Flow 402 402 402 384
1 pH -- 4.08 6.5-8.5 6.5-8.5 7.33
2 Total Dissolve Solid (TDS) mg/L 2930 - - 1808
3 COD mg/L 11230 3870 260 245
4 BOD (3 days @ 27°C) mg/L 3295 1160 70 66
5 Ammonical Nitrogen mg/L 10.2 7 5.85 5.85
6 Oil & grease mg/L 13 3 3 3
6 Sulphide mg/L 32 6.5 2 2
7 Chloride mg/L 461 322 297 297
8 Sulphate mg/L 350 245 203 203
2.12.2.2 Treatment of Effluent
Conventional anaerobic treatment followed by aerobic (extended or diffused aeration) treatment followed
by polishing appears to be most economical for treatment of process condensate of evaporation, spent lees
of distillation etc. To have eco-friendly & natural treatment, this plant will be designed based on the
biological treatment concept. This means microbes removes or degrade the organic matter present in the
effluent & at the end clean water is available for the non-potable usage for reuse in process and non-
process applications.
There are following three stage of treatment,
Pre-Treatment: Collection and Neutralization
Secondary Treatment: Anaerobic Treatment [Up-Flow Anaerobic Sludge Blanket Reactor
(UASBR)] and Activated Sludge Process (Aeration)
Tertiary Treatment : Coarse Filtration and Activated Carbon Filter
A) Pre-Treatment: Effluent from distillery plant will have approx. 60 to 70 0C temperature, hence it
required to be drop down. Cooling tower will be provided for the same and then it will collected in
collection tank having one day capacity. Neutralization system is provided to neutralize the effluent
using lime slurry (10%) or soda ash.
B) Secondary Treatment: Anaerobic Treatment i.e. Up-Flow Anaerobic Sludge Blanket Reactor
(UASBR)
Wastewater from intermediate tank would be pumped into UASB reactor through a specially designed
distribution pipes. The multiple distributions ensure uniform distribution of flow throughout the sludge
blanket making maximum rises to the top of anaerobic reactor along with bio-gas generated and also some
sludge particles. A unique three-phase gas – solid liquid separator would be provided at the top to separate
out the gas, liquid and the sludge particles. The wastewater flows upward through a sludge blanket
composed of biologically formed granules or particles. Treatment occurs as the wastewater comes in
contact with the granules. The gases produced under anaerobic conditions (principally methane and carbon
en-vιsιn
COPER CO-OPERATIVE SUGAR LTD., DADRIYA, VALOD 2-33
dioxide) cause internal circulation, which helps in the formation and maintenance of the biological
granules. Some of the gas produced within the sludge blanket becomes attached to the biological granules.
The free gas and the particles with the attached gas rise to the top of the reactor. The particles that rise to
the surface, strike the bottom of the degassing baffles, which causes the attached gas bubbles to release.
The degassed granules typically drop back to the surface of the sludge blanket. The free gas and the gas
released from the granules are captured in the gas collection domes located in the top of the reactor. Liquid
containing some residual solids and biological granules passes into settling chamber, where the residual
solids are separated from the liquid. The separated solids fall back through the baffle system to the top of
the sludge blanket. Gas will be collected in the domes provided at the top. The liquid overflows through
the gutters and suspended solids then separated are allowed to settle down in the sludge blanket thereby
retaining valuable bacterial population. The gas will be carried through a gas line equipped with safety
devices to the flare stack and would be burnt subsequently.
(1) Activated Sludge Process (Aeration) – ASP
ASP is the main section of the plant where degradation of organic pollutants with the help of aerobic
micro-organism takes place. In aeration tank activated biomass is developed in such a way that certain
MLSS is maintained for continuous effluent flow which comes to aeration basin. Effluent is degraded in
given retention time and activated sludge is further passed to clarifier and recycled as per requirement. The
sludge, which is not required after recirculation, is passed to sludge drying bed. To maintain the aerobic
condition in the bioreactor, air supply arrangement is provided by means of aeration equipment which has
high oxygen transfer efficiency.
Primary Clarifier: In Primary clarifier, effluent passed from first aeration tank along with
biomass (MLSS) gets settled here. The settled biomass recycled back to aeration tank as per
requirement and excess biomass transfer to sludge drying bed.
C) Tertiary Treatment : Coarse Filtration and Activated Carbon Filter
(1) Coarse Filtration: The raw water is first passed through a Multi-grade sand filter to reduce the
suspended solids present in the raw water. The filter will have to be washed with the help of raw
water for 10 to 15 mins daily. This filter is provided to keep a check on the suspended solids.
(2) Activated Carbon Filter: Activated Carbon Filter shall be used for DE chlorination of filtered
water, where the excess chlorine will be removed along with undesired color & odor.
Schematic flow diagram for ETP is shown in Figure 2-11.
New and innovative treatment for spent wash by CSIR and CSMCRI is discussed in section 5.3.2
of chapter – 5 as it will be another option of treatment.
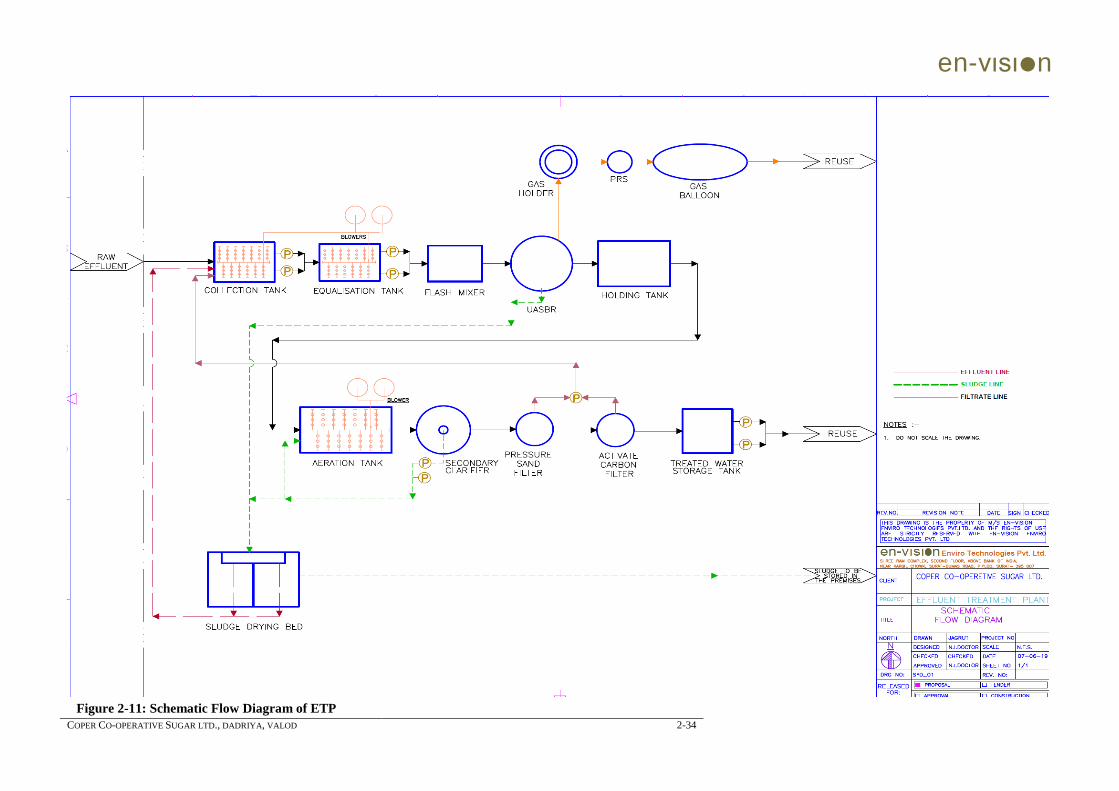
en-vιsιn
COPER CO-OPERATIVE SUGAR LTD., DADRIYA, VALOD 2-34
Figure 2-11: Schematic Flow Diagram of ETP
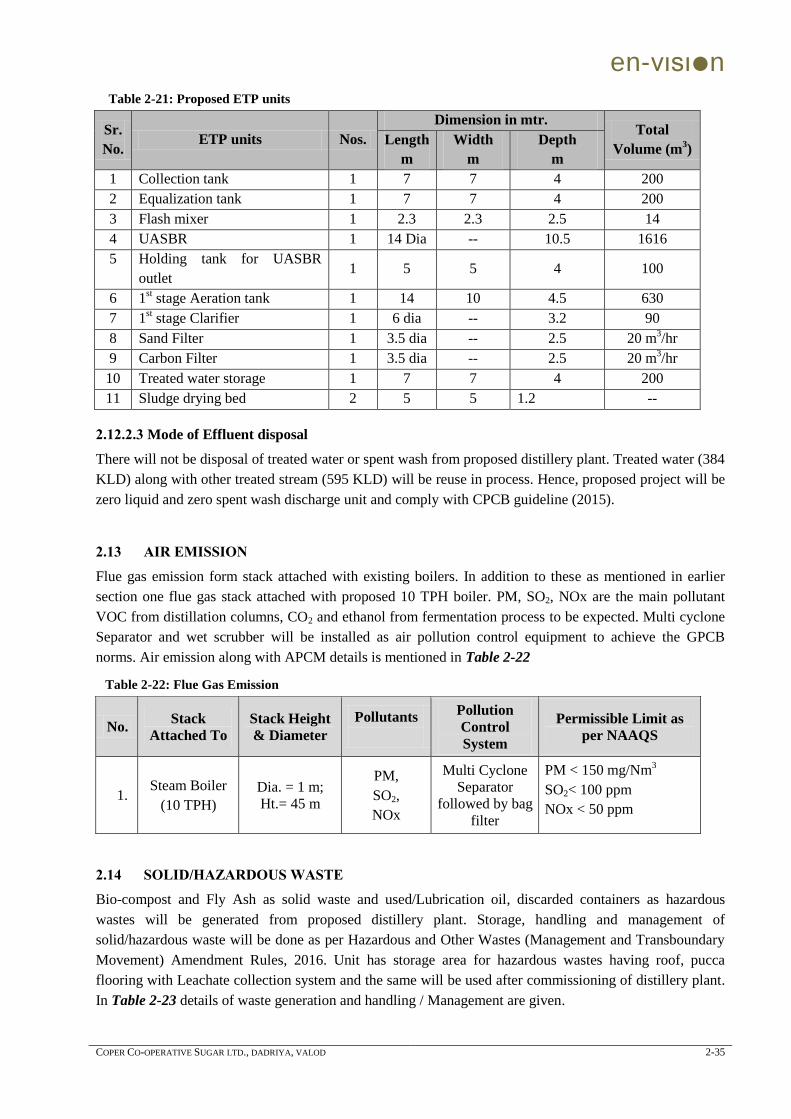
en-vιsιn
COPER CO-OPERATIVE SUGAR LTD., DADRIYA, VALOD 2-35
Table 2-21: Proposed ETP units
Sr.
No. ETP units Nos.
Dimension in mtr. Total
Volume (m3)
Length
m
Width
m
Depth
m
1 Collection tank 1 7 7 4 200
2 Equalization tank 1 7 7 4 200
3 Flash mixer 1 2.3 2.3 2.5 14
4 UASBR 1 14 Dia -- 10.5 1616
5 Holding tank for UASBR
outlet 1 5 5 4 100
6 1st stage Aeration tank 1 14 10 4.5 630
7 1st stage Clarifier 1 6 dia -- 3.2 90
8 Sand Filter 1 3.5 dia -- 2.5 20 m3/hr
9 Carbon Filter 1 3.5 dia -- 2.5 20 m3/hr
10 Treated water storage 1 7 7 4 200
11 Sludge drying bed 2 5 5 1.2 --
2.12.2.3 Mode of Effluent disposal
There will not be disposal of treated water or spent wash from proposed distillery plant. Treated water (384
KLD) along with other treated stream (595 KLD) will be reuse in process. Hence, proposed project will be
zero liquid and zero spent wash discharge unit and comply with CPCB guideline (2015).
2.13 AIR EMISSION
Flue gas emission form stack attached with existing boilers. In addition to these as mentioned in earlier
section one flue gas stack attached with proposed 10 TPH boiler. PM, SO2, NOx are the main pollutant
VOC from distillation columns, CO2 and ethanol from fermentation process to be expected. Multi cyclone
Separator and wet scrubber will be installed as air pollution control equipment to achieve the GPCB
norms. Air emission along with APCM details is mentioned in Table 2-22
Table 2-22: Flue Gas Emission
No. Stack
Attached To
Stack Height
& Diameter
Pollutants
Pollution
Control
System
Permissible Limit as
per NAAQS
1. Steam Boiler
(10 TPH)
Dia. = 1 m;
Ht.= 45 m
PM,
SO2,
NOx
Multi Cyclone
Separator
followed by bag
filter
PM < 150 mg/Nm3
SO2< 100 ppm
NOx < 50 ppm
2.14 SOLID/HAZARDOUS WASTE
Bio-compost and Fly Ash as solid waste and used/Lubrication oil, discarded containers as hazardous
wastes will be generated from proposed distillery plant. Storage, handling and management of
solid/hazardous waste will be done as per Hazardous and Other Wastes (Management and Transboundary
Movement) Amendment Rules, 2016. Unit has storage area for hazardous wastes having roof, pucca
flooring with Leachate collection system and the same will be used after commissioning of distillery plant.
In Table 2-23 details of waste generation and handling / Management are given.
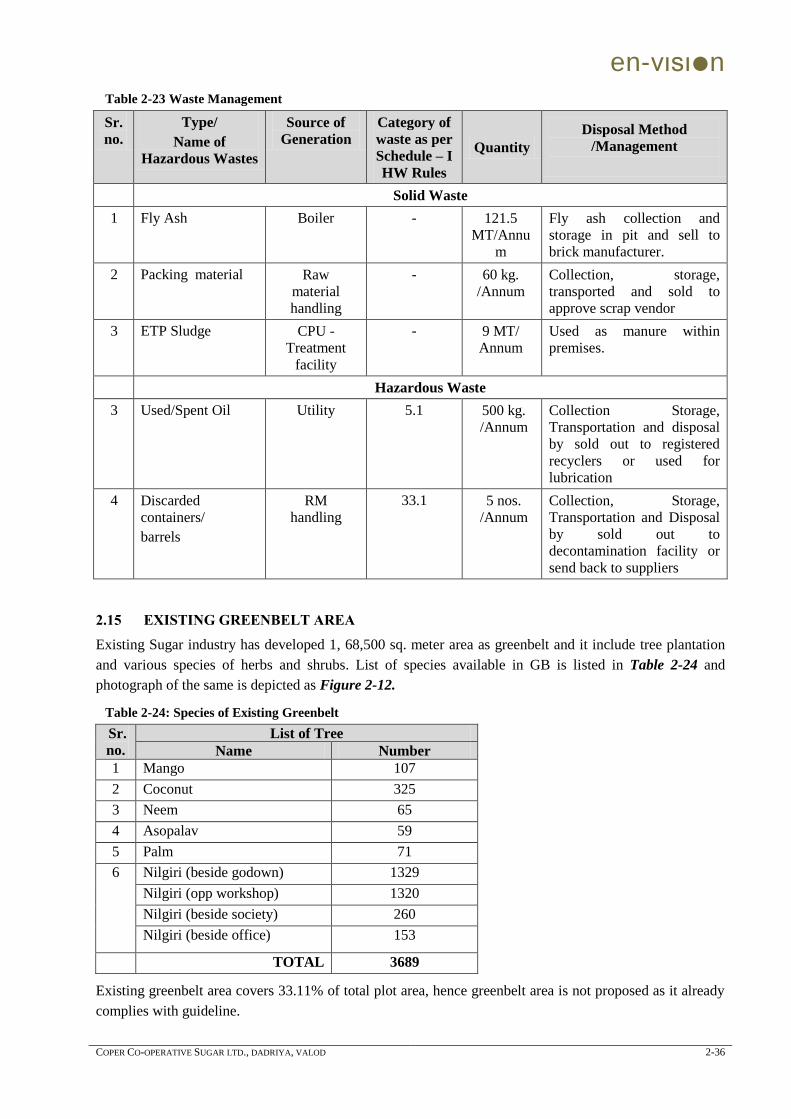
en-vιsιn
COPER CO-OPERATIVE SUGAR LTD., DADRIYA, VALOD 2-36
Table 2-23 Waste Management
Sr.
no.
Type/
Name of
Hazardous Wastes
Source of
Generation
Category of
waste as per
Schedule – I
HW Rules
Quantity
Disposal Method
/Management
Solid Waste
1 Fly Ash Boiler - 121.5
MT/Annu
m
Fly ash collection and
storage in pit and sell to
brick manufacturer.
2 Packing material Raw
material
handling
- 60 kg.
/Annum
Collection, storage,
transported and sold to
approve scrap vendor
3 ETP Sludge CPU -
Treatment
facility
- 9 MT/
Annum
Used as manure within
premises.
Hazardous Waste
3 Used/Spent Oil Utility
5.1 500 kg.
/Annum
Collection Storage,
Transportation and disposal
by sold out to registered
recyclers or used for
lubrication
4 Discarded
containers/
barrels
RM
handling
33.1 5 nos.
/Annum
Collection, Storage,
Transportation and Disposal
by sold out to
decontamination facility or
send back to suppliers
2.15 EXISTING GREENBELT AREA
Existing Sugar industry has developed 1, 68,500 sq. meter area as greenbelt and it include tree plantation
and various species of herbs and shrubs. List of species available in GB is listed in Table 2-24 and
photograph of the same is depicted as Figure 2-12.
Table 2-24: Species of Existing Greenbelt
Sr.
no.
List of Tree
Name Number
1 Mango 107
2 Coconut 325
3 Neem 65
4 Asopalav 59
5 Palm 71
6
Nilgiri (beside godown) 1329
Nilgiri (opp workshop) 1320
Nilgiri (beside society) 260
Nilgiri (beside office) 153
TOTAL 3689
Existing greenbelt area covers 33.11% of total plot area, hence greenbelt area is not proposed as it already
complies with guideline.
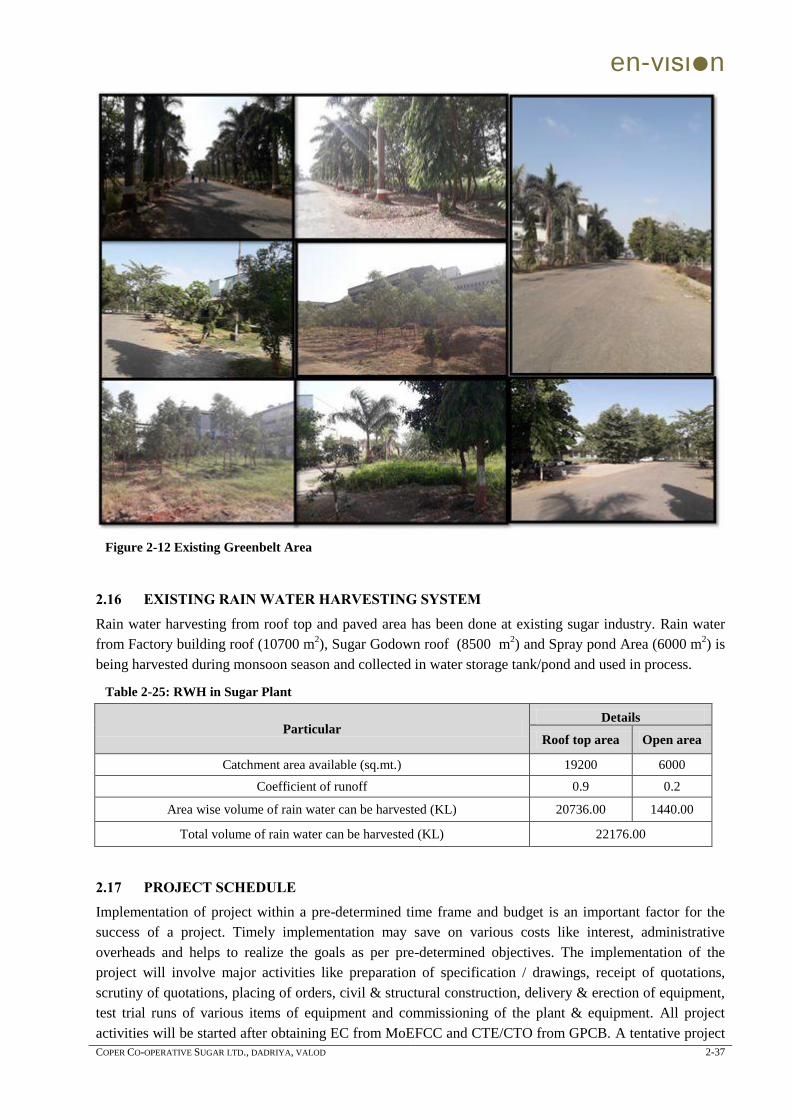
en-vιsιn
COPER CO-OPERATIVE SUGAR LTD., DADRIYA, VALOD 2-37
Figure 2-12 Existing Greenbelt Area
2.16 EXISTING RAIN WATER HARVESTING SYSTEM
Rain water harvesting from roof top and paved area has been done at existing sugar industry. Rain water
from Factory building roof (10700 m2), Sugar Godown roof (8500 m
2) and Spray pond Area (6000 m
2) is
being harvested during monsoon season and collected in water storage tank/pond and used in process.
Table 2-25: RWH in Sugar Plant
Particular Details
Roof top area Open area
Catchment area available (sq.mt.) 19200 6000
Coefficient of runoff 0.9 0.2
Area wise volume of rain water can be harvested (KL) 20736.00 1440.00
Total volume of rain water can be harvested (KL) 22176.00
2.17 PROJECT SCHEDULE
Implementation of project within a pre-determined time frame and budget is an important factor for the
success of a project. Timely implementation may save on various costs like interest, administrative
overheads and helps to realize the goals as per pre-determined objectives. The implementation of the
project will involve major activities like preparation of specification / drawings, receipt of quotations,
scrutiny of quotations, placing of orders, civil & structural construction, delivery & erection of equipment,
test trial runs of various items of equipment and commissioning of the plant & equipment. All project
activities will be started after obtaining EC from MoEFCC and CTE/CTO from GPCB. A tentative project
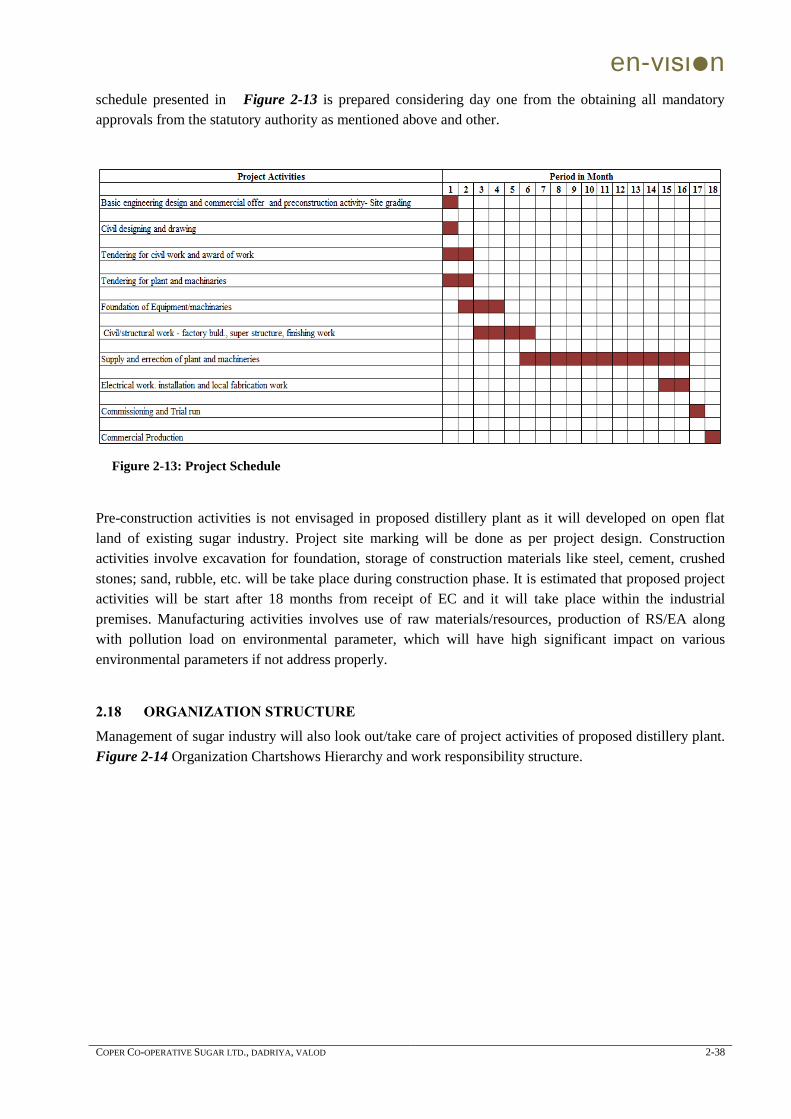
en-vιsιn
COPER CO-OPERATIVE SUGAR LTD., DADRIYA, VALOD 2-38
schedule presented in Figure 2-13 is prepared considering day one from the obtaining all mandatory
approvals from the statutory authority as mentioned above and other.
Figure 2-13: Project Schedule
Pre-construction activities is not envisaged in proposed distillery plant as it will developed on open flat
land of existing sugar industry. Project site marking will be done as per project design. Construction
activities involve excavation for foundation, storage of construction materials like steel, cement, crushed
stones; sand, rubble, etc. will be take place during construction phase. It is estimated that proposed project
activities will be start after 18 months from receipt of EC and it will take place within the industrial
premises. Manufacturing activities involves use of raw materials/resources, production of RS/EA along
with pollution load on environmental parameter, which will have high significant impact on various
environmental parameters if not address properly.
2.18 ORGANIZATION STRUCTURE
Management of sugar industry will also look out/take care of project activities of proposed distillery plant.
Figure 2-14 Organization Chartshows Hierarchy and work responsibility structure.
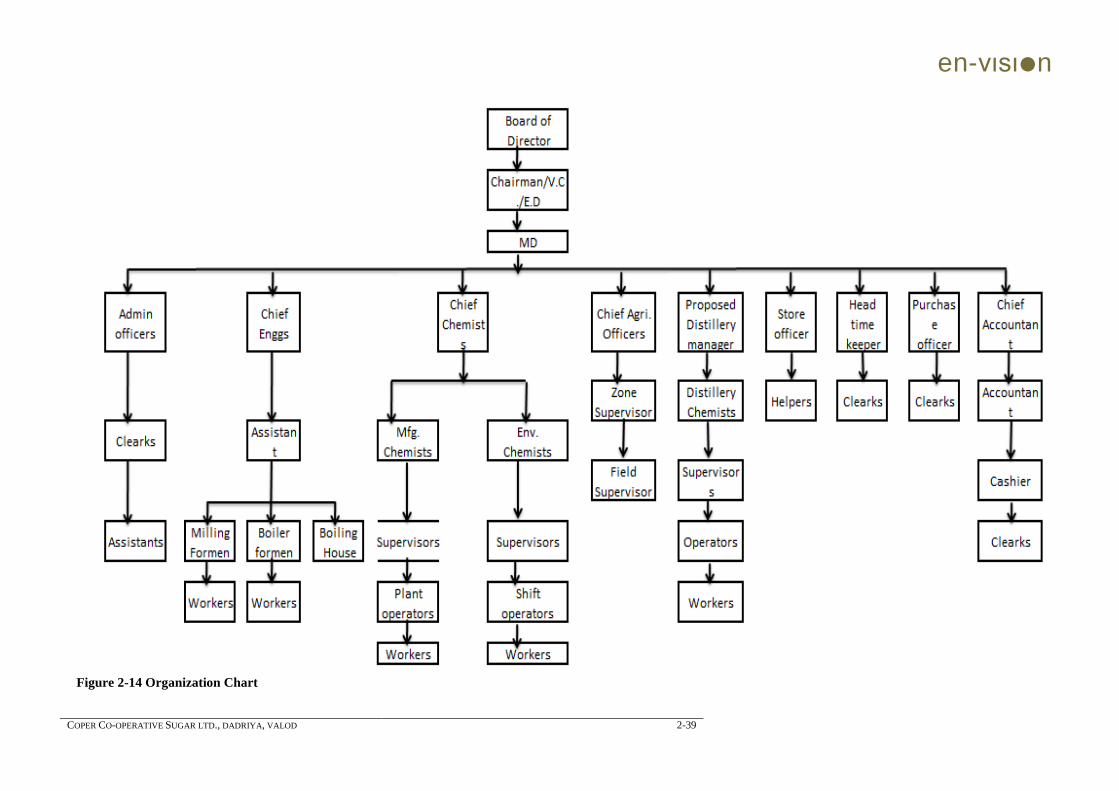
en-vιsιn
COPER CO-OPERATIVE SUGAR LTD., DADRIYA, VALOD 2-39
Figure 2-14 Organization Chart
en-vιsιn
COPER CO-OPERATIVE SUGAR LTD., DADRIYA, VALOD 3-1
CHAPTER 3 DESCRIPTION OF ENVIRONTMENT
3.1 INTRODUCTION
Environmental quality in the vicinity of project site serves as the basis for identification, prediction and
evaluation of impacts. The baseline environmental quality is assessed through field studies within the
impact zone for various components. Baseline data generation of the following environmental attributes is
essential in EIA studies.
Meteorology
Ambient Air Quality
Surface and Ground water Quality
Ambient Noise Quality
Soil Quality
Land use pattern
Geological Features
Biological Information
Socio-economic status survey
3.1.1 Objectives of Baseline Monitoring
The term „baseline‟ refers to conditions existing before development against which subsequent changes
can be referenced. Baseline monitoring studies are carried out to measure environmental parameters during
a pre-project period for the purpose of determining the range of variation of the system and establishing
reference points against which changes can be measured.
Identify environmental conditions which might influence project design decisions (e.g., site layout,
structural or operational characteristics);
Identify sensitive issues or areas requiring mitigation or compensation;
Collect input data for analytical models and predict effects due to proposed project;
Provide proposed environmental monitoring programs.
At this stage of EIA process, baseline monitoring is primarily discussed in the context of first purpose
wherein feedback from baseline monitoring programs may be used to:
Determine available assimilative capacity of different environmental components within the
designated impact zone and whether more or less stringent mitigation measures are needed.
Improve predictive capability of EIAs.
3.1.2 Study Area and Period
Environment Baseline Monitoring was carry out during March to May – 2019 to generate baseline
environmental data within study area of 10 km radial distance from proposed project site. Base line data of
Ambient air quality, water quality; land use & land cover, topography, ecology as well as socio economic
status was collected as per ToR requirement. The details of frequency of sampling & method of
environmental sampling & analysis are given below in subsequent sections under respective titles.
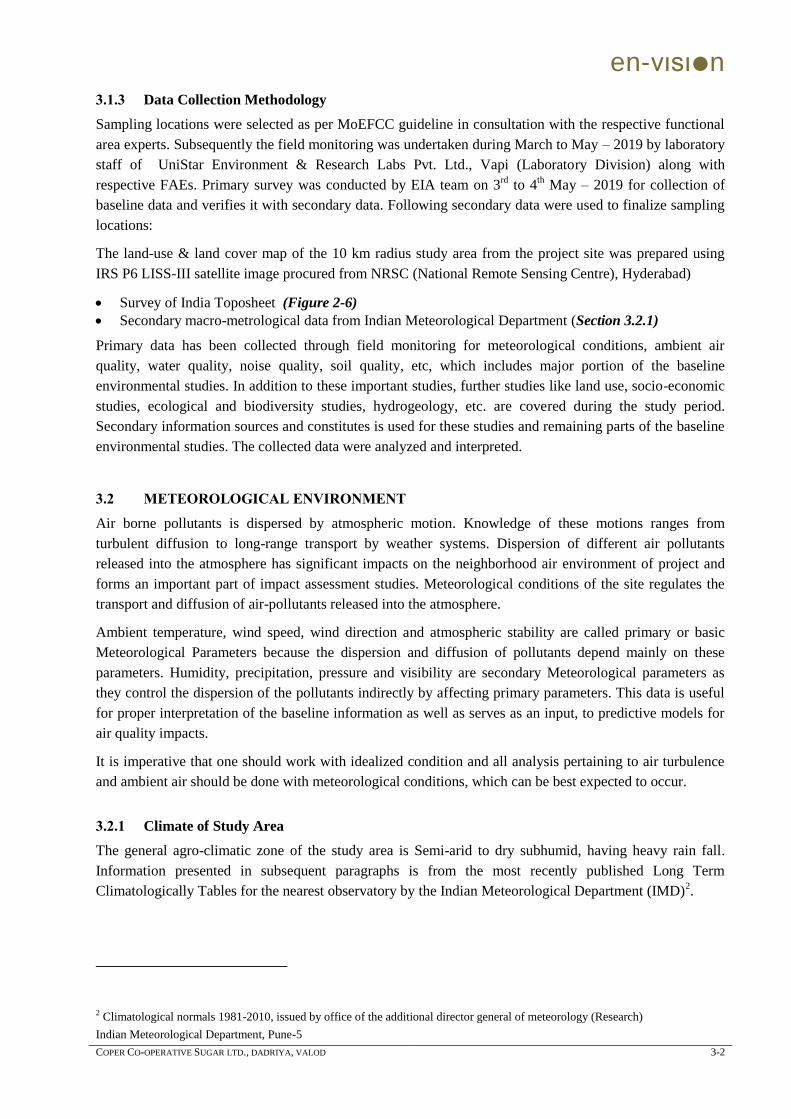
en-vιsιn
COPER CO-OPERATIVE SUGAR LTD., DADRIYA, VALOD 3-2
3.1.3 Data Collection Methodology
Sampling locations were selected as per MoEFCC guideline in consultation with the respective functional
area experts. Subsequently the field monitoring was undertaken during March to May – 2019 by laboratory
staff of UniStar Environment & Research Labs Pvt. Ltd., Vapi (Laboratory Division) along with
respective FAEs. Primary survey was conducted by EIA team on 3rd
to 4th May – 2019 for collection of
baseline data and verifies it with secondary data. Following secondary data were used to finalize sampling
locations:
The land-use & land cover map of the 10 km radius study area from the project site was prepared using
IRS P6 LISS-III satellite image procured from NRSC (National Remote Sensing Centre), Hyderabad)
Survey of India Toposheet (Figure 2-6)
Secondary macro-metrological data from Indian Meteorological Department (Section 3.2.1)
Primary data has been collected through field monitoring for meteorological conditions, ambient air
quality, water quality, noise quality, soil quality, etc, which includes major portion of the baseline
environmental studies. In addition to these important studies, further studies like land use, socio-economic
studies, ecological and biodiversity studies, hydrogeology, etc. are covered during the study period.
Secondary information sources and constitutes is used for these studies and remaining parts of the baseline
environmental studies. The collected data were analyzed and interpreted.
3.2 METEOROLOGICAL ENVIRONMENT
Air borne pollutants is dispersed by atmospheric motion. Knowledge of these motions ranges from
turbulent diffusion to long-range transport by weather systems. Dispersion of different air pollutants
released into the atmosphere has significant impacts on the neighborhood air environment of project and
forms an important part of impact assessment studies. Meteorological conditions of the site regulates the
transport and diffusion of air-pollutants released into the atmosphere.
Ambient temperature, wind speed, wind direction and atmospheric stability are called primary or basic
Meteorological Parameters because the dispersion and diffusion of pollutants depend mainly on these
parameters. Humidity, precipitation, pressure and visibility are secondary Meteorological parameters as
they control the dispersion of the pollutants indirectly by affecting primary parameters. This data is useful
for proper interpretation of the baseline information as well as serves as an input, to predictive models for
air quality impacts.
It is imperative that one should work with idealized condition and all analysis pertaining to air turbulence
and ambient air should be done with meteorological conditions, which can be best expected to occur.
3.2.1 Climate of Study Area
The general agro-climatic zone of the study area is Semi-arid to dry subhumid, having heavy rain fall.
Information presented in subsequent paragraphs is from the most recently published Long Term
Climatologically Tables for the nearest observatory by the Indian Meteorological Department (IMD)2.
2 Climatological normals 1981-2010, issued by office of the additional director general of meteorology (Research)
Indian Meteorological Department, Pune-5
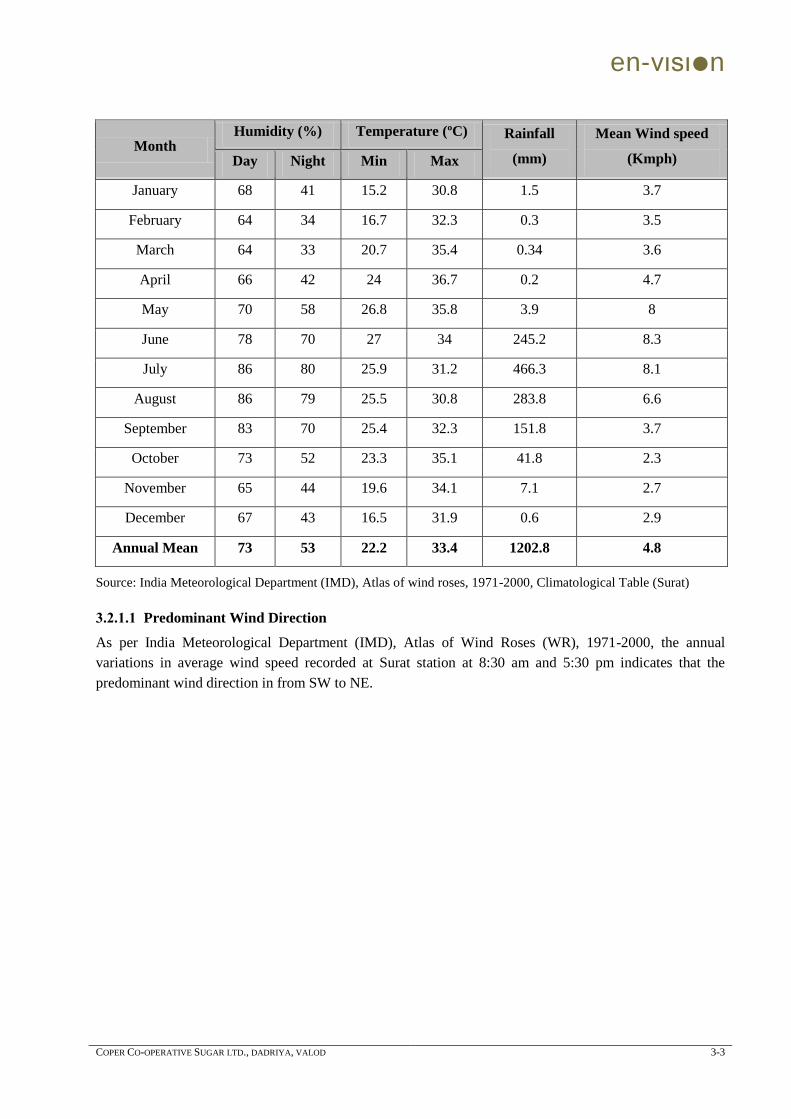
en-vιsιn
COPER CO-OPERATIVE SUGAR LTD., DADRIYA, VALOD 3-3
Month Humidity (%) Temperature (ºC) Rainfall
(mm)
Mean Wind speed
(Kmph) Day Night Min Max
January 68 41 15.2 30.8 1.5 3.7
February 64 34 16.7 32.3 0.3 3.5
March 64 33 20.7 35.4 0.34 3.6
April 66 42 24 36.7 0.2 4.7
May 70 58 26.8 35.8 3.9 8
June 78 70 27 34 245.2 8.3
July 86 80 25.9 31.2 466.3 8.1
August 86 79 25.5 30.8 283.8 6.6
September 83 70 25.4 32.3 151.8 3.7
October 73 52 23.3 35.1 41.8 2.3
November 65 44 19.6 34.1 7.1 2.7
December 67 43 16.5 31.9 0.6 2.9
Annual Mean 73 53 22.2 33.4 1202.8 4.8
Source: India Meteorological Department (IMD), Atlas of wind roses, 1971-2000, Climatological Table (Surat)
3.2.1.1 Predominant Wind Direction
As per India Meteorological Department (IMD), Atlas of Wind Roses (WR), 1971-2000, the annual
variations in average wind speed recorded at Surat station at 8:30 am and 5:30 pm indicates that the
predominant wind direction in from SW to NE.
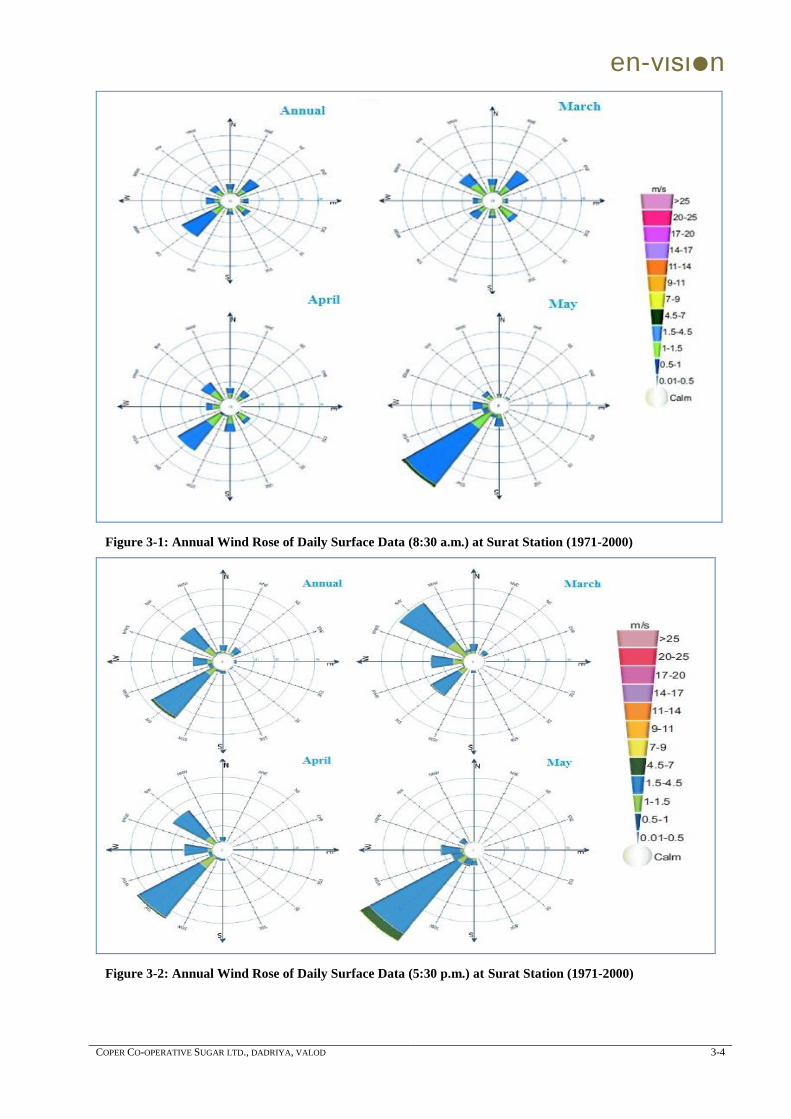
en-vιsιn
COPER CO-OPERATIVE SUGAR LTD., DADRIYA, VALOD 3-4
Figure 3-1: Annual Wind Rose of Daily Surface Data (8:30 a.m.) at Surat Station (1971-2000)
Figure 3-2: Annual Wind Rose of Daily Surface Data (5:30 p.m.) at Surat Station (1971-2000)
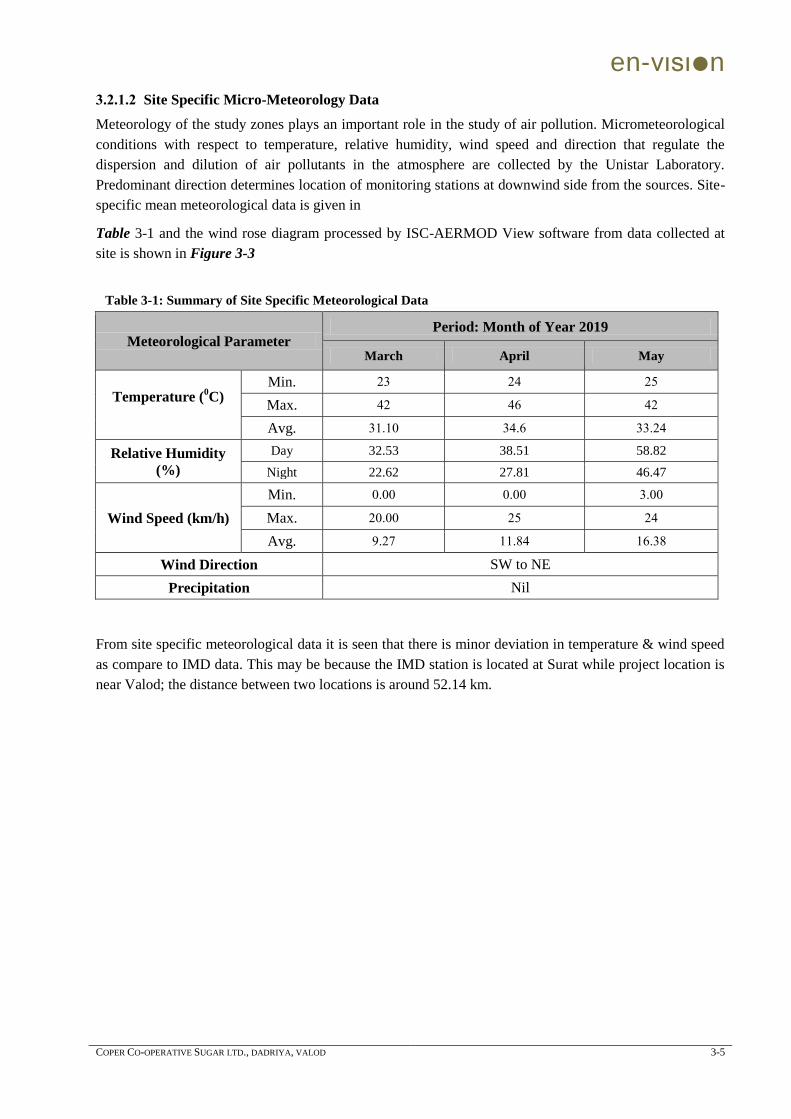
en-vιsιn
COPER CO-OPERATIVE SUGAR LTD., DADRIYA, VALOD 3-5
3.2.1.2 Site Specific Micro-Meteorology Data
Meteorology of the study zones plays an important role in the study of air pollution. Micrometeorological
conditions with respect to temperature, relative humidity, wind speed and direction that regulate the
dispersion and dilution of air pollutants in the atmosphere are collected by the Unistar Laboratory.
Predominant direction determines location of monitoring stations at downwind side from the sources. Site-
specific mean meteorological data is given in
Table 3-1 and the wind rose diagram processed by ISC-AERMOD View software from data collected at
site is shown in Figure 3-3
Table 3-1: Summary of Site Specific Meteorological Data
Meteorological Parameter Period: Month of Year 2019
March April May
Temperature (0C)
Min. 23 24 25
Max. 42 46 42
Avg. 31.10 34.6 33.24
Relative Humidity
(%)
Day 32.53 38.51 58.82
Night 22.62 27.81 46.47
Wind Speed (km/h)
Min. 0.00 0.00 3.00
Max. 20.00 25 24
Avg. 9.27 11.84 16.38
Wind Direction SW to NE
Precipitation Nil
From site specific meteorological data it is seen that there is minor deviation in temperature & wind speed
as compare to IMD data. This may be because the IMD station is located at Surat while project location is
near Valod; the distance between two locations is around 52.14 km.
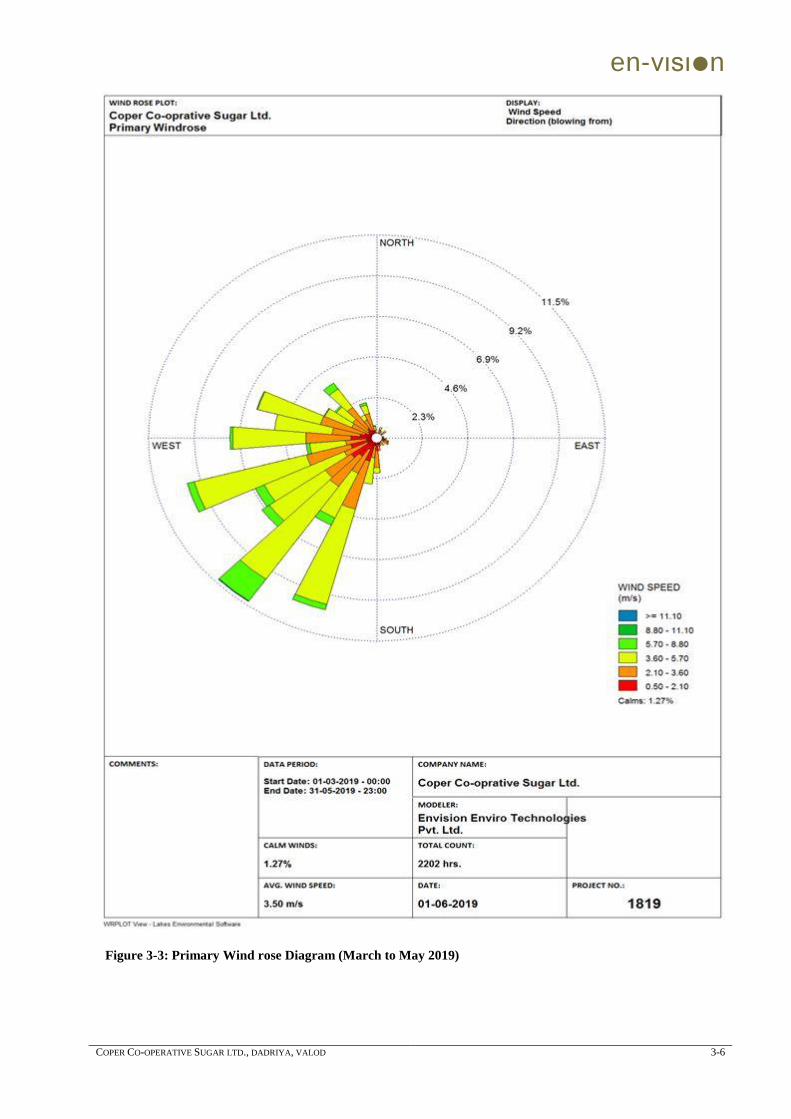
en-vιsιn
COPER CO-OPERATIVE SUGAR LTD., DADRIYA, VALOD 3-6
Figure 3-3: Primary Wind rose Diagram (March to May 2019)
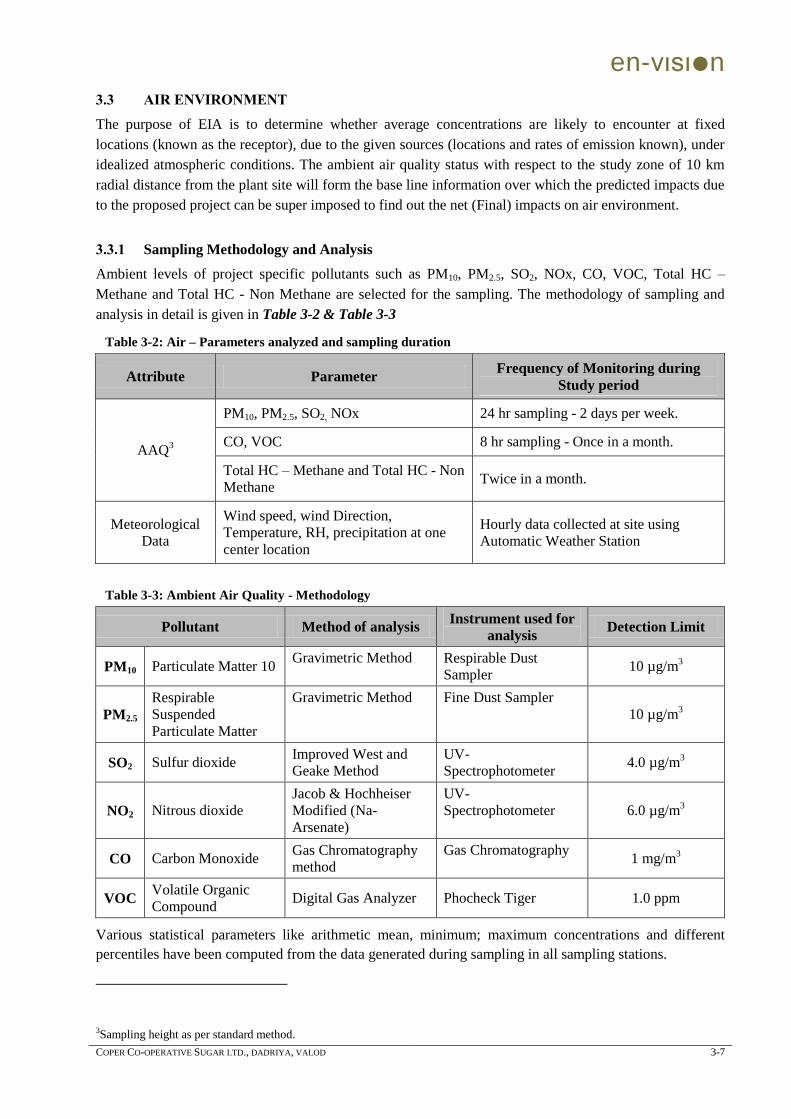
en-vιsιn
COPER CO-OPERATIVE SUGAR LTD., DADRIYA, VALOD 3-7
3.3 AIR ENVIRONMENT
The purpose of EIA is to determine whether average concentrations are likely to encounter at fixed
locations (known as the receptor), due to the given sources (locations and rates of emission known), under
idealized atmospheric conditions. The ambient air quality status with respect to the study zone of 10 km
radial distance from the plant site will form the base line information over which the predicted impacts due
to the proposed project can be super imposed to find out the net (Final) impacts on air environment.
3.3.1 Sampling Methodology and Analysis
Ambient levels of project specific pollutants such as PM10, PM2.5, SO2, NOx, CO, VOC, Total HC –
Methane and Total HC - Non Methane are selected for the sampling. The methodology of sampling and
analysis in detail is given in Table 3-2 & Table 3-3
Table 3-2: Air – Parameters analyzed and sampling duration
Attribute Parameter Frequency of Monitoring during
Study period
AAQ3
PM10, PM2.5, SO2, NOx 24 hr sampling - 2 days per week.
CO, VOC 8 hr sampling - Once in a month.
Total HC – Methane and Total HC - Non
Methane Twice in a month.
Meteorological
Data
Wind speed, wind Direction,
Temperature, RH, precipitation at one
center location
Hourly data collected at site using
Automatic Weather Station
Table 3-3: Ambient Air Quality - Methodology
Pollutant Method of analysis Instrument used for
analysis Detection Limit
PM10 Particulate Matter 10 Gravimetric Method Respirable Dust
Sampler 10 µg/m
3
PM2.5
Respirable
Suspended
Particulate Matter
Gravimetric Method Fine Dust Sampler
10 µg/m3
SO2 Sulfur dioxide Improved West and
Geake Method
UV-
Spectrophotometer 4.0 µg/m
3
NO2 Nitrous dioxide
Jacob & Hochheiser
Modified (Na-
Arsenate)
UV-
Spectrophotometer 6.0 µg/m3
CO Carbon Monoxide Gas Chromatography
method
Gas Chromatography 1 mg/m
3
VOC Volatile Organic
Compound Digital Gas Analyzer Phocheck Tiger 1.0 ppm
Various statistical parameters like arithmetic mean, minimum; maximum concentrations and different
percentiles have been computed from the data generated during sampling in all sampling stations.
3Sampling height as per standard method.
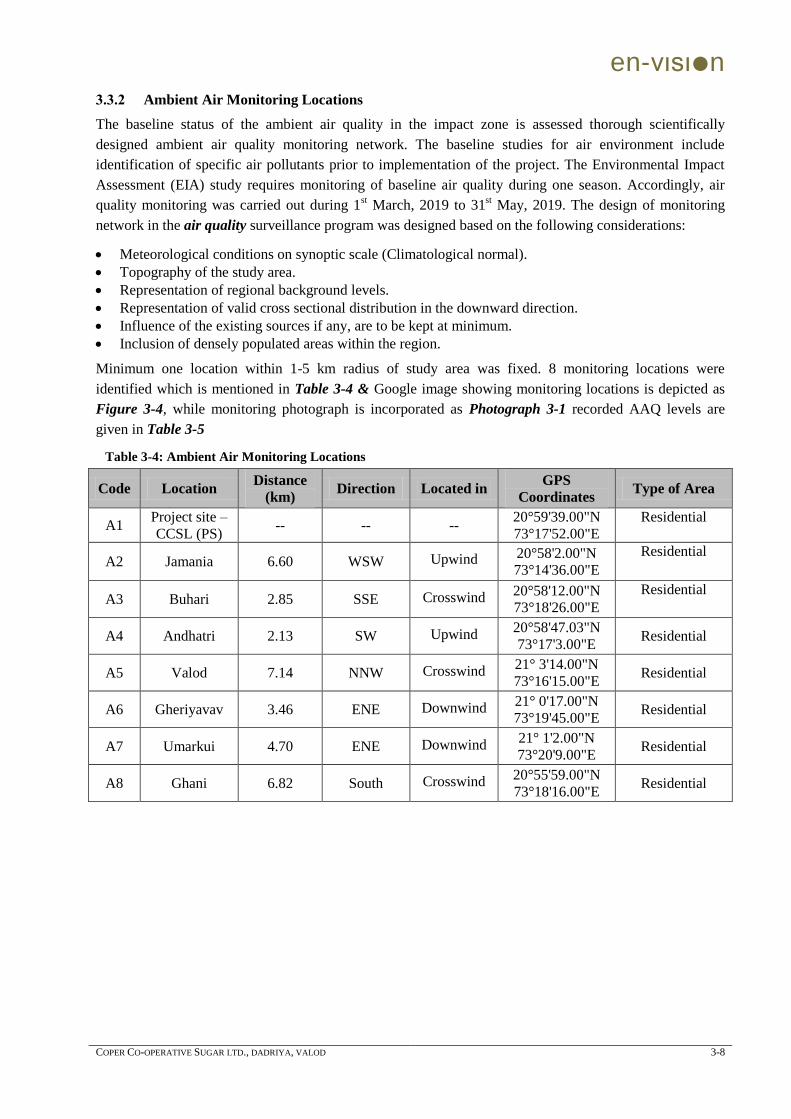
en-vιsιn
COPER CO-OPERATIVE SUGAR LTD., DADRIYA, VALOD 3-8
3.3.2 Ambient Air Monitoring Locations
The baseline status of the ambient air quality in the impact zone is assessed thorough scientifically
designed ambient air quality monitoring network. The baseline studies for air environment include
identification of specific air pollutants prior to implementation of the project. The Environmental Impact
Assessment (EIA) study requires monitoring of baseline air quality during one season. Accordingly, air
quality monitoring was carried out during 1st March, 2019 to 31
st May, 2019. The design of monitoring
network in the air quality surveillance program was designed based on the following considerations:
Meteorological conditions on synoptic scale (Climatological normal).
Topography of the study area.
Representation of regional background levels.
Representation of valid cross sectional distribution in the downward direction.
Influence of the existing sources if any, are to be kept at minimum.
Inclusion of densely populated areas within the region.
Minimum one location within 1-5 km radius of study area was fixed. 8 monitoring locations were
identified which is mentioned in Table 3-4 & Google image showing monitoring locations is depicted as
Figure 3-4, while monitoring photograph is incorporated as Photograph 3-1 recorded AAQ levels are
given in Table 3-5
Table 3-4: Ambient Air Monitoring Locations
Code Location Distance
(km) Direction Located in
GPS
Coordinates Type of Area
A1 Project site –
CCSL (PS) -- -- --
20°59'39.00"N
73°17'52.00"E
Residential
A2 Jamania 6.60 WSW Upwind 20°58'2.00"N
73°14'36.00"E
Residential
A3 Buhari 2.85 SSE Crosswind 20°58'12.00"N
73°18'26.00"E
Residential
A4 Andhatri 2.13 SW Upwind 20°58'47.03"N
73°17'3.00"E Residential
A5 Valod 7.14 NNW Crosswind 21° 3'14.00"N
73°16'15.00"E Residential
A6 Gheriyavav 3.46 ENE Downwind 21° 0'17.00"N
73°19'45.00"E Residential
A7 Umarkui 4.70 ENE Downwind 21° 1'2.00"N
73°20'9.00"E Residential
A8 Ghani 6.82 South Crosswind 20°55'59.00"N
73°18'16.00"E Residential
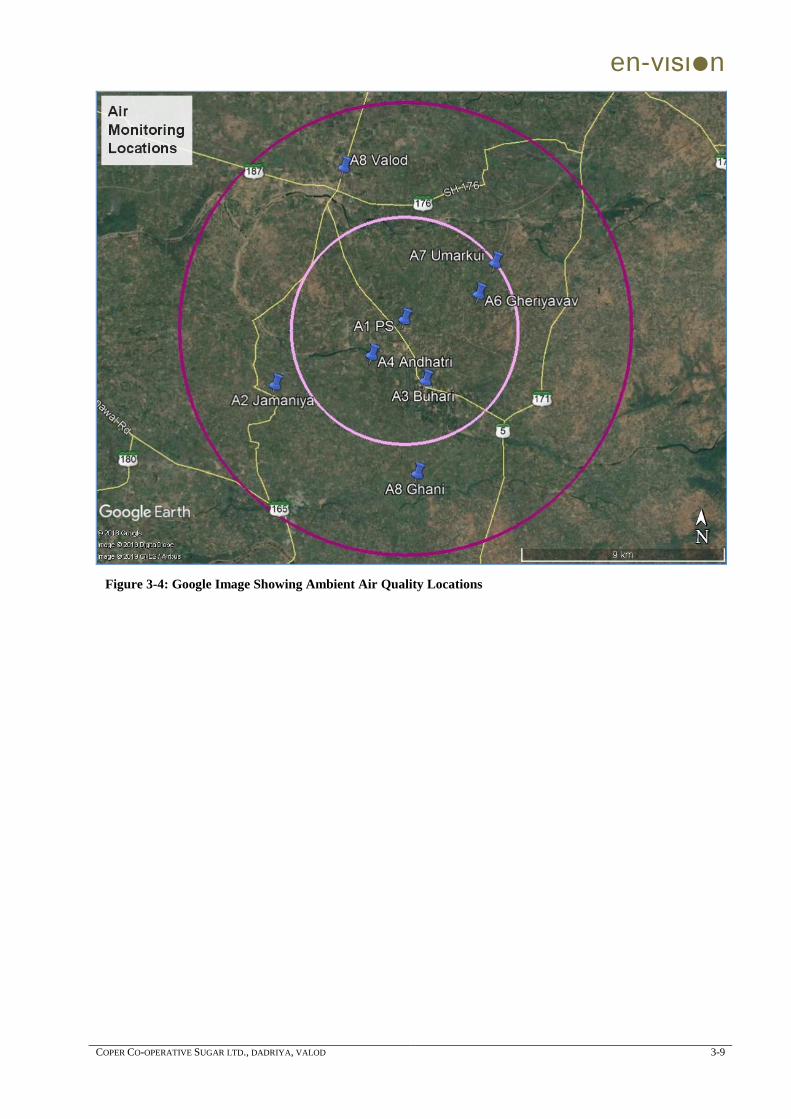
en-vιsιn
COPER CO-OPERATIVE SUGAR LTD., DADRIYA, VALOD 3-9
Figure 3-4: Google Image Showing Ambient Air Quality Locations
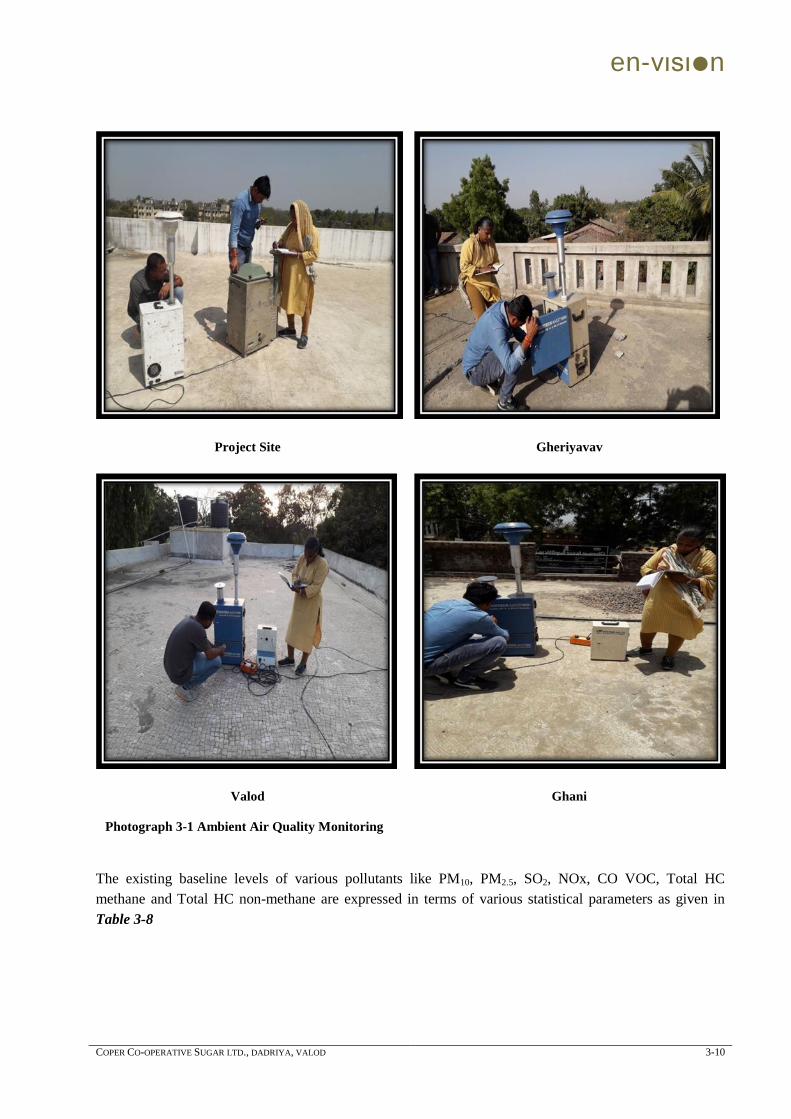
en-vιsιn
COPER CO-OPERATIVE SUGAR LTD., DADRIYA, VALOD 3-10
Project Site Gheriyavav
Valod Ghani
Photograph 3-1 Ambient Air Quality Monitoring
The existing baseline levels of various pollutants like PM10, PM2.5, SO2, NOx, CO VOC, Total HC
methane and Total HC non-methane are expressed in terms of various statistical parameters as given in
Table 3-8
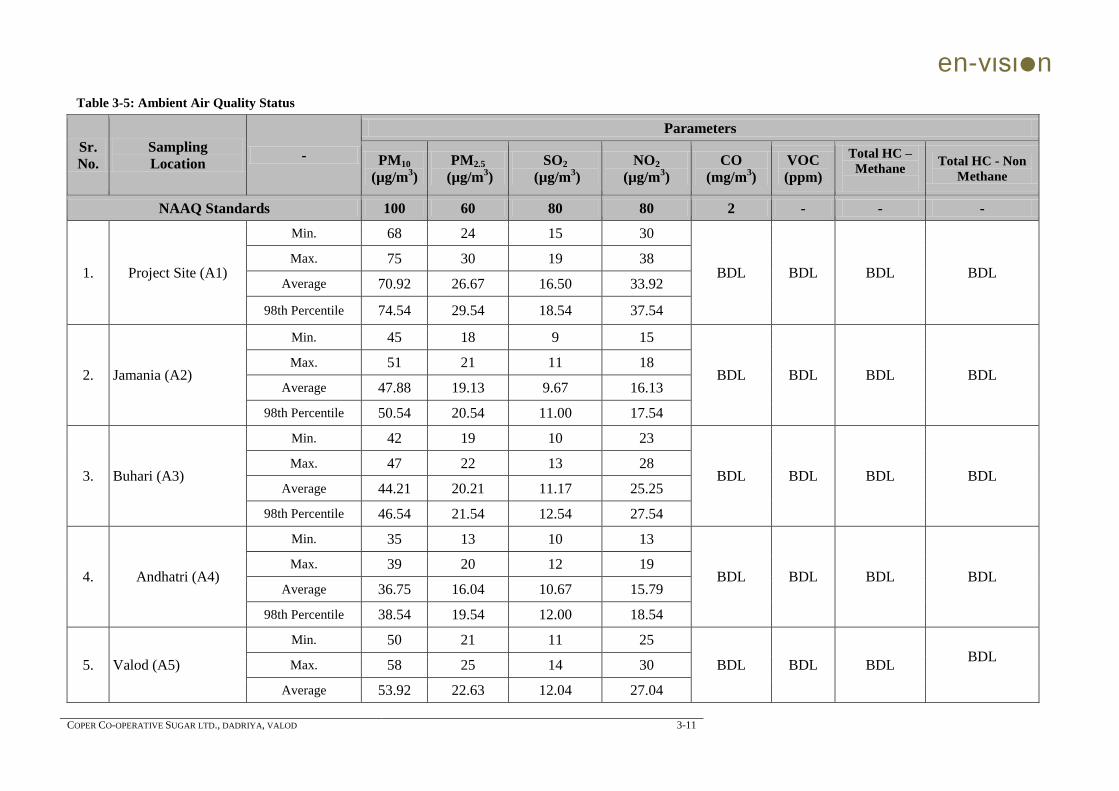
en-vιsιn
COPER CO-OPERATIVE SUGAR LTD., DADRIYA, VALOD 3-11
Table 3-5: Ambient Air Quality Status
Sr.
No.
Sampling
Location -
Parameters
PM10
(µg/m3)
PM2.5
(µg/m3)
SO2
(µg/m3)
NO2
(µg/m3)
CO
(mg/m3)
VOC
(ppm)
Total HC –
Methane
Total HC - Non
Methane
NAAQ Standards 100 60 80 80 2 - - -
1. Project Site (A1)
Min. 68 24 15 30
BDL BDL BDL
BDL
Max. 75 30 19 38
Average 70.92 26.67 16.50 33.92
98th Percentile 74.54 29.54 18.54 37.54
2. Jamania (A2)
Min. 45 18 9 15
BDL BDL BDL
BDL
Max. 51 21 11 18
Average 47.88 19.13 9.67 16.13
98th Percentile 50.54 20.54 11.00 17.54
3. Buhari (A3)
Min. 42 19 10 23
BDL BDL BDL
BDL
Max. 47 22 13 28
Average 44.21 20.21 11.17 25.25
98th Percentile 46.54 21.54 12.54 27.54
4. Andhatri (A4)
Min. 35 13 10 13
BDL BDL BDL
BDL
Max. 39 20 12 19
Average 36.75 16.04 10.67 15.79
98th Percentile 38.54 19.54 12.00 18.54
5. Valod (A5)
Min. 50 21 11 25
BDL BDL BDL BDL
Max. 58 25 14 30
Average 53.92 22.63 12.04 27.04
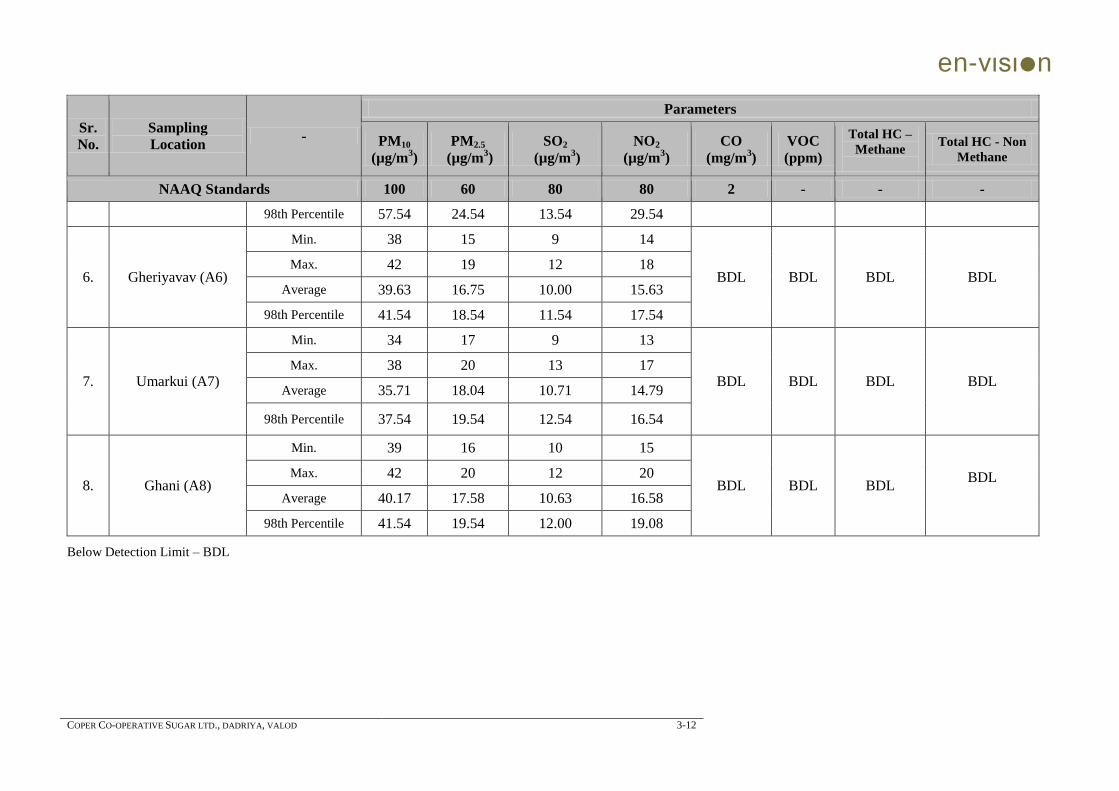
en-vιsιn
COPER CO-OPERATIVE SUGAR LTD., DADRIYA, VALOD 3-12
Sr.
No.
Sampling
Location -
Parameters
PM10
(µg/m3)
PM2.5
(µg/m3)
SO2
(µg/m3)
NO2
(µg/m3)
CO
(mg/m3)
VOC
(ppm)
Total HC –
Methane
Total HC - Non
Methane
NAAQ Standards 100 60 80 80 2 - - -
98th Percentile 57.54 24.54 13.54 29.54
6. Gheriyavav (A6)
Min. 38 15 9 14
BDL BDL BDL
BDL
Max. 42 19 12 18
Average 39.63 16.75 10.00 15.63
98th Percentile 41.54 18.54 11.54 17.54
7. Umarkui (A7)
Min. 34 17 9 13
BDL BDL BDL
BDL
Max. 38 20 13 17
Average 35.71 18.04 10.71 14.79
98th Percentile 37.54 19.54 12.54 16.54
8. Ghani (A8)
Min. 39 16 10 15
BDL BDL BDL BDL
Max. 42 20 12 20
Average 40.17 17.58 10.63 16.58
98th Percentile 41.54 19.54 12.00 19.08
Below Detection Limit – BDL
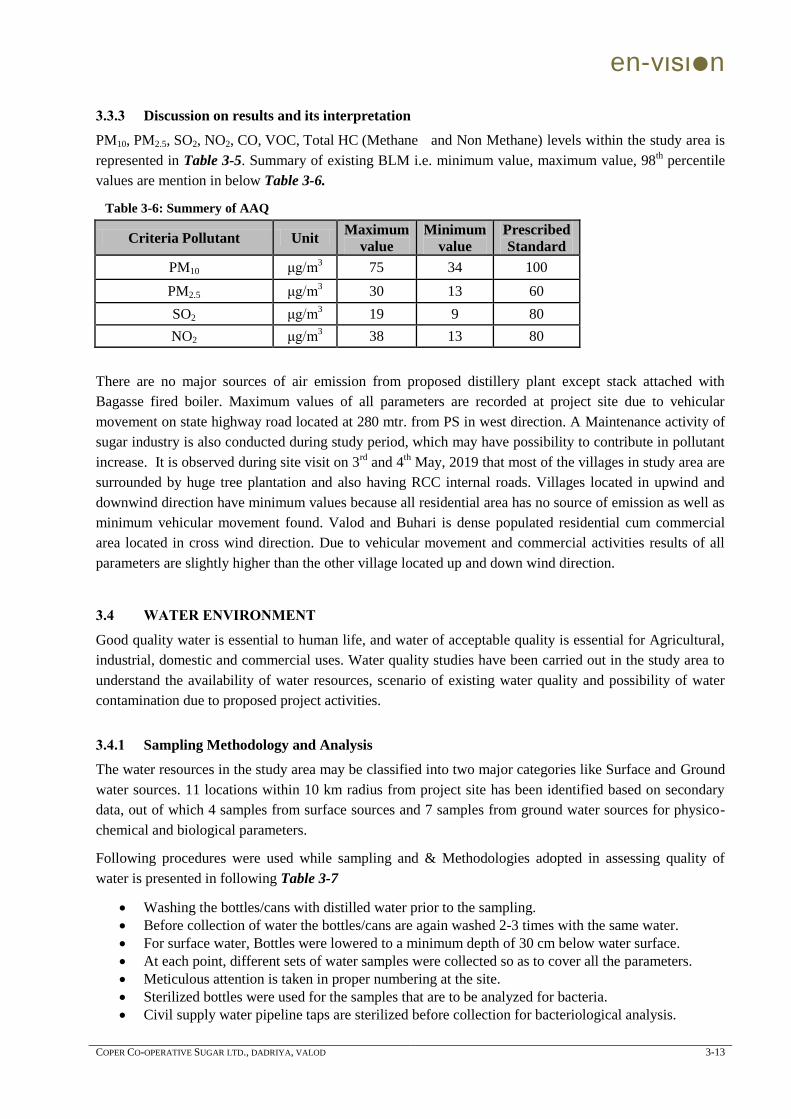
en-vιsιn
COPER CO-OPERATIVE SUGAR LTD., DADRIYA, VALOD 3-13
3.3.3 Discussion on results and its interpretation
PM10, PM2.5, SO2, NO2, CO, VOC, Total HC (Methane and Non Methane) levels within the study area is
represented in Table 3-5. Summary of existing BLM i.e. minimum value, maximum value, 98th percentile
values are mention in below Table 3-6.
Table 3-6: Summery of AAQ
Criteria Pollutant Unit Maximum
value
Minimum
value
Prescribed
Standard
PM10 μg/m3 75 34 100
PM2.5 μg/m3 30 13 60
SO2 μg/m3 19 9 80
NO2 μg/m3 38 13 80
There are no major sources of air emission from proposed distillery plant except stack attached with
Bagasse fired boiler. Maximum values of all parameters are recorded at project site due to vehicular
movement on state highway road located at 280 mtr. from PS in west direction. A Maintenance activity of
sugar industry is also conducted during study period, which may have possibility to contribute in pollutant
increase. It is observed during site visit on 3rd
and 4th May, 2019 that most of the villages in study area are
surrounded by huge tree plantation and also having RCC internal roads. Villages located in upwind and
downwind direction have minimum values because all residential area has no source of emission as well as
minimum vehicular movement found. Valod and Buhari is dense populated residential cum commercial
area located in cross wind direction. Due to vehicular movement and commercial activities results of all
parameters are slightly higher than the other village located up and down wind direction.
3.4 WATER ENVIRONMENT
Good quality water is essential to human life, and water of acceptable quality is essential for Agricultural,
industrial, domestic and commercial uses. Water quality studies have been carried out in the study area to
understand the availability of water resources, scenario of existing water quality and possibility of water
contamination due to proposed project activities.
3.4.1 Sampling Methodology and Analysis
The water resources in the study area may be classified into two major categories like Surface and Ground
water sources. 11 locations within 10 km radius from project site has been identified based on secondary
data, out of which 4 samples from surface sources and 7 samples from ground water sources for physico-
chemical and biological parameters.
Following procedures were used while sampling and & Methodologies adopted in assessing quality of
water is presented in following Table 3-7
Washing the bottles/cans with distilled water prior to the sampling.
Before collection of water the bottles/cans are again washed 2-3 times with the same water.
For surface water, Bottles were lowered to a minimum depth of 30 cm below water surface.
At each point, different sets of water samples were collected so as to cover all the parameters.
Meticulous attention is taken in proper numbering at the site.
Sterilized bottles were used for the samples that are to be analyzed for bacteria.
Civil supply water pipeline taps are sterilized before collection for bacteriological analysis.
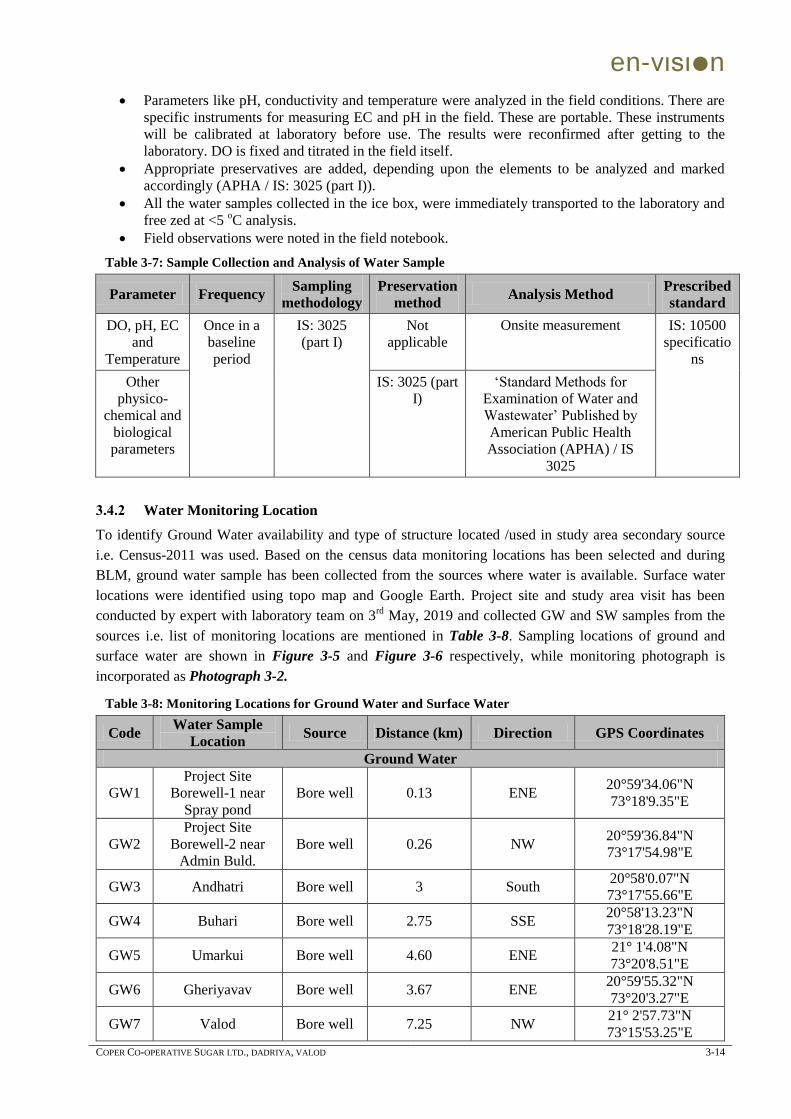
en-vιsιn
COPER CO-OPERATIVE SUGAR LTD., DADRIYA, VALOD 3-14
Parameters like pH, conductivity and temperature were analyzed in the field conditions. There are
specific instruments for measuring EC and pH in the field. These are portable. These instruments
will be calibrated at laboratory before use. The results were reconfirmed after getting to the
laboratory. DO is fixed and titrated in the field itself.
Appropriate preservatives are added, depending upon the elements to be analyzed and marked
accordingly (APHA / IS: 3025 (part I)).
All the water samples collected in the ice box, were immediately transported to the laboratory and
free zed at <5 oC analysis.
Field observations were noted in the field notebook.
Table 3-7: Sample Collection and Analysis of Water Sample
Parameter Frequency Sampling
methodology
Preservation
method Analysis Method
Prescribed
standard
DO, pH, EC
and
Temperature
Once in a
baseline
period
IS: 3025
(part I)
Not
applicable
Onsite measurement IS: 10500
specificatio
ns
Other
physico-
chemical and
biological
parameters
IS: 3025 (part
I)
„Standard Methods for
Examination of Water and
Wastewater‟ Published by
American Public Health
Association (APHA) / IS
3025
3.4.2 Water Monitoring Location
To identify Ground Water availability and type of structure located /used in study area secondary source
i.e. Census-2011 was used. Based on the census data monitoring locations has been selected and during
BLM, ground water sample has been collected from the sources where water is available. Surface water
locations were identified using topo map and Google Earth. Project site and study area visit has been
conducted by expert with laboratory team on 3rd
May, 2019 and collected GW and SW samples from the
sources i.e. list of monitoring locations are mentioned in Table 3-8. Sampling locations of ground and
surface water are shown in Figure 3-5 and Figure 3-6 respectively, while monitoring photograph is
incorporated as Photograph 3-2.
Table 3-8: Monitoring Locations for Ground Water and Surface Water
Code Water Sample
Location Source Distance (km) Direction GPS Coordinates
Ground Water
GW1
Project Site
Borewell-1 near
Spray pond
Bore well 0.13 ENE 20°59'34.06"N
73°18'9.35"E
GW2
Project Site
Borewell-2 near
Admin Buld.
Bore well 0.26 NW 20°59'36.84"N
73°17'54.98"E
GW3 Andhatri Bore well 3 South 20°58'0.07"N
73°17'55.66"E
GW4 Buhari Bore well 2.75 SSE 20°58'13.23"N
73°18'28.19"E
GW5 Umarkui Bore well 4.60 ENE 21° 1'4.08"N
73°20'8.51"E
GW6 Gheriyavav Bore well 3.67 ENE 20°59'55.32"N
73°20'3.27"E
GW7 Valod Bore well 7.25 NW 21° 2'57.73"N
73°15'53.25"E
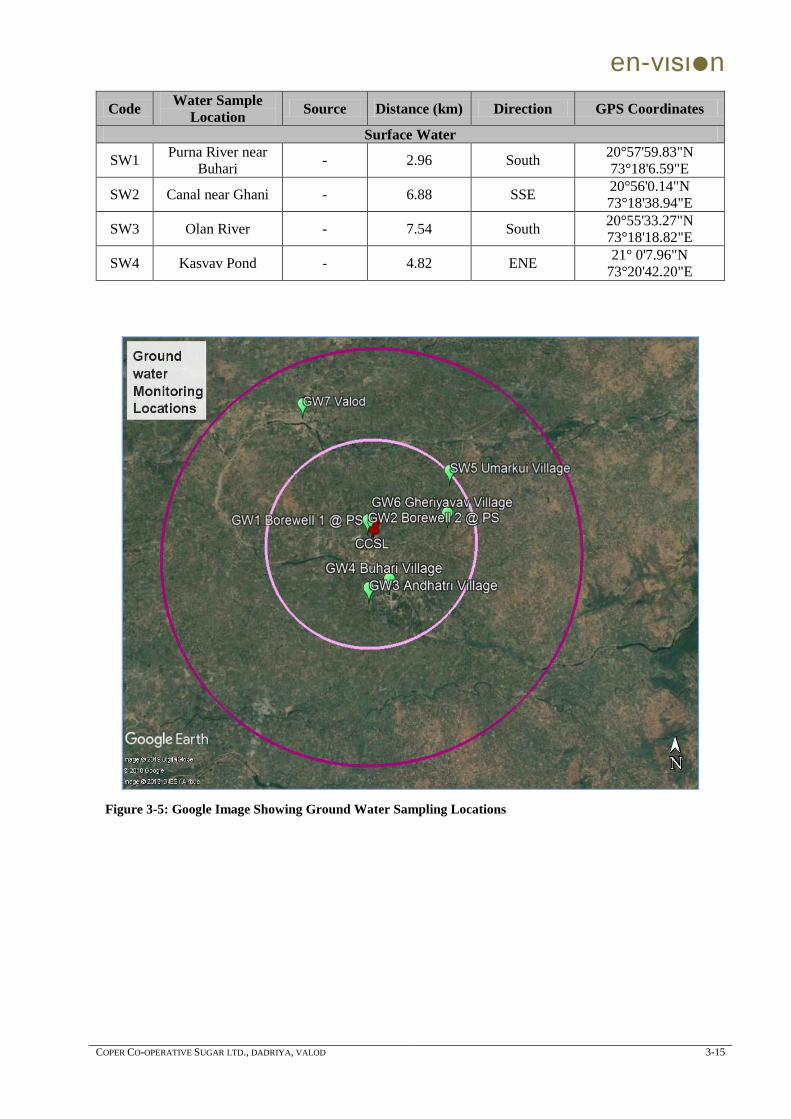
en-vιsιn
COPER CO-OPERATIVE SUGAR LTD., DADRIYA, VALOD 3-15
Code Water Sample
Location Source Distance (km) Direction GPS Coordinates
Surface Water
SW1 Purna River near
Buhari - 2.96 South
20°57'59.83"N
73°18'6.59"E
SW2 Canal near Ghani - 6.88 SSE 20°56'0.14"N
73°18'38.94"E
SW3 Olan River - 7.54 South 20°55'33.27"N
73°18'18.82"E
SW4 Kasvav Pond - 4.82 ENE 21° 0'7.96"N
73°20'42.20"E
Figure 3-5: Google Image Showing Ground Water Sampling Locations
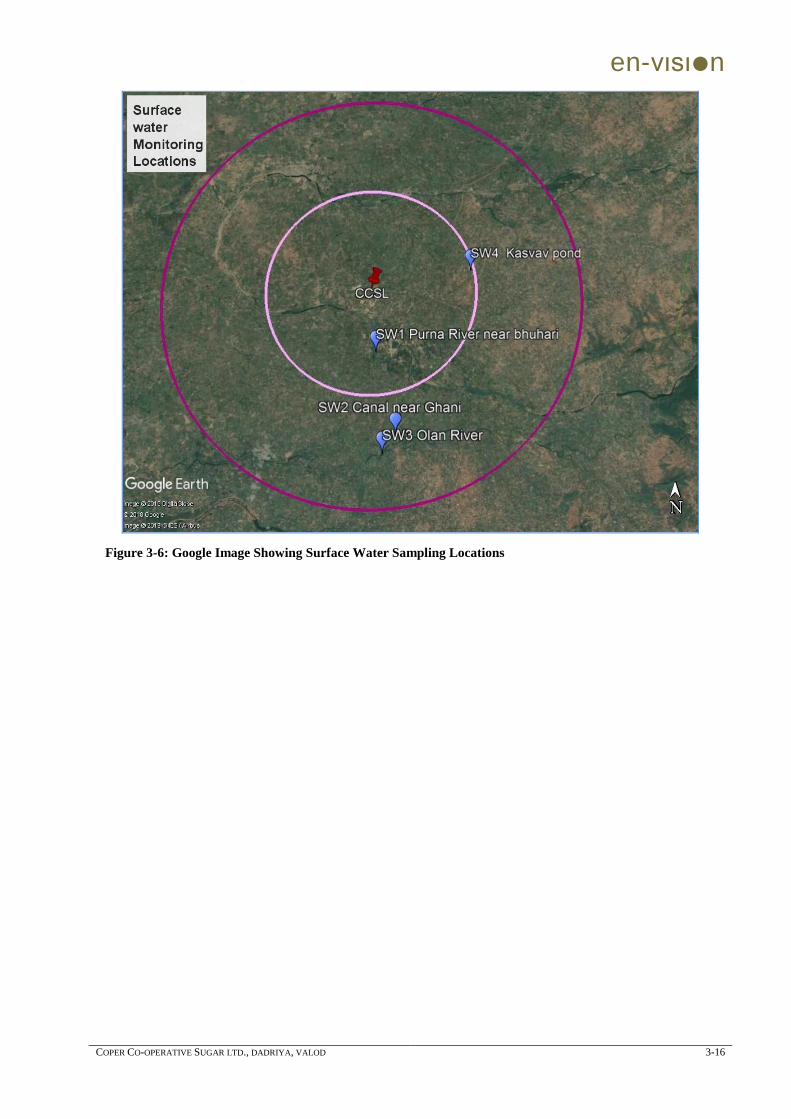
en-vιsιn
COPER CO-OPERATIVE SUGAR LTD., DADRIYA, VALOD 3-16
Figure 3-6: Google Image Showing Surface Water Sampling Locations
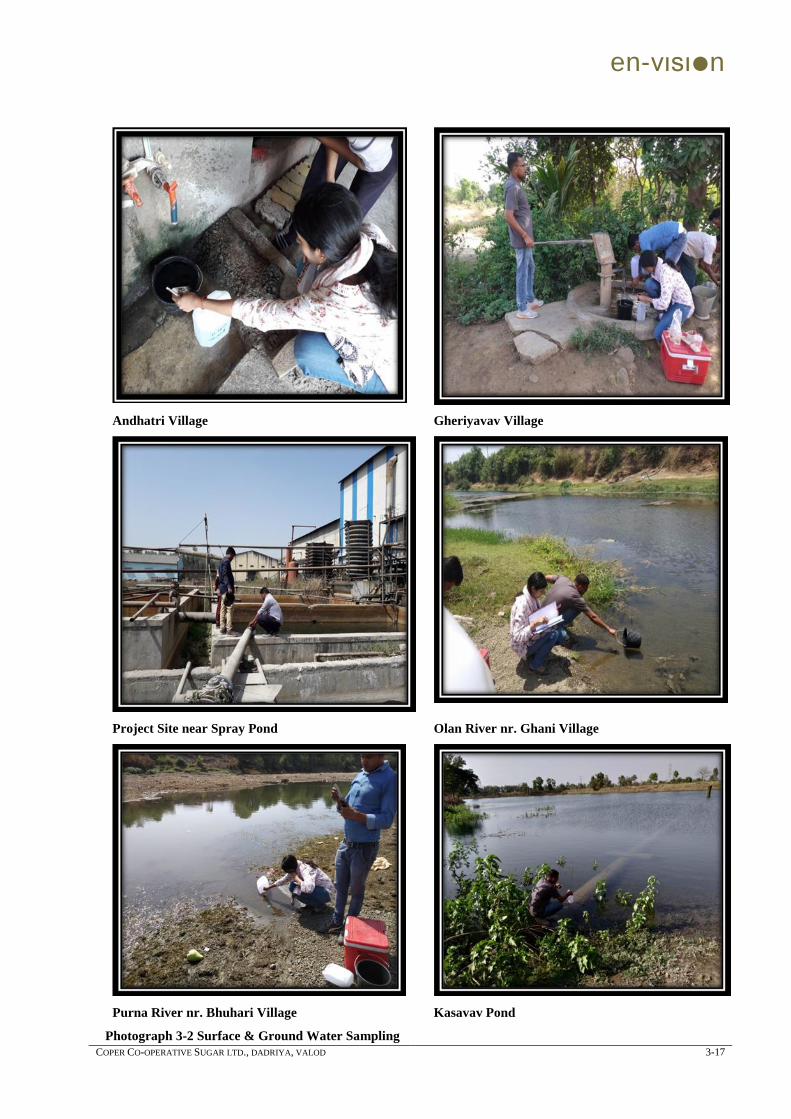
en-vιsιn
COPER CO-OPERATIVE SUGAR LTD., DADRIYA, VALOD 3-17
Andhatri Village Gheriyavav Village
Project Site near Spray Pond Olan River nr. Ghani Village
Purna River nr. Bhuhari Village Kasavav Pond
Photograph 3-2 Surface & Ground Water Sampling
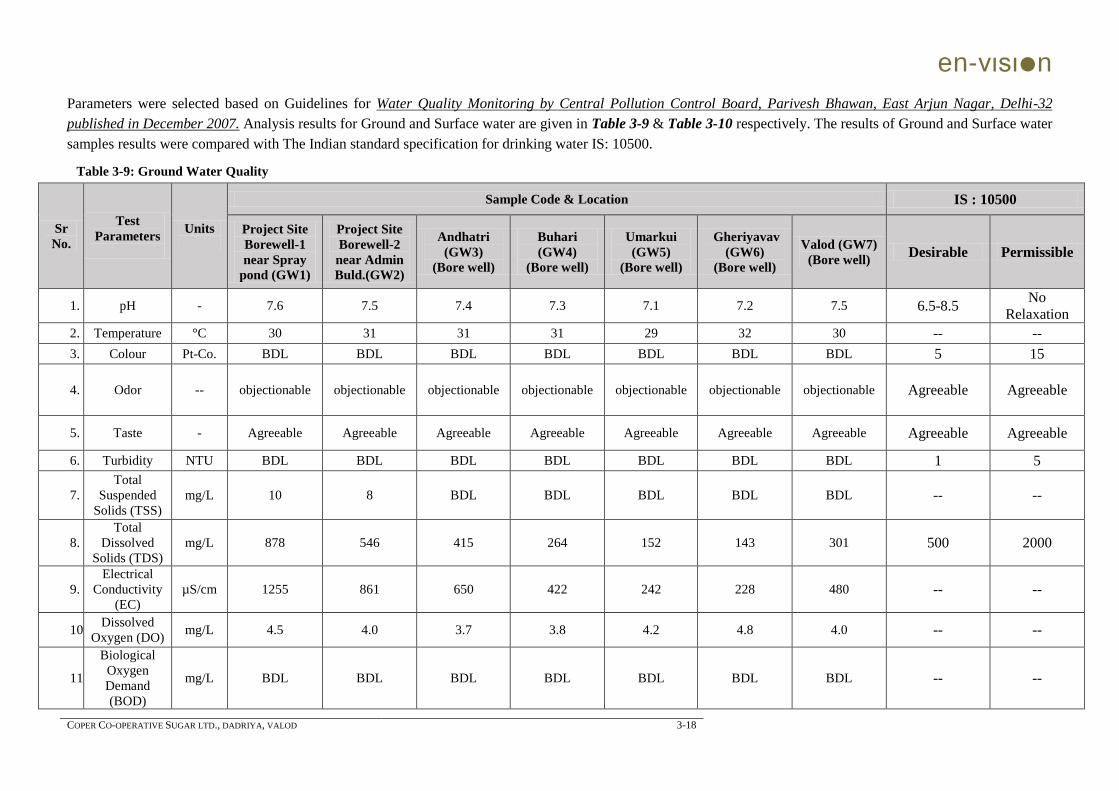
en-vιsιn
COPER CO-OPERATIVE SUGAR LTD., DADRIYA, VALOD 3-18
Parameters were selected based on Guidelines for Water Quality Monitoring by Central Pollution Control Board, Parivesh Bhawan, East Arjun Nagar, Delhi-32
published in December 2007. Analysis results for Ground and Surface water are given in Table 3-9 & Table 3-10 respectively. The results of Ground and Surface water
samples results were compared with The Indian standard specification for drinking water IS: 10500.
Table 3-9: Ground Water Quality
Sr
No.
Test
Parameters
Units
Sample Code & Location IS : 10500
Project Site
Borewell-1
near Spray
pond (GW1)
Project Site
Borewell-2
near Admin
Buld.(GW2)
Andhatri
(GW3)
(Bore well)
Buhari
(GW4)
(Bore well)
Umarkui
(GW5)
(Bore well)
Gheriyavav
(GW6)
(Bore well)
Valod (GW7)
(Bore well) Desirable Permissible
1. pH - 7.6 7.5 7.4 7.3 7.1 7.2 7.5 6.5-8.5 No
Relaxation
2. Temperature °C 30 31 31 31 29 32 30 -- --
3. Colour Pt-Co. BDL BDL BDL BDL BDL BDL BDL 5 15
4. Odor -- objectionable objectionable objectionable objectionable objectionable objectionable objectionable Agreeable Agreeable
5. Taste - Agreeable Agreeable Agreeable Agreeable Agreeable Agreeable Agreeable Agreeable Agreeable
6. Turbidity NTU BDL BDL BDL BDL BDL BDL BDL 1 5
7.
Total
Suspended
Solids (TSS)
mg/L 10 8 BDL BDL BDL BDL BDL -- --
8.
Total
Dissolved
Solids (TDS)
mg/L 878 546 415 264 152 143 301 500 2000
9.
Electrical
Conductivity
(EC)
µS/cm 1255 861 650 422 242 228 480 -- --
10. Dissolved
Oxygen (DO) mg/L 4.5 4.0 3.7 3.8 4.2 4.8 4.0 -- --
11.
Biological
Oxygen
Demand
(BOD)
mg/L BDL BDL BDL BDL BDL BDL BDL -- --
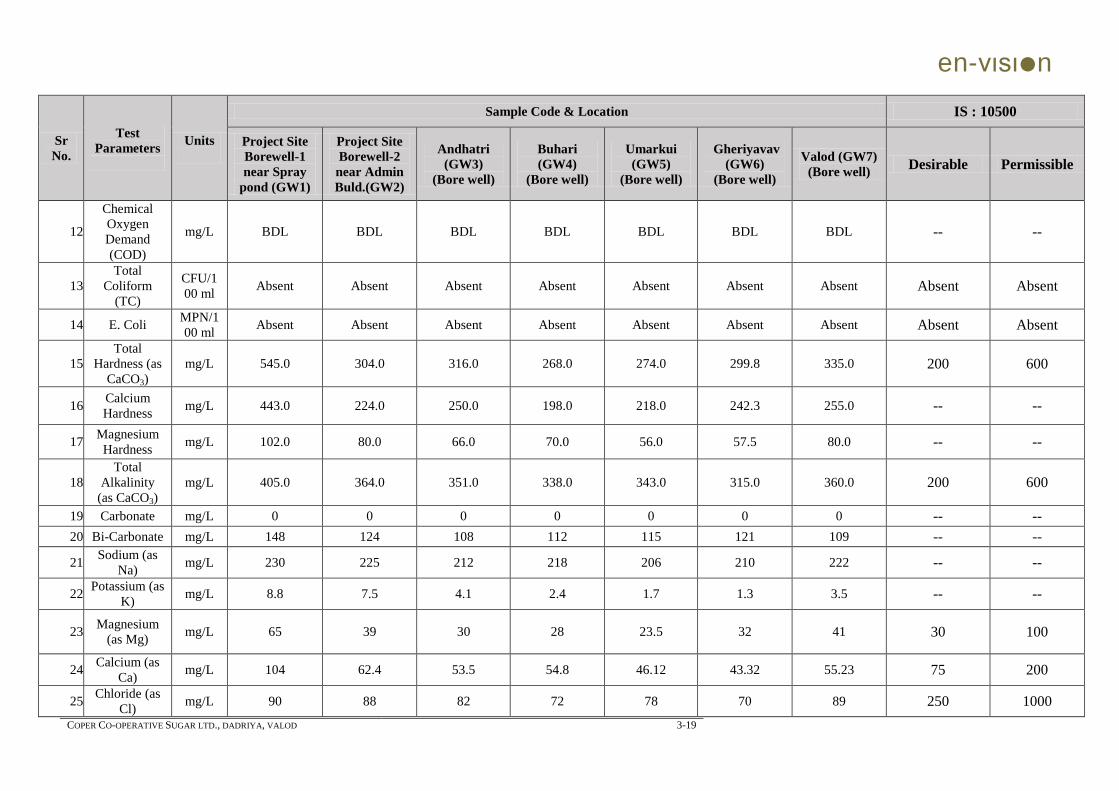
en-vιsιn
COPER CO-OPERATIVE SUGAR LTD., DADRIYA, VALOD 3-19
Sr
No.
Test
Parameters
Units
Sample Code & Location IS : 10500
Project Site
Borewell-1
near Spray
pond (GW1)
Project Site
Borewell-2
near Admin
Buld.(GW2)
Andhatri
(GW3)
(Bore well)
Buhari
(GW4)
(Bore well)
Umarkui
(GW5)
(Bore well)
Gheriyavav
(GW6)
(Bore well)
Valod (GW7)
(Bore well) Desirable Permissible
12.
Chemical
Oxygen
Demand
(COD)
mg/L BDL BDL BDL BDL BDL BDL BDL -- --
13.
Total
Coliform
(TC)
CFU/1
00 ml Absent Absent Absent Absent Absent Absent Absent Absent Absent
14. E. Coli MPN/1
00 ml Absent Absent Absent Absent Absent Absent Absent Absent Absent
15.
Total
Hardness (as
CaCO3)
mg/L 545.0 304.0 316.0 268.0 274.0 299.8 335.0 200 600
16. Calcium
Hardness mg/L 443.0 224.0 250.0 198.0 218.0 242.3 255.0 -- --
17. Magnesium
Hardness mg/L 102.0 80.0 66.0 70.0 56.0 57.5 80.0 -- --
18.
Total
Alkalinity
(as CaCO3)
mg/L 405.0 364.0 351.0 338.0 343.0 315.0 360.0 200 600
19. Carbonate mg/L 0 0 0 0 0 0 0 -- --
20. Bi-Carbonate mg/L 148 124 108 112 115 121 109 -- --
21. Sodium (as
Na) mg/L 230 225 212 218 206 210 222 -- --
22. Potassium (as
K) mg/L 8.8 7.5 4.1 2.4 1.7 1.3 3.5 -- --
23. Magnesium
(as Mg) mg/L 65 39 30 28 23.5 32 41 30 100
24. Calcium (as
Ca) mg/L 104 62.4 53.5 54.8 46.12 43.32 55.23 75 200
25. Chloride (as
Cl) mg/L 90 88 82 72 78 70 89 250 1000
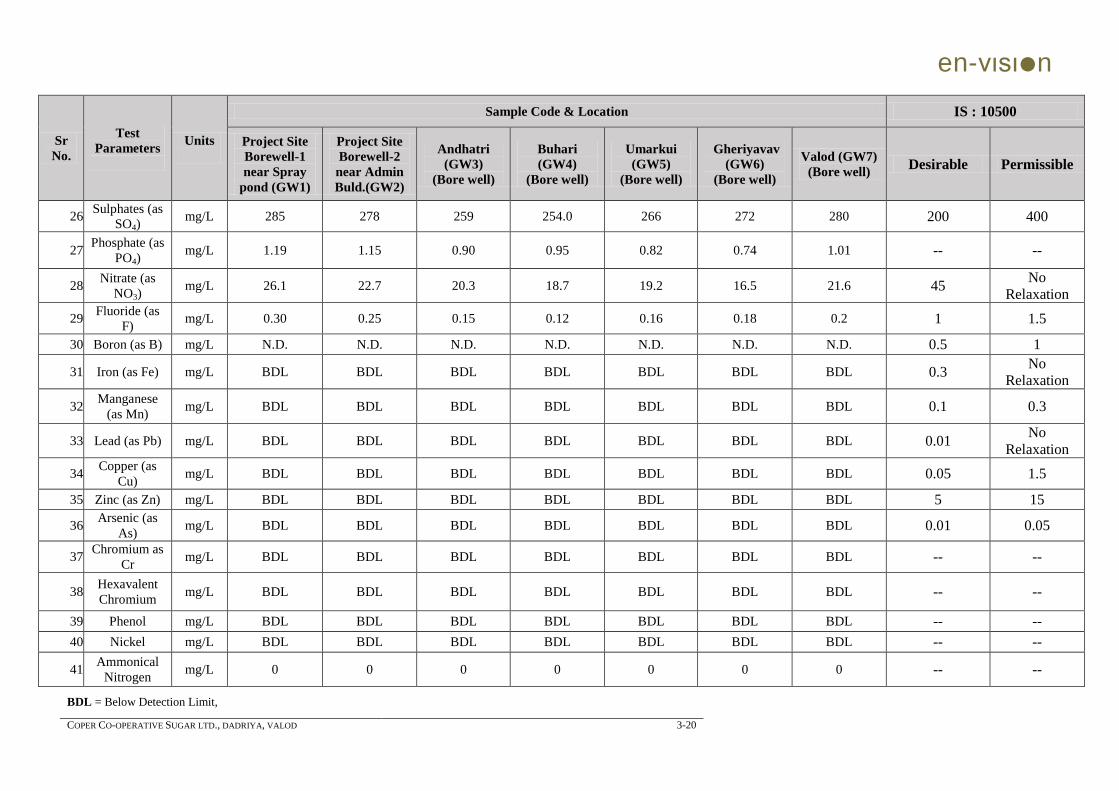
en-vιsιn
COPER CO-OPERATIVE SUGAR LTD., DADRIYA, VALOD 3-20
Sr
No.
Test
Parameters
Units
Sample Code & Location IS : 10500
Project Site
Borewell-1
near Spray
pond (GW1)
Project Site
Borewell-2
near Admin
Buld.(GW2)
Andhatri
(GW3)
(Bore well)
Buhari
(GW4)
(Bore well)
Umarkui
(GW5)
(Bore well)
Gheriyavav
(GW6)
(Bore well)
Valod (GW7)
(Bore well) Desirable Permissible
26. Sulphates (as
SO4) mg/L 285 278 259 254.0 266 272 280 200 400
27. Phosphate (as
PO4) mg/L 1.19 1.15 0.90 0.95 0.82 0.74 1.01 -- --
28. Nitrate (as
NO3) mg/L 26.1 22.7 20.3 18.7 19.2 16.5 21.6 45
No
Relaxation
29. Fluoride (as
F) mg/L 0.30 0.25 0.15 0.12 0.16 0.18 0.2 1 1.5
30. Boron (as B) mg/L N.D. N.D. N.D. N.D. N.D. N.D. N.D. 0.5 1
31. Iron (as Fe) mg/L BDL BDL BDL BDL BDL BDL BDL 0.3 No
Relaxation
32. Manganese
(as Mn) mg/L BDL BDL BDL BDL BDL BDL BDL 0.1 0.3
33. Lead (as Pb) mg/L BDL BDL BDL BDL BDL BDL BDL 0.01 No
Relaxation
34. Copper (as
Cu) mg/L BDL BDL BDL BDL BDL BDL BDL 0.05 1.5
35. Zinc (as Zn) mg/L BDL BDL BDL BDL BDL BDL BDL 5 15
36. Arsenic (as
As) mg/L BDL BDL BDL BDL BDL BDL BDL 0.01 0.05
37. Chromium as
Cr mg/L BDL BDL BDL BDL BDL BDL BDL -- --
38. Hexavalent
Chromium mg/L BDL BDL BDL BDL BDL BDL BDL -- --
39. Phenol mg/L BDL BDL BDL BDL BDL BDL BDL -- --
40. Nickel mg/L BDL BDL BDL BDL BDL BDL BDL -- --
41. Ammonical
Nitrogen mg/L 0 0 0 0 0 0 0 -- --
BDL = Below Detection Limit,
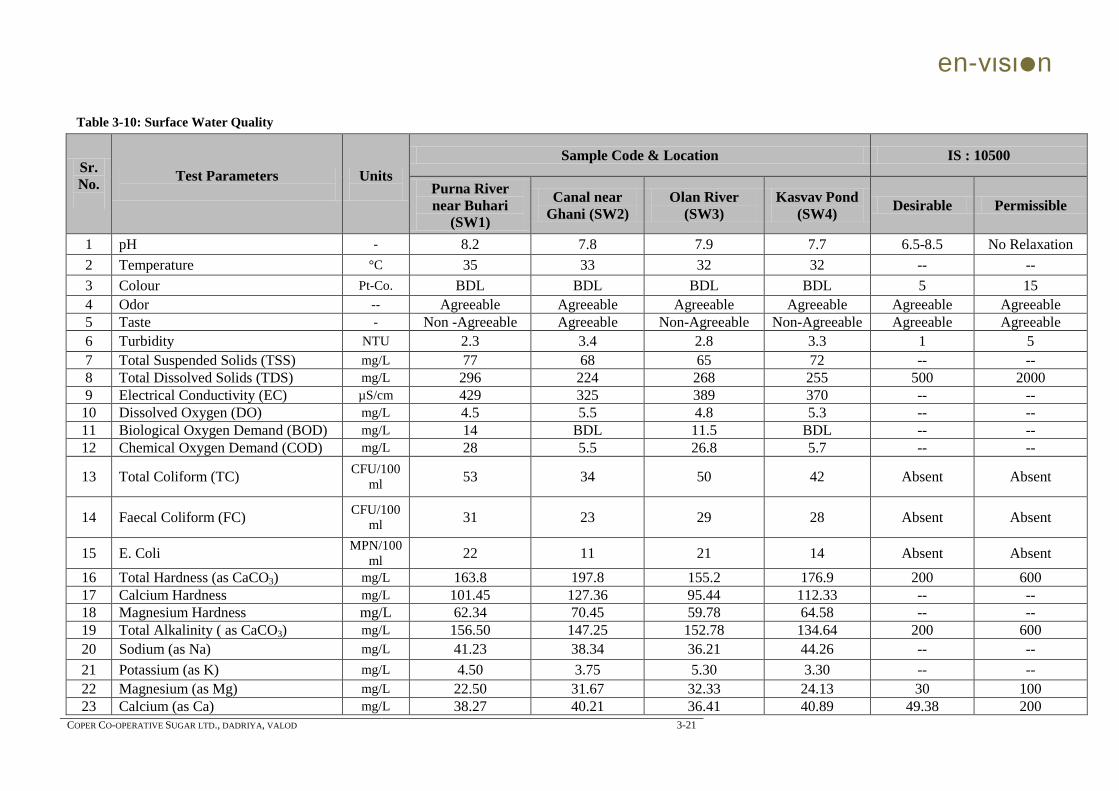
en-vιsιn
COPER CO-OPERATIVE SUGAR LTD., DADRIYA, VALOD 3-21
Table 3-10: Surface Water Quality
Sr.
No.
Test Parameters
Units
Sample Code & Location IS : 10500
Purna River
near Buhari
(SW1)
Canal near
Ghani (SW2)
Olan River
(SW3)
Kasvav Pond
(SW4) Desirable Permissible
1 pH - 8.2 7.8 7.9 7.7 6.5-8.5 No Relaxation
2 Temperature °C 35 33 32 32 -- --
3 Colour Pt-Co. BDL BDL BDL BDL 5 15
4 Odor -- Agreeable Agreeable Agreeable Agreeable Agreeable Agreeable
5 Taste - Non -Agreeable Agreeable Non-Agreeable Non-Agreeable Agreeable Agreeable
6 Turbidity NTU 2.3 3.4 2.8 3.3 1 5
7 Total Suspended Solids (TSS) mg/L 77 68 65 72 -- --
8 Total Dissolved Solids (TDS) mg/L 296 224 268 255 500 2000
9 Electrical Conductivity (EC) µS/cm 429 325 389 370 -- --
10 Dissolved Oxygen (DO) mg/L 4.5 5.5 4.8 5.3 -- --
11 Biological Oxygen Demand (BOD) mg/L 14 BDL 11.5 BDL -- --
12 Chemical Oxygen Demand (COD) mg/L 28 5.5 26.8 5.7 -- --
13 Total Coliform (TC) CFU/100
ml 53 34 50 42 Absent Absent
14 Faecal Coliform (FC) CFU/100
ml 31 23 29 28 Absent Absent
15 E. Coli MPN/100
ml 22 11 21 14 Absent Absent
16 Total Hardness (as CaCO3) mg/L 163.8 197.8 155.2 176.9 200 600
17 Calcium Hardness mg/L 101.45 127.36 95.44 112.33 -- --
18 Magnesium Hardness mg/L 62.34 70.45 59.78 64.58 -- --
19 Total Alkalinity ( as CaCO3) mg/L 156.50 147.25 152.78 134.64 200 600
20 Sodium (as Na) mg/L 41.23 38.34 36.21 44.26 -- --
21 Potassium (as K) mg/L 4.50 3.75 5.30 3.30 -- --
22 Magnesium (as Mg) mg/L 22.50 31.67 32.33 24.13 30 100
23 Calcium (as Ca) mg/L 38.27 40.21 36.41 40.89 49.38 200
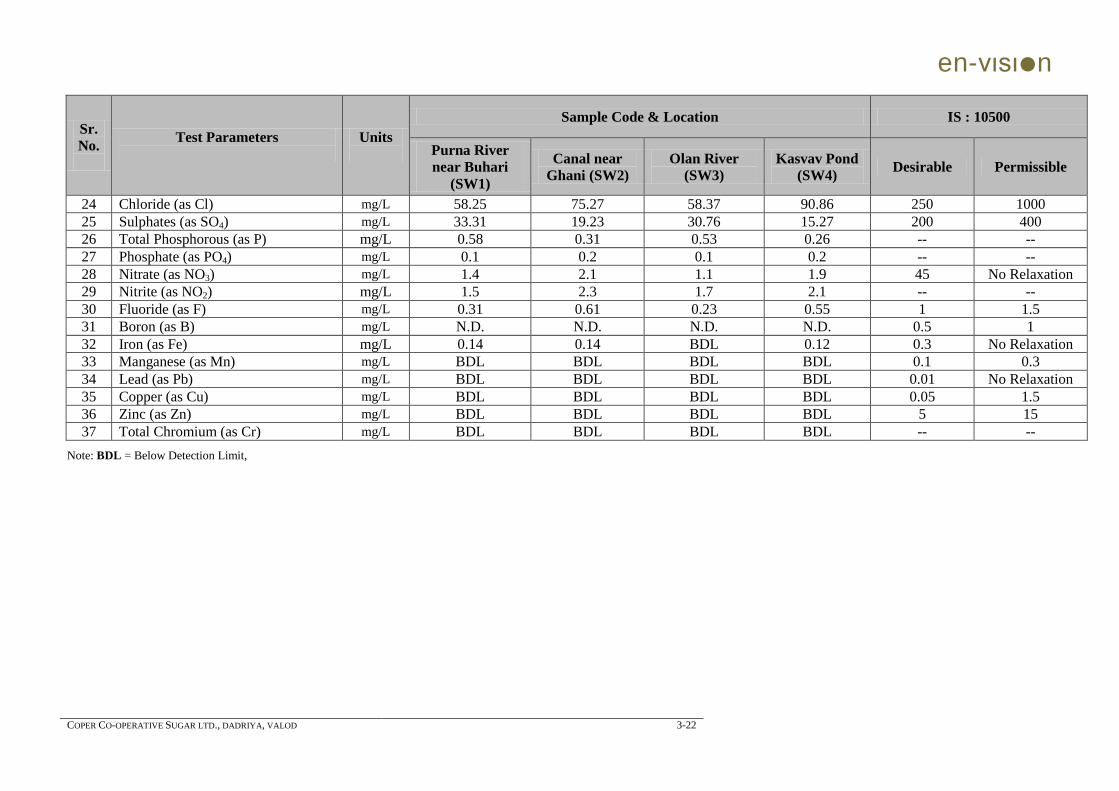
en-vιsιn
COPER CO-OPERATIVE SUGAR LTD., DADRIYA, VALOD 3-22
Sr.
No.
Test Parameters
Units
Sample Code & Location IS : 10500
Purna River
near Buhari
(SW1)
Canal near
Ghani (SW2)
Olan River
(SW3)
Kasvav Pond
(SW4) Desirable Permissible
24 Chloride (as Cl) mg/L 58.25 75.27 58.37 90.86 250 1000
25 Sulphates (as SO4) mg/L 33.31 19.23 30.76 15.27 200 400
26 Total Phosphorous (as P) mg/L 0.58 0.31 0.53 0.26 -- --
27 Phosphate (as PO4) mg/L 0.1 0.2 0.1 0.2 -- --
28 Nitrate (as NO3) mg/L 1.4 2.1 1.1 1.9 45 No Relaxation
29 Nitrite (as NO2) mg/L 1.5 2.3 1.7 2.1 -- --
30 Fluoride (as F) mg/L 0.31 0.61 0.23 0.55 1 1.5
31 Boron (as B) mg/L N.D. N.D. N.D. N.D. 0.5 1
32 Iron (as Fe) mg/L 0.14 0.14 BDL 0.12 0.3 No Relaxation
33 Manganese (as Mn) mg/L BDL BDL BDL BDL 0.1 0.3
34 Lead (as Pb) mg/L BDL BDL BDL BDL 0.01 No Relaxation
35 Copper (as Cu) mg/L BDL BDL BDL BDL 0.05 1.5
36 Zinc (as Zn) mg/L BDL BDL BDL BDL 5 15
37 Total Chromium (as Cr) mg/L BDL BDL BDL BDL -- --
Note: BDL = Below Detection Limit,
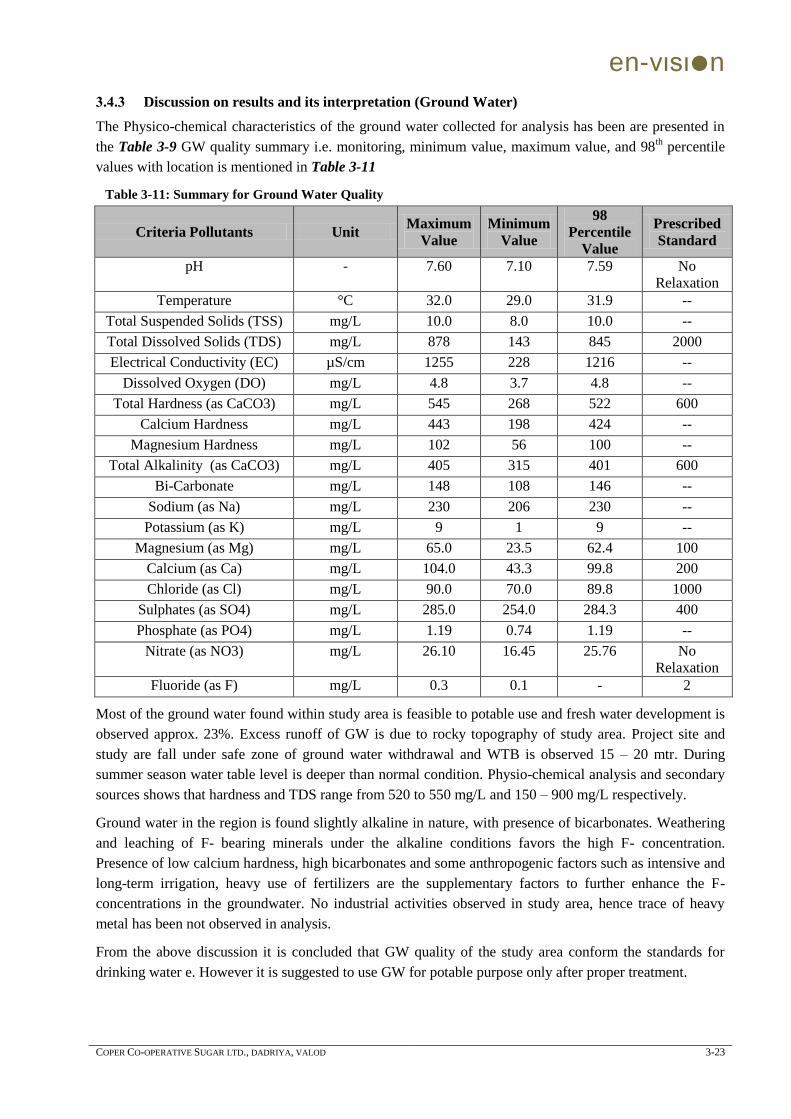
en-vιsιn
COPER CO-OPERATIVE SUGAR LTD., DADRIYA, VALOD 3-23
3.4.3 Discussion on results and its interpretation (Ground Water)
The Physico-chemical characteristics of the ground water collected for analysis has been are presented in
the Table 3-9 GW quality summary i.e. monitoring, minimum value, maximum value, and 98th percentile
values with location is mentioned in Table 3-11
Table 3-11: Summary for Ground Water Quality
Criteria Pollutants Unit Maximum
Value
Minimum
Value
98
Percentile
Value
Prescribed
Standard
pH - 7.60 7.10 7.59 No
Relaxation
Temperature °C 32.0 29.0 31.9 --
Total Suspended Solids (TSS) mg/L 10.0 8.0 10.0 --
Total Dissolved Solids (TDS) mg/L 878 143 845 2000
Electrical Conductivity (EC) µS/cm 1255 228 1216 --
Dissolved Oxygen (DO) mg/L 4.8 3.7 4.8 --
Total Hardness (as CaCO3) mg/L 545 268 522 600
Calcium Hardness mg/L 443 198 424 --
Magnesium Hardness mg/L 102 56 100 --
Total Alkalinity (as CaCO3) mg/L 405 315 401 600
Bi-Carbonate mg/L 148 108 146 --
Sodium (as Na) mg/L 230 206 230 --
Potassium (as K) mg/L 9 1 9 --
Magnesium (as Mg) mg/L 65.0 23.5 62.4 100
Calcium (as Ca) mg/L 104.0 43.3 99.8 200
Chloride (as Cl) mg/L 90.0 70.0 89.8 1000
Sulphates (as SO4) mg/L 285.0 254.0 284.3 400
Phosphate (as PO4) mg/L 1.19 0.74 1.19 --
Nitrate (as NO3) mg/L 26.10 16.45 25.76 No
Relaxation
Fluoride (as F) mg/L 0.3 0.1 - 2
Most of the ground water found within study area is feasible to potable use and fresh water development is
observed approx. 23%. Excess runoff of GW is due to rocky topography of study area. Project site and
study are fall under safe zone of ground water withdrawal and WTB is observed 15 – 20 mtr. During
summer season water table level is deeper than normal condition. Physio-chemical analysis and secondary
sources shows that hardness and TDS range from 520 to 550 mg/L and 150 – 900 mg/L respectively.
Ground water in the region is found slightly alkaline in nature, with presence of bicarbonates. Weathering
and leaching of F- bearing minerals under the alkaline conditions favors the high F- concentration.
Presence of low calcium hardness, high bicarbonates and some anthropogenic factors such as intensive and
long-term irrigation, heavy use of fertilizers are the supplementary factors to further enhance the F-
concentrations in the groundwater. No industrial activities observed in study area, hence trace of heavy
metal has been not observed in analysis.
From the above discussion it is concluded that GW quality of the study area conform the standards for
drinking water e. However it is suggested to use GW for potable purpose only after proper treatment.
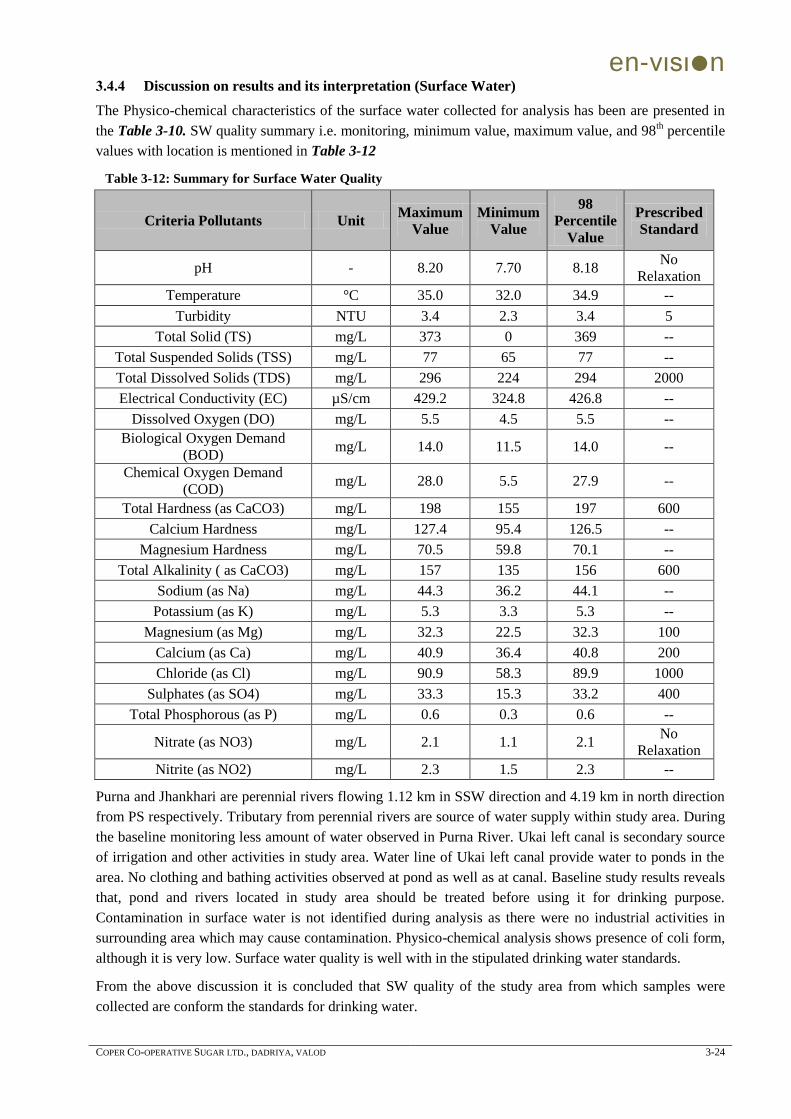
en-vιsιn
COPER CO-OPERATIVE SUGAR LTD., DADRIYA, VALOD 3-24
3.4.4 Discussion on results and its interpretation (Surface Water)
The Physico-chemical characteristics of the surface water collected for analysis has been are presented in
the Table 3-10. SW quality summary i.e. monitoring, minimum value, maximum value, and 98th percentile
values with location is mentioned in Table 3-12
Table 3-12: Summary for Surface Water Quality
Criteria Pollutants Unit Maximum
Value
Minimum
Value
98
Percentile
Value
Prescribed
Standard
pH - 8.20 7.70 8.18 No
Relaxation
Temperature °C 35.0 32.0 34.9 --
Turbidity NTU 3.4 2.3 3.4 5
Total Solid (TS) mg/L 373 0 369 --
Total Suspended Solids (TSS) mg/L 77 65 77 --
Total Dissolved Solids (TDS) mg/L 296 224 294 2000
Electrical Conductivity (EC) µS/cm 429.2 324.8 426.8 --
Dissolved Oxygen (DO) mg/L 5.5 4.5 5.5 --
Biological Oxygen Demand
(BOD) mg/L 14.0 11.5 14.0 --
Chemical Oxygen Demand
(COD) mg/L 28.0 5.5 27.9 --
Total Hardness (as CaCO3) mg/L 198 155 197 600
Calcium Hardness mg/L 127.4 95.4 126.5 --
Magnesium Hardness mg/L 70.5 59.8 70.1 --
Total Alkalinity ( as CaCO3) mg/L 157 135 156 600
Sodium (as Na) mg/L 44.3 36.2 44.1 --
Potassium (as K) mg/L 5.3 3.3 5.3 --
Magnesium (as Mg) mg/L 32.3 22.5 32.3 100
Calcium (as Ca) mg/L 40.9 36.4 40.8 200
Chloride (as Cl) mg/L 90.9 58.3 89.9 1000
Sulphates (as SO4) mg/L 33.3 15.3 33.2 400
Total Phosphorous (as P) mg/L 0.6 0.3 0.6 --
Nitrate (as NO3) mg/L 2.1 1.1 2.1 No
Relaxation
Nitrite (as NO2) mg/L 2.3 1.5 2.3 --
Purna and Jhankhari are perennial rivers flowing 1.12 km in SSW direction and 4.19 km in north direction
from PS respectively. Tributary from perennial rivers are source of water supply within study area. During
the baseline monitoring less amount of water observed in Purna River. Ukai left canal is secondary source
of irrigation and other activities in study area. Water line of Ukai left canal provide water to ponds in the
area. No clothing and bathing activities observed at pond as well as at canal. Baseline study results reveals
that, pond and rivers located in study area should be treated before using it for drinking purpose.
Contamination in surface water is not identified during analysis as there were no industrial activities in
surrounding area which may cause contamination. Physico-chemical analysis shows presence of coli form,
although it is very low. Surface water quality is well with in the stipulated drinking water standards.
From the above discussion it is concluded that SW quality of the study area from which samples were
collected are conform the standards for drinking water.
en-vιsιn
COPER CO-OPERATIVE SUGAR LTD., DADRIYA, VALOD 3-25
3.5 NOISE ENVIRONMENT
Noise is unpleasant, unexpected, or undesired with various frequencies over the audible range due to the
regular activities of the mankind. The source of most outdoor noise worldwide is mainly evolved from
Industries, constructions and transportation systems, including motor vehicle noise, aircraft noise and rail
noise, poor urban planning may give rise to noise pollution.
Industrial Noise resulting to noise pollution has many reasons such as industries being close to human
habitats which prevent the noise from decaying before it reaches human ear.
A determination is made of the micro scale impact by predicting anticipated noise levels for each
alternative during both construction and operational phases. Predicted noise levels are compared with
applicable standards or criteria in order to assess the impact.
The physical description of sound concerns its loudness as a function of frequency. Noise in general sound
comprises of many frequency components with different variations in loudness over the audible frequency
range.
The objective of noise pollution survey around the project site was to identify existing noise sources and to
measure background noise levels. The study was carried out in the following steps:
Reconnaissance
Identification of noise sources and measurement of noise levels
Measurement of transportation and community noise levels
Monitoring of noise is done by identifying suitable number of noise quality monitoring locations.
Background noise quality is monitored in dB (A) Leq (d) and dB (A) Leq (n) at the selected locations.
Ambient noise level monitoring was done at same locations where ambient air monitoring was carried out
within a study area. The locations are away from the major roads and major noise sources so as to measure
ambient noise levels. One day monitoring was carried out at all the locations. The frequency of monitoring
was set at an interval of one hour for 24-hours.
Table 3-13: Noise Monitoring Methodology
Environment
Component
Sampling
frequency Methodology
Sample collection Sampling
Parameter Sampling
equipment Range Resolution
Ambient
Noise
Once during the
study
(Hourly
reading for 24
hours at each
location)
IS: 9989-
1991
Sound
level meter
30 dB(A)
to 130
dB(A)
0.1 dB Decibels –
dB (A)
Equivalent Sound Levels or Equivalent Continuous Equal Energy Level (Leq)
There is large number of noise scales and rating methods based on some sort of average of weighted
average quantities derived from the detailed noise characteristics. Equivalent sound levels or Equivalent
continuous equal energy level (Leq) is a statistical value of sound pressure level that can be equated to any
fluctuating noise level and forms a useful measure of noise exposure and forms basis of several of the
noise indices used presently.
en-vιsιn
COPER CO-OPERATIVE SUGAR LTD., DADRIYA, VALOD 3-26
Leq is defined as the constant noise level, which over a given time, expands the same amount of energy, as
is expanded by the fluctuating level over the same time. This value is expressed by the equation:
Leq = 10 log (10) Li/10
ti
Where,
n = Total number of sound samples,
Li = the noise level of any ith
sample
ti = Time duration of ith sample,
Expressed as fraction of total sample time
Leq has gained wide spread acceptance as a scale for the measurement of long term noise exposure. Hourly
equipment noise levels in the identified impact zone are monitored for day and time separately using sound
level meter. All the values are reported in Leq and in case of equipment noise, Sound pressure level are
monitored 1.5 m away from the machine and assessed with respect to standard prescribed in factory Act.
3.5.1 Noise Monitoring Locations
Ambient noise monitoring was carried out 10 km study area. Sensitive locations (as defined in The Noise
Pollution (Regulation and Control) Rules, 2000 and its subsequent amendments) were identified and
ambient monitoring was done at a distance more than 100 m from the identified location.
Table 3-14: Ambient Noise Quality Standards for Different Areas/Zones
Ambient Air Quality
Standards
in Respect of Noise
Area
Code Category
Limits in dB(A) Leq4
Day Time
(6 am to 10
pm)
Night Time
(10 pm to 6
am)
The Noise Pollution
(Regulation and
Control)
Rules, 2000 and its
subsequent
amendments
A Industrial 75.0 70.0
B Commercial 65.0 55.0
C Residential 55.0 45.0
D Silence5 50.0 45.0
Keeping in view of various local activities such as residential and Industrial activities 6 noise level
measurement locations were identified and the sites are mentioned in Table 3-15 Google image showing
monitoring locations is depicted as Figure 3-7 while monitoring photograph is incorporated as photograph
- Recorded noise levels are given in Photograph 3-3
4 dB (A) Leq*: denotes the time weighted average of the level of sound in decibels on scale A which is
relatable to human hearing. 5Area comprising not less than 100 mt around Hospitals, educational institutions, courts, religious places or
any other area which is declared as such by the competent authority.
i=n
i=1
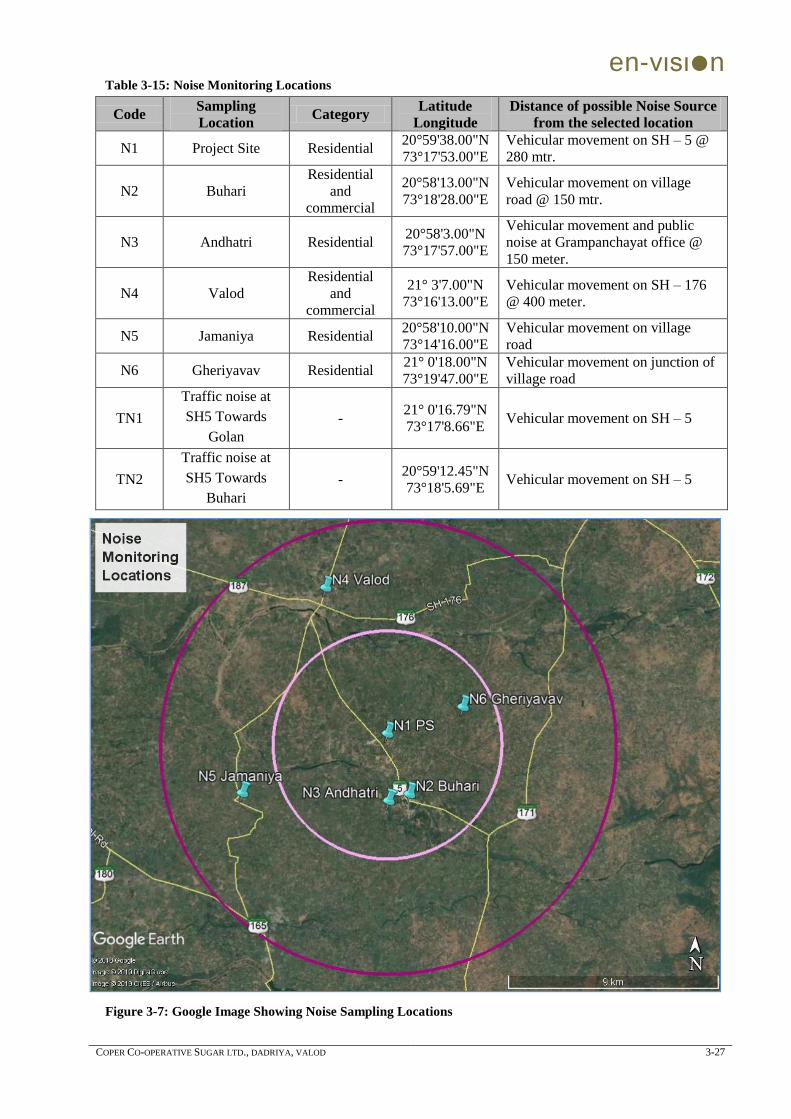
en-vιsιn
COPER CO-OPERATIVE SUGAR LTD., DADRIYA, VALOD 3-27
Table 3-15: Noise Monitoring Locations
Code Sampling
Location Category
Latitude
Longitude
Distance of possible Noise Source
from the selected location
N1 Project Site Residential 20°59'38.00"N
73°17'53.00"E
Vehicular movement on SH – 5 @
280 mtr.
N2 Buhari
Residential
and
commercial
20°58'13.00"N
73°18'28.00"E
Vehicular movement on village
road @ 150 mtr.
N3 Andhatri Residential 20°58'3.00"N
73°17'57.00"E
Vehicular movement and public
noise at Grampanchayat office @
150 meter.
N4 Valod
Residential
and
commercial
21° 3'7.00"N
73°16'13.00"E
Vehicular movement on SH – 176
@ 400 meter.
N5 Jamaniya Residential 20°58'10.00"N
73°14'16.00"E
Vehicular movement on village
road
N6 Gheriyavav Residential 21° 0'18.00"N
73°19'47.00"E
Vehicular movement on junction of
village road
TN1
Traffic noise at
SH5 Towards
Golan
- 21° 0'16.79"N
73°17'8.66"E Vehicular movement on SH – 5
TN2
Traffic noise at
SH5 Towards
Buhari
- 20°59'12.45"N
73°18'5.69"E Vehicular movement on SH – 5
Figure 3-7: Google Image Showing Noise Sampling Locations
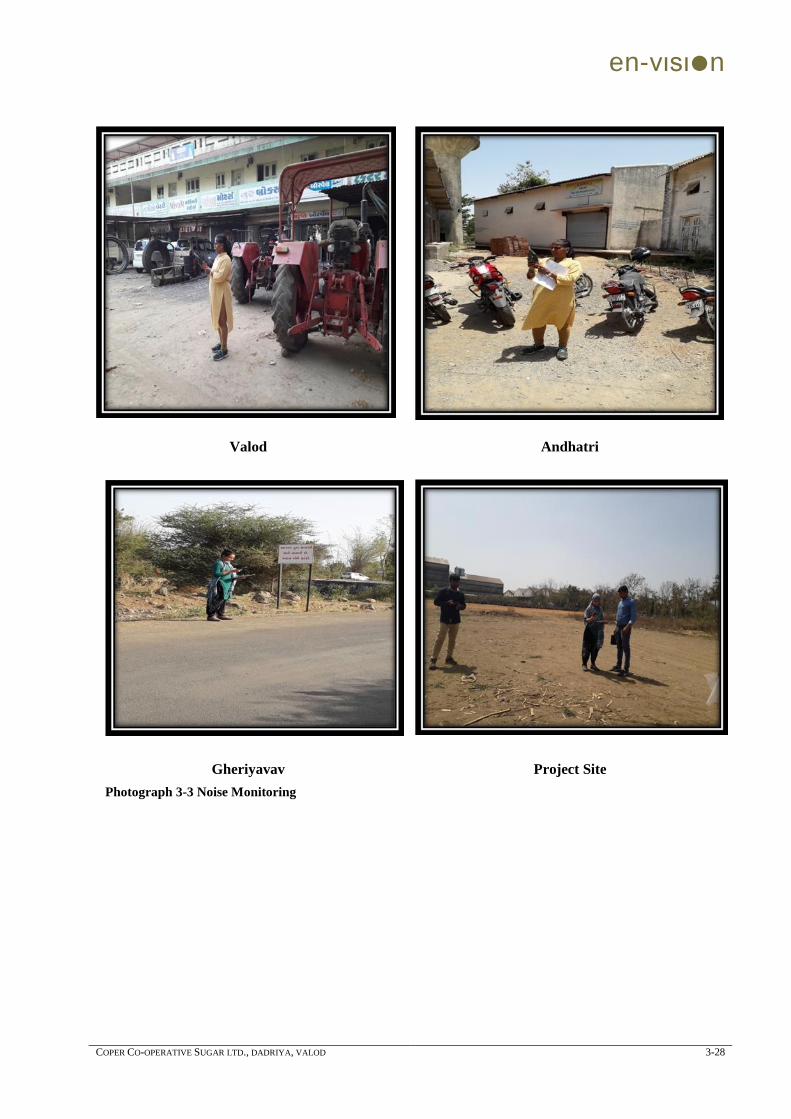
en-vιsιn
COPER CO-OPERATIVE SUGAR LTD., DADRIYA, VALOD 3-28
Valod Andhatri
Gheriyavav Project Site
Photograph 3-3 Noise Monitoring
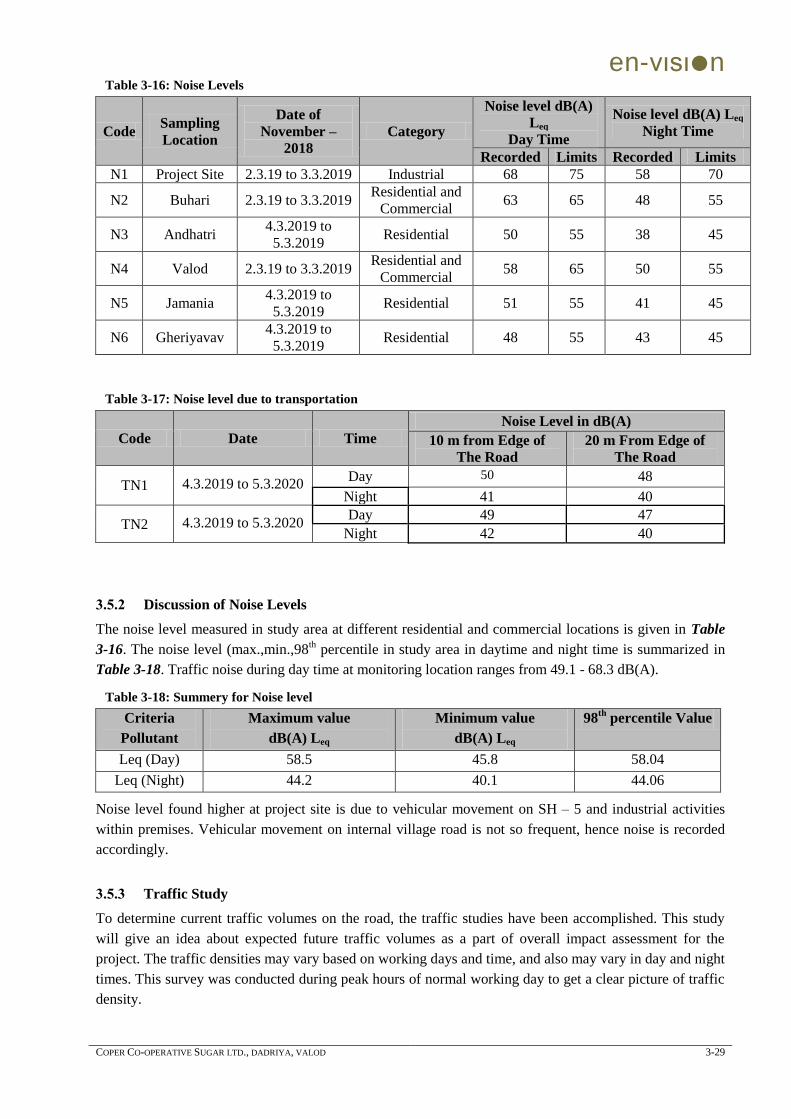
en-vιsιn
COPER CO-OPERATIVE SUGAR LTD., DADRIYA, VALOD 3-29
Table 3-16: Noise Levels
Code Sampling
Location
Date of
November –
2018
Category
Noise level dB(A)
Leq
Day Time
Noise level dB(A) Leq
Night Time
Recorded Limits Recorded Limits
N1 Project Site 2.3.19 to 3.3.2019 Industrial 68 75 58 70
N2 Buhari 2.3.19 to 3.3.2019 Residential and
Commercial 63 65 48 55
N3 Andhatri 4.3.2019 to
5.3.2019 Residential 50 55 38 45
N4 Valod 2.3.19 to 3.3.2019 Residential and
Commercial 58 65 50 55
N5 Jamania 4.3.2019 to
5.3.2019 Residential 51 55 41 45
N6 Gheriyavav 4.3.2019 to
5.3.2019 Residential 48 55 43 45
Table 3-17: Noise level due to transportation
Code Date Time
Noise Level in dB(A)
10 m from Edge of
The Road
20 m From Edge of
The Road
TN1 4.3.2019 to 5.3.2020 Day 50 48
Night 41 40
TN2 4.3.2019 to 5.3.2020 Day 49 47
Night 42 40
3.5.2 Discussion of Noise Levels
The noise level measured in study area at different residential and commercial locations is given in Table
3-16. The noise level (max.,min.,98th percentile in study area in daytime and night time is summarized in
Table 3-18. Traffic noise during day time at monitoring location ranges from 49.1 - 68.3 dB(A).
Table 3-18: Summery for Noise level
Criteria
Pollutant
Maximum value
dB(A) Leq
Minimum value
dB(A) Leq
98th
percentile Value
Leq (Day) 58.5 45.8 58.04
Leq (Night) 44.2 40.1 44.06
Noise level found higher at project site is due to vehicular movement on SH – 5 and industrial activities
within premises. Vehicular movement on internal village road is not so frequent, hence noise is recorded
accordingly.
3.5.3 Traffic Study
To determine current traffic volumes on the road, the traffic studies have been accomplished. This study
will give an idea about expected future traffic volumes as a part of overall impact assessment for the
project. The traffic densities may vary based on working days and time, and also may vary in day and night
times. This survey was conducted during peak hours of normal working day to get a clear picture of traffic
density.
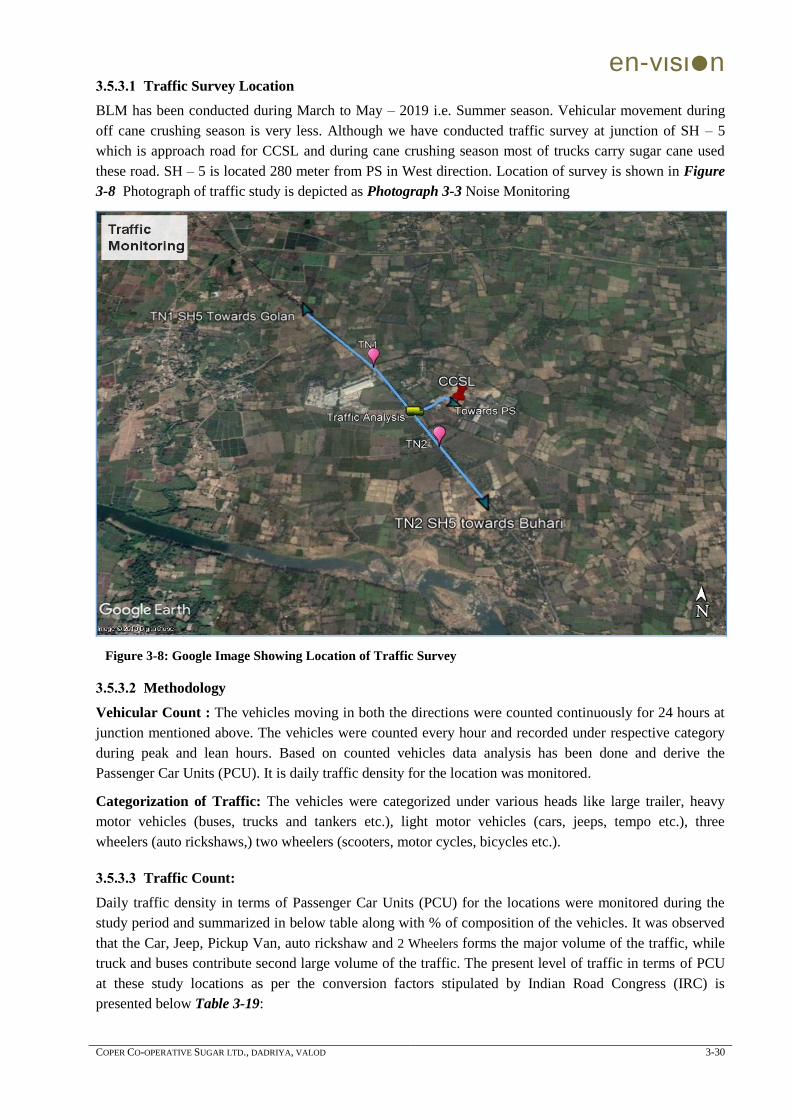
en-vιsιn
COPER CO-OPERATIVE SUGAR LTD., DADRIYA, VALOD 3-30
3.5.3.1 Traffic Survey Location
BLM has been conducted during March to May – 2019 i.e. Summer season. Vehicular movement during
off cane crushing season is very less. Although we have conducted traffic survey at junction of SH – 5
which is approach road for CCSL and during cane crushing season most of trucks carry sugar cane used
these road. SH – 5 is located 280 meter from PS in West direction. Location of survey is shown in Figure
3-8 Photograph of traffic study is depicted as Photograph 3-3 Noise Monitoring
Figure 3-8: Google Image Showing Location of Traffic Survey
3.5.3.2 Methodology
Vehicular Count : The vehicles moving in both the directions were counted continuously for 24 hours at
junction mentioned above. The vehicles were counted every hour and recorded under respective category
during peak and lean hours. Based on counted vehicles data analysis has been done and derive the
Passenger Car Units (PCU). It is daily traffic density for the location was monitored.
Categorization of Traffic: The vehicles were categorized under various heads like large trailer, heavy
motor vehicles (buses, trucks and tankers etc.), light motor vehicles (cars, jeeps, tempo etc.), three
wheelers (auto rickshaws,) two wheelers (scooters, motor cycles, bicycles etc.).
3.5.3.3 Traffic Count:
Daily traffic density in terms of Passenger Car Units (PCU) for the locations were monitored during the
study period and summarized in below table along with % of composition of the vehicles. It was observed
that the Car, Jeep, Pickup Van, auto rickshaw and 2 Wheelers forms the major volume of the traffic, while
truck and buses contribute second large volume of the traffic. The present level of traffic in terms of PCU
at these study locations as per the conversion factors stipulated by Indian Road Congress (IRC) is
presented below Table 3-19:
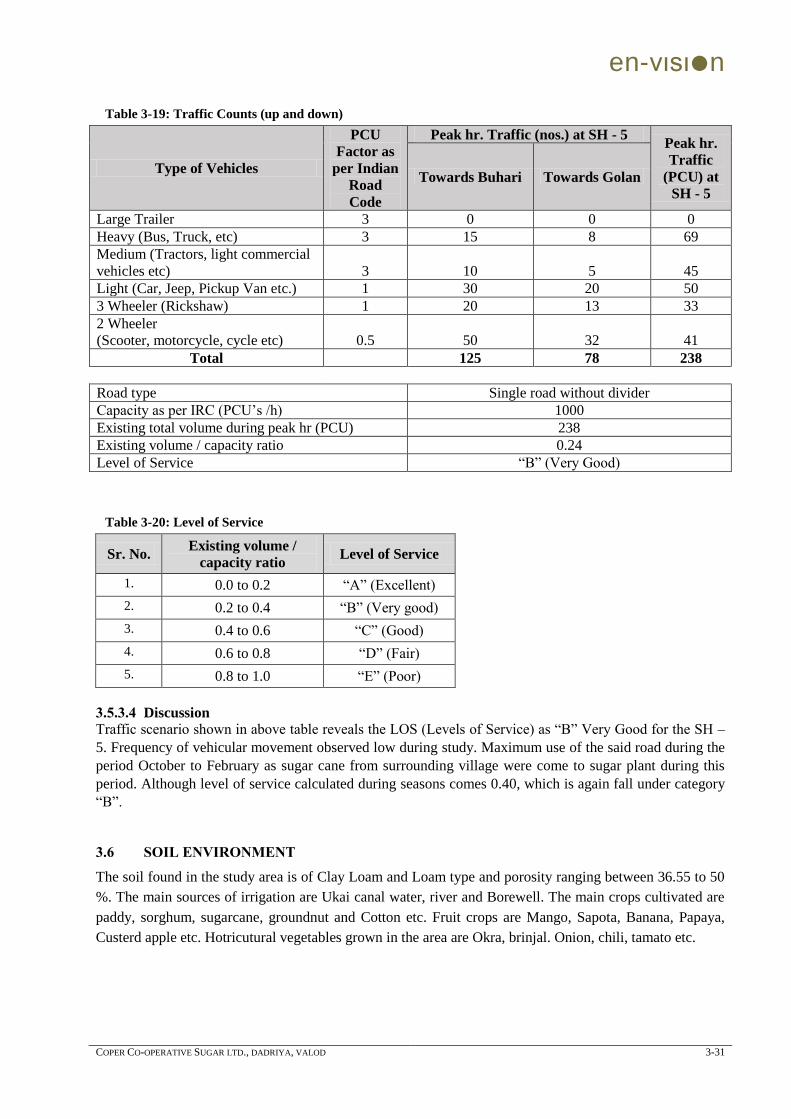
en-vιsιn
COPER CO-OPERATIVE SUGAR LTD., DADRIYA, VALOD 3-31
Table 3-19: Traffic Counts (up and down)
Type of Vehicles
PCU
Factor as
per Indian
Road
Code
Peak hr. Traffic (nos.) at SH - 5 Peak hr.
Traffic
(PCU) at
SH - 5
Towards Buhari Towards Golan
Large Trailer 3 0 0 0
Heavy (Bus, Truck, etc) 3 15 8 69
Medium (Tractors, light commercial
vehicles etc) 3 10 5 45
Light (Car, Jeep, Pickup Van etc.) 1 30 20 50
3 Wheeler (Rickshaw) 1 20 13 33
2 Wheeler
(Scooter, motorcycle, cycle etc) 0.5 50 32 41
Total 125 78 238
Road type Single road without divider
Capacity as per IRC (PCU‟s /h) 1000
Existing total volume during peak hr (PCU) 238
Existing volume / capacity ratio 0.24
Level of Service “B” (Very Good)
Table 3-20: Level of Service
Sr. No. Existing volume /
capacity ratio Level of Service
1. 0.0 to 0.2 “A” (Excellent)
2. 0.2 to 0.4 “B” (Very good)
3. 0.4 to 0.6 “C” (Good)
4. 0.6 to 0.8 “D” (Fair)
5. 0.8 to 1.0 “E” (Poor)
3.5.3.4 Discussion
Traffic scenario shown in above table reveals the LOS (Levels of Service) as “B” Very Good for the SH –
5. Frequency of vehicular movement observed low during study. Maximum use of the said road during the
period October to February as sugar cane from surrounding village were come to sugar plant during this
period. Although level of service calculated during seasons comes 0.40, which is again fall under category
“B”.
3.6 SOIL ENVIRONMENT
The soil found in the study area is of Clay Loam and Loam type and porosity ranging between 36.55 to 50
%. The main sources of irrigation are Ukai canal water, river and Borewell. The main crops cultivated are
paddy, sorghum, sugarcane, groundnut and Cotton etc. Fruit crops are Mango, Sapota, Banana, Papaya,
Custerd apple etc. Hotricutural vegetables grown in the area are Okra, brinjal. Onion, chili, tamato etc.
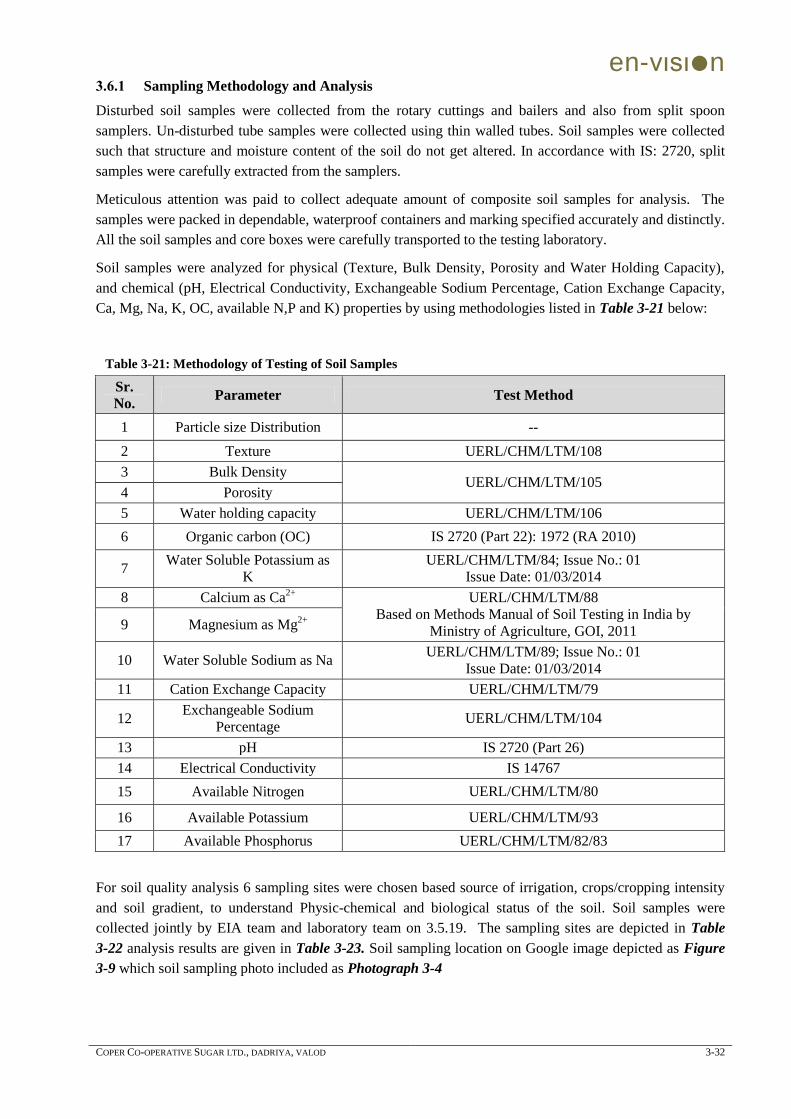
en-vιsιn
COPER CO-OPERATIVE SUGAR LTD., DADRIYA, VALOD 3-32
3.6.1 Sampling Methodology and Analysis
Disturbed soil samples were collected from the rotary cuttings and bailers and also from split spoon
samplers. Un-disturbed tube samples were collected using thin walled tubes. Soil samples were collected
such that structure and moisture content of the soil do not get altered. In accordance with IS: 2720, split
samples were carefully extracted from the samplers.
Meticulous attention was paid to collect adequate amount of composite soil samples for analysis. The
samples were packed in dependable, waterproof containers and marking specified accurately and distinctly.
All the soil samples and core boxes were carefully transported to the testing laboratory.
Soil samples were analyzed for physical (Texture, Bulk Density, Porosity and Water Holding Capacity),
and chemical (pH, Electrical Conductivity, Exchangeable Sodium Percentage, Cation Exchange Capacity,
Ca, Mg, Na, K, OC, available N,P and K) properties by using methodologies listed in Table 3-21 below:
Table 3-21: Methodology of Testing of Soil Samples
Sr.
No. Parameter Test Method
1 Particle size Distribution --
2 Texture UERL/CHM/LTM/108
3 Bulk Density UERL/CHM/LTM/105
4 Porosity
5 Water holding capacity UERL/CHM/LTM/106
6 Organic carbon (OC) IS 2720 (Part 22): 1972 (RA 2010)
7 Water Soluble Potassium as
K
UERL/CHM/LTM/84; Issue No.: 01
Issue Date: 01/03/2014
8 Calcium as Ca2+
UERL/CHM/LTM/88
Based on Methods Manual of Soil Testing in India by
Ministry of Agriculture, GOI, 2011 9 Magnesium as Mg2+
10 Water Soluble Sodium as Na UERL/CHM/LTM/89; Issue No.: 01
Issue Date: 01/03/2014
11 Cation Exchange Capacity UERL/CHM/LTM/79
12 Exchangeable Sodium
Percentage UERL/CHM/LTM/104
13 pH IS 2720 (Part 26)
14 Electrical Conductivity IS 14767
15 Available Nitrogen UERL/CHM/LTM/80
16 Available Potassium UERL/CHM/LTM/93
17 Available Phosphorus UERL/CHM/LTM/82/83
For soil quality analysis 6 sampling sites were chosen based source of irrigation, crops/cropping intensity
and soil gradient, to understand Physic-chemical and biological status of the soil. Soil samples were
collected jointly by EIA team and laboratory team on 3.5.19. The sampling sites are depicted in Table
3-22 analysis results are given in Table 3-23. Soil sampling location on Google image depicted as Figure
3-9 which soil sampling photo included as Photograph 3-4
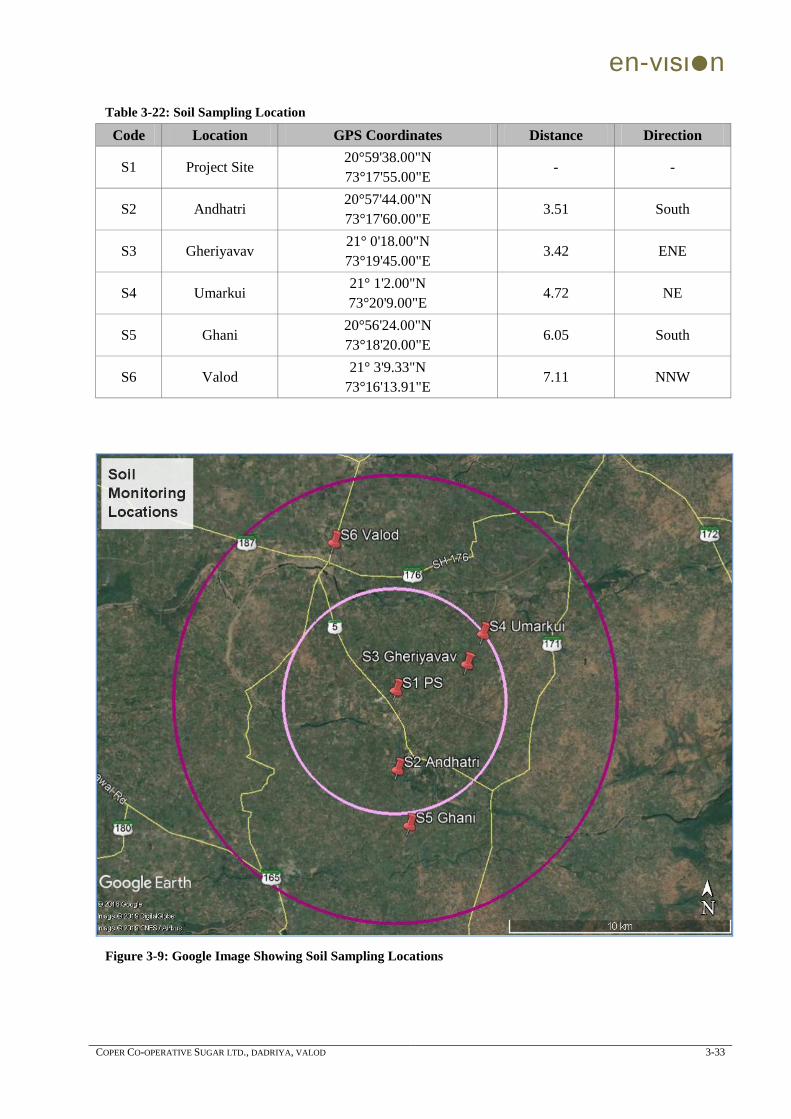
en-vιsιn
COPER CO-OPERATIVE SUGAR LTD., DADRIYA, VALOD 3-33
Table 3-22: Soil Sampling Location
Code Location GPS Coordinates Distance Direction
S1 Project Site 20°59'38.00"N
73°17'55.00"E - -
S2 Andhatri 20°57'44.00"N
73°17'60.00"E 3.51 South
S3 Gheriyavav 21° 0'18.00"N
73°19'45.00"E 3.42 ENE
S4 Umarkui 21° 1'2.00"N
73°20'9.00"E 4.72 NE
S5 Ghani 20°56'24.00"N
73°18'20.00"E 6.05 South
S6 Valod 21° 3'9.33"N
73°16'13.91"E 7.11 NNW
Figure 3-9: Google Image Showing Soil Sampling Locations
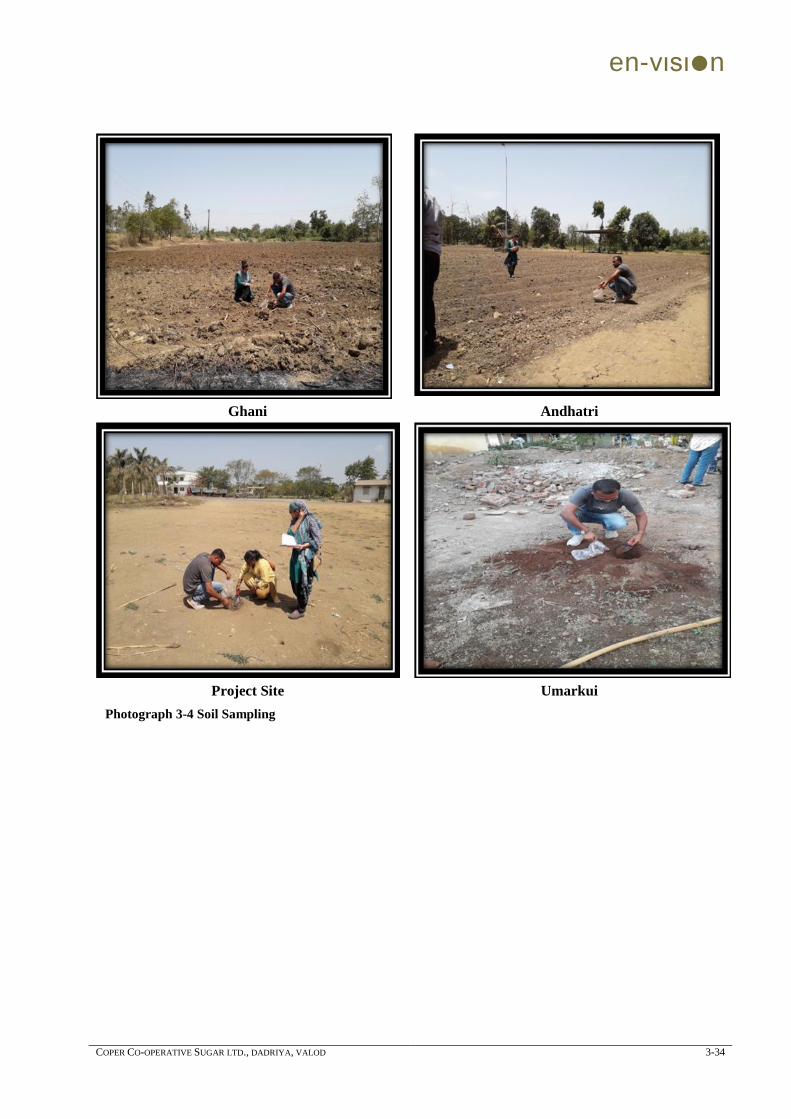
en-vιsιn
COPER CO-OPERATIVE SUGAR LTD., DADRIYA, VALOD 3-34
Ghani Andhatri
Project Site Umarkui
Photograph 3-4 Soil Sampling
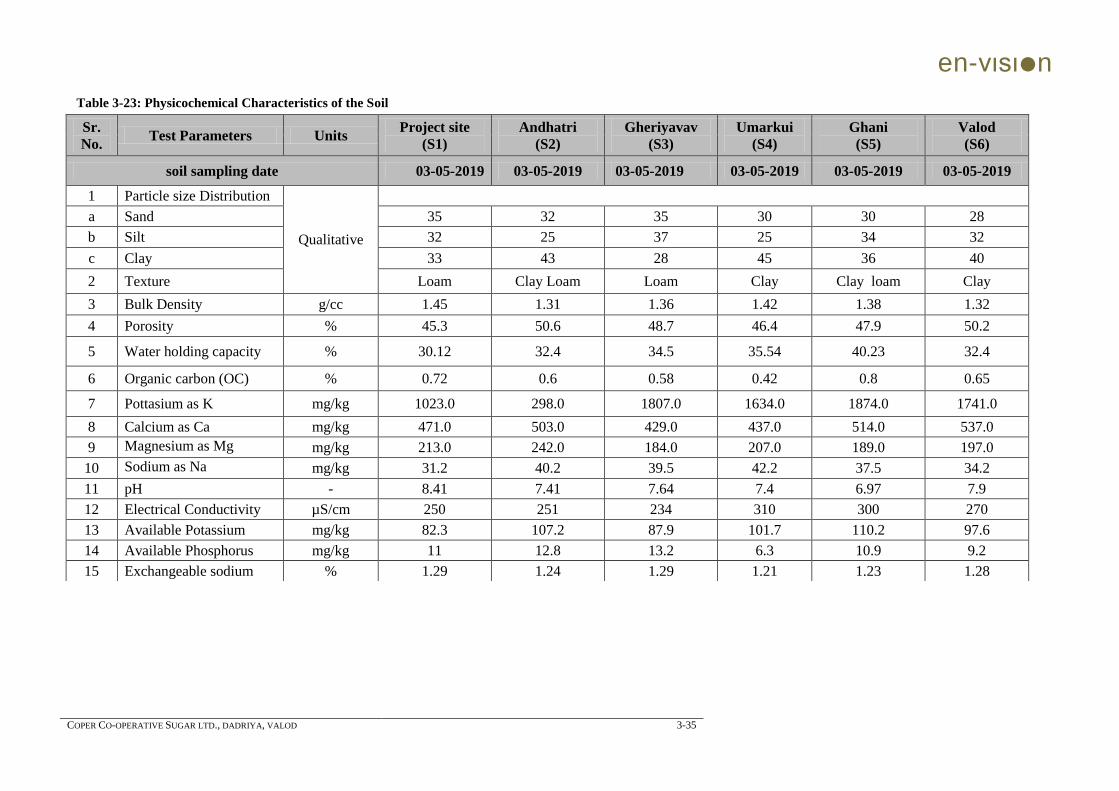
en-vιsιn
COPER CO-OPERATIVE SUGAR LTD., DADRIYA, VALOD 3-35
Table 3-23: Physicochemical Characteristics of the Soil
Sr.
No. Test Parameters Units
Project site
(S1)
Andhatri
(S2)
Gheriyavav
(S3)
Umarkui
(S4)
Ghani
(S5)
Valod
(S6)
soil sampling date 03-05-2019 03-05-2019 03-05-2019 03-05-2019 03-05-2019 03-05-2019
1 Particle size Distribution
Qualitative
a Sand 35 32 35 30 30 28
b Silt 32 25 37 25 34 32
c Clay 33 43 28 45 36 40
2 Texture Loam Clay Loam Loam Clay Clay loam Clay
3 Bulk Density g/cc 1.45 1.31 1.36 1.42 1.38 1.32
4 Porosity % 45.3 50.6 48.7 46.4 47.9 50.2
5 Water holding capacity % 30.12 32.4 34.5 35.54 40.23 32.4
6 Organic carbon (OC) % 0.72 0.6 0.58 0.42 0.8 0.65
7 Pottasium as K mg/kg 1023.0 298.0 1807.0 1634.0 1874.0 1741.0
8 Calcium as Ca mg/kg 471.0 503.0 429.0 437.0 514.0 537.0
9 Magnesium as Mg mg/kg 213.0 242.0 184.0 207.0 189.0 197.0
10 Sodium as Na mg/kg 31.2 40.2 39.5 42.2 37.5 34.2
11 pH - 8.41 7.41 7.64 7.4 6.97 7.9
12 Electrical Conductivity µS/cm 250 251 234 310 300 270
13 Available Potassium mg/kg 82.3 107.2 87.9 101.7 110.2 97.6
14 Available Phosphorus mg/kg 11 12.8 13.2 6.3 10.9 9.2
15 Exchangeable sodium % 1.29 1.24 1.29 1.21 1.23 1.28


