Embed Size (px)
Citation preview
1-32 PI. 1-8 9 Figs. 11 Tab. ERLANGEN 1993 FACIES 28
Satonda Crater Lake, Indonesia: Hydrogeochemistry and Biocarbonates
Stephan Kempe, Hamburg and J6zef Ka;tmierczak, Warsaw
KEYWORDS: BIOCARBONATES - STROMATOLITES - CYANOBACTERIA (PLEUROCAPSALES) - HYDRO- GEOCHEMISTRY (QUASI-MARINE) - SATONDA ISLAND (INDONESIA) -RECENT
CONTENTS 1 INTRODUCTION
Summary 1 Introduction 2 Geographic and geological setting 3 Methods 3.1 Survey 3.2 Water samples 3.3 Sediment samples 4 Discussion of hydrochemical data 4.1 Recalculation procedures 4.2 Stratification of the lake 4.3 Carbonate system 4.4 Samples from lagoons among calcareous reefs 5 Discussion of sediment analyses 5.1 Calcareous reefs 5.2 Onshore digs 5.3 Sediment core 6 Chemical and biotic evolution of Satonda Crater Lake 7 Conclusions References
SUMMARY
The results of detailed hydrochemical and bio- sedimentological studies of the sea-linked Satonda Crater Lake, Sumbawa Island/Indonesia are presented. They revealed that the mildly alkaline, mid-water stratified and species-poor lake supports growth of cyanobacterial-red algal calcareous reefs comparable with some ancient marine biocarbonates. The chemical and biotic changes during the last 4,000 years of the lake history have been reconstructed. They indicate that the chemistry of the lake evolved from initially fresh water, through highly alkaline to the modern slightly alkaline quasi-marine conditions with cor- responding biotic changes. The influence of the 1815 eruption of the nearby located Tambora Volcano on the lake chemistry and resulting lithological and biotic changes is also discussed. The lake proves to be a good model for the recently proposed hypothesis of an early alkaline (soda) ocean.
On November 22nd, 1983, the 'Soda Ocean Hypothesis' (SOIl) was born during a public lecture on the global carbon cycle. Its theoretical background has since been published in K~rea,E & DE6ENS (1985, 1986) and in Kmca,E et al. (1989). The S OH maintains that the Precambrian ocean was highly alkaline, of high pH and of low Ca concentrations. It is based on the observation that the weathering of silicate rocks with carbonic acid (the Urey-reaction, Um~Y, 1951) produces, in general, solutions with equivalent ratios [Ca 2§ + Mg 2§ < [HCO3"] and [-Na + + K § > [CI- + SO42-]. Upon evaporation, these solutions will reach the solubility product of the alkaline earth carbonate minerals first. Precipitation of calcite, aragonite or even dolomite will leave Na § K § and HCO 3- (plus CI- and SO~) behind, i.e., highly alkaline conditions (GARRELS & MACrCEr, rz~, 1967; HARDIn & EU~SrER, 1970; EUGSa-ZR & HARD•, 1978). Today, we find alkaline lakes (so-called soda lakes) in volcanic areas associated with ac five plate boundaries worldwide (KEr~E et al., 1989).
However, comparing the chemistry of 'isolated' lakes with that of the early ocean, does not seem to be very convincing. The chance to find a contemporary alkaline but marine en- vironment came during the Dutch-Indonesian Snellius II expedition to the Flores Sea in November 1984 (participants from Hamburg: E. T. Degens, V. Ittekkot and S. Kempe). One of us (S. K.) noticed on the map that the small volcanic island Satonda contained a lake, seemingly at sea level and therefore possibly filled with seawater. Professor D. Eisma, chief- scientist of the Snellius II-leg, kindly agreed to send a landing party to Satonda. In the moming of November 22nd, 1984, one year after the SOH had been formulated, Stephan Kempe, DoekeEisma, Theo B uisma, Haruna Mappa and Surino set out from the R/V Tyro by rubber boat to inspect the island and its lake.
The first glance already proved that we had found what was expected: the water tasted salty like seawater but had a pH of 8.55! And, even more important, there were groups of large,
Addresses: Dr. S. Kempe Institute for Biogeochemistry and Marine Chemistry, Center of Marine and Climate Research, University of Hamburg, B undesstr. 55, D-2000 Hamburg 13, Fed. Rep. of Germany; Prof. Dr. J. Ka~mierczak, Institute of Paleobiology, Polish Academy of Sciences, Zwirki i Wigury 93, PL-02089 Warsaw, Poland.
2
semicircular pillars made of carbonate dotting the shore (PI. 1/1). Because November is the end of the dry season, the heads of these pillars lay dry. During the wet season the lake level obviously stands more than a meter higher as marked by bands of dry algae on rocks. The beach of the lake otherwise consists of black volcanic sand. T. Buisma scuba dived clown to 10 m where the water was as warm as at the surface, i.e., 32 ~ S. Kempe snorkeled in the murky water along the shore observing that the pillars rise vertically from depth, some of them seemed to be taller than I0 m. The pillars are overgrown with long filaments of non-calcified green algae. The fauna in the lake evidently consists of only a few species: one sponge, one fish and one thin-shelled, small, black gastropod even though 100 m across the crater rim the tropical reef houses hundreds of species. Two water samples (for chemical data of surface sample see Table 1) were taken proving that the lake was mixed down to a depth of 10 m. These samples showed that not only the pH but also the total alkalinity is elevated in the lake as compared with modern seawater, while the Ca concentration is much lower than in seawater of comparable salinity.
The carbonate pillars were sampled for microscopic inspection. These pieces were later examined by J. Kaz- mierczak, who discovered that the carbonate is not an inorganic precipitate, but has been mainly precipitated by cyanobacteria (blue-green algae). The microscopic structure, either laminated, cystous or clotty, reminds one of Pre- cambrian stromatolites, the only macroscopic fossil preserved from the ancient pre-metazoan sea (I&r,~,E et al., 1992).
These first results showed that Satonda crater lake could serve in fact as a contemporary model of the Precambrian ocean: it contains seawater of a higher alkalinity and pH and
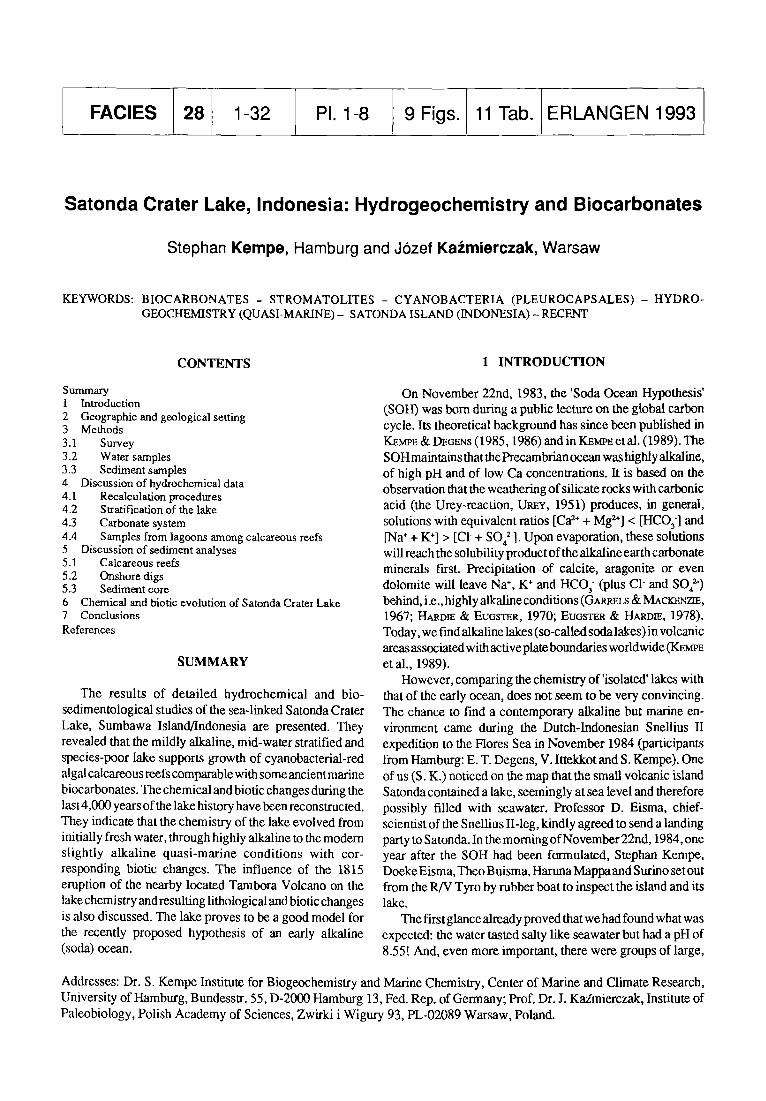
Fig. 1. Sketch map of the Island of Satonda and its location north of the Sanggar Peninsula on Sumbawa/ Indonesia.
lower Ca concentration than any recent seawater and it promotes the growth of in situ calcifying cyanobacterial stromatolites, not reported from any other modern marine site previously.
These were the known facts when the German- Indonesian R N Sonne 45B expedition was planned by the late Professor E. T. Degens in 1985. From the beginning it was clear that Satonda Island should be paid an extended visit during that ex- pedition. At first, a few days were thought to be sufficient, but then, as planning became more detailed, itwas decided to launch a more extensive program and to have a land party on the island throughout most of the cruise. This land party would in part cooperate with the 'Tambora' land party (D. Jung, K. Heyckendorf, K. Paluskova and company) and would receive logistic help from aboard the R/V Sonne. The land party consisted of the two authors, the research divers G. Landmann and A. Lipp, and two Indonesian colleagues from Bandung University: Y. Surachman and D. Su- santo. The party arrived at Satonda October 2nd with two rubber boats from Den Passar and was
taken aboard the R/V Sonne October 13th, 1986. The Tambora land party visited Satonda October 3rd when also one of the rubber boats was carried over the crater rim into the lake. On October 4th, the R/V Sonne stopped at Satonda delivering Professor How Kin Wong and Uwe Salge with their seismic gear. They mapped the bathymetry of the lake and left one day later. On the 5th water samples were taken to be analyzed for nutrients by Dr. G. Liebezeit aboard the R/V Sonne. A more detailed trip report is found in the Interims Report to the BMFT ~Tambora Volcano, Cruise SO 45-B', December 1986, Kazmierczak et al., unpublished (1986). All rock and sediment samples were taken in duplicates, one set for the University of Bandung and one set for the University of Hamburg. All notes and data tables were
Parameter Satonda Saleh Bay surface surface
pH 8.55 8.27 Temp. 31.3 ~ 29.3 ~ Sal. o/oo 34.23 ~ cr 17.96 g/l 19.44 g~ Ca 2+ 9.58 meq/1 19.8 meq/l Mg 2+ 92.92 meq/1 104.60 meq/l Mg/Ca 9.75 5.8 Alk 3.65 meq/l 2.28 meq/l o-PO43" 0.28 ~.MA 0 p.MA H2SiO 4 29.9 ~ 0 p./vl/l Urea 0.8 laM/I laJvl/l NH 4 + 1.0 ~M]I < 0.1 N%" 0.2 ~ o NO 2 0.01 p2vlA 0 p.M/l
Table 1: Comparison of chemical data of two surface water samples collected in Satonda Crater Lake and in nearby Saleh B ay (Sample TAM2). Nutrient data by R. De Vries.
copied aboard the R/V Sonne for the University of Bandung. The video tapes were later copied at Hamburg and given to the Indonesian colleagues on occasion of their visit at Hamburg.
This paper documents the results of the Satonda land party and discusses some of the implications from these findings as to our understanding of the nature of the Pre- cambrian ocean (KE~a,E et al., 1992). A short account of the principal findings of the expedition has been published by K z ~ & K A Z M r ~ (1990a). Specific aspects of the stromatollte structure have been published by K A z ~ & KEMr~ (1990 and 1992).
2 GEOGRAPHIC AND GEOLOGICAL SETTING
Satonda is a small volcanic island 3 km off the northern shore of the Sanggar peninsula on Sumbawa/Indonesia (Fig. 1). Its geographical coordinates are 807 ' S and 117~ The island is about 30 Ion away from the Tambora volcano, the last eruption of which in 1815 was the largest paroxysm of historic times worldwide (SELF et al., 1984).
The Satonda Volcano belongs to the string of Quateruary and Recent volcanoes following the inner part of the 6,000 km long Sunda Island Arc between Sumatra and the eastern Banda Sea. West of Flores, the Indian ocean plate (of Jurassic age) is subducted, while to the east of Flores the arc collides with the Australian continent. In the vicinity of Sumbawa the crust is relatively thin and its seismic characteristics are oceanic (HA~aL3"ON, 1979). The structural elements of the arc at Sumbawa include -from south to north- the Java trench (which marks the beginning of the under- thrusting of the Indian plate), the non-volcanic outer arc (mostly submarine), the inner arc basins (up to 4,000 m deep
south of Lombok-Sumbawa) and the volcanic island arc. Between Java and eastern Flores most of the volcanoes occur 125 to 200 km above the active Benioff zone. At first, the Benioff zone dips at a shallow angle to the north and the volcanoes are 300 km away from the trench axis. Then the zone steepens and reaches 600 km depth within 200 km farther north under the Flores Sea (I-IAr~aLa'ON, 1974, 1979). The Tambora, its associated eruption centers, the Sangeang Api and Satonda occur 175 to 200 km above the Benioff zone. Satonda marks the most outward subaerial eruption center with regard to the depth of the Benioff zone in all of the Lesser Sunda Islands.
The oldest rocks on Sumbawa are Lower Miocene in age and their volcanic rocks belong to the calc-alkaline series (basalt- andesite - dacite association) normal for island arcs. The material of the Tambora and the Sangeang Api, however, is marked by an unusual potassium affinity (potassic ne- trachybasalt-trachyandesite association). Such rocks norm- ally occur over much deeper parts of the Benioff zone and the S i t 2 - K20 ratio is much smaller than expected for the young age of the volcanos (FODZN & VARr~, 1980; BARBEPa et al., 1983 a,b). The Tambora is a large (40-50 km diameter) shield volcano made up of basaltic lava. Explosive eruptions producing pyroclastics occurred only recently. The last one, literally annihilating the 1,500 m high summit cone of the then 4,300 m high volcano, was possibly triggered by the intrusion of water into a shallow magma chamber (BARaER~ et al., 1983a; SELF et al., 1984; S~tJRDSSON & CAREV, 1988). The eruption ejected 50 km 3 of rock (150 km 3 of pumice and pyroclastics) on April 10th, 1815. On the island 92,000 people died because of the eruption or because of the following famine. Due to the stratospheric dust produced by the eruption, the summer of 1816 was extremely cold
throughout the northern hemisphere (SToMMEL & STO~V~EL, 1979), causing severe crop failures. In Scotland and England alone 65,000 people died because of hunger that year (S~trRDSSON & CAREV, 1988).
The island of Satonda is shown on a satellite image of the Tambora published on the front cover of the 1984 November
!::~ o
N . ~
edition of Geology. The island is about 3 x 2 km in size, with an elongated axis striking NW-SE. It forms a caldera about 2 x 2 km large and the caldera walls rise up to 300 m above sea level (a.s.l.). The eastern wall is very steep and not covered by vegetation. Here various strata of pyroclastic deposits can be seen interrupted by a few harder banks. Lava
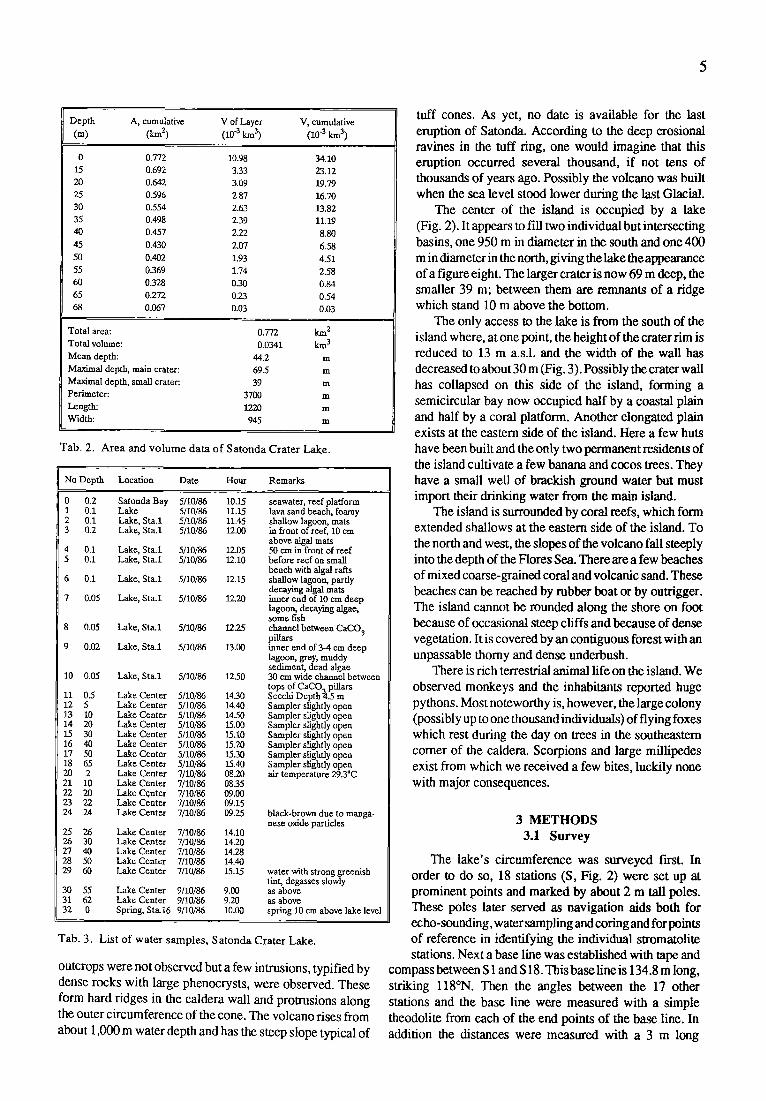
Depth A, cumulative V of Layer V, cumulative (m) (km 2) (10 "3 kin 3) (10 .3 kln 3)
0 0.772 10.98 34.10 15 0.692 3.33 23.12 20 0.642 3,09 19.79 25 0.596 2.87 16.70 30 0.554 2.63 13.82 35 0.498 2.39 11.19 40 0.457 2.22 8.80
45 0.430 2.07 6.58 50 0.402 1.93 4.51 55 0.369 1.74 2.58 60 0.328 030 0.84 65 0.272 0.23 0.54 68 0.067 0.03 0.03
Total area: 0.772 km 2 Total volume: 0.0341 km 3 Mean depth: 44.2 m Maximal depth, main crater: 69.5 m Maximal depth, small crater. 39 m Perimeter: 3700 m Length: 1220 m Width: 945 m
Tab. 2. Area and v o l u m e data o f Satonda Crater L a k e .
No Depth Location Date Hour Remarks
0 0.2 Satonda Bay 5/10/86 1 0.1 Lake 5/10/86 2 0.1 Lake, Sta.1 5/10/86 3 0.2 Lake, Sta.1 5/10/86
4 0.1 Lake, Sta.1 5/10/86 5 0.1 Lake, Sta.1 5/10/86
6 0.1 Lake, Sta.1 5/10/86
7 0.05 Lake, Sta.1 5/10/86
8 0.05 Lake, Sta.1 5/10/86
9 0.02 Lake, Sta.1 5110/86
10 0.05 Lake, Sta.1 5/10/85
11 0.5 Lake Center 5/10/86 12 5 Lake Center 5/10/86 13 10 Lake Center 5/10/86 14 20 Lake Center 5/10/86 15 30 Lake Center 5/10/86 16 40 Lake Center 5/10/86 17 50 Lake Center 5/10/86 18 65 Lake Center 5/10/86 20 2 Lake Center 7/10/86 21 I0 Lake Center 7/I0/86 22 20 Lake Center 7/10/86 23 22 Lake Center 7/10/86 24 24 Lake Center 7/10/86
25 26 Lake Center 7/10/86 26 30 Lake Center 7/10/86 27 40 Lake Center 7/10/86 28 50 Lake Center 7/10/86 29 60 Lake Center 7/10/86
30 55 Lake Center 9/10/86 31 62 Lake Center 9/10/86 32 0 Spring, Sta.16 9/10/86
10.15 seawater, reef platform 11.15 lava sand beach, foamy 11.45 shallow lagoon, mats 12.00 in front of reef, 10 cm
above algal mats 12.05 50 era in front of reef 12.10 before reef on small
bench with algal rafts 12.15 shallow lagoon, partly
decaying algal mats 12.20 inner end of 10 em deep
lagoon, decaying algae, some fish
12.25 channel between CaCO 3 pillars
13.00 inner end of 3-4 cm deep lagoon, grey, muddy sediment, dead algae
12.50 30 cm wide channel between tops of CaCO. pillars
14.30 Secchi Depth ~.5 m 14.40 Sampler slightly open 14.50 Sampler slightly open 15.00 Sampler slightly open I5.10 Sampler slightly open 15.20 Sampler slightly open 15.30 Sampler slightly open 15.40 Sampler slightly open 08.20 air temperature 29.3~ 0835 09.00 09.15 09.25 black-brown due to manga-
nese oxide particles 14.10 14.20 14.28 14.40 15.15 water with strong greenish
tint, degasses slowly 9.00 as above 9.9-0 as above 10.00 spring 10 cm above lake level
Tab. 3 . L i s t of water samples , Sa tonda Crater L a k e .
outcrops were not observed but a few intrusions, typified by dense rocks with large phenocrysts, were observed. These form hard ridges in the caldera wall and protrusions along the outer circumference of the cone. The volcano rises from about 1,000 m water depth and has the steep slope typical of
tuff cones. As yet, no date is available for the last eruption of Satonda. According to the deep erosional ravines in the tuff ring, one would imagine that this eruption occurred several thousand, if not tens of thousands of years ago. Possibly the volcano was built when the sea level stood lower during the last Glacial.
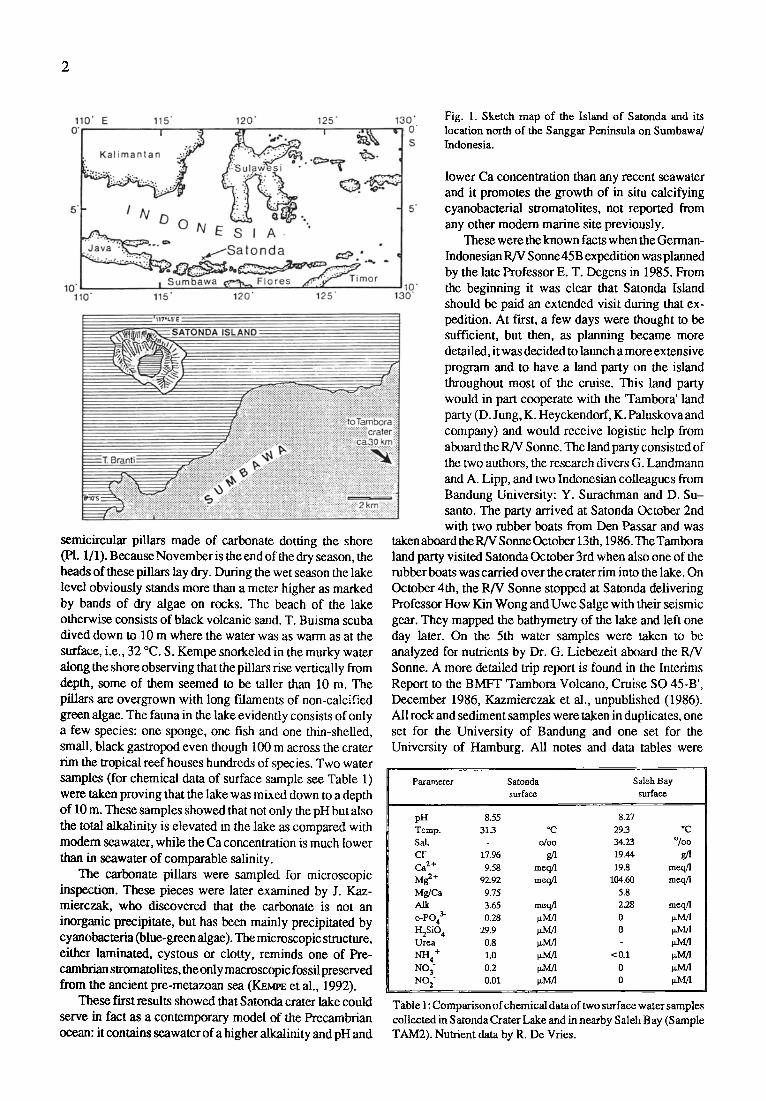
The center of the island is occupied by a lake (Fig. 2). It appears to • l two individual but intersecting basins, one 950 m in diameter in the south and one 400 m in diameter in the north, giving the lake theappearance of a figure eight. The larger crater is now 69 m deep, the smaller 39 m; between them are remnants of a ridge which stand 10 m above the bottom.
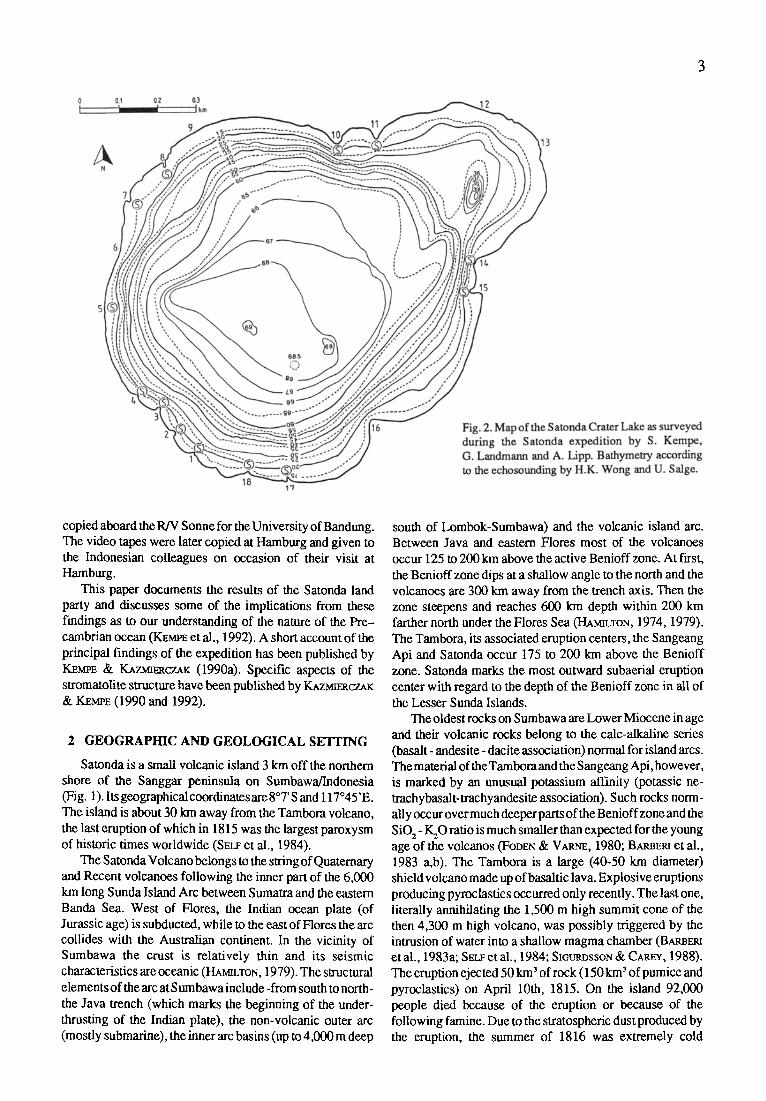
The only access to the lake is from the south of the island where, at one point, the height of the crater rim is reduced to 13 m a.s.l, and the width of the wall has decreased to about 30 m (Fig. 3). Possibly the crater wall has collapsed on this side of the island, forming a semicircular bay now occupied half by a coastal plain and half by a coral platform. Another elongated plain exists at the eastern side of the island. Here a few huts have been built and the only two permanent residents of the island cultivate a few banana and cocos trees. They have a small well of brackish ground water but must import their drinking water from the main island.
The island is surrounded by coral reefs, which form extended shallows at the eastern side of the island. To the north and west, the slopes of the volcano fall steeply into the depth of the Flores Sea. There are a few beaches of mixed coarse-grained coral and volcanic sand. These beaches can be reached by rubber boat or by outrigger. The island cannot be rounded along the shore on foot because of occasional steep cliffs and because of dense vegetation. It is covered by an contiguous forest with an unpassable thorny and dense underbush.
There is rich terrestrial animal life on the island. We observed monkeys and the inhabitants reported huge pythons. Most noteworthy is, however, the large colony (possibly up to one thousand individuals) of flying foxes which rest during the day on trees in the southeastern corner of the caldera. Scorpions and large millipedes exist from which we received a few bites, luckily none with major consequences.
3 METHODS 3.1 Survey
The lake's circumference was surveyed first. In order to do so, 18 stations (S, Fig. 2) were set up at prominent points and marked by about 2 m tall poles. These poles later served as navigation aids both for echo-sounding, water sampling and coring and for points of reference in identifying the individual stromatolite stations. Next a base line was established with tape and
compass between S 1 and S 18. This base line is 134.8 m long, striking 118~ Then the angles between the 17 other stations and the base line were measured with a simple theodolite from each of the end points of the base line. In addition the distances were measured with a 3 m long
6
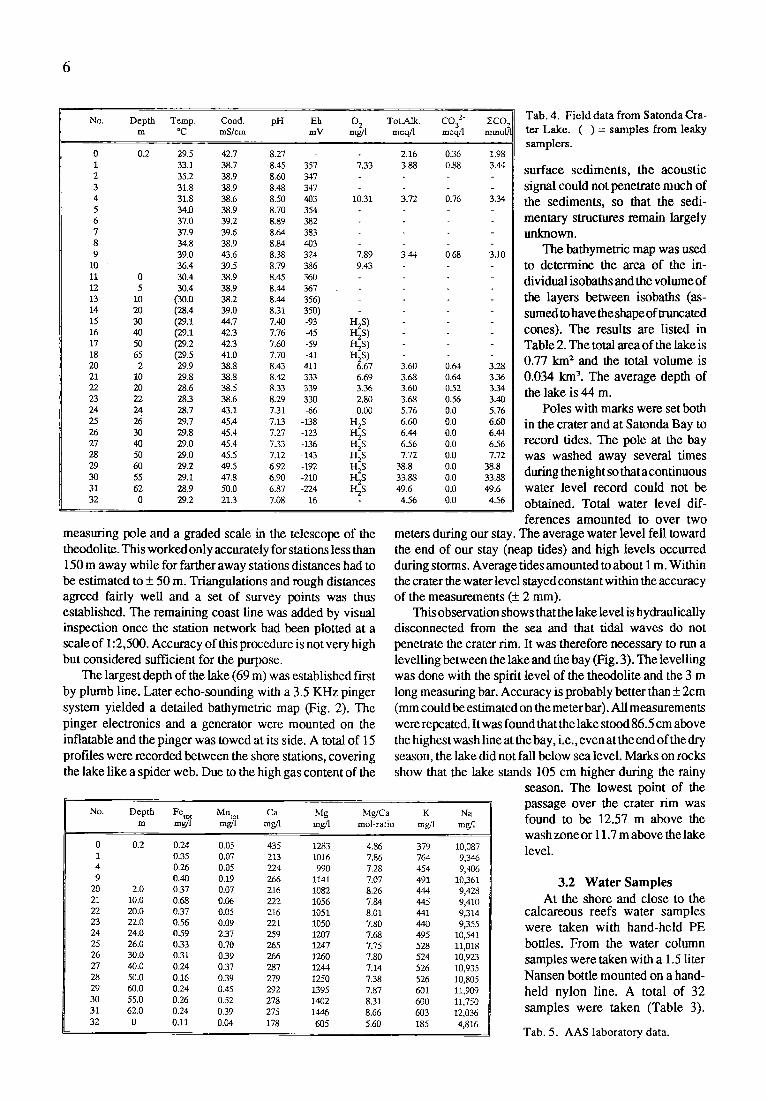
No. Depth Temp. Cond. pH Eh 0 2 Tot.Alk. C032- ~,CO~ m *C mS/cm mV mg,/l meq/1 meq/l mmolT]
0.2 29.5 2.16 0.36 1.98 33.1 7.33 3.88 0.88 3.44 35.2 31.8 31.8 10.31 3.72 0.76 3.34 34.0 37.0
0 42.7 8.27 1 38.7 8.45 357 2 38.9 8.60 347 3 38.9 8.48 347 4 38.6 8.50 403 5 38.9 8.70 354 6 39.2 8.89 382 7 37.9 39.6 8.64 383 8 34.8 38.9 8.84 403 9 39.0 43.6 8.38 324 7.89
10 36.4 39.5 8.79 386 9.43 11 0 30.4 38.9 8.45 360 12 5 30.4 38.9 8.44 367 13 10 (30.0 38.2 8.44 356) 14 20 (28.4 39.0 8.31 350) 15 30 (29.1 44.7 7.40 -93 H2S ) 16 40 (29.1 42.3 7.76 -45 H2S ) 17 50 (29.2 42.3 7.60 -59 HzS ) 18 65 (29.5 41.0 7.70 -41 H2S ) 20 2 29.9 38.8 8.43 411 6.67 21 10 29.8 38.8 8.42 333 6.69 22 20 28.6 38.5 8.33 339 3.36 23 22 28.3 38.6 8.29 330 2.80 24 24 28.7 43.1 7.31 -66 0.00 25 26 29.7 45.4 7.13 -138 H2S 26 30 29.8 45.4 7.27 -123 1-12S 27 40 29.0 45.4 7.33 -136 I-t2S 28 50 29.0 45.5 7.12 - 143 1-12S 29 60 29.2 49.5 6.92 -192 I-LzS 30 55 29.1 47.8 6.90 -210 I-~S 31 62 28.9 50.0 6.87 -224 H.zS 32 0 29.2 21.3 7.08 16
3.44 0.68 3.10
3.60 0.64 3.28 3.68 0.64 3.36 3.60 0.52 3.34 3.68 0.56 3.40 5.76 0.0 5.76 6.60 0.0 6.60 6.44 0.0 6.44 6.56 0~0 6.56 7.72 0.0 7.72
38,8 0.0 38.8 33.88 0.0 33.88 49.6 0.0 49.6
4.56 0.0 4.56
Tab. 4. Field data from Satonda Cra- ter Lake. ( ) = samples from leaky samplers.
surface sediments, the acoustic signal could not penetrate much of the sediments, so that the sedi- mentary structures remain largely unknown.
The hathymetric map was used to determine the area of the in- dividual isobaths and the volume of the layers between isobaths (as- sumed to have the shape of tnmcated cones). The results are listed in Table 2. The total area of the lake is 0.77 km 2 and the total volume is 0.034 kmL The average depth of the lake is 44 m.
Poles with marks were set both in the crater and at Satonda Bay to record tides. The pole at the bay was washed away several times during the night so that a continuous water level record could not be obtained. Total water level dif- ferences amounted to over two
measuring pole and a graded scale in the telescope of the theodolite. This worked only accurately for stations less than 150 m away while for farther away stations distances had to be estimated to +_ 50 m. Triangulations and rough distances agreed fairly well and a set of survey points was thus established. The remaining coast line was added by visual inspection once the station network had been plotted at a scale of 1:2,500. Accuracy of this procedure is not very high but considered sufficient for the purpose.
The largest depth of the lake (69 m) was established first by plumb line. Later echo-sounding with a 3.5 KHz pinger system yielded a detailed bathymetric map (Fig. 2). The pinger electronics and a generator were mounted on the inflatable and the pinger was towed at its side. A total of 15 profiles were recorded between the shore stations, covering the lake like a spider web. Due to the high gas content of the
meters during our stay. The average water level fell toward the end of our stay (neap tides) and high levels occurred during storms. Average tides amounted to about 1 m. Within the crater the water level stayed constant within the accuracy of the measurements (+ 2 mm).
This observation shows that the lake level is hydraulically disconnected from the sea and that tidal waves do not penetrate the crater rim. It was therefore necessary to run a levelling between the lake and the bay (Fig. 3). The levelling was done with the spirit level of the theodolite and the 3 m long measuring bar. Accuracy is probably better than + 2cm (mm could be estimated on the meter bar). All measurements were repeated. It was found that the lake stood 86.5 cm above the highest wash line at the bay, i.e., even at the end of the dry season, the lake did not fall below sea level. Marks on rocks show that the lake stands 105 cm higher during the rainy
No. Depth Feto t Mnto t Ca Mg Mg/Ca K Na m mg/1 mg/1 mg/l mg,'l tool-ratio mg/1 mg/l
0 0.2 0.24 0.05 435 1283 4.86 379 10,087 1 0.35 0.07 213 1016 7.86 764 9,346 4 0.26 0.05 T24 990 7.28 454 9,406 9 0.40 0.19 266 1141 7.07 491 10,361
20 2.0 0.37 0.07 216 1082 8.26 4.44 9,428 21 10.0 0.68 0.06 222 1056 7.84 445 9,410 22 20.0 0.37 0.05 216 1051 8.01 441 9,314 23 22.0 0.56 0.09 221 1050 7.80 440 9,355 24 24.0 0.59 2.37 259 1207 7.68 495 10,541 25 26.0 0.33 0.70 265 1247 7.75 528 11,018 26 30.0 0.31 0.39 266 1260 7.80 524 10,923 27 40.0 0.24 0.37 287 1244 7.14 526 10,935 28 50.0 0.16 0.39 279 1250 7.38 526 10,805 29 60.0 0.24 0.45 292 1395 7.87 601 11,909 30 55.0 0.26 0.52 278 1402 8.31 600 11,750 31 62.0 0.24 0.39 275 1446 8.66 603 12,036 32 0 0.11 0.04 178 605 5.60 185 4,816
season. The lowest point of the passage over the crater rim was found to be 12.57 m above the wash zone or 11.7 m above the lake level.
3.2 Water Samples At the shore and close to the
calcareous reefs water samples were taken with hand-held PE bottles. From the water column samples were taken with a 1.5 liter Nansen bottle mounted on a hand- held nylon line. A total of 32 samples were taken (Table 3).
Tab. 5. AAS laboratory data.
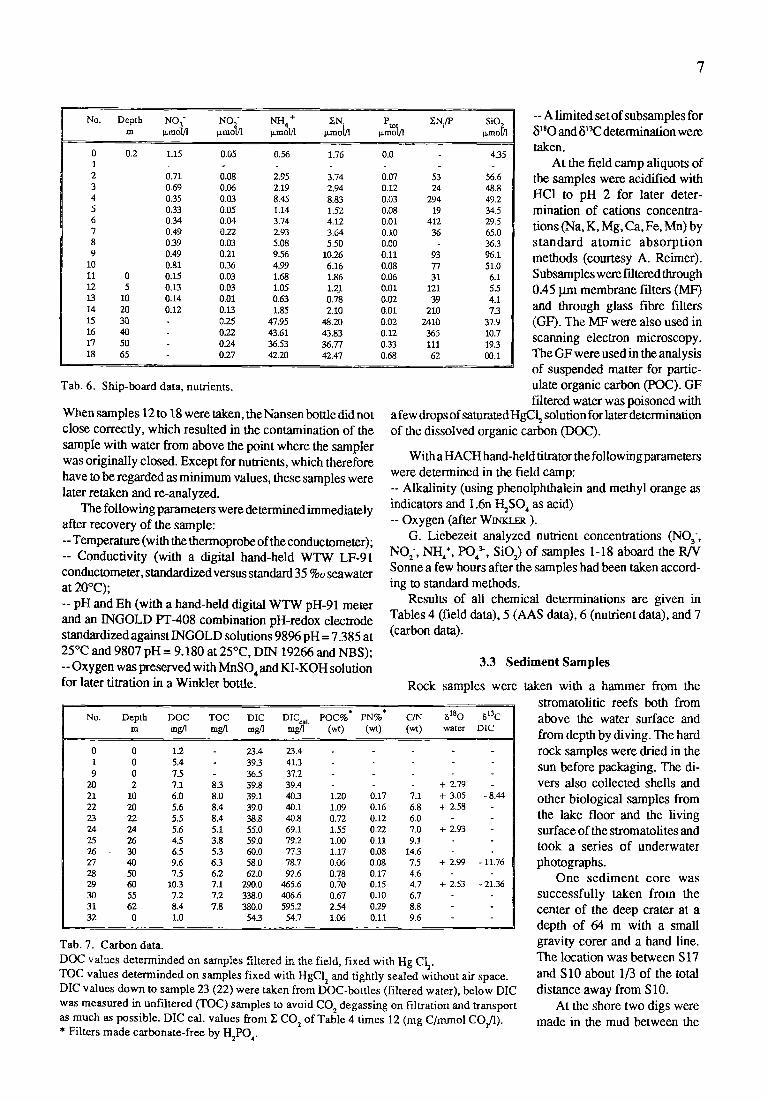
NH4 + Ptot No. Depth NO 3" NO " ~.N- ENi/P SiO~, m Izmolfl p ,moh o, mol/1 Izrnot]l l.~mol/1 p, mot/l
0 0.2 1.15 0.05 0.56 1.76 0.0 4.35 1 2 0.71 0,08 2.95 3.74 0.07 53 56.6 3 0.69 0.06 2.19 2.94 0.12 24 48.8 4 0.35 0.03 8.45 8.83 0.03 294 49.2 5 0.33 0.05 1.14 1.52 0.08 19 34.5 6 0.34 0.04 3.74 4.12 0.01 412 29.5 7 0.49 0.22 2,93 3.64 0.10 36 65.0 8 0.39 0.03 5.08 5.50 0.00 36.3 9 0.49 0.21 9.56 10.26 0.11 93 96.1
10 0.81 0.36 4.99 6.16 0.08 77 51.0 11 0 0.15 0.03 1.68 1.86 0,06 31 6.1 12 5 0.13 0.03 1.05 1.2_1 0.01 121 5.5 13 10 0.14 0.01 0.63 0.78 0.02 39 4.1 14 20 0.12 0.13 1.85 2.10 0.01 210 7.3 15 30 0.25 47.95 48.20 0.02 2410 37.9 16 40 0.22 43.61 43.83 0.12 365 10.7 17 50 0.24 36.53 36.77 0.33 111 19.3 18 65 0.27 42.20 42.47 0.68 62 00.1
Tab. 6. Ship-board data, nutrients.
-- A limited setofsubsamples for 5t80 and 5t3C determination were taken.
At the field camp aliquots of the samples were acidified with HCI to pH 2 for later deter- ruination of cations concentra- tions (Na, K, Mg, Ca, Fe, Mn) by standard a tomic absorpt ion methods (courtesy A. Reimer). S ubsamples were faltered through 0.45 pm membrane filters (MF) and through glass fibre filters (GF). The MF were also used in scanning electron microscopy. The GF were used in the analysis of suspended matter for partic- ulate organic carbon (POC). GF filtered water was poisoned with
When samples 12 to 18 were taken, the Nansen bottle did not close correctly, which resulted in the contamination of the sample with water from above the point where the sampler was originally closed. Except for nutrients, which therefore have to be regarded as minimum values, these samples were later retaken and re-analyzed.
The following parameters were determined immediately after recovery of the sample: -- Temperature (with the thermoprobe of the conductometer); -- Conductivity (with a digital hand-held WTW LF-91 conductometer, standardized versus standard 35 %0 seawater at 20~ -- pH and Eh (with a hand-held digital WTW pH-91 meter and an INGOLD PT-408 combination pH-redox electrode standardized against INGOLD solutions 9896 pH = 7.385 at 25~ and 9807 pH = 9.180 at 25~ DIN 19266 and NBS); -- Oxygen was preserved with MnSO, and KI-KOH solution for later titration in a Winkler bottle.
a few drops of saturated HgC 12 solution for later determination of the dissolved organic carbon (DOC).
With a HACH h and-held titrator the following parameters were determined in the field camp: -- Alkalinity (using phenolphthalein and methyl orange as indicators and 1.6n H;SO 4 as acid) -- Oxygen (after Wm-KL~ ).
G. Liebezeit analyzed nutrient concentrations (NO3-, NO2", NH, § PO43-, S i t : ) of samples 1-18 aboard the R/V Sonne a few hours after the samples had been taken accord- ing to standard methods.
Results of all chemical determinations are given in Tables 4 (field data), 5 (AAS data), 6 (nutrient data), and 7 (carbon data).
3.3 Sediment Samples
Rock samples were taken with a hammer from the
No. Depth DOC TOC DIC DIC~,I. POC%* PN%* C/N ~tSo 513C m rag/1 rag/1 rag/1 mg~ (wt) (wt) (wt) water DIC
- 8.44 + 2.79 + 3.05 + 2.58
+ 2.93
0 0 1.2 23,4 23.4 1 0 5.4 39.3 41.3 9 0 7.5 36.5 37.2
20 2 7.1 8.3 39.8 39.4 21 10 6.0 8.0 39.1 40.3 1.20 0.17 7.1 22 20 5.6 8.4 39.0 40.1 1.09 0.16 6.8 23 22 5.5 8.4 38.8 40.8 0.72 0.12 6.0 24 24 5.6 5.1 55.0 69.1 1.55 0.22 7.0 25 26 4.5 3.8 59.0 79.2 1.00 0.11 9.1 26 30 6.5 5.3 60.0 77.3 1.17 0.08 14.6 27 40 9.6 6.3 58.0 78.7 0.06 0-08 7.5 28 50 7 5 6.2 62.0 92.6 0.78 0.17 4.6 29 60 10.3 7.1 290.0 465.6 0.70 0.15 4.7 30 55 7.2 7.2 338.0 406.6 0.67 0.10 6.7 31 62 8.4 7.8 380.0 595.2 2.54 0.29 8.8 32 0 1,0 54.3 54.7 1.06 0.11 9.6
+ 2.99 - 11.76
+ 2.53 - 21.36
Tab. 7. Carbon data. DOC values determinded on samples filtered in the field, fixed with Hg C�89 TOC values determinded on samples fixed with HgC12 and tightly sealed without air space. DIC values down to sample 23 (22) were taken from DOC-bottles (filtered water), below DIC was measured in unfiltered (TOC) samples to avoid CO 2 degassing on filtration and transport as much as possible. DIC cal. values from Z CO 2 of Table 4 times 12 (mg C/retool COt/1 ). * Filters made carbonate-free by H2PO 4.
stromatolitic reefs both from above the water surface and from depth by diving. The hard rock samples were dried in the sun before packaging. The di- vers also collected shells and other biological samples from the lake floor and the living surface of the stromatolites and took a series of underwater photographs.
One sediment core was successfully taken from the center of the deep crater at a depth of 64 m with a small gravity corer and a hand line. The location was between $17 and S10 about 1/3 of the total distance away from S 10.
At the shore two digs were made in the mud between the
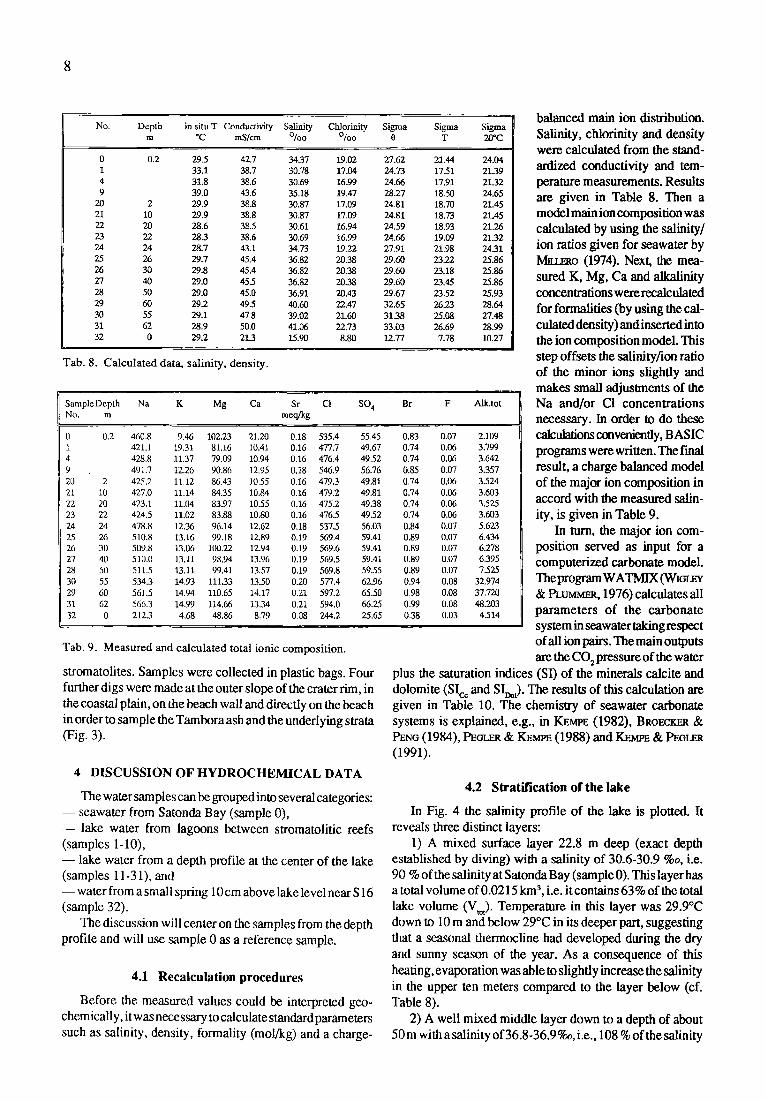
No. Depth in situ T Conductivity Salinity Chlorinity Sigma Sigma Sigma m *C mS/cm ~ ~ 0 T 20"C
0 0.2 295 42.7 3437 19.02 27.62 21.44 24.04 1 33.1 38.7 30.78 17.04 24.73 1751 2139 4 31.8 38.6 30.69 16.99 24.66 17.91 21.32 9 39.0 43.6 35.18 19.47 28.27 18.50 24.65
20 2 29.9 38.8 30`87 17.09 24.81 18.70 21.45 21 10 29.9 38.8 30.87 17.09 24.81 18.73 21.45 22 20 28.6 38s 30.61 16.94 24.59 18.93 21.26 23 22 28.3 38.6 30.69 16.99 24.66 19.09 21.32 24 24 28.7 43.1 34.73 19.22 27.91 21.98 24.31 25 26 29.7 45.4 36.82 20.38 29.60 23,22 25`86 26 30 29.8 45.4 36.82 20.38 29.60 23.18 25.86 27 40 29.0 45.5 36.82 20.38 29,60 23.45 25.86 28 50 29.0 45.0 36.91 20.43 29.67 2352 25.93 29 60 29.2 495 40.60 22.47 32.65 26.23 28.64 30 55 29.1 47.8 39.02 21.60 3138 25.08 27.48 31 62 28.9 50.0 41.06 22.73 33.03 26.69 28.99 32 0 29.2 213 15.90 8.80 12.77 7.78 10.27
T a b . 8. C a l c u l a t e d da ta , s a l i n i t y , d e n s i t y .
SampleDepth Na K Mg Ca Sr CI SO 4 Br F Alk.tot No. m meq/kg
0 0.2 460.8 9.46 102.23 21.20 0.18 535.4 55,45 0.83 0.07 2,109 1 421.1 19,31 81.16 10.41 0.16 477.7 49.67 0.74 0.06 3.799 4 428,8 11.37 79.09 10.94 0.16 476.4 49.52 0,74 0.06 3,642 9 491.7 12.26 90.86 12.95 0,18 546.9 56.76 0.85 0,07 3,357 20 2 425.2 11.12 86.43 10.55 0.16 479.3 49.81 0.74 0.06 3,524 2J. 10 42%0 11.14 84.35 10.84 0.16 479.2 49.81 0.74 0.06 3,603 22 20 423.1 11.04 83.97 10.55 0.16 475.2 49.38 0.74 0.06 3.525 23 22 424.5 11.02 83.88 10.80 0.16 476.5 49,52 0.74 0.06 3.603 24 24 478.8 12.36 96.14 12.62 0.18 537.5 56.03 0`84 0.07 5.623 25 26 510.8 13.16 99.]8 12.89 0.19 569.4 59.41 0.89 0.07 6.434 26 30 509.8 13.06 100.22 12.94 0.19 569.6 59.41 0,89 0.07 6.278 27 4(I 510,0 13.1.1 98.94 13.96 0.19 569.5 59.41 0.89 0.(17 6,395 28 50 511,5 13.11 99.41 13.57 0.19 569.8 59.55 0.89 0.07 7.525 30 55 534.3 14,93 11133 13.50 0.20 577.4 62.96 0.94 0.08 32,974 29 60 561.5 14.94 110 .65 14.I7 0.21 597.2 65.50 0.98 0.08 3%720 31 62 566.3 14.99 114 .66 13.34 0.21 594.0 66.25 0.99 0.08 48.203 32 0 212.3 4.68 48.86 8.79 0,08 244.2 25.65 0.38 0.03 4.514
Tab. 9. Measured and calculated total ionic composition.
balanced main ion distribution. Salinity, chlorinity and density were calculated from the stand- ardized conductivity and tem- perature measurements. Results are given in Table 8. Then a model main ion composition was calculated by using the salinity/ ion ratios given for seawater by MnJ~o (1974). Next, the mea- sured K, Mg, Ca and alkalinity concentrations were recalculated for formalities (by using the cal- culated density) and inserted into the ion composition model. This step offsets the salinity/ion ratio of the minor ions slightly and makes small adjustments of the Na and/or CI concentrations necessary. In order to do these CalOflafions conveniently, BASIC programs were written. The final result, a charge balanced model of the major ion composition in accord with the measured salin- ity, is given in Table 9.
In turn, the major ion com- position served as input for a computerized carbonate model. The program WATMIX (WIGL~ & P L Y , 1976) calculates all parameters of the carbonate system in seawater takingresp~t of all ion pairs. The main outputs are the CO2 pressure of the water
stromatolites. Samples were collected in plastic bags. Four further digs were made at the outer slope of the crater tim, in the coastal plain, on the beach wall and directly on the beach in order to sample the Tambora ash and the underlying strata (Fig. 3).
4 DISCUSSION OFHYDROCHEMICAL DATA
The water samples can be grouped into several categories: - - seawater from Satonda Bay (sample 0), - - lake water from lagoons between stromatolitic reefs (samples 1-10), - - lake water from a depth profile at the center of the lake (samples 11-31), and - - water from a small spring 10 cm above lake level near S 16 (sample 32).
The discussion will center on the samples from the depth profile and will use sample 0 as a reference sample.
4.1 Recalculation procedures
Before the measured values could be interpreted geo- chemically, it was necessary to calculate standard parameters such as salinity, density, formality (mol/kg) and a charge-
plus the saturation indices (SI) of the minerals calcite and dolomite (Sic, and SI~1 ). The results of this calculation are given in Table 10. The chemistry of seawater carbonate systems is explained, e.g., in KE~E (1982), BgOECKER & PENG (1984), PEGLF~ & KErOE (1988) and K E ~ & PEOLEa (1991).
4.2 Stratification of the lake
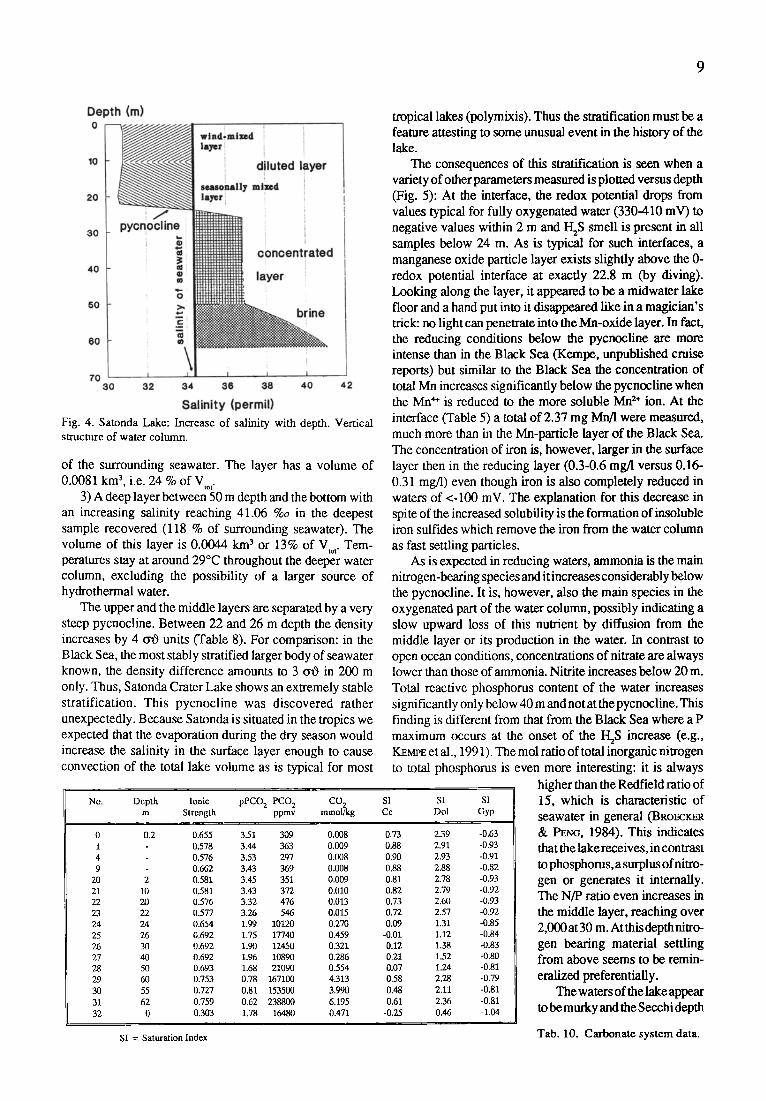
In Fig. 4 the salinity profile of the lake is plotted. It reveals three distinct layers:
1) A mixed surface layer 22.8 m deep (exact depth established by diving) with a salinity of 30.6-30.9 %o, i.e. 90 % of the salinity at Satonda Bay (sample 0). This layer has a total volume of 0.0215 km 3, i.e. it contains 63 % of the total lake volume (V~o). Temperature in this layer was 29.9~ down to 10 m and below 29~ in its deeper part, suggesting that a seasonal thermocline had developed during the dry and sunny season of the year. As a consequence of this heating, evaporation was able to slightly increase the salinity in the upper ten meters compared to the layer below (cf. Table 8).
2) A well mixed middle layer down to a depth of about 50 m with a salinity of 36.8-36.9 o/~, i.e., 108 % of the salinity
9
Fig. 4. Satonda Lake: Increase of salinity with depth. Vertical structure of water column.
of the surrounding seawater. The layer has a volume of 0.0081 km 3, i.e. 24 % of VLo c
3) A deep layer between 50 m depth and the bottom with an increasing salinity reaching 41.06 %0 in the deepest sample recovered (118 % of surrounding seawater). The volume of this layer is 0.0044 km 3 or 13% of V c Tem- peratures stay at around 29~ throughout the deeper water column, excluding the possibility of a larger source of hydrothermal water.
The upper and the middle layers are separated by a very steep pycnocline. Between 22 and 26 m depth the density increases by 4 o~O units (Table 8). For comparison: in the Black Sea, the most stably stratified larger body of seawater known, the density difference amounts to 3 (tO in 200 m only. Thus, Satonda Crater Lake shows an extremely stable stratification. This pycnocline was discovered rather unexpectedly. Because Satonda is situated in the tropics we expected that the evaporation during the dry season would increase the salinity in the surface layer enough to cause convection of the total lake volume as is typical for most
tropical lakes (polymixis). Thus the stratification must be a feature attesting to some unusual event in the history of the lake.
The consequences of this stratification is seen when a variety of other parameters measured is plotted versus depth (Fig. 5): At the interface, the redox potential drops from values typical for fully oxygenated water (330-410 mV) to negative values within 2 m and I-I2S smell is present in all samples below 24 m. As is typical for such interfaces, a manganese oxide particle layer exists slightly above the 0- redox potential interface at exactly 22.8 m (by diving). Looking along the layer, it appeared to be a midwater lake floor and a hand put into it disappeared like in a magician's trice no light can penetrate into the Mn-oxide layer. In fact, the reducing conditions below the pycnocline are more intense than in the Black Sea (Kempe, unpublished cruise reports) but similar to the Black Sea the concentration of total Mn increases significantly below the pycnocline when the Mn*' is reduced to the more soluble Mn 2§ ion. At the interface (Table 5) a total of 2.37 mg Mn/1 were measured, much more than in the Mn-particle layer of the Black Sea. The concentration of iron is, however, larger in the surface layer then in the reducing layer (0.3-0.6 mg/l versus 0.16- 0.31 mg/1) even though iron is also completely reduced in waters of <-100 mV. The explanation for this decrease in spite of the increased solubility is the formation of insoluble iron sulfides which remove the iron from the water column as fast settling particles.
As is expected in reducing waters, ammonia is the main �9 nitrogen-bearing species and itincreases considerably below the pycnocline. It is, however, also the main species in the oxygenated part of the water column, possibly indicating a slow upward loss of this nutrient by diffusion from the middle layer or its production in the water. In contrast to open ocean conditions, concentrations of nitrate are always lower than those of ammonia. Nitrite increases below 20 m. Total reactive phosphorus content of the water increases significantly only below 40 m and not at thepycnocline. This finding is different from that from the Black Sea where a P maximum occurs at the onset of the I-I2S increase (e.g., KZMPE et al., 1991). The mol ratio of total inorganic nitrogen to total phosphorus is even more interesting: it is always
No. Depth Ionic pPCO 2 PCO 2 CO 2 SI SI SI m Strength ppmv mmol/kg Cc Dol Gyp
0 0.2 0.655 3.51 309 0.008 0.73 2.39 -0.63 1 0.578 3.44 363 0,009 0.88 2.91 -0.93 4 0.576 3.53 297 0.008 0.90 2.93 -0.91 9 0.662 3.43 369 0.008 0.88 2.88 -0.82
20 2 0.581 3.45 351 0.009 0.81 2.78 -0.93 21 10 0.581 3.43 372 0,010 0.82 2.79 -(I.92 22 20 0.576 3.32 476 0.013 0.73 2.6(I -0.93 23 22 0.577 3.26 546 0.015 0.72 2.57 -0.92 24 24 0.654 1.99 10120 0,270 0.09 1.31 -0.85 25 26 0.692 1.75 17740 0.459 -0.01 1.12 -0.84 26 30 0,692 1.90 12450 0.321 0.12 1.38 -0.83 27 40 0.692 1.96 10890 0,286 0.21 1.52 -0.80 28 50 0.693 1.68 21090 0.554 0.07 1.24 -0.81 29 60 0.753 0.78 167100 4.313 0.58 2.28 -0.79 30 55 0.727 0.81 153500 3.990 0.48 2.11 -0,81 31 62 0.759 0.62 238800 6,195 0.61 2.36 -0.81 32 0 0,303 1.78 16480 0,471 -0.25 0.46 -1.04
SI = Saturation Index
higher than the Redfield ratio of 15, which is characteristic of seawater in general ( B R o ~ &PnNc, 1984). This indicates that the lake receives, in con wast to phosphorus, a surplus of nitro- gen or generates it internally. The N/P ratio even increases in the middle layer, reaching over 2,000at 30 m. Atthisdepthnitro- gen bearing material settling from above seems to be remin- eralized preferentially.
The waters of the lake appear to be murky and the Secchi depth
Tab. 10. Carbonate system data.
10
200 400 1 30 32 34 36 38 40 80 gO I 00 I 10 7 8 - 200 0 2 3 4
tt l f ( lll t i'i~ J , , , , , , i , , i , , , , , i
tO
a l a g A I k . Mg /Ca a g Na K h pH PCO2 SE t t u ra l i on (Ca l c i l e )
20
30
5C
6C
' ' ' ' ' ' ~ o's '~ ~. Imp. " . 9 ,o~ IA,. [ .~ . " . 9~ . . , .o . . ~., ,o.--
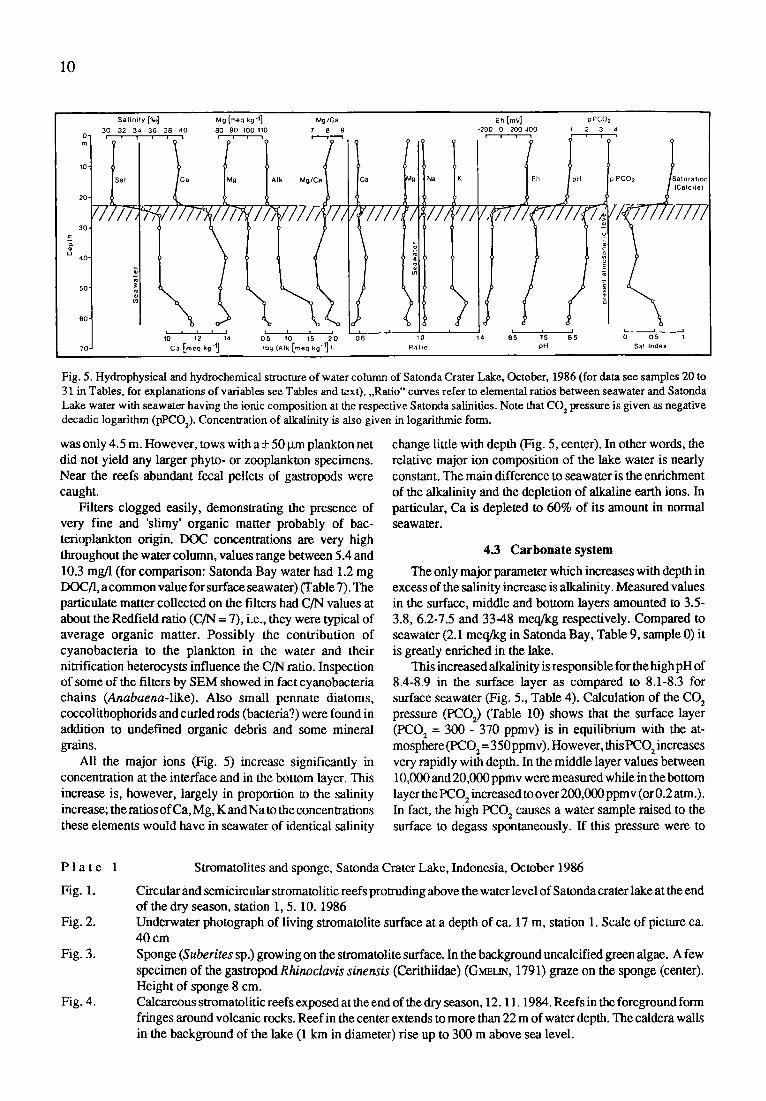
Fig. 5. Hydrophysieal and hydrochemieal structure of water column of Satonda Crater Lake, October, 1986 (for data see samples 20 to 31 in Tables, for explanations of variables see Tables and text). ,,Ratio" curves refer to elemental ratios between seawater and Satonda Lake water with seawater having the ionic composition at the respective Satonda salinifies. Note that CO 2 pressure is given as negative decadic logarithm (pPCO2). Concentration of alkalinity is also given in logarithmic form.
was only 4.5 m. However, tows with a + 50 t-tm plankton net did not yield any larger phyto- or zooplankton specimens. Near the reefs abundant fecal pellets of gastropods were caught.
Filters clogged easily, demonstrating the presence of very fine and 'slimy' organic matter probably of bac- terioplankton origin. DOC concentrations am very high throughout the water column, values range between 5.4 and 10.3 mg/1 (for comparison: Satonda Bay water had 1.2 mg DOC/1, a common value for surface seawater) (Table 7). The particulate matter collected on the filters had C/N values at about the Redfield ratio (C/N = 7), i.e., they were typical of average organic matter. Possibly the contribution of cyanobacteria to the plankton in the water and their nitrification heterocysts influence the C/N ratio. Inspection of some of the filters by SEM showed in fact cyanobacteria chains (Anabaena-like). Also small pennate diatoms, coccolithophorids and curled rods (bacteria?) were found in addition to undefined organic debris and some mineral grains.
All the major ions (Fig. 5) increase significantly in concentration at the interface and in the bottom layer. This increase is, however, largely in proportion to the salinity increase; the ratios of Ca, Mg, K and Na to the concentrations these elements would have in seawater of identical salinity
change little with depth (Fig. 5, center). In other words, the relative major ion composition of the lake water is nearly constant. The main difference to seawater is the enrichment of the alkalinity and the depletion of alkaline earth ions. In particular, Ca is depleted to 60% of its amount in normal seawater.
4.3 Carbonate system
The only major parameter which increases with depth in excess of the salinity increase is alkalinity. Measured values in the surface, middle and bottom layers amounted to 3.5- 3.8, 6.2-7.5 and 33-48 meq/kg respectively. Compared to seawater (2.1 meq/kg in Satonda Bay, Table 9, sample 0) it is greatly enriched in the lake.
This increased alkalinity is responsible for the high pH of 8.4-8.9 in the surface layer as compared to 8.1-8.3 for surface seawater (Fig. 5., Table 4). Calculation of the CO 2 pressure (PCO2) (Table 10) shows that the surface layer (PCO 2 = 300 - 370 ppmv) is in equilibrium with the at- mosphere (PCO: = 350ppmv). However, thisPCO 2increases very rapidly with depth. In the middle layer values between 10,000 and 20,000 ppmv were measured while in the bottom layer the PCO 2 increased to over 200,000 ppm v (or 0.2 atm.). In fact, the high PCO 2 causes a water sample raised to the surface to degass spontaneously. If this pressure were to
P l a t e
Fig. 1.
Fig. 2.
Fig. 3.
Fig. 4.
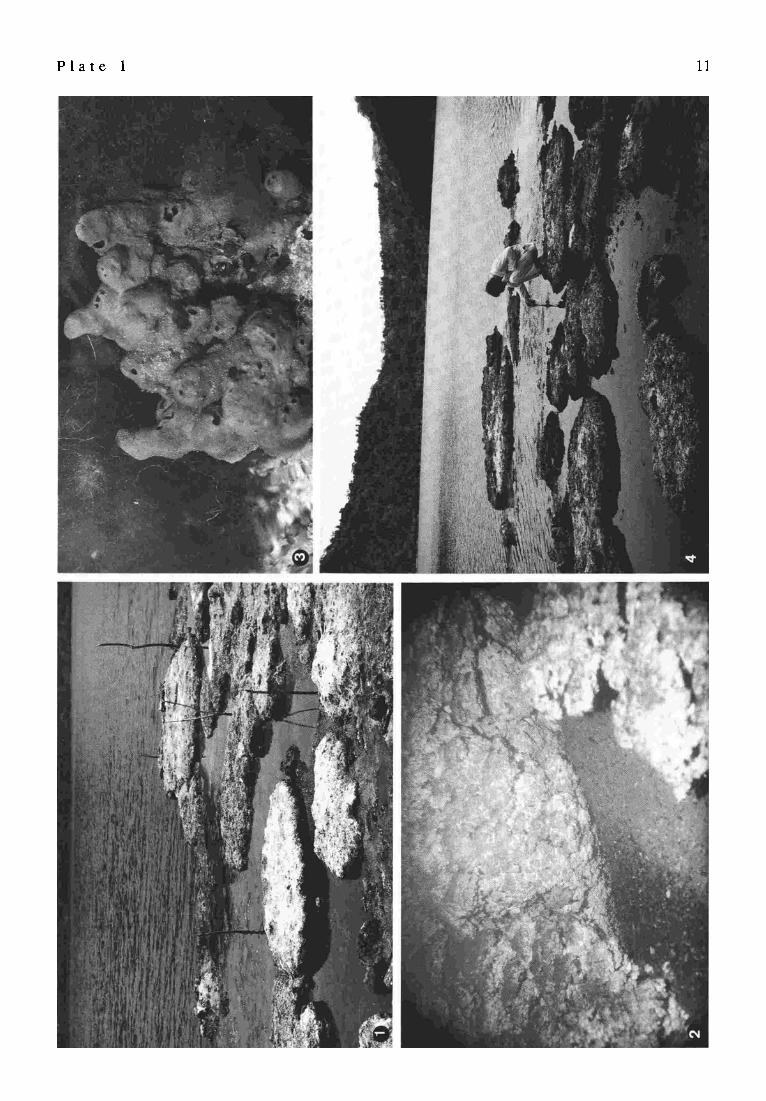
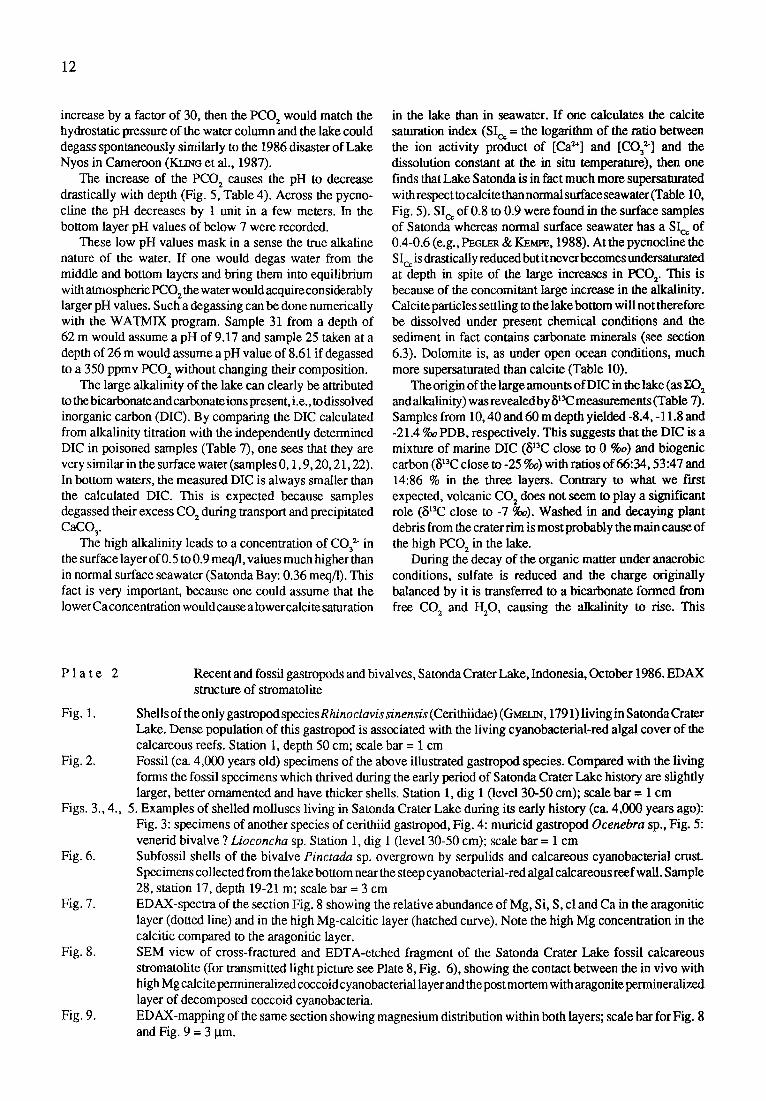
Stromatolites and sponge, Satonda Crater Lake, Indonesia, October 1986
Circular and semicircular stromatolitic reefs protruding above the water level of Satonda crater lake at the end of the dry season, station 1, 5. 10. 1986 Underwater photograph of living stzomatolite surface at a depth of ca. 17 m, station 1. Scale of picture ca. 40 cm Sponge (Suberites sp.) growing on the stromatolite surface. In the background uncalcified green algae. A few specimen of the gastropod Rhinoclavis sinensis (Cerithiidae) (GMEtJN, 1791) graze on the sponge (center). Height of sponge 8 cm. Calcareous stromatolitic reefs exposed at the end of the dry season, 12. 11.1984. Reefs in the foreground form fringes around volcanic rocks. Reef in the center extends to more than 22 m of water depth. The caldera walls in the background of the lake (1 km in diameter) rise up to 300 m above sea level.
P l a t e 1 11
12
increase by a factor of 30, then the PCO 2 would match the hydrostatic pressure of the water column and the lake could degass spontaneously similarly to the 1986 disaster of Lake Nyos in Cameroon (KLrN~ et al., 1987).
The increase of the PCO 2 causes the pH to decrease drastically with depth (Fig. 5, Table 4). Across the pycno- cline the pH decreases by 1 unit in a few meters. In the bottom layer pH values of below 7 were recorded.
These low pH values mask in a sense the true alkaline nature of the water. If one would degas water from the middle and bottom layers and bring them into equilibrium with atmospheric PCO 2the water would acquire considerably larger pH values. Such a degassing can be done numerically with the WATMIX program. Sample 31 from a depth of 62 m would assume a pH of 9.17 and sample 25 taken at a depth of 26 m would assume a pH value of 8.61 if degassed to a 350 ppmv PCO 2 without changing their composition.
The large alkalinity of the lake can clearly be attributed to the bicarbonate and carbonate ions present, i.e., to dissolved inorganic carbon (DIC). By comparing the DIC calculated from alkalinity titration with the independently determined DIC in poisoned samples (Table 7), one sees that they are very similar in the surface water (samples 0, 1,9, 20, 21, 22). In bottom waters, the measured DIC is always smaller than the calculated DIC. This is expected because samples degassed their excess CO 2 during transport and precipitated CaCO r
The high alkalinity leads to a concentration of CO3 : in the surface layer of 0.5 to 0.9 meq/l, values much higher than in normal surface seawater (Satonda Bay: 0.36 meq/l). This fact is very important, because one could assume that the lower Ca concentration would cause alower calcite saturation
in the lake than in seawater. If one calculates the calcite saturation index (Sic. = the logarithm of the ratio between the ion activity product of [Ca 2+] and ICOn-] and the dissolution constant at the in situ temperature), then one finds that Lake Satonda is in fact much more supersaturated with respect to calcite than normal surface seawater (Table 10, Fig. 5). Sic. of 0.8 to 0.9 were found in the surface samples of Satonda whereas normal surface seawater has a Sic. of 0.4-0.6 (e.g., PEGLER & KE~an~, 1988). At the pycnocline the SIc~ is drastically reduced butitneverbecomes undersaturated at depth in spite of the large increases in PCO 2. This is because of the concomitant large increase in the alkalinity. Calcite particles settling to the lake bottom will not therefore be dissolved under present chemical conditions and the sediment in fact contains carbonate minerals (see section 6.3). Dolomite is, as under open ocean conditions, much more supersaturated than calcite (Table 10).
The origin of the large amounts of DIC in the lake (as Y-,O 2 and alkalinity) was revealed by 813C measurements (Table 7). Samples from 10, 40 and 60 m depth yielded -8.4, - 11.8 and -21.4 57o0 PDB, respectively. This suggests that the DIC is a mixture of marine DIC (813C close to 0 %0) and biogenic carbon (8~3C close to -25 5700) with ratios of 66:34, 53:47 and 14:86 % in the three layers. Contrary to what we first expected, volcanic CO 2 does not seem to play a significant role (8x3C close to -7 %o). Washed in and decaying plant debris from the crater rim is most probably the main cause of the high PCO 2 in the lake.
During the decay of the organic matter under anaerobic conditions, sulfate is reduced and the charge originally balanced by it is transferred to a bicarbonate formed from free CO 2 and 1-I20, causing the alkalinity to rise. This
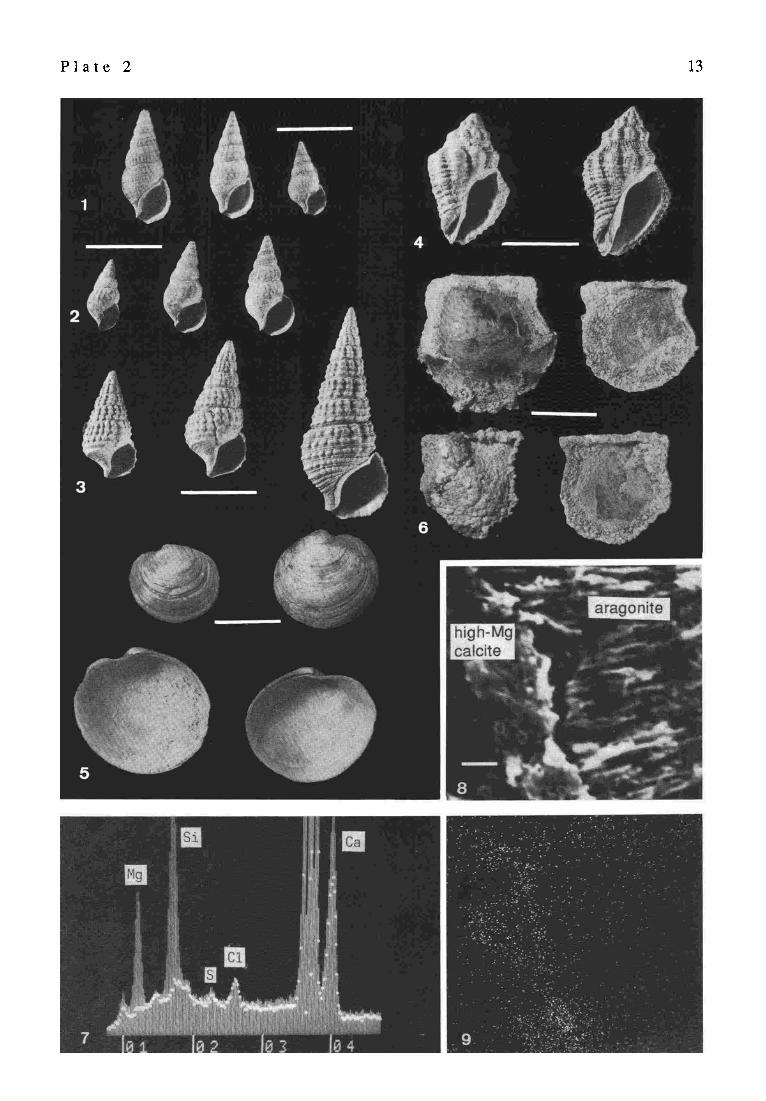
P l a t e 2 Recent and fossil gastropods and bivalves, Satonda Crater Lake, Indonesia, October 1986. EDAX structure of stromatolite
Fig. 1. Shells of the only gastropod speciesRhinoclavissinensis (Cerithiidae) (G~.taN, 1791) living in Satonda Crater Lake. Dense population of this gastropod is associated with the living cyanobacterial-red algal cover of the calcareous reefs. Station 1, depth 50 cm; scale bar = 1 cm
Fig. 2. Fossil (ca. 4,000 years old) specimens of the above illustrated gastropod species. Compared with the living forms the fossil specimens which thrived during the early period of Satonda Crater Lake history are slightly larger, better ornamented and have thicker shells. Station 1, dig 1 (level 30-50 cm); scale bar = 1 cm
Figs. 3., 4., 5. Examples of shelled molluscs living in Satonda Crater Lake during its early history (ca. 4,000 years ago): Fig. 3: specimens of another species of cerithiid gastropod, Fig. 4: muricid gastropod Ocenebra sp., Fig. 5: venerid bivalve ? Lioconcha sp. Station 1, dig 1 (level 30-50 cm); scale bar = 1 cm
Fig. 6. Subfossil shells of the bivalve Pinctada sp. overgrown by serpulids and calcareous cyanobacterial crust. Specimens collected from the lake bottom near the steep cyanobacterial-red algal calcareous reef wall. Sample 28, station 17, depth 19-21 m; scale bar = 3 cm
Fig. 7. EDAX-spectra of the section Fig. 8 showing the relative abundance ofMg, Si, S, cl and Ca in the aragonitic layer (dotted line) and in the high Mg-calcitic layer (hatched curve). Note the high Mg concentration in the calcitic compared to the aragonitic layer.
Fig. 8. SEM view of cross-fractured and EDTA-etched fragment of the Satonda Crater Lake fossil calcareous stromatolite (for transmitted light picture see Hate 8, Fig. 6), showing the contact between the in vivo with high Mg calcite permineralized coccoid cyanobacterial layer and the post mortem with aragonite permineralized layer of decomposed coccoid cyanobacteria.
Fig. 9. EDAX-mapping of the same section showing magnesium distribution within both layers; scale bar for Fig. 8 and Fig. 9 = 3 ~tm.
P l a t e 2 13
14
18. 8
8.6
8.4
8.2
pH ..-"
12 . / , ' ' I . �9 /
0 . . S / E 10 \ . . . . / " " / E \ "'" / = 8 / . . . . X / / / o . _ " ~ . /
"~ 6 X. , , ,
C
" ' . . . C a o 2 -r Ctot , , , . o.
I I I
480 490 500 Total Na-Concentrat ion [mrnol kg -1]
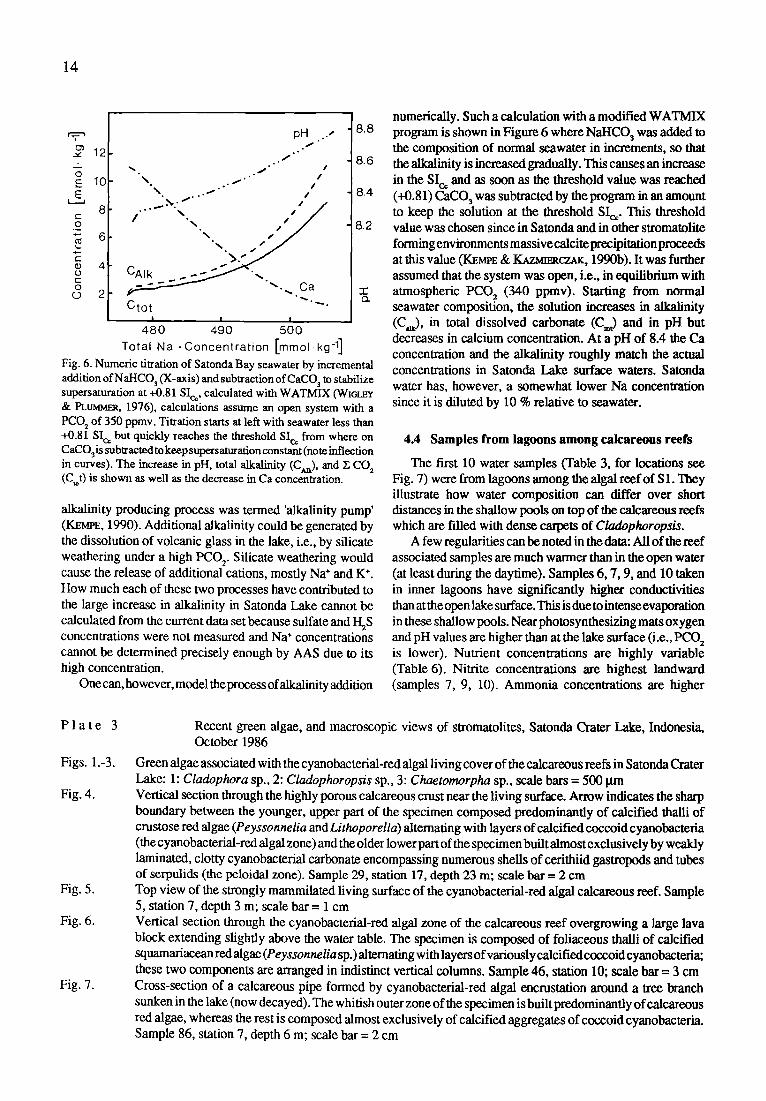
Fig. 6. Numeric titration of Satonda Bay seawater by incremental addition of NaHCO~ (X-axis) and subtraction of CaCO 3 to stabilize supersaturation at +0.81 Sic,, calculated with WATMIX (WIoLEY & PLt~,IMER, 1976), calculations assume an open system with a PCO 2 of 350 ppmv. Titration starts at left with seawater less than +0.81 Sic, but quickly reaches the threshold Sic, from where on CaCO 3is subtracted to keep supersaturation constant (note inflection in curves). The increase in pH, total alkalinity (C~,), and Y. CO 2 (C,t) is shown as well as the decrease in Ca concentration.
alkalinity producing process was termed 'alkalinity pump' (KEMPE, 1990). Additional alkalinity could be generated by the dissolution of volcanic glass in the lake, i.e., by silicate weathering under a high PCO 2. Silicate weathering would cause the release of additional cations, mostly Na § and K § How much each of these two processes have contributed to the large increase in alkalinity in Satonda Lake cannot be calculated from the current data set because sulfate and I-I~S concentrations were not measured and Na § concentrations cannot be determined precisely enough by AAS due to its high concentration.
One can, however, model the process of alkalinity addition
numerically. Such a calculation with a modified WATMIX program is shown in Figure 6 where NaHCO 3 was added to the composition of normal seawater in increments, so that the alkalinity is increased gradually. This causes an increase in the Sic, and as soon as the threshold value was reached (+0.81) CaCO 3 was subtracted by the program in an amount to keep the solution at the threshold Sic. This threshold value was chosen since in Satonda and in other stromatolite forming environments massive calcite precipitation proceeds at this value (KEr~E & ~ C 7 _ . ~ : , 1990b). It was further assumed that the system was open, i.e., in equilibrium with atmospheric PCO 2 (340 ppmv). Starting from normal seawater composition, the solution increases in alkalinity (CQ, in total dissolved carbonate (C~) and in pH but decreases in calcium concentration. At a pH of 8.4 the Ca concentration and the alkalinity roughly match the actual concentrations in Satonda Lake surface waters. Satonda water has, however, a somewhat lower Na concentration since it is diluted by 10 % relative to seawater.
4.4 Samples from lagoons among calcareous reefs
The first 10 water samples (Table 3, for locations see Fig. 7) were from lagoons among the algal reef of S1. They illustrate how water composition can differ over short distances in the shallow pools on top of the calcareous reefs which are filled with dense carpets of Cladophoropsis.
A few regularities can be noted in the data: All of the reef associated samples are much wanner than in the open water (at least during the daytime). Samples 6, 7, 9, and 10 taken in inner lagoons have significantly higher conductivities than at the open lake surface. This is due to intense evaporation in these shallow pools. Near photosynthesizing mats oxygen and pH values are higher than at the lake surface (i.e., PCO 2 is lower). Nutrient concentrations are highly variable (Table 6). Nitrite concentrations are highest landward (samples 7, 9, 10). Ammonia concentrations are higher
P l a t e 3
Figs. 1.-3.
Fig. 4.
Fig. 5.
Fig. 6.
Fig. 7.
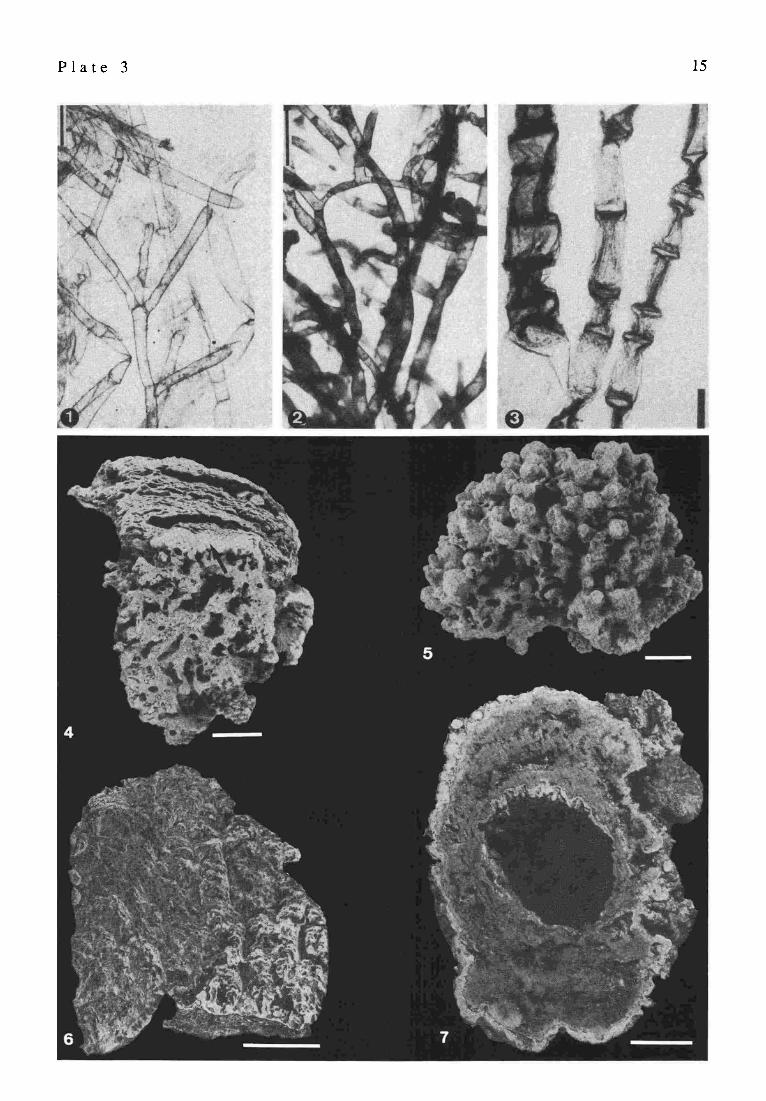
Recent green algae, and macroscopic views of stromatolites, Satonda Crater Lake, Indonesia, October 1986
Green algae associated with the cyanobacterial-red algal living cover of the calcareous reefs in Satonda Crater Lake: 1: Cladophora sp., 2: Cladophoropsis sp., 3: Chaetomorpha sp., scale bars = 500 Vertical section through the highly porous calcareous crest near the living surface. Arrow indicates the sharp boundary between the younger, upper part of the specimen composed predominantly of calcified thalli of crustose red algae (Peyssonnelia andLithoporella) alternating with layers of calcified coccoid cyanobacteria (the cyanobac terial-red algal zone) and the older lower part of the specimen built almost exclusively by weakly laminated, clotty cyanobacterial carbonate encompassing numerous shells of cerithiid gastropods and tubes of serpulids (the peloidal zone). Sample 29, station 17, depth 23 m; scale bar = 2 cm Top view of the strongly mammilated living surface of the cyanobacterial-red algal calcareous reef. Sample 5, station 7, depth 3 m; scale bar = 1 cm Vertical section through the cyanobacterial-red algal zone of the calcareous reef overgrowing a large lava block extending slightly above the water table. The specimen is composed of foliaeeous thalli of calcified squamariacean red algae (Peyssonnelia sp.) alternating with layers of variously calcified coccoid cyanobacteria; these two components are arranged in indistinct vertical columns. Sample 46, station 10; scale bar = 3 cm Cross-section of a calcareous pipe formed by cyanobacterial-red algal encrustation around a tree branch sunken in the lake (now decayed). The whitish outer zone of the specimen is built predominantly of calcareous red algae, whereas the rest is composed almost exclusively of calcified aggregates of coccoid cyanobacteria. Sample 86, station 7, depth 6 m; scale bar = 2 cm
P l a t e 3 15
16
among the mats than in the open water. Highest phosphorus values correspond to highest temperatures (samples 7 and 9) indicative of the release of nutrients in water too warm for algal activity. Sample 9 has also high SiO2, Fe, Mn, and DOC concentrations but a low alkalinity, a low measured DIC concentration and the lowest Mg/Ca ratio of all samples. The PCO 2 was near atmospheric pressure and the Sic, not higher than in the other samples. The lagoon of sample 9 was filled with decaying algae and dead gastropods, a place which has experienced first intensive photosynthesis and then aerobic remineralization.
These samples illustrate that the water chemistry near the algal mats is highly variable according to season, weather, time of day, water level and biological activity admitted by these factors. This fact is important to the discussion of carbonate precipitation on the cyanobacterial mats.
5 DISCUSSION OF SEDIMENT ANALYSES 5.1 Calcareous reefs
5.1.1 Setting and macroscopic appearance
Massive calcareous reefs occur along the lake shore at thirteen rocky points (Fig. 2). The largest reef bodies are located on the southwestern shore of the lake (S 1-4 and S 16- 18). The reefs appear typically as low mounds or irregularly shaped crusts 0.5-1.2 m in thickness (Figs. 7-8). They grow outward from the steep substratum as lobated overhanging ledges. The living cover of the reefs has been observed by direct diving down to the Off/~S interface. Dead reef surface has been observed below the chemocline, testifying deeper extension of the oxic layer in the past. The top of the reefs is almost fiat with slightly raised outer edges covered with strongly corroded subcircular heads emerged about 30 cm above the water level at the end of the dry season (October 1986) (Pl. 1/1, 1/4).
The submerged reef surface has, down to the depth of ca. 8 m, a cauliflower-like appearance due to the presence of
numerous granules, mammilae and knobs, a few mm to 2 cm high (PI. 3/5). Deeper, it is distinctly smoother, bearing in places low cyst-like elevations (Pls. 1/2; 3/4).
The outer 10-15 cm of the reef are highly porous and brittle. Older parts of the reef structure are built of massive, hard limestone (PI. 3/6).
Calcareous crusts of various thickness have also been observed on pieces of wood and tree branches washed into the lake from the crater wall. The woody material is often decayed, leaving calcareous tubes and chimneys behind (Pl. 3/7).
5.2.2 Living reef surface
Reef-forming biota The biota taking part at present in the reef formation
consists chiefly of in situ calcifying mats of coccoid cyanobacteria (Pleurocapsa group, sensu Ru, PKA etal., 1981; see e.g., Pls. 5/5 and 6/4, 6) intergrowing with two kinds of crustose red algae: the monostromatous corallinacean Lithoporella sp. (e.g., Pls. 5/2; 6/7; 7/1) and the less abundant squamariacean Peyssonnelia sp. (e.g., Pls. 4/6, 5/1-3). At depths below 12 m down to the Oz/FI:S interface nubecullinid foraminifers participate also significantly in the reef framework formation (Pls. 5/4 and 6/1). Aggregations of nubecullinid calcareous tests encrust particularly densely shadowed reef surfaces such as overhangs, crypts and cavities. Individual nubecuUinid tubes also occur, though rarely, on the reef surface at lesser depths and on better illuminated areas. The main groups of the reef-forming organisms are distributed on the reef surface in patches leaving some places uncolonized. Periodic (probably seasonal) domination of one group over the other is visible in the recent history of the reef communities. During the time of our stay, the reef surface was largely covered by a thin film of soft or only weakly encrusted pleurocapsalean cyanobacteria over- growing mostly non-living thalli of Lithoporella and
P l a t e 4
Fig. 1.
Fig. 2.
Fig. 3.
Fig. 4.
Fig. 5.
Fig. 6.
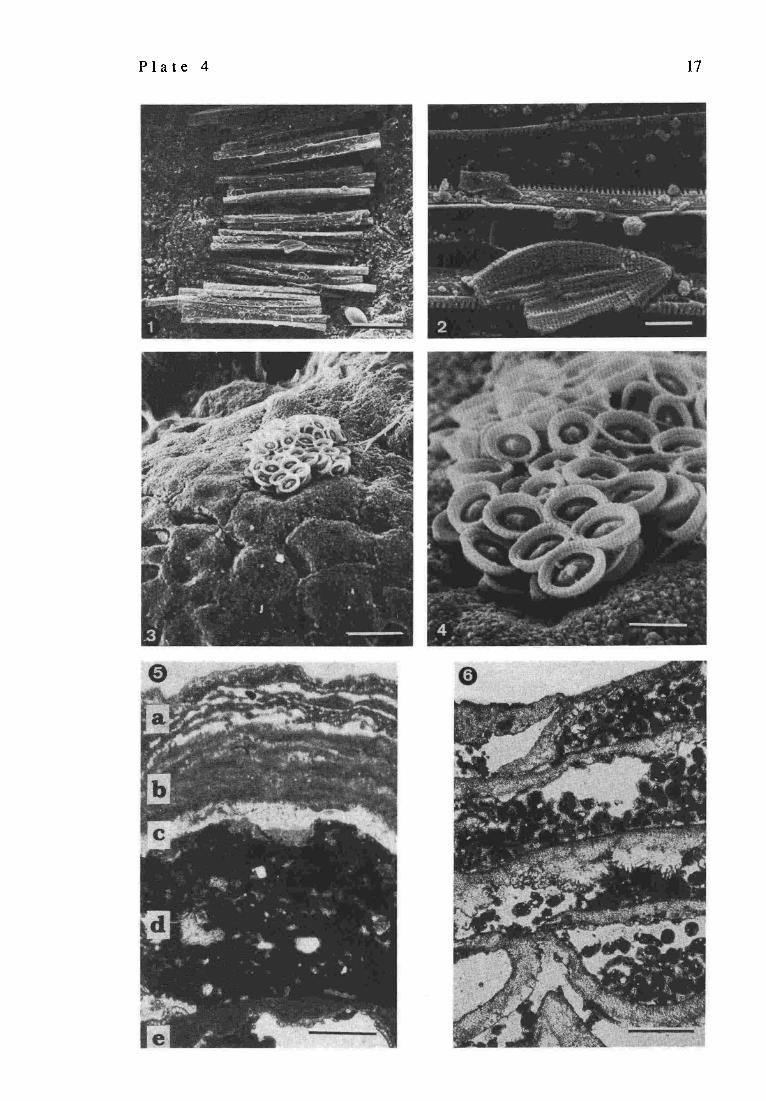
Diatoms, coccolithophorid and red algae associated with the cyanobacterial stromatolites, Satonda Crater Lake, Indonesia, October 1986.
SEM picture of a colony of pennate diatom (Fragilaria sp.) from the surface of a calcified coccoid cyanobacterial layer. Sample 11, station 11, depth 9 m; scale bar = 30 I.tm Enlarged fragment of the above showing a broken specimen of a smaller benthic pennate diatom Mastogloia sp.; scale bar = 3 ~trn SEM picture of an almost intact coccolithophorid coccosphere (Syracosphaera mediterranea) from the surface of a calcified cyanobacterial layer. Sample 10, station 7, depth 8 m; scale bar = 10 lazn Magnification of the above to show the details of the coccoliths and the granular character of the CaCO 3 covering the cyanobacterial aggregates; scale bar = 3 lam Vertical section through the uppermost part of the calcareous cyanobacterial-red algal zone demonstrating the rapid changes in the crust-forming biota and associated sediments; a: layer dominated by the crustose coralline algae Lithoporella sp. intergrowing with variously calcified pleurocapsalean cyanobacteria; b: layer built of closely adhering crustose thalli of the squamariacean red algae Peyssonnelia sp.; c: layer of silicified coccoid cyanobacterial aggregates; d: layer of clotty (thrombolitic) micrite; e: layer composed of loosely distributed foliaceous thalli of the squamariacean red algae Peyssonnelia sp. alternating with irregular accumulations of petletoid and clotty (peloidal) calcareous material. Sample 29, station 17, depth 23 m; scale bar = 500 lava Continuation of layer e from above to show the squamariacean framework of the crust and the pelletoid- peloidal character of the internal sediment filling partially the spaces between the foliaceous thalli of the red algae; scale bar = 500 lam
P l a t e 4 17
18
Peyssonnelia (P1. 6/7). Encrustations consisted of fine, granular Mg calcite. The number of living red algae during that time was significantly higherin depths between 2 and 15 m. Close to the O~-I2S interface the reef surface was almost entirely overgrown by pleurocapsalean cyanobacteria.
Noteworthy is the great variety of skeletal mineralogies of the reef-forming organisms. Hence, Lithoporella, like other corallinaceans, secretes high Mg calcite (ADEv & MACma~RE, 1973), whereas Peyssonnelia has an aragonitic skeleton (WRAV, 1977; JAMES et al., 1988). The cyanobacteria and the nubecullinid foraminifers produce in turn high Mg calcite.
Reef-associated biota Macrobiota: Green algae, sponges and gastropods are the main groups of macroorganisms associated with the cyanobacterial-red algal reef surface. Three species of siphonocladalean algae belonging to the genera Cladophora, Cladophoropsis and Chaetomorpha thrive in dense clusters close to the reef wall. They are very abundant to water depths of about 4 m, less common deeper and disappear below 8 m. The specimens of Cladophoropsis are always attached to the reef surface, whereas Cladophora and Chaetomorpha grow both attached to the reef surface or float free as bunches of f'daments. The green algae as a rule do not calcify except for the brushy carpets of Cladophoropsisgrowing in evaporative pools on the top of the reef where the tips of their filaments are encrusted with thin layers of calcium carbonate.
Sponges are represented by one species of brown to bright orange colored monaxonid demosponge identified as Suberites sp. (PI. 1/3) bearing only one kind of tylote spicules (PI. 6/1-2). Post mortem accumulations of Suberites spicules are strewed over the reef surface (PI. 6/1). The spicules dissolved, however, quickly close to the reef surface and have not been encountered incorporated into the
cyanobacterial-red algal carbonate framework. A large population of the cerithiid gastropodRhinoclavis
sinensis (G~.Lr~) is grazing both on the cyanobacteria and red algae as well as on the siphonocladalean algae. Empty gastropod shells are often encrusted and embedded in the reef framework. Post mortem accumulations of gastropod shells washed downward form a few cm thick coquina blankets on the lake bottom close to the reef wall. Gastropod fecal pellets are common components of internal sediment, filling the interskeletal reef cavities. (pl. 7/3
It is interesting to note that the large population of grazing gastropods has apparently no adverse effect on the cyanobacterial-algal community living on the Satonda Lake reef surface. This is in contrast to views attributing the decline in stromatolite formation in the past marine environments to the activity of grazing animals, particularly in the time close to the Precambriart/Cambrian boundary ( G ~ , 1970; WALTER & HEYS, 1985).
Skeletal microbiota: No special studies have been carried out on the reef-associated microbiota. It is, however, interesting to note the occurrence ofpennate benthic diatoms Fragilaria sp. and Mastogloia sp. (Pl. 4/1-2) and the coccolithophorid Syracosphaera mediterranea (P1.4/3-4) on the reef surface. The association of Fragilaria and Mastogloia is known to prefer alkaline conditions (e.g., HAVOaTn, 1972) and lower salinities. Syracosphaera as well as the rare miliolid foraminifers living on the reef surface (Quinqueloculina, Miliolinella) are cosmopolitan forms tolerating varying salinities.
5.2.3 Biota and lithology of the fossil reef framework
The calcareous reef framework below the living cover can be divided vertically into three zones which differ significantly in their biotic and lithologic composition. The-
P l a t e 5
Fig. 1.
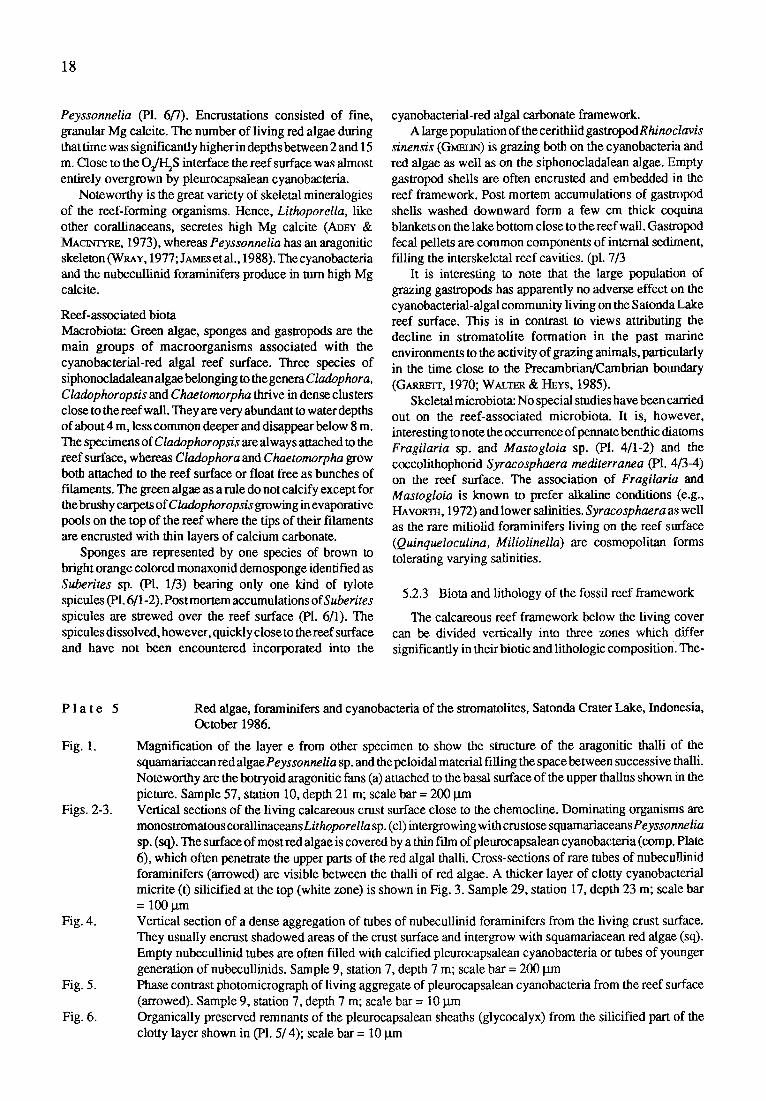
Figs. 2-3.
Fig. 4.
Fig. 5.
Fig. 6.
Red algae, foraminifers and cyanobacteria of the stromatolites, Satonda Crater Lake, Indonesia, October 1986.
Magnification of the layer e from other specimen to show the structure of the aragonitic thalli of the squamariacean red algae Peyssonnelia sp. and the peloidal material filling the space between successive thalli. Noteworthy are the botryoid aragonitic fans (a) attached to the basal surface of the upper thallus shown in the picture. Sample 57, station 10, depth 21 m; scale bar = 200 ~m Vertical sections of the living calcareous crust surface close to the chemocline. Dominating organisms are monostromatous corallinaceansLithoporella sp. (cl) intergrowing with crustose squamariaceans Peyssonnelia sp. (sq). The surface of most red algae is covered by a thin film of pleurocapsalean cyanobacteria (comp. Plate 6), which often penetrate the upper parts of the red algal thalli. Cross-sections of rare tubes of nubecullinid foraminifers (arrowed) are visible between the thalli of red algae. A thicker layer of clotty cyanobacterial micrite (t) silicified at the top (white zone) is shown in Fig. 3. Sample 29, station 17, depth 23 m; scale bar = 100gin Vertical section of a dense aggregation of tubes of nubecullinid foraminifers from the living crust surface. They usually encrust shadowed areas of the crust surface and intergrow with squamariacean red algae (sq). Empty nubecullinid tubes are often filled with calcified pleurocapsalean cyanobacteria or tubes of younger generation of nubecullinids. Sample 9, station 7, depth 7 m; scale bar = 200 pm Phase contrast photomicrograph of living aggregate of pleurocapsalean cyanobacteria from the reef surface (arrowed). Sample 9, station 7, depth 7 m; scale bar = I0 I.tm Organically preserved remnants of the pleurocapsalean sheaths (glycocalyx) from the silicified part of the clotty layer shown in (P1.5/4); scale bar = 10 pm
P l a t e 5 19
20
se are (from the top): 1. the cyanobacterial-red algal zone, 2. the peloidal zone, and 3. the stromatolitic-siphonocladalean zor le .
The cyanobacterial-red algal zone At the first few millimeters below the surface the skeletal
framework is composed of biota identical to those living on the reef surface, i.e., mainly thalli of Lithoporella alternating with thin layers of calcified sheaths of pleurocapsalean cyanobacteria (PI. 4/5, layer a). The next 2-3 mm of the reef section are built of a dense layer composed of Peyssonnelia thalli alternating with thin films of calcified pleurocapsalean cyanobacteria (P1.4/5, layer b). Below, a 2-4 mm thick layer of weakly translucent thrombolitic (clotty) limestone occurs which is silicified at the top (PI. 4/5, layers c and d) and encloses in many places well-preserved remnants of pleurocapsalean sheaths (PI. 5/6). The thrombolitic layer passes into a broader zone composed of irregularly wrinkled or slightly arched foliaceous thalli of Peyssonnelia giving the reef structure a cystous appearance (see PI. 3/4, above the arrow). The zone is thicker at shallow water depths (0-5 m) where it attains 15-25 cm, and much thinner (3-4 cm) close to the O2/H2S interface. The arcuate sheets of the peyssonnelid algae, on the average 250-300 Ixm thick, are loosely attached to the substratum, overlapping and often curling back on themselves (PI. 4/5, layer e, 4/6 and 5/1). The cavities between the sheets are either empty or partially or entirely filled with internal sediment composed predominantly of clotty (peloid) micrite and sparry cement (P1.4/6 and 5/1). Some peyssonnelid thalli display hypobasal calcification in the form of botryoidal aragonite fringes, 100-250 I.tm thick, very similar to those described recently by JAMES et al. (1988) in Holocene peyssonnelid algae from the Bahamas. The h ypoba sal aragonite in peys so nnelids and other coral lines has been interpreted as syngenetic and probably the product
of metabolic activity of the algae (WAJ.x~ & Moss, 1984; JAMES et al., 1988; BOSF~CE, 1991). In the Satonda speci- mens, however, the botryoids usually replace micritic sed- iment evidently predating the hypobasal calcification. It seems therefore that the botryoids represent rather early diagenetic calcification (cf. ~ F ~ S S O N , 1974) evoked probably shortly after the death of the algae by microbial decomposition of the non -calcified hypobasal algalrhyzoids. The latter, in fact, have never been found preserved in the Satonda peyssonnelids.
The lowermost part of the mulitiered peyssonnelid canopies comprises a dense set of thalli forming a 2-5 mm thick band, distinctly separating thecyanobactefial-red algal zone from the underlying peloidal zone (Pls. 3/4 and 7/3).
The peloidal zone The lithology and biotic composition of this unit differs
significantly from the overlying cyanobacterial-red algal limestone described above. The sharp contact between the two zones has a discontinuous character (Pls. 3/4 and 7/3, marked by arrows). This discontinuity can probably be attributed to a rapid change in Satonda Lake chemistry caused by the eruption of the nearby Tambora Volcano in 1815 (ashfall). The zone attains an average thickness of 15- 20 cm and passes downward continuously into the stroma- tolitic-siphonocladalean zone. The lower boundary of the peloidal zone has been arbitrarily placed at the level where the first stromatolitic (microlaminated) structures appear abundantly and the reef changes from a highly porous and brittle to a massive and hard structure.
The porous sediment is composed mainly of micritic peloids 30-250 jam in size with a significant contribution of thrombolitic micrite in places. The peloids are not well- sorted but are sometimes graded and form micritic laminae. Many of the peloids are surrounded by rims of structureless
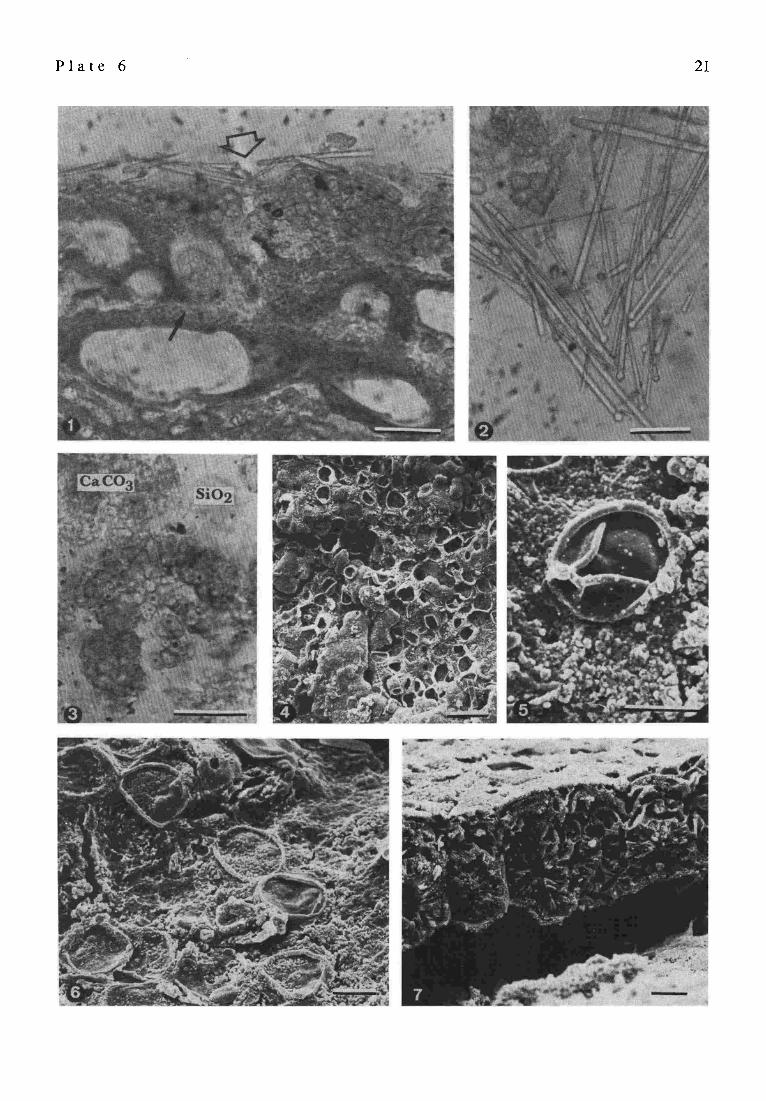
P l a t e 6
Fig. 1.
Fig. 2.
Fig. 3.
Fig. 4.
Fig. 5.
Fig. 6.
Fig. 7.
Red algae, sponge spicules and coccoidal cyanobacteria of the stromatolites, Satonda Crater Lake, Indonesia, October 1986.
Vertical section of the living surface of the calcareous crust built of coraMnacean (Lithoporella sp.) and squamariacean (Peyssonnelia sp.) red algae intercalating with calcareous tubes of nubecullinid foraminifers visible in cross-sections as variously sized cysts (thin arrow). The cyanobacterial-red algal-nubecullinid community is associated with large population of monaxonid demosponges (Suberites sp.) which spicules cover in many places the living surface (bold arrow). Sample 8, station 7, depth 6 m; scale bar = 50 pan A bunch of monaxonic spicules (tylostyles) of Suberites sp. (Demospongiae) associated with the reef-forming cyanobacterial-red algal community. Sample same as above; scale bar = 50 Jam Magnified section of (Fig. 1) showing remnants of pleurocapsalean sheaths preserved due to early post mortem silicification; scale bar = 30 txm SEM picture of soft and calcified pleurocapsalean capsules from the desiccated surface of the living cyanobacterial-red algal crust in a top view. Sample 11, station 7, depth 9 m; scale bar = 30 lam SEM picture ofa multiple fissioned pleurocapsalean cell aggregate from the living surface of the cyanobacterial- red algal calcareous crust in a top view (desiccated specimen). Note the microgranular character of the high Mg calcite permineralizing the cyanobacterial sheaths. Sample 11, station 7, depth 9 m; scale bar = 10 lam SEM picture showing various degrees of calcification of desiccated pleurocapsalean capsules from the living surface of the cyanobacterial-red algal calcareous crust in a top view; scale bar = 10 ~ n SEM picture of cross-fractured surficial portion of the cyanobacterial-red algal zone (for a top view of the same see Fig. 4). The top layer is built of calcified pleurocapsalean sheaths encrusting a monostromatous thallus of strongly calcified corallinacean alga Lithoporella sp. Sample 10, station 7, depth 9 m; scale bar = 10 I.tm
P l a t e 6 21
22
sparry calcite 15-25 ~rn thick. Calcified ellipsoidal to fusiform fecal pellets of cerithiid gastropods, up to 800 lain in length, are also present and may in places occur in dense accumulations (P1.7/3). Shells of the gastropods are often found immurated in the peloid sediment. Some of them are encrusted by thin layers of stromatolitic sediment. Some larger peloids and part of the gastropod fecal pellets are silicified. The silicification may be complete or is limited only to the outer part of the grains (PI. 7/4). Skeletal grains associated with the peloids include foraminifers (miliolids and undetermined uniserial textularids), ostracods and tiny serpulids.
Peloidal sediments similar to those from Satonda Lake are present in carbonate build-ups of a variety of ages. They may occur as internal sediments and in open spaces between reef frame builders (e.g., PALMER & Ft~sIcn, 1981; K~BS, 1974; S~mER & WtrgM, 1980; D~PJO et al., 1981; REID, 1987; REID et al., 1990). It is uncertain whether the genesis of peloids was inorganic or organically induced. Hetero- trophic bacteria have been recently suggested as possible precipitating agents (C~IAFWr'Z, 1986). Association of some silicified Satonda Lake peloids with remnants of coccoid pleurocapsalean cyanobacteria suggests that they may represent decomposed and diagenetically altered aggregates of calcified coccoid cyanobacteria, i.e., microbial structures closely related to in situ calcified cyanobacterial stmmatolites. This suggestion needs to be supported by further detailed studies.
The stromatolitic-siphonocladalean zone This zone comprises the bulk of the Satonda Lake reef
framework and directly overlies the lava substratum. Its thickness varies considerably with lake depth, attaining 50-
80 cm near the lake surface and only 2-5 cm close to the reef base.
The rock is composed of variously sized, elongated and irregularly twisted microlaminated bodies densely intergrown to form a massive calcareous structure. Small spaces between the laminated bodies are filled with clotty micrite or they remain empty (PI. 7/6),
The central part of each microlaminated body is occupied mostly by one, rarely by two or three empty cylindrical tubes not adhering to each other, attaining 90-220 pan in diameter (PI. 7/6-7). The tubes are, as a rule, equidimensional with occasional constrictions and scarce lateral branches. The size and shape of the tubular structures leaves little doubt that they represent remnants (moulds) of siphonocladalean green algae and are essentially similar to filaments of Cladophoropsis associated with the living reef surface. Similar to the living Cladophoropsis the tubular structures are most densely distributed in the microlaminated rock which has been formed in shallow water. The distribution density of the tubes decreases apparently with depth. Below 10 m they are lacking and the rock is composed exclusively of microlaminated columns and nodules of various sizes. The mostly central position of the algal tubes in the microlaminated structures indicates that the siphonocladalean filaments formed originally the growth base for the calcareous encrustations. After decay they left the empty tubes behind.
The laminated deposits surrounding the siphonocladalean tubes are clearly of microbial, i.e., stromatolitic origin. Since the individual stromatolites are not visible to the unaided eye they can be classified as microstromatolites ( H o ~ , 1969). Their texture is in optical micrographs defined by alternating dark-light couplets ofmicritic and sparitic laminae (P1.7/6-7). The dark laminae are thinner (15-50 ~n) than
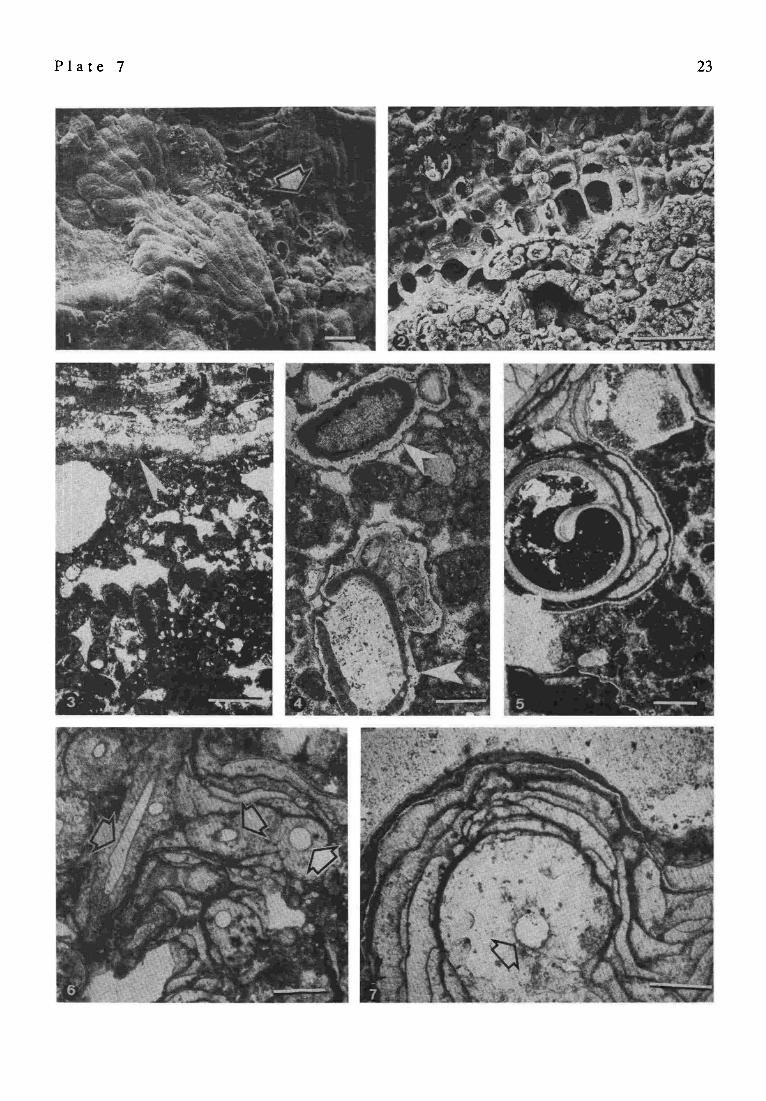
P l a t e 7
Fig. 1.
Fig. 2.
Fig. 3.
Fig. 4. Fig. 5.
Fig. 6.
Fig. 7.
Cyanobacterial-red algal zone, peloidal zone and stromatolitic-siphonocladalean zone of stromatolites, Satonda Crater Lake, Indonesia, October 1986.
SEM picture of the single-layered thalli ofLithoporella sp. from the living surface of the cyanobacterial-red algal zone in a top view (desiccated specimen). Attached to Lithoporella are shrunken capsules of uncalcified pleurocapsalean cyanobacterial (arrowed). Sample 29, station 17, depth 23 m; scale bar = 30 ~trn SEM picture (EDTA etched cross-fracture) of the cyanobacterial-red algal zone close to the living surface. Clearly visible is the difference between the cells of the crustose squamariacean alga Peyssonnelia sp. permineralized with aragonite and the pleurocapsalean cell aggregates permineralized with dense, microgmnular high Mg calcite. Sample 8a, station 7, depth 6 m; scale bar = 30 t.tm Vertical section through the subsurficial portion of the calcareous reef showing the sharp boundary (arrowed) between the cyanobacterial-red algal zone and the underlying peloidal zone enclosing numerous fecal pellets of cerithiid gastropods. For macroscopic photograph of the boundary between the two units see PI. 3/4. Sample 29, station 17, depth 23 m; scale bar = 500 ~m Examples of silicified peloids (arrowed) from the peloidal zone shown in Fig. 3; scale bar = 200 lain Fragment of the peloidal zone with section of an immurated shell of cerithiid gastropod covered by a few stromatolitic layers. Sample 8, station 7, depth 7 m; scale bar -- 500 lam Thin section of the stromatolitic-siphonocladalean zone of the reef framework. The massive rock is built almost exclusively of stromatolitic layers; their complex configuration is due to various calcifications of subsequent coccoid cyanobacterial layers overgrowing filaments of now decayed siphonocladalean green algae (some of them are arrowed). Sample 47, station 10, above water mark; scale bar = 500 lma Magnified fragment of the same as above to show the subcystose pattern of the stromatolitic structure in vertical section. Arrow indicates cross-section of a filament of green algae forming the basis for the cyanobacterial growth; scale bar = 200 ~Jn
P l a t e 7 23
24
the light ones (20-300 grn). They display subparallel to subcystose or cystose arrangement (PI. 7/7) and are often gathered in sets separated by thicker light bands. Pillar- and column-shaped micritic structures occur sometimes at junctions between neighboring cysts. The texture of the Satonda microstromatolites is remarkably similar to internal patterns observed in vertical thin sections of, e.g., Lower Proterozoic stromatolites (subcystose patterns; see WALTEa, 1983, photo 8-11), certain Ordovician and Lower Carbon- iferous stromatoporoid stromatolites (cystose to subclathrate patterns; see GALLOWAY, 1961; DONe, 1964), and Quaternary lacustrine stromatolites (subparallel to subeystose patterns; see CASANOVA, 1987; Hn.T AIRE-MARc~L & CASANOVA, 1987), or even Paleozoic biostructures known as Wetheredella WooD, 1948, and related problematic fossils. We have addressed this questions in two separatepapers (KAzMIERCZAK & K~MPE, 1990, 1992).
SEM analyses revealed that the dark and light laminae differ sharply both in their microstructural and mineralogical characters. SEM pictures and EDAX mapping of etched sections show that the dark laminae have an irregular porous microstructure and are composed of microgranular high Mg calcite, whereas the light ones are compact and built of fibrous aragonite (P1.2/8-9; P1. 8/1-2, 4).
The remnants of the original microbial community generating the stromatolitic structures are recognizable in the dark as well as in the light laminae. They are much better preserved in the dark laminae, where they occur as patchy to semicontinuous clusters of coccoid microfossils which can be easily identified as CaCO 3 permineralized capsules (sheaths) or moulds of capsules of pleurocapsalean cyanobacteria. Very similar, if not identical, capsules have been described from other modern and fossil stromatolites (e.g., HORODYSKI & VOND~ HAAR, 1975; KRUMaEnq & Gmt~, 1979; KAZMI~CZAK & K~UMaEn~, 1983; BRArmwArrE et al., 1989). In the light laminae the remains of the original pleuro- capsalean cyanobacteria are occasionally preserved in the aragonitic matrix as indistinct patches of former cell
aggregates (P1.8/2) or residues of the outer common sheaths (glycocalyx) which surround the cell aggregates during life (PI. 8/6). Careful etchings with EDTA demonstrate that traces of a continuous mass of coccoid aggregates can be detected throughoutthe aragonitic layers. They are visible as shallow, roundish depressions etched within the horizontally striated aragonitic background (PI. 8/4-5). The size and mode of distribution of these depressions correspond exactly with the well preserved pleurocapsalean aggregates from the dark laminae. This permits the conclusion that the entire microstromatolitic structure was produced by the same kind of cyanobacteria and that the final textural, microstructural, and mineralogical differences expressed in the micro- stromatolites were to a large extent controlled by abiotic environmental factors.
It seems that two basically different calcification processes of the coccoid cyanobacterial mat were involved in the formation of the microsllomatolites. The dark calcitic laminae originated most probably as the result of rapid in vivo calcification of the coccoid mat surface. The fast calcification was presumably the crucial factor enhancing the relatively good preservation of the microbiota noticed in the dark laminae. The microgranular calcite permineralizing of the coccoids in the dark laminae is identical to that covering the living cyanobacteria today. The light aragonitic laminae, in turn, appear to be the product of early diagenetic (early post mortem) calcification of the subsurface masses of coccoid cells which, due to periodic formation of the in vivo calcified surficial cell layers, have been closed in cryptic micro- environments where they underwent microbial decom- position and concomitant permineralization by aragonite. Thread-like bodies occurring in some aragonitic laminae of the Satonda microstromatolites which are reminiscent of sheaths of sulfur bacteria or flexibacteria seem to support such an interpretation. Calcification processes in decaying cyanobacterial mats evoked by bacterial degradation (mostly sulfate reducers) below the zone of photosynthesis have been recently advanced as major factor in CaCO 3 formation
P l a t e 8
Fig. 1.
Fig. 2.
Fig. 3.
Fig. 4.
Fig. 5. Fig. 6.
Details of the structure of the stromatolitic-siphonocladalean zone of the Satonda Crater Lake stromatolites, Indonesia, October 1986.
Vertical section through the stromatolitic-siphonocladalean zone of the Satonda Crater Lake calcareous reef in transmitted light. The light layers are composed of aragonite and the much thinner dark layers of high Mg calcite. Sample 47, station 10, above water table; scale bar = 100 grn SEM picture of (Fig. 1) (formic acid etched vertical section) showing the sharp textural difference between the fibrous aragonitic layer and the spongy high Mg calcitic layer the basal part of which is slighdy silicified. Arrow indicates a remnant of strongly obliterated pleurocapsalean aggregate preserved within the aragonitic layer; scale bar = 10 txm SEM picture of formic acid etched, vertical section showing remnant of a pleurocapsalean cell aggregate as shown in Fig 1 from the dark high Mg calcitic layer surrounded by the remains of the common mucus sheath; scale bar = 10 gin SEM picture (EDTA etched, vertical section) of the finely striated aragonitic layer figured in(Fig. 1; the numerous etching depressions represent traces of early post mortem decomposed pleurocapsalean aggregates; scale bar = 30 grn A magnified, formic acid etched fragment of Fig. 4; scale bar = 10 grn SEM picture (EDTA etched, vertical section) of the aragonitic stromatolitic layer with organically preserved remnants of the outer common sheaths of pleurocapsalean cell aggregates (glycocalyx) preserved within the early diagenetic fibrous aragonite; scale bar = 30 grn
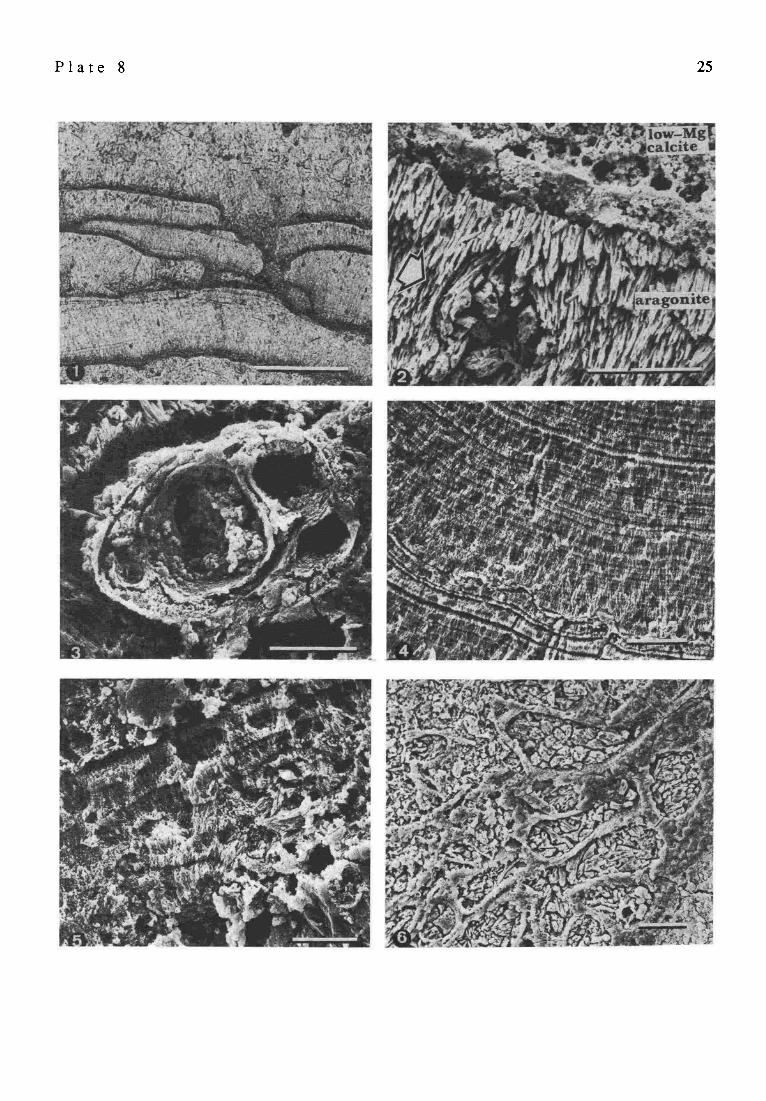
P l a t e 8 25
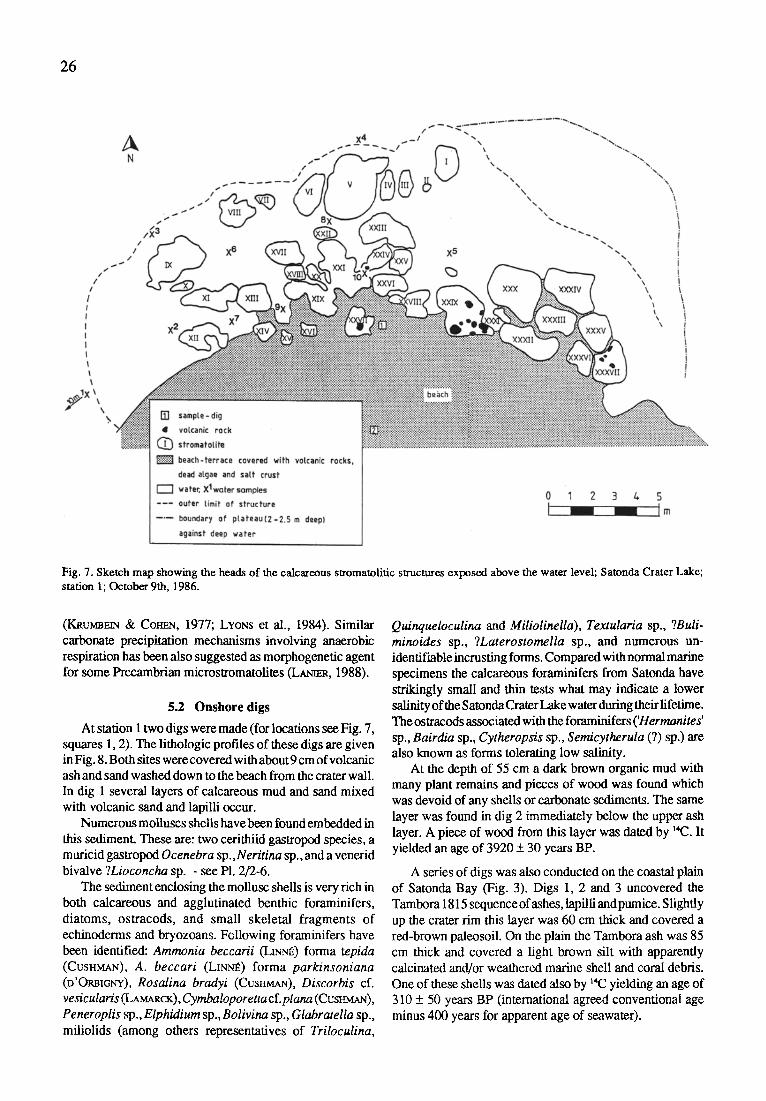
26
Fig. 7. Sketch map showing the heads of the calcareous stromatolitic structures exposed above the water level; Satonda Crater Lake; station 1; October 9th, 1986.
(KRur, mEtN & COHEN, 1977; LYONS et al., 1984). Similar carbonate precipitation mechanisms involving anaerobic respiration has been also suggested as morphogenetic agent for some Precambrian microstromatolites (LANmR, 1988).
5.2 Onshore digs
At station 1 two digs were made (for locations see Fig. 7, squares 1, 2). The lithologic profiles of these digs are given in Fig. 8. Both sites were covered with about 9 cm of volcanic ash and sand washed down to the beach from the crater wall. In dig 1 several layers of calcareous mud and sand mixed with volcanic sand and lapilli occur.
Numerous molluscs shells havebeen found embedded in this sediment. These are: two cerithiid gastropod species, a muricid gastropod Ocenebra sp., Neritina sp., and a venerid bivalve ?Lioconcha sp. - see PI. 2/2-6.
The sediment enclosing the mollusc shells is very rich in both calcareous and agglutinated benthic foraminifers, diatoms, ostracods, and small skeletal fragments of echinoderms and bryozoans. Following foraminifers have been identified: Ammonia beccarii (LIN~) forma tepida (CUSHMAN), A. beccari (LINN~) forma parkinsoniana (D'ORBICr,rY), Rosalina bradyi (CusHMAN), Discorbis cf. ve sic ularis (LAMARCK ), Cymba lopor etta cf.plana (CusI-tMAN), Peneroplis sp., Elphidium sp., Bolivina sp., Glabratella sp., miliolids (among others representatives of Triloculina,
Quinqueloculina and Miliolinella), Textularia sp., ?Buli- minoides sp., ?Laterostomella sp., and numerous un- identifiable incrusting forms. Compared with normal marine specimens the calcareous foraminifers from Satonda have strikingly small and thin tests what may indicate a lower salinity of the Satonda Crater Lake water during their lifetime. The ostracods associated with the foraminifers ('Hermanites' sp., Bairdia sp., Cytheropsis sp., Semicytherula (?) sp.) are also known as forms tolerating low salinity.
At the depth of 55 cm a dark brown organic mud with many plant remains and pieces of wood was found which was devoid of any shells or carbonate sediments. The same layer was found in dig 2 immediately below the upper ash layer. A piece of wood from this layer was dated by "C. It yielded an age of 3920 + 30 years BP.
A series of digs was also conducted on the coastal plain of Satonda Bay (Fig. 3). Digs 1, 2 and 3 uncovered the Tambora 1815 sequenceofashes, lapilli andpumice. Slightly up the crater rim this layer was 60 cm thick and covered a red-brown paleosoil. On the plain the Tambora ash was 85 cm thick and covered a light brown silt with apparently calcinated and/or weathered marine shell and coral debris. One of these shells was dated also by ~4C yielding an age of 310 + 50 years BP (international agreed conventional age minus 400 years for apparent age of seawater).
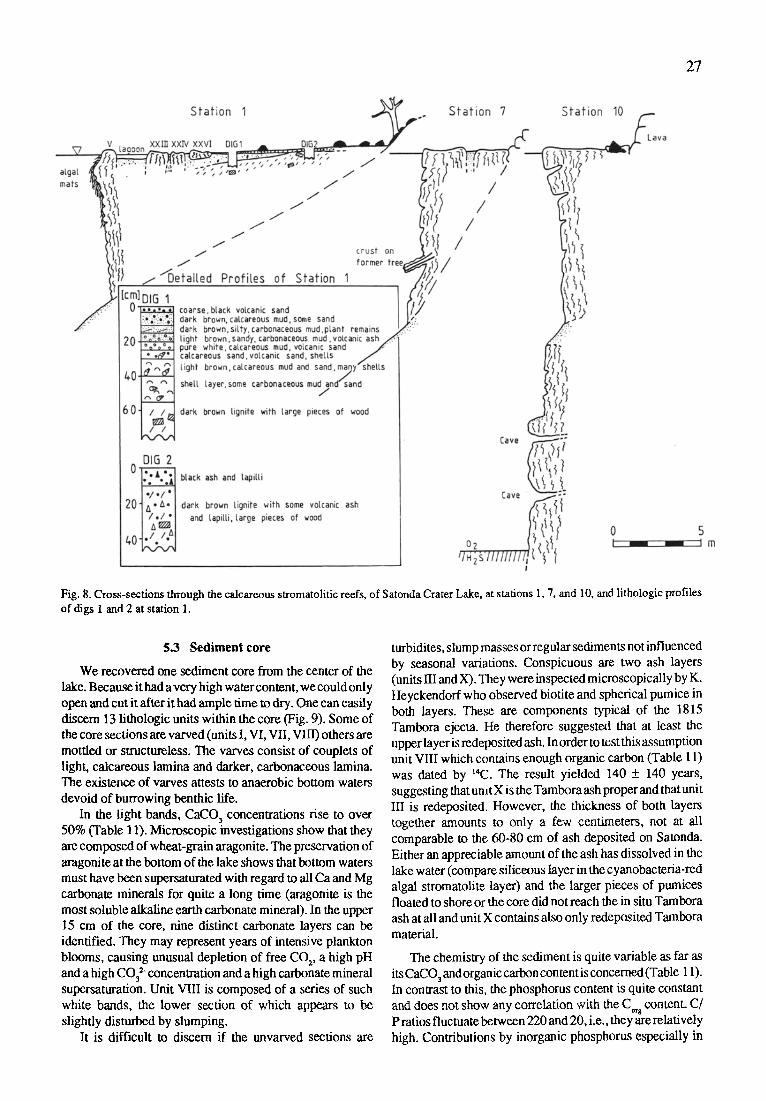
27
Fig. 8. Cross-sections through the calcareous stromatolitic reefs, of Satonda Crater Lake, at stations 1, 7, and 10, and lithologic profiles of digs 1 and 2 at station 1.
5.3 S e d i m e n t core
We recovered one sediment core from the center of the lake. Because it had a very high water content, we could only open and cut it after it had ample time to dry. One can easily discern 13 lithologic units within the core (Fig. 9). Some of the core sections are varved (units I, VI, VII, VIII) others are mottled or structureless. The varves consist of couplets of light, calcareous lamina and darker, carbonaceous lamina. The existence of varves attests to anaerobic bottom waters devoid of burrowing benthic life.
In the light bands, CaCO 3 concen~ations rise to over 50% (Table 11). Microscopic investigations show that they are composed of wheat-grain aragonite. The preservation of amgonite at the bottom of the lake shows that bottom waters must have been supersaturated with regard to all Ca and Mg carbonate minerals for quite a long time (aragonite is the most soluble alkaline earth carbonate mineral). In the upper 15 cm of the core, nine distinct carbonate layers can be identified. They may represent years of intensive plankton blooms, causing unusual depletion of free CO v a high pH and a high CO3 ~ concentration and a high carbonate mineral supersaturation. Unit VIII is composed of a series of such white bands, the lower section of which appears to be slightly disturbed by slumping.
It is difficult to discern if the unvarved sections are
turbidites, slump masses or regular sediments not influenced by seasonal variations. Conspicuous are two ash layers (units III and X). They were inspected microscopically by K. Heyckendorf who observed biotite and spherical pumice in both layers. These are components typical of the 1815 Tambora ejecta. He therefore suggested that at least the upper layer is redeposited ash. In order to test this assumption unit VIII which contains enough organic carbon (Table 11) was dated by '4C. The result yielded 140 + 140 years, suggesting that unitX is the Tambora ash proper and that unit III is redeposited. However, the thickness of both layers together amounts to only a few centimeters, not at all comparable to the 60-80 cm of ash deposited on Satonda. Either an appreciable amount of the ash has dissolved in the lake water (compare siliceous layer in the cyanobacteria-red algal stromatolite layer) and the larger pieces of pumices floated to shore or the core did not reach the in situ Tambora ash at all and unit X contains also only redeposited Tambora material.
The chemistry of the sediment is quite variable as far as itsCaCO3andorganiccarbon contentis concerned(Table 11). In contrast to this, the phosphorus content is quite constant and does not show any correlation with the C 8 content. C/ P ratios fluctuate between 220 and 20, i.e., they are relatively high. Contributions by inorganic phosphorus especially in
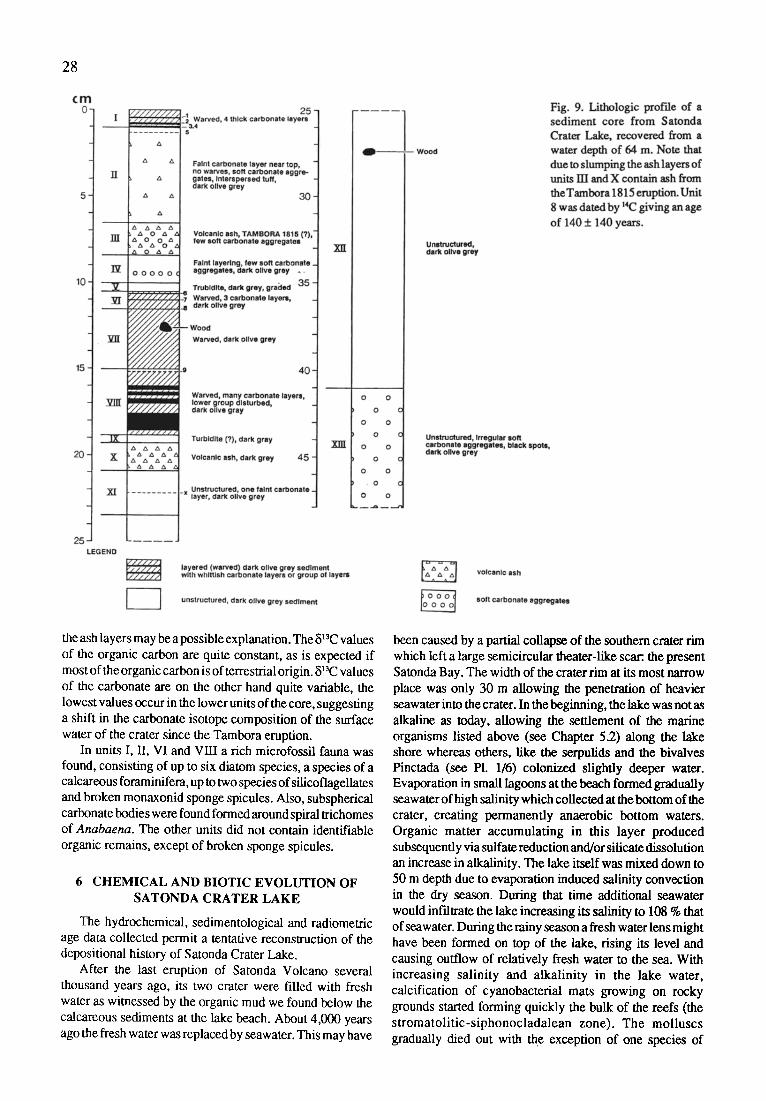
28
the ash layers may be a possible explanation. The 8~3C values of the organic carbon are quite constant, as is expected if most of the organic carbon is of terrestrial origin. 513C values of the carbonate are on the other hand quite variable, the lowest values occur in the lower units of the core, suggesting a shift in the carbonate isotope composition of the surface water of the crater since the Tambora eruption.
In units I, I/, VI and VIII a rich microfossil fauna was found, consisting of up to six diatom species, a species of a calcareous foraminifera, up to two species of silicoflagellates and broken monaxonid sponge spicules. Also, subspherical carbonate bodies were found formed around spiral trichomes of Anabaena. The other units did not contain identifiable organic remains, except of broken sponge spicules.
6 CHEMICAL AND BIOTIC EVOLUTION OF SATONDA CRATER LAKE
The hydrochemical, sedimentological and radiometric age data collected permit a tentative reconstruction of the depositional history of Satonda Crater Lake.
After the last eruption of Satonda Volcano several thousand years ago, its two crater were filled with fresh water as witnessed by the organic mud we found below the calcareous sediments at the lake beach. About 4,000 years ago the fresh water was replaced by seawater. This may have
been caused by a partial collapse of the southern crater rim which left a large semicircular theater-like scar:, the present Satonda Bay. The width of the crater rim at its most narrow place was only 30 m allowing the penetration of heavier seawater into the crater. In the beginning, the lake was not as alkaline as today, allowing the settlement of the marine organisms listed above (see Chapter 5.2) along the lake shore whereas others, like the serpulids and the bivalves Pinctada (see PI. 1/6) colonized slightly deeper water. Evaporation in small lagoons at the beach formed gradnally seawater of high salinity which collected at the bottom of the crater, creating permanently anaerobic bottom waters. Organic matter accumulating in this layer produced subsequently via sulfate reduction and/or silicate dissolution an increase in alkalinity. The lake itself was mixed down to 50 m depth due to evaporation induced salinity convection in the dry season. During that time additional seawater would inf'dtrate the lake increasing its salinity to 108 % that of seawater. During the rainy season a fresh water lens might have been formed on top of the lake, rising its level and causing outflow of relatively fresh water to the sea. With increasing salinity and alkalinity in the lake water, calcification of cyanobacterial mats growing on rocky grounds started forming quickly the bulk of the reefs (the stromatolitic-siphonocladalean zone). The molluscs gradually died out with the exception of one species of
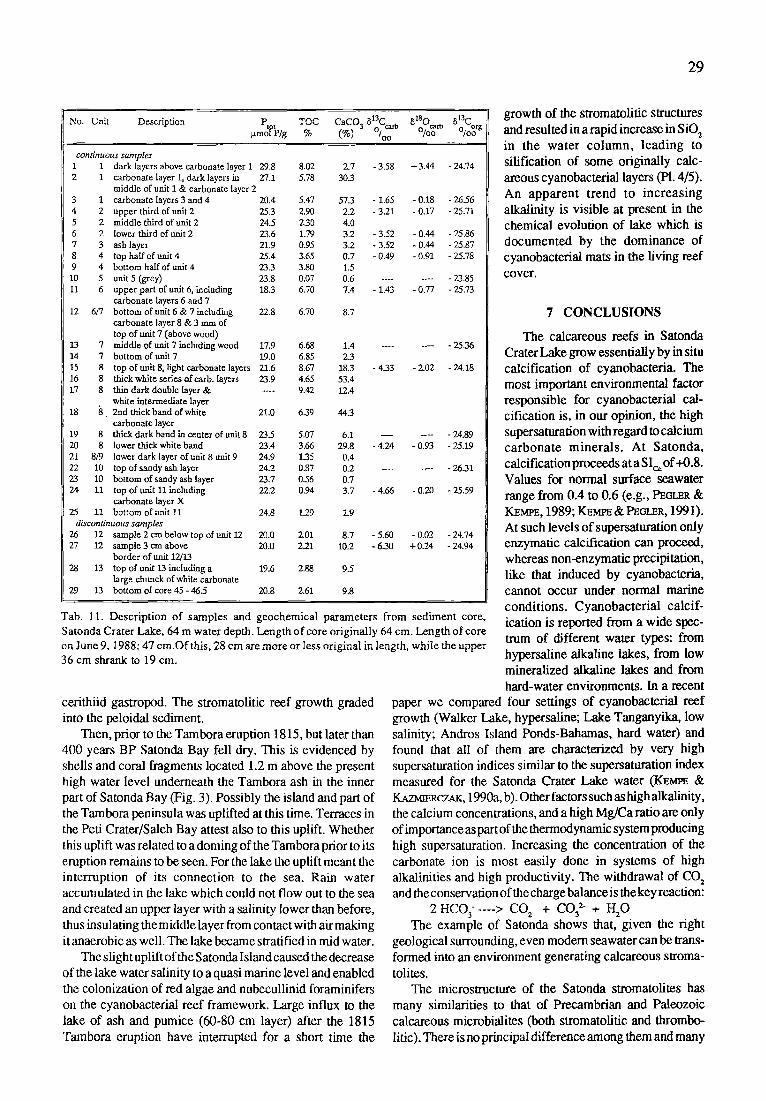
29
lazn~i ~ T O C C a C O 3 813Ccaeo 8180 [~t3c No. u n i t Deseri~,tion i'/g ~ (~) ~ % ~ %~r
continuous samples 1 1 dark layers above carbonate layer 1 29.8 8.02 2.7 - 3.58 + 3.44 - 24.74 2 1 carbonate layer 1, dark layers in 27.1 5.78 30.3
middle of unit 1 & carbonate layer 2 3 1 carbonate layers 3 and 4 20.4 5.47 57.3 - 1.65 - 0.18 - 26.56 4 2 upper third of unit 2 25.3 2.90 2.2 - 3.21 - 0.17 - 25.71 5 2 middle third of unit 2 24.5 230 4.0 6 2 lower third of unit 2 23.6 1.79 3.2 - 3.52 - 0.44 - 25.86 7 3 ash layer 21.9 0.95 3.2 - 3.52 - 0.44 - 25.87 8 4 top half of unit 4 25.4 3.65 0.7 - 0.49 - 0.91 - 25.78 9 4 bo t tom half of unit 4 23.3 3.80 1.5 10 5 unit 5 (grey) 23.8 0.07 0.6 . . . . . . . . . 23.85 11 6 upper par t of unit 6, including 18.3 6.70 7.4 - 1.43 - 0.77 - 25.73
carbonate layers 6 and 7 12 6/7 bot tom of unit 6 & 7 including 22.8 6.70 8.7
carbonate layer 8 & 3 m m of top of unit 7 (above wood)
13 7 middle of unit 7 including wood 17.9 6.68 1.4 . . . . . . . 25.36 14 7 bot tom of unit 7 19.0 6.85 2 3 15 8 top of unit 8, light carbonate layers 21.6 8.67 18.3 - 4.33 - 2.02 - 24.18 16 8 thick white series of carb. layers 23.9 4.65 53.4 17 8 thin da rk double layer & . . . . 9.42 12.4
white in termediate layer 18 8 2nd thick band of white 21.0 6.39 44.3
carbonate layer 19 8 thick dark band in center of unit 8 23.5 5.07 6.1 . . . . . . 24.89 20 8 lower thick white band 23.4 3.66 29.8 - 4.24 - 0.93 - 25.19 21 8/9 lower dark layer of unit 8 unit 9 24.9 1.35 0.4 22 10 top of sandy ash layer 24.2 0.87 0.2 . . . . . . . 26.31 23 10 bot tom of sandy ash layer 23.7 0.56 0.7 24 11 top of unit 11 including 22.2 0.94 3.7 - 4.66 - 0.20 - 25.59
carbonate layer X 25 11 bot tom of unit 11 24.8 1.29 1.9
discontinuous samples 26 12 sample 2 cm below top of trait 12 20.0 2.01 8.7 27 12 sample 3 cm above 20.0 2.21 10.2
border of unit 12/13 28 13 top of unit 13 including a 19.6 2.88 9.5
large ehtmck of white carbonate 29 13 bot tom of core 45 - 46.5 20.8 2.61 9.8
- 5.60 - 0.02 - 24.74 - 6.30 + 0.24 - 24.94
Tab. 11. Description of samples and geochemical parameters from sediment core, Satonda Crater Lake, 64 m water depth. Length o f core originally 64 cm. Length of core on June 9, 1988:47 cm.Of this, 28 cm are more or less original in length, while the upper 36 cm shrank to 19 cm.
cerithiid gastropod. The stromatolitic reef growth graded into the peloidal sediment.
Then, prior to the Tambora eruption 1815, but later than 400 years BP Satonda Bay fell dry. This is evidenced by shells and coral fragments located 1.2 m above the present high water level underneath the Tambora ash in the inner part of Satonda Bay (Fig. 3). Possibly the island and part of the Tambora peninsula was uplifted at this time. Terraces in the Peti Crater/Saleh Bay attest also to this uplift. Whether this uplift was related to a doming of the Tambora prior to its eruption remains to be seen. For the lake the uplift meant the interruption of its connection to the sea. Rain water accumulated in the lake which could not flow out to the sea and created an upper layer with a salinity lower than before, thus insulating the middle layer from contact with air making it anaerobic as well. The lake became stratified in mid water.
The slight uplift of the Satonda Island caused the decrease of the lake water salinity to a quasi marine level and enabled the colonization of red algae and nubecullinid foraminifers on the cyanobacterial reef framework. Large influx to the lake of ash and pumice (60-80 cm layer) after the 1815 Tambora eruption have interrupted for a short time the
growth of the stromatolitic structures and resulted in a rapid increase in S iO 2 in the water column, leading to silification of some originally calc- areous cyanobacterial layers (PI. 4/5). An apparent trend to increasing alkalinity is visible at present in the chemical evolution of lake which is documented by the dominance of cyanobacterial mats in the living reef cover.
7 CONCLUSIONS
The calcareous reefs in Satonda Crater Lake grow essentially by in situ calcification of cyanobacteria. The most important environmental factor responsible for cyanobacterial cal- cification is, in our opinion, the high supersaturation with regard to calcium carbonate minerals. At Satonda, calcification proceeds at a S Ic~ of +0.8. Values for normal surface seawater range from 0.4 to 0,6 (e.g., PEa_mR & K~Mr'E, 1989; KEM~ & PZOLER, 1991). At such levels of supersaturation only enzymatic calcification can proceed, whereas non-enzymatic precipitation, like that induced by cyanobacteria, cannot occur under normal marine conditions. Cyanobacterial calcif- ication is reported from a wide spec- trum of different water types: from hypersaline alkaline lakes, from low mineralized alkaline lakes and from hard-water environments. In a recent
paper we compared four settings of cyanobacterial reef growth (Walker Lake, hypersaline; Lake Tanganyika, low salinity; Andros Island Ponds-Bahamas, hard water) and found that all of them are characterized by very high supersaturation indices similar to the supersaturation index measured for the Satonda Crater Lake water (KEM~ & KAZMIERCZAK, 1990a, b). Other factors such as high alkalinity, the calcium concentrations, and a high Mg/Ca ratio are only of importance as part of the thermodynamic system producing high supersaturation. Increasing the concentration of the carbonate ion is most easily done in systems of high alkalinities and high productivity. The withdrawal of CO 2 and the conservation of the charge balance is the key reaction:
2 HCO 3- ----> CO 2 + CO3 ~ + H20 The example of Satonda shows that, given the right
geological surrounding, even modern seawater can be trans- formed into an environment generating calcareous stroma- tolites.
The microstlucture of the Satonda stromatolites has many similarities to that of Precambrian and Paleozoic calcareous microbialites (both stromatolitic and thrombo- litic). There is no principal difference among them and many
30
of our thin sections have identical matches in the fossil record. It is therefore plausible to conclude that the Pre- cambrian Ocean had a high carbonate mineral supersaturation and that it was most probably more alkaline than the sea of today. In a sense, Satonda is a big experimental vessel where Precambrian environmental conditions can be studied and where seemingly extinguished life styles have been recreated. The growth ofstromatolites is therefore a predictable feature and not a trick nature knew how to play a billion years ago and has forgotten in the meantime.
The results presented are definitely not the final word about Satonda. At best our conclusions can be tentative at this moment. Much needs to be learnt about the early phases of the reefs and their microstructure. Longer sediment cores could resolve the history of the last 4,000 years in greater detail and more isotopic measurements are needed to decipher thecomplex story of mass balances and isotopic fractionations not even touched upon in this study.
The role of cyanobacteria in the lake is also felt in the nutrient budget: the dominance of ammonia over nitrite and nitrate, the high N/P ratios in the dissolved nutrients and the low C/N ratios in the suspended matter. Nitrification seems to run high in the lake. Unusual for seawater is also the ability of the lake to maintain high DOC concentrations. Both the high ammonia and the high DOC concentrations could prove to be interesting details in a discussion of the chemistry of the cyanobacteria-dominated early ocean.
ACKNOWLEDGEMENTS
The investigations on Satonda would not have been possible without the full-hearted scientific support by the late Professor Egon T. Degens. From the beginning he was convinced that the carbonate deposits on the island were worthwhile to study, even though he has never seen the deposits himself. He shaped the Sonne 45 B cruise to give us a maximum in time and an optimum in logistic support for our investigations on Satonda.
The authors gratefully acknowledge the assistance by Gfinter Landmann, Andreas Lipp, Yusuf Surachman and Dwi Susanto during the field work. Without their physical efforts and their good humor the expedition would not have been successful. Professor How Kin Wong and Uwe Salge kindly interrupted their seismic studies aboard the R/V Sonne to assist us in mapping the crater lake. Analytical assistance was given to us by Prof. W. Mook, Groningen (813C, 81sO and a4C), by Dr. G. Liebezeit, Hamburg (nutrient chemistry) and by A. Reimer, Hamburg (AAS). Laboratory assistance was provided by M. Sternhagen and R. Koop. Their contributions are gratefully acknowledged. Special thanks are extended to Drs. Janina Szczechura, Danuta Peryt, and Waclaw Baluk, Warszawa, for helping in identification of molluscs and skeletal microbiota, and to Zbigniew Strak, Warszawa, for technical assistance. We are also indebted to the captain and crew of the R/V Sonne for help in transportation and for provisions. Thanks are also due to the manager of the Hotel Tambora and to the police at Calabai for their friendly reception and logistic help.
Financial support from the German Federal Ministry of
Research and Technology (Grant No 524 03R372/7) as well as from the Alexander von Humboldt Foundation to one of us O.K.) is greatly appreciated. The paper is a contribution to the IGCP Project No. 261 'Stromatolites'.
R E F E R E N C E S
ADEY) W.H. • MACINTYRE, I.G. (1973): Crustose coralline algae: A re-evaluation in the geological sciences. - Geol. Soc. Amer. Bull. 84, 883-904, Boulder
ALEXA~ERSSON, E.T. (1974): Carbonate cementation in coralline algal nodules in the Skagerrak, North Sea: Biochemical precipitation in tmdersaturated waters. - J. Sed. Petrol., 44, 7- 26, Tulsa
BARBER~, F., BIGIOC, OE~O, B., BOR~A~, A., CAVALLrN, A., Chore, R., EVA, C., GELMINL R., GIOROETYI, F., IACARINO, S., INN(XENTI, F., M ~ t a , G., Scorn, A., SLE.~O, D., SLIDRADJAT, A., & VILLA, I. (1983a): Magmatic evolution and structural meaning of the Island of Sumbawa, Indonesia. - IUGG Interdis. Syrup. Ham- burg August 15-27, 1983, Progr. Abstr. 1, 49, Hamburg
BARBERI, F., BIGIOGGERO, B., BIZOUARD, H. BOPdAN~, A., Clom, R., CLOCCHIA'VFI, R., INNO<Y_ma, F., & MARI/CELLI, G. (1983b): Tambora Volcano, Island of Sumbawa, Indonesia. - IUGG Interdis. Symp. Hamburg August 15-27, 1983, Progr. Abstr. 1, 48, Hamburg
BOSENCE. D.W.J. (1991): Coralline algae: mineralization, taxonomy, and paleoecology. - In: RIDINO, R. (ed.): Calcareous Algae and Stromatolites. - 98-113, Berlin (Springer)
BRArrHWArrE, C.J.R., CASANOVA, J., FREVERT, T. & WmTror~, B.A. (1989): Recent stromatolites in thelandlocked pools on Aldabra, western Indian Ocean. - Paleogeogr. Paleoclimat. Paleoecol. 69, 145-166, Amsterdam
BROECKEa, W.C. & PENO, T.-H. (1984): Tracers in the Sea.- Lamont - Doherty Geological Observatory, 690 pp, Palisades, N.Y.
CASANOVA, J. (1987): Stromatolites et hauts niveaux lacustres P16istoc6nes du bassin Natron-Magadi (Tanzanie-Kenya). - Sci. G6ol. Bull. 40, 135-153, Strasbourg
CHAFETZ, H.S. (1986): Maxine peloids: a product of bacterially induced precipitation of calcite. - J. Sed. Petrol. 56, 812-817, Tulsa
DABRIO, C.J., ESTEBAN, M. J.M. & MARTn~, J.M. (1981): The coral reef of Nijar, Messinian (Uppermost Miocene), Almerla Province, southeast Spain. - J. Sed. Petrol. 51,521-539, Tulsa
DONO, D.Y. (1964): Stromatoporoids from the early Carboniferous of Kwangsi and Kuiechow. - Acta Palaeont. Sinica 12, 280- 299, Nanking
EUOSTER, H. P. & HARDIn, L. A. (1978): Saline lakes. -In: LERMAN, A. (ed.): Lakes- Chemistry, Geology, Physics.- 237-293, New York (Springer)
FODEN, J. D. & VARNE, R. (1980): The petrology and tectonic setting of Quaternary-Recent volcanic centres of Lombok and Sumbawa, Sunda Arc.- Chem. Geol. 30, 201 - 226, Amsterdam.
GALLOWAY, ]'.J. (1961): Ordovician Stromatoporoidea of North America. - Bull. Amer. Paleont. 43, 5-102, Ithaka
GARRELS, R. M. & MACKENZIE, F. T. (1967): Origin of the chemical composition of some springs and lakes. - In: Equilibrium Concepts in Natural Water Systems. - Amer. Chem. Soc., Advances in Chemistry, 67, 222 - 242, Washington D.C.
GARR~'rr, P. (1970): Phanerozoic stromatolites: Non-competitive ecologic restriction by grazing and burrowing animals. - Science 169, 171-173, Washington D.C.
HAMILTON, W. (1974): Earthquake map of the Indonesian region. - U. S. Geol. Surv., Miscell. Invest. Ser. Map 1-875-C, scale 1:5,000,000, Washington D.C.
- - (1979): Tectonics of the Indonesian region. - U. S. Geol. Surv. Prof. Pap. 1078, Washington D.C.
HARDIn, L. A. & Eu~s~,, H. P. (1970): The evolution of closed- basin brines. - Mineral. Soc. Amer., Spec. Publ. 3, 273 - 290, Washington D.C.
31
I-~vogra, E.Y. (1972): Diatom succession in a core from Pickerel Lake, northeastern south Dakota. - Geol. Soc. Amer. Bull. 83, 157-172, Boulder
Hn~J~m~-M~c~, C. & CASANOVA, J. (1987): Isotopic hydrology and paleohydrology of the Magadi (Kenya) -Natron (Tanzania) basin during the late Quaternary. - Paleogeogr. Paleoclimat. Paleoecol. 58, 155-181, Amsterdam
H o ~ , H.J. (1969): Attributes of stromatolites. - Geol. Surv. Can. Pap. 69-35, 1-77, Ottawa
HORODYS~a, R.J. & V o ~ H ~ , S.P. (1975): Recent calcareous stromatolites fromLagunaMormona (Baja Califomia),Mexico. - J. Sed. Petrol. 45, 894-906, Tulsa
JAMES, N.P., WRA't, J.L. & G~sBtr~o, R.N. (1988): Calcification of encrusting aragonitic algae (Peyssormeliaceae): implications for the origin of late Paleozoic reefs and cements. - J. Sed. Petrol. 58, 291-303, Tulsa
~ C 7 . ~ K , J., ~ S., L ~ r D ~ , G., Ln~,, A., Sta~cro~.~, Y. & Sus~,'cro, D. (1986): Satonda excursion, trip report, 2 - 13 October, 1986. - In: Tambora Volcano, Cruise SO 45-B. - Interims Report to the BMF'I', 34 pp. (unpublished), Hamburg
~ c 7 _ . ~ , J. & I ~ , S. (1990): Modem cyanobacterial analogues of Paleozoic stromatoporoids. - Science 250, 1244- 1248, Washington, D.C.
- - & - - (1992): Recent cyanobacterial counterparts of Paleezoic Wetheredella and related problematic fossils. - Palaios 7, 294- 304, Tulsa
~ _ . ~ a c , J. & K ~ , W.E. (1983): Identification o f calcified coccoid cyanobacteria forming stromatoporoid stromatolites. - Lethaia 16, 207-215, Oslo
S. (1982): Valdivia Cruise, October 1981: Carbonate equilibria in the estuaries of Elbe, Weser, Ems and in the southem German Bight.- In: D~x~s, E.T. (ed.): Transport of Carbon and Minerals in Major World Rivers. Part 1. - Mitt. Geol.-Pal~nt. InsL Univ. Hamburg, SCOPE/UNEP, Spee. Vol., 52, 719-742, Hamburg
- - (1990): Alkalinity: The link between anaerobic basins and shallow water carbonates? - Naturwissenschaften 77,426-427.
K.~E, S. & D~3ENS, E. T. (1985): An early soda ocean? - Chem. Geol. 53, 95-108, Amsterdam
- - & - - (1986): Enthielt der urzeitliche Ozean Soda statt Koch- salz? - Spektrum der Wissenschaft 11, Weinheim.
K e ~ , S., ~ r . ~ , J. & D~zNs, E. T. (1989): The soda ocean concept and its bearing on biotic evolution. - In: CRICK, E. (ed.): Origin, Evolution and Modern Aspects of Biomineralization in Plants and Animals. - Proc. 5th Int. Symp. Biomineralization, Arlington, Texas, May, 1986). - 29~3, New York (Plenum Press)
K ~ e , S. & K~ava~cz~x, J. (1990a): Chemistry and s~omatolites of the sea-linked Satonda Crater Lake, Indonesia: A recent model for the Precambrian sea? - Chem. Geol. 81, 299-310, Amsterdam
- - & - - (1990b): Calcium carbonate supersaturation and the formation of in situ calcified stromatolites. - In: Irmrd~OT, V.A.,
S., MICH~.aS, W. & SPrrzY, A. (Eds.): Facets of / Modern Biogeochemistry. - Festschrift for E.T. Degens on occasion of his 60th birthday, 255-278, Berlin (Springer)
I4O~E, S. & P~t.m~, K. (1991): Sinks and sources of CO~ in coastal seas: the North See. - Tellus 43B, 224-235, Copenhagen
S., Dm~c~, A.-R., Lm~Tw~rr, G. & P ~ , ~ , A. (1991): Geochemical and structural aspects of the pycnocline in the Black Sea (R/V KNORR 134-8 leg 1, 1988). - In: IZD~, E. & MURRAY, J.W. (eds.): Black Sea Oceanography. - NATO Advanced Studies Institute Series C, Vol. 351, 89-110, Dordrecht (Kluwer)
K ~ E , S., ~ C Z A ~ , J., KONU~ T., L~rDM,~,n'~, G., l.m~, A. & It~N~_~, A. (1992): Mikrobialithe in alkalischen Seen - lebende Zeugen des Urozeans? - Spektrum der Wissenschaft 1, 14-15, Weinheim
Kt~G, G. CLAR~, M.A., COVn'TON, H.R. et al., (1987): The 1986 Lake Nyos gas disaster in Cameroon, West Africa.- Science
236, 169-175, Washington, D.C. KaEBs, W. (1974): Devonian carbonate complexes of Central
Europe. - In: L~o~'m, L.F. (ed.): Reefs in Time and Space. - Soc. Econ. Paleont. Miner. Spec. Pub. 18, 155-208, Tulsa
K R ~ , W.E. & Corms, Y. (1977): Primary production, mat formation and lithification: Contribution of oxygenic and facultative anoxygenic cyanobacteria. - In: FLOGN~, E. (ed.): Fossil Algae: Recent Results and Developments. - 37-56, Berlin (Springer)
KRtrMB~r~, W.E. & GmLE, C. (1979): Calcification in a coccoid cyanobacterium associated with the formation of desert stromatolites. - Sedimentology 26, 593-604, Oxford
LANIEr, W.P. (1988): Structure and morphogenesis of microstromatolites from the Transvaal Supergroup, South Africa. - J. Sod. Petrol. 58, 89-99, Tulsa
LYONS, W.B., LoNe, D.T., He,'~, M.E., GAtmErrE, H.E. & Am~s~or~Q, P.B. (1984): Calcification of cyanobacterial mats in Solar Lake, Sinai. - Geology 12, 623-626, Boulder
Mn I~RO, F.J. (1974): The physical chemistry of seawater.- Ann. Res. Earth Planet. Sci. 2, 101-150, Amsterdam
PALMER, T.I. & FORSlCH, F.T. ( 1981): Ecology of sponge reefs from the Upper Bathonian of Normandy. - Palaeontology 24, 1-25, Oxford
P r a ~ , K. & ~ S. (1988): The carbonate system of the North Sea: determination of alkalinity and TCO 2 and calculation of PCO a and Sire (spring 1986).- In: ~ S., LmB~Err, G., DETm.0~'% V. & H~..MS, U. (eds.): Biogeochemistry and Distribution of Suspended Matter in the North Sea and Implications to Fisheries Biology. - Mitt. Geol.-Pal~iont. Inst. Univ. Hamburg, SCOPE/UNEP Sonderbd., 65, 35-87, Ham- burg
REIn, R.P. (1987): Nonskeletal peloidal precipitates in Upper Triassic reefs, Yukon Territory (Canada). - J. Sed. Petrol. 57, 983-990, Tulsa
REIn, R.P., MAC~CrrPd~, I.G. & JAMES, N.P. (1990): Internal precipitation of microcrystalline carbonates: a fundamental problem for sedimentologists. - Sediment. Geol. 68, 163-170, Amsterdam
Rn~lcA, R., WA~nURy, J.B. & ST~,rmR, R.Y. (1981): Provisional generic assignments for cyanobacteria in pure culture. - In: S'r~.R, M.P. et al. (eds.): The Prokaryotes. - 247-256, Berlin (Springer)
SELF, S., R~n~o , M. R., N~"roN, M. S. & WOLF, J. A. (1984): Volcanological study of the great Tambora eruption in 1815.- Geology 12, 659 - 663, Boulder
Smtm3SSON, H. & C ~ Y , S. (1988): The far reach of Tambora. - Nat. Hist. 6/88, 67-73, New York
Sar~GF.R, T. & WtmM, D. (1980): Facies patterns of Upper Jurassic platform carbonates (Plassen Limestone, Northern Alps, Styria/ Austria). - Facies 2, 241-283, Erlangen
S ' r o ~ , H. & S T O ~ , E. (1979): The year without a summer. - Scient. Amer. 240, 134-140, New York
UP.EY, H. C. (1951 ): The origin and development of the Earth and other terrestrial planets. - Geochim. Cosmochim. Acta 1, 209 - 277, Oxford
W~I~.R, R. & Moss, B. (1984): Mode of attachment of six epilithic crustose Corallinaceae (Rhodophyta). - Phycologia, 23, 321- 329, Oxford
W~'mR, M.R. (1983): Archean stromatolites: evidence of the Earth's earliest benthos. - In: SCltOPF, J.W. (ed.): Earth's Earliest Biosphere.- 187-213, Princeton (Univ. Press)
WAt.~, M.R. & l-IEYs, G.R. (1985): Links between the rise of the Metazoa and the decline of stromatolites. - Precambrian Res. 29, 149-174, Amsterdam
WIGLEY, T.M.L. & P L ~ , L.N. (1976): Mixing of carbonate waters.- Geochim. Cosmochim. Acta 40, 989-995, Oxford
WRAY, J.L. (1977): Calcareous Algae. - 185 pp., Amsterdam (Elsevier)
Manuscript accepted January 16, 1993


