Embed Size (px)
Citation preview
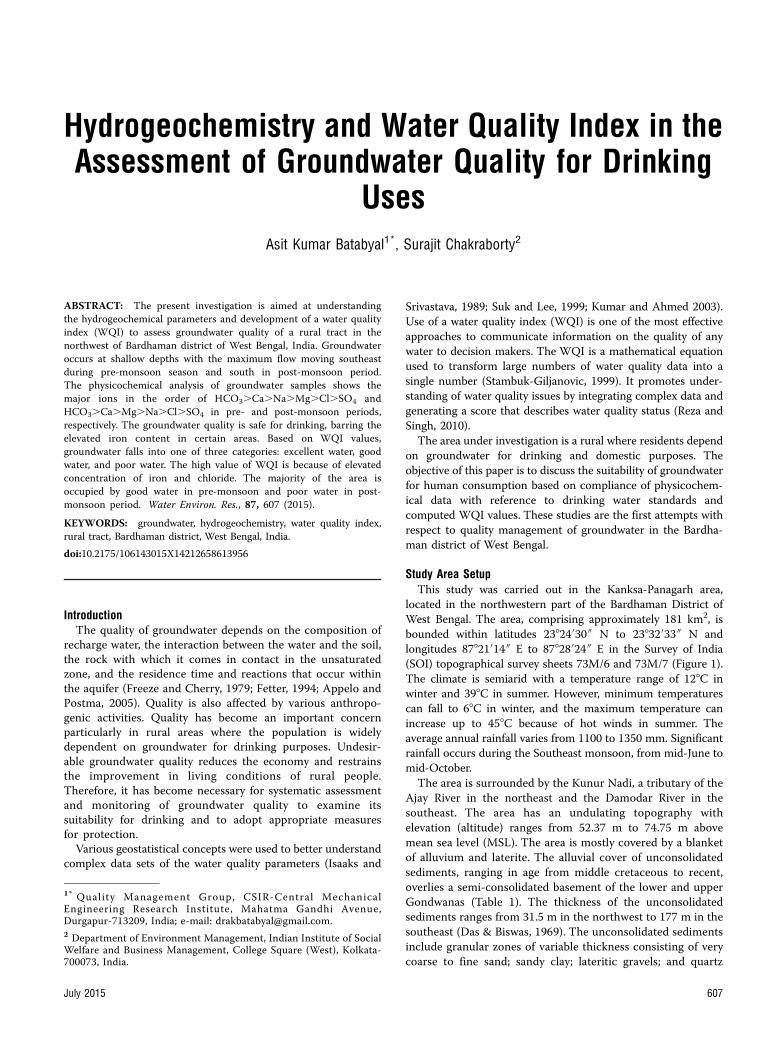
Hydrogeochemistry and Water Quality Index in theAssessment of Groundwater Quality for Drinking
UsesAsit Kumar Batabyal1*, Surajit Chakraborty2
ABSTRACT: The present investigation is aimed at understanding
the hydrogeochemical parameters and development of a water quality
index (WQI) to assess groundwater quality of a rural tract in the
northwest of Bardhaman district of West Bengal, India. Groundwater
occurs at shallow depths with the maximum flow moving southeast
during pre-monsoon season and south in post-monsoon period.
The physicochemical analysis of groundwater samples shows the
major ions in the order of HCO3.Ca.Na.Mg.Cl.SO4 and
HCO3.Ca.Mg.Na.Cl.SO4 in pre- and post-monsoon periods,
respectively. The groundwater quality is safe for drinking, barring the
elevated iron content in certain areas. Based on WQI values,
groundwater falls into one of three categories: excellent water, good
water, and poor water. The high value of WQI is because of elevated
concentration of iron and chloride. The majority of the area is
occupied by good water in pre-monsoon and poor water in post-
monsoon period. Water Environ. Res., 87, 607 (2015).
KEYWORDS: groundwater, hydrogeochemistry, water quality index,
rural tract, Bardhaman district, West Bengal, India.
doi:10.2175/106143015X14212658613956
IntroductionThe quality of groundwater depends on the composition of
recharge water, the interaction between the water and the soil,
the rock with which it comes in contact in the unsaturated
zone, and the residence time and reactions that occur within
the aquifer (Freeze and Cherry, 1979; Fetter, 1994; Appelo and
Postma, 2005). Quality is also affected by various anthropo-
genic activities. Quality has become an important concern
particularly in rural areas where the population is widely
dependent on groundwater for drinking purposes. Undesir-
able groundwater quality reduces the economy and restrains
the improvement in living conditions of rural people.
Therefore, it has become necessary for systematic assessment
and monitoring of groundwater quality to examine its
suitability for drinking and to adopt appropriate measures
for protection.
Various geostatistical concepts were used to better understand
complex data sets of the water quality parameters (Isaaks and
Srivastava, 1989; Suk and Lee, 1999; Kumar and Ahmed 2003).
Use of a water quality index (WQI) is one of the most effective
approaches to communicate information on the quality of any
water to decision makers. The WQI is a mathematical equation
used to transform large numbers of water quality data into a
single number (Stambuk-Giljanovic, 1999). It promotes under-
standing of water quality issues by integrating complex data and
generating a score that describes water quality status (Reza and
Singh, 2010).
The area under investigation is a rural where residents depend
on groundwater for drinking and domestic purposes. The
objective of this paper is to discuss the suitability of groundwater
for human consumption based on compliance of physicochem-
ical data with reference to drinking water standards and
computed WQI values. These studies are the first attempts with
respect to quality management of groundwater in the Bardha-
man district of West Bengal.
Study Area SetupThis study was carried out in the Kanksa-Panagarh area,
located in the northwestern part of the Bardhaman District of
West Bengal. The area, comprising approximately 181 km2, is
bounded within latitudes 23824030 00 N to 23832033 00 N and
longitudes 87821014 00 E to 87828024 00 E in the Survey of India
(SOI) topographical survey sheets 73M/6 and 73M/7 (Figure 1).
The climate is semiarid with a temperature range of 128C in
winter and 398C in summer. However, minimum temperatures
can fall to 68C in winter, and the maximum temperature can
increase up to 458C because of hot winds in summer. The
average annual rainfall varies from 1100 to 1350 mm. Significant
rainfall occurs during the Southeast monsoon, from mid-June to
mid-October.
The area is surrounded by the Kunur Nadi, a tributary of the
Ajay River in the northeast and the Damodar River in the
southeast. The area has an undulating topography with
elevation (altitude) ranges from 52.37 m to 74.75 m above
mean sea level (MSL). The area is mostly covered by a blanket
of alluvium and laterite. The alluvial cover of unconsolidated
sediments, ranging in age from middle cretaceous to recent,
overlies a semi-consolidated basement of the lower and upper
Gondwanas (Table 1). The thickness of the unconsolidated
sediments ranges from 31.5 m in the northwest to 177 m in the
southeast (Das & Biswas, 1969). The unconsolidated sediments
include granular zones of variable thickness consisting of very
coarse to fine sand; sandy clay; lateritic gravels; and quartz
1* Quality Management Group, CSIR-Central MechanicalEngineering Research Institute, Mahatma Gandhi Avenue,Durgapur-713209, India; e-mail: [email protected] Department of Environment Management, Indian Institute of SocialWelfare and Business Management, College Square (West), Kolkata-700073, India.
July 2015 607

pebbles. The groundwater occurs in these granular zones
under unconfined conditions in shallow aquifers within 37 m
below ground level (bgl). Groundwater in semiconfined to
confined conditions in deeper aquifers (31 to 118 m bgl) were
also recorded in the eastern area (Das and Biswas, 1969). Here,
impervious beds like clay, shale, and argillaceous limestone
overlie the water saturated granular zones comprising of
coarse to fine sand and pebbles. The impervious layers
separating different granular zones in the east pinch out to
the west, and, thus, the different zones become hydraulically
interconnected with the near surface granular zones (Das and
Biswas, 1969).
The groundwater is being exploited in the study area through
shallow tube wells for drinking and domestic purposes. The
present investigation concentrated on groundwater occurring
under unconfined conditions.
MethodologyIn this investigation, water level at 98 tube wells was measured
from the ground surface during November to December 2011
for the post-monsoon period and during May to June 2012 for
the pre-monsoon period. The maximum depth recorded was 37
m bgl. Several steps were taken to construct a water table
contour map. First, the water-level data measured from the
ground surface are converted to the water table elevations (water
level height above the mean sea level). The water table elevation
with respect to mean sea level (MSL) at tube wells was
determined with the help of global position system (GPS) and
shuttle radar topography mission (SRTM) data. A handheld
global positioning system (GPS, Model GARMIN GPSMAP 78s)
was used to determine the tube well locations (longitude and
latitude). The reduced level of the tube well points was
computed from the SRTM data and cross checked against the
contour data of SOI Toposheets. The water table elevation data
Figure 1—Location map of the study area.
Table 1—Stratigraphy of the area around Kanksa-Panagarh, Bardhaman district, West Bengal (after Das and Biswas, 1969).
System Age Lithology Thickness range
Quaternary Recent Sand, ferruginous, yellow, fine to coarse,silt, greyish yellow clay
Unconsolidated sediments, 31.5 m to morethan 177 m from northwest to southeast
Pliocene to Pleistocene Sand, ferruginous, yellow; litho-margic clay,yellow clay; laterite and calcareousnodules
Tertiary Middle Cretaceous to Miocene Sand and pebbles, greyish white; stickyclay; red, green, and white clays;calcareous and carbonaceous shales;bluish grey, grey, and greyish blackclaystones with lenses of peat or ligniteat paces; siltstones and sandstones withlayers of argillaceous and arenaceouslimestone
Batabyal and Chakraborty
608 Water Environment Research, Volume 87, Number 7
were computed by subtracting water level data (bgl) from the
reduced level values. The water table contour maps for both
seasons were constructed using triangulation with linear
interpolation method with the help of GIS software (Surfer). A
contour interval of 1 m was chosen to avoid overcrowding the
map with contour lines.
Groundwater samples were collected from 28 representative
tube wells (Figure 1) during the post-monsoon (Po) and pre-
monsoon (Pr) periods. The samples were collected after 10
minutes of pumping and stored in properly washed polyethylene
bottles at 48C until the analyses were finished. Each of the
groundwater samples was analyzed for various physicochemical
parameters such as pH; electrical conductivity at 258C; total
dissolved solids (TDS); total hardness as CaCO3 (TH); turbidity;
total alkalinity as CaCO3 (Alk); major cations—sodium (Naþ),
potassium (Kþ), calcium (Ca2þ) and magnesium (Mg2þ); major
anions—bicarbonate (HCO3�), chloride (Cl�), nitrate (NO�3 ) and
sulphate (SO2�4 ); components such as fluoride (F�), phosphate
(PO3�4 ), phenol as C6H5OH; and heavy metals such as iron (Fe),
manganese (Mn), copper (Cu), arsenic (As), zinc (Zn), lead (Pb)
cadmium (Cd), nickel (Ni), and mercury (Hg). Test methods
followed are the standard procedures recommended by Amer-
ican Public Health Association (2005). The quality of analytical
data was examined by computing the balance of positive and
negative ions. Almost all groundwater samples of the pre- and
post monsoon seasons showed good charge balance, typically
less than 10%. The analytical data obtained were processed for
statistical analyses using AquaChem v.2011.1 and Excel 2007
software. The geochemistry of groundwater was analyzed by
major cation and anion concentrations and correlation analysis
among various physiochemical parameters. The suitability of
groundwater of the study area was examined based on percent
compliance of the measured data with respect to Indian
Standard (BIS, 1991) and WHO (1993).
To get a comprehensive picture of overall quality of ground-
water, theWQI was used.WQI is defined as a rating reflecting the
composite influence of different water quality parameters on the
overall quality of water. The Indian standard specified for drinking
water (BIS, 1991) was used for the calculation of WQI. The WQI
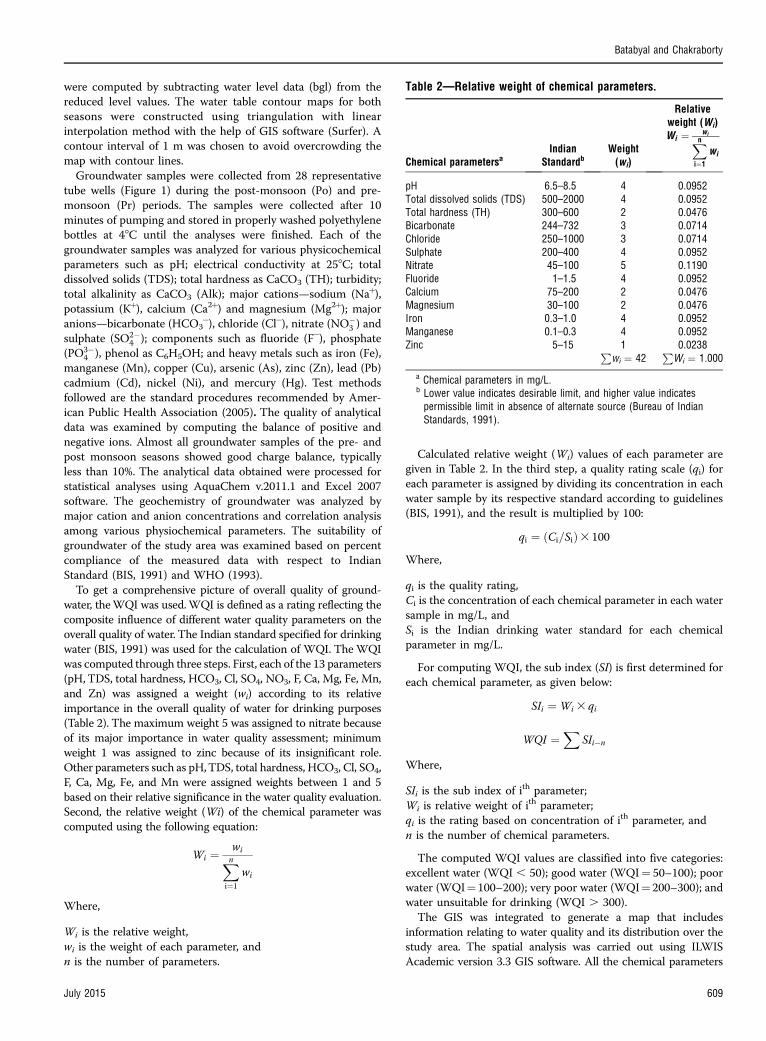
was computed through three steps. First, each of the 13 parameters
(pH, TDS, total hardness, HCO3, Cl, SO4, NO3, F, Ca, Mg, Fe, Mn,
and Zn) was assigned a weight (wi) according to its relative
importance in the overall quality of water for drinking purposes
(Table 2). The maximum weight 5 was assigned to nitrate because
of its major importance in water quality assessment; minimum
weight 1 was assigned to zinc because of its insignificant role.
Other parameters such as pH,TDS, total hardness, HCO3, Cl, SO4,
F, Ca, Mg, Fe, and Mn were assigned weights between 1 and 5
based on their relative significance in the water quality evaluation.
Second, the relative weight (Wi) of the chemical parameter was
computed using the following equation:
Wi ¼wiXn
i¼1wi
Where,
Wi is the relative weight,
wi is the weight of each parameter, and
n is the number of parameters.
Calculated relative weight (Wi) values of each parameter are
given in Table 2. In the third step, a quality rating scale (qi) for
each parameter is assigned by dividing its concentration in each
water sample by its respective standard according to guidelines
(BIS, 1991), and the result is multiplied by 100:
qi ¼ ðCi=SiÞ3 100
Where,
qi is the quality rating,
Ci is the concentration of each chemical parameter in each water
sample in mg/L, and
Si is the Indian drinking water standard for each chemical
parameter in mg/L.
For computing WQI, the sub index (SI) is first determined for
each chemical parameter, as given below:
SIi ¼Wi 3 qi
WQI ¼X
SIi�n
Where,
SIi is the sub index of ith parameter;
Wi is relative weight of ith parameter;
qi is the rating based on concentration of ith parameter, and
n is the number of chemical parameters.
The computed WQI values are classified into five categories:
excellent water (WQI , 50); good water (WQI¼ 50–100); poor
water (WQI¼100–200); very poor water (WQI¼ 200–300); and
water unsuitable for drinking (WQI . 300).
The GIS was integrated to generate a map that includes
information relating to water quality and its distribution over the
study area. The spatial analysis was carried out using ILWIS
Academic version 3.3 GIS software. All the chemical parameters
Table 2—Relative weight of chemical parameters.
Chemical parametersaIndian
StandardbWeight
(wi)
Relativeweight (Wi)Wi ¼ wiXn
i¼1
wi
pH 6.5–8.5 4 0.0952Total dissolved solids (TDS) 500–2000 4 0.0952Total hardness (TH) 300–600 2 0.0476Bicarbonate 244–732 3 0.0714Chloride 250–1000 3 0.0714Sulphate 200–400 4 0.0952Nitrate 45–100 5 0.1190Fluoride 1–1.5 4 0.0952Calcium 75–200 2 0.0476Magnesium 30–100 2 0.0476Iron 0.3–1.0 4 0.0952Manganese 0.1–0.3 4 0.0952Zinc 5–15 1 0.0238P
wi ¼ 42P
Wi ¼ 1.000
a Chemical parameters in mg/L.b Lower value indicates desirable limit, and higher value indicates
permissible limit in absence of alternate source (Bureau of IndianStandards, 1991).
Batabyal and Chakraborty
July 2015 609
with their location details, concentration values and weight (Wi)
were included separately into the attribute table of GIS. Then by
applying the above expression in GIS functions menu, qi and Siwere calculated. Finally, the WQI values were calculated by the
summation of all Si. All these values were then interpolated by
moving the average algorithm with an inverse distance method to
generate aWQI value map. The logic behind choosing the average
inverse distance method is that points that are close to an output
pixel obtain large weights; while points that are farther away from
an output pixel obtain small weights.Values of points that are close
to an output pixel are thus of greater importance to the output
pixel value than the values of points which are farther away. The
values for the output pixels are the weighted averages of input
point values. Finally, slicing options are applied using these ranges
of values with four groups of water quality classes to generate a
spatial distribution of water quality map (Chakraborty et al., 2007).
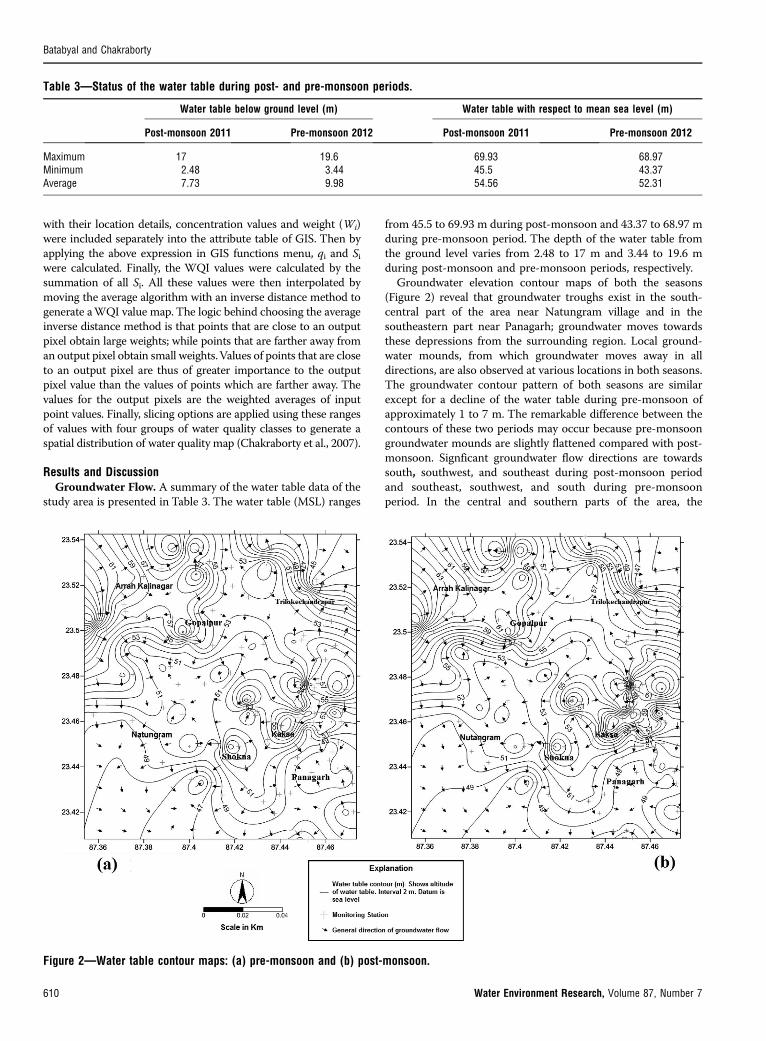
Results and DiscussionGroundwater Flow. A summary of the water table data of the
study area is presented in Table 3. The water table (MSL) ranges
from 45.5 to 69.93 m during post-monsoon and 43.37 to 68.97 m
during pre-monsoon period. The depth of the water table from
the ground level varies from 2.48 to 17 m and 3.44 to 19.6 m
during post-monsoon and pre-monsoon periods, respectively.
Groundwater elevation contour maps of both the seasons
(Figure 2) reveal that groundwater troughs exist in the south-
central part of the area near Natungram village and in the
southeastern part near Panagarh; groundwater moves towards
these depressions from the surrounding region. Local ground-
water mounds, from which groundwater moves away in all
directions, are also observed at various locations in both seasons.
The groundwater contour pattern of both seasons are similar
except for a decline of the water table during pre-monsoon of
approximately 1 to 7 m. The remarkable difference between the
contours of these two periods may occur because pre-monsoon
groundwater mounds are slightly flattened compared with post-
monsoon. Signficant groundwater flow directions are towards
south, southwest, and southeast during post-monsoon period
and southeast, southwest, and south during pre-monsoon
period. In the central and southern parts of the area, the
Table 3—Status of the water table during post- and pre-monsoon periods.
Water table below ground level (m) Water table with respect to mean sea level (m)
Post-monsoon 2011 Pre-monsoon 2012 Post-monsoon 2011 Pre-monsoon 2012
Maximum 17 19.6 69.93 68.97Minimum 2.48 3.44 45.5 43.37Average 7.73 9.98 54.56 52.31
Figure 2—Water table contour maps: (a) pre-monsoon and (b) post-monsoon.
Batabyal and Chakraborty
610 Water Environment Research, Volume 87, Number 7

contours in both the periods are widely spaced, indicating
permeability of the near-surface sedimentary formation. In the
northwestern and eastern parts of the area, the contours are
closely spaced, which is likely because of the less permeable
nature of the formations transmitting groundwater.
Compliance of Physicochemical Data Respecting Drinking
Water Standards. The basic statistics of groundwater chemistry
are presented in Table 4. The percent compliance of the
physicochemical data with respect to Indian Standard (BIS,
1991) and WHO (1993) for suitability for drinking water is
summarized in Table 5.
The pH shows slightly acidic to alkaline nature (Pr 5.9 to 7.7,
Po 5.5 to 7.2) of groundwater in the study area. The maximum
values of electrical conductivity are 820 lS/Cm (Pr) and 540 lS/Cm (Po), indicating low to moderate mineralization in the area.
With respect to TDS (maximum values Pr 452 mg/L, Po 396 mg/
L), the groundwater is hydrochemically freshwater suitable for
drinking. The turbidity values at some locations were high (Pr ,
1 to 130 NTU, median 2.5 NTU and Po , 1 to 172 NTU, median
Table 4—Basic statistics of the physicochemical parameters of groundwater samples.
Parameters
Pre-monsoon Post-monsoon
Min Max AM Med SD Min Max AM Med SD
pH 5.9 7.7 7.05 7.2 0.58 5.5 7.2 6.45 6.57 0.59EC 50 820 311.18 270 191.94 43 540 250.79 210 144.65TDS 30 452 172.36 155 105.51 30 396 169.86 148 97.09TH 10.1 341 133.18 121.2 89.18 8 336 127.64 112 86.01Turbidity ,1 130 20.9 2.5 39.72 ,1 172 34.56 18 48.93Alkalinity 12.2 355 128 118.3 91.56 8 313.6 115.73 105.9 85.56Naþ 3.1 61.7 19.09 15.35 15 3.5 46.7 17.23 12 13.73Kþ 1.5 13.6 3.77 2.6 3.06 0.81 20 3.52 2.15 3.7Ca2þ 3.1 92.5 37.55 32.9 26.13 2.4 91.2 35.39 32.8 23.74Mg2þ ,0.02 26.3 9.5 10.7 6.18 0.48 26 9.45 8.64 7.16HCO�3 14.9 433.1 157.55 144.3 110.43 9.8 382.6 142.95 129.2 102.82Cl� 4.9 96 15.77 10.8 17.36 6.1 79.6 17.2 13.25 14.86NO�3 ,0.4 38 9.21 7.15 10.82 ,0.4 32.7 8.89 7 8.87
SO2�4 ,1 44.6 14.13 10.4 13.62 ,1 26.3 9.96 6 7.35
F� ,0.1 0.6 0.3 0.3 0.14 ,0.1 0.7 0.25 0.2 0.17Fe 0.05 14 1.65 0.29 3.69 0.11 16.8 3.07 0.69 4.6Mn ,0.02 0.8 0.17 0.11 0.18 ,0.02 0.82 0.13 0.07 0.19Zn ,0.02 1.35 0.26 0.08 0.4 ,0.02 18.3 0.98 0.06 3.64
Min¼minimum; max ¼maximum; AM ¼ arithmetic mean; med¼median; SD¼ standard deviation; TDS¼ total dissolved solids; TH¼ total hardness.Electrical conductivity (EC) in lS/Cm, turbidity in NTU, all other parameters in mg/L).
Table 5—Comparison of groundwater quality with drinking water standards (TDS ¼ total dissolved solids; TH ¼ total hardness; EC ¼electrical conductivity) (Bureau of Indian Standards, 1991; World Health Organization, 1993).
Parameters Indian standard (desirable limit)
Percent compliance
WHO limit
Percent compliance
Pre-monsoon Post-monsoon Pre-monsoon Post-monsoon
pH 6.5–8.5 82.1 60.7 7–8 64.3 25EC – – – – – –TDS 500 100 100 1000 100 100TH 300 96.4 96.4 – – –Turbidity 5 71.4 46.4 – – –Alkalinity 200 71.4 82.1 – – –Naþ – – – 200 100 100.00Kþ – – – – –Ca2þ 75 89.3 92.9 75 89.3 92.9Mg2þ 30 100 100 30 100 100HCO�3 – – – – – –Cl� 250 100 100 250 100 100NO�3 45 100 100 50 100 100
SO2�4 200 100 100 250 100 100
F� 1 100 100 1.5 100 100Fe-Tot 0.3 53.6 28.6 0.3 53.6 28.6Mn-Tot 0.1 60.7 75 0.1 60.7 75Zn-Tot 5 100 96.4 3 100 96.4
Note: Electrical conductivity in lS/Cm, turbidity in NTU, all other parameters in mg/L.
Batabyal and Chakraborty
July 2015 611

18 NTU). The TDS content is within permissible limit at
maximum sites (Pr 82.1% and Po 57.1%). The higher values of
turbidity in groundwater, particularly during post-monsoon
samples, might be caused by enhanced erosion of host rocks and
leaching from lateritic soil. Apart from one sample, the total
hardness of groundwater is within the safe limit for drinking; the
groundwater is soft to moderately hard at maximum locations.
The alkalinities (maximum values Pr 355 mg/L and Po 313.6
mg/L) are within the permissible limit.
The major ion chemistry reveals that Ca2þ is the most
leading cation, and HCO3� is the most dominant anion in both
the seasons. The array of abundance of cations was recorded
as Ca.Na.Mg in pre-monsoon and Ca.Mg.Na in
post-monsoon period; the relative order of anions as
HCO3.Cl.SO4 was observed in both the seasons. The
overall concentration pattern of the major ions may
be o rde r ed a s HCO3.Ca.Na.Mg.Cl.SO4 and
HCO3.Ca.Mg.Na.Cl.SO4 in pre- and post-monsoons,
respectively. All the major cations and anions show values
within the permissible and safe limits with respect to Indian and
WHO standards. The concentration of Cl� was high (greater
than 10 mg/L) at places in the study area. InWest Bengal, India,
the chloride (Cl�) concentration in uncontaminated water is less
than 10 mg/L, and it ranges between 30 and 300 mg/L in the
domestic/septic tank wastewater (McArthur et al., 2012). This
indicates that the high Cl� concentration in groundwater of the
present study area might be from the domestic and household
septic tanks. The influence of wastewater on groundwater
quality is a well-documented concern worldwide (Foster et al.,
2011). In rural areas, most domestic supply, and much irrigation
water, is derived from shallow (, 50 m) wells, many of which are
close to either septic tanks or pit latrines (McArthur et al., 2012).
Possible sources of contaminated chloride are de-icers, evapo-
rites, landfill leachate, agricultural chemicals, industrial chem-
icals, recharge from village ponds, mixing with saline water, and
domestic wastewater. The present study area is located in the
northwestern part of Bardhaman district of West Bengal, India.
In the area, de-icers are not used; the evaporate deposits at
shallow depths, and landfill sites at or near the study area are not
reported. The use of agricultural chemicals is light, and no
chemical industries emerge in the study area. Village ponds are
small, and chloride concentrations are found within the normal
limit. There is no question of intrusion of saline water because
the sea is far away from the study area. By exclusion, it may be
concluded that the contaminant chloride in the study area
derives from domestic wastewater. In field studies, chloride-
contaminated sites are in close proximity to household septic
tanks.
Phosphate (, 0.05 mg/L) and phenol (, 0.001 mg/L) in
groundwater were less than the detection limit. The NO�3 and F�
contents are within the safe limits for drinking uses; maximum
concentrations during pre- and post-monsoon periods are found
as 38 mg/L and 0.6 mg/L and 32.7 and 0.7 mg/L, respectively.
The heavy metals aresenic, cadmium, copper, lead, mercury, and
nickel were found below the detection limits. Concentration of
iron varied from 0.05 to 14 mg/L and 0.11 to 16.8 mg/L with
compliances of 53.6% and 28.6% in pre- and post-monsoon
samples, respectively; the lateritic nature of soil and host rocks
likely caused the elevated iron concentration in groundwater.
Except for agricultural activities no other major anthropogenic
activities are being carried out in the study area which could be
assigned responsible for elevated concentration of iron, rather
the water-rock interaction might be the explanation for higher
values of iron. The groundwater in the study area occurs at
shallow depths under unconfined conditions in quaternary
sediments in the upper part of the unconsolidated sediments
(Table 1). In this zone, continuous sequences of ferruginous
sand, lateritic gravel, and laterite, with minor clay, has been
intersected. The interaction of rainwater during infiltration with
the iron-rich sediments was primarily responsible for the high
iron content in groundwater. Manganese concentrations greater
than the desirable limit was found in 39.3% and 25% of sampling
sites during pre- and post-monsoon periods, respectively, and
this may be because of some localized effects. Except for one
post-monsoon sample, zinc concentrations were found to be
within the safe range of drinking water standards during both
the seasons.
Correlation Analysis. A widely used correlation criterion
between two variables is the simple correlation coefficient which
indicates the sufficiency of one variable to predict the other
(Davis, 1986). This coefficient is used to determine the
correlation between the variables when the dependent (x) is
only influenced by the independent (y) and vice versa
(Voudouris et al., 2000). In this study, the correlation matrix of
15 variables for the pre- and post-monsoon seasons was
computed using AquaChem v.2011.1 software and is presented
in Table 6 and Table 7, respectively. Each table shows the degree
of a linear association between any two of the parameters, as
measured by the simple correlation coefficient (r). A linear
regression method calculates the coefficient (r), as given below:
r ¼
Xni¼1
xiyi �
Xni¼1
xiXni¼1
yi
nffiffiffiffiffiffiffiffiffiffiffiffiffiffiffiffiffiffiffiffiffiffiffiffiffiffiffiffiffiffiffiffiffiffiffiffiffiffiffiffiffiffiffiffiffiXni¼1
x2i �
Xni¼1
xi
!2
n
266664
377775
vuuuuuuut
ffiffiffiffiffiffiffiffiffiffiffiffiffiffiffiffiffiffiffiffiffiffiffiffiffiffiffiffiffiffiffiffiffiffiffiffiffiffiffiffiffiffiffiffiXni
y2i �
Xni¼1
yi
!2
n
266664
377775
vuuuuuuutWhere, x and y are the variables, and n is the number of water
parameters.
The value of r ranges from�1 toþ1; r¼þ1 indicates strongest
positive linear correlation and r¼�1 reveals strongest negative
linear correlation.
The correlation among parameters in the pre- and post-
monsoon seasons has shown approximately an analogous trend.
Strong (r . 0.9) to good (r ¼ , 0.9 to . 0.5) correlations
between the various physicochemical parameters have been
observed: (1) electrical conductivity with TDS, total hardness,
Alk, Ca2þ, Mg2þ, HCO�3 , Naþ and SO2�4 ; (2) TDS with total
hardness, Alk, Ca2þ, Mg2þ, HCO�3 , Naþ, and SO2�4 ; (3) total
hardness with Alk, Ca2þ, Mg2þ, HCO�3 , Naþ, and SO2�4 ; (4) Ca2þ
with Mg2þ, HCO�3 , and SO2�4 ; (5) Mg2þ with HCO�3 and SO2�
4 ;
and (6) HCO�3 with SO2�4 . This correlation indicates that all of
them have originated from the same source.
Electrical conductivity and TDS are strongly correlated (pre-
monsoon r ¼ 0.990; post-monsoon r ¼ 0.965), consistent with
the fact that conductivity increases as the concentration of all
dissolved constituents/ions increases. Electrical conductivity
exhibits strong (r . 0.9) and good (r ¼ , 0.9 to . 0.5)
Batabyal and Chakraborty
612 Water Environment Research, Volume 87, Number 7

correlations with total hardness, Ca2þ, Mg2þ, HCO�3 , Naþ, SO2�4
during both the pre- and post-monsoon seasons, indicating that
most of the ions were involved in various physicochemical
reactions, such as oxidation-reduction and ion exchange in the
groundwater aquifer system (Subba Rao, 2002). The WQI has
also been incorporated in the correlation matrix to examine the
role of water parameters in the WQI values. The iron is strongly
correlated withWQI (pre-monsoon r¼ 0.98, and post-monsoon
r¼ 0.988); chloride also shows good correlation (r¼ 0.532) with
WQI during post-monsoon period.
Water Quality Index. The WQI value and water type of the
individual samples are presented in Table 8 and Figure 3. The
WQI ranges from 15.3 to 475.9 and 18.2 to 584.3 for pre- and
post-monsoon seasons, respectively. During pre-monsoon,
46.4% of groundwater samples were ‘‘excellent’’; 35.7% were
‘‘good’’; and 7.1% were ‘‘poor’’. In post-monsoon, 32.1% of water
samples were ‘‘excellent’’; 25% were ‘‘good’’; 21.4% were ‘‘poor’’;
and 10.7% were ‘‘very poor’’. In addition, 10.7% of samples were
‘‘unsuitable for drinking’’ in both the seasons (Table 9). The
dissolved ions in groundwater affected WQI values, particularly
K, Mg, HCO3, Cl, NO3, SO4, Fe, and Mn during post-monsoon
period and Na, K, Mg, Cl, Fe, and Mn during pre-monsoon
period. High iron concentration in groundwater caused high
WQI values; high chloride concentrations also contributed to
high WQI values typically during the post-monsoon period.
These affects are evident from the correlation coefficients of
WQI with respect to iron and chloride (Table 6 and Table 7).
Iron shows strong correlation withWQI values (r . 0.9) in both
the seasons. The post-monsoon samples reveal a greater percent
of poor to very poor quality, 32.1%, compared to pre-monsoon
7.1% (Table 9). This may be explained by the observed higher
values mainly of iron in many post-monsoon samples compared
to pre-monsoon samples. The WQI values (Table 8) show that
the quality of groundwater at some locations (sample numbers 7,
Table 7—Correlation coefficient matrix of physicochemical parameters of post-monsoon groundwater samples (TDS¼ total dissolvedsolids; TH ¼ total hardness; EC ¼ electrical conductivity; WQI ¼ water quality index).
Variable pH EC TDS TH Alk Naþ Kþ Ca2þ Mg2þ HCO3� Cl� NO3
� SO42� Fe Mn WQI
pH 1 0.799 0.834 0.891 0.925 0.552 0.053 0.853 0.867 0.919 0.022 �0.172 0.409 0.026 0.346 0.123EC 1 0.965 0.919 0.882 0.741 0.043 0.925 0.804 0.894 0.376 0.126 0.528 0.01 0.451 0.126TDS 1 0.948 0.921 0.793 0.114 0.928 0.881 0.937 0.345 0.074 0.582 0.084 0.537 0.21TH 1 0.965 0.618 �0.044 0.981 0.924 0.974 0.086 �0.081 0.505 �0.064 0.512 0 .059Alk 1 0.671 �0.017 0.929 0.927 0.996 0.026 �0.156 0.487 �0.035 0.557 0.09Naþ 1 0.27 0.558 0.667 0.684 0.578 0.159 0.347 0.221 0.632 0.341Kþ 1 �0.108 0.086 �0.003 0.345 0.447 0.252 0.507 �0.095 0.498Ca2þ 1 0.834 0.942 0.084 �0.08 0.513 �0.146 0.467 �0.029Mg2þ 1 0.927 0.08 �0.076 0.44 0.11 0.546 0.231HCO3
� 1 0.048 �0.151 0.485 �0.045 0.557 0.081Cl� 1 0.511 0.099 0.508 0.048 0.532NO�3 1 0.023 0.263 �0.206 0.251
SO2�4 1 0.107 0.281 0.174
Fe 1 �0.069 0.988Mn 1 0.074WQI 1
Note: Concentrations in meq /L; bold ¼ strong correlation (r . 0.9).
Table 6—Correlation coefficient matrix of physicochemical parameters of pre-monsoon groundwater samples (TDS ¼ total dissolvedsolids; TH ¼ total hardness; EC ¼ electrical conductivity; WQI ¼ water quality index).
Variable pH EC TDS TH Alk Naþ Kþ Ca2þ Mg2þ HCO3� Cl� NO3
� SO42� Fe Mn WQI
pH 1 0.757 0.762 0.816 0.842 0.459 0.102 0.776 0.841 0.841 �0.012 �0.28 0.357 0.098 0.351 0.221EC 1 0.99 0.972 0.922 0.802 0.171 0.96 0.917 0.937 0.338 �0.095 0.596 �0.119 0.468 0.039TDS 1 0.97 0.927 0.826 0.222 0.955 0.925 0.944 0.369 �0.09 0.555 �0.098 0.484 0.063TH 1 0.94 0.682 0.13 0.99 0.938 0.951 0.235 �0.125 0.609 �0.145 0.413 0.007Alk 1 0.679 0.142 0.906 0.947 0.998 0.029 �0.266 0.499 �0.077 0.525 0.085Na 1 0.221 0.667 0.662 0.71 0.614 �0.107 0.312 �0.022 0.591 0.129K 1 0.076 0.253 0.152 0.233 �0.011 �0.067 0.354 �0.075 0.352Ca 1 0.881 0.919 0.254 �0.091 0.652 �0.184 0.36 �0.041Mg 1 0.952 0.166 �0.206 0.45 �0.038 0.509 0.12HCO3 1 0.083 �0.262 0.498 �0.081 0.528 0.082Cl 1 0.23 �0.011 �0.029 0.134 0.014NO3 1 �0.104 �0.171 �0.237 �0.201SO4 1 �0.199 0.164 �0.119Fe 1 0.052 0.98Mn 1 0.231WQI 1
Note: Concentrations in meq /L; bold ¼ strong correlation (r . 0.9).
Batabyal and Chakraborty
July 2015 613

Table 8—Computation of water quality index (WQI) for individual groundwater samples (pr ¼ pre-monsoon; po ¼ post-monsoon).
Sample No WQI-Pr Water type WQI-Po Water type
3 68.8 Good water 65.2 Good water5 25.9 Excellent water 23.2 Excellent water7 48.4 Excellent water 111.8 Poor water9 136.2 Poor water 132.5 Poor water12 49.4 Excellent water 55.3 Good water15 65.5 Good water 416.2 Water unsuitable for drinking21 46.8 Excellent water 43.1 Excellent water22 53.2 Good water 66.5 Good water31 66.6 Good water 50.9 Good water35 475.9 Water unsuitable for drinking 292.9 Very poor water43 26.8 Excellent water 231.7 Very poor water45 348.4 Water unsuitable for drinking 584.3 Water unsuitable for drinking50 59.9 Good water 131.5 Poor water55 50.4 Good water 282.7 Very poor water57 15.3 Excellent water 22.6 Excellent water62 118.0 Poor water 137.7 Poor water66 19.3 Excellent water 18.2 Excellent water67 64.2 Good water 55.8 Good water68 94.9 Good water 108.4 Poor water74 30.1 Excellent water 27.7 Excellent water76 427.0 Water unsuitable for drinking 469.9 Water unsuitable for drinking79 20.0 Excellent water 19.2 Excellent water80 49.5 Excellent water 36.3 Excellent water82 33.0 Excellent water 28.4 Excellent water83 33.1 Excellent water 42.7 Excellent water85 50.8 Good water 61.1 Good water89 84.8 Good water 74.7 Good water98 41.4 Excellent water 128.5 Poor water
Minimum ¼ 15.3,Maximum ¼ 475.9
Minimum ¼ 18.2,Maximum ¼ 584.3
Figure 3—Water quality index (WQI) of groundwater at different locations of the study area (dotted lines represent the range of differentcategories of water quality).
Batabyal and Chakraborty
614 Water Environment Research, Volume 87, Number 7
15, 43, 55, and 98) deteriorated in the post-monsoon period.
This deterioration likely occurred as iron leached out of the
lateritic soil and rocks because of monsoon precipitation.
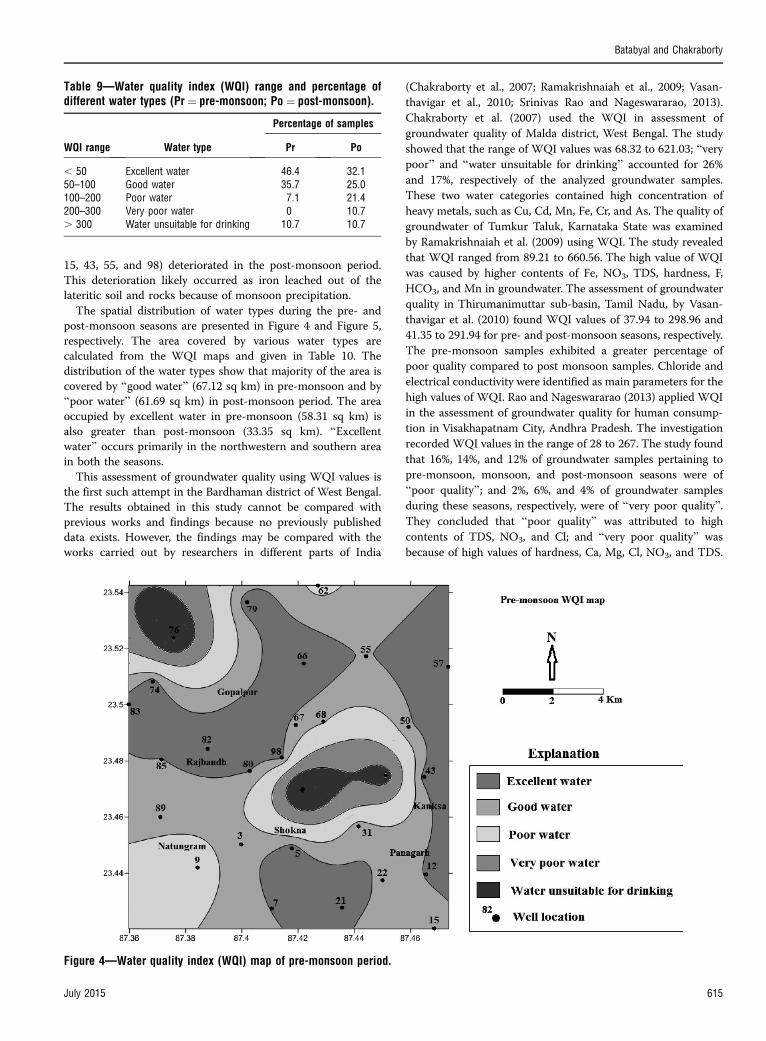
The spatial distribution of water types during the pre- and
post-monsoon seasons are presented in Figure 4 and Figure 5,
respectively. The area covered by various water types are
calculated from the WQI maps and given in Table 10. The
distribution of the water types show that majority of the area is
covered by ‘‘good water’’ (67.12 sq km) in pre-monsoon and by
‘‘poor water’’ (61.69 sq km) in post-monsoon period. The area
occupied by excellent water in pre-monsoon (58.31 sq km) is
also greater than post-monsoon (33.35 sq km). ‘‘Excellent
water’’ occurs primarily in the northwestern and southern area
in both the seasons.
This assessment of groundwater quality using WQI values is
the first such attempt in the Bardhaman district of West Bengal.
The results obtained in this study cannot be compared with
previous works and findings because no previously published
data exists. However, the findings may be compared with the
works carried out by researchers in different parts of India
(Chakraborty et al., 2007; Ramakrishnaiah et al., 2009; Vasan-
thavigar et al., 2010; Srinivas Rao and Nageswararao, 2013).
Chakraborty et al. (2007) used the WQI in assessment of
groundwater quality of Malda district, West Bengal. The study
showed that the range of WQI values was 68.32 to 621.03; ‘‘very
poor’’ and ‘‘water unsuitable for drinking’’ accounted for 26%
and 17%, respectively of the analyzed groundwater samples.
These two water categories contained high concentration of
heavy metals, such as Cu, Cd, Mn, Fe, Cr, and As. The quality of
groundwater of Tumkur Taluk, Karnataka State was examined
by Ramakrishnaiah et al. (2009) using WQI. The study revealed
that WQI ranged from 89.21 to 660.56. The high value of WQI
was caused by higher contents of Fe, NO3, TDS, hardness, F,
HCO3, and Mn in groundwater. The assessment of groundwater
quality in Thirumanimuttar sub-basin, Tamil Nadu, by Vasan-
thavigar et al. (2010) found WQI values of 37.94 to 298.96 and
41.35 to 291.94 for pre- and post-monsoon seasons, respectively.
The pre-monsoon samples exhibited a greater percentage of
poor quality compared to post monsoon samples. Chloride and
electrical conductivity were identified as main parameters for the
high values of WQI. Rao and Nageswararao (2013) applied WQI
in the assessment of groundwater quality for human consump-
tion in Visakhapatnam City, Andhra Pradesh. The investigation
recorded WQI values in the range of 28 to 267. The study found
that 16%, 14%, and 12% of groundwater samples pertaining to
pre-monsoon, monsoon, and post-monsoon seasons were of
‘‘poor quality’’; and 2%, 6%, and 4% of groundwater samples
during these seasons, respectively, were of ‘‘very poor quality’’.
They concluded that ‘‘poor quality’’ was attributed to high
contents of TDS, NO3, and Cl; and ‘‘very poor quality’’ was
because of high values of hardness, Ca, Mg, Cl, NO3, and TDS.
Table 9—Water quality index (WQI) range and percentage ofdifferent water types (Pr ¼ pre-monsoon; Po ¼ post-monsoon).
WQI range Water type
Percentage of samples
Pr Po
, 50 Excellent water 46.4 32.150–100 Good water 35.7 25.0100–200 Poor water 7.1 21.4200–300 Very poor water 0 10.7. 300 Water unsuitable for drinking 10.7 10.7
Figure 4—Water quality index (WQI) map of pre-monsoon period.
Batabyal and Chakraborty
July 2015 615

All of these studies proved the usefulness of WQI method in the
assessment of drinking water quality.
The findings in the present study may be summarized as:
WQI values ranged from 15.3 to 475.9 in pre-monsoon period
and 18.2 to 584.3 in post-monsoon period; Na, K, Mg, Cl, Fe,
and Mn during pre-monsoon period and Na, K, Mg, HCO3, Cl,
NO3, SO4, Fe, and Mn during post-monsoon period contributed
to theWQI values. High iron content in groundwater led to high
WQI values; chloride also significantly increased WQI values at
some locations, typically during the post-monsoon period.
ConclusionsGroundwater occurs at shallow aquifers under unconfined
conditions within a depth of 37 m from the surface.
Groundwater primarily flows south, southwest, and southeast
directions during post-monsoon period and southeast, south-
west, and south during pre-monsoon period.
The major ions may be ordered on abundance as
HCO3.Ca.Na.Mg.Cl.SO4 and HCO3.Ca.Mg.Na.
Cl.SO4 in pre- and post-monsoon periods, respectively. Apart
from high concentrations of iron at several sites and chloride
and manganese at some locations, the chemical composition of
groundwater of the study area shows compliance with drinking
water standards. The high concentration of iron may be
ascribed to leaching from lateritic soil and host rocks, and
higher values of chloride may be attributed to anthropogenic
inputs from improper sanitation systems. High concentrations
of manganese may be because of some localized effects; these
waters may be consumed after proper treatment. The typical
method of iron and manganese treatment system uses
oxidation and filtration. The oxidant chemically oxidizes the
iron or manganese to form particles. The filter then removes
the iron or manganese particles. Oxidation using chlorine or
potassium permanganate is frequently applied in small
groundwater systems (http://www.nesc.wvu.edu/). The chlo-
ride in water may be reduced by the methods such as
demineralization, reverse osmosis, coagulation, precipitation,
electro dialysis, and other approaches. Recent studies showed
the suitability of Parthenium sp. dried biomass as a sorbent
which is capable of achieving up to 40% reduction in the
chloride content (Apte Sagar et al., 2011).
In this study, the computed values of WQI vary from 15.3 to
475.9 for pre-monsoon and 18.2 to 584.3 for post-monsoon
season. According to the WQI values, groundwater at only three
locations in pre- and post monsoon periods were found
unsuitable for drinking (WQI . 300).
Dissolved ions such as Na, K, Mg, HCO3, Cl, NO3, SO4, Fe,
and Mn during post-monsoon period and Na, K, Mg, Cl, Fe, and
Mn during pre-monsoon period affected WQI values. High iron
content was responsible for the high WQI values recorded at
several sampling sites. The concentration of chloride also was a
significant constituent for high WQI values at some places
during post-monsoon period.
Figure 5—Water quality index (WQI) map of post-monsoon period.
Table 10—Area covered by different water types.
Water type
Area, sq km
Pre-monsoon Post-monsoon
Excellent water 58.31 33.55Good water 67.12 49.46Poor water 32.68 61.69Very poor water 13.92 21.88Water unsuitable for drinking 8.97 14.42
Batabyal and Chakraborty
616 Water Environment Research, Volume 87, Number 7

The distribution pattern of water types based on WQI
indicates that ‘‘good water’’ dominates the area during pre-
monsoon, and ‘‘poor water’’ during post-monsoon period. This
situation suggests that a greater amount of leaching and
subsequent infiltration of pollutants to the shallow aquifer zone
occurs during monsoons.
AcknowledgmentsThe author (AKB) thanks the Director, CSIR-Central Me-
chanical Engineering Research Institute (CSIR-CMERI), Durga-
pur for giving permission to publish this paper. The author
(AKB) acknowledges financial support in the form of in-house
project from CSIR-CMERI.
Submitted for publication March 24, 2014; revised manuscript
submitted November 19, 2014; accepted for publication January
12, 2015.
ReferencesAmerican Public Health Association (2005) Standard Methods for
Examination of Water and Wastewater, 21st ed. American Public
Health Association: Washington, D.C.
Appelo, C. A. J.; Postma, D. (2005) Geochemistry, Groundwater, and
Pollution, 2nd ed. A.A. Balkema: Rotterdam, Netherlands.
Apte Sagar, S.; Apte Shruti, S.; Kore, V. S.; Kore, S. V. (2011) Chloride
Removal from Wastewater by Biosorption with the Plant Biomass.
Universal J. Environ. Res. and Tech., 1 (4), 416–422.
Bureau of Indian Standards (1991) Indian Standard Drinking Water-
Specification. 1st rev. Bureau of Indian Standards: New Dehli, India.
Chakraborty, S.; Sikdar, P. K.; Paul, P. K. (2007) Hydrogeochemical
Framework of Quaternary Aquifer of English Bazaar Block, Malda
District, West Bengal. The Icfai J. Earth Sci., 1, 61–74.
Das, S.; Biswas, A. B. (1969) Geology and Groundwater Conditions of the
Alluvial Tract, East of Durgapur, Burdwan District, West Bengal: A
Preliminary Study. Indian Geohydrology, 5 (1), 71–89.
Davis, J. C. (1986) Statistics and Data Analysis in Geology, 2nd ed. John
Wiley & Sons: New York.
Fetter, C. W. (1994) Applied Hydrogeology, 3rd ed. Macmillan College
Publication: New York.
Foster, S.; Hirata, R.; Howard, K. (2011) Groundwater Use in Developing
Cities: Policy Issues Arising from Current Trends. Hydrogeol. J., 19,
271–274.
Freeze, A. R.; Cherry, J. A. (1979) Groundwater. Prentice-Hall: New
Jersey.
Iron and Manganese Removal: Tech Brief. A National Drinking Water
Clearing House Fact Sheet. http://www.nesc.wvu.edu /pdf/ dw/
publications/ontap/ 2009_tb /iron_DWFSOM42.pdf accessed on
October 11, 2014.
Isaaks, E. H.; Srivastava, R. M. (1989) An Introduction to Applied
Geostatistics. Oxford University Press: New York.
Kumar, D.; Ahmed, S. (2003) Seasonal Behaviour of Spatial Variability of
Groundwater Level in a Granitic Aquifer in Monsoon Climate.
Current Science, 84 (2), 188–196.
McArthur, J. M.; Sikdar, P. K.; Hoque, M. A.; Ghosal, U. (2012) Waste-
water Impacts on Groundwater: Cl/Br Ratios and Implications for
Arsenic Pollution of Groundwater in the Bengal Basin and Red
River Basin, Vietnam. Sci. Total Environ., 437, 390–402.
Reza, R.; Singh, G. (2010) Assessment of GroundWater Quality Status by
Using Water Quality Index Method in Orissa, India. World Appl.
Sci. J., 9 (12), 1392–1397.
Ramakrishnaiah, C. R.; Sadashivaiah C.; Ranganna, G. (2009) Assessment
of Water Quality Index for the Groundwater in Tumkur Taluk,
Karnataka State, India. E-J. Chem., 6 (2), 523–530.
Srinivas Rao, G.; Nageswararao, G. (2013) Assessment of Groundwater
quality using Water Quality Index. Arch. Environ. Sci., 7, 1–5.
Suk, H.; Lee, K. (1999) Characterization of a Ground Water Hydro-
chemical System through Multivariate Analysis: Clustering into
Ground Water Zones. Ground Water, 37, 358–366.
Stambuk, G. N. (1999) Water Quality Evaluation by Index in Dalmatia.
Water Res., 33 (16), 3423–3440.
Subba Rao, N. (2002) Geochemistry of Groundwater in Parts of Guntur
District, Andhra Pradesh, India. Environ. Geol., 41, 552–562.
Vasanthavigar, M.; Srinivasamoorthy, K.; Vijayaragavan, K.; Ganthi, R.
Rajiv.; Chidambaram, S.; Anandhan, P.; Manivannan, R.; Vasudevan,
S. (2010) Application of Water Quality Index for Groundwater
Quality Assessment: Thirumanimuttar Sub-basin, Tamilnadu, India.
Environ. Monit. Assess., 171, 595–609.
Voudouris, K.; Panagopoulos, A.; Koumantakis, J. (2000) Multivariate
Statistical Analysis in the Assessment of Hydrochemistry of the
Northern Korinthia Prefecture Alluvial Aquifer System (Peloponn-
ese, Greece). Natural Resources Res., 9 (2), 135–146.
World Health Organization (1993) Guideline for Drinking Water Quality,
2nd ed., vol 1. World Health Organization: Geneva, Switzerland.
Batabyal and Chakraborty
July 2015 617