Embed Size (px)
Citation preview

Scaling of human body composition to stature: new insights intobody mass index1–3
Steven B Heymsfield, Dympna Gallagher, Laurel Mayer, Joel Beetsch, and Angelo Pietrobelli
ABSTRACTBackground: Although Quetelet first reported in 1835 that adultweight scales to the square of stature, limited or no information isavailable on how anatomical body compartments, including adiposetissue (AT), scale to height.Objective: We examined the critical underlying assumptions ofadiposity–body mass index (BMI) relations and extended theseanalyses to major anatomical compartments: skeletal muscle (SM),bone, residual mass, weight (AT�SM�bone), AT-free mass, andorgans (liver, brain).Design: This was a cross-sectional analysis of 2 body-compositiondatabases: one including magnetic resonance imaging and dual-energy X-ray absorptiometry (DXA) estimates of evaluated compo-nents in adults (total n � 411; organs � 76) and the other a largerDXA database (n � 1346) that included related estimates of fat,fat-free mass, and bone mineral mass.Results: Weight, primary lean components (SM, residual mass,AT-free mass, and fat-free mass), and liver scaled to height withpowers of �2 (all P � 0.001); bone and bone mineral mass scaled toheight with powers �2 (2.31–2.48), and the fraction of weight asbone mineral mass was significantly (P � 0.001) correlated withheight in women. AT scaled weakly to height with powers of �2, andadiposity was independent of height. Brain mass scaled to heightwith a power of 0.83 (P � 0.04) in men and nonsignificantly inwomen; the fraction of weight as brain was inversely related toheight in women (P � 0.002).Conclusions: These observations suggest that short and tall subjectswith equivalent BMIs have similar but not identical body composi-tion, provide new insights into earlier BMI-related observations andthus establish a foundation for height-normalized indexes, and createan analytic framework for future studies. Am J Clin Nutr 2007;86:82–91.
KEY WORDS Height, brain mass, liver mass, skeletal muscle,adipose tissue, obesity
INTRODUCTION
Quetelet, in his 1835 classic treatise Sur l’homme et le déve-loppement de se facultés, ou Essai de physique sociale, firstmade the observation that weight increases in adults of normalbuild in proportion to the square of height (1, 2). More than acentury later, Keys and his colleagues, while evaluating weight-height indexes as measures of adiposity, identified Quetelet’sindex (weight/height2) as having the highest correlations with
skinfold and body density measurements (3). Body mass index(BMI), as Keys referred to weight/height2, has since been exten-sively studied as a phenotypic marker of adiposity in children andadults (4–17).
The classic studies of Quetelet (1, 2) and Keys et al (3) providethe foundation for applying BMI as an optimum weight-heightindex of adiposity. The evolved concepts include 3 main math-ematical constructs, the first of which is that weight scales toheight2 and thus weight/height2 (ie, BMI) is independent ofheight (6, 11). Several early studies support the validity of thisassumption (11), although there is some variability in the expo-nent or power of height above and below 2 (11–13, 15, 18).Others argued on the basis of the work of Benn (6) that the powerof height should be population specific (13, 14), and this sug-gestion was incorporated into what became known as the BennIndex (weight/height�, with � population specific). The sourcesof variation in observed powers when weight is scaled to heightremain unknown.
A second related tenet of the BMI model, although one rarelystudied, is that adipose tissue also scales to the square of height.Unless weight and adipose tissue scale to the same power ofheight, short and tall subjects will differ in adiposity. The ques-tion of the stature dependency of adiposity has not been rigor-ously examined (6, 19), although Garrow and Webster (9) wereunable to find a significant association between height and per-centage fat in a small cohort of women.
A third and important feature of the BMI model is that adi-posity, which is defined as adipose tissue mass/weight, is max-imally correlated with weight/height� when � is equal to 2. Keyset al (3) and others (7, 12, 15) examined powers of height inaddition to 2 and largely confirmed that 2 was the nearest integerproviding maximal correlations with measures of adiposity.
1 From Merck & Company, Rahway, NJ (SBH and JB); the New YorkObesity Research Center (DG) and the Department of Psychiatry (LM),Columbia University, College of Physicians and Surgeons, New York, NY;and the Pediatric Unit, Verona University Medical School, Verona, Italy(AP).
2 Supported by National Institutes of Health grants PO1 DK-42618, DK-02749, and P30-DK026687.
3 Reprints not available. Address correspondence to SB Heymsfield, ClinicalResearch,Metabolism,MerckResearchLaboratories,126EastLincolnAvenue,PO Box 2000, RY34A-A238, Rahway, NJ 07065-0900. E-mail: [email protected].
Received November 23, 2006.Accepted for publication March 6, 2007.
82 Am J Clin Nutr 2007;86:82–91. Printed in USA. © 2007 American Society for Nutrition
by guest on February 2, 2016
ajcn.nutrition.orgD
ownloaded from
by guest on F
ebruary 2, 2016ajcn.nutrition.org
Dow
nloaded from
by guest on February 2, 2016
ajcn.nutrition.orgD
ownloaded from
by guest on F
ebruary 2, 2016ajcn.nutrition.org
Dow
nloaded from

Although adiposity is of central interest in relation to BMI,other compartments of importance also contribute to how weightscales to height. Moreover, there is an implicit but not wellarticulated assumption that subjects of the same BMI but whodiffer in height have the same relative amount of skeletal muscle,bone, and components other than adipose tissue. This theorystates that short and tall subjects of equivalent BMI have identicalfractional body composition (ie, component weight/bodyweight), not just adiposity. Accordingly, in the current study, wecritically examined the scaling of anatomical body compart-ments to height with the aim of clarifying prevailing questionsrelated to the now widely applied phenotypic measure, BMI.
SUBJECTS AND METHODS
Experimental design and rationale
Allometric models
Existing databases were used to examine 3 questions, the first2 of which were: How do weight and major anatomical andclosely related molecular-level body compartments scale toheight in healthy adults? When expressed as a fraction of bodymass, are these compartments independent of height? The scal-ing of weight and each component to height, used to examinethese 2 questions, was evaluated by using the traditional allo-metric model
y � � � x�� (1)
where y is body weight or component mass, x is height, � is thescaling exponent or power, � is the proportionality constant, and� is a multiplicative error term (11, 16, 17). When converted tologarithmic form, the allometric equation can be solved as
logey � loge� � �logex � loge� (2)
According to Quetelet, � in Equations 1 and 2 for weight (y)scaled to height (x) is equal to 2. When weight (or component)/height� is plotted against height, the correlation will be nonsig-nificant when � is derived in the population under study asemphasized by Benn (6). If � is assumed to be 2 as in BMI andthe actual value differs from 2, there exists the possibility of biasin adjusted weights or component mass. Dividing weight or com-ponent mass by height2 when � � 2 may over- or under-correctfor between-individual differences in stature. In addition toweight, there is growing interest in expressing body-compositionresults in the form of height-normalized indexes, ie, component/height2 (20, 21), although there has been little examination ofhow these selected components actually scale to height.
In addition to Equation 2, the value of � and a related error termcan also be estimated by using an approach suggested by Benn(6). Flegal (18) showed close agreement between the 2 methodsand we also confirmed nearly identical results for both methodsin the present study. Accordingly, we provide estimates for � inthe results only for the log-log approach as stated in Equation 2.
A common practice is to express component mass as a fractionor percentage of weight. The background for the analysis of thesecond question is formulated on the ratio of component mass toweight, each of which scale individually to height:
Component � �1height�1 (3)
Weight � �2height�2 (4)
Therefore,
Component/weight � �1/�2height�1��2 (5)
When �1 and b2 are equal (ie, the component and body weightscale the same to height), the value of � is 0 and a non-zeronumber raised to the power of zero equals 1. Thus, there will beno association between component fractional mass and height ifthe difference between �1 and �2 is at or near zero. If the dif-ference between �1 and �2 in Equation 5 is not zero, the frac-tional component mass will scale positively or negatively toheight, possibly significantly. If a component and weight scaledifferently to height, short and tall subjects will not have the samebody composition.
Maximal associations
What is the power (�) of height in the ratio weight/height� thatmaximizes the component’s correlation with adiposity and mus-cularity? Adiposity is generally defined as the amount of adiposetissue or fat present relative to body weight. A similar definitionapplies to muscularity. The basis of this third question is formu-lated on the studies of Keys et al (3), who were the first of manyto examine the correlations between adiposity (adipose tissue orfat mass/weight) and weight/height�, with � � 2 in BMI. Inexploring this question, we established the optimum values of �for adiposity and muscularity because of their clinical and re-search relevance. The approach suggested by Benn (6) and Lars-son et al (12) was applied, in which R2 values are generated forthe regressions of component/weight on weight/height� for vary-ing values of �. The resulting data can then be used to plot R2
(variance) values versus � for the component of interest, andvisual inspection is then used to select the � value or valuesassociated with the maximum correlation.
Subjects and measurements
The 3 questions were examined by using data from healthynormal-weight and obese adults of varying ethnicity collectedacross multiple studies at the New York Obesity Research Cen-ter. The first evaluated database (NY-1) included subjects withwhole-body magnetic resonance imaging (MRI) (22, 23) anddual-energy X-ray absorptiometry (DXA) studies (22–24). Thedeveloped anatomical body-composition model for all subjectsincluded 4 major body compartments: adipose tissue, skeletalmuscle, bone, and residual mass. Residual mass, the differencebetween weight and the other 3 measured components, includeshigh-metabolic-rate tissues and organs such as liver, brain, heart,and kidneys (23). Bone mass was estimated from DXA-measured bone mineral mass (22, 23), and estimates of adiposetissue, skeletal muscle, and residual mass were provided by MRI(22, 23, 25).
In addition, a subset of the subjects evaluated in the NY-1studies completed separate imaging procedures for estimation of2 residual mass components, brain and liver, by use of the meth-ods reported by Gallagher et al (23). Adipose-tissue-free mass(ATFM) was calculated as the difference between weight andadipose tissue mass. This group is referred to as the NY-1Asubgroup of the larger NY-1 database in subsequent presenta-tions.
The second database (NY-2) included healthy adult subjectsevaluated solely by DXA for total body fat, fat-free mass (FFM),and bone mineral mass (8, 22–24). Fat and FFM as measured by
BMI AND BODY COMPOSITION 83
by guest on February 2, 2016
ajcn.nutrition.orgD
ownloaded from

DXA are the molecular body-composition level counterparts ofthe anatomical level components adipose tissue and ATFM (22).Bone mass in the NY-1 group was also derived from DXA-measured bone mineral mass, and the 2 differed only by a con-stant (22, 23). Evaluation of the NY-2 database was prompted byfindings in the smaller NY-1 database that suggested the appro-priateness of confirming fat and bone mineral scaling to height ina much larger and more diverse database.
Both databases included subjects with a minimum BMI (inkg/m2) of 18.5 and a maximum BMI of 35; the latter cutoff wasdue to MRI and DXA size limitations. Subjects in all databaseswere aged � 18 y with no imposed maximum age. Body weightand height in all subjects were measured with a calibrated digitalscale and stadiometer, respectively.
Statistical methods
Baseline subject demographic characteristics are reported asmeans and SDs. The statistical analyses were carried out by usingSPSS (SPSS for WINDOWS, version 11.5; SPSS Inc, Chicago,IL).
The allometric model coefficients in Equation 2, � and �, werederived by using least-squares multiple linear regression analysisand log-transformed data with weight or component mass set asthe dependent variable and height and potentially age as inde-pendent variables. Values for log � and � along with R and SEEvalues for each developed regression model are presented in theResults. Student’s t tests were used to compare values of � for theheight predictor variable in regression models compared with thereference � value of 2.0. In expanded analyses, we also devel-oped regression models with height alone as an independentvariable within discrete age groups in the large NY-2 database.These results were concordant with the pooled group analysesand are not presented.
Review of data in the first series of allometric analyses indi-cated that 2 components consistently scaled to height differentlyfrom weight, namely, bone and brain. Accordingly, we specifi-cally examined the correlations between bone/weight and brain/weight with height. These analyses were carried out by multipleregression analysis. None of the other component/weight asso-ciations with height were statistically significant.
We regressed the fractions of weight as adipose tissue andskeletal muscle against body weight/height� by using simplelinear regression analysis or a second-order polynomial, depend-ing on the established data structure. Values of � were system-atically varied from 0 to 3 in increments of 0.5 following pre-liminary analyses. Benn (6) and Larsson et al’s (12) method was
used to establish values of � that maximally correlated withadiposity and muscularity.
RESULTS
Baseline group characteristics
The baseline demographic information for the study groups issummarized in Table 1. The 2 groups, NY-1 and NY-2, collec-tively had 1757 subjects, 759 men and 998 women (NY-1, 411;NY-1A, 76; NY-2, 1346). The groups ranged in mean age from39.4 to 49.8 y and in BMI from 24.3 to 26.1. The NY-1A sub-group included 76 subjects, 19 men and 57 women, who did notdiffer significantly in mean BMI from the main NY-1 group. TheNY-1 and NY-1A men did not differ in age, whereas the NY-1women were significantly older (P � 0.03) than their NY-1Acounterparts.
Allometric analyses
We present both the NY-1 and the NY-2 results in parallel,starting with weight-stature relations and then advancing to eachof the evaluated body compartments. The regression model re-sults presented in this section are summarized in Table 2 for theNY-1 and NY-2 groups. The associations of weight and eachcomponent with height, fitted with univariate regression models,are presented in Figure 1 and Figure 2 for NY-1 men andwomen, respectively. The corresponding scatter plots for NY-2men and women are presented in Figure 3.
Body weight
Weight scaled with respective powers of height (� SEE) min-imally below and above 2 in the NY-1 and NY-2 men (1.78 �0.25 and 1.86 � 0.13) and women (2.17 � 0.27 and 2.17 � 0.14),with all 4 models highly significant (all P � 0.001). None of theserespective powers differed significantly from 2.0. Age was asignificant positive predictor of weight, after control for height,in all 4 regression models. BMI (ie, weight/height2) and weight/height raised to the respective actual powers (ie, 1.78–2.17) werealso independent of height in the male and female groups.
Lean compartments
Skeletal muscle mass
Skeletal muscle mass scaled to height with powers of 1.98 �0.27 and 2.08 � 0.20 in the NY-1 men and women (Table 2; both
TABLE 1Subject characteristics of the NY-1 and NY-2 database groups1
NY-1 NY-1A NY-2
Men(n � 178)
Women(n � 233)
Men(n � 19)
Women(n � 57)
Men(n � 581)
Women(n � 765)
Age (y) 49.8 � 15.8 44.9 � 17.4 48.9 � 21.1 39.4 � 18.22 44.8 � 7.7 47.9 � 18.0Weight (kg) 80.6 � 12.4 68.7 � 15.0 78.1 � 10.1 65.4 � 16.0 76.8 � 12.4 65.0 � 11.5Height (cm) 1.77 � 0.07 1.62 � 0.07 1.79 � 0.08 1.63 � 0.07 1.74 � 0.08 1.62 � 0.07BMI (kg/m2) 25.7 � 3.6 26.1 � 5.4 24.3 � 2.5 24.7 � 5.5 25.3 � 3.4 24.9 � 14.1
1 All values are x� � SD. The databases are described in Subjects and Methods.2 Significantly different from the NY-1 females, P � 0.03. (There were no other significant differences between the NY-1 and NY-1A groups.)
84 HEYMSFIELD ET AL
by guest on February 2, 2016
ajcn.nutrition.orgD
ownloaded from

P � NS versus a power of 2.0), respectively. Age was a signif-icant negative predictor of skeletal muscle mass after control forheight in the men but not the women. Both models were highlysignificant in the men (R � 0.54, P � 0.001) and women (R �0.56, P � 0.001).
Bone mass
Bone mass scaled to height with powers of 2.42 � 0.24 and2.48 � 0.17 in NY-1 men and women (Table 2), respectively.Bone mineral mass also scaled significantly to height in the NY-2men and women (Table 2) with respective powers of 2.31 � 0.12and 2.38 � 0.12. All 4 of the � values were significantly (P �0.05) or borderline significantly (NY-1 men, P � 0.09) � 2.0.Age added significantly to the 4 regression models with negativecoefficients in both men and women.
Among weight and all evaluated body compartments, thehighest R values (0.65–0.70) tended to be for the bone-statureassociations (Table 2). The values of � for bone scaled to heightwere consistently among the highest observed across weight andthe multiple evaluated body compartments.
Residual mass
Residual mass scaled to height with powers of 2.22 � 0.28 and2.13 � 0.28 in the NY-1 men and women (Table 2; both P � NSversus a power of 2.0), respectively. Age was a positive signif-icant predictor of residual mass after control for height, and bothmodels were highly significant in the men (R � 0.60, P � 0.001)and women (R � 0.48, P � 0.001).
The regression models for the 2 residual mass components,liver and brain, are summarized in Table 2, and scatter plots arepresented in Figure 4. Liver mass scaled to height with powersof 2.65 � 0.85 and 2.10 � 0.61 in men and women (both P � NS
versus a power of 2.0), respectively. The models were statisti-cally significant in the men (R � 0.60, P � 0.005) and women(R � 0.43, P � 0.001) and did not include age as a covariate.
Unlike the other evaluated lean components, brain mass scaledweakly to height in the men (r � 0.46, P � 0.04) with a power of0.83 � 0.39 (P � 0.05 versus a power of 2.0) and nonsignifi-cantly (r � 0.003, P � NS) in the women (Figure 4).
ATFM and FFM
The composite lean compartment, ATFM, scaled to heightwith powers of 2.09 � 0.19 and 2.20 � 0.17 in the NY-1 men andwomen (Table 2), respectively. Neither model, which were bothstatistically significant, included age as a predictor variable. Thesimilar compartment, FFM, scaled to height with respectivepowers of 1.86 � 0.10 and 2.05 � 0.09 in the NY-2 men andwomen. Age was a small-magnitude, but statistically significantpredictor variable in both models. All ATFM and FFM modelswere highly significant (P � 0.001), with R values ranging from0.64 to 0.69; none of the � values differed significantly from 2.0.
Adipose tissue
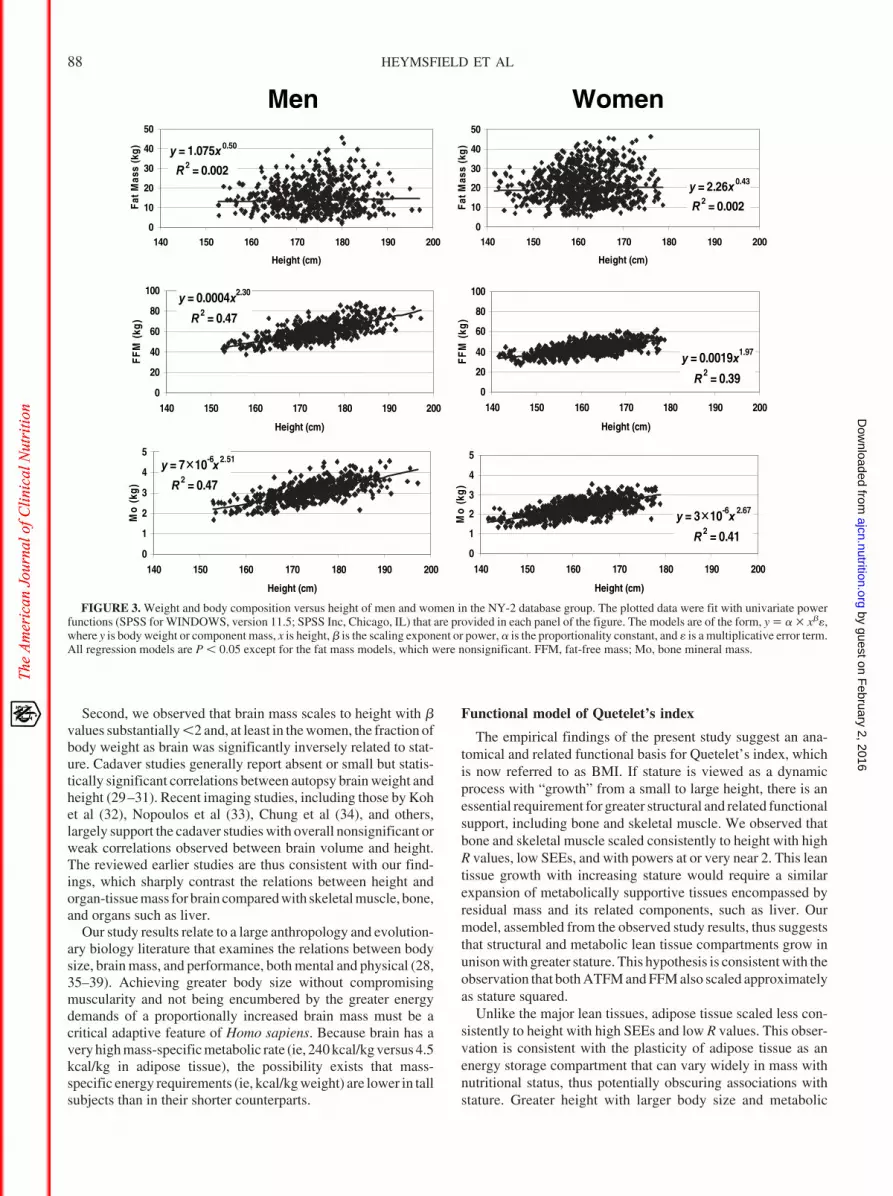
Adipose tissue scaled to height with a power of 1.76 � 0.75 inthe NY-1 men and 2.15 � 0.60 in the women with age a signif-icant covariate in both models (Table 2). Fat mass also scaledsignificantly to height in the NY-2 men and women with respec-tive powers of 1.86 � 0.47 and 2.17 � 0.33, but only after addingage to the models (Table 2). The allometric fat mass models werethe only nonsignificant univariate correlations observed acrossthe NY-2 group, as presented in Figure 3 for male and femalesubjects.
The 4 AT and fat mass models of the NY-1 and NY-2 groupshad the lowest R values and largest SEEs among the allometric
TABLE 2Body composition–stature associations of the NY-1 and NY-2 database groups1
Men Women
Model2
SEE R Mass
Model2
SEE R MassHt Age Int Ht Age Int
Weight (kg)NY-1 1.78 0.07 �5.08 0.14 0.48 80.6 � 12.43 2.17 0.19 �7.52 0.18 0.52 68.7 � 15.0NY-2 1.86 0.11 �5.72 0.16 0.45 76.8 � 12.4 2.17 0.05 �7.06 0.13 0.57 65.0 � 11.5
AT, NY-1 (kg) 1.76 0.35 �7.65 0.41 0.34 17.3 � 7.5 2.15 0.54 �9.89 0.41 0.47 23.8 � 11.1Fat, NY-2 (kg) 1.89 0.47 �8.39 0.38 0.43 15.9 � 7.7 2.58 0.63 �13.03 0.47 0.46 21.4 � 8.4ATFM, NY-1 (kg) 2.09 NS �6.77 0.10 0.64 63.3 � 8.3 2.20 NS �7.45 �0.11 0.65 44.9 � 7.0FFM, NY-2 (kg) 1.86 �0.04 �5.55 0.11 0.63 60.9 � 9.0 2.05 �0.08 �6.16 0.10 0.72 43.5 � 5.9SM, NY-1 (kg) 1.98 �0.11 �6.33 0.14 0.54 33.6 � 5.5 2.08 NS �7.55 0.14 0.56 20.5 � 3.5Bone, NY-1 (kg) 2.424 �0.06 �9.88 0.12 0.65 11.6 � 1.7 2.485 �0.06 �10.26 0.12 0.70 8.7 � 1.4Mo, NY-2 (kg) 2.315 �0.12 �10.50 0.13 0.68 3.1 � 0.5 2.385 �0.04 �11.03 0.12 0.69 2.3 � 0.4RM, NY-1 (kg) 2.22 0.13 �9.10 0.14 0.60 18.1 � 3.1 2.13 0.09 �8.56 0.17 0.48 14.9 � 3.3Brain, NY-1 (kg) 0.835 NS �3.83 0.07 0.466 1.59 � 0.12 �0.001 NS 0.31 0.10 0.0037 1.36 � 0.14Liver, NY-1 (kg) 2.65 NS �13.2 0.15 0.608 1.71 � 0.30 2.10 NS �10.40 0.19 0.43 1.43 � 0.32
1 The databases are described in Subjects and Methods. AT, adipose tissue; ATFM, adipose-tissue-free mass; FFM, fat-free mass; Ht, height; int, intercept;Mo, bone mineral mass; RM, residual mass; SM, skeletal muscle. Sample sizes for total AT, SM, bone, and RM: 178 males and 233 females in NY-1; samplesizes for brain and liver: 19 males and 57 females in NY-1A. Regression models were based on the allometric formula y � � � x��, and are solved as logey �loge� � �logex � log e�. The regression models were developed by using SPSS (SPSS for WINDOWS, version 11.5; SPSS Inc, Chicago, IL).
2 Ht and Age are the respective values for � (slopes) in equation 2, whereas Int corresponds to log �.3 x� � SD (all such values).4,5 Power of height vs a power of 2.0: 4P � 0.09, 5P � 0.05. All other powers of height reported in the table were not significantly different from a power
of 2.0; the power of height in the model for brain in women was not statistically significant.6–8 P values for the model: 6P � 0.04, 7P � NS, 8P � 0.005. (All other models were P � 0.001.)
BMI AND BODY COMPOSITION 85
by guest on February 2, 2016
ajcn.nutrition.orgD
ownloaded from

models for components evaluated in the 2 respective groups.None of the observed � values for height in the AT and fatprediction models differed significantly from 2.0.
Stature-dependence of fractional mass
Inspection of the univariate plots in Figures 1-3 and Table 2indicate that most components scaled to height with powerssimilar to that of weight. Thus, according to Equation 5, theirfractional mass will not correlate significantly with height. Theassociation between liver/weight and height was not statisticallysignificant in the NY-1A men even though liver scaled to heightwith a power of 2.65. After an initial screen of the remaining data,only bone and brain justified further analyses.
The fractions of weight as bone and bone mineral mass werenot significantly correlated with height in either group of men.The association between fractional bone mass and height in theNY-1 women was borderline significant alone (P � 0.07), butsignificance was no longer present when age was added to theregression model. The fraction of weight as bone mineral was
significantly correlated with height in the NY-2 women, evenafter adding age and age2 as predictor variables in a multipleregression analysis model (model R2 � 0.36; height covariate,P � 0.001). The fraction of weight as brain showed a trend or wassignificantly inversely correlated with stature in the men (P �0.07) and women (P � 0.002), respectively (Figure 4).
Maximal correlations
The associations between component/weight and weight/height� were systematically examined for adipose tissue andskeletal muscle mass. The maximal correlations, expressed as R2,between adipose tissue or fat/weight with weight/height� and thecorresponding plots for skeletal muscle (Figure 5) were ob-served for values of � in the range of 2–2.5. These ranges ofmaximal correlation were similar in men and women. Theseresults are similar to those of Benn (6), who suggested the rela-tively flat ranges comprising peak correlations indicated onlysmall differences in the value of selecting indexes with powersjust above or below 2.
y = 0.0034x1.94
R 2 = 0.160
20
40
60
80
100
120
140 150 160 170 180 190 200
Height (cm)
Wei
ght (
kg)
y = 3�10 x 2.-5 48
R 2 = 0.44
0
5
10
15
20
140 150 160 170 180 190 200
Height (cm)B
on
e M
ass
(kg
)
y = 0.014x1.43
R 2 = 0.020
10
20
30
40
50
60
140 150 160 170 180 190 200
Height (cm)
AT
Mas
s (k
g)
y = 0.0003x2.16
R2 = 0.31
0
10
20
30
40
50
60
140 150 160 170 180 190 200
Height (cm)
SM
Mas
s(k
g)
y = 0.0003x2.10
R 2 = 0.19
05
1015
20253035
140 150 160 170 180 190 200
Height (cm)
RM
(kg
)
y = 0.0006x2.21
R2 = 0.42
0102030405060708090
140 150 160 170 180 190 200
Height (cm)
AT
FM
(kg
)
FIGURE 1. Weight and body composition versus height of men in the NY-1 database group. The plotted data were fit with univariate power functions (SPSSfor WINDOWS, version 11.5; SPSS Inc, Chicago, IL) that are provided in each panel of the figure. The models are of the form, y � � � x��, where y is bodyweight or component mass, x is height, � is the scaling exponent or power, � is the proportionality constant, and � is a multiplicative error term. All regressionmodels in the figure are P � 0.05; the regression models including age as a covariate in addition to height are presented in Table 2. AT, adipose tissue; ATFM,adipose-tissue-free mass; SM, skeletal muscle mass; RM, residual mass.
86 HEYMSFIELD ET AL
by guest on February 2, 2016
ajcn.nutrition.orgD
ownloaded from

DISCUSSION
The present study is one of the first comprehensive examina-tions of anatomical body-composition scaling to stature in adults.Our observations strongly support those of Quetelet (1, 2) andmany others (3–19, 26) that weight scales approximately to stat-ure squared. We extended these classic observations by showingthat other components, with the exception of brain and bone, alsoscale to height with powers approximating 2 as the nearest inte-ger. Moreover, we confirmed (12) and extended earlier observa-tions by showing that maximal correlations between adiposityand muscularity (ie, component mass/weight) and weight/height� are present when � has values of �2–2.5. After appro-priately adjusting for height, including adjustment as weight/height2, the short and tall subjects in our sample had similaranatomical body composition, except for brain mass and to alesser extent bone mass.
Although our samples were relatively small, as noted, wedetected 2 “deviations” from the “� � 2” rule. First, we observed
consistently higher � values that differed significantly from 2.0for the scaling of bone to height compared with the other eval-uated components. A significantly higher fraction of weight asbone in tall subjects was, however, only observed in the relativelylarge NY-2 female sample. Tall subjects are heavier than shortsubjects because weight increases as height2. Bone scales toweight in mammals with � � �1.05–1.1, and Galileo was thefirst of many to draw attention to the relations between mamma-lian body size and bone structure/mass (27). Galileo advancedthe concept that maintenance of the same relative bone strength,resistance to elastic buckling, bending, and torsion across ani-mals differing by orders of magnitude in body mass requiresproportionally thicker bones. The observation that mammalianskeletal mass scales to weight with powers greater than one isseen as consistent with this theory (28). Weight and bone in oursubjects respectively scaled to height2 and height2.3, a smalldifference but one that is consistent with observations in mam-mals as a whole.
y = 0.002x1.77
R 2 = 0.020
10
20
30
40
50
60
140 150 160 170 180 190 200
Height (cm)
AT
Ma
ss (
kg)
y = 0.001x 2.00
R 2 = 0.240
10
20
30
40
50
60
140 150 160 170 180 190 200
Height (cm)
SM
Mas
s(k
g)
y = 0.01 1.78
R 2 = 0.210
20
40
60
80
100
120
140 150 160 170 180 190 200
Height (cm)
Wei
ght (
kg)
y = 0.0003x2.11
R 2 = 0.250
5
10
15
20
25
30
35
140 150 160 170 180 190 200
Height (cm)
RM
(kg
)
y = 0.001x 2.10
R 2 = 0.400
10203040
5060708090
140 150 160 170 180 190 200
Height (cm)
AT
FM
(kg
)
y = 7�10 x 2.-5 33
R2 = 0.390
5
10
15
20
140 150 160 170 180 190 200
Height (cm)B
on
e M
ass
(kg
)
x
FIGURE 2. Weight and body composition versus height of women in the NY-1 database group. The plotted data were fit with univariate power functions(SPSS for WINDOWS, version 11.5; SPSS Inc, Chicago, IL) that are provided in each panel of the figure. The models are of the form, y � � � x��, where yis body weight or component mass, x is height, � is the scaling exponent or power, � is the proportionality constant, and � is a multiplicative error term. Allregression models in the figure are P � 0.05; the regression models including age as a covariate in addition to height are presented in Table 2. AT, adipose tissue;ATFM, adipose-tissue-free mass; SM, skeletal muscle mass; RM, residual mass.
BMI AND BODY COMPOSITION 87
by guest on February 2, 2016
ajcn.nutrition.orgD
ownloaded from
Second, we observed that brain mass scales to height with �values substantially �2 and, at least in the women, the fraction ofbody weight as brain was significantly inversely related to stat-ure. Cadaver studies generally report absent or small but statis-tically significant correlations between autopsy brain weight andheight (29–31). Recent imaging studies, including those by Kohet al (32), Nopoulos et al (33), Chung et al (34), and others,largely support the cadaver studies with overall nonsignificant orweak correlations observed between brain volume and height.The reviewed earlier studies are thus consistent with our find-ings, which sharply contrast the relations between height andorgan-tissue mass for brain compared with skeletal muscle, bone,and organs such as liver.
Our study results relate to a large anthropology and evolution-ary biology literature that examines the relations between bodysize, brain mass, and performance, both mental and physical (28,35–39). Achieving greater body size without compromisingmuscularity and not being encumbered by the greater energydemands of a proportionally increased brain mass must be acritical adaptive feature of Homo sapiens. Because brain has avery high mass-specific metabolic rate (ie, 240 kcal/kg versus 4.5kcal/kg in adipose tissue), the possibility exists that mass-specific energy requirements (ie, kcal/kg weight) are lower in tallsubjects than in their shorter counterparts.
Functional model of Quetelet’s index
The empirical findings of the present study suggest an ana-tomical and related functional basis for Quetelet’s index, whichis now referred to as BMI. If stature is viewed as a dynamicprocess with “growth” from a small to large height, there is anessential requirement for greater structural and related functionalsupport, including bone and skeletal muscle. We observed thatbone and skeletal muscle scaled consistently to height with highR values, low SEEs, and with powers at or very near 2. This leantissue growth with increasing stature would require a similarexpansion of metabolically supportive tissues encompassed byresidual mass and its related components, such as liver. Ourmodel, assembled from the observed study results, thus suggeststhat structural and metabolic lean tissue compartments grow inunison with greater stature. This hypothesis is consistent with theobservation that both ATFM and FFM also scaled approximatelyas stature squared.
Unlike the major lean tissues, adipose tissue scaled less con-sistently to height with high SEEs and low R values. This obser-vation is consistent with the plasticity of adipose tissue as anenergy storage compartment that can vary widely in mass withnutritional status, thus potentially obscuring associations withstature. Greater height with larger body size and metabolic
y = 1.075x 0.50
R 2 = 0.002
0
10
20
30
40
50
140 150 160 170 180 190 200
Height (cm)
Fat
Mas
s (k
g)
y = 0.0004x2.30
R 2 = 0.47
0
20
40
60
80
100
140 150 160 170 180 190 200
Height (cm)
FF
M (
kg)
y = 7�10 x 2.-6 51
R 2 = 0.47
0
1
2
3
4
5
140 150 160 170 180 190 200
Height (cm)
Mo
(kg
)
y = 3�10 x 2.-6 67
R 2 = 0.410
1
2
3
4
5
140 150 160 170 180 190 200
Height (cm)
Mo
(kg
)
y = 0.0019x1.97
R 2 = 0.390
20
40
60
80
100
140 150 160 170 180 190 200
Height (cm)
FF
M(k
g)
y = 2.26x 0.43
R 2 = 0.002
0
10
20
30
40
50
140 150 160 170 180 190 200
Height (cm)
Fat
Mas
s(k
g)
WomenMen
FIGURE 3. Weight and body composition versus height of men and women in the NY-2 database group. The plotted data were fit with univariate powerfunctions (SPSS for WINDOWS, version 11.5; SPSS Inc, Chicago, IL) that are provided in each panel of the figure. The models are of the form, y � � � x��,where y is body weight or component mass, x is height, � is the scaling exponent or power, � is the proportionality constant, and � is a multiplicative error term.All regression models are P � 0.05 except for the fat mass models, which were nonsignificant. FFM, fat-free mass; Mo, bone mineral mass.
88 HEYMSFIELD ET AL
by guest on February 2, 2016
ajcn.nutrition.orgD
ownloaded from

requirements would optimally include an appropriate subcuta-neous adipose tissue insulation layer and energy stores, and thishypothesis provides one explanation for why adipose tissue andfat mass might in theory scale to height with powers similar tothose of lean tissues.
The observations of the present study thus suggest the exis-tence of a lean tissue “core” that scales consistently and stronglyto height with a power not significantly different from 2.0. Thecorresponding associations for adipose tissue and fat mass areweaker, although � values also did not differ significantly from2.0. Thus, small differences between populations in adiposity,muscularity, and potentially secular effects may combine to in-troduce some variability in � values around a mean of 2 forweight scaled to height. More focused studies including appro-priate methods in specific populations may elucidate the basis forracial and geographic differences in the relations between adi-posity and BMI.
Clinical applications
The results of the present study provide support for thesuggestion of Van Itallie et al (20) to normalize fat and FFMfor height2 as a means of adjusting the mass of these compo-nents for between-subject differences in stature. Our findings,with the aforementioned provisos, suggest that skeletal mus-cle, bone, ATFM, FFM, and potentially liver mass also scaleapproximately as the square of height. Pending the study oflarger and more representative samples, it thus seems reason-able that creating indexes of these and related components to
height2 would allow for body-composition comparisons be-tween subjects or groups differing in height. This approachhas been proposed for left ventricular mass measured by echo-cardiography, which appears to scale in adults as height2.13
(40), which is similar to our observations for other nonneurallean tissues.
Study limitations
Although our sample of subjects evaluated with MRI overallwas large given the expense and complexity of whole-body stud-ies, we still lacked adequate power to detect small differences incomponent scaling to height. To some extent, our larger NY-2subject database compensated for this limitation with lowerSEEs for major component � estimates (6). Our sample for brainand liver mass estimates was even smaller, which highlights theneed to extend our exploratory observations to larger popula-tions, particularly to groups differing in age and race (41). We didnot consider more advanced questions, such as the effect onscaling of relative leg length and other skeletal proportions. Ourstudy was limited to adults with BMIs between 18.5 and 35, andconsideration should be given to subjects outside of this range.Advancing our studies to children and adolescents would alsoprovide new insights into Quetelet’s rule when applied to personsother than adults (42). Quetelet noted that his height2 rule wasgenerally applicable across the life span, except during the firstyear of life and the pubertal period (1).
FIGURE 4. Brain and liver mass (upper panels) and their fractions of weight (lower panels) versus height of the men and women in the NY-1A databasegroup. The plotted data for brain and liver mass versus height (upper panels) were fit with univariate power functions (SPSS for WINDOWS, version 11.5; SPSSInc, Chicago, IL) that are provided in each panel of the figure. The models are of the form, y � � � x��, where y is body weight or component mass, x is height,� is the scaling exponent or power, � is the proportionality constant, and � is a multiplicative error term. Organ mass expressed as a fraction of body weight(BW) is plotted against height in the lower panels of the figure and include the corresponding linear regression models. Brain mass versus height: men P � 0.04and women P � NS; liver mass versus height: men P � 0.005 and women P � 0.001. Fraction of weight as brain versus height: men P � 0.07; women, P �0.002. Fraction of weight as liver: P � NS in men and women.
BMI AND BODY COMPOSITION 89
by guest on February 2, 2016
ajcn.nutrition.orgD
ownloaded from

Conclusions
The results of the present study suggest that weight, skeletalmuscle, adipose tissue, ATFM, and FFM all scale to height withpowers of 2 as the nearest whole integer. These observationsindicate that corresponding height-normalized indexes are alsoindependent of height, as are both adiposity and muscularity.Moreover, adiposity and muscularity maximally correlate withweight/height� when � is �2. These observations provide strongsupport for the application of BMI and height-normalized body-composition indexes as stature-independent measures of relativeadipose tissue and skeletal muscle mass.
The observations were less clear for bone, which scaled toheight with powers minimally but consistently higher than thoseobserved for weight scaled to height. Taller subjects, notablywomen, thus may have a larger fractional bone mass than theirshorter counterparts. The scaling functions were less ambiguousfor brain mass, which scaled to height with powers far �2, againmainly in women. Our findings tentatively indicate that in pro-portion to weight, taller subjects have a smaller brain mass, afinding that has implications related to human energy require-ments (23). Subjects of the same BMI but who differ in staturethus have similar but not identical body composition. Thesecollective observations have broad-reaching implications for thestudy of human biology and to the clinical application of BMI asa surrogate measure of human body composition.
The authors’ contributions were as follows—SBH: principal investigator,design, data collection, analysis, and article preparation; DG: design, subjectevaluation, and data collection; LM: design, subject evaluation, data collec-tion, analysis, and article preparation; JB: design, analysis, and article prep-aration; AP: design, analysis, and article preparation. None of the authors hadany financial or personal conflicts of interest.
REFERENCES1. Quetelet LAJ. A treatise on man and the development of his faculties.
Edinburgh, United Kingdom: William and Robert Chambers, 1842. In:Comparative statistics in the 19th century. Farnborough, United King-dom: Gregg International Publishers, 1973.
2. Quetelet MA. Letters addressed to HRH the Grand Duke of Saxe Coburgand Goth on the theory of probabilities, as applied to the moral andpolitical sciences (Transl by O.G. Downes) London, United Kingdom:Charles & Edwin, 1849.
3. Keys A, Fidanza F, Karvonen MJ, Kimura N, Taylor HL. Indices ofrelative weight and obesity. J Chronic Dis 1972;25:329–43.
4. Bray GA. Evaluation of obesity. Who are the obese? Postgrad Med2003;114:19–27.
5. Mei Z, Grummer-Strawn LM, Pietrobelli A, Goulding A, Goran MI,Dietz WH. Validity of body mass index compared with other body-composition screening indexes for the assessment of body fatness inchildren and adolescents. Am J Clin Nutr 2002;75:978–85.
6. Benn RT. Some mathematical properties of weight-height indices usedas a measure of adiposity. Br J Prev Soc Med 1971;25:42–50.
7. Garn SM, Pesick SD. Comparison of the Benn index and other body massindices in nutritional assessment. Am J Clin Nutr 1982;36:573–5.
8. Gallagher D, Visser M, Sepulveda D, Pierson RN Jr, Harris T,Heymsfield SB. How useful is body mass index for comparison of bodyfatness across age, sex, and ethnic groups? Am J Epidemiol 1996;143:228–39.
9. Garrow JS, Webster JD. Quetelet’s Index (Wt/Ht2) as a measure offatness. Int J Obes 1985;9:147–53.
10. Pietrobelli A, Faith MS, Allison DB, Gallagher D, Chiumello G,Heymsfield SB. Body mass index as a measure of adiposity amongchildren and adolescents: a validation study. J Pediatr 1998;132:204 –10.
11. Cole TJ. Weight-stature indices to measure underweight, overweight,and obesity. In: Himes J, ed. Anthropometric assessment of nutritionalstatus. New York: Wiley-Liss, 1991:83–111.
12. Larsson I, Henning B, Lindroos AK, Naslund I, Sjostrom CD, SjostromL. Optimized predictions of absolute and relative amounts of body fatfrom weight, height, other anthropometric predictors, and age. Am J ClinNutr 2006;83:252–9.
13. Lee J, Kolonel LN, Hinds MW. Relative merits of the weight-corrected-for-height indices. Am J Clin Nutr 1981;34:2521–9.
14. Lee J, Kolonel LN, Hinds MW. The use of an inappropriate weight-height derived index of obesity can produce misleading results. Int JObes 1982;6:233–9.
15. Revicki DA, Israel RG. Relationship between body mass indices andmeasures of body adiposity. Am J Public Health 1986;76:992–4.
16. Abdel-Malek AK, Mukherjee D, Roche AF. A method of constructing anindex of obesity. Hum Biol 1985;57:415–30.
17. Nevill AM, Holder RL. Body mass index: a measure of fatness or lean-ness? Br J Nutr 1995;73:507–16.
18. Flegal KM. Ratio of actual to predicted weight as an alternative to apower-type weight-height index (Benn index). Am J Clin Nutr 1990;51:540–7.
19. Khosla T, Lowe CR. Indices of obesity derived from body weight andheight. Br J Prev Soc Med 1967;21:122–8.
20. Van Itallie TB, Yang MU, Heymsfield SB, Funk RC, Boileau RA.Height-normalized indices of the body’s fat-free mass and fat mass:potentially useful indicators of nutritional status. Am J Clin Nutr 1990;52:953–9.
21. Kyle UG, Genton L, Gremion G, Slosman DO, Pichard C. Aging, phys-ical activity and height-normalized body composition parameters. ClinNutr 2004;23:79–88.
Adiposity
0
0.1
0.2
0.3
0.4
0.5
0.6
0.7
0.8
0 1 2 3 4
Power (β)
Power (β)
R2
Muscularity
-0.8
-0.7
-0.6
-0.5
-0.4
-0.3
-0.2
-0.1
00 1 2 3 4
R2
NY-1F
NY-2F
NY-1M
NY-1F
NY-1MNY-2M
FIGURE 5. Variance (R2) versus power (�) when adipose tissue or fatmass/weight (upper) and skeletal muscle mass/weight (lower) are regressedagainst weight/height�. The fractions of weight as adipose tissue and skeletalmuscle were regressed against body weight/height� by simple linear regres-sion analysis or a second-order polynomial, depending on the establisheddata structure. Values of � in the ratio weight/height� were systematicallyvaried from 0 to 3 in increments of 0.5 after preliminary analyses.
90 HEYMSFIELD ET AL
by guest on February 2, 2016
ajcn.nutrition.orgD
ownloaded from

22. Heymsfield SB, Gallagher D, Kotler DP, Wang Z, Allison DB, HeshkaS. Body-size dependence of resting energy expenditure can be attributedto nonenergetic homogeneity of fat-free mass. Am J Physiol EndocrinolMetab 2002;282:E132–8.
23. Gallagher D, Belmonte D, Deurenberg P, et al. Organ-tissue mass mea-surement allows modeling of REE and metabolically active tissue mass.Am J Physiol 1998;275:E249–58.
24. Visser M, Gallagher D, Deurenberg P, Wang J, Pierson RN Jr, Heyms-field SB. Density of fat-free body mass: relationship with race, age, andlevel of body fatness. Am J Physiol 1997;272:E781–7.
25. Ross R. Advances in the application of imaging methods in applied andclinical physiology. Acta Diabetol 2003;40:S45–50.
26. Billewicz WZ, Kemsley WF, Thomson AM. Indices of adiposity. Br JPrev Soc Med 1962;16:183–8.
27. Galileo Galilei. Discorsi e dimostrazioni matematiche, intorno a duenouve scienze. 1638.
28. Calder WA. Size, function, and life history. Mineola, NY: Dover Pub-lications, 1996.
29. Holloway RL. Within-species brain-body weight variability: a reexam-ination of the Danish data and other primate species. Am J Phys An-thropol 1980;53:109–21.
30. Peters M. Sex differences in human brain size and the general meaningof differences in brain size. Can J Psychol 1991;45:507–22.
31. Peters M, Jancke L, Staiger JF, Schlaug G, Huang Y, Steinmetz H.Unsolved problems in comparing brain sizes in Homo sapiens. BrainCogn 1998;37:254–85.
32. Koh I, Lee MS, Lee NJ, et al. Body size effect on brain volume in Koreanyouth. Neuroreport 2005;16:2029–32.
33. Nopoulos P, Flaum M, O’Leary D, Andreasen NC. Sexual dimorphismin the human brain: evaluation of tissue volume, tissue composition andsurface anatomy using magnetic resonance imaging. Psychiatry Res2000;28:98:1–13.
34. Chung SC, Tack GR, Yi JH, et al. Effects of gender, age, and bodyparameters on the ventricular volume of Korean people. Neurosci Lett2006;395:155–8.
35. Altmann SA. Foraging for survival: yearling baboons in Africa. Chi-cago, IL: University Of Chicago Press, 1998.
36. Gould SJ. Allometry in primates, with emphasis on scaling and theevolution of the brain. Contrib Primatol 1975;5:244–92.
37. McNab BK, Eisenberg JF. Brain size and its relation to the rate ofmetabolism in mammals. American Naturalist 1989;133(2):157-67.
38. Peters RH. The ecological implications of body size. Cambridge, UnitedKingdom: Cambridge University Press, 1993.
39. Schoenemann PT. Brain size scaling and body composition in mammals.Brain Behav Evol 2004;63:47–60.
40. de Simone G, Devereux RB, Daniels SR, Koren MJ, Meyer RA, LaraghJH. Effect of growth on variability of left ventricular mass: assessmentof allometric signals in adults and children and their capacity to predictcardiovascular risk. J Am Coll Cardiol 1995;25:1056–62.
41. Schwartz RS. Racial profiling in medical research. N Engl J Med 2001;344:1392–3.
42. Forbes GB. Stature and lean body mass. Am J Clin Nutr 1974;27:595–602.
BMI AND BODY COMPOSITION 91
by guest on February 2, 2016
ajcn.nutrition.orgD
ownloaded from
Erratum
Heymsfield SB, Gallagher D, Mayer L, Beetsch J, Pietrobelli A. Scaling of human body composition to stature:new insights into body mass index. Am J Clin Nutr 2007;86:82–91.
Figures 1 and 2 are reversed. The charts shown in Figure 1 actually depict data for women, not men. Similarly,the charts in Figure 2 actually depict data for men, not women. The title for Figure 1 should therefore read asfollows: “Weight and body composition versus height of women in the NY-1 database group.” The title forFigure 2 should read as follows: “Weight and body composition versus height of men in the NY-1 databasegroup.” In addition, on page 84, the third sentence of the subsection “Allometric analyses” should read as follows:“The associations of weight and each component with height, fitted with univariate regression models, arepresented in Figure 1 and Figure 2 for NY-1 women and men, respectively.”
Erratum
Keogh JB, Clifton P. The effect of meal replacements high in glycomacropeptide on weight loss and markers ofcardiovascular disease risk. Am J Clin Nutr 2008;87:1602–5.
On page 1602, the second sentence of the “Design” section of the abstract should read as follows: “Mealreplacements contained 33 g protein from GMP-enriched whey protein isolate (GMP-WPI) or skim milk powder(SMP) and 954 kJ/sachet.” A similar error occurred in the second sentence of the first full paragraph in the “Studydesign and methodology” subsection of the “Subjects and Methods” section (page 1603). That sentence shouldread as follows: “Both contained 33 g of protein and 954 kJ per pack.”
810 Am J Clin Nutr 2008;88:810–1. Printed in USA. © 2008 American Society for Nutrition

Erratum
Wang J, Wang Y, Wang Z, et al. Vitamin A equivalence of spirulina �-carotene in Chinese adults as assessedby using a stable-isotope reference method. Am J Clin Nutr 2008;87:1730–7.
In the Conclusion section of the abstract (page 1730), the wording “1 mg retinyl acetate” is incorrect and shouldbe replaced with “1 mg retinol.”
In the fourth sentence of the first paragraph of the Discussion section (page 1735), the wording “37% of theintake recommended in China” is incorrect and should be replaced with “37% of the actual intake by Chinesemen.”
In Figure 2 (page 1734), the x axis label is incorrect. The x axis label should read “Ion mass-to-charge ratio.” Thecorrected figure appears below.
ERRATA 811


