Embed Size (px)
Citation preview
__________________________________________________________________________________
CREDIT Research Paper
No. 12/ 05 __________________________________________________________________________________
SCHOOL EFFECTS ON EDUCATIONAL ATTAINMENT IN EGYPT
by
Menshawy Badr
Abstract
Using Trends in International Mathematics and Science Study (TIMSS) data for Egypt in
2007, this paper examines the determinants and gender inequality of educational attainment
(test scores in Mathematics and Science). The complicated structure of the data is carefully
addressed during all stages of the analysis by employing plausible values and jackknife
standard error technique to accommodate the measurement error of the dependant variable
and the clustering of students in classes and schools. A detailed analysis of Egyptian
students’ achievements reveals differential effects of school types, notably being single or
mixed sex and Arabic or language schools. Single‐sex schools tend to have higher attainment
than mixed schools, especially for girls, and single‐sex language schools have higher test
scores than Arabic single sex schools. The better performance of language schools is related
to the socio‐economic characteristics of enrolled students.
JEL Classification: H52, I21, I24, O15
Keywords: School inputs; Production function; School types; Test Scores; and Egypt.
__________________________________________________________________________________
Centre for Research in Economic Development and International Trade,
University of Nottingham
_________________________________________________________________________________
CREDIT Research Paper
No. 12/05 __________________________________________________________________________________
SCHOOL EFFECTS ON EDUCATIONAL ATTAINMENT IN EGYPT
by
Menshawy Badr
Outline
1. Introduction 2. Egypt’s Education System 3. Data and Descriptive Statistics 4. Empirical Model 5. Main Results 6. Further Analysis Using Interactions 7. School Effects and School Types 8. Extensions 9. Conclusions
References
Appendices
The Author
Menshawy Badr is currently a doctoral candidate, the School of Economics, University of Nottingham and an assistant lecturer (on study‐leave) from the Department of Economics, Sadat Academy for Management Sciences (SAMS), Egypt.
Acknowledgements
I am gratefully acknowledges the useful comments and directions provided by my supervisors Oliver Morrissey and Simon Appleton and during the XREAP workshop on Economics of Education at IEB, Barcelona in 2010.
Corresponding Author: [email protected] ; [email protected]
__________________________________________________________________________________
Research Papers at www.nottingham.ac.uk/economics/credit/
1
1. Introduction
This paper uses data from large comprehensive international student achievement tests –
Trends in International Mathematics and Science Study (TIMSS) – to estimate the impact of
parental education, other measures of Social‐Economic status (SES) and school inputs on
students’ achievements in Egypt. Although there are now numerous studies on the factors
influencing education quality in developed and developing countries (Hanushek and Lavy,
1994, Hanushek and Woessmann, 2007, Lloyd and Division, 2001), few include Arab
countries and studies on Egypt focus on education problems such as enrolment and dropout
rates and how these affect quality. Human capital quality measured by cognitive
achievement tests directly and indirectly influences productivity and long‐run growth. It is a
research priority to investigate sources of human capital quality. Governments, the main
education services provider around the world, should apply rational, efficient, and equitable
policies based on true research results (Hanushek and Luque, 2003; Woessmann, 2003).
This study estimates the impact of student characteristics and family background on the one
hand (the set of student variables) and teacher’s characteristics and school resources on the
other (the set of school variables), on cognitive achievement in Egypt. The broad question
addressed is: what are the major determinants, distinguishing Social‐Economic Status (SES)
and school inputs, of students’ cognitive achievements (as captured by test scores)? Using
test scores for 8th grade (age 14) students in Mathematics and Science for 2007, we examine
the influence of SES and school variables. The literature on education production functions
reveals no clear systematic relationship between school resources and student achievement;
teacher quality is the only factor that usually has a significant influence (Hanushek, 1995).
The paper is structured as follows. Section 2 provides an overview of education in Egypt.
Section 3 describes the TIMSS data for Egypt. Section 4 outlines the empirical model and
sections 5 to 8 discuss the results: core findings and further analysis with specific attention to
school fixed effects and the impact of test language and section 9 concludes.
2. Egypt’s education system
With more than 17 million students, 821 thousand teachers and 40 thousand schools, the
Egyptian education system is one of the largest in the world and the largest in MENA
2
(Middle East North African Countries)1. The Egyptian education system is divided into Al‐
Azharite system (Islamic school) and a secular system. The first is supervised by ALAZHAR2
and accounts for 9.8% of students while the secular system includes Arabic, language and
religious schools; the 90.2 percent of all students in the secular system are divided into public
and private education sectors (comprising 83 percent and 7.2 percent, respectively)3. All are
under the supervision of the Ministry of Education. Since 1981, free compulsory education is
provided at the primary and preparatory stages.
The school enrolment age is 6 years. The 9 years of basic education is divided into six years
primary stage and 3 years preparatory stage. Vocational preparatory education is provided
to serve slow learners in primary and preparatory education. The preparatory stage (grade 9
at age 15) exit exam (held at the governorates level) determines whether students are
qualified for general or vocational secondary school. The secondary stage is divided into
vocational (3 to 5 years) and general academic (3 years) schools. The test scores of the
secondary school exit examination (country level) determine their access to higher education
which includes universities and institutes (3 to 6 years). Students upgrade to the following
year is conditional on their exams’ results, so there is grade repetition (Ministry of Education,
2008).
Both mixed and single sex education is provided in Egypt. Typically, boys and girls attend
mixed classes at the primary level with single sex‐schools being mainly at the preparatory
level. In the rural areas where there are insufficient students to create two schools, students
enrolled in the same school with either mixed or single sex classes.
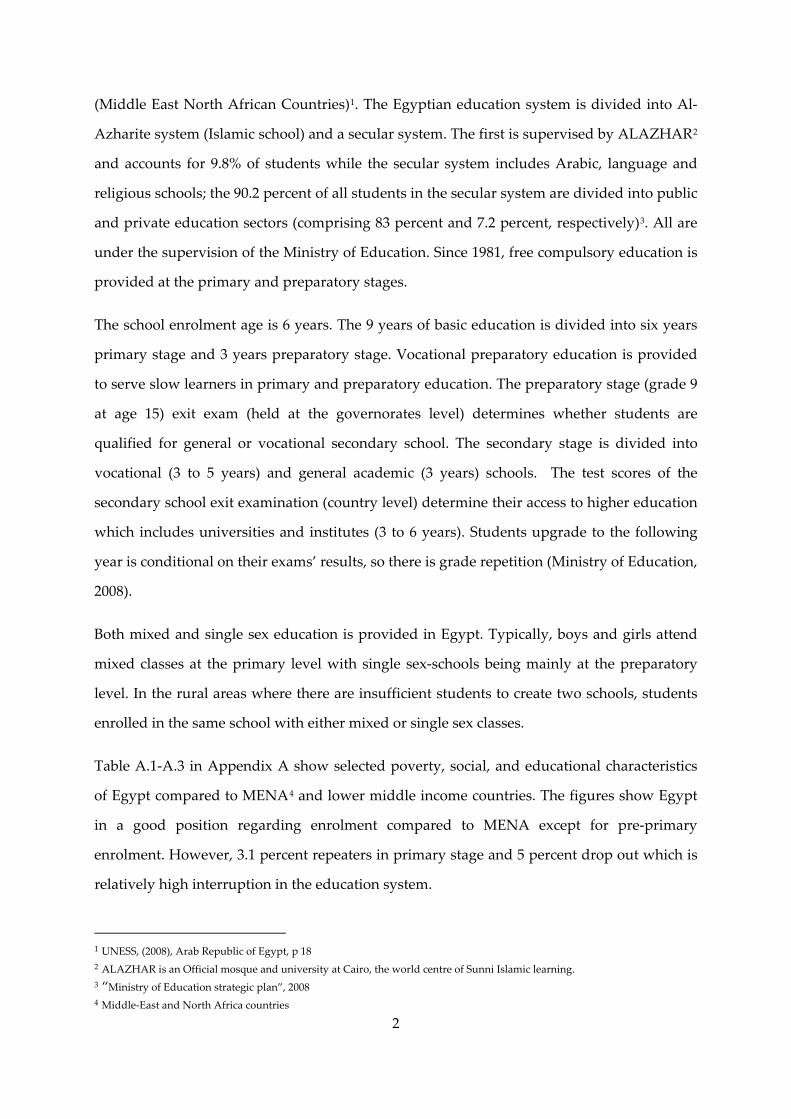
Table A.1‐A.3 in Appendix A show selected poverty, social, and educational characteristics
of Egypt compared to MENA4 and lower middle income countries. The figures show Egypt
in a good position regarding enrolment compared to MENA except for pre‐primary
enrolment. However, 3.1 percent repeaters in primary stage and 5 percent drop out which is
relatively high interruption in the education system.
1 UNESS, (2008), Arab Republic of Egypt, p 18 2 ALAZHAR is an Official mosque and university at Cairo, the world centre of Sunni Islamic learning. 3 “Ministry of Education strategic plan”, 2008 4 Middle‐East and North Africa countries
3
The Egyptian education system is highly centralised regarding administration, curriculum
and examination. The Ministry of Education has the main responsibility for all education
issues, collaborating with the ministry of Finance and the governorates regarding other
organizational and financial issues. The Egyptian education system diagnostic identifies the
following as issues: shortage of school buildings at the basic education level, existence of
poor quality vocational preparatory education, weak participation of the private and
cooperative sectors in education, high repetition rates in basic education, poor reading and
writing skills of pupils in basic education, increases in the education wage bill (large number
of employees not high wages), administrative jobs are overstaffed (1:1.26), shortages in basic
education qualified teachers (41percent do not have university degree), training mismatch
with the actual needs of teachers, curricula problems, existence of traditional teaching and
evaluation methods, and the spread of private tutoring5.
3. Data and descriptive statistics
The Trends in International Mathematics and Science Study (TIMSS) carried out by the
International Association for the Evaluation of Educational Achievement (IEA), an
independent organization, collects data on students at fourth (9‐10 years) and eighth (14‐15
years) grade for a large sample of countries to give comparative assessments dedicated to
improving teaching and learning in maths and science for students around the world.
This study relies on data from TIMSS on student tests results with extensive information
from the student background questionnaire and teachers and school characteristics for both
maths and science. The TIMSS target population is fourth and eighth grades. Each
participant country followed a uniform sampling approach applied by TIMSS team to assure
high quality standards. A two stage stratified cluster design was followed: at the first level a
random schools sample is selected and within each of these schools one or two classes are
selected at the second stage randomly. All students in a selected class were tested for both
maths and science. Two main issues need to be addressed in using TIMSS; the complex
multi‐stage sample design mentioned above and the use of imputed scores or “plausible
values” (Foy and Olson, 2009).
5 National Strategic Plan for Pre‐University Education Reform in Egypt (2007/08 ‐ 2011/12), P 249
4
3.1. Egypt in TIMSS 2007
Egypt has 8,179 schools with 1,342,127 students at the eighth grade. The selected TIMSS
sample for Egypt is 233 schools with 6,582 students which produces an estimated population
of 1,059,228 students. There are 234 teachers of integrated science and 234 teachers of maths.
TIMSS tests for maths and science are administered in both Arabic and English while the
background questionnaire is administered only in Arabic.
Table A.4 in the appendix shows average achievement of maths and science in Egypt and
some developed and developing countries. The substantial difference in maths scores
between Egypt and Spain, US, England, and Japan is evident (it exceeds 100 points). The
situation compared to other Arab and MENA countries is mixed; while Egyptian students’
achievement is higher than Algeria, Morocco, Kuwait, Saudi Arabia, Oman and Qatar, it is
lower than Turkey, Israel, Iran, Dubai, Lebanon, Jordan, Tunisia, Bahrain and Syria. In Sub‐
Saharan African countries such as Ghana and Botswana, students’ achievement in maths is
behind that in Egypt.
In Egypt, the TIMSS sample was 49.5 percent girls. The overview concentrates on the Egypt
2007 TIMSS maths scores with some comparison to the 2003 round. Egypt maths scores
declined from 406 in 2003 to 391 points in 2007 representing a statistically significant decline
of 15 points. Girls’ maths achievement scores declined from 406 in 2003 to 397 in 2007,
whereas boys’ achievement declined significantly from 406 to 384. Gender differences in
achievement scores were not significant in 2003 (less than one point difference) whereas they
were at the 95% level in 2007 (girls 13 points higher on average).
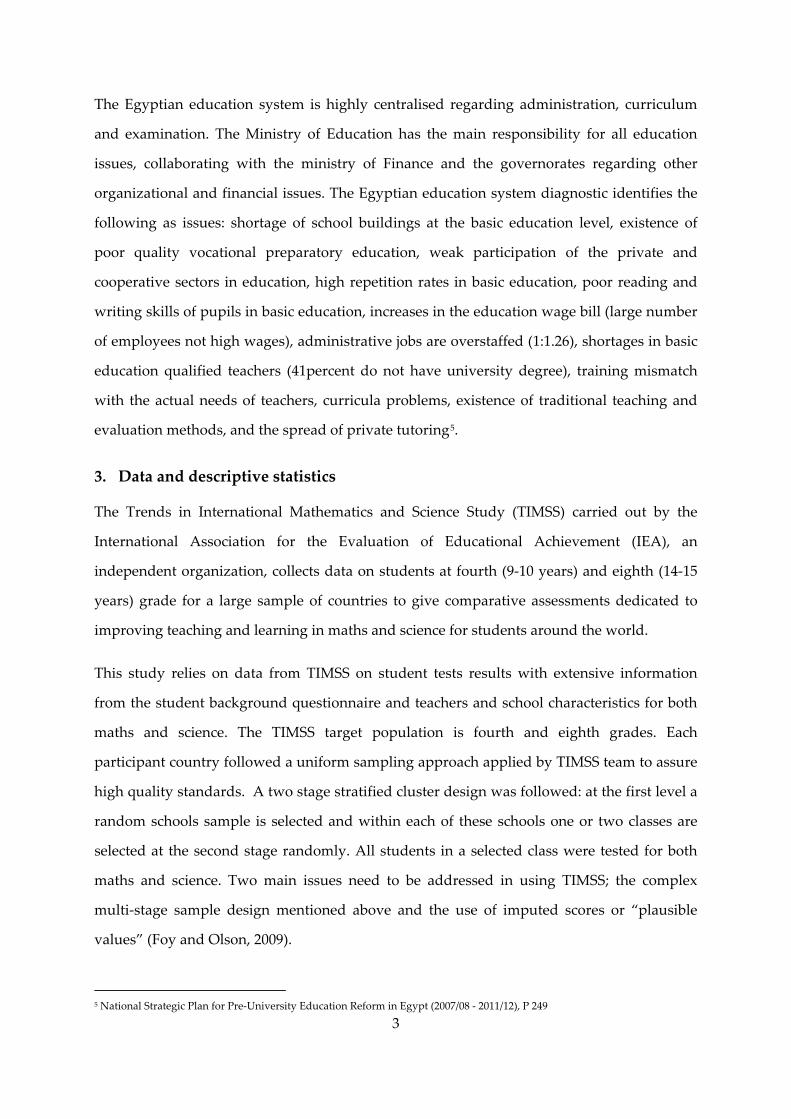
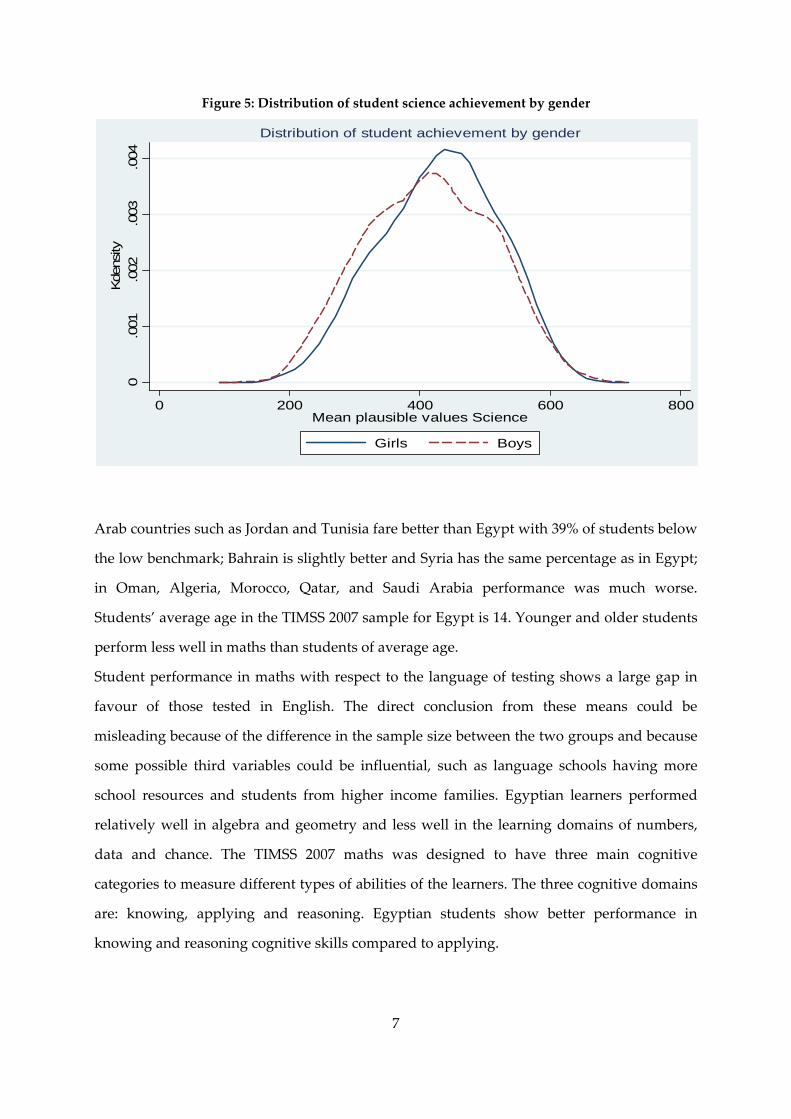
Science test scores achievements declined from 421 in 2003 to 408 in 2007 on average. This
fall of 13 points is statistically significant at the 5% level Appendix A (Table A.5). The
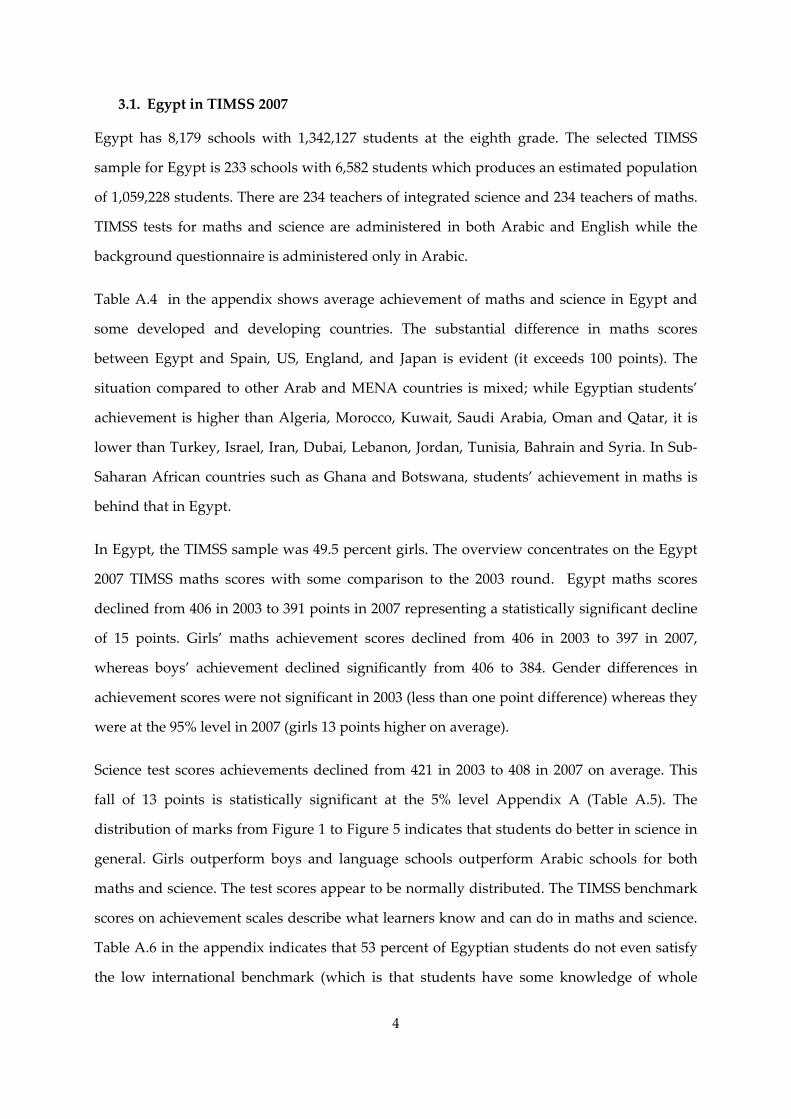
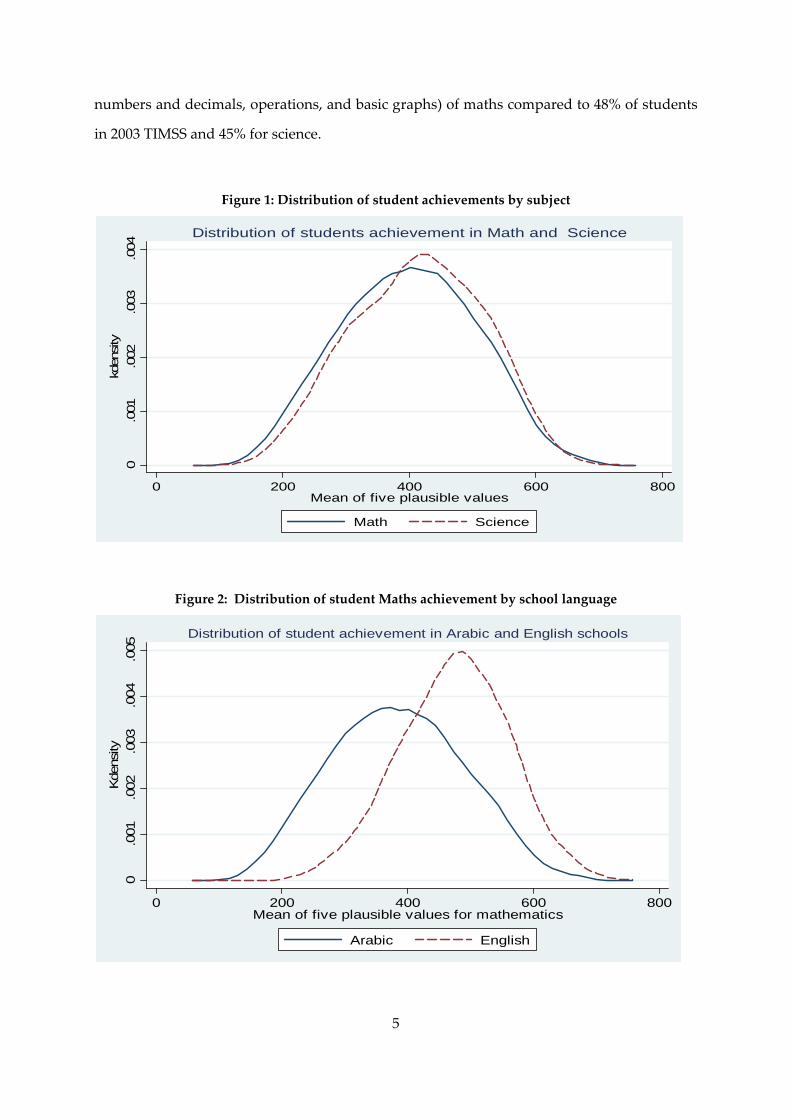
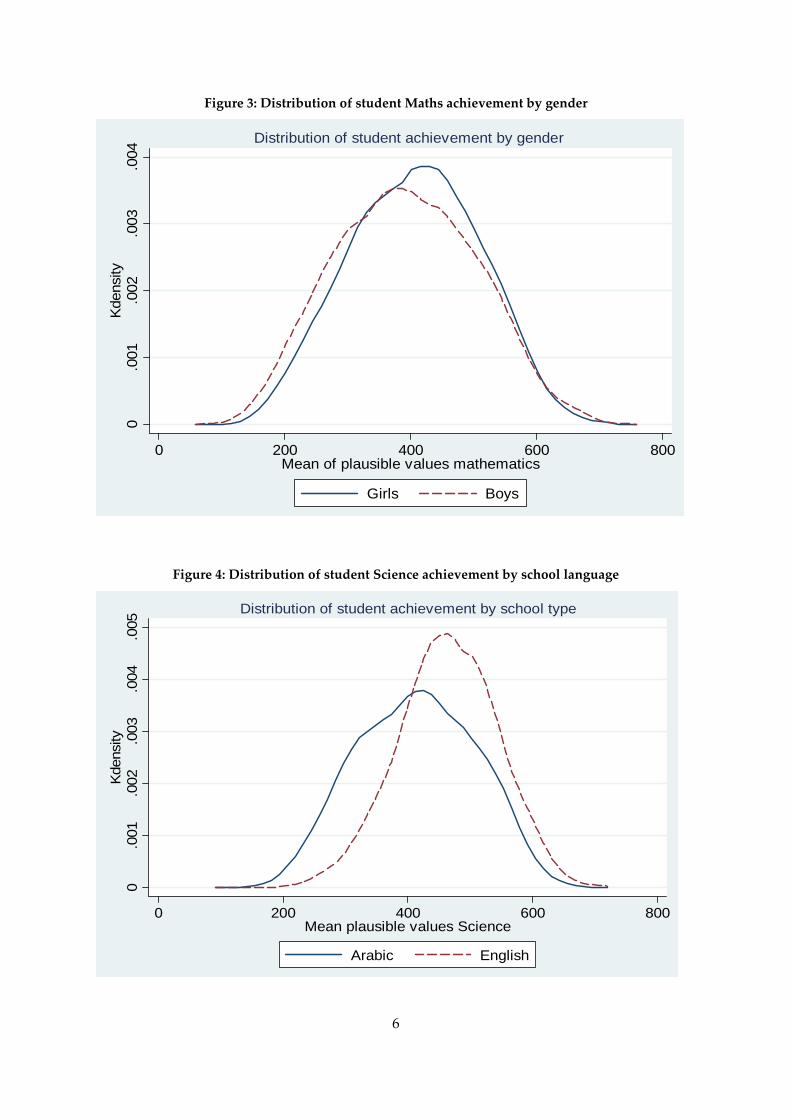
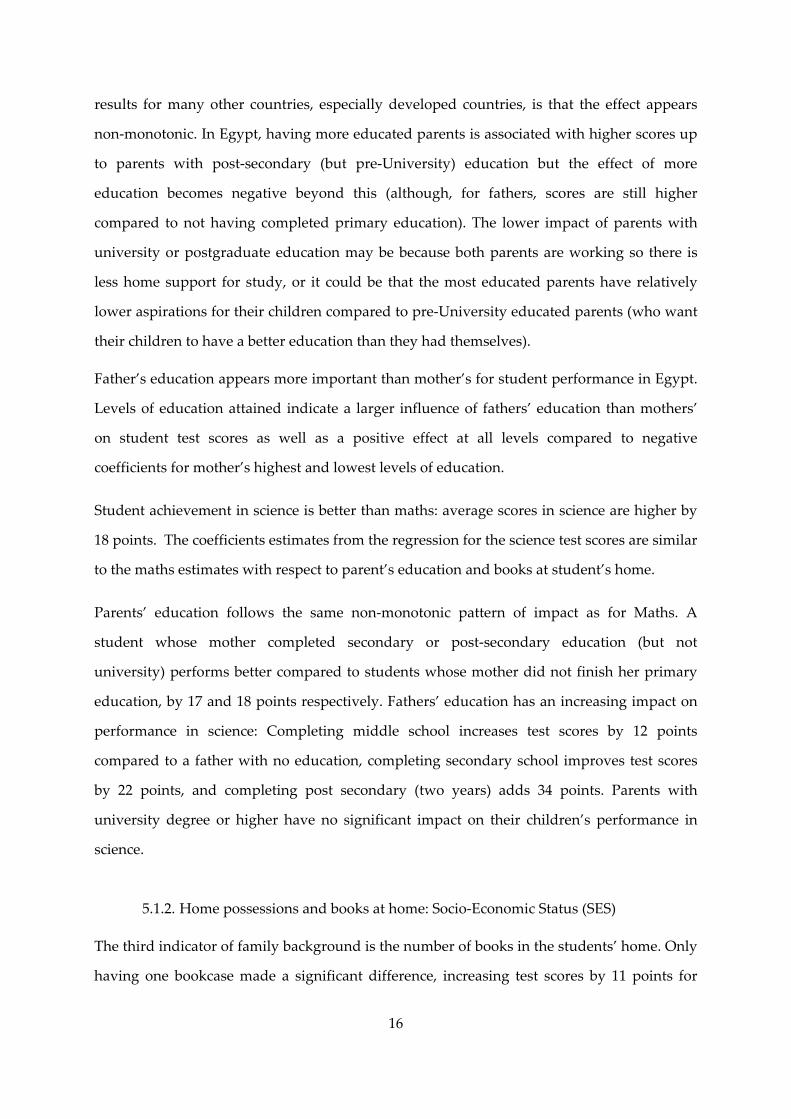
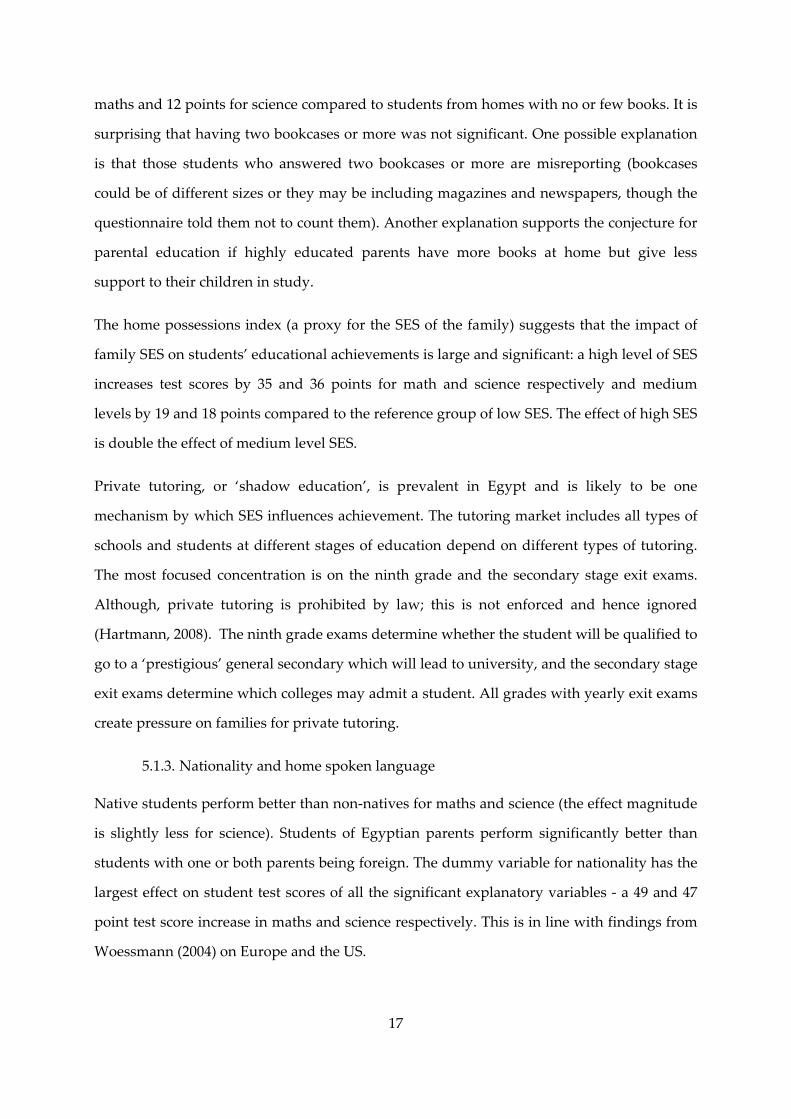
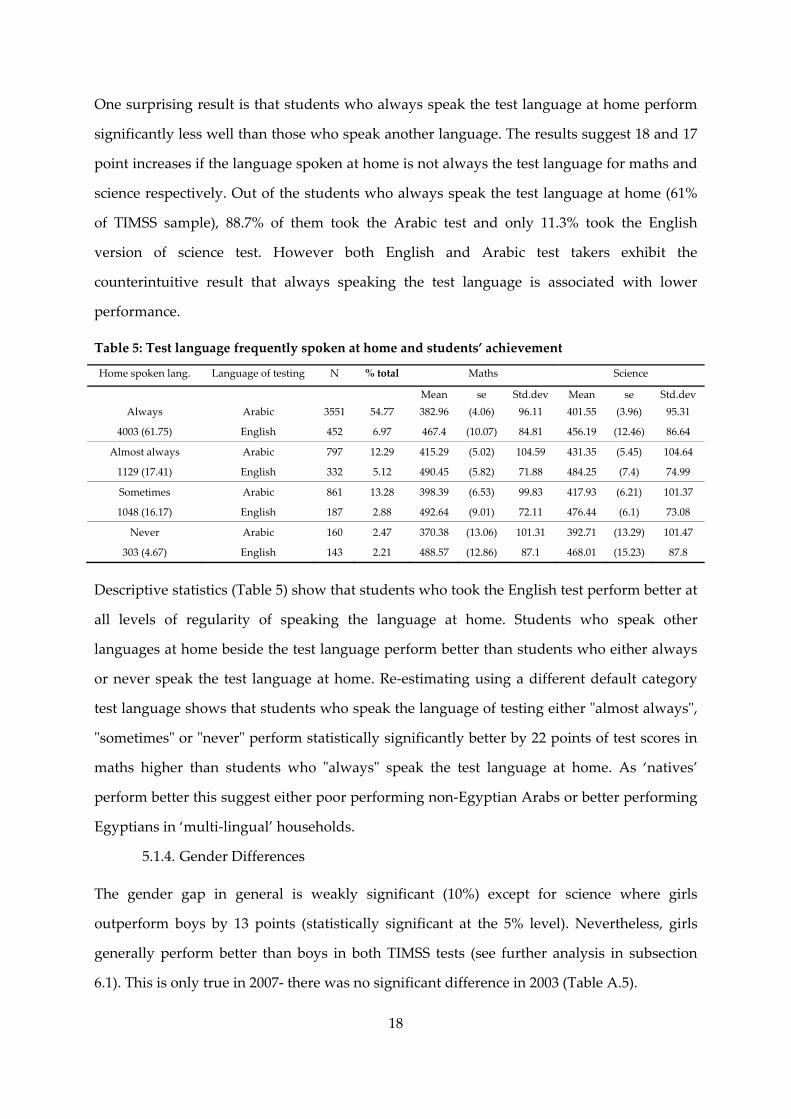
distribution of marks from Figure 1 to Figure 5 indicates that students do better in science in
general. Girls outperform boys and language schools outperform Arabic schools for both
maths and science. The test scores appear to be normally distributed. The TIMSS benchmark
scores on achievement scales describe what learners know and can do in maths and science.
Table A.6 in the appendix indicates that 53 percent of Egyptian students do not even satisfy
the low international benchmark (which is that students have some knowledge of whole
5
numbers and decimals, operations, and basic graphs) of maths compared to 48% of students
in 2003 TIMSS and 45% for science.
Figure 1: Distribution of student achievements by subject
Figure 2: Distribution of student Maths achievement by school language
0.0
01.0
02.0
03.0
04kd
ensity
0 200 400 600 800Mean of five plausible values
Math Science
Distribution of students achievement in Math and Science
0.0
01.0
02.0
03.0
04.0
05Kde
nsity
0 200 400 600 800Mean of five plausible values for mathematics
Arabic English
Distribution of student achievement in Arabic and English schools
6
Figure 3: Distribution of student Maths achievement by gender
Figure 4: Distribution of student Science achievement by school language
0.0
01.0
02.0
03.0
04K
dens
ity
0 200 400 600 800Mean of plausible values mathematics
Girls Boys
Distribution of student achievement by gender 0
.001
.002
.003
.004
.005
Kde
nsity
0 200 400 600 800Mean plausible values Science
Arabic English
Distribution of student achievement by school type
7
Figure 5: Distribution of student science achievement by gender
Arab countries such as Jordan and Tunisia fare better than Egypt with 39% of students below
the low benchmark; Bahrain is slightly better and Syria has the same percentage as in Egypt;
in Oman, Algeria, Morocco, Qatar, and Saudi Arabia performance was much worse.
Students’ average age in the TIMSS 2007 sample for Egypt is 14. Younger and older students
perform less well in maths than students of average age.
Student performance in maths with respect to the language of testing shows a large gap in
favour of those tested in English. The direct conclusion from these means could be
misleading because of the difference in the sample size between the two groups and because
some possible third variables could be influential, such as language schools having more
school resources and students from higher income families. Egyptian learners performed
relatively well in algebra and geometry and less well in the learning domains of numbers,
data and chance. The TIMSS 2007 maths was designed to have three main cognitive
categories to measure different types of abilities of the learners. The three cognitive domains
are: knowing, applying and reasoning. Egyptian students show better performance in
knowing and reasoning cognitive skills compared to applying.
0.0
01.0
02.0
03.0
04Kd
ensi
ty
0 200 400 600 800Mean plausible values Science
Girls Boys
Distribution of student achievement by gender
8
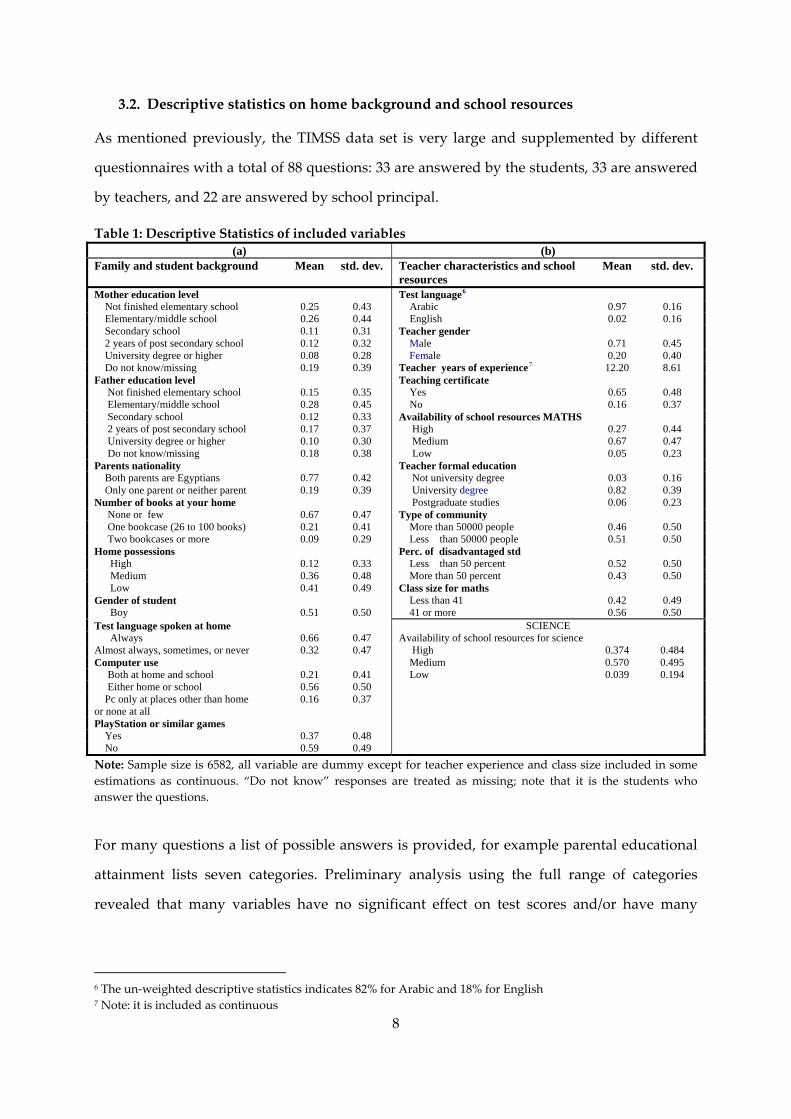
3.2. Descriptive statistics on home background and school resources
As mentioned previously, the TIMSS data set is very large and supplemented by different
questionnaires with a total of 88 questions: 33 are answered by the students, 33 are answered
by teachers, and 22 are answered by school principal.
Table 1: Descriptive Statistics of included variables (a) (b)
Family and student background Mean std. dev. Teacher characteristics and school resources
Mean std. dev.
Mother education level Test language6 Not finished elementary school 0.25 0.43 Arabic 0.97 0.16 Elementary/middle school 0.26 0.44 English 0.02 0.16 Secondary school 0.11 0.31 Teacher gender 2 years of post secondary school 0.12 0.32 Male 0.71 0.45 University degree or higher 0.08 0.28 Female 0.20 0.40 Do not know/missing 0.19 0.39 Teacher years of experience7 12.20 8.61 Father education level Teaching certificate Not finished elementary school 0.15 0.35 Yes 0.65 0.48 Elementary/middle school 0.28 0.45 No 0.16 0.37 Secondary school 0.12 0.33 Availability of school resources MATHS 2 years of post secondary school 0.17 0.37 High 0.27 0.44 University degree or higher 0.10 0.30 Medium 0.67 0.47 Do not know/missing 0.18 0.38 Low 0.05 0.23 Parents nationality Teacher formal education Both parents are Egyptians 0.77 0.42 Not university degree 0.03 0.16 Only one parent or neither parent 0.19 0.39 University degree 0.82 0.39 Number of books at your home Postgraduate studies 0.06 0.23 None or few 0.67 0.47 Type of community One bookcase (26 to 100 books) 0.21 0.41 More than 50000 people 0.46 0.50 Two bookcases or more 0.09 0.29 Less than 50000 people 0.51 0.50 Home possessions Perc. of disadvantaged std High 0.12 0.33 Less than 50 percent 0.52 0.50 Medium 0.36 0.48 More than 50 percent 0.43 0.50 Low 0.41 0.49 Class size for maths Gender of student Less than 41 0.42 0.49 Boy 0.51 0.50 41 or more 0.56 0.50 Test language spoken at home SCIENCE Always 0.66 0.47 Availability of school resources for science Almost always, sometimes, or never 0.32 0.47 High 0.374 0.484 Computer use Medium 0.570 0.495 Both at home and school 0.21 0.41 Low 0.039 0.194 Either home or school 0.56 0.50 Pc only at places other than home or none at all
0.16 0.37
PlayStation or similar games Yes 0.37 0.48 No 0.59 0.49 Note: Sample size is 6582, all variable are dummy except for teacher experience and class size included in some estimations as continuous. “Do not know” responses are treated as missing; note that it is the students who answer the questions.
For many questions a list of possible answers is provided, for example parental educational
attainment lists seven categories. Preliminary analysis using the full range of categories
revealed that many variables have no significant effect on test scores and/or have many
6 The un‐weighted descriptive statistics indicates 82% for Arabic and 18% for English 7 Note: it is included as continuous
9
missing observations. Where appropriate and justified by this analysis, we have combined or
omitted categories. This section outlines the coding we use for the explanatory variables.
Table 1 panel (a) presents the descriptive statistics for student characteristics, family
background and Social‐Economic status (SES) for Egypt. Parental education includes
mother’s education and father’s education measured by the highest educational level
attained for each them measured in six categories: not finished elementary school; finished
elementary or middle school; finished secondary school; 2 years of post secondary school;
University degree or higher; and “don’t know”. The share of students in the TIMSS sample
of Egypt whose mothers have not finished elementary school is 20 percent compared to 12
percent for fathers; mother’s with university degree or higher (postgraduate studies)8 are 12
percent compared to 16 percent for fathers. Approximately 15 percent of the students
reported they do not know their mothers’ highest educational level attained, and a similar
percentage does not know their fathers’ educational level attained.
The number of books in the students’ home is coded in three categories: none or few books;
one bookcase full of books; and two bookcases or more. The share of students from homes
with no or few books is 63 percent compared to 25 percent with one bookcase and 13 percent
with two bookcases or more.
The home possessions index, used as a proxy for family SES, is coded as high, medium or
low. This index is constructed using data from four selected variables investigating different
types of possessions: computer; study desk; internet connection; and satellite TV channels.
Those variables were selected out of eight variables indicating home possessions using
principal component analysis to identify the most influential variables for constructing the
index. The construction of an index is problematic. The absence of a convenient approach of
selecting variables to proxy living standards were shown by Montgomery et al. (2000), who
argue that most studies used ad‐hoc strategy to select variables. Recent studies employed
principal component analysis (PCA) to derive Social‐Economic Status (SES) indices from
data sets which have no income measures such as Demographic Health Surveys (DHS)
(Filmer and Pritchett, 2001, McKenzie, 2005).
8 The coding refers to postgraduate education but may not mean a Masters or PhD; it is likely to refer to other higher or professional qualification.
10
PCA was employed to capture the most influential variables among eight variables. A home
possession index was then constructed using the most influential variables based on their
shares in explaining the variation in the PCA. The share of students who coded high is 24
percent, 36 percent coded low and 39 percent coded medium (Appendix B).
Parents’ nationality is measured by two categories: both parents are Egyptian; one or both
have foreign nationality. Almost 84 percent of students are of Egyptian parents. The test
language is either Arabic or English. The majority of students took the TIMSS maths test in
Arabic (83 percent of the sample). “How often the language of testing spoken at home?” is
measured by two categories: always spoken at home; and with “almost always”,
“sometimes”, and “never” combined into one category9.
Two more variables were introduced to investigate their impact on student achievement.
Computer use is coded in three categories: both at home and school (28 percent); either at
home or school (56 percent); and only at places other than home/school or not at all (16
percent). Empirical evidence from a study on “home computer use and development of
human capital” indicates that home computer use had significantly lowered the Romanian
students’ grades in Maths, English, and Romanian especially for low‐income children
(Malamud and Pop‐Eleches, 2011). Students were asked if they have a PlayStation or similar
games at home; 42 percent responded yes and 58 percent said no. The effect of this on test
scores is ambiguous; it could reduce scores if access to games is a distraction from study at
home, but if having such games is an indicator of household wealth it may be positively
associated with test scores if students from wealthier households tend to perform better (the
index of possessions is our only control for household assets).
Table 1 panel (b) reports descriptive statistics for Teachers’ characteristics and school
resources. 80 percent of maths teachers are men. Teachers’ experience is measured by years
of teaching which we coded in three categories: less than 10 years experience (35 percent for
maths); 11 to 19 years (38 percent); and 20 years or more (27 percent). Some 82 percent of
teachers have a teaching certificate. Teachers’ formal education level attained is coded in
9 ‘Almost always’ is combined with other group to capture any other language spoken at home (so ‘always’ means only one language spoken)
11
three categories: below university degree (two percent); university degree (89 percent); and
postgraduate degree.
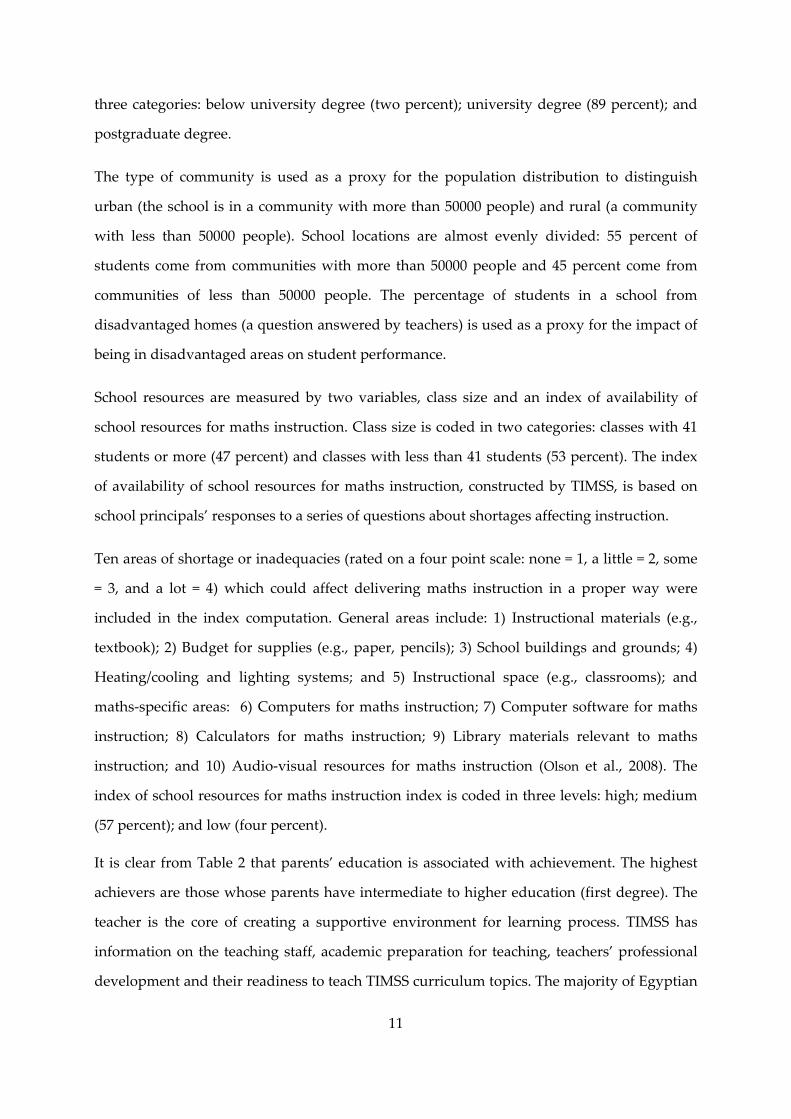
The type of community is used as a proxy for the population distribution to distinguish
urban (the school is in a community with more than 50000 people) and rural (a community
with less than 50000 people). School locations are almost evenly divided: 55 percent of
students come from communities with more than 50000 people and 45 percent come from
communities of less than 50000 people. The percentage of students in a school from
disadvantaged homes (a question answered by teachers) is used as a proxy for the impact of
being in disadvantaged areas on student performance.
School resources are measured by two variables, class size and an index of availability of
school resources for maths instruction. Class size is coded in two categories: classes with 41
students or more (47 percent) and classes with less than 41 students (53 percent). The index
of availability of school resources for maths instruction, constructed by TIMSS, is based on
school principals’ responses to a series of questions about shortages affecting instruction.
Ten areas of shortage or inadequacies (rated on a four point scale: none = 1, a little = 2, some
= 3, and a lot = 4) which could affect delivering maths instruction in a proper way were
included in the index computation. General areas include: 1) Instructional materials (e.g.,
textbook); 2) Budget for supplies (e.g., paper, pencils); 3) School buildings and grounds; 4)
Heating/cooling and lighting systems; and 5) Instructional space (e.g., classrooms); and
maths‐specific areas: 6) Computers for maths instruction; 7) Computer software for maths
instruction; 8) Calculators for maths instruction; 9) Library materials relevant to maths
instruction; and 10) Audio‐visual resources for maths instruction (Olson et al., 2008). The
index of school resources for maths instruction index is coded in three levels: high; medium
(57 percent); and low (four percent).
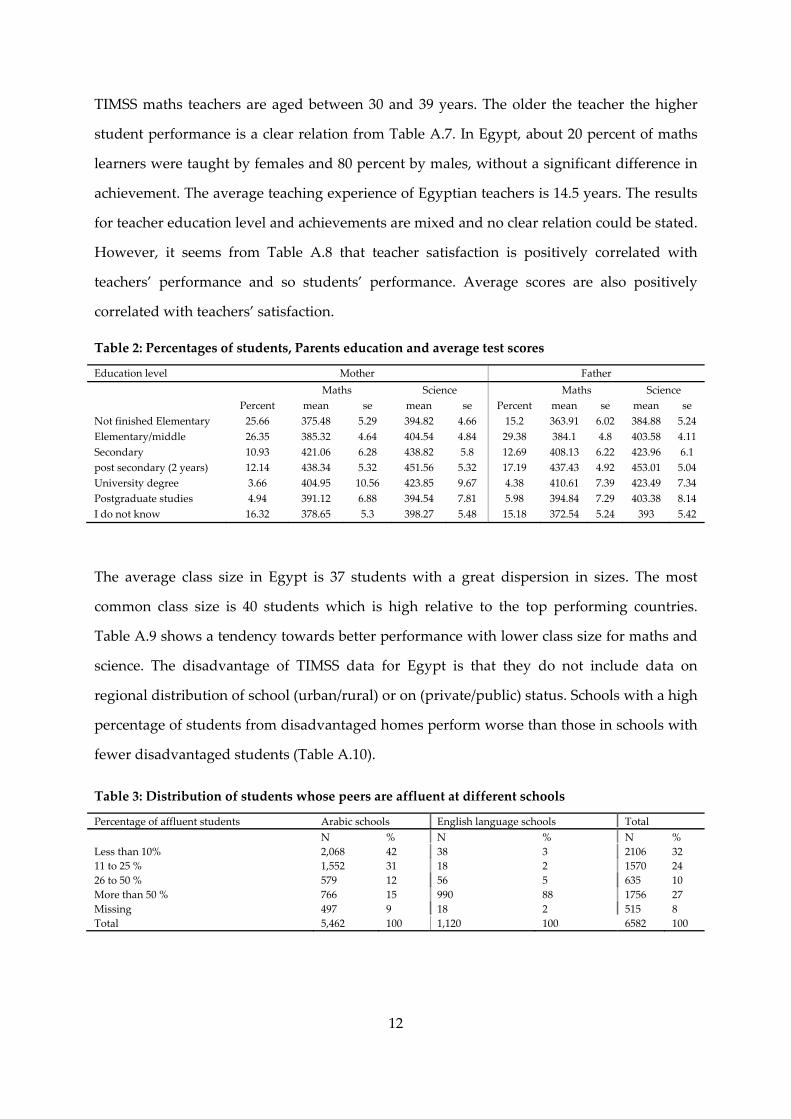
It is clear from Table 2 that parents’ education is associated with achievement. The highest
achievers are those whose parents have intermediate to higher education (first degree). The
teacher is the core of creating a supportive environment for learning process. TIMSS has
information on the teaching staff, academic preparation for teaching, teachers’ professional
development and their readiness to teach TIMSS curriculum topics. The majority of Egyptian
12
TIMSS maths teachers are aged between 30 and 39 years. The older the teacher the higher
student performance is a clear relation from Table A.7. In Egypt, about 20 percent of maths
learners were taught by females and 80 percent by males, without a significant difference in
achievement. The average teaching experience of Egyptian teachers is 14.5 years. The results
for teacher education level and achievements are mixed and no clear relation could be stated.
However, it seems from Table A.8 that teacher satisfaction is positively correlated with
teachers’ performance and so students’ performance. Average scores are also positively
correlated with teachers’ satisfaction.
Table 2: Percentages of students, Parents education and average test scores
Education level Mother Father Maths Science Maths Science Percent mean se mean se Percent mean se mean se
Not finished Elementary 25.66 375.48 5.29 394.82 4.66 15.2 363.91 6.02 384.88 5.24 Elementary/middle 26.35 385.32 4.64 404.54 4.84 29.38 384.1 4.8 403.58 4.11 Secondary 10.93 421.06 6.28 438.82 5.8 12.69 408.13 6.22 423.96 6.1 post secondary (2 years) 12.14 438.34 5.32 451.56 5.32 17.19 437.43 4.92 453.01 5.04 University degree 3.66 404.95 10.56 423.85 9.67 4.38 410.61 7.39 423.49 7.34 Postgraduate studies 4.94 391.12 6.88 394.54 7.81 5.98 394.84 7.29 403.38 8.14 I do not know 16.32 378.65 5.3 398.27 5.48 15.18 372.54 5.24 393 5.42
The average class size in Egypt is 37 students with a great dispersion in sizes. The most
common class size is 40 students which is high relative to the top performing countries.
Table A.9 shows a tendency towards better performance with lower class size for maths and
science. The disadvantage of TIMSS data for Egypt is that they do not include data on
regional distribution of school (urban/rural) or on (private/public) status. Schools with a high
percentage of students from disadvantaged homes perform worse than those in schools with
fewer disadvantaged students (Table A.10).
Table 3: Distribution of students whose peers are affluent at different schools
Percentage of affluent students Arabic schools English language schools Total N % N % N %
Less than 10% 2,068 42 38 3 2106 32 11 to 25 % 1,552 31 18 2 1570 24 26 to 50 % 579 12 56 5 635 10 More than 50 % 766 15 990 88 1756 27 Missing 497 9 18 2 515 8 Total 5,462 100 1,120 100 6582 100
13
Students were tested in either Arabic or English; we assume that those tested in Arabic are
enrolled in Arabic schools and the others are in English language schools. The language
schools in Egypt are mainly private schools but there are also public experimental language
schools, but TIMSS does not identify these. The data indicate a bigger share of affluent
students enrolled language schools (Table 3).
4. The Empirical model
The underlying model is very straightforward. The output of the educational process is
directly related to a group of inputs by an education production function (EPF). We use
student standardized achievements in test scores as a measure of output. Inputs include
characteristics of schools, teachers, and other non‐student variables; and student SES
variables such as family characteristics and home resources.
We estimate an education production function of the following form:
0 1 2is is s isA F Sβ δ δ ε= + + + (1)10
Where A is the test score of student i in school11 s, F is a vector of family background
variables and S is a vector of school characteristics variables. The coefficient vectors α, 1δ and
2δ are to be estimated. The error term ε has two components as we have two‐stage stratified
sample, the imputation error on student’s level and the sample error at the school level.
Table 1 described in detail the variables included in our estimations.
School inputs and school choice will be the parents’ decision; parents may make residential
choice to ensure that their children are taught in a good school (small class size, good
teachers or available facilities). Parents, teachers, and schools make choices that might give
rise to a non‐causal association between school inputs and student achievement even after
controlling for family background. This makes the empirical investigation complex seeking
identification and examining the sources of the effects by different techniques and
methodologies to ensure the right interpretations of results.
10 We include D, a vector of dummy variables for each variable both in F and S to capture the effect of missing observations; a dummy takes the value 1 for observation with missing data and 0 otherwise (the variables themselves are set to zero if their values are missing). 11 Egypt’s sample selects only one class from each school, simplifying notation to students and schools only.
14
5. Main Results
The results of estimating the education production functions, equation (1), for TIMSS
achievement test scores in Egypt are discussed comparatively for maths and science (Table
4). The explanatory variables are organized in blocks, starting with measures of family
background and student characteristics, followed by teacher characteristics and school
features. In addition a critical look is paid to possible role of school type, interaction effects,
school fixed effects and test language differences. The dependant variables are the plausible
values for test scores in maths and Science.
5.1. Students background
We employ three sets of dummy variables to reflect the family background of students: the
father’s education level, the mother’s education level, and the number of books at home. We
also include various variables to capture a broader picture of student background and socio‐
economic status.
5.1.1. Parental education
For Maths, student level variables have the largest and most significant coefficients in the
production function. Children of a mother with secondary or two years post‐secondary
education perform better than children of a mother with elementary or middle school. The
results suggest a significant 17 point test score increase for students if their mother has two
years’ post‐secondary education (compared to mother with no education or did not finish
elementary school) and 15 point increase if the mother has secondary education. Although
scores are lower for students whose mother finished university or postgraduate studies, this
is not significant.
Similar results are obtained for father’s education. Fathers who completed middle and
secondary school increase test score by 13 and 26 points respectively compared to those who
did not complete primary education. Having a father with university or postgraduate
education has the lowest (and insignificant) impact on test scores compared to a father who
did not complete primary education (but not significant), while a father who completed two
years post‐secondary has the greatest impact (an increase of 35 points).
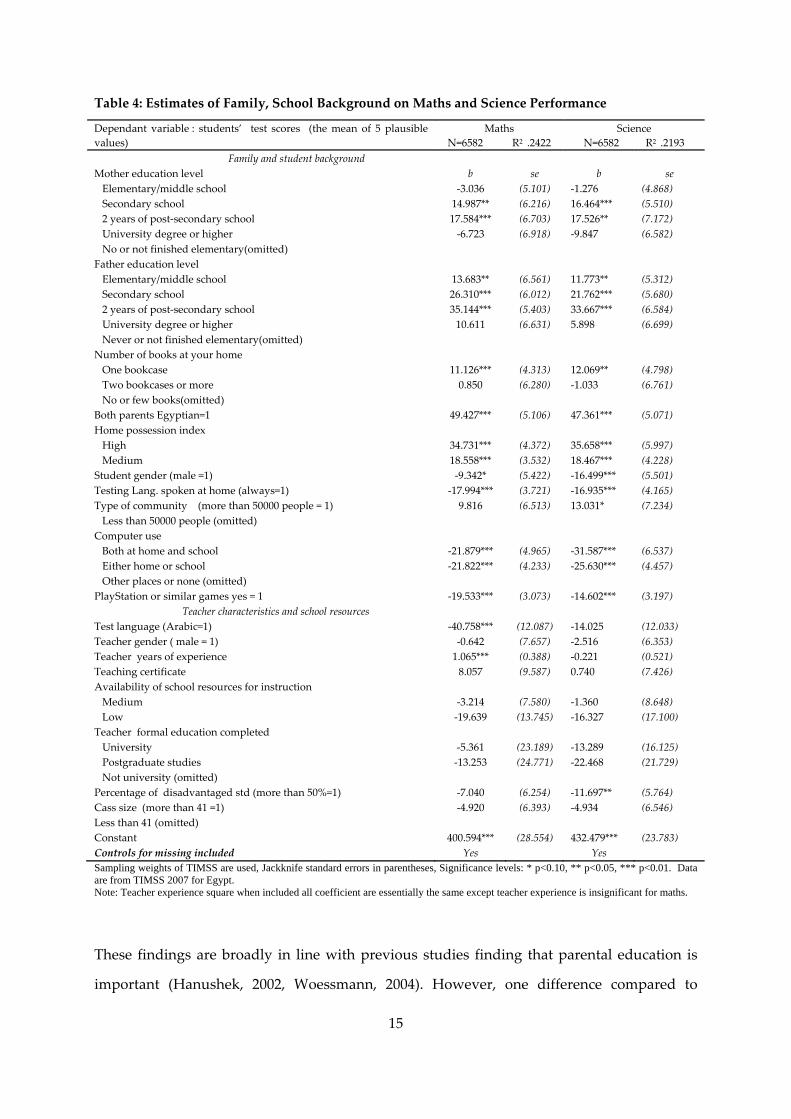
15
Table 4: Estimates of Family, School Background on Maths and Science Performance
Dependant variable : students’ test scores (the mean of 5 plausible values)
Maths N=6582 R2 .2422
Science N=6582 R2 .2193
Family and student background Mother education level b se b se Elementary/middle school ‐3.036 (5.101) ‐1.276 (4.868) Secondary school 14.987** (6.216) 16.464*** (5.510) 2 years of post‐secondary school 17.584*** (6.703) 17.526** (7.172) University degree or higher ‐6.723 (6.918) ‐9.847 (6.582) No or not finished elementary(omitted) Father education level Elementary/middle school 13.683** (6.561) 11.773** (5.312) Secondary school 26.310*** (6.012) 21.762*** (5.680) 2 years of post‐secondary school 35.144*** (5.403) 33.667*** (6.584) University degree or higher 10.611 (6.631) 5.898 (6.699) Never or not finished elementary(omitted) Number of books at your home One bookcase 11.126*** (4.313) 12.069** (4.798) Two bookcases or more 0.850 (6.280) ‐1.033 (6.761) No or few books(omitted) Both parents Egyptian=1 49.427*** (5.106) 47.361*** (5.071) Home possession index High 34.731*** (4.372) 35.658*** (5.997) Medium 18.558*** (3.532) 18.467*** (4.228) Student gender (male =1) ‐9.342* (5.422) ‐16.499*** (5.501) Testing Lang. spoken at home (always=1) ‐17.994*** (3.721) ‐16.935*** (4.165) Type of community (more than 50000 people = 1) 9.816 (6.513) 13.031* (7.234) Less than 50000 people (omitted) Computer use Both at home and school ‐21.879*** (4.965) ‐31.587*** (6.537) Either home or school ‐21.822*** (4.233) ‐25.630*** (4.457) Other places or none (omitted) PlayStation or similar games yes = 1 ‐19.533*** (3.073) ‐14.602*** (3.197) Teacher characteristics and school resources Test language (Arabic=1) ‐40.758*** (12.087) ‐14.025 (12.033) Teacher gender ( male = 1) ‐0.642 (7.657) ‐2.516 (6.353) Teacher years of experience 1.065*** (0.388) ‐0.221 (0.521) Teaching certificate 8.057 (9.587) 0.740 (7.426) Availability of school resources for instruction Medium ‐3.214 (7.580) ‐1.360 (8.648) Low ‐19.639 (13.745) ‐16.327 (17.100) Teacher formal education completed University ‐5.361 (23.189) ‐13.289 (16.125) Postgraduate studies ‐13.253 (24.771) ‐22.468 (21.729) Not university (omitted) Percentage of disadvantaged std (more than 50%=1) ‐7.040 (6.254) ‐11.697** (5.764) Cass size (more than 41 =1) ‐4.920 (6.393) ‐4.934 (6.546) Less than 41 (omitted) Constant 400.594*** (28.554) 432.479*** (23.783) Controls for missing included Yes Yes Sampling weights of TIMSS are used, Jackknife standard errors in parentheses, Significance levels: * p<0.10, ** p<0.05, *** p<0.01. Data are from TIMSS 2007 for Egypt. Note: Teacher experience square when included all coefficient are essentially the same except teacher experience is insignificant for maths.
These findings are broadly in line with previous studies finding that parental education is
important (Hanushek, 2002, Woessmann, 2004). However, one difference compared to
16
results for many other countries, especially developed countries, is that the effect appears
non‐monotonic. In Egypt, having more educated parents is associated with higher scores up
to parents with post‐secondary (but pre‐University) education but the effect of more
education becomes negative beyond this (although, for fathers, scores are still higher
compared to not having completed primary education). The lower impact of parents with
university or postgraduate education may be because both parents are working so there is
less home support for study, or it could be that the most educated parents have relatively
lower aspirations for their children compared to pre‐University educated parents (who want
their children to have a better education than they had themselves).
Father’s education appears more important than mother’s for student performance in Egypt.
Levels of education attained indicate a larger influence of fathers’ education than mothers’
on student test scores as well as a positive effect at all levels compared to negative
coefficients for mother’s highest and lowest levels of education.
Student achievement in science is better than maths: average scores in science are higher by
18 points. The coefficients estimates from the regression for the science test scores are similar
to the maths estimates with respect to parent’s education and books at student’s home.
Parents’ education follows the same non‐monotonic pattern of impact as for Maths. A
student whose mother completed secondary or post‐secondary education (but not
university) performs better compared to students whose mother did not finish her primary
education, by 17 and 18 points respectively. Fathers’ education has an increasing impact on
performance in science: Completing middle school increases test scores by 12 points
compared to a father with no education, completing secondary school improves test scores
by 22 points, and completing post secondary (two years) adds 34 points. Parents with
university degree or higher have no significant impact on their children’s performance in
science.
5.1.2. Home possessions and books at home: Socio‐Economic Status (SES)
The third indicator of family background is the number of books in the students’ home. Only
having one bookcase made a significant difference, increasing test scores by 11 points for
17
maths and 12 points for science compared to students from homes with no or few books. It is
surprising that having two bookcases or more was not significant. One possible explanation
is that those students who answered two bookcases or more are misreporting (bookcases
could be of different sizes or they may be including magazines and newspapers, though the
questionnaire told them not to count them). Another explanation supports the conjecture for
parental education if highly educated parents have more books at home but give less
support to their children in study.
The home possessions index (a proxy for the SES of the family) suggests that the impact of
family SES on students’ educational achievements is large and significant: a high level of SES
increases test scores by 35 and 36 points for math and science respectively and medium
levels by 19 and 18 points compared to the reference group of low SES. The effect of high SES
is double the effect of medium level SES.
Private tutoring, or ‘shadow education’, is prevalent in Egypt and is likely to be one
mechanism by which SES influences achievement. The tutoring market includes all types of
schools and students at different stages of education depend on different types of tutoring.
The most focused concentration is on the ninth grade and the secondary stage exit exams.
Although, private tutoring is prohibited by law; this is not enforced and hence ignored
(Hartmann, 2008). The ninth grade exams determine whether the student will be qualified to
go to a ‘prestigious’ general secondary which will lead to university, and the secondary stage
exit exams determine which colleges may admit a student. All grades with yearly exit exams
create pressure on families for private tutoring.
5.1.3. Nationality and home spoken language
Native students perform better than non‐natives for maths and science (the effect magnitude
is slightly less for science). Students of Egyptian parents perform significantly better than
students with one or both parents being foreign. The dummy variable for nationality has the
largest effect on student test scores of all the significant explanatory variables ‐ a 49 and 47
point test score increase in maths and science respectively. This is in line with findings from
Woessmann (2004) on Europe and the US.
18
One surprising result is that students who always speak the test language at home perform
significantly less well than those who speak another language. The results suggest 18 and 17
point increases if the language spoken at home is not always the test language for maths and
science respectively. Out of the students who always speak the test language at home (61%
of TIMSS sample), 88.7% of them took the Arabic test and only 11.3% took the English
version of science test. However both English and Arabic test takers exhibit the
counterintuitive result that always speaking the test language is associated with lower
performance.
Table 5: Test language frequently spoken at home and students’ achievement
Home spoken lang. Language of testing N % total Maths Science
Mean se Std.dev Mean se Std.dev Always Arabic 3551 54.77 382.96 (4.06) 96.11 401.55 (3.96) 95.31
4003 (61.75) English 452 6.97 467.4 (10.07) 84.81 456.19 (12.46) 86.64
Almost always Arabic 797 12.29 415.29 (5.02) 104.59 431.35 (5.45) 104.64
1129 (17.41) English 332 5.12 490.45 (5.82) 71.88 484.25 (7.4) 74.99
Sometimes Arabic 861 13.28 398.39 (6.53) 99.83 417.93 (6.21) 101.37
1048 (16.17) English 187 2.88 492.64 (9.01) 72.11 476.44 (6.1) 73.08
Never Arabic 160 2.47 370.38 (13.06) 101.31 392.71 (13.29) 101.47
303 (4.67) English 143 2.21 488.57 (12.86) 87.1 468.01 (15.23) 87.8
Descriptive statistics (Table 5) show that students who took the English test perform better at
all levels of regularity of speaking the language at home. Students who speak other
languages at home beside the test language perform better than students who either always
or never speak the test language at home. Re‐estimating using a different default category
test language shows that students who speak the language of testing either ʺalmost alwaysʺ,
ʺsometimesʺ or ʺneverʺ perform statistically significantly better by 22 points of test scores in
maths higher than students who ʺalwaysʺ speak the test language at home. As ‘natives’
perform better this suggest either poor performing non‐Egyptian Arabs or better performing
Egyptians in ‘multi‐lingual’ households.
5.1.4. Gender Differences
The gender gap in general is weakly significant (10%) except for science where girls
outperform boys by 13 points (statistically significant at the 5% level). Nevertheless, girls
generally perform better than boys in both TIMSS tests (see further analysis in subsection
6.1). This is only true in 2007‐ there was no significant difference in 2003 (Table A.5).
19
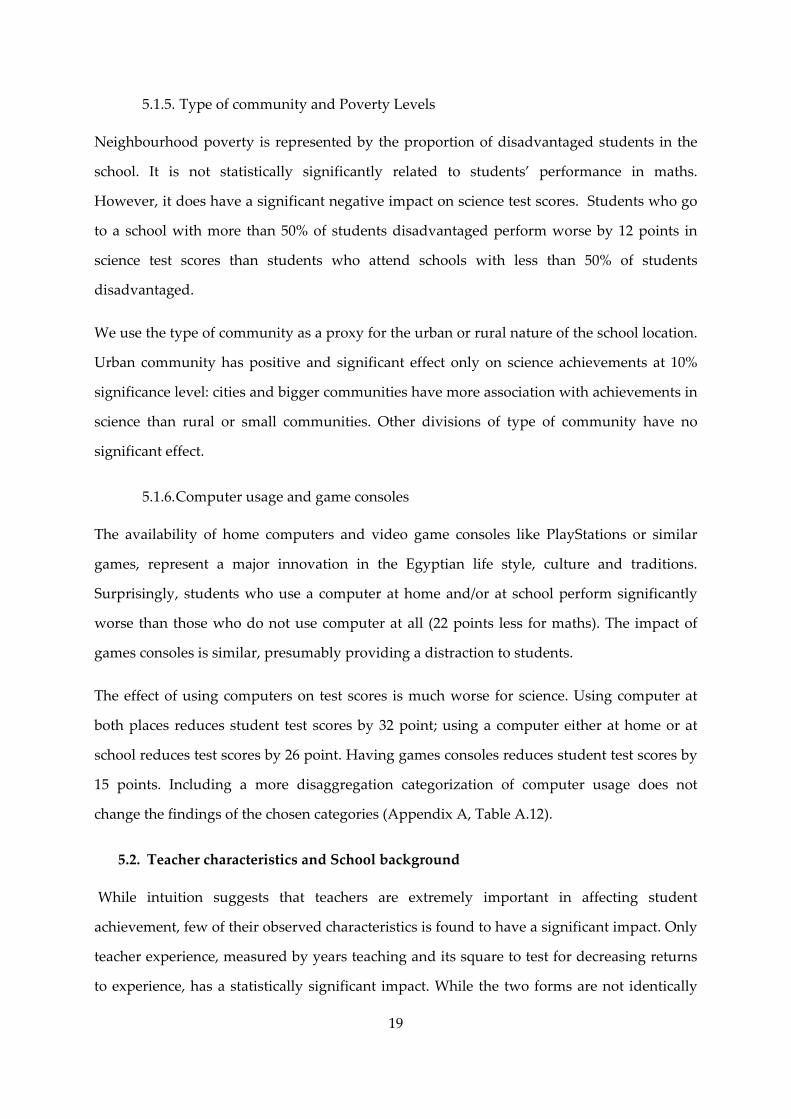
5.1.5. Type of community and Poverty Levels
Neighbourhood poverty is represented by the proportion of disadvantaged students in the
school. It is not statistically significantly related to students’ performance in maths.
However, it does have a significant negative impact on science test scores. Students who go
to a school with more than 50% of students disadvantaged perform worse by 12 points in
science test scores than students who attend schools with less than 50% of students
disadvantaged.
We use the type of community as a proxy for the urban or rural nature of the school location.
Urban community has positive and significant effect only on science achievements at 10%
significance level: cities and bigger communities have more association with achievements in
science than rural or small communities. Other divisions of type of community have no
significant effect.
5.1.6. Computer usage and game consoles
The availability of home computers and video game consoles like PlayStations or similar
games, represent a major innovation in the Egyptian life style, culture and traditions.
Surprisingly, students who use a computer at home and/or at school perform significantly
worse than those who do not use computer at all (22 points less for maths). The impact of
games consoles is similar, presumably providing a distraction to students.
The effect of using computers on test scores is much worse for science. Using computer at
both places reduces student test scores by 32 point; using a computer either at home or at
school reduces test scores by 26 point. Having games consoles reduces student test scores by
15 points. Including a more disaggregation categorization of computer usage does not
change the findings of the chosen categories (Appendix A, Table A.12).
5.2. Teacher characteristics and School background
While intuition suggests that teachers are extremely important in affecting student
achievement, few of their observed characteristics is found to have a significant impact. Only
teacher experience, measured by years teaching and its square to test for decreasing returns
to experience, has a statistically significant impact. While the two forms are not identically
20
significant, they are jointly different from zero at 5% of significance, and when the squared
teacher experience term is dropped, teacher experience in years has a significant positive
effect on test scores.
School background and resource endowment are measured by an index for the availability of
school resources and by class size. The school resources availability index12 has no effect on
performance, although low school resources are associated with lower test scores for both
maths and science. Class size is one of the most important measures of school endowment in
the literature but also shows no significant influence on student performance.
We measured class size by dummy variables for three intervals: high (above 41), medium (25
to 40), and low (1 to 24). With ʺhighʺ as the default, neither the ʺlowʺ or ʺmediumʺ dummies
were significant. The World Bank has argued it is only when class sizes reach the ʺlargeʺ
category that they start to impede performance. However, including only the ʺlargeʺ dummy
(and so combining the other two as the default) reveals no significant effect in Egypt. These
findings are counter‐intuitive but nonetheless in line with many previous studies since the
Coleman report in 1966 (Woessmann, 2003, 2004; Hanushek, 2007).
The last remaining finding concerns the impact of the test language used in the TIMSS test.
The results differ for maths and science: testing language is insignificant for science, but
students who take the maths test in English perform significantly better than those who take
the test in Arabic. This striking finding is subject to further investigation later, in subsection
7.2.
6. Further analysis using interactions
To elaborate on the main findings, a series of interaction terms were used to explore three
issues: gender differences, home spoken language, and parents’ education and how they
vary with respect to other influential factors. Table 6 reports significant results for gender
interactions (full details in Appendix A).
12 The index is composed using factor analysis technique including five major school variables and five subject specific indicators for both Math and science (TIMSS Technical report, 2009). Disaggregating the index indicates very few significant effects for some levels and suffers from multicollinearity.
21
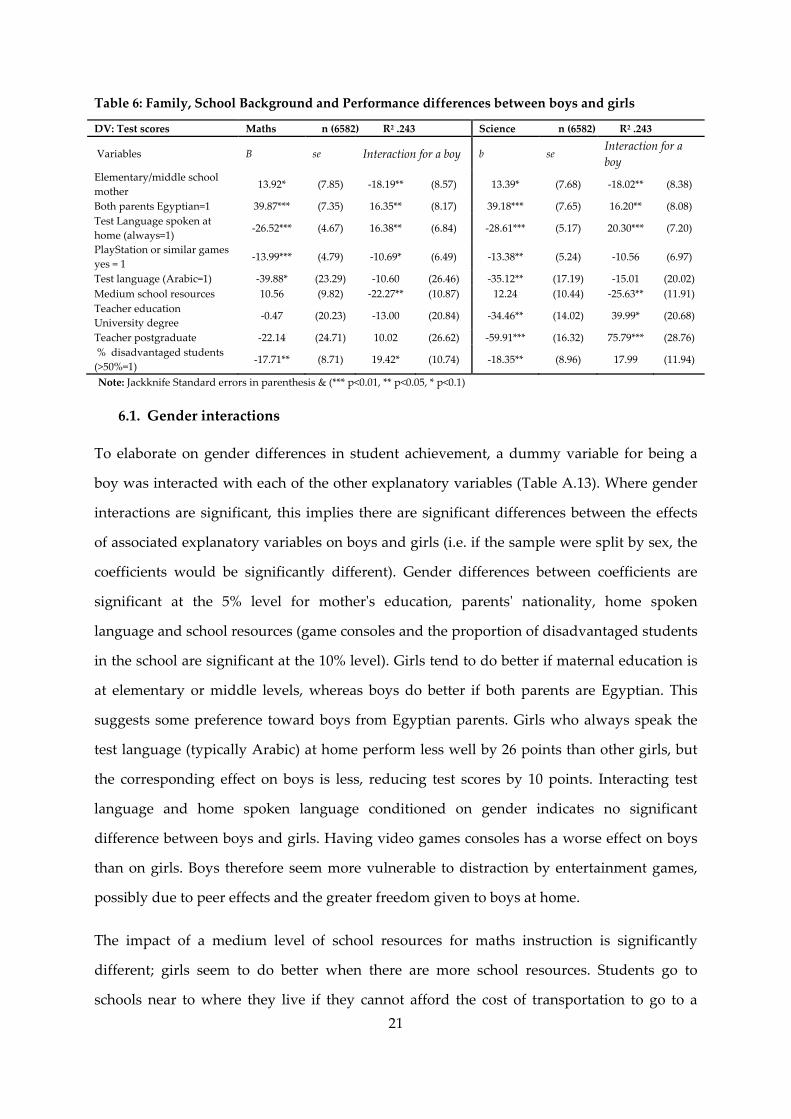
Table 6: Family, School Background and Performance differences between boys and girls
DV: Test scores Maths n (6582) R2 .243 Science n (6582) R2 .243
Variables B se Interaction for a boy b se Interaction for a boy
Elementary/middle school mother
13.92* (7.85) ‐18.19** (8.57) 13.39* (7.68) ‐18.02** (8.38)
Both parents Egyptian=1 39.87*** (7.35) 16.35** (8.17) 39.18*** (7.65) 16.20** (8.08) Test Language spoken at home (always=1)
‐26.52*** (4.67) 16.38** (6.84) ‐28.61*** (5.17) 20.30*** (7.20)
PlayStation or similar games yes = 1
‐13.99*** (4.79) ‐10.69* (6.49) ‐13.38** (5.24) ‐10.56 (6.97)
Test language (Arabic=1) ‐39.88* (23.29) ‐10.60 (26.46) ‐35.12** (17.19) ‐15.01 (20.02) Medium school resources 10.56 (9.82) ‐22.27** (10.87) 12.24 (10.44) ‐25.63** (11.91) Teacher education University degree
‐0.47 (20.23) ‐13.00 (20.84) ‐34.46** (14.02) 39.99* (20.68)
Teacher postgraduate ‐22.14 (24.71) 10.02 (26.62) ‐59.91*** (16.32) 75.79*** (28.76) % disadvantaged students (>50%=1)
‐17.71** (8.71) 19.42* (10.74) ‐18.35** (8.96) 17.99 (11.94)
Note: Jackknife Standard errors in parenthesis & (*** p<0.01, ** p<0.05, * p<0.1)
6.1. Gender interactions
To elaborate on gender differences in student achievement, a dummy variable for being a
boy was interacted with each of the other explanatory variables (Table A.13). Where gender
interactions are significant, this implies there are significant differences between the effects
of associated explanatory variables on boys and girls (i.e. if the sample were split by sex, the
coefficients would be significantly different). Gender differences between coefficients are
significant at the 5% level for motherʹs education, parentsʹ nationality, home spoken
language and school resources (game consoles and the proportion of disadvantaged students
in the school are significant at the 10% level). Girls tend to do better if maternal education is
at elementary or middle levels, whereas boys do better if both parents are Egyptian. This
suggests some preference toward boys from Egyptian parents. Girls who always speak the
test language (typically Arabic) at home perform less well by 26 points than other girls, but
the corresponding effect on boys is less, reducing test scores by 10 points. Interacting test
language and home spoken language conditioned on gender indicates no significant
difference between boys and girls. Having video games consoles has a worse effect on boys
than on girls. Boys therefore seem more vulnerable to distraction by entertainment games,
possibly due to peer effects and the greater freedom given to boys at home.
The impact of a medium level of school resources for maths instruction is significantly
different; girls seem to do better when there are more school resources. Students go to
schools near to where they live if they cannot afford the cost of transportation to go to a
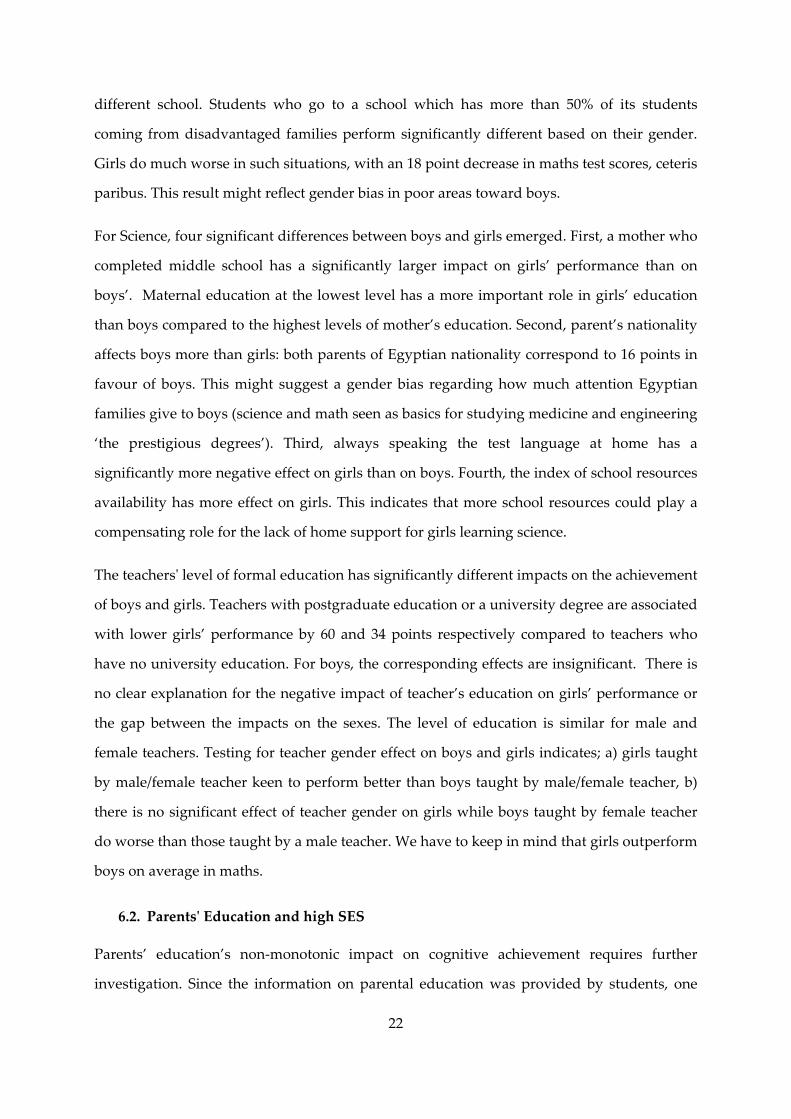
22
different school. Students who go to a school which has more than 50% of its students
coming from disadvantaged families perform significantly different based on their gender.
Girls do much worse in such situations, with an 18 point decrease in maths test scores, ceteris
paribus. This result might reflect gender bias in poor areas toward boys.
For Science, four significant differences between boys and girls emerged. First, a mother who
completed middle school has a significantly larger impact on girls’ performance than on
boys’. Maternal education at the lowest level has a more important role in girls’ education
than boys compared to the highest levels of mother’s education. Second, parent’s nationality
affects boys more than girls: both parents of Egyptian nationality correspond to 16 points in
favour of boys. This might suggest a gender bias regarding how much attention Egyptian
families give to boys (science and math seen as basics for studying medicine and engineering
‘the prestigious degrees’). Third, always speaking the test language at home has a
significantly more negative effect on girls than on boys. Fourth, the index of school resources
availability has more effect on girls. This indicates that more school resources could play a
compensating role for the lack of home support for girls learning science.
The teachersʹ level of formal education has significantly different impacts on the achievement
of boys and girls. Teachers with postgraduate education or a university degree are associated
with lower girls’ performance by 60 and 34 points respectively compared to teachers who
have no university education. For boys, the corresponding effects are insignificant. There is
no clear explanation for the negative impact of teacher’s education on girls’ performance or
the gap between the impacts on the sexes. The level of education is similar for male and
female teachers. Testing for teacher gender effect on boys and girls indicates; a) girls taught
by male/female teacher keen to perform better than boys taught by male/female teacher, b)
there is no significant effect of teacher gender on girls while boys taught by female teacher
do worse than those taught by a male teacher. We have to keep in mind that girls outperform
boys on average in maths.
6.2. Parentsʹ Education and high SES
Parents’ education’s non‐monotonic impact on cognitive achievement requires further
investigation. Since the information on parental education was provided by students, one
23
possibility is that it is reporting error which leads to the apparent non‐monotonicity.
Academically weaker students may exaggerate the education of their parents and this ‘top
level’ may not all mean university, leading to a downward bias in its estimated effect.
However, the distribution of parents’ level of education from TIMSS is similar to the
distribution of population education according to the 2006 population census in Egypt. The
only exception is that census data show a lower percentage with postgraduate or equivalent
studies.
To investigate further the effect of parents’ education we interact parent’s education levels
with the status of high home possessions index (to proxy high SES). However, one should be
careful here in drawing conclusions given the over‐representation of postgraduate education
in TIMSS. The results in (Table A.15) indicate that a student whose mother has a university
degree or higher but does not have a high level of home possessions performs significantly
worse than a mother with high home possessions. The impact on performance differs
significantly for home possessions and the size of difference is 24.8 points of test scores. This
means that students whose mother has a university degree or postgraduate degree and has a
high level of home possessions perform better by 12 points (25 ‐ 13). We observe the same
patterns for father’s education.
Before drawing a general conclusion let us look first at the results from the interaction term
of father’s education with high home possession index. Fathers who completed higher
education and in high SES affects children’s performance more than those in low SES. This
result is implied from the significant difference between the two cases. This is to say that
parents’ education at the highest level [university/PG] should be accompanied by high SES
to increase students’ performance.
6.3. Parentsʹ education effect and Parental support
We use measures of parental support as reported by the students’ maths teachers. We
excluded this measure from the core estimates because of likely endogeneity but explore it
here to see if the puzzling negative effect of having highly educated parents’ is related to
their lack of support for their childrenʹs studies. A high parental support increases student
test scores on math and science column (1) Table A.16. However, the inclusion of parental
24
support variables does not change the no‐monotonic effect of parents’ education. The
parents’ level of support is different for different level of education of parents. The share of
high supportive parents who got a post secondary education but not a university degree is
more than those with university degree.
Column (2) in Table A.16 shows the interaction estimates of father’s education with the high
level of parental support. The results indicate that there is significant difference for the high
level of parental support for highly educated father compared to low level of support. The
difference reaches 27 points for maths and 20 point for science achievement. A mother
education interaction indicates no significant difference for the highly supportive parents at
any level of mother’s education. Those results, for parent’s education interaction with
parental support, indicate that father’s support is more important for better achievement
than maternal support. In societies where the man has the main earning responsibility better
educated fathers may invest more in their children’s education. This type of monetary
support could be directly related to the phenomenon of private tutoring. The interpretation
of parental support here takes the form of the ability to afford the alternative form of
education or what is called the shadow education. Similar results apply to science scores
column (3) and (4) Table A.16 with one difference that medium parental support would
work significantly for better achievements for both mother and father.
6.4. Parental education interaction with computer usage
Social changes are influenced by technological developments. We have looked at how some
IT technologies have affected Egyptian students and their families. However, the impact of
computing resources could be different across students with different parental backgrounds
(i.e. parental education). We explore this by using interaction terms between computer use
and parental education. For students whose fathers have a university degree or higher level
of education, using computers both at home and at school does not appear to affect their
achievement (see Table A.17). In general higher parent’s education reduces the negative
impact of computer use. Similar results apply to science scores. These results go in line with
the findings of Malamud and Pop‐Eleches (2011) on the home computer use effect on
children in Romania.
25
Parents with higher education have a significant reducing effect on the harm caused by
computer usage by Egyptian students. The negative effects of computer usage on test scores
were reduced in families with highly educated parents for both maths and science.
7. School Effects and school types
Controlling for observable school and teacher characteristics in education production
function indicates that school level variables are not so important in explaining the variations
in students’ achievements. It is the ability to control for unobservable school fixed effects that
allows the identification of school effects. The school fixed effects accounts for unobserved
differences, i.e. All school level factors that do not vary for students in that school and that
affect the learning of students.
7.1. School fixed effects
We introduce school fixed effects estimation with student and family characteristics. School
invariant variables drop out since they are perfectly collinear with school fixed effects. Under
this approach, we estimate the pure effect of student and family level variables (SES), by
controlling for the unobserved heterogeneity across schools. Dummy variables for each
school absorb the effects on students’ achievements particular to each school. This model will
assess whether some schools are more productive than others, but cannot determine which
school qualities matter (Gamoran and Long, 2006). This strategy will eliminate all variation
between schools. To implement school fixed effects, a vector of dummy variables Z for each
school is included in model (1), leading to equation (2)
0 1 2is s is is isA F Dα δ δ ε= Ζ + + + (2)
Where A is the student’s test scores of student i in school s, Z is a vector of dummy variables
one for each school and F is a vector of family background variables. The coefficient vectors
0α , 1δ and 2δ are to be estimated. The D vector of dummy variables accounts for missing
observations as above and ε is the error term. Controlling for school fixed effects should also
reduce the effect of student unobserved ability if students are grouped across schools by
similar levels of ability. We first estimate a null model with only fixed effects ( 0 sα Ζ ),
26
equation (3), to assess the existence and the magnitude of raw differences in student
achievement across schools in TIMSS.
0is s isA α ε= Ζ + (3)
Then we move to the main specification in equation (2) to check the genuine differences at
school level in Egypt. The crucial assumption for consistent estimates is that the school
dummies Z and the student and family characteristics F included in the regression equation
are not correlated with the error term. While all school and teacher characteristics S will be
eliminated.
Using normal estimation techniques will not return consistent estimates since it does not
correct for ‘alpha inflation’ and does not take care of measurement error yields from
plausible values (Wu, 2005). The alpha inflation emerges from the correlation of students in
the same class; if we do not allow for this clustering effect, the estimates will give lower
standard errors. The solution proposed by the TIMSS technical report is to use the jackknife
technique to calculate correct standard errors. The use of plausible values as mentioned
before yields some measurement error since it based on the Item Response Theory. We
employ the five plausible values to correct for measurement error in using IRT and employ
jack‐knife repeated replication to remove standard error bias. Along with the fact that we are
seeking population estimates which require using weights, we included all this in the
specification for school fixed effects.
From model (1) estimates we obtained a broad picture which shows that the major impacts
come from student and family characteristics rather than school level characteristics. The
school fixed‐effects address the question of how this picture changes once we control for all
school level factors including those unobserved.
In the school fixed‐effects regression father’s education is still more important than mother’s.
Highly educated mothers reduce maths performance by 12 points compared to mothers
without primary education. The non monotonic impact of parents’ education is still evident.
Student and family background characteristics appear to be the same in terms of sign and
significance but with lower values.
27
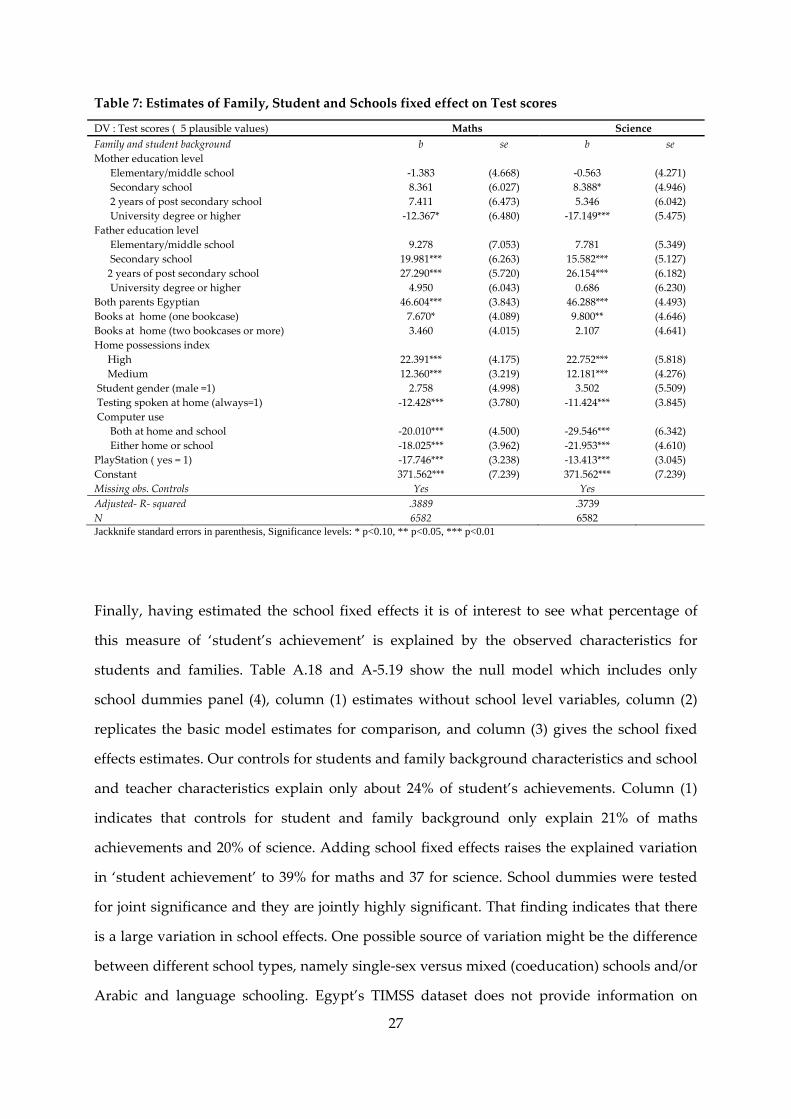
Table 7: Estimates of Family, Student and Schools fixed effect on Test scores
DV : Test scores ( 5 plausible values) Maths Science Family and student background b se b se Mother education level Elementary/middle school ‐1.383 (4.668) ‐0.563 (4.271) Secondary school 8.361 (6.027) 8.388* (4.946) 2 years of post secondary school 7.411 (6.473) 5.346 (6.042) University degree or higher ‐12.367* (6.480) ‐17.149*** (5.475) Father education level Elementary/middle school 9.278 (7.053) 7.781 (5.349) Secondary school 19.981*** (6.263) 15.582*** (5.127) 2 years of post secondary school 27.290*** (5.720) 26.154*** (6.182) University degree or higher 4.950 (6.043) 0.686 (6.230) Both parents Egyptian 46.604*** (3.843) 46.288*** (4.493) Books at home (one bookcase) 7.670* (4.089) 9.800** (4.646) Books at home (two bookcases or more) 3.460 (4.015) 2.107 (4.641) Home possessions index High 22.391*** (4.175) 22.752*** (5.818) Medium 12.360*** (3.219) 12.181*** (4.276) Student gender (male =1) 2.758 (4.998) 3.502 (5.509) Testing spoken at home (always=1) ‐12.428*** (3.780) ‐11.424*** (3.845) Computer use Both at home and school ‐20.010*** (4.500) ‐29.546*** (6.342) Either home or school ‐18.025*** (3.962) ‐21.953*** (4.610) PlayStation ( yes = 1) ‐17.746*** (3.238) ‐13.413*** (3.045) Constant 371.562*** (7.239) 371.562*** (7.239) Missing obs. Controls Yes Yes Adjusted‐ R‐ squared .3889 .3739 N 6582 6582 Jackknife standard errors in parenthesis, Significance levels: * p<0.10, ** p<0.05, *** p<0.01
Finally, having estimated the school fixed effects it is of interest to see what percentage of
this measure of ‘student’s achievement’ is explained by the observed characteristics for
students and families. Table A.18 and A‐5.19 show the null model which includes only
school dummies panel (4), column (1) estimates without school level variables, column (2)
replicates the basic model estimates for comparison, and column (3) gives the school fixed
effects estimates. Our controls for students and family background characteristics and school
and teacher characteristics explain only about 24% of student’s achievements. Column (1)
indicates that controls for student and family background only explain 21% of maths
achievements and 20% of science. Adding school fixed effects raises the explained variation
in ‘student achievement’ to 39% for maths and 37 for science. School dummies were tested
for joint significance and they are jointly highly significant. That finding indicates that there
is a large variation in school effects. One possible source of variation might be the difference
between different school types, namely single‐sex versus mixed (coeducation) schools and/or
Arabic and language schooling. Egypt’s TIMSS dataset does not provide information on
28
types of schooling. To overcome this limitation we will use both the gender composition of
schools and the test language as proxies for this differentiation.
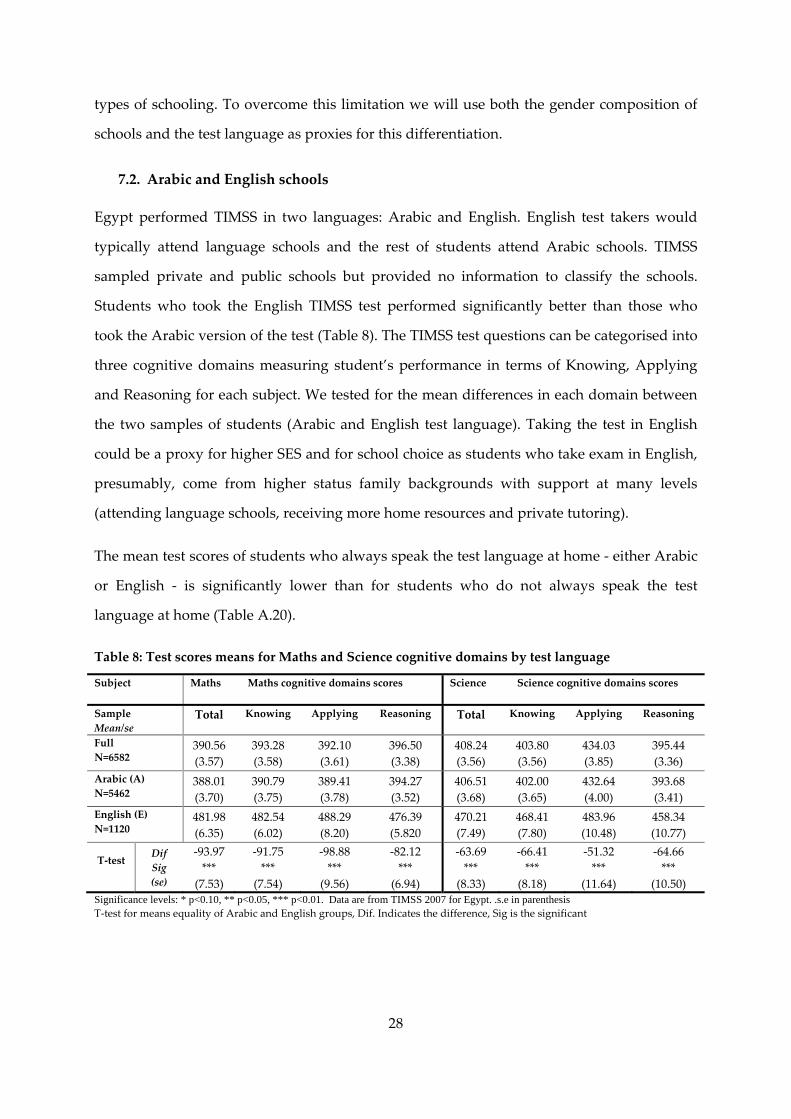
7.2. Arabic and English schools
Egypt performed TIMSS in two languages: Arabic and English. English test takers would
typically attend language schools and the rest of students attend Arabic schools. TIMSS
sampled private and public schools but provided no information to classify the schools.
Students who took the English TIMSS test performed significantly better than those who
took the Arabic version of the test (Table 8). The TIMSS test questions can be categorised into
three cognitive domains measuring student’s performance in terms of Knowing, Applying
and Reasoning for each subject. We tested for the mean differences in each domain between
the two samples of students (Arabic and English test language). Taking the test in English
could be a proxy for higher SES and for school choice as students who take exam in English,
presumably, come from higher status family backgrounds with support at many levels
(attending language schools, receiving more home resources and private tutoring).
The mean test scores of students who always speak the test language at home ‐ either Arabic
or English ‐ is significantly lower than for students who do not always speak the test
language at home (Table A.20).
Table 8: Test scores means for Maths and Science cognitive domains by test language
Subject Maths Maths cognitive domains scores
Science Science cognitive domains scores
Sample Mean/se
Total Knowing
Applying
Reasoning
Total Knowing
Applying
Reasoning
Full N=6582
390.56 (3.57)
393.28 (3.58)
392.10 (3.61)
396.50 (3.38)
408.24 (3.56)
403.80 (3.56)
434.03 (3.85)
395.44 (3.36)
Arabic (A) N=5462
388.01 (3.70)
390.79 (3.75)
389.41 (3.78)
394.27 (3.52)
406.51 (3.68)
402.00 (3.65)
432.64 (4.00)
393.68 (3.41)
English (E) N=1120
481.98 (6.35)
482.54 (6.02)
488.29 (8.20)
476.39 (5.820
470.21 (7.49)
468.41 (7.80)
483.96 (10.48)
458.34 (10.77)
T‐test
Dif Sig (se)
‐93.97 ***
(7.53)
‐91.75 ***
(7.54)
‐98.88 ***
(9.56)
‐82.12 ***
(6.94)
‐63.69 ***
(8.33)
‐66.41 ***
(8.18)
‐51.32 ***
(11.64)
‐64.66 ***
(10.50) Significance levels: * p<0.10, ** p<0.05, *** p<0.01. Data are from TIMSS 2007 for Egypt. .s.e in parenthesis T‐test for means equality of Arabic and English groups, Dif. Indicates the difference, Sig is the significant
29
However, introducing interaction terms for how frequently the test languages are spoken at
home and natives with test language shows no significant difference between Arabic and
English test takers. These findings suggest that it is a matter of SES; it is neither home
practice nor nationality as it appears from simple comparisons.
The test language interacted with the index of home possessions – a proxy for SES – allows
us to see whether the effect of the test language is different depending on the studentʹs SES
(Table A.21). The results show a statistically significant relation between the SES and the test
language. High SES background reduces the negative effect of being tested in Arabic. This is
in line with the findings on parental support and parental education above. These findings
support the assumption made in the main results section that students who took the English
test are coming from high income families and this increases their scores. However this
finding raises the issue of the endogeneity of school choice. We will return to this issue in the
next sub‐section, which describes estimates obtained from separate samples for the testing
language (to capture the two school type’s effects).
7.2.1. Splitting sample using test language
Students who took the English version of TIMSS most probably attended language school
while the others, who took the Arabic test, attended Arabic schools (private or public).
Descriptive statistics show that of 5462 students that took the test in Arabic only 13% have
high SES. By contrast, two thirds of the 1120 students tested in English had high SES. Re‐
estimating the basic model on separate samples, Table 9 presents the results for language
schools and Arabic schools in terms of population (weighted) estimates. Regarding SES and
school choice, the findings indicate that the home possessions index has a highly significant
effect on student achievements in Arabic schools for maths and science. For English language
test takers the effect of SES is insignificant for both maths and science. Not just this but SES
is negative, it could be home possessions index not discriminating at higher end or sample
selection issue (only smart poor go to language schools). For students that took the test in
Arabic, scores are significantly higher for those with high SES.
Parents’ education is not significant for students tested in English. For students tested in
Arabic, father’s education matters more than mother’s education with each level of paternal
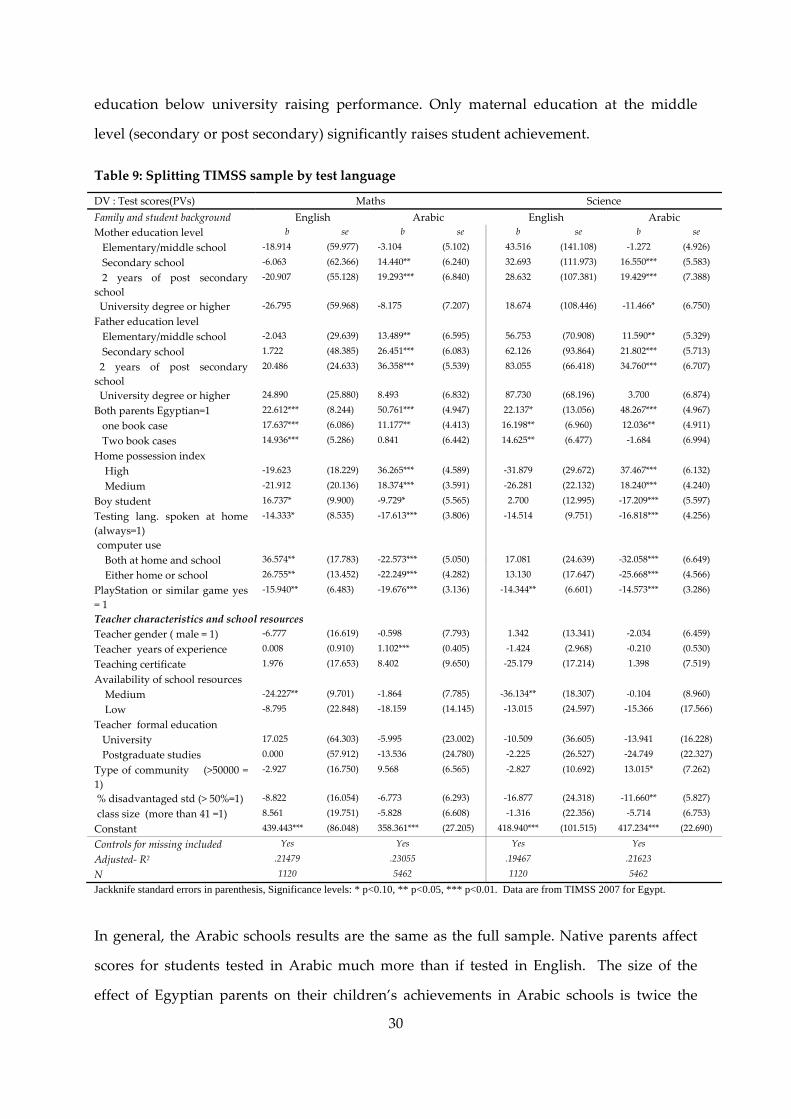
30
education below university raising performance. Only maternal education at the middle
level (secondary or post secondary) significantly raises student achievement.
Table 9: Splitting TIMSS sample by test language
DV : Test scores(PVs) Maths Science Family and student background English Arabic English Arabic Mother education level b se b se b se b se
Elementary/middle school ‐18.914 (59.977) ‐3.104 (5.102) 43.516 (141.108) ‐1.272 (4.926)
Secondary school ‐6.063 (62.366) 14.440** (6.240) 32.693 (111.973) 16.550*** (5.583)
2 years of post secondary school
‐20.907 (55.128) 19.293*** (6.840) 28.632 (107.381) 19.429*** (7.388)
University degree or higher ‐26.795 (59.968) ‐8.175 (7.207) 18.674 (108.446) ‐11.466* (6.750)
Father education level
Elementary/middle school ‐2.043 (29.639) 13.489** (6.595) 56.753 (70.908) 11.590** (5.329)
Secondary school 1.722 (48.385) 26.451*** (6.083) 62.126 (93.864) 21.802*** (5.713)
2 years of post secondary school
20.486 (24.633) 36.358*** (5.539) 83.055 (66.418) 34.760*** (6.707)
University degree or higher 24.890 (25.880) 8.493 (6.832) 87.730 (68.196) 3.700 (6.874)
Both parents Egyptian=1 22.612*** (8.244) 50.761*** (4.947) 22.137* (13.056) 48.267*** (4.967)
one book case 17.637*** (6.086) 11.177** (4.413) 16.198** (6.960) 12.036** (4.911)
Two book cases 14.936*** (5.286) 0.841 (6.442) 14.625** (6.477) ‐1.684 (6.994)
Home possession index
High ‐19.623 (18.229) 36.265*** (4.589) ‐31.879 (29.672) 37.467*** (6.132)
Medium ‐21.912 (20.136) 18.374*** (3.591) ‐26.281 (22.132) 18.240*** (4.240)
Boy student 16.737* (9.900) ‐9.729* (5.565) 2.700 (12.995) ‐17.209*** (5.597)
Testing lang. spoken at home (always=1)
‐14.333* (8.535) ‐17.613*** (3.806) ‐14.514 (9.751) ‐16.818*** (4.256)
computer use
Both at home and school 36.574** (17.783) ‐22.573*** (5.050) 17.081 (24.639) ‐32.058*** (6.649)
Either home or school 26.755** (13.452) ‐22.249*** (4.282) 13.130 (17.647) ‐25.668*** (4.566)
PlayStation or similar game yes = 1
‐15.940** (6.483) ‐19.676*** (3.136) ‐14.344** (6.601) ‐14.573*** (3.286)
Teacher characteristics and school resources
Teacher gender ( male = 1) ‐6.777 (16.619) ‐0.598 (7.793) 1.342 (13.341) ‐2.034 (6.459)
Teacher years of experience 0.008 (0.910) 1.102*** (0.405) ‐1.424 (2.968) ‐0.210 (0.530)
Teaching certificate 1.976 (17.653) 8.402 (9.650) ‐25.179 (17.214) 1.398 (7.519)
Availability of school resources
Medium ‐24.227** (9.701) ‐1.864 (7.785) ‐36.134** (18.307) ‐0.104 (8.960)
Low ‐8.795 (22.848) ‐18.159 (14.145) ‐13.015 (24.597) ‐15.366 (17.566)
Teacher formal education
University 17.025 (64.303) ‐5.995 (23.002) ‐10.509 (36.605) ‐13.941 (16.228)
Postgraduate studies 0.000 (57.912) ‐13.536 (24.780) ‐2.225 (26.527) ‐24.749 (22.327)
Type of community (>50000 = 1)
‐2.927 (16.750) 9.568 (6.565) ‐2.827 (10.692) 13.015* (7.262)
% disadvantaged std (> 50%=1) ‐8.822 (16.054) ‐6.773 (6.293) ‐16.877 (24.318) ‐11.660** (5.827)
class size (more than 41 =1) 8.561 (19.751) ‐5.828 (6.608) ‐1.316 (22.356) ‐5.714 (6.753)
Constant 439.443*** (86.048) 358.361*** (27.205) 418.940*** (101.515) 417.234*** (22.690)
Controls for missing included Yes Yes Yes Yes
Adjusted‐ R2 .21479 .23055 .19467 .21623
N 1120 5462 1120 5462
Jackknife standard errors in parenthesis, Significance levels: * p<0.10, ** p<0.05, *** p<0.01. Data are from TIMSS 2007 for Egypt.
In general, the Arabic schools results are the same as the full sample. Native parents affect
scores for students tested in Arabic much more than if tested in English. The size of the
effect of Egyptian parents on their children’s achievements in Arabic schools is twice the
31
effect for those in language schools. Having one or two bookcases at home increases test
scores for students in language schools. Language education might stress more on reading,
making the presence of books in the home more important.
The gender effect is different in size and direction between the two types; boys outperform
girls in language schools but girls do better in Arabic schools. Computer usage has positive
significant effect in language schools. This effect is only for maths, the effect on science in
insignificant. Computer use has a highly significant negative impact on maths and science in
Arabic schools which seems to dominate in the full model estimation. Play‐Station has
negative effect on both types of schools for maths and science. Medium school resources
reduce achievement in language schools compared to high level of resources. Teacher’s
experience matters only in Arabic schools with very small effect.
7.2.2. Test language different effect on maths and science achievements
Table 8 shows that the means are significantly different for all three cognitive domains and
for the total test scores for both maths and science. The least statistically significant
difference and the highest standard errors are in the cognitive domain of applying in the
science test. Figure A.1 clearly shows that there are differences in the test scores distributions
as well as the superiority of the English language takers for maths. The picture is not so clear
for the science (Figure A.2) distributions for cognitive domains, but still indicates higher test
scores distributions for the English language students.
Estimates of student, family and school impact on test scores show a highly significant effect
of English as the test language on maths test scores for each of the cognitive domains (Table
A.22). Given the better performance of students in English language schools, it is expected to
have the same performance in science. The striking result is that English schools students are
indifferent from their peers in Arabic schools in science achievement. The test language has
an insignificant effect on science test scores. For the cognitive domains of knowing and
reasoning for science, the effects of English are statistically significant at the 10% level. To
understand why language schools do not seem to have an advantage in the applying science
domain, we investigated the science curriculum questionnaire which contains the responses
32
provided by the National Research Coordinators of the participating countries to the TIMSS
2007.
Egypt’s science curriculum questionnaire states that the national science curriculum places a
lot of emphasis on knowing basic facts and principles, with some emphasis on providing
explanations to what is being studied and to link up what students are learning to their daily
life. Unfortunately, very little emphasis is placed on observing natural phenomena and
describing what is seen, designing and planning experiments or investigations, conducting
experiments or investigations, and integrating science with other subjects. The nature of the
science curricula does not encourage understanding the application of science, and this may
be why scores in the applying science domain is not influenced by the type of school (or
testing language).
These findings shed light on some reasons for the frequently stated problem of mismatch
between the graduate acquired skills and the required skills of the labour market especially
technical and practical skills. There is little provision for the application of subjects learnt in
school especially science. As we have argued, this problem stems from the poor nature of the
curricula and hence there need for a reform in the science curricula.
7.2.3. Test language and home spoken language
One curious finding was that students who always speak the test language at home perform
worse, ceteris paribus, than others. We use the sub‐samples split by test language to see if this
finding holds true for both those tested in Arabic and those tested in English. We find that
the overall finding is driven by the results for students tested in Arabic, who perform
significantly worse in maths and science if they always speak Arabic at home (compared to
sometimes or never). The effects of speaking the test language at home on test scores are
weaker or insignificant for those tested in English (Table 9).
We can only speculate on why always speaking the test language at home is associated with
lower test scores, particularly if tested in Arabic. The most plausible explanation is that it is
related to (lower) SES. For those tested in Arabic a possibility is that households in which a
language other than Arabic is spoken (sometimes) at home are higher income and/or have
motivated immigrant parents. For those tested in English, it may be that only Egyptian
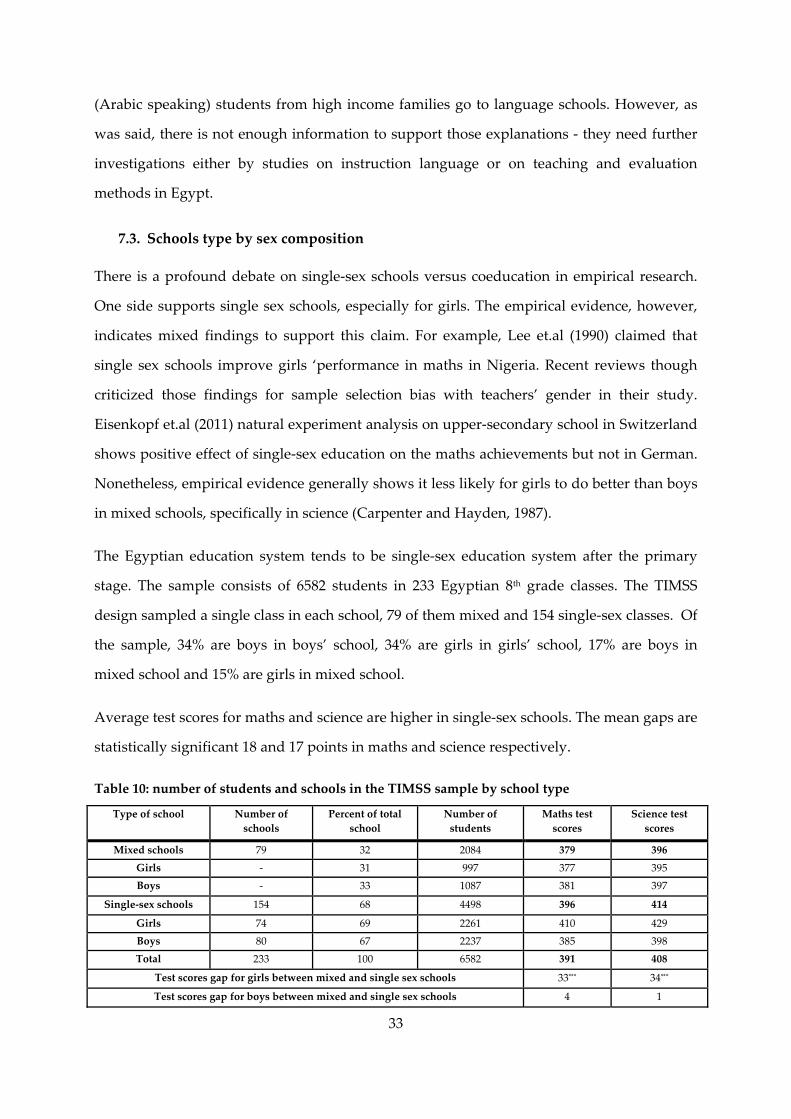
33
(Arabic speaking) students from high income families go to language schools. However, as
was said, there is not enough information to support those explanations ‐ they need further
investigations either by studies on instruction language or on teaching and evaluation
methods in Egypt.
7.3. Schools type by sex composition
There is a profound debate on single‐sex schools versus coeducation in empirical research.
One side supports single sex schools, especially for girls. The empirical evidence, however,
indicates mixed findings to support this claim. For example, Lee et.al (1990) claimed that
single sex schools improve girls ‘performance in maths in Nigeria. Recent reviews though
criticized those findings for sample selection bias with teachers’ gender in their study.
Eisenkopf et.al (2011) natural experiment analysis on upper‐secondary school in Switzerland
shows positive effect of single‐sex education on the maths achievements but not in German.
Nonetheless, empirical evidence generally shows it less likely for girls to do better than boys
in mixed schools, specifically in science (Carpenter and Hayden, 1987).
The Egyptian education system tends to be single‐sex education system after the primary
stage. The sample consists of 6582 students in 233 Egyptian 8th grade classes. The TIMSS
design sampled a single class in each school, 79 of them mixed and 154 single‐sex classes. Of
the sample, 34% are boys in boys’ school, 34% are girls in girls’ school, 17% are boys in
mixed school and 15% are girls in mixed school.
Average test scores for maths and science are higher in single‐sex schools. The mean gaps are
statistically significant 18 and 17 points in maths and science respectively.
Table 10: number of students and schools in the TIMSS sample by school type
Type of school Number of schools
Percent of total school
Number of students
Maths test scores
Science test scores
Mixed schools 79 32 2084 379 396Girls ‐ 31 997 377 395 Boys ‐ 33 1087 381 397
Single‐sex schools 154 68 4498 396 414
Girls 74 69 2261 410 429 Boys 80 67 2237 385 398 Total 233 100 6582 391 408
Test scores gap for girls between mixed and single sex schools 33*** 34***
Test scores gap for boys between mixed and single sex schools 4 1
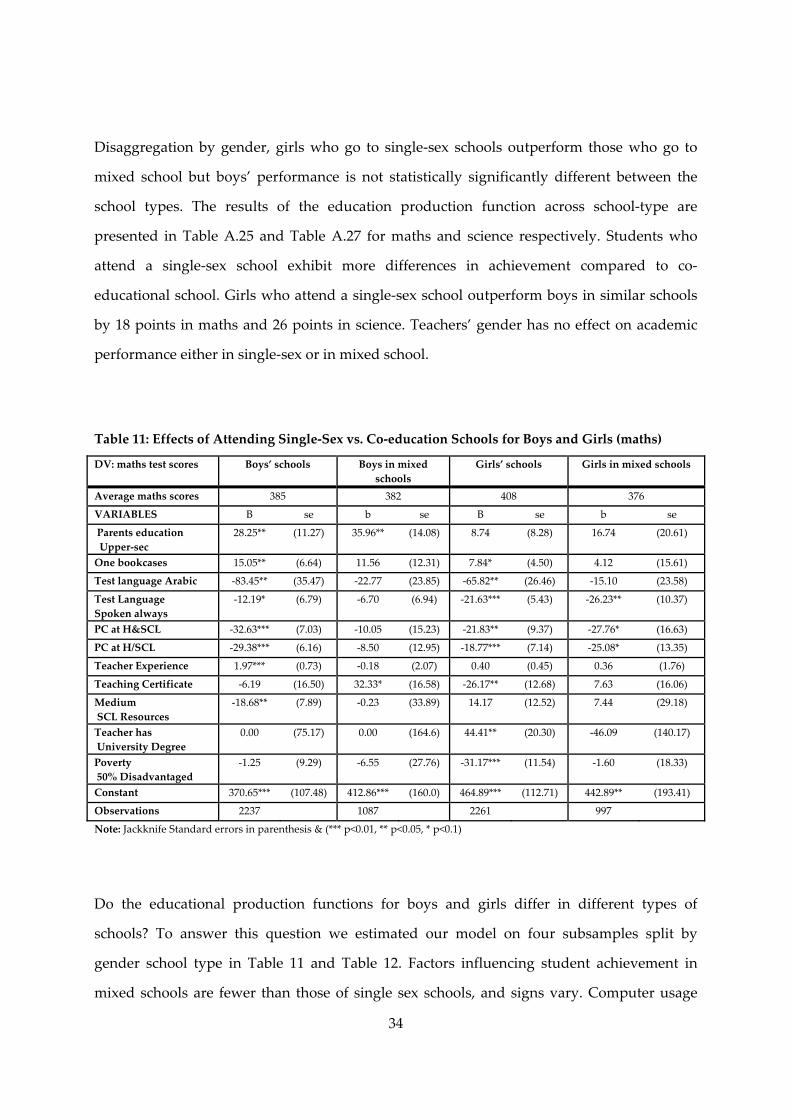
34
Disaggregation by gender, girls who go to single‐sex schools outperform those who go to
mixed school but boys’ performance is not statistically significantly different between the
school types. The results of the education production function across school‐type are
presented in Table A.25 and Table A.27 for maths and science respectively. Students who
attend a single‐sex school exhibit more differences in achievement compared to co‐
educational school. Girls who attend a single‐sex school outperform boys in similar schools
by 18 points in maths and 26 points in science. Teachers’ gender has no effect on academic
performance either in single‐sex or in mixed school.
Table 11: Effects of Attending Single‐Sex vs. Co‐education Schools for Boys and Girls (maths)
DV: maths test scores Boys’ schools Boys in mixed schools
Girls’ schools Girls in mixed schools
Average maths scores 385 382 408 376
VARIABLES B se b se B se b se
Parents education Upper‐sec
28.25** (11.27) 35.96** (14.08) 8.74 (8.28) 16.74 (20.61)
One bookcases 15.05** (6.64) 11.56 (12.31) 7.84* (4.50) 4.12 (15.61)
Test language Arabic ‐83.45** (35.47) ‐22.77 (23.85) ‐65.82** (26.46) ‐15.10 (23.58)
Test Language Spoken always
‐12.19* (6.79) ‐6.70 (6.94) ‐21.63*** (5.43) ‐26.23** (10.37)
PC at H&SCL ‐32.63*** (7.03) ‐10.05 (15.23) ‐21.83** (9.37) ‐27.76* (16.63)
PC at H/SCL ‐29.38*** (6.16) ‐8.50 (12.95) ‐18.77*** (7.14) ‐25.08* (13.35)
Teacher Experience 1.97*** (0.73) ‐0.18 (2.07) 0.40 (0.45) 0.36 (1.76)
Teaching Certificate ‐6.19 (16.50) 32.33* (16.58) ‐26.17** (12.68) 7.63 (16.06)
Medium SCL Resources
‐18.68** (7.89) ‐0.23 (33.89) 14.17 (12.52) 7.44 (29.18)
Teacher has University Degree
0.00 (75.17) 0.00 (164.6) 44.41** (20.30) ‐46.09 (140.17)
Poverty 50% Disadvantaged
‐1.25 (9.29) ‐6.55 (27.76) ‐31.17*** (11.54) ‐1.60 (18.33)
Constant 370.65*** (107.48) 412.86*** (160.0) 464.89*** (112.71) 442.89** (193.41)
Observations 2237 1087 2261 997
Note: Jackknife Standard errors in parenthesis & (*** p<0.01, ** p<0.05, * p<0.1)
Do the educational production functions for boys and girls differ in different types of
schools? To answer this question we estimated our model on four subsamples split by
gender school type in Table 11 and Table 12. Factors influencing student achievement in
mixed schools are fewer than those of single sex schools, and signs vary. Computer usage
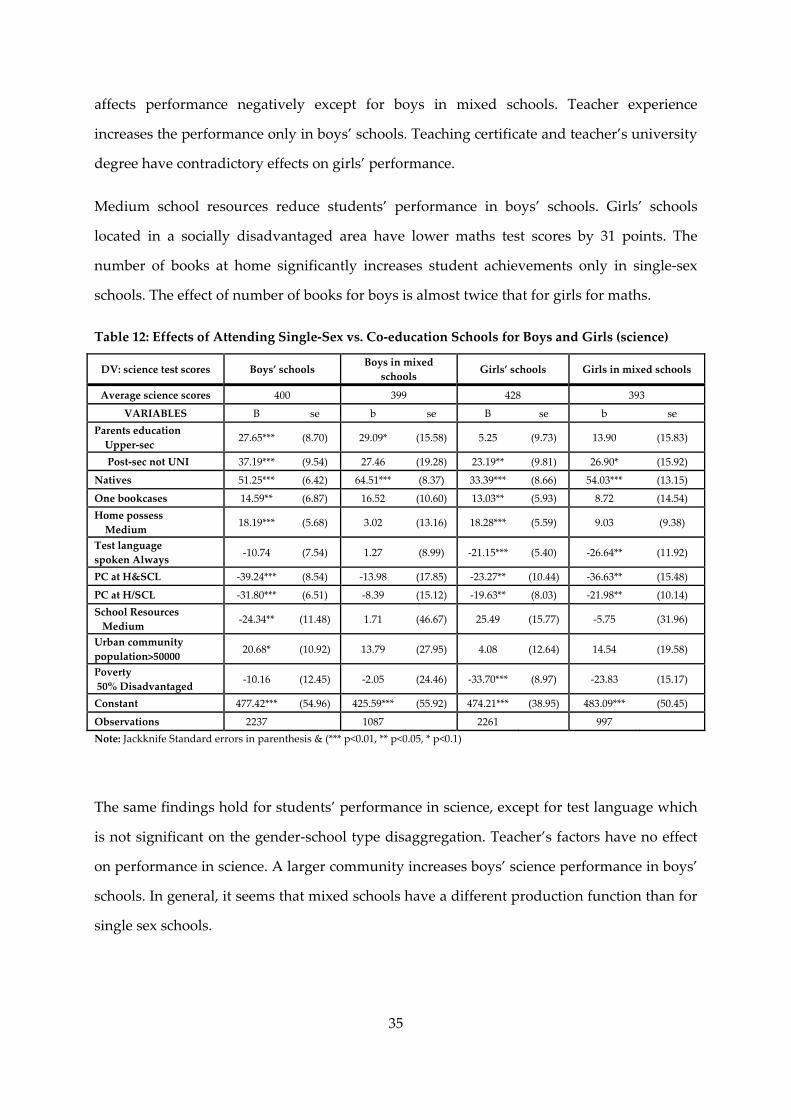
35
affects performance negatively except for boys in mixed schools. Teacher experience
increases the performance only in boys’ schools. Teaching certificate and teacher’s university
degree have contradictory effects on girls’ performance.
Medium school resources reduce students’ performance in boys’ schools. Girls’ schools
located in a socially disadvantaged area have lower maths test scores by 31 points. The
number of books at home significantly increases student achievements only in single‐sex
schools. The effect of number of books for boys is almost twice that for girls for maths.
Table 12: Effects of Attending Single‐Sex vs. Co‐education Schools for Boys and Girls (science)
DV: science test scores Boys’ schools Boys in mixed
schools Girls’ schools Girls in mixed schools
Average science scores 400 399 428 393
VARIABLES B se b se B se b se Parents education Upper‐sec 27.65*** (8.70) 29.09* (15.58) 5.25 (9.73) 13.90 (15.83)
Post‐sec not UNI 37.19*** (9.54) 27.46 (19.28) 23.19** (9.81) 26.90* (15.92)
Natives 51.25*** (6.42) 64.51*** (8.37) 33.39*** (8.66) 54.03*** (13.15)
One bookcases 14.59** (6.87) 16.52 (10.60) 13.03** (5.93) 8.72 (14.54) Home possess Medium 18.19*** (5.68) 3.02 (13.16) 18.28*** (5.59) 9.03 (9.38)
Test language spoken Always ‐10.74 (7.54) 1.27 (8.99) ‐21.15*** (5.40) ‐26.64** (11.92)
PC at H&SCL ‐39.24*** (8.54) ‐13.98 (17.85) ‐23.27** (10.44) ‐36.63** (15.48)
PC at H/SCL ‐31.80*** (6.51) ‐8.39 (15.12) ‐19.63** (8.03) ‐21.98** (10.14) School Resources Medium ‐24.34** (11.48) 1.71 (46.67) 25.49 (15.77) ‐5.75 (31.96)
Urban community population>50000 20.68* (10.92) 13.79 (27.95) 4.08 (12.64) 14.54 (19.58)
Poverty 50% Disadvantaged ‐10.16 (12.45) ‐2.05 (24.46) ‐33.70*** (8.97) ‐23.83 (15.17)
Constant 477.42*** (54.96) 425.59*** (55.92) 474.21*** (38.95) 483.09*** (50.45)
Observations 2237 1087 2261 997 Note: Jackknife Standard errors in parenthesis & (*** p<0.01, ** p<0.05, * p<0.1)
The same findings hold for students’ performance in science, except for test language which
is not significant on the gender‐school type disaggregation. Teacher’s factors have no effect
on performance in science. A larger community increases boys’ science performance in boys’
schools. In general, it seems that mixed schools have a different production function than for
single sex schools.
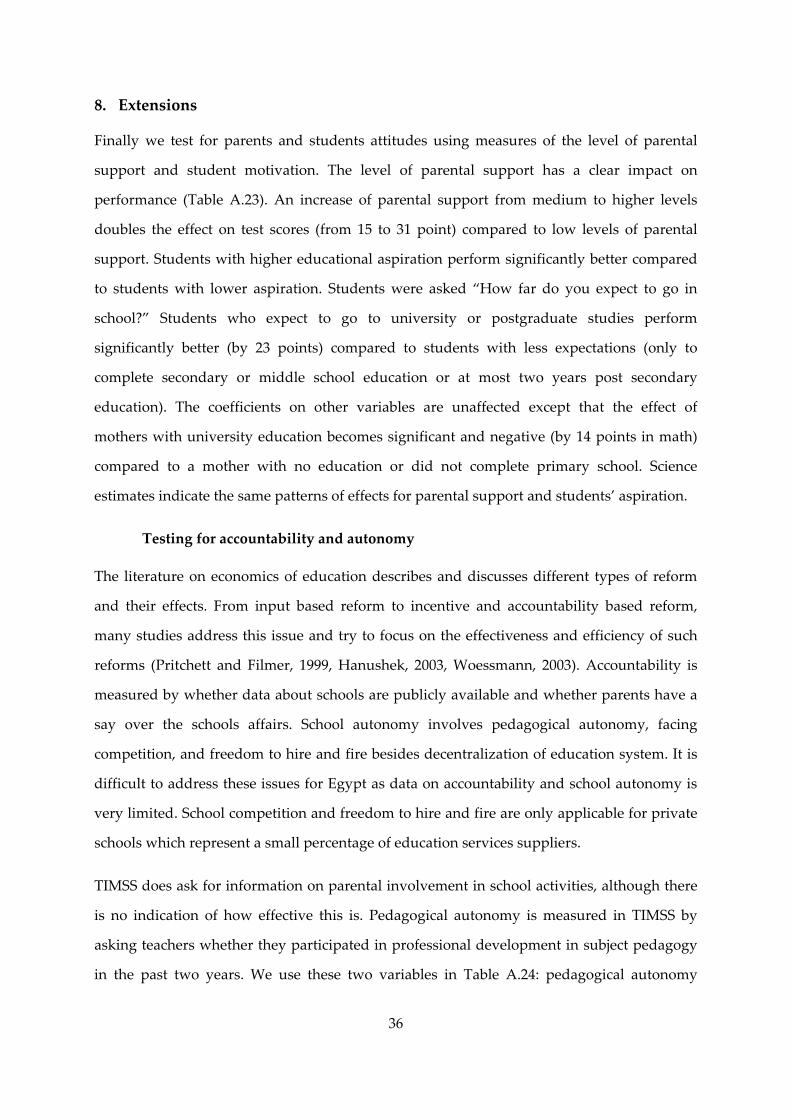
36
8. Extensions
Finally we test for parents and students attitudes using measures of the level of parental
support and student motivation. The level of parental support has a clear impact on
performance (Table A.23). An increase of parental support from medium to higher levels
doubles the effect on test scores (from 15 to 31 point) compared to low levels of parental
support. Students with higher educational aspiration perform significantly better compared
to students with lower aspiration. Students were asked “How far do you expect to go in
school?” Students who expect to go to university or postgraduate studies perform
significantly better (by 23 points) compared to students with less expectations (only to
complete secondary or middle school education or at most two years post secondary
education). The coefficients on other variables are unaffected except that the effect of
mothers with university education becomes significant and negative (by 14 points in math)
compared to a mother with no education or did not complete primary school. Science
estimates indicate the same patterns of effects for parental support and students’ aspiration.
Testing for accountability and autonomy
The literature on economics of education describes and discusses different types of reform
and their effects. From input based reform to incentive and accountability based reform,
many studies address this issue and try to focus on the effectiveness and efficiency of such
reforms (Pritchett and Filmer, 1999, Hanushek, 2003, Woessmann, 2003). Accountability is
measured by whether data about schools are publicly available and whether parents have a
say over the schools affairs. School autonomy involves pedagogical autonomy, facing
competition, and freedom to hire and fire besides decentralization of education system. It is
difficult to address these issues for Egypt as data on accountability and school autonomy is
very limited. School competition and freedom to hire and fire are only applicable for private
schools which represent a small percentage of education services suppliers.
TIMSS does ask for information on parental involvement in school activities, although there
is no indication of how effective this is. Pedagogical autonomy is measured in TIMSS by
asking teachers whether they participated in professional development in subject pedagogy
in the past two years. We use these two variables in Table A.24: pedagogical autonomy
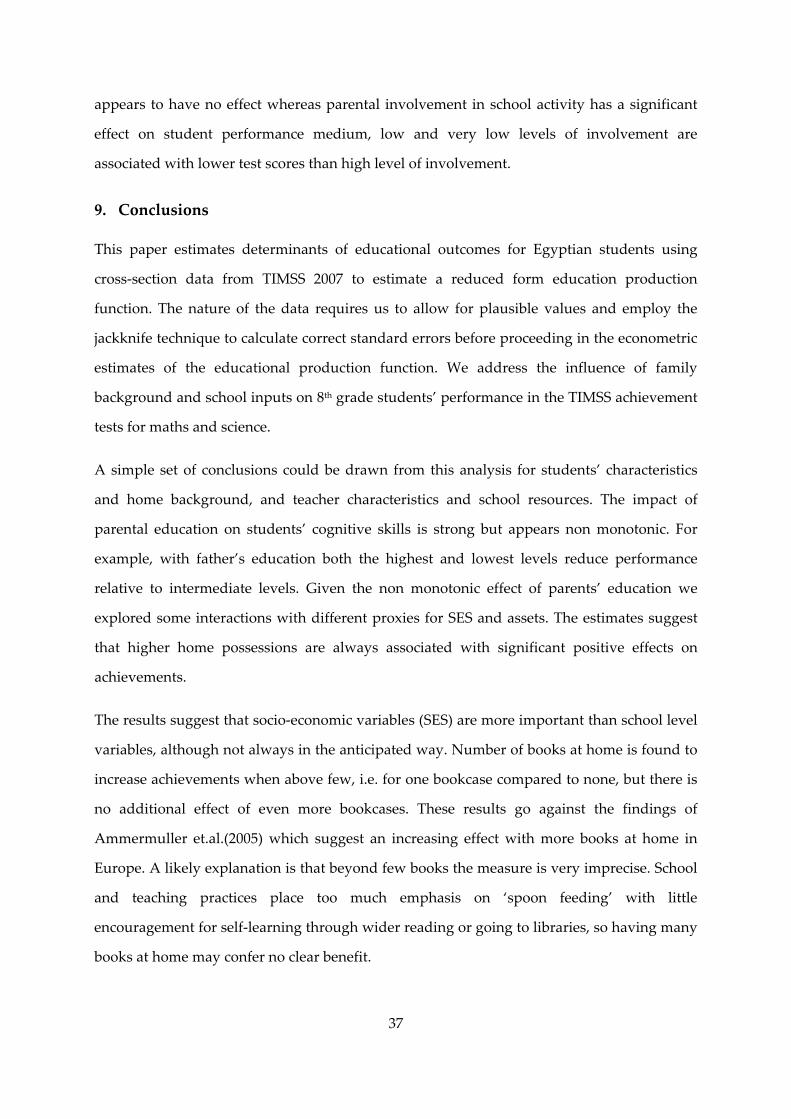
37
appears to have no effect whereas parental involvement in school activity has a significant
effect on student performance medium, low and very low levels of involvement are
associated with lower test scores than high level of involvement.
9. Conclusions
This paper estimates determinants of educational outcomes for Egyptian students using
cross‐section data from TIMSS 2007 to estimate a reduced form education production
function. The nature of the data requires us to allow for plausible values and employ the
jackknife technique to calculate correct standard errors before proceeding in the econometric
estimates of the educational production function. We address the influence of family
background and school inputs on 8th grade students’ performance in the TIMSS achievement
tests for maths and science.
A simple set of conclusions could be drawn from this analysis for students’ characteristics
and home background, and teacher characteristics and school resources. The impact of
parental education on students’ cognitive skills is strong but appears non monotonic. For
example, with father’s education both the highest and lowest levels reduce performance
relative to intermediate levels. Given the non monotonic effect of parents’ education we
explored some interactions with different proxies for SES and assets. The estimates suggest
that higher home possessions are always associated with significant positive effects on
achievements.
The results suggest that socio‐economic variables (SES) are more important than school level
variables, although not always in the anticipated way. Number of books at home is found to
increase achievements when above few, i.e. for one bookcase compared to none, but there is
no additional effect of even more bookcases. These results go against the findings of
Ammermuller et.al.(2005) which suggest an increasing effect with more books at home in
Europe. A likely explanation is that beyond few books the measure is very imprecise. School
and teaching practices place too much emphasis on ‘spoon feeding’ with little
encouragement for self‐learning through wider reading or going to libraries, so having many
books at home may confer no clear benefit.
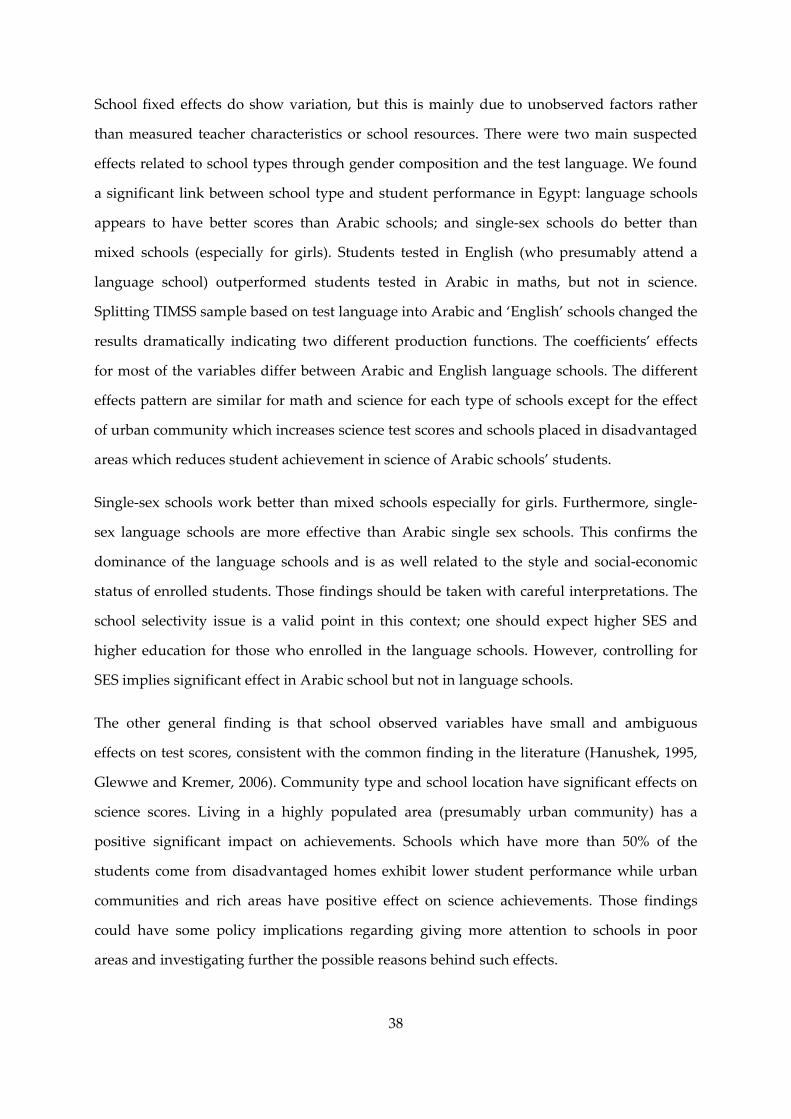
38
School fixed effects do show variation, but this is mainly due to unobserved factors rather
than measured teacher characteristics or school resources. There were two main suspected
effects related to school types through gender composition and the test language. We found
a significant link between school type and student performance in Egypt: language schools
appears to have better scores than Arabic schools; and single‐sex schools do better than
mixed schools (especially for girls). Students tested in English (who presumably attend a
language school) outperformed students tested in Arabic in maths, but not in science.
Splitting TIMSS sample based on test language into Arabic and ‘English’ schools changed the
results dramatically indicating two different production functions. The coefficients’ effects
for most of the variables differ between Arabic and English language schools. The different
effects pattern are similar for math and science for each type of schools except for the effect
of urban community which increases science test scores and schools placed in disadvantaged
areas which reduces student achievement in science of Arabic schools’ students.
Single‐sex schools work better than mixed schools especially for girls. Furthermore, single‐
sex language schools are more effective than Arabic single sex schools. This confirms the
dominance of the language schools and is as well related to the style and social‐economic
status of enrolled students. Those findings should be taken with careful interpretations. The
school selectivity issue is a valid point in this context; one should expect higher SES and
higher education for those who enrolled in the language schools. However, controlling for
SES implies significant effect in Arabic school but not in language schools.
The other general finding is that school observed variables have small and ambiguous
effects on test scores, consistent with the common finding in the literature (Hanushek, 1995,
Glewwe and Kremer, 2006). Community type and school location have significant effects on
science scores. Living in a highly populated area (presumably urban community) has a
positive significant impact on achievements. Schools which have more than 50% of the
students come from disadvantaged homes exhibit lower student performance while urban
communities and rich areas have positive effect on science achievements. Those findings
could have some policy implications regarding giving more attention to schools in poor
areas and investigating further the possible reasons behind such effects.
39
References
AMMERMÜLLER, A., HEIJKE, H. & WOESSMANN, L. (2005) Schooling quality in Eastern Europe: Educational production during transition. Economics of Education Review, 24, 579‐599.
CARPENTER, P. & HAYDEN, M. (1987) Girlsʹ Academic Achievements: Single‐Sex Versus Coeducational Schools in Australia. Sociology of Education, 60, 156‐167.
EISENKOPF, G., HESSAMI, Z., FISCHBACHER, U. & URSPRUNG, H. (2011) Academic Performance and Single‐Sex Schooling: Evidence from a Natural Experiment in Switzerland. CESIFO WORKING PAPER NO. 3592 SSRN eLibrary.
FILMER, D. & PRITCHETT, L. (2001) Estimating Wealth Effects Without Expenditure Data—Or Tears: An Application To Educational Enrollments In States Of India. Demography, 38, 115‐132.
FOY, P. & OLSON, J. (2009) TIMSS 2007 user guide for the international database. Chestnut Hill, MA: TIMSS & PIRLS International Study Center, Boston College.
GAMORAN, A. & LONG, D. A. (2006) Equality of Educational opportunity: A 40‐Year Retrospective. wisconson center of Education Research.
GLEWWE, P. & KREMER, M. (2006) Chapter 16 Schools, Teachers, and Education Outcomes in Developing Countries. IN HANUSHEK, E. & WELCH, F. (Eds.) Handbook of the Economics of Education. Elsevier.
HANUSHEK, E. A. (1995) Interpreting recent research on schooling in developing countries. The World Bank Research Observer, 10, 227‐246.
HANUSHEK, E. A. (2002) Chapter 30 Publicly provided education. IN ALAN, J. A. & MARTIN, F. (Eds.) Handbook of Public Economics. Elsevier.
HANUSHEK, E. A. (2003) The Failure of Input‐Based Schooling Policies. Economic Journal, 113, F64‐F98.
HANUSHEK, E. A. & LAVY, V. (1994) School quality, achievement bias, and dropout behavior in Egypt, World Bank Publications.
HANUSHEK, E. A. & WOESSMANN, L. (2007) The Role of School Improvement in Economic Development. National Bureau of Economic Research Working Paper Series, No. 12832.
HARTMANN, S. (2008) The informal market of education in Egypt: private tutoring and its implications. Institut für Ethnologie und Afrikastudien Working Paper, 88.
40
LEE, V. E. & LOCKHEED, M. E. (1990) The effects of single‐sex schooling on achievement and attitudes in Nigeria. Comparative Education Review, 34, 209‐231.
LLOYD, C. B. & DIVISION, P. C. P. R. (2001) Determinants of educational attainment among adolescents in Egypt: does school quality make a difference?, Population Council New York.
MALAMUD, O. & POP‐ELECHES, C. (2011) Home Computer Use and the Development of Human Capital. The Quarterly Journal of Economics, 126, 987‐1027.
MCKENZIE, D. (2005) Measuring inequality with asset indicators. Journal of Population Economics, 18, 229‐260.
MINISTRY OF EDUCATION (2008) strategic plan. Egypt Ministry of Education.
MONTGOMERY, M., GRAGNOLATI, M., BURKE, K. & PAREDES, E. (2000) Measuring living standards with proxy variables. Demography, 37, 155‐174.
OLSON, J. F., MARTIN, M. O. & MULLIS, I. V. S. (2008) TIMSS 2007 Technical Report. International Association for the Evaluation of Educational Achievement (IEA).
PRITCHETT, L. & FILMER, D. (1999) What education production functions really show: a positive theory of education expenditures. Economics of Education Review, 18, 223‐239.
WOESSMANN, L. (2003) Educational Production in East Asia: The Impact of Family Background and Schooling Policies on Student Performance. SSRN eLibrary.
WOESSMANN, L. (2004) How Equal are Educational Opportunities? Family Background and Student Achievement in Europe and the US. SSRN eLibrary.
WU, B. M. (2005) The role of plausible values in large‐scale surveys. Studies In Educational Evaluation, 31, 114‐128.
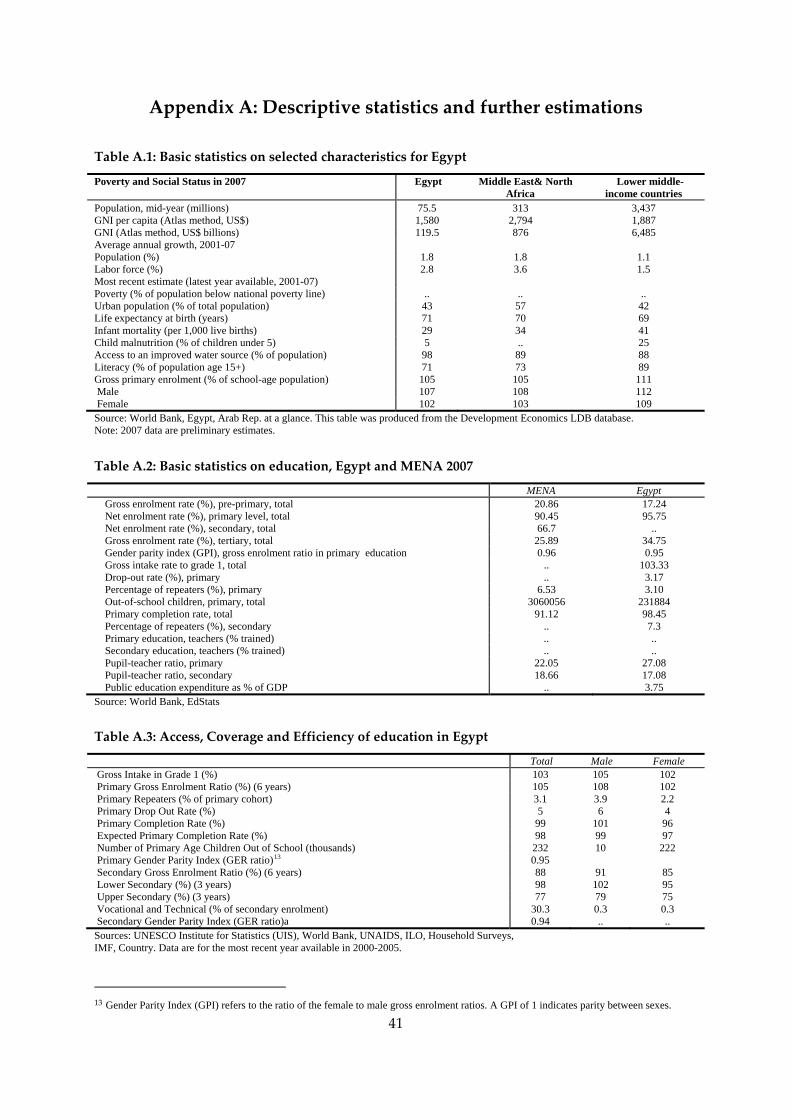
41
Appendix A: Descriptive statistics and further estimations
Table A.1: Basic statistics on selected characteristics for Egypt
Poverty and Social Status in 2007 Egypt Middle East& North Africa
Lower middle- income countries
Population, mid-year (millions) 75.5 313 3,437 GNI per capita (Atlas method, US$) 1,580 2,794 1,887 GNI (Atlas method, US$ billions) 119.5 876 6,485 Average annual growth, 2001-07 Population (%) 1.8 1.8 1.1 Labor force (%) 2.8 3.6 1.5 Most recent estimate (latest year available, 2001-07) Poverty (% of population below national poverty line) .. .. .. Urban population (% of total population) 43 57 42 Life expectancy at birth (years) 71 70 69 Infant mortality (per 1,000 live births) 29 34 41 Child malnutrition (% of children under 5) 5 .. 25 Access to an improved water source (% of population) 98 89 88 Literacy (% of population age 15+) 71 73 89 Gross primary enrolment (% of school-age population) 105 105 111 Male 107 108 112 Female 102 103 109 Source: World Bank, Egypt, Arab Rep. at a glance. This table was produced from the Development Economics LDB database. Note: 2007 data are preliminary estimates.
Table A.2: Basic statistics on education, Egypt and MENA 2007
MENA Egypt Gross enrolment rate (%), pre-primary, total 20.86 17.24 Net enrolment rate (%), primary level, total 90.45 95.75 Net enrolment rate (%), secondary, total 66.7 .. Gross enrolment rate (%), tertiary, total 25.89 34.75 Gender parity index (GPI), gross enrolment ratio in primary education 0.96 0.95 Gross intake rate to grade 1, total .. 103.33 Drop-out rate (%), primary .. 3.17 Percentage of repeaters (%), primary 6.53 3.10 Out-of-school children, primary, total 3060056 231884 Primary completion rate, total 91.12 98.45 Percentage of repeaters (%), secondary .. 7.3 Primary education, teachers (% trained) .. .. Secondary education, teachers (% trained) .. .. Pupil-teacher ratio, primary 22.05 27.08 Pupil-teacher ratio, secondary 18.66 17.08 Public education expenditure as % of GDP .. 3.75
Source: World Bank, EdStats
Table A.3: Access, Coverage and Efficiency of education in Egypt
Total Male Female Gross Intake in Grade 1 (%) 103 105 102 Primary Gross Enrolment Ratio (%) (6 years) 105 108 102 Primary Repeaters (% of primary cohort) 3.1 3.9 2.2 Primary Drop Out Rate (%) 5 6 4 Primary Completion Rate (%) 99 101 96 Expected Primary Completion Rate (%) 98 99 97 Number of Primary Age Children Out of School (thousands) 232 10 222 Primary Gender Parity Index (GER ratio)13 0.95 Secondary Gross Enrolment Ratio (%) (6 years) 88 91 85 Lower Secondary (%) (3 years) 98 102 95 Upper Secondary (%) (3 years) 77 79 75 Vocational and Technical (% of secondary enrolment) 30.3 0.3 0.3 Secondary Gender Parity Index (GER ratio)a 0.94 .. .. Sources: UNESCO Institute for Statistics (UIS), World Bank, UNAIDS, ILO, Household Surveys, IMF, Country. Data are for the most recent year available in 2000-2005.
13 Gender Parity Index (GPI) refers to the ratio of the female to male gross enrolment ratios. A GPI of 1 indicates parity between sexes.
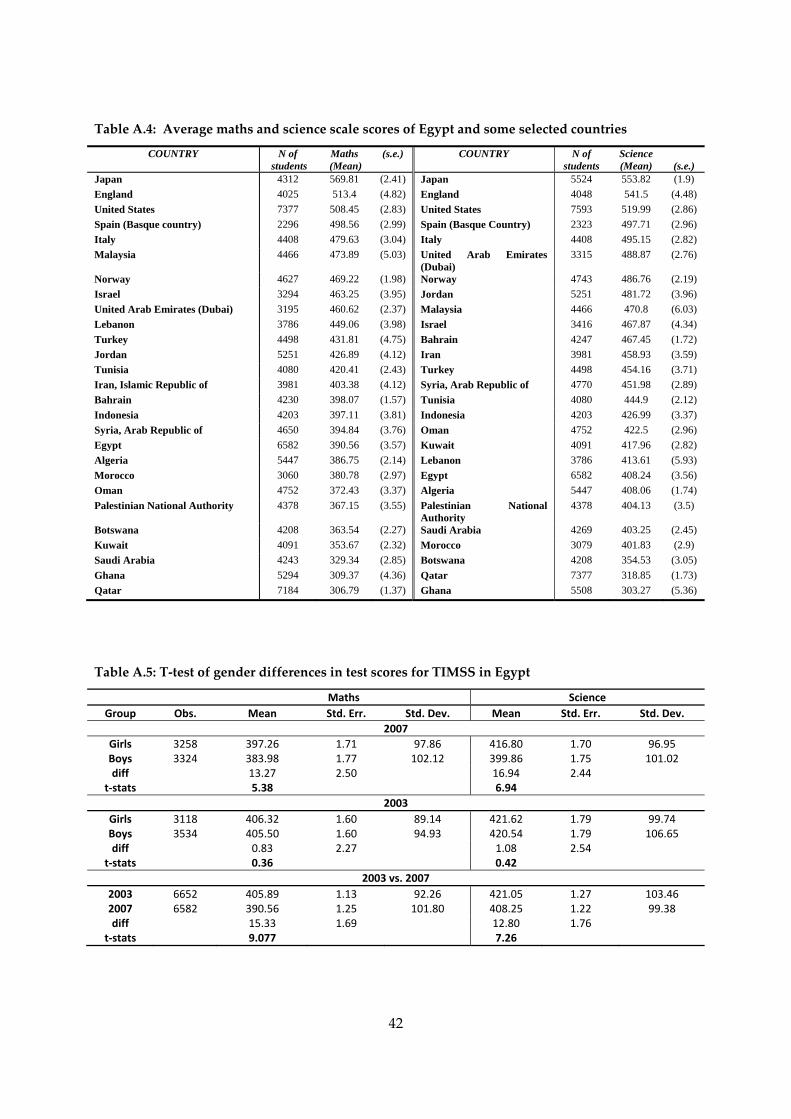
42
Table A.4: Average maths and science scale scores of Egypt and some selected countries
COUNTRY N of students
Maths (Mean)
(s.e.) COUNTRY N of students
Science (Mean)
(s.e.)
Japan 4312 569.81 (2.41) Japan 5524 553.82 (1.9) England 4025 513.4 (4.82) England 4048 541.5 (4.48) United States 7377 508.45 (2.83) United States 7593 519.99 (2.86) Spain (Basque country) 2296 498.56 (2.99) Spain (Basque Country) 2323 497.71 (2.96) Italy 4408 479.63 (3.04) Italy 4408 495.15 (2.82) Malaysia 4466 473.89 (5.03) United Arab Emirates
(Dubai) 3315 488.87 (2.76)
Norway 4627 469.22 (1.98) Norway 4743 486.76 (2.19) Israel 3294 463.25 (3.95) Jordan 5251 481.72 (3.96) United Arab Emirates (Dubai) 3195 460.62 (2.37) Malaysia 4466 470.8 (6.03) Lebanon 3786 449.06 (3.98) Israel 3416 467.87 (4.34) Turkey 4498 431.81 (4.75) Bahrain 4247 467.45 (1.72) Jordan 5251 426.89 (4.12) Iran 3981 458.93 (3.59) Tunisia 4080 420.41 (2.43) Turkey 4498 454.16 (3.71) Iran, Islamic Republic of 3981 403.38 (4.12) Syria, Arab Republic of 4770 451.98 (2.89) Bahrain 4230 398.07 (1.57) Tunisia 4080 444.9 (2.12) Indonesia 4203 397.11 (3.81) Indonesia 4203 426.99 (3.37) Syria, Arab Republic of 4650 394.84 (3.76) Oman 4752 422.5 (2.96) Egypt 6582 390.56 (3.57) Kuwait 4091 417.96 (2.82) Algeria 5447 386.75 (2.14) Lebanon 3786 413.61 (5.93) Morocco 3060 380.78 (2.97) Egypt 6582 408.24 (3.56) Oman 4752 372.43 (3.37) Algeria 5447 408.06 (1.74) Palestinian National Authority 4378 367.15 (3.55) Palestinian National
Authority 4378 404.13 (3.5)
Botswana 4208 363.54 (2.27) Saudi Arabia 4269 403.25 (2.45) Kuwait 4091 353.67 (2.32) Morocco 3079 401.83 (2.9) Saudi Arabia 4243 329.34 (2.85) Botswana 4208 354.53 (3.05) Ghana 5294 309.37 (4.36) Qatar 7377 318.85 (1.73) Qatar 7184 306.79 (1.37) Ghana 5508 303.27 (5.36)
Table A.5: T‐test of gender differences in test scores for TIMSS in Egypt
Maths Science Group Obs. Mean Std. Err. Std. Dev. Mean Std. Err. Std. Dev.
2007 Girls 3258 397.26 1.71 97.86 416.80 1.70 96.95 Boys 3324 383.98 1.77 102.12 399.86 1.75 101.02 diff 13.27 2.50 16.94 2.44
t‐stats 5.38 6.94 2003
Girls 3118 406.32 1.60 89.14 421.62 1.79 99.74 Boys 3534 405.50 1.60 94.93 420.54 1.79 106.65 diff 0.83 2.27 1.08 2.54
t‐stats 0.36 0.42 2003 vs. 2007
2003 6652 405.89 1.13 92.26 421.05 1.27 103.46 2007 6582 390.56 1.25 101.80 408.25 1.22 99.38 diff 15.33 1.69 12.80 1.76
t‐stats 9.077 7.26
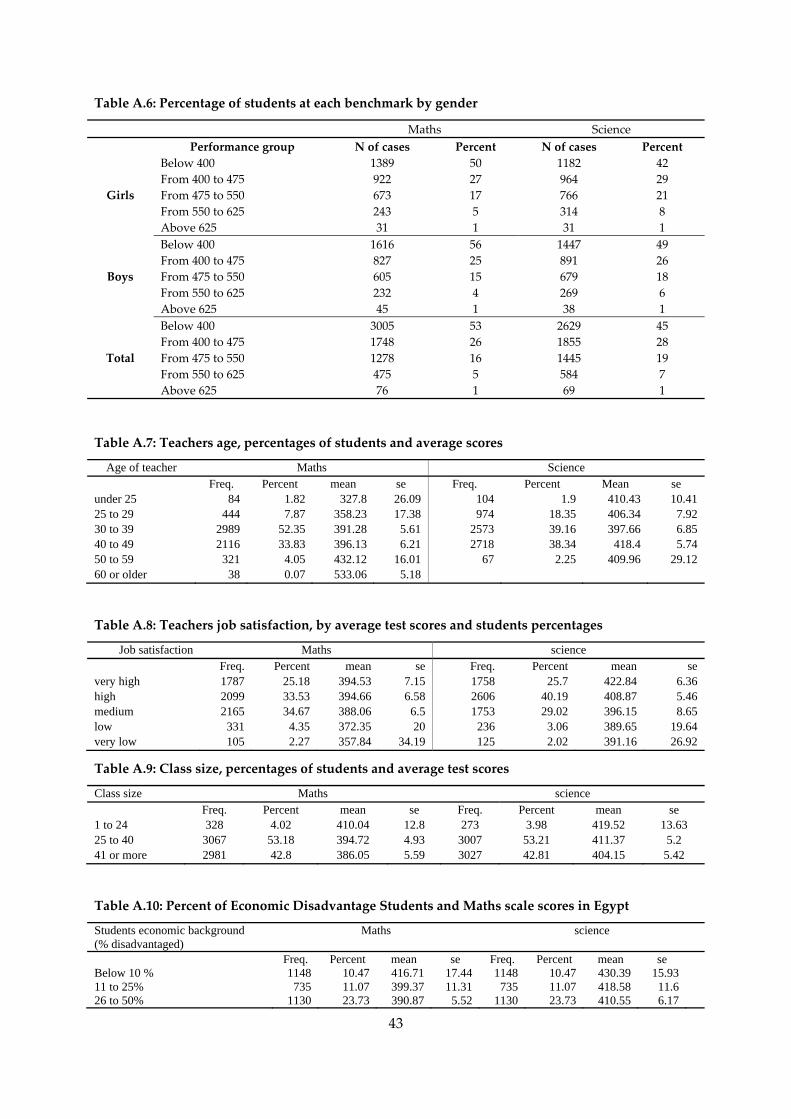
43
Table A.6: Percentage of students at each benchmark by gender
Maths Science Performance group N of cases Percent N of cases Percent
Girls
Below 400 1389 50 1182 42 From 400 to 475 922 27 964 29 From 475 to 550 673 17 766 21 From 550 to 625 243 5 314 8 Above 625 31 1 31 1
Boys
Below 400 1616 56 1447 49 From 400 to 475 827 25 891 26 From 475 to 550 605 15 679 18 From 550 to 625 232 4 269 6 Above 625 45 1 38 1
Total
Below 400 3005 53 2629 45 From 400 to 475 1748 26 1855 28 From 475 to 550 1278 16 1445 19 From 550 to 625 475 5 584 7 Above 625 76 1 69 1
Table A.7: Teachers age, percentages of students and average scores
Age of teacher Maths Science Freq. Percent mean se Freq. Percent Mean se under 25 84 1.82 327.8 26.09 104 1.9 410.43 10.41 25 to 29 444 7.87 358.23 17.38 974 18.35 406.34 7.92 30 to 39 2989 52.35 391.28 5.61 2573 39.16 397.66 6.85 40 to 49 2116 33.83 396.13 6.21 2718 38.34 418.4 5.74 50 to 59 321 4.05 432.12 16.01 67 2.25 409.96 29.12 60 or older 38 0.07 533.06 5.18
Table A.8: Teachers job satisfaction, by average test scores and students percentages
Job satisfaction Maths science Freq. Percent mean se Freq. Percent mean se very high 1787 25.18 394.53 7.15 1758 25.7 422.84 6.36 high 2099 33.53 394.66 6.58 2606 40.19 408.87 5.46 medium 2165 34.67 388.06 6.5 1753 29.02 396.15 8.65 low 331 4.35 372.35 20 236 3.06 389.65 19.64 very low 105 2.27 357.84 34.19 125 2.02 391.16 26.92
Table A.9: Class size, percentages of students and average test scores
Class size Maths science Freq. Percent mean se Freq. Percent mean se 1 to 24 328 4.02 410.04 12.8 273 3.98 419.52 13.63 25 to 40 3067 53.18 394.72 4.93 3007 53.21 411.37 5.2 41 or more 2981 42.8 386.05 5.59 3027 42.81 404.15 5.42
Table A.10: Percent of Economic Disadvantage Students and Maths scale scores in Egypt
Students economic background (% disadvantaged)
Maths science
Freq. Percent mean se Freq. Percent mean se Below 10 % 1148 10.47 416.71 17.44 1148 10.47 430.39 15.93 11 to 25% 735 11.07 399.37 11.31 735 11.07 418.58 11.6 26 to 50% 1130 23.73 390.87 5.52 1130 23.73 410.55 6.17
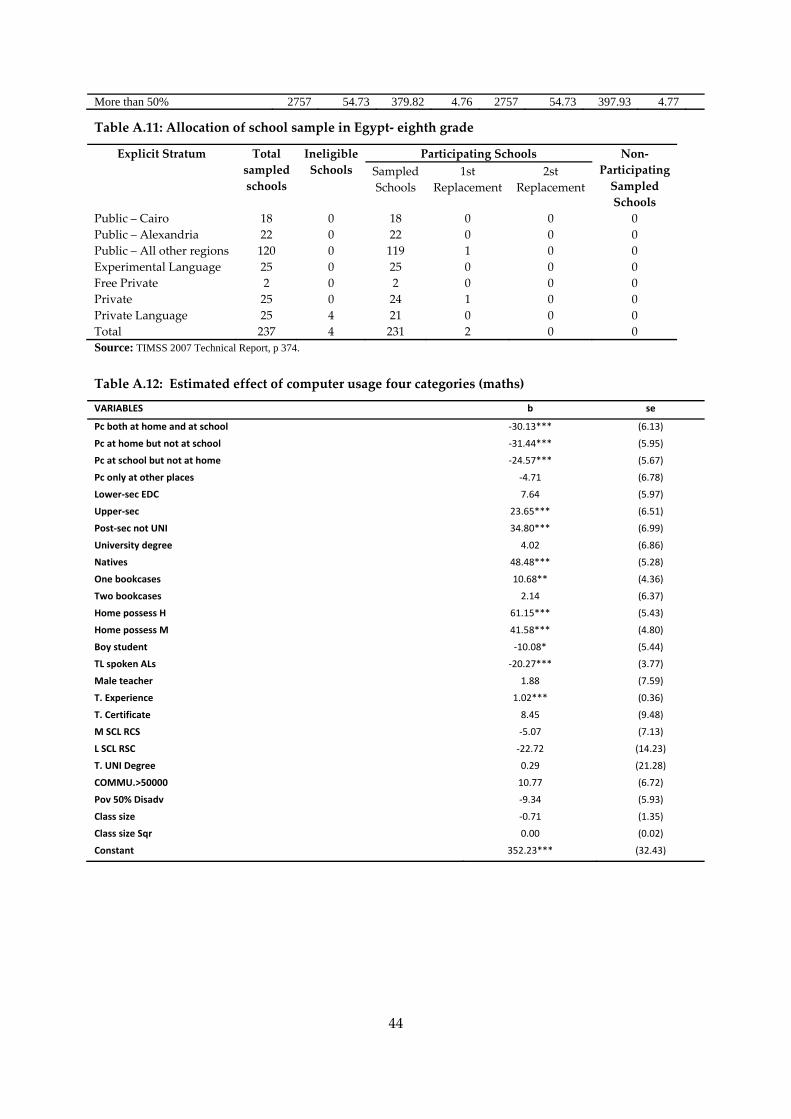
44
More than 50% 2757 54.73 379.82 4.76 2757 54.73 397.93 4.77
Table A.11: Allocation of school sample in Egypt‐ eighth grade
Explicit Stratum Total sampled schools
IneligibleSchools
Participating Schools Non‐ ParticipatingSampled Schools
Sampled Schools
1st Replacement
2st Replacement
Public – Cairo 18 0 18 0 0 0 Public – Alexandria 22 0 22 0 0 0 Public – All other regions 120 0 119 1 0 0 Experimental Language 25 0 25 0 0 0 Free Private 2 0 2 0 0 0 Private 25 0 24 1 0 0 Private Language 25 4 21 0 0 0 Total 237 4 231 2 0 0 Source: TIMSS 2007 Technical Report, p 374.
Table A.12: Estimated effect of computer usage four categories (maths)
VARIABLES b se
Pc both at home and at school ‐30.13*** (6.13)
Pc at home but not at school ‐31.44*** (5.95)
Pc at school but not at home ‐24.57*** (5.67)
Pc only at other places ‐4.71 (6.78)
Lower‐sec EDC 7.64 (5.97)
Upper‐sec 23.65*** (6.51)
Post‐sec not UNI 34.80*** (6.99)
University degree 4.02 (6.86)
Natives 48.48*** (5.28)
One bookcases 10.68** (4.36)
Two bookcases 2.14 (6.37)
Home possess H 61.15*** (5.43)
Home possess M 41.58*** (4.80)
Boy student ‐10.08* (5.44)
TL spoken ALs ‐20.27*** (3.77)
Male teacher 1.88 (7.59)
T. Experience 1.02*** (0.36)
T. Certificate 8.45 (9.48)
M SCL RCS ‐5.07 (7.13)
L SCL RSC ‐22.72 (14.23)
T. UNI Degree 0.29 (21.28)
COMMU.>50000 10.77 (6.72)
Pov 50% Disadv ‐9.34 (5.93)
Class size ‐0.71 (1.35)
Class size Sqr 0.00 (0.02)
Constant 352.23*** (32.43)
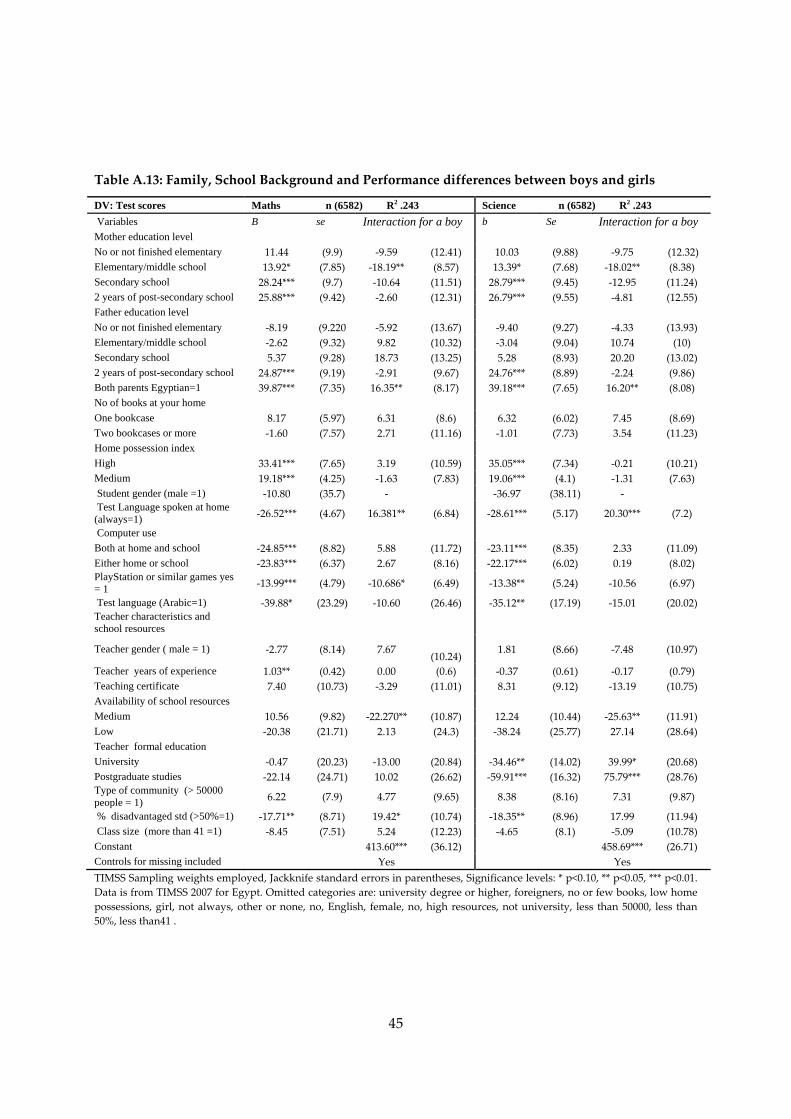
45
Table A.13: Family, School Background and Performance differences between boys and girls
DV: Test scores Maths n (6582) R2 .243 Science n (6582) R2 .243 Variables B se Interaction for a boy b Se Interaction for a boy Mother education level No or not finished elementary 11.44 (9.9) ‐9.59 (12.41) 10.03 (9.88) ‐9.75 (12.32) Elementary/middle school 13.92* (7.85) ‐18.19** (8.57) 13.39* (7.68) ‐18.02** (8.38) Secondary school 28.24*** (9.7) ‐10.64 (11.51) 28.79*** (9.45) ‐12.95 (11.24) 2 years of post-secondary school 25.88*** (9.42) ‐2.60 (12.31) 26.79*** (9.55) ‐4.81 (12.55) Father education level No or not finished elementary ‐8.19 (9.220 ‐5.92 (13.67) ‐9.40 (9.27) ‐4.33 (13.93) Elementary/middle school ‐2.62 (9.32) 9.82 (10.32) ‐3.04 (9.04) 10.74 (10) Secondary school 5.37 (9.28) 18.73 (13.25) 5.28 (8.93) 20.20 (13.02) 2 years of post-secondary school 24.87*** (9.19) ‐2.91 (9.67) 24.76*** (8.89) ‐2.24 (9.86) Both parents Egyptian=1 39.87*** (7.35) 16.35** (8.17) 39.18*** (7.65) 16.20** (8.08) No of books at your home One bookcase 8.17 (5.97) 6.31 (8.6) 6.32 (6.02) 7.45 (8.69) Two bookcases or more ‐1.60 (7.57) 2.71 (11.16) ‐1.01 (7.73) 3.54 (11.23) Home possession index High 33.41*** (7.65) 3.19 (10.59) 35.05*** (7.34) ‐0.21 (10.21) Medium 19.18*** (4.25) ‐1.63 (7.83) 19.06*** (4.1) ‐1.31 (7.63) Student gender (male =1) ‐10.80 (35.7) ‐ ‐36.97 (38.11) ‐ Test Language spoken at home (always=1) ‐26.52*** (4.67) 16.381** (6.84) ‐28.61*** (5.17) 20.30*** (7.2)
Computer use Both at home and school ‐24.85*** (8.82) 5.88 (11.72) ‐23.11*** (8.35) 2.33 (11.09) Either home or school ‐23.83*** (6.37) 2.67 (8.16) ‐22.17*** (6.02) 0.19 (8.02) PlayStation or similar games yes = 1 ‐13.99*** (4.79) ‐10.686* (6.49) ‐13.38** (5.24) ‐10.56 (6.97)
Test language (Arabic=1) ‐39.88* (23.29) ‐10.60 (26.46) ‐35.12** (17.19) ‐15.01 (20.02) Teacher characteristics and school resources
Teacher gender ( male = 1) ‐2.77 (8.14) 7.67
(10.24) 1.81 (8.66) ‐7.48 (10.97)
Teacher years of experience 1.03** (0.42) 0.00 (0.6) ‐0.37 (0.61) ‐0.17 (0.79) Teaching certificate 7.40 (10.73) ‐3.29 (11.01) 8.31 (9.12) ‐13.19 (10.75) Availability of school resources Medium 10.56 (9.82) ‐22.270** (10.87) 12.24 (10.44) ‐25.63** (11.91) Low ‐20.38 (21.71) 2.13 (24.3) ‐38.24 (25.77) 27.14 (28.64) Teacher formal education University ‐0.47 (20.23) ‐13.00 (20.84) ‐34.46** (14.02) 39.99* (20.68) Postgraduate studies ‐22.14 (24.71) 10.02 (26.62) ‐59.91*** (16.32) 75.79*** (28.76) Type of community (> 50000 people = 1) 6.22 (7.9) 4.77 (9.65) 8.38 (8.16) 7.31 (9.87)
% disadvantaged std (>50%=1) ‐17.71** (8.71) 19.42* (10.74) ‐18.35** (8.96) 17.99 (11.94) Class size (more than 41 =1) ‐8.45 (7.51) 5.24 (12.23) ‐4.65 (8.1) ‐5.09 (10.78) Constant 413.60*** (36.12) 458.69*** (26.71) Controls for missing included Yes Yes TIMSS Sampling weights employed, Jackknife standard errors in parentheses, Significance levels: * p<0.10, ** p<0.05, *** p<0.01. Data is from TIMSS 2007 for Egypt. Omitted categories are: university degree or higher, foreigners, no or few books, low home possessions, girl, not always, other or none, no, English, female, no, high resources, not university, less than 50000, less than 50%, less than41 .
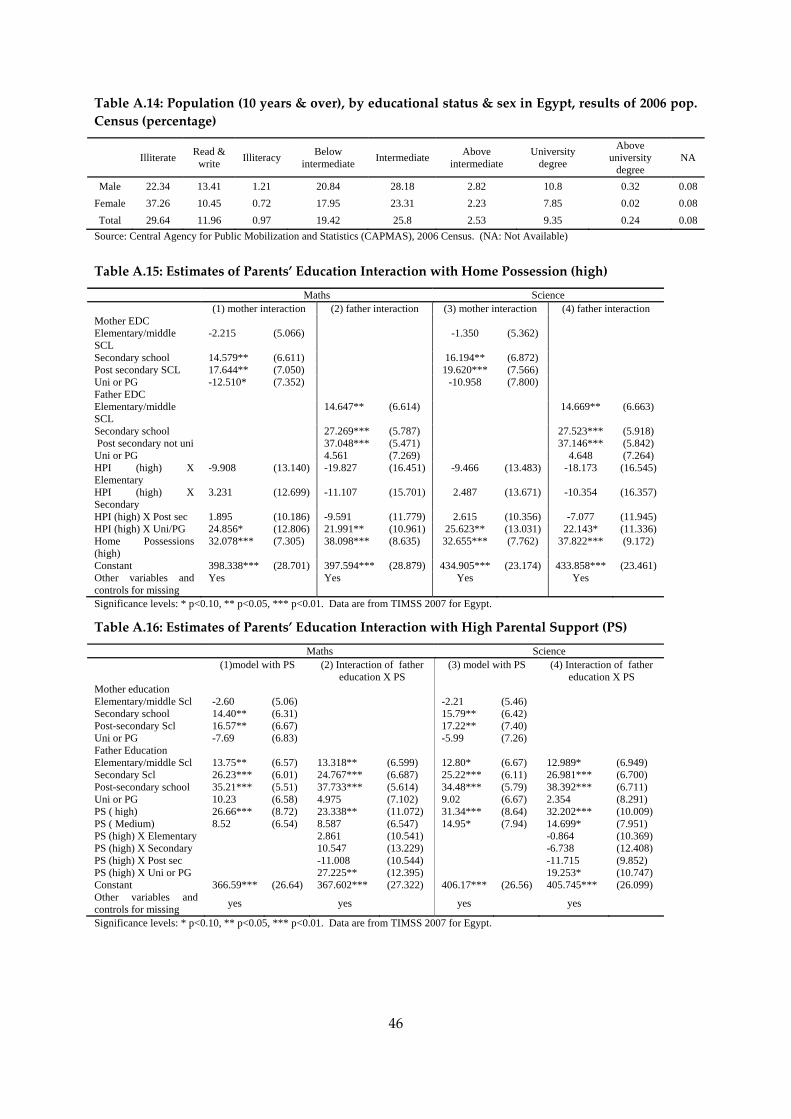
46
Table A.14: Population (10 years & over), by educational status & sex in Egypt, results of 2006 pop. Census (percentage)
Illiterate Read & write Illiteracy Below
intermediate Intermediate Above intermediate
University degree
Above university
degree NA
Male 22.34 13.41 1.21 20.84 28.18 2.82 10.8 0.32 0.08 Female 37.26 10.45 0.72 17.95 23.31 2.23 7.85 0.02 0.08 Total 29.64 11.96 0.97 19.42 25.8 2.53 9.35 0.24 0.08
Source: Central Agency for Public Mobilization and Statistics (CAPMAS), 2006 Census. (NA: Not Available)
Table A.15: Estimates of Parents’ Education Interaction with Home Possession (high)
Maths Science (1) mother interaction (2) father interaction (3) mother interaction (4) father interaction Mother EDC Elementary/middle SCL
-2.215 (5.066) -1.350 (5.362)
Secondary school 14.579** (6.611) 16.194** (6.872) Post secondary SCL 17.644** (7.050) 19.620*** (7.566) Uni or PG -12.510* (7.352) -10.958 (7.800) Father EDC Elementary/middle SCL
14.647** (6.614) 14.669** (6.663)
Secondary school 27.269*** (5.787) 27.523*** (5.918) Post secondary not uni 37.048*** (5.471) 37.146*** (5.842) Uni or PG 4.561 (7.269) 4.648 (7.264) HPI (high) X Elementary
-9.908 (13.140) -19.827 (16.451) -9.466 (13.483) -18.173 (16.545)
HPI (high) X Secondary
3.231 (12.699) -11.107 (15.701) 2.487 (13.671) -10.354 (16.357)
HPI (high) X Post sec 1.895 (10.186) -9.591 (11.779) 2.615 (10.356) -7.077 (11.945) HPI (high) X Uni/PG 24.856* (12.806) 21.991** (10.961) 25.623** (13.031) 22.143* (11.336) Home Possessions (high)
32.078*** (7.305) 38.098*** (8.635) 32.655*** (7.762) 37.822*** (9.172)
Constant 398.338*** (28.701) 397.594*** (28.879) 434.905*** (23.174) 433.858*** (23.461) Other variables and controls for missing
Yes Yes Yes Yes
Significance levels: * p<0.10, ** p<0.05, *** p<0.01. Data are from TIMSS 2007 for Egypt.
Table A.16: Estimates of Parents’ Education Interaction with High Parental Support (PS)
Maths Science (1)model with PS (2) Interaction of father
education X PS (3) model with PS (4) Interaction of father
education X PS Mother education Elementary/middle Scl -2.60 (5.06) -2.21 (5.46) Secondary school 14.40** (6.31) 15.79** (6.42) Post-secondary Scl 16.57** (6.67) 17.22** (7.40) Uni or PG -7.69 (6.83) -5.99 (7.26) Father Education Elementary/middle Scl 13.75** (6.57) 13.318** (6.599) 12.80* (6.67) 12.989* (6.949) Secondary Scl 26.23*** (6.01) 24.767*** (6.687) 25.22*** (6.11) 26.981*** (6.700) Post-secondary school 35.21*** (5.51) 37.733*** (5.614) 34.48*** (5.79) 38.392*** (6.711) Uni or PG 10.23 (6.58) 4.975 (7.102) 9.02 (6.67) 2.354 (8.291) PS ( high) 26.66*** (8.72) 23.338** (11.072) 31.34*** (8.64) 32.202*** (10.009) PS ( Medium) 8.52 (6.54) 8.587 (6.547) 14.95* (7.94) 14.699* (7.951) PS (high) X Elementary 2.861 (10.541) -0.864 (10.369) PS (high) X Secondary 10.547 (13.229) -6.738 (12.408) PS (high) X Post sec -11.008 (10.544) -11.715 (9.852) PS (high) X Uni or PG 27.225** (12.395) 19.253* (10.747) Constant 366.59*** (26.64) 367.602*** (27.322) 406.17*** (26.56) 405.745*** (26.099) Other variables and controls for missing yes yes yes yes
Significance levels: * p<0.10, ** p<0.05, *** p<0.01. Data are from TIMSS 2007 for Egypt.
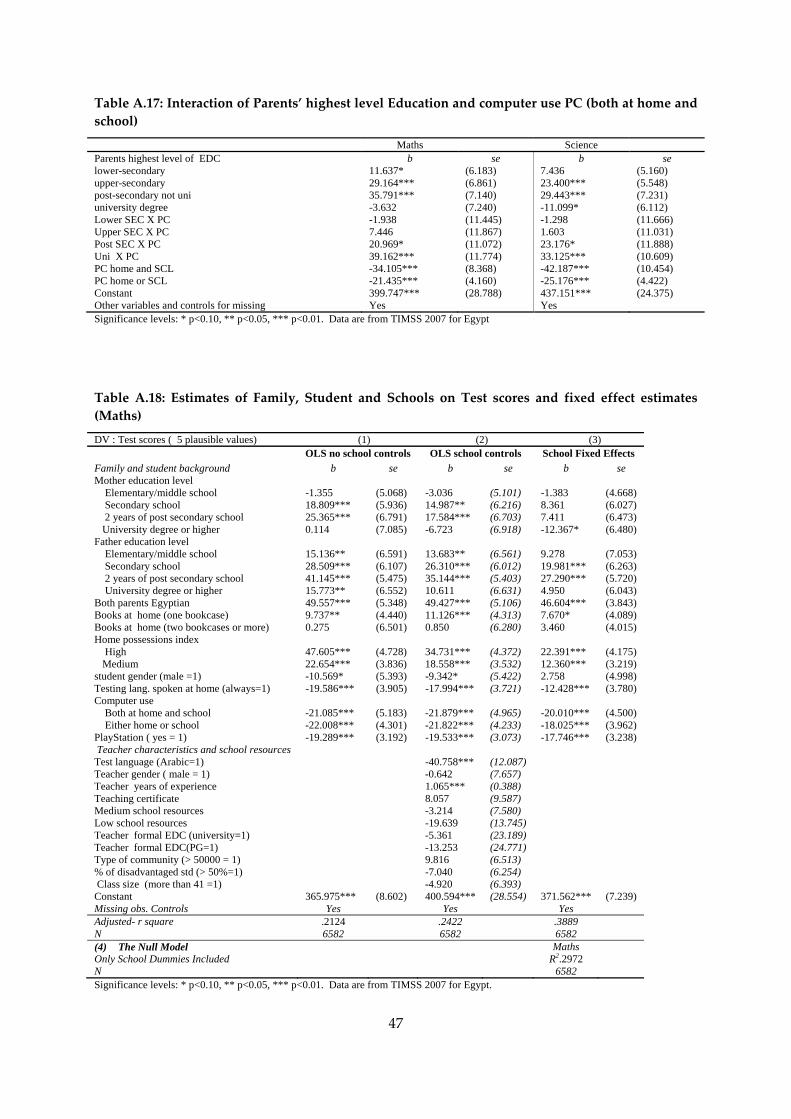
47
Table A.17: Interaction of Parents’ highest level Education and computer use PC (both at home and school)
Maths Science Parents highest level of EDC b se b se lower-secondary 11.637* (6.183) 7.436 (5.160) upper-secondary 29.164*** (6.861) 23.400*** (5.548) post-secondary not uni 35.791*** (7.140) 29.443*** (7.231) university degree -3.632 (7.240) -11.099* (6.112) Lower SEC X PC -1.938 (11.445) -1.298 (11.666) Upper SEC X PC 7.446 (11.867) 1.603 (11.031) Post SEC X PC 20.969* (11.072) 23.176* (11.888) Uni X PC 39.162*** (11.774) 33.125*** (10.609) PC home and SCL -34.105*** (8.368) -42.187*** (10.454) PC home or SCL -21.435*** (4.160) -25.176*** (4.422) Constant 399.747*** (28.788) 437.151*** (24.375) Other variables and controls for missing Yes Yes Significance levels: * p<0.10, ** p<0.05, *** p<0.01. Data are from TIMSS 2007 for Egypt
Table A.18: Estimates of Family, Student and Schools on Test scores and fixed effect estimates (Maths)
DV : Test scores ( 5 plausible values) (1) (2) (3) OLS no school controls OLS school controls School Fixed Effects Family and student background b se b se b se Mother education level Elementary/middle school -1.355 (5.068) -3.036 (5.101) -1.383 (4.668) Secondary school 18.809*** (5.936) 14.987** (6.216) 8.361 (6.027) 2 years of post secondary school 25.365*** (6.791) 17.584*** (6.703) 7.411 (6.473) University degree or higher 0.114 (7.085) -6.723 (6.918) -12.367* (6.480) Father education level Elementary/middle school 15.136** (6.591) 13.683** (6.561) 9.278 (7.053) Secondary school 28.509*** (6.107) 26.310*** (6.012) 19.981*** (6.263) 2 years of post secondary school 41.145*** (5.475) 35.144*** (5.403) 27.290*** (5.720) University degree or higher 15.773** (6.552) 10.611 (6.631) 4.950 (6.043) Both parents Egyptian 49.557*** (5.348) 49.427*** (5.106) 46.604*** (3.843) Books at home (one bookcase) 9.737** (4.440) 11.126*** (4.313) 7.670* (4.089) Books at home (two bookcases or more) 0.275 (6.501) 0.850 (6.280) 3.460 (4.015) Home possessions index High 47.605*** (4.728) 34.731*** (4.372) 22.391*** (4.175) Medium 22.654*** (3.836) 18.558*** (3.532) 12.360*** (3.219) student gender (male =1) -10.569* (5.393) -9.342* (5.422) 2.758 (4.998) Testing lang. spoken at home (always=1) -19.586*** (3.905) -17.994*** (3.721) -12.428*** (3.780) Computer use Both at home and school -21.085*** (5.183) -21.879*** (4.965) -20.010*** (4.500) Either home or school -22.008*** (4.301) -21.822*** (4.233) -18.025*** (3.962) PlayStation ( yes = 1) -19.289*** (3.192) -19.533*** (3.073) -17.746*** (3.238) Teacher characteristics and school resources Test language (Arabic=1) -40.758*** (12.087) Teacher gender ( male = 1) -0.642 (7.657) Teacher years of experience 1.065*** (0.388) Teaching certificate 8.057 (9.587) Medium school resources -3.214 (7.580) Low school resources -19.639 (13.745) Teacher formal EDC (university=1) -5.361 (23.189) Teacher formal EDC(PG=1) -13.253 (24.771) Type of community (> 50000 = 1) 9.816 (6.513) % of disadvantaged std (> 50%=1) -7.040 (6.254) Class size (more than 41 =1) -4.920 (6.393) Constant 365.975*** (8.602) 400.594*** (28.554) 371.562*** (7.239) Missing obs. Controls Yes Yes Yes Adjusted- r square .2124 .2422 .3889 N 6582 6582 6582 (4) The Null Model Maths Only School Dummies Included R2.2972 N 6582 Significance levels: * p<0.10, ** p<0.05, *** p<0.01. Data are from TIMSS 2007 for Egypt.
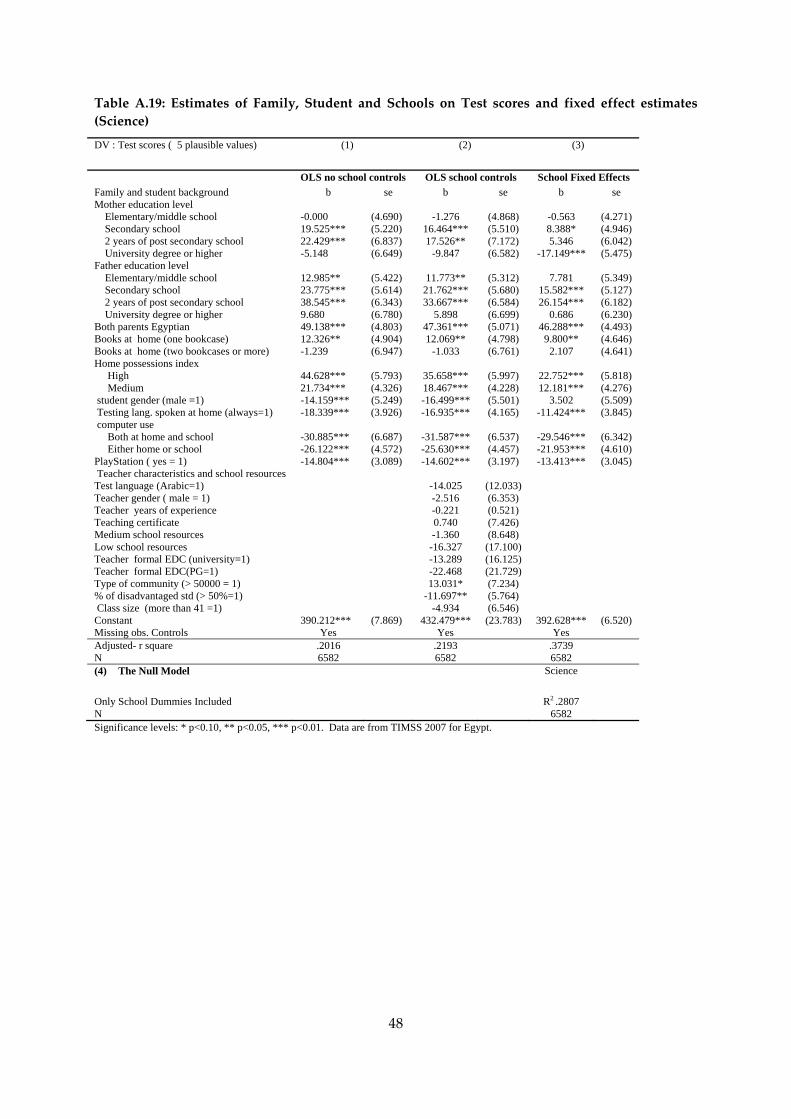
48
Table A.19: Estimates of Family, Student and Schools on Test scores and fixed effect estimates (Science)
DV : Test scores ( 5 plausible values) (1) (2) (3)
OLS no school controls OLS school controls School Fixed Effects Family and student background b se b se b se Mother education level Elementary/middle school -0.000 (4.690) -1.276 (4.868) -0.563 (4.271) Secondary school 19.525*** (5.220) 16.464*** (5.510) 8.388* (4.946) 2 years of post secondary school 22.429*** (6.837) 17.526** (7.172) 5.346 (6.042) University degree or higher -5.148 (6.649) -9.847 (6.582) -17.149*** (5.475) Father education level Elementary/middle school 12.985** (5.422) 11.773** (5.312) 7.781 (5.349) Secondary school 23.775*** (5.614) 21.762*** (5.680) 15.582*** (5.127) 2 years of post secondary school 38.545*** (6.343) 33.667*** (6.584) 26.154*** (6.182) University degree or higher 9.680 (6.780) 5.898 (6.699) 0.686 (6.230) Both parents Egyptian 49.138*** (4.803) 47.361*** (5.071) 46.288*** (4.493) Books at home (one bookcase) 12.326** (4.904) 12.069** (4.798) 9.800** (4.646) Books at home (two bookcases or more) -1.239 (6.947) -1.033 (6.761) 2.107 (4.641) Home possessions index High 44.628*** (5.793) 35.658*** (5.997) 22.752*** (5.818) Medium 21.734*** (4.326) 18.467*** (4.228) 12.181*** (4.276) student gender (male =1) -14.159*** (5.249) -16.499*** (5.501) 3.502 (5.509) Testing lang. spoken at home (always=1) -18.339*** (3.926) -16.935*** (4.165) -11.424*** (3.845) computer use Both at home and school -30.885*** (6.687) -31.587*** (6.537) -29.546*** (6.342) Either home or school -26.122*** (4.572) -25.630*** (4.457) -21.953*** (4.610) PlayStation ( yes = 1) -14.804*** (3.089) -14.602*** (3.197) -13.413*** (3.045) Teacher characteristics and school resources Test language (Arabic=1) -14.025 (12.033) Teacher gender ( male = 1) -2.516 (6.353) Teacher years of experience -0.221 (0.521) Teaching certificate 0.740 (7.426) Medium school resources -1.360 (8.648) Low school resources -16.327 (17.100) Teacher formal EDC (university=1) -13.289 (16.125) Teacher formal EDC(PG=1) -22.468 (21.729) Type of community (> 50000 = 1) 13.031* (7.234) % of disadvantaged std (> 50%=1) -11.697** (5.764) Class size (more than 41 =1) -4.934 (6.546) Constant 390.212*** (7.869) 432.479*** (23.783) 392.628*** (6.520) Missing obs. Controls Yes Yes Yes Adjusted- r square .2016 .2193 .3739 N 6582 6582 6582 (4) The Null Model Science
Only School Dummies Included R2 .2807 N 6582 Significance levels: * p<0.10, ** p<0.05, *** p<0.01. Data are from TIMSS 2007 for Egypt.
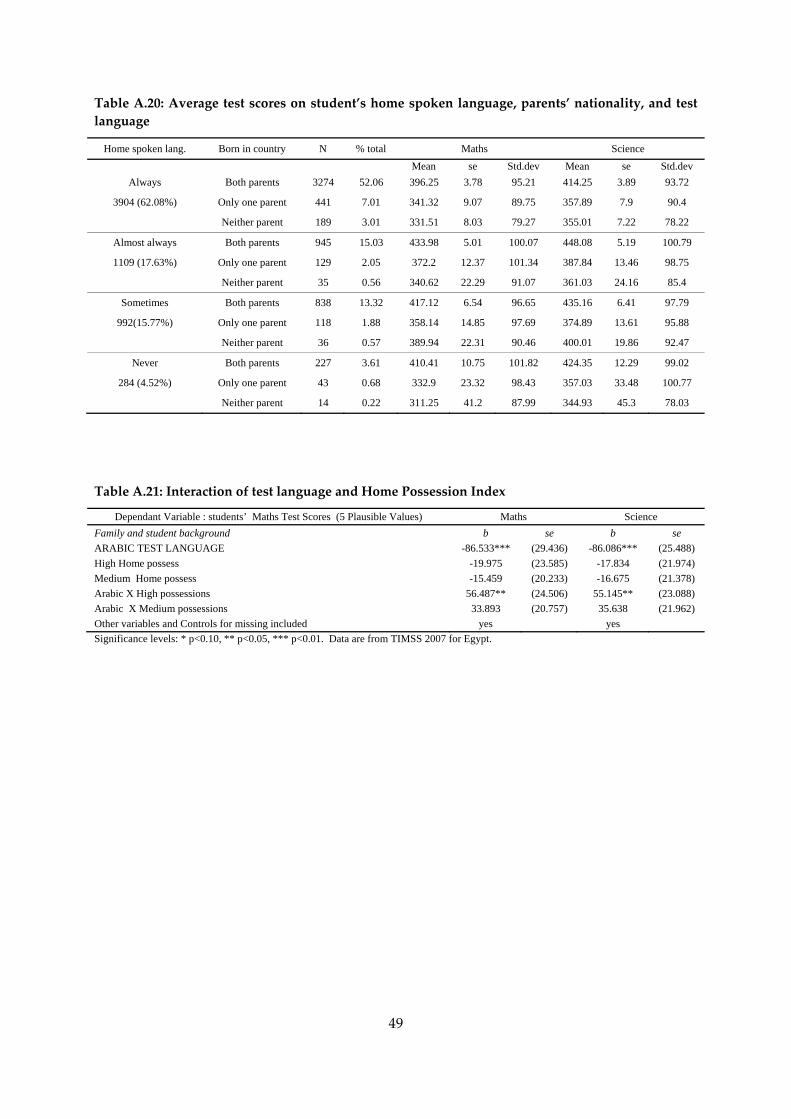
49
Table A.20: Average test scores on student’s home spoken language, parents’ nationality, and test language
Home spoken lang. Born in country N % total Maths Science
Mean se Std.dev Mean se Std.dev Always Both parents 3274 52.06 396.25 3.78 95.21 414.25 3.89 93.72
3904 (62.08%) Only one parent 441 7.01 341.32 9.07 89.75 357.89 7.9 90.4
Neither parent 189 3.01 331.51 8.03 79.27 355.01 7.22 78.22
Almost always Both parents 945 15.03 433.98 5.01 100.07 448.08 5.19 100.79
1109 (17.63%) Only one parent 129 2.05 372.2 12.37 101.34 387.84 13.46 98.75
Neither parent 35 0.56 340.62 22.29 91.07 361.03 24.16 85.4
Sometimes Both parents 838 13.32 417.12 6.54 96.65 435.16 6.41 97.79
992(15.77%) Only one parent 118 1.88 358.14 14.85 97.69 374.89 13.61 95.88
Neither parent 36 0.57 389.94 22.31 90.46 400.01 19.86 92.47
Never Both parents 227 3.61 410.41 10.75 101.82 424.35 12.29 99.02
284 (4.52%) Only one parent 43 0.68 332.9 23.32 98.43 357.03 33.48 100.77
Neither parent 14 0.22 311.25 41.2 87.99 344.93 45.3 78.03
Table A.21: Interaction of test language and Home Possession Index
Dependant Variable : students’ Maths Test Scores (5 Plausible Values) Maths Science Family and student background b se b se ARABIC TEST LANGUAGE -86.533*** (29.436) -86.086*** (25.488) High Home possess -19.975 (23.585) -17.834 (21.974) Medium Home possess -15.459 (20.233) -16.675 (21.378) Arabic X High possessions 56.487** (24.506) 55.145** (23.088) Arabic X Medium possessions 33.893 (20.757) 35.638 (21.962) Other variables and Controls for missing included yes yes Significance levels: * p<0.10, ** p<0.05, *** p<0.01. Data are from TIMSS 2007 for Egypt.
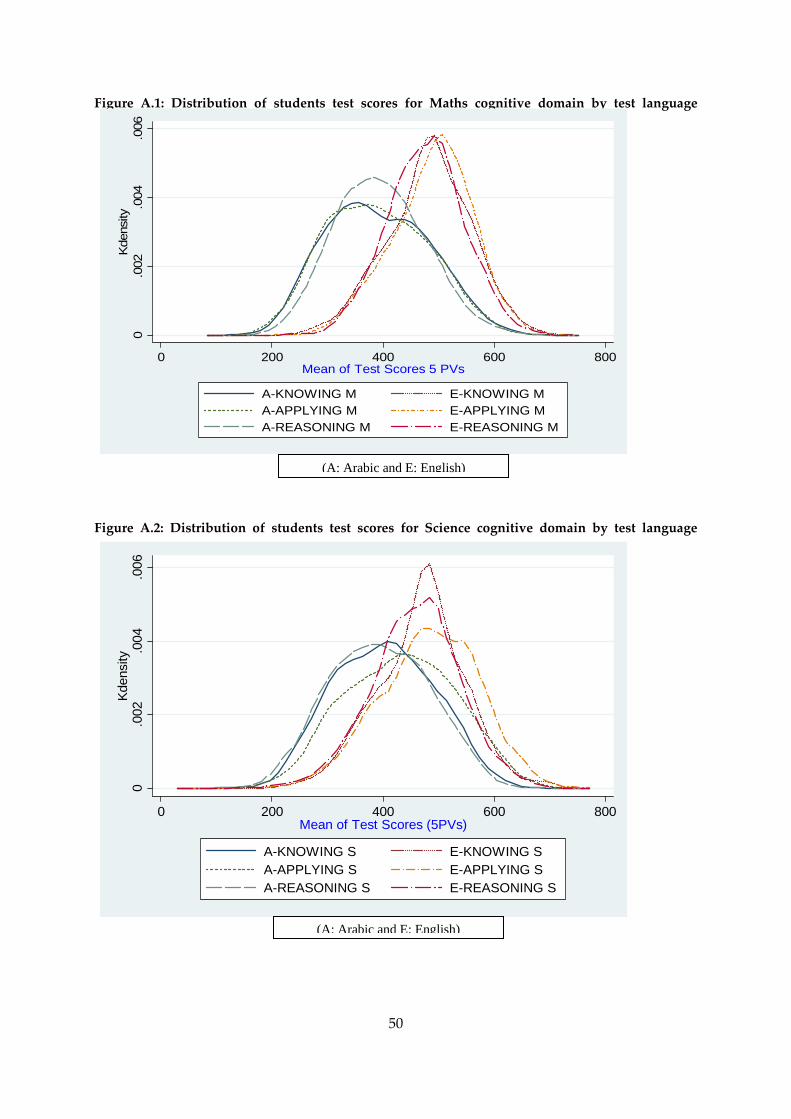
50
Figure A.1: Distribution of students test scores for Maths cognitive domain by test language
Figure A.2: Distribution of students test scores for Science cognitive domain by test language
0.0
02.0
04.0
06K
dens
ity
0 200 400 600 800Mean of Test Scores 5 PVs
A-KNOWING M E-KNOWING MA-APPLYING M E-APPLYING MA-REASONING M E-REASONING M
0.0
02.0
04.0
06Kd
ensi
ty
0 200 400 600 800Mean of Test Scores (5PVs)
A-KNOWING S E-KNOWING SA-APPLYING S E-APPLYING SA-REASONING S E-REASONING S
(A: Arabic and E: English)
(A: Arabic and E: English)
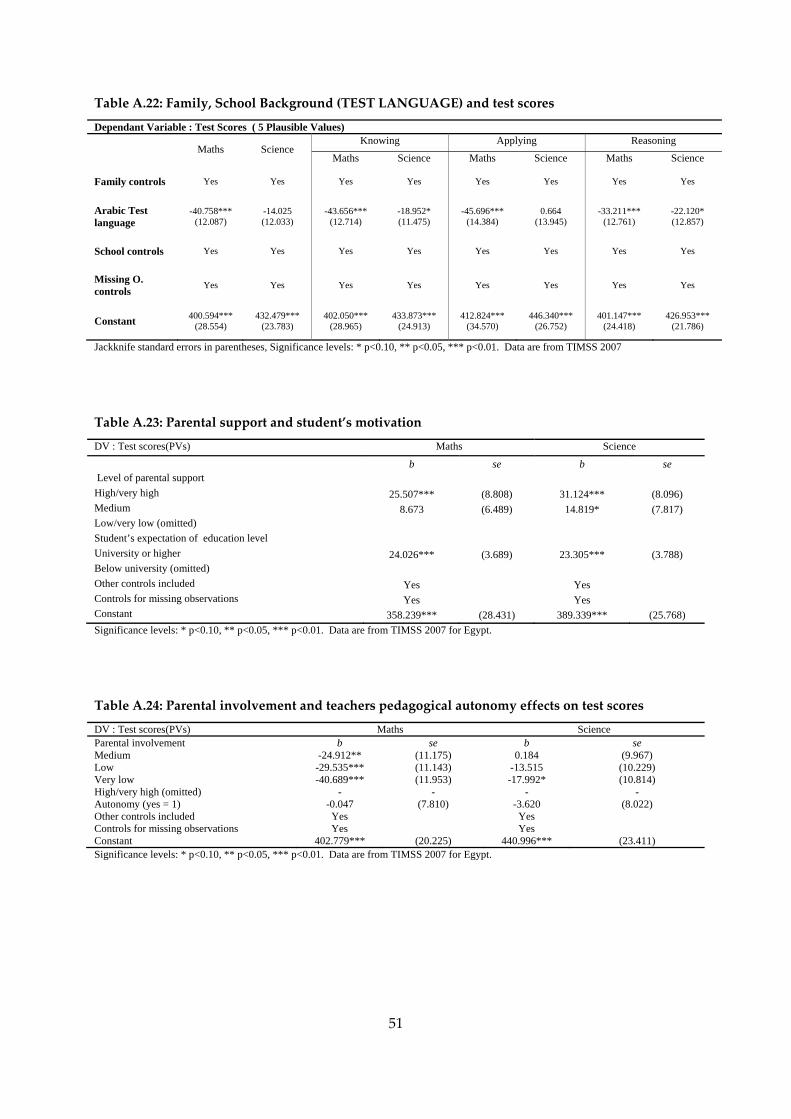
51
Table A.22: Family, School Background (TEST LANGUAGE) and test scores
Dependant Variable : Test Scores ( 5 Plausible Values)
Maths Science Knowing Applying Reasoning
Maths Science Maths Science Maths Science
Family controls Yes Yes Yes Yes Yes Yes Yes Yes
Arabic Test language
-40.758*** (12.087)
-14.025 (12.033)
-43.656*** (12.714)
-18.952* (11.475)
-45.696*** (14.384)
0.664 (13.945)
-33.211*** (12.761)
-22.120* (12.857)
School controls Yes Yes Yes Yes Yes Yes Yes Yes
Missing O. controls Yes Yes Yes Yes Yes Yes Yes Yes
Constant 400.594*** (28.554)
432.479*** (23.783)
402.050*** (28.965)
433.873*** (24.913)
412.824*** (34.570)
446.340*** (26.752)
401.147*** (24.418)
426.953*** (21.786)
Jackknife standard errors in parentheses, Significance levels: * p<0.10, ** p<0.05, *** p<0.01. Data are from TIMSS 2007
Table A.23: Parental support and student’s motivation
DV : Test scores(PVs) Maths Science b se b se
Level of parental support High/very high 25.507*** (8.808) 31.124*** (8.096) Medium 8.673 (6.489) 14.819* (7.817) Low/very low (omitted) Student’s expectation of education level University or higher 24.026*** (3.689) 23.305*** (3.788) Below university (omitted) Other controls included Yes Yes Controls for missing observations Yes Yes Constant 358.239*** (28.431) 389.339*** (25.768) Significance levels: * p<0.10, ** p<0.05, *** p<0.01. Data are from TIMSS 2007 for Egypt.
Table A.24: Parental involvement and teachers pedagogical autonomy effects on test scores
DV : Test scores(PVs) Maths Science Parental involvement b se b se Medium -24.912** (11.175) 0.184 (9.967) Low -29.535*** (11.143) -13.515 (10.229) Very low -40.689*** (11.953) -17.992* (10.814) High/very high (omitted) - - - - Autonomy (yes = 1) -0.047 (7.810) -3.620 (8.022) Other controls included Yes Yes Controls for missing observations Yes Yes Constant 402.779*** (20.225) 440.996*** (23.411) Significance levels: * p<0.10, ** p<0.05, *** p<0.01. Data are from TIMSS 2007 for Egypt.
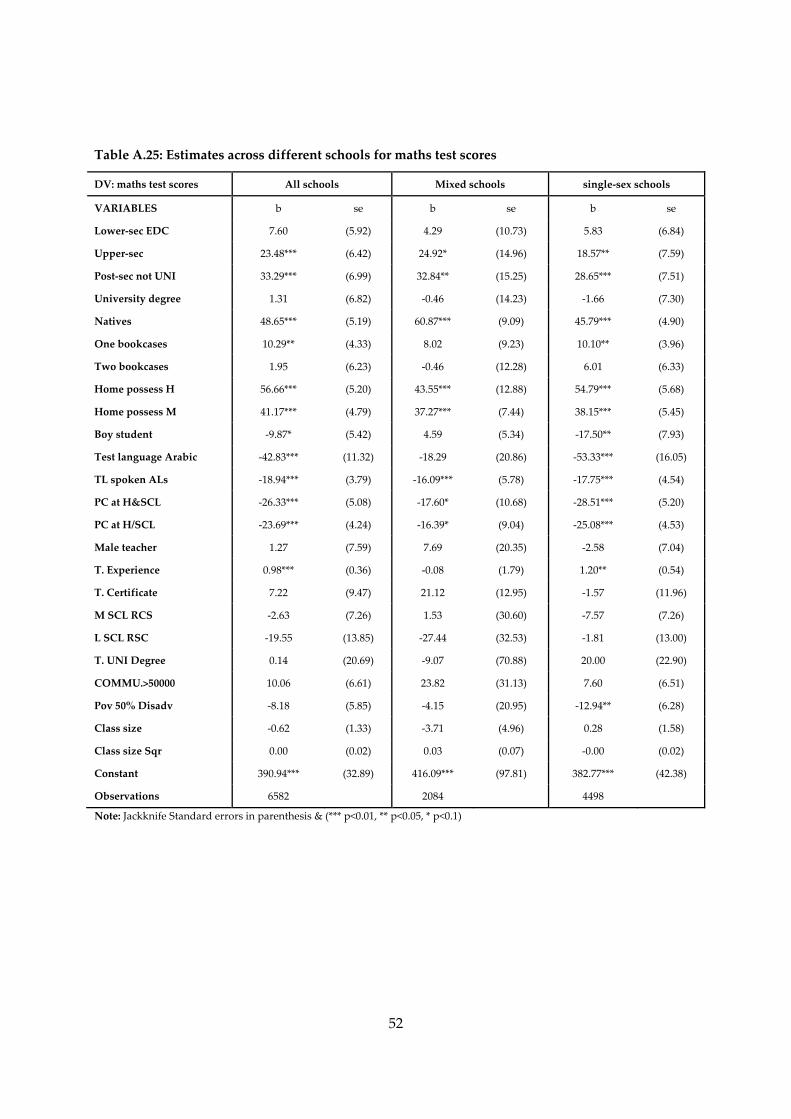
52
Table A.25: Estimates across different schools for maths test scores
DV: maths test scores All schools Mixed schools single‐sex schools
VARIABLES b se b se b se
Lower‐sec EDC 7.60 (5.92) 4.29 (10.73) 5.83 (6.84)
Upper‐sec 23.48*** (6.42) 24.92* (14.96) 18.57** (7.59)
Post‐sec not UNI 33.29*** (6.99) 32.84** (15.25) 28.65*** (7.51)
University degree 1.31 (6.82) ‐0.46 (14.23) ‐1.66 (7.30)
Natives 48.65*** (5.19) 60.87*** (9.09) 45.79*** (4.90)
One bookcases 10.29** (4.33) 8.02 (9.23) 10.10** (3.96)
Two bookcases 1.95 (6.23) ‐0.46 (12.28) 6.01 (6.33)
Home possess H 56.66*** (5.20) 43.55*** (12.88) 54.79*** (5.68)
Home possess M 41.17*** (4.79) 37.27*** (7.44) 38.15*** (5.45)
Boy student ‐9.87* (5.42) 4.59 (5.34) ‐17.50** (7.93)
Test language Arabic ‐42.83*** (11.32) ‐18.29 (20.86) ‐53.33*** (16.05)
TL spoken ALs ‐18.94*** (3.79) ‐16.09*** (5.78) ‐17.75*** (4.54)
PC at H&SCL ‐26.33*** (5.08) ‐17.60* (10.68) ‐28.51*** (5.20)
PC at H/SCL ‐23.69*** (4.24) ‐16.39* (9.04) ‐25.08*** (4.53)
Male teacher 1.27 (7.59) 7.69 (20.35) ‐2.58 (7.04)
T. Experience 0.98*** (0.36) ‐0.08 (1.79) 1.20** (0.54)
T. Certificate 7.22 (9.47) 21.12 (12.95) ‐1.57 (11.96)
M SCL RCS ‐2.63 (7.26) 1.53 (30.60) ‐7.57 (7.26)
L SCL RSC ‐19.55 (13.85) ‐27.44 (32.53) ‐1.81 (13.00)
T. UNI Degree 0.14 (20.69) ‐9.07 (70.88) 20.00 (22.90)
COMMU.>50000 10.06 (6.61) 23.82 (31.13) 7.60 (6.51)
Pov 50% Disadv ‐8.18 (5.85) ‐4.15 (20.95) ‐12.94** (6.28)
Class size ‐0.62 (1.33) ‐3.71 (4.96) 0.28 (1.58)
Class size Sqr 0.00 (0.02) 0.03 (0.07) ‐0.00 (0.02)
Constant 390.94*** (32.89) 416.09*** (97.81) 382.77*** (42.38)
Observations 6582 2084 4498
Note: Jackknife Standard errors in parenthesis & (*** p<0.01, ** p<0.05, * p<0.1)
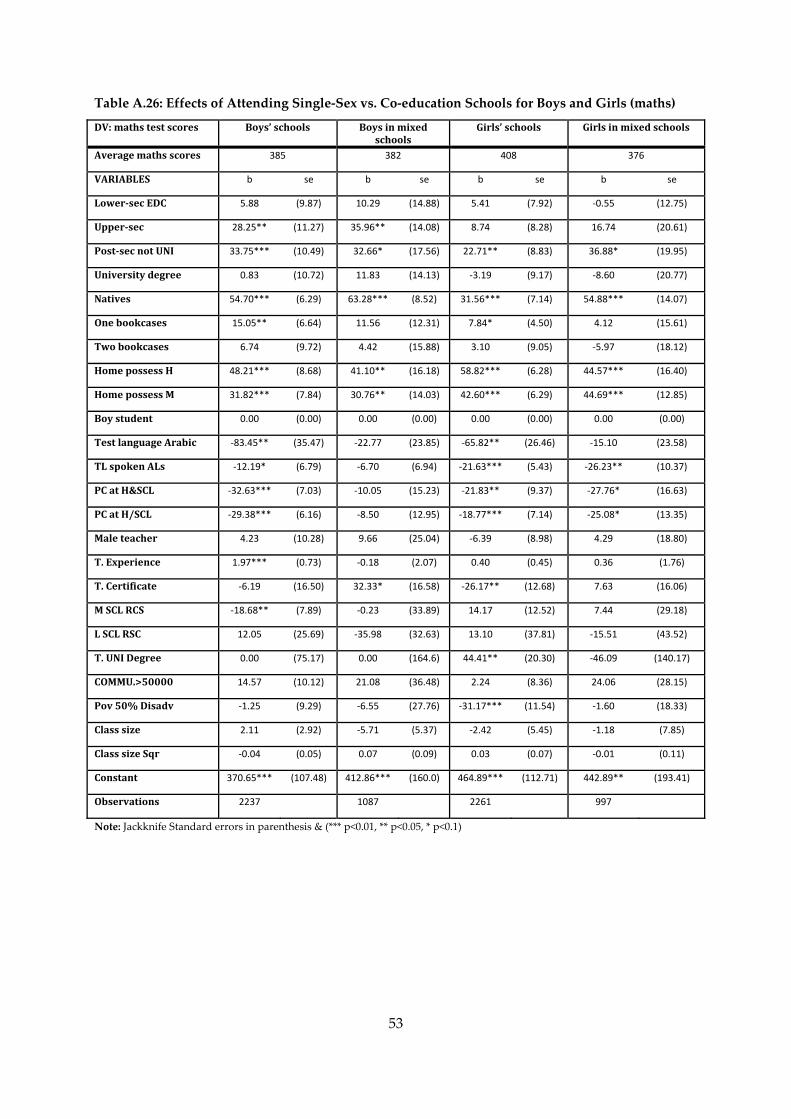
53
Table A.26: Effects of Attending Single‐Sex vs. Co‐education Schools for Boys and Girls (maths)
DV: maths test scores Boys’ schools Boys in mixed schools
Girls’ schools Girls in mixed schools
Average maths scores 385 382 408 376
VARIABLES b se b se b se b se
Lowersec EDC 5.88 (9.87) 10.29 (14.88) 5.41 (7.92) ‐0.55 (12.75)
Uppersec 28.25** (11.27) 35.96** (14.08) 8.74 (8.28) 16.74 (20.61)
Postsec not UNI 33.75*** (10.49) 32.66* (17.56) 22.71** (8.83) 36.88* (19.95)
University degree 0.83 (10.72) 11.83 (14.13) ‐3.19 (9.17) ‐8.60 (20.77)
Natives 54.70*** (6.29) 63.28*** (8.52) 31.56*** (7.14) 54.88*** (14.07)
One bookcases 15.05** (6.64) 11.56 (12.31) 7.84* (4.50) 4.12 (15.61)
Two bookcases 6.74 (9.72) 4.42 (15.88) 3.10 (9.05) ‐5.97 (18.12)
Home possess H 48.21*** (8.68) 41.10** (16.18) 58.82*** (6.28) 44.57*** (16.40)
Home possess M 31.82*** (7.84) 30.76** (14.03) 42.60*** (6.29) 44.69*** (12.85)
Boy student 0.00 (0.00) 0.00 (0.00) 0.00 (0.00) 0.00 (0.00)
Test language Arabic ‐83.45** (35.47) ‐22.77 (23.85) ‐65.82** (26.46) ‐15.10 (23.58)
TL spoken ALs ‐12.19* (6.79) ‐6.70 (6.94) ‐21.63*** (5.43) ‐26.23** (10.37)
PC at H&SCL ‐32.63*** (7.03) ‐10.05 (15.23) ‐21.83** (9.37) ‐27.76* (16.63)
PC at H/SCL ‐29.38*** (6.16) ‐8.50 (12.95) ‐18.77*** (7.14) ‐25.08* (13.35)
Male teacher 4.23 (10.28) 9.66 (25.04) ‐6.39 (8.98) 4.29 (18.80)
T. Experience 1.97*** (0.73) ‐0.18 (2.07) 0.40 (0.45) 0.36 (1.76)
T. Certificate ‐6.19 (16.50) 32.33* (16.58) ‐26.17** (12.68) 7.63 (16.06)
M SCL RCS ‐18.68** (7.89) ‐0.23 (33.89) 14.17 (12.52) 7.44 (29.18)
L SCL RSC 12.05 (25.69) ‐35.98 (32.63) 13.10 (37.81) ‐15.51 (43.52)
T. UNI Degree 0.00 (75.17) 0.00 (164.6) 44.41** (20.30) ‐46.09 (140.17)
COMMU.>50000 14.57 (10.12) 21.08 (36.48) 2.24 (8.36) 24.06 (28.15)
Pov 50% Disadv ‐1.25 (9.29) ‐6.55 (27.76) ‐31.17*** (11.54) ‐1.60 (18.33)
Class size 2.11 (2.92) ‐5.71 (5.37) ‐2.42 (5.45) ‐1.18 (7.85)
Class size Sqr ‐0.04 (0.05) 0.07 (0.09) 0.03 (0.07) ‐0.01 (0.11)
Constant 370.65*** (107.48) 412.86*** (160.0) 464.89*** (112.71) 442.89** (193.41)
Observations 2237 1087 2261 997
Note: Jackknife Standard errors in parenthesis & (*** p<0.01, ** p<0.05, * p<0.1)
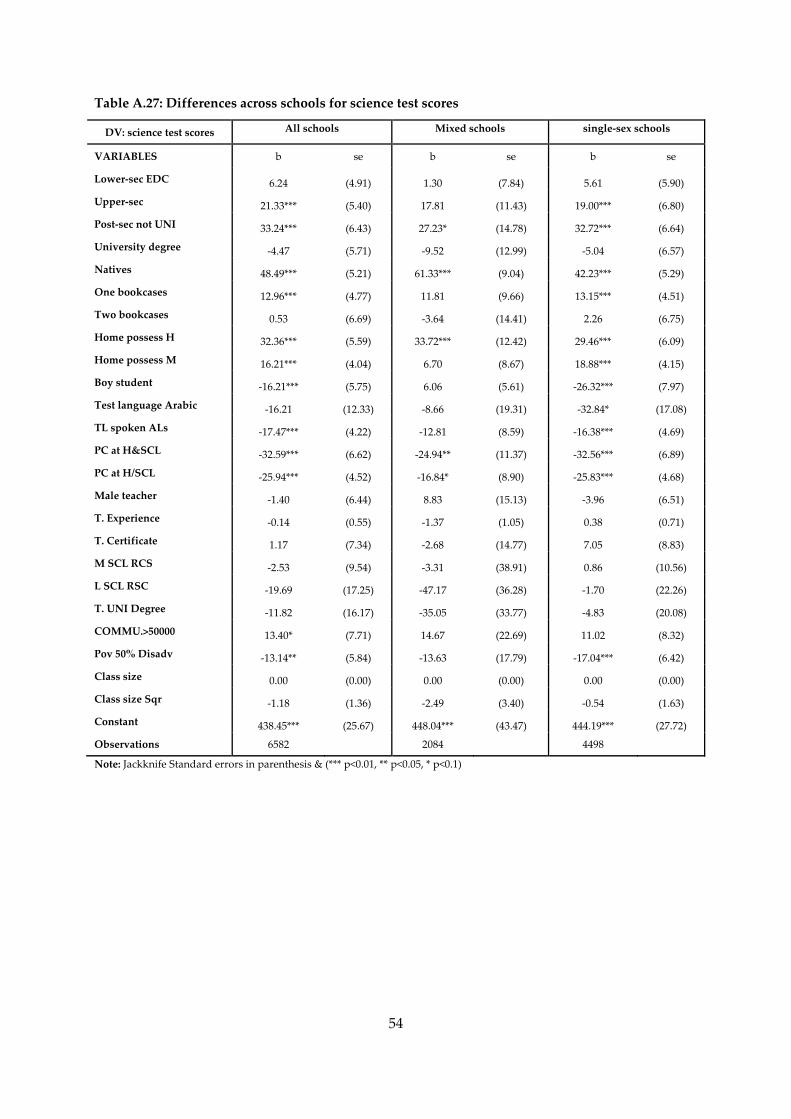
54
Table A.27: Differences across schools for science test scores
DV: science test scores All schools Mixed schools single‐sex schools
VARIABLES b se b se b se
Lower‐sec EDC 6.24 (4.91) 1.30 (7.84) 5.61 (5.90)
Upper‐sec 21.33*** (5.40) 17.81 (11.43) 19.00*** (6.80)
Post‐sec not UNI 33.24*** (6.43) 27.23* (14.78) 32.72*** (6.64)
University degree ‐4.47 (5.71) ‐9.52 (12.99) ‐5.04 (6.57)
Natives 48.49*** (5.21) 61.33*** (9.04) 42.23*** (5.29)
One bookcases 12.96*** (4.77) 11.81 (9.66) 13.15*** (4.51)
Two bookcases 0.53 (6.69) ‐3.64 (14.41) 2.26 (6.75)
Home possess H 32.36*** (5.59) 33.72*** (12.42) 29.46*** (6.09)
Home possess M 16.21*** (4.04) 6.70 (8.67) 18.88*** (4.15)
Boy student ‐16.21*** (5.75) 6.06 (5.61) ‐26.32*** (7.97)
Test language Arabic ‐16.21 (12.33) ‐8.66 (19.31) ‐32.84* (17.08)
TL spoken ALs ‐17.47*** (4.22) ‐12.81 (8.59) ‐16.38*** (4.69)
PC at H&SCL ‐32.59*** (6.62) ‐24.94** (11.37) ‐32.56*** (6.89)
PC at H/SCL ‐25.94*** (4.52) ‐16.84* (8.90) ‐25.83*** (4.68)
Male teacher ‐1.40 (6.44) 8.83 (15.13) ‐3.96 (6.51)
T. Experience ‐0.14 (0.55) ‐1.37 (1.05) 0.38 (0.71)
T. Certificate 1.17 (7.34) ‐2.68 (14.77) 7.05 (8.83)
M SCL RCS ‐2.53 (9.54) ‐3.31 (38.91) 0.86 (10.56)
L SCL RSC ‐19.69 (17.25) ‐47.17 (36.28) ‐1.70 (22.26)
T. UNI Degree ‐11.82 (16.17) ‐35.05 (33.77) ‐4.83 (20.08)
COMMU.>50000 13.40* (7.71) 14.67 (22.69) 11.02 (8.32)
Pov 50% Disadv ‐13.14** (5.84) ‐13.63 (17.79) ‐17.04*** (6.42)
Class size 0.00 (0.00) 0.00 (0.00) 0.00 (0.00)
Class size Sqr ‐1.18 (1.36) ‐2.49 (3.40) ‐0.54 (1.63)
Constant 438.45*** (25.67) 448.04*** (43.47) 444.19*** (27.72)
Observations 6582 2084 4498
Note: Jackknife Standard errors in parenthesis & (*** p<0.01, ** p<0.05, * p<0.1)
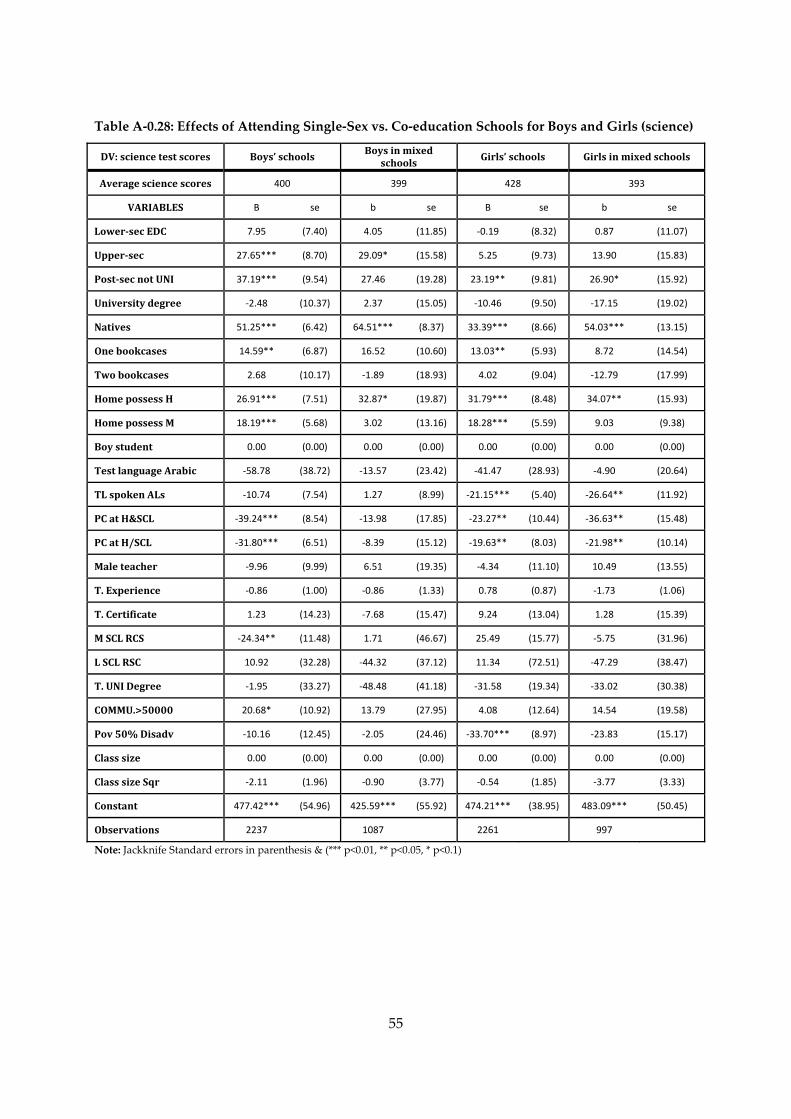
55
Table A‐ 0.28: Effects of Attending Single‐Sex vs. Co‐education Schools for Boys and Girls (science)
DV: science test scores Boys’ schools Boys in mixed
schools Girls’ schools Girls in mixed schools
Average science scores 400 399 428 393
VARIABLES B se b se B se b se
Lowersec EDC 7.95 (7.40) 4.05 (11.85) ‐0.19 (8.32) 0.87 (11.07)
Uppersec 27.65*** (8.70) 29.09* (15.58) 5.25 (9.73) 13.90 (15.83)
Postsec not UNI 37.19*** (9.54) 27.46 (19.28) 23.19** (9.81) 26.90* (15.92)
University degree ‐2.48 (10.37) 2.37 (15.05) ‐10.46 (9.50) ‐17.15 (19.02)
Natives 51.25*** (6.42) 64.51*** (8.37) 33.39*** (8.66) 54.03*** (13.15)
One bookcases 14.59** (6.87) 16.52 (10.60) 13.03** (5.93) 8.72 (14.54)
Two bookcases 2.68 (10.17) ‐1.89 (18.93) 4.02 (9.04) ‐12.79 (17.99)
Home possess H 26.91*** (7.51) 32.87* (19.87) 31.79*** (8.48) 34.07** (15.93)
Home possess M 18.19*** (5.68) 3.02 (13.16) 18.28*** (5.59) 9.03 (9.38)
Boy student 0.00 (0.00) 0.00 (0.00) 0.00 (0.00) 0.00 (0.00)
Test language Arabic ‐58.78 (38.72) ‐13.57 (23.42) ‐41.47 (28.93) ‐4.90 (20.64)
TL spoken ALs ‐10.74 (7.54) 1.27 (8.99) ‐21.15*** (5.40) ‐26.64** (11.92)
PC at H&SCL ‐39.24*** (8.54) ‐13.98 (17.85) ‐23.27** (10.44) ‐36.63** (15.48)
PC at H/SCL ‐31.80*** (6.51) ‐8.39 (15.12) ‐19.63** (8.03) ‐21.98** (10.14)
Male teacher ‐9.96 (9.99) 6.51 (19.35) ‐4.34 (11.10) 10.49 (13.55)
T. Experience ‐0.86 (1.00) ‐0.86 (1.33) 0.78 (0.87) ‐1.73 (1.06)
T. Certificate 1.23 (14.23) ‐7.68 (15.47) 9.24 (13.04) 1.28 (15.39)
M SCL RCS ‐24.34** (11.48) 1.71 (46.67) 25.49 (15.77) ‐5.75 (31.96)
L SCL RSC 10.92 (32.28) ‐44.32 (37.12) 11.34 (72.51) ‐47.29 (38.47)
T. UNI Degree ‐1.95 (33.27) ‐48.48 (41.18) ‐31.58 (19.34) ‐33.02 (30.38)
COMMU.>50000 20.68* (10.92) 13.79 (27.95) 4.08 (12.64) 14.54 (19.58)
Pov 50% Disadv ‐10.16 (12.45) ‐2.05 (24.46) ‐33.70*** (8.97) ‐23.83 (15.17)
Class size 0.00 (0.00) 0.00 (0.00) 0.00 (0.00) 0.00 (0.00)
Class size Sqr ‐2.11 (1.96) ‐0.90 (3.77) ‐0.54 (1.85) ‐3.77 (3.33)
Constant 477.42*** (54.96) 425.59*** (55.92) 474.21*** (38.95) 483.09*** (50.45)
Observations 2237 1087 2261 997
Note: Jackknife Standard errors in parenthesis & (*** p<0.01, ** p<0.05, * p<0.1)
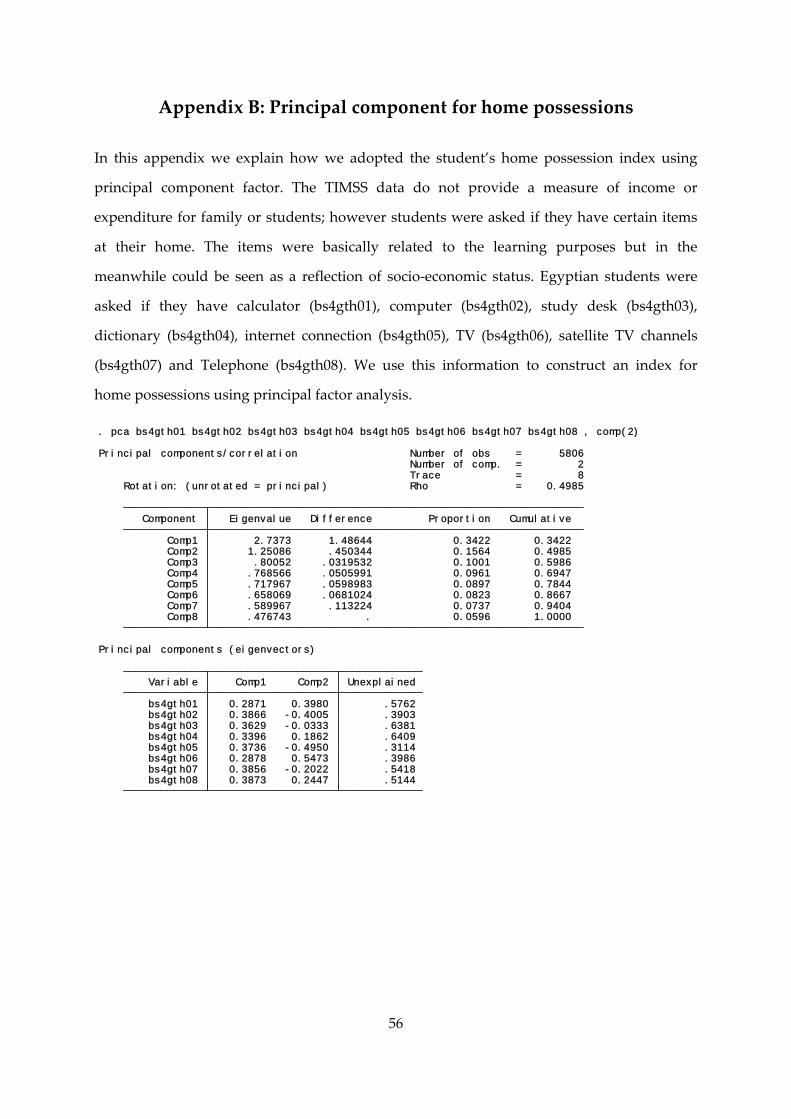
56
Appendix B: Principal component for home possessions
In this appendix we explain how we adopted the student’s home possession index using
principal component factor. The TIMSS data do not provide a measure of income or
expenditure for family or students; however students were asked if they have certain items
at their home. The items were basically related to the learning purposes but in the
meanwhile could be seen as a reflection of socio‐economic status. Egyptian students were
asked if they have calculator (bs4gth01), computer (bs4gth02), study desk (bs4gth03),
dictionary (bs4gth04), internet connection (bs4gth05), TV (bs4gth06), satellite TV channels
(bs4gth07) and Telephone (bs4gth08). We use this information to construct an index for
home possessions using principal factor analysis.
bs4gth08 0.3873 0.2447 .5144 bs4gth07 0.3856 -0.2022 .5418 bs4gth06 0.2878 0.5473 .3986 bs4gth05 0.3736 -0.4950 .3114 bs4gth04 0.3396 0.1862 .6409 bs4gth03 0.3629 -0.0333 .6381 bs4gth02 0.3866 -0.4005 .3903 bs4gth01 0.2871 0.3980 .5762 Variable Comp1 Comp2 Unexplained
Principal components (eigenvectors)
Comp8 .476743 . 0.0596 1.0000 Comp7 .589967 .113224 0.0737 0.9404 Comp6 .658069 .0681024 0.0823 0.8667 Comp5 .717967 .0598983 0.0897 0.7844 Comp4 .768566 .0505991 0.0961 0.6947 Comp3 .80052 .0319532 0.1001 0.5986 Comp2 1.25086 .450344 0.1564 0.4985 Comp1 2.7373 1.48644 0.3422 0.3422 Component Eigenvalue Difference Proportion Cumulative
Rotation: (unrotated = principal) Rho = 0.4985 Trace = 8 Number of comp. = 2Principal components/correlation Number of obs = 5806
. pca bs4gth01 bs4gth02 bs4gth03 bs4gth04 bs4gth05 bs4gth06 bs4gth07 bs4gth08 , comp(2)
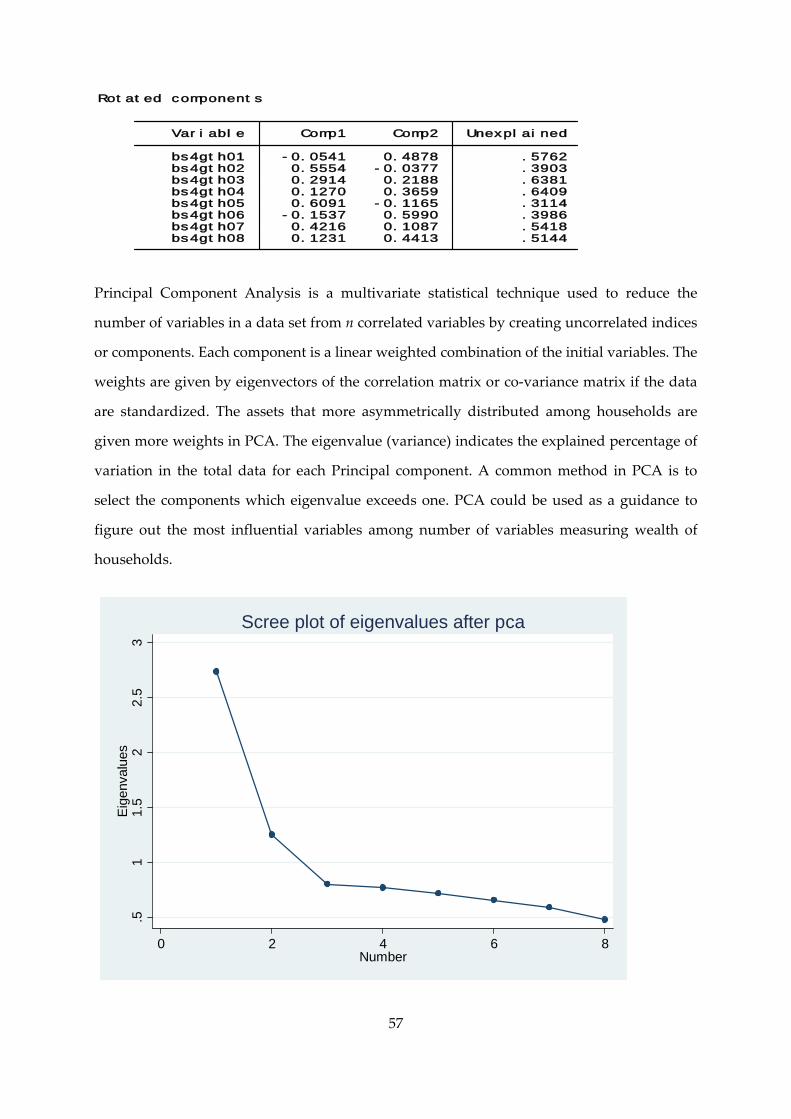
57
Principal Component Analysis is a multivariate statistical technique used to reduce the
number of variables in a data set from n correlated variables by creating uncorrelated indices
or components. Each component is a linear weighted combination of the initial variables. The
weights are given by eigenvectors of the correlation matrix or co‐variance matrix if the data
are standardized. The assets that more asymmetrically distributed among households are
given more weights in PCA. The eigenvalue (variance) indicates the explained percentage of
variation in the total data for each Principal component. A common method in PCA is to
select the components which eigenvalue exceeds one. PCA could be used as a guidance to
figure out the most influential variables among number of variables measuring wealth of
households.
bs4gth08 0.1231 0.4413 .5144 bs4gth07 0.4216 0.1087 .5418 bs4gth06 -0.1537 0.5990 .3986 bs4gth05 0.6091 -0.1165 .3114 bs4gth04 0.1270 0.3659 .6409 bs4gth03 0.2914 0.2188 .6381 bs4gth02 0.5554 -0.0377 .3903 bs4gth01 -0.0541 0.4878 .5762 Variable Comp1 Comp2 Unexplained
Rotated components
.51
1.5
22.
53
Eig
enva
lues
0 2 4 6 8Number
Scree plot of eigenvalues after pca
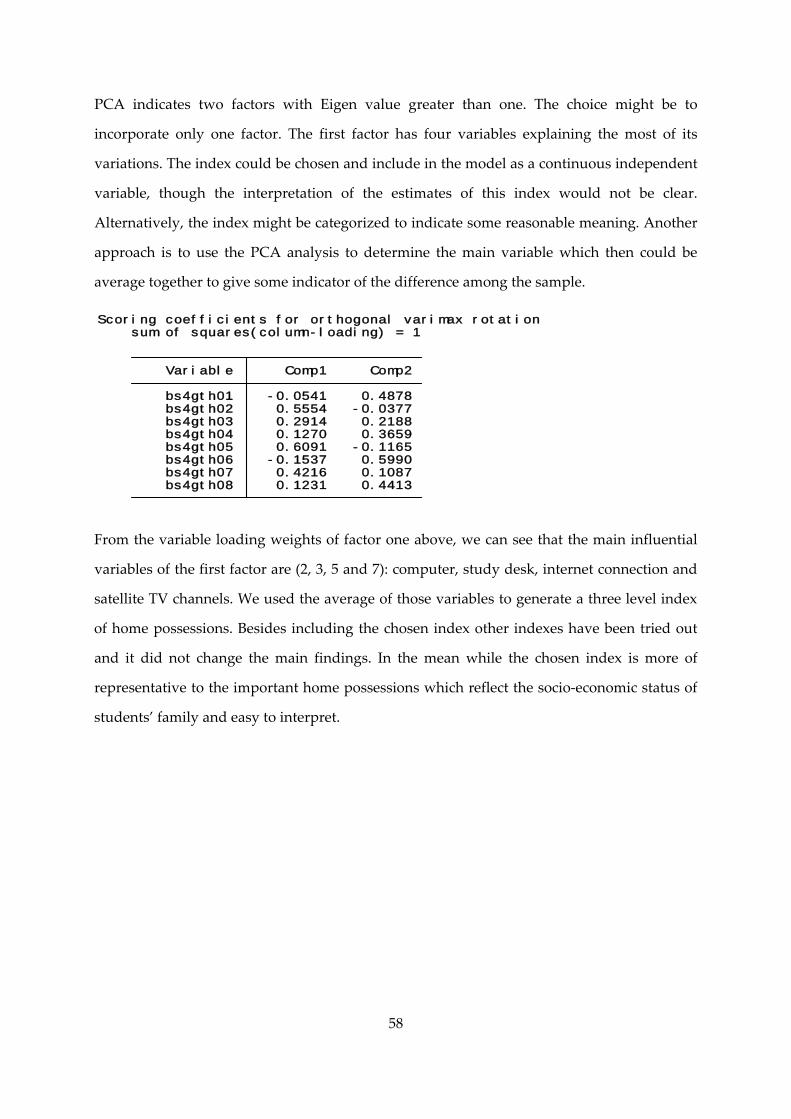
58
PCA indicates two factors with Eigen value greater than one. The choice might be to
incorporate only one factor. The first factor has four variables explaining the most of its
variations. The index could be chosen and include in the model as a continuous independent
variable, though the interpretation of the estimates of this index would not be clear.
Alternatively, the index might be categorized to indicate some reasonable meaning. Another
approach is to use the PCA analysis to determine the main variable which then could be
average together to give some indicator of the difference among the sample.
From the variable loading weights of factor one above, we can see that the main influential
variables of the first factor are (2, 3, 5 and 7): computer, study desk, internet connection and
satellite TV channels. We used the average of those variables to generate a three level index
of home possessions. Besides including the chosen index other indexes have been tried out
and it did not change the main findings. In the mean while the chosen index is more of
representative to the important home possessions which reflect the socio‐economic status of
students’ family and easy to interpret.
bs4gth08 0.1231 0.4413 bs4gth07 0.4216 0.1087 bs4gth06 -0.1537 0.5990 bs4gth05 0.6091 -0.1165 bs4gth04 0.1270 0.3659 bs4gth03 0.2914 0.2188 bs4gth02 0.5554 -0.0377 bs4gth01 -0.0541 0.4878 Variable Comp1 Comp2
sum of squares(column-loading) = 1Scoring coefficients for orthogonal varimax rotation


