Embed Size (px)
Citation preview
MANUSCRIP
T
ACCEPTED
ACCEPTED MANUSCRIPT
School Engagement, Information Technology Use, and Educational Development: An Empirical Investigation of Adolescents
Hamed Qahri-Saremi1* ([email protected]), Ofir Turel2 ([email protected])
1 University of Illinois at Springfield, One University Plaza, MS UHB 4021, Springfield, IL 62703-5407. 2 California State University Fullerton, 800 N. State College Blvd., SGMH-4160, Fullerton, California 92834 * Corresponding Author.

MANUSCRIP
T
ACCEPTED
ACCEPTED MANUSCRIPT
1
School Engagement, Information Technology Use, and Educational Development: An Empirical Investigation of
Adolescents
Abstract
This study focuses on three objectives. First, it investigates distinctive profiles of
adolescents based on combinations of their levels of behavioral, cognitive, and emotional
engagement with school. Second, it examines whether adolescents’ educational
development outcomes (GPA) and extent of use of utilitarian (school-oriented) and
hedonic (social media and videogames) information technologies (IT) vary as a function
of their school engagement profiles. Third, it probes the mediation effects of adolescents’
extent of use of utilitarian and hedonic IT on the relation between the different school
engagement dimensions and educational development outcomes. The sample (n = 6885)
was drawn from a large nationally representative dataset that is part of a series of annual
surveys of American adolescents. Latent profile analysis identified five distinctive
profiles of adolescents based on the combinations of their levels of three school
engagement dimensions. The results of ANCOVA analyses indicated that these profiles
differ in the use of utilitarian and hedonic IT as well as GPAs. Moreover, results of
structural equation modeling showed that while the extent of use of hedonic IT partially
mediated the effect of school engagement dimensions on GPA, the extent of use of
utilitarian IT did not. Considering the importance of adolescents’ school engagement for
their development and the essential role of IT in adolescents’ lives, our findings make
important contributions to the literature and shed light on promising avenues for future
research.

MANUSCRIP
T
ACCEPTED
ACCEPTED MANUSCRIPT
2
Keywords
Secondary education; Media in education; Improving classroom teaching; Utilitarian
Information Technologies; Hedonic Information Technologies

MANUSCRIP
T
ACCEPTED
ACCEPTED MANUSCRIPT
3
1. Introduction
School engagement is an important antecedent of students’ psychological and
educational development (Fredricks, Blumenfeld, & Paris, 2004). Several prototypical
types of school engagement profiles may exist, including Highly Engaged, Moderately
Engaged, Minimally Engaged, Emotionally Disengaged, and Cognitively Disengaged,
each of which can drive different behaviors, psychological states, and educational
development outcomes (M.-T. Wang & Peck, 2013). Nonetheless, the mediating
mechanisms through which different engagement profiles result in different educational
development outcomes are still largely unknown. It is important to focus on such
mechanisms, because interventions targeting them may improve the relationship between
school engagement dimensions and educational development outcomes.
One arguably important set of such mediating mechanisms includes the use of
information technologies (IT), both for school (i.e., utilitarian) and pleasure (i.e.,
hedonic) purposes. IT has become an increasingly important part of life in modern
societies, especially among adolescents, who are commonly referred to as “digital
natives” (e.g., Thompson, 2013). Discussing IT use as a mediating mechanism is
particularly important because IT can dualistically facilitate both adolescents’
engagement with school work (e.g., asking for help with homework, searching for
relevant information, Ensor, 2012; Jacobs, 2012), and their disengagement from school
(e.g., through playing non-educational videogames or using social media for socialization
and fun, Christakis, Ebee, Rivara, & Zimmerman, 2004; Ong, et al., 2011). In essence, IT
is a double-edged sword; it is a readily available means for engaging with the school
work (e.g., Gross, 2004; Jackson, et al., 2006; Madell & Muncer, 2004; Willoughby,

MANUSCRIP
T
ACCEPTED
ACCEPTED MANUSCRIPT
4
2008), but also for escaping and disengaging from school (e.g., Junco, 2012a; Karpinski,
Kirschner, Ozer, Mellott, & Ochwo, 2013; Kirschner & Karpinski, 2010; Shah,
Subramanian, Rouis, & Limayem, 2012; Van Rooij, Schoenmakers, Vermulst, Van Den
Eijnden, & Van De Mheen, 2011). For example, some studies have raised concerns
regarding the negative effects of hedonic and excessive patterns of IT use, such as the
problematic use of videogames and/or social media, on adolescents’ performance at
school (e.g., Junco, 2012a; Karpinski, et al., 2013; Kirschner & Karpinski, 2010; Shah, et
al., 2012; Van Rooij, et al., 2011). In contrast, other studies have argued that IT can help
adolescents; they use IT predominantly for accessing information, mostly for educational
purposes, which can have positive impacts on adolescents’ educational development
(e.g., Gross, 2004; Jackson, et al., 2006; Madell & Muncer, 2004; Willoughby, 2008).
Considering this wide spectrum of potential impacts of different patterns of IT use on
adolescents’ educational development, it is important to better comprehend (a) how the
patterns of IT use vary among adolescents as a function of their school engagement, and
(b) how these patterns can affect adolescents’ educational development outcomes. This
study makes one of the first strides towards addressing these gaps; it examines how IT
use patterns can help translating common school engagement profiles into educational
outcomes.
1.1. School Engagement
School engagement refers to “energized, directed, and continued action, or the
discernible qualities of students’ interactions with learning activities or environments”
(M.-T. Wang & Peck, 2013, p. 1266). It is a trichotomy of behavioral, cognitive, and
emotional engagement dimensions (e.g., Fredricks, et al., 2004; M.-T. Wang & Peck,

MANUSCRIP
T
ACCEPTED
ACCEPTED MANUSCRIPT
5
2013; Watton, 2014). Behavioral engagement with school refers to the notion of
participation in learning activities and physical presence in class and school (Fredricks, et
al., 2004; M.-T. Wang & Peck, 2013). Cognitive engagement with school captures
preference for hard work, investment in and use of self-regulated approaches to learning,
as well as being strategic in planning, monitoring, and evaluating short-term and long-
term learning outcomes (Fredricks, et al., 2004; Zimmerman, 1989). Emotional
engagement with school encompasses affective reactions to the school environment and
to the school activities (e.g., Fredricks, et al., 2004; Skinner & Belmont, 1993; Voelkl,
1997). The multidimensional conceptualization of school engagement provides a rich
lens for understanding how students act, feel, and think toward the school, which can
directly and indirectly affect their educational development outcomes (Fredricks, et al.,
2004; M.-T. Wang & Peck, 2013).
Students who demonstrate high behavioral engagement with school are more likely to
absorb the delivered content, feel they belong, participate in the class, and ultimately
succeed academically. In contrast, students who adapt disengaging behaviors, such as
truancy, are at a greater risk for educational failure (Appleton, Christenson, Kim, &
Reschly, 2006; Simons-Morton & Chen, 2009; M.-T. Wang, 2009; M. T. Wang, Selman,
Dishion, & Stormshak, 2010). Similarly, cognitive engagement with school is positively
associated with educational development; students who are willing to exert the necessary
cognitive effort toward studying and learning and develop and use self-regulated
strategies for learning, manage to better comprehend and master complex concepts
(Miller & Byrnes, 2001; Zimmerman, 1989). Finally, high emotional engagement with
school (i.e., having positive feelings and attitude toward the school and enjoying being at

MANUSCRIP
T
ACCEPTED
ACCEPTED MANUSCRIPT
6
school) can foster educational development (Fredricks, et al., 2004; M.-T. Wang & Peck,
2013). In contrast, low emotional engagement with school can lead to a number of
developmental problems, such as substance abuse and depression (e.g., Hawkins, Guo,
Hill, Battin-Pearson, & Abbott, 2001; Li & Lerner, 2011; Maddox & Prinz, 2003; M.-T.
Wang & Peck, 2013).
Despite the importance of viewing school engagement as a multidimensional
phenomenon, most studies thus far have either focused on a sole dimension of school
engagement, usually behavioral engagement, or combined various dimensions of school
engagement into a single composite factor (Marks, 2000). Both of these approaches
impede the examination of distinctive and simultaneous effects on dimensions of
engagement on developmental outcomes (Jimerson, Campos, & Greif, 2003; M.-T.
Wang & Peck, 2013). Accordingly, a recent study has shown that the three dimensions of
school engagement can configure differently in adolescents, creating distinct profiles of
individuals, who significantly vary in their educational and psychological functioning
(M.-T. Wang & Peck, 2013). Following this path, we first attempt to investigate the
following question:
Research Question 1: Are there meaningful distinctive clusters of adolescents based
on the configurations of different levels of their behavioral, cognitive, and emotional
engagement with school?
1.2. Adolescents’ Use of IT
IT may be broadly classified into two types: productivity-oriented or “utilitarian”
systems and pleasure-oriented or “hedonic” systems (Massey, Khatri, & Montoya-Weiss,
2007; Van der Heijden, 2004; Wu & Lu, 2013). While the prime objective of utilitarian

MANUSCRIP
T
ACCEPTED
ACCEPTED MANUSCRIPT
7
IT is to improve users’ productivity in school/job related tasks, the principal objective of
a hedonic IT is to create pleasurable and entertaining experiences for users (Massey, et
al., 2007; Van der Heijden, 2004). Using self-determination theory (Ryan & Deci, 2000)
terminology, utilitarian IT (e.g., Microsoft Excel) are aimed at primarily generating
extrinsic rewards, whereas hedonic IT (e.g., videogames, social media) are aimed at
yielding intrinsic rewards. Hence, utilitarian IT serves a specific goal external to the
interaction between the user and the system, such as doing school work (Massey, et al.,
2007). In contrast, interacting with hedonic IT is typically an end in itself.
Extrapolating these notions to the context of this study, we can categorize adolescents’
use of IT into two types: (1) use of IT for utilitarian purposes, which represents the use of
IT, such as word processors or online learning systems, in support of school work
(hereafter, use of utilitarian IT); and (2) use of IT for hedonic purposes, which refers to
the use of IT for pleasure, socialization, and entertainment purposes (hereafter, use of
hedonic IT). It is noteworthy that the boundaries between utilitarian and hedonic IT may
not always be as palpable as their names suggest (Sun & Zhang, 2006; Wu & Lu, 2013)
because hedonic IT can still occasionally provide utilitarian value and utilitarian IT can
elicit intrinsic rewards. Nonetheless, we follow the logic that “a system is classified as
utilitarian if it is used in a work or education environment to improve job or school
performance more than 80 percent of the time, or as hedonic if it is employed in the home
for fun and relaxation more than 80 percent of the time” (Wu & Lu, 2013, p. 155).
Studies on the impacts of use of IT on students’ educational development have
implicitly associated the use of utilitarian IT with positive impacts and the use of hedonic
IT with negative impacts (e.g., Jackson, et al., 2006; Junco, 2012b, 2012c; Willoughby,

MANUSCRIP
T
ACCEPTED
ACCEPTED MANUSCRIPT
8
2008). Nonetheless, how these IT use choices may be influenced by one's school
engagement is largely unknown. While we know that different school engagement
profiles may lead to different levels of educational functioning (M.-T. Wang & Peck,
2013), our search revealed no study that examined the relationships between adolescents’
engagement with school and their patterns of use of utilitarian and hedonic IT. Hence, we
address this issue by examining how the extent of use of utilitarian and hedonic IT as
well as educational development outcomes vary between adolescents with different
school engagement profiles.
Research Question 2: How are distinctive clusters of adolescents, based on
combinations of their different levels of behavioral, cognitive, and emotional engagement
with school, associated with adolescents’ extent of use of utilitarian and hedonic IT as
well as their educational development outcomes (GPA)?
1.3. Mediation Effect of Adolescents’ Use of IT on their Educational Development
Behavioral, cognitive, and emotional engagement dimensions can drive students'
educational development (e.g., Fredricks, et al., 2004; Li & Lerner, 2011; M.-T. Wang &
Peck, 2013). Moreover, it is also expected that different school engagement profiles
determine, in part, the extent of use of utilitarian and hedonic IT employed by students.
Furthermore, research has generally indicated positive impacts of the use of utilitarian IT
and negative impacts of the use of hedonic IT on students’ educational development
outcomes (e.g., Jackson, et al., 2006; Junco, 2012b, 2012c; Kirschner & Karpinski, 2010;
Paul, Baker, & Cochran, 2012; Willoughby, 2008). On this basis, we can expect that
adolescents’ use of utilitarian and hedonic IT partially mediates the effects of
adolescents’ behavioral, cognitive, and emotional engagement with schools on their
MANUSCRIP
T
ACCEPTED
ACCEPTED MANUSCRIPT
9
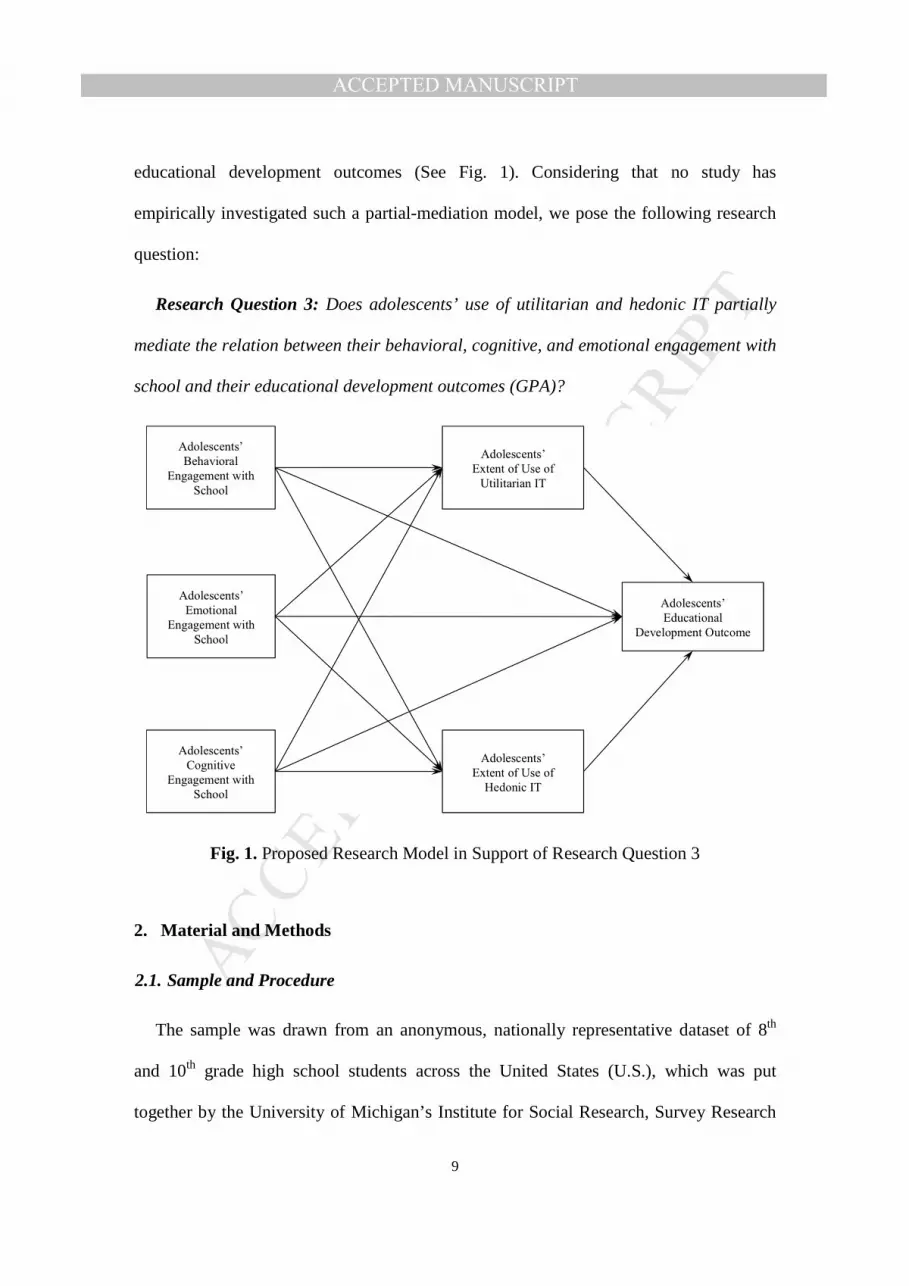
educational development outcomes (See Fig. 1). Considering that no study has
empirically investigated such a partial-mediation model, we pose the following research
question:
Research Question 3: Does adolescents’ use of utilitarian and hedonic IT partially
mediate the relation between their behavioral, cognitive, and emotional engagement with
school and their educational development outcomes (GPA)?
Fig. 1. Proposed Research Model in Support of Research Question 3
2. Material and Methods
2.1. Sample and Procedure
The sample was drawn from an anonymous, nationally representative dataset of 8th
and 10th grade high school students across the United States (U.S.), which was put
together by the University of Michigan’s Institute for Social Research, Survey Research

MANUSCRIP
T
ACCEPTED
ACCEPTED MANUSCRIPT
10
Center in 2013 (Johnston, Bachman, O'Malley, & Schulenberg, 2013). This dataset is part
of a series of annual surveys that explore changes in important values, behaviors, and
lifestyle orientations of American adolescents. After removing the missing values for the
key variables in this study, a clean sample of 6885 ethnically diverse (10% Black, 56%
White, 17% Hispanic, and 18% others) adolescents (52.6% female; 47.4% male) from
across the U.S. (17% Northeast Region, 24% North Central Region, 35% South Region,
and 25% West Region) was obtained and used for investigating the three research
questions.
2.2. Measures
We used conceptually established measures in the dataset (see appendix A for details).
Behavioral engagement with school was measured using the following questions: (1)
during the last four weeks, how many whole days of school have you missed because you
skipped or cut? (2) During the last four weeks, how often have you gone to school, but
skipped a class when you weren't supposed to? Cognitive engagement with school was
assessed by a principal component of: (1) the number of hours in an average week that
the student had spent on his/her school work, and (2) the student’s educational aspiration
(Fredricks, et al., 2004; M.-T. Wang & Peck, 2013), which was measured as a principal
component of: (1) the student’s self-reported likelihood of going to college after high
school, and (2) the student’s self-reported likelihood of graduation from college in the
future. Emotional engagement with school was measured using the principal component
of: (1) during the last year at school, how often did you enjoy being at school? And the
reverse-coded values of (2) during the last year at school, how often did you hate being at
school? Extent of use of utilitarian (school-oriented) IT was assessed with a single

MANUSCRIP
T
ACCEPTED
ACCEPTED MANUSCRIPT
11
question: "About how many hours a week do you spend using a computer to do school
work?” Extent of use of hedonic (pleasure-oriented) IT was assessed based on the self-
reported number of hours a week each participant had spent playing videogames and/or
visiting social media websites. The educational development outcome was captured by
adolescents’ self-reported GPAs. Socio-demographic characteristics of adolescents,
namely gender, ethnicity, and high school region in the U.S. were also extracted from the
dataset for descriptive and control purposes. Considering the restricted age range in the
sample (i.e., 8th and 10th grade students), age was not included as a control factor.
2.3. Data Analysis
Each research question was tested with a different technique as deemed appropriate.
We examined the first research question using Latent Profile Analysis (LPA) (Melas,
Zampetakis, Dimopoulou, & Moustakis, 2014), using the “mclust” package version 5.0.2
in R version 3.2.2 (Fraley, Raftery, Murphy, & Scrucca, 2012). LPA was employed
iteratively with different numbers of possible latent clusters (1 to 9, which is the
maximum number of clusters that converged) to identify distinct latent clusters of
adolescents based on the three dimensions of school engagement. LPA model fit was
compared across different number of clusters using the Bayesian Information Criterion
(BIC) (Fraley, et al., 2012) in order to find the optimal number of clusters. Larger values
of BIC indicated better fit to the data (Fraley, et al., 2012). Obtained solutions were
examined for interpretability. The second research question was examined using analysis
of covariance (ANCOVA) in SPSS version 23. The third research question was addressed
using structural equation modeling (SEM) analysis for estimating the model in Fig. 1,
using AMOS version 23 (More details are provided in Appendix B).

MANUSCRIP
T
ACCEPTED
ACCEPTED MANUSCRIPT
12
3. Results
Descriptive statistics and correlations for key variables are provided in Table 1.
3.1. Investigating Research Question 1: LPA Results
Results of the LPA (BIC values for different number of clusters) revealed that a five-
cluster solution was the best fit for the data. Mean differences were evident across the
five clusters on behavioral engagement (F(4, 6880) = 37825.81, p < 0.001), cognitive
engagement (F(4, 6880) = 959.36, p < 0.001), and emotional engagement (F(4, 6880) = 216.49,
p < 0.001). The interpretation of these five clusters was mainly consistent with (M.-T.
Wang & Peck, 2013)’s findings.
As depicted in Fig. 2, relatively low levels of behavioral, cognitive, and emotional
Table 1 Descriptive Statistics and Correlations
Variable Mean (SD)
Skew (Kurt)
1 2 3 4 5 6 7
1 Behavioral Engagement
3.65 (0.82)
-2.27 (3.87)
1.00
2 Cognitive Engagement
0.00 (1.00)
-0.3 (1.09)
.20*** 1.00
3 Emotional Engagement
0.00 (1.00)
-0.29 (-0.33)
.21*** .24*** 1.00
4 GPA 6.41 (2.15)
-0.65 (-0.42)
.27*** .42*** .29*** 1.00
5 Extent of Use of Utilitarian IT
3.15 (1.52)
1.02 (1.91)
.04** .36*** .08*** .15*** 1.00
6 Extent of Social Media Use
3.99 (2.40)
0.7 (-0.47)
-.14*** -.02 -.13*** -.14*** .07*** 1.00
7 Extent of Use of Videogames
4.47 (2.28)
0.5 (-0.56)
-.05*** -.08*** -.12*** -.11*** .03** .31*** 1.00
SD: Standard Deviation; Skew: Skewness; Kurt: Kurtosis. * < .05; ** < .01; *** < .001.
MANUSCRIP
T
ACCEPTED
ACCEPTED MANUSCRIPT
13
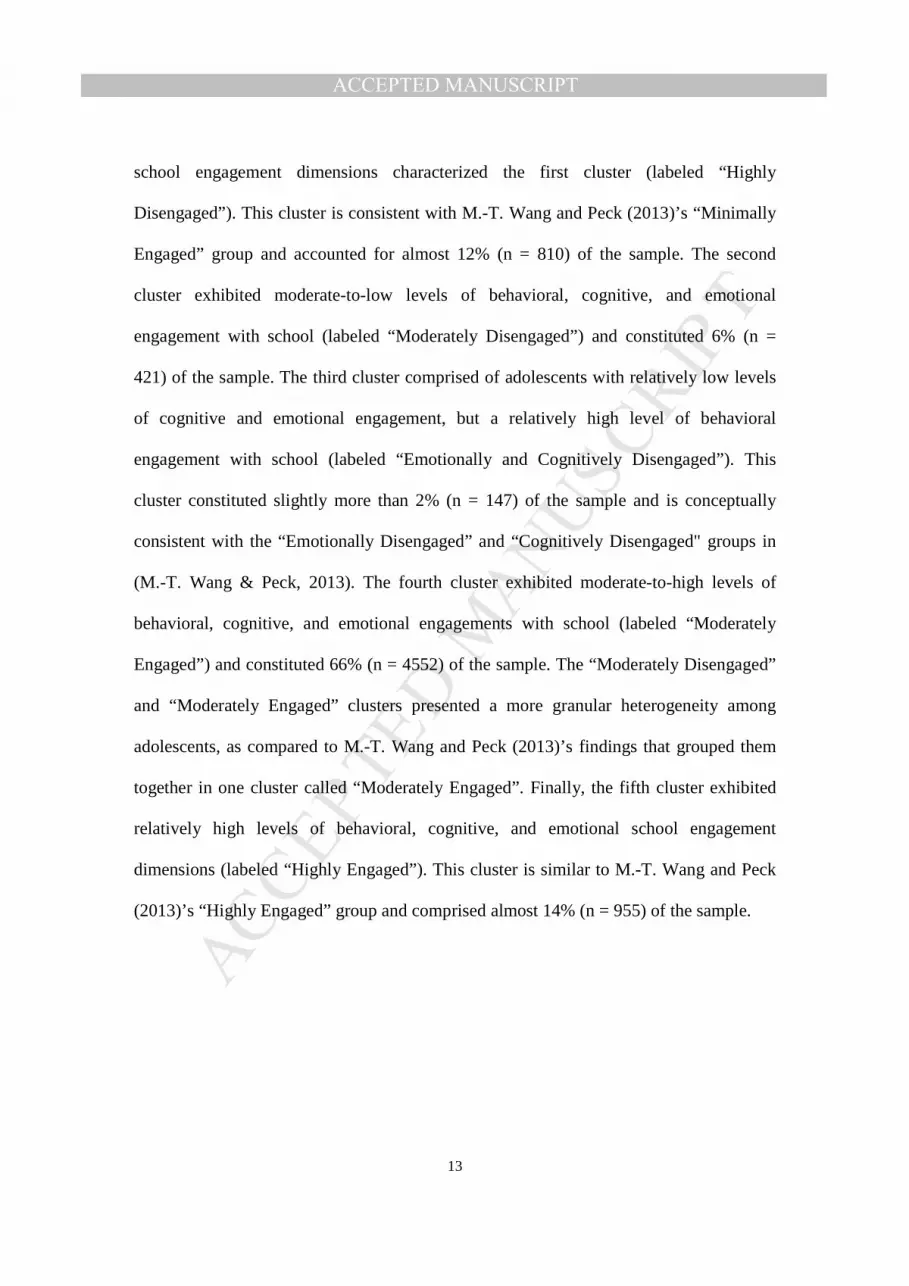
school engagement dimensions characterized the first cluster (labeled “Highly
Disengaged”). This cluster is consistent with M.-T. Wang and Peck (2013)’s “Minimally
Engaged” group and accounted for almost 12% (n = 810) of the sample. The second
cluster exhibited moderate-to-low levels of behavioral, cognitive, and emotional
engagement with school (labeled “Moderately Disengaged”) and constituted 6% (n =
421) of the sample. The third cluster comprised of adolescents with relatively low levels
of cognitive and emotional engagement, but a relatively high level of behavioral
engagement with school (labeled “Emotionally and Cognitively Disengaged”). This
cluster constituted slightly more than 2% (n = 147) of the sample and is conceptually
consistent with the “Emotionally Disengaged” and “Cognitively Disengaged" groups in
(M.-T. Wang & Peck, 2013). The fourth cluster exhibited moderate-to-high levels of
behavioral, cognitive, and emotional engagements with school (labeled “Moderately
Engaged”) and constituted 66% (n = 4552) of the sample. The “Moderately Disengaged”
and “Moderately Engaged” clusters presented a more granular heterogeneity among
adolescents, as compared to M.-T. Wang and Peck (2013)’s findings that grouped them
together in one cluster called “Moderately Engaged”. Finally, the fifth cluster exhibited
relatively high levels of behavioral, cognitive, and emotional school engagement
dimensions (labeled “Highly Engaged”). This cluster is similar to M.-T. Wang and Peck
(2013)’s “Highly Engaged” group and comprised almost 14% (n = 955) of the sample.

MANUSCRIP
T
ACCEPTED
ACCEPTED MANUSCRIPT
14
Fig. 2. Clusters of adolescents in 8th and 10th grades, based on their standardized scores of
behavioral, cognitive, and emotional school engagement dimensions.
3.2. Investigating Research Question 2: ANCOVA Results
Results of ANCOVA tests suggested that the five aforementioned clusters are
associated with students’ extent of use of utilitarian and hedonic IT, as well as their
GPAs. Fig. 3 shows the mean and the standard error for each of the five clusters. Tables 2
to 6 outline the ANCOVA results in form of pairwise comparisons between the five
clusters.
-3
-2.5
-2
-1.5
-1
-0.5
0
0.5
1
1.5
HighlyDisengaged (1)
ModeratelyDisengaged (2)
Emotionally &Cognitively
Disengaged (3)
ModeratelyEngaged (4)
Highly Engaged(5)
Behavioral Engagament (Mean) Cognitive Engagement (Mean)
Emotional Engagement (Mean)

MANUSCRIP
T
ACCEPTED
ACCEPTED MANUSCRIPT
15
Fig. 3. Means and standard errors of adolescents’ extent of use of utilitarian and hedonic
IT as well as their GPAs based on their school engagement cluster.
GPA. The pairwise comparisons identified significant differences among clusters.
Specifically, as depicted in Fig. 3 and Table 2, the Highly Engaged cluster of adolescents
had significantly higher self-reported GPA than the other clusters had, followed by the
Moderately Engaged, Moderately Disengaged, Highly Disengaged, and Emotionally &
Cognitively Disengaged clusters, in a descending order.
Table 2 ANCOVA results of adolescents’ educational development outcome (GPA) in different school engagement clusters, after controlling for gender, ethnicity, and school region
Cluster (I) Cluster (J) Mean
Difference (I-J)
Std. Error
Sig.
95% Confidence Interval
Lower Bound
Upper Bound
-1.2
-1
-0.8
-0.6
-0.4
-0.2
0
0.2
0.4
0.6
0.8
GPA Extent ofUtilitarian Use of
IT
Extent of Use ofVideogames
Extent of SocialMedia Use
Extent of Use ofHedonic IT
(PCA)Highly Disengaged (1) Moderately Disengaged (2)
Emotionally & Cognitively Disengaged (3) Moderately Engaged (4)
Highly Engaged (5)

MANUSCRIP
T
ACCEPTED
ACCEPTED MANUSCRIPT
16
Table 2 ANCOVA results of adolescents’ educational development outcome (GPA) in different school engagement clusters, after controlling for gender, ethnicity, and school region
Cluster (I) Cluster (J) Mean
Difference (I-J)
Std. Error
Sig.
95% Confidence Interval
Lower Bound
Upper Bound
1 2 -0.24 0.06 0.00 -0.35 -0.13 1 3 0.31 0.08 0.00 0.15 0.47 1 4 -0.73 0.04 0.00 -0.80 -0.67 1 5 -1.07 0.04 0.00 -1.16 -0.98
2 1 0.24 0.06 0.00 0.13 0.35 2 3 0.55 0.09 0.00 0.38 0.73 2 4 -0.49 0.05 0.00 -0.59 -0.40 2 5 -0.83 0.05 0.00 -0.94 -0.72
3 1 -0.31 0.08 0.00 -0.47 -0.15 3 2 -0.55 0.09 0.00 -0.73 -0.38 3 4 -1.04 0.08 0.00 -1.20 -0.89 3 5 -1.38 0.08 0.00 -1.54 -1.22
4 1 0.73 0.04 0.00 0.67 0.80 4 2 0.49 0.05 0.00 0.40 0.59 4 3 1.04 0.08 0.00 0.89 1.20 4 5 -0.34 0.03 0.00 -0.40 -0.27
5 1 1.07 0.04 0.00 0.98 1.16 5 2 0.83 0.05 0.00 0.72 0.94 5 3 1.38 0.08 0.00 1.22 1.54 5 4 0.34 0.03 0.00 0.27 0.40
Extent of Use of Utilitarian IT. As depicted in Fig. 3 and Table 3, adolescents in the
Highly Disengaged, Moderately Engaged, and Moderately Disengaged clusters had fairly
similar extent of use of utilitarian IT. Nonetheless, their extent of use of utilitarian IT was
significantly lower than that of students in the Highly Engaged, and significantly higher
than that of students in the Emotionally and Cognitively Disengaged clusters. In other
words, adolescents in the Highly Engaged cluster spent more time using utilitarian IT in
support of their school work, while their counterparts in the Emotionally and Cognitively

MANUSCRIP
T
ACCEPTED
ACCEPTED MANUSCRIPT
17
Disengaged cluster spent the least amount of time using utilitarian IT. The extent of use
of utilitarian IT was similar in the Highly Disengaged, Moderately Engaged, and
Moderately Disengaged clusters.
Table 3 ANCOVA results of adolescents’ extent of use of utilitarian IT in different school engagement clusters, after controlling for gender, ethnicity, and school region
Cluster (I) Cluster (J) Mean
Difference (I-J)
Std. Error
Sig.
95% Confidence Interval
Lower Bound
Upper Bound
1 2 0.03 0.06 0.65 -0.09 0.14 1 3 0.31 0.09 0.00 0.14 0.48 1 4 0.00 0.04 0.93 -0.07 0.08 1 5 -0.70 0.05 0.00 -0.79 -0.61
2 1 -0.03 0.06 0.65 -0.14 0.09 2 3 0.29 0.09 0.00 0.10 0.47 2 4 -0.02 0.05 0.64 -0.12 0.07 2 5 -0.72 0.06 0.00 -0.83 -0.61
3 1 -0.31 0.09 0.00 -0.48 -0.14 3 2 -0.29 0.09 0.00 -0.47 -0.10 3 4 -0.31 0.08 0.00 -0.47 -0.15 3 5 -1.01 0.09 0.00 -1.18 -0.84
4 1 0.00 0.04 0.93 -0.08 0.07 4 2 0.02 0.05 0.64 -0.07 0.12 4 3 0.31 0.08 0.00 0.15 0.47 4 5 -0.70 0.04 0.00 -0.77 -0.63
5 1 0.70 0.05 0.00 0.61 0.79 5 2 0.72 0.06 0.00 0.61 0.83 5 3 1.01 0.09 0.00 0.84 1.18 5 4 0.70 0.04 0.00 0.63 0.77
Extent of Use of Hedonic IT. We considered three operationalization of this
construct: (1) extent of use of social media, (2) extent of use of videogames, and (3) the
composite (i.e., principal component) score of the extent of use of social media and
videogames (labeled “extent of use of hedonic IT”).

MANUSCRIP
T
ACCEPTED
ACCEPTED MANUSCRIPT
18
As demonstrated in Fig. 3 and Table 4, adolescents in the Highly Disengaged and
Moderately Disengaged clusters had quite similar levels of use of social media. Likewise,
adolescents in the Moderately Engaged and Emotionally and Cognitively Disengaged
clusters had relatively similar levels of use of social media, although their levels of use
were significantly lower than those of the students in the Highly Disengaged and
Moderately Disengaged clusters. Lastly, adolescents in the Highly Engaged cluster spent
significantly less time on social media as compared to adolescents in the other four
clusters.
Table 4 ANCOVA results of adolescents’ extent of social media use in different school engagement clusters, after controlling for gender, ethnicity, and school region
Cluster (I) Cluster (J) Mean
Difference (I-J)
Std. Error
Sig.
95% Confidence Interval
Lower Bound
Upper Bound
1 2 0.00 0.06 0.95 -0.12 0.11 1 3 0.28 0.09 0.00 0.11 0.45 1 4 0.37 0.04 0.00 0.30 0.44 1 5 0.45 0.05 0.00 0.36 0.54
2 1 0.00 0.06 0.95 -0.11 0.12 2 3 0.28 0.09 0.00 0.10 0.47 2 4 0.37 0.05 0.00 0.27 0.47 2 5 0.46 0.06 0.00 0.34 0.57
3 1 -0.28 0.09 0.00 -0.45 -0.11 3 2 -0.28 0.09 0.00 -0.47 -0.10 3 4 0.09 0.08 0.27 -0.07 0.25 3 5 0.17 0.09 0.05 0.00 0.34
4 1 -0.37 0.04 0.00 -0.44 -0.30 4 2 -0.37 0.05 0.00 -0.47 -0.27 4 3 -0.09 0.08 0.27 -0.25 0.07 4 5 0.08 0.04 0.02 0.02 0.15
5 1 -0.45 0.05 0.00 -0.54 -0.36 5 2 -0.46 0.06 0.00 -0.57 -0.34 5 3 -0.17 0.09 0.05 -0.34 0.00 5 4 -0.08 0.04 0.02 -0.15 -0.02

MANUSCRIP
T
ACCEPTED
ACCEPTED MANUSCRIPT
19
Fig. 3 and Table 5 show that adolescents in the Moderately Disengaged cluster spent
significantly more time playing videogames as compared to adolescents in other clusters.
The extent of use of videogames in the remaining clusters in a descending order was as
follows: Emotionally & Cognitively Disengaged, Highly Disengaged, Moderately
Engaged, and Highly Engaged. Almost all differences in cluster means were statistically
significant; the only exception was the Emotionally & Cognitively Disengaged cluster,
the mean of which was only significantly different from the mean of the Highly Engaged
cluster1.
Table 5 ANCOVA results of adolescents’ extent of use of videogames in different school engagement clusters, after controlling for gender, ethnicity, and school region
Cluster (I)
Cluster (J)
Mean Difference
(I-J)
Std. Error
Sig.
95% Confidence Interval
Lower Bound
Upper Bound
1 2 -0.16 0.06 0.01 -0.27 -0.04 1 3 -0.01 0.09 0.89 -0.19 0.16 1 4 0.09 0.04 0.02 0.01 0.16 1 5 0.26 0.05 0.00 0.17 0.36 2 1 0.16 0.06 0.01 0.04 0.27 2 3 0.14 0.10 0.13 -0.04 0.33 2 4 0.24 0.05 0.00 0.14 0.34 2 5 0.42 0.06 0.00 0.31 0.53 3 1 0.01 0.09 0.89 -0.16 0.19 3 2 -0.14 0.10 0.13 -0.33 0.04 3 4 0.10 0.08 0.24 -0.07 0.26 3 5 0.28 0.09 0.00 0.10 0.45 4 1 -0.09 0.04 0.02 -0.16 -0.01 4 2 -0.24 0.05 0.00 -0.34 -0.14 4 3 -0.10 0.08 0.24 -0.26 0.07
1 This can be attributed to the larger standard error in the Emotionally & Cognitively Disengaged cluster, which can be an artifact of its smaller cluster size.

MANUSCRIP
T
ACCEPTED
ACCEPTED MANUSCRIPT
20
Table 5 ANCOVA results of adolescents’ extent of use of videogames in different school engagement clusters, after controlling for gender, ethnicity, and school region
Cluster (I)
Cluster (J)
Mean Difference
(I-J)
Std. Error
Sig.
95% Confidence Interval
Lower Bound
Upper Bound
4 5 0.18 0.04 0.00 0.11 0.25 5 1 -0.26 0.05 0.00 -0.36 -0.17 5 2 -0.42 0.06 0.00 -0.53 -0.31 5 3 -0.28 0.09 0.00 -0.45 -0.10 5 4 -0.18 0.04 0.00 -0.25 -0.11
As shown in Fig. 3 and Table 6, adolescents in the Highly Disengaged and Moderately
Disengaged clusters had fairly similar extent of use of hedonic IT. Furthermore, there
was no statistically significant difference in terms of the extent of use of hedonic IT
among adolescents in the Moderately Engaged and Emotionally and Cognitively
Disengaged clusters. Nonetheless, adolescents in the Highly Disengaged and Moderately
Disengaged clusters showed significantly larger extent of use of hedonic IT than did
adolescents in the Moderately Engaged and Emotionally and Cognitively Disengaged
clusters. Adolescents in the Highly Engaged cluster spent the shortest time with hedonic
IT.
Table 6 ANCOVA results of adolescents’ extent of use of hedonic IT (principal components) in different school engagement clusters, after controlling for gender, ethnicity, and school region
Cluster (I) Cluster (J) Mean
Difference (I-J)
Std. Error
Sig.
95% Confidence Interval
Lower Bound
Upper Bound
1 2 -0.10 0.06 0.10 -0.22 0.02 1 3 0.16 0.09 0.07 -0.01 0.34 1 4 0.28 0.04 0.00 0.21 0.35

MANUSCRIP
T
ACCEPTED
ACCEPTED MANUSCRIPT
21
Table 6 ANCOVA results of adolescents’ extent of use of hedonic IT (principal components) in different school engagement clusters, after controlling for gender, ethnicity, and school region
Cluster (I) Cluster (J) Mean
Difference (I-J)
Std. Error
Sig.
95% Confidence Interval
Lower Bound
Upper Bound
1 5 0.44 0.05 0.00 0.35 0.53 2 1 0.10 0.06 0.10 -0.02 0.22 2 3 0.26 0.10 0.01 0.08 0.45 2 4 0.38 0.05 0.00 0.28 0.48 2 5 0.54 0.06 0.00 0.43 0.65 3 1 -0.16 0.09 0.07 -0.34 0.01 3 2 -0.26 0.10 0.01 -0.45 -0.08 3 4 0.12 0.08 0.16 -0.05 0.28 3 5 0.28 0.09 0.00 0.11 0.45 4 1 -0.28 0.04 0.00 -0.35 -0.21 4 2 -0.38 0.05 0.00 -0.48 -0.28 4 3 -0.12 0.08 0.16 -0.28 0.05 4 5 0.16 0.04 0.00 0.09 0.23 5 1 -0.44 0.05 0.00 -0.53 -0.35 5 2 -0.54 0.06 0.00 -0.65 -0.43 5 3 -0.28 0.09 0.00 -0.45 -0.11 5 4 -0.16 0.04 0.00 -0.23 -0.09
3.3. Testing Research Question 3: SEM Results
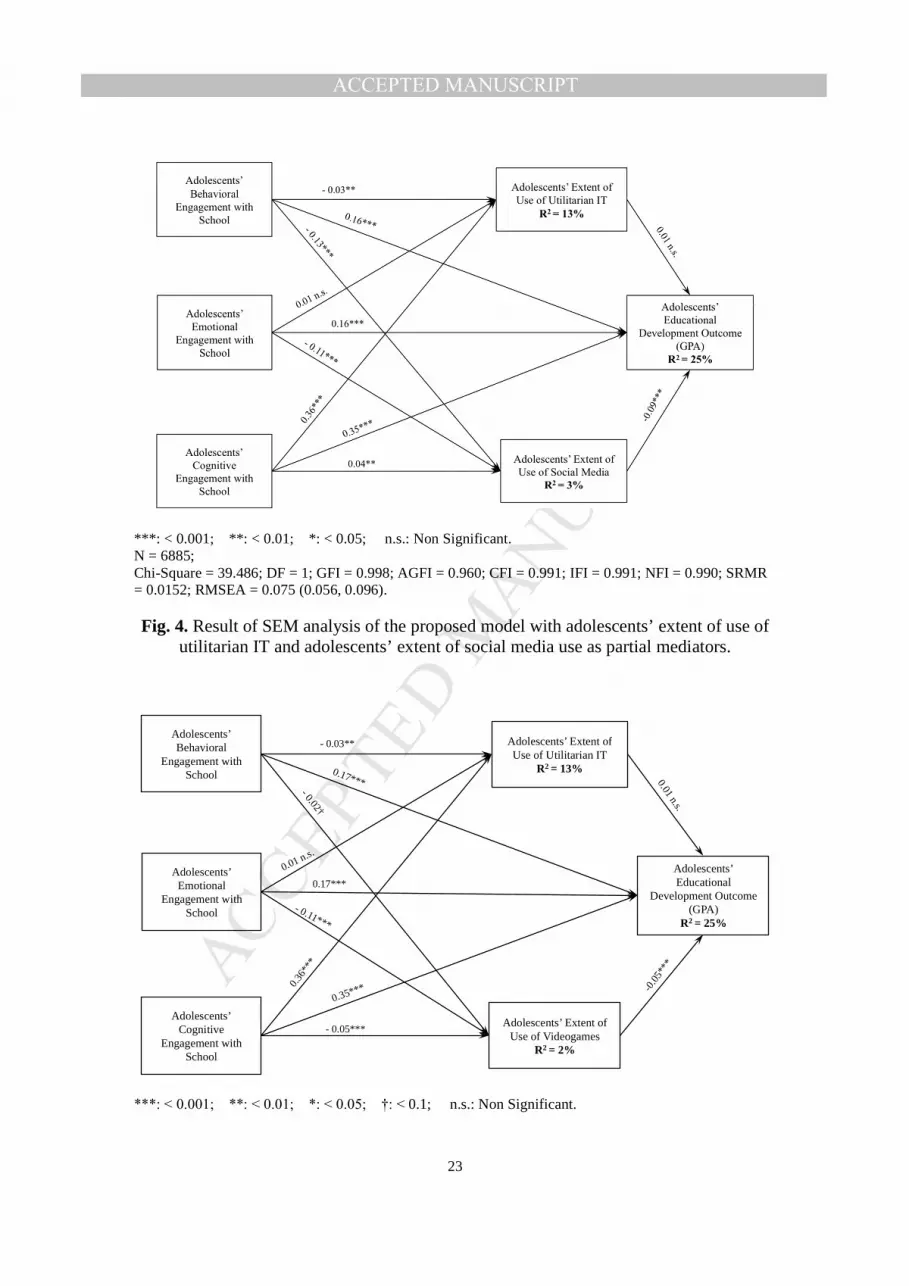
Fig. 4 to 6 depict the results of SEM analyses, each employing a different
operationalization of extent of use of hedonic IT: (1) social media, (2) videogames, and
(3) a composite score. The goodness of fit indices for the three models were within
acceptable thresholds (Hu & Bentler, 1999), which indicated acceptable fit of data to the
models.
The results were generally similar across the three models. All three models showed
that the extent of use of hedonic IT partially and negatively mediates the effects of the

MANUSCRIP
T
ACCEPTED
ACCEPTED MANUSCRIPT
22
three dimensions of school engagement on GPA. These results were consistent with prior
findings, which demonstrated that the extent of use of hedonic IT negatively affected
students’ GPAs (e.g., Junco, 2012b, 2012c; Karpinski, et al., 2013; Kirschner &
Karpinski, 2010; Paul, et al., 2012). In contrast to our expectation, the results showed that
the use of utilitarian IT in support of school work did not have a significant direct effect
on students’ GPA. It hence did not partially mediate the effects of adolescents’
engagement with school on their GPA.
The results also showed that behavioral engagement with school negatively affected
adolescents’ extent of use of both utilitarian and hedonic IT. Emotional engagement with
school negatively affected adolescents’ extent of use of hedonic IT, but had no significant
effect on the extent of use of utilitarian IT. Cognitive engagement with school positively
affected the extent of use of utilitarian IT, while its effect on the extent of use of hedonic
IT varied based on the type of hedonic IT. Specifically, cognitive engagement with
school positively affected the extent of social media use, but negatively affected the
extent of use of videogames. This relationship was not significant for the composite
score.
MANUSCRIP
T
ACCEPTED
ACCEPTED MANUSCRIPT
23
***: < 0.001; **: < 0.01; *: < 0.05; n.s.: Non Significant. N = 6885; Chi-Square = 39.486; DF = 1; GFI = 0.998; AGFI = 0.960; CFI = 0.991; IFI = 0.991; NFI = 0.990; SRMR = 0.0152; RMSEA = 0.075 (0.056, 0.096). Fig. 4. Result of SEM analysis of the proposed model with adolescents’ extent of use of
utilitarian IT and adolescents’ extent of social media use as partial mediators.
***: < 0.001; **: < 0.01; *: < 0.05; †: < 0.1; n.s.: Non Significant.
Adolescents’ Extent of Use of Utilitarian IT
R2 = 13%
Adolescents’ Educational
Development Outcome (GPA)
R2 = 25%
Adolescents’ Emotional
Engagement with School
Adolescents’ Extent of Use of Videogames
R2 = 2%
0.01 n.s.
-0.0
5** *
0.01 n.s.
0.17***
Adolescents’ Behavioral
Engagement with School
Adolescents’ Cognitive
Engagement with School
- 0.11* **
- 0.05***
0.35*** 0.36
***
- 0.02†
0.17***
- 0.03**

MANUSCRIP
T
ACCEPTED
ACCEPTED MANUSCRIPT
24
N = 6885; Chi-Square = 28.950; DF = 1; GFI = 0.999; AGFI = 0.971; CFI = 0.993; IFI = 0.993; NFI = 0.993; SRMR = 0.0131; RMSEA = 0.064 (0.045, 0.085). Fig. 5. Result of SEM analysis of the proposed model with adolescents’ extent of use of
utilitarian IT and adolescents’ extent of use of videogames as partial mediators.
***: < 0.001; **: < 0.01; *: < 0.05; n.s.: Non Significant. N = 6885; Chi-Square = 52.332; DF = 1; GFI = 0.997; AGFI = 0.947; CFI = 0.987; IFI = 0.987; NFI = 0.987; SRMR = 0.0175; RMSEA = 0.086 (0.067, 0.10). Fig. 6. Result of SEM analysis of the proposed model with adolescents’ extent of use of
utilitarian and hedonic IT as partial mediators.
3.4. Post-hoc Mediation Tests
In order to better examine the proposed partial mediation effects of IT use, post-hoc
mediation tests were performed with 500 re-samples (Preacher, Rucker, & Hayes, 2007).
The direct, indirect and total effects, as well as their levels of two-tailed significance are
given in Table 7, where each column represents a different operationalization of hedonic

MANUSCRIP
T
ACCEPTED
ACCEPTED MANUSCRIPT
25
IT use. In all cases, the total and direct effects of school engagement dimensions on GPA
were positive and significant. In almost all cases, the direct, indirect and total effects of
emotional and behavioral engagement on GPA were statistically significant (except for
the indirect effect of behavioral engagement, in the case of videogame use). In the case of
cognitive engagement, the indirect effects were not significant across the
operationalizations of use of hedonic IT. This implies that extent of use of IT (hedonic
and utilitarian) partially mediated the effects of emotional and behavioral engagement
dimensions on GPA. It did not mediate the effect of cognitive engagement on GPA.
Table 7 Direct, indirect and total effects (two-tailed significance in parentheses) for the relationship between school engagement dimensions and school performance
School Engagement Dimensions
Standardized Effects on GPA
IT Use: Utilitarian and Social Media
IT Use: Utilitarian and Videogames
IT Use: Utilitarian and Hedonic
Behavioral Engagement Direct Effect 0.158 (p < 0.003)
0.168 (p < 0.004)
0.161 (p < 0.004)
Indirect Effect 0.011 (p < 0.003)
0.001 (p < 0.166)
0.008 (p < 0.003)
Total Effect 0.169 (p < 0.003)
0.169 (p < 0.003)
0.169 (p < 0.003)
Cognitive Engagement Direct Effect 0.350 (p < 0.004)
0.347 (p < 0.004)
0.347 (p < 0.004)
Indirect Effect -0.001 (p < 0.833)
0.004 (p < 0.359)
0.003 (p < 0.411)
Total Effect 0.351 (p < 0.006)
0.350 (p < 0.006)
0.350 (p < 0.006)
Emotional Engagement Direct Effect 0.161 (p < 0.004)
0.165 (p < 0.004)
0.159 (p < 0.004)
Indirect Effect 0.010 (p < 0.04)
0.005 (p < 0.002)
0.011 (p < 0.004)
Total Effect 0.171 (p < 0.004)
0.171 (p < 0.004)
0.171 (p < 0.004)

MANUSCRIP
T
ACCEPTED
ACCEPTED MANUSCRIPT
26
4. Discussion and Conclusions
This study contributes to research in education and developmental psychology by
addressing three important research questions. The first research question focused on
school engagement as a multidimensional construct and inquired about the distinctive and
meaningful clusters of adolescents based on the combinations of different levels of
behavioral, cognitive, and emotional engagement with school. Our findings lent support
to the existence of distinctive profiles of adolescents, based on combinations of different
levels of behavioral, cognitive, and emotional engagement with school. Specifically, five
profiles of engagement with school were identified: Highly Disengaged, Moderately
Disengaged, Emotionally & Cognitively Disengaged, Moderately Engaged, and Highly
Engaged. These profiles differed in terms of their extent of utilitarian and hedonic IT use
as well as GPA. Consistent with M.-T. Wang and Peck (2013), our findings illustrate that
heterogeneity among adolescents in terms of engagement with school and its
consequences can be more meaningfully explained based on multidimensional school
engagement profiles, rather than through using a single composite school engagement
score (Jimerson, et al., 2003).
The clusters we identified were largely consistent with M.-T. Wang and Peck (2013)’s
findings. This study therefore adds to the thus far very limited body of works on
distinctive school engagement profiles. Future studies can examine the stability of the
clusters identified. Furthermore, using larger samples sizes can result a more nuanced
distinction of school engagement profiles. For example, our large sample size (n = 6885)
as compared to M.-T. Wang and Peck (2013)’s sample size (n = 1025) resulted in more
nuanced partitioning of the “Moderately Engaged” cluster into two clusters: “Moderately

MANUSCRIP
T
ACCEPTED
ACCEPTED MANUSCRIPT
27
Disengaged” and "Moderately Engaged”. Such differences in our findings as compared to
M.-T. Wang and Peck (2013)’s, as well as the possibility of having new, more nuanced
clusters that can better explain adolescents’ heterogeneity in terms of school engagement
dimensions are important avenues for future research.
Building on the first research question, our second research question investigated how
adolescents’ school engagement profiles are associated with their patterns of IT use, a
question that had been left unexplored in the prior studies. In general, our findings depict
a negative relation between school engagement and extent of use of hedonic IT
(videogames and social media) and a positive relation between school engagement and
extent of use of utilitarian IT. Adolescents who are more disengaged from school have
higher extent of use of social media and videogames, while they typically use utilitarian
IT less often. Specifically, students in the Highly Engaged cluster spent, on average, the
largest number of hours using school-oriented (utilitarian) IT, while they spent, on
average, fewer hours on using hedonic IT, as compared to adolescents in other clusters.
In contrast, it was found that adolescents in Cognitively & Emotionally Disengaged
cluster spent the least amount of time working with utilitarian IT. This finding is
important, considering that these adolescents’ academic failure can potentially be
overlooked by teachers, essentially because they are behaviorally engaged with school
(i.e., they are not causing disciplinary problems) (M.-T. Wang & Peck, 2013).
Furthermore, it is noteworthy that behavioral disengagement can result from emotional
and cognitive disengagement: “dropping out of school for many students is not an
instantaneous event; rather, it is a cumulative process within which the student becomes
emotionally and cognitively disengaged from school” (M.-T. Wang & Peck, 2013, p.

MANUSCRIP
T
ACCEPTED
ACCEPTED MANUSCRIPT
28
1272). Therefore, just focusing on behavioral engagement indicators (e.g., attending
school and classes) may not be adequate for capturing school engagement. Moreover, our
findings show that this cluster of students does not heavily use utilitarian IT, nor hedonic
IT, as compared to other clusters. Therefore, future research should shed light on how
this group of students spends time. Our findings suggest that early identification and
intervention, for example based on observing students' extent of use of educational
(utilitarian) and hedonic IT, can help devise more effective interventions to prevent
behavioral problems, such as school dropout. Future research should examine such
interventions.
Our results also showed that students in the Highly Disengaged and Moderately
Disengaged clusters spent, on average, significantly more time on hedonic IT, as
compared to other clusters. These groups are also among the ones with relatively lower
GPAs, as compared to other clusters. Therefore, we can argue that these findings,
consistent with the extension of escape theory (Kiraly, et al., 2015; Kwon, Chung, & Lee,
2011), show that the extent of use of hedonic IT, such as videogames and social media,
can help adolescents who are disengaged from school to escape from the stress of not
performing at school. This can point to a serious problem, because hedonic IT can further
isolate these adolescents from school and friends, which can exacerbate their school
engagement and performance problems (Hall-Lande, Eisenberg, Christenson, &
Neumark-Sztainer, 2007; Sanders, Field, Miguel, & Kaplan, 2000).
Consistent with this view, we contend that spending a significant amount of time per
week on using hedonic IT by adolescents, who are largely disengaged from school, may
reinforce and perhaps worsen their situation. This is an important avenue for future

MANUSCRIP
T
ACCEPTED
ACCEPTED MANUSCRIPT
29
research. Furthermore, future research can also investigate how educators can leverage
adolescents’ interest in hedonic IT, for instance, by developing educational systems that
include more hedonic features (e.g., “gamification” (Abrams & Walsh, 2014)). While this
study focused on the effects of school engagement profiles on the extent of use of
utilitarian and hedonic IT and GPA, future studies can focus on the antecedents of school
engagement profiles and leverage their findings to devise effective interventions for
improving adolescents’ engagement with school.
The results of analysis in response to the third research question shed light on the
mediating mechanisms through which different school engagement dimensions influence
the educational development outcome, a question that had remained a black box in the
extant literature. This study tried to partially open this black box by investigating the
mediation effects of adolescents’ extent of use of utilitarian and hedonic IT between the
three dimensions of school engagement and their GPA. The results of SEM analyses
showed that extent of use of hedonic IT negatively and partially mediate the effects of
two dimensions of school engagement, namely behavioral and emotional engagement, on
students' educational development outcome. This was not the case for the use of school-
oriented (utilitarian) systems.
The across-the-board negative partial mediation effects of extent of hedonic IT use on
GPA illuminate the importance of controlling the use of these systems among
adolescents. This is particularly important given the frenziedly increasing popularity of
hedonic IT, such as social media and videogames, among adolescents. A recent survey
(Lenhart, 2015) suggests that more than 70% of adolescents in the US use Facebook,
many of which also use other social media sites such as Instagram and Snapchat; and

MANUSCRIP
T
ACCEPTED
ACCEPTED MANUSCRIPT
30
73% of adolescents have access to videogames on their smartphones. Furthermore, recent
studies have pointed to the potentially addictive characteristics of hedonic IT, including
social media (e.g., Vernon, Barber, & Modecki, 2015) and videogames (e.g., Festl,
Scharkow, & Quandt, 2013). This may result in adverse developmental and psychological
outcomes, including subpar educational performance. Hence, our results call for finding
effective interventions for controlling the extent of use of hedonic IT among adolescents.
The non-significance effect of extent of use of utilitarian IT on adolescents’ GPA is
another important finding of this study. It points to possible lack of effective school-
oriented and educational systems and applications for adolescents. While IT has been
used effectively to promote the use of hedonic applications (Eyal & Hoover, 2014), it
may not have been used as effectively in developing educational systems, specifically for
adolescents. Considering the importance of IT in adolescents’ lives, such issues call for
not only a better investment in IT-enabled educational systems and applications for
adolescents, but also more studies to identify the important functionalities and
approaches, such as “digital game-based learning” (Papastergiou, 2009), that can make
IT-enabled educational systems more effective in terms of promoting students’
knowledge and motivation for learning.
Finally, it is noteworthy that while our data are from 8th and 10th grade students in the
U.S., we contend that the findings may generalize to other grades and other countries. An
important feature of hedonic IT, such as social media and videogames, is their
accessibility for different age groups and around the World. This makes it likely that the
patterns we observed in this study generalize to other adolescent groups and in other

MANUSCRIP
T
ACCEPTED
ACCEPTED MANUSCRIPT
31
countries with similar Internet connectivity and availability. Nevertheless, such
extensions should be studied in future research.
5. References
Abrams, S. S., & Walsh, S. (2014). Gamified Vocabulary. Journal of Adolescent & Adult Literacy, 58(1), 49-58.
Appleton, J. J., Christenson, S. L., Kim, D., & Reschly, A. L. (2006). Measuring cognitive and psychological engagement: Validation of the Student Engagement Instrument. Journal of School Psychology, 44(5), 427-445.
Christakis, D. A., Ebee, B. E., Rivara, F. P., & Zimmerman, F. J. (2004). Television, video, and computer game usage in children under 11 years of age. Journal of Pediatrics, 145(5), 652-656.
Ensor, T. (2012). Teaming With Technology: "Real" iPad Applications. Journal of Adolescent & Adult Literacy, 56(3), 193-193.
Eyal, N., & Hoover, R. (2014). Hooked: How to bild habit forming products. New York, NY: Portfolio Hardcover.
Festl, R., Scharkow, M., & Quandt, T. (2013). Problematic computer game use among adolescents, younger and older adults. Addiction, 108(3), 592-599.
Fraley, C., Raftery, A. E., Murphy, T. B., & Scrucca, L. (2012). mclust Version 4 for R: Normal Mixture Modeling for Model-Based Clustering, Classification, and Density Estimation. In.
Fredricks, J. A., Blumenfeld, P. C., & Paris, A. H. (2004). School engagement: Potential of the concept, state of the evidence. Review of educational research, 74(1), 59-109.
Gross, E. F. (2004). Adolescent Internet use: What we expect, what teens report. Journal of Applied Developmental Psychology, 25(6), 633-649.
Hall-Lande, J. A., Eisenberg, M. E., Christenson, S. L., & Neumark-Sztainer, D. (2007). Social isolation, psychological health, and protective factors in adolescence. Adolescence, 42(166), 265-286.
Hawkins, J. D., Guo, J., Hill, K. G., Battin-Pearson, S., & Abbott, R. D. (2001). Long-term effects of the Seattle Social Development Intervention on school bonding trajectories. Applied Developmental Science, 5(4), 225-236.
Hu, L. T., & Bentler, P. M. (1999). Cut off criteria of fit indices in co-variance structure analysis; Conventional criteria versus new alternatives. Structural Equation Modeling, 6(1), 1-55.
Jackson, L. A., Von Eye, A., Biocca, F. A., Barbatsis, G., Zhao, Y., & Fitzgerald, H. E. (2006). Does home internet use influence the academic performance of low-income children? Developmental psychology, 42(3), 429-435.
Jacobs, G. E. (2012). Rethinking Common Assumptions About Adolescents' Motivation to Use Technology In and Out of School. Journal of Adolescent & Adult Literacy, 56(4), 271-274.
Jimerson, S. R., Campos, E., & Greif, J. L. (2003). Toward an understanding of definitions and measures of school engagement and related terms. The California School Psychologist, 8(1), 7-27.
Johnston, L. D., Bachman, J. G., O'Malley, P. M., & Schulenberg, J. E. (2013). Monitoring the Future: A Continuing Study of American Youth (8th- and 10th-Grade Surveys), 2013. In (2015-03-26 ed.): Ann Arbor, MI: Inter-university Consortium for Political and Social Research.
Junco, R. (2012a). In-class multitasking and academic performance. Computers in Human Behavior, 28(6), 2236-2243.
Junco, R. (2012b). The relationship between frequency of Facebook use, participation in Facebook activities, and student engagement. Computers & Education, 58(1), 162-171.
Junco, R. (2012c). Too much face and not enough books: The relationship between multiple indices of Facebook use and academic performance. Computers in Human Behavior, 28(1), 187-198.
Karpinski, A. C., Kirschner, P. A., Ozer, I., Mellott, J. A., & Ochwo, P. (2013). An exploration of social networking site use, multitasking, and academic performance among United States and European university students. Computers in Human Behavior, 29(3), 1182-1192.

MANUSCRIP
T
ACCEPTED
ACCEPTED MANUSCRIPT
32
Kiraly, O., Urban, R., Griffiths, M. D., Agoston, C., Nagygyorgy, K., Kokonyei, G., & Demetrovics, Z. (2015). The Mediating Effect of Gaming Motivation Between Psychiatric Symptoms and Problematic Online Gaming: An Online Survey. Journal of medical Internet research, 17(4), 1-20.
Kirschner, P. A., & Karpinski, A. C. (2010). Facebook® and academic performance. Computers in Human Behavior, 26(6), 1237-1245.
Kwon, J.-H., Chung, C.-S., & Lee, J. (2011). The effects of escape from self and interpersonal relationship on the pathological use of Internet games. Community mental health journal, 47(1), 113-121.
Lenhart, A. (2015). Teens, Social Media & Technology Overview 2015. In (pp. 47). http://www.pewinternet.org/2015/04/09/teens-social-media-technology-2015/: Pew Research Center.
Li, Y., & Lerner, R. (2011). Developmental trajectories of school engagement across adolescence: Implications for academic achievement, substance use, depression, and delinquency. Developmental psychology, 47(1), 233-247.
Maddox, S. J., & Prinz, R. J. (2003). School bonding in children and adolescents: Conceptualization, assessment, and associated variables. Clinical child and family psychology review, 6(1), 31-49.
Madell, D., & Muncer, S. (2004). Gender differences in the use of the Internet by English secondary school children. Social Psychology of Education, 7(2), 229-251.
Marks, H. M. (2000). Student engagement in instructional activity: Patterns in the elementary, middle, and high school years. American educational research journal, 37(1), 153-184.
Massey, A. P., Khatri, V., & Montoya-Weiss, M. M. (2007). Usability of Online Services: The Role of Technology Readiness and Context. Decision Sciences, 38(2), 277-308.
Melas, C. D., Zampetakis, L. A., Dimopoulou, A., & Moustakis, V. S. (2014). An empirical investigation of Technology Readiness among medical staff based in Greek hospitals. European Journal of Information Systems, 23(6), 672–690.
Miller, D. C., & Byrnes, J. P. (2001). Adolescents' decision making in social situations: A self-regulation perspective. Journal of Applied Developmental Psychology, 22(3), 237-256.
Ong, E. Y. L., Ang, R. P., Ho, J. C. M., Lim, J. C. Y., Goh, D. H., Lee, C. S., & Chua, A. Y. K. (2011). Narcissism, extraversion and adolescents' self-presentation on Facebook. Personality and Individual Differences, 50(2), 180-185.
Papastergiou, M. (2009). Digital game-based learning in high school computer science education: Impact on educational effectiveness and student motivation. Computers & Education, 52(1), 1-12.
Paul, J. A., Baker, H. M., & Cochran, J. D. (2012). Effect of online social networking on student academic performance. Computers in Human Behavior, 28(6), 2117-2127.
Preacher, K. J., Rucker, D. D., & Hayes, A. F. (2007). Addressing moderated mediation hypotheses: Theory, methods, and prescriptions. Multivariate Behavioral Research, 42(1), 185-227.
Ryan, R. M., & Deci, E. L. (2000). Self-determination theory and the facilitation of intrinsic motivation, social development, and well-being. American psychologist, 55(1), 68-78.
Sanders, C. E., Field, T. M., Miguel, D., & Kaplan, M. (2000). The relationship of Internet use to depression and social isolation among adolescents. Adolescence, 35(138), 237-242.
Shah, V., Subramanian, S., Rouis, S., & Limayem, M. (2012). A Study on the Impact of Facebook Usage on Student’s Social Capital and Academic Performance. In Americas Conference on Information Systems (AMCIS). Seattle, Washington.
Simons-Morton, B., & Chen, R. (2009). Peer and parent influences on school engagement among early adolescents. Youth & society, 41, 3-25.
Skinner, E. A., & Belmont, M. J. (1993). Motivation in the classroom: Reciprocal effects of teacher behavior and student engagement across the school year. Journal of educational psychology, 85, 571-581.
Sun, H., & Zhang, P. (2006). Causal relationships between perceived enjoyment and perceived ease of use: An alternative approach. Journal of the Association for Information Systems, 7(9), 618-645.
Thompson, P. (2013). The digital natives as learners: Technology use patterns and approaches to learning. Computers & Education, 65, 12-33.
Van der Heijden, H. (2004). User acceptance of hedonic information systems. MIS Quarterly, 28(4), 695-704.
Van Rooij, A. J., Schoenmakers, T. M., Vermulst, A. A., Van Den Eijnden, R. J., & Van De Mheen, D. (2011). Online video game addiction: identification of addicted adolescent gamers. Addiction, 106(1), 205-212.

MANUSCRIP
T
ACCEPTED
ACCEPTED MANUSCRIPT
33
Vernon, L., Barber, B. L., & Modecki, K. L. (2015). Adolescent problematic social networking and school experiences: the mediating effects of sleep disruptions and sleep quality. Cyberpsychology, Behavior, and Social Networking, 18(7), 386-392.
Voelkl, K. E. (1997). Identification with school. American Journal of Education, 105, 294-318. Wang, M.-T. (2009). School climate support for behavioral and psychological adjustment: testing the
mediating effect of social competence. School Psychology Quarterly, 24(4), 240. Wang, M.-T., & Peck, S. C. (2013). Adolescent educational success and mental health vary across school
engagement profiles. Developmental psychology, 49(7), 1266-1276. Wang, M. T., Selman, R. L., Dishion, T. J., & Stormshak, E. A. (2010). A tobit regression analysis of the
covariation between middle school students' perceived school climate and behavioral problems. Journal of research on adolescence, 20(2), 274-286.
Watton, C. (2014). Suicidal Youth in America: The Role of School Disengagement and Other Sociodemographic Factors. The University of Guelph, Ontario, Canada.
Willoughby, T. (2008). A short-term longitudinal study of Internet and computer game use by adolescent boys and girls: prevalence, frequency of use, and psychosocial predictors. Developmental psychology, 44(1), 195-204.
Wu, J., & Lu, X. (2013). Effects of Extrinsic and Intrinsic Motivators on Using Utilitarian, Hedonic, and Dual-Purposed Information Systems: A Meta-Analysis. Journal of the Association for Information Systems, 14(3).
Zimmerman, B. J. (1989). Models of self-regulated learning and academic achievement. In B. J. Zimmerman & D. Schunk (Eds.), Self-regulated learning and academic achievement: Theory, research, and practice (pp. 1-25): Springer.

MANUSCRIP
T
ACCEPTED
ACCEPTED MANUSCRIPT
Highlights
• Distinctive School Engagement Profiles of Adolescents • Explaining GPA and patterns of IT use based on school engagement profiles • Mediation of patterns of IT use between school engagement dimensions and GPA • Large, nationally representative dataset of adolescents • Latent profile analysis, ANCOVA, and structural equation modeling