Embed Size (px)
Citation preview

SEALED AIRPROTECTION
What you eat & drink. Where you go. What you ship.
2011 Annual Report
Financial Highlights 2
CEO Letter 3
Protection 6
Food & Beverage 8
Institutional & Laundry 12
Protective Packaging 16
Our Approach 20
Our Footprint 22
Sustainability 24
Our Team 26
CONTENTS
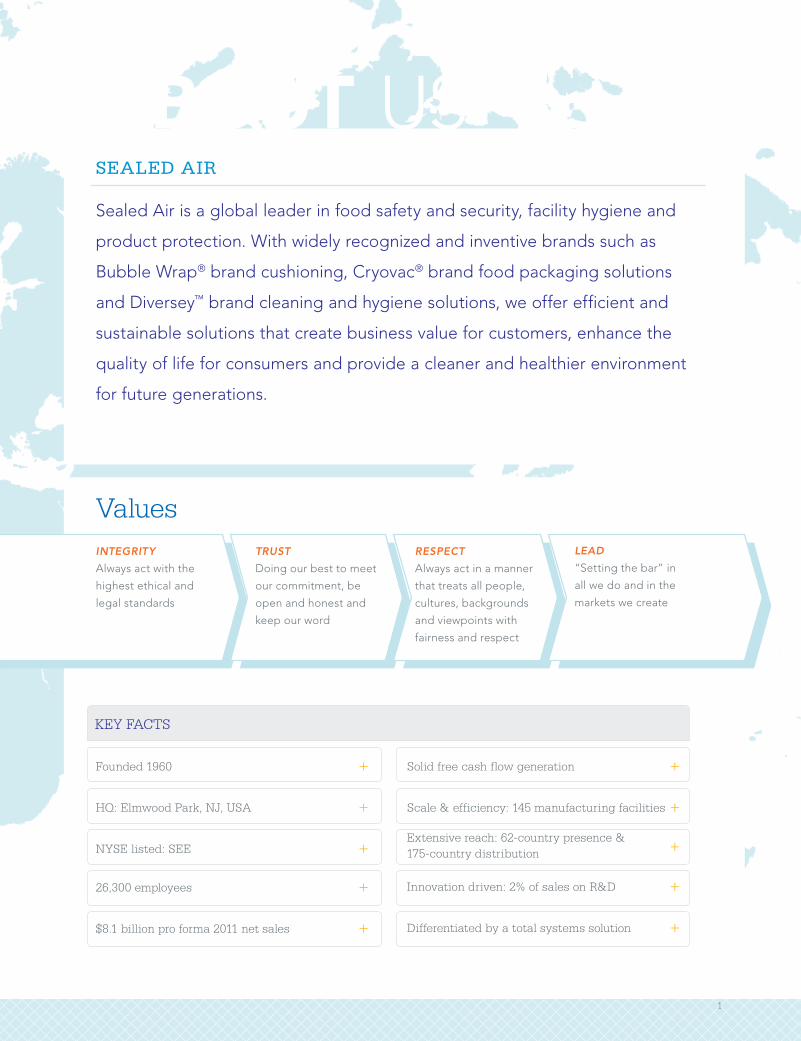
ABOUT USSealed Air is a global leader in food safety and security, facility hygiene and
product protection. With widely recognized and inventive brands such as
Bubble Wrap® brand cushioning, Cryovac® brand food packaging solutions
and Diversey™ brand cleaning and hygiene solutions, we offer efficient and
sustainable solutions that create business value for customers, enhance the
quality of life for consumers and provide a cleaner and healthier environment
for future generations.
SEALED AIR
ValuesINTEGRITY
Always act with the
highest ethical and
legal standards
TRUST
Doing our best to meet
our commitment, be
open and honest and
keep our word
RESPECT
Always act in a manner
that treats all people,
cultures, backgrounds
and viewpoints with
fairness and respect
LEAD
“Setting the bar” in
all we do and in the
markets we create
Founded 1960 +
HQ: Elmwood Park, NJ, USA +
NYSE listed: SEE +
26,300 employees +
$8.1 billion pro forma 2011 net sales +
Solid free cash flow generation +
Scale & efficiency: 145 manufacturing facilities +
Extensive reach: 62-country presence & +
175-country distribution
Innovation driven: 2% of sales on R&D +
Differentiated by a total systems solution +
KEY FACTS
1
FINANCIAL HIGHLIGHTS
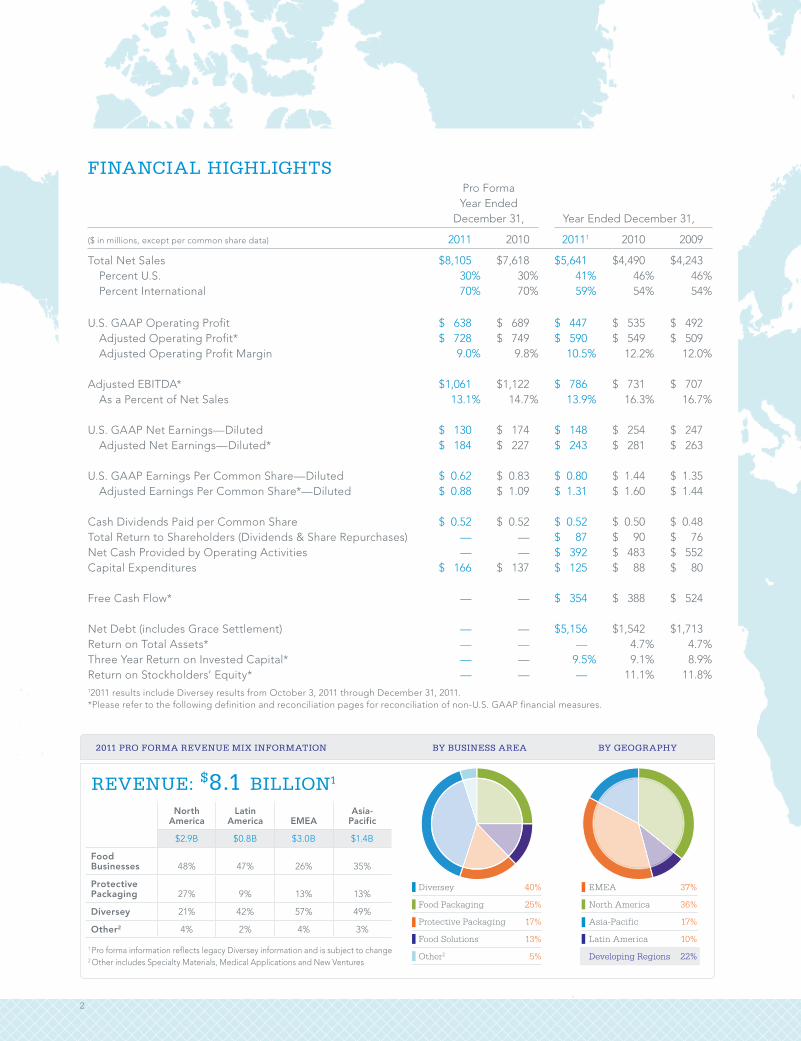
BY BUSINESS AREA BY GEOGRAPHY
Diversey
Food Packaging
Protective Packaging
Food Solutions
Other2
40%
25%
17%
13%
5%
2011 PRO FORMA REVENUE MIX INFORMATION
REVENUE: $8.1 BILLION1
Pro Forma Year Ended
December 31, Year Ended December 31,
($ in millions, except per common share data) 2011 2010 20111 2010 2009
Total Net Sales $ 8,105 $ 7,618 $ 5,641 $ 4,490 $ 4,243 Percent U.S. 30% 30% 41% 46% 46% Percent International 70% 70% 59% 54% 54%
U.S. GAAP Operating Profit $ 638 $ 689 $ 447 $ 535 $ 492 Adjusted Operating Profit* $ 728 $ 749 $ 590 $ 549 $ 509 Adjusted Operating Profit Margin 9.0% 9.8% 10.5% 12.2% 12.0%
Adjusted EBITDA* $ 1,061 $ 1,122 $ 786 $ 731 $ 707 As a Percent of Net Sales 13.1% 14.7% 13.9% 16.3% 16.7%
U.S. GAAP Net Earnings—Diluted $ 130 $ 174 $ 148 $ 254 $ 247 Adjusted Net Earnings—Diluted* $ 184 $ 227 $ 243 $ 281 $ 263
U.S. GAAP Earnings Per Common Share—Diluted $ 0.62 $ 0.83 $ 0.80 $ 1.44 $ 1.35 Adjusted Earnings Per Common Share*—Diluted $ 0.88 $ 1.09 $ 1.31 $ 1.60 $ 1.44
Cash Dividends Paid per Common Share $ 0.52 $ 0.52 $ 0.52 $ 0.50 $ 0.48Total Return to Shareholders (Dividends & Share Repurchases) — — $ 87 $ 90 $ 76Net Cash Provided by Operating Activities — — $ 392 $ 483 $ 552Capital Expenditures $ 166 $ 137 $ 125 $ 88 $ 80
Free Cash Flow* — — $ 354 $ 388 $ 524
Net Debt (includes Grace Settlement) — — $ 5,156 $ 1,542 $ 1,713Return on Total Assets* — — — 4.7% 4.7%Three Year Return on Invested Capital* — — 9.5% 9.1% 8.9%Return on Stockholders’ Equity* — — — 11.1% 11.8%12011 results include Diversey results from October 3, 2011 through December 31, 2011.*Please refer to the following definition and reconciliation pages for reconciliation of non-U.S. GAAP financial measures.
EMEA
North America
Asia-Pacific
Latin America
Developing Regions
37%
36%
17%
10%
22%
North America
Latin America EMEA
Asia- Pacific
$2.9B $0.8B $3.0B $1.4B
Food Businesses 48% 47% 26% 35%
Protective Packaging 27% 9% 13% 13%
Diversey 21% 42% 57% 49%
Other2 4% 2% 4% 3%
1 Pro forma information reflects legacy Diversey information and is subject to change 2 Other includes Specialty Materials, Medical Applications and New Ventures
2
CEO LETTER
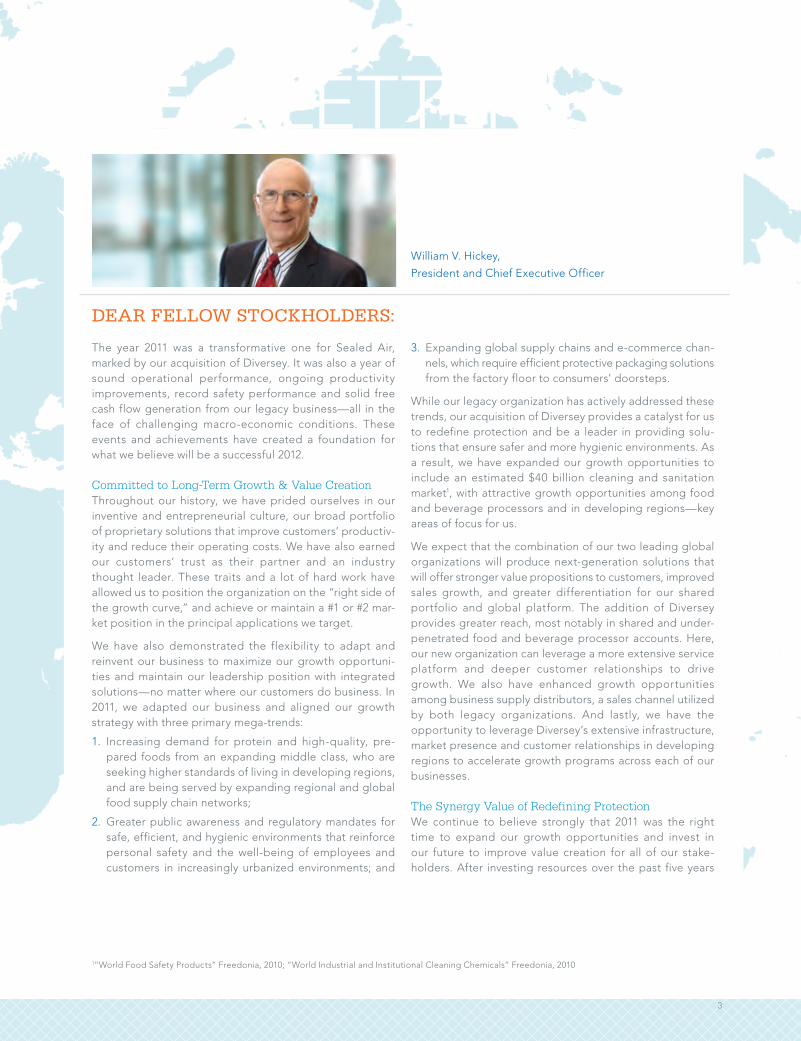
William V. Hickey,
President and Chief Executive Officer
The year 2011 was a transformative one for Sealed Air, marked by our acquisition of Diversey. It was also a year of sound operational performance, ongoing productivity improvements, record safety performance and solid free cash flow generation from our legacy business—all in the face of challenging macro-economic conditions. These events and achievements have created a foundation for what we believe will be a successful 2012.
Committed to Long-Term Growth & Value CreationThroughout our history, we have prided ourselves in our inventive and entrepreneurial culture, our broad portfolio of proprietary solutions that improve customers’ productiv-ity and reduce their operating costs. We have also earned our customers’ trust as their partner and an industry thought leader. These traits and a lot of hard work have allowed us to position the organization on the “right side of the growth curve,” and achieve or maintain a #1 or #2 mar-ket position in the principal applications we target.
We have also demonstrated the flexibility to adapt and reinvent our business to maximize our growth opportuni-ties and maintain our leadership position with integrated solutions—no matter where our customers do business. In 2011, we adapted our business and aligned our growth strategy with three primary mega-trends:
1. Increasing demand for protein and high-quality, pre-pared foods from an expanding middle class, who are seeking higher standards of living in developing regions, and are being served by expanding regional and global food supply chain networks;
2. Greater public awareness and regulatory mandates for safe, efficient, and hygienic environments that reinforce personal safety and the well-being of employees and customers in increasingly urbanized environments; and
3. Expanding global supply chains and e-commerce chan-nels, which require efficient protective packaging solutions from the factory floor to consumers’ doorsteps.
While our legacy organization has actively addressed these trends, our acquisition of Diversey provides a catalyst for us to redefine protection and be a leader in providing solu-tions that ensure safer and more hygienic environments. As a result, we have expanded our growth opportunities to include an estimated $40 billion cleaning and sanitation market1, with attractive growth opportunities among food and beverage processors and in developing regions—key areas of focus for us.
We expect that the combination of our two leading global organizations will produce next-generation solutions that will offer stronger value propositions to customers, improved sales growth, and greater differentiation for our shared portfolio and global platform. The addition of Diversey provides greater reach, most notably in shared and under-penetrated food and beverage processor accounts. Here, our new organization can leverage a more extensive service platform and deeper customer relationships to drive growth. We also have enhanced growth opportunities among business supply distributors, a sales channel utilized by both legacy organizations. And lastly, we have the opportunity to leverage Diversey’s extensive infrastructure, market presence and customer relationships in developing regions to accelerate growth programs across each of our businesses.
The Synergy Value of Redefining ProtectionWe continue to believe strongly that 2011 was the right time to expand our growth opportunities and invest in our future to improve value creation for all of our stake-holders. After investing resources over the past five years
DEAR FELLOW STOCKHOLDERS:
1”World Food Safety Products” Freedonia, 2010; “World Industrial and Institutional Cleaning Chemicals” Freedonia, 2010
3
CEO LETTER
to optimize our legacy internal operations, lower our cost structure, transition to a standard ERP system, revitalize our R&D pipeline, and build a solid balance sheet—our team was ready to focus on the next 10 years as a period of trans-formational growth. While the Diversey transaction initially met with a mixed reaction from investors, I believe that our commitment to expand our leadership presence in food safety and security and facility hygiene is the right long-term strategy for the organization and Diversey was the right investment to drive long-term stockholder value.
With Diversey, we are focused on being a global leader in sustainable solutions that improve food safety and security, facility hygiene and product protection—protecting what is important: what you eat and drink, where you go and the valuable goods you ship.
The global business unit structure we expect to implement in 2012 will align three business areas to a specific protec-tion theme: Food & Beverage, Institutional & Laundry, and Protective Packaging. Each business area will continue to leverage our expansive, shared global infrastructure and our core competencies in advanced material science, microbiology, food science and engineering to improve the efficiency and efficacy of protection solutions for cus-tomers worldwide. As we transition to this structure, our businesses will be focusing their attention and investments on a core growth strategy that emphasizes sustaining our current market footprint in North America, maintaining our leadership positions in the EMEA markets, and accelerat-ing growth in developing regions. We believe this approach will ultimately generate the most growth opportunity, value and return on our investment.
As you will see in this year’s annual report, the new Sealed Air is positioned to create measurable value for our cus-tomers and their operations through solutions that improve safety and risk management, drive operational efficiencies through automation and deliver water, waste and energy reduction. Additionally, we ensure downstream benefits such as extended shelf life, which reduces food waste, brand enhancement, and value-added convenience features for both customers and consumers.
I am excited about the opportunities ahead for Sealed Air based on what we have learned following the close of the Diversey transaction in October 2011. The diligent analysis of over ten integration teams has yielded 2013 goals that include cost synergy targets that are double our initial esti-mate and have reinforced our free cash flow targets—core to achieving our net debt target and long-term capital structure of a 3.0x to 3.5x net debt to EBITDA ratio by the end of 2013. These goals include:
• $8.6 billion in annual revenue, including $70 million in rev-enue synergies;
• $100 million in annual cost synergies;
• $1.4 billion in adjusted EBITDA ($1.45 billion run-rate at end-2013);
• $600 million in annual free cash flow; and
• $4.5 billion in net debt.
Committed and Aligned to Achieve SuccessBoth senior management and the Board are committed to achieving a successful integration, realizing our 2013 goals, and delivering the earnings improvement and stockholder value creation that we expect will follow when we perform to plan over the next two years. To our disappointment, 2011 became a challenging year for our stockholders due to the significant decline in our stock price following the announcement of our Diversey acquisition. In response, the Board took a hard look at our strategy and took meaningful actions. We reaffirmed the strategic rationale supporting the Diversey transaction, appointed a new lead director, Mr. William Marino, and two additional independent Board members, and we aligned our incentive compensation pro-grams to include our 2013 goals and total shareholder return (among other metrics).
As we move ahead and execute on our plans, we commit to our stockholders that we will:
• Put our full effort into achieving the success of our deal;
• Set clear, reasonable performance goals and communi-cate them;
• Report on our progress toward achieving our goals; and
• Share our insights along the way.
“ SEALED AIR’S GROWTH HAS ALWAYS COME FROM CHALLENGING OUR OWN
NOTION OF HOW ‘OUR PRODUCTS PROTECT YOUR PRODUCTS.’ BY HAVING
THE COURAGE TO REDEFINE PROTECTION, WE HAVE ALWAYS MAXIMIZED
THE VALUE WE OFFER AS CUSTOMER AND CONSUMER NEEDS EVOLVE.”
4
These commitments, along with the placement of a solid senior management team which represents industry-leading executives with an average tenure of 20 years, who know their markets and know how to win, position us to success-fully execute on our integration and growth programs.
Growing on Solid FundamentalsOur 2013 plans are built on a solid legacy Sealed Air foun-dation. In 2011, despite the slowing pace of growth in the second half of the year, our businesses maintained con-stant dollar growth, solid free cash flow generation and ongoing penetration across customer accounts and in developing regions. Our core drivers of success were our ongoing expansion into developing regions, our solid pipeline of innovations, which continued to offer lower total cost solutions for customers, superior customer service and strong access to diverse distribution channels. For the legacy Sealed Air business, this resulted in full year:
• 5% constant dollar growth, including 2% volume growth and 3% price/mix growth;
• Launch of nearly 40 new solutions, with 17% of sales from new solutions (+200 bps vs. 2010);
• Approximately $30 million in productivity benefits from our commitment to continuous improvement;
• Another year of record safety performance; and
• Maintenance of relatively steady operating profit margins versus 2010, reflecting 80% recovery of petrochemical-based raw material costs.
During the year, we maintained our strong liquidity position with approximately $1.5 billion in available funds to meet an estimated $830 million obligation associated with the W. R. Grace settlement. We finished the year with over $700 mil-lion in cash and cash equivalents, allowing us to be well positioned to fund the settlement when it becomes due. We continue to expect the payment of the settlement to be accretive to our post-payment diluted earnings per share by $0.13 annually and yield over $350 million in cash tax benefits, which will either aid in our reduction of debt or allow us to return cash to stockholders if we have already achieved our targeted $4.5 billion net debt level.
Focused on the Deliverables: 2012 MilestonesAs we continue to look to the future with great optimism, our priorities are to place our customers first and complete key milestones necessary to achieve our long-term goals.
In 2012, our organization will be focused on five objectives:
• Achieving $50 million in cost synergies and increasing our rate of revenue synergies to meet our 2013 goal of $70 million;
• Successful integration of the business by executing on integration plans across back-office functions and within our supply chain network, as well as transitioning to three business areas;
• Achieving approximately $1.2 billion in adjusted EBITDA from the benefits of organic sales growth, productivity improvements, synergies and legacy restructuring programs;
• Generating cash flow to reduce debt, with estimated $450 to $475 million of free cash flow (includes working capital), and decreasing net debt from $5.2 billion to a target of $4.9 billion by year-end; and
• Developing our people by providing a cohesive and collaborative environment that will allow our employees to thrive, offer greater development opportunities and ensure skills required to achieve our growth strategies are in place.
As we look ahead, we believe we have identified the right markets for growth and the right strategy to achieve our goals. We have the expertise and leadership, technological capability and global platform that will define Sealed Air as an unparalleled protection company dedicated to deliver on our commitments to our stakeholders.
William V. HickeyPresident and Chief Executive Officer
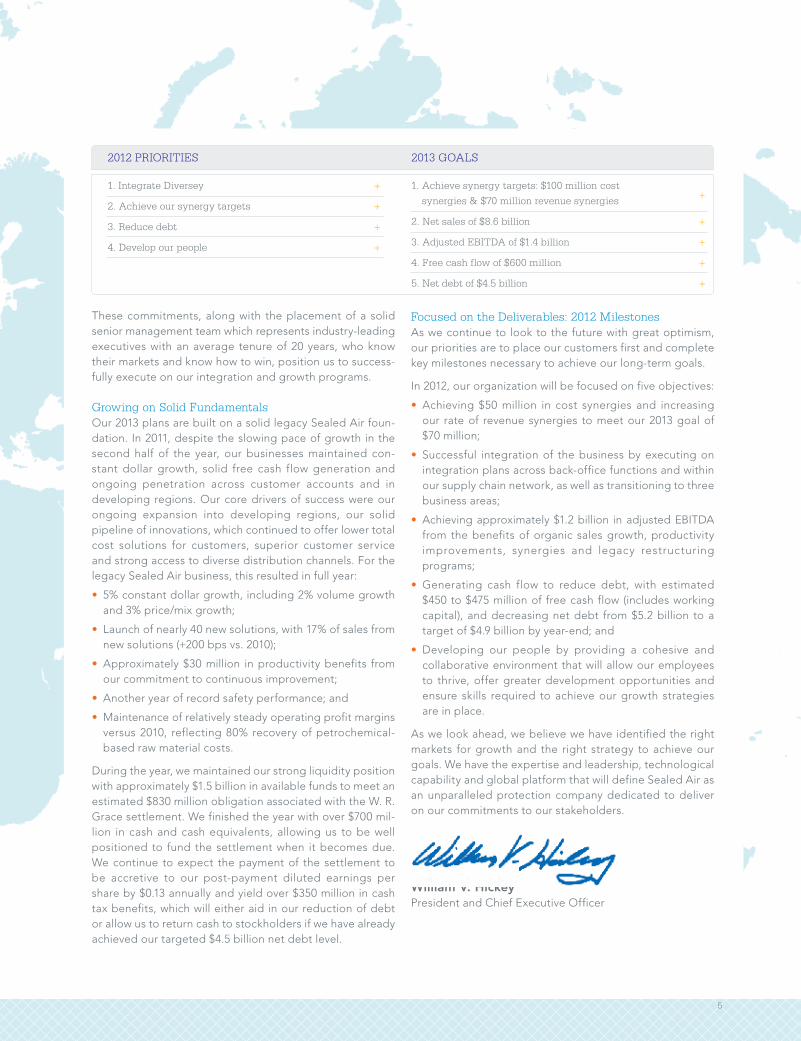
2012 PRIORITIES 2013 GOALS
1. Integrate Diversey +
2. Achieve our synergy targets +
3. Reduce debt +
4. Develop our people +
1. Achieve synergy targets: $100 million cost +
synergies & $70 million revenue synergies
2. Net sales of $8.6 billion +
3. Adjusted EBITDA of $1.4 billion +
4. Free cash flow of $600 million +
5. Net debt of $4.5 billion +
5

Sealed Air’s 26,300 employees focus on PROTECTION every day and focus their
energy on innovating solutions that deliver greater operational efficiency, total
cost reduction and brand protection for our customers.
For over fifty years, we have reinvented and redefined protection, but have always
reinforced our founding principle that “our products protect your products®.”
With the addition of Diversey in 2011, we are now a global leader in food safety
and security, facility hygiene and product protection—protecting what you
eat and drink; where you live, work, shop and vacation and where you receive
your health care; and the valuable goods you ship.
Greater confidence in food safety and security
We offer the industry’s broadest
expertise in food science and
microbiology to help improve the
management of contaminants and
improve supply chain efficiencies
with complete system solutions.
Our solutions improve customers’
confidence that food and beverages
are processed, sold and prepared in
safe, efficient environments, have
extended shelf life and reduced
waste, while providing value-added
convenience features and formats
for consumers.
Efficient facility hygiene solutions
We deliver tailored system solutions
for building care, food safety, laundry
and infection control applications.
Our solutions incorporate automated
equipment, tools and utensils with
tailored cleaning solutions from
one trusted partner. We design our
solutions to simplify and automate
cleaning functions to improve pro-
ductivity, minimize water and energy
use and reduce customers’ total
operating costs.
Practical solutions for demanding protective packaging needs
We offer the broadest portfolio of
protective, industrial and display
packaging systems to meet diverse
application requirements across a
wide range of industries. We focus
on minimizing material use and maxi-
mizing operational efficiency and
product protection, which generates
total cost savings from the customers’
facility to the consumers’ doorstep.
BY TRANSFORMING OUR CAPABILITIES, WE NOW PROVIDE CUSTOMERS WITH:
PROTECTION
6

What you eat & drink +
Where you go +
What you ship +7
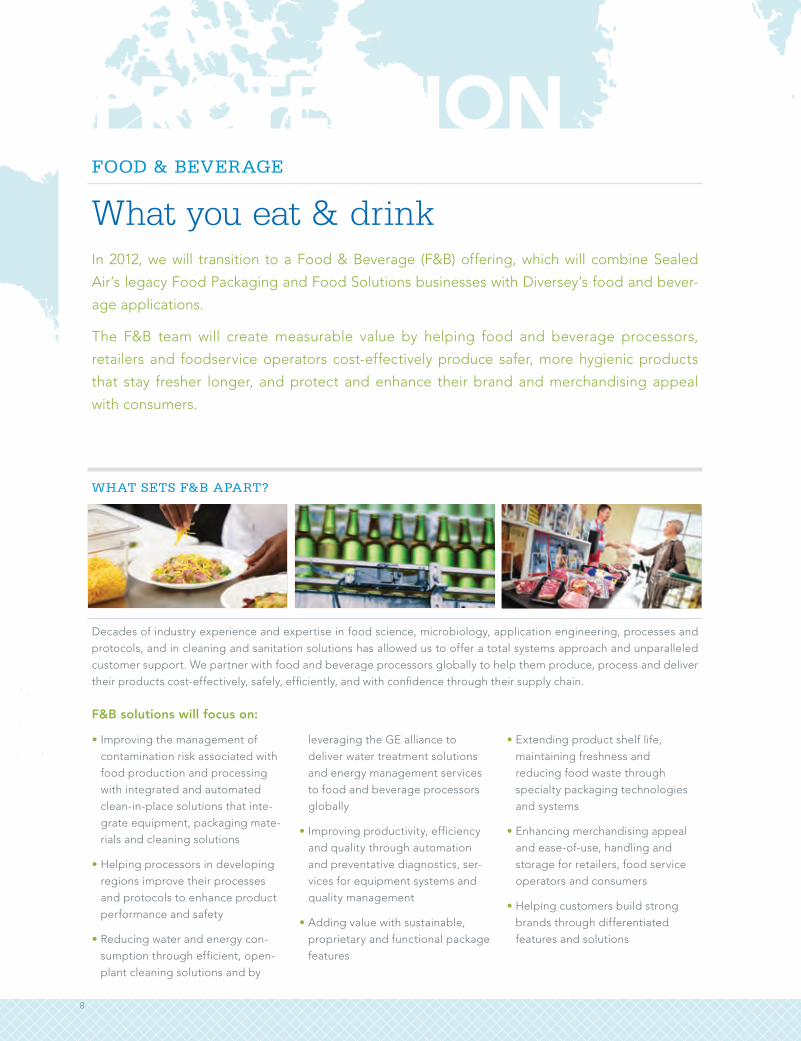
In 2012, we will transition to a Food & Beverage (F&B) offering, which will combine Sealed
Air’s legacy Food Packaging and Food Solutions businesses with Diversey’s food and bever-
age applications.
The F&B team will create measurable value by helping food and beverage processors,
retailers and foodservice operators cost-effectively produce safer, more hygienic products
that stay fresher longer, and protect and enhance their brand and merchandising appeal
with consumers.
FOOD & BEVERAGE
What you eat & drink
Decades of industry experience and expertise in food science, microbiology, application engineering, processes and
protocols, and in cleaning and sanitation solutions has allowed us to offer a total systems approach and unparalleled
customer support. We partner with food and beverage processors globally to help them produce, process and deliver
their products cost-effectively, safely, efficiently, and with confidence through their supply chain.
F&B solutions will focus on:
• Improving the management of
contamination risk associated with
food production and processing
with integrated and automated
clean-in-place solutions that inte-
grate equipment, packaging mate-
rials and cleaning solutions
• Helping processors in developing
regions improve their processes
and protocols to enhance product
performance and safety
• Reducing water and energy con-
sumption through efficient, open-
plant cleaning solutions and by
leveraging the GE alliance to
deliver water treatment solutions
and energy management services
to food and beverage processors
globally
• Improving productivity, efficiency
and quality through automation
and preventative diagnostics, ser-
vices for equipment systems and
quality management
• Adding value with sustainable,
proprietary and functional package
features
• Extending product shelf life,
maintaining freshness and
reducing food waste through
specialty packaging technologies
and systems
• Enhancing merchandising appeal
and ease-of-use, handling and
storage for retailers, food service
operators and consumers
• Helping customers build strong
brands through differentiated
features and solutions
WHAT SETS F&B APART?
PROTECTION
8

Karl Deily, President, Food & Beverage
“ REDUCING CUSTOMER COSTS AND WASTE IS OUR GOAL,
BUT DELIVERING PEACE OF MIND IS OUR MISSION.”
GEOGRAPHIC REVENUE MIX SOLUTION FOCUS
North America
EMEA
Asia-Pacific
Latin America
39%
32%
16%
13%
80%
20%
Packaging
Cleaning & Sanitation
CHANNEL MIX
99%
1%
Direct Sales
Distributor Sales
$3.8 BILLION SALES*
*Represents estimated pro forma 2011 net sales data, which is preliminary and subject to change.
9
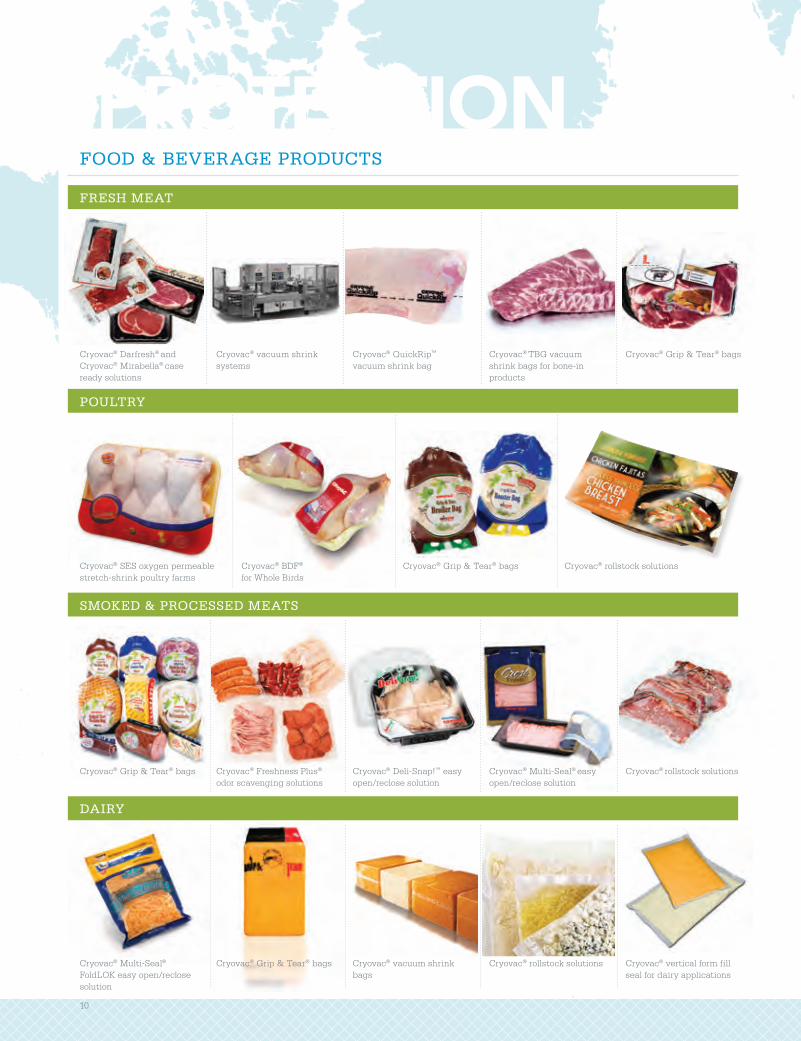
FOOD & BEVERAGE PRODUCTS
FRESH MEAT
POULTRY
SMOKED & PROCESSED MEATS
DAIRY
Cryovac® Darfresh® and Cryovac® Mirabella® case ready solutions
Cryovac® vacuum shrink systems
Cryovac® QuickRip™
vacuum shrink bagCryovac® TBG vacuum shrink bags for bone-in products
Cryovac® Grip & Tear® bags
PROTECTION
Cryovac® Multi-Seal® FoldLOK easy open/reclose solution
Cryovac® Grip & Tear® bags Cryovac® vacuum shrink bags
Cryovac® rollstock solutions Cryovac® vertical form fill seal for dairy applications
Cryovac® SES oxygen permeable stretch-shrink poultry farms
Cryovac® BDF® for Whole Birds
Cryovac® Grip & Tear® bags Cryovac® rollstock solutions
Cryovac® Grip & Tear® bags Cryovac® Freshness Plus® odor scavenging solutions
Cryovac® Deli-Snap!™ easy open/reclose solution
Cryovac® Multi-Seal® easy open/reclose solution
Cryovac® rollstock solutions
10

CONSUMER PORTIONS
FLUIDS PACKAGING
DIVERSEY™ CLEANING AND SANITATION
Cryovac® n’Oven Ovenable Foam Tray
Cryovac® Oven Ease™
solutionsCryovac® BDF® Soft Cryovac® LID Film Simple Steps®
microwavable packaging
Diverflow® clean in place systems Divos® membrane cleaning Divobrite® system bottle washing & Dicolube® track treatment
Cryovac® VPP Vertical Pouch Packaging (frozen, chilled and shelf stable packaging)
ProAseptic pouch solutions Entapack® IBC liners and bag-in-box solutions
Diverclean™ portable foamer with EnduroChlor™ for open plant cleaning
Diversey™ detergents and Divosan® disinfectants
Dry Tech™ lubricant ZipClean™ conveyor belt cleaning
11

The Institutional & Laundry (I&L) business will represent the broad offering of Diversey™-branded total system solutions that ensure facility hygiene, food safety and security in food service operations, and infection control to customers worldwide. I&L integrates cleaning chemicals, floor care equipment, cleaning tools, and a wide range of value-added services. These services include food safety and application training/consulting and the auditing of hygiene and water management to improve the operational efficiency of customers’ processes and improve their cleaning methods.
I&L’s efficient, easy-to-use solutions include super concentrated cleaning formulations and proprietary and patented dosing and dilution technology that allows for significant savings. Additionally, floor care equipment and cleaning tools improve productivity by either automating or reducing manual procedures, minimizing waste, and lowering water and energy consumption across the customers’ processes and operations. Together, these solutions reduce the overall environmental footprint of customers’ commercial and industrial facilities and reduce the customer’s “total cost to clean.”
INSTITUTIONAL & LAUNDRY
Where you go
I&L solutions target four primary application categories: kitchen hygiene, floor care, restroom care & housekeeping, and
laundry, which are most commonly applied as follows:
Primary solutions include fully integrated lines of products and dispensing systems for hard surface cleaning, disinfect-
ing and sanitizing, hand washing, deodorizing, ware washing, hard surface and carpeted floor cleaning systems, tools
and utensils, and fabric care for laundry applications, including detergents, stain removers, bleaches and a broad
range of dispensing equipment and process control and management information systems.
I&L SERVES INSTITUTIONS AND INDUSTRIAL END-USERS IN:
PROTECTION
PRIMARY SECTORS WHERE SOLUTIONS ARE IN USE
Food Service LodgingBuilding Care Maintenance Retail Healthcare
Commercial Laundry
Kitchen Hygiene
Floor Care
Restroom Care & Housekeeping
Laundry
Food Service Lodging Building Service Contractors
Retail Healthcare Facilities Commercial Laundry
12

Pedro Chidichimo, President, Institutional & Laundry
“ OUR GLOBAL REACH, LEADING INDUSTRY EXPERTISE AND
INTEGRATED CLEANING & HYGIENE SOLUTIONS DRIVE OUR
WAY TO SUSTAINABLE PROFITABLE GROWTH.”
GEOGRAPHIC REVENUE MIX SECTOR MIX
EMEA
North America
Asia-Pacific
Latin America
Distribution1
Building Service Contractors
Food Service
Retail
Lodging & Laundry
Healthcare
Other
CHANNEL MIX
Distributor Sales2
Direct Sales
$2.5 BILLION SALES*
37%
17%
13%
12%
11%
8%
2%
50%
22%
21%
7%
1 End-users managed by distributors.2 Includes end-users managed by I&L.*Represents estimated pro forma 2011 net sales data, which is preliminary and subject to change.
52%
48%
13

GENERAL CLEANING & HOUSEKEEPING SOLUTIONS
INSTITUTIONAL AND LAUNDRY PRODUCTS
Oxivir® disinfectant cleaner
R2-plus™ cleaner
Sani Calc™ concentrate
Divermite™ Room Care
Good Sense® odor control spray
Twinkle® stainless steel polisher1
Dosing and Dispensing Systems
QuattroSelect® dispensing system SmartDose™ dispensing system J-Flex™ dispensing system Divermite™ dispensing system
Microfiber cloths
Suma® Optifill™ pan and pot detergent concentrate and portable dosing and dispensing technology
Suma® Revoflow™ washing detergent and dispensing system
Diverflow® dispensing system for detergents
Other solutions include: degreasers, sanitizers, and oven grill cleaners 1Twinkle® is a registered trademark of Malco Products, Inc. and used under license
PROTECTION
TASKI® Cleaning Cart Systems
WARE WASHING AND KITCHEN HYGIENE SOLUTIONS
Diversey™ Cleaning and Sanitizing product range
Comprehensive Range of Cleaning Chemicals
14

Clax® Revoflow™ laundry dispensing system
Diverflow™ 2 laundry dispensing system
Soft Care® Dispenser Soft Care® Sensations
FLOOR CARE SOLUTIONS
Floor finish applicators and sprayable mops
TASKI® Swingo™ Scrubber/Driers
TASKI Ergodisc® single-disc burnishing solutions TASKI® Dry foam carpet care system
Floor Finishes, Strippers and Cleaners
Floor Care Systems
Floor Care Tools
PERSONAL CARE—(HAND CARE)LAUNDRY SOLUTIONS
15

Protective Packaging will combine Sealed Air’s legacy Protective Packaging, Shrink Packaging and Specialty Materials businesses to be the preferred provider of protective packaging solu-tions for the distribution of goods globally. This new business provides customers with the industry’s broadest and most versatile range of protective packaging solutions to meet cush-ioning, void fill, positioning/block-and-bracing, surface protection, retail display, containment and dunnage needs.
Today, solutions are largely used in B2B/industrial applications with customers representing over 400-SIC* codes, in e-commerce/fulfillment applications, and at retail level where Protective Packaging offers select products for consumer use.
PROTECTIVE PACKAGING
What you ship
• Innovative systems that deliver the highest performing products
• Engineered solutions that meet premium quality and environmental standards
• Industry-leading brands
• Extensive global sales, service and development lab network
• Broad distribution—both geographically and across numerous sales channels
Together, these strengths allow Protective Packaging to commercialize systems globally that are designed to minimize
material use while maximizing packaging performance, productivity, recyclability, re-use, and total cost savings for
our customers.
THE BUSINESS IS DIFFERENTIATED BY:
PROTECTION
*SIC=Standard Industrial Classification
16

GEOGRAPHIC REVENUE MIX SOLUTION MIX
North America
EMEA
Asia-Pacific
Latin America
Cushioning
Core Solutions
Shrink Films
Packaging Systems
CHANNEL MIX
“ WE DRIVE EFFICIENCY AND VALUE FROM OUR CUSTOMER’S
SHOP FLOOR TO THEIR CUSTOMER’S DOORSTEP.”
$1.6 BILLION SALES*
Ryan Flanagan, President, Protective Packaging
82%
18%
38%
36%
18%
8%
*Represents estimated pro forma 2011 net sales data, which is preliminary and subject to change.
Distributor & Fabricator
Direct & Retail
55%
28%
12%
5%
17

PROTECTIONSHRINK PACKAGING SOLUTIONS
PROTECTIVE PACKAGING PRODUCTS
CUSHIONING
CORE SOLUTIONS
Korrvu® retention packaging Instapak® foam in place Instapak Quick® RT foam packaging
Ethafoam® MRC recycled content polyethylene foam
Ethafoam® Synergy® fine cell polyethylene foam
Cellu-Cushion® Excell™ expandable polyethylene foam
Instapak Complete® system Instapak iMold® automated foam packaging system
SpeedyPacker® foam-in-bag systems
Bubble Wrap® recycled grade cushioning PakNatural™ loose fill Jiffy Mailer® products
18

Shanklin® shrink film systems Cryovac CT-301® shrink film Cryovac® and Opti® shrink film
NewAir I.B.® systems PriorityPak® automated packaging systems
Fill-Air® inflatable packaging system
FillTeck™ inflatable cushioning systems
PackTiger® paper packaging systems FasFil® EZ™ paper void fill systems Rapid Fill® automated void fill packaging system
PACKAGING SYSTEMS
SHRINK PACKAGING SOLUTIONS
19
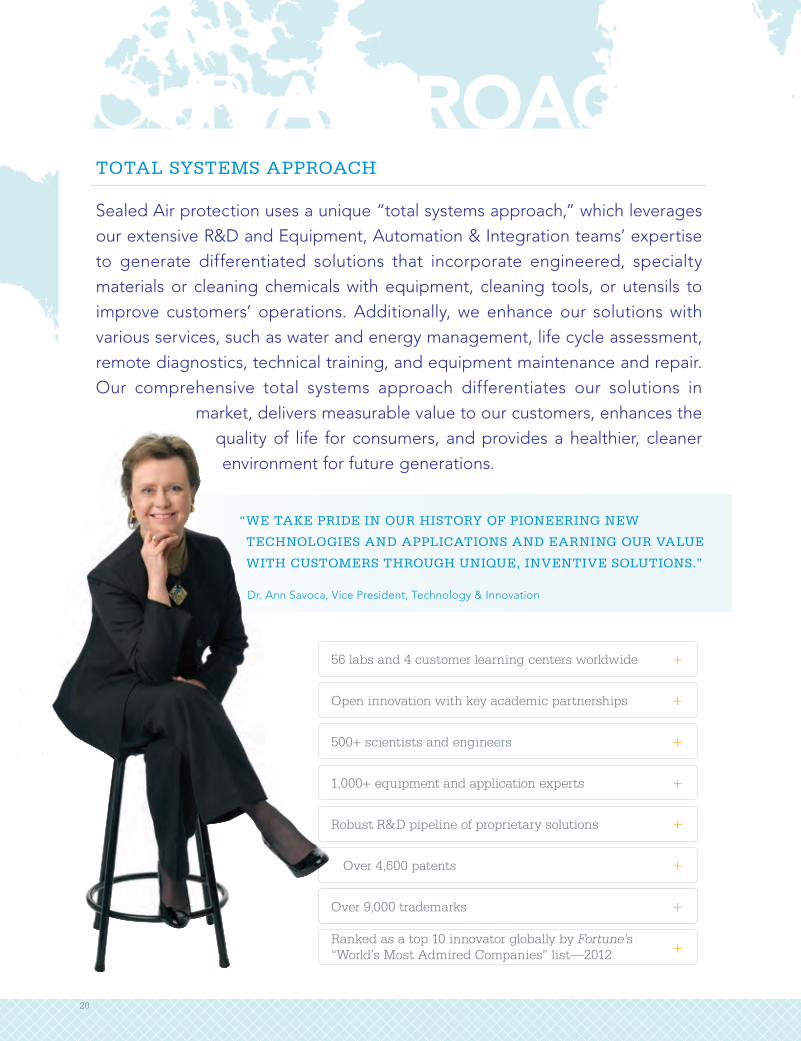
TOTAL SYSTEMS APPROACH
56 labs and 4 customer learning centers worldwide +
Open innovation with key academic partnerships +
500+ scientists and engineers +
1,000+ equipment and application experts +
Robust R&D pipeline of proprietary solutions +
Over 4,600 patents +
Over 9,000 trademarks +
Ranked as a top 10 innovator globally by Fortune’s +
“World’s Most Admired Companies” list—2012
OUR APPROACHSealed Air protection uses a unique “total systems approach,” which leverages our extensive R&D and Equipment, Automation & Integration teams’ expertise to generate differentiated solutions that incorporate engineered, specialty materials or cleaning chemicals with equipment, cleaning tools, or utensils to improve customers’ operations. Additionally, we enhance our solutions with various services, such as water and energy management, life cycle assessment, remote diagnostics, technical training, and equipment maintenance and repair. Our comprehensive total systems approach differentiates our solutions in
market, delivers measurable value to our customers, enhances the quality of life for consumers, and provides a healthier, cleaner environment for future generations.
“ WE TAKE PRIDE IN OUR HISTORY OF PIONEERING NEW
TECHNOLOGIES AND APPLICATIONS AND EARNING OUR VALUE
WITH CUSTOMERS THROUGH UNIQUE, INVENTIVE SOLUTIONS.”
Dr. Ann Savoca, Vice President, Technology & Innovation
20
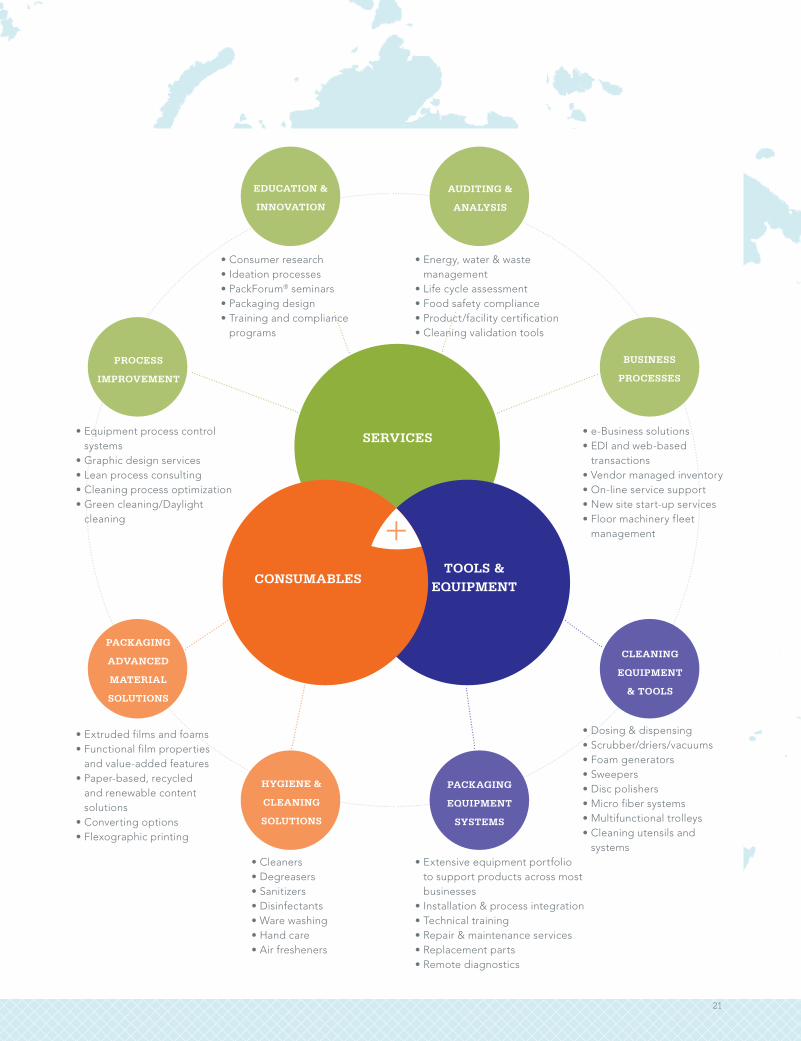
AUDITING &
ANALYSIS
EDUCATION &
INNOVATION
PROCESS
IMPROVEMENT
CLEANING
EQUIPMENT
& TOOLS
PACKAGING
ADVANCED
MATERIAL
SOLUTIONS
HYGIENE &
CLEANING
SOLUTIONS
PACKAGING
EQUIPMENT
SYSTEMS
TOOLS & EQUIPMENT
CONSUMABLES
SERVICES
• Energy, water & waste management
• Life cycle assessment• Food safety compliance• Product/facility certification• Cleaning validation tools
• Consumer research• Ideation processes• PackForum® seminars• Packaging design• Training and compliance
programs
• Equipment process control systems
• Graphic design services• Lean process consulting• Cleaning process optimization• Green cleaning/Daylight
cleaning
• e-Business solutions• EDI and web-based
transactions• Vendor managed inventory• On-line service support• New site start-up services• Floor machinery fleet
management
• Dosing & dispensing• Scrubber/driers/vacuums• Foam generators• Sweepers• Disc polishers• Micro fiber systems• Multifunctional trolleys• Cleaning utensils and
systems• Extensive equipment portfolio
to support products across most businesses
• Installation & process integration• Technical training• Repair & maintenance services • Replacement parts • Remote diagnostics
• Extruded films and foams• Functional film properties
and value-added features • Paper-based, recycled
and renewable content solutions
• Converting options• Flexographic printing
• Cleaners• Degreasers• Sanitizers• Disinfectants• Ware washing• Hand care• Air fresheners
BUSINESS
PROCESSES
21

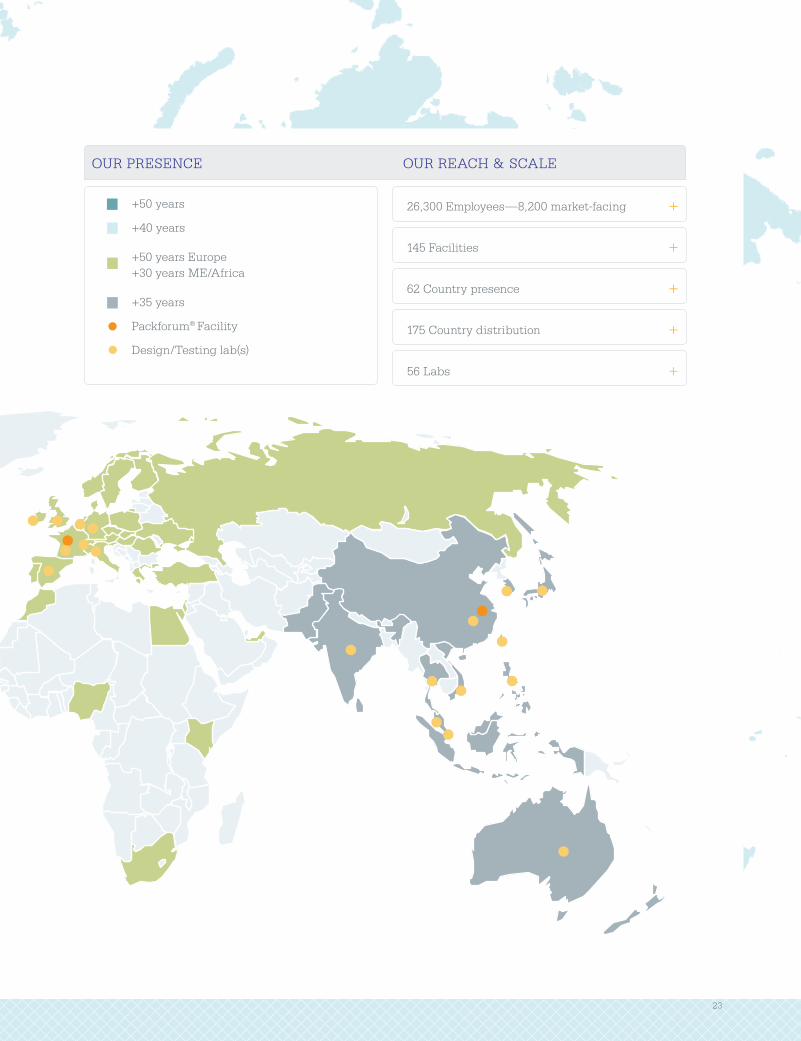
Sealed Air maintains an unparalleled manufacturing footprint and extensive global sales and distribution network that
provides access to over 80% of the world’s population. The integration of Diversey’s expansive international footprint
and strong orientation in developing regions further bolsters our reach and opportunities for growth and improved
customer service levels in many of the fastest growing economies today. Together our global supply chain produces
best-in-class solutions that are delivered safely and on time worldwide, while optimizing the effective use of our assets.
Our established local presence and experience provide both domestic and multinational customers with local market
insight and expertise, as well as the ability to gain from key learnings and innovations sourced from other Sealed Air
regions and businesses. We are also well positioned to maintain high service levels, provide rapid response to
customer needs, and 24/7 maintenance and repair.
GEOGRAPHIC REACH
OUR PRESENCE
+50 years
+40 years
+40 years Europe+25 years ME/Africa
+35 years
Packforum
Design/Testing lab(s)
OUR REACH & SCALE26,000 Employees
138 Facilities
69 Country presence
175 Country distribution
60 Labs
Yagmur Sagnak,
Developing Markets Leader
Emile Chammas,
Senior Vice President,
Chief Supply Chain Officer
OUR FOOTPRINT
“ A diverse team and solid infrastructure in emerging markets allows us to collaborate locally to define new rules for new markets and drive growth.”
Yagmur Sagnak,
Developing Markets Leader
22
OUR PRESENCE
+50 years
+40 years
+40 years Europe+25 years ME/Africa
+35 years
Packforum
Design/Testing lab(s)
OUR REACH & SCALE26,000 Employees
138 Facilities
69 Country presence
175 Country distribution
60 Labs
OUR PRESENCE OUR REACH & SCALE
26,300 Employees—8,200 market-facing +
145 Facilities +
62 Country presence +
175 Country distribution +
56 Labs +
+50 years
+40 years
+50 years Europe+30 years ME/Africa
+35 years
Packforum® Facility
Design/Testing lab(s)
23
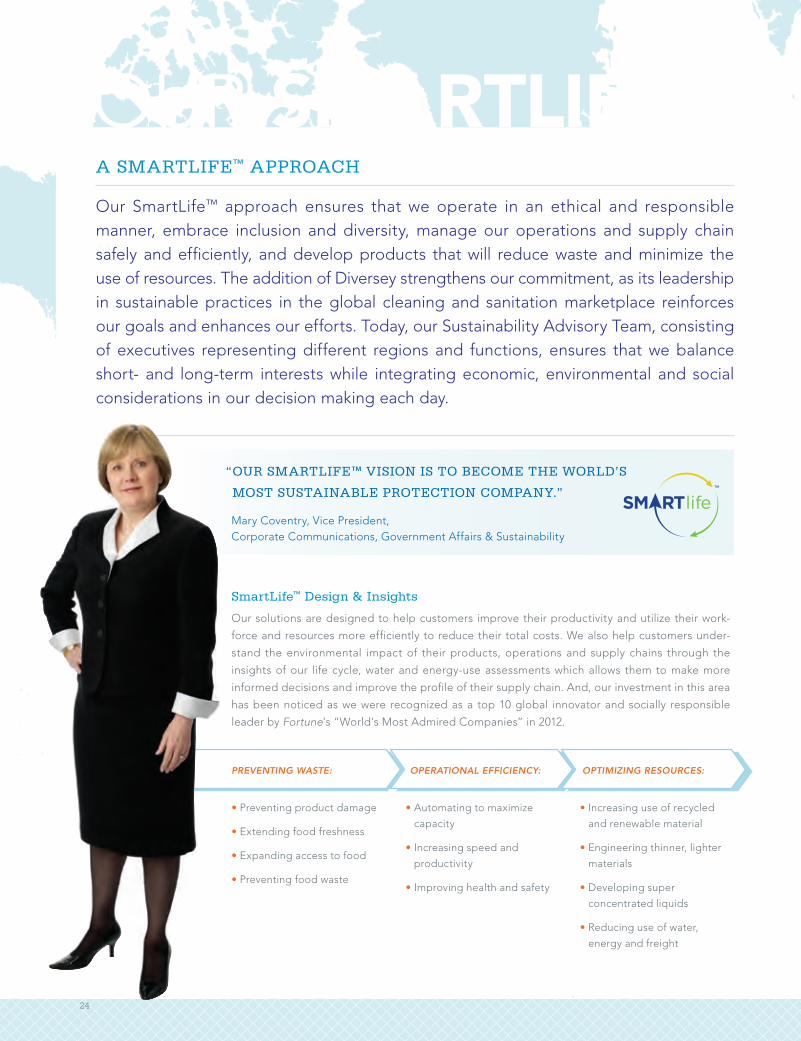
Mary Coventry, Vice President, Corporate Communications, Government Affairs & Sustainability
“ OUR SMARTLIFE™ VISION IS TO BECOME THE WORLD’S
MOST SUSTAINABLE PROTECTION COMPANY.”
• Preventing product damage
• Extending food freshness
• Expanding access to food
• Preventing food waste
• Automating to maximize
capacity
• Increasing speed and
productivity
• Improving health and safety
• Increasing use of recycled
and renewable material
• Engineering thinner, lighter
materials
• Developing super
concentrated liquids
• Reducing use of water,
energy and freight
SmartLife™ Design & Insights
Our solutions are designed to help customers improve their productivity and utilize their work-
force and resources more efficiently to reduce their total costs. We also help customers under-
stand the environmental impact of their products, operations and supply chains through the
insights of our life cycle, water and energy-use assessments which allows them to make more
informed decisions and improve the profile of their supply chain. And, our investment in this area
has been noticed as we were recognized as a top 10 global innovator and socially responsible
leader by Fortune’s “World’s Most Admired Companies” in 2012.
Our SmartLife™ approach ensures that we operate in an ethical and responsible manner, embrace inclusion and diversity, manage our operations and supply chain safely and efficiently, and develop products that will reduce waste and minimize the use of resources. The addition of Diversey strengthens our commitment, as its leadership in sustainable practices in the global cleaning and sanitation marketplace reinforces our goals and enhances our efforts. Today, our Sustainability Advisory Team, consisting of executives representing different regions and functions, ensures that we balance short- and long-term interests while integrating economic, environmental and social considerations in our decision making each day.
A SMARTLIFE™ APPROACH
OUR SMARTLIFE™
PREVENTING WASTE: OPERATIONAL EFFICIENCY: OPTIMIZING RESOURCES:
™
24
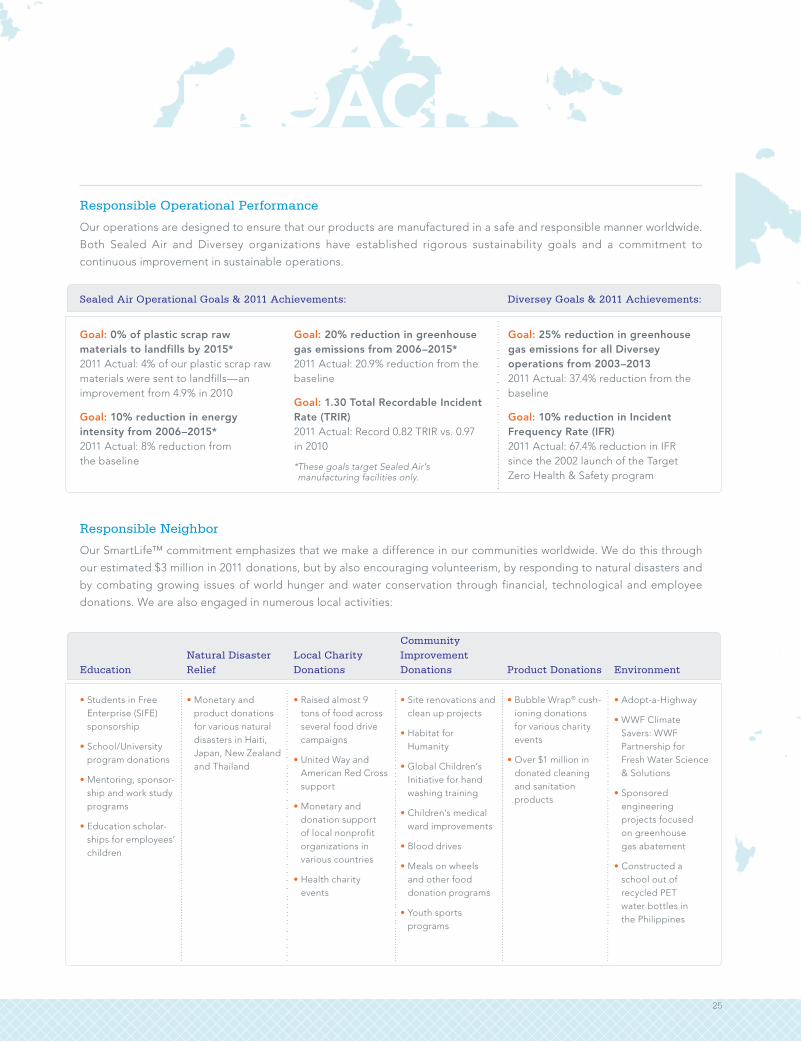
Responsible Operational Performance
Our operations are designed to ensure that our products are manufactured in a safe and responsible manner worldwide.
Both Sealed Air and Diversey organizations have established rigorous sustainability goals and a commitment to
continuous improvement in sustainable operations.
Goal: 0% of plastic scrap raw materials to landfills by 2015*2011 Actual: 4% of our plastic scrap raw materials were sent to landfills—an improvement from 4.9% in 2010
Goal: 10% reduction in energy intensity from 2006–2015*2011 Actual: 8% reduction from the baseline
Goal: 20% reduction in greenhouse gas emissions from 2006–2015*2011 Actual: 20.9% reduction from the baseline
Goal: 1.30 Total Recordable Incident Rate (TRIR)2011 Actual: Record 0.82 TRIR vs. 0.97 in 2010
* These goals target Sealed Air’s manufacturing facilities only.
Goal: 25% reduction in greenhouse gas emissions for all Diversey operations from 2003–20132011 Actual: 37.4% reduction from the baseline
Goal: 10% reduction in Incident Frequency Rate (IFR)2011 Actual: 67.4% reduction in IFR since the 2002 launch of the Target Zero Health & Safety program
Diversey Goals & 2011 Achievements:Sealed Air Operational Goals & 2011 Achievements:
• Students in Free Enterprise (SIFE) sponsorship
• School/University program donations
• Mentoring, sponsor-ship and work study programs
• Education scholar-ships for employees’ children
• Monetary and product donations for various natural disasters in Haiti, Japan, New Zealand and Thailand
• Raised almost 9 tons of food across several food drive campaigns
• United Way and American Red Cross support
• Monetary and donation support of local nonprofit organizations in various countries
• Health charity events
• Site renovations and clean up projects
• Habitat for Humanity
• Global Children’s Initiative for hand washing training
• Children’s medical ward improvements
• Blood drives
• Meals on wheels and other food donation programs
• Youth sports programs
• Bubble Wrap® cush-ioning donations for various charity events
• Over $1 million in donated cleaning and sanitation products
• Adopt-a-Highway
• WWF Climate Savers: WWF Partnership for Fresh Water Science & Solutions
• Sponsored engineering projects focused on greenhouse gas abatement
• Constructed a school out of recycled PET water bottles in the Philippines
Responsible Neighbor
Our SmartLife™ commitment emphasizes that we make a difference in our communities worldwide. We do this through
our estimated $3 million in 2011 donations, but by also encouraging volunteerism, by responding to natural disasters and
by combating growing issues of world hunger and water conservation through financial, technological and employee
donations. We are also engaged in numerous local activities:
Education
Natural Disaster
Relief
Local Charity
Donations
Community
Improvement
Donations Product Donations Environment
APPROACH
25

OUR TEAM
DEAR STOCKHOLDERS:
Over the course of Sealed Air’s fifty-year history, our Board members have developed and maintained a tradition of sound governance and management of the business with the highest standards of business ethics as outlined in Sealed Air’s Code of Conduct. This commitment has led to solid business per-formance, even in challenging economic times.
2011 marked a year of transformation for Sealed Air through our investment in Diversey—a transaction that we believe
provides considerable long-term growth opportunities for the organization and solid value creation for our investors.
Having expanded Sealed Air’s scope and size of operations following the acquisition, the Board enhanced governance
practices to improve the facilitation of the Company’s affairs by creating a Lead Director position and announced my
appointment to this position. We believe that this change will continue to enhance the Company’s corporate gover-
nance practices and more fully align the Company with stockholder interests, particularly as they relate to achieving
the benefits of the recent acquisition.
The Board takes pride in the solid foundation the Company’s leaders have achieved, the reputation of leading gover-
nance practices, and the balanced approach we have tried to consistently apply to align and meet the interests of our
stockholders, customers and employees. We encourage our investors to read our annual report and proxy to become
better acquainted with Sealed Air, to understand our commitment to the business and how we work hard to meet the
interests of all of our stakeholders.
Sincerely,
William J. MarinoLead Director
LETTER FROM OUR LEAD DIRECTOR
26
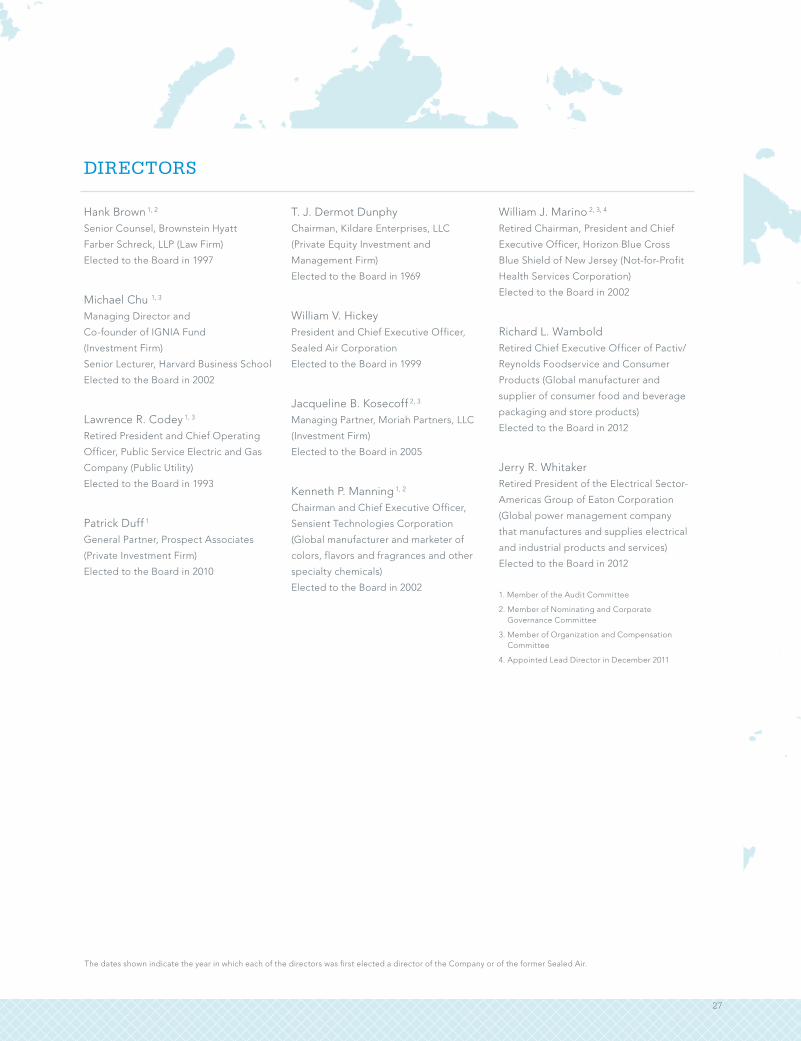
The dates shown indicate the year in which each of the directors was first elected a director of the Company or of the former Sealed Air.
Hank Brown 1, 2
Senior Counsel, Brownstein Hyatt
Farber Schreck, LLP (Law Firm)
Elected to the Board in 1997
Michael Chu 1, 3
Managing Director and
Co-founder of IGNIA Fund
(Investment Firm)
Senior Lecturer, Harvard Business School
Elected to the Board in 2002
Lawrence R. Codey 1, 3
Retired President and Chief Operating
Officer, Public Service Electric and Gas
Company (Public Utility)
Elected to the Board in 1993
Patrick Duff 1
General Partner, Prospect Associates
(Private Investment Firm)
Elected to the Board in 2010
T. J. Dermot DunphyChairman, Kildare Enterprises, LLC
(Private Equity Investment and
Management Firm)
Elected to the Board in 1969
William V. HickeyPresident and Chief Executive Officer,
Sealed Air Corporation
Elected to the Board in 1999
Jacqueline B. Kosecoff 2, 3
Managing Partner, Moriah Partners, LLC
(Investment Firm)
Elected to the Board in 2005
Kenneth P. Manning 1, 2
Chairman and Chief Executive Officer,
Sensient Technologies Corporation
(Global manufacturer and marketer of
colors, flavors and fragrances and other
specialty chemicals)
Elected to the Board in 2002
William J. Marino 2, 3, 4
Retired Chairman, President and Chief
Executive Officer, Horizon Blue Cross
Blue Shield of New Jersey (Not-for-Profit
Health Services Corporation)
Elected to the Board in 2002
Richard L. WamboldRetired Chief Executive Officer of Pactiv/
Reynolds Foodservice and Consumer
Products (Global manufacturer and
supplier of consumer food and beverage
packaging and store products)
Elected to the Board in 2012
Jerry R. WhitakerRetired President of the Electrical Sector-
Americas Group of Eaton Corporation
(Global power management company
that manufactures and supplies electrical
and industrial products and services)
Elected to the Board in 2012
1. Member of the Audit Committee
2. Member of Nominating and Corporate Governance Committee
3. Member of Organization and Compensation Committee
4. Appointed Lead Director in December 2011
DIRECTORS
27

OUR TEAM
The dates shown indicate the year in which each of the officers was first elected an officer of the Company or of the former Sealed Air.
OFFICERS
William V. HickeyPresident and Chief Executive OfficerFirst elected an officer in 1980
Tod S. ChristieTreasurer and Interim Chief Financial OfficerFirst elected an officer in 1999
Emile Z. ChammasSenior Vice PresidentFirst elected an officer in 2010
Jonathan B. BakerVice PresidentFirst elected an officer in 1994
Pedro ChidichimoVice PresidentFirst elected an officer in 2012
Mary A. CoventryVice PresidentFirst elected an officer in 1994
Karl R. DeilyVice PresidentFirst elected an officer in 2006
Jean-Marie DeméautisVice PresidentFirst elected an officer in 2006
J. Ryan FlanaganVice PresidentFirst elected an officer in 2009
Warren J. KudmanVice PresidentFirst elected an officer in 2009
James P. MixVice PresidentFirst elected an officer in 1994
Manuel MondragónVice PresidentFirst elected an officer in 1999
Larry PilloteVice PresidentFirst elected an officer in 2010
Ruth RoperVice PresidentFirst elected an officer in 2004
Yagmur SagnakVice PresidentFirst elected an officer in 2012
Dr. Ann C. SavocaVice PresidentFirst elected an officer in 2008
H. Katherine WhiteVice President, General Counsel and SecretaryFirst elected an officer in 1996
Christopher C. WoodbridgeVice PresidentFirst elected an officer in 2005
Jeffrey S. WarrenControllerFirst elected an officer in 1996
OFFICERS
From left to right: Chip Cook (Sales & Customer Service), Pedro Chidichimo (Diversey, Institutional & Laundry), Warren Kudman (CIO), Ruth Roper (Strategy), Tod Christie (Treasurer & Interim CFO), Emile Chammas (Supply Chain), Ann Savoca (T&I), Bill Hickey (President & CEO), Jean-Marie Deméautis (Marketing), Katherine White (Law), Mary Coventry (Corporate Communications & Sustainability), Ryan Flanagan (Protective Packaging), Karl Deily (Food and Beverage), Yagmur Sagnak (Diversey, Emerging Markets). Not pictured: Larry Pillote (Equipment, Automation & Integration)
SENIOR MANAGEMENT TEAM
28
CAUTIONARY NOTICE REGARDING FORWARD-LOOKING STATEMENTS
This annual report contains “forward-looking statements” within the meaning of the Private Securities Litigation Reform Act of 1995 concerning our business, consolidated financial condition and results of operations. All statements other than statements of historical facts included in this report regarding our strategies, prospects, financial condition, costs, plans and objectives are forward-looking statements. The SEC encourages companies to disclose forward-looking statements so that investors can better understand a company’s future prospects and make informed investment decisions. Some of our statements in this report, in documents incorporated by reference into this report and in our future oral and written state-ments may be forward-looking. These statements reflect our beliefs and expectations as to future events and trends affect-ing our business, our consolidated financial condition and results of operations. These forward-looking statements are based upon our current expectations concerning future events and discuss, among other things, anticipated future financial performance and future business plans. Forward-looking statements are necessarily subject to risks and uncertainties, many of which are outside our control, that could cause actual results to differ materially from these statements. Forward-looking statements can be identified by such words as “anticipates,” “believes,” “plan,” “assumes,” “could,” “should,” “estimates,” “expects,” “intends,” “potential,” “seek,” “predict,” “may,” “will” and similar expressions.
The following are important factors that we believe could cause actual results to differ materially from those in our forward-looking statements: the implementation of our Settlement agreement regarding the various asbestos-related, fraudulent transfer, successor liability, and indemnification claims made against the Company arising from a 1998 transaction with W. R. Grace & Co.; global economic conditions; credit ratings; changes in raw material pricing and availability; changes in energy costs; competitive conditions and contract terms; currency translation and devaluation effects, including in Venezuela; the success of our financial growth, profitability, cash generation and manufacturing strategies and our cost reduction and productivity efforts; the effects of animal and food-related health issues; pandemics; consumer preferences; environmental matters; regulatory actions and legal matters; successful integration and other information included in our Annual Report on Form 10-K under Item 1A, “Risk Factors.” Except as required by the federal securities laws, we undertake no obligation to update or revise any forward-looking statement, whether as a result of new information, future events or otherwise.
In our annual report, we present financial information in accordance with U.S. GAAP. In addition, we present financial infor-mation that does not conform to U.S. GAAP, which we refer to as non-U.S. GAAP, as our management believes it is useful to investors. In addition, non-U.S. GAAP measures are used by management to review and analyze our operating performance and, along with other data, as internal measures for setting annual budgets and forecasts, assessing financial performance, providing guidance and comparing our financial performance with our peers. The non-U.S. GAAP information has limitations as an analytical tool and should not be considered in isolation from or as a substitute for U.S. GAAP information. It does not purport to represent any similarly titled U.S. GAAP information and is not an indicator of our performance under U.S. GAAP. Further, non-U.S. GAAP financial measures that we present may not be comparable with similarly titled measures used by others. Investors are cautioned against placing undue reliance on these non-U.S. GAAP measures. Further, investors are urged to review and consider carefully the adjustments made by management to the most directly comparable U.S. GAAP financial measure to arrive at these non-U.S. GAAP financial measures.
Our management may assess our financial results, such as gross profit, operating profit and diluted net earnings per com-mon share (“EPS”), both on a U.S. GAAP basis and on an adjusted non-U.S. GAAP basis. Examples of some other supple-mental financial metrics our management will also use to assess our financial performance include Earnings before Interest Expense, Taxes, Depreciation and Amortization (“EBITDA”), Adjusted EBITDA, Adjusted EPS, Adjusted Cash EPS and Free Cash Flow. These non-U.S. GAAP financial measures provide management with additional means to understand and evalu-ate the core operating results and trends in our ongoing business by eliminating certain one-time expenses and/or gains (which may not occur in each period presented) and other items that management believes might otherwise make compari-sons of our ongoing business with prior periods and peers more difficult, obscure trends in ongoing operations or reduce management’s ability to make useful forecasts. Our non-U.S. GAAP financial measures may also be considered in calcula-tions of our performance measures set by the Organization and Compensation Committee of our Board of Directors for purposes of determining incentive compensation.
The non-U.S. GAAP financial metrics mentioned above exclude items we consider unusual or special items and also exclude their related tax effects. We evaluate the unusual or special items on an individual basis. Our evaluation of whether to exclude an unusual or special item for purposes of determining our non-U.S. GAAP financial measures considers both the quantitative and qualitative aspects of the item, including, among other things (i) its nature, (ii) whether or not it relates to our ongoing business operations, and (iii) whether or not we expect it to occur as part of our normal business on a regular basis.
DEFINITIONS AND RECONCILIATIONS OF NON-U.S. GAAP FINANCIAL MEASURES
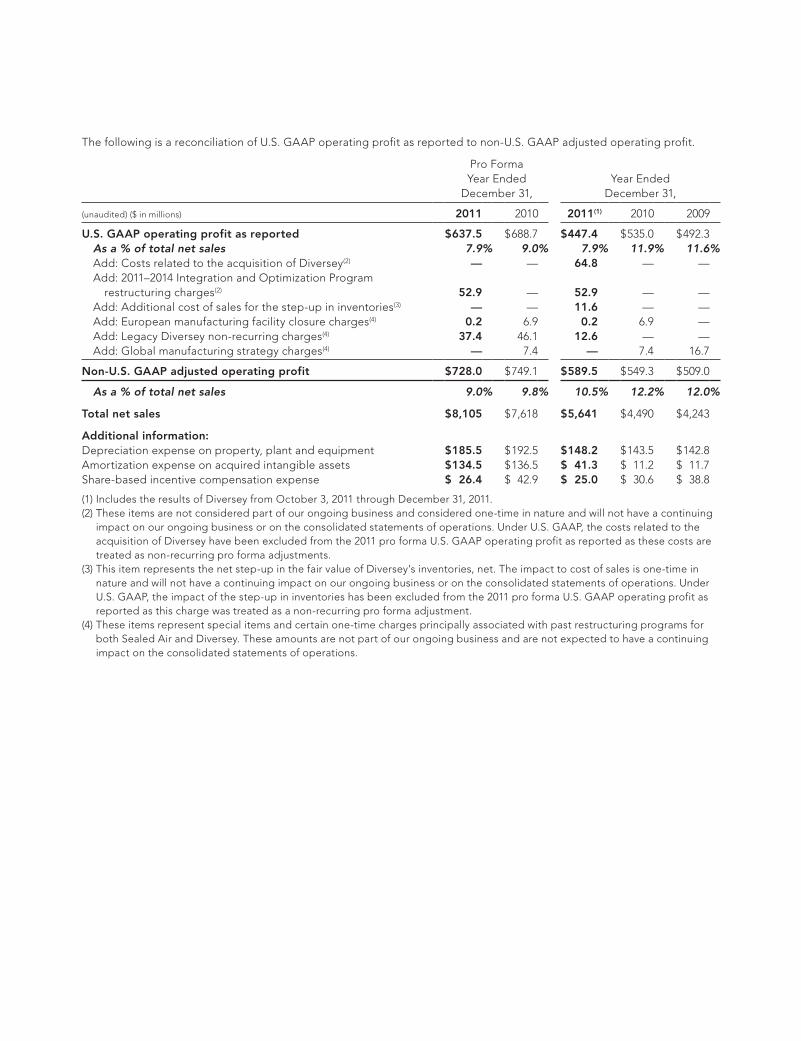
The following is a reconciliation of U.S. GAAP operating profit as reported to non-U.S. GAAP adjusted operating profit.
Pro Forma Year Ended
December 31,Year Ended
December 31,
(unaudited) ($ in millions) 2011 2010 2011(1) 2010 2009
U.S. GAAP operating profit as reported $ 637.5 $ 688.7 $ 447.4 $ 535.0 $ 492.3 As a % of total net sales 7.9% 9.0% 7.9% 11.9% 11.6% Add: Costs related to the acquisition of Diversey(2) — — 64.8 — — Add: 2011–2014 Integration and Optimization Program
restructuring charges(2) 52.9 — 52.9 — — Add: Additional cost of sales for the step-up in inventories(3) — — 11.6 — — Add: European manufacturing facility closure charges(4) 0.2 6.9 0.2 6.9 — Add: Legacy Diversey non-recurring charges(4) 37.4 46.1 12.6 — — Add: Global manufacturing strategy charges(4) — 7.4 — 7.4 16.7
Non-U.S. GAAP adjusted operating profit $ 728.0 $ 749.1 $ 589.5 $ 549.3 $ 509.0
As a % of total net sales 9.0% 9.8% 10.5% 12.2% 12.0%
Total net sales $ 8,105 $ 7,618 $ 5,641 $ 4,490 $ 4,243
Additional information:Depreciation expense on property, plant and equipment $ 185.5 $ 192.5 $ 148.2 $ 143.5 $ 142.8Amortization expense on acquired intangible assets $ 134.5 $ 136.5 $ 41.3 $ 11.2 $ 11.7Share-based incentive compensation expense $ 26.4 $ 42.9 $ 25.0 $ 30.6 $ 38.8
(1) Includes the results of Diversey from October 3, 2011 through December 31, 2011.(2) These items are not considered part of our ongoing business and considered one-time in nature and will not have a continuing
impact on our ongoing business or on the consolidated statements of operations. Under U.S. GAAP, the costs related to the acquisition of Diversey have been excluded from the 2011 pro forma U.S. GAAP operating profit as reported as these costs are treated as non-recurring pro forma adjustments.
(3) This item represents the net step-up in the fair value of Diversey’s inventories, net. The impact to cost of sales is one-time in nature and will not have a continuing impact on our ongoing business or on the consolidated statements of operations. Under U.S. GAAP, the impact of the step-up in inventories has been excluded from the 2011 pro forma U.S. GAAP operating profit as reported as this charge was treated as a non-recurring pro forma adjustment.
(4) These items represent special items and certain one-time charges principally associated with past restructuring programs for both Sealed Air and Diversey. These amounts are not part of our ongoing business and are not expected to have a continuing impact on the consolidated statements of operations.
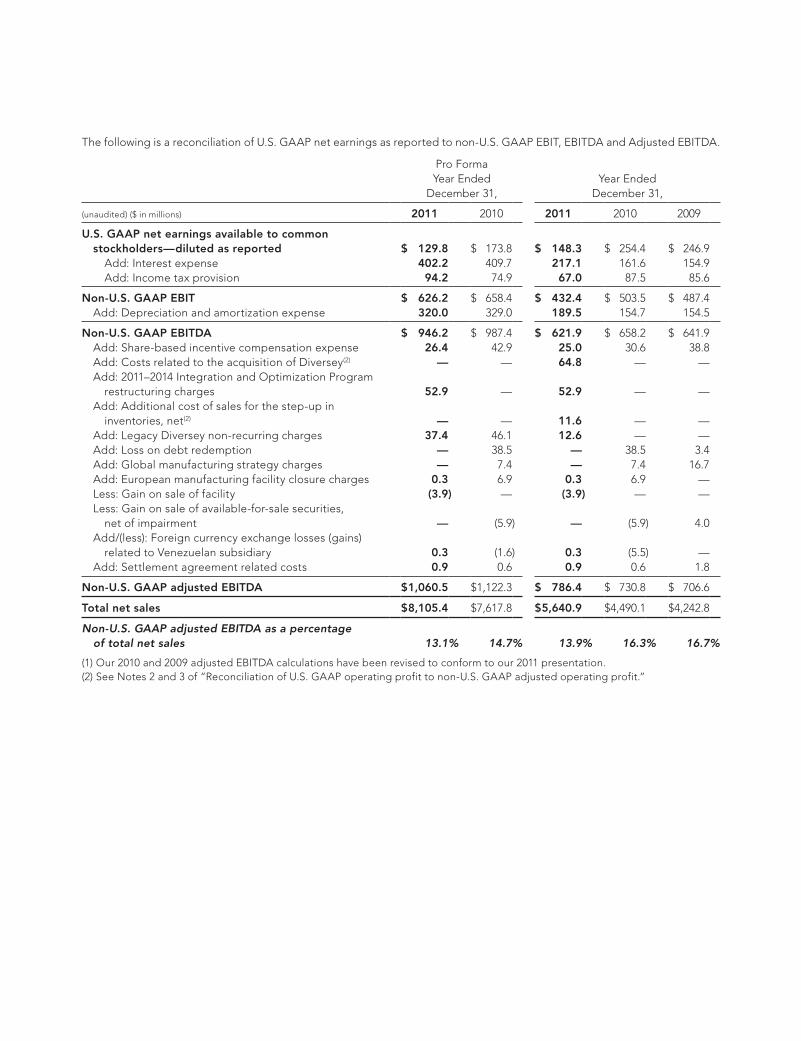
The following is a reconciliation of U.S. GAAP net earnings as reported to non-U.S. GAAP EBIT, EBITDA and Adjusted EBITDA.
Pro Forma Year Ended
December 31,Year Ended
December 31,
(unaudited) ($ in millions) 2011 2010 2011 2010 2009
U.S. GAAP net earnings available to common stockholders—diluted as reported $ 129.8 $ 173.8 $ 148.3 $ 254.4 $ 246.9 Add: Interest expense 402.2 409.7 217.1 161.6 154.9 Add: Income tax provision 94.2 74.9 67.0 87.5 85.6
Non-U.S. GAAP EBIT $ 626.2 $ 658.4 $ 432.4 $ 503.5 $ 487.4 Add: Depreciation and amortization expense 320.0 329.0 189.5 154.7 154.5
Non-U.S. GAAP EBITDA $ 946.2 $ 987.4 $ 621.9 $ 658.2 $ 641.9 Add: Share-based incentive compensation expense 26.4 42.9 25.0 30.6 38.8 Add: Costs related to the acquisition of Diversey(2) — — 64.8 — — Add: 2011–2014 Integration and Optimization Program
restructuring charges 52.9 — 52.9 — — Add: Additional cost of sales for the step-up in
inventories, net(2) — — 11.6 — — Add: Legacy Diversey non-recurring charges 37.4 46.1 12.6 — — Add: Loss on debt redemption — 38.5 — 38.5 3.4 Add: Global manufacturing strategy charges — 7.4 — 7.4 16.7 Add: European manufacturing facility closure charges 0.3 6.9 0.3 6.9 — Less: Gain on sale of facility (3.9) — (3.9) — — Less: Gain on sale of available-for-sale securities,
net of impairment — (5.9) — (5.9) 4.0 Add/(less): Foreign currency exchange losses (gains)
related to Venezuelan subsidiary 0.3 (1.6) 0.3 (5.5) — Add: Settlement agreement related costs 0.9 0.6 0.9 0.6 1.8
Non-U.S. GAAP adjusted EBITDA $ 1,060.5 $ 1,122.3 $ 786.4 $ 730.8 $ 706.6
Total net sales $ 8,105.4 $ 7,617.8 $ 5,640.9 $ 4,490.1 $ 4,242.8
Non-U.S. GAAP adjusted EBITDA as a percentage of total net sales 13.1% 14.7% 13.9% 16.3% 16.7%
(1) Our 2010 and 2009 adjusted EBITDA calculations have been revised to conform to our 2011 presentation.(2) See Notes 2 and 3 of “Reconciliation of U.S. GAAP operating profit to non-U.S. GAAP adjusted operating profit.”
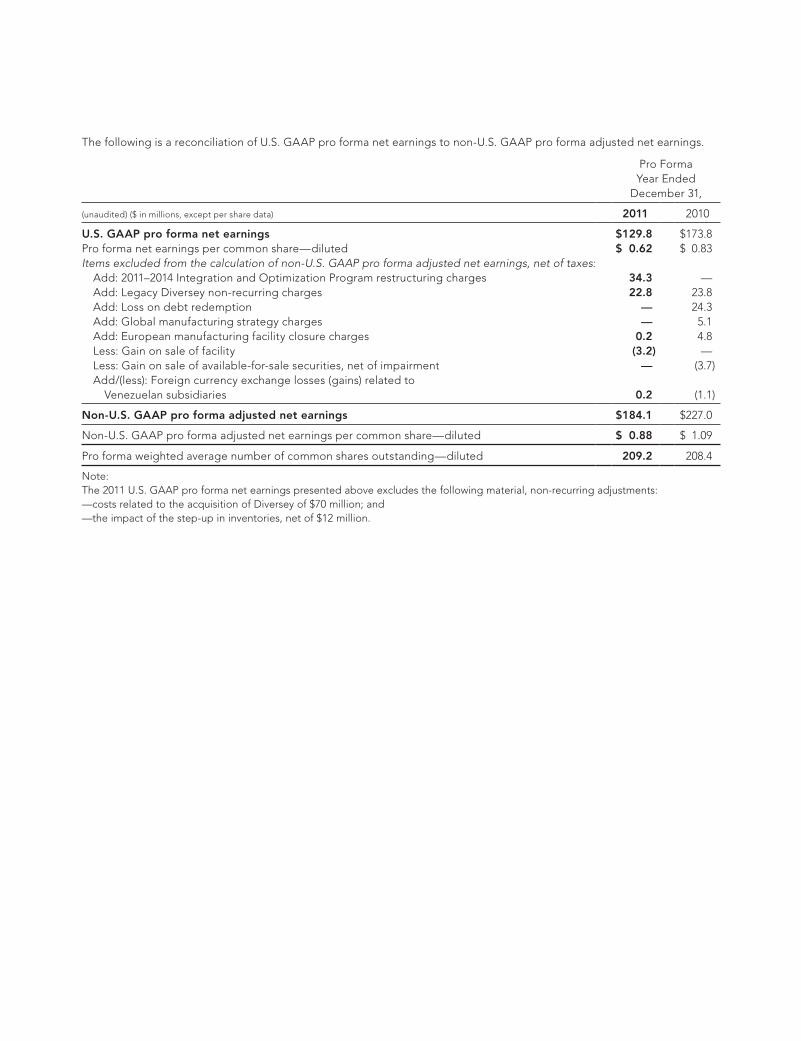
The following is a reconciliation of U.S. GAAP pro forma net earnings to non-U.S. GAAP pro forma adjusted net earnings.
Pro Forma Year Ended
December 31,
(unaudited) ($ in millions, except per share data) 2011 2010
U.S. GAAP pro forma net earnings $129.8 $173.8Pro forma net earnings per common share—diluted $ 0.62 $ 0.83Items excluded from the calculation of non-U.S. GAAP pro forma adjusted net earnings, net of taxes: Add: 2011–2014 Integration and Optimization Program restructuring charges 34.3 — Add: Legacy Diversey non-recurring charges 22.8 23.8 Add: Loss on debt redemption — 24.3 Add: Global manufacturing strategy charges — 5.1 Add: European manufacturing facility closure charges 0.2 4.8 Less: Gain on sale of facility (3.2) — Less: Gain on sale of available-for-sale securities, net of impairment — (3.7) Add/(less): Foreign currency exchange losses (gains) related to
Venezuelan subsidiaries 0.2 (1.1)
Non-U.S. GAAP pro forma adjusted net earnings $184.1 $227.0
Non-U.S. GAAP pro forma adjusted net earnings per common share—diluted $ 0.88 $ 1.09
Pro forma weighted average number of common shares outstanding—diluted 209.2 208.4
Note:The 2011 U.S. GAAP pro forma net earnings presented above excludes the following material, non-recurring adjustments:—costs related to the acquisition of Diversey of $70 million; and —the impact of the step-up in inventories, net of $12 million.
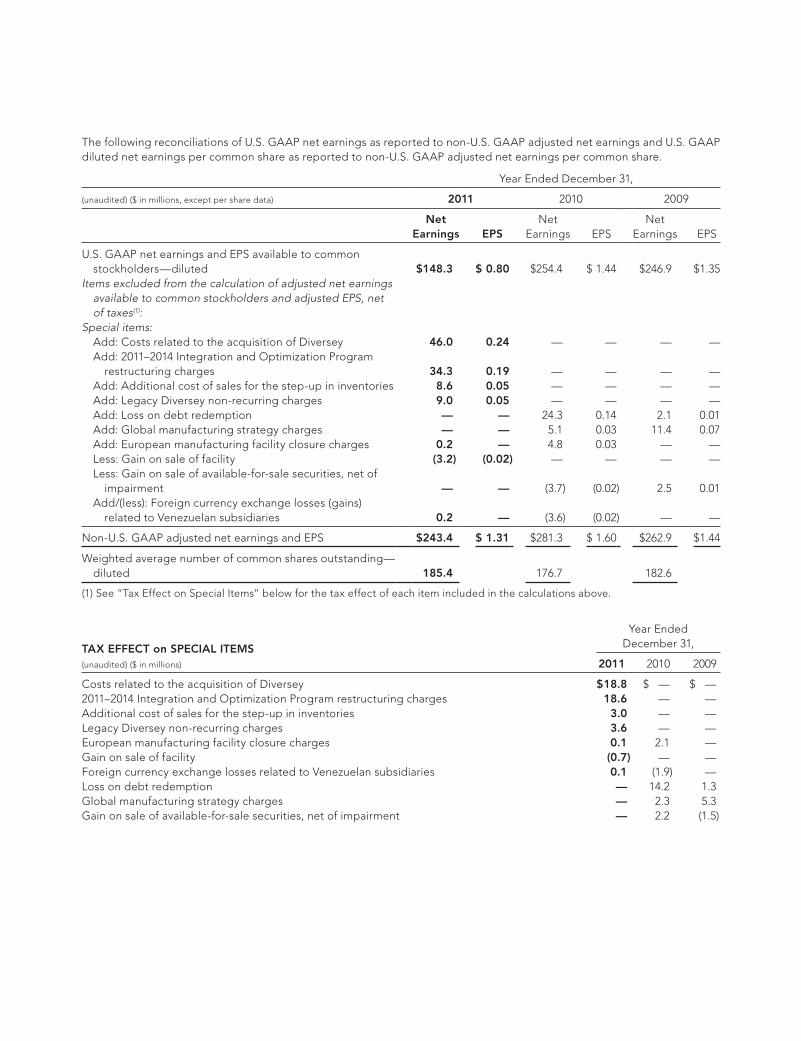
The following reconciliations of U.S. GAAP net earnings as reported to non-U.S. GAAP adjusted net earnings and U.S. GAAP diluted net earnings per common share as reported to non-U.S. GAAP adjusted net earnings per common share.
Year Ended December 31,
(unaudited) ($ in millions, except per share data) 2011 2010 2009
Net Earnings EPS
Net Earnings EPS
Net Earnings EPS
U.S. GAAP net earnings and EPS available to common stockholders—diluted $148.3 $ 0.80 $254.4 $ 1.44 $246.9 $ 1.35Items excluded from the calculation of adjusted net earnings available to common stockholders and adjusted EPS, net
of taxes(1):Special items: Add: Costs related to the acquisition of Diversey 46.0 0.24 — — — — Add: 2011–2014 Integration and Optimization Program
restructuring charges 34.3 0.19 — — — — Add: Additional cost of sales for the step-up in inventories 8.6 0.05 — — — — Add: Legacy Diversey non-recurring charges 9.0 0.05 — — — — Add: Loss on debt redemption — — 24.3 0.14 2.1 0.01 Add: Global manufacturing strategy charges — — 5.1 0.03 11.4 0.07 Add: European manufacturing facility closure charges 0.2 — 4.8 0.03 — — Less: Gain on sale of facility (3.2) (0.02) — — — — Less: Gain on sale of available-for-sale securities, net of
impairment — — (3.7) (0.02) 2.5 0.01 Add/(less): Foreign currency exchange losses (gains)
related to Venezuelan subsidiaries 0.2 — (3.6) (0.02) — —
Non-U.S. GAAP adjusted net earnings and EPS $243.4 $ 1.31 $281.3 $ 1.60 $262.9 $ 1.44
Weighted average number of common shares outstanding— diluted 185.4 176.7 182.6
(1) See “Tax Effect on Special Items” below for the tax effect of each item included in the calculations above.
TAX EFFECT on SPECIAL ITEMS
Year Ended December 31,
(unaudited) ($ in millions) 2011 2010 2009
Costs related to the acquisition of Diversey $ 18.8 $ — $ —2011–2014 Integration and Optimization Program restructuring charges 18.6 — —Additional cost of sales for the step-up in inventories 3.0 — —Legacy Diversey non-recurring charges 3.6 — —European manufacturing facility closure charges 0.1 2.1 —Gain on sale of facility (0.7) — —Foreign currency exchange losses related to Venezuelan subsidiaries 0.1 (1.9) —Loss on debt redemption — 14.2 1.3Global manufacturing strategy charges — 2.3 5.3Gain on sale of available-for-sale securities, net of impairment — 2.2 (1.5)
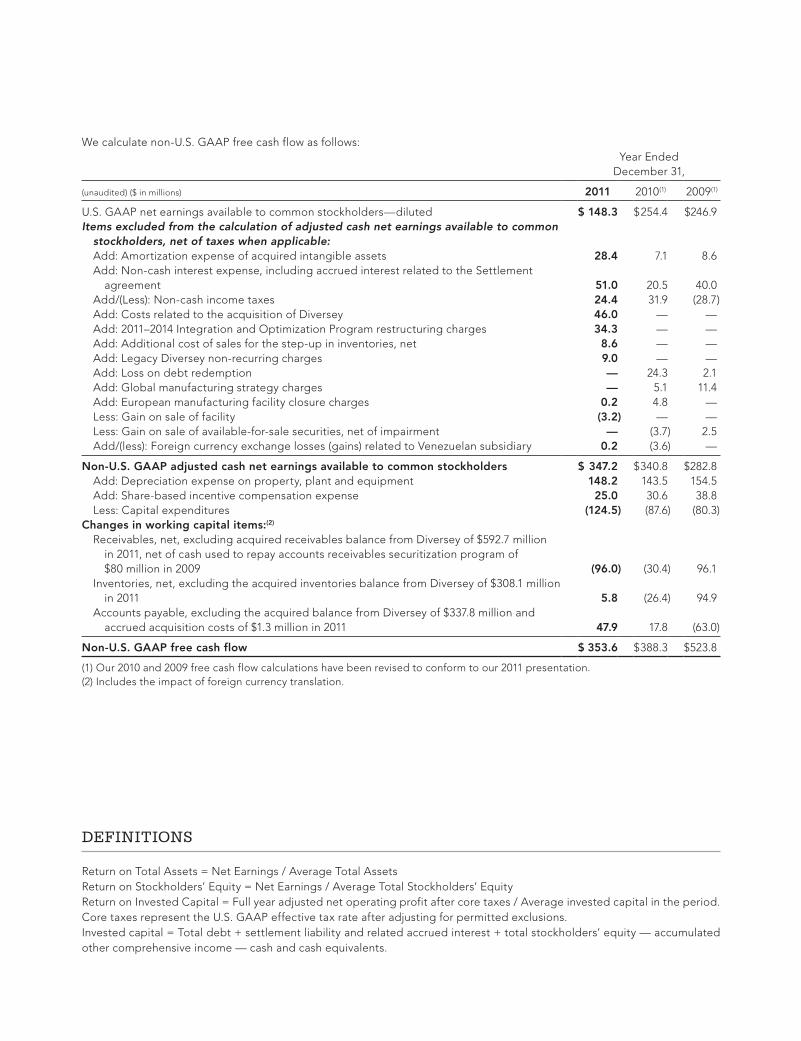
Return on Total Assets = Net Earnings / Average Total AssetsReturn on Stockholders’ Equity = Net Earnings / Average Total Stockholders’ EquityReturn on Invested Capital = Full year adjusted net operating profit after core taxes / Average invested capital in the period. Core taxes represent the U.S. GAAP effective tax rate after adjusting for permitted exclusions.Invested capital = Total debt + settlement liability and related accrued interest + total stockholders’ equity — accumulated other comprehensive income — cash and cash equivalents.
DEFINITIONS
We calculate non-U.S. GAAP free cash flow as follows:Year Ended
December 31,
(unaudited) ($ in millions) 2011 2010(1) 2009(1)
U.S. GAAP net earnings available to common stockholders—diluted $ 148.3 $ 254.4 $246.9Items excluded from the calculation of adjusted cash net earnings available to common stockholders, net of taxes when applicable: Add: Amortization expense of acquired intangible assets 28.4 7.1 8.6 Add: Non-cash interest expense, including accrued interest related to the Settlement
agreement 51.0 20.5 40.0 Add/(Less): Non-cash income taxes 24.4 31.9 (28.7) Add: Costs related to the acquisition of Diversey 46.0 — — Add: 2011–2014 Integration and Optimization Program restructuring charges 34.3 — — Add: Additional cost of sales for the step-up in inventories, net 8.6 — — Add: Legacy Diversey non-recurring charges 9.0 — — Add: Loss on debt redemption — 24.3 2.1 Add: Global manufacturing strategy charges — 5.1 11.4 Add: European manufacturing facility closure charges 0.2 4.8 — Less: Gain on sale of facility (3.2) — — Less: Gain on sale of available-for-sale securities, net of impairment — (3.7) 2.5 Add/(less): Foreign currency exchange losses (gains) related to Venezuelan subsidiary 0.2 (3.6) —
Non-U.S. GAAP adjusted cash net earnings available to common stockholders $ 347.2 $ 340.8 $282.8 Add: Depreciation expense on property, plant and equipment 148.2 143.5 154.5 Add: Share-based incentive compensation expense 25.0 30.6 38.8 Less: Capital expenditures (124.5) (87.6) (80.3)Changes in working capital items:(2)
Receivables, net, excluding acquired receivables balance from Diversey of $592.7 million in 2011, net of cash used to repay accounts receivables securitization program of
$80 million in 2009 (96.0) (30.4) 96.1 Inventories, net, excluding the acquired inventories balance from Diversey of $308.1 million
in 2011 5.8 (26.4) 94.9 Accounts payable, excluding the acquired balance from Diversey of $337.8 million and
accrued acquisition costs of $1.3 million in 2011 47.9 17.8 (63.0)
Non-U.S. GAAP free cash flow $ 353.6 $ 388.3 $523.8
(1) Our 2010 and 2009 free cash flow calculations have been revised to conform to our 2011 presentation.(2) Includes the impact of foreign currency translation.
FORM 10–K
UNITED STATES SECURITIES AND EXCHANGE COMMISSIONWashington, D.C. 20549
Form 10-K(Mark One)
Í ANNUAL REPORT PURSUANT TO SECTION 13 OR 15(d) OF THE SECURITIES EXCHANGE ACT OF 1934For the fiscal year ended December 31, 2011
Or‘ TRANSITION REPORT PURSUANT TO SECTION 13 OR 15(d) OF THE SECURITIES EXCHANGE ACT OF 1934
For the transition period from to
Commission file number 1-12139
SEALED AIR CORPORATION(Exact name of registrant as specified in its charter)
Delaware 65-0654331(State or other jurisdiction of
incorporation or organization)(I.R.S. Employer
Identification Number)
200 Riverfront Boulevard,Elmwood Park, New Jersey 07407-1033
(Address of principal executive offices) (Zip Code)
Registrant’s telephone number, including area code: (201) 791-7600
Securities registered pursuant to Section 12(b) of the Act:Title of Each Class Name of Each Exchange on Which Registered
Common Stock, par value $0.10 per share New York Stock Exchange
Securities registered pursuant to Section 12(g) of the Act:None
Indicate by check mark if the registrant is a well-known seasoned issuer, as defined in Rule 405 of the SecuritiesAct. Yes Í No ‘
Indicate by check mark if the registrant is not required to file reports pursuant to Section 13 or Section 15(d) of the ExchangeAct. Yes ‘ No Í
Indicate by check mark whether the registrant (1) has filed all reports required to be filed by Section 13 or 15(d) of the SecuritiesExchange Act of 1934 during the preceding 12 months (or for such shorter period that the registrant was required to file such reports),and (2) has been subject to such filing requirements for the past 90 days. Yes Í No ‘
Indicate by check mark whether the registrant has submitted electronically and posted on its corporate Website, if any, everyInteractive Data File required to be submitted and posted pursuant to Rule 405 of Regulation S-T (§ 232.405 of this chapter) duringthe preceding 12 months (or for such shorter period that the registrant was required to submit and post such files). Yes Í No ‘
Indicate by check mark if disclosure of delinquent filers pursuant to Item 405 of Regulation S-K (§ 229.405 of this chapter) is notcontained herein, and will not be contained, to the best of registrant’s knowledge, in definitive proxy or information statementsincorporated by reference in Part III of this Form 10-K or any amendment to this Form 10-K. Í
Indicate by check mark whether the registrant is a large accelerated filer, an accelerated filer, a non-accelerated filer, or a smallerreporting company. See the definitions of “large accelerated filer,” “accelerated filer” and “smaller reporting company” in Rule 12b-2of the Exchange Act. (Check one):
Large accelerated filer Í Accelerated filer ‘ Non-accelerated filer ‘ Smaller reporting company ‘
(Do not check if a smaller reporting company)
Indicate by check mark whether the registrant is a shell company (as defined in Rule 12b-2 of the Exchange Act).Yes ‘ No Í
As of the last business day of the registrant’s most recently completed second fiscal quarter, June 30, 2011, the aggregate marketvalue of the registrant’s common stock held by non-affiliates of the registrant was approximately $3,727,000,000, based on theclosing sale price as reported on the New York Stock Exchange.
There were 192,055,662 shares of the registrant’s common stock, par value $0.10 per share, issued and outstanding as ofJanuary 31, 2012.
DOCUMENTS INCORPORATED BY REFERENCE:
Portions of the registrant’s definitive proxy statement for its 2012 Annual Meeting of Stockholders, to be held on May 17, 2012,are incorporated by reference into Part II and Part III of this Form 10-K.
SEALED AIR CORPORATION AND SUBSIDIARIES
Table of Contents
PART IItem 1. Business . . . . . . . . . . . . . . . . . . . . . . . . . . . . . . . . . . . . . . . . . . . . . . . . . . . . . . . . . . . . . . . . . . . . 1
Item 1A. Risk Factors . . . . . . . . . . . . . . . . . . . . . . . . . . . . . . . . . . . . . . . . . . . . . . . . . . . . . . . . . . . . . . . . . 13
Item 1B. Unresolved Staff Comments . . . . . . . . . . . . . . . . . . . . . . . . . . . . . . . . . . . . . . . . . . . . . . . . . . . . . 27
Item 2. Properties . . . . . . . . . . . . . . . . . . . . . . . . . . . . . . . . . . . . . . . . . . . . . . . . . . . . . . . . . . . . . . . . . . . 27
Item 3. Legal Proceedings . . . . . . . . . . . . . . . . . . . . . . . . . . . . . . . . . . . . . . . . . . . . . . . . . . . . . . . . . . . . . 28
Item 4. Mine Safety Disclosures . . . . . . . . . . . . . . . . . . . . . . . . . . . . . . . . . . . . . . . . . . . . . . . . . . . . . . . . 28
PART IIItem 5. Market for Registrant’s Common Equity, Related Stockholder Matters and Issuer Purchases
of Equity Securities . . . . . . . . . . . . . . . . . . . . . . . . . . . . . . . . . . . . . . . . . . . . . . . . . . . . . . . . . . . 29
Item 6. Selected Financial Data . . . . . . . . . . . . . . . . . . . . . . . . . . . . . . . . . . . . . . . . . . . . . . . . . . . . . . . . 32
Item 7. Management’s Discussion and Analysis of Financial Condition and Results of Operations . . . 33
Cautionary Notice Regarding Forward-Looking Statements . . . . . . . . . . . . . . . . . . . . . . . . . . . 33
Item 7A. Quantitative and Qualitative Disclosures About Market Risk . . . . . . . . . . . . . . . . . . . . . . . . . . . 64
Item 8. Financial Statements and Supplementary Data . . . . . . . . . . . . . . . . . . . . . . . . . . . . . . . . . . . . . . 67
Item 9. Changes in and Disagreements With Accountants on Accounting and Financial Disclosure . . . 140
Item 9A. Controls and Procedures . . . . . . . . . . . . . . . . . . . . . . . . . . . . . . . . . . . . . . . . . . . . . . . . . . . . . . . . 140
Item 9B. Other Information . . . . . . . . . . . . . . . . . . . . . . . . . . . . . . . . . . . . . . . . . . . . . . . . . . . . . . . . . . . . . 140
PART IIIItem 10. Directors, Executive Officers and Corporate Governance . . . . . . . . . . . . . . . . . . . . . . . . . . . . . . 141
Item 11. Executive Compensation . . . . . . . . . . . . . . . . . . . . . . . . . . . . . . . . . . . . . . . . . . . . . . . . . . . . . . . 143
Item 12. Security Ownership of Certain Beneficial Owners and Management and Related StockholderMatters . . . . . . . . . . . . . . . . . . . . . . . . . . . . . . . . . . . . . . . . . . . . . . . . . . . . . . . . . . . . . . . . . . . . . 143
Item 13. Certain Relationships and Related Transactions, and Director Independence . . . . . . . . . . . . . . . 143
Item 14. Principal Accounting Fees and Services . . . . . . . . . . . . . . . . . . . . . . . . . . . . . . . . . . . . . . . . . . . 143
PART IVItem 15. Exhibits and Financial Statement Schedules . . . . . . . . . . . . . . . . . . . . . . . . . . . . . . . . . . . . . . . . 144
Signatures . . . . . . . . . . . . . . . . . . . . . . . . . . . . . . . . . . . . . . . . . . . . . . . . . . . . . . . . . . . . . . . . . . . . . . . . . . . . . 151
i
PART I
Item 1. Business
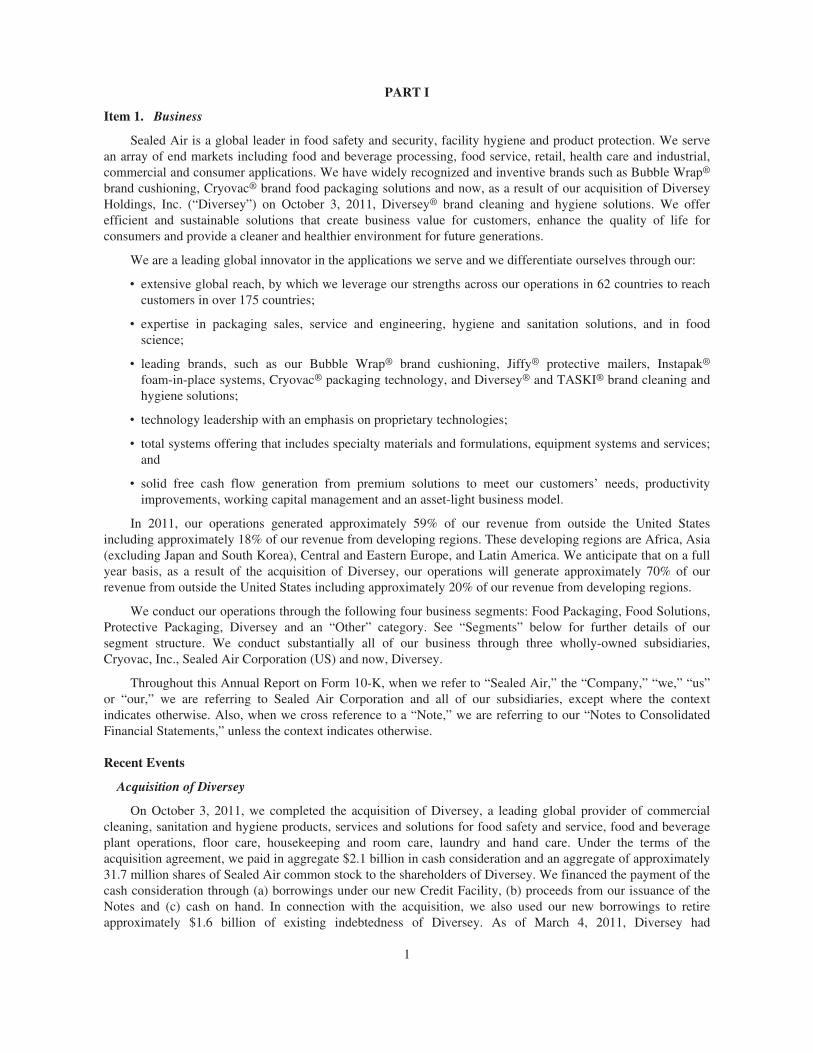
Sealed Air is a global leader in food safety and security, facility hygiene and product protection. We servean array of end markets including food and beverage processing, food service, retail, health care and industrial,commercial and consumer applications. We have widely recognized and inventive brands such as Bubble Wrap®
brand cushioning, Cryovac® brand food packaging solutions and now, as a result of our acquisition of DiverseyHoldings, Inc. (“Diversey”) on October 3, 2011, Diversey® brand cleaning and hygiene solutions. We offerefficient and sustainable solutions that create business value for customers, enhance the quality of life forconsumers and provide a cleaner and healthier environment for future generations.
We are a leading global innovator in the applications we serve and we differentiate ourselves through our:
‰ extensive global reach, by which we leverage our strengths across our operations in 62 countries to reachcustomers in over 175 countries;
‰ expertise in packaging sales, service and engineering, hygiene and sanitation solutions, and in foodscience;
‰ leading brands, such as our Bubble Wrap® brand cushioning, Jiffy® protective mailers, Instapak®
foam-in-place systems, Cryovac® packaging technology, and Diversey® and TASKI® brand cleaning andhygiene solutions;
‰ technology leadership with an emphasis on proprietary technologies;
‰ total systems offering that includes specialty materials and formulations, equipment systems and services;and
‰ solid free cash flow generation from premium solutions to meet our customers’ needs, productivityimprovements, working capital management and an asset-light business model.
In 2011, our operations generated approximately 59% of our revenue from outside the United Statesincluding approximately 18% of our revenue from developing regions. These developing regions are Africa, Asia(excluding Japan and South Korea), Central and Eastern Europe, and Latin America. We anticipate that on a fullyear basis, as a result of the acquisition of Diversey, our operations will generate approximately 70% of ourrevenue from outside the United States including approximately 20% of our revenue from developing regions.
We conduct our operations through the following four business segments: Food Packaging, Food Solutions,Protective Packaging, Diversey and an “Other” category. See “Segments” below for further details of oursegment structure. We conduct substantially all of our business through three wholly-owned subsidiaries,Cryovac, Inc., Sealed Air Corporation (US) and now, Diversey.
Throughout this Annual Report on Form 10-K, when we refer to “Sealed Air,” the “Company,” “we,” “us”or “our,” we are referring to Sealed Air Corporation and all of our subsidiaries, except where the contextindicates otherwise. Also, when we cross reference to a “Note,” we are referring to our “Notes to ConsolidatedFinancial Statements,” unless the context indicates otherwise.
Recent Events
Acquisition of Diversey
On October 3, 2011, we completed the acquisition of Diversey, a leading global provider of commercialcleaning, sanitation and hygiene products, services and solutions for food safety and service, food and beverageplant operations, floor care, housekeeping and room care, laundry and hand care. Under the terms of theacquisition agreement, we paid in aggregate $2.1 billion in cash consideration and an aggregate of approximately31.7 million shares of Sealed Air common stock to the shareholders of Diversey. We financed the payment of thecash consideration through (a) borrowings under our new Credit Facility, (b) proceeds from our issuance of theNotes and (c) cash on hand. In connection with the acquisition, we also used our new borrowings to retireapproximately $1.6 billion of existing indebtedness of Diversey. As of March 4, 2011, Diversey had
1
approximately 10,170 employees and reported net sales of $3.1 billion for the year ended December 31, 2010.See Note 3, “Acquisition of Diversey Holdings, Inc.,” for further information about the acquisition and “NewSegment Structure” below for information about our announcement of the expected establishment of newbusiness units and our current segment reporting structure.
The consolidated financial statements and information included in this Annual Report on Form 10-K (“Form10-K”) includes the financial results of Diversey for the period beginning October 3, 2011 (the “acquisitiondate”) through December 31, 2011. The financial results included in this Form 10-K related to the acquisitionmethod of accounting for the Diversey transaction are subject to change as the acquisition method of accountingis not yet finalized and dependent upon the finalization of management’s review of certain independentvaluations and studies that are still in process. See Note 3, “Acquisition of Diversey Holdings, Inc.,” for furtherinformation about the acquisition and related transactions and the acquisition method of accounting.
New Segment Structure
On November 3, 2011, we announced the expected establishment of new business units for our segmentreporting structure. The new segment reporting structure will consist of three global business units. This newstructure is expected to be implemented in 2012 and will replace our existing seven business unit structure andDiversey’s legacy four region-based structure.
The new segment reporting structure will include the following:
Food & Beverage — This new segment will combine our legacy Food Packaging and Food Solutionsbusinesses with Diversey’s Food & Beverage applications. This segment will focus on providing solutions thatimprove the management of contamination risk associated with food production and processing, extend productshelf life through packaging technologies, and improve merchandising, ease-of-use and back-of-house processes.These solutions are designed to reduce customers’ total operating costs, improve operational efficiencies andreduce food waste and water and energy use.
Institutional & Laundry — This new segment will represent the legacy Diversey business servinginstitutional and industrial end-users such as food service providers, lodging establishments, building servicecontractors, building managers and property owners, retail outlets, schools and health care facilities. Thissegment will focus on developing differentiated solutions for facility hygiene, food safety and security in foodservice operations, and infection control. In addition, this segment offers a wide range of value-added services,including food safety and application training and consulting, and auditing of hygiene and water management.These solutions create business value by improving operating efficiency, mitigating risk and reducing the overallenvironmental footprint of commercial and industrial facilities.
Protective Packaging — This new segment will combine our legacy Protective Packaging, ShrinkPackaging and Specialty Materials businesses to provide customers with a broad portfolio of protectivepackaging systems across a range of applications and industries.
There will also be an “Other” category, which will include our legacy Medical Applications business andNew Ventures.
Until the new organization is implemented, we will continue to report our segment results using thefollowing structure: Food Packaging, Food Solutions, Protective Packaging, Diversey and an Other category.Additionally, there will be no immediate changes in how we manage our business with our customers, includingthe products, solutions and services we provide, however, our businesses will pursue revenue synergyopportunities where available.
New Directors Elected
On January 30, 2012, we announced that Mr. Jerry R. Whitaker was elected to our Board of Directors as anindependent director, effective immediately. Mr. Whitaker is the retired President of the Electrical Sector-Americas Group of Eaton Corporation, a global diversified power management company that manufactureselectrical and industrial products and services. The Electrical Sector-Americas represents the largest operating
2
unit of Eaton Corporation. During Mr. Whitaker’s 17-year tenure at Eaton Corporation, he held several executivemanagement positions and established a track record of improving profitability across the multinationalmanufacturing footprint and expanding Eaton’s market presence in targeted segments. Currently, Mr. Whitakerserves as a director of Matthews International Inc. and as a director of Crescent Electric Supply Company. Healso serves on the boards of the Carnegie Science Center (serving as Chairman of the Carnegie Science CenterAwards for Excellence over the last ten years), the Allegheny Conference on Community Development,Pittsburgh American Middle East Institute and the Corporate Circles Board of the Pittsburgh Cultural Trust. Mr.Whitaker holds a bachelor of science degree in electrical engineering from Syracuse University and a master ofbusiness administration degree from George Washington University.
On January 17, 2012, we announced that Mr. Richard L. Wambold was elected to our Board of Directors asan independent director, effective March 1, 2012. Mr. Wambold was formerly the Chief Executive Officer ofPactiv/Reynolds Foodservice and Consumer Products, a global manufacturer and supplier of consumer food andbeverage packaging and store products. Previously, Mr. Wambold served for approximately 12 years asChairman of the Board and Chief Executive Officer of Pactiv Corporation, a global provider of advancedpackaging solutions. Currently, Mr. Wambold is a private investor and serves as a director of Cooper Tire andRubber Company and as a director of Precision Castparts Corporation.
Our Business Strategies
We are focused on protection and expanding our presence by innovating solutions that improve food safetyand security, facility hygiene and product protection. Our strategy aligns with three global trends: the increaseddemand for protein and high-quality prepared foods from an expanding middle class in developing regions;greater public and regulatory demand for safe, efficient and hygienic environments; and the expansion of globalsupply chains and e-commerce, which require efficient packaging solutions. Our business is well positioned toleverage these trends through our extensive portfolio of proprietary solutions, leading research and developmentteams, our large international footprint and presence in developing regions, our access to broad distributionnetworks and our high levels of customer service.
The key strategic priorities developed to achieve our growth goals are:
Maintain and Expand our Positions with Key Customers. We have developed a reputation for deliveringexceptional value to our customers as proven by our long-standing relationships and market leadership positions.Our total systems solution model often involves technology and equipment installed within our customers’facilities which further enhances the value we bring to our customers. We plan to build on the strength of theserelationships to deliver end-to-end solutions across the food “Production-Packaging-Preparation-Consumption”continuum to become an increasingly important partner to our customers.
Position our Company to Capture Growth Opportunities in Developing Regions. We are focused onrealizing growth from developing regions due to favorable demand trends, including: greater disposable incomefrom a growing middle class; the continued urbanization of populations; increased wealth per capita drivinggreater demand for protein and higher quality foods; and expansion of cold supply chains and Western-styleretail supermarkets, which require more packaging. As a result, these regions represent opportunities forenhanced food production, packaging and processing, which offer growth opportunities for our solutions.
Extend Reach and Maintain Innovation Leadership. The Diversey acquisition provides additional scope,scale, and geographic reach to deliver proprietary solutions to address our customers’ unmet needs in managingfood safety, hygiene and shelf life performance while maximizing productivity and risk management andreducing costs. We believe our extensive competencies in food science, equipment automation, cleaning andsanitation and process integration position us to address these unmet needs globally. We plan to build on thesecombined strengths by innovating new end-to-end solutions across the food “Production-Packaging-Preparation-Consumption” continuum that will provide measurable value for our customers and ultimately enhance theefficacy and efficiency of food supply chains.
Integrate Diversey and Realize Cost Savings and Revenue Synergies. We intend to achieve commercialand financial benefits from our integration of Diversey. We are proceeding with our extensive integration plan
3
that addresses both commercial opportunities and areas for cost savings. We expect to realize approximately$110 million to $115 million of annual gross cost savings by the end of 2014. We continue to anticipate $70million of revenue synergies by the end of 2013, largely from expanding our access and presence within our foodand beverage processing customers’ businesses and broadening our reach in developing regions. We believe thatcost and revenue synergies will further enhance our financial profile and future free cash flow generation.
Utilize Free Cash Flow to Repay Debt Obligations. We have a long track record of free cash flowgeneration and deleveraging through the economic cycle. We plan to use internally-generated free cash flow torepay our debt obligations. As of December 31, 2011, our net debt was $5.2 billion. Our goal is to reduce netdebt to $4.9 billion by the end of 2012 and then to $4.5 billion by the end of 2013. In addition, we plan toopportunistically invest in our businesses to further enhance our free cash flow generation in the future, whichwill create additional value for shareholders.
Segments
We currently report our business publicly in five parts: four reportable segments and an “Other” category.
Our reportable segments are:
1. Food Packaging;
2. Food Solutions;
3. Protective Packaging, which includes Shrink Packaging; and
4. Diversey.
Our Other category includes:
(a) Specialty Materials;
(b) Medical Applications; and
(c) New Ventures.
Information concerning our reportable segments, including net sales, depreciation and amortization,operating profit and certain assets, appears in Note 4, “Segments.”
Descriptions of the Reportable Segments and Other Category
We offer a broad range of solutions across leading brands worldwide.
Food Packaging Segment
In this segment, we focus on the automated packaging of perishable foods, predominantly fresh andprocessed meats and cheeses. Our products are sold primarily to food processors, distributors, supermarketretailers and foodservice operators. We market these products under the Cryovac® trademark and sub-brandssuch as Cryovac Grip & Tear®, Oven EaseTM and Multi-Seal®. This segment’s growth opportunities are targetedtoward developments in technologies that enable our customers to package and ship their meat and cheeseproducts effectively through their supply chain. These technologies focus on automation and packagingintegration solutions, innovation in material science and expansion of the sale of our products into developingregions, where consumers continue to increase their protein consumption and are transitioning to packagedproducts.
Our Food Packaging segment offerings include:
‰ shrink bags to vacuum package many fresh food products, including beef, lamb, pork, poultry andseafood, as well as cheese and smoked and processed meats;
‰ packaging materials for cook-in applications, predominantly for deli and foodservice businesses;
4
‰ a wide range of laminated and coextruded rollstock packaging materials utilized in thermoforming andform, fill and seal applications, providing an effective packaging option for a variety of fresh meat,smoked and processed meat, seafood, poultry and cheese applications;
‰ packaging trays; and
‰ associated packaging equipment and systems, including bag loaders, dispensers and vacuum chambersystems.
Food Solutions Segment
In this segment, we target advanced food packaging technologies that provide consumers convenient accessto fresh, consistently prepared, high-quality meals, either from foodservice outlets or from expanding retail casesat grocery stores. We sell the products in this reportable segment primarily to food processors, distributors,supermarket retailers and foodservice operators. We market these products under the Cryovac® trademark andsub-brands such as Simple Steps®, Cryovac Mirabella® and Darfresh®. This segment’s growth strategy isfocused on developing convenience-oriented solutions through material science and innovative end applicationsthat serve both consumers and the commercial chef.
Our Food Solutions segment offerings include:
‰ case-ready packaging offerings that are utilized in the centralized packaging of various proteins, includingbeef, pork, lamb, poultry, smoked and processed meats, seafood and cheese, for retail sale at the consumerlevel;
‰ ready meals packaging, including our Simple Steps® solution, a microwavable package designed withvacuum skin packaging technology and a unique self-venting feature, as well as our flex-tray-flexpackage, which is an oven-compatible package that utilizes skin-pack technology;
‰ vertical pouch packaging solutions for packaging flowable food products, including soups, sauces, salads,meats, toppings and syrups, including film and filling equipment systems for products utilizing hot andambient, retort and aseptic processing methods;
‰ foam and solid plastic trays and containers that customers use to package a wide variety of food products;
‰ absorbent products used for food packaging, such as our Dri-Loc® absorbent pads; and
‰ related packaging equipment, including vacuum chamber systems.
Protective Packaging Segment
This segment comprises our core protective packaging technologies and solutions aimed at traditionalindustrial applications as well as consumer-oriented packaging solutions. We aggregate our protective packagingproducts and shrink packaging products into our Protective Packaging segment for reporting purposes. We sellproducts in this segment primarily to distributors and manufacturers in a wide variety of industries as well as toretailers and to e-commerce and mail order fulfillment firms. This segment’s growth is focused on providing abroad range of protective packaging products and solutions worldwide by focusing on advancements in materialscience, automation, and the development of reliable customer equipment. We target markets that serve bothdeveloped and developing regions.
Our Protective Packaging segment offerings include:
‰ Bubble Wrap® and AirCap® brand air cellular packaging materials, which employ a “barrier layer” thatretains air for longer lasting protection, forming a pneumatic cushion to protect products from damagethrough shock or vibration during shipment;
‰ Cryovac®, Opti® and CorTuff® polyolefin performance shrink films for product display, bundling andmerchandising applications, which customers use to “shrink-wrap” a wide assortment of industrial,consumer, and food products;
5
‰ Shanklin® and Opti® shrink packaging equipment systems;
‰ Instapak® polyurethane foam packaging systems, which consist of proprietary blends of polyurethanechemicals, high performance polyolefin films and specially designed dispensing equipment that provideprotective packaging for a wide variety of applications;
‰ Jiffy® mailers and bags, including lightweight, tear-resistant mailers lined with air cellular cushioningmaterial that are marketed under the Jiffylite® and TuffGard® trademarks, Jiffy® padded mailers madefrom recycled kraft paper padded with macerated recycled newspaper, and Jiffy® ShurTuff® bagscomposed of multi-layered polyolefin film;
‰ inflatable packaging systems, including our Fill-Air® inflatable packaging system, which converts rolls ofpolyethylene film into continuous perforated chains of air-filled cushions, our Fill-Air® RF system, whichconsists of a compact, portable inflator and self-sealing inflatable plastic bags, which is also available in afully automated model, and our NewAir I.B.® Express packaging system, which provides on-site,on-demand Barrier Bubble® cushioning material;
‰ PackTiger® paper cushioning system, a versatile high-speed paper packaging solution that includes bothrecycled paper and automated dispensing equipment;
‰ Kushion Kraft®, Custom WrapTM, Jiffy Packer® and Void KraftTM paper packaging products; and
‰ Korrvu® suspension and retention packaging.
Diversey Segment
Products and Services
Our Diversey segment offers a wide range of products and services designed primarily for use in fiveapplication categories: food service, food and beverage manufacturing and processing, floor care, restroom careand other housekeeping, and laundry. Many of our products are consumable and require periodic replacement,which generates recurring revenue and helps provide consistency in business performance.
The global sustainability movement is expected to be a long-term driver of growth in the industries weserve, as customers seek products and expertise that reduce their environmental profile while also providingclean, hygienic facilities that reduce the risk of human- and food-borne infection. Our extensive suite of products,services and solutions improves our customers’ operational efficiency as well as their cleaning, sanitizing andhygiene results, which we believe assists them in protecting their brands. We also help our customers achievetheir goals of reducing waste, energy and water consumption, and we are able to provide documented analysis ofthe cost and resource savings they can achieve by implementing our solutions.
Food Service. Food Service products remove soil and address microbiological contamination on foodcontact surfaces. Our food service products include chemicals for washing dishes, glassware, flatware, utensilsand kitchen equipment; dish machines; pre-rinse units; dish tables and racks; food handling and storage products;and safe floor systems and tools. We also manufacture and supply kitchen cleaning products, such as generalpurpose cleaners, lime scale removers, bactericides/disinfectants, detergents, oven and grill cleaners, generalsurface degreasers, floor cleaners and food surface disinfectants. In addition, we provide customers withexpertise to execute cleaning and hygiene programs. These applications are sold into a variety of end useapplications, including contract and in-flight caterers, restaurant chains and lodging establishments. We also havea relationship with Cintas Corporation through which we provide application expertise and a food serviceportfolio under Cintas’ SignetTM brand.
Food and Beverage Manufacturing and Processing. Food and Beverage Manufacturing and Processingproducts include detergents, cleaners, sanitizers and lubricants, as well as cleaning systems, electronic dispensersand chemical injectors for the application of chemical products and improvement of operational efficiency andsanitation. We also offer gel and foam products for manual open plant cleaning, acid and alkaline cleaners andmembrane cleaning products. In addition, we provide consulting services in the areas of food safety, water andenergy use reduction and quality management.
6
Floor Care. We manufacture a broad range of floor care products and systems, including finishes, waxes,cleaners, degreasers, polishes, sealers and strippers for all types of flooring surfaces, including vinyl, terrazzo,granite, concrete, marble, linoleum and wood. We also provide a full range of carpet cleaners, such as extractioncleaners and shampoos; carpet powders; treatments, such as pre-sprays and deodorizers; and a full line of carpetspotters. Our range of products also includes carpet cleaning and floor care machines, as well as utensils andtools, which support the cleaning and maintenance process. Among the product brands are TASKI® floor caremachines and Signature® floor finish. These products are sold primarily for use in building management, retail,lodging and health care customer sectors.
Restroom Care and Other Housekeeping. We offer a fully integrated line of products and dispensingsystems for hard surface cleaning, disinfecting and sanitizing, hand washing and air deodorizing and freshening.Our restroom care and other housekeeping products include bowl and hard surface cleaners, hand soaps,sanitizers, air care products, general purpose cleaners, disinfectants and specialty cleaning products. Among theproduct brands are Clax®, J-Flextm and Oxivir®. These products are sold into the food service, buildingmanagement, retail, lodging and health care customer sectors.
Laundry. We offer detergents, stain removers, fabric conditioners, softeners and bleaches in liquid,powder and concentrated forms to clean items such as bed linen, clothing and table linen. Our range of productscovers requirements of fabric care for domestic-sized machines in small lodging facilities to washers incommercial laundry facilities. We also offer customized washing programs for different levels and types of soils,a comprehensive range of dispensing equipment and a selection of process control and management informationsystems. Through a joint venture with Standard Textile Company, we provide a commercial laundry applicationthat combines a unique activator unit with proprietary chemistry to deliver a fully integrated cleaning andsanitizing solution. Leading brands include Clax®, Suma® and Proteustm. These products are sold primarily intothe lodging, and health care and commercial laundry customer sectors.
Diversey Segment End-Users and Customers
We offer our Diversey products directly or through third-party distributors to end-users in seven sectors —food service, lodging, retail, health care, building managers/service contractors, food and beverage and other.
Food Service. End-users include fast food and full-service restaurants as well as contract caterers.
Lodging. We serve many of the largest hotel chains in the world as well as local independent propertiesand regional chains.
Retail. Retail end-users include supermarkets, drug stores, discounters, hypermarkets and wholesale clubs.
Health Care. These customers include both public and private hospitals, long-term care facilities and otherfacilities where medical services are performed.
Building Service Contractors/Facility Management. These end-users include building owners/managers aswell as building service contractors and building owners/managers. Contractors clean, maintain and manage avariety of facilities including office buildings, retail stores, health care facilities, production facilities, andeducation and government institutions.
Food and Beverage. Food and Beverage end-users include dairy plants, dairy farms, breweries, soft-drinkand juice bottling plants, protein and processed food production facilities, and other food processors.
In addition, we serve customers in cash and carry establishments, industrial plants and laundries. Cash andcarry establishments are stores in which professional end-users purchase products for their own use.
Other
We also focus on growth by utilizing our technologies in new market segments. This category includesspecialty materials serving both packaging and non-packaging applications and medical products andapplications. Additionally, this category includes several of our new ventures, such as vacuum insulated panels.
7
Specialty Materials
Our Specialty Materials business seeks to expand our product portfolio and core competencies intospecialized and non-packaging applications and new market segments. We sell specialty materials productsprimarily to fabricators and manufacturers encompassing a wide array of businesses and end uses.
Medical Applications
The goal of our Medical Applications business is to provide solutions offering superior protection andreliability to the medical, pharmaceutical and medical device industries. We sell medical applications productsdirectly to medical device manufacturers and pharmaceutical companies and to the contract packaging firms thatsupply them.
New Ventures
Our New Ventures area includes several development projects. These include technologies and solutionssourced from renewable materials, proprietary process technologies that have opportunity for application withinour manufacturing processes and for future licensing, and equipment systems that offer an automated packagingservice for high-volume fulfillment or pick-and-pack operators. Two examples of development projects are theI-Pack and Ultipack automated void reduction and containment systems that provide efficient, automatedpackaging processes that minimize carton sizes and void fill requirements. These systems are being offered as aservice and sold using a unique per-package charge model.
Outsourced Products
In addition to net sales from products produced in our facilities, we also sell products fabricated by othermanufacturers, which we refer to as “outsourced products.” Outsourced products are mostly sold in our FoodSolutions and Diversey segments. Food Solutions’ outsourced products include, among others, foam and solidplastic trays and containers fabricated primarily in North America and in Europe that largely support our FoodSolution segment’s case ready products. Diversey’s outsourced products include, among others, mostnon-chemical products, including, dosing and dispensing equipment, cleaning tools and utensils, paper productsand food and beverage cleaning equipment fabricated primarily in Europe and Asia. In addition, we alsooutsource certain of our chemical products in our floor care line.
We have strategically opted to use third-party manufacturers for technically less complex products andselected equipment in order to offer customers a broader range of solutions. We have benefited from this strategywith increased net sales and operating profit requiring minimal capital expenditures.
Outsourced products sales represented approximately 14% of Food Solutions net sales in 2011, and 17% in2010 and 2009. Outsourced products sales represented approximately 39% of Diversey’s net sales in the fourthquarter of 2011.
Total outsourced products sales represented approximately 11% of total net sales in 2011, and 6% in 2010and 2009.
8
Foreign Operations
We operate through our subsidiaries and have a presence in the United States and the 61 other countrieslisted below, enabling us to distribute our products to our customers in over 175 countries.
Americas Europe, Middle East and Africa (“EMEA”) Asia Pacific
Argentina Austria Netherlands AustraliaBarbados Belgium Nigeria ChinaBrazil Czech Republic Norway IndiaCanada Denmark Poland IndonesiaChile Egypt Portugal JapanColombia Finland Romania MalaysiaCosta Rica France Russia New ZealandDominican Republic Germany Slovakia PakistanGuatemala Greece Slovenia PhilippinesJamaica Hungary South Africa SingaporeMexico Ireland Spain South KoreaPeru Israel Sweden TaiwanUruguay Italy Switzerland ThailandVenezuela Kenya Turkey Vietnam
Luxembourg UkraineMorocco United Arab Emirates
United Kingdom
In maintaining our foreign operations, we face risks inherent in these operations, such as currencyfluctuations, inflation and political instability. Information on currency exchange risk appears in Part II, Item 7Aof this Annual Report on Form 10-K, which information is incorporated herein by reference. Other risksattendant to our foreign operations are set forth in Part I, Item 1A. “Risk Factors,” of this Annual Report onForm 10-K, which information is incorporated herein by reference. Information on the impact of currencyexchange on our consolidated financial statements appears in Part II, Item 7. Management’s Discussion andAnalysis of Financial Condition and Results of Operations. Financial information showing net sales and totallong-lived assets by geographic region for each of the three years ended December 31, 2011 appears in Note 4,“Segments,” which information is incorporated herein by reference. We maintain programs to comply with thevarious laws, rules and regulations related to the protection of the environment that we may be subject to in themany countries in which we operate. See “Environmental Matters,” below.
Employees
As of December 31, 2011, we had approximately 26,300 employees worldwide. Approximately 8,000 ofthese employees were in the U.S., with approximately 160 of these employees covered by collective bargainingagreements. Of the approximately 18,300 employees who were outside the U.S., approximately 5,700 werecovered by collective bargaining agreements. Outside of the U.S., many of the covered employees arerepresented by works councils or industrial boards, as is customary in the jurisdictions in which they areemployed. We believe that our employee relations are satisfactory.
Marketing, Distribution and Customers
At December 31, 2011, we employed approximately 8,200 sales, marketing and customer service personnelthroughout the world who sell and market our products to and through a large number of distributors, fabricators,converters, e-commerce and mail order fulfillment firms, and contract packaging firms as well as directly toend-users such as food processors, foodservice businesses, supermarket retailers, lodging, retail, pharmaceuticalcompanies, health care facilities, medical device manufacturers, and other manufacturers.
To support our food and new ventures customers, we operate three Packforum® innovation and learningcenters that are located in the U.S., France, and China. At Packforum®, we assist customers in identifying theappropriate packaging materials and systems to meet their needs. We also offer ideation services, educationalseminars, employee training and customized graphic design services to our customers.
9
To assist our marketing efforts for our protective packaging products and to provide specialized customerservices, we operate 35 industrial Package Design and Development Centers (PDDC’s) worldwide within ourfacilities. These PDDC’s are staffed with professional packaging engineers and outfitted with drop-testing andother equipment used to develop, test and validate cost-effective package designs to meet each protectivepackaging customer’s needs.
To support our equipment systems and the marketing of our totals systems solutions, we provide fieldtechnical services to our customers worldwide. These services include system installation, integration andmonitoring systems, repair and upgrade, operator training in the efficient use of our systems, qualification ofvarious consumable and system combinations, and equipment layout and design.
For our medical application customers, we offer two cleanroom contract assembly and packaging facilitiesin two countries, as well as a packaging validation lab.
Our food packaging, food solutions and food and beverage applications are largely sold direct, while ourProtective Packaging and a large component of the remaining end-use applications in Diversey are sold throughbusiness supply distributors.
We have no material long-term contracts for the distribution of our products. In 2011, no customer oraffiliated group of customers accounted for 10% or more of our consolidated net sales.
Seasonality
Historically, net sales in our food businesses have tended to be slightly lower in the first quarter and slightlyhigher towards the end of the third quarter through the fourth quarter, due to holiday events. Net sales in ourProtective Packaging segment have also tended to be slightly lower in the first quarter and higher during the“back-to-school” season in the mid-third quarter and through the fourth quarter due to the holiday shoppingseason. The Diversey segment’s net sales trend slightly lower in the first quarter, while second quarter salesrepresent a modest seasonal peak due to the European-based lodging and food and beverage demand. On aconsolidated basis, there is little seasonality in the business, with net sales slightly lower in the first quarter andslightly higher towards the end of the third quarter through the fourth quarter. Our consolidated net earningstypically trend directionally the same as our net sales seasonality.
However, other factors may outweigh the effects of seasonal changes in our net earnings results including,but not limited to, changes in raw materials and other costs, foreign exchange rates, interest rates, taxes and thetiming and amount of acquisition synergies and restructuring and other non-recurring charges.
Competition
Competition for most of our packaging products is based primarily on packaging performancecharacteristics, service and price. Since competition is also based upon innovations in packaging technology, wemaintain ongoing research and development programs to enable us to maintain technological leadership. Weinvest approximately double the industry average on research and development as a percentage of net sales peryear as compared with our packaging peers. There are also other companies producing competing products thatare well-established.
There are other manufacturers of food packaging and food solutions products, some of which are companiesoffering similar products that operate across regions and others that operate in a single region or single country.Competing manufacturers produce a wide variety of food packaging based on plastic, metals and other materials.We believe that we are one of the leading suppliers of (i) flexible food packaging materials and related systemsin the principal geographic areas in which we offer those products, (ii) barrier trays for case-ready meat productsin the principal geographic areas in which we offers those trays, and (iii) absorbent pads for food products tosupermarkets and to meat and poultry processors in the United States.
Our protective packaging products compete with similar products made by other manufacturers and with anumber of other packaging materials that customers use to provide protection against damage to their productsduring shipment and storage. Among the competitive materials are various forms of paper packaging products,expanded plastics, corrugated die cuts, strapping, envelopes, reinforced bags, boxes and other containers, andvarious corrugated materials, as well as various types of molded foam plastics, fabricated foam plastics,
10
mechanical shock mounts, and wood blocking and bracing systems. We believe that we are one of the leadingsuppliers of air cellular cushioning materials containing a barrier layer, inflatable packaging, suspension andretention packaging, shrink films for industrial and commercial applications, protective mailers, polyethylenefoam and polyurethane foam packaging systems in the principal geographic areas in which we sell theseproducts.
Our Diversey solutions face a wide spectrum of competitors across each product category. Competition isboth global and regional in scope and includes numerous small, local competitors with limited product portfoliosand geographic reach. We compete globally on premium product offerings and application expertise, innovativeproduct and dispensing equipment offerings, value-added solution delivery, and strong customer service andsupport. We differentiate our offerings from competitors by becoming the preferred partner to our customers, andby providing innovative, industry-leading products to make their facilities safer and healthier for bothmaintenance staff and building occupants. We believe our integrated solutions approach, which includes thesupply of machines, tools, chemicals, processes and training to customers to drive productivity improvements,reduces risk of food safety events and improves infection control to reduce health care acquired infections, is aunique competitive strength. Additionally, the quality, ease of use and environmental profile of our products areunique and have helped support long-standing, profitable relationships with many top customers.
Competition in specialty materials is focused on performance characteristics and price. Competition formost of our Medical Applications products is based primarily on performance characteristics, service and price.Technical design capability is an additional competitive factor for the rigid packaging offered by the MedicalApplications business.
Raw Materials and Sourcing
Suppliers provide raw materials, packaging components, equipment, accessories and contract manufacturedgoods. Our principal raw materials are polyolefin and other petrochemical-based resins and films, caustic soda,solvents, waxes, phosphates, surfactants, chelates, fragrances and paper and wood pulp products. These rawmaterials represent approximately one third of our consolidated cost of sales. We also purchase corrugatedmaterials, cores for rolls of products such as films and Bubble Wrap® brand cushioning, inks for printedmaterials, bag-in-the-box containers, bottles, drums, pails, totes, aerosol cans, caps, triggers, valves, and blowingagents used in the expansion of foam packaging products. In addition, we offer a wide variety of specializedpackaging equipment, some of which we manufacture or have manufactured to our specifications, some of whichwe assemble and some of which we purchase from suppliers. Equipment and accessories include industrial andfood packaging equipment, dilution-control warewashing and laundry equipment, floor care machines as well asitems used in the maintenance of a facility such as air care dispensers, floor care applicators, microfiber mopsand cloths, buckets, carts and other cleaning tools and utensils.
The vast majority of the raw materials required for the manufacture of our products and all componentsrelated to our equipment and accessories generally have been readily available on the open market, in most casesare available from several suppliers and are available in amounts sufficient to meet our manufacturingrequirements. However, we have some sole-source suppliers, and the lack of availability of supplies could have amaterial negative impact on our business. Natural disasters such as hurricanes, as well as political instability andterrorist activities, may negatively impact the production or delivery capabilities of refineries and natural gas andpetrochemical suppliers in the future. Due to by-product/co-product chemical relationships to the automotive andhousing markets, several materials may become difficult to source. These factors could lead to increased pricesfor our raw materials, curtailment of supplies and allocation of raw materials by our suppliers. We source somematerials used in our packaging products from materials recycled in our manufacturing operations or obtainedthrough participation in recycling programs. Although we purchase some raw materials under long-term supplyarrangements with third parties, these arrangements follow market forces and are in line with our overall globalsourcing strategy, which seeks to balance the cost of acquisition and availability of supply.
We have a centralized supply chain organization, which includes the centralized management ofprocurement and logistic activities. Our objective is to leverage our global scale to achieve sourcing efficienciesand reduce our total delivered cost across all our regions. We do this while adhering to strategic performancemetrics and stringent sourcing practices.
11
Research and Development Activities
We maintain a continuing effort to develop new products and improve our existing products and processes,including developing new packaging, non-packaging and chemical equipment and applications using ourintellectual property. From time to time, we also acquire and commercialize new packaging and other products ortechniques developed by others. Our research and development projects rely on our technical capabilities in theareas of food science, materials science, chemistry, package design and equipment engineering. Our research anddevelopment expense was $106 million in 2011, $88 million in 2010 and $81 million in 2009.
Our research and development activities are focused on end-use application. As a result, we operate:
‰ two food science laboratories located in the U.S. and Italy;
‰ 35 industrial Package Design and Development Centers worldwide, which are located within ourProtective Packaging facilities. These centers develop, test and validate cost-effective package designs;
‰ seven research and development laboratories focused on the development of cleaning and sanitationformulations, which are located in the U.S., Germany, the Netherlands, Switzerland, India, Japan, andBrazil;
‰ nine equipment design centers in the U.S., Germany, Switzerland, the U.K., and Japan that focus onequipment and parts design and innovation to support the development of comprehensive systemssolutions;
‰ two medical rigids packaging design centers in the U.S. and the Netherlands; and
‰ one medical device packaging validation laboratory in the Netherlands.
Patents and Trademarks
We are the owner or licensee of an aggregate of over 4,600 United States and foreign patents and patentapplications, as well as an aggregate of over 9,000 United States and foreign trademark registrations andtrademark applications that relate to many of our products, manufacturing processes and equipment. We believethat our patents and trademarks collectively provide a competitive advantage. As such, each year we continue tofile, in the aggregate, an average of 350 United States and foreign patent applications and 400 United States andforeign trademark applications. None of our reportable segments is dependent upon any single patent ortrademark alone. Rather, we believe that our success depends primarily on our sales and service, marketing,engineering and manufacturing skills and on our ongoing research and development efforts. We believe that theexpiration or unenforceability of any of our patents, applications, licenses or trademark registrations would notbe material to our business or consolidated financial condition.
Environmental, Health and Safety Matters
As a manufacturer, we are subject to various laws, rules and regulations in the countries, jurisdictions andlocalities in which we operate. These cover: the safe storage and use of raw materials and production chemicals;the release of materials into the environment; standards for the treatment, storage and disposal of solid andhazardous wastes; or otherwise relate to the protection of the environment. We review environmental, health andsafety laws and regulations pertaining to our operations and believe that compliance with current environmentaland workplace health and safety laws and regulations has not had a material effect on our capital expenditures orconsolidated financial condition.
In some jurisdictions in which our packaging products are sold or used, laws and regulations have beenadopted or proposed that seek to regulate, among other things, minimum levels of recycled or reprocessedcontent and, more generally, the sale or disposal of packaging materials. In addition, customer demand continuesto evolve for packaging materials that incorporate renewable materials or that are otherwise viewed as being“environmentally sound.” Our new venture activities, described above, include the development of packagingproducts from renewable resources. We maintain programs designed to comply with these laws and regulations,to monitor their evolution, and to meet this customer demand. One advantage inherent in many of our products isthat thin, lightweight packaging solutions reduce waste and transportation costs in comparison to availablealternatives. We continue to evaluate and implement new technologies in this area as they become available.
12
Various federal, state, local and foreign laws and regulations regulate some of our products and require us toregister certain products and comply with specified requirements. In the United States, we must register oursanitizing and disinfecting products with the U.S. Environmental Protection Agency (“EPA”). We are alsosubject to various federal, state, local and foreign laws and regulations that regulate products manufactured andsold by is for controlling microbial growth on humans, animals and processed foods. In the United States, theserequirements are general administered by the U.S. Food and Drug Administration (“FDA”). To date, the cost ofcomplying with product registration requirements and FDA compliance has not had a material adverse effect onour business, financial condition, results of operations or cash flows.
We also support our customers’ interests in eliminating waste by offering or participating in collectionprograms for some of our products or product packaging and for materials used in some of our products. Whenpossible, materials collected through these programs are reprocessed and either reused in our protectivepackaging operations or offered to other manufacturers for use in other products. In addition, gains that we havemade in internal recycling programs have allowed us to improve our net raw material yield, thus mitigating theimpact of resin costs, while lowering solid waste disposal costs and controlling environmental liability risksassociated with waste disposal.
Our emphasis on environmental, health and safety compliance provides us with risk reduction opportunitiesand cost savings through asset protection and protection of employees, for which we are recognized as leaders inour industry. Our website, www.sealedair.com, contains additional detailed information about our corporatecitizenship initiatives.
Available Information
Our Internet address is www.sealedair.com. We make available, free of charge, on or through our website atwww.sealedair.com, our Annual Report on Form 10-K, quarterly reports on Form 10-Q, current reports onForm 8-K, and amendments to those reports that we file or furnish pursuant to Sections 13(a) or 15(d) of theSecurities Exchange Act of 1934, or the Exchange Act, as soon as reasonably practicable after we electronicallyfile these materials with, or furnish them to, the Securities and Exchange Commission.
Item 1A. Risk Factors
Introduction
Investors should carefully consider the risks described below before making an investment decision. Theseare the most significant risk factors, however, they are not the only risk factors that you should consider inmaking an investment decision. This Form 10-K also contains and may incorporate by reference forward-lookingstatements that involve risks and uncertainties. See the “Cautionary Notice Regarding Forward-LookingStatements,” in “Management’s Discussion and Analysis of Financial Condition and Results of Operations” inPart II, Item 7 of this Form 10-K. Our business, consolidated financial condition or results of operations could bematerially adversely affected by any of these risks. The trading price of our securities could decline due to any ofthese risks, and investors in our securities may lose all or part of their investment.
Weakened global economic conditions have had and could continue to have an adverse effect on ourconsolidated financial condition and results of operations.
Weakened global economic conditions have had and may continue to have an adverse impact on ourbusiness in the form of lower net sales due to weakened demand, unfavorable changes in product price/mix, orlower profit margins. For example, the recent global economic downturn has adversely impacted some of ourend-users and customers, such as food processors, distributors, supermarket retailers, hotels, restaurants, retailestablishments, other retailers and e-commerce and mail order fulfillment firms, and other end-users that areparticularly sensitive to business and consumer spending.
During economic downturns or recessions, there can be a heightened competition for sales and increasedpressure to reduce selling prices as our customers may reduce their volume of purchases from us. If we losesignificant sales volume or reduce selling prices significantly, then there could be a negative impact on ourconsolidated financial condition or results of operations, profitability and cash flows.
13
Also, reduced availability of credit may adversely affect the ability of some of our customers and suppliersto obtain funds for operations and capital expenditures. This could negatively impact our ability to obtainnecessary supplies as well as our sales of materials and equipment to affected customers. This also could result inreduced or delayed collections of outstanding accounts receivable.
The global nature of our operations exposes us to numerous risks that could materially adversely affect ourconsolidated financial condition and results of operations.
We operate in 62 countries, and our products are distributed in those countries as well as in other parts ofthe world. A large portion of our manufacturing operations are located outside of the United States and amajority of our net sales are generated outside of the United States. Operations outside of the United States,particularly operations in developing regions, are subject to various risks that may not be present or as significantfor our U.S. operations. Economic uncertainty in some of the geographic regions in which we operate, includingdeveloping regions, could result in the disruption of commerce and negatively impact cash flows from ouroperations in those areas.
Risks inherent in our international operations include:
‰ foreign currency exchange controls and tax rates;
‰ foreign currency exchange rate fluctuations, including devaluations;
‰ the potential for changes in regional and local economic conditions, including local inflationary pressures;
‰ restrictive governmental actions such as those on transfer or repatriation of funds and trade protectionmatters, including antidumping duties, tariffs, embargoes and prohibitions or restrictions on acquisitionsor joint ventures;
‰ changes in laws and regulations, including the laws and policies of the United States affecting trade andforeign investment;
‰ the difficulty of enforcing agreements and collecting receivables through certain foreign legal systems;
‰ variations in protection of intellectual property and other legal rights;
‰ more expansive legal rights of foreign unions or works councils;
‰ changes in labor conditions and difficulties in staffing and managing international operations;
‰ social plans that prohibit or increase the cost of certain restructuring actions;
‰ the potential for nationalization of enterprises or facilities; and
‰ unsettled political conditions and possible terrorist attacks against U.S. or other interests.
In addition, there are potential tax inefficiencies in repatriating funds from our non-U.S. subsidiaries.
These and other factors may have a material adverse effect on our international operations and,consequently, on our consolidated financial condition or results of operations.
If the Settlement agreement (as defined in Note 17, “Commitments and Contingencies”) is not implemented,we will not be released from the various asbestos-related, fraudulent transfer, successor liability, andindemnification claims made against us arising from a 1998 transaction with Grace. We have no controlover the timing of the cash payment required from us under the Settlement agreement. We are also adefendant in a number of asbestos-related actions in Canada arising from Grace’s activities in Canadaprior to the 1998 transaction.
On March 31, 1998, Sealed Air completed a multi-step transaction (the “Cryovac transaction”) involvingGrace which brought the Cryovac packaging business and the former Sealed Air Corporation’s business underthe common ownership of the Company. As part of that transaction, Grace and its subsidiaries retained allliabilities arising out of their operations before the Cryovac transaction (including asbestos-related liabilities),other than liabilities relating to Cryovac’s operations, and agreed to indemnify the Company with respect to suchretained liabilities. Since 2000, the Company has been served with a number of lawsuits alleging that, as a result
14
of the Cryovac transaction, the Company is responsible for the alleged asbestos liabilities of Grace and itssubsidiaries. While they vary, these suits all appear to allege that the transfer of the Cryovac business was afraudulent transfer or gave rise to successor liability. On April 2, 2001, Grace and certain of its subsidiaries filedfor Chapter 11 relief in the U.S. Bankruptcy Court for the District of Delaware (the “Bankruptcy Court”). Inconnection with Grace’s Chapter 11 case, the Bankruptcy Court issued orders dated May 3, 2001 and January 22,2002, staying all asbestos actions against the Company. However, the official committees appointed to representasbestos claimants in Grace’s Chapter 11 case (the “Committees”) received the court’s permission to pursuefraudulent transfer and other claims against the Company and its subsidiary Cryovac, Inc. based upon theCryovac transaction. This proceeding was brought in the U.S. District Court for the District of Delaware (the“District Court”) (Adv. No. 02-02210).
On November 27, 2002, we reached an agreement in principle with the Committees to resolve the fraudulenttransfer proceeding and all current and future asbestos-related claims made against us and our affiliates inconnection with the Cryovac transaction. The Settlement agreement will also resolve the fraudulent transferclaims and successor liability claims, as well as indemnification claims by Fresenius Medical Care Holdings, Inc.and affiliated companies in connection with the Cryovac transaction. The parties to the agreement in principlesigned the definitive Settlement agreement as of November 10, 2003 consistent with the terms of the agreementin principle. On June 27, 2005, the Bankruptcy Court signed an order approving the definitive Settlementagreement. Although Grace is not a party to the Settlement agreement, under the terms of the order, Grace isdirected to comply with the Settlement agreement subject to limited exceptions. On September 19, 2008, Grace,the Official Committee of Asbestos Personal Injury Claimants, the Asbestos PI Future Claimants’ Representative(the “FCR”), and the Official Committee of Equity Security Holders (the “Equity Committee”) filed, asco-proponents, a plan of reorganization (as filed and amended from time to time, the “PI Settlement Plan”) andseveral exhibits and associated documents, including a disclosure statement (as filed and amended from time totime, the “PI Settlement Disclosure Statement”), with the Bankruptcy Court. As filed, the PI Settlement Planwould provide for the establishment of two asbestos trusts under Section 524(g) of the United States BankruptcyCode to which present and future asbestos-related claims would be channeled. The PI Settlement Plan alsocontemplates that the terms of our definitive Settlement agreement will be incorporated into the PI SettlementPlan and that we will pay the amount contemplated by that agreement.
On January 31, 2011, the Bankruptcy Court entered a memorandum opinion (the “Bankruptcy CourtOpinion”) overruling certain objections to the PI Settlement Plan. On the same date, the Bankruptcy Courtentered an order regarding confirmation of the PI Settlement Plan (the “Bankruptcy Court Confirmation Order”).As entered on January 31, 2011, the Bankruptcy Court Confirmation Order contained recommended findings offact and conclusions of law, and recommended that the District Court approve the Confirmation Order, and thatthe District Court confirm the PI Settlement Plan and issue a channeling injunction under Section 524(g) of theBankruptcy Code. Thereafter, on February 15, 2011, the Bankruptcy Court issued an order clarifying theBankruptcy Court Opinion and the Bankruptcy Court Confirmation Order (the “Clarifying Order”). Among otherthings, the Clarifying Order provided that any references in the Bankruptcy Court Opinion and the BankruptcyCourt Confirmation Order to a recommendation that the District Court confirm the PI Settlement Plan werethereby amended to make clear that the PI Settlement Plan was confirmed and that the Bankruptcy Court wasrequesting that the District Court issue and affirm the Confirmation Order including the injunction underSection 524(g) of the Bankruptcy Code. On March 11, 2011, the Bankruptcy Court entered an order granting inpart and denying in part a motion to reconsider the Bankruptcy Court Opinion filed by BNSF Railway Company(the “March 11 Order”). Among other things, the March 11 Order amended the Bankruptcy Court Opinion toclarify certain matters relating to objections to the PI Settlement Plan filed by BNSF.
Various parties appealed or otherwise challenged the Bankruptcy Court Opinion and the Bankruptcy CourtConfirmation Order, including without limitation with respect to issues relating to releases and injunctionscontained in the PI Settlement Plan. On June 28 and 29, 2011, the District Court heard oral arguments inconnection with appeals of the Bankruptcy Court Opinion and the Bankruptcy Court Confirmation Order. OnJanuary 30, 2012, the District Court issued a memorandum opinion (the “District Court Opinion”) andconfirmation order (the “District Court Confirmation Order”) overruling all objections to the PI Settlement Planand confirming the PI Settlement Plan in its entirety (including the issuance of the injunction under
15
Section 524(g) of the Bankruptcy Code). On February 2, 2012, Garlock Sealing Technologies LLC (“Garlock”)filed a motion (the “Garlock Reargument Motion”) with the District Court requesting that the District Court grantreargument, rehearing, or otherwise amend the District Court Opinion and the District Court Confirmation Orderinsofar as they overrule Garlock’s objections to the PI Settlement Plan. On February 13, 2012, the Company,Cryovac, and Fresenius Medical Care Holdings, Inc. filed a joint motion (the “Sealed Air/Fresenius Motion”)with the District Court. The Sealed Air/Fresenius Motion does not seek to disturb confirmation of the PISettlement Plan but requests that the District Court amend and clarify certain matters in the District CourtOpinion and the District Court Confirmation Order. Also on February 13, 2012, Grace and the other proponentsof the PI Settlement Plan filed a motion (the “Plan Proponents’ Motion”) with the District Court requestingcertain of the same amendments and clarifications sought by the Sealed Air/Fresenius Motion. On February 27,2012, certain asbestos claimants known as the “Libby Claimants” filed a response to the Sealed Air/FreseniusMotion and the Plan Proponents’ Motion (the “Libby Response”). The Libby Response does not oppose theSealed Air/Fresenius Motion or the Plan Proponents’ Motion but indicates, among other things, that: (a) theLibby Claimants have reached a settlement in principle of their objections to the PI Settlement Plan but that thissettlement has not become effective and (b) the Libby Claimants reserve their rights with respect to the PISettlement Plan pending the effectiveness of the Libby Claimants’ settlement. In addition, parties have appealedthe District Court Opinion and the District Court Confirmation Order to the United States Court of Appeals forthe Third Circuit (the “Third Circuit Court of Appeals”). By orders dated February 23, 2012, the Third CircuitCourt of Appeals stayed appeals of the District Court Opinion and the District Court Confirmation Order pendingdisposition of motions filed in the District Court with respect to the District Court Opinion and the District CourtConfirmation Order. The District Court has not ruled on the Garlock Reargument Motion, the Sealed Air/Fresenius Motion, or the Plan Proponents’ Motion. In addition, on February 27, 2012, Garlock filed a motion (the“Garlock Stay Motion”) requesting that the District Court stay the District Court Opinion and the District CourtConfirmation Order until the later of 14 days after the disposition of the Garlock Reargument Motion ordisposition of any timely appeal by Garlock of the District Court Opinion and the District Court ConfirmationOrder. The District Court has not ruled on the Garlock Stay Motion.
If it becomes effective, the PI Settlement Plan may implement the terms of the Settlement agreement, butthere can be no assurance that this will be the case notwithstanding the confirmation of the PI Settlement Plan bythe Bankruptcy Court and the District Court. The terms of the PI Settlement Plan remain subject to amendment.Moreover, the PI Settlement Plan is subject to the satisfaction of a number of conditions which are more fully setforth in the PI Settlement Plan and include, without limitation, the availability of exit financing and the approvalof the PI Settlement Plan becoming final and no longer subject to appeal. Parties have appealed the District CourtConfirmation Order to the Third Circuit Court of Appeals or otherwise challenged the District Court Opinion andthe District Court Confirmation Order. Matters relating to the PI Settlement Plan, the Bankruptcy and DistrictCourt Opinions, and the Bankruptcy and District Court Confirmation Orders may be subject to further appeal,challenge, and proceedings before the District Court, the Third Circuit Court of Appeals, or other courts. Partiesmay designate various issues to be considered in challenging the PI Settlement Plan, the Bankruptcy and DistrictCourt Opinions, or the Bankruptcy and District Court Confirmation Orders, including, without limitation, issuesrelating to releases and injunctions contained in the PI Settlement Plan.
While the Bankruptcy Court and the District Court have confirmed the PI Settlement Plan, we do not knowwhether or when the Third Circuit Court of Appeals will affirm the District Court Confirmation Order or theDistrict Court Opinion, whether or when the Bankruptcy and District Court Opinions or the Bankruptcy andDistrict Court Confirmation Orders will become final and no longer subject to appeal, or whether or when a finalplan of reorganization (whether the PI Settlement Plan or another plan of reorganization) will become effective.Assuming that a final plan of reorganization (whether the PI Settlement Plan or another plan of reorganization) isconfirmed by the Bankruptcy Court and the District Court, and does become effective, we do not know whetherthe final plan of reorganization will be consistent with the terms of the Settlement agreement or if the otherconditions to our obligation to pay the Settlement agreement amount will be met. If these conditions are notsatisfied or not waived by us, we will not be obligated to pay the amount contemplated by the Settlementagreement. However, if we do not pay the Settlement agreement amount, we and our affiliates will not bereleased from the various claims against us.
16
If the Settlement agreement does not become effective, either because Grace fails to emerge frombankruptcy or because Grace does not emerge from bankruptcy with a plan of reorganization that is consistentwith the terms of the Settlement agreement, then we and our affiliates will not be released from the variousasbestos-related, fraudulent transfer, successor liability, and indemnification claims made against us and ouraffiliates noted above, and all of these claims would remain pending and would have to be resolved through othermeans, such as through agreement on alternative settlement terms or trials. In that case, we could face liabilitiesthat are significantly different from our obligations under the Settlement agreement. We cannot estimate at thistime what those differences or their magnitude may be. In the event these liabilities are materially larger than thecurrent existing obligations, they could have a material adverse effect on our consolidated financial condition orresults of operations.
Since November 2004, the Company and specified subsidiaries have been named as defendants in a numberof cases, including a number of putative class actions, brought in Canada as a result of Grace’s allegedmarketing, manufacturing or distributing of asbestos or asbestos containing products in Canada prior to theCryovac transaction in 1998. Grace has agreed to defend and indemnify us and our subsidiaries in these cases.The Canadian cases are currently stayed. A global settlement of these Canadian claims to be funded byGrace has been approved by the Canadian court, and the PI Settlement Plan provides for payment of theseclaims. We do not have any positive obligations under the Canadian settlement, but we are a beneficiary of therelease of claims. The release in favor of the Grace parties (including us) will become operative upon theeffective date of a plan of reorganization in Grace’s United States Chapter 11 bankruptcy proceeding. As filed,the PI Settlement Plan contemplates that the claims released under the Canadian settlement will be subject toinjunctions under Section 524(g) of the Bankruptcy Code. As indicated above, the Bankruptcy Court entered theBankruptcy Court Confirmation Order on January 31, 2011 and the Clarifying Order on February 15, 2011 andthe District Court entered the District Court Confirmation Order on January 30, 2012; however, we can give noassurance that the PI Settlement Plan (or any other plan of reorganization) will become effective. Assuming thata final plan of reorganization (whether the PI Settlement Plan or another plan of reorganization) is confirmed bythe Bankruptcy Court and the District Court, and does become effective, if the final plan of reorganization doesnot incorporate the terms of the Canadian settlement or if the Canadian courts refuse to enforce the final plan ofreorganization in the Canadian courts, and if in addition Grace is unwilling or unable to defend and indemnify usand our subsidiaries in these cases, then we could be required to pay substantial damages, which we cannotestimate at this time and which could have a material adverse effect on our consolidated financial condition orresults of operations.
For further information concerning these matters, see Note 17, “Commitments and Contingencies.”
We require a significant amount of cash to service our indebtedness. The ability to generate cash and/orrefinance our indebtedness as it becomes due depends on many factors, some of which are beyond ourcontrol.
Our ability to make payments on our indebtedness, including our senior notes and our new Credit Facility,and to fund planned capital expenditures, research and development efforts and other corporate expenses dependson our future operating performance and on economic, financial, competitive, legislative, regulatory and otherfactors. Many of these factors are beyond our control. We cannot assure that our business will generate sufficientcash flow from operations, that currently anticipated cost savings, including synergies related to our acquisitionof Diversey, and operating improvements will be realized or that future borrowings will be available to us in anamount sufficient to enable us to repay our indebtedness or to fund our other operating requirements. Significantdelays in our planned capital expenditures may materially and adversely affect our future revenue prospects.
The indenture governing our new senior notes and the credit agreement for our new Credit Facility restrictour ability and the ability of most of our subsidiaries to engage in some business and financial transactions.
New Senior Notes. The indenture governing our new senior notes contains restrictive covenants that,among other things, limit our ability to:
‰ incur additional indebtedness;
17
‰ pay dividends, redeem stock or make other distributions;
‰ make investments;
‰ create liens;
‰ transfer or sell assets;
‰ merge or consolidate; and
‰ enter into certain transactions with our affiliates.
New Credit Facility. The credit agreement for our new Credit Facility contains a number of covenantsthat:
‰ require us to meet specified financial ratios and financial tests;
‰ restrict our ability to declare dividends;
‰ restrict our ability to redeem and repurchase capital stock;
‰ limit our ability to incur additional liens;
‰ limit our ability to engage in sale-leaseback transactions; and
‰ limit our ability to incur additional debt and make investments.
The credit agreement for our new Credit Facility also contains other covenants customary for creditfacilities of this nature. Our ability to borrow additional amounts under our Credit Facility depends uponsatisfaction of these covenants. Events beyond our control can affect our ability to meet these covenants.
Raw material pricing, availability and allocation by suppliers as well as energy-related costs may negativelyimpact our results of operations, including our profit margins.
We use petrochemical-based raw materials to manufacture many of our products. The prices for these rawmaterials are cyclical, and increases in market demand or fluctuations in the global trade for petrochemical-basedraw materials and energy could increase our costs. In addition, the prices of many of the key raw materials usedin our Diversey business, such as caustic soda, solvents, waxes, phosphates, surfactants, polymers and resins,chelates and fragrances, are cyclical based on numerous supply and demand factors that are beyond our control.If we are unable to minimize the effects of increased raw material costs through sourcing, pricing or otheractions, our business, consolidated financial condition or results of operations may be materially adverselyaffected. We also have some sole-source suppliers, and the lack of availability of supplies could have a materialadverse effect on our consolidated financial condition or results of operations.
Natural disasters such as hurricanes, as well as political instability and terrorist activities, may negativelyimpact the production or delivery capabilities of refineries and natural gas and petrochemical suppliers andsuppliers of other raw materials in the future. These factors could lead to increased prices for our raw materials,curtailment of supplies and allocation of raw materials by our suppliers, which could reduce revenues and profitmargins and harm relations with our customers and which could have a material adverse effect on ourconsolidated financial condition or results of operations.
The effects of animal and food-related health issues such as bovine spongiform encephalopathy, alsoknown as “mad cow” disease, foot-and-mouth disease and avian influenza or “bird-flu,” as well as otherhealth issues affecting the food industry may lead to decreased revenues.
We manufacture and sell food packaging products, among other products. Various health issues affectingthe food industry have in the past and may in the future have a negative effect on the sales of food packagingproducts. In recent years, occasional cases of mad cow disease have been confirmed and incidents of bird fluhave surfaced in various countries. Outbreaks of animal diseases may lead governments to restrict exports andimports of potentially affected animals and food products, leading to decreased demand for our products andpossibly also to the culling or slaughter of significant numbers of the animal population otherwise intended for
18
food supply. Also, consumers may change their eating habits as a result of perceived problems with certain typesof food. These factors may lead to reduced sales of food businesses’ products, which could have a materialadverse effect on our consolidated financial condition or results of operations.
Demand for our products could be adversely affected by changes in consumer preferences.
Our sales depend heavily on the volumes of sales by our customers in the food processing and food serviceindustries. Consumer preferences for food and packaging formats of prepackaged food can influence our sales, ascan consumer preferences for fresh and unpackaged foods. Changes in consumer behavior, including changes inconsumer preferences driven by various health-related concerns and perceptions, could negatively impactdemand for our products.
The consolidation of customers may adversely affect our business, consolidated financial condition orresults of operations.
Customers in the building care, food service, food and beverage processing, lodging, retail and health caresectors have been consolidating in recent years, and we believe this trend may continue. Such consolidationcould have an adverse impact on the pricing of our products and services and our ability to retain customers,which could in turn adversely affect our business, consolidated financial condition or results of operations.
We experience competition in the markets for our products and services and in the geographic areas inwhich we operate.
Our packaging products compete with similar products made by other manufacturers and with a number ofother types of materials or products. We compete on the basis of performance characteristics of our products, aswell as service, price and innovations in technology. A number of competing domestic and foreign companies arewell-established.
The market for our Diversey segment’s products is highly competitive. Our Diversey segment facessignificant competition from global, national, regional and local companies within some or all of its product linesin each sector that it serves. Barriers to entry and expansion in the institutional and industrial cleaning, sanitationand hygiene industry are low.
Our inability to maintain a competitive advantage could result in lower prices or lower sales volumes for ourproducts, which would have an adverse impact on our consolidated financial condition or results of operations.
Concerns about greenhouse gas (“GHG”) emissions and climate change and the resulting governmentaland market responses to these issues could increase costs that we incur and could otherwise affect ourconsolidated financial condition or results of operations.
Numerous legislative and regulatory initiatives have been enacted and proposed in response to concernsabout GHG emissions and climate change. We are a manufacturing entity that utilizes petrochemical-based rawmaterials to produce many of our products, including plastic packaging materials. Increased environmentallegislation or regulation could result in higher costs for us in the form of higher raw materials and freight andenergy costs. We could also incur additional compliance costs for monitoring and reporting emissions and formaintaining permits. It is also possible that certain materials might cease to be permitted to be used in ourprocesses.
Disruption and volatility of the financial and credit markets could affect our external liquidity sources.
Our principal sources of liquidity are accumulated cash and cash equivalents, short-term investments, cashflow from operations and amounts available under our existing and new lines of credit, including our new CreditFacility and our accounts receivable securitization program. We cannot assure that we will be able to refinanceany of our indebtedness, including our new senior notes and our new Credit Facility, on commercially reasonableterms or at all. Our accounts receivable securitization program includes a bank financing commitment that mustbe renewed annually prior to the expiration date. The bank financing commitment was renewed on December 2,
19
2011. While the bank is not obligated to renew the bank financing commitment, we have negotiated annualrenewals since the commencement of the program in 2001.
Additionally, conditions in financial markets could affect financial institutions with which we haverelationships and could result in adverse effects on our ability to utilize fully our committed borrowing facilities.For example, a lender under the senior secured credit facilities may be unwilling or unable to fund a borrowingrequest, and we may not be able to replace such lender.
Strengthening of the U.S. dollar and other foreign currency exchange rate fluctuations could materiallyimpact our consolidated financial condition or results of operations.
A majority of our net sales are generated outside the United States. We translate sales and other resultsdenominated in foreign currency into U.S. dollars for our consolidated financial statements. During periods of astrengthening U.S. dollar, our reported international sales and net earnings could be reduced because foreigncurrencies may translate into fewer U.S. dollars.
Also, while we often produce in the same geographic markets as our products are sold, expenses are moreconcentrated in the United States compared with sales, so that in a time of strengthening of the U.S. dollar, ourprofit margins could be reduced. While we use financial instruments to hedge certain foreign currency exposures,this does not insulate us completely from foreign currency effects.
We have recognized foreign exchange gains and losses related to the currency devaluations in Venezuelaand its designation as a highly inflationary economy under U.S. GAAP, effective January 1, 2010. See “SealedAir Management’s Discussion and Analysis of Financial Condition and Results of Operations — Quantitativeand Qualitative Disclosures About Market Risk — Foreign Exchange Rates — Venezuela.”
We may use financial instruments from time to time to manage exposure to foreign exchange ratefluctuations, which exposes us to counterparty credit risk for non-performance. See Note 12, “Derivatives andHedging Activities.”
In all jurisdictions in which we operate, we are also subject to laws and regulations that govern foreigninvestment, foreign trade and currency exchange transactions. These laws and regulations may limit our ability torepatriate cash as dividends or otherwise to the United States and may limit our ability to convert foreigncurrency cash flows into U.S. dollars.
The full realization of our deferred tax assets, including primarily those related to the Settlementagreement, may be affected by a number of factors.
We have deferred tax assets related to the Settlement agreement, other accruals not yet deductible for taxpurposes, foreign tax credits, foreign net operating loss carry forwards and investment tax allowances, employeebenefit items, and other items. We have established valuation allowances to reduce those deferred tax assets to anamount that is more likely than not to be realized. Our ability to utilize these deferred tax assets depends in partupon our future operating results. We expect to realize these assets over an extended period. If we are unable togenerate sufficient future taxable income in certain jurisdictions, or if there is a significant change in the timeperiod within which the underlying temporary differences become taxable or deductible, we could be required toincrease our valuation allowances against our deferred tax assets. This would result in an increase in our effectivetax rate, and would have an adverse effect on our future consolidated results of operations. In addition, changesin statutory tax rates may change our deferred tax assets or liability balances, with either favorable or unfavorableimpact on our effective tax rate. Our deferred tax assets may also be impacted by new legislation or regulation.
Our largest deferred tax asset relates to our Settlement agreement. The value of this asset, which was$384 million at December 31, 2011, may be affected by our tax situation at the time of the payment under theSettlement agreement as well as by the value of our common stock at that time. The deferred tax asset reflects thefair market value of 18 million shares of our common stock at a post-split price of $17.86 per share based on theprice when the Settlement agreement was reached in 2002. We will not be able to realize this deferred tax assetand related cash tax benefits until a plan of reorganization of Grace becomes effective.
20
Our annual effective income tax rate can change materially as a result of changes in our mix of U.S. and foreignearnings and other factors, including changes in tax laws and changes made by regulatory authorities.
Our overall effective income tax rate is equal to our total tax expense as a percentage of total earningsbefore tax. However, income tax expense and benefits are not recognized on a global basis but rather on ajurisdictional or legal entity basis. Losses in one jurisdiction may not be used to offset profits in otherjurisdictions and may cause an increase in our tax rate. Income tax provision changes in statutory tax rates andlaws, as well as ongoing audits by domestic and international authorities, could affect the amount of incometaxes and other taxes paid by us. For example, legislative proposals to change U.S. taxation of non-U.S. earningscould increase our effective tax rate. Also, changes in the mix of earnings (or losses) between jurisdictions andassumptions used in the calculation of income taxes, among other factors, could have a significant effect on ouroverall effective income tax rate. In addition, our effective tax rate would increase if we were unable to generatesufficient future taxable income in certain jurisdictions, or if we were otherwise required to increase ourvaluation allowances against our deferred tax assets.
We are subject to taxation in multiple jurisdictions. As a result, any adverse development in the tax laws ofany of these jurisdictions or any disagreement with our tax positions could have a material adverse effect onour business, consolidated financial condition or results of operations.
We are subject to taxation in, and to the tax laws and regulations of, multiple jurisdictions as a result of theinternational scope of our operations and our corporate and financing structure. We are also subject to transferpricing laws with respect to our intercompany transactions, including those relating to the flow of funds amongour companies. Adverse developments in these laws or regulations, or any change in position regarding theapplication, administration or interpretation thereof, in any applicable jurisdiction, could have a material adverseeffect on our business, consolidated financial condition or results of our operations. In addition, the taxauthorities in any applicable jurisdiction, including the United States, may disagree with the positions we havetaken or intend to take regarding the tax treatment or characterization of any of our transactions. If any applicabletax authorities, including U.S. tax authorities, were to successfully challenge the tax treatment or characterizationof any of our transactions, it could have a material adverse effect on our business, consolidated financialcondition or results of our operations.
Our performance and prospects for future growth could be adversely affected if new products do not meetsales or margin expectations.
Our competitive advantage is due in part to our ability to develop and introduce new products in a timelymanner at favorable margins. The development and introduction cycle of new products can be lengthy andinvolve high levels of investment. New products may not meet sales or margin expectations due to many factors,including our inability to (i) accurately predict demand, end-user preferences and evolving industry standards;(ii) resolve technical and technological challenges in a timely and cost-effective manner; or (iii) achievemanufacturing efficiencies.
A major loss of or disruption in our manufacturing and distribution operations or our information systemsand telecommunication resources could adversely affect our business, consolidated financial condition orresults of operations.
If we experienced a natural disaster, such as a tornado, hurricane, earthquake or other severe weather event,or a casualty loss from an event such as a fire or flood, at one of our larger strategic facilities or if such eventaffected a key supplier, our supply chain or our information systems and telecommunication resources, then therecould be a material adverse effect on our consolidated financial condition or results of operations.
We are dependent on internal and third party information technology networks and systems, including theInternet, to process, transmit and store electronic information. In particular, we depend on our informationtechnology infrastructure for fulfilling and invoicing customer orders, applying cash receipts, and placingpurchase orders with suppliers, making cash disbursements, and conducting digital marketing activities, dataprocessing and electronic communications among business locations. We also depend on telecommunication
21
systems for communications between company personnel and our customers and suppliers. Future systemdisruptions, security breaches or shutdowns could significantly disrupt our operations or result in lost ormisappropriated information and may have a material adverse effect on our business, consolidated financialcondition or results of operations.
We recorded a significant amount of additional goodwill and other identifiable intangible assets as a resultof the acquisition of Diversey, and we may never realize the full carrying value of these assets.
As a result of the acquisition of Diversey, we recorded a significant amount of additional goodwill and otheridentifiable intangible assets, including customer relationships, trademarks and developed technologies.
We test goodwill and intangible assets with indefinite useful lives for possible impairment annually duringthe fourth quarter of each fiscal year or more frequently if events or changes in circumstances indicate that theasset might be impaired. Amortizable intangible assets are periodically reviewed for possible impairmentwhenever there is evidence that events or changes in circumstances indicate that the carrying value may not berecoverable. Impairment may result from, among other things, (i) a decrease in our expected net earnings;(ii) adverse equity market conditions; (iii) a decline in current market multiples; (iv) a decline in our commonstock price; (v) a significant adverse change in legal factors or business climates; (vi) an adverse action orassessment by a regulator; (vii) heightened competition; (viii) strategic decisions made in response to economicor competitive conditions; or (ix) a more-likely-than-not expectation that a reporting unit or a significant portionof a reporting unit will be sold or disposed of. In the event that we determine that events or circumstances existthat indicate that the carrying value of goodwill or identifiable intangible assets may no longer be recoverable,we might have to recognize a non-cash impairment of goodwill or other identifiable intangible assets, whichcould have a material adverse effect on our consolidated financial condition or results of operations.
Product liability claims or regulatory actions could adversely affect our financial results or harm ourreputation or the value of our brands.
Claims for losses or injuries purportedly caused by some of our products arise in the ordinary course of ourbusiness. In addition to the risk of substantial monetary judgments, product liability claims or regulatory actionscould result in negative publicity that could harm our reputation in the marketplace or adversely impact the valueof our brands or our ability to sell our products in certain jurisdictions. We could also be required to recallpossibly defective products, which could result in adverse publicity and significant expenses. Although wemaintain product liability insurance coverage, potential product liability claims could be excluded or exceedcoverage limits under the terms of our insurance policies or could result in increased costs for such coverage.
The relationship with S.C. Johnson & Son, Inc. (“SCJ”) is important to our Diversey business, and anydamage to this relationship could have a material adverse effect on the Diversey business.
Our Diversey segment is party to various agreements with SCJ, including a brand license agreement (the“BLA”), a technology disclosure and license agreement, supply and manufacturing agreements and severalleases. Under the BLA, Diversey is granted a license in specified territories to sell certain SCJ products and usespecified trade names and house marks owned by SCJ including the right to use “Johnson” in combination withits owned trade name “Diversey,” in the institutional and industrial channels of trade and, subject to certainlimitations, in specified channels of trade in which both Diversey’s business and SCJ’s consumer businessoperate. SCJ and its affiliates supply products under the BLA. Sales of these products have historically beensignificant to Diversey’s business. In addition, in some countries, Diversey depends on SCJ to produce or sellsome of its products. If we default under our agreements with SCJ and the agreements are terminated, SCJ failsto perform its obligations under these agreements, or our relationship with SCJ is otherwise damaged or severed,this could have a material adverse effect on our Diversey business, consolidated financial condition or results ofoperations.
Diversey also holds licenses to use some trademarks and technology of Unilever in the market forinstitutional and industrial cleaning, sanitation and hygiene products and related services under licenseagreements with Unilever. We believe that these license agreements are significant to our Diversey business and
22
the termination of our rights under any of these agreements may have a material adverse effect on our Diverseybusiness, consolidated financial condition or results of operations.
If we are unable to retain key employees and other personnel, our consolidated financial condition orresults of operations may be adversely affected.
Our success depends largely on the efforts and abilities of our management team and other key personnel.Their experience and industry contacts significantly benefit us, and we need their expertise to execute ourbusiness strategies. If any of our senior management or other key personnel ceases to work for us, our business,consolidated financial condition or results of operations may be materially adversely affected.
The integration process and our ability to successfully conduct the combined business going forward willrequire the experience and expertise of key employees from both Sealed Air and Diversey. Therefore, the abilityto successfully integrate operations, as well as the future success of the combined company’s operations, willdepend in part on our ability to retain such key employees. We may not be able to retain key employees for thetime period necessary to complete the integration process or beyond. Although we do not have any reason tobelieve any of these employees will cease to be employed by us, the loss of such employees could adverselyaffect our business, consolidated financial condition or results of operations.
On July 28, 2011, David H. Kelsey notified us of his resignation as Chief Financial Officer of the Companyeffective as of August 12, 2011. Tod S. Christie, who was serving as the Company’s Treasurer, was appointed asthe Interim Chief Financial Officer, effective as of the close of business on August 12, 2011. We intend toappoint a new Chief Financial Officer once we have identified and agreed on terms with a suitable candidate. Wecan provide no assurance as to how long it will take us to appoint a new Chief Financial Officer.
We could experience disruptions in operations and/or increased labor costs.
In Europe and Latin America, the majority of our employees is represented by labor unions and is coveredby collective bargaining agreements, which are generally renewable on an annual basis. As is the case with anynegotiation, we may not be able to negotiate acceptable new collective bargaining agreements, which could resultin strikes or work stoppages by affected workers. Renewal of collective bargaining agreements could also resultin higher wages or benefits paid to union members. A disruption in operations or higher ongoing labor costscould materially affect our business.
The United States Patient Protection and Affordable Care Act and the United States Health Care andEducation Reconciliation Act of 2010 could result in increased costs related to our postretirement benefitplans.
In March 2010, the Patient Protection and Affordable Care Act and the Health Care and EducationReconciliation Act of 2010 were signed into law. These statutes include a number of provisions that will impactcompanies that provide retiree health care benefits through postretirement benefit plans and will require certainchanges to be made to individual plans in order to comply with the new legislation.
In addition, these statutes require changes to our information technology infrastructure and in ouradministrative processes. The ultimate extent and cost of these changes, including the timing of when these costswill be recognized in our consolidated financial statements, cannot be determined at this time but will continue tobe evaluated as regulations and interpretations relating to the legislation become available.
We are subject to a variety of environmental and product registration laws that expose us to potentialfinancial liability and increased operating costs.
Our operations are subject to a number of federal, state, local and foreign environmental, health and safetylaws and regulations that govern, among other things, the manufacture of our products, the discharge ofpollutants into the air, soil and water and the use, handling, transportation, storage and disposal of hazardousmaterials.
Some jurisdictions have laws and regulations that govern the registration and labeling of some of ourproducts. Some of these laws require us to have operating permits for our production and warehouse facilities
23
and operations. Any failure to obtain, maintain or comply with the terms of these permits could result in fines orpenalties, revocation or nonrenewal of our permits, or orders to cease certain operations, and may have a materialadverse effect on our business, financial condition, results of operations and cash flows. For example, a recentunfavorable court decision regarding a municipal operating permit for one of our food packaging facilities in SaoPaulo, Brazil leaves the facility subject to an administrative procedure that could lead to the closure of thefacility. Although we are working to resolve the dispute, if our facility is required to close or relocate we couldincur substantial costs.
We generate, use and dispose of hazardous materials in our manufacturing processes. In the event ouroperations result in the release of hazardous materials into the environment, we may become responsible for thecosts associated with the investigation andremediation of sites at which we have released pollutants, or sites where we have disposed or arranged for thedisposal of hazardous wastes, even if we fully complied with environmental laws at the time of disposal. Wehave been, and may continue to be, responsible for the cost of remediation at some locations.
We expect significant future environmental compliance obligations in our European operations as a result ofa European Union (“EU”) Directive “Registration, Evaluation, Authorization, and Restriction of Chemicals” (EUDirective No. 2006/1907) enacted on December 18, 2006. The directive imposes several requirements related tothe identification and management of risks related to chemical substances manufactured or marketed in Europe.The EU has also recently enacted a “Classification, Packaging and Labeling” regulation. Other jurisdictions mayimpose similar requirements.
We cannot predict with reasonable certainty the future cost to us of environmental compliance, productregistration, or environmental remediation. Environmental laws have become more stringent and complex overtime. Our environmental costs and operating expenses will be subject to evolving regulatory requirements andwill depend on the scope and timing of the effectiveness of requirements in these various jurisdictions. As aresult of such requirements, we may be subject to an increased regulatory burden, and we expect significantfuture environmental compliance obligations in our operations. Increased compliance costs, increasing risks andpenalties associated with violations, or our inability to market some of our products in certain jurisdictions mayhave a material adverse effect on our business, consolidated financial condition or results of operations.
The legacy Diversey business had tendered various environmental indemnification claims to Unileverpursuant to the Unilever Acquisition Agreement (as defined below).
Under a previous acquisition agreement between the legacy Diversey business and Unilever (the “UnileverAcquisition Agreement”), Unilever made warranties to Diversey with respect to the facilities formerly owned byUnilever. In addition, Unilever agreed to indemnify Diversey for specified types of environmental liabilities ifthe aggregate amount of damages meets various dollar thresholds, subject to a cap of $250 million in theaggregate. Diversey was required to notify Unilever of any environmental indemnification claims by May 3,2008. Any environmental claims pending after this date, with respect to which Diversey has notified Unilever,remain subject to indemnification until remediation is completed in accordance with the Unilever AcquisitionAgreement. If Diversey incurs damages or liabilities that do not meet the indemnity thresholds under theUnilever Acquisition Agreement, if Diversey failed to notify Unilever of an environmental indemnity claimwithin the period specified in the Unilever Acquisition Agreement or if the aggregate limits on indemnitypayments under the Unilever Acquisition Agreement become applicable, Diversey would not be entitled toindemnity from Unilever for such non-qualifying claims and it would be required to bear the costs.
Diversey has previously tendered various environmental indemnification claims to Unilever in connectionwith former Unilever locations. Unilever has not indicated its agreement with Diversey’s request forindemnification. We may file additional requests for reimbursement in the future in connection with pendingindemnification claims. However, there can be no assurance that we will be able to recover any amounts relatingto these indemnification claims from Unilever.
24
Our insurance policies may not cover all operating risks and a casualty loss beyond the limits of ourcoverage could adversely impact our business.
Our business is subject to operating hazards and risks relating to handling, storing, transporting and use ofthe products we sell. We maintain insurance policies in amounts and with coverage and deductibles that webelieve are reasonable and prudent. Nevertheless, our insurance coverage may not be adequate to protect us fromall liabilities and expenses that may arise from claims for personal injury or death or property damage arising inthe ordinary course of business, and our current levels of insurance may not be maintained or available in thefuture at economical prices. If a significant liability claim is brought against us that is not adequately covered byinsurance, we may have to pay the claim with our own funds, which could have a material adverse effect on ourbusiness, consolidated financial condition or results of operations.
If we are not able to protect our trade secrets or maintain our trademarks, patents and other intellectualproperty, we may not be able to prevent competitors from developing similar products or from marketingtheir products in a manner that capitalizes on our trademarks, and this loss of a competitive advantagecould decrease our profitability and liquidity.
Our ability to compete effectively with other companies depends, in part, on our ability to maintain theproprietary nature of our owned and licensed intellectual property. If we were unable to maintain the proprietarynature of our intellectual property and our significant current or proposed products, this loss of a competitiveadvantage could result in decreased sales or increased operating costs, either of which could have a materialadverse effect on our business, consolidated financial condition or results of operations.
We rely on trade secrets to maintain our competitive position, including protecting the formulation andmanufacturing techniques of many of our products. As such, we have not sought U.S. or international patentprotection for some of our principal product formula and manufacturing processes. Accordingly, we may not beable to prevent others from developing products that are similar to or competitive with our products.
We own a large number of patents and pending patent applications on our products, aspects thereof,methods of use, and/or methods of manufacturing. There is a risk that our patents may not provide meaningfulprotection and patents may never be issued for our pending patent applications.
We own, or have licenses to use, all of the material trademark and trade name rights used in connection withthe packaging, marketing and distribution of our major products both in the United States and in other countrieswhere our products are principally sold. Trademark and trade name protection is important to our business.Although most of our trademarks are registered in the United States and in the foreign countries in which weoperate, we may not be successful in asserting trademark or trade name protection. In addition, the laws of someforeign countries may not protect our intellectual property rights to the same extent as the laws of the UnitedStates. The costs required to protect our trademarks and trade names may be substantial.
We cannot be certain that we will be able to assert these intellectual property rights successfully in thefuture or that they will not be invalidated, circumvented or challenged. Other parties may infringe on ourintellectual property rights and may thereby dilute the value of our intellectual property in the marketplace. Thirdparties, including competitors, may assert intellectual property infringement or invalidity claims against us thatcould be upheld. Intellectual property litigation, which could result in substantial cost to and diversion of effortby us, may be necessary to protect our trade secrets or proprietary technology or for us to defend against claimedinfringement of the rights of others and to determine the scope and validity of others’ proprietary rights. We maynot prevail in any such litigation, and if we are unsuccessful, we may not be able to obtain any necessary licenseson reasonable terms or at all.
Any failure by us to protect our trademarks and other intellectual property rights may have a materialadverse effect on our business, consolidated financial condition or results of operations.
The relocation of manufacturing capability from Diversey’s U.S. manufacturing facility could adverselyaffect our business, consolidated financial condition or results of operations.
Our legacy Diversey business manufactures a significant portion of the products it sells. The lease from SCJof the Waxdale manufacturing facility in Sturtevant, Wisconsin will expire on May 31, 2013, and we do not plan
25
to renew this lease after expiration. We have made arrangements to relocate its manufacturing capability bymoving some production to its other locations in North America, and by pursuing contract manufacturing for aportion of its product lines. The timeline to transition out of Waxdale is not certain, but production is expected tocease and decommissioning is expected to begin during the first half of 2012. This relocation may posesignificant risks, which could include:
‰ the risk that we may be unable to integrate successfully the relocated manufacturing operations;
‰ the risk that we may be unable to coordinate management and integrate and retain employees of therelocated manufacturing operations;
‰ the risk that we may face difficulties in implementing and maintaining consistent standards, controls,procedures, policies and information systems;
‰ the risk that we may fail to realize anticipated synergies, economies of scale or other anticipated benefits,or to maintain operating margins;
‰ potential strains on our personnel, systems and resources, and diversion of attention from other priorities;and
‰ any unforeseen or contingent liabilities of the relocated manufacturing operations.
We may not achieve growth through acquisitions.
As part of our business strategy, we may from time to time pursue acquisitions of companies that we believeare strategic to our business. There can be no assurance that we will be able to identify attractive acquisitiontargets, negotiate satisfactory terms for acquisitions or obtain necessary financing for acquisitions. Further,acquisitions involve risks, including that acquired businesses will not perform in accordance with expectations,that we will not realize the operating efficiencies expected from acquisitions and that business judgmentsconcerning the value, strengths and weaknesses of companies we acquire will prove to have been incorrect. If wefail to complete acquisitions, if we acquire companies but are not able to successfully integrate them with ourbusiness or if we do not otherwise realize the anticipated financial and strategic goals for our acquisitions, ourbusiness and results of operations may be adversely affected. In addition, future acquisitions may result in theincurrence of debt and contingent liabilities and an increase in interest expense, amortization expenses andsignificant charges relating to integration costs.
The combination of our business with the Diversey business will require significant management attention,and we may incur significant additional integration costs because of integration difficulties and otherchallenges.
We are in the process of integrating the Diversey business with our legacy business. We are required todevote significant management attention and resources to integrating the two businesses. Our failure to meet thechallenges involved in successfully completing the integration of our operations could adversely affect ourresults of operations. Challenges involved in the integration include:
‰ integrating successfully each company’s operations; and
‰ combining corporate cultures, maintaining employee morale and retaining key employees.
We may not successfully complete the integration of our operations in a timely manner and may havedifficulty integrating the Diversey business. We may not achieve the synergy targets that we currently anticipate.We may experience disruptions in relationships with current and new employees, customers and suppliers.
We already have incurred and we expect to incur additional non-recurring costs associated with combiningthe operations of the two companies. Some of these costs may be higher than anticipated. We may also incurunanticipated costs, including costs to maintain employee morale, retain key employees and successfullyintegrate the Diversey business.
26
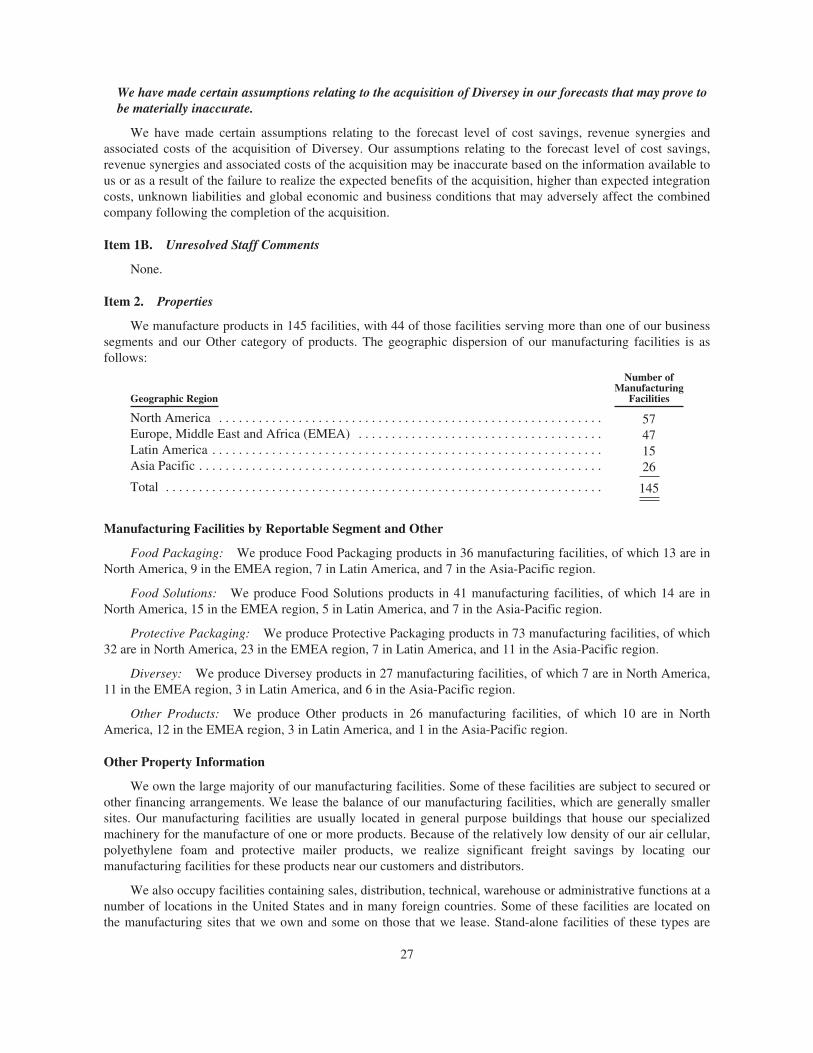
We have made certain assumptions relating to the acquisition of Diversey in our forecasts that may prove tobe materially inaccurate.
We have made certain assumptions relating to the forecast level of cost savings, revenue synergies andassociated costs of the acquisition of Diversey. Our assumptions relating to the forecast level of cost savings,revenue synergies and associated costs of the acquisition may be inaccurate based on the information available tous or as a result of the failure to realize the expected benefits of the acquisition, higher than expected integrationcosts, unknown liabilities and global economic and business conditions that may adversely affect the combinedcompany following the completion of the acquisition.
Item 1B. Unresolved Staff Comments
None.
Item 2. Properties
We manufacture products in 145 facilities, with 44 of those facilities serving more than one of our businesssegments and our Other category of products. The geographic dispersion of our manufacturing facilities is asfollows:
Geographic Region
Number ofManufacturing
Facilities
North America . . . . . . . . . . . . . . . . . . . . . . . . . . . . . . . . . . . . . . . . . . . . . . . . . . . . . . . . . . 57Europe, Middle East and Africa (EMEA) . . . . . . . . . . . . . . . . . . . . . . . . . . . . . . . . . . . . . 47Latin America . . . . . . . . . . . . . . . . . . . . . . . . . . . . . . . . . . . . . . . . . . . . . . . . . . . . . . . . . . . 15Asia Pacific . . . . . . . . . . . . . . . . . . . . . . . . . . . . . . . . . . . . . . . . . . . . . . . . . . . . . . . . . . . . . 26
Total . . . . . . . . . . . . . . . . . . . . . . . . . . . . . . . . . . . . . . . . . . . . . . . . . . . . . . . . . . . . . . . . . . 145
Manufacturing Facilities by Reportable Segment and Other
Food Packaging: We produce Food Packaging products in 36 manufacturing facilities, of which 13 are inNorth America, 9 in the EMEA region, 7 in Latin America, and 7 in the Asia-Pacific region.
Food Solutions: We produce Food Solutions products in 41 manufacturing facilities, of which 14 are inNorth America, 15 in the EMEA region, 5 in Latin America, and 7 in the Asia-Pacific region.
Protective Packaging: We produce Protective Packaging products in 73 manufacturing facilities, of which32 are in North America, 23 in the EMEA region, 7 in Latin America, and 11 in the Asia-Pacific region.
Diversey: We produce Diversey products in 27 manufacturing facilities, of which 7 are in North America,11 in the EMEA region, 3 in Latin America, and 6 in the Asia-Pacific region.
Other Products: We produce Other products in 26 manufacturing facilities, of which 10 are in NorthAmerica, 12 in the EMEA region, 3 in Latin America, and 1 in the Asia-Pacific region.
Other Property Information
We own the large majority of our manufacturing facilities. Some of these facilities are subject to secured orother financing arrangements. We lease the balance of our manufacturing facilities, which are generally smallersites. Our manufacturing facilities are usually located in general purpose buildings that house our specializedmachinery for the manufacture of one or more products. Because of the relatively low density of our air cellular,polyethylene foam and protective mailer products, we realize significant freight savings by locating ourmanufacturing facilities for these products near our customers and distributors.
We also occupy facilities containing sales, distribution, technical, warehouse or administrative functions at anumber of locations in the United States and in many foreign countries. Some of these facilities are located onthe manufacturing sites that we own and some on those that we lease. Stand-alone facilities of these types are
27
generally leased. Our global headquarters are located in a leased property in Elmwood Park, New Jersey. For alist of those countries outside of the United States where we have operations, see “Foreign Operations” above.Our website, www.sealedair.com, contains additional information about our worldwide business.
We believe that our manufacturing, warehouse, office and other facilities are well maintained, suitable fortheir purposes and adequate for our needs.
Item 3. Legal Proceedings
The information set forth in Part II, Item 8 of this Annual Report on Form 10-K in Note 17, “Commitmentsand Contingencies,” under the caption “Cryovac Transaction Commitments and Contingencies” is incorporatedherein by reference.
At December 31, 2011, we were a party to, or otherwise involved in, several federal, state and foreignenvironmental proceedings and private environmental claims for the cleanup of “Superfund” sites under theComprehensive Environmental Response, Compensation, and Liability Act of 1980 and other sites. We may havepotential liability for investigation and cleanup of some of these sites. It is our policy to accrue for environmentalcleanup costs if it is probable that a liability has been incurred and if we can reasonably estimate an amount orrange of costs associated with various alternative remediation strategies, without giving effect to any possiblefuture insurance proceeds. As assessments and cleanups proceed, we review these liabilities periodically andadjust our reserves as additional information becomes available. At December 31, 2011, environmental relatedreserves were not material to our consolidated financial condition or results of operations. While it is oftendifficult to estimate potential liabilities and the future impact of environmental matters, based upon theinformation currently available to us and our experience in dealing with these matters, we believe that ourpotential future liability with respect to these sites is not material to our consolidated financial condition orresults of operations.
We are also involved in various other legal actions incidental to our business. We believe, after consultingwith counsel, that the disposition of these other legal proceedings and matters will not have a material effect onour consolidated financial condition or results of operations.
Item 4. Mine Safety Disclosures.
Not applicable
28
Part II
Item 5. Market for Registrant’s Common Equity, Related Stockholder Matters and Issuer Purchases ofEquity Securities
Market Information
Our common stock is listed on the New York Stock Exchange under the trading symbol SEE. The tablebelow shows the quarterly high and low closing sales prices of our common stock and cash dividends per sharefor 2011 and 2010.
2011 High Low Dividends
First Quarter . . . . . . . . . . . . . . . . . . . . . . . . . . . . . . . . . . . . . . . . . . . . . . $28.52 $25.15 $0.13
Second Quarter . . . . . . . . . . . . . . . . . . . . . . . . . . . . . . . . . . . . . . . . . . . 26.90 21.89 0.13
Third Quarter . . . . . . . . . . . . . . . . . . . . . . . . . . . . . . . . . . . . . . . . . . . . . 23.87 16.70 0.13
Fourth Quarter . . . . . . . . . . . . . . . . . . . . . . . . . . . . . . . . . . . . . . . . . . . . 18.72 15.61 0.13
2010 High Low Dividends
First Quarter . . . . . . . . . . . . . . . . . . . . . . . . . . . . . . . . . . . . . . . . . . . . . . $22.02 $18.84 $0.12
Second Quarter . . . . . . . . . . . . . . . . . . . . . . . . . . . . . . . . . . . . . . . . . . . 23.26 19.72 0.12
Third Quarter . . . . . . . . . . . . . . . . . . . . . . . . . . . . . . . . . . . . . . . . . . . . . 22.96 19.49 0.13
Fourth Quarter . . . . . . . . . . . . . . . . . . . . . . . . . . . . . . . . . . . . . . . . . . . . 25.59 22.25 0.13
As of January 31, 2012, there were approximately 6,000 holders of record of our common stock.
Dividends
Our new Credit Facility and the Notes contain covenants that restrict our ability to declare or pay dividends.However, we do not believe these covenants are likely to materially limit the future payment of quarterly cashdividends on our common stock.
The following table shows our total cash dividends paid each year since we initiated quarterly cash dividendpayments in 2006.
Total CashDividends Paid
Total CashDividends Paid per
Common Share
(In millions)
2006 . . . . . . . . . . . . . . . . . . . . . . . . . . . . . . . . . . . . . . . . . . . . . . . . . $ 48.6 $0.30
2007 . . . . . . . . . . . . . . . . . . . . . . . . . . . . . . . . . . . . . . . . . . . . . . . . . 64.6 0.40
2008 . . . . . . . . . . . . . . . . . . . . . . . . . . . . . . . . . . . . . . . . . . . . . . . . . 76.4 0.48
2009 . . . . . . . . . . . . . . . . . . . . . . . . . . . . . . . . . . . . . . . . . . . . . . . . . 75.7 0.48
2010 . . . . . . . . . . . . . . . . . . . . . . . . . . . . . . . . . . . . . . . . . . . . . . . . . 79.7 0.50
2011 . . . . . . . . . . . . . . . . . . . . . . . . . . . . . . . . . . . . . . . . . . . . . . . . . 87.4 0.52
Total . . . . . . . . . . . . . . . . . . . . . . . . . . . . . . . . . . . . . . . . . . . . . . . . . $432.4
On February 16, 2012, our Board of Directors declared a quarterly cash dividend of $0.13 per commonshare payable on March 16, 2012 to stockholders of record at the close of business on March 2, 2012. Theestimated amount of this dividend payment is $25 million based on 192 million shares of our common stockissued and outstanding as of January 31, 2012.
The dividend payments discussed above are recorded as reductions to cash and cash equivalents andretained earnings on our consolidated balance sheets. From time to time, we may consider other means ofreturning value to our stockholders based on our consolidated financial condition and results of operations. Thereis no guarantee that our Board of Directors will declare any further dividends.
29
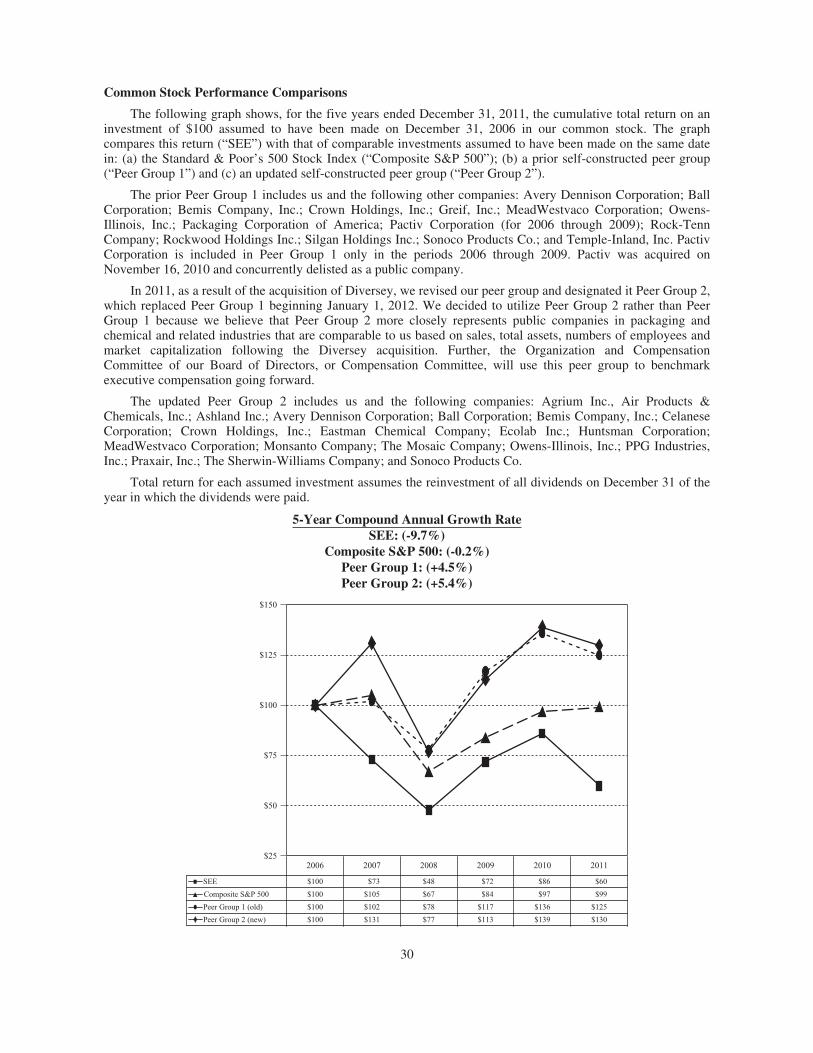
Common Stock Performance Comparisons
The following graph shows, for the five years ended December 31, 2011, the cumulative total return on aninvestment of $100 assumed to have been made on December 31, 2006 in our common stock. The graphcompares this return (“SEE”) with that of comparable investments assumed to have been made on the same datein: (a) the Standard & Poor’s 500 Stock Index (“Composite S&P 500”); (b) a prior self-constructed peer group(“Peer Group 1”) and (c) an updated self-constructed peer group (“Peer Group 2”).
The prior Peer Group 1 includes us and the following other companies: Avery Dennison Corporation; BallCorporation; Bemis Company, Inc.; Crown Holdings, Inc.; Greif, Inc.; MeadWestvaco Corporation; Owens-Illinois, Inc.; Packaging Corporation of America; Pactiv Corporation (for 2006 through 2009); Rock-TennCompany; Rockwood Holdings Inc.; Silgan Holdings Inc.; Sonoco Products Co.; and Temple-Inland, Inc. PactivCorporation is included in Peer Group 1 only in the periods 2006 through 2009. Pactiv was acquired onNovember 16, 2010 and concurrently delisted as a public company.
In 2011, as a result of the acquisition of Diversey, we revised our peer group and designated it Peer Group 2,which replaced Peer Group 1 beginning January 1, 2012. We decided to utilize Peer Group 2 rather than PeerGroup 1 because we believe that Peer Group 2 more closely represents public companies in packaging andchemical and related industries that are comparable to us based on sales, total assets, numbers of employees andmarket capitalization following the Diversey acquisition. Further, the Organization and CompensationCommittee of our Board of Directors, or Compensation Committee, will use this peer group to benchmarkexecutive compensation going forward.
The updated Peer Group 2 includes us and the following companies: Agrium Inc., Air Products &Chemicals, Inc.; Ashland Inc.; Avery Dennison Corporation; Ball Corporation; Bemis Company, Inc.; CelaneseCorporation; Crown Holdings, Inc.; Eastman Chemical Company; Ecolab Inc.; Huntsman Corporation;MeadWestvaco Corporation; Monsanto Company; The Mosaic Company; Owens-Illinois, Inc.; PPG Industries,Inc.; Praxair, Inc.; The Sherwin-Williams Company; and Sonoco Products Co.
Total return for each assumed investment assumes the reinvestment of all dividends on December 31 of theyear in which the dividends were paid.
5-Year Compound Annual Growth RateSEE: (-9.7%)
Composite S&P 500: (-0.2%)Peer Group 1: (+4.5%)Peer Group 2: (+5.4%)
$73
$105
$100
$100
$100
$100
$102
$48
$67
$78
$72
$84
$117
$86
$97
$136
$60
$99
$125
$131 $77 $113 $139 $130
Peer Group 1 (old)
Peer Group 2 (new)
Composite S&P 500
SEE
$25
$50
$75
$100
$125
$150
201120102009200820072006
30
Issuer Purchases of Equity Securities
The table below sets forth the total number of shares of our common stock, par value $0.10 per share, thatwe repurchased in each month of the quarter ended December 31, 2011, the average price paid per share and themaximum number of shares that may yet be purchased under our publicly announced plans or programs.
Period
TotalNumber of
SharesPurchased (1)
(a)
AveragePrice
Paid PerShare
(b)
Total Number ofShare Purchased
As Part of PubliclyAnnounced Plansor Programs (c)
MaximumNumber of Sharesthat May Yet BePurchased Under
the Plans orPrograms (d)
Balance as of September 30, 2011 . . — $— — 15,546,142
October 1, 2011 through October 31,2011 . . . . . . . . . . . . . . . . . . . . . . . 8,500 — — 15,546,142
November 1, 2011 throughNovember 30, 2011 . . . . . . . . . . . 8,000 — — 15,546,142
December 1, 2011 throughDecember 31, 2011 . . . . . . . . . . . . 4,220 — — 15,546,142
Total . . . . . . . . . . . . . . . . . . . . . . . . . 20,720 $— — 15,546,142
(1) We did not purchase any shares during the quarter ended December 31, 2011 pursuant to our publiclyannounced program (described below). We did acquire shares by means of (a) shares withheld from awardsunder our 2005 contingent stock plan pursuant to the provision thereof that permits tax withholdingobligations or other legally required charges to be satisfied by having us withhold shares from an awardunder that plan and (b) shares reacquired pursuant to the forfeiture provision of our 2005 contingent stockplan. (See table below.) We report price calculations in column (b) in the table above only for sharespurchased as part of our publicly announced program, when applicable, including commissions. For shareswithheld for tax withholding obligations or other legally required charges, we withhold shares at a priceequal to their fair market value. We do not make payments for shares reacquired by the Company pursuant tothe forfeiture provision of the 2005 contingent stock plan as those shares are simply forfeited.
Period
Shares withheld for taxobligations and charges
(a)
Average withholding pricefor shares in column “a”
(b)
Forfeitures under 2005Contingent Stock Plan
(c)Total
(d)
October 2011 . . . . . — $ — 8,500 8,500
November 2011 . . . — — 8,000 8,000
December 2011 . . . . 3,420 18.46 800 4,220
Total . . . . . . . . . . . . 3,420 $18.46 17,300 20,720
On August 9, 2007, we announced that our Board of Directors had approved a share repurchase programauthorizing us to repurchase in the aggregate up to 20 million shares of our issued and outstanding common stock(described further under the caption, “Repurchases of Capital Stock,” in “Management’s Discussion and Analysisof Financial Condition and Results of Operations” in Part II Item 7 of this Annual Report on Form 10-K). Thisprogram has no set expiration date. This program replaced our prior share repurchase program, which weterminated at that time.
31
Item 6. Selected Financial Data
Year Ended December 31,
2011(1) 2010 2009 2008 2007
(In millions, except per common share data)
Consolidated Statements of Operations Data(2):Net sales . . . . . . . . . . . . . . . . . . . . . . . . . . . . . . . . . . . $ 5,640.9 $4,490.1 $4,242.8 $4,843.5 $4,651.2Gross profit . . . . . . . . . . . . . . . . . . . . . . . . . . . . . . . . . 1,641.2 1,252.8 1,218.5 1,236.6 1,301.1Operating profit . . . . . . . . . . . . . . . . . . . . . . . . . . . . . . 447.4 535.0 492.3 396.5 549.3Earnings before income tax provision . . . . . . . . . . . . . 216.1 343.4 329.9 222.3 456.0Net earnings . . . . . . . . . . . . . . . . . . . . . . . . . . . . . . . . . 149.1 255.9 244.3 179.9 353.0Basic and diluted net earnings per common share:
Basic . . . . . . . . . . . . . . . . . . . . . . . . . . . . . . . . . . . . $ 0.89 $ 1.61 $ 1.54 $ 1.13 $ 2.19Diluted . . . . . . . . . . . . . . . . . . . . . . . . . . . . . . . . . . . $ 0.80 $ 1.44 $ 1.35 $ 0.99 $ 1.88
Common stock dividends . . . . . . . . . . . . . . . . . . . . . . $ 88.7 $ 80.9 $ 77.5 $ 76.4 $ 64.6Consolidated Balance Sheets Data:
Cash and cash equivalents . . . . . . . . . . . . . . . . . . . . . . $ 722.8 $ 675.6 $ 694.5 $ 128.9 $ 430.3Intangible assets, net . . . . . . . . . . . . . . . . . . . . . . . . . . 2,103.2 78.0 58.4 64.2 70.4Goodwill . . . . . . . . . . . . . . . . . . . . . . . . . . . . . . . . . . . 4,220.5 1,945.9 1,948.7 1,938.1 1,969.7Total assets . . . . . . . . . . . . . . . . . . . . . . . . . . . . . . . . . 11,496.7 5,399.4 5,420.1 4,986.0 5,438.3Settlement agreement and related accrued interest . . . 831.2 787.9 746.8 707.8 670.9Long-term debt, less current portion(3) . . . . . . . . . . . 5,010.9 1,399.2 1,626.3 1,289.9 1,531.6Total stockholders’ equity . . . . . . . . . . . . . . . . . . . . . . 2,952.4 2,401.6 2,200.3 1,925.6 2,025.5Working capital . . . . . . . . . . . . . . . . . . . . . . . . . . . . . . 879.1 592.3 639.6 50.5 194.5
Consolidated Cash Flows Data:Net cash provided by operating activities . . . . . . . . . . $ 392.1 $ 483.1 $ 552.0 $ 404.4 $ 378.1Net cash used in investing activities . . . . . . . . . . . . . . (2,370.4) (96.9) (70.3) (176.7) (274.1)Net cash provided by (used in) financing activities . . 2,023.6 (373.0) 90.3 (562.9) (59.5)
Other Financial Data:Depreciation and amortization(4) . . . . . . . . . . . . . . . . $ 189.5 $ 154.7 $ 154.5 $ 155.0 $ 150.4Share-based incentive compensation(4) . . . . . . . . . . . 25.0 30.6 38.8 16.5 15.9Capital expenditures . . . . . . . . . . . . . . . . . . . . . . . . . . 124.5 87.6 80.3 180.7 210.8
(1) Includes the financial results of Diversey for the period beginning October 3, 2011 through December 31,2011. The financial results included in this Form 10-K related to the acquisition accounting for the Diverseytransaction are subject to change as the acquisition method of accounting is not yet finalized and dependentupon the finalization of management’s review of certain independent valuations and studies. See Note 3,“Acquisition of Diversey Holdings, Inc.,” for further information about the acquisition and relatedtransactions and the acquisition method of accounting.
(2) See Item 7, “Management’s Discussion and Analysis of Financial Condition and Results of Operations,” for adiscussion of the factors that contributed to our consolidated operating results for the three years endedDecember 31, 2011.
(3) See Note 11, “Debt and Credit Facilities,” for a discussion of our outstanding debt and available lines ofcredit.
(4) The depreciation and amortization amounts for 2007 and 2008 have been adjusted to exclude share-basedincentive compensation expense to conform to the 2009 through 2011 presentation. Share-based incentivecompensation expense is included in marketing, administrative and development expenses on ourconsolidated statements of operations for all periods.
32
Item 7. Management’s Discussion and Analysis of Financial Condition and Results of Operations
The information in Management’s Discussion and Analysis of Financial Condition and Results ofOperations (“MD&A”) should be read together with our consolidated financial statements and related notes setforth in Part II, Item 8, as well as the discussion included in Part I, Item 1A, “Risk Factors,” of this AnnualReport on Form 10-K. All amounts and percentages are approximate due to rounding and all dollars are inmillions, except per share amounts.
Cautionary Notice Regarding Forward-Looking Statements
This report contains “forward-looking statements” within the meaning of the Private Securities LitigationReform Act of 1995 concerning our business, consolidated financial condition and results of operations. Allstatements other than statements of historical facts included in this report regarding our strategies, prospects,financial condition, costs, plans and objectives are forward-looking statements. The SEC encourages companiesto disclose forward-looking statements so that investors can better understand a company’s future prospects andmake informed investment decisions. Some of our statements in this report, in documents incorporated byreference into this report and in our future oral and written statements may be forward-looking. These statementsreflect our beliefs and expectations as to future events and trends affecting our business, our consolidatedfinancial condition and results of operations. These forward-looking statements are based upon our currentexpectations concerning future events and discuss, among other things, anticipated future financial performanceand future business plans. Forward-looking statements are necessarily subject to risks and uncertainties, many ofwhich are outside our control, that could cause actual results to differ materially from these statements. Forward-looking statements can be identified by such words as “anticipates,” “believes,” “plan,” “assumes,” “could,”“should,” “estimates,” “expects,” “intends,” “potential,” “seek,” “predict,” “may,” “will” and similar expressions.Examples of these forward-looking statements include projections regarding our financial performance such asthose in the “Components of Change in Net Sales” and “Cost of Sales” sections of our MD&A.
The following are important factors that we believe could cause actual results to differ materially from thosein our forward-looking statements: the implementation of our Settlement agreement regarding the variousasbestos-related, fraudulent transfer, successor liability, and indemnification claims made against the Companyarising from a 1998 transaction with W. R. Grace & Co.; global economic conditions; credit ratings; changes inraw material pricing and availability; changes in energy costs; competitive conditions and contract terms;currency translation and devaluation effects, including in Venezuela; the success of our financial growth,profitability, cash generation and manufacturing strategies and our cost reduction and productivity efforts; theeffects of animal and food-related health issues; pandemics; consumer preferences; environmental matters;regulatory actions and legal matters; successful integration and the other information referenced below underItem 1A, “Risk Factors.” Except as required by the federal securities laws, we undertake no obligation to updateor revise any forward-looking statement, whether as a result of new information, future events or otherwise.
Non-U.S. GAAP Information
In our MD&A, we present financial information in accordance with U.S. GAAP. In addition, we presentfinancial information that does not conform to U.S. GAAP, which we refer to as non-U.S. GAAP, as ourmanagement believes it is useful to investors. In addition, non-U.S. GAAP measures are used by management toreview and analyze our operating performance and, along with other data, as internal measures for setting annualbudgets and forecasts, assessing financial performance, providing guidance and comparing our financialperformance with our peers. The non-U.S. GAAP information has limitations as an analytical tool and should notbe considered in isolation from or as a substitute for U.S. GAAP information. It does not purport to represent anysimilarly titled U.S. GAAP information and is not an indicator of our performance under U.S. GAAP. Further,non-U.S. GAAP financial measures that we present may not be comparable with similarly titled measures usedby others. Investors are cautioned against placing undue reliance on these non-U.S. GAAP measures. Further,investors are urged to review and consider carefully the adjustments made by management to the most directlycomparable U.S. GAAP financial measure to arrive at these non-U.S. GAAP financial measures.
33
Our management may assess our financial results, such as gross profit, operating profit and diluted netearnings per common share (“EPS”), both on a U.S. GAAP basis and on an adjusted non-U.S. GAAP basis.Examples of some other supplemental financial metrics our management will also use to assess our financialperformance include Earnings before Interest Expense, Taxes, Depreciation and Amortization (“EBITDA”),Adjusted EBITDA, Adjusted EPS, Adjusted Cash EPS and Free Cash Flow. These non-U.S. GAAP financialmeasures provide management with additional means to understand and evaluate the core operating results andtrends in our ongoing business by eliminating certain one-time expenses and/or gains (which may not occur ineach period presented) and other items that management believes might otherwise make comparisons of ourongoing business with prior periods and peers more difficult, obscure trends in ongoing operations or reducemanagement’s ability to make useful forecasts. Our non-U.S. GAAP financial measures may also be consideredin calculations of our performance measures set by the Organization and Compensation Committee of our Boardof Directors for purposes of determining incentive compensation.
The non-U.S. GAAP financial metrics mentioned above exclude items we consider unusual or special itemsand also exclude their related tax effects. We evaluate the unusual or special items on an individual basis. Ourevaluation of whether to exclude an unusual or special item for purposes of determining our non-U.S. GAAPfinancial measures considers both the quantitative and qualitative aspects of the item, including, among otherthings (i) its nature, (ii) whether or not it relates to our ongoing business operations, and (iii) whether or not weexpect it to occur as part of our normal business on a regular basis.
Another non-U.S GAAP financial metric we present is our core income tax provision and/or core tax rate.Our core taxes are measures of our U.S. GAAP reported effective tax rate, which is adjusted for the same itemsapplicable to our core taxes that are excluded from our adjusted net earnings and adjusted EPS metrics. Weconsider our core taxes as an indicator of the taxes on our core business. The tax situation and effective tax rateof a specific country where the excluded or special items occur will determine the impact (positive or negative)on our core taxes.
In our “Highlights of Financial Performance,” “Net Sales by Segment Reporting Structure,” “Net Sales byGeographic Region” and in some of the discussions and tables that follow, we exclude the impact of foreigncurrency translation when presenting net sales information, which we define as “constant dollar.” Changes in netsales excluding the impact of foreign currency translation are non-U.S. GAAP financial measures. As aworldwide business, it is important that we take into account the effects of foreign currency translation when weview our results and plan our strategies. Nonetheless, we cannot directly control changes in foreign currencyexchange rates. Consequently, when our management looks at net sales to measure the performance of ourbusiness, we typically exclude the impact of foreign currency translation from net sales. We also may exclude theimpact of foreign currency translation when making incentive compensation determinations. As a result, ourmanagement believes that these presentations may be useful to investors.
Overview
We are a global leader in food safety and security, facility hygiene and product protection. We serve anarray of end markets including food and beverage processing, food service, retail, health care and industrial,commercial and consumer applications. We have widely recognized and inventive brands such as Bubble Wrap®
brand cushioning, Cryovac® brand food packaging solutions and now, as a result of our acquisition of Diverseyon October 3, 2011, Diversey® brand cleaning and hygiene solutions. We offer efficient and sustainable solutionsthat create business value for customers, enhance the quality of life for consumers and provide a cleaner andhealthier environment for future generations.
At December 31, 2011, we employed approximately 8,200 sales, marketing and customer service personnelthroughout the world who sell and market our products to and through a large number of distributors, fabricators,converters, e-commerce and mail order fulfillment firms, and contract packaging firms as well as directly toend-users such as food processors, foodservice businesses, supermarket retailers, lodging, retail pharmaceuticalcompanies, health care facilities, medical device manufacturers, and other manufacturers. We have no materiallong-term contracts for the distribution of our products. In 2011, no customer or affiliated group of customersaccounted for 10% or more of our consolidated net sales.
34
Historically, net sales in our food businesses have tended to be slightly lower in the first quarter and slightlyhigher towards the end of the third quarter through the fourth quarter, due to holiday events. Net sales in ourProtective Packaging segment have also tended to be slightly lower in the first quarter and higher during the“back-to-school” season in the mid-third quarter and through the fourth quarter due to the holiday shoppingseason. The Diversey segment’s net sales trend slightly lower in the first quarter, while second quarter salesrepresent a modest seasonal peak due to the European-based lodging and food and beverage demand. On aconsolidated basis, there is little seasonality in the business, with net sales slightly lower in the first quarter andslightly higher towards the end of the third quarter through the fourth quarter. Our consolidated net earningstypically trend directionally the same as our net sales seasonality.
However, other factors may outweigh the effects of seasonal changes in our net earnings results including,but not limited to, changes in raw materials and other costs, foreign exchange rates, interest rates, taxes andrestructuring and the timing and amount of acquisition synergies and other non-recurring charges.
Competition for most of our packaging products is based primarily on packaging performancecharacteristics, service and price. Competition is also based upon innovations in packaging technology and, as aresult, we maintain ongoing research and development programs to enable us to maintain technologicalleadership. Our Diversey solutions face a wide spectrum of competitors across each product category.Competition is both global and regional in scope and includes numerous small, local competitors with limitedproduct portfolios and geographic reach. For more details, see “Competition” included in “Business,” of Item 1,Part I.
Our net sales are sensitive to developments in our customers’ business or market conditions, changes in theglobal economy, and the effects of foreign currency translation. Our costs can vary materially due to changes ininput costs, including petrochemical-related costs (primarily resin costs), which are not within our control.Consequently, our management focuses on reducing those costs that we can control and using petrochemical-based and other raw materials as efficiently as possible. We also believe that our global presence helps to insulateus from localized changes in business conditions.
We manage our businesses to generate substantial operating cash flow. We believe that our operating cashflow will permit us to continue to spend on innovative research and development and to invest in our business bymeans of capital expenditures for property and equipment and acquisitions. Moreover, we expect that our abilityto generate substantial operating cash flow should provide us with the flexibility to repay debt and to returncapital to our stockholders.
Significant 2011 Events
Acquisition of Diversey
On October 3, 2011, we completed the acquisition of Diversey. The financial results presented in thisMD&A include the financial results of Diversey for the period beginning October 3, 2011 through December 31,2011. See Note 1, “Organization and Nature of Operations,” and Note 3, “Acquisition of Diversey Holdings,Inc.,” for further details.
Quarterly Cash Dividends
We declared and paid quarterly cash dividends of $0.13 per common share on March 18, 2011 tostockholders of record at the close of business on March 4, 2011, on June 17, 2011 to stockholders of record atthe close of business on June 3, 2011, on September 16, 2011 to stockholders of record at the close of businesson September 2, 2011 and on December 16, 2011 to stockholders of record at the close of business onDecember 2, 2011. We used available cash totaling $87 million to pay these quarterly cash dividends.
On February 16, 2012, our Board of Directors declared a quarterly cash dividend of $0.13 per commonshare payable on March 16, 2012 to stockholders of record at the close of business on March 2, 2012. Theestimated amount of this dividend payment is $25 million based on 192 million shares of our common stockissued and outstanding as of January 31, 2012.
35
2012 Outlook
Our 2012 Adjusted EPS is anticipated to be in the range of $1.50 per share to $1.60 per share.
Our Adjusted EPS range reflects the following assumptions:
‰ net sales in the range of $8.2 billion to $8.3 billion, which includes an assumption of a full yearunfavorable impact from foreign currency translation;
‰ cost of sales as a percent of net sales of 65%, which includes $20 million of synergies (see “2011 – 2014Integration and Optimization Program” below);
‰ marketing, administrative and development expense in the range of 24% to 25% of net sales, whichincludes $30 million of synergies (see “2011 – 2014 Integration and Optimization Program” below);
‰ depreciation and amortization expense of $320 million, which includes $135 million of amortization ofacquired intangible assets;
‰ amortization expense of non-cash, share-based compensation of $25 million;
‰ interest expense of $380 million;
‰ core tax rate of 30%; and
‰ weighted average diluted common shares of 211 million.
Additionally, we anticipate capital expenditures to be in the range of $180 million to $190 million, whichincludes capital expenditures associated with the 2011-2014 Integration and Optimization Program. See“Restructuring Activities” below.
Our adjusted EPS outlook excludes the payment of the Settlement agreement, as the exact timing of thesettlement is unknown. Final payment of the Settlement agreement is expected to be accretive to EPS byapproximately $0.13 annually following the payment date under the assumption of using a substantial portion ofcash on hand for the payment and ceasing to accrue interest on the Settlement agreement amount. Additionally,our outlook excludes any non-operating gains or losses that may be recognized in 2012 due to currencyfluctuations in Venezuela.
36
Highlights of Financial Performance
Below are the highlights of our financial performance for the three years ended December 31, 2011.
2011 2010 20092011 vs. 2010
% Change2010 vs. 2009
% Change
Net sales . . . . . . . . . . . . . . . . . . . . . $5,640.9 $4,490.1 $4,242.8 26% 6%
Gross profit . . . . . . . . . . . . . . . . . . . $1,641.2 $1,252.8 $1,218.5 31% 3%
As a % of net sales . . . . . . . . . . . 29.1% 27.9% 28.7%Marketing, administrative and
development expenses(1) . . . . . . 1,034.9 699.0 707.5 48 (1)
As a % of net sales . . . . . . . . . . . 18.3% 15.6% 16.7%
Amortization expense of intangibleassets acquired . . . . . . . . . . . . . . . 41.3 11.2 11.7 # (4)
Costs related to the acquisition ofDiversey . . . . . . . . . . . . . . . . . . . 64.8 — — # —
Restructuring and other charges . . . 52.8 7.6 7.0 # 9
Operating profit . . . . . . . . . . . . . . . . $ 447.4 $ 535.0 $ 492.3 (16)% 9%
As a % of total net sales . . . . . . . 7.9% 11.9% 11.6%
Interest expense . . . . . . . . . . . . . . . . (217.1) (161.6) (154.9) 34% 4%
Other expense, net . . . . . . . . . . . . . . (13.9) (2.9) (0.1) # #
Net earnings available to commonstockholders . . . . . . . . . . . . . . . . . $ 149.1 $ 255.9 $ 244.3 (42)% 5%
Net earnings available to commonstockholders-diluted . . . . . . . . . . $ 148.3 $ 254.4 $ 246.9 (42)% 3%
Net earnings per common share:
Basic . . . . . . . . . . . . . . . . . . . . . . $ 0.89 $ 1.61 $ 1.54 (45)% 4%
Diluted . . . . . . . . . . . . . . . . . . . . . $ 0.80 $ 1.44 $ 1.35 (44)% 7%
Weighted average number ofcommon shares outstanding:
Basic . . . . . . . . . . . . . . . . . . . . . . 167.0 158.3 157.2 5% 1%
Diluted . . . . . . . . . . . . . . . . . . . . . 185.4 176.7 182.6 5% (3)%
Non-U.S. GAAP adjusted dilutednet earnings per commonshare . . . . . . . . . . . . . . . . . . . . . . $ 1.31 $ 1.60 $ 1.44 (18)% 11%
# Denotes a variance greater than or equal to 100%, or not meaningful.
(1) The marketing, administrative and development expenses for 2009 and 2010 have been adjusted to excludeamortization expense of intangible assets acquired to conform to the 2011 presentation.
37
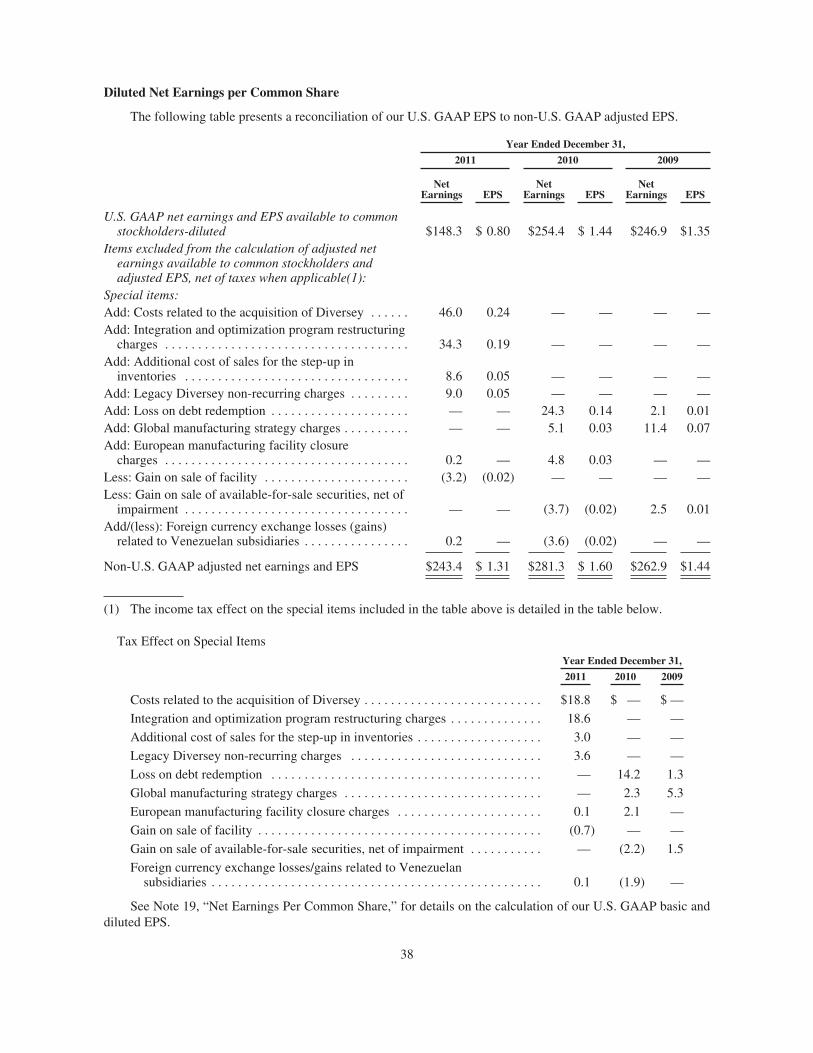
Diluted Net Earnings per Common Share
The following table presents a reconciliation of our U.S. GAAP EPS to non-U.S. GAAP adjusted EPS.
Year Ended December 31,
2011 2010 2009
NetEarnings EPS
NetEarnings EPS
NetEarnings EPS
U.S. GAAP net earnings and EPS available to commonstockholders-diluted $148.3 $ 0.80 $254.4 $ 1.44 $246.9 $1.35
Items excluded from the calculation of adjusted netearnings available to common stockholders andadjusted EPS, net of taxes when applicable(1):
Special items:Add: Costs related to the acquisition of Diversey . . . . . . 46.0 0.24 — — — —Add: Integration and optimization program restructuring
charges . . . . . . . . . . . . . . . . . . . . . . . . . . . . . . . . . . . . . 34.3 0.19 — — — —Add: Additional cost of sales for the step-up in
inventories . . . . . . . . . . . . . . . . . . . . . . . . . . . . . . . . . . 8.6 0.05 — — — —Add: Legacy Diversey non-recurring charges . . . . . . . . . 9.0 0.05 — — — —Add: Loss on debt redemption . . . . . . . . . . . . . . . . . . . . . — — 24.3 0.14 2.1 0.01Add: Global manufacturing strategy charges . . . . . . . . . . — — 5.1 0.03 11.4 0.07Add: European manufacturing facility closure
charges . . . . . . . . . . . . . . . . . . . . . . . . . . . . . . . . . . . . . 0.2 — 4.8 0.03 — —Less: Gain on sale of facility . . . . . . . . . . . . . . . . . . . . . . (3.2) (0.02) — — — —Less: Gain on sale of available-for-sale securities, net of
impairment . . . . . . . . . . . . . . . . . . . . . . . . . . . . . . . . . . — — (3.7) (0.02) 2.5 0.01Add/(less): Foreign currency exchange losses (gains)
related to Venezuelan subsidiaries . . . . . . . . . . . . . . . . 0.2 — (3.6) (0.02) — —
Non-U.S. GAAP adjusted net earnings and EPS $243.4 $ 1.31 $281.3 $ 1.60 $262.9 $1.44
(1) The income tax effect on the special items included in the table above is detailed in the table below.
Tax Effect on Special Items
Year Ended December 31,
2011 2010 2009
Costs related to the acquisition of Diversey . . . . . . . . . . . . . . . . . . . . . . . . . . . $18.8 $ — $ —
Integration and optimization program restructuring charges . . . . . . . . . . . . . . 18.6 — —
Additional cost of sales for the step-up in inventories . . . . . . . . . . . . . . . . . . . 3.0 — —
Legacy Diversey non-recurring charges . . . . . . . . . . . . . . . . . . . . . . . . . . . . . 3.6 — —
Loss on debt redemption . . . . . . . . . . . . . . . . . . . . . . . . . . . . . . . . . . . . . . . . . — 14.2 1.3
Global manufacturing strategy charges . . . . . . . . . . . . . . . . . . . . . . . . . . . . . . — 2.3 5.3
European manufacturing facility closure charges . . . . . . . . . . . . . . . . . . . . . . 0.1 2.1 —
Gain on sale of facility . . . . . . . . . . . . . . . . . . . . . . . . . . . . . . . . . . . . . . . . . . . (0.7) — —
Gain on sale of available-for-sale securities, net of impairment . . . . . . . . . . . — (2.2) 1.5
Foreign currency exchange losses/gains related to Venezuelansubsidiaries . . . . . . . . . . . . . . . . . . . . . . . . . . . . . . . . . . . . . . . . . . . . . . . . . . 0.1 (1.9) —
See Note 19, “Net Earnings Per Common Share,” for details on the calculation of our U.S. GAAP basic anddiluted EPS.
38
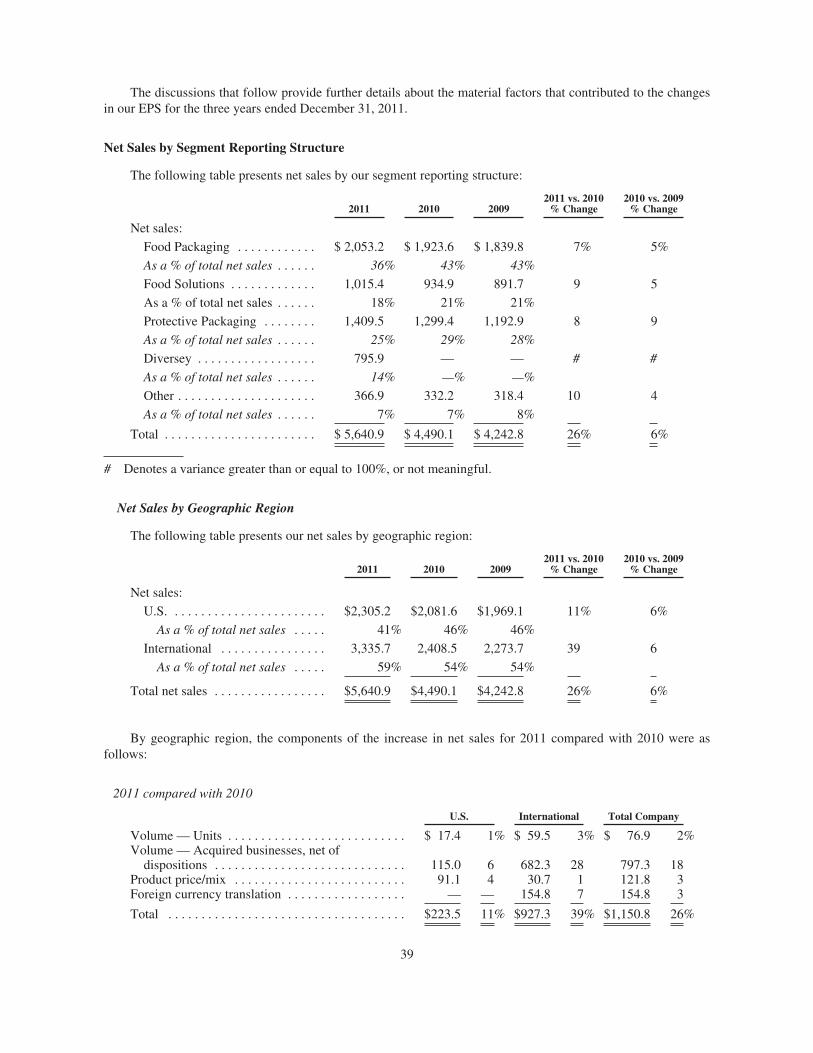
The discussions that follow provide further details about the material factors that contributed to the changesin our EPS for the three years ended December 31, 2011.
Net Sales by Segment Reporting Structure
The following table presents net sales by our segment reporting structure:
2011 2010 20092011 vs. 2010
% Change2010 vs. 2009
% Change
Net sales:
Food Packaging . . . . . . . . . . . . $ 2,053.2 $ 1,923.6 $ 1,839.8 7% 5%
As a % of total net sales . . . . . . 36% 43% 43%
Food Solutions . . . . . . . . . . . . . 1,015.4 934.9 891.7 9 5
As a % of total net sales . . . . . . 18% 21% 21%
Protective Packaging . . . . . . . . 1,409.5 1,299.4 1,192.9 8 9
As a % of total net sales . . . . . . 25% 29% 28%
Diversey . . . . . . . . . . . . . . . . . . 795.9 — — # #
As a % of total net sales . . . . . . 14% —% —%
Other . . . . . . . . . . . . . . . . . . . . . 366.9 332.2 318.4 10 4
As a % of total net sales . . . . . . 7% 7% 8%
Total . . . . . . . . . . . . . . . . . . . . . . . $ 5,640.9 $ 4,490.1 $ 4,242.8 26% 6%
# Denotes a variance greater than or equal to 100%, or not meaningful.
Net Sales by Geographic Region
The following table presents our net sales by geographic region:
2011 2010 20092011 vs. 2010
% Change2010 vs. 2009
% Change
Net sales:
U.S. . . . . . . . . . . . . . . . . . . . . . . . $2,305.2 $2,081.6 $1,969.1 11% 6%
As a % of total net sales . . . . . 41% 46% 46%
International . . . . . . . . . . . . . . . . 3,335.7 2,408.5 2,273.7 39 6
As a % of total net sales . . . . . 59% 54% 54%
Total net sales . . . . . . . . . . . . . . . . . $5,640.9 $4,490.1 $4,242.8 26% 6%
By geographic region, the components of the increase in net sales for 2011 compared with 2010 were asfollows:
2011 compared with 2010
U.S. International Total Company
Volume — Units . . . . . . . . . . . . . . . . . . . . . . . . . . . $ 17.4 1% $ 59.5 3% $ 76.9 2%Volume — Acquired businesses, net of
dispositions . . . . . . . . . . . . . . . . . . . . . . . . . . . . . 115.0 6 682.3 28 797.3 18Product price/mix . . . . . . . . . . . . . . . . . . . . . . . . . . 91.1 4 30.7 1 121.8 3Foreign currency translation . . . . . . . . . . . . . . . . . . — — 154.8 7 154.8 3
Total . . . . . . . . . . . . . . . . . . . . . . . . . . . . . . . . . . . . $223.5 11% $927.3 39% $1,150.8 26%
39
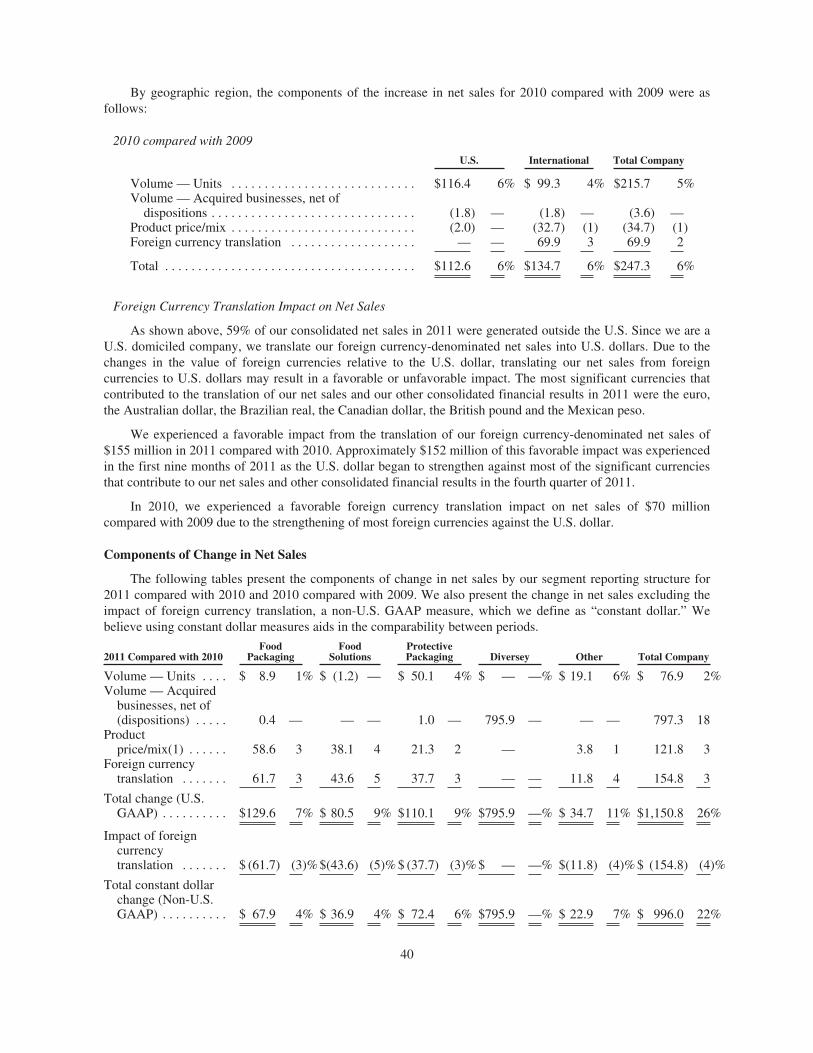
By geographic region, the components of the increase in net sales for 2010 compared with 2009 were asfollows:
2010 compared with 2009
U.S. International Total Company
Volume — Units . . . . . . . . . . . . . . . . . . . . . . . . . . . . $116.4 6% $ 99.3 4% $215.7 5%Volume — Acquired businesses, net of
dispositions . . . . . . . . . . . . . . . . . . . . . . . . . . . . . . . (1.8) — (1.8) — (3.6) —Product price/mix . . . . . . . . . . . . . . . . . . . . . . . . . . . . (2.0) — (32.7) (1) (34.7) (1)Foreign currency translation . . . . . . . . . . . . . . . . . . . — — 69.9 3 69.9 2
Total . . . . . . . . . . . . . . . . . . . . . . . . . . . . . . . . . . . . . . $112.6 6% $134.7 6% $247.3 6%
Foreign Currency Translation Impact on Net Sales
As shown above, 59% of our consolidated net sales in 2011 were generated outside the U.S. Since we are aU.S. domiciled company, we translate our foreign currency-denominated net sales into U.S. dollars. Due to thechanges in the value of foreign currencies relative to the U.S. dollar, translating our net sales from foreigncurrencies to U.S. dollars may result in a favorable or unfavorable impact. The most significant currencies thatcontributed to the translation of our net sales and our other consolidated financial results in 2011 were the euro,the Australian dollar, the Brazilian real, the Canadian dollar, the British pound and the Mexican peso.
We experienced a favorable impact from the translation of our foreign currency-denominated net sales of$155 million in 2011 compared with 2010. Approximately $152 million of this favorable impact was experiencedin the first nine months of 2011 as the U.S. dollar began to strengthen against most of the significant currenciesthat contribute to our net sales and other consolidated financial results in the fourth quarter of 2011.
In 2010, we experienced a favorable foreign currency translation impact on net sales of $70 millioncompared with 2009 due to the strengthening of most foreign currencies against the U.S. dollar.
Components of Change in Net Sales
The following tables present the components of change in net sales by our segment reporting structure for2011 compared with 2010 and 2010 compared with 2009. We also present the change in net sales excluding theimpact of foreign currency translation, a non-U.S. GAAP measure, which we define as “constant dollar.” Webelieve using constant dollar measures aids in the comparability between periods.
2011 Compared with 2010Food
PackagingFood
SolutionsProtectivePackaging Diversey Other Total Company
Volume — Units . . . . $ 8.9 1% $ (1.2) — $ 50.1 4% $ — —% $ 19.1 6% $ 76.9 2%Volume — Acquired
businesses, net of(dispositions) . . . . . 0.4 — — — 1.0 — 795.9 — — — 797.3 18
Productprice/mix(1) . . . . . . 58.6 3 38.1 4 21.3 2 — 3.8 1 121.8 3
Foreign currencytranslation . . . . . . . 61.7 3 43.6 5 37.7 3 — — 11.8 4 154.8 3
Total change (U.S.GAAP) . . . . . . . . . . $129.6 7% $ 80.5 9% $110.1 9% $795.9 —% $ 34.7 11% $1,150.8 26%
Impact of foreigncurrencytranslation . . . . . . . $ (61.7) (3)% $(43.6) (5)% $ (37.7) (3)% $ — —% $(11.8) (4)% $ (154.8) (4)%
Total constant dollarchange (Non-U.S.GAAP) . . . . . . . . . . $ 67.9 4% $ 36.9 4% $ 72.4 6% $795.9 —% $ 22.9 7% $ 996.0 22%
40
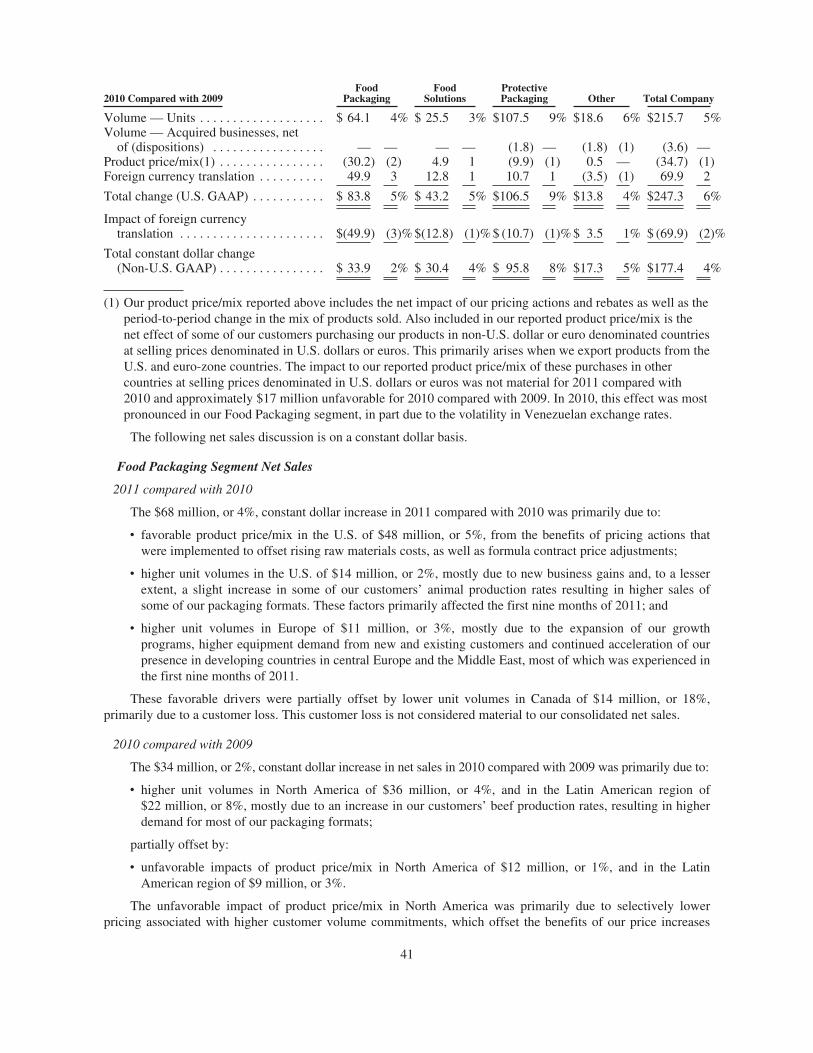
2010 Compared with 2009Food
PackagingFood
SolutionsProtectivePackaging Other Total Company
Volume — Units . . . . . . . . . . . . . . . . . . . $ 64.1 4% $ 25.5 3% $107.5 9% $18.6 6% $215.7 5%Volume — Acquired businesses, net
of (dispositions) . . . . . . . . . . . . . . . . . — — — — (1.8) — (1.8) (1) (3.6) —Product price/mix(1) . . . . . . . . . . . . . . . . (30.2) (2) 4.9 1 (9.9) (1) 0.5 — (34.7) (1)Foreign currency translation . . . . . . . . . . 49.9 3 12.8 1 10.7 1 (3.5) (1) 69.9 2
Total change (U.S. GAAP) . . . . . . . . . . . $ 83.8 5% $ 43.2 5% $106.5 9% $13.8 4% $247.3 6%
Impact of foreign currencytranslation . . . . . . . . . . . . . . . . . . . . . . $(49.9) (3)% $(12.8) (1)% $ (10.7) (1)% $ 3.5 1% $ (69.9) (2)%
Total constant dollar change(Non-U.S. GAAP) . . . . . . . . . . . . . . . . $ 33.9 2% $ 30.4 4% $ 95.8 8% $17.3 5% $177.4 4%
(1) Our product price/mix reported above includes the net impact of our pricing actions and rebates as well as theperiod-to-period change in the mix of products sold. Also included in our reported product price/mix is thenet effect of some of our customers purchasing our products in non-U.S. dollar or euro denominated countriesat selling prices denominated in U.S. dollars or euros. This primarily arises when we export products from theU.S. and euro-zone countries. The impact to our reported product price/mix of these purchases in othercountries at selling prices denominated in U.S. dollars or euros was not material for 2011 compared with2010 and approximately $17 million unfavorable for 2010 compared with 2009. In 2010, this effect was mostpronounced in our Food Packaging segment, in part due to the volatility in Venezuelan exchange rates.
The following net sales discussion is on a constant dollar basis.
Food Packaging Segment Net Sales
2011 compared with 2010
The $68 million, or 4%, constant dollar increase in 2011 compared with 2010 was primarily due to:
‰ favorable product price/mix in the U.S. of $48 million, or 5%, from the benefits of pricing actions thatwere implemented to offset rising raw materials costs, as well as formula contract price adjustments;
‰ higher unit volumes in the U.S. of $14 million, or 2%, mostly due to new business gains and, to a lesserextent, a slight increase in some of our customers’ animal production rates resulting in higher sales ofsome of our packaging formats. These factors primarily affected the first nine months of 2011; and
‰ higher unit volumes in Europe of $11 million, or 3%, mostly due to the expansion of our growthprograms, higher equipment demand from new and existing customers and continued acceleration of ourpresence in developing countries in central Europe and the Middle East, most of which was experienced inthe first nine months of 2011.
These favorable drivers were partially offset by lower unit volumes in Canada of $14 million, or 18%,primarily due to a customer loss. This customer loss is not considered material to our consolidated net sales.
2010 compared with 2009
The $34 million, or 2%, constant dollar increase in net sales in 2010 compared with 2009 was primarily due to:
‰ higher unit volumes in North America of $36 million, or 4%, and in the Latin American region of$22 million, or 8%, mostly due to an increase in our customers’ beef production rates, resulting in higherdemand for most of our packaging formats;
partially offset by:
‰ unfavorable impacts of product price/mix in North America of $12 million, or 1%, and in the LatinAmerican region of $9 million, or 3%.
The unfavorable impact of product price/mix in North America was primarily due to selectively lowerpricing associated with higher customer volume commitments, which offset the benefits of our price increases
41
and formula contract adjustments in the year. The unfavorable impact of product price/mix in the Latin Americanregion was primarily due to the volatility of the Venezuelan currency as discussed above.
Food Solutions Segment Net Sales
2011 compared with 2010
The $37 million, or 4%, constant dollar increase in net sales in 2011 compared with 2010 was primarily due to:
‰ favorable product price/mix in the U.S. of $25 million, or 7%, and Europe of $10 million, or 3%, bothfrom the benefits of pricing actions that were implemented to offset rising raw materials costs and formulaprice adjustments;
‰ higher unit volumes in Australia of $9 million, or 7%, primarily due to higher demand for our fresh dairypackaging products, which occurred primarily in the first half of 2011; and
‰ higher unit volumes in Europe of $8 million, or 3%, mostly due to higher sales of our case-ready, readymeal and vertical pouch packaging products and, to a lesser extent, higher equipment demand from newand existing customers.
These favorable drivers were partially offset by lower unit volumes in the U.S. of $25 million, or 7%,resulting from a change in our case-ready format by a major retailer in mid-2010. A portion of this lost unitvolume is now being supplied to the major retailer in another format by our Food Packaging segment. Theremainder of the lost unit volume was not material to our consolidated net sales.
2010 compared with 2009
The $30 million, or 4%, constant dollar increase in net sales in 2010 compared with 2009 was primarily due to:
‰ higher unit volumes in Europe of $11 million, or 3%, and North America of $10 million, or 3%, mostlydue to increased demand for our ready meals packaging products and, to a lesser extent, our vertical pouchpackaging products; and
‰ favorable product price/mix in North America of $12 million, or 3%, from the benefits of both prior priceincreases and contract adjustments.
These factors were partially offset by a decline in product price/mix in Europe of $5 million, or 2%,primarily due to the timing of price adjustments for changes in resin costs experienced in the first half of 2010.
Protective Packaging Segment Net Sales
2011 compared with 2010
The $72 million, or 6%, constant dollar increase in 2011 compared with 2010 was primarily due to higherunit volumes in the U.S. of $29 million, or 4%, in Asia of $13 million, or 11%, and in Europe of $6 million, or2%. These unit volume increases were predominantly due to higher year-over-year industrial production rates inthose regions, which in turn favorably affected the sales of our protective packaging products to existingcustomers in the order fulfillment space and our inflatable materials and equipment systems to new and existingcustomers in the e-commerce space. We also experienced favorable product price/mix in the U.S. of $12 million,or 2%, and in Europe of $10 million, or 3%, due to the benefits of pricing actions that were implemented to offsetrising raw materials costs.
2010 compared with 2009
The $96 million, or 8%, constant dollar increase in net sales in 2010 compared with 2009 was primarily theresult of higher unit volumes in North America of $60 million, or 9%, in Europe of $24 million, or 7%, and in theAsia Pacific region of $17 million, or 13%. These increases were principally attributable to improving economicconditions in these regions, which were consistent with manufacturing output and export and shipping trends.
42
Also contributing to the higher unit volumes, to a lesser extent, was strength in fulfillment and e-commerceapplications.
Diversey Segment Net Sales
Reported net sales were $796 million in the fourth quarter of 2011 and are included in the year over yearcomparison as volume — acquired businesses, net of (dispositions).
Other Net Sales
2011 compared to 2010
The $23 million, or 7%, constant dollar increase in net sales in 2011 compared with 2010 was primarily dueto higher unit volumes in Europe of $10 million, or 6%, primarily in our Specialty Materials business, which wasattributable to higher demand for our products from the construction sector. Also contributing to this increasewas higher unit volumes in our Medical Applications business in Asia of $6 million, or 28%, since we receivedChinese government approval to import, distribute and sell a reformulated medical film late in the third quarter of2010.
2010 compared to 2009
The $17 million, or 5%, constant dollar increase in 2010 compared with 2009 was primarily attributed tohigher unit volumes in North America of $12 million, or 11%, and in Europe of $16 million, or 11%. Theseincreases were primarily attributable to higher unit volumes for some of our Specialty Materials products, whichwere principally the result of improving economic conditions in these regions, consistent with manufacturingoutput and export and shipping trends. Partially offsetting these factors was lower unit volumes in our MedicalApplications business in Asia of $13 million, or 38%, primarily due to the impact of an April 2010 licensingexpiration in China. Late in the third quarter of 2010, our license was renewed.
Cost of Sales
Our primary input costs include raw materials such as polyolefin and other petrochemical-based resins andfilms, caustic soda, solvents, waxes, phosphates, surfactants, chelates, fragrances and paper and wood pulpproducts. These raw materials represent approximately one third of our cost of sales. Our other cost of salesinputs include direct and indirect labor, other raw materials and other input costs, including energy-related costsand transportation costs. The costs for our raw materials are impacted by the rise and fall in crude oil and naturalgas prices, since they serve as feedstocks utilized in the production of our raw materials. The prices for thesefeedstocks have been particularly volatile in recent years as a result of changes in global demand. In addition,supply and demand imbalances of intermediate compounds such as benzene and supplier facility outages haveimpacted resin costs. Although changes in the prices of crude oil and natural gas are indicative of the variationsin certain raw materials and energy-related costs, they are not perfect benchmarks. We continue to monitorchanges in raw material and energy-related costs as they occur and take pricing actions as appropriate to lessenthe impact of cost increases when they occur.
In this cost of sales section and in the marketing, administrative and development expenses section below,when we refer to “variable incentive compensation” we are referring to our annual U.S. profit sharingcontribution (in both sections) and our annual cash incentive compensation (in the marketing, administrative anddevelopment expenses section). Variable incentive compensation does not include our share-based incentivecompensation programs. Details about our share-based incentive compensation programs are included inNote 18, “Stockholders’ Equity.”
Cost of sales for the three years ended December 31, 2011 was as follows:
2011 2010 20092011 vs. 2010
% Change2010 vs. 2009
% Change
Cost of sales . . . . . . . . . . . . . . . . . . $3,999.7 $3,237.3 $3,024.3 24% 7%
As a % of net sales . . . . . . . . . . . 71% 72% 71%
43
2011 compared with 2010
The $762 million increase in cost of sales in 2011 compared with 2010 was primarily due to:
‰ a $472 million incremental impact of Diversey’s cost of sales included in our results in the fourth quarterof 2011;
‰ higher raw materials costs of $125 million attributable to the increased average cost per pound of resin in2011;
‰ an unfavorable impact of foreign currency translation of $115 million; and
‰ higher transportation and energy-related costs of $20 million.
2010 compared with 2009
The $213 million increase in cost of sales in 2010 compared with 2009 was primarily due to:
‰ higher average petrochemical-based raw material expenditures due to additional consumption from the 5%increase in sales volume in 2010;
‰ higher raw materials costs of approximately $130 million attributable to the increased average cost perpound of resin in 2010;
‰ higher other input costs, including transportation and energy-related costs of $30 million in 2010; and
‰ the unfavorable impact of foreign currency translation of $53 million in 2010.
The factors above that drove the increase in cost of sales in 2010 compared with 2009 were partially offsetby our supply chain productivity improvements, including lower headcount in 2010 compared with 2009 despitehigher unit volumes, and by the benefits of producing products in our new, low-cost facilities in developingregions.
Also partially offsetting the increase in cost of sales was lower variable incentive compensation expenses of$6 million in 2010 compared with 2009 because we did not meet some of our 2010 financial performance goals.
Expenses included in cost of sales related to the implementation of GMS were $4 million in 2010 comparedwith $10 million in 2009.
Marketing, Administrative and Development Expenses
Marketing, administrative and development expenses for the three years ended December 31, 2011 isincluded in the table below. The amounts for 2010 and 2009 have been reclassified to conform to the 2011presentation of these expenses as we now present the amortization of intangible assets acquired as a separate lineitem on our consolidated statements of operations.
2011 2010 20092011 vs. 2010
% Change2010 vs. 2009
% Change
Marketing, administrative anddevelopment expenses . . . . . . . . . . . . $1,034.9 $699.0 $707.5 48% (1)%
As a % of net sales . . . . . . . . . . . . . . 18% 16% 17%
2011 compared with 2010
The $336 million increase in marketing, administrative and development expenses in 2011 compared with2010 was primarily due to:
‰ a $296 million incremental impact of Diversey’s marketing, administrative and development expensesincluded in our results in the fourth quarter of 2011;
‰ an unfavorable impact of foreign currency translation of $21 million;
44
‰ an increase in selling and marketing expenses of $15 million to support our sales growth; and
‰ higher development expenses of $3 million due to additional headcount and increase in project spendingto support strategic growth programs.
These factors were partially offset by a decrease in share-based compensation of $6 million primarilybecause we did not achieve some of our 2011 financial performance goals.
2010 compared with 2009
Marketing, administrative and development expenses decreased $9 million in 2010 compared with 2009.These expenses decreased primarily due to lower incentive compensation expenses of approximately $30 millionin 2010, primarily because we did not meet some of our 2010 financial performance goals. See the table belowfor further details.
This factor was partially offset by:
‰ higher sales and marketing costs to support the increase in net sales in 2010 compared with 2009,including higher travel and entertainment expenses of $20 million; and
‰ additional research and development expenses of $5 million, which includes spending related toinnovation and new product introductions.
Our variable incentive compensation expense includes annual cash incentives and our annual U.S. profitsharing contribution. We also have long-term, share-based incentive compensation that is included in marketing,administrative and development expenses. The table below shows the year over year changes in these expenses in2010 compared with 2009.
2010 20092010 vs. 2009
Change
Annual cash incentive compensation . . . . . . . . . . . . . . . . . . . . . . . . $ 18.0 $ 35.0 $(17.0)
Annual U.S. profit sharing contribution(1) . . . . . . . . . . . . . . . . . . . . 18.0 29.0 (11.0)
Share-based incentive compensation . . . . . . . . . . . . . . . . . . . . . . . . 30.6 38.8 (8.2)
Total . . . . . . . . . . . . . . . . . . . . . . . . . . . . . . . . . . . . . . . . . . . . . . . . . $ 66.6 $ 102.8 $(36.2)
(1) Approximately $10 million in 2010 and $16 million in 2009 of our U.S. profit sharing contribution expense isincluded in cost of sales.
Amortization Expense of Intangible Assets Acquired
Amortization expense of intangible assets acquired for the three years ended December 31, 2011 were asfollows:
2011 2010 2009
Amortization expense of intangible assets acquired . . . . . . . . . . . . . . . . . . . $41.3 $11.2 $11.7
The increase in 2011 compared with 2010 was due to the amortization of the intangible assets acquired inconnection with the acquisition of Diversey in the fourth quarter of 2011.
Costs Related to the Acquisition of Diversey
We recorded $65 million of transaction and integration costs directly related to the acquisition of Diverseyin 2011. The transaction related costs were $55 million and primarily consist of financing commitment, legal,regulatory and appraisal fees. The remainder of the costs in both periods were integration costs primarilyconsisting of consulting fees. As discussed above, we have excluded these costs from our adjusted EPScalculations in 2011. See Note 3, “Acquisition of Diversey Holdings, Inc.,” for further discussion of theacquisition.
45
Restructuring Activities
2011-2014 Integration and Optimization Program
As part of our previously announced integration of Diversey, we are undertaking a number of actions tointegrate and realign our organization, further improve operating efficiencies and lower our overall cost structureto maximize cost synergies and better meet customers’ needs. This program primarily consists of (i) a reductionin headcount, (ii) the consolidation of facilities, and (iii) the consolidation and streamlining of certain customerand vendor contracts and relationships.
We have extended our program through 2014 and have increased our annual cost synergy run rate benefittarget by the end of 2014 to a range of $110 million to $115 million. This compares to our initial annual costsynergy estimate of $50 million in 2013. We expect to achieve the estimated cost synergy benefits as follows:
‰ 2012: $50 million;
‰ 2013: incremental $50 million, to achieve annual savings of $100 million in 2013; and
‰ 2014: incremental $10 million to $15 million, to achieve annual savings of $110 million to $115 millionin 2014.
We expect to achieve these synergies through the elimination of duplicative roles, the consolidation of ourbusiness units into three primary business units in 2012, supply chain network optimization, which includes theclosure or consolidation of several small facilities to streamline our operations, and the benefits of scale inprocurement, logistics and warehousing, as well as in information systems and other shared services. Weanticipate these cost savings to be realized equally within cost of sales and in marketing, administrative anddevelopment expenses.
We currently anticipate the total associated costs and restructuring charges related to this program to be$165 million to $185 million. We expect to incur the majority of these costs in 2012.
In the fourth quarter of 2011, we incurred a pre-tax restructuring charge of $53 million, or $0.18 on anearnings per share basis. This charge was primarily for termination and benefits costs, of which $29 million waspaid in the quarter. This restructuring charge includes $38 million related to stock appreciation rights, (“SARs”)that were granted as part of the consideration for the acquisition of Diversey. See Note 3, “Acquisition ofDiversey Holdings, Inc.,” for further discussion.
Additionally, we anticipate capital expenditures of $40 million to $50 million through 2014 related to theprogram and expect to spend $20 million in 2012. The actual timing of future costs is subject to change due to avariety of factors that may cause a portion of the spending and benefits to occur later than we now expect.Additionally, changes in foreign currency exchange translation may impact future costs and benefits.
See Note 9, “Restructuring Activities,” for further discussion of this program.
Revenue Synergies
We continue to anticipate $70 million of revenue synergies by the end of 2013, largely from expanding ouraccess and presence within our food and beverage processing customers’ businesses and broadening our reach indeveloping regions. In the fourth quarter of 2011, we began to secure new accounts and are currently in theprocess of closing additional opportunities with customers.
European Principal Company
In May 2011, before the acquisition of Diversey, Diversey approved, subject to successful works councilconsultations, plans to reorganize its European operations to function under a centralized management andsupply chain model. After completing the reorganization in 2012, the European Principal Company (“EPC”),based in the Netherlands, is expected to centrally manage Diversey’s European operations. The Europeansubsidiaries will execute sales and distribution locally, and local production companies will act as tollmanufacturers on behalf of the EPC.
46
As part of the planning for this reorganization, in the fourth quarter of 2011, we recognized associated costsof $4 million, which are included in marketing, administrative and development expenses in the consolidatedstatements of operations and restructuring charges related to termination benefits of $1 million.
We anticipate benefits from this reorganization to come from lower overhead costs from a centralizedmanagement and supply chain model as well as tax savings. We anticipate additional associated and/orrestructuring costs in 2012 and net benefits to begin in 2013. The amount and timing of costs and benefits issubject to change due to a variety of factors such as the overall profitability of our European business,administrative efficiency, and foreign currency exchange translation.
Global Manufacturing Strategy
We announced our global manufacturing strategy program in 2006 and completed the program in 2010. Thegoals of this multi-year program were to realign our manufacturing footprint to expand capacity in growingmarkets, to further improve our operating efficiencies, and to implement new technologies more effectively.Additionally, we optimized certain manufacturing platforms in North America and Europe into centers ofexcellence. By taking advantage of new technologies and streamlining production on a global scale, we havecontinued to enhance our profitable growth and our global leadership position and have produced meaningfulbenefits.
The capital expenditures, associated costs and related restructuring charges and the total amounts incurredsince inception of this multi-year program are included in the table below.
CumulativeThrough
December 31,Year Ended December 31,
2010 2009 2010
Capital expenditures . . . . . . . . . . . . . . . . . . . . . . . . . . . . . . . . . . $3.3 $20.0 $156.0
Associated costs . . . . . . . . . . . . . . . . . . . . . . . . . . . . . . . . . . . . . . 3.8 9.8 36.2
Restructuring and other charges . . . . . . . . . . . . . . . . . . . . . . . . . 4.4 6.5 42.7
We estimate that we realized approximately $25 million in benefits in 2008, which increased to $45 million in2009, and increased further to $55 million in 2010. These benefits are primarily realized in cost of sales.
European Facility Closure
In December 2010, we informed affected employees that we would be closing a small shrink packagingfactory in Europe. We took this action based on our review of operating costs and technology levels in an effortto simplify our plant network and improve our operating efficiency. We recorded nominal associated costs andrestructuring and other charges in 2011 and $7 million in 2010. We do not expect to record any materialremaining costs associated with this closure.
The associated costs and restructuring and other charges related to the actions described above areconsidered special items and are excluded from our non-U.S. GAAP EPS calculations. See “Diluted NetEarnings Per Common Share” above for further details.
See Note 9, “Restructuring Activities,” for additional information on our recent restructuring activities.
47
Operating Profit
Management evaluates the performance of each reportable segment based on its operating profit. Operatingprofit by our segment reporting structure for the three years ended December 31, 2011 was as follows:
2011 2010 20092011 vs. 2010
% Change2010 vs. 2009
% Change
Food Packaging $276.5 $262.7 $251.7 5% 4%
As a % of Food Packaging net sales . . 13.5% 13.7% 13.7%Food Solutions . . . . . . . . . . . . . . . . . . . . . 101.5 99.2 85.7 2 16
As a % of Food Solutions net sales . . . 10.0% 10.6% 9.6%Protective Packaging . . . . . . . . . . . . . . . . 183.8 169.5 150.0 8 13
As a % of Protective Packaging netsales . . . . . . . . . . . . . . . . . . . . . . . . . 13.0% 13.0% 12.6%
Diversey . . . . . . . . . . . . . . . . . . . . . . . . . . (2.9) — — # —
As a % of Diversey net sales . . . . . . . . (0.4)% # #Other . . . . . . . . . . . . . . . . . . . . . . . . . . . . . 6.1 11.2 11.9 (46) (6)
As a % of Other net sales . . . . . . . . . . . 1.7% 3.4% 3.7%
Total segments and other . . . . . . . . . . . . . 565.0 542.6 499.3 4 9
As a % of net sales . . . . . . . . . . . . . . . . 10.0% 12.1% 11.8%
Costs related to the acquisition ofDiversey . . . . . . . . . . . . . . . . . . . . . . . . 64.8 — — # —
Restructuring and other charges(1) . . . . . 52.8 7.6 7.0 # 9
Total operating profit $447.4 $535.0 $492.3 (16)% 9%
As a % of net sales . . . . . . . . . . . . . . . . 7.9% 11.9% 11.6%
# Denotes a variance greater than or equal to 100%, or not meaningful.
(1) Restructuring and other charges by our segment reporting structure were as follows:
2011 2010 2009
Food Packaging . . . . . . . . . . . . . . . . . . . . . . . . . . . . . . . . . . . . . . . . . . . . . . . . . $ — $3.7 $ 6.0
Food Solutions . . . . . . . . . . . . . . . . . . . . . . . . . . . . . . . . . . . . . . . . . . . . . . . . . — — 1.0
Protective Packaging . . . . . . . . . . . . . . . . . . . . . . . . . . . . . . . . . . . . . . . . . . . . . (0.4) 3.8 (0.1)
Diversey . . . . . . . . . . . . . . . . . . . . . . . . . . . . . . . . . . . . . . . . . . . . . . . . . . . . . . 53.2 — —
Other . . . . . . . . . . . . . . . . . . . . . . . . . . . . . . . . . . . . . . . . . . . . . . . . . . . . . . . . . — 0.1 0.1
Total . . . . . . . . . . . . . . . . . . . . . . . . . . . . . . . . . . . . . . . . . . . . . . . . . . . . . . . . . $52.8 $7.6 $ 7.0
See “Restructuring Activities” above for further discussion of restructuring activities.
Food Packaging Segment Operating Profit
2011 compared with 2010
The increase in operating profit in 2011 compared with 2010 was primarily due to the net favorable impacts ofthe changes in net sales mentioned above, which was partially offset by higher raw materials costs, which weestimate to be $60 million higher in 2011 compared with 2010.
2010 compared with 2009
The increase in operating profit in 2010 compared with 2009 was primarily due to the favorable impact ofthe increase in unit volumes mentioned above. Also contributing to this segment’s increase in operating profitwere lower marketing, administrative and development expenses as a percentage of net sales, which include theimpact of lower variable incentive compensation expenses mentioned above. These factors were partially offsetby higher raw materials costs of approximately $51 million.
48
Expenses in this segment related to the implementation of GMS were $3 million in 2010 compared with$8 million in 2009.
Food Solutions Segment Operating Profit
2011 compared with 2010
The increase in operating profit in 2011 compared with 2010 was primarily due to the net favorable impactsof the changes in net sales mentioned above. These factors were partially offset by higher raw materials costs,which we estimate to be $25 million higher in 2011 compared with 2010.
2010 compared with 2009
The increase in operating profit in 2010 compared with 2009 was primarily due to the favorable impacts ofthe increase in unit volumes and product price/mix, both mentioned above. Also contributing to this segment’sincrease in operating profit were lower marketing, administrative and development expenses as a percentage ofnet sales, which include the impact of lower variable incentive compensation expenses mentioned above. Thesefactors were partially offset by higher raw materials costs of approximately $30 million.
Protective Packaging Segment Operating Profit
2011 compared with 2010
The increase in operating profit in 2011 compared with the same periods in 2010 was primarily due to thenet favorable impacts of the changes in net sales mentioned above. These factors were partially offset by higherraw materials costs, which we estimate to be $32 million higher in 2011 compared with 2010.
2010 compared with 2009
The increase in operating profit in 2010 compared with 2009 was primarily due to the favorable impact ofthe increase in unit volumes mentioned above. Also contributing to this segment’s increase in operating profitwere lower marketing, administrative and development expenses as a percentage of net sales, which include theimpact of lower variable incentive compensation expenses mentioned above. These factors were partially offsetby higher raw materials costs of approximately $35 million. Expenses included in this segment’s operating profitrelated to the closure of a small factory in Europe were $3 million in 2010.
Diversey Segment Operating Loss
Our Diversey segment reported a $3 million operating loss in 2011. This loss reflects the results of Diverseyfrom October 3, 2011 through December 31, 2011.
In addition to the incremental results of Diversey mentioned above, the segment’s operating loss in 2011reflected the following items:
‰ $31 million of amortization of acquired intangibles;
‰ $12 million of additional cost of sales related to the step-up in inventories in connection with theacquisition accounting; and
‰ $12 million of legacy Diversey non-recurring charges related to prior restructuring programs, including $4million of associated costs related to the EPC and $4 million of associated costs related to a prior legacyDiversey program to realign certain accounting functions as well as cease manufacturing at its primaryU.S. manufacturing facility.
Other Operating Profit
2011 compared with 2010
The decline in operating profit in 2011 compared with 2010 was primarily due to higher raw materials costs,which we estimate to be $8 million higher compared with 2010. Also contributing to the decline in operatingprofit were incremental expenses related to our new ventures. These factors were partially offset by the netfavorable impacts of the increases in unit volumes mentioned above.
49
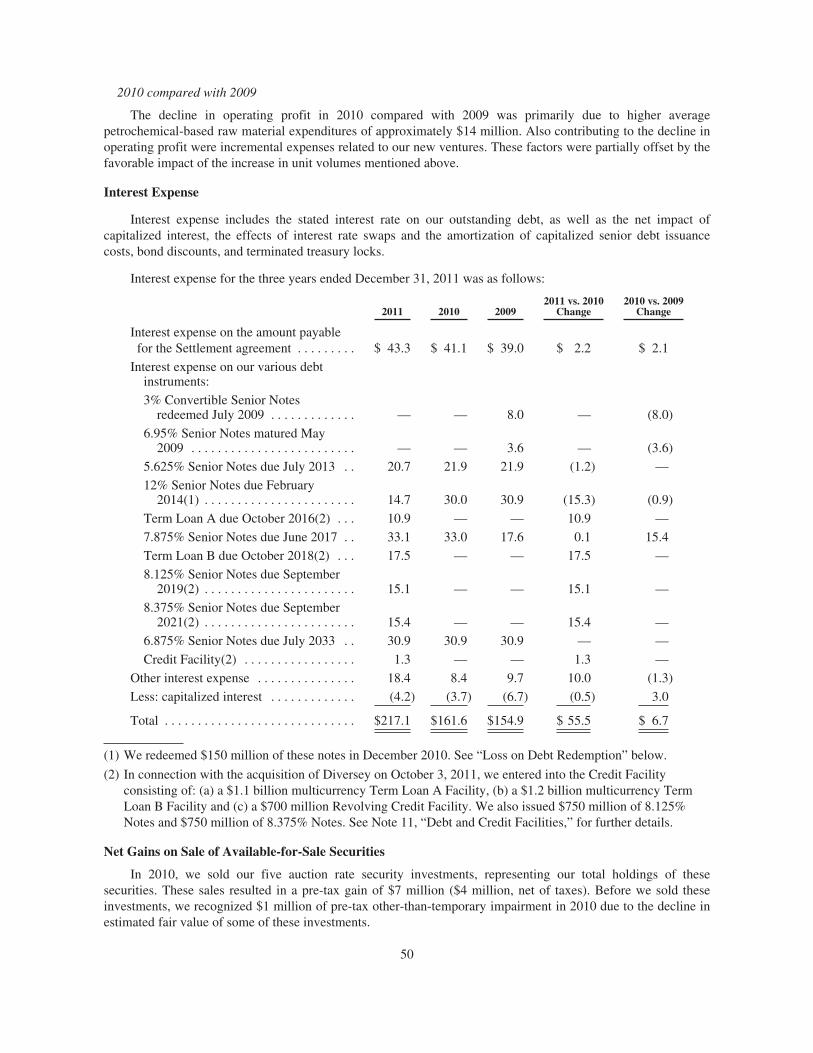
2010 compared with 2009
The decline in operating profit in 2010 compared with 2009 was primarily due to higher averagepetrochemical-based raw material expenditures of approximately $14 million. Also contributing to the decline inoperating profit were incremental expenses related to our new ventures. These factors were partially offset by thefavorable impact of the increase in unit volumes mentioned above.
Interest Expense
Interest expense includes the stated interest rate on our outstanding debt, as well as the net impact ofcapitalized interest, the effects of interest rate swaps and the amortization of capitalized senior debt issuancecosts, bond discounts, and terminated treasury locks.
Interest expense for the three years ended December 31, 2011 was as follows:
2011 2010 20092011 vs. 2010
Change2010 vs. 2009
Change
Interest expense on the amount payablefor the Settlement agreement . . . . . . . . . $ 43.3 $ 41.1 $ 39.0 $ 2.2 $ 2.1
Interest expense on our various debtinstruments:
3% Convertible Senior Notesredeemed July 2009 . . . . . . . . . . . . . — — 8.0 — (8.0)
6.95% Senior Notes matured May2009 . . . . . . . . . . . . . . . . . . . . . . . . . — — 3.6 — (3.6)
5.625% Senior Notes due July 2013 . . 20.7 21.9 21.9 (1.2) —
12% Senior Notes due February2014(1) . . . . . . . . . . . . . . . . . . . . . . . 14.7 30.0 30.9 (15.3) (0.9)
Term Loan A due October 2016(2) . . . 10.9 — — 10.9 —
7.875% Senior Notes due June 2017 . . 33.1 33.0 17.6 0.1 15.4
Term Loan B due October 2018(2) . . . 17.5 — — 17.5 —
8.125% Senior Notes due September2019(2) . . . . . . . . . . . . . . . . . . . . . . . 15.1 — — 15.1 —
8.375% Senior Notes due September2021(2) . . . . . . . . . . . . . . . . . . . . . . . 15.4 — — 15.4 —
6.875% Senior Notes due July 2033 . . 30.9 30.9 30.9 — —
Credit Facility(2) . . . . . . . . . . . . . . . . . 1.3 — — 1.3 —
Other interest expense . . . . . . . . . . . . . . . 18.4 8.4 9.7 10.0 (1.3)
Less: capitalized interest . . . . . . . . . . . . . (4.2) (3.7) (6.7) (0.5) 3.0
Total . . . . . . . . . . . . . . . . . . . . . . . . . . . . . $217.1 $161.6 $154.9 $ 55.5 $ 6.7
(1) We redeemed $150 million of these notes in December 2010. See “Loss on Debt Redemption” below.
(2) In connection with the acquisition of Diversey on October 3, 2011, we entered into the Credit Facilityconsisting of: (a) a $1.1 billion multicurrency Term Loan A Facility, (b) a $1.2 billion multicurrency TermLoan B Facility and (c) a $700 million Revolving Credit Facility. We also issued $750 million of 8.125%Notes and $750 million of 8.375% Notes. See Note 11, “Debt and Credit Facilities,” for further details.
Net Gains on Sale of Available-for-Sale Securities
In 2010, we sold our five auction rate security investments, representing our total holdings of thesesecurities. These sales resulted in a pre-tax gain of $7 million ($4 million, net of taxes). Before we sold theseinvestments, we recognized $1 million of pre-tax other-than-temporary impairment in 2010 due to the decline inestimated fair value of some of these investments.
50
Our valuation of our auction rate security investments resulted in the recognition of other-than-temporaryimpairment of $4 million ($2 million, net of taxes) in 2009.
Foreign Currency Exchange (Losses) Gains Related to Venezuelan Subsidiaries
Effective January 1, 2010, Venezuela was designated a highly inflationary economy. The foreign currencyexchange gains and losses we recorded in 2011 and 2010 for our Venezuelan subsidiary were the result of twofactors: 1) the significant changes in the exchange rates used to settle bolivar-denominated transactions and 2) thesignificant changes in the exchange rates used to remeasure our Venezuelan subsidiary’s financial statements atthe balance sheet date. We believe these gains and losses are attributable to the unstable foreign currencyenvironment in Venezuela. See “Venezuela” in “Foreign Exchange Rates” of Item 7A, “Quantitative andQualitative Disclosures About Market Risk,” for further discussion on Venezuela.
Loss on Debt Redemption
In December 2010, we completed an early redemption of $150 million of the outstanding $300 millionprincipal amount of our 12% Senior Notes due February 14, 2014. We redeemed the notes at 127% of theprincipal amount plus accrued interest. The aggregate redemption price was $196 million, including $5 million ofaccrued interest. We funded the redemption with available cash. We recorded a pre-tax loss of $41 millionresulting from the 27% premium. We also recognized a gain of $2 million from the termination of a relatedinterest rate swap. As a result, the total net pre-tax loss was $39 million, which equated to a $0.14 per commonshare decrease to our reported diluted net earnings per common share. The annual pre-tax interest expensesavings from this redemption is $18 million, which equates to $0.06 per diluted common share, beginning inDecember 2010 through February 2014.
In 2009, we redeemed the entire $431.3 million of our 3% Convertible Senior Notes due 2033 and recordeda $3 million pre-tax loss. This loss represented a 0.429% call premium of $2 million and a write-down of theremaining debt issuance costs of $1 million related to the issuance of these senior notes in July 2003.
The losses associated with our debt redemptions have been excluded from our non-U.S. GAAP adjusteddiluted net earnings per common share. See “Diluted Net Earnings Per Common Share” below for further details.
Other Expense, Net
See Note 20, “Other Expense, net,” for the components and discussion of other expense, net.
Income Taxes
Our effective income tax rate was 31.0% for 2011, 25.5% for 2010 and 25.9% for 2009. As describedbelow, the Diversey operations and the costs of the Diversey acquisition increased our 2011 effective tax rate.The costs of the acquisition are not expected to recur to the same extent in future years. As such, we expect aneffective income tax rate of approximately 30% for 2012.
For 2011 and 2010, our effective income tax rate was lower than the statutory U.S. federal income tax rateof 35% primarily due to the lower net effective income tax rate on foreign earnings, as well as income taxbenefits from tax credits and the domestic manufacturing deduction, partially offset by state income taxes and, in2011, nondeductible expenses incurred in connection with the Diversey acquisition.
See Note 16, “Income Taxes,” for a reconciliation of the U.S. federal statutory rate to our effective tax rate,which also shows the major components of the year over year changes.
Liquidity and Capital Resources
The discussion that follows contains descriptions of:
‰ our material commitments and contingencies;
‰ our principal sources of liquidity;
51
‰ our outstanding indebtedness;
‰ our historical cash flows and changes in working capital;
‰ changes in our stockholders’ equity; and
‰ our derivative financial instruments.
Material Commitments and Contingencies
Settlement Agreement and Related Costs
We recorded a pre-tax charge of $850 million in 2002, of which $513 million represents a cash payment thatwe are required to make (subject to the satisfaction of the terms and conditions of the Settlement agreement)upon the effectiveness of a plan of reorganization in the bankruptcy of W. R. Grace & Co. We did not use cash inany period with respect to this liability.
We currently expect to fund a substantial portion of this payment when it becomes due by usingaccumulated cash and cash equivalents with the remainder from our committed credit facilities. Our new CreditFacility is available for general corporate purposes, including the payment of the amounts required uponeffectiveness of the Settlement agreement. See “Principal Sources of Liquidity” below. The cash payment of$513 million accrues interest at a 5.5% annual rate, which is compounded annually, from December 21, 2002 tothe date of payment. This accrued interest was $319 million at December 31, 2011 and is recorded in Settlementagreement and related accrued interest on our consolidated balance sheet. The total liability on our consolidatedbalance sheet was $831 million at December 31, 2011. In addition, the Settlement agreement provides for theissuance of 18 million shares of our common stock. Since the impact of issuing these shares is dilutive to ourEPS, under U.S. GAAP, they are included in our diluted weighted average number of common sharesoutstanding in our calculation of EPS for all periods presented. See Note 19, “Net Earnings Per Common Share,”for details of our calculation of EPS.
Tax benefits resulting from the payment made under the Settlement agreement are currently recorded as a$380 million deferred tax asset on our consolidated balance sheets. This deferred tax asset reflects the cashportion of the Settlement agreement and related accrued interest and the value of the 18 million shares of ourcommon stock at the post-split price of $17.86 per share, which was the price when the Settlement agreementwas reached in 2002. The amount and timing of our future cash tax benefits could vary, depending on the amountof cash paid by us and various facts and circumstances at the time of payment under the Settlement agreement,including the price of our common stock, our tax position and the applicable tax codes.
While the Bankruptcy Court and the District Court have confirmed the PI Settlement Plan, parties haveappealed or otherwise challenged the PI Settlement Plan and the opinions and orders entered by the BankruptcyCourt and the District Court confirming the PI Settlement Plan. These matters may be subject to further appeal,challenge, and proceedings before the District Court, the Third Circuit Court of Appeals, or other courts. Partiesmay designate various issues to be considered in challenging the PI Settlement Plan and the opinions and ordersentered by the Bankruptcy Court and the District Court, including (without limitation) issues relating to releasesand injunctions contained in the PI Settlement Plan. We will continue to review the Grace bankruptcyproceedings (including appeals and other proceedings relating to the PI Settlement Plan or to the opinions andorders entered by the Bankruptcy Court and the District Court confirming the PI Settlement Plan), as well as anyamendments or other changes to the PI Settlement Plan or to the opinions and orders entered by the BankruptcyCourt and the District Court confirming the PI Settlement Plan, to verify compliance with the Settlementagreement. We do not know whether or when a final plan of reorganization (whether the PI Settlement Plan oranother plan of reorganization) will become effective or whether the final plan will be consistent with the termsof the Settlement agreement.
As mentioned in “2012 Outlook” above, our full year 2012 diluted net earnings per common share guidancecontinues to exclude the payment under the Settlement agreement, as the timing is unknown. Payment under theSettlement agreement is expected to be accretive to our post-payment diluted net earnings per common share byapproximately $0.13 annually. This range primarily represents the accretive impact on our net earnings fromceasing to accrue any future interest on the settlement amount following the payment.
52
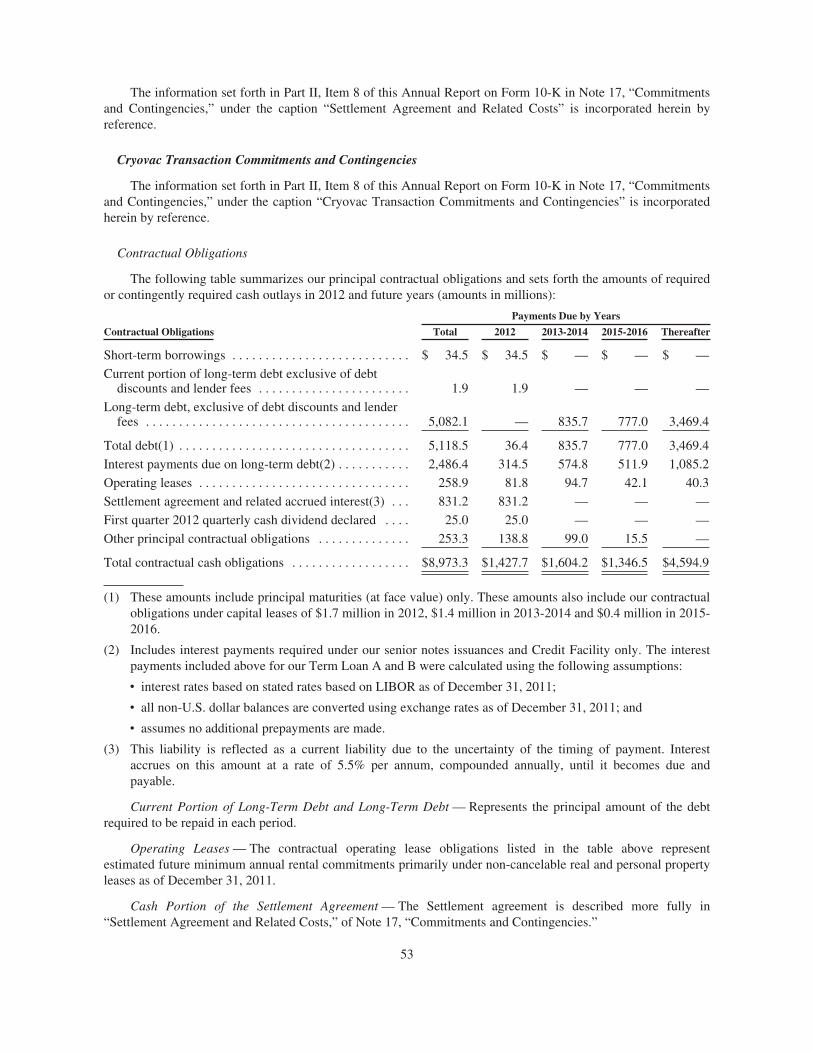
The information set forth in Part II, Item 8 of this Annual Report on Form 10-K in Note 17, “Commitmentsand Contingencies,” under the caption “Settlement Agreement and Related Costs” is incorporated herein byreference.
Cryovac Transaction Commitments and Contingencies
The information set forth in Part II, Item 8 of this Annual Report on Form 10-K in Note 17, “Commitmentsand Contingencies,” under the caption “Cryovac Transaction Commitments and Contingencies” is incorporatedherein by reference.
Contractual Obligations
The following table summarizes our principal contractual obligations and sets forth the amounts of requiredor contingently required cash outlays in 2012 and future years (amounts in millions):
Payments Due by Years
Contractual Obligations Total 2012 2013-2014 2015-2016 Thereafter
Short-term borrowings . . . . . . . . . . . . . . . . . . . . . . . . . . . $ 34.5 $ 34.5 $ — $ — $ —
Current portion of long-term debt exclusive of debtdiscounts and lender fees . . . . . . . . . . . . . . . . . . . . . . . 1.9 1.9 — — —
Long-term debt, exclusive of debt discounts and lenderfees . . . . . . . . . . . . . . . . . . . . . . . . . . . . . . . . . . . . . . . . 5,082.1 — 835.7 777.0 3,469.4
Total debt(1) . . . . . . . . . . . . . . . . . . . . . . . . . . . . . . . . . . . 5,118.5 36.4 835.7 777.0 3,469.4
Interest payments due on long-term debt(2) . . . . . . . . . . . 2,486.4 314.5 574.8 511.9 1,085.2
Operating leases . . . . . . . . . . . . . . . . . . . . . . . . . . . . . . . . 258.9 81.8 94.7 42.1 40.3
Settlement agreement and related accrued interest(3) . . . 831.2 831.2 — — —
First quarter 2012 quarterly cash dividend declared . . . . 25.0 25.0 — — —
Other principal contractual obligations . . . . . . . . . . . . . . 253.3 138.8 99.0 15.5 —
Total contractual cash obligations . . . . . . . . . . . . . . . . . . $8,973.3 $1,427.7 $1,604.2 $1,346.5 $4,594.9
(1) These amounts include principal maturities (at face value) only. These amounts also include our contractualobligations under capital leases of $1.7 million in 2012, $1.4 million in 2013-2014 and $0.4 million in 2015-2016.
(2) Includes interest payments required under our senior notes issuances and Credit Facility only. The interestpayments included above for our Term Loan A and B were calculated using the following assumptions:
‰ interest rates based on stated rates based on LIBOR as of December 31, 2011;
‰ all non-U.S. dollar balances are converted using exchange rates as of December 31, 2011; and
‰ assumes no additional prepayments are made.
(3) This liability is reflected as a current liability due to the uncertainty of the timing of payment. Interestaccrues on this amount at a rate of 5.5% per annum, compounded annually, until it becomes due andpayable.
Current Portion of Long-Term Debt and Long-Term Debt — Represents the principal amount of the debtrequired to be repaid in each period.
Operating Leases — The contractual operating lease obligations listed in the table above representestimated future minimum annual rental commitments primarily under non-cancelable real and personal propertyleases as of December 31, 2011.
Cash Portion of the Settlement Agreement — The Settlement agreement is described more fully in“Settlement Agreement and Related Costs,” of Note 17, “Commitments and Contingencies.”
53
Other Principal Contractual Obligations — Other principal contractual obligations include agreements topurchase an estimated amount of goods, including raw materials, or services, including energy, in the normalcourse of business. These obligations are enforceable and legally binding and specify all significant terms,including fixed or minimum quantities to be purchased, minimum or variable price provisions and theapproximate timing of the purchase.
Liability for Unrecognized Tax Benefits
At December 31, 2011, we had liabilities for unrecognized tax benefits and related interest and penalties of$279 million, which is included in other liabilities on the consolidated balance sheet. At December 31, 2011, wecannot reasonably estimate the future period or periods of cash settlement of these liabilities. See Note 16,“Income Taxes,” for further discussion.
Off-Balance Sheet Arrangements
We have reviewed our off-balance sheet arrangements and have determined that none of those arrangementshas a material current effect or is reasonably likely to have a material future effect on our consolidated financialstatements, liquidity, capital expenditures or capital resources.
Income Tax Payments
We currently expect to pay between $115 million and $135 million in income taxes in 2012.
Contributions to Defined Benefit Pension Plans
We maintain defined benefit pension plans for some of our U.S. and our non-U.S. employees. We currentlyexpect employer contributions to be approximately $39 million in 2012.
Environmental Matters
We are subject to loss contingencies resulting from environmental laws and regulations, and we accrue foranticipated costs associated with investigatory and remediation efforts when an assessment has indicated that aloss is probable and can be reasonably estimated. These accruals do not take into account any discounting for thetime value of money and are not reduced by potential insurance recoveries, if any. We do not believe that it isreasonably possible that the liability in excess of the amounts that we have accrued for environmental matterswill be material to our consolidated statements of operations, balance sheets or cash flows. We reassessenvironmental liabilities whenever circumstances become better defined or we can better estimate remediationefforts and their costs. We evaluate these liabilities periodically based on available information, including theprogress of remedial investigations at each site, the current status of discussions with regulatory authoritiesregarding the methods and extent of remediation and the apportionment of costs among potentially responsibleparties. As some of these issues are decided (the outcomes of which are subject to uncertainties) or new sites areassessed and costs can be reasonably estimated, we adjust the recorded accruals, as necessary. We believe thatthese exposures are not material to our consolidated financial condition and results of operations. We believe thatwe have adequately reserved for all probable and estimable environmental exposures.
Principal Sources of Liquidity
We require cash to fund our operating expenses, capital expenditures, interest, taxes and dividend paymentsand to pay our debt obligations and other long-term liabilities as they come due. Our principal sources ofliquidity are cash flows from operations, accumulated cash and amounts available under our existing lines ofcredit described below, including the Credit Facility, and our accounts receivable securitization program.
We believe that our current liquidity position and future cash flows from operations will enable us to fundour operations, including all of the items mentioned above, and the cash payment under the Settlement agreementshould it become payable within the next 12 months.
54
In connection with the funding of the cash consideration for the acquisition and the repayment of existingindebtedness of Diversey, and to provide ongoing liquidity, on October 3, 2011, we entered into the CreditFacility, which consists of: (a) a $1.1 billion multicurrency Term Loan A Facility, (b) a $1.2 billionmulticurrency Term Loan B Facility and (c) a $700 million Revolving Credit Facility. Additionally, onOctober 3, 2011, we completed an offering of $750 million aggregate principal amount of 8.125% senior notesdue 2019 and $750 million aggregate principal amount of 8.375% senior notes due 2021. See Note 11, “Debt andCredit Facilities,” for further details.
Cash and Cash Equivalents
The following table summarizes our accumulated cash and cash equivalents:
December 31,2011
December 31,2010
Cash and cash equivalents . . . . . . . . . . . . . . . . . . . . . . . . . . . . . . . . . . . . . $722.8 $675.6
See “Analysis of Historical Cash Flows” below.
Lines of Credit
Effective October 3, 2011, we terminated our former global credit facility and European credit facility andreplaced them with the Revolving Credit Facility. The Revolving Credit Facility may be used for working capitalneeds and general corporate purposes, including the payment of the amounts required upon effectiveness of theSettlement agreement. We did not use our former global credit facility and European credit facility in the yearsended December 31, 2011 and 2010. We used our Credit Facility for a short time period in connection with theacquisition of Diversey. Interest paid for the year ended December 31, 2011 under the Revolving Credit Facilitywas immaterial. There were no amounts outstanding under the Revolving Credit Facility at December 31, 2011.See Note 11, “Debt and Credit Facilities,” for further details.
Accounts Receivable Securitization Program
At December 31, 2011, we had $92 million available to us under the program, and we did not utilize thisprogram in 2011. See Note 8, “Accounts Receivable Securitization Program,” for information concerning thisprogram.
Covenants
At December 31, 2011, we were in compliance with our financial covenants and limitations, as discussed in“Covenants” of Note 11, “Debt and Credit Facilities.”
Debt Ratings
Our cost of capital and ability to obtain external financing may be affected by our debt ratings, which thecredit rating agencies review periodically. Below is a table that details our credit ratings by the various types ofdebt by rating agency.
Moody’sInvestorServices
Standard& Poor’s
Corporate Rating . . . . . . . . . . . . . . . . . . . . . . . . . . . . . . . . . . . . . . . . . . . . . . . . . . . Ba3 BBSenior Unsecured Rating . . . . . . . . . . . . . . . . . . . . . . . . . . . . . . . . . . . . . . . . . . . . B1 BBSenior Secured Credit Facility Rating . . . . . . . . . . . . . . . . . . . . . . . . . . . . . . . . . . Ba1 BB+Outlook . . . . . . . . . . . . . . . . . . . . . . . . . . . . . . . . . . . . . . . . . . . . . . . . . . . . . . . . . . Stable Stable
These credit ratings are considered to be below investment grade. If our credit ratings are downgraded, therecould be a negative impact on our ability to access capital markets and borrowing costs could increase. A creditrating is not a recommendation to buy, sell or hold securities and may be subject to revision or withdrawal at anytime by the rating organization. Each rating should be evaluated independently of any other rating.
55
Outstanding Indebtedness
At December 31, 2011 and 2010, our total debt outstanding consisted of the amounts set forth in thefollowing table. See Note 11, “Debt and Credit Facilities,” for further information on our debt.
December 31,
2011 2010
Short-term borrowings . . . . . . . . . . . . . . . . . . . . . . . . . . . . . . . . . . . . . . . . . . . . $ 34.5 $ 23.5
Current portion of long-term debt . . . . . . . . . . . . . . . . . . . . . . . . . . . . . . . . . . . . 1.9 6.5
Total current debt . . . . . . . . . . . . . . . . . . . . . . . . . . . . . . . . . . . . . . . . . . . . . . . . 36.4 30.0
Total long-term debt, less current portion . . . . . . . . . . . . . . . . . . . . . . . . . . . . . . 5,010.9 1,399.2
Total debt . . . . . . . . . . . . . . . . . . . . . . . . . . . . . . . . . . . . . . . . . . . . . . . . . . . . . . . $5,047.3 $1,429.2
In the fourth quarter of 2011, we paid our required 2011 and prepaid our required 2012 Term Loan AFacility and Term Loan B Facility amortization payments. These payments totaled approximately $97 million.
Analysis of Historical Cash Flow
The following table shows the changes in our consolidated cash flows in the three years endedDecember 31, 2011.
2011 2010 2009
Net cash provided by operating activities . . . . . . . . . . . . . . . . . . . . . $ 392.1 $ 483.1 $552.0
Net cash used in investing activities . . . . . . . . . . . . . . . . . . . . . . . . . . (2,370.4) (96.9) (70.3)
Net cash provided by (used in) financing activities . . . . . . . . . . . . . . 2,023.6 (373.0) 90.3
Net Cash Provided by Operating Activities
2011
Net cash provided by operating activities in 2011 was primarily attributable to net earnings adjusted toreconcile to net cash provided by operating activities of $387 million, which primarily includes adjustments fordepreciation and amortization, costs related to the acquisition of Diversey and share-based incentivecompensation expenses. Net cash provided by changes in operating assets and liabilities resulted in a net sourceof cash of $6 million in 2011.
2010
Net cash provided by operating activities in 2010 was primarily attributable to net earnings adjusted toreconcile to net cash provided by operating activities of $480 million, which primarily includes adjustments fordepreciation and amortization and share-based incentive compensation expenses. The changes in operating assetsand liabilities resulted in a net cash source of $3 million.
Net Cash Used in Investing Activities
2011
Net cash used in investing activities in 2011 was primarily due to the acquisition of Diversey. See Note 3,“Acquisition of Diversey Holdings, Inc.” for further information.
2010
In 2010, we used net cash of $97 million for investing activities, which was primarily due to capitalexpenditures of $88 million and the use of $24 million of cash for the completion of three business acquisitionsand one equity investment in 2010. These investments were not material, individually or in the aggregate, to ourconsolidated financial condition and results of operations. Partially offsetting these uses of cash in 2010 werecash proceeds of $13 million received from the sale of all of our auction rate security investments in 2010.
56
We expect to continue to invest capital as we deem appropriate to expand our business, to maintain orreplace depreciating property, plant and equipment, to acquire new manufacturing technology and to improveproductivity and net sales growth. As discussed in “2012 Outlook” above, we expect total capital expenditures in2012 to be in the range $180 million to $190 million, which includes capital expenditures of $20 millionassociated with the 2011-2014 Integration and Optimization Program. This projection is based upon our updatedcapital expenditure budget for 2012, the status of approved but not yet completed capital projects, anticipatedfuture projects and historic spending trends.
Net Cash Provided By (Used in) Financing Activities
2011
Net cash provided by financing activities was primarily due to the following:
‰ net proceeds of $1.1 billion on Term Loan B Facility due October 2018;
‰ net proceeds of $1.1 billion on Term Loan A Facility due October 2016;
‰ issuance of $750 million of 8.125% Senior Notes due September 2019;
‰ issuance of $750 million of 8.375% Senior Notes due September 2021; and
‰ changes in restricted cash of $263 million, which was used for the redemption of the DHI and DI Notes(as described in Note 3, “Acquisition of Diversey Holdings, Inc”);
partially offset by:
‰ the repayment of existing indebtedness of Diversey of $1.6 billion, in connection with the acquisition ofDiversey;
‰ the payment of our required 2011 and prepayment of our required 2012 Term Loan A Facility and TermLoan B Facility amortization payments totaling $97 million;
‰ the payment of quarterly dividends of $87 million;
‰ net payments of short-term borrowings of $44 million;
‰ payments of debt issuance costs of $51 million in connection with the financing of the acquisition ofDiversey; and
‰ the acquisition of 0.5 million shares of common stock with a fair market value of $13 million that werewithheld from employees to satisfy their minimum tax withholding obligations under our 2005 contingentstock plan.
2010
In 2010, we used $373 million of cash and cash equivalents for financing activities primarily due to thefollowing activities:
‰ the use of $196 million of cash for the redemption of $150 million of the outstanding $300 millionprincipal amount of our 12% Senior Notes due February 14, 2014;
‰ the repayment of amounts outstanding under our European credit facility of $64 million in the first quarterof 2010;
‰ the payment of quarterly dividends of $80 million; and
‰ the repurchase of 0.4 million shares of our common stock for $10 million.
Repurchases of Capital Stock
We did not make any repurchases of our common stock in 2011 under our share repurchase program.
57
During 2010, we repurchased 0.4 million shares of our common stock, par value $0.10 per share, in openmarket purchases at a cost of $10 million. The average price per share of these common stock repurchases was$22.91.
We made the share repurchases in 2010 under the share repurchase program adopted by our Board ofDirectors in August 2007 under which the Board of Directors authorized us to repurchase in the aggregate up to20 million shares of our issued and outstanding common stock. The program has no set expiration date, and wemay from time to time continue to repurchase our common stock. See Item 5, “Issuer Purchases of EquitySecurities,” for further information on the share repurchase program.
Changes in Working CapitalDecember 31,
2011December 31,
2010Increase
(Decrease)
Working capital (current assets less current liabilities) . . . . . $879.1 $592.3 $286.8
Current ratio (current assets divided by currentliabilities) . . . . . . . . . . . . . . . . . . . . . . . . . . . . . . . . . . . . . . 1.4x 1.4x
Quick ratio (current assets, less inventories divided bycurrent liabilities) . . . . . . . . . . . . . . . . . . . . . . . . . . . . . . . . 1.0x 1.1x
The $287 million increase, or 48%, in working capital in the year ended December 31, 2011 was primarilydue to the following factors:
‰ net cash provided by operating activities of $392 million;
partially offset by:
‰ the payment of quarterly dividends of $87 million.
Changes in Stockholders’ Equity
The $551 million, or 23%, increase in stockholders’ equity in 2011 compared with 2010 was primarily dueto the following:
‰ 31.7 million shares of common stock with a fair market value of $513 million that were part of theconsideration transferred related to the acquisition of Diversey.
‰ net earnings of $149 million; and
‰ the recognition of share-based incentive compensation expense of $28 million.
These factors were partially offset by:
‰ dividends paid and accrued on our common stock of $89 million;
‰ foreign currency translation adjustments of $38 million; and
‰ the acquisition of 0.5 million shares of common stock with a fair market value of $13 million that werewithheld from employees to satisfy their minimum tax withholding obligations under our 2005 contingentstock plan. These shares are held in common stock in treasury.
Derivative Financial Instruments
Interest Rate Swaps
The information set forth in Part II, Item 8 of this Annual Report on Form 10-K in Note 12, “Derivativesand Hedging Activities,” under the caption “Interest Rate Swaps” is incorporated herein by reference.
Foreign Currency Forward Contracts
At December 31, 2011, we were party to foreign currency forward contracts, which did not have asignificant impact on our liquidity.
58
The information set forth in Part II, Item 8 of this Annual Report on Form 10-K in Note 12, “Derivativesand Hedging Activities,” under the caption “Foreign Currency Forward Contracts” is incorporated herein byreference.
For further discussion about these contracts and other financial instruments, see Item 7A, “Quantitative andQualitative Disclosures About Market Risk.”
Recently Issued Statements of Financial Accounting Standards, Accounting Guidance and DisclosureRequirements
We are subject to numerous recently issued statements of financial accounting standards, accountingguidance and disclosure requirements. Note 2, “Summary of Significant Accounting Policies and Recently IssuedAccounting Standards,” which is contained in Part II, Item 8 of this Annual Report on Form 10-K, describesthese new accounting standards and is incorporated herein by reference.
Critical Accounting Policies and Estimates
Our discussion and analysis of our consolidated financial condition and results of operations are based uponour consolidated financial statements, which are prepared in accordance with U.S. GAAP. The preparation ofconsolidated financial statements in conformity with U.S. GAAP requires management to make estimates andassumptions that affect the reported amounts of assets, liabilities, revenues and expenses and the disclosure ofcontingent assets and liabilities.
Our estimates and assumptions are evaluated on an ongoing basis and are based on all available evidence,including historical experience and other factors believed to be reasonable under the circumstances. To derivethese estimates and assumptions, management draws from those available sources that can best contribute to itsefforts. These sources include our officers and other employees, outside consultants and legal counsel, expertsand actuaries. In addition, we use internally generated reports and statistics, such as aging of accounts receivable,as well as outside sources such as government statistics, industry reports and third-party research studies. Theresults of these estimates and assumptions may form the basis of the carrying value of assets and liabilities andmay not be readily apparent from other sources. Actual results may differ from estimates under conditions andcircumstances different from those assumed, and any such differences may be material to our consolidatedfinancial statements.
We believe the following accounting policies are critical to understanding our consolidated results ofoperations and affect the more significant judgments and estimates used in the preparation of our consolidatedfinancial statements. The critical accounting policies discussed below should be read together with oursignificant accounting policies set forth in Note 2, “Summary of Significant Accounting Policies and RecentlyIssued Accounting Standards.”
Accounts Receivable and Allowance for Doubtful Accounts
In the normal course of business, we extend credit to our customers if they satisfy pre-defined credit criteria.We maintain an accounts receivable allowance for estimated losses resulting from the failure of our customers tomake required payments. An additional allowance may be required if the financial condition of our customersdeteriorates. The allowance for doubtful accounts is maintained at a level that management assesses to beappropriate to absorb estimated losses in the accounts receivable portfolio. The allowance for doubtful accountsis reviewed quarterly, and changes to the allowance are made through the provision for bad debts, which isincluded in marketing, administrative and development expenses on our consolidated statements of operations.These changes may reflect changes in economic, business and market conditions. The allowance is increased bythe provision for bad debts and decreased by the amount of charge-offs, net of recoveries.
The provision for bad debts charged against operating results is based on several factors including, but notlimited to, a regular assessment of the collectibility of specific customer balances, the length of time a receivableis past due and our historical experience with our customers. In circumstances where a specific customer’sinability to meet its financial obligations is known, we record a specific provision for bad debt against amounts
59
due thereby reducing the receivable to the amount we reasonably assess will be collected. If circumstanceschange, such as higher than expected defaults or an unexpected material adverse change in a major customer’sability to pay, our estimates of recoverability could be reduced by a material amount.
Fair Value Measurements of Financial Instruments
In determining fair value of financial instruments, we utilize valuation techniques that maximize the use ofobservable inputs and minimize the use of unobservable inputs to the extent possible and consider counterpartycredit risk in our assessment of fair value. We determine fair value of our financial instruments based onassumptions that market participants would use in pricing an asset or liability in the principal or mostadvantageous market. When considering market participant assumptions in fair value measurements, thefollowing fair value hierarchy distinguishes between observable and unobservable inputs, which are categorizedin one of the following levels:
‰ Level 1 Inputs: Unadjusted quoted prices in active markets for identical assets or liabilities accessible tothe reporting entity at the measurement date.
‰ Level 2 Inputs: Other than quoted prices included in Level 1 inputs that are observable for the asset orliability, either directly or indirectly, for substantially the full term of the asset or liability.
‰ Level 3 Inputs: Unobservable inputs for the asset or liability used to measure fair value to the extent thatobservable inputs are not available, thereby allowing for situations in which there is little, if any, marketactivity for the asset or liability at measurement date.
Our fair value measurements for our financial instruments are subjective and involve uncertainties andmatters of significant judgment. Changes in assumptions could significantly affect our estimates. See Note 13,“Fair Value Measurements and Other Financial Instruments,” for further details on our fair value measurements.
Commitments and Contingencies — Litigation
On an ongoing basis, we assess the potential liabilities and costs related to any lawsuits or claims broughtagainst us. We accrue a liability when we believe a loss is probable and when the amount of loss can bereasonably estimated. Litigation proceedings are evaluated on a case-by-case basis considering the availableinformation, including that received from internal and outside legal counsel, to assess potential outcomes. Whileit is typically very difficult to determine the timing and ultimate outcome of these actions, we use our bestjudgment to determine if it is probable that we will incur an expense related to the settlement or finaladjudication of these matters and whether a reasonable estimation of the probable loss, if any, can be made. Inassessing probable losses, we consider insurance recoveries, if any. We expense legal costs, including those legalcosts expected to be incurred in connection with a loss contingency, as incurred. We have in the past adjustedexisting accruals as proceedings have continued, been settled or otherwise provided further information on whichwe could review the likelihood of outflows of resources and their measurability, and we expect to do so in futureperiods. Due to the inherent uncertainties related to the eventual outcome of litigation and potential insurancerecovery, it is possible that disputed matters may be resolved for amounts materially different from anyprovisions or disclosures that we have previously made.
Impairment of Long-Lived Assets
For definite-lived intangible assets, such as customer relationships, contracts and intellectual property, andfor other long-lived assets, such as property, plant and equipment, whenever impairment indicators are present,we perform a review for impairment. We calculate the undiscounted value of the projected cash flows associatedwith the asset, or asset group, and compare this estimated amount to the carrying amount. If the carrying amountis found to be greater, we record an impairment loss for the excess of book value over the fair value. In addition,in all cases of an impairment review, we re-evaluate the remaining useful lives of the assets and modify them asappropriate.
For indefinite – lived intangible assets, such as in-process research and development and trademarks andtrade names, each year and whenever impairment indicators are present, we determine the fair value of the asset
60
and record an impairment loss for the excess of book value of fair value, if any. In addition, in all cases of animpairment review other than for in-process research and development assets, we re-evaluate whether continuingto characterize the asset as indefinite –lived is appropriate.
Goodwill
Goodwill is reviewed for possible impairment at least annually on a reporting unit level during the fourthquarter of each year. A review of goodwill may be initiated before or after conducting the annual analysis ifevents or changes in circumstances indicate the carrying value of goodwill may no longer be recoverable.
A reporting unit is the operating segment unless, at businesses one level below that operating segment —the “component” level — discrete financial information is prepared and regularly reviewed by management, andthe component has economic characteristics that are different from the economic characteristics of the othercomponents of the operating segment, in which case the component is the reporting unit.
We use a fair value approach to test goodwill for impairment. We must recognize a non-cash impairmentcharge for the amount, if any, by which the carrying amount of goodwill exceeds its implied fair value. Wederive an estimate of fair values for each of our reporting units using a combination of an income approach andappropriate market approaches, each based on an applicable weighting. We assess the applicable weighting basedon such factors as current market conditions and the quality and reliability of the data. Absent an indication offair value from a potential buyer or similar specific transactions, we believe that the use of these methodsprovides a reasonable estimate of a reporting unit’s fair value.
Fair value computed by these methods is arrived at using a number of factors, including projected futureoperating results, anticipated future cash flows, effective income tax rates, comparable marketplace data within aconsistent industry grouping, and the cost of capital. There are inherent uncertainties, however, related to thesefactors and to our judgment in applying them to this analysis. Nonetheless, we believe that the combination ofthese methods provides a reasonable approach to estimate the fair value of our reporting units. Assumptions forsales, net earnings and cash flows for each reporting unit were consistent among these methods.
Income Approach Used to Determine Fair Values
The income approach is based upon the present value of expected cash flows. Expected cash flows areconverted to present value using factors that consider the timing and risk of the future cash flows. The estimate ofcash flows used is prepared on an unleveraged debt-free basis. We use a discount rate that reflects a market-derived weighted average cost of capital. We believe that this approach is appropriate because it provides a fairvalue estimate based upon the reporting unit’s expected long-term operating and cash flow performance. Theprojections are based upon our best estimates of projected economic and market conditions over the relatedperiod including growth rates, estimates of future expected changes in operating margins and cash expenditures.Other significant estimates and assumptions include terminal value long-term growth rates, provisions for incometaxes, future capital expenditures and changes in future cashless, debt-free working capital.
Market Approaches Used to Determine Fair Values
Each year we consider various relevant market approaches that could be used to determine fair valueincluding an approach referred to as the merger and acquisition method.
The first market approach estimates the fair value of the reporting unit by applying multiples of operatingperformance measures to the reporting unit’s operating performance. These multiples are derived fromcomparable publicly-traded companies with similar investment characteristics to the reporting unit, and suchcomparables are reviewed and updated as needed annually. We believe that this approach is appropriate becauseit provides a fair value estimate using multiples from entities with operations and economic characteristicscomparable to our reporting units and the Company. The second market approach is based on the publicly tradedcommon stock of the Company, and the estimate of fair value of the reporting unit is based on the applicablemultiples of the Company. The third market approach is based on recent mergers and acquisitions of comparablepublicly-traded and privately-held companies in the packaging industry.
61
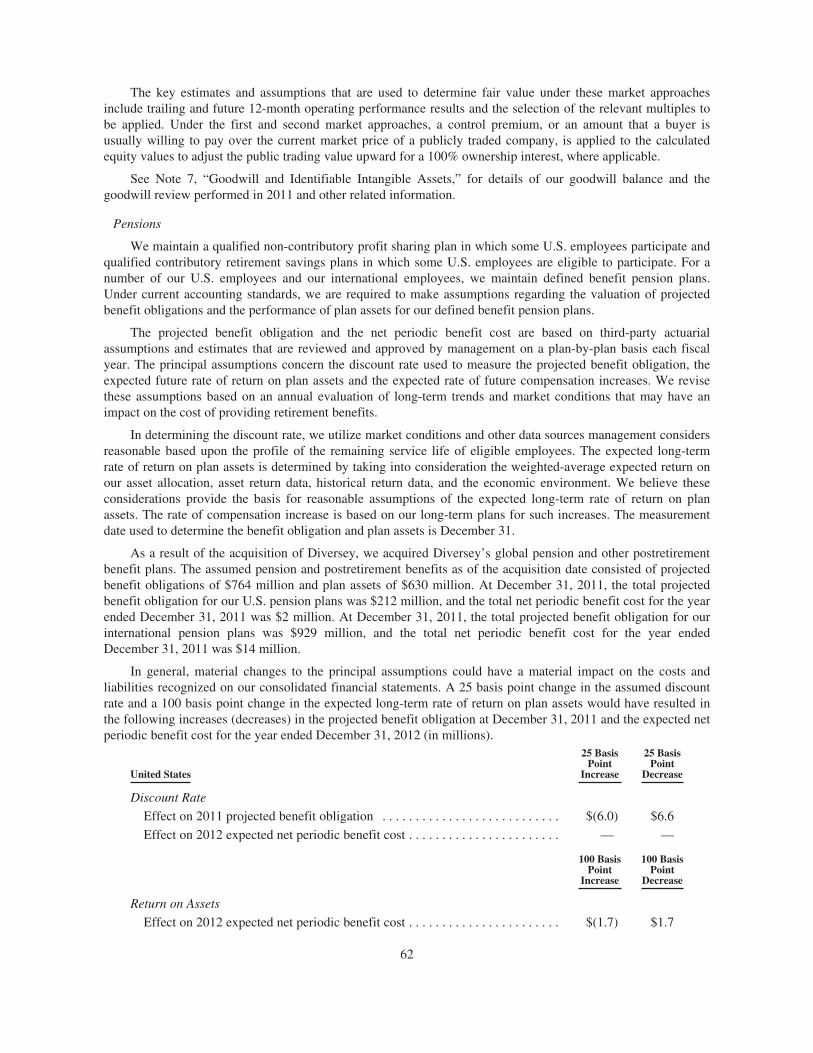
The key estimates and assumptions that are used to determine fair value under these market approachesinclude trailing and future 12-month operating performance results and the selection of the relevant multiples tobe applied. Under the first and second market approaches, a control premium, or an amount that a buyer isusually willing to pay over the current market price of a publicly traded company, is applied to the calculatedequity values to adjust the public trading value upward for a 100% ownership interest, where applicable.
See Note 7, “Goodwill and Identifiable Intangible Assets,” for details of our goodwill balance and thegoodwill review performed in 2011 and other related information.
Pensions
We maintain a qualified non-contributory profit sharing plan in which some U.S. employees participate andqualified contributory retirement savings plans in which some U.S. employees are eligible to participate. For anumber of our U.S. employees and our international employees, we maintain defined benefit pension plans.Under current accounting standards, we are required to make assumptions regarding the valuation of projectedbenefit obligations and the performance of plan assets for our defined benefit pension plans.
The projected benefit obligation and the net periodic benefit cost are based on third-party actuarialassumptions and estimates that are reviewed and approved by management on a plan-by-plan basis each fiscalyear. The principal assumptions concern the discount rate used to measure the projected benefit obligation, theexpected future rate of return on plan assets and the expected rate of future compensation increases. We revisethese assumptions based on an annual evaluation of long-term trends and market conditions that may have animpact on the cost of providing retirement benefits.
In determining the discount rate, we utilize market conditions and other data sources management considersreasonable based upon the profile of the remaining service life of eligible employees. The expected long-termrate of return on plan assets is determined by taking into consideration the weighted-average expected return onour asset allocation, asset return data, historical return data, and the economic environment. We believe theseconsiderations provide the basis for reasonable assumptions of the expected long-term rate of return on planassets. The rate of compensation increase is based on our long-term plans for such increases. The measurementdate used to determine the benefit obligation and plan assets is December 31.
As a result of the acquisition of Diversey, we acquired Diversey’s global pension and other postretirementbenefit plans. The assumed pension and postretirement benefits as of the acquisition date consisted of projectedbenefit obligations of $764 million and plan assets of $630 million. At December 31, 2011, the total projectedbenefit obligation for our U.S. pension plans was $212 million, and the total net periodic benefit cost for the yearended December 31, 2011 was $2 million. At December 31, 2011, the total projected benefit obligation for ourinternational pension plans was $929 million, and the total net periodic benefit cost for the year endedDecember 31, 2011 was $14 million.
In general, material changes to the principal assumptions could have a material impact on the costs andliabilities recognized on our consolidated financial statements. A 25 basis point change in the assumed discountrate and a 100 basis point change in the expected long-term rate of return on plan assets would have resulted inthe following increases (decreases) in the projected benefit obligation at December 31, 2011 and the expected netperiodic benefit cost for the year ended December 31, 2012 (in millions).
United States
25 BasisPoint
Increase
25 BasisPoint
Decrease
Discount Rate
Effect on 2011 projected benefit obligation . . . . . . . . . . . . . . . . . . . . . . . . . . . $(6.0) $6.6
Effect on 2012 expected net periodic benefit cost . . . . . . . . . . . . . . . . . . . . . . . — —
100 BasisPoint
Increase
100 BasisPoint
Decrease
Return on Assets
Effect on 2012 expected net periodic benefit cost . . . . . . . . . . . . . . . . . . . . . . . $(1.7) $1.7
62
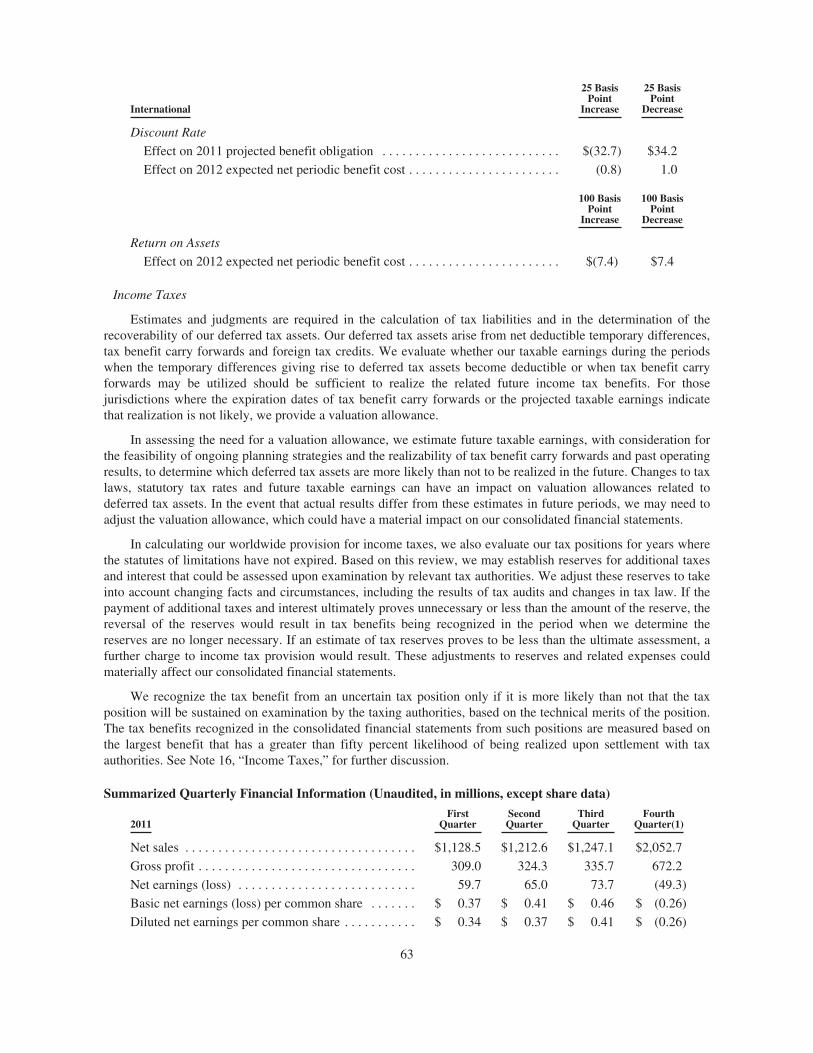
International
25 BasisPoint
Increase
25 BasisPoint
Decrease
Discount Rate
Effect on 2011 projected benefit obligation . . . . . . . . . . . . . . . . . . . . . . . . . . . $(32.7) $34.2
Effect on 2012 expected net periodic benefit cost . . . . . . . . . . . . . . . . . . . . . . . (0.8) 1.0
100 BasisPoint
Increase
100 BasisPoint
Decrease
Return on Assets
Effect on 2012 expected net periodic benefit cost . . . . . . . . . . . . . . . . . . . . . . . $(7.4) $7.4
Income Taxes
Estimates and judgments are required in the calculation of tax liabilities and in the determination of therecoverability of our deferred tax assets. Our deferred tax assets arise from net deductible temporary differences,tax benefit carry forwards and foreign tax credits. We evaluate whether our taxable earnings during the periodswhen the temporary differences giving rise to deferred tax assets become deductible or when tax benefit carryforwards may be utilized should be sufficient to realize the related future income tax benefits. For thosejurisdictions where the expiration dates of tax benefit carry forwards or the projected taxable earnings indicatethat realization is not likely, we provide a valuation allowance.
In assessing the need for a valuation allowance, we estimate future taxable earnings, with consideration forthe feasibility of ongoing planning strategies and the realizability of tax benefit carry forwards and past operatingresults, to determine which deferred tax assets are more likely than not to be realized in the future. Changes to taxlaws, statutory tax rates and future taxable earnings can have an impact on valuation allowances related todeferred tax assets. In the event that actual results differ from these estimates in future periods, we may need toadjust the valuation allowance, which could have a material impact on our consolidated financial statements.
In calculating our worldwide provision for income taxes, we also evaluate our tax positions for years wherethe statutes of limitations have not expired. Based on this review, we may establish reserves for additional taxesand interest that could be assessed upon examination by relevant tax authorities. We adjust these reserves to takeinto account changing facts and circumstances, including the results of tax audits and changes in tax law. If thepayment of additional taxes and interest ultimately proves unnecessary or less than the amount of the reserve, thereversal of the reserves would result in tax benefits being recognized in the period when we determine thereserves are no longer necessary. If an estimate of tax reserves proves to be less than the ultimate assessment, afurther charge to income tax provision would result. These adjustments to reserves and related expenses couldmaterially affect our consolidated financial statements.
We recognize the tax benefit from an uncertain tax position only if it is more likely than not that the taxposition will be sustained on examination by the taxing authorities, based on the technical merits of the position.The tax benefits recognized in the consolidated financial statements from such positions are measured based onthe largest benefit that has a greater than fifty percent likelihood of being realized upon settlement with taxauthorities. See Note 16, “Income Taxes,” for further discussion.
Summarized Quarterly Financial Information (Unaudited, in millions, except share data)
2011First
QuarterSecondQuarter
ThirdQuarter
FourthQuarter(1)
Net sales . . . . . . . . . . . . . . . . . . . . . . . . . . . . . . . . . . . $1,128.5 $1,212.6 $1,247.1 $2,052.7
Gross profit . . . . . . . . . . . . . . . . . . . . . . . . . . . . . . . . . 309.0 324.3 335.7 672.2
Net earnings (loss) . . . . . . . . . . . . . . . . . . . . . . . . . . . 59.7 65.0 73.7 (49.3)
Basic net earnings (loss) per common share . . . . . . . $ 0.37 $ 0.41 $ 0.46 $ (0.26)
Diluted net earnings per common share . . . . . . . . . . . $ 0.34 $ 0.37 $ 0.41 $ (0.26)
63
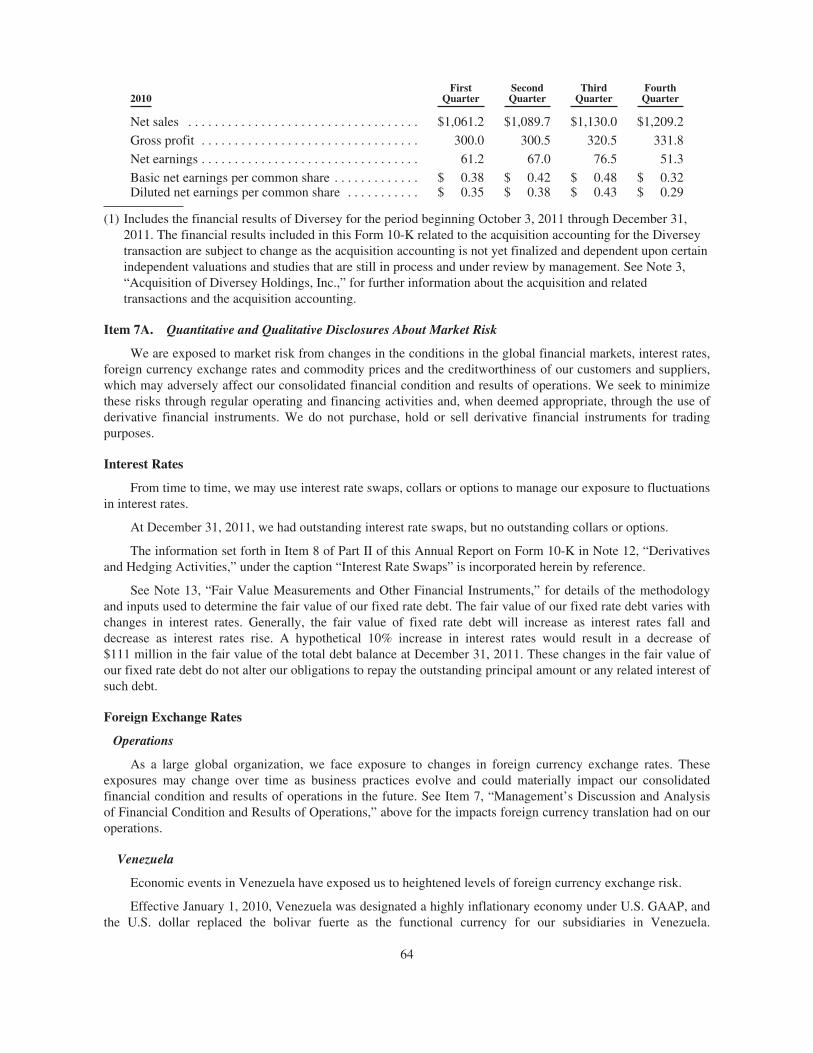
2010First
QuarterSecondQuarter
ThirdQuarter
FourthQuarter
Net sales . . . . . . . . . . . . . . . . . . . . . . . . . . . . . . . . . . . $1,061.2 $1,089.7 $1,130.0 $1,209.2
Gross profit . . . . . . . . . . . . . . . . . . . . . . . . . . . . . . . . . 300.0 300.5 320.5 331.8
Net earnings . . . . . . . . . . . . . . . . . . . . . . . . . . . . . . . . . 61.2 67.0 76.5 51.3
Basic net earnings per common share . . . . . . . . . . . . . $ 0.38 $ 0.42 $ 0.48 $ 0.32Diluted net earnings per common share . . . . . . . . . . . $ 0.35 $ 0.38 $ 0.43 $ 0.29
(1) Includes the financial results of Diversey for the period beginning October 3, 2011 through December 31,2011. The financial results included in this Form 10-K related to the acquisition accounting for the Diverseytransaction are subject to change as the acquisition accounting is not yet finalized and dependent upon certainindependent valuations and studies that are still in process and under review by management. See Note 3,“Acquisition of Diversey Holdings, Inc.,” for further information about the acquisition and relatedtransactions and the acquisition accounting.
Item 7A. Quantitative and Qualitative Disclosures About Market Risk
We are exposed to market risk from changes in the conditions in the global financial markets, interest rates,foreign currency exchange rates and commodity prices and the creditworthiness of our customers and suppliers,which may adversely affect our consolidated financial condition and results of operations. We seek to minimizethese risks through regular operating and financing activities and, when deemed appropriate, through the use ofderivative financial instruments. We do not purchase, hold or sell derivative financial instruments for tradingpurposes.
Interest Rates
From time to time, we may use interest rate swaps, collars or options to manage our exposure to fluctuationsin interest rates.
At December 31, 2011, we had outstanding interest rate swaps, but no outstanding collars or options.
The information set forth in Item 8 of Part II of this Annual Report on Form 10-K in Note 12, “Derivativesand Hedging Activities,” under the caption “Interest Rate Swaps” is incorporated herein by reference.
See Note 13, “Fair Value Measurements and Other Financial Instruments,” for details of the methodologyand inputs used to determine the fair value of our fixed rate debt. The fair value of our fixed rate debt varies withchanges in interest rates. Generally, the fair value of fixed rate debt will increase as interest rates fall anddecrease as interest rates rise. A hypothetical 10% increase in interest rates would result in a decrease of$111 million in the fair value of the total debt balance at December 31, 2011. These changes in the fair value ofour fixed rate debt do not alter our obligations to repay the outstanding principal amount or any related interest ofsuch debt.
Foreign Exchange Rates
Operations
As a large global organization, we face exposure to changes in foreign currency exchange rates. Theseexposures may change over time as business practices evolve and could materially impact our consolidatedfinancial condition and results of operations in the future. See Item 7, “Management’s Discussion and Analysisof Financial Condition and Results of Operations,” above for the impacts foreign currency translation had on ouroperations.
Venezuela
Economic events in Venezuela have exposed us to heightened levels of foreign currency exchange risk.
Effective January 1, 2010, Venezuela was designated a highly inflationary economy under U.S. GAAP, andthe U.S. dollar replaced the bolivar fuerte as the functional currency for our subsidiaries in Venezuela.
64
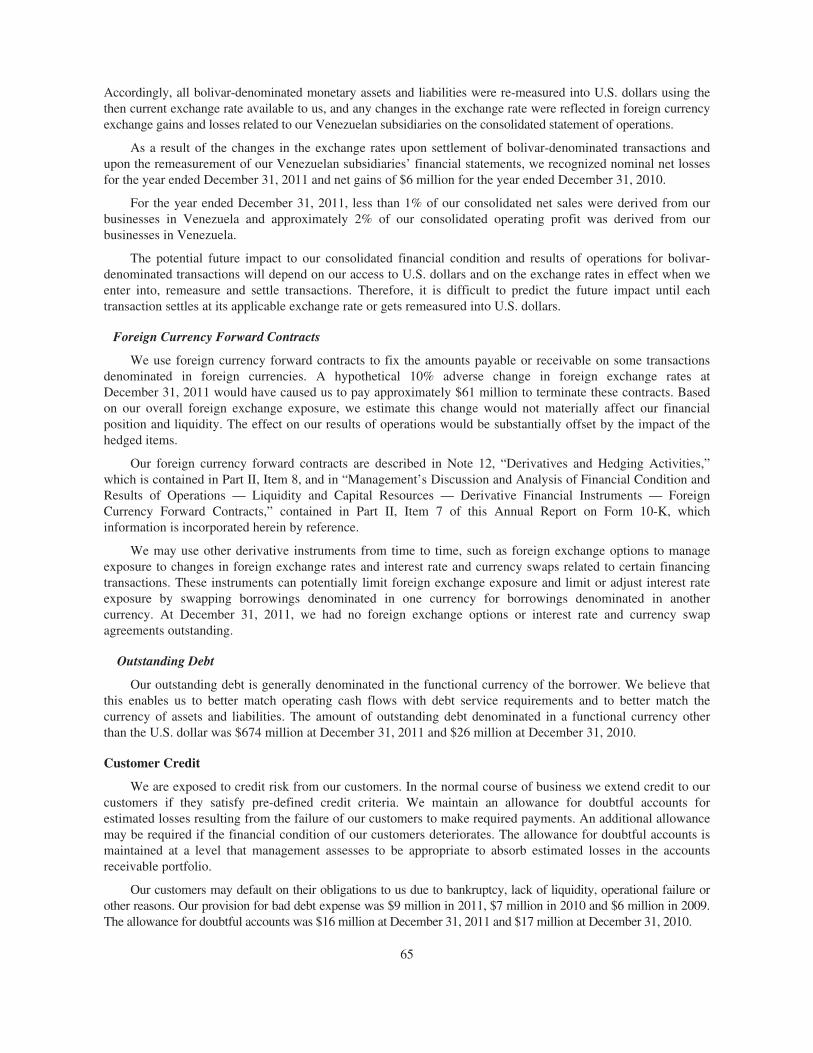
Accordingly, all bolivar-denominated monetary assets and liabilities were re-measured into U.S. dollars using thethen current exchange rate available to us, and any changes in the exchange rate were reflected in foreign currencyexchange gains and losses related to our Venezuelan subsidiaries on the consolidated statement of operations.
As a result of the changes in the exchange rates upon settlement of bolivar-denominated transactions andupon the remeasurement of our Venezuelan subsidiaries’ financial statements, we recognized nominal net lossesfor the year ended December 31, 2011 and net gains of $6 million for the year ended December 31, 2010.
For the year ended December 31, 2011, less than 1% of our consolidated net sales were derived from ourbusinesses in Venezuela and approximately 2% of our consolidated operating profit was derived from ourbusinesses in Venezuela.
The potential future impact to our consolidated financial condition and results of operations for bolivar-denominated transactions will depend on our access to U.S. dollars and on the exchange rates in effect when weenter into, remeasure and settle transactions. Therefore, it is difficult to predict the future impact until eachtransaction settles at its applicable exchange rate or gets remeasured into U.S. dollars.
Foreign Currency Forward Contracts
We use foreign currency forward contracts to fix the amounts payable or receivable on some transactionsdenominated in foreign currencies. A hypothetical 10% adverse change in foreign exchange rates atDecember 31, 2011 would have caused us to pay approximately $61 million to terminate these contracts. Basedon our overall foreign exchange exposure, we estimate this change would not materially affect our financialposition and liquidity. The effect on our results of operations would be substantially offset by the impact of thehedged items.
Our foreign currency forward contracts are described in Note 12, “Derivatives and Hedging Activities,”which is contained in Part II, Item 8, and in “Management’s Discussion and Analysis of Financial Condition andResults of Operations — Liquidity and Capital Resources — Derivative Financial Instruments — ForeignCurrency Forward Contracts,” contained in Part II, Item 7 of this Annual Report on Form 10-K, whichinformation is incorporated herein by reference.
We may use other derivative instruments from time to time, such as foreign exchange options to manageexposure to changes in foreign exchange rates and interest rate and currency swaps related to certain financingtransactions. These instruments can potentially limit foreign exchange exposure and limit or adjust interest rateexposure by swapping borrowings denominated in one currency for borrowings denominated in anothercurrency. At December 31, 2011, we had no foreign exchange options or interest rate and currency swapagreements outstanding.
Outstanding Debt
Our outstanding debt is generally denominated in the functional currency of the borrower. We believe thatthis enables us to better match operating cash flows with debt service requirements and to better match thecurrency of assets and liabilities. The amount of outstanding debt denominated in a functional currency otherthan the U.S. dollar was $674 million at December 31, 2011 and $26 million at December 31, 2010.
Customer Credit
We are exposed to credit risk from our customers. In the normal course of business we extend credit to ourcustomers if they satisfy pre-defined credit criteria. We maintain an allowance for doubtful accounts forestimated losses resulting from the failure of our customers to make required payments. An additional allowancemay be required if the financial condition of our customers deteriorates. The allowance for doubtful accounts ismaintained at a level that management assesses to be appropriate to absorb estimated losses in the accountsreceivable portfolio.
Our customers may default on their obligations to us due to bankruptcy, lack of liquidity, operational failure orother reasons. Our provision for bad debt expense was $9 million in 2011, $7 million in 2010 and $6 million in 2009.The allowance for doubtful accounts was $16 million at December 31, 2011 and $17 million at December 31, 2010.
65
Pensions
Recent market conditions have resulted in an unusually high degree of volatility and increased risks andshort-term liquidity concerns associated with some of the plan assets held by our defined benefit pension plans,which have impacted the performance of some of the plan assets. Based upon the annual valuation of our definedbenefit pension plans at December 31, 2011, we expect our net periodic benefit costs to be approximately$21 million in 2012. See Note 14, “Profit Sharing, Retirement Savings Plans and Defined Benefit PensionPlans,” for further details on our defined benefit pension plans.
Commodities
We use various commodity raw materials such as plastic resins and other chemicals and energy productssuch as electric power and natural gas in conjunction with our manufacturing processes. Generally, we acquirethese components at market prices in the region in which they will be used and do not use financial instrumentsto hedge commodity prices. Moreover, we seek to maintain appropriate levels of commodity raw materialinventories thus minimizing the expense and risks of carrying excess inventories. We do not typically purchasesubstantial quantities in advance of production requirements. As a result, we are exposed to market risks relatedto changes in commodity prices of these components.
66
Item 8. Financial Statements and Supplementary Data
The following consolidated financial statements and notes are filed as part of this report.
Sealed Air CorporationPage
Report of Independent Registered Public Accounting Firm . . . . . . . . . . . . . . . . . . . . . . . . . . . . . . . . . . . . . . 68
Financial Statements:
Consolidated Balance Sheets — December 31, 2011 and 2010 . . . . . . . . . . . . . . . . . . . . . . . . . . . . . . . . . 70
Consolidated Statements of Operations for the Three Years Ended December 31, 2011 . . . . . . . . . . . . . . 71
Consolidated Statements of Stockholders’ Equity for the Three Years Ended December 31, 2011 . . . . . . 72
Consolidated Statements of Cash Flows for the Three Years Ended December 31, 2011 . . . . . . . . . . . . . . 73
Consolidated Statements of Comprehensive Income for the Three Years Ended December 31, 2011 . . . . 74
Notes to Consolidated Financial Statements . . . . . . . . . . . . . . . . . . . . . . . . . . . . . . . . . . . . . . . . . . . . . . 75
Note 1 Organization and Nature of Operations . . . . . . . . . . . . . . . . . . . . . . . . . . . . . . . . . . . . . . . . . . . . 75
Note 2 Summary of Significant Accounting Policies and Recently Issued Accounting Standards . . . . . 75
Note 3 Acquisition of Diversey Holdings, Inc. . . . . . . . . . . . . . . . . . . . . . . . . . . . . . . . . . . . . . . . . . . . . 82
Note 4 Segments . . . . . . . . . . . . . . . . . . . . . . . . . . . . . . . . . . . . . . . . . . . . . . . . . . . . . . . . . . . . . . . . . . . . 89
Note 5 Inventories . . . . . . . . . . . . . . . . . . . . . . . . . . . . . . . . . . . . . . . . . . . . . . . . . . . . . . . . . . . . . . . . . . . 92
Note 6 Property and Equipment, net . . . . . . . . . . . . . . . . . . . . . . . . . . . . . . . . . . . . . . . . . . . . . . . . . . . . 92
Note 7 Goodwill and Identifiable Intangible Assets . . . . . . . . . . . . . . . . . . . . . . . . . . . . . . . . . . . . . . . . 93
Note 8 Accounts Receivable Securitization Program . . . . . . . . . . . . . . . . . . . . . . . . . . . . . . . . . . . . . . . . 94
Note 9 Restructuring Activities . . . . . . . . . . . . . . . . . . . . . . . . . . . . . . . . . . . . . . . . . . . . . . . . . . . . . . . . 95
Note 10 Other Liabilities . . . . . . . . . . . . . . . . . . . . . . . . . . . . . . . . . . . . . . . . . . . . . . . . . . . . . . . . . . . . . 97
Note 11 Debt and Credit Facilities . . . . . . . . . . . . . . . . . . . . . . . . . . . . . . . . . . . . . . . . . . . . . . . . . . . . . . 98
Note 12 Derivatives and Hedging Activities . . . . . . . . . . . . . . . . . . . . . . . . . . . . . . . . . . . . . . . . . . . . . . 101
Note 13 Fair Value Measurements and Other Financial Instruments . . . . . . . . . . . . . . . . . . . . . . . . . . . 104
Note 14 Profit Sharing, Retirement Savings Plans and Defined Benefit Pension Plans . . . . . . . . . . . . . 106
Note 15 Other Post-Employment Benefits and Other Employee Benefit Plans . . . . . . . . . . . . . . . . . . . . 113
Note 16 Income Taxes . . . . . . . . . . . . . . . . . . . . . . . . . . . . . . . . . . . . . . . . . . . . . . . . . . . . . . . . . . . . . . . 116
Note 17 Commitments and Contingencies . . . . . . . . . . . . . . . . . . . . . . . . . . . . . . . . . . . . . . . . . . . . . . . . 119
Note 18 Stockholders’ Equity . . . . . . . . . . . . . . . . . . . . . . . . . . . . . . . . . . . . . . . . . . . . . . . . . . . . . . . . . . 128
Note 19 Net Earnings Per Common Share . . . . . . . . . . . . . . . . . . . . . . . . . . . . . . . . . . . . . . . . . . . . . . . . 137
Note 20 Other Expense, net . . . . . . . . . . . . . . . . . . . . . . . . . . . . . . . . . . . . . . . . . . . . . . . . . . . . . . . . . . . 138
Note 21 Related Party Transactions . . . . . . . . . . . . . . . . . . . . . . . . . . . . . . . . . . . . . . . . . . . . . . . . . . . . . 139
Financial Statement Schedule:
II — Valuation and Qualifying Accounts and Reserves for the Three Years Ended December 31, 2011 . . . . 150
67
Report of Independent Registered Public Accounting Firm
The Board of Directors and StockholdersSealed Air Corporation:
We have audited the accompanying consolidated balance sheets of Sealed Air Corporation and subsidiariesas of December 31, 2011 and 2010, and the related consolidated statements of operations, stockholders’ equity,cash flows and comprehensive income for each of the years in the three-year period ended December 31, 2011.In connection with our audits of the consolidated financial statements, we also have audited financial statementschedule II — valuation and qualifying accounts and reserves. We also have audited Sealed Air Corporation’sinternal control over financial reporting as of December 31, 2011, based on criteria established in InternalControl — Integrated Framework issued by the Committee of Sponsoring Organizations of the TreadwayCommission (COSO). Sealed Air Corporation’s management is responsible for these consolidated financialstatements and financial statement schedule, for maintaining effective internal control over financial reporting,and for its assessment of the effectiveness of internal control over financial reporting, included in theaccompanying Management’s Annual Report on Internal Control over Financial Reporting. Our responsibility isto express an opinion on these consolidated financial statements and financial statement schedule, and an opinionon the Company’s internal control over financial reporting based on our audits.
We conducted our audits in accordance with the standards of the Public Company Accounting OversightBoard (United States). Those standards require that we plan and perform the audits to obtain reasonableassurance about whether the financial statements are free of material misstatement and whether effective internalcontrol over financial reporting was maintained in all material respects. Our audits of the consolidated financialstatements included examining, on a test basis, evidence supporting the amounts and disclosures in the financialstatements, assessing the accounting principles used and significant estimates made by management, andevaluating the overall financial statement presentation. Our audit of internal control over financial reportingincluded obtaining an understanding of internal control over financial reporting, assessing the risk that a materialweakness exists, and testing and evaluating the design and operating effectiveness of internal control based onthe assessed risk. Our audits also included performing such other procedures as we considered necessary in thecircumstances. We believe that our audits provide a reasonable basis for our opinions.
A company’s internal control over financial reporting is a process designed to provide reasonable assuranceregarding the reliability of financial reporting and the preparation of financial statements for external purposes inaccordance with generally accepted accounting principles. A company’s internal control over financial reportingincludes those policies and procedures that (1) pertain to the maintenance of records that, in reasonable detail,accurately and fairly reflect the transactions and dispositions of the assets of the company; (2) provide reasonableassurance that transactions are recorded as necessary to permit preparation of financial statements in accordancewith generally accepted accounting principles, and that receipts and expenditures of the company are being madeonly in accordance with authorizations of management and directors of the company; and (3) provide reasonableassurance regarding prevention or timely detection of unauthorized acquisition, use, or disposition of thecompany’s assets that could have a material effect on the financial statements.
Because of its inherent limitations, internal control over financial reporting may not prevent or detectmisstatements. Also, projections of any evaluation of effectiveness to future periods are subject to the risk thatcontrols may become inadequate because of changes in conditions, or that the degree of compliance with thepolicies or procedures may deteriorate.
In our opinion, the consolidated financial statements referred to above present fairly, in all material respects,the financial position of Sealed Air Corporation and subsidiaries as of December 31, 2011 and 2010, and theresults of their operations and their cash flows for each of the years in the three-year period ended December 31,2011, in conformity with U.S. generally accepted accounting principles. Also in our opinion, the related financialstatement schedule, when considered in relation to the basic consolidated financial statements taken as a whole,presents fairly, in all material respects, the information set forth therein. Also in our opinion, Sealed AirCorporation maintained, in all material respects, effective internal control over financial reporting as ofDecember 31, 2011, based on criteria established in Internal Control — Integrated Framework issued by theCommittee of Sponsoring Organizations of the Treadway Commission.
68
Sealed Air Corporation acquired Diversey Holdings Inc., on October 3, 2011, and management excludedfrom its assessment of the effectiveness of Sealed Air Corporation’s internal control over financial reporting as ofDecember 31, 2011, Diversey Holdings Inc.’s internal control over financial reporting associated with total assetsof $6.5 billion (of which $4.7 billion represented goodwill and intangible assets included within the scope of theassessment) and total net sales of $796 million included in the consolidated financial statements of Sealed AirCorporation as of and for the year ended December 31, 2011. Our audit of internal control over financialreporting of Sealed Air Corporation also excluded an evaluation of the internal control over financial reporting ofDiversey Holdings Inc.
/s/ KPMG LLP
Short Hills, New JerseyFebruary 29, 2012
69
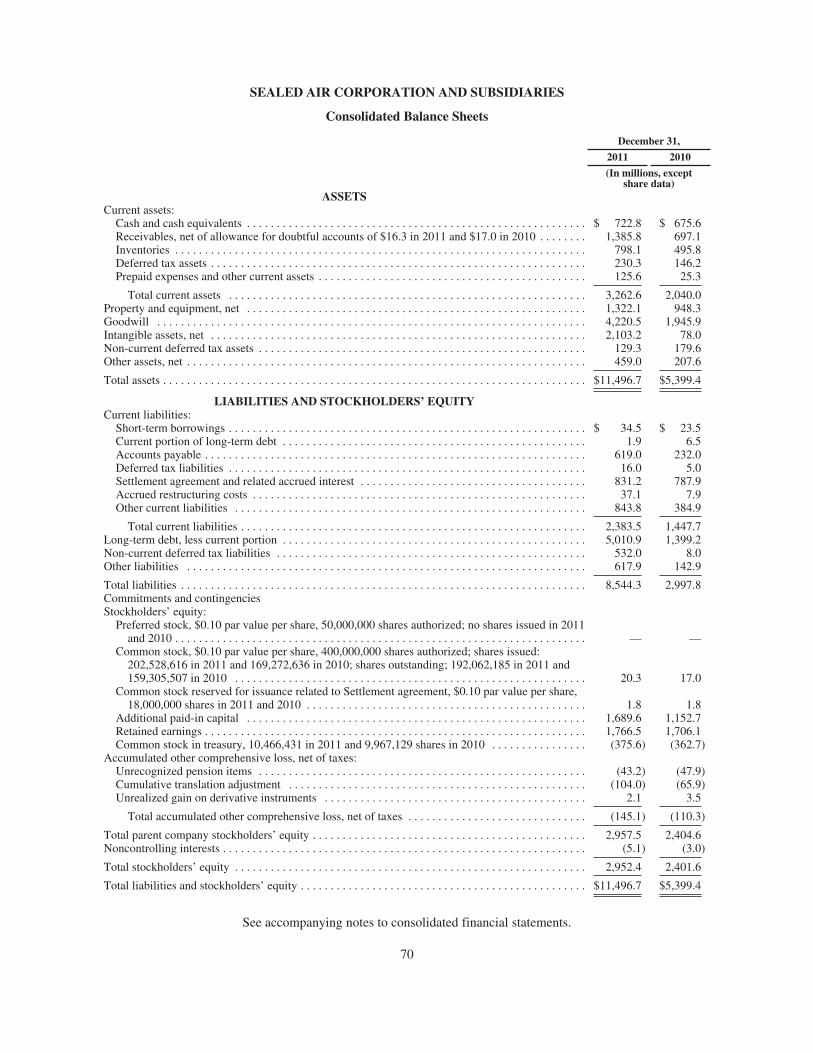
SEALED AIR CORPORATION AND SUBSIDIARIES
Consolidated Balance Sheets
December 31,
2011 2010
(In millions, exceptshare data)
ASSETSCurrent assets:
Cash and cash equivalents . . . . . . . . . . . . . . . . . . . . . . . . . . . . . . . . . . . . . . . . . . . . . . . . . . . . . . . . . $ 722.8 $ 675.6Receivables, net of allowance for doubtful accounts of $16.3 in 2011 and $17.0 in 2010 . . . . . . . . 1,385.8 697.1Inventories . . . . . . . . . . . . . . . . . . . . . . . . . . . . . . . . . . . . . . . . . . . . . . . . . . . . . . . . . . . . . . . . . . . . . 798.1 495.8Deferred tax assets . . . . . . . . . . . . . . . . . . . . . . . . . . . . . . . . . . . . . . . . . . . . . . . . . . . . . . . . . . . . . . . 230.3 146.2Prepaid expenses and other current assets . . . . . . . . . . . . . . . . . . . . . . . . . . . . . . . . . . . . . . . . . . . . . 125.6 25.3
Total current assets . . . . . . . . . . . . . . . . . . . . . . . . . . . . . . . . . . . . . . . . . . . . . . . . . . . . . . . . . . . . 3,262.6 2,040.0Property and equipment, net . . . . . . . . . . . . . . . . . . . . . . . . . . . . . . . . . . . . . . . . . . . . . . . . . . . . . . . . . 1,322.1 948.3Goodwill . . . . . . . . . . . . . . . . . . . . . . . . . . . . . . . . . . . . . . . . . . . . . . . . . . . . . . . . . . . . . . . . . . . . . . . . 4,220.5 1,945.9Intangible assets, net . . . . . . . . . . . . . . . . . . . . . . . . . . . . . . . . . . . . . . . . . . . . . . . . . . . . . . . . . . . . . . . 2,103.2 78.0Non-current deferred tax assets . . . . . . . . . . . . . . . . . . . . . . . . . . . . . . . . . . . . . . . . . . . . . . . . . . . . . . . 129.3 179.6Other assets, net . . . . . . . . . . . . . . . . . . . . . . . . . . . . . . . . . . . . . . . . . . . . . . . . . . . . . . . . . . . . . . . . . . . 459.0 207.6
Total assets . . . . . . . . . . . . . . . . . . . . . . . . . . . . . . . . . . . . . . . . . . . . . . . . . . . . . . . . . . . . . . . . . . . . . . . $11,496.7 $5,399.4
LIABILITIES AND STOCKHOLDERS’ EQUITYCurrent liabilities:
Short-term borrowings . . . . . . . . . . . . . . . . . . . . . . . . . . . . . . . . . . . . . . . . . . . . . . . . . . . . . . . . . . . . $ 34.5 $ 23.5Current portion of long-term debt . . . . . . . . . . . . . . . . . . . . . . . . . . . . . . . . . . . . . . . . . . . . . . . . . . . 1.9 6.5Accounts payable . . . . . . . . . . . . . . . . . . . . . . . . . . . . . . . . . . . . . . . . . . . . . . . . . . . . . . . . . . . . . . . . 619.0 232.0Deferred tax liabilities . . . . . . . . . . . . . . . . . . . . . . . . . . . . . . . . . . . . . . . . . . . . . . . . . . . . . . . . . . . . 16.0 5.0Settlement agreement and related accrued interest . . . . . . . . . . . . . . . . . . . . . . . . . . . . . . . . . . . . . . 831.2 787.9Accrued restructuring costs . . . . . . . . . . . . . . . . . . . . . . . . . . . . . . . . . . . . . . . . . . . . . . . . . . . . . . . . 37.1 7.9Other current liabilities . . . . . . . . . . . . . . . . . . . . . . . . . . . . . . . . . . . . . . . . . . . . . . . . . . . . . . . . . . . 843.8 384.9
Total current liabilities . . . . . . . . . . . . . . . . . . . . . . . . . . . . . . . . . . . . . . . . . . . . . . . . . . . . . . . . . . 2,383.5 1,447.7Long-term debt, less current portion . . . . . . . . . . . . . . . . . . . . . . . . . . . . . . . . . . . . . . . . . . . . . . . . . . . 5,010.9 1,399.2Non-current deferred tax liabilities . . . . . . . . . . . . . . . . . . . . . . . . . . . . . . . . . . . . . . . . . . . . . . . . . . . . 532.0 8.0Other liabilities . . . . . . . . . . . . . . . . . . . . . . . . . . . . . . . . . . . . . . . . . . . . . . . . . . . . . . . . . . . . . . . . . . . 617.9 142.9
Total liabilities . . . . . . . . . . . . . . . . . . . . . . . . . . . . . . . . . . . . . . . . . . . . . . . . . . . . . . . . . . . . . . . . . . . . 8,544.3 2,997.8Commitments and contingenciesStockholders’ equity:
Preferred stock, $0.10 par value per share, 50,000,000 shares authorized; no shares issued in 2011and 2010 . . . . . . . . . . . . . . . . . . . . . . . . . . . . . . . . . . . . . . . . . . . . . . . . . . . . . . . . . . . . . . . . . . . . . — —
Common stock, $0.10 par value per share, 400,000,000 shares authorized; shares issued:202,528,616 in 2011 and 169,272,636 in 2010; shares outstanding; 192,062,185 in 2011 and159,305,507 in 2010 . . . . . . . . . . . . . . . . . . . . . . . . . . . . . . . . . . . . . . . . . . . . . . . . . . . . . . . . . . . 20.3 17.0
Common stock reserved for issuance related to Settlement agreement, $0.10 par value per share,18,000,000 shares in 2011 and 2010 . . . . . . . . . . . . . . . . . . . . . . . . . . . . . . . . . . . . . . . . . . . . . . . 1.8 1.8
Additional paid-in capital . . . . . . . . . . . . . . . . . . . . . . . . . . . . . . . . . . . . . . . . . . . . . . . . . . . . . . . . . 1,689.6 1,152.7Retained earnings . . . . . . . . . . . . . . . . . . . . . . . . . . . . . . . . . . . . . . . . . . . . . . . . . . . . . . . . . . . . . . . . 1,766.5 1,706.1Common stock in treasury, 10,466,431 in 2011 and 9,967,129 shares in 2010 . . . . . . . . . . . . . . . . (375.6) (362.7)
Accumulated other comprehensive loss, net of taxes:Unrecognized pension items . . . . . . . . . . . . . . . . . . . . . . . . . . . . . . . . . . . . . . . . . . . . . . . . . . . . . . . (43.2) (47.9)Cumulative translation adjustment . . . . . . . . . . . . . . . . . . . . . . . . . . . . . . . . . . . . . . . . . . . . . . . . . . (104.0) (65.9)Unrealized gain on derivative instruments . . . . . . . . . . . . . . . . . . . . . . . . . . . . . . . . . . . . . . . . . . . . 2.1 3.5
Total accumulated other comprehensive loss, net of taxes . . . . . . . . . . . . . . . . . . . . . . . . . . . . . . (145.1) (110.3)
Total parent company stockholders’ equity . . . . . . . . . . . . . . . . . . . . . . . . . . . . . . . . . . . . . . . . . . . . . . 2,957.5 2,404.6Noncontrolling interests . . . . . . . . . . . . . . . . . . . . . . . . . . . . . . . . . . . . . . . . . . . . . . . . . . . . . . . . . . . . . (5.1) (3.0)
Total stockholders’ equity . . . . . . . . . . . . . . . . . . . . . . . . . . . . . . . . . . . . . . . . . . . . . . . . . . . . . . . . . . . 2,952.4 2,401.6
Total liabilities and stockholders’ equity . . . . . . . . . . . . . . . . . . . . . . . . . . . . . . . . . . . . . . . . . . . . . . . . $11,496.7 $5,399.4
See accompanying notes to consolidated financial statements.
70
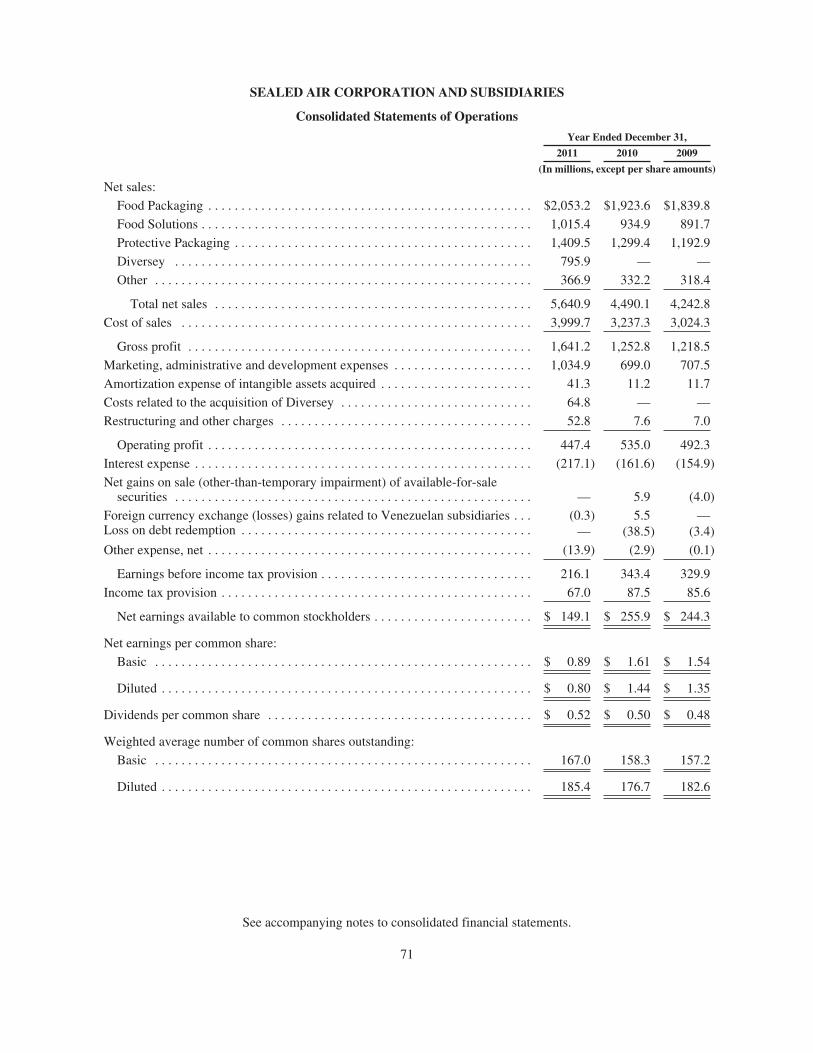
SEALED AIR CORPORATION AND SUBSIDIARIES
Consolidated Statements of Operations
Year Ended December 31,
2011 2010 2009
(In millions, except per share amounts)
Net sales:
Food Packaging . . . . . . . . . . . . . . . . . . . . . . . . . . . . . . . . . . . . . . . . . . . . . . . . . $2,053.2 $1,923.6 $1,839.8
Food Solutions . . . . . . . . . . . . . . . . . . . . . . . . . . . . . . . . . . . . . . . . . . . . . . . . . . 1,015.4 934.9 891.7
Protective Packaging . . . . . . . . . . . . . . . . . . . . . . . . . . . . . . . . . . . . . . . . . . . . . 1,409.5 1,299.4 1,192.9
Diversey . . . . . . . . . . . . . . . . . . . . . . . . . . . . . . . . . . . . . . . . . . . . . . . . . . . . . . 795.9 — —
Other . . . . . . . . . . . . . . . . . . . . . . . . . . . . . . . . . . . . . . . . . . . . . . . . . . . . . . . . . 366.9 332.2 318.4
Total net sales . . . . . . . . . . . . . . . . . . . . . . . . . . . . . . . . . . . . . . . . . . . . . . . . 5,640.9 4,490.1 4,242.8
Cost of sales . . . . . . . . . . . . . . . . . . . . . . . . . . . . . . . . . . . . . . . . . . . . . . . . . . . . . 3,999.7 3,237.3 3,024.3
Gross profit . . . . . . . . . . . . . . . . . . . . . . . . . . . . . . . . . . . . . . . . . . . . . . . . . . . . 1,641.2 1,252.8 1,218.5
Marketing, administrative and development expenses . . . . . . . . . . . . . . . . . . . . . 1,034.9 699.0 707.5
Amortization expense of intangible assets acquired . . . . . . . . . . . . . . . . . . . . . . . 41.3 11.2 11.7
Costs related to the acquisition of Diversey . . . . . . . . . . . . . . . . . . . . . . . . . . . . . 64.8 — —
Restructuring and other charges . . . . . . . . . . . . . . . . . . . . . . . . . . . . . . . . . . . . . . 52.8 7.6 7.0
Operating profit . . . . . . . . . . . . . . . . . . . . . . . . . . . . . . . . . . . . . . . . . . . . . . . . . 447.4 535.0 492.3
Interest expense . . . . . . . . . . . . . . . . . . . . . . . . . . . . . . . . . . . . . . . . . . . . . . . . . . . (217.1) (161.6) (154.9)
Net gains on sale (other-than-temporary impairment) of available-for-salesecurities . . . . . . . . . . . . . . . . . . . . . . . . . . . . . . . . . . . . . . . . . . . . . . . . . . . . . . — 5.9 (4.0)
Foreign currency exchange (losses) gains related to Venezuelan subsidiaries . . . (0.3) 5.5 —Loss on debt redemption . . . . . . . . . . . . . . . . . . . . . . . . . . . . . . . . . . . . . . . . . . . . — (38.5) (3.4)
Other expense, net . . . . . . . . . . . . . . . . . . . . . . . . . . . . . . . . . . . . . . . . . . . . . . . . . (13.9) (2.9) (0.1)
Earnings before income tax provision . . . . . . . . . . . . . . . . . . . . . . . . . . . . . . . . 216.1 343.4 329.9
Income tax provision . . . . . . . . . . . . . . . . . . . . . . . . . . . . . . . . . . . . . . . . . . . . . . . 67.0 87.5 85.6
Net earnings available to common stockholders . . . . . . . . . . . . . . . . . . . . . . . . $ 149.1 $ 255.9 $ 244.3
Net earnings per common share:
Basic . . . . . . . . . . . . . . . . . . . . . . . . . . . . . . . . . . . . . . . . . . . . . . . . . . . . . . . . . $ 0.89 $ 1.61 $ 1.54
Diluted . . . . . . . . . . . . . . . . . . . . . . . . . . . . . . . . . . . . . . . . . . . . . . . . . . . . . . . . $ 0.80 $ 1.44 $ 1.35
Dividends per common share . . . . . . . . . . . . . . . . . . . . . . . . . . . . . . . . . . . . . . . . $ 0.52 $ 0.50 $ 0.48
Weighted average number of common shares outstanding:
Basic . . . . . . . . . . . . . . . . . . . . . . . . . . . . . . . . . . . . . . . . . . . . . . . . . . . . . . . . . 167.0 158.3 157.2
Diluted . . . . . . . . . . . . . . . . . . . . . . . . . . . . . . . . . . . . . . . . . . . . . . . . . . . . . . . . 185.4 176.7 182.6
See accompanying notes to consolidated financial statements.
71
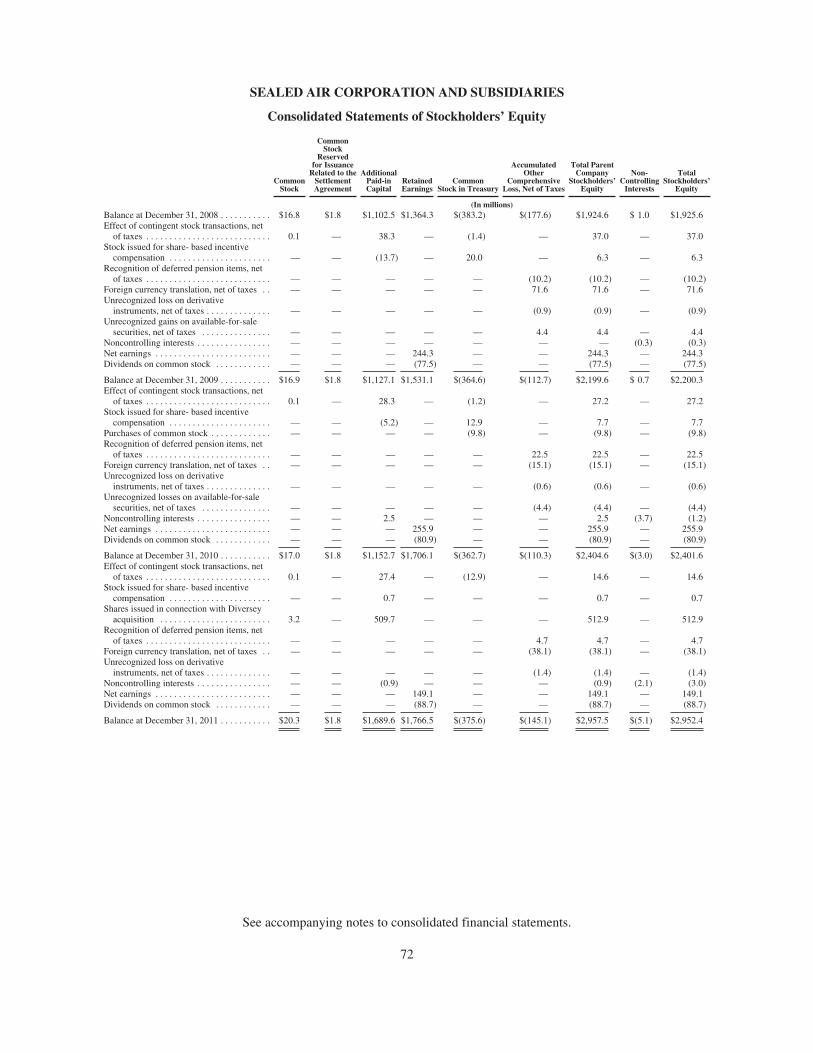
SEALED AIR CORPORATION AND SUBSIDIARIES
Consolidated Statements of Stockholders’ Equity
CommonStock
CommonStock
Reservedfor Issuance
Related to theSettlementAgreement
AdditionalPaid-inCapital
RetainedEarnings
CommonStock in Treasury
AccumulatedOther
ComprehensiveLoss, Net of Taxes
Total ParentCompany
Stockholders’Equity
Non-Controlling
Interests
TotalStockholders’
Equity
(In millions)Balance at December 31, 2008 . . . . . . . . . . . $16.8 $1.8 $1,102.5 $1,364.3 $(383.2) $(177.6) $1,924.6 $ 1.0 $1,925.6Effect of contingent stock transactions, net
of taxes . . . . . . . . . . . . . . . . . . . . . . . . . . . 0.1 — 38.3 — (1.4) — 37.0 — 37.0Stock issued for share- based incentive
compensation . . . . . . . . . . . . . . . . . . . . . . — — (13.7) — 20.0 — 6.3 — 6.3Recognition of deferred pension items, net
of taxes . . . . . . . . . . . . . . . . . . . . . . . . . . . — — — — — (10.2) (10.2) — (10.2)Foreign currency translation, net of taxes . . — — — — — 71.6 71.6 — 71.6Unrecognized loss on derivative
instruments, net of taxes . . . . . . . . . . . . . . — — — — — (0.9) (0.9) — (0.9)Unrecognized gains on available-for-sale
securities, net of taxes . . . . . . . . . . . . . . . — — — — — 4.4 4.4 — 4.4Noncontrolling interests . . . . . . . . . . . . . . . . — — — — — — — (0.3) (0.3)Net earnings . . . . . . . . . . . . . . . . . . . . . . . . . — — — 244.3 — — 244.3 — 244.3Dividends on common stock . . . . . . . . . . . . — — — (77.5) — — (77.5) — (77.5)
Balance at December 31, 2009 . . . . . . . . . . . $16.9 $1.8 $1,127.1 $1,531.1 $(364.6) $(112.7) $2,199.6 $ 0.7 $2,200.3Effect of contingent stock transactions, net
of taxes . . . . . . . . . . . . . . . . . . . . . . . . . . . 0.1 — 28.3 — (1.2) — 27.2 — 27.2Stock issued for share- based incentive
compensation . . . . . . . . . . . . . . . . . . . . . . — — (5.2) — 12.9 — 7.7 — 7.7Purchases of common stock . . . . . . . . . . . . . — — — — (9.8) — (9.8) — (9.8)Recognition of deferred pension items, net
of taxes . . . . . . . . . . . . . . . . . . . . . . . . . . . — — — — — 22.5 22.5 — 22.5Foreign currency translation, net of taxes . . — — — — — (15.1) (15.1) — (15.1)Unrecognized loss on derivative
instruments, net of taxes . . . . . . . . . . . . . . — — — — — (0.6) (0.6) — (0.6)Unrecognized losses on available-for-sale
securities, net of taxes . . . . . . . . . . . . . . . — — — — — (4.4) (4.4) — (4.4)Noncontrolling interests . . . . . . . . . . . . . . . . — — 2.5 — — — 2.5 (3.7) (1.2)Net earnings . . . . . . . . . . . . . . . . . . . . . . . . . — — — 255.9 — — 255.9 — 255.9Dividends on common stock . . . . . . . . . . . . — — — (80.9) — — (80.9) — (80.9)
Balance at December 31, 2010 . . . . . . . . . . . $17.0 $1.8 $1,152.7 $1,706.1 $(362.7) $(110.3) $2,404.6 $(3.0) $2,401.6Effect of contingent stock transactions, net
of taxes . . . . . . . . . . . . . . . . . . . . . . . . . . . 0.1 — 27.4 — (12.9) — 14.6 — 14.6Stock issued for share- based incentive
compensation . . . . . . . . . . . . . . . . . . . . . . — — 0.7 — — — 0.7 — 0.7Shares issued in connection with Diversey
acquisition . . . . . . . . . . . . . . . . . . . . . . . . 3.2 — 509.7 — — — 512.9 — 512.9Recognition of deferred pension items, net
of taxes . . . . . . . . . . . . . . . . . . . . . . . . . . . — — — — — 4.7 4.7 — 4.7Foreign currency translation, net of taxes . . — — — — — (38.1) (38.1) — (38.1)Unrecognized loss on derivative
instruments, net of taxes . . . . . . . . . . . . . . — — — — — (1.4) (1.4) — (1.4)Noncontrolling interests . . . . . . . . . . . . . . . . — — (0.9) — — — (0.9) (2.1) (3.0)Net earnings . . . . . . . . . . . . . . . . . . . . . . . . . — — — 149.1 — — 149.1 — 149.1Dividends on common stock . . . . . . . . . . . . — — — (88.7) — — (88.7) — (88.7)
Balance at December 31, 2011 . . . . . . . . . . . $20.3 $1.8 $1,689.6 $1,766.5 $(375.6) $(145.1) $2,957.5 $(5.1) $2,952.4
See accompanying notes to consolidated financial statements.
72
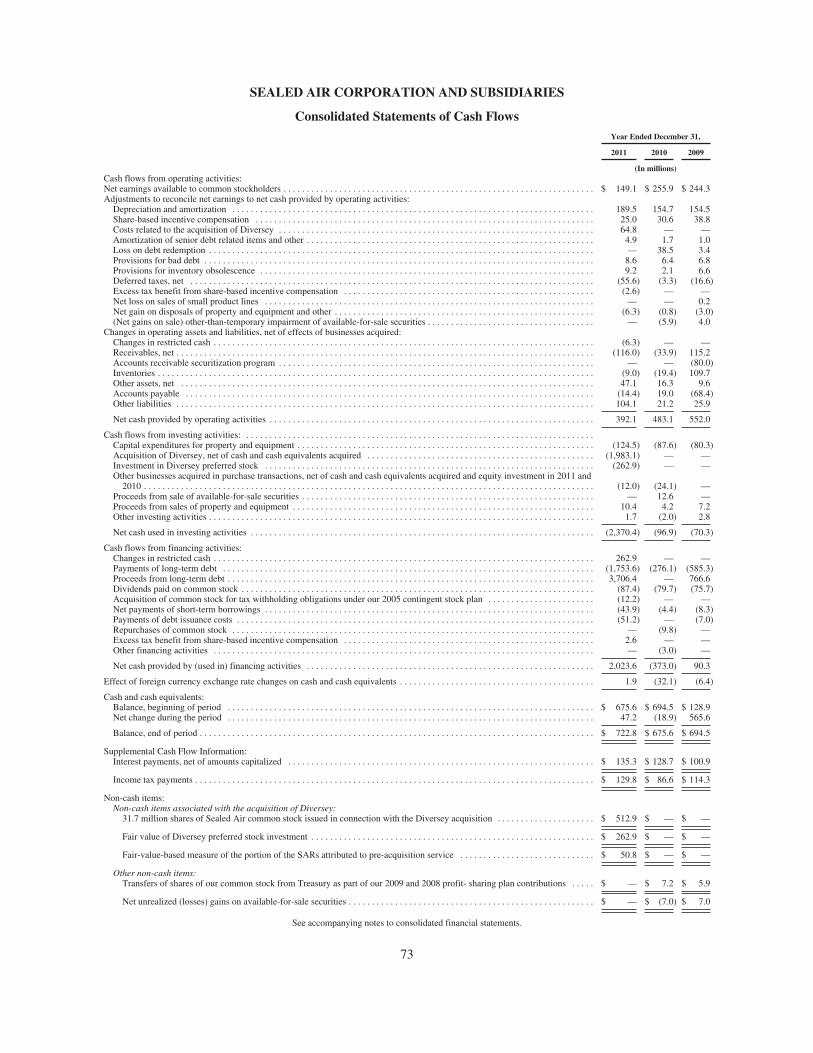
SEALED AIR CORPORATION AND SUBSIDIARIES
Consolidated Statements of Cash FlowsYear Ended December 31,
2011 2010 2009
(In millions)Cash flows from operating activities:Net earnings available to common stockholders . . . . . . . . . . . . . . . . . . . . . . . . . . . . . . . . . . . . . . . . . . . . . . . . . . . . . . . . . . . . . . . . . . . $ 149.1 $ 255.9 $ 244.3Adjustments to reconcile net earnings to net cash provided by operating activities:
Depreciation and amortization . . . . . . . . . . . . . . . . . . . . . . . . . . . . . . . . . . . . . . . . . . . . . . . . . . . . . . . . . . . . . . . . . . . . . . . . . . . . . . 189.5 154.7 154.5Share-based incentive compensation . . . . . . . . . . . . . . . . . . . . . . . . . . . . . . . . . . . . . . . . . . . . . . . . . . . . . . . . . . . . . . . . . . . . . . . . . 25.0 30.6 38.8Costs related to the acquisition of Diversey . . . . . . . . . . . . . . . . . . . . . . . . . . . . . . . . . . . . . . . . . . . . . . . . . . . . . . . . . . . . . . . . . . . . 64.8 — —Amortization of senior debt related items and other . . . . . . . . . . . . . . . . . . . . . . . . . . . . . . . . . . . . . . . . . . . . . . . . . . . . . . . . . . . . . . 4.9 1.7 1.0Loss on debt redemption . . . . . . . . . . . . . . . . . . . . . . . . . . . . . . . . . . . . . . . . . . . . . . . . . . . . . . . . . . . . . . . . . . . . . . . . . . . . . . . . . . . — 38.5 3.4Provisions for bad debt . . . . . . . . . . . . . . . . . . . . . . . . . . . . . . . . . . . . . . . . . . . . . . . . . . . . . . . . . . . . . . . . . . . . . . . . . . . . . . . . . . . . 8.6 6.4 6.8Provisions for inventory obsolescence . . . . . . . . . . . . . . . . . . . . . . . . . . . . . . . . . . . . . . . . . . . . . . . . . . . . . . . . . . . . . . . . . . . . . . . . 9.2 2.1 6.6Deferred taxes, net . . . . . . . . . . . . . . . . . . . . . . . . . . . . . . . . . . . . . . . . . . . . . . . . . . . . . . . . . . . . . . . . . . . . . . . . . . . . . . . . . . . . . . . (55.6) (3.3) (16.6)Excess tax benefit from share-based incentive compensation . . . . . . . . . . . . . . . . . . . . . . . . . . . . . . . . . . . . . . . . . . . . . . . . . . . . . . (2.6) — —Net loss on sales of small product lines . . . . . . . . . . . . . . . . . . . . . . . . . . . . . . . . . . . . . . . . . . . . . . . . . . . . . . . . . . . . . . . . . . . . . . . — — 0.2Net gain on disposals of property and equipment and other . . . . . . . . . . . . . . . . . . . . . . . . . . . . . . . . . . . . . . . . . . . . . . . . . . . . . . . . (6.3) (0.8) (3.0)(Net gains on sale) other-than-temporary impairment of available-for-sale securities . . . . . . . . . . . . . . . . . . . . . . . . . . . . . . . . . . . . — (5.9) 4.0
Changes in operating assets and liabilities, net of effects of businesses acquired:Changes in restricted cash . . . . . . . . . . . . . . . . . . . . . . . . . . . . . . . . . . . . . . . . . . . . . . . . . . . . . . . . . . . . . . . . . . . . . . . . . . . . . . . . . . (6.3) — —Receivables, net . . . . . . . . . . . . . . . . . . . . . . . . . . . . . . . . . . . . . . . . . . . . . . . . . . . . . . . . . . . . . . . . . . . . . . . . . . . . . . . . . . . . . . . . . . (116.0) (33.9) 115.2Accounts receivable securitization program . . . . . . . . . . . . . . . . . . . . . . . . . . . . . . . . . . . . . . . . . . . . . . . . . . . . . . . . . . . . . . . . . . . . — — (80.0)Inventories . . . . . . . . . . . . . . . . . . . . . . . . . . . . . . . . . . . . . . . . . . . . . . . . . . . . . . . . . . . . . . . . . . . . . . . . . . . . . . . . . . . . . . . . . . . . . . (9.0) (19.4) 109.7Other assets, net . . . . . . . . . . . . . . . . . . . . . . . . . . . . . . . . . . . . . . . . . . . . . . . . . . . . . . . . . . . . . . . . . . . . . . . . . . . . . . . . . . . . . . . . . 47.1 16.3 9.6Accounts payable . . . . . . . . . . . . . . . . . . . . . . . . . . . . . . . . . . . . . . . . . . . . . . . . . . . . . . . . . . . . . . . . . . . . . . . . . . . . . . . . . . . . . . . . (14.4) 19.0 (68.4)Other liabilities . . . . . . . . . . . . . . . . . . . . . . . . . . . . . . . . . . . . . . . . . . . . . . . . . . . . . . . . . . . . . . . . . . . . . . . . . . . . . . . . . . . . . . . . . . 104.1 21.2 25.9
Net cash provided by operating activities . . . . . . . . . . . . . . . . . . . . . . . . . . . . . . . . . . . . . . . . . . . . . . . . . . . . . . . . . . . . . . . . . . . . . . 392.1 483.1 552.0
Cash flows from investing activities: . . . . . . . . . . . . . . . . . . . . . . . . . . . . . . . . . . . . . . . . . . . . . . . . . . . . . . . . . . . . . . . . . . . . . . . . . . .Capital expenditures for property and equipment . . . . . . . . . . . . . . . . . . . . . . . . . . . . . . . . . . . . . . . . . . . . . . . . . . . . . . . . . . . . . . . . (124.5) (87.6) (80.3)Acquisition of Diversey, net of cash and cash equivalents acquired . . . . . . . . . . . . . . . . . . . . . . . . . . . . . . . . . . . . . . . . . . . . . . . . . (1,983.1) — —Investment in Diversey preferred stock . . . . . . . . . . . . . . . . . . . . . . . . . . . . . . . . . . . . . . . . . . . . . . . . . . . . . . . . . . . . . . . . . . . . . . . (262.9) — —Other businesses acquired in purchase transactions, net of cash and cash equivalents acquired and equity investment in 2011 and
2010 . . . . . . . . . . . . . . . . . . . . . . . . . . . . . . . . . . . . . . . . . . . . . . . . . . . . . . . . . . . . . . . . . . . . . . . . . . . . . . . . . . . . . . . . . . . . . . . . . (12.0) (24.1) —Proceeds from sale of available-for-sale securities . . . . . . . . . . . . . . . . . . . . . . . . . . . . . . . . . . . . . . . . . . . . . . . . . . . . . . . . . . . . . . . — 12.6 —Proceeds from sales of property and equipment . . . . . . . . . . . . . . . . . . . . . . . . . . . . . . . . . . . . . . . . . . . . . . . . . . . . . . . . . . . . . . . . . 10.4 4.2 7.2Other investing activities . . . . . . . . . . . . . . . . . . . . . . . . . . . . . . . . . . . . . . . . . . . . . . . . . . . . . . . . . . . . . . . . . . . . . . . . . . . . . . . . . . . 1.7 (2.0) 2.8
Net cash used in investing activities . . . . . . . . . . . . . . . . . . . . . . . . . . . . . . . . . . . . . . . . . . . . . . . . . . . . . . . . . . . . . . . . . . . . . . . . . . (2,370.4) (96.9) (70.3)
Cash flows from financing activities:Changes in restricted cash . . . . . . . . . . . . . . . . . . . . . . . . . . . . . . . . . . . . . . . . . . . . . . . . . . . . . . . . . . . . . . . . . . . . . . . . . . . . . . . . . . 262.9 — —Payments of long-term debt . . . . . . . . . . . . . . . . . . . . . . . . . . . . . . . . . . . . . . . . . . . . . . . . . . . . . . . . . . . . . . . . . . . . . . . . . . . . . . . . (1,753.6) (276.1) (585.3)Proceeds from long-term debt . . . . . . . . . . . . . . . . . . . . . . . . . . . . . . . . . . . . . . . . . . . . . . . . . . . . . . . . . . . . . . . . . . . . . . . . . . . . . . . 3,706.4 — 766.6Dividends paid on common stock . . . . . . . . . . . . . . . . . . . . . . . . . . . . . . . . . . . . . . . . . . . . . . . . . . . . . . . . . . . . . . . . . . . . . . . . . . . . (87.4) (79.7) (75.7)Acquisition of common stock for tax withholding obligations under our 2005 contingent stock plan . . . . . . . . . . . . . . . . . . . . . . . (12.2) — —Net payments of short-term borrowings . . . . . . . . . . . . . . . . . . . . . . . . . . . . . . . . . . . . . . . . . . . . . . . . . . . . . . . . . . . . . . . . . . . . . . . (43.9) (4.4) (8.3)Payments of debt issuance costs . . . . . . . . . . . . . . . . . . . . . . . . . . . . . . . . . . . . . . . . . . . . . . . . . . . . . . . . . . . . . . . . . . . . . . . . . . . . . (51.2) — (7.0)Repurchases of common stock . . . . . . . . . . . . . . . . . . . . . . . . . . . . . . . . . . . . . . . . . . . . . . . . . . . . . . . . . . . . . . . . . . . . . . . . . . . . . . — (9.8) —Excess tax benefit from share-based incentive compensation . . . . . . . . . . . . . . . . . . . . . . . . . . . . . . . . . . . . . . . . . . . . . . . . . . . . . . 2.6 — —Other financing activities . . . . . . . . . . . . . . . . . . . . . . . . . . . . . . . . . . . . . . . . . . . . . . . . . . . . . . . . . . . . . . . . . . . . . . . . . . . . . . . . . . — (3.0) —
Net cash provided by (used in) financing activities . . . . . . . . . . . . . . . . . . . . . . . . . . . . . . . . . . . . . . . . . . . . . . . . . . . . . . . . . . . . . . 2,023.6 (373.0) 90.3
Effect of foreign currency exchange rate changes on cash and cash equivalents . . . . . . . . . . . . . . . . . . . . . . . . . . . . . . . . . . . . . . . . . . 1.9 (32.1) (6.4)
Cash and cash equivalents:Balance, beginning of period . . . . . . . . . . . . . . . . . . . . . . . . . . . . . . . . . . . . . . . . . . . . . . . . . . . . . . . . . . . . . . . . . . . . . . . . . . . . . . . $ 675.6 $ 694.5 $ 128.9Net change during the period . . . . . . . . . . . . . . . . . . . . . . . . . . . . . . . . . . . . . . . . . . . . . . . . . . . . . . . . . . . . . . . . . . . . . . . . . . . . . . . 47.2 (18.9) 565.6
Balance, end of period . . . . . . . . . . . . . . . . . . . . . . . . . . . . . . . . . . . . . . . . . . . . . . . . . . . . . . . . . . . . . . . . . . . . . . . . . . . . . . . . . . . . . $ 722.8 $ 675.6 $ 694.5
Supplemental Cash Flow Information:Interest payments, net of amounts capitalized . . . . . . . . . . . . . . . . . . . . . . . . . . . . . . . . . . . . . . . . . . . . . . . . . . . . . . . . . . . . . . . . . . $ 135.3 $ 128.7 $ 100.9
Income tax payments . . . . . . . . . . . . . . . . . . . . . . . . . . . . . . . . . . . . . . . . . . . . . . . . . . . . . . . . . . . . . . . . . . . . . . . . . . . . . . . . . . . . . . $ 129.8 $ 86.6 $ 114.3
Non-cash items:Non-cash items associated with the acquisition of Diversey:
31.7 million shares of Sealed Air common stock issued in connection with the Diversey acquisition . . . . . . . . . . . . . . . . . . . . . $ 512.9 $ — $ —
Fair value of Diversey preferred stock investment . . . . . . . . . . . . . . . . . . . . . . . . . . . . . . . . . . . . . . . . . . . . . . . . . . . . . . . . . . . . . $ 262.9 $ — $ —
Fair-value-based measure of the portion of the SARs attributed to pre-acquisition service . . . . . . . . . . . . . . . . . . . . . . . . . . . . . $ 50.8 $ — $ —
Other non-cash items:Transfers of shares of our common stock from Treasury as part of our 2009 and 2008 profit- sharing plan contributions . . . . . $ — $ 7.2 $ 5.9
Net unrealized (losses) gains on available-for-sale securities . . . . . . . . . . . . . . . . . . . . . . . . . . . . . . . . . . . . . . . . . . . . . . . . . . . . . $ — $ (7.0) $ 7.0
See accompanying notes to consolidated financial statements.
73
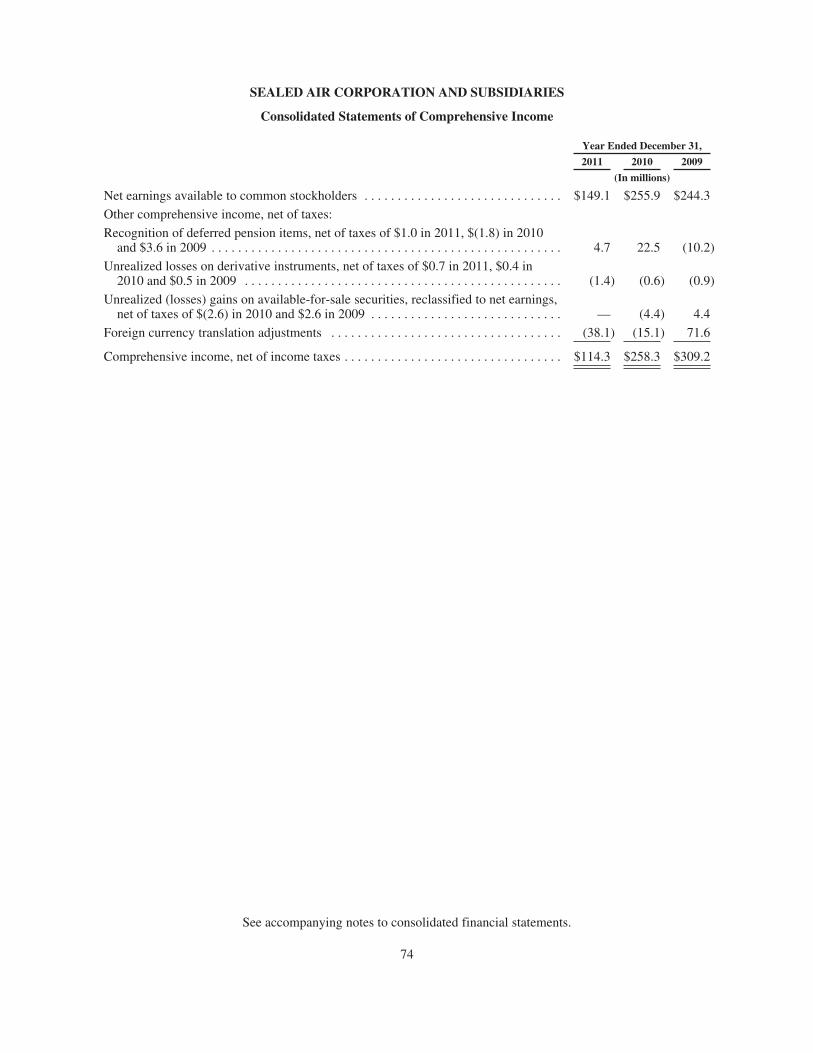
SEALED AIR CORPORATION AND SUBSIDIARIES
Consolidated Statements of Comprehensive Income
Year Ended December 31,
2011 2010 2009
(In millions)
Net earnings available to common stockholders . . . . . . . . . . . . . . . . . . . . . . . . . . . . . . $149.1 $255.9 $244.3
Other comprehensive income, net of taxes:
Recognition of deferred pension items, net of taxes of $1.0 in 2011, $(1.8) in 2010and $3.6 in 2009 . . . . . . . . . . . . . . . . . . . . . . . . . . . . . . . . . . . . . . . . . . . . . . . . . . . . . 4.7 22.5 (10.2)
Unrealized losses on derivative instruments, net of taxes of $0.7 in 2011, $0.4 in2010 and $0.5 in 2009 . . . . . . . . . . . . . . . . . . . . . . . . . . . . . . . . . . . . . . . . . . . . . . . . (1.4) (0.6) (0.9)
Unrealized (losses) gains on available-for-sale securities, reclassified to net earnings,net of taxes of $(2.6) in 2010 and $2.6 in 2009 . . . . . . . . . . . . . . . . . . . . . . . . . . . . . — (4.4) 4.4
Foreign currency translation adjustments . . . . . . . . . . . . . . . . . . . . . . . . . . . . . . . . . . . (38.1) (15.1) 71.6
Comprehensive income, net of income taxes . . . . . . . . . . . . . . . . . . . . . . . . . . . . . . . . . $114.3 $258.3 $309.2
See accompanying notes to consolidated financial statements.
74
SEALED AIR CORPORATION AND SUBSIDIARIES
Notes to Consolidated Financial Statements
Note 1 Organization and Nature of Operations
We are a global leader in food safety and security, facility hygiene and product protection. We serve anarray of end markets including food and beverage processing, food service, retail, health care and industrial,commercial and consumer applications. We have widely recognized and inventive brands such as Bubble Wrap®
brand cushioning, Cryovac® brand food packaging solutions and now, as a result of our acquisition of DiverseyHoldings, Inc. (“Diversey”) on October 3, 2011, Diversey® brand cleaning and hygiene solutions. We offerefficient and sustainable solutions that create business value for customers, enhance the quality of life forconsumers and provide a cleaner and healthier environment for future generations.
Throughout this report, when we refer to “Sealed Air,” the “Company,” “we,” “our,” or “us,” we arereferring to Sealed Air Corporation and all of our subsidiaries, except where the context indicates otherwise.
We conduct our operations through the following four business segments: Food Packaging, Food Solutions,Protective Packaging, Diversey and an “Other” category. See Note 4, “Segments,” for further details of oursegment structure. We conduct substantially all of our business through three wholly-owned subsidiaries,Cryovac, Inc., Sealed Air Corporation (US) and now, Diversey.
Note 2 Summary of Significant Accounting Policies and Recently Issued Accounting Standards
Summary of Significant Accounting Policies
Basis of Presentation
Our consolidated financial statements include all of the accounts of the Company and our subsidiaries. Wehave eliminated all significant intercompany transactions and balances in consolidation. All amounts are inmillions, except per share amounts, and approximate due to rounding. Some prior period amounts have beenreclassified to conform to the current year presentation. These reclassifications, individually and in the aggregate,had no impact on our consolidated financial condition, results of operations and cash flows.
The consolidated financial statements and information included in this Annual Report on Form 10-K (“Form10-K”) includes the financial results of Diversey for the period beginning October 3, 2011 through December 31,2011. The financial results included in this Form 10-K related to the acquisition method accounting for theDiversey transaction are subject to change as the acquisition method accounting is not yet finalized anddependent upon the finalization of management’s review of certain independent valuations and studies that arestill in process. See Note 3, “Acquisition of Diversey Holdings, Inc.,” for further information about theacquisition and related transactions and the acquisition accounting.
Use of Estimates
The preparation of our consolidated financial statements and related disclosures in conformity withU.S. GAAP requires our management to make estimates and assumptions that affect the reported amounts ofassets and liabilities, including amounts recorded in connection with the acquisition of Diversey, the disclosureof contingent assets and liabilities at the date of the financial statements and revenue and expenses during theperiod reported. These estimates include, among other items, assessing the collectibility of receivables, the useand recoverability of inventory, the estimation of fair value of financial instruments, assumptions used in thecalculation of income taxes, useful lives and recoverability of tangible and intangible assets, assumptions used inour defined benefit pension plans, estimates related to self-insurance such as the aggregate liability for uninsuredclaims using historical experience, insurance and actuarial estimates and estimated trends in claim values, costsfor incentive compensation and accruals for commitments and contingencies. We review these estimates andassumptions periodically using historical experience and other factors and reflect the effects of any revisions inthe consolidated financial statements in the period we determine any revisions to be necessary. Actual resultscould differ from these estimates.
75
SEALED AIR CORPORATION AND SUBSIDIARIES
Notes to Consolidated Financial Statements — (Continued)
Financial Instruments
We may use financial instruments, such as cross currency swaps, interest rate swaps, caps and collars,U.S. Treasury lock agreements and foreign currency exchange forward contracts and options relating to ourborrowing and trade activities. We may use these financial instruments from time to time to manage our exposureto fluctuations in interest rates and foreign currency exchange rates. We do not purchase, hold or sell derivativefinancial instruments for trading purposes. We face credit risk if the counterparties to these transactions areunable to perform their obligations. Our policy is to have counterparties to these contracts that are rated at leastA- by Standard & Poor’s and A3 by Moody’s.
We report derivative instruments at fair value and establish criteria for designation and effectiveness oftransactions entered into for hedging purposes. Before entering into any derivative transaction, we identify ourspecific financial risk, the appropriate hedging instrument to use to reduce this risk, and the correlation betweenthe financial risk and the hedging instrument. We use purchase orders and historical data as the basis fordetermining the anticipated values of the transactions to be hedged. We do not enter into derivative transactionsthat do not have a high correlation with the underlying financial risk we are trying to reduce. We regularly reviewour hedge positions and the correlation between the transaction risks and the hedging instruments.
We account for derivative instruments as hedges of the related underlying risks if we designate thesederivative instruments as hedges and the derivative instruments are effective as hedges of recognized assets orliabilities, forecasted transactions, unrecognized firm commitments or forecasted intercompany transactions.
We record gains and losses on derivatives qualifying as cash flow hedges in other comprehensive income, tothe extent that hedges are effective and until the underlying transactions are recognized in the consolidatedstatements of operations, at which time we recognize the gains and losses in the consolidated statements ofoperations. We recognize gains and losses on qualifying fair value hedges and the related loss or gain on thehedged item attributable to the hedged risk in the consolidated statements of operations.
Our practice is to terminate derivative transactions if the underlying asset or liability matures or is sold orterminated, or if we determine the underlying forecasted transaction is no longer probable of occurring. Anydeferred gains or losses associated with derivative instruments are recognized on the consolidated statements ofoperations over the period in which the income or expense on the underlying hedged transaction is recognized.
See Note 12, “Derivatives and Hedging Activities,” for further details.
Fair Value Measurements of Financial Instruments
In determining fair value of financial instruments, we utilize valuation techniques that maximize the use ofobservable inputs and minimize the use of unobservable inputs to the extent possible and consider counterpartycredit risk in our assessment of fair value. We determine fair value of our financial instruments based onassumptions that market participants would use in pricing an asset or liability in the principal or mostadvantageous market. When considering market participant assumptions in fair value measurements, thefollowing fair value hierarchy distinguishes between observable and unobservable inputs, which are categorizedin one of the following levels:
• Level 1 Inputs: Unadjusted quoted prices in active markets for identical assets or liabilities accessible tothe reporting entity at the measurement date.
• Level 2 Inputs: Other than quoted prices included in Level 1 inputs that are observable for the asset orliability, either directly or indirectly, for substantially the full term of the asset or liability.
• Level 3 Inputs: Unobservable inputs for the asset or liability used to measure fair value to the extent thatobservable inputs are not available, thereby allowing for situations in which there is little, if any, marketactivity for the asset or liability at measurement date.
76
SEALED AIR CORPORATION AND SUBSIDIARIES
Notes to Consolidated Financial Statements — (Continued)
Our fair value measurements for our financial instruments are subjective and involve uncertainties andmatters of significant judgment. Changes in assumptions could significantly affect our estimates. See Note 13,“Fair Value Measurements and Other Financial Instruments,” for further details on our fair value measurements.
Foreign Currency Translation
In non-U.S. locations that are not considered highly inflationary, we translate the balance sheets at the endof period exchange rates with translation adjustments accumulated in stockholders’ equity on our consolidatedbalance sheets. We translate the statements of operations at the average exchange rates during the applicableperiod.
We translate assets and liabilities of our operations in countries with highly inflationary economies at theend of period exchange rates, except that nonmonetary asset and liability amounts are translated at historicalexchange rates. In countries with highly inflationary economies, we translate items reflected in the statements ofoperations at average rates of exchange prevailing during the period, except that nonmonetary amounts aretranslated at historical exchange rates.
Commitments and Contingencies — Litigation
On an ongoing basis, we assess the potential liabilities related to any lawsuits or claims brought against us.While it is typically very difficult to determine the timing and ultimate outcome of these actions, we use our bestjudgment to determine if it is probable that we will incur an expense related to the settlement or finaladjudication of these matters and whether a reasonable estimation of the probable loss, if any, can be made. Inassessing probable losses, we make estimates of the amount of insurance recoveries, if any. We accrue a liabilitywhen we believe a loss is probable and the amount of loss can be reasonably estimated. Due to the inherentuncertainties related to the eventual outcome of litigation and potential insurance recovery, it is possible thatdisputed matters may be resolved for amounts materially different from any provisions or disclosures that wehave previously made. We expense legal costs, including those legal costs expected to be incurred in connectionwith a loss contingency, as incurred.
Revenue Recognition
Our revenue earning activities primarily involve manufacturing and selling products, and we considerrevenues to be earned when we have completed the process by which we are entitled to receive consideration.The following criteria are used for revenue recognition: persuasive evidence that an arrangement exists, shipmenthas occurred, selling price is fixed or determinable, and collection is reasonably assured.
Sales taxes collected from customers and remitted to governmental authorities are accounted for on a netbasis and therefore are excluded from net sales on the consolidated statements of operations.
Charges for rebates and other allowances are recognized as a deduction from revenue on an accrual basis inthe period in which the associated revenue is recorded. When we estimate our rebate accruals, we considercustomer-specific contractual commitments including stated rebate rates and history of actual rebates paid. Ourrebate accruals are reviewed at each reporting period and adjusted to reflect data available at that time. We adjustthe accruals to reflect any differences between estimated and actual amounts. These adjustments impact theamount of net sales recognized by us in the period of adjustment. Charges for rebates and other allowances wereapproximately 7% of net sales in 2011 and less than 5% of net sales in 2010 and 2009.
Research and Development
We expense research and development costs as incurred. Research and development costs were $106million in 2011, $88 million in 2010 and $81 million in 2009.
77
SEALED AIR CORPORATION AND SUBSIDIARIES
Notes to Consolidated Financial Statements — (Continued)
Share-Based Incentive Compensation
Our primary share-based employee incentive compensation program is the 2005 Contingent Stock Plan. SeeNote 18, “Stockholders’ Equity,” for further information on this plan.
We record share-based compensation awards exchanged for employee services at fair value on the date ofgrant and record the expense for these awards in marketing, administrative and development expense on ourconsolidated statement of operations over the requisite employee service period. Share-based incentivecompensation expense includes an estimate for forfeitures and anticipated achievement levels and is generallyrecognized over the expected term of the award on a straight-line basis.
Environmental Expenditures
We expense or capitalize environmental expenditures that relate to ongoing business activities, as appropriate.We expense costs that relate to an existing condition caused by past operations and which do not contribute tocurrent or future net sales. We record liabilities when we determine that environmental assessments or remediationexpenditures are probable and that we can reasonably estimate the associated cost or a range of costs.
Income Taxes
We file a consolidated U.S. federal income tax return. Our non-U.S. subsidiaries file income tax returns intheir respective local jurisdictions. We provide for income taxes on those portions of our foreign subsidiaries’accumulated earnings that we believe are not reinvested indefinitely in our businesses. It is not practicable toestimate the amount of tax that might be payable on the portion of those accumulated earnings that we believeare reinvested indefinitely.
We account for income taxes under the asset and liability method to provide for income taxes on alltransactions recorded in the consolidated financial statements. We recognize deferred tax assets and liabilities forthe future tax consequences attributable to differences between the financial statement carrying amounts ofexisting assets and liabilities and their respective tax bases and tax benefit carry forwards. We determine deferredtax assets and liabilities at the end of each period using enacted tax rates.
We recognize the tax benefit from an uncertain tax position only if it is more likely than not that the tax positionwill be sustained on examination by the taxing authorities, based on the technical merits of the position. The taxbenefits recognized in the financial statements from such positions are measured based on the largest benefit that has agreater than fifty percent likelihood of being realized upon settlement with tax authorities. We recognize interest andpenalties related to unrecognized tax benefits in income tax expense on our consolidated statements of operations.
See Note 16, “Income Taxes,” for further discussion.
Cash and Cash Equivalents
We consider highly liquid investments with original maturities of three months or less at the date ofpurchase to be cash equivalents. Our policy is to invest cash in excess of short-term operating and debt servicerequirements in cash equivalents. Cash equivalents are stated at cost, which approximates fair value because ofthe short term maturity of the instruments. Our policy is to transact with counterparties that are rated at least A-by Standard & Poor’s and A3 by Moody’s. Some of our operations are located in countries that are rated belowA- or A3. In this case, we try to minimize our risk by holding cash and cash equivalents at financial institutionswith which we have existing global relationships whenever possible, diversifying counterparty exposures andminimizing the amount held by each counterparty and within the country in total.
Accounts Receivable Securitization
Two of our primary U.S. operating subsidiaries are parties to an accounts receivable securitization program underwhich they sell eligible U.S. accounts receivable to an indirectly wholly-owned subsidiary that was formed for the sole
78
SEALED AIR CORPORATION AND SUBSIDIARIES
Notes to Consolidated Financial Statements — (Continued)
purpose of entering into this program. The wholly-owned subsidiary in turn may sell an undivided ownership interestin these receivables to a participating bank or an issuer of commercial paper administered by the participating bank.The wholly-owned subsidiary retains the receivables it purchases from the two operating subsidiaries.
Before January 1, 2010, if the wholly-owned subsidiary sold undivided ownership interests in receivables, weremoved the transferred ownership interest amounts from our balance sheet at the time of the sale and reflected theproceeds from the sale in cash provided by operating activities on the consolidated statements of cash flows.Effective January 1, 2010, under U.S. GAAP, our current program qualifies as a secured borrowing rather than thesale of an asset. Any future transfers of ownership interests of receivables under our receivables securitizationprogram to the issuer of commercial paper or to the participating bank are no longer considered sales of receivablesbut are considered secured borrowings and will be recorded as liabilities on our consolidated balance sheet.
Receivables, Net
In the normal course of business, we extend credit to customers that satisfy pre-defined credit criteria.Accounts receivable, which are included in receivables, net, on the consolidated balance sheets, are net ofallowances for doubtful accounts. We maintain accounts receivable allowances for estimated losses resultingfrom the failure of our customers to make required payments. An additional allowance may be required if thefinancial condition of our customers deteriorates.
Inventories
We determine the cost of our legacy Sealed Air U.S. inventories on a last-in, first-out or LIFO cost flowbasis. The cost of our U.S. equipment inventories and the balance of our U.S. inventories and mostnon-U.S. inventories is determined on a first-in, first-out or FIFO cost flow basis. We state inventories at thelower of cost or market.
Property and Equipment, Net
We state property and equipment at cost, except for the fair value of acquired property and equipment andproperty and equipment that have been impaired, for which we reduce the carrying amount to the estimated fairvalue at the impairment date. We capitalize significant improvements and charge repairs and maintenance coststhat do not extend the lives of the assets to expense as incurred. We remove the cost and accumulateddepreciation of assets sold or otherwise disposed of from the accounts and recognize any resulting gain or lossupon the disposition of the assets.
We depreciate the cost of property and equipment over their estimated useful lives on a straight-line basis asfollows: buildings — 20 to 40 years; machinery and equipment — 5 to 10 years; and other property andequipment — 2 to 10 years.
Goodwill and Identifiable Intangible Assets
Goodwill represents the excess of the consideration transferred, the fair value of any noncontrolling interestin the acquiree and, if the business combination is achieved in stages, the acquisition-date fair value of ourpreviously held equity interest in the acquiree over the net of the acquisition-date amounts of the identifiableassets acquired and the liabilities assumed.
These assets consist primarily of patents, licenses, trademarks, trade names, customer lists and relationships,non-compete agreements and technology based intangibles and other contractual agreements. We amortize finitelived identifiable intangible assets over the shorter of their stated or statutory duration or their estimated usefullives, generally ranging from 3 to 15 years, on a straight-line basis to their estimated residual values andperiodically review them for impairment. Total identifiable intangible assets comprise 18% in 2011 and 1% in2010 of our consolidated total assets. See Note 3, “Acquisition of Diversey Holdings, Inc.,” for furtherinformation on our acquired intangible assets.
79
SEALED AIR CORPORATION AND SUBSIDIARIES
Notes to Consolidated Financial Statements — (Continued)
We use the acquisition method of accounting for all business combinations and do not amortize goodwill orintangible assets with indefinite useful lives. Goodwill and intangible assets with indefinite useful lives are testedfor possible impairment annually during the fourth quarter of each fiscal year or more frequently if events orchanges in circumstances indicate that the asset might be impaired.
See Note 7, “Goodwill and Identifiable Intangible Assets,” for further discussion of our goodwill.
Long-Lived Assets
Impairment and Disposal of Long-Lived Assets
For definite lived intangible assets, such as customer relationships, contracts, intellectual property, and forother long-lived assets, such as property, plant and equipment, whenever impairment indicators are present, weperform a review for impairment. We calculate the undiscounted value of the projected cash flows associated withthe asset, or asset group, and compare this estimated amount to the carrying amount. If the carrying amount is foundto be greater, we record an impairment loss for the excess of book value over the fair value. In addition, in all casesof an impairment review, we re-evaluate the remaining useful lives of the assets and modify them, as appropriate.
For indefinite – lived intangible assets, such as in-process research and development and trademarks andtrade names, each year and whenever impairment indicators are present, we determine the fair value of the assetand record an impairment loss for the excess of book value over the fair value, if any. In addition, in all cases ofan impairment review other than for in-process research and development assets, we re-evaluate whethercontinuing to characterize the asset as indefinite –lived is appropriate.
Conditional Asset Retirement Obligations
We recognize a liability for a conditional asset retirement obligation when incurred if the liability can bereasonably estimated. A conditional asset retirement obligation is a legal obligation to perform an assetretirement activity in which the timing and/or method of settlement are conditional on a future event that may ormay not be within our control. In addition, we would record a corresponding amount by increasing the carryingamount of the related long-lived asset, which is depreciated over the useful life of such long-lived asset.
Self-Insurance
We retain the obligation for specified claims and losses related to property, casualty, workers’ compensationand employee benefit claims. We accrue for outstanding reported claims and claims that have been incurred butnot reported based upon management’s estimates of the aggregate liability for retained losses using historicalexperience, insurance company estimates and the estimated trends in claim values. Our estimates includemanagement’s and independent insurance companies’ assumptions regarding economic conditions, the frequencyand severity of claims and claim development patterns and settlement practices. These estimates and assumptionsare monitored and evaluated on a periodic basis by management and are adjusted when warranted by changingcircumstances. Although management believes it has the ability to adequately project and record estimated claimpayments, actual results could differ significantly from the recorded liabilities.
Pensions
We maintain a qualified non-contributory profit sharing plan in which some U.S. employees participate andqualified contributory retirement savings plans in which some U.S. employees are eligible to participate. For anumber of our U.S. employees and our international employees, we maintain defined benefit pension plans. Weare required to make assumptions regarding the valuation of projected benefit obligations and the performance ofplan assets for our defined benefit pension plans.
80
SEALED AIR CORPORATION AND SUBSIDIARIES
Notes to Consolidated Financial Statements — (Continued)
We review and approve the assumptions made by our actuaries regarding the valuation of benefitobligations and performance of plan assets. The principal assumptions concern the discount rate used to measurefuture obligations, the expected future rate of return on plan assets, the expected rate of future compensationincreases and various other actuarial assumptions. The measurement date used to determine benefit obligationsand plan assets is December 31. In general, significant changes to these assumptions could have a materialimpact on the costs and liabilities recorded in our consolidated financial statements.
As a result of the acquisition of Diversey we acquired Diversey’s global pension and other post retirementbenefit plans. See Note 14, “Profit Sharing, Retirement Savings Plans and Defined Benefit Pension Plans,” forinformation about the combined company’s benefit plans.
Net Earnings per Common Share
Basic earnings per common share is calculated by dividing net earnings available to common stockholdersby the weighted average number of common shares outstanding for the period. Net earnings available to commonstockholders was adjusted to reflect the reduction to interest expense, net of income taxes, that would haveoccurred as a result of the assumed conversion of the 3% Convertible Senior Notes for periods prior to theredemption of these notes in July 2009.
On January 1, 2009, we adopted a new accounting standard requiring non-vested share-based paymentawards that contain non-forfeitable rights to dividends to be treated as participating securities and thereforeincluded in computing earnings per common share using the “two-class method”. The two-class method is anearnings allocation formula that calculates basic and diluted net earnings per common share for each class ofcommon stock separately based on dividends declared and participation rights in undistributed earnings. Thenon-vested restricted stock issued under our 2005 Contingent Stock Plan are considered participating securitiessince these securities have non-forfeitable rights to dividends when we declare a dividend during the contractualvesting period of the share-based payment award and therefore included in our earnings allocation formula usingthe two-class method.
When calculating diluted net earnings per common share, the more dilutive effect of applying either of thefollowing is presented: (a) the two-class method (described above) assuming that the participating security is notexercised or converted, or, (b) the treasury stock method for the participating security. Our diluted net earningsper common share for all periods presented were calculated using the two-class method since such method wasmore dilutive.
See Note 19, “Net Earnings Per Common Share,” for further discussion.
Recently Issued Accounting Standards
Unless necessary to clarify a point to readers, we will refrain from citing specific topic and sectionreferences when addressing new or pending accounting standard changes or discussing application of U.S. GAAPin this Annual Report on Form 10-K.
Adopted in 2011
In September 2009, the Financial Accounting Standards Board (“FASB”) ratified an amendment toaccounting standards addressing revenue recognition for arrangements with multiple revenue-generatingactivities. The amendment addresses how revenue should be allocated to separate elements that could impact thetiming of revenue recognition. The amendment is effective for us on a prospective basis for revenuearrangements entered into or materially modified on or after January 1, 2011, and earlier application is permitted.We adopted this amendment on January 1, 2011 on a prospective basis, and any impact to our consolidatedfinancial condition and results of operations will depend on future revenue arrangements we enter into.Currently, we do not believe the adoption of this amendment will materially impact our consolidated financialcondition and results of operations.
81
SEALED AIR CORPORATION AND SUBSIDIARIES
Notes to Consolidated Financial Statements — (Continued)
In January 2010, the FASB issued authoritative guidance requiring additional disclosures about fair valuemeasurements including transfers in and out of Levels 1 and 2 and a higher level of disaggregation for thedifferent types of financial instruments. For the reconciliation of Level 3 fair value measurements, informationabout purchases, sales, issuances and settlements are presented separately. This standard was effective for interimand annual reporting periods beginning after December 15, 2009 with the exception of revised Level 3 disclosurerequirements which are effective for interim and annual reporting periods beginning after December 15, 2010.Comparative disclosures are not required in the year of adoption. We adopted the provisions of the standard onJanuary 1, 2011, which did not have a material impact on our financial statements.
In December 2010, the FASB issued an update to authoritative guidance with the objective of to addressdiversity in practice about the interpretation of the pro forma revenue and earnings disclosure requirements forbusiness combinations. This update specifies, among other items, that if a public entity presents comparativefinancial statements, the entity should disclose revenue and earnings of the combined entity as though thebusiness combination(s) that occurred during the current year had occurred as of the beginning of the comparableprior annual reporting period only. The amendments in this updated guidance are effective prospectively forbusiness combinations for which the acquisition date is on or after the beginning of the first annual reportingperiod beginning on or after December 15, 2010. Early adoption is permitted. We adopted the provisions of thestandard on January 1, 2011, which did not have a material impact on our financial statements.
Adopted in 2012
In June 2011, the FASB issued authoritative guidance on the presentation of comprehensive income thatwill become effective for us beginning January 1, 2012. This standard eliminates the current option to reportother comprehensive income and its components in the statement of changes in equity. We do not believe theadoption of this guidance will impact our consolidated financial condition and results of operations.
In September 2011, the FASB issued authoritative guidance on testing goodwill for impairment that willbecome effective for us beginning January 1, 2012. The revised standard is intended to reduce the cost andcomplexity of the annual goodwill impairment test by providing entities an option to perform a qualitativeassessment to determine whether further impairment testing is necessary. We are currently assessing the potentialimpact of the adoption of this guidance on our financial statements.
Note 3 Acquisition of Diversey Holdings, Inc.
Description of Transaction
On October 3, 2011, we completed the acquisition of 100% of the outstanding stock of Diversey. Weacquired Diversey to position us to capture growth opportunities by developing end-to-end service-basedsolutions for the food processing and food service industries, to leverage combined research and developmentinvestments to develop broader growth initiatives in the food processing and food service industries and toimprove access to under-developed markets and increase access to developing regions.
Under the terms of the acquisition agreement, we paid in aggregate $2.1 billion in cash consideration and anaggregate of approximately 31.7 million shares of Sealed Air common stock to the shareholders of Diversey. Wefinanced the payment of the cash consideration and related fees and expenses through (a) borrowings under ournew Credit Facility, (b) proceeds from our issuance of the Notes and (c) cash on hand. In connection with theacquisition, we also used our new borrowings and cash on hand to retire $1.6 billion of existing indebtedness ofDiversey. The new Credit Facility and Notes are described further in Note 11, “Debt and Credit Facilities.”
82
SEALED AIR CORPORATION AND SUBSIDIARIES
Notes to Consolidated Financial Statements — (Continued)
Consideration TransferredThe following table summarizes the consideration transferred at the acquisition date.
Cash . . . . . . . . . . . . . . . . . . . . . . . . . . . . . . . . . . . . . . . . . . . . . . . . . . . . . . . . . . . . . . . . . . . . . $2,098.731.7 million shares of Sealed Air common stock (at October 3, 2011 average price of
$16.18 per share) . . . . . . . . . . . . . . . . . . . . . . . . . . . . . . . . . . . . . . . . . . . . . . . . . . . . . . . . . 512.9
Fair value of Diversey preferred stock investment(1) . . . . . . . . . . . . . . . . . . . . . . . . . . . . . . . 262.9
Fair-value-based measure of the portion of the SARs attributed to pre-acquisitionservice(2) . . . . . . . . . . . . . . . . . . . . . . . . . . . . . . . . . . . . . . . . . . . . . . . . . . . . . . . . . . . . . . . 50.8
Total consideration . . . . . . . . . . . . . . . . . . . . . . . . . . . . . . . . . . . . . . . . . . . . . . . . . . . . . . . . . $2,925.3
(1) On October 3, 2011, prior to the closing of the acquisition, we used cash on hand in the amount of$262.9 million to purchase preferred stock of Diversey (the “Preferred Stock Issuance”) and this amount hasbeen included in the consideration transferred. Diversey elected to exercise its covenant defeasance optionwith respect to its 10.50% senior notes due 2020 (the “DHI Notes”), and Diversey, Inc., a subsidiary ofDiversey, elected to exercise its covenant defeasance option with respect to its 8.25% senior notes due 2019(the “DI Notes”). In addition, Diversey elected to redeem 35% of the aggregate accreted value of the DHINotes using a portion of the proceeds of the Preferred Stock Issuance, and Diversey, Inc. elected to redeem35% of the aggregate principal amount of the DI Notes using a portion of the proceeds of the Preferred StockIssuance that had been contributed to the equity capital of Diversey, Inc. Each such redemption occurred onNovember 2, 2011 (the “Equity Claw Redemption Date”).On the Equity Claw Redemption Date, 35% of the DHI Notes were redeemed at a price of 110.50% of theiraccreted value, plus accrued and unpaid interest to the Equity Claw Redemption Date. Additionally, 35% ofthe DI Notes were redeemed at a price of 108.25% of their principal amount, plus accrued and unpaid interestto the Equity Claw Redemption Date. Following the completion of these redemptions Diversey and Diversey,Inc. notified The Depository Trust Company and Wilmington Trust (the “Trustee”) that they would beredeeming the remaining 65% of the DHI Notes and the DI Notes pursuant to the make-whole redemptionprovisions of the indentures governing the DHI Notes and the DI Notes. Each such redemption occurred onDecember 2, 2011.
(2) In connection with the acquisition, Sealed Air exchanged Diversey’s cash-settled stock appreciation rightsand stock options that were unvested as of May 31, 2011 and unexercised at October 3, 2011 into cash-settledstock appreciation rights based on Sealed Air common stock (“SARs”). The number of SARs was determinedbased on the ratio of the per share merger consideration value of $24.50 and the fair value of Sealed Air’scommon stock on September 30, 2011 of $16.70, or an exchange fraction of 1.46722. This resulted ingranting 13.0 million SARs.
The fair-value-based measure of the SARs at October 3, 2011 was $100.2 million based on the assumptionsas of the closing date of the acquisition. The fair value of the SARs was calculated using a Black-Scholesvaluation model with assumptions with respect to each of the following variables: closing stock price onOctober 3, 2011; forfeiture rates; risk-free interest rates; expected volatility and a dividend yield. We includedthe fair value of Diversey cash-settled stock appreciation rights and unvested stock options converted to SARs of$50.8 million in the consideration transferred for the acquisition that was related to services rendered prior to theacquisition.
Since these SARs are settled in cash, the amount of the related future expense will fluctuate based on theforfeiture activity and the changes in the assumptions used in the Black-Scholes valuation model which includeSealed Air’s stock price; risk-free interest rates; expected volatility and a dividend yield. In addition, once vested,the related expense will continue to fluctuate due to the changes in the assumptions used in the Black-Scholesvaluation model for any SARs that are not exercised until their respective expiration dates, the last of which iscurrently in March 2021.
83
SEALED AIR CORPORATION AND SUBSIDIARIES
Notes to Consolidated Financial Statements — (Continued)
During the three months ended December 31, 2011, we recognized compensation expense of $19 millionrelated to SARs. This expense was based on the assumptions mentioned above and is included in marketing,administrative and development expenses on our consolidated statements of operations. Payments due to theexercise of SARs in the three months ended December 31, 2011 were $22 million. As of December 31, 2011, theremaining liability for these SARs was $47 million.
In addition, in the three months ended December 31, 2011, we recognized compensation expense of $38million for SARs, which was included in restructuring charges on our consolidated statements of operations forthe termination and benefit costs related to the Diversey employees that were part of the 2011 – 2014 Integration& Optimization Program. Payments due to the exercise of these SARs were $28 million in the three monthsended December 31, 2011. The remaining liability for SARs included in the restructuring plan was $12 million asof December 31, 2011.
Fair Value Estimate of Assets Acquired and Liabilities Assumed
We are continuing our review of our fair value estimate of assets acquired and liabilities assumed during themeasurement period, which will conclude as soon as we receive the information we are seeking about facts andcircumstances that existed as of the acquisition date, or learn that more information is not available. Thismeasurement period will not exceed one year from the acquisition date. At the effective date of the acquisition,the assets acquired and liabilities assumed are generally required to be measured at fair value.
Our fair value estimate of assets acquired and liabilities assumed is pending completion of several elements,including the finalization of an independent appraisal and valuations of fair value of the assets acquired andliabilities assumed and final review by our management. The primary areas that are not yet finalized relate to thefair value of receivables, net and payables, certain tangible assets acquired and liabilities assumed, the valuationof property and equipment, the valuation of intangible assets acquired, the valuation of the SARs, environmentaland legal reserves, favorable or unfavorable contracts, operating leases or commitments, contingent liabilities andincome and non-income based taxes, including the filing of pre-acquisition tax returns for Diversey.Accordingly, there could be material adjustments to our consolidated financial statements, including changes toour depreciation and amortization expense related to the valuation of property and equipment and intangibleassets acquired and their respective useful lives among other adjustments.
Legacy Diversey is subject to legal and regulatory requirements, including but not limited to those related toenvironmental matters and taxation, in each of the jurisdictions in which it operates. We have conducted apreliminary assessment of the liabilities arising from these matters in each of these jurisdictions and haverecognized provisional amounts in our initial accounting for the acquisition of Diversey for all identifiedliabilities. However, we are continuing our review of these matters during the measurement period, and if newinformation obtained about facts and circumstances that existed at the acquisition date identifies adjustments tothe liabilities initially recognized, as well as any additional liabilities that existed at the acquisition date, theacquisition accounting will be revised to reflect the resulting adjustments to the provisional amounts initiallyrecognized.
The final determination of the assets acquired and liabilities assumed will be based on the established fairvalue of the assets acquired and the liabilities assumed as of the acquisition date. The excess of the purchaseprice over the fair value of net assets acquired is allocated to goodwill. The final determination of the purchaseprice, fair values and resulting goodwill may differ significantly from what is reflected in these consolidatedfinancial statements. Goodwill is not tax deductible.
84
SEALED AIR CORPORATION AND SUBSIDIARIES
Notes to Consolidated Financial Statements — (Continued)
The following table summarizes the preliminary estimated fair values of the assets acquired and liabilitiesassumed at the acquisition date.
Net assets acquired (liabilities assumed):Cash . . . . . . . . . . . . . . . . . . . . . . . . . . . . . . . . . . . . . . . . . . . . . . . . . . . . . . . . . . . . . . . . . . . . $ 109.3
Restricted cash . . . . . . . . . . . . . . . . . . . . . . . . . . . . . . . . . . . . . . . . . . . . . . . . . . . . . . . . . . . . 269.2
Receivables, net . . . . . . . . . . . . . . . . . . . . . . . . . . . . . . . . . . . . . . . . . . . . . . . . . . . . . . . . . . . 592.7
Inventories(1) . . . . . . . . . . . . . . . . . . . . . . . . . . . . . . . . . . . . . . . . . . . . . . . . . . . . . . . . . . . . . 308.1
Current deferred tax assets(2) . . . . . . . . . . . . . . . . . . . . . . . . . . . . . . . . . . . . . . . . . . . . . . . . 60.9
Prepaid expenses and other current assets . . . . . . . . . . . . . . . . . . . . . . . . . . . . . . . . . . . . . . . 161.8
Property and equipment, net(3) . . . . . . . . . . . . . . . . . . . . . . . . . . . . . . . . . . . . . . . . . . . . . . . 420.0
Intangible assets(4) . . . . . . . . . . . . . . . . . . . . . . . . . . . . . . . . . . . . . . . . . . . . . . . . . . . . . . . . 2,072.1
Non-current deferred tax assets(2) . . . . . . . . . . . . . . . . . . . . . . . . . . . . . . . . . . . . . . . . . . . . . 62.9
Other assets, net(5) . . . . . . . . . . . . . . . . . . . . . . . . . . . . . . . . . . . . . . . . . . . . . . . . . . . . . . . . . 178.7
Short-term borrowings . . . . . . . . . . . . . . . . . . . . . . . . . . . . . . . . . . . . . . . . . . . . . . . . . . . . . . (55.0)
Accounts payable . . . . . . . . . . . . . . . . . . . . . . . . . . . . . . . . . . . . . . . . . . . . . . . . . . . . . . . . . . (337.8)
Other current liabilities . . . . . . . . . . . . . . . . . . . . . . . . . . . . . . . . . . . . . . . . . . . . . . . . . . . . . (488.8)
Long-term debt, less current portion . . . . . . . . . . . . . . . . . . . . . . . . . . . . . . . . . . . . . . . . . . . (1,648.8)
Non-current deferred tax liabilities(2) . . . . . . . . . . . . . . . . . . . . . . . . . . . . . . . . . . . . . . . . . . (619.4)
Other liabilities(5) . . . . . . . . . . . . . . . . . . . . . . . . . . . . . . . . . . . . . . . . . . . . . . . . . . . . . . . . . (443.2)
Total net assets acquired . . . . . . . . . . . . . . . . . . . . . . . . . . . . . . . . . . . . . . . . . . . . . . . . . . . 642.7
Goodwill . . . . . . . . . . . . . . . . . . . . . . . . . . . . . . . . . . . . . . . . . . . . . . . . . . . . . . . . . . . . . . . . 2,282.6
Total consideration . . . . . . . . . . . . . . . . . . . . . . . . . . . . . . . . . . . . . . . . . . . . . . . . . . . . . . . $ 2,925.3
The following information provides further details about the estimated net step-up in fair value and/or theestimated fair value at the acquisition date for some key balance sheet items.
(1) Inventories
Estimated net step-up in fair value . . . . . . . . . . . . . . . . . . . . . . . . . . . . . . . . . . . . . . . . . . . . . $11.6
Increase due to change from LIFO to FIFO . . . . . . . . . . . . . . . . . . . . . . . . . . . . . . . . . . . . . . 5.5
Total . . . . . . . . . . . . . . . . . . . . . . . . . . . . . . . . . . . . . . . . . . . . . . . . . . . . . . . . . . . . . . . . . . . . $17.1
As of the effective date of the acquisition, inventory is required to be measured at fair value. Raw materials arevalued at current replacement costs which approximate their carrying value. The preliminary fair values for finishedgoods inventory were determined based on estimated selling prices less the sum of (a) costs of disposal and (b) areasonable profit allowance for the selling effort of Sealed Air. The method used was the comparative sales method,which is based upon the expected selling price of a manufacturer’s finished goods inventory to customers.
(2) Deferred taxes
In connection with the acquisition of Diversey, we acquired the stock of Diversey and therefore inherited thehistorical tax bases of its assets and liabilities, as well as its other tax attributes. As a result, we establisheddeferred tax assets and liabilities with respect to the net step-up to fair value of assets and liabilities other thangoodwill. We also inherited various tax uncertainties and valuation allowances, which were adjusted to reflectour judgments and estimates regarding the ultimate resolution of the items and consideration of the combined
85
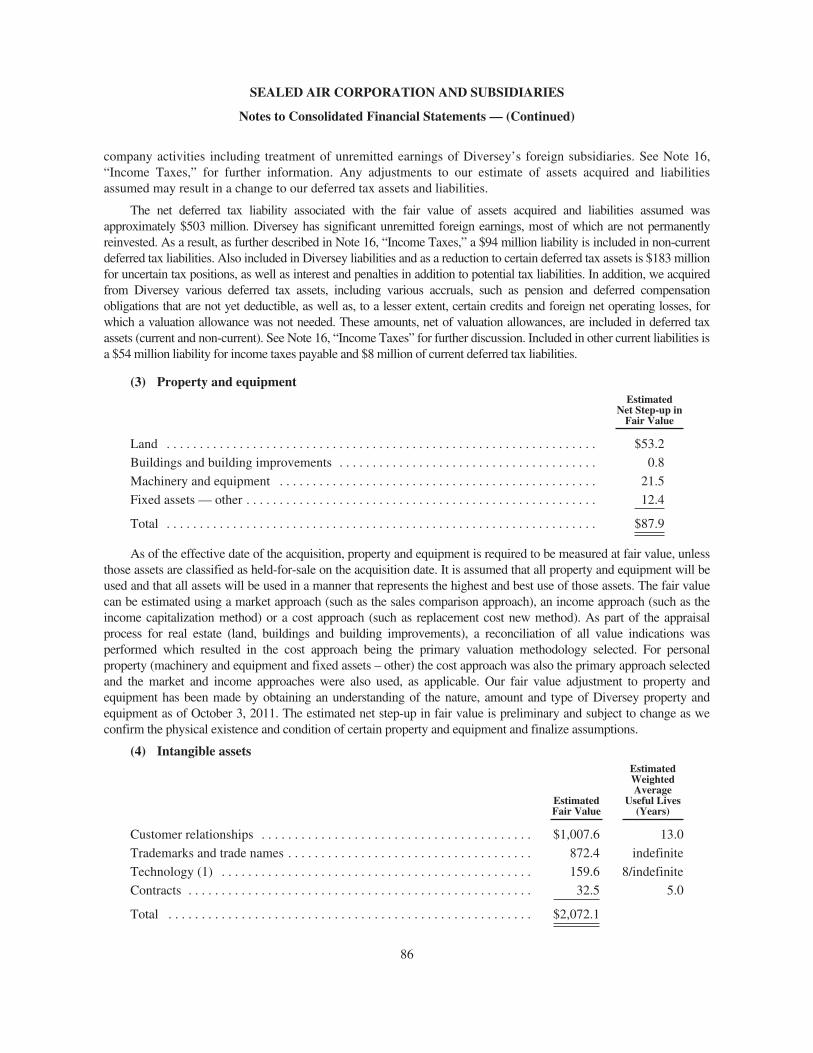
SEALED AIR CORPORATION AND SUBSIDIARIES
Notes to Consolidated Financial Statements — (Continued)
company activities including treatment of unremitted earnings of Diversey’s foreign subsidiaries. See Note 16,“Income Taxes,” for further information. Any adjustments to our estimate of assets acquired and liabilitiesassumed may result in a change to our deferred tax assets and liabilities.
The net deferred tax liability associated with the fair value of assets acquired and liabilities assumed wasapproximately $503 million. Diversey has significant unremitted foreign earnings, most of which are not permanentlyreinvested. As a result, as further described in Note 16, “Income Taxes,” a $94 million liability is included in non-currentdeferred tax liabilities. Also included in Diversey liabilities and as a reduction to certain deferred tax assets is $183 millionfor uncertain tax positions, as well as interest and penalties in addition to potential tax liabilities. In addition, we acquiredfrom Diversey various deferred tax assets, including various accruals, such as pension and deferred compensationobligations that are not yet deductible, as well as, to a lesser extent, certain credits and foreign net operating losses, forwhich a valuation allowance was not needed. These amounts, net of valuation allowances, are included in deferred taxassets (current and non-current). See Note 16, “Income Taxes” for further discussion. Included in other current liabilities isa $54 million liability for income taxes payable and $8 million of current deferred tax liabilities.
(3) Property and equipmentEstimated
Net Step-up inFair Value
Land . . . . . . . . . . . . . . . . . . . . . . . . . . . . . . . . . . . . . . . . . . . . . . . . . . . . . . . . . . . . . . . . . $53.2
Buildings and building improvements . . . . . . . . . . . . . . . . . . . . . . . . . . . . . . . . . . . . . . . 0.8
Machinery and equipment . . . . . . . . . . . . . . . . . . . . . . . . . . . . . . . . . . . . . . . . . . . . . . . . 21.5
Fixed assets — other . . . . . . . . . . . . . . . . . . . . . . . . . . . . . . . . . . . . . . . . . . . . . . . . . . . . . 12.4
Total . . . . . . . . . . . . . . . . . . . . . . . . . . . . . . . . . . . . . . . . . . . . . . . . . . . . . . . . . . . . . . . . . $87.9
As of the effective date of the acquisition, property and equipment is required to be measured at fair value, unlessthose assets are classified as held-for-sale on the acquisition date. It is assumed that all property and equipment will beused and that all assets will be used in a manner that represents the highest and best use of those assets. The fair valuecan be estimated using a market approach (such as the sales comparison approach), an income approach (such as theincome capitalization method) or a cost approach (such as replacement cost new method). As part of the appraisalprocess for real estate (land, buildings and building improvements), a reconciliation of all value indications wasperformed which resulted in the cost approach being the primary valuation methodology selected. For personalproperty (machinery and equipment and fixed assets – other) the cost approach was also the primary approach selectedand the market and income approaches were also used, as applicable. Our fair value adjustment to property andequipment has been made by obtaining an understanding of the nature, amount and type of Diversey property andequipment as of October 3, 2011. The estimated net step-up in fair value is preliminary and subject to change as weconfirm the physical existence and condition of certain property and equipment and finalize assumptions.
(4) Intangible assets
EstimatedFair Value
EstimatedWeightedAverage
Useful Lives(Years)
Customer relationships . . . . . . . . . . . . . . . . . . . . . . . . . . . . . . . . . . . . . . . . . $1,007.6 13.0
Trademarks and trade names . . . . . . . . . . . . . . . . . . . . . . . . . . . . . . . . . . . . . 872.4 indefinite
Technology (1) . . . . . . . . . . . . . . . . . . . . . . . . . . . . . . . . . . . . . . . . . . . . . . . 159.6 8/indefinite
Contracts . . . . . . . . . . . . . . . . . . . . . . . . . . . . . . . . . . . . . . . . . . . . . . . . . . . . 32.5 5.0
Total . . . . . . . . . . . . . . . . . . . . . . . . . . . . . . . . . . . . . . . . . . . . . . . . . . . . . . . $2,072.1
86
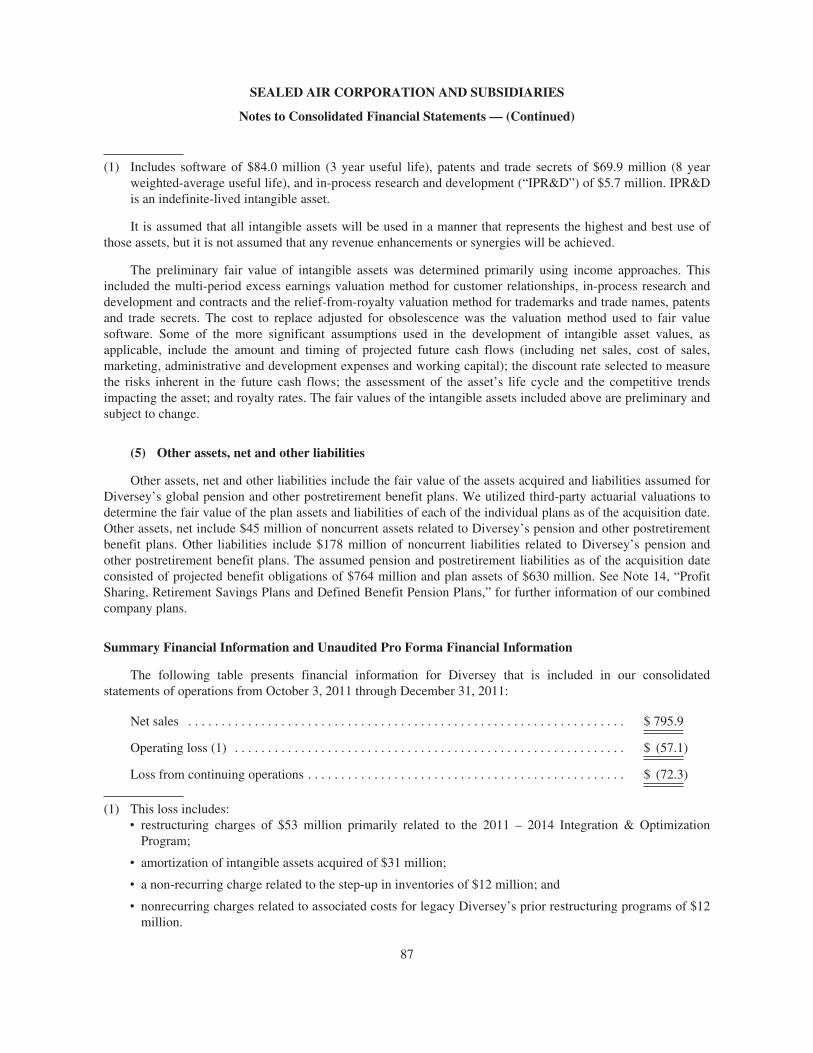
SEALED AIR CORPORATION AND SUBSIDIARIES
Notes to Consolidated Financial Statements — (Continued)
(1) Includes software of $84.0 million (3 year useful life), patents and trade secrets of $69.9 million (8 yearweighted-average useful life), and in-process research and development (“IPR&D”) of $5.7 million. IPR&Dis an indefinite-lived intangible asset.
It is assumed that all intangible assets will be used in a manner that represents the highest and best use ofthose assets, but it is not assumed that any revenue enhancements or synergies will be achieved.
The preliminary fair value of intangible assets was determined primarily using income approaches. Thisincluded the multi-period excess earnings valuation method for customer relationships, in-process research anddevelopment and contracts and the relief-from-royalty valuation method for trademarks and trade names, patentsand trade secrets. The cost to replace adjusted for obsolescence was the valuation method used to fair valuesoftware. Some of the more significant assumptions used in the development of intangible asset values, asapplicable, include the amount and timing of projected future cash flows (including net sales, cost of sales,marketing, administrative and development expenses and working capital); the discount rate selected to measurethe risks inherent in the future cash flows; the assessment of the asset’s life cycle and the competitive trendsimpacting the asset; and royalty rates. The fair values of the intangible assets included above are preliminary andsubject to change.
(5) Other assets, net and other liabilities
Other assets, net and other liabilities include the fair value of the assets acquired and liabilities assumed forDiversey’s global pension and other postretirement benefit plans. We utilized third-party actuarial valuations todetermine the fair value of the plan assets and liabilities of each of the individual plans as of the acquisition date.Other assets, net include $45 million of noncurrent assets related to Diversey’s pension and other postretirementbenefit plans. Other liabilities include $178 million of noncurrent liabilities related to Diversey’s pension andother postretirement benefit plans. The assumed pension and postretirement liabilities as of the acquisition dateconsisted of projected benefit obligations of $764 million and plan assets of $630 million. See Note 14, “ProfitSharing, Retirement Savings Plans and Defined Benefit Pension Plans,” for further information of our combinedcompany plans.
Summary Financial Information and Unaudited Pro Forma Financial Information
The following table presents financial information for Diversey that is included in our consolidatedstatements of operations from October 3, 2011 through December 31, 2011:
Net sales . . . . . . . . . . . . . . . . . . . . . . . . . . . . . . . . . . . . . . . . . . . . . . . . . . . . . . . . . . . . . . . . . . $ 795.9
Operating loss (1) . . . . . . . . . . . . . . . . . . . . . . . . . . . . . . . . . . . . . . . . . . . . . . . . . . . . . . . . . . . $ (57.1)
Loss from continuing operations . . . . . . . . . . . . . . . . . . . . . . . . . . . . . . . . . . . . . . . . . . . . . . . . $ (72.3)
(1) This loss includes:‰ restructuring charges of $53 million primarily related to the 2011 – 2014 Integration & Optimization
Program;
‰ amortization of intangible assets acquired of $31 million;
‰ a non-recurring charge related to the step-up in inventories of $12 million; and
‰ nonrecurring charges related to associated costs for legacy Diversey’s prior restructuring programs of $12million.
87
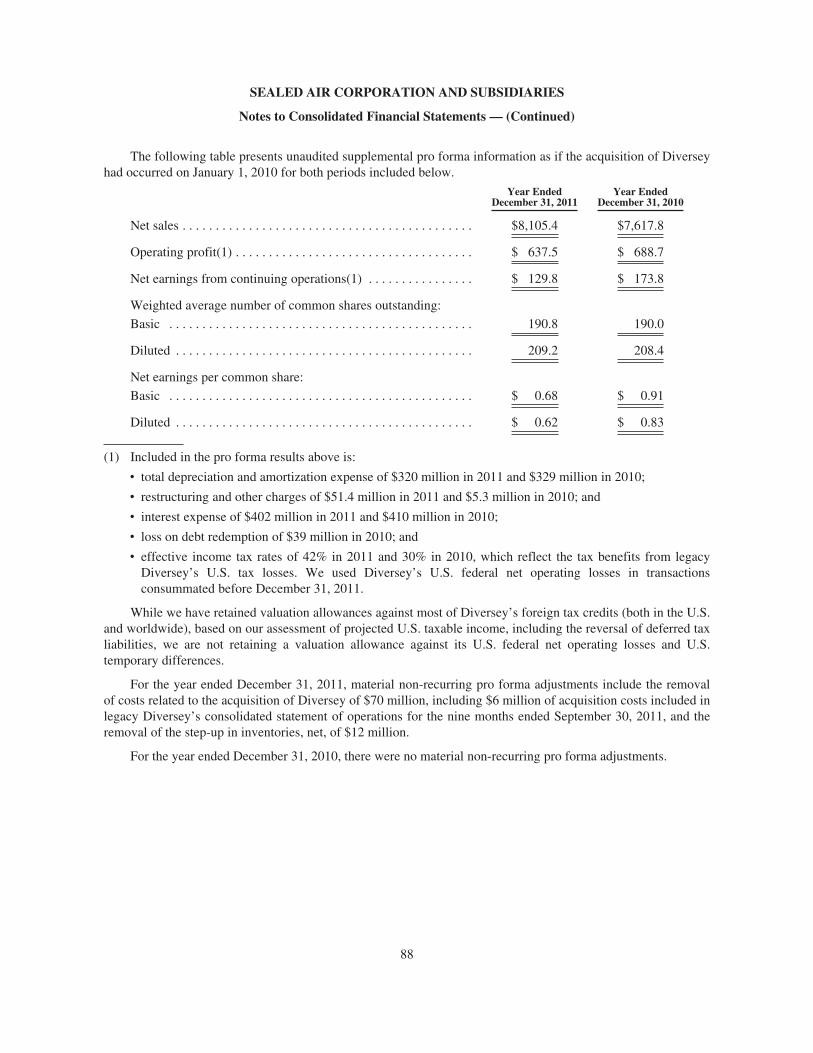
SEALED AIR CORPORATION AND SUBSIDIARIES
Notes to Consolidated Financial Statements — (Continued)
The following table presents unaudited supplemental pro forma information as if the acquisition of Diverseyhad occurred on January 1, 2010 for both periods included below.
Year Ended Year EndedDecember 31, 2011 December 31, 2010
Net sales . . . . . . . . . . . . . . . . . . . . . . . . . . . . . . . . . . . . . . . . . . . . $8,105.4 $7,617.8
Operating profit(1) . . . . . . . . . . . . . . . . . . . . . . . . . . . . . . . . . . . . $ 637.5 $ 688.7
Net earnings from continuing operations(1) . . . . . . . . . . . . . . . . $ 129.8 $ 173.8
Weighted average number of common shares outstanding:
Basic . . . . . . . . . . . . . . . . . . . . . . . . . . . . . . . . . . . . . . . . . . . . . . 190.8 190.0
Diluted . . . . . . . . . . . . . . . . . . . . . . . . . . . . . . . . . . . . . . . . . . . . . 209.2 208.4
Net earnings per common share:
Basic . . . . . . . . . . . . . . . . . . . . . . . . . . . . . . . . . . . . . . . . . . . . . . $ 0.68 $ 0.91
Diluted . . . . . . . . . . . . . . . . . . . . . . . . . . . . . . . . . . . . . . . . . . . . . $ 0.62 $ 0.83
(1) Included in the pro forma results above is:
‰ total depreciation and amortization expense of $320 million in 2011 and $329 million in 2010;
‰ restructuring and other charges of $51.4 million in 2011 and $5.3 million in 2010; and
‰ interest expense of $402 million in 2011 and $410 million in 2010;
‰ loss on debt redemption of $39 million in 2010; and
‰ effective income tax rates of 42% in 2011 and 30% in 2010, which reflect the tax benefits from legacyDiversey’s U.S. tax losses. We used Diversey’s U.S. federal net operating losses in transactionsconsummated before December 31, 2011.
While we have retained valuation allowances against most of Diversey’s foreign tax credits (both in the U.S.and worldwide), based on our assessment of projected U.S. taxable income, including the reversal of deferred taxliabilities, we are not retaining a valuation allowance against its U.S. federal net operating losses and U.S.temporary differences.
For the year ended December 31, 2011, material non-recurring pro forma adjustments include the removalof costs related to the acquisition of Diversey of $70 million, including $6 million of acquisition costs included inlegacy Diversey’s consolidated statement of operations for the nine months ended September 30, 2011, and theremoval of the step-up in inventories, net, of $12 million.
For the year ended December 31, 2010, there were no material non-recurring pro forma adjustments.
88
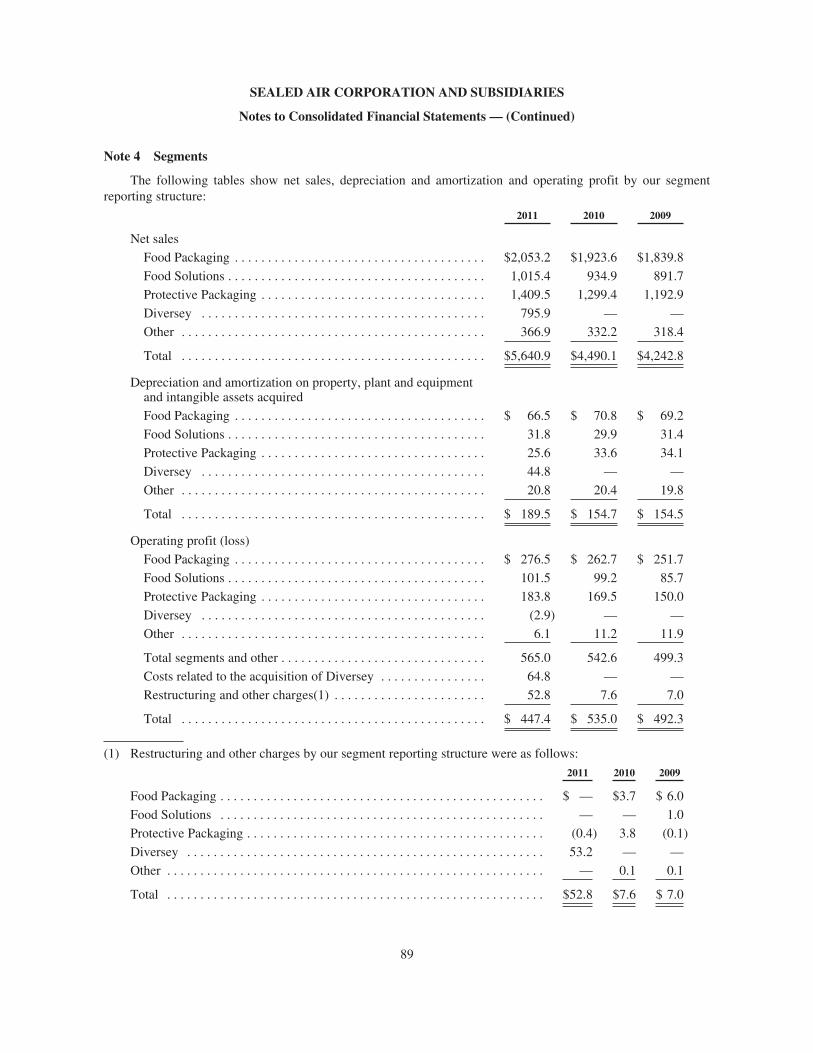
SEALED AIR CORPORATION AND SUBSIDIARIES
Notes to Consolidated Financial Statements — (Continued)
Note 4 Segments
The following tables show net sales, depreciation and amortization and operating profit by our segmentreporting structure:
2011 2010 2009
Net sales
Food Packaging . . . . . . . . . . . . . . . . . . . . . . . . . . . . . . . . . . . . . . $2,053.2 $1,923.6 $1,839.8
Food Solutions . . . . . . . . . . . . . . . . . . . . . . . . . . . . . . . . . . . . . . . 1,015.4 934.9 891.7
Protective Packaging . . . . . . . . . . . . . . . . . . . . . . . . . . . . . . . . . . 1,409.5 1,299.4 1,192.9
Diversey . . . . . . . . . . . . . . . . . . . . . . . . . . . . . . . . . . . . . . . . . . . 795.9 — —
Other . . . . . . . . . . . . . . . . . . . . . . . . . . . . . . . . . . . . . . . . . . . . . . 366.9 332.2 318.4
Total . . . . . . . . . . . . . . . . . . . . . . . . . . . . . . . . . . . . . . . . . . . . . . $5,640.9 $4,490.1 $4,242.8
Depreciation and amortization on property, plant and equipmentand intangible assets acquired
Food Packaging . . . . . . . . . . . . . . . . . . . . . . . . . . . . . . . . . . . . . . $ 66.5 $ 70.8 $ 69.2
Food Solutions . . . . . . . . . . . . . . . . . . . . . . . . . . . . . . . . . . . . . . . 31.8 29.9 31.4
Protective Packaging . . . . . . . . . . . . . . . . . . . . . . . . . . . . . . . . . . 25.6 33.6 34.1
Diversey . . . . . . . . . . . . . . . . . . . . . . . . . . . . . . . . . . . . . . . . . . . 44.8 — —
Other . . . . . . . . . . . . . . . . . . . . . . . . . . . . . . . . . . . . . . . . . . . . . . 20.8 20.4 19.8
Total . . . . . . . . . . . . . . . . . . . . . . . . . . . . . . . . . . . . . . . . . . . . . . $ 189.5 $ 154.7 $ 154.5
Operating profit (loss)
Food Packaging . . . . . . . . . . . . . . . . . . . . . . . . . . . . . . . . . . . . . . $ 276.5 $ 262.7 $ 251.7
Food Solutions . . . . . . . . . . . . . . . . . . . . . . . . . . . . . . . . . . . . . . . 101.5 99.2 85.7
Protective Packaging . . . . . . . . . . . . . . . . . . . . . . . . . . . . . . . . . . 183.8 169.5 150.0
Diversey . . . . . . . . . . . . . . . . . . . . . . . . . . . . . . . . . . . . . . . . . . . (2.9) — —
Other . . . . . . . . . . . . . . . . . . . . . . . . . . . . . . . . . . . . . . . . . . . . . . 6.1 11.2 11.9
Total segments and other . . . . . . . . . . . . . . . . . . . . . . . . . . . . . . . 565.0 542.6 499.3
Costs related to the acquisition of Diversey . . . . . . . . . . . . . . . . 64.8 — —
Restructuring and other charges(1) . . . . . . . . . . . . . . . . . . . . . . . 52.8 7.6 7.0
Total . . . . . . . . . . . . . . . . . . . . . . . . . . . . . . . . . . . . . . . . . . . . . . $ 447.4 $ 535.0 $ 492.3
(1) Restructuring and other charges by our segment reporting structure were as follows:
2011 2010 2009
Food Packaging . . . . . . . . . . . . . . . . . . . . . . . . . . . . . . . . . . . . . . . . . . . . . . . . . $ — $3.7 $ 6.0
Food Solutions . . . . . . . . . . . . . . . . . . . . . . . . . . . . . . . . . . . . . . . . . . . . . . . . . — — 1.0
Protective Packaging . . . . . . . . . . . . . . . . . . . . . . . . . . . . . . . . . . . . . . . . . . . . . (0.4) 3.8 (0.1)
Diversey . . . . . . . . . . . . . . . . . . . . . . . . . . . . . . . . . . . . . . . . . . . . . . . . . . . . . . 53.2 — —
Other . . . . . . . . . . . . . . . . . . . . . . . . . . . . . . . . . . . . . . . . . . . . . . . . . . . . . . . . . — 0.1 0.1
Total . . . . . . . . . . . . . . . . . . . . . . . . . . . . . . . . . . . . . . . . . . . . . . . . . . . . . . . . . $52.8 $7.6 $ 7.0
89
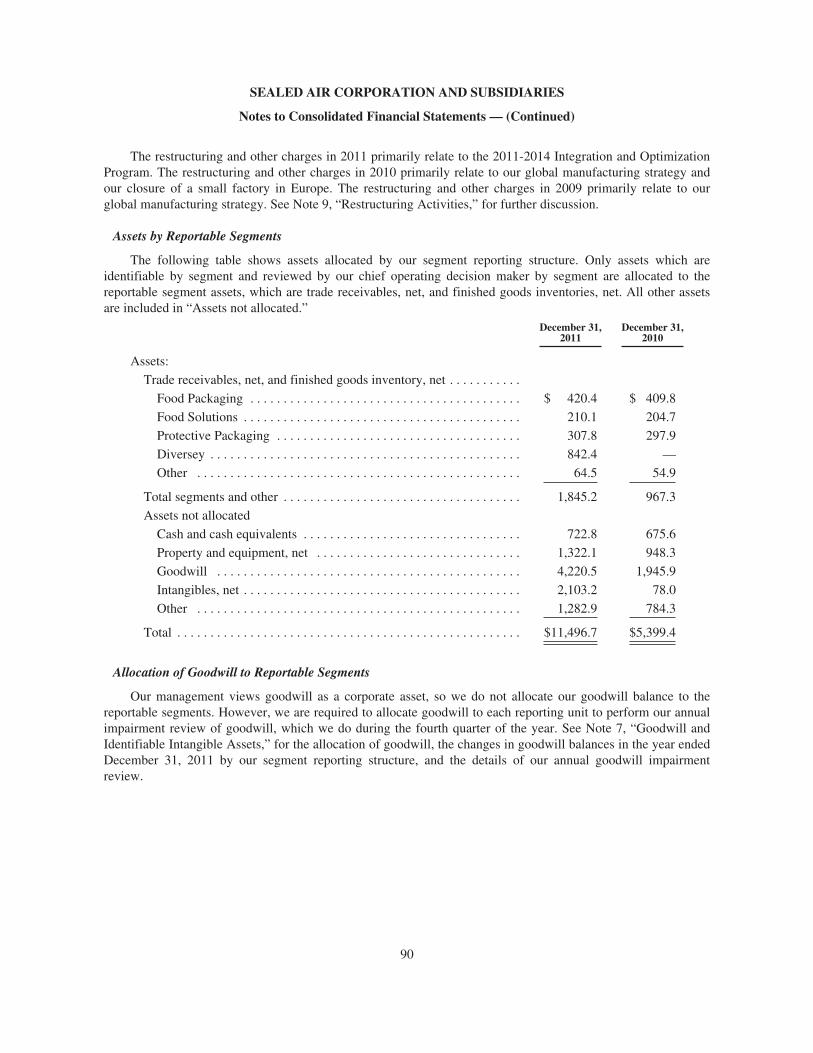
SEALED AIR CORPORATION AND SUBSIDIARIES
Notes to Consolidated Financial Statements — (Continued)
The restructuring and other charges in 2011 primarily relate to the 2011-2014 Integration and OptimizationProgram. The restructuring and other charges in 2010 primarily relate to our global manufacturing strategy andour closure of a small factory in Europe. The restructuring and other charges in 2009 primarily relate to ourglobal manufacturing strategy. See Note 9, “Restructuring Activities,” for further discussion.
Assets by Reportable Segments
The following table shows assets allocated by our segment reporting structure. Only assets which areidentifiable by segment and reviewed by our chief operating decision maker by segment are allocated to thereportable segment assets, which are trade receivables, net, and finished goods inventories, net. All other assetsare included in “Assets not allocated.”
December 31, December 31,2011 2010
Assets:
Trade receivables, net, and finished goods inventory, net . . . . . . . . . . .
Food Packaging . . . . . . . . . . . . . . . . . . . . . . . . . . . . . . . . . . . . . . . . . $ 420.4 $ 409.8
Food Solutions . . . . . . . . . . . . . . . . . . . . . . . . . . . . . . . . . . . . . . . . . . 210.1 204.7
Protective Packaging . . . . . . . . . . . . . . . . . . . . . . . . . . . . . . . . . . . . . 307.8 297.9
Diversey . . . . . . . . . . . . . . . . . . . . . . . . . . . . . . . . . . . . . . . . . . . . . . . 842.4 —
Other . . . . . . . . . . . . . . . . . . . . . . . . . . . . . . . . . . . . . . . . . . . . . . . . . 64.5 54.9
Total segments and other . . . . . . . . . . . . . . . . . . . . . . . . . . . . . . . . . . . . 1,845.2 967.3
Assets not allocated
Cash and cash equivalents . . . . . . . . . . . . . . . . . . . . . . . . . . . . . . . . . 722.8 675.6
Property and equipment, net . . . . . . . . . . . . . . . . . . . . . . . . . . . . . . . 1,322.1 948.3
Goodwill . . . . . . . . . . . . . . . . . . . . . . . . . . . . . . . . . . . . . . . . . . . . . . 4,220.5 1,945.9
Intangibles, net . . . . . . . . . . . . . . . . . . . . . . . . . . . . . . . . . . . . . . . . . . 2,103.2 78.0
Other . . . . . . . . . . . . . . . . . . . . . . . . . . . . . . . . . . . . . . . . . . . . . . . . . 1,282.9 784.3
Total . . . . . . . . . . . . . . . . . . . . . . . . . . . . . . . . . . . . . . . . . . . . . . . . . . . . $11,496.7 $5,399.4
Allocation of Goodwill to Reportable Segments
Our management views goodwill as a corporate asset, so we do not allocate our goodwill balance to thereportable segments. However, we are required to allocate goodwill to each reporting unit to perform our annualimpairment review of goodwill, which we do during the fourth quarter of the year. See Note 7, “Goodwill andIdentifiable Intangible Assets,” for the allocation of goodwill, the changes in goodwill balances in the year endedDecember 31, 2011 by our segment reporting structure, and the details of our annual goodwill impairmentreview.
90
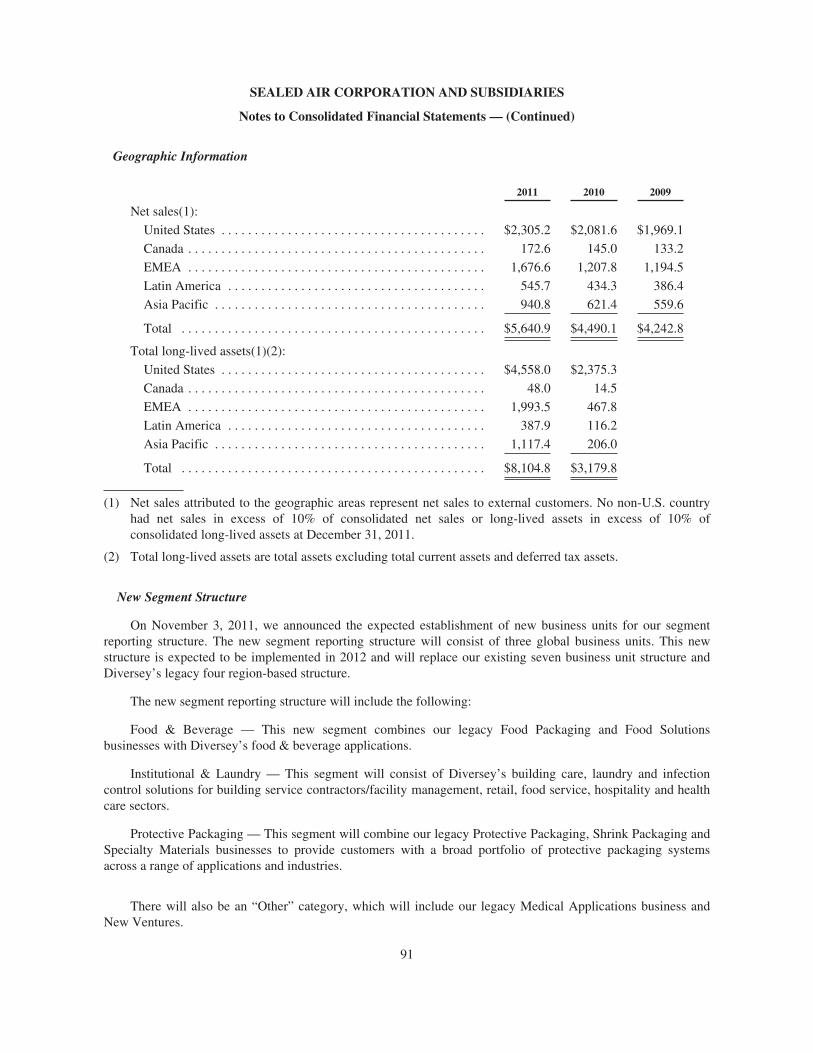
SEALED AIR CORPORATION AND SUBSIDIARIES
Notes to Consolidated Financial Statements — (Continued)
Geographic Information
2011 2010 2009
Net sales(1):
United States . . . . . . . . . . . . . . . . . . . . . . . . . . . . . . . . . . . . . . . . $2,305.2 $2,081.6 $1,969.1
Canada . . . . . . . . . . . . . . . . . . . . . . . . . . . . . . . . . . . . . . . . . . . . . 172.6 145.0 133.2
EMEA . . . . . . . . . . . . . . . . . . . . . . . . . . . . . . . . . . . . . . . . . . . . . 1,676.6 1,207.8 1,194.5
Latin America . . . . . . . . . . . . . . . . . . . . . . . . . . . . . . . . . . . . . . . 545.7 434.3 386.4
Asia Pacific . . . . . . . . . . . . . . . . . . . . . . . . . . . . . . . . . . . . . . . . . 940.8 621.4 559.6
Total . . . . . . . . . . . . . . . . . . . . . . . . . . . . . . . . . . . . . . . . . . . . . . $5,640.9 $4,490.1 $4,242.8
Total long-lived assets(1)(2):
United States . . . . . . . . . . . . . . . . . . . . . . . . . . . . . . . . . . . . . . . . $4,558.0 $2,375.3
Canada . . . . . . . . . . . . . . . . . . . . . . . . . . . . . . . . . . . . . . . . . . . . . 48.0 14.5
EMEA . . . . . . . . . . . . . . . . . . . . . . . . . . . . . . . . . . . . . . . . . . . . . 1,993.5 467.8
Latin America . . . . . . . . . . . . . . . . . . . . . . . . . . . . . . . . . . . . . . . 387.9 116.2
Asia Pacific . . . . . . . . . . . . . . . . . . . . . . . . . . . . . . . . . . . . . . . . . 1,117.4 206.0
Total . . . . . . . . . . . . . . . . . . . . . . . . . . . . . . . . . . . . . . . . . . . . . . $8,104.8 $3,179.8
(1) Net sales attributed to the geographic areas represent net sales to external customers. No non-U.S. countryhad net sales in excess of 10% of consolidated net sales or long-lived assets in excess of 10% ofconsolidated long-lived assets at December 31, 2011.
(2) Total long-lived assets are total assets excluding total current assets and deferred tax assets.
New Segment Structure
On November 3, 2011, we announced the expected establishment of new business units for our segmentreporting structure. The new segment reporting structure will consist of three global business units. This newstructure is expected to be implemented in 2012 and will replace our existing seven business unit structure andDiversey’s legacy four region-based structure.
The new segment reporting structure will include the following:
Food & Beverage — This new segment combines our legacy Food Packaging and Food Solutionsbusinesses with Diversey’s food & beverage applications.
Institutional & Laundry — This segment will consist of Diversey’s building care, laundry and infectioncontrol solutions for building service contractors/facility management, retail, food service, hospitality and healthcare sectors.
Protective Packaging — This segment will combine our legacy Protective Packaging, Shrink Packaging andSpecialty Materials businesses to provide customers with a broad portfolio of protective packaging systemsacross a range of applications and industries.
There will also be an “Other” category, which will include our legacy Medical Applications business andNew Ventures.
91
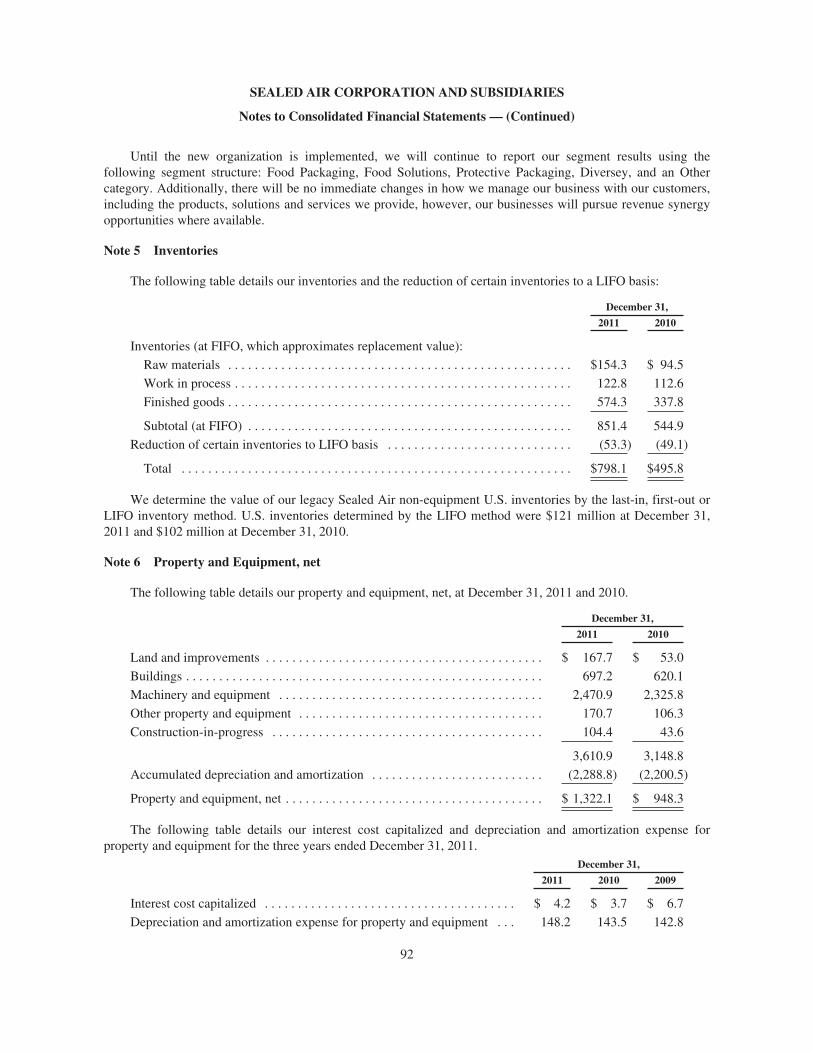
SEALED AIR CORPORATION AND SUBSIDIARIES
Notes to Consolidated Financial Statements — (Continued)
Until the new organization is implemented, we will continue to report our segment results using thefollowing segment structure: Food Packaging, Food Solutions, Protective Packaging, Diversey, and an Othercategory. Additionally, there will be no immediate changes in how we manage our business with our customers,including the products, solutions and services we provide, however, our businesses will pursue revenue synergyopportunities where available.
Note 5 Inventories
The following table details our inventories and the reduction of certain inventories to a LIFO basis:
December 31,
2011 2010
Inventories (at FIFO, which approximates replacement value):
Raw materials . . . . . . . . . . . . . . . . . . . . . . . . . . . . . . . . . . . . . . . . . . . . . . . . . . . . $154.3 $ 94.5
Work in process . . . . . . . . . . . . . . . . . . . . . . . . . . . . . . . . . . . . . . . . . . . . . . . . . . . 122.8 112.6
Finished goods . . . . . . . . . . . . . . . . . . . . . . . . . . . . . . . . . . . . . . . . . . . . . . . . . . . . 574.3 337.8
Subtotal (at FIFO) . . . . . . . . . . . . . . . . . . . . . . . . . . . . . . . . . . . . . . . . . . . . . . . . . 851.4 544.9
Reduction of certain inventories to LIFO basis . . . . . . . . . . . . . . . . . . . . . . . . . . . . (53.3) (49.1)
Total . . . . . . . . . . . . . . . . . . . . . . . . . . . . . . . . . . . . . . . . . . . . . . . . . . . . . . . . . . . $798.1 $495.8
We determine the value of our legacy Sealed Air non-equipment U.S. inventories by the last-in, first-out orLIFO inventory method. U.S. inventories determined by the LIFO method were $121 million at December 31,2011 and $102 million at December 31, 2010.
Note 6 Property and Equipment, net
The following table details our property and equipment, net, at December 31, 2011 and 2010.
December 31,
2011 2010
Land and improvements . . . . . . . . . . . . . . . . . . . . . . . . . . . . . . . . . . . . . . . . . . $ 167.7 $ 53.0
Buildings . . . . . . . . . . . . . . . . . . . . . . . . . . . . . . . . . . . . . . . . . . . . . . . . . . . . . . 697.2 620.1
Machinery and equipment . . . . . . . . . . . . . . . . . . . . . . . . . . . . . . . . . . . . . . . . 2,470.9 2,325.8
Other property and equipment . . . . . . . . . . . . . . . . . . . . . . . . . . . . . . . . . . . . . 170.7 106.3
Construction-in-progress . . . . . . . . . . . . . . . . . . . . . . . . . . . . . . . . . . . . . . . . . 104.4 43.6
3,610.9 3,148.8
Accumulated depreciation and amortization . . . . . . . . . . . . . . . . . . . . . . . . . . (2,288.8) (2,200.5)
Property and equipment, net . . . . . . . . . . . . . . . . . . . . . . . . . . . . . . . . . . . . . . . $ 1,322.1 $ 948.3
The following table details our interest cost capitalized and depreciation and amortization expense forproperty and equipment for the three years ended December 31, 2011.
December 31,
2011 2010 2009
Interest cost capitalized . . . . . . . . . . . . . . . . . . . . . . . . . . . . . . . . . . . . . . $ 4.2 $ 3.7 $ 6.7
Depreciation and amortization expense for property and equipment . . . 148.2 143.5 142.8
92
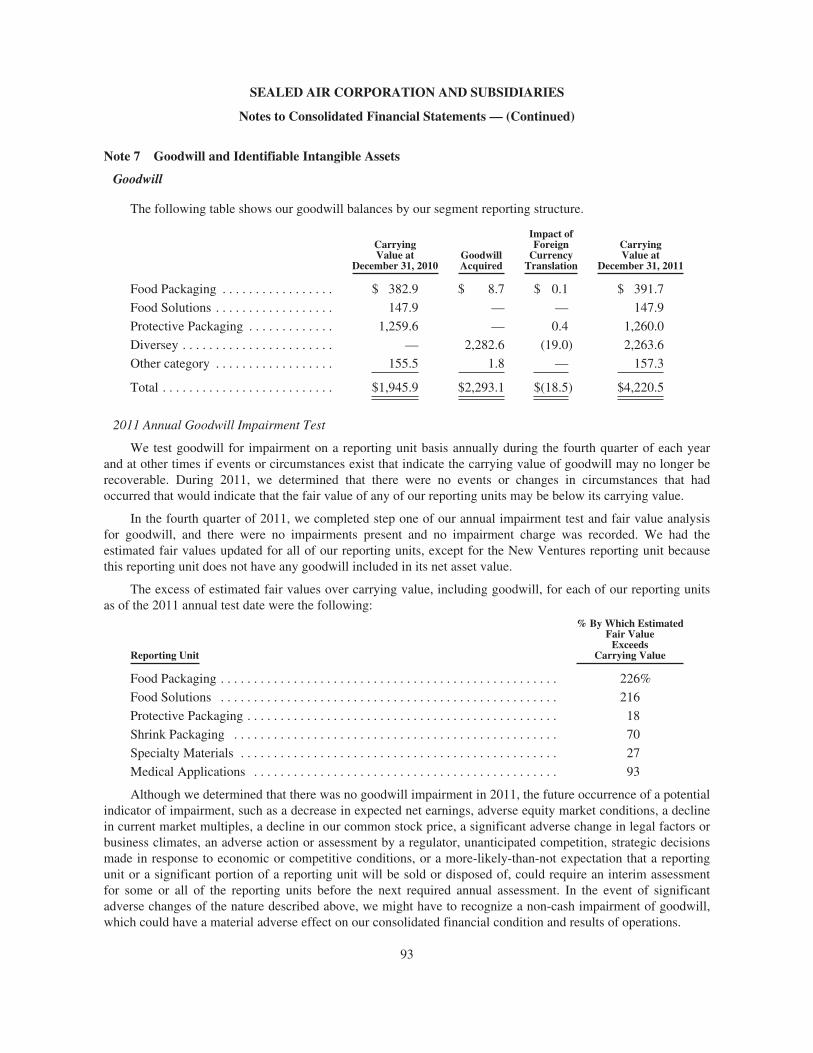
SEALED AIR CORPORATION AND SUBSIDIARIES
Notes to Consolidated Financial Statements — (Continued)
Note 7 Goodwill and Identifiable Intangible Assets
Goodwill
The following table shows our goodwill balances by our segment reporting structure.
CarryingValue at
December 31, 2010GoodwillAcquired
Impact ofForeign
CurrencyTranslation
CarryingValue at
December 31, 2011
Food Packaging . . . . . . . . . . . . . . . . . $ 382.9 $ 8.7 $ 0.1 $ 391.7
Food Solutions . . . . . . . . . . . . . . . . . . 147.9 — — 147.9
Protective Packaging . . . . . . . . . . . . . 1,259.6 — 0.4 1,260.0
Diversey . . . . . . . . . . . . . . . . . . . . . . . — 2,282.6 (19.0) 2,263.6
Other category . . . . . . . . . . . . . . . . . . 155.5 1.8 — 157.3
Total . . . . . . . . . . . . . . . . . . . . . . . . . . $1,945.9 $2,293.1 $(18.5) $4,220.5
2011 Annual Goodwill Impairment Test
We test goodwill for impairment on a reporting unit basis annually during the fourth quarter of each yearand at other times if events or circumstances exist that indicate the carrying value of goodwill may no longer berecoverable. During 2011, we determined that there were no events or changes in circumstances that hadoccurred that would indicate that the fair value of any of our reporting units may be below its carrying value.
In the fourth quarter of 2011, we completed step one of our annual impairment test and fair value analysisfor goodwill, and there were no impairments present and no impairment charge was recorded. We had theestimated fair values updated for all of our reporting units, except for the New Ventures reporting unit becausethis reporting unit does not have any goodwill included in its net asset value.
The excess of estimated fair values over carrying value, including goodwill, for each of our reporting unitsas of the 2011 annual test date were the following:
Reporting Unit
% By Which EstimatedFair Value
ExceedsCarrying Value
Food Packaging . . . . . . . . . . . . . . . . . . . . . . . . . . . . . . . . . . . . . . . . . . . . . . . . . . . 226%
Food Solutions . . . . . . . . . . . . . . . . . . . . . . . . . . . . . . . . . . . . . . . . . . . . . . . . . . . 216
Protective Packaging . . . . . . . . . . . . . . . . . . . . . . . . . . . . . . . . . . . . . . . . . . . . . . . 18
Shrink Packaging . . . . . . . . . . . . . . . . . . . . . . . . . . . . . . . . . . . . . . . . . . . . . . . . . 70
Specialty Materials . . . . . . . . . . . . . . . . . . . . . . . . . . . . . . . . . . . . . . . . . . . . . . . . 27
Medical Applications . . . . . . . . . . . . . . . . . . . . . . . . . . . . . . . . . . . . . . . . . . . . . . 93
Although we determined that there was no goodwill impairment in 2011, the future occurrence of a potentialindicator of impairment, such as a decrease in expected net earnings, adverse equity market conditions, a declinein current market multiples, a decline in our common stock price, a significant adverse change in legal factors orbusiness climates, an adverse action or assessment by a regulator, unanticipated competition, strategic decisionsmade in response to economic or competitive conditions, or a more-likely-than-not expectation that a reportingunit or a significant portion of a reporting unit will be sold or disposed of, could require an interim assessmentfor some or all of the reporting units before the next required annual assessment. In the event of significantadverse changes of the nature described above, we might have to recognize a non-cash impairment of goodwill,which could have a material adverse effect on our consolidated financial condition and results of operations.
93
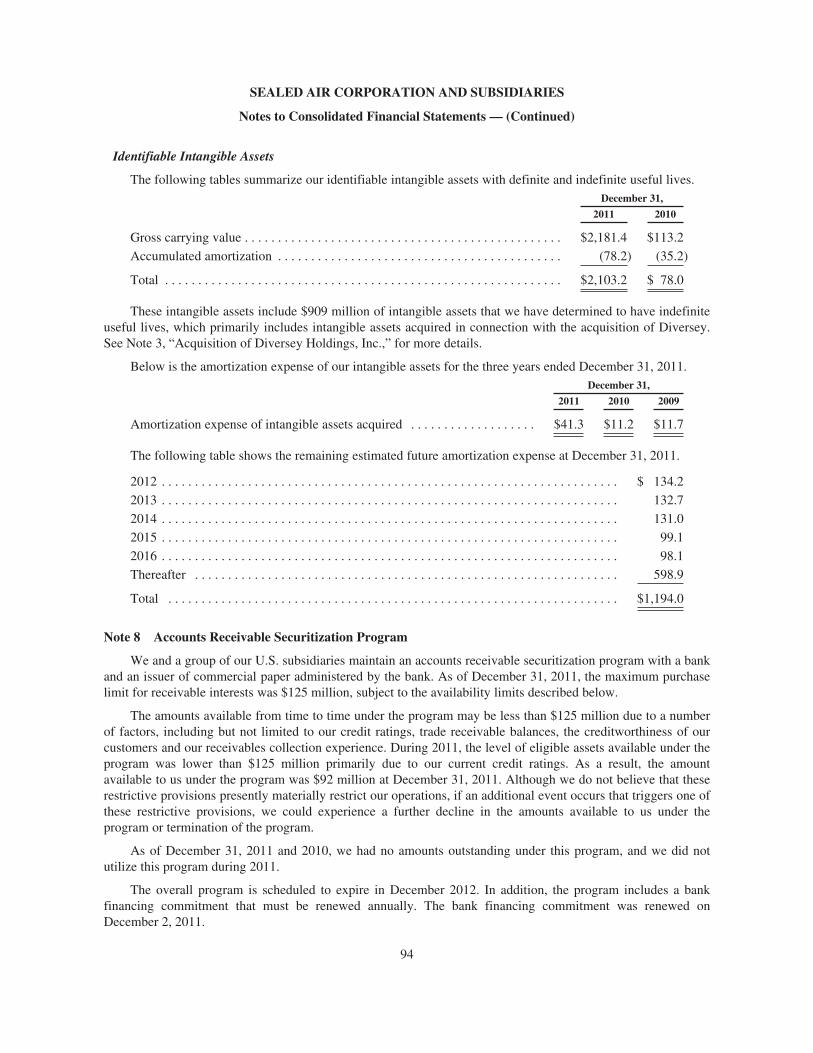
SEALED AIR CORPORATION AND SUBSIDIARIES
Notes to Consolidated Financial Statements — (Continued)
Identifiable Intangible Assets
The following tables summarize our identifiable intangible assets with definite and indefinite useful lives.December 31,
2011 2010
Gross carrying value . . . . . . . . . . . . . . . . . . . . . . . . . . . . . . . . . . . . . . . . . . . . . . . . $2,181.4 $113.2
Accumulated amortization . . . . . . . . . . . . . . . . . . . . . . . . . . . . . . . . . . . . . . . . . . . (78.2) (35.2)
Total . . . . . . . . . . . . . . . . . . . . . . . . . . . . . . . . . . . . . . . . . . . . . . . . . . . . . . . . . . . . $2,103.2 $ 78.0
These intangible assets include $909 million of intangible assets that we have determined to have indefiniteuseful lives, which primarily includes intangible assets acquired in connection with the acquisition of Diversey.See Note 3, “Acquisition of Diversey Holdings, Inc.,” for more details.
Below is the amortization expense of our intangible assets for the three years ended December 31, 2011.December 31,
2011 2010 2009
Amortization expense of intangible assets acquired . . . . . . . . . . . . . . . . . . . $41.3 $11.2 $11.7
The following table shows the remaining estimated future amortization expense at December 31, 2011.
2012 . . . . . . . . . . . . . . . . . . . . . . . . . . . . . . . . . . . . . . . . . . . . . . . . . . . . . . . . . . . . . . . . . . . . . $ 134.2
2013 . . . . . . . . . . . . . . . . . . . . . . . . . . . . . . . . . . . . . . . . . . . . . . . . . . . . . . . . . . . . . . . . . . . . . 132.7
2014 . . . . . . . . . . . . . . . . . . . . . . . . . . . . . . . . . . . . . . . . . . . . . . . . . . . . . . . . . . . . . . . . . . . . . 131.0
2015 . . . . . . . . . . . . . . . . . . . . . . . . . . . . . . . . . . . . . . . . . . . . . . . . . . . . . . . . . . . . . . . . . . . . . 99.1
2016 . . . . . . . . . . . . . . . . . . . . . . . . . . . . . . . . . . . . . . . . . . . . . . . . . . . . . . . . . . . . . . . . . . . . . 98.1
Thereafter . . . . . . . . . . . . . . . . . . . . . . . . . . . . . . . . . . . . . . . . . . . . . . . . . . . . . . . . . . . . . . . . 598.9
Total . . . . . . . . . . . . . . . . . . . . . . . . . . . . . . . . . . . . . . . . . . . . . . . . . . . . . . . . . . . . . . . . . . . . $1,194.0
Note 8 Accounts Receivable Securitization Program
We and a group of our U.S. subsidiaries maintain an accounts receivable securitization program with a bankand an issuer of commercial paper administered by the bank. As of December 31, 2011, the maximum purchaselimit for receivable interests was $125 million, subject to the availability limits described below.
The amounts available from time to time under the program may be less than $125 million due to a numberof factors, including but not limited to our credit ratings, trade receivable balances, the creditworthiness of ourcustomers and our receivables collection experience. During 2011, the level of eligible assets available under theprogram was lower than $125 million primarily due to our current credit ratings. As a result, the amountavailable to us under the program was $92 million at December 31, 2011. Although we do not believe that theserestrictive provisions presently materially restrict our operations, if an additional event occurs that triggers one ofthese restrictive provisions, we could experience a further decline in the amounts available to us under theprogram or termination of the program.
As of December 31, 2011 and 2010, we had no amounts outstanding under this program, and we did notutilize this program during 2011.
The overall program is scheduled to expire in December 2012. In addition, the program includes a bankfinancing commitment that must be renewed annually. The bank financing commitment was renewed onDecember 2, 2011.
94
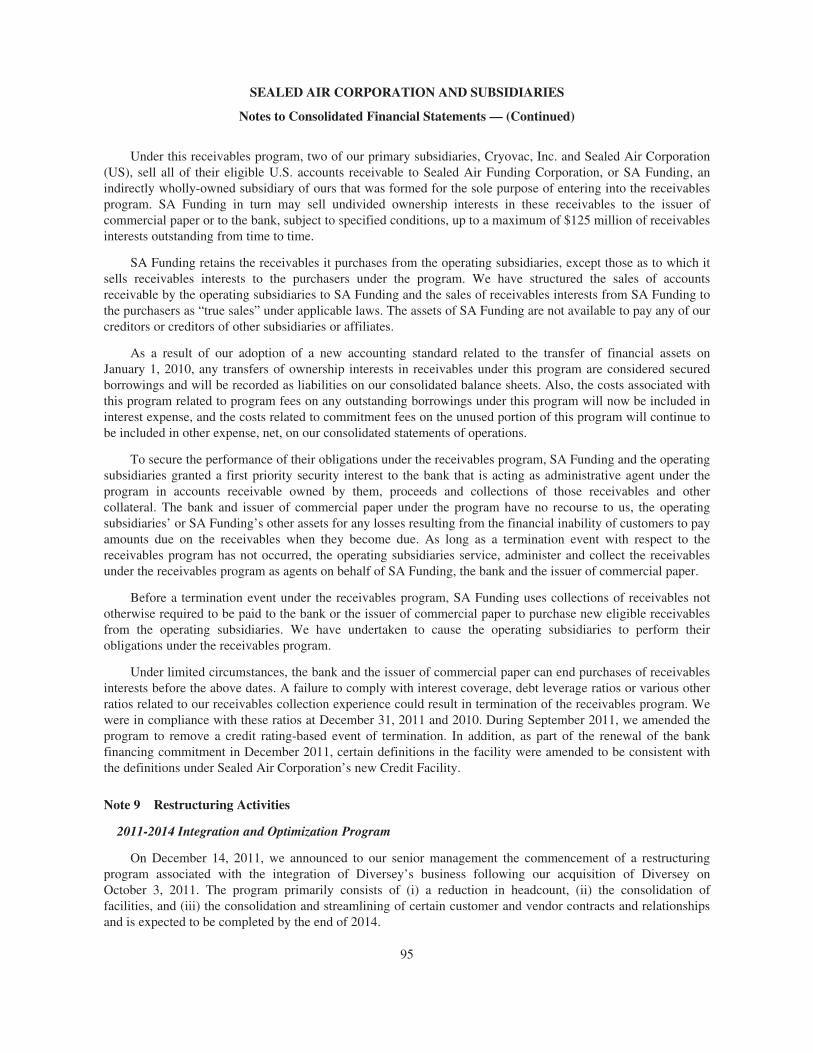
SEALED AIR CORPORATION AND SUBSIDIARIES
Notes to Consolidated Financial Statements — (Continued)
Under this receivables program, two of our primary subsidiaries, Cryovac, Inc. and Sealed Air Corporation(US), sell all of their eligible U.S. accounts receivable to Sealed Air Funding Corporation, or SA Funding, anindirectly wholly-owned subsidiary of ours that was formed for the sole purpose of entering into the receivablesprogram. SA Funding in turn may sell undivided ownership interests in these receivables to the issuer ofcommercial paper or to the bank, subject to specified conditions, up to a maximum of $125 million of receivablesinterests outstanding from time to time.
SA Funding retains the receivables it purchases from the operating subsidiaries, except those as to which itsells receivables interests to the purchasers under the program. We have structured the sales of accountsreceivable by the operating subsidiaries to SA Funding and the sales of receivables interests from SA Funding tothe purchasers as “true sales” under applicable laws. The assets of SA Funding are not available to pay any of ourcreditors or creditors of other subsidiaries or affiliates.
As a result of our adoption of a new accounting standard related to the transfer of financial assets onJanuary 1, 2010, any transfers of ownership interests in receivables under this program are considered securedborrowings and will be recorded as liabilities on our consolidated balance sheets. Also, the costs associated withthis program related to program fees on any outstanding borrowings under this program will now be included ininterest expense, and the costs related to commitment fees on the unused portion of this program will continue tobe included in other expense, net, on our consolidated statements of operations.
To secure the performance of their obligations under the receivables program, SA Funding and the operatingsubsidiaries granted a first priority security interest to the bank that is acting as administrative agent under theprogram in accounts receivable owned by them, proceeds and collections of those receivables and othercollateral. The bank and issuer of commercial paper under the program have no recourse to us, the operatingsubsidiaries’ or SA Funding’s other assets for any losses resulting from the financial inability of customers to payamounts due on the receivables when they become due. As long as a termination event with respect to thereceivables program has not occurred, the operating subsidiaries service, administer and collect the receivablesunder the receivables program as agents on behalf of SA Funding, the bank and the issuer of commercial paper.
Before a termination event under the receivables program, SA Funding uses collections of receivables nototherwise required to be paid to the bank or the issuer of commercial paper to purchase new eligible receivablesfrom the operating subsidiaries. We have undertaken to cause the operating subsidiaries to perform theirobligations under the receivables program.
Under limited circumstances, the bank and the issuer of commercial paper can end purchases of receivablesinterests before the above dates. A failure to comply with interest coverage, debt leverage ratios or various otherratios related to our receivables collection experience could result in termination of the receivables program. Wewere in compliance with these ratios at December 31, 2011 and 2010. During September 2011, we amended theprogram to remove a credit rating-based event of termination. In addition, as part of the renewal of the bankfinancing commitment in December 2011, certain definitions in the facility were amended to be consistent withthe definitions under Sealed Air Corporation’s new Credit Facility.
Note 9 Restructuring Activities
2011-2014 Integration and Optimization Program
On December 14, 2011, we announced to our senior management the commencement of a restructuringprogram associated with the integration of Diversey’s business following our acquisition of Diversey onOctober 3, 2011. The program primarily consists of (i) a reduction in headcount, (ii) the consolidation offacilities, and (iii) the consolidation and streamlining of certain customer and vendor contracts and relationshipsand is expected to be completed by the end of 2014.
95
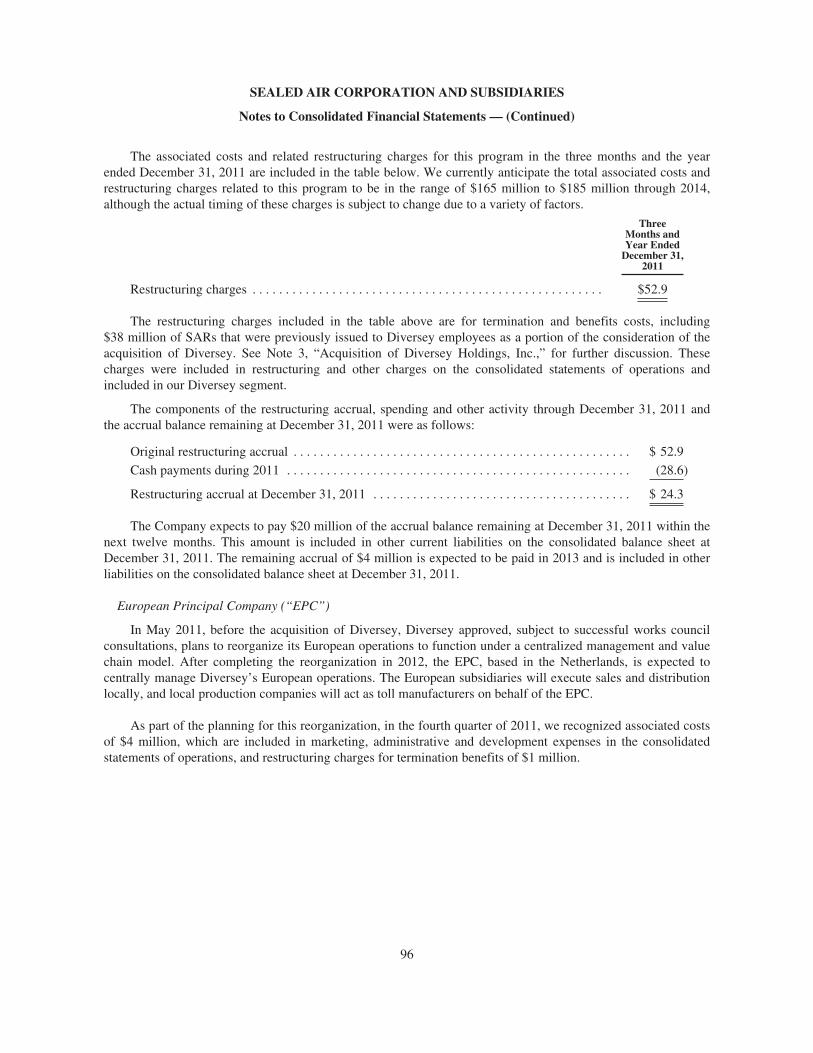
SEALED AIR CORPORATION AND SUBSIDIARIES
Notes to Consolidated Financial Statements — (Continued)
The associated costs and related restructuring charges for this program in the three months and the yearended December 31, 2011 are included in the table below. We currently anticipate the total associated costs andrestructuring charges related to this program to be in the range of $165 million to $185 million through 2014,although the actual timing of these charges is subject to change due to a variety of factors.
ThreeMonths andYear Ended
December 31,2011
Restructuring charges . . . . . . . . . . . . . . . . . . . . . . . . . . . . . . . . . . . . . . . . . . . . . . . . . . . . . $52.9
The restructuring charges included in the table above are for termination and benefits costs, including$38 million of SARs that were previously issued to Diversey employees as a portion of the consideration of theacquisition of Diversey. See Note 3, “Acquisition of Diversey Holdings, Inc.,” for further discussion. Thesecharges were included in restructuring and other charges on the consolidated statements of operations andincluded in our Diversey segment.
The components of the restructuring accrual, spending and other activity through December 31, 2011 andthe accrual balance remaining at December 31, 2011 were as follows:
Original restructuring accrual . . . . . . . . . . . . . . . . . . . . . . . . . . . . . . . . . . . . . . . . . . . . . . . . . . . $ 52.9
Cash payments during 2011 . . . . . . . . . . . . . . . . . . . . . . . . . . . . . . . . . . . . . . . . . . . . . . . . . . . . (28.6)
Restructuring accrual at December 31, 2011 . . . . . . . . . . . . . . . . . . . . . . . . . . . . . . . . . . . . . . . $ 24.3
The Company expects to pay $20 million of the accrual balance remaining at December 31, 2011 within thenext twelve months. This amount is included in other current liabilities on the consolidated balance sheet atDecember 31, 2011. The remaining accrual of $4 million is expected to be paid in 2013 and is included in otherliabilities on the consolidated balance sheet at December 31, 2011.
European Principal Company (“EPC”)
In May 2011, before the acquisition of Diversey, Diversey approved, subject to successful works councilconsultations, plans to reorganize its European operations to function under a centralized management and valuechain model. After completing the reorganization in 2012, the EPC, based in the Netherlands, is expected tocentrally manage Diversey’s European operations. The European subsidiaries will execute sales and distributionlocally, and local production companies will act as toll manufacturers on behalf of the EPC.
As part of the planning for this reorganization, in the fourth quarter of 2011, we recognized associated costsof $4 million, which are included in marketing, administrative and development expenses in the consolidatedstatements of operations, and restructuring charges for termination benefits of $1 million.
96
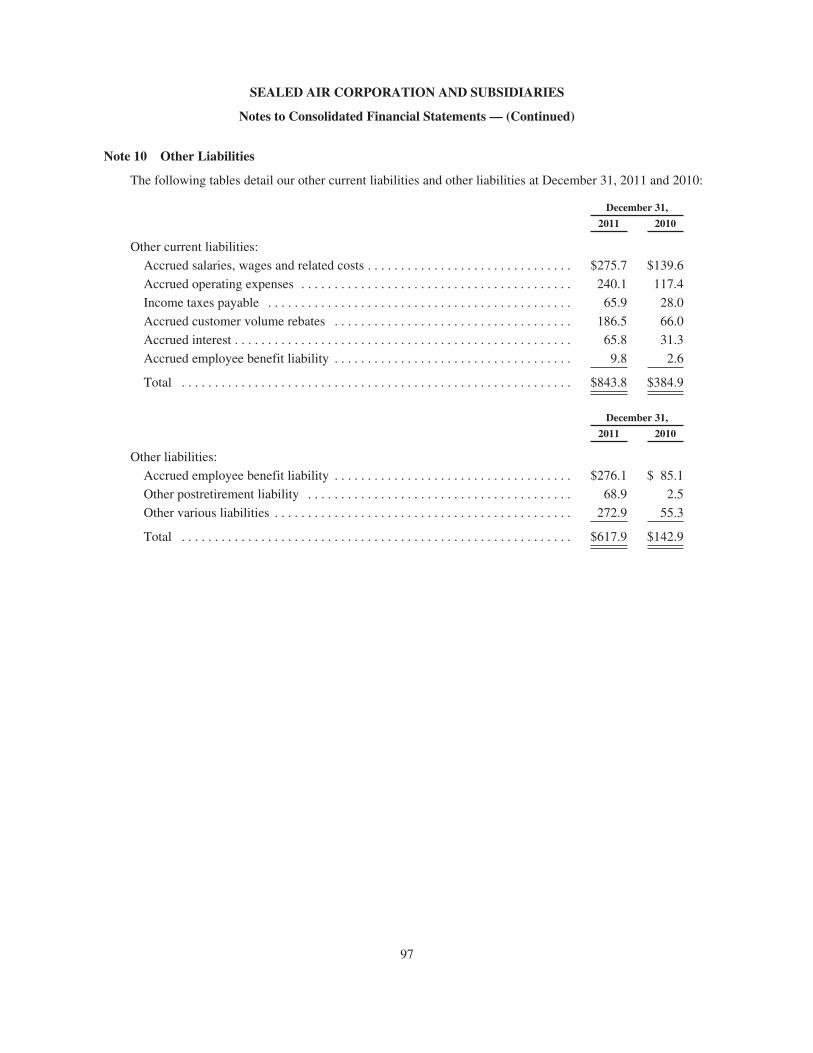
SEALED AIR CORPORATION AND SUBSIDIARIES
Notes to Consolidated Financial Statements — (Continued)
Note 10 Other Liabilities
The following tables detail our other current liabilities and other liabilities at December 31, 2011 and 2010:
December 31,
2011 2010
Other current liabilities:
Accrued salaries, wages and related costs . . . . . . . . . . . . . . . . . . . . . . . . . . . . . . . $275.7 $139.6
Accrued operating expenses . . . . . . . . . . . . . . . . . . . . . . . . . . . . . . . . . . . . . . . . . 240.1 117.4
Income taxes payable . . . . . . . . . . . . . . . . . . . . . . . . . . . . . . . . . . . . . . . . . . . . . . 65.9 28.0
Accrued customer volume rebates . . . . . . . . . . . . . . . . . . . . . . . . . . . . . . . . . . . . 186.5 66.0
Accrued interest . . . . . . . . . . . . . . . . . . . . . . . . . . . . . . . . . . . . . . . . . . . . . . . . . . . 65.8 31.3
Accrued employee benefit liability . . . . . . . . . . . . . . . . . . . . . . . . . . . . . . . . . . . . 9.8 2.6
Total . . . . . . . . . . . . . . . . . . . . . . . . . . . . . . . . . . . . . . . . . . . . . . . . . . . . . . . . . . . $843.8 $384.9
December 31,
2011 2010
Other liabilities:
Accrued employee benefit liability . . . . . . . . . . . . . . . . . . . . . . . . . . . . . . . . . . . . $276.1 $ 85.1
Other postretirement liability . . . . . . . . . . . . . . . . . . . . . . . . . . . . . . . . . . . . . . . . 68.9 2.5
Other various liabilities . . . . . . . . . . . . . . . . . . . . . . . . . . . . . . . . . . . . . . . . . . . . . 272.9 55.3
Total . . . . . . . . . . . . . . . . . . . . . . . . . . . . . . . . . . . . . . . . . . . . . . . . . . . . . . . . . . . $617.9 $142.9
97
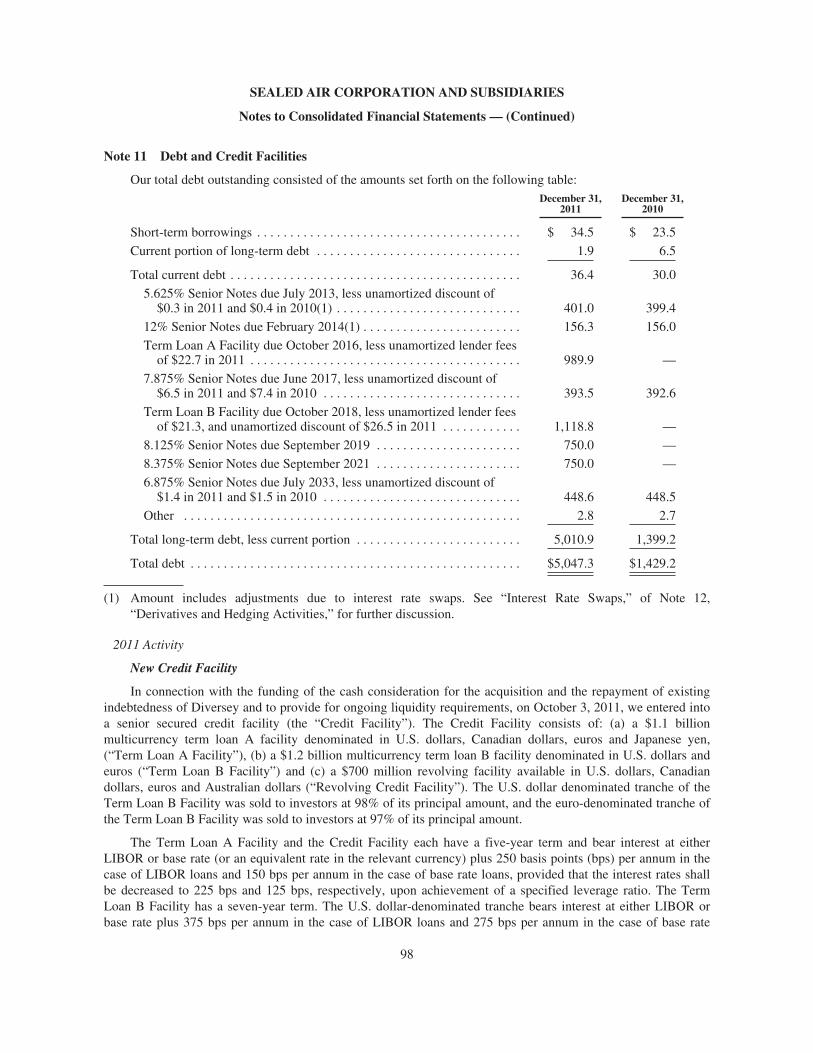
SEALED AIR CORPORATION AND SUBSIDIARIES
Notes to Consolidated Financial Statements — (Continued)
Note 11 Debt and Credit Facilities
Our total debt outstanding consisted of the amounts set forth on the following table:December 31,
2011December 31,
2010
Short-term borrowings . . . . . . . . . . . . . . . . . . . . . . . . . . . . . . . . . . . . . . . . $ 34.5 $ 23.5
Current portion of long-term debt . . . . . . . . . . . . . . . . . . . . . . . . . . . . . . . 1.9 6.5
Total current debt . . . . . . . . . . . . . . . . . . . . . . . . . . . . . . . . . . . . . . . . . . . . 36.4 30.0
5.625% Senior Notes due July 2013, less unamortized discount of$0.3 in 2011 and $0.4 in 2010(1) . . . . . . . . . . . . . . . . . . . . . . . . . . . . 401.0 399.4
12% Senior Notes due February 2014(1) . . . . . . . . . . . . . . . . . . . . . . . . 156.3 156.0
Term Loan A Facility due October 2016, less unamortized lender feesof $22.7 in 2011 . . . . . . . . . . . . . . . . . . . . . . . . . . . . . . . . . . . . . . . . . 989.9 —
7.875% Senior Notes due June 2017, less unamortized discount of$6.5 in 2011 and $7.4 in 2010 . . . . . . . . . . . . . . . . . . . . . . . . . . . . . . 393.5 392.6
Term Loan B Facility due October 2018, less unamortized lender feesof $21.3, and unamortized discount of $26.5 in 2011 . . . . . . . . . . . . 1,118.8 —
8.125% Senior Notes due September 2019 . . . . . . . . . . . . . . . . . . . . . . 750.0 —
8.375% Senior Notes due September 2021 . . . . . . . . . . . . . . . . . . . . . . 750.0 —
6.875% Senior Notes due July 2033, less unamortized discount of$1.4 in 2011 and $1.5 in 2010 . . . . . . . . . . . . . . . . . . . . . . . . . . . . . . 448.6 448.5
Other . . . . . . . . . . . . . . . . . . . . . . . . . . . . . . . . . . . . . . . . . . . . . . . . . . . 2.8 2.7
Total long-term debt, less current portion . . . . . . . . . . . . . . . . . . . . . . . . . 5,010.9 1,399.2
Total debt . . . . . . . . . . . . . . . . . . . . . . . . . . . . . . . . . . . . . . . . . . . . . . . . . . $5,047.3 $1,429.2
(1) Amount includes adjustments due to interest rate swaps. See “Interest Rate Swaps,” of Note 12,“Derivatives and Hedging Activities,” for further discussion.
2011 Activity
New Credit Facility
In connection with the funding of the cash consideration for the acquisition and the repayment of existingindebtedness of Diversey and to provide for ongoing liquidity requirements, on October 3, 2011, we entered intoa senior secured credit facility (the “Credit Facility”). The Credit Facility consists of: (a) a $1.1 billionmulticurrency term loan A facility denominated in U.S. dollars, Canadian dollars, euros and Japanese yen,(“Term Loan A Facility”), (b) a $1.2 billion multicurrency term loan B facility denominated in U.S. dollars andeuros (“Term Loan B Facility”) and (c) a $700 million revolving facility available in U.S. dollars, Canadiandollars, euros and Australian dollars (“Revolving Credit Facility”). The U.S. dollar denominated tranche of theTerm Loan B Facility was sold to investors at 98% of its principal amount, and the euro-denominated tranche ofthe Term Loan B Facility was sold to investors at 97% of its principal amount.
The Term Loan A Facility and the Credit Facility each have a five-year term and bear interest at eitherLIBOR or base rate (or an equivalent rate in the relevant currency) plus 250 basis points (bps) per annum in thecase of LIBOR loans and 150 bps per annum in the case of base rate loans, provided that the interest rates shallbe decreased to 225 bps and 125 bps, respectively, upon achievement of a specified leverage ratio. The TermLoan B Facility has a seven-year term. The U.S. dollar-denominated tranche bears interest at either LIBOR orbase rate plus 375 bps per annum in the case of LIBOR loans and 275 bps per annum in the case of base rate
98
SEALED AIR CORPORATION AND SUBSIDIARIES
Notes to Consolidated Financial Statements — (Continued)
loans, and the euro-denominated tranche bears interest at either EURIBOR or base rate plus 450 bps per annumin the case of EURIBOR loans and 350 bps per annum in the case of base rate loans. LIBOR and EURIBOR aresubject to a 1.0% floor under the Term Loan B Facility tranches. Our obligations under the Credit Facility havebeen guaranteed by certain of Sealed Air’s subsidiaries and secured by pledges of certain assets and the capitalstock of certain of our subsidiaries.
As a result of the transactions mentioned above we recorded $28 million of original issuance discounts on theterm loans. This amount is included in the carrying amount of the respective term loans. We also recorded $48million of lender fees related to the transactions mentioned above. These fees are also included in the carryingamount of the respective debt instruments. In addition, we recorded $51 million of non-lender fees related to thetransactions mentioned above. These fees are included in other assets on our consolidated balance sheet.
The amortization expense of the original issuance discount, and lender and non-lender fees are calculatedusing the effective interest rate method over the life of the respective debt instrument. Total amortization expensein 2011 related to the debt instruments above was $8 million and is included in interest expense on ourconsolidated statements of operations.
Effective October 3, 2011, we terminated our former global credit facility and European credit facility andreplaced them with the Revolving Credit Facility. The Revolving Credit Facility may be used for working capital needsand general corporate purposes, including the payment of the amounts required upon effectiveness of the Settlementagreement. We did not use our former global credit facility and European credit facility in the years endedDecember 31, 2011 and 2010. We used our Revolving Credit Facility for a short time period in connection with theacquisition of Diversey. Interest paid for the year ended December 31, 2011 under the Revolving Credit Facility wasimmaterial. There were no amounts outstanding under the Revolving Credit Facility at December 31, 2011.
The Credit Facility provides for customary events of default, including failure to pay principal or interest whendue, failure to comply with covenants, the fact that any representation or warranty made by Sealed Air is false in anymaterial respect, certain insolvency or receivership events affecting Sealed Air and its subsidiaries and a change incontrol of Sealed Air. For certain events of default, the commitments of the lenders will be automatically terminated,and all outstanding obligations of Sealed Air under the Credit Facility may be declared immediately due and payable.
Senior Notes
Additionally, on October 3, 2011, we completed an offering of $750 million aggregate principal amount of8.125% senior notes due 2019 and $750 million aggregate principal amount of 8.375% senior notes due 2021(“Notes”). The Notes were sold to investors at 100.0% of their aggregate principal amount, and interest ispayable on the Notes on March 15 and September 15 of each year, commencing March 15, 2012.
The Notes and their related guarantees were offered only to qualified institutional buyers under Rule 144Aof the Securities Act of 1933, as amended (the “Securities Act”), and to non-U.S. persons in transactions outsidethe United States under Regulation S of the Securities Act. The Notes have not been registered under theSecurities Act, and, unless so registered, may not be offered or sold in the United States absent registration or anapplicable exemption from, or in a transaction not subject to, the registration requirements of the Securities Actand other applicable securities laws.
2010 Activity
Partial Redemption of 12% Senior Notes due 2014
In December 2010, we completed an early redemption of $150 million of the outstanding $300 millionprincipal amount of our 12% Senior Notes due February 14, 2014. We redeemed these notes at fair value. Theaggregate redemption price was $196 million, which included the principal amount of $150 million, a 27%premium of $41 million and accrued interest of $5 million. We funded the redemption with available cash. Werecognized a net pre-tax loss of $39 million, which included the premium mentioned above, less a gain of$2 million on the termination of a related interest rate swap.
99
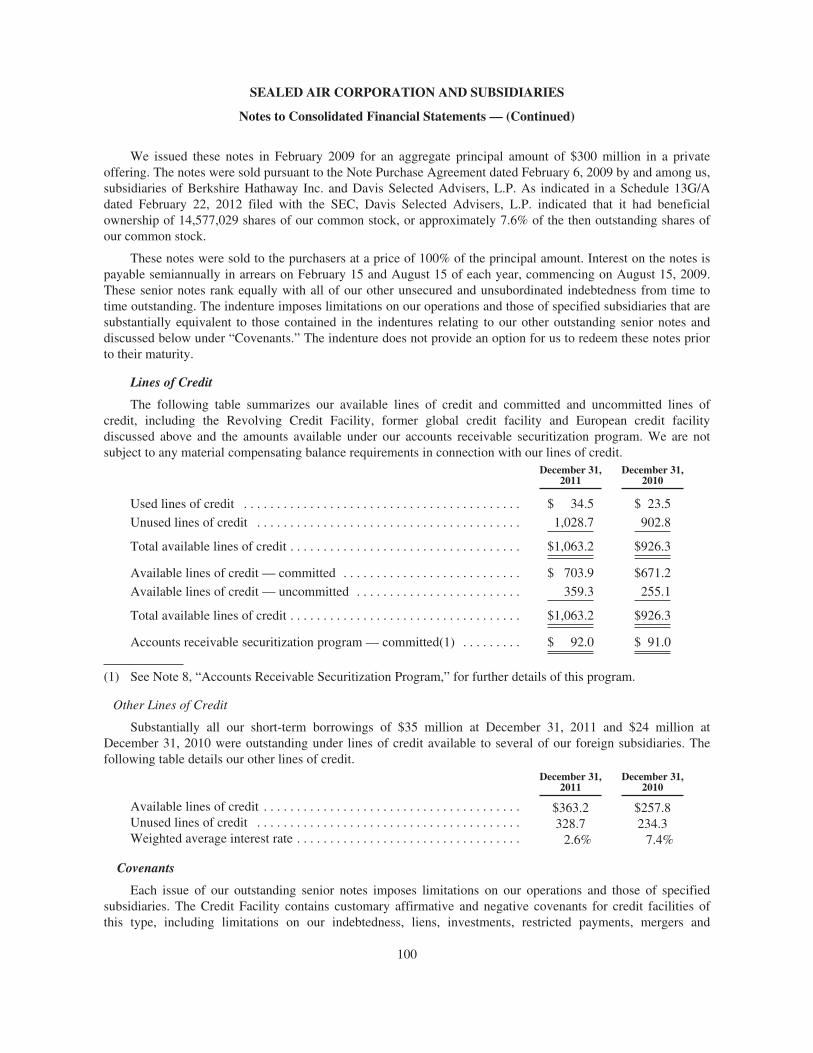
SEALED AIR CORPORATION AND SUBSIDIARIES
Notes to Consolidated Financial Statements — (Continued)
We issued these notes in February 2009 for an aggregate principal amount of $300 million in a privateoffering. The notes were sold pursuant to the Note Purchase Agreement dated February 6, 2009 by and among us,subsidiaries of Berkshire Hathaway Inc. and Davis Selected Advisers, L.P. As indicated in a Schedule 13G/Adated February 22, 2012 filed with the SEC, Davis Selected Advisers, L.P. indicated that it had beneficialownership of 14,577,029 shares of our common stock, or approximately 7.6% of the then outstanding shares ofour common stock.
These notes were sold to the purchasers at a price of 100% of the principal amount. Interest on the notes ispayable semiannually in arrears on February 15 and August 15 of each year, commencing on August 15, 2009.These senior notes rank equally with all of our other unsecured and unsubordinated indebtedness from time totime outstanding. The indenture imposes limitations on our operations and those of specified subsidiaries that aresubstantially equivalent to those contained in the indentures relating to our other outstanding senior notes anddiscussed below under “Covenants.” The indenture does not provide an option for us to redeem these notes priorto their maturity.
Lines of Credit
The following table summarizes our available lines of credit and committed and uncommitted lines ofcredit, including the Revolving Credit Facility, former global credit facility and European credit facilitydiscussed above and the amounts available under our accounts receivable securitization program. We are notsubject to any material compensating balance requirements in connection with our lines of credit.
December 31,2011
December 31,2010
Used lines of credit . . . . . . . . . . . . . . . . . . . . . . . . . . . . . . . . . . . . . . . . . . $ 34.5 $ 23.5
Unused lines of credit . . . . . . . . . . . . . . . . . . . . . . . . . . . . . . . . . . . . . . . . 1,028.7 902.8
Total available lines of credit . . . . . . . . . . . . . . . . . . . . . . . . . . . . . . . . . . . $1,063.2 $926.3
Available lines of credit — committed . . . . . . . . . . . . . . . . . . . . . . . . . . . $ 703.9 $671.2
Available lines of credit — uncommitted . . . . . . . . . . . . . . . . . . . . . . . . . 359.3 255.1
Total available lines of credit . . . . . . . . . . . . . . . . . . . . . . . . . . . . . . . . . . . $1,063.2 $926.3
Accounts receivable securitization program — committed(1) . . . . . . . . . $ 92.0 $ 91.0
(1) See Note 8, “Accounts Receivable Securitization Program,” for further details of this program.
Other Lines of Credit
Substantially all our short-term borrowings of $35 million at December 31, 2011 and $24 million atDecember 31, 2010 were outstanding under lines of credit available to several of our foreign subsidiaries. Thefollowing table details our other lines of credit.
December 31,2011
December 31,2010
Available lines of credit . . . . . . . . . . . . . . . . . . . . . . . . . . . . . . . . . . . . . . . $363.2 $257.8Unused lines of credit . . . . . . . . . . . . . . . . . . . . . . . . . . . . . . . . . . . . . . . . 328.7 234.3Weighted average interest rate . . . . . . . . . . . . . . . . . . . . . . . . . . . . . . . . . . 2.6% 7.4%
Covenants
Each issue of our outstanding senior notes imposes limitations on our operations and those of specifiedsubsidiaries. The Credit Facility contains customary affirmative and negative covenants for credit facilities ofthis type, including limitations on our indebtedness, liens, investments, restricted payments, mergers and
100
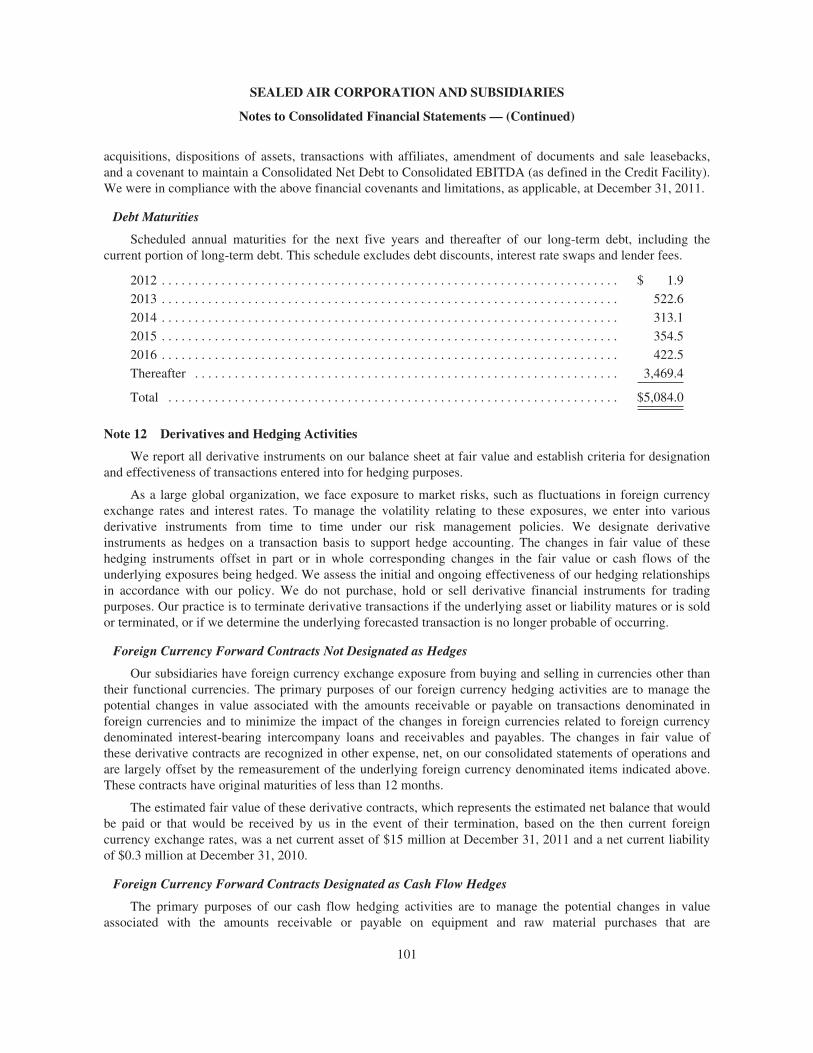
SEALED AIR CORPORATION AND SUBSIDIARIES
Notes to Consolidated Financial Statements — (Continued)
acquisitions, dispositions of assets, transactions with affiliates, amendment of documents and sale leasebacks,and a covenant to maintain a Consolidated Net Debt to Consolidated EBITDA (as defined in the Credit Facility).We were in compliance with the above financial covenants and limitations, as applicable, at December 31, 2011.
Debt Maturities
Scheduled annual maturities for the next five years and thereafter of our long-term debt, including thecurrent portion of long-term debt. This schedule excludes debt discounts, interest rate swaps and lender fees.
2012 . . . . . . . . . . . . . . . . . . . . . . . . . . . . . . . . . . . . . . . . . . . . . . . . . . . . . . . . . . . . . . . . . . . . . $ 1.9
2013 . . . . . . . . . . . . . . . . . . . . . . . . . . . . . . . . . . . . . . . . . . . . . . . . . . . . . . . . . . . . . . . . . . . . . 522.6
2014 . . . . . . . . . . . . . . . . . . . . . . . . . . . . . . . . . . . . . . . . . . . . . . . . . . . . . . . . . . . . . . . . . . . . . 313.1
2015 . . . . . . . . . . . . . . . . . . . . . . . . . . . . . . . . . . . . . . . . . . . . . . . . . . . . . . . . . . . . . . . . . . . . . 354.5
2016 . . . . . . . . . . . . . . . . . . . . . . . . . . . . . . . . . . . . . . . . . . . . . . . . . . . . . . . . . . . . . . . . . . . . . 422.5
Thereafter . . . . . . . . . . . . . . . . . . . . . . . . . . . . . . . . . . . . . . . . . . . . . . . . . . . . . . . . . . . . . . . . 3,469.4
Total . . . . . . . . . . . . . . . . . . . . . . . . . . . . . . . . . . . . . . . . . . . . . . . . . . . . . . . . . . . . . . . . . . . . $5,084.0
Note 12 Derivatives and Hedging Activities
We report all derivative instruments on our balance sheet at fair value and establish criteria for designationand effectiveness of transactions entered into for hedging purposes.
As a large global organization, we face exposure to market risks, such as fluctuations in foreign currencyexchange rates and interest rates. To manage the volatility relating to these exposures, we enter into variousderivative instruments from time to time under our risk management policies. We designate derivativeinstruments as hedges on a transaction basis to support hedge accounting. The changes in fair value of thesehedging instruments offset in part or in whole corresponding changes in the fair value or cash flows of theunderlying exposures being hedged. We assess the initial and ongoing effectiveness of our hedging relationshipsin accordance with our policy. We do not purchase, hold or sell derivative financial instruments for tradingpurposes. Our practice is to terminate derivative transactions if the underlying asset or liability matures or is soldor terminated, or if we determine the underlying forecasted transaction is no longer probable of occurring.
Foreign Currency Forward Contracts Not Designated as Hedges
Our subsidiaries have foreign currency exchange exposure from buying and selling in currencies other thantheir functional currencies. The primary purposes of our foreign currency hedging activities are to manage thepotential changes in value associated with the amounts receivable or payable on transactions denominated inforeign currencies and to minimize the impact of the changes in foreign currencies related to foreign currencydenominated interest-bearing intercompany loans and receivables and payables. The changes in fair value ofthese derivative contracts are recognized in other expense, net, on our consolidated statements of operations andare largely offset by the remeasurement of the underlying foreign currency denominated items indicated above.These contracts have original maturities of less than 12 months.
The estimated fair value of these derivative contracts, which represents the estimated net balance that wouldbe paid or that would be received by us in the event of their termination, based on the then current foreigncurrency exchange rates, was a net current asset of $15 million at December 31, 2011 and a net current liabilityof $0.3 million at December 31, 2010.
Foreign Currency Forward Contracts Designated as Cash Flow Hedges
The primary purposes of our cash flow hedging activities are to manage the potential changes in valueassociated with the amounts receivable or payable on equipment and raw material purchases that are
101
SEALED AIR CORPORATION AND SUBSIDIARIES
Notes to Consolidated Financial Statements — (Continued)
denominated in foreign currencies in order to minimize the impact of the changes in foreign currencies. Werecord gains and losses on foreign currency forward contracts qualifying as cash flow hedges in othercomprehensive income to the extent that these hedges are effective and until we recognize the underlyingtransactions in net earnings, at which time we recognize these gains and losses in other expense, net, on ourconsolidated statements of operations.
Net unrealized after tax gains (losses) related to these contracts that were included in other comprehensiveincome for the years ended December 31, 2011 and 2010 were immaterial. The unrealized amounts in othercomprehensive income will fluctuate based on changes in the fair value of open contracts during each reportingperiod.
Interest Rate Swaps
From time to time, we may use interest rate swaps to manage our mix of fixed and floating interest rates onour outstanding indebtedness.
At December 31, 2011, we had outstanding interest rate swaps related to our 12% Senior Notes thatqualified and were designated as fair value hedges.
In the fourth quarter of 2011, we terminated or offset interest rate swaps on our 5.625% Senior Notes and aportion of our 12% Senior Notes. As a result, we received cash of $7 million related to these terminations andrecognized a reduction of interest expense of $1 million and an increase of $6 million in the carrying amount ofour 12% Senior Notes and our 5.625% Senior Notes, which is being amortized over the remaining maturities ofthese notes and included in interest expense on our consolidated statements of operations.
We also recorded a mark-to-market adjustment to record an increase of $2 million at December 31, 2011 inthe carrying amount of our 12% Senior Notes due to changes in interest rates and an offsetting increase to otherassets at December 31, 2011 to record the fair value of the remaining outstanding interest rate swaps. There wasno ineffective portion of the hedges recognized in earnings during the period.
At December 31, 2010, we recorded a mark-to-market adjustment to record an increase of $6 million in thecarrying amount of our 12% Senior Notes and our 5.625% Senior Notes due to changes in interest rates and anoffsetting increase to other assets at December 31, 2010 to record the fair value of the related interest rate swaps.There was no ineffective portion of the hedges recognized in earnings during the period.
In the fourth quarter of 2010, we terminated an interest rate swap with a notional amount of $50 million inconnection with the partial redemption of the 12% Senior Notes. As a result, we received cash of $2 millionrelated to this termination and recognized a gain of $2 million which partially offset the loss on debt redemptionon the consolidated statement of operations.
Under the terms of most of our outstanding interest rate swap agreements in 2011, we received interest at afixed rate and paid interest at variable rates that were based on the one-month LIBOR. The remaining portion ofour outstanding interest rate swap agreements in 2011 were based on the six-month LIBOR. As a result of ourinterest rate swap agreements, interest expense was reduced by $3 million in 2011 and $5 million in 2010.
Other Derivative Instruments
We may use other derivative instruments from time to time, such as foreign exchange options to manageexposure to foreign exchange rates and interest rate and currency swaps related to access to internationalfinancing transactions. These instruments can potentially limit foreign exchange exposure by swappingborrowings denominated in one currency for borrowings denominated in another currency. At December 31,2011 and 2010, we had no foreign exchange options or interest rate and currency swap agreements outstanding.
See Note 13, “Fair Value Measurements and Other Financial Instruments,” for a discussion of the inputs andvaluation techniques used to determine the fair value of our outstanding derivative instruments.
102
SEALED AIR CORPORATION AND SUBSIDIARIES
Notes to Consolidated Financial Statements — (Continued)
Fair Value of Derivative Instruments
The following table details the fair value of our derivative instruments included on our consolidated balancesheets.
Fair Value of AssetDerivatives(1)
Fair Value of (Liability)Derivatives(1)
December 31,2011
December 31,2010
December 31,2011
December 31,2010
Derivatives designated as hedging instruments:Foreign currency forward contracts (cash flow
hedges) . . . . . . . . . . . . . . . . . . . . . . . . . . . . . . . . . . . $ 0.5 $0.1 $(0.6) $ —
Interest rate swaps (fair value hedges) . . . . . . . . . . . . . 2.1 6.0 — (0.2)
Derivatives not designated as hedging instruments:Foreign currency forward contracts . . . . . . . . . . . . . . . 18.0 0.5 (3.0) (0.8)
Total . . . . . . . . . . . . . . . . . . . . . . . . . . . . . . . . . . . . . . . . . $20.6 $6.6 $(3.6) $(1.0)
(1) Asset derivatives were included in other assets for the foreign currency forward contracts and for the interestrate swaps. Liability derivatives were included in other liabilities for foreign currency forward contracts andfor the interest rate swaps.
The following table details the effect of our derivative instruments on our consolidated statements ofoperations.
Amount ofGain (Loss)
Recognized inEarnings on
Derivatives(1)Year Ended
December 31,
2011 2010
Derivatives designated as hedging instruments:Interest rate swaps . . . . . . . . . . . . . . . . . . . . . . . . . . . . . . . . . . . . . . . . . . . . . . . . . . . . . . $4.1 $ 4.5Foreign currency forward contracts(2) . . . . . . . . . . . . . . . . . . . . . . . . . . . . . . . . . . . . . . 0.4 0.5
Derivatives not designated as hedging instruments:Foreign currency forward contracts(2) . . . . . . . . . . . . . . . . . . . . . . . . . . . . . . . . . . . . . . 5.3 (6.0)
Total . . . . . . . . . . . . . . . . . . . . . . . . . . . . . . . . . . . . . . . . . . . . . . . . . . . . . . . . . . . . . . . . $9.8 $(1.0)
(1) Amounts recognized on the foreign currency forward contracts were included in other expense, net.Amounts recognized on the interest rate swaps were included in interest expense and do not include the gainrecognized from the termination of interest rate swaps in connection with the partial redemption of the12% Senior Notes in 2010.
(2) The net gains and (losses) included above were substantially offset by the net (losses) and gains resultingfrom the remeasurement of the underlying foreign currency denominated items, which are included in otherexpense, net, on the consolidated statement of operations. The underlying foreign currency denominateditems include receivables and payables and interest-bearing intercompany loans and receivables andpayables. See “Foreign Currency Forward Contracts Not Designated as Hedges” above for furtherinformation.
103
SEALED AIR CORPORATION AND SUBSIDIARIES
Notes to Consolidated Financial Statements — (Continued)
Note 13 Fair Value Measurements and Other Financial Instruments
Fair Value Measurements
The fair value of our financial instruments, using the fair value hierarchy under U.S. GAAP detailed in “FairValue Measurements,” of Note 2, “Summary of Significant Accounting Policies and Recently Issued AccountingStandards,” are included in the table below.
December 31, 2011Total
Fair Value Level 1 Level 2 Level 3
Cash equivalents . . . . . . . . . . . . . . . . . . . . . . . . . . . . . . . . . . $148.9 $— $148.9 $—
Derivative financial instruments net asset:Interest rate swaps . . . . . . . . . . . . . . . . . . . . . . . . . . . . . . . $ 2.1 $— $ 2.1 $—
Foreign currency forward contracts . . . . . . . . . . . . . . . . . . $ 14.9 $— $ 14.9 $—
December 31, 2010Total
Fair Value Level 1 Level 2 Level 3
Cash equivalents . . . . . . . . . . . . . . . . . . . . . . . . . . . . . . . . . . $163.4 $53.4 $110.0 $—
Derivative financial instrument net asset: . . . . . . . . . . . . . . .Interest rate swaps $ 5.8 $ — $ 5.8 $—
Derivative financial instrument net liability: . . . . . . . . . . . . .Foreign currency forward contracts . . . . . . . . . . . . . . . . . . $ 0.2 $ — $ 0.2 $—
Cash Equivalents
Our cash equivalents at December 31, 2011 consisted of commercial paper and money market accounts (fairvalue determined using Level 2 inputs). Our cash equivalents at December 31, 2010 consisted of investments inU.S. Treasury obligations (fair value determined using Level 1 inputs) and commercial paper (fair valuedetermined using Level 2 inputs). Since these are short-term highly liquid investments with original maturities ofthree months or less at the date of purchase, they present negligible risk of changes in fair value due to changes ininterest rates.
Derivative Financial Instruments
Our foreign currency forward contracts are recorded at fair value on our consolidated balance sheets usingan income approach valuation technique based on observable market inputs (Level 2).
Observable market inputs used in the calculation of the fair value of foreign currency forward contractsinclude foreign currency spot and forward rates obtained from an independent third party market data provider.In addition, other pricing data quoted by various banks and foreign currency dealers involving identical orcomparable instruments are included.
Our interest rate swaps are recorded at fair value on our consolidated balance sheet using an incomeapproach valuation technique based on observable market inputs (Level 2). Observable market inputs used in thecalculation of the fair value of interest rate swaps include pricing data from counterparties to these swaps, and acomparison is made to other market data including U.S. Treasury yields and swap spreads involving identical orcomparable derivative instruments.
Counterparties to these foreign currency forward contracts and interest rate swaps are rated at least A- byStandard & Poor’s and A3 by Moody’s. None of these counterparties experienced any significant ratingsdowngrades for the year ended December 31, 2011. Credit ratings on some of our counterparties may changeduring the term of our financial instruments. We closely monitor our counterparties’ credit ratings and ifnecessary will make any appropriate changes to our financial instruments. The fair value generally reflects theestimated amounts that we would receive or pay to terminate the contracts at the reporting date.
104
SEALED AIR CORPORATION AND SUBSIDIARIES
Notes to Consolidated Financial Statements — (Continued)
Other Financial Instruments
The following financial instruments are recorded at fair value or at amounts that approximate fair value:(1) receivables, net, (2) certain other current assets, (3) accounts payable and (4) other current liabilities. Thecarrying amounts reported on our consolidated balance sheets for the above financial instruments closelyapproximate their fair value due to the short-term nature of these assets and liabilities.
Other liabilities that are recorded at carrying value on our consolidated balance sheets include our seniornotes. We utilize a market approach to calculate the fair value of our senior notes. Due to their limited investorbase and the face value of some of our senior notes, they may not be actively traded on the date we calculate theirfair value. Therefore, we may utilize prices and other relevant information generated by market transactionsinvolving similar securities, reflecting U.S. Treasury yields to calculate the yield to maturity and the price onsome of our senior notes. These inputs are provided by an independent third party and are considered to be Level2 inputs.
We derive our fair value estimates of our various other debt instruments by evaluating the nature and termsof each instrument, considering prevailing economic and market conditions, and examining the cost of similardebt offered at the balance sheet date. We also incorporated our credit default swap rates and currency specificswap rates in the valuation of each debt instrument, as applicable.
These estimates are subjective and involve uncertainties and matters of significant judgment, and thereforewe cannot determine them with precision. Changes in assumptions could significantly affect our estimates.
The table below shows the carrying amounts and estimated fair values of our total debt:
December 31, 2011 December 31, 2010
CarryingAmount
FairValue
CarryingAmount
FairValue
5.625% Senior Notes due July 2013(1) . . . . . . . . . . . . $ 401.0 $ 414.1 $ 399.4 $ 423.1
12% Senior Notes due February 2014(1) . . . . . . . . . . 156.3 179.8 156.0 196.5
Term Loan A Facility due October 2016(2) . . . . . . . . 989.9 989.9 — —
7.875% Senior Notes due June 2017 . . . . . . . . . . . . . . 393.5 426.0 392.6 438.8
Term Loan B Facility due October 2018(2) . . . . . . . . 1,118.8 1,118.8 — —
8.125% Senior Notes due September 2019 . . . . . . . . . 750.0 824.5 — —
8.375% Senior Notes due September 2021 . . . . . . . . . 750.0 826.9 — —
6.875% Senior Notes due July 2033 . . . . . . . . . . . . . . 448.6 389.3 448.5 415.1
Other foreign loans . . . . . . . . . . . . . . . . . . . . . . . . . . . 37.8 37.4 26.2 26.0
Other domestic loans . . . . . . . . . . . . . . . . . . . . . . . . . . 1.4 1.3 6.5 6.5
Total debt . . . . . . . . . . . . . . . . . . . . . . . . . . . . . . . . . . . $5,047.3 $5,208.0 $1,429.2 $1,506.0
(1) The carrying value and fair value of such debt include adjustments due to interest rate swaps. See Note 12,“Derivatives and Hedging Activities.”
(2) Includes non-U.S. dollar tranches.
Credit and Market Risk
Financial instruments, including derivatives, expose us to counterparty credit risk for nonperformance andto market risk related to changes in interest or currency exchange rates. We manage our exposure to counterpartycredit risk through specific minimum credit standards, establishing credit limits, diversification of counterparties,and procedures to monitor concentrations of credit risk.
105
SEALED AIR CORPORATION AND SUBSIDIARIES
Notes to Consolidated Financial Statements — (Continued)
We do not expect any of our counterparties in derivative transactions to fail to perform as it is our policy tohave counterparties to these contracts that are rated at least A- by Standard & Poor’s and A3 by Moody’s.Nevertheless, there is a risk that our exposure to losses arising out of derivative contracts could be material if thecounterparties to these agreements fail to perform their obligations. We will replace counterparties if a creditdowngrade is deemed to increase our risk to unacceptable levels.
We regularly monitor the impact of market risk on the fair value and cash flows of our derivative and otherfinancial instruments considering reasonably possible changes in interest and currency exchange rates and restrictthe use of derivative financial instruments to hedging activities. We do not use derivative financial instrumentsfor trading or other speculative purposes and do not use leveraged derivative financial instruments.
We continually monitor the creditworthiness of our diverse base of customers to which we grant creditterms in the normal course of business and generally do not require collateral. We consider the concentrations ofcredit risk associated with our trade accounts receivable to be commercially reasonable and believe that suchconcentrations do not leave us vulnerable to significant risks of near-term severe adverse impacts. The terms andconditions of our credit sales are designed to mitigate concentrations of credit risk with any single customer. Oursales are not materially dependent on a single customer or a small group of customers.
Note 14 Profit Sharing, Retirement Savings Plans and Defined Benefit Pension Plans
Profit Sharing and Retirement Savings Plans
Legacy Sealed Air has a qualified non-contributory profit sharing plan covering most of its U.S. employees.Contributions to this plan, which are made at the discretion of our Board of Directors, may be made in cash,shares of our common stock, or in a combination of cash and shares of our common stock. We also maintainqualified contributory retirement savings plans in which most of our U.S. employees are eligible to participate.The qualified contributory retirement savings plans generally provide for our contributions in cash based uponthe amount contributed to the plans by the participants.
Our contributions to or provisions for the profit sharing plan and retirement savings plans are charged tooperations and amounted to $32 million in 2011, $27 million in 2010 and $38 million in 2009. No shares of ourcommon stock were contributed in 2011, while 0.3 million shares were contributed in 2010 as part of ourcontribution to the profit sharing plan. These shares were issued out of treasury stock.
We have various international defined contribution benefit plans which cover certain employees. We haveexpanded use of these plans in select countries where they have been used to supplement or replace definedbenefit plans.
Defined Benefit Pension Plans
We recognize the funded status of each defined pension benefit plan measured as the difference between thefair value of plan assets and the projected benefit obligations of the employee benefit plans on the consolidatedbalance sheet, with a corresponding adjustment to accumulated other comprehensive loss, net of taxes. Eachoverfunded plan is recognized as an asset and each underfunded plan is recognized as a liability on ourconsolidated balance sheets. Subsequent changes in the funded status are recognized in unrecognized pensionitems, a component of accumulated other comprehensive loss, that is included in total stockholders’ equity. Theamount of unamortized pension items is recorded net of tax. The measurement date used by us to determineprojected benefit obligations and plan assets is December 31.
United States
A number of our U.S. employees, including some employees who are covered by collective bargainingagreements, participate in defined benefit pension plans. The following table presents our funded status for 2011
106
SEALED AIR CORPORATION AND SUBSIDIARIES
Notes to Consolidated Financial Statements — (Continued)
and 2010 for our U.S. pension plans. The measurement date for the defined benefit pension plans presentedbelow is December 31 of each period.
2011 2010
Change in benefit obligation:
Projected benefit obligation at beginning of period . . . . . . . . . . . . . . . . . . . . . . . . $ 54.8 $ 55.1
Service cost . . . . . . . . . . . . . . . . . . . . . . . . . . . . . . . . . . . . . . . . . . . . . . . . . . . . . . 1.1 1.0
Interest cost . . . . . . . . . . . . . . . . . . . . . . . . . . . . . . . . . . . . . . . . . . . . . . . . . . . . . . 4.8 2.8
Actuarial (gain) loss . . . . . . . . . . . . . . . . . . . . . . . . . . . . . . . . . . . . . . . . . . . . . . . . 10.2 (1.9)
Benefits paid . . . . . . . . . . . . . . . . . . . . . . . . . . . . . . . . . . . . . . . . . . . . . . . . . . . . . (9.3) (2.2)
Acquisition of Diversey . . . . . . . . . . . . . . . . . . . . . . . . . . . . . . . . . . . . . . . . . . . . . 150.5 —
Projected benefit obligation at end of period . . . . . . . . . . . . . . . . . . . . . . . . . . . . . $212.1 $ 54.8
Change in plan assets:
Fair value of plan assets at beginning of period . . . . . . . . . . . . . . . . . . . . . . . . . . $ 40.8 $ 37.9
Actual gain on plan assets . . . . . . . . . . . . . . . . . . . . . . . . . . . . . . . . . . . . . . . . . . . 7.5 3.9
Employer contributions . . . . . . . . . . . . . . . . . . . . . . . . . . . . . . . . . . . . . . . . . . . . . 4.4 1.2
Benefits paid . . . . . . . . . . . . . . . . . . . . . . . . . . . . . . . . . . . . . . . . . . . . . . . . . . . . . (9.3) (2.2)
Acquisition of Diversey . . . . . . . . . . . . . . . . . . . . . . . . . . . . . . . . . . . . . . . . . . . . . 127.8 —
Fair value of plan assets at end of period . . . . . . . . . . . . . . . . . . . . . . . . . . . . . . . . 171.2 40.8
Underfunded status at end of year . . . . . . . . . . . . . . . . . . . . . . . . . . . . . . . . . . . . . . . $ (40.9) $(14.0)
Amounts included on the consolidated balance sheets consisted of other liabilities of $41 million in 2011and $14.0 million in 2010.
The following table shows the components of our net periodic benefit cost for the three years endedDecember 31, 2011, for our U.S. pension plans charged to operations.
2011 2010 2009
Components of net periodic benefit cost:
Service cost . . . . . . . . . . . . . . . . . . . . . . . . . . . . . . . . . . . . . . . . . . . . . . . . . $ 1.1 $ 1.0 $ 1.5
Interest cost . . . . . . . . . . . . . . . . . . . . . . . . . . . . . . . . . . . . . . . . . . . . . . . . . 4.8 2.8 3.1
Expected return on plan assets . . . . . . . . . . . . . . . . . . . . . . . . . . . . . . . . . . . (5.1) (2.7) (2.6)
Amortization of net prior service cost . . . . . . . . . . . . . . . . . . . . . . . . . . . . . 0.2 0.3 0.5
Amortization of net actuarial loss . . . . . . . . . . . . . . . . . . . . . . . . . . . . . . . . 1.3 1.2 1.4
Net periodic benefit cost . . . . . . . . . . . . . . . . . . . . . . . . . . . . . . . . . . . . . . . $ 2.3 $ 2.6 $ 3.9
The amounts in accumulated other comprehensive loss, net of taxes, that have not yet been recognized ascomponents of net periodic benefit cost at December 31, 2011, are:
Unrecognized prior service costs . . . . . . . . . . . . . . . . . . . . . . . . . . . . . . . . . . . . . . . . . . . . . . . . . $ 0.5
Unrecognized net actuarial loss . . . . . . . . . . . . . . . . . . . . . . . . . . . . . . . . . . . . . . . . . . . . . . . . . . 23.7
Total . . . . . . . . . . . . . . . . . . . . . . . . . . . . . . . . . . . . . . . . . . . . . . . . . . . . . . . . . . . . . . . . . . . . . $24.2
107
SEALED AIR CORPORATION AND SUBSIDIARIES
Notes to Consolidated Financial Statements — (Continued)
Changes in plan assets and benefit obligations recognized in other comprehensive loss in 2011 were asfollows:
Current year actuarial gain . . . . . . . . . . . . . . . . . . . . . . . . . . . . . . . . . . . . . . . . . . . . . . . . . . . . . . $ 7.8
Amortization of actuarial loss . . . . . . . . . . . . . . . . . . . . . . . . . . . . . . . . . . . . . . . . . . . . . . . . . . . . (1.3)
Amortization of prior service cost . . . . . . . . . . . . . . . . . . . . . . . . . . . . . . . . . . . . . . . . . . . . . . . . (0.2)
Total recognized in other comprehensive loss . . . . . . . . . . . . . . . . . . . . . . . . . . . . . . . . . . . . . . . $ 6.3
The amounts in accumulated other comprehensive loss that are expected to be recognized as components ofnet periodic benefit cost during 2012 are as follows:
Unrecognized prior service costs . . . . . . . . . . . . . . . . . . . . . . . . . . . . . . . . . . . . . . . . . . . . . . . . . $ 0.2
Unrecognized net actuarial loss . . . . . . . . . . . . . . . . . . . . . . . . . . . . . . . . . . . . . . . . . . . . . . . . . . 2.0
Total . . . . . . . . . . . . . . . . . . . . . . . . . . . . . . . . . . . . . . . . . . . . . . . . . . . . . . . . . . . . . . . . . . . . . $ 2.2
Information for plans with accumulated benefit obligations in excess of plan assets as of December 31, 2011is as follows:
Accumulated benefit obligation . . . . . . . . . . . . . . . . . . . . . . . . . . . . . . . . . . . . . . . . . . . . . . . . . $207.5
Fair value of plan assets . . . . . . . . . . . . . . . . . . . . . . . . . . . . . . . . . . . . . . . . . . . . . . . . . . . . . . . 171.2
Actuarial Assumptions
Weighted average assumptions used to determine benefit obligations at December 31, 2011 and 2010 wereas follows:
2011 2010
Discount rate . . . . . . . . . . . . . . . . . . . . . . . . . . . . . . . . . . . . . . . . . . . . . . . . . . . . . . . . . . . . 4.6% 5.4%
Rate of compensation increase . . . . . . . . . . . . . . . . . . . . . . . . . . . . . . . . . . . . . . . . . . . . . . 3.5 3.5
Weighted average assumptions used to determine net periodic benefit cost for the three years endedDecember 31, 2011 were as follows:
2011 2010 2009
Discount rate . . . . . . . . . . . . . . . . . . . . . . . . . . . . . . . . . . . . . . . . . . . . . . . . . . . . . 4.9% 5.5% 6.0%
Expected long-term rate of return . . . . . . . . . . . . . . . . . . . . . . . . . . . . . . . . . . . . . 6.7 7.3 8.0
Rate of compensation increase . . . . . . . . . . . . . . . . . . . . . . . . . . . . . . . . . . . . . . . . 3.5 3.5 3.5
Estimated Future Benefit Payments
We expect the following estimated future benefit payments, which reflect expected future service asappropriate, to be paid in the years indicated below:
Year Amount
2012 . . . . . . . . . . . . . . . . . . . . . . . . . . . . . . . . . . . . . . . . . . . . . . . . . . . . . . . . . . . . . . . . . . . . . . $ 11.4
2013 . . . . . . . . . . . . . . . . . . . . . . . . . . . . . . . . . . . . . . . . . . . . . . . . . . . . . . . . . . . . . . . . . . . . . . 12.8
2014 . . . . . . . . . . . . . . . . . . . . . . . . . . . . . . . . . . . . . . . . . . . . . . . . . . . . . . . . . . . . . . . . . . . . . . 11.7
2015 . . . . . . . . . . . . . . . . . . . . . . . . . . . . . . . . . . . . . . . . . . . . . . . . . . . . . . . . . . . . . . . . . . . . . . 12.4
2016 . . . . . . . . . . . . . . . . . . . . . . . . . . . . . . . . . . . . . . . . . . . . . . . . . . . . . . . . . . . . . . . . . . . . . . 14.7
2017 — 2021 . . . . . . . . . . . . . . . . . . . . . . . . . . . . . . . . . . . . . . . . . . . . . . . . . . . . . . . . . . . . . . . 71.7
108
SEALED AIR CORPORATION AND SUBSIDIARIES
Notes to Consolidated Financial Statements — (Continued)
We expect to contribute approximately $4 million of cash to our U.S. defined benefit plans in 2012.
Plan Assets
We review the expected long-term rate of return on plan assets annually, taking into consideration our assetallocation, historical returns, and the current economic environment.
Our long-term objectives for plan investments are to ensure that (a) there is an adequate level of assets tosupport benefit obligations to participants over the life of the plans, (b) there is sufficient liquidity in plan assetsto cover current benefit obligations, and (c) there is a high level of investment return consistent with a prudentlevel of investment risk. The investment strategy is focused on a long-term total return in excess of a pure fixedincome strategy with short-term volatility less than that of a pure equity strategy. To accomplish this objective,we cause assets to be invested in a balanced and diversified mix of equity and fixed income investments. Thetarget asset allocation will typically be 40-50% in equity securities, with a maximum equity allocation of 70%,and 50-60% in fixed income securities, with a minimum fixed income allocation of 30% including cash.
The fair values of our U.S. pension plan assets, by asset category and by the level of fair values at December31, 2011, are as follows:
Asset CategoryTotal
Fair Value Level 1 Level 2 Level 3
Cash and cash equivalents(1) . . . . . . . . . . . . . . . . . . . . . . . . . $ 4.2 $— $ 4.2 $ —
Fixed income funds (2) . . . . . . . . . . . . . . . . . . . . . . . . . . . . . 96.4 — 96.4 —
Equity funds (3) . . . . . . . . . . . . . . . . . . . . . . . . . . . . . . . . . . . 64.8 — 64.8 —
Other (4) . . . . . . . . . . . . . . . . . . . . . . . . . . . . . . . . . . . . . . . . . 5.8 — 0.5 5.3
Total . . . . . . . . . . . . . . . . . . . . . . . . . . . . . . . . . . . . . . . . . . . . $171.2 $— $165.9 $5.3
(1) Short-term investment fund that invests in a collective trust that holds short-term highly liquid investmentswith principal preservation and daily liquidity as its primary objectives. Investments are primarilycomprised of certificates of deposit, U.S. government treasuries, commercial paper, and time deposits.
(2) A diversified portfolio of publicly traded government bonds, corporate bonds, and mortgage-backedsecurities. There are no restrictions on these investments and they are valued at the net asset value of theshares held at year end, which are supported by the value of the underlying securities and by the unit pricesof actual purchase and sale transactions occurring as of or close to the financial statement date.
(3) A diversified portfolio of publicly traded domestic and international common stock. There are norestrictions on these investments, and they are valued at the net asset value of the shares held at year end,which are supported by the values of the underlying securities and by the unit prices of actual purchase andsale transactions occurring as of or close to the financial statement date.
(4) More than 90% is invested in real estate funds with less than $0.5 million invested in alternative investmentssuch as private equity funds, hedge funds and commodities. The level 3 amount were from Diversey’s plans.
109
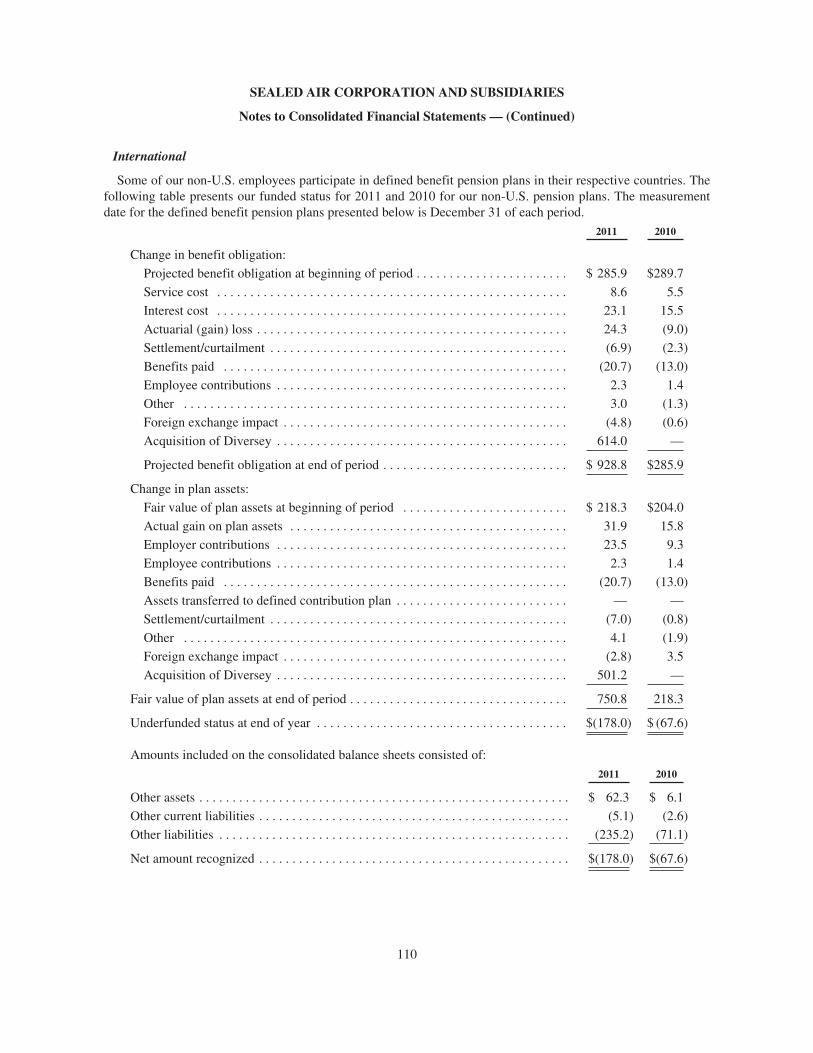
SEALED AIR CORPORATION AND SUBSIDIARIES
Notes to Consolidated Financial Statements — (Continued)
International
Some of our non-U.S. employees participate in defined benefit pension plans in their respective countries. Thefollowing table presents our funded status for 2011 and 2010 for our non-U.S. pension plans. The measurementdate for the defined benefit pension plans presented below is December 31 of each period.
2011 2010
Change in benefit obligation:
Projected benefit obligation at beginning of period . . . . . . . . . . . . . . . . . . . . . . . $ 285.9 $289.7
Service cost . . . . . . . . . . . . . . . . . . . . . . . . . . . . . . . . . . . . . . . . . . . . . . . . . . . . . 8.6 5.5
Interest cost . . . . . . . . . . . . . . . . . . . . . . . . . . . . . . . . . . . . . . . . . . . . . . . . . . . . . 23.1 15.5
Actuarial (gain) loss . . . . . . . . . . . . . . . . . . . . . . . . . . . . . . . . . . . . . . . . . . . . . . . 24.3 (9.0)
Settlement/curtailment . . . . . . . . . . . . . . . . . . . . . . . . . . . . . . . . . . . . . . . . . . . . . (6.9) (2.3)
Benefits paid . . . . . . . . . . . . . . . . . . . . . . . . . . . . . . . . . . . . . . . . . . . . . . . . . . . . (20.7) (13.0)
Employee contributions . . . . . . . . . . . . . . . . . . . . . . . . . . . . . . . . . . . . . . . . . . . . 2.3 1.4
Other . . . . . . . . . . . . . . . . . . . . . . . . . . . . . . . . . . . . . . . . . . . . . . . . . . . . . . . . . . 3.0 (1.3)
Foreign exchange impact . . . . . . . . . . . . . . . . . . . . . . . . . . . . . . . . . . . . . . . . . . . (4.8) (0.6)
Acquisition of Diversey . . . . . . . . . . . . . . . . . . . . . . . . . . . . . . . . . . . . . . . . . . . . 614.0 —
Projected benefit obligation at end of period . . . . . . . . . . . . . . . . . . . . . . . . . . . . $ 928.8 $285.9
Change in plan assets:
Fair value of plan assets at beginning of period . . . . . . . . . . . . . . . . . . . . . . . . . $ 218.3 $204.0
Actual gain on plan assets . . . . . . . . . . . . . . . . . . . . . . . . . . . . . . . . . . . . . . . . . . 31.9 15.8
Employer contributions . . . . . . . . . . . . . . . . . . . . . . . . . . . . . . . . . . . . . . . . . . . . 23.5 9.3
Employee contributions . . . . . . . . . . . . . . . . . . . . . . . . . . . . . . . . . . . . . . . . . . . . 2.3 1.4
Benefits paid . . . . . . . . . . . . . . . . . . . . . . . . . . . . . . . . . . . . . . . . . . . . . . . . . . . . (20.7) (13.0)
Assets transferred to defined contribution plan . . . . . . . . . . . . . . . . . . . . . . . . . . — —
Settlement/curtailment . . . . . . . . . . . . . . . . . . . . . . . . . . . . . . . . . . . . . . . . . . . . . (7.0) (0.8)
Other . . . . . . . . . . . . . . . . . . . . . . . . . . . . . . . . . . . . . . . . . . . . . . . . . . . . . . . . . . 4.1 (1.9)
Foreign exchange impact . . . . . . . . . . . . . . . . . . . . . . . . . . . . . . . . . . . . . . . . . . . (2.8) 3.5
Acquisition of Diversey . . . . . . . . . . . . . . . . . . . . . . . . . . . . . . . . . . . . . . . . . . . . 501.2 —
Fair value of plan assets at end of period . . . . . . . . . . . . . . . . . . . . . . . . . . . . . . . . . 750.8 218.3
Underfunded status at end of year . . . . . . . . . . . . . . . . . . . . . . . . . . . . . . . . . . . . . . $(178.0) $ (67.6)
Amounts included on the consolidated balance sheets consisted of:
2011 2010
Other assets . . . . . . . . . . . . . . . . . . . . . . . . . . . . . . . . . . . . . . . . . . . . . . . . . . . . . . . . $ 62.3 $ 6.1
Other current liabilities . . . . . . . . . . . . . . . . . . . . . . . . . . . . . . . . . . . . . . . . . . . . . . . (5.1) (2.6)
Other liabilities . . . . . . . . . . . . . . . . . . . . . . . . . . . . . . . . . . . . . . . . . . . . . . . . . . . . . (235.2) (71.1)
Net amount recognized . . . . . . . . . . . . . . . . . . . . . . . . . . . . . . . . . . . . . . . . . . . . . . . $(178.0) $(67.6)
110
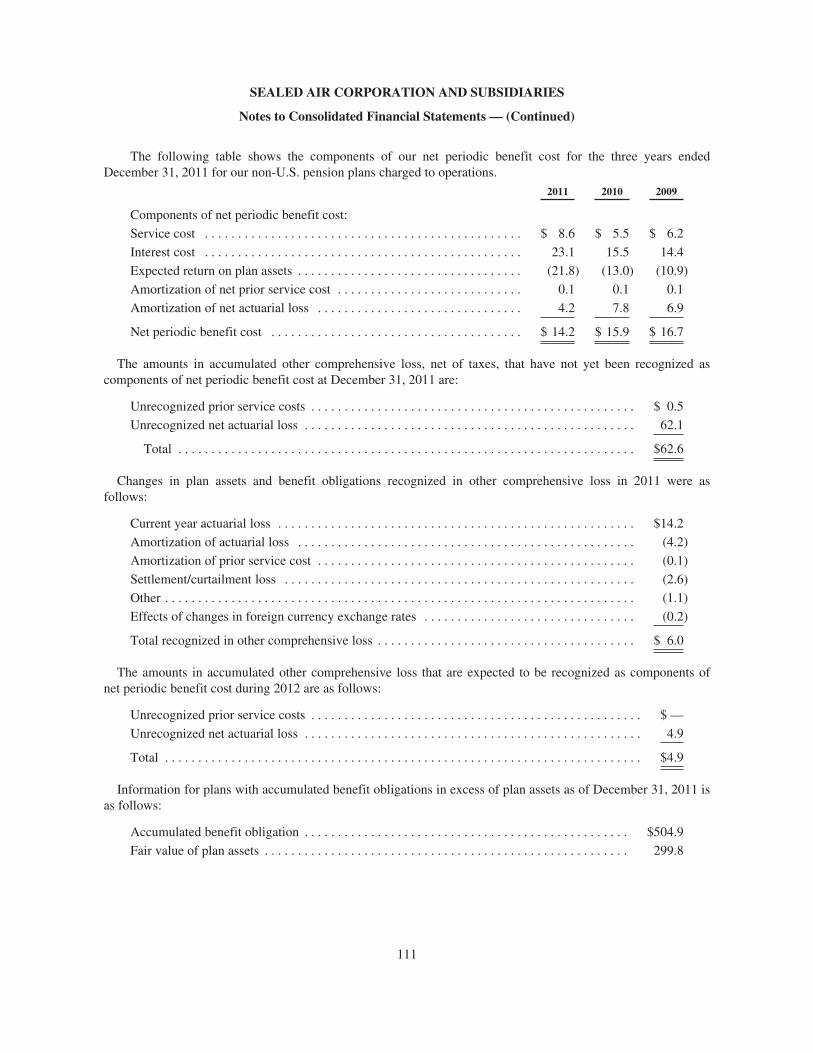
SEALED AIR CORPORATION AND SUBSIDIARIES
Notes to Consolidated Financial Statements — (Continued)
The following table shows the components of our net periodic benefit cost for the three years endedDecember 31, 2011 for our non-U.S. pension plans charged to operations.
2011 2010 2009
Components of net periodic benefit cost:
Service cost . . . . . . . . . . . . . . . . . . . . . . . . . . . . . . . . . . . . . . . . . . . . . . . . $ 8.6 $ 5.5 $ 6.2
Interest cost . . . . . . . . . . . . . . . . . . . . . . . . . . . . . . . . . . . . . . . . . . . . . . . . 23.1 15.5 14.4
Expected return on plan assets . . . . . . . . . . . . . . . . . . . . . . . . . . . . . . . . . . (21.8) (13.0) (10.9)
Amortization of net prior service cost . . . . . . . . . . . . . . . . . . . . . . . . . . . . 0.1 0.1 0.1
Amortization of net actuarial loss . . . . . . . . . . . . . . . . . . . . . . . . . . . . . . . 4.2 7.8 6.9
Net periodic benefit cost . . . . . . . . . . . . . . . . . . . . . . . . . . . . . . . . . . . . . . $ 14.2 $ 15.9 $ 16.7
The amounts in accumulated other comprehensive loss, net of taxes, that have not yet been recognized ascomponents of net periodic benefit cost at December 31, 2011 are:
Unrecognized prior service costs . . . . . . . . . . . . . . . . . . . . . . . . . . . . . . . . . . . . . . . . . . . . . . . . . $ 0.5
Unrecognized net actuarial loss . . . . . . . . . . . . . . . . . . . . . . . . . . . . . . . . . . . . . . . . . . . . . . . . . . 62.1
Total . . . . . . . . . . . . . . . . . . . . . . . . . . . . . . . . . . . . . . . . . . . . . . . . . . . . . . . . . . . . . . . . . . . . . $62.6
Changes in plan assets and benefit obligations recognized in other comprehensive loss in 2011 were asfollows:
Current year actuarial loss . . . . . . . . . . . . . . . . . . . . . . . . . . . . . . . . . . . . . . . . . . . . . . . . . . . . . . $14.2
Amortization of actuarial loss . . . . . . . . . . . . . . . . . . . . . . . . . . . . . . . . . . . . . . . . . . . . . . . . . . . (4.2)
Amortization of prior service cost . . . . . . . . . . . . . . . . . . . . . . . . . . . . . . . . . . . . . . . . . . . . . . . . (0.1)
Settlement/curtailment loss . . . . . . . . . . . . . . . . . . . . . . . . . . . . . . . . . . . . . . . . . . . . . . . . . . . . . (2.6)
Other . . . . . . . . . . . . . . . . . . . . . . . . . . . . . . . . . . . . . . . . . . . . . . . . . . . . . . . . . . . . . . . . . . . . . . . (1.1)
Effects of changes in foreign currency exchange rates . . . . . . . . . . . . . . . . . . . . . . . . . . . . . . . . (0.2)
Total recognized in other comprehensive loss . . . . . . . . . . . . . . . . . . . . . . . . . . . . . . . . . . . . . . . $ 6.0
The amounts in accumulated other comprehensive loss that are expected to be recognized as components ofnet periodic benefit cost during 2012 are as follows:
Unrecognized prior service costs . . . . . . . . . . . . . . . . . . . . . . . . . . . . . . . . . . . . . . . . . . . . . . . . . . $ —
Unrecognized net actuarial loss . . . . . . . . . . . . . . . . . . . . . . . . . . . . . . . . . . . . . . . . . . . . . . . . . . . 4.9
Total . . . . . . . . . . . . . . . . . . . . . . . . . . . . . . . . . . . . . . . . . . . . . . . . . . . . . . . . . . . . . . . . . . . . . . . . $4.9
Information for plans with accumulated benefit obligations in excess of plan assets as of December 31, 2011 isas follows:
Accumulated benefit obligation . . . . . . . . . . . . . . . . . . . . . . . . . . . . . . . . . . . . . . . . . . . . . . . . . $504.9
Fair value of plan assets . . . . . . . . . . . . . . . . . . . . . . . . . . . . . . . . . . . . . . . . . . . . . . . . . . . . . . . 299.8
111
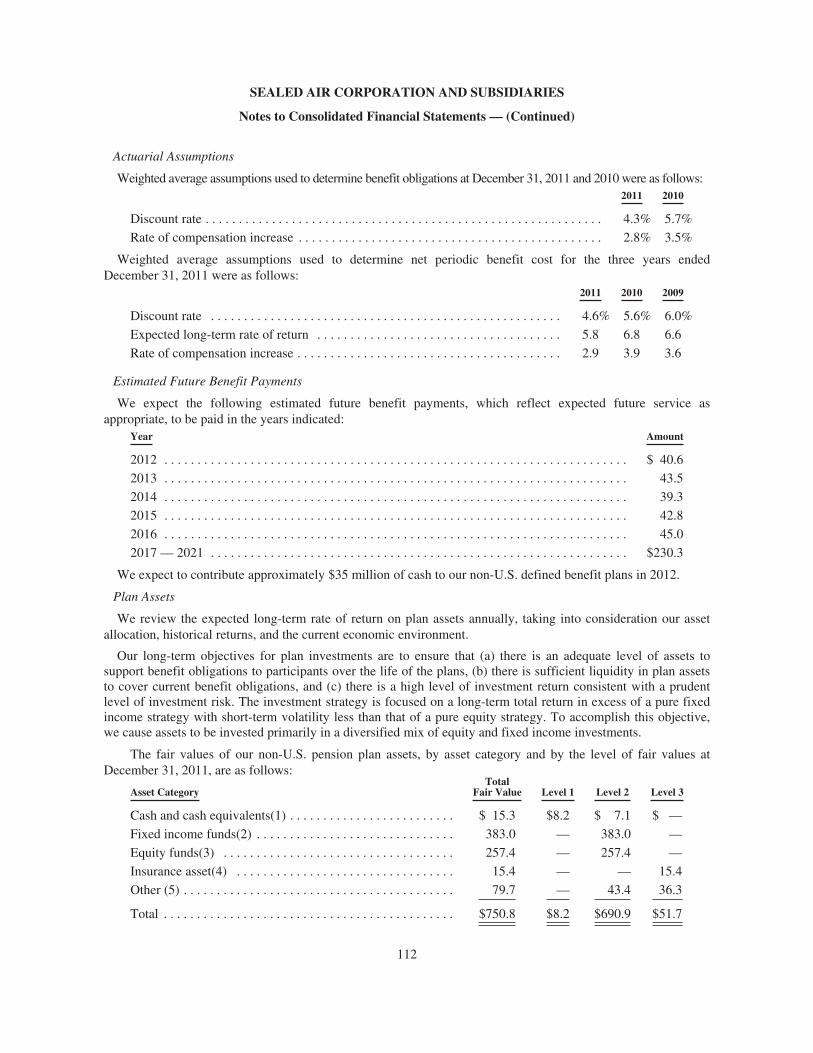
SEALED AIR CORPORATION AND SUBSIDIARIES
Notes to Consolidated Financial Statements — (Continued)
Actuarial Assumptions
Weighted average assumptions used to determine benefit obligations at December 31, 2011 and 2010 were as follows:2011 2010
Discount rate . . . . . . . . . . . . . . . . . . . . . . . . . . . . . . . . . . . . . . . . . . . . . . . . . . . . . . . . . . . . 4.3% 5.7%
Rate of compensation increase . . . . . . . . . . . . . . . . . . . . . . . . . . . . . . . . . . . . . . . . . . . . . . 2.8% 3.5%
Weighted average assumptions used to determine net periodic benefit cost for the three years endedDecember 31, 2011 were as follows:
2011 2010 2009
Discount rate . . . . . . . . . . . . . . . . . . . . . . . . . . . . . . . . . . . . . . . . . . . . . . . . . . . . . 4.6% 5.6% 6.0%
Expected long-term rate of return . . . . . . . . . . . . . . . . . . . . . . . . . . . . . . . . . . . . . 5.8 6.8 6.6
Rate of compensation increase . . . . . . . . . . . . . . . . . . . . . . . . . . . . . . . . . . . . . . . . 2.9 3.9 3.6
Estimated Future Benefit Payments
We expect the following estimated future benefit payments, which reflect expected future service asappropriate, to be paid in the years indicated:
Year Amount
2012 . . . . . . . . . . . . . . . . . . . . . . . . . . . . . . . . . . . . . . . . . . . . . . . . . . . . . . . . . . . . . . . . . . . . . . $ 40.6
2013 . . . . . . . . . . . . . . . . . . . . . . . . . . . . . . . . . . . . . . . . . . . . . . . . . . . . . . . . . . . . . . . . . . . . . . 43.5
2014 . . . . . . . . . . . . . . . . . . . . . . . . . . . . . . . . . . . . . . . . . . . . . . . . . . . . . . . . . . . . . . . . . . . . . . 39.3
2015 . . . . . . . . . . . . . . . . . . . . . . . . . . . . . . . . . . . . . . . . . . . . . . . . . . . . . . . . . . . . . . . . . . . . . . 42.8
2016 . . . . . . . . . . . . . . . . . . . . . . . . . . . . . . . . . . . . . . . . . . . . . . . . . . . . . . . . . . . . . . . . . . . . . . 45.0
2017 — 2021 . . . . . . . . . . . . . . . . . . . . . . . . . . . . . . . . . . . . . . . . . . . . . . . . . . . . . . . . . . . . . . . $230.3
We expect to contribute approximately $35 million of cash to our non-U.S. defined benefit plans in 2012.
Plan Assets
We review the expected long-term rate of return on plan assets annually, taking into consideration our assetallocation, historical returns, and the current economic environment.
Our long-term objectives for plan investments are to ensure that (a) there is an adequate level of assets tosupport benefit obligations to participants over the life of the plans, (b) there is sufficient liquidity in plan assetsto cover current benefit obligations, and (c) there is a high level of investment return consistent with a prudentlevel of investment risk. The investment strategy is focused on a long-term total return in excess of a pure fixedincome strategy with short-term volatility less than that of a pure equity strategy. To accomplish this objective,we cause assets to be invested primarily in a diversified mix of equity and fixed income investments.
The fair values of our non-U.S. pension plan assets, by asset category and by the level of fair values atDecember 31, 2011, are as follows:
Asset CategoryTotal
Fair Value Level 1 Level 2 Level 3
Cash and cash equivalents(1) . . . . . . . . . . . . . . . . . . . . . . . . . $ 15.3 $8.2 $ 7.1 $ —
Fixed income funds(2) . . . . . . . . . . . . . . . . . . . . . . . . . . . . . . 383.0 — 383.0 —
Equity funds(3) . . . . . . . . . . . . . . . . . . . . . . . . . . . . . . . . . . . 257.4 — 257.4 —
Insurance asset(4) . . . . . . . . . . . . . . . . . . . . . . . . . . . . . . . . . 15.4 — — 15.4
Other (5) . . . . . . . . . . . . . . . . . . . . . . . . . . . . . . . . . . . . . . . . . 79.7 — 43.4 36.3
Total . . . . . . . . . . . . . . . . . . . . . . . . . . . . . . . . . . . . . . . . . . . . $750.8 $8.2 $690.9 $51.7
112
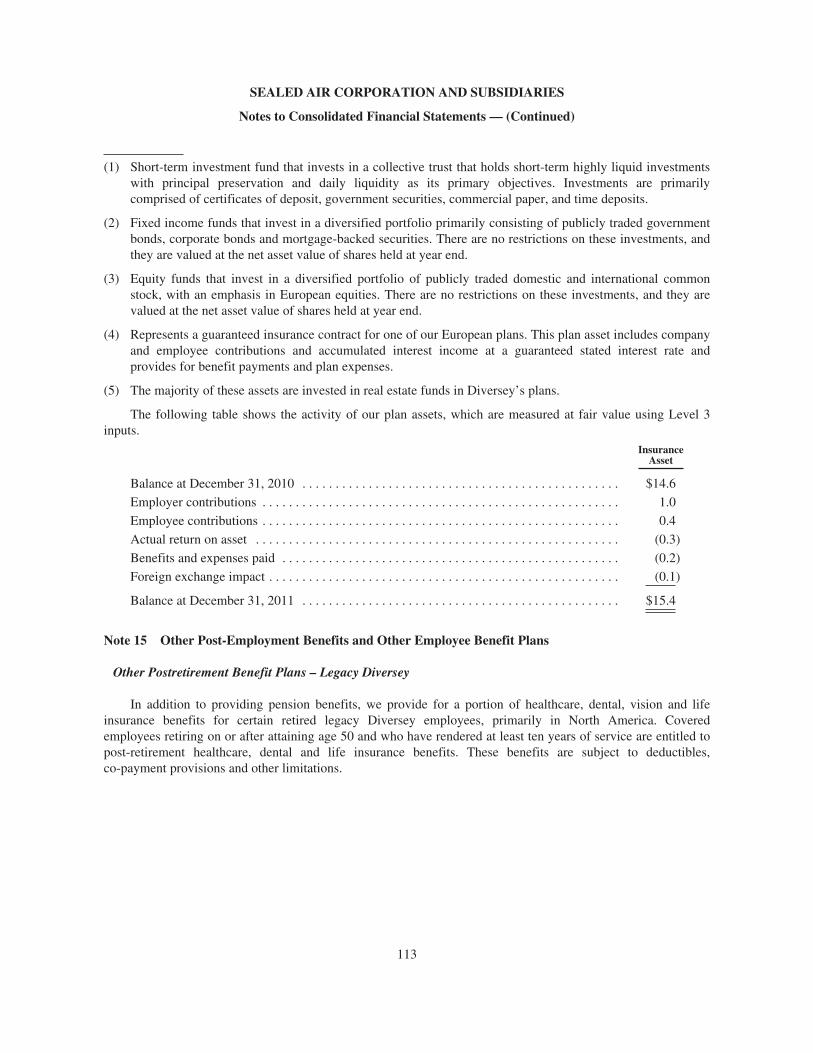
SEALED AIR CORPORATION AND SUBSIDIARIES
Notes to Consolidated Financial Statements — (Continued)
(1) Short-term investment fund that invests in a collective trust that holds short-term highly liquid investmentswith principal preservation and daily liquidity as its primary objectives. Investments are primarilycomprised of certificates of deposit, government securities, commercial paper, and time deposits.
(2) Fixed income funds that invest in a diversified portfolio primarily consisting of publicly traded governmentbonds, corporate bonds and mortgage-backed securities. There are no restrictions on these investments, andthey are valued at the net asset value of shares held at year end.
(3) Equity funds that invest in a diversified portfolio of publicly traded domestic and international commonstock, with an emphasis in European equities. There are no restrictions on these investments, and they arevalued at the net asset value of shares held at year end.
(4) Represents a guaranteed insurance contract for one of our European plans. This plan asset includes companyand employee contributions and accumulated interest income at a guaranteed stated interest rate andprovides for benefit payments and plan expenses.
(5) The majority of these assets are invested in real estate funds in Diversey’s plans.
The following table shows the activity of our plan assets, which are measured at fair value using Level 3inputs.
InsuranceAsset
Balance at December 31, 2010 . . . . . . . . . . . . . . . . . . . . . . . . . . . . . . . . . . . . . . . . . . . . . . . . $14.6
Employer contributions . . . . . . . . . . . . . . . . . . . . . . . . . . . . . . . . . . . . . . . . . . . . . . . . . . . . . . 1.0
Employee contributions . . . . . . . . . . . . . . . . . . . . . . . . . . . . . . . . . . . . . . . . . . . . . . . . . . . . . . 0.4
Actual return on asset . . . . . . . . . . . . . . . . . . . . . . . . . . . . . . . . . . . . . . . . . . . . . . . . . . . . . . . (0.3)
Benefits and expenses paid . . . . . . . . . . . . . . . . . . . . . . . . . . . . . . . . . . . . . . . . . . . . . . . . . . . (0.2)
Foreign exchange impact . . . . . . . . . . . . . . . . . . . . . . . . . . . . . . . . . . . . . . . . . . . . . . . . . . . . . (0.1)
Balance at December 31, 2011 . . . . . . . . . . . . . . . . . . . . . . . . . . . . . . . . . . . . . . . . . . . . . . . . $15.4
Note 15 Other Post-Employment Benefits and Other Employee Benefit Plans
Other Postretirement Benefit Plans – Legacy Diversey
In addition to providing pension benefits, we provide for a portion of healthcare, dental, vision and lifeinsurance benefits for certain retired legacy Diversey employees, primarily in North America. Coveredemployees retiring on or after attaining age 50 and who have rendered at least ten years of service are entitled topost-retirement healthcare, dental and life insurance benefits. These benefits are subject to deductibles,co-payment provisions and other limitations.
113
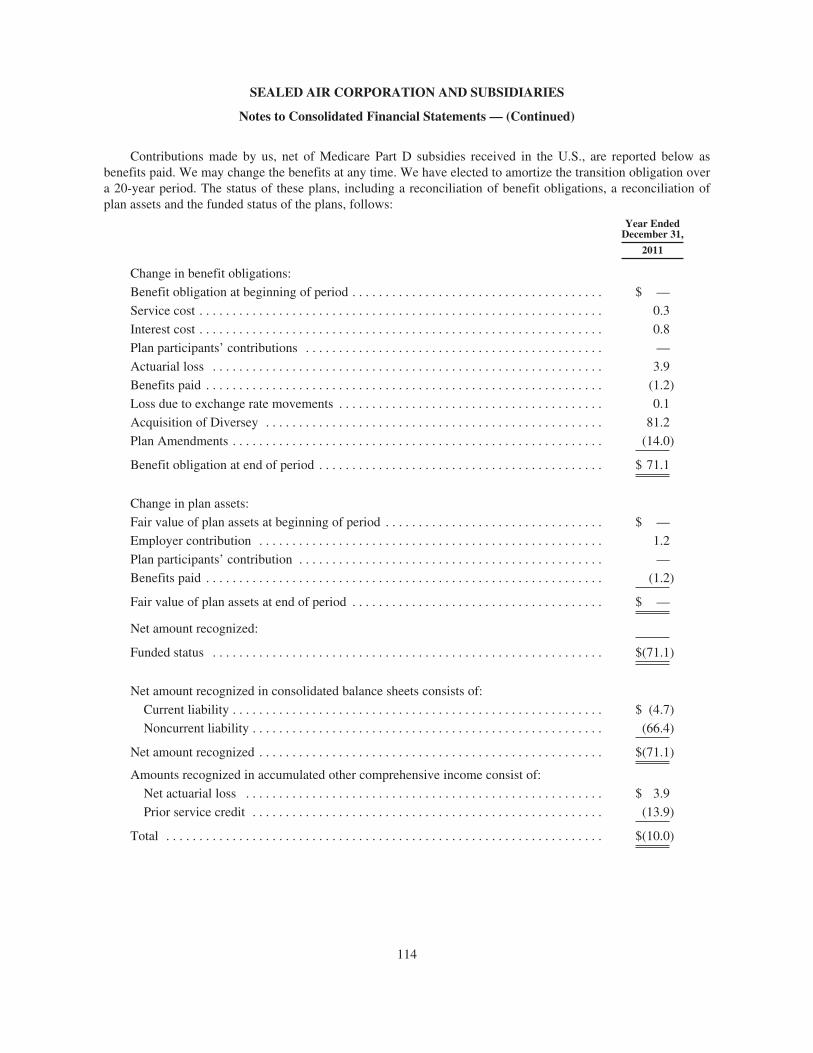
SEALED AIR CORPORATION AND SUBSIDIARIES
Notes to Consolidated Financial Statements — (Continued)
Contributions made by us, net of Medicare Part D subsidies received in the U.S., are reported below asbenefits paid. We may change the benefits at any time. We have elected to amortize the transition obligation overa 20-year period. The status of these plans, including a reconciliation of benefit obligations, a reconciliation ofplan assets and the funded status of the plans, follows:
Year EndedDecember 31,
2011
Change in benefit obligations:
Benefit obligation at beginning of period . . . . . . . . . . . . . . . . . . . . . . . . . . . . . . . . . . . . . . $ —
Service cost . . . . . . . . . . . . . . . . . . . . . . . . . . . . . . . . . . . . . . . . . . . . . . . . . . . . . . . . . . . . . 0.3
Interest cost . . . . . . . . . . . . . . . . . . . . . . . . . . . . . . . . . . . . . . . . . . . . . . . . . . . . . . . . . . . . . 0.8
Plan participants’ contributions . . . . . . . . . . . . . . . . . . . . . . . . . . . . . . . . . . . . . . . . . . . . . —
Actuarial loss . . . . . . . . . . . . . . . . . . . . . . . . . . . . . . . . . . . . . . . . . . . . . . . . . . . . . . . . . . . 3.9
Benefits paid . . . . . . . . . . . . . . . . . . . . . . . . . . . . . . . . . . . . . . . . . . . . . . . . . . . . . . . . . . . . (1.2)
Loss due to exchange rate movements . . . . . . . . . . . . . . . . . . . . . . . . . . . . . . . . . . . . . . . . 0.1
Acquisition of Diversey . . . . . . . . . . . . . . . . . . . . . . . . . . . . . . . . . . . . . . . . . . . . . . . . . . . 81.2
Plan Amendments . . . . . . . . . . . . . . . . . . . . . . . . . . . . . . . . . . . . . . . . . . . . . . . . . . . . . . . . (14.0)
Benefit obligation at end of period . . . . . . . . . . . . . . . . . . . . . . . . . . . . . . . . . . . . . . . . . . . $ 71.1
Change in plan assets:
Fair value of plan assets at beginning of period . . . . . . . . . . . . . . . . . . . . . . . . . . . . . . . . . $ —
Employer contribution . . . . . . . . . . . . . . . . . . . . . . . . . . . . . . . . . . . . . . . . . . . . . . . . . . . . 1.2
Plan participants’ contribution . . . . . . . . . . . . . . . . . . . . . . . . . . . . . . . . . . . . . . . . . . . . . . —
Benefits paid . . . . . . . . . . . . . . . . . . . . . . . . . . . . . . . . . . . . . . . . . . . . . . . . . . . . . . . . . . . . (1.2)
Fair value of plan assets at end of period . . . . . . . . . . . . . . . . . . . . . . . . . . . . . . . . . . . . . . $ —
Net amount recognized:
Funded status . . . . . . . . . . . . . . . . . . . . . . . . . . . . . . . . . . . . . . . . . . . . . . . . . . . . . . . . . . . $(71.1)
Net amount recognized in consolidated balance sheets consists of:
Current liability . . . . . . . . . . . . . . . . . . . . . . . . . . . . . . . . . . . . . . . . . . . . . . . . . . . . . . . . $ (4.7)
Noncurrent liability . . . . . . . . . . . . . . . . . . . . . . . . . . . . . . . . . . . . . . . . . . . . . . . . . . . . . (66.4)
Net amount recognized . . . . . . . . . . . . . . . . . . . . . . . . . . . . . . . . . . . . . . . . . . . . . . . . . . . . $(71.1)
Amounts recognized in accumulated other comprehensive income consist of:
Net actuarial loss . . . . . . . . . . . . . . . . . . . . . . . . . . . . . . . . . . . . . . . . . . . . . . . . . . . . . . $ 3.9
Prior service credit . . . . . . . . . . . . . . . . . . . . . . . . . . . . . . . . . . . . . . . . . . . . . . . . . . . . . (13.9)
Total . . . . . . . . . . . . . . . . . . . . . . . . . . . . . . . . . . . . . . . . . . . . . . . . . . . . . . . . . . . . . . . . . . $(10.0)
114
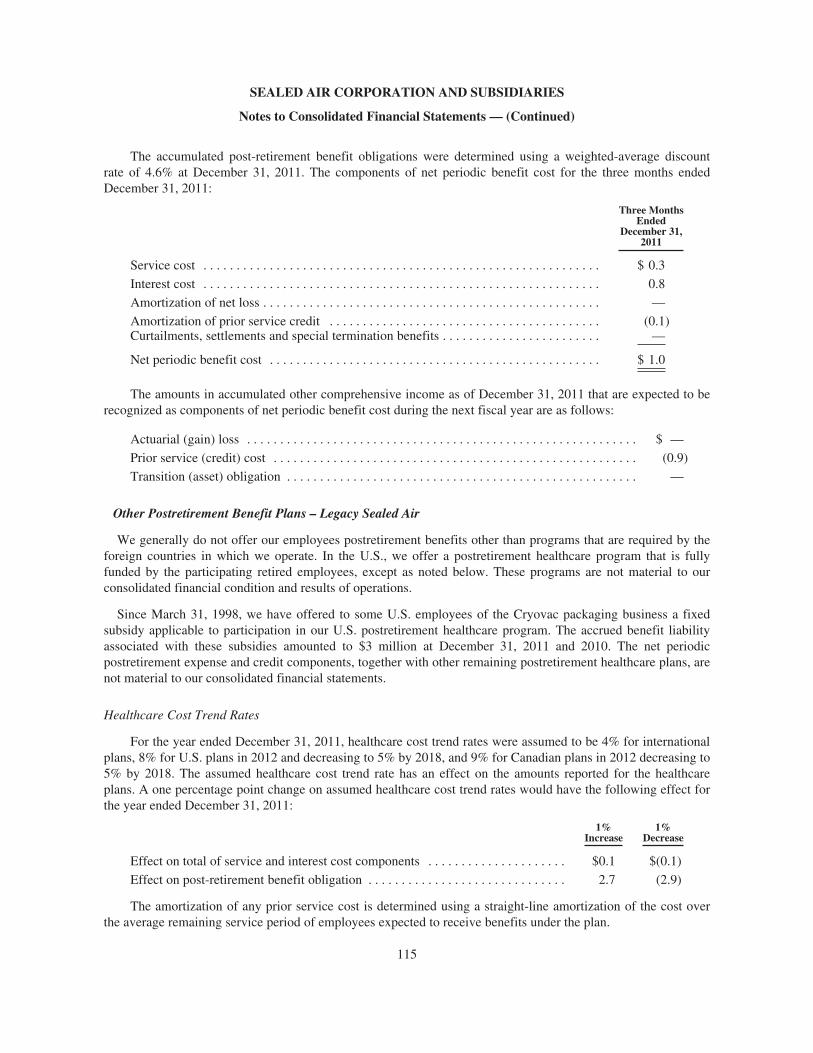
SEALED AIR CORPORATION AND SUBSIDIARIES
Notes to Consolidated Financial Statements — (Continued)
The accumulated post-retirement benefit obligations were determined using a weighted-average discountrate of 4.6% at December 31, 2011. The components of net periodic benefit cost for the three months endedDecember 31, 2011:
Three MonthsEnded
December 31,2011
Service cost . . . . . . . . . . . . . . . . . . . . . . . . . . . . . . . . . . . . . . . . . . . . . . . . . . . . . . . . . . . . $ 0.3
Interest cost . . . . . . . . . . . . . . . . . . . . . . . . . . . . . . . . . . . . . . . . . . . . . . . . . . . . . . . . . . . . 0.8
Amortization of net loss . . . . . . . . . . . . . . . . . . . . . . . . . . . . . . . . . . . . . . . . . . . . . . . . . . . —
Amortization of prior service credit . . . . . . . . . . . . . . . . . . . . . . . . . . . . . . . . . . . . . . . . . (0.1)Curtailments, settlements and special termination benefits . . . . . . . . . . . . . . . . . . . . . . . . —
Net periodic benefit cost . . . . . . . . . . . . . . . . . . . . . . . . . . . . . . . . . . . . . . . . . . . . . . . . . . $ 1.0
The amounts in accumulated other comprehensive income as of December 31, 2011 that are expected to berecognized as components of net periodic benefit cost during the next fiscal year are as follows:
Actuarial (gain) loss . . . . . . . . . . . . . . . . . . . . . . . . . . . . . . . . . . . . . . . . . . . . . . . . . . . . . . . . . . . $ —
Prior service (credit) cost . . . . . . . . . . . . . . . . . . . . . . . . . . . . . . . . . . . . . . . . . . . . . . . . . . . . . . . (0.9)
Transition (asset) obligation . . . . . . . . . . . . . . . . . . . . . . . . . . . . . . . . . . . . . . . . . . . . . . . . . . . . . —
Other Postretirement Benefit Plans – Legacy Sealed Air
We generally do not offer our employees postretirement benefits other than programs that are required by theforeign countries in which we operate. In the U.S., we offer a postretirement healthcare program that is fullyfunded by the participating retired employees, except as noted below. These programs are not material to ourconsolidated financial condition and results of operations.
Since March 31, 1998, we have offered to some U.S. employees of the Cryovac packaging business a fixedsubsidy applicable to participation in our U.S. postretirement healthcare program. The accrued benefit liabilityassociated with these subsidies amounted to $3 million at December 31, 2011 and 2010. The net periodicpostretirement expense and credit components, together with other remaining postretirement healthcare plans, arenot material to our consolidated financial statements.
Healthcare Cost Trend Rates
For the year ended December 31, 2011, healthcare cost trend rates were assumed to be 4% for internationalplans, 8% for U.S. plans in 2012 and decreasing to 5% by 2018, and 9% for Canadian plans in 2012 decreasing to5% by 2018. The assumed healthcare cost trend rate has an effect on the amounts reported for the healthcareplans. A one percentage point change on assumed healthcare cost trend rates would have the following effect forthe year ended December 31, 2011:
1%Increase
1%Decrease
Effect on total of service and interest cost components . . . . . . . . . . . . . . . . . . . . . $0.1 $(0.1)
Effect on post-retirement benefit obligation . . . . . . . . . . . . . . . . . . . . . . . . . . . . . . 2.7 (2.9)
The amortization of any prior service cost is determined using a straight-line amortization of the cost overthe average remaining service period of employees expected to receive benefits under the plan.
115
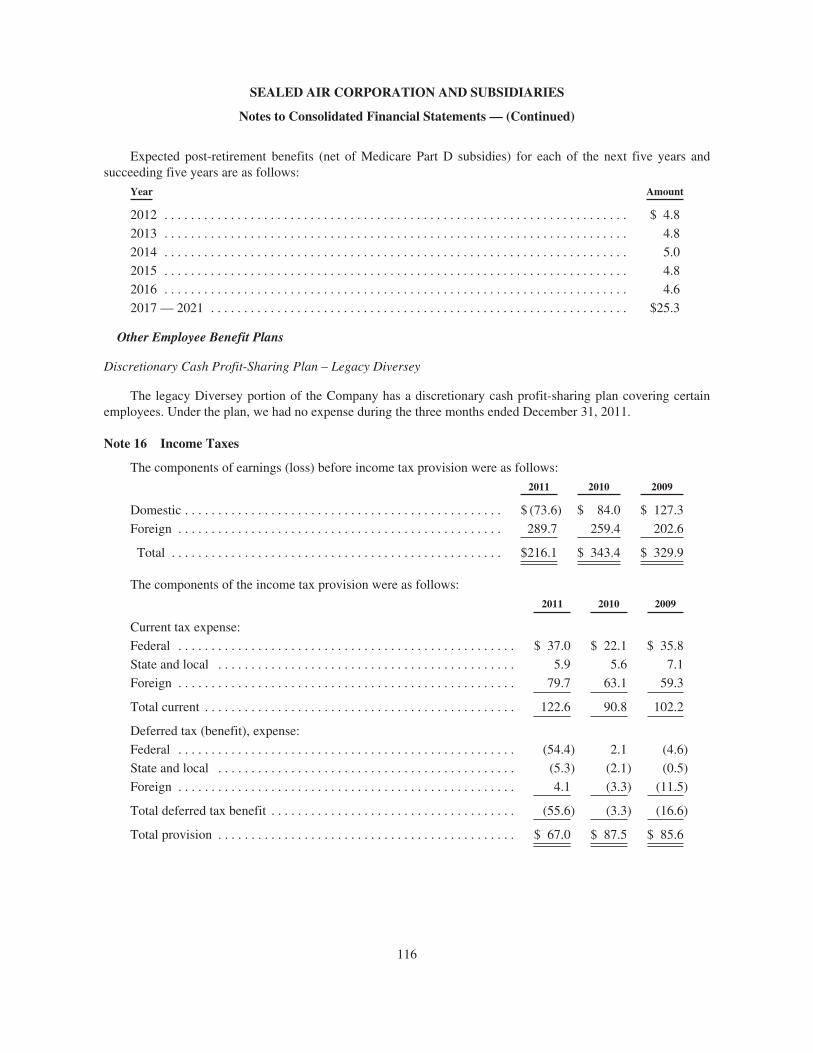
SEALED AIR CORPORATION AND SUBSIDIARIES
Notes to Consolidated Financial Statements — (Continued)
Expected post-retirement benefits (net of Medicare Part D subsidies) for each of the next five years andsucceeding five years are as follows:
Year Amount
2012 . . . . . . . . . . . . . . . . . . . . . . . . . . . . . . . . . . . . . . . . . . . . . . . . . . . . . . . . . . . . . . . . . . . . . . $ 4.8
2013 . . . . . . . . . . . . . . . . . . . . . . . . . . . . . . . . . . . . . . . . . . . . . . . . . . . . . . . . . . . . . . . . . . . . . . 4.8
2014 . . . . . . . . . . . . . . . . . . . . . . . . . . . . . . . . . . . . . . . . . . . . . . . . . . . . . . . . . . . . . . . . . . . . . . 5.0
2015 . . . . . . . . . . . . . . . . . . . . . . . . . . . . . . . . . . . . . . . . . . . . . . . . . . . . . . . . . . . . . . . . . . . . . . 4.8
2016 . . . . . . . . . . . . . . . . . . . . . . . . . . . . . . . . . . . . . . . . . . . . . . . . . . . . . . . . . . . . . . . . . . . . . . 4.6
2017 — 2021 . . . . . . . . . . . . . . . . . . . . . . . . . . . . . . . . . . . . . . . . . . . . . . . . . . . . . . . . . . . . . . . $25.3
Other Employee Benefit Plans
Discretionary Cash Profit-Sharing Plan – Legacy Diversey
The legacy Diversey portion of the Company has a discretionary cash profit-sharing plan covering certainemployees. Under the plan, we had no expense during the three months ended December 31, 2011.
Note 16 Income Taxes
The components of earnings (loss) before income tax provision were as follows:
2011 2010 2009
Domestic . . . . . . . . . . . . . . . . . . . . . . . . . . . . . . . . . . . . . . . . . . . . . . . . $ (73.6) $ 84.0 $ 127.3
Foreign . . . . . . . . . . . . . . . . . . . . . . . . . . . . . . . . . . . . . . . . . . . . . . . . . 289.7 259.4 202.6
Total . . . . . . . . . . . . . . . . . . . . . . . . . . . . . . . . . . . . . . . . . . . . . . . . . . $216.1 $ 343.4 $ 329.9
The components of the income tax provision were as follows:
2011 2010 2009
Current tax expense:
Federal . . . . . . . . . . . . . . . . . . . . . . . . . . . . . . . . . . . . . . . . . . . . . . . . . . . $ 37.0 $ 22.1 $ 35.8
State and local . . . . . . . . . . . . . . . . . . . . . . . . . . . . . . . . . . . . . . . . . . . . . 5.9 5.6 7.1
Foreign . . . . . . . . . . . . . . . . . . . . . . . . . . . . . . . . . . . . . . . . . . . . . . . . . . . 79.7 63.1 59.3
Total current . . . . . . . . . . . . . . . . . . . . . . . . . . . . . . . . . . . . . . . . . . . . . . . 122.6 90.8 102.2
Deferred tax (benefit), expense:
Federal . . . . . . . . . . . . . . . . . . . . . . . . . . . . . . . . . . . . . . . . . . . . . . . . . . . (54.4) 2.1 (4.6)
State and local . . . . . . . . . . . . . . . . . . . . . . . . . . . . . . . . . . . . . . . . . . . . . (5.3) (2.1) (0.5)
Foreign . . . . . . . . . . . . . . . . . . . . . . . . . . . . . . . . . . . . . . . . . . . . . . . . . . . 4.1 (3.3) (11.5)
Total deferred tax benefit . . . . . . . . . . . . . . . . . . . . . . . . . . . . . . . . . . . . . (55.6) (3.3) (16.6)
Total provision . . . . . . . . . . . . . . . . . . . . . . . . . . . . . . . . . . . . . . . . . . . . . $ 67.0 $ 87.5 $ 85.6
116
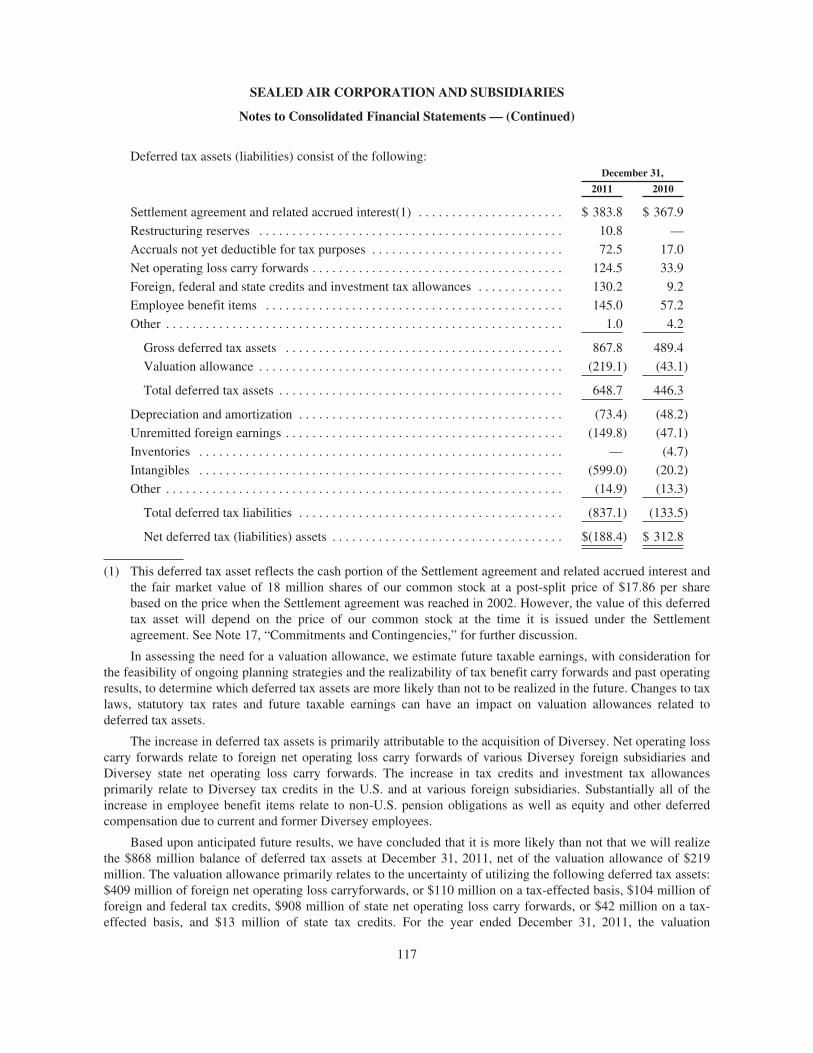
SEALED AIR CORPORATION AND SUBSIDIARIES
Notes to Consolidated Financial Statements — (Continued)
Deferred tax assets (liabilities) consist of the following:December 31,
2011 2010
Settlement agreement and related accrued interest(1) . . . . . . . . . . . . . . . . . . . . . . $ 383.8 $ 367.9
Restructuring reserves . . . . . . . . . . . . . . . . . . . . . . . . . . . . . . . . . . . . . . . . . . . . . . 10.8 —
Accruals not yet deductible for tax purposes . . . . . . . . . . . . . . . . . . . . . . . . . . . . . 72.5 17.0
Net operating loss carry forwards . . . . . . . . . . . . . . . . . . . . . . . . . . . . . . . . . . . . . . 124.5 33.9
Foreign, federal and state credits and investment tax allowances . . . . . . . . . . . . . 130.2 9.2
Employee benefit items . . . . . . . . . . . . . . . . . . . . . . . . . . . . . . . . . . . . . . . . . . . . . 145.0 57.2
Other . . . . . . . . . . . . . . . . . . . . . . . . . . . . . . . . . . . . . . . . . . . . . . . . . . . . . . . . . . . . 1.0 4.2
Gross deferred tax assets . . . . . . . . . . . . . . . . . . . . . . . . . . . . . . . . . . . . . . . . . . 867.8 489.4
Valuation allowance . . . . . . . . . . . . . . . . . . . . . . . . . . . . . . . . . . . . . . . . . . . . . . (219.1) (43.1)
Total deferred tax assets . . . . . . . . . . . . . . . . . . . . . . . . . . . . . . . . . . . . . . . . . . . 648.7 446.3
Depreciation and amortization . . . . . . . . . . . . . . . . . . . . . . . . . . . . . . . . . . . . . . . . (73.4) (48.2)
Unremitted foreign earnings . . . . . . . . . . . . . . . . . . . . . . . . . . . . . . . . . . . . . . . . . . (149.8) (47.1)
Inventories . . . . . . . . . . . . . . . . . . . . . . . . . . . . . . . . . . . . . . . . . . . . . . . . . . . . . . . — (4.7)
Intangibles . . . . . . . . . . . . . . . . . . . . . . . . . . . . . . . . . . . . . . . . . . . . . . . . . . . . . . . (599.0) (20.2)
Other . . . . . . . . . . . . . . . . . . . . . . . . . . . . . . . . . . . . . . . . . . . . . . . . . . . . . . . . . . . . (14.9) (13.3)
Total deferred tax liabilities . . . . . . . . . . . . . . . . . . . . . . . . . . . . . . . . . . . . . . . . (837.1) (133.5)
Net deferred tax (liabilities) assets . . . . . . . . . . . . . . . . . . . . . . . . . . . . . . . . . . . $(188.4) $ 312.8
(1) This deferred tax asset reflects the cash portion of the Settlement agreement and related accrued interest andthe fair market value of 18 million shares of our common stock at a post-split price of $17.86 per sharebased on the price when the Settlement agreement was reached in 2002. However, the value of this deferredtax asset will depend on the price of our common stock at the time it is issued under the Settlementagreement. See Note 17, “Commitments and Contingencies,” for further discussion.
In assessing the need for a valuation allowance, we estimate future taxable earnings, with consideration forthe feasibility of ongoing planning strategies and the realizability of tax benefit carry forwards and past operatingresults, to determine which deferred tax assets are more likely than not to be realized in the future. Changes to taxlaws, statutory tax rates and future taxable earnings can have an impact on valuation allowances related todeferred tax assets.
The increase in deferred tax assets is primarily attributable to the acquisition of Diversey. Net operating losscarry forwards relate to foreign net operating loss carry forwards of various Diversey foreign subsidiaries andDiversey state net operating loss carry forwards. The increase in tax credits and investment tax allowancesprimarily relate to Diversey tax credits in the U.S. and at various foreign subsidiaries. Substantially all of theincrease in employee benefit items relate to non-U.S. pension obligations as well as equity and other deferredcompensation due to current and former Diversey employees.
Based upon anticipated future results, we have concluded that it is more likely than not that we will realizethe $868 million balance of deferred tax assets at December 31, 2011, net of the valuation allowance of $219million. The valuation allowance primarily relates to the uncertainty of utilizing the following deferred tax assets:$409 million of foreign net operating loss carryforwards, or $110 million on a tax-effected basis, $104 million offoreign and federal tax credits, $908 million of state net operating loss carry forwards, or $42 million on a tax-effected basis, and $13 million of state tax credits. For the year ended December 31, 2011, the valuation
117
SEALED AIR CORPORATION AND SUBSIDIARIES
Notes to Consolidated Financial Statements — (Continued)
allowance increased by $176 million due to $162 million related to the acquisition of Diversey, $3 million thatwas charged to the income tax provision and $11 million resulting from a net increase to deferred tax assets witha 100% valuation allowance. For the year ended December 31, 2010, the valuation allowance decreased by $4million, which reduced the income tax provision. For the year ended December 31, 2009, the valuation allowanceincreased by $7 million, which increased the income tax provision.
As of December 31, 2011, we have foreign net operating loss carryforwards totaling $409 million thatexpire during the following calendar years (in millions): 2012 - $2; 2013 - $20; 2014 - $7; 2015 - $22; 2016 -$15; 2017 and beyond - $84; and no expiration - $259. The state net operating loss carryforwards totaling $908million, expire in various amounts over one to 20 years.
As of December 31, 2011, we have foreign and federal foreign tax credit carryforwards and investmentallowances totaling $108 million that expire during the following calendar years (in millions): 2015 - $8; 2016 -$20; 2017 and beyond - $60; and no expiration - $20. The state tax credit carryforwards, totaling $13 million,expire in various amounts over one to 20 years.
Net deferred income taxes charged (credited) to stockholders’ equity were $6 million in 2011, $(5) millionin 2010 and $4 million in 2009.
The U.S. federal statutory corporate tax rate reconciles to our effective income tax rate as follows:
2011 2010 2009
Statutory U.S. federal tax rate . . . . . . . . . . . . . . . . . . . . . . . . . . . . . . . . . . . . . . . 35.0% 35.0% 35.0%
State income taxes, net of federal tax benefit . . . . . . . . . . . . . . . . . . . . . . . . . . . 0.3 0.6 1.5
Foreign earnings taxed at lower effective rates . . . . . . . . . . . . . . . . . . . . . . . . . . (6.3) (9.2) (8.7)
Nondeductible acquisition costs . . . . . . . . . . . . . . . . . . . . . . . . . . . . . . . . . . . . . . 2.5 — —
U.S. domestic manufacturing deduction . . . . . . . . . . . . . . . . . . . . . . . . . . . . . . . (2.4) (1.1) (1.0)
Net change in unrecognized tax benefits . . . . . . . . . . . . . . . . . . . . . . . . . . . . . . . 0.4 — 1.7
Other . . . . . . . . . . . . . . . . . . . . . . . . . . . . . . . . . . . . . . . . . . . . . . . . . . . . . . . . . . . 1.5 0.2 (2.6)
Effective income tax rate . . . . . . . . . . . . . . . . . . . . . . . . . . . . . . . . . . . . . . . . . . . 31.0% 25.5% 25.9%
Unrecognized tax benefits
We are providing the following disclosures related to our unrecognized tax benefits and the effect on oureffective income tax rate if recognized.
Gross Net
Unrecognized tax benefits at January 1, 2011 . . . . . . . . . . . . . . . . . . . . . . . . . . . . . $ 72.5 $ 64.7
Additions relating to the acquisition of Diversey (included in other liabilities) . . . . 182.7 182.7
Additions for tax positions of prior years . . . . . . . . . . . . . . . . . . . . . . . . . . . . . . . . . 2.7 2.7
Reductions for tax positions of prior years . . . . . . . . . . . . . . . . . . . . . . . . . . . . . . . . (3.4) (3.4)
Unrecognized tax benefits at December 31, 2011 . . . . . . . . . . . . . . . . . . . . . . . . . . $254.5 $246.7
If the unrecognized tax benefits at December 31, 2011 were recognized, our income tax provision woulddecrease by $201 million, resulting in a substantially lower effective tax rate. As described in Note 17,“Commitments and Contingencies,” in 2011 the Bankruptcy Court has taken various actions with respect to thePI Settlement Plan. Although we do not know whether or when a final plan of reorganization will becomeeffective, it is reasonably possible that within the next 12 months our unrecognized tax benefit position willdecrease because of recognizing a portion of the unrecognized tax benefits relating to the Settlement agreement.
118
SEALED AIR CORPORATION AND SUBSIDIARIES
Notes to Consolidated Financial Statements — (Continued)
We recognize interest and penalties related to unrecognized tax benefits in income tax provision on theconsolidated statements of operations. We had a liability of approximately $4 million (of which $2 millionrepresents penalties) at January 1, 2011 and a liability of $32 million (of which $15 million represents penalties)at December 31, 2011 for the payment of interest and penalties (before any tax benefit). In 2011, interest andpenalties of $1.5 million (gross) ($1.5 million (net)) were recognized in connection with the related tax accrualsfor uncertainties in prior years. In addition, interest and penalties of $0.5 million (gross) ($0.5 million (net)) werereversed in connection with the related tax accruals for uncertainties in prior years.
Income Tax Returns
The Internal Revenue Service (the “Service”) has concluded its examination of the legacy Sealed AirU.S. federal income tax returns for all years through 2006. Examination of legacy Diversey U.S. federal incometax returns has also been substantially completed through 2006, but the Service could challenge the DiverseyU.S. income tax losses carried forward to subsequent periods.
State income tax returns are generally subject to examination for a period of three to five years after theirfiling date. We have various state income tax returns in the process of examination.
Income tax returns in foreign jurisdictions have statutes of limitations generally ranging from three to fiveyears after their filing date and except where still under examination or where we are litigating, we havegenerally concluded all other income tax matters globally for years through 2005. Our foreign income tax returnsare under examination in various jurisdictions in which we conduct business and we are litigating certain issuesin several jurisdictions. The statute of limitations for tax assessments will expire in many jurisdictions during2012. It is reasonably possible there could be a reduction of approximately $20 million in unrecognized taxbenefits during 2012.
Note 17 Commitments and Contingencies
Cryovac Transaction Commitments and Contingencies
Settlement Agreement and Related Costs
On November 27, 2002, we reached an agreement in principle with the Committees appointed to representasbestos claimants in the bankruptcy case of W. R. Grace & Co., known as Grace, to resolve all current andfuture asbestos-related claims made against the Company and our affiliates in connection with the Cryovactransaction described below (as memorialized by the parties in the Settlement agreement and as approved by theBankruptcy Court, the “Settlement agreement”). The Settlement agreement will also resolve the fraudulenttransfer claims and successor liability claims, as well as indemnification claims by Fresenius Medical CareHoldings, Inc. and affiliated companies, in connection with the Cryovac transaction. On December 3, 2002, ourBoard of Directors approved the agreement in principle. We received notice that both of the Committees hadapproved the agreement in principle as of December 5, 2002. The parties subsequently signed the definitiveSettlement agreement as of November 10, 2003 consistent with the terms of the agreement in principle. For adescription of the Cryovac transaction, asbestos-related claims and the parties involved, see “CryovacTransaction” “Discussion of Cryovac Transaction Commitments and Contingencies,” “Fresenius Claims,”“Canadian Claims” and “Additional Matters Related to the Cryovac Transaction” below.
We recorded a pre-tax charge of approximately $850 million as a result of the Settlement agreement on ourconsolidated statement of operations for the year ended December 31, 2002. The charge consisted of thefollowing items:
‰ a charge of $513 million covering a cash payment that we will be required to make under the Settlementagreement upon the effectiveness of an appropriate plan of reorganization in the Grace bankruptcy.Because we cannot predict when a plan of reorganization may become effective, we recorded this liabilityas a current liability on our consolidated balance sheet at December 31, 2002. Under the terms of the
119
SEALED AIR CORPORATION AND SUBSIDIARIES
Notes to Consolidated Financial Statements — (Continued)
Settlement agreement, this amount accrues interest at a 5.5% annual rate from December 21, 2002 to thedate of payment. We have recorded this interest in interest expense on our consolidated statements ofoperations and in Settlement agreement and related accrued interest on our consolidated balance sheets.The accrued interest, which is compounded annually, was $319 million at December 31, 2011 and$275 million at December 31, 2010.
‰ a non-cash charge of $322 million representing the fair market value at the date we recorded the charge ofnine million shares of Sealed Air common stock that we expect to issue under the Settlement agreementupon the effectiveness of an appropriate plan of reorganization in the Grace bankruptcy, which wasadjusted to eighteen million shares due to our two-for-one stock split in March 2007. These shares aresubject to customary anti-dilution provisions that adjust for the effects of stock splits, stock dividends andother events affecting our common stock. The fair market value of our common stock was $35.72 per pre-split share ($17.86 post-split) as of the close of business on December 5, 2002. We recorded this amounton our consolidated balance sheet at December 31, 2002 as follows: $0.9 million representing theaggregate par value of these shares of common stock reserved for issuance related to the Settlementagreement, and the remaining $321 million, representing the excess of the aggregate fair market valueover the aggregate par value of these common shares, in additional paid-in capital. The diluted netearnings per common share calculations for the years ended December 31, 2011 and 2010 reflect theeighteen million shares of common stock that we have reserved for issuance related to the Settlementagreement.
‰ $16 million of legal and related fees as of December 31, 2002.
Settlement agreement and related costs reflected legal and related fees for Settlement-related matters of$1 million in 2011 and in 2010 and $2 million in 2009, which are included in other expense, net, on ourconsolidated statements of operations.
Cryovac Transaction
On March 31, 1998, we completed a multi-step transaction that brought the Cryovac packaging business andthe former Sealed Air Corporation’s business under the common ownership of the Company. These businessesoperate as subsidiaries of the Company, and the Company acts as a holding company. As part of that transaction,the parties separated the Cryovac packaging business, which previously had been held by various direct andindirect subsidiaries of the Company, from the remaining businesses previously held by the Company. Theparties then arranged for the contribution of these remaining businesses to a company now known as W. R.Grace & Co., and the Company distributed the Grace shares to the Company’s stockholders. As a result, W. R.Grace & Co. became a separate publicly owned company. The Company recapitalized its outstanding shares ofcommon stock into a new common stock and a new convertible preferred stock. A subsidiary of the Companythen merged into the former Sealed Air Corporation, which became a subsidiary of the Company and changed itsname to Sealed Air Corporation (US).
Discussion of Cryovac Transaction Commitments and Contingencies
In connection with the Cryovac transaction, Grace and its subsidiaries retained all liabilities arising out oftheir operations before the Cryovac transaction, whether accruing or occurring before or after the Cryovactransaction, other than liabilities arising from or relating to Cryovac’s operations. Among the liabilities retainedby Grace are liabilities relating to asbestos-containing products previously manufactured or sold by Grace’ssubsidiaries prior to the Cryovac transaction, including its primary U.S. operating subsidiary, W. R. Grace & Co.— Conn., which has operated for decades and has been a subsidiary of Grace since the Cryovac transaction. TheCryovac transaction agreements provided that, should any claimant seek to hold the Company or any of itssubsidiaries responsible for liabilities retained by Grace or its subsidiaries, including the asbestos-relatedliabilities, Grace and its subsidiaries would indemnify and defend us.
120
SEALED AIR CORPORATION AND SUBSIDIARIES
Notes to Consolidated Financial Statements — (Continued)
Since the beginning of 2000, we have been served with a number of lawsuits alleging that, as a result of theCryovac transaction, we are responsible for alleged asbestos liabilities of Grace and its subsidiaries, some ofwhich were also named as co-defendants in some of these actions. Among these lawsuits are several purportedclass actions and a number of personal injury lawsuits. Some plaintiffs seek damages for personal injury orwrongful death, while others seek medical monitoring, environmental remediation or remedies related to an atticinsulation product. Neither the former Sealed Air Corporation nor Cryovac, Inc. ever produced or sold any of theasbestos-containing materials that are the subjects of these cases. None of these cases has reached resolutionthrough judgment, settlement or otherwise. As discussed below, Grace’s Chapter 11 bankruptcy proceeding hasstayed all of these cases.
While the allegations in these actions directed to us vary, these actions all appear to allege that the transferof the Cryovac business as part of the Cryovac transaction was a fraudulent transfer or gave rise to successorliability. Under a theory of successor liability, plaintiffs with claims against Grace and its subsidiaries mayattempt to hold us liable for liabilities that arose with respect to activities conducted prior to the Cryovactransaction by W. R. Grace & Co. — Conn. or other Grace subsidiaries. A transfer would be a fraudulent transferif the transferor received less than reasonably equivalent value and the transferor was insolvent or was renderedinsolvent by the transfer, was engaged or was about to engage in a business for which its assets constituteunreasonably small capital, or intended to incur or believed that it would incur debts beyond its ability to pay asthey mature. A transfer may also be fraudulent if it was made with actual intent to hinder, delay or defraudcreditors. If a court found any transfers in connection with the Cryovac transaction to be fraudulent transfers, wecould be required to return the property or its value to the transferor or could be required to fund liabilities ofGrace or its subsidiaries for the benefit of their creditors, including asbestos claimants. We have reached anagreement in principle and subsequently signed the Settlement agreement, described below, that is expected toresolve all these claims.
In the Joint Proxy Statement furnished to their respective stockholders in connection with the Cryovactransaction, both parties to the transaction stated that it was their belief that Grace and its subsidiaries wereadequately capitalized and would be adequately capitalized after the Cryovac transaction and that none of thetransfers contemplated to occur in the Cryovac transaction would be a fraudulent transfer. They also stated theirbelief that the Cryovac transaction complied with other relevant laws. However, if a court applying the relevantlegal standards had reached conclusions adverse to us, these determinations could have had a materially adverseeffect on our consolidated financial condition and results of operations.
On April 2, 2001, Grace and a number of its subsidiaries filed petitions for reorganization under Chapter 11of the U.S. Bankruptcy Code in the U.S. Bankruptcy Court in the District of Delaware (the “Bankruptcy Court”).Grace stated that the filing was made in response to a sharply increasing number of asbestos claims since 1999.
In connection with its Chapter 11 filing, Grace filed an application with the Bankruptcy Court seeking tostay, among others, all actions brought against the Company and specified subsidiaries related to alleged asbestosliabilities of Grace and its subsidiaries or alleging fraudulent transfer claims. The court issued an order datedMay 3, 2001, which was modified on January 22, 2002, under which the court stayed all the filed or pendingasbestos actions against us and, upon filing and service on us, all future asbestos actions. No further proceedingsinvolving us can occur in the actions that have been stayed except upon further order of the Bankruptcy Court.
Committees appointed to represent asbestos claimants in Grace’s bankruptcy case received the court’spermission to pursue fraudulent transfer and other claims against the Company and its subsidiary Cryovac, Inc., andagainst Fresenius, as discussed below. The claims against Fresenius are based upon a 1996 transaction betweenFresenius and W. R. Grace & Co. — Conn. Fresenius is not affiliated with us. In March 2002, the court ordered thatthe issues of the solvency of Grace following the Cryovac transaction and whether Grace received reasonablyequivalent value in the Cryovac transaction would be tried on behalf of all of Grace’s creditors. This proceedingwas brought in the U.S. District Court for the District of Delaware (the “District Court”) (Adv. No. 02-02210).
121
SEALED AIR CORPORATION AND SUBSIDIARIES
Notes to Consolidated Financial Statements — (Continued)
In June 2002, the court permitted the U.S. government to intervene as a plaintiff in the fraudulent transferproceeding, so that the U.S. government could pursue allegations that environmental remediation expenses wereunderestimated or omitted in the solvency analyses of Grace conducted at the time of the Cryovac transaction. Thecourt also permitted Grace, which asserted that the Cryovac transaction was not a fraudulent transfer, to intervene inthe proceeding. In July 2002, the court issued an interim ruling on the legal standards to be applied in the trial,holding, among other things, that, subject to specified limitations, post-1998 claims should be considered in thesolvency analysis of Grace. We believe that only claims and liabilities that were known, or reasonably should havebeen known, at the time of the 1998 Cryovac transaction should be considered under the applicable standard.
With the fraudulent transfer trial set to commence on December 9, 2002, on November 27, 2002, wereached an agreement in principle with the Committees prosecuting the claims against the Company andCryovac, Inc., to resolve all current and future asbestos-related claims arising from the Cryovac transaction. Onthe same day, the court entered an order confirming that the parties had reached an amicable resolution of thedisputes among the parties and that counsel for us and the Committees had agreed and bound the parties to theterms of the agreement in principle. As discussed above, the agreement in principle called for payment of ninemillion shares of our common stock and $513 million in cash, plus interest on the cash payment at a 5.5% annualrate starting on December 21, 2002 and ending on the effective date of an appropriate plan of reorganization inthe Grace bankruptcy, when we are required to make the payment. These shares are subject to customary anti-dilution provisions that adjust for the effects of stock splits, stock dividends and other events affecting ourcommon stock, and as a result, the number of shares of our common stock that we will issue increased toeighteen million shares upon the two-for-one stock split in March 2007. On December 3, 2002, the Company'sBoard of Directors approved the agreement in principle. We received notice that both of the Committees hadapproved the agreement in principle as of December 5, 2002. The parties subsequently signed the definitiveSettlement agreement as of November 10, 2003 consistent with the terms of the agreement in principle. OnNovember 26, 2003, the parties jointly presented the definitive Settlement agreement to the District Court forapproval. On Grace’s motion to the District Court, that court transferred the motion to approve the Settlementagreement to the Bankruptcy Court for disposition.
On June 27, 2005, the Bankruptcy Court signed an order approving the Settlement agreement. Although Graceis not a party to the Settlement agreement, under the terms of the order, Grace is directed to comply with theSettlement agreement subject to limited exceptions. The order also provides that the Court will retain jurisdictionover any dispute involving the interpretation or enforcement of the terms and provisions of the Settlementagreement. We expect that the Settlement agreement will become effective upon Grace’s emergence frombankruptcy pursuant to a plan of reorganization that is consistent with the terms of the Settlement agreement.
On June 8, 2004, we filed a motion with the District Court, where the fraudulent transfer trial was pending,requesting that the court vacate the July 2002 interim ruling on the legal standards to be applied relating to thefraudulent transfer claims against us. We were not challenging the Settlement agreement. The motion was filedas a protective measure in the event that the Settlement agreement is ultimately not approved or implemented;however, we still expect that the Settlement agreement will become effective upon Grace’s emergence frombankruptcy with a plan of reorganization that is consistent with the terms of the Settlement agreement.
On July 11, 2005, the Bankruptcy Court entered an order closing the proceeding brought in 2002 by thecommittees appointed to represent asbestos claimants in the Grace bankruptcy proceeding against us withoutprejudice to our right to reopen the matter and renew in our sole discretion our motion to vacate the July 2002interim ruling on the legal standards to be applied relating to the fraudulent transfer claims against us.
As a condition to our obligation to make the payments required by the Settlement agreement, any final planof reorganization must be consistent with the terms of the Settlement agreement, including provisions for thetrusts and releases referred to below and for an injunction barring the prosecution of any asbestos-related claimsagainst us. The Settlement agreement provides that, upon the effective date of the final plan of reorganization andpayment of the shares and cash, all present and future asbestos-related claims against us that arise from alleged
122
SEALED AIR CORPORATION AND SUBSIDIARIES
Notes to Consolidated Financial Statements — (Continued)
asbestos liabilities of Grace and its affiliates (including former affiliates that became our affiliates through theCryovac transaction) will be channeled to and become the responsibility of one or more trusts to be establishedunder Section 524(g) of the Bankruptcy Code as part of a final plan of reorganization in the Grace bankruptcy.The Settlement agreement will also resolve all fraudulent transfer claims against us arising from the Cryovactransaction as well as the Fresenius claims described below. The Settlement agreement provides that we willreceive releases of all those claims upon payment. Under the agreement, we cannot seek indemnity from Gracefor our payments required by the Settlement agreement. The order approving the Settlement agreement alsoprovides that the stay of proceedings involving us described above will continue through the effective date of thefinal plan of reorganization, after which, upon implementation of the Settlement agreement, we will be releasedfrom the liabilities asserted in those proceedings and their continued prosecution against us will be enjoined.
In January 2005, Grace filed a proposed plan of reorganization (the “Grace Plan”) with the BankruptcyCourt. There were a number of objections filed. The Official Committee of Asbestos Personal Injury Claimants(the “ACC”) and the Asbestos PI Future Claimants' Representative (the “FCR”) filed their proposed plan ofreorganization (the “Claimants’ Plan”) with the Bankruptcy Court in November 2007. On April 7, 2008, Graceissued a press release announcing that Grace, the ACC, the FCR, and the Official Committee of Equity SecurityHolders (the “Equity Committee”) had reached an agreement in principle to settle all present and future asbestos-related personal injury claims against Grace (the “PI Settlement”) and disclosed a term sheet outlining certainterms of the PI Settlement and for a contemplated plan of reorganization that would incorporate the PI Settlement(as filed and amended from time to time, the “PI Settlement Plan”).
On September 19, 2008, Grace, the ACC, the FCR, and the Equity Committee filed, as co-proponents, the PISettlement Plan and several exhibits and associated documents, including a disclosure statement (as filed andamended from time to time, the “PI Settlement Disclosure Statement”), with the Bankruptcy Court. Amendedversions of the PI Settlement Plan and the PI Settlement Disclosure Statement have been filed with the BankruptcyCourt from time to time. The PI Settlement Plan, which supersedes each of the Grace Plan and the Claimants' Plan,remains pending and has not become effective. The committee representing general unsecured creditors and theOfficial Committee of Asbestos Property Damage Claimants are not co-proponents of the PI Settlement Plan. Asfiled, the PI Settlement Plan would provide for the establishment of two asbestos trusts under Section 524(g) of theUnited States Bankruptcy Code to which present and future asbestos-related claims would be channeled. The PISettlement Plan also contemplates that the terms of the Settlement agreement will be incorporated into the PISettlement Plan and that we will pay the amount contemplated by the Settlement agreement. On March 9, 2009, theBankruptcy Court entered an order approving the PI Settlement Disclosure Statement (the “DS Order”) ascontaining adequate information and authorizing Grace to solicit votes to accept or reject the PI Settlement Plan, allas more fully described in the order. The DS Order did not constitute the Bankruptcy Court’s confirmation of the PISettlement Plan, approval of the merits of the PI Settlement Plan, or endorsement of the PI Settlement Plan. Inconnection with the plan voting process in the Grace bankruptcy case, we voted in favor of the PI Settlement Planthat was before the Bankruptcy Court. We will continue to review any amendments to the PI Settlement Plan on anongoing basis to verify compliance with the Settlement agreement.
On June 8, 2009, a senior manager with the voting agent appointed in the Grace bankruptcy case filed adeclaration with the Bankruptcy Court certifying the voting results with respect to the PI Settlement Plan. Thisdeclaration was amended on August 5, 2009 (as amended, the “Voting Declaration”). According to the VotingDeclaration, with respect to each class of claims designated as impaired by Grace, the PI Settlement Plan wasapproved by holders of at least two-thirds in amount and more than one-half in number (or for classes voting forpurposes of Section 524(g) of the Bankruptcy Code, at least 75% in number) of voted claims. The VotingDeclaration also discusses the voting results with respect to holders of general unsecured claims (“GUCs”)against Grace, whose votes were provisionally solicited and counted subject to a determination by theBankruptcy Court of whether GUCs are impaired (and, thus, entitled to vote) or, as Grace contends, unimpaired(and, thus, not entitled to vote). According to the Voting Declaration, more than one half of voting holders ofGUCs voted to accept the PI Settlement Plan, but the provisional vote did not obtain the requisite two-thirds
123
SEALED AIR CORPORATION AND SUBSIDIARIES
Notes to Consolidated Financial Statements — (Continued)
dollar amount to be deemed an accepting class in the event that GUCs are determined to be impaired. To theextent that GUCs are determined to be an impaired non-accepting class, Grace and the other plan proponentshave indicated that they would nevertheless seek confirmation of the PI Settlement Plan under the “cram down”provisions contained in Section 1129(b) of the Bankruptcy Code.
On January 31, 2011, the Bankruptcy Court entered a memorandum opinion (as amended, the “BankruptcyCourt Opinion”) overruling certain objections to the PI Settlement Plan and finding, among other things, thatGUCs are not impaired under the PI Settlement Plan. On the same date, the Bankruptcy Court entered an orderregarding confirmation of the PI Settlement Plan (as amended, the “Bankruptcy Court Confirmation Order”). Asentered on January 31, 2011, the Bankruptcy Court Confirmation Order contained recommended findings of factand conclusions of law, and recommended that the District Court approve the Bankruptcy Court ConfirmationOrder, and that the District Court confirm the PI Settlement Plan and issue a channeling injunction underSection 524(g) of the Bankruptcy Code. Thereafter, on February 15, 2011, the Bankruptcy Court issued an orderclarifying the Bankruptcy Court Opinion and the Bankruptcy Court Confirmation Order (the “Clarifying Order”).Among other things, the Clarifying Order provided that any references in the Bankruptcy Court Opinion and theBankruptcy Court Confirmation Order to a recommendation that the District Court confirm the PI SettlementPlan were thereby amended to make clear that the PI Settlement Plan was confirmed and that the BankruptcyCourt was requesting that the District Court issue and affirm the Bankruptcy Court Confirmation Order includingthe injunction under Section 524(g) of the Bankruptcy Code. On March 11, 2011, the Bankruptcy Court enteredan order granting in part and denying in part a motion to reconsider the Bankruptcy Court Opinion filed by BNSFRailway Company (the “March 11 Order”). Among other things, the March 11 Order amended the BankruptcyCourt Opinion to clarify certain matters relating to objections to the PI Settlement Plan filed by BNSF.
Various parties appealed or otherwise challenged the Bankruptcy Court Opinion and the Bankruptcy CourtConfirmation Order, including without limitation with respect to issues relating to releases and injunctionscontained in the PI Settlement Plan. On June 28 and 29, 2011, the District Court heard oral arguments inconnection with appeals of the Bankruptcy Court Opinion and the Bankruptcy Court Confirmation Order. OnJanuary 30, 2012, the District Court issued a memorandum opinion (the “District Court Opinion”) andconfirmation order (the “District Court Confirmation Order”) overruling all objections to the PI Settlement Planand confirming the PI Settlement Plan in its entirety (including the issuance of the injunction underSection 524(g) of the Bankruptcy Code). On February 2, 2012, Garlock Sealing Technologies LLC (“Garlock”)filed a motion (the “Garlock Reargument Motion”) with the District Court requesting that the District Court grantreargument, rehearing, or otherwise amend the District Court Opinion and the District Court Confirmation Orderinsofar as they overrule Garlock’s objections to the PI Settlement Plan. On February 13, 2012, the Company,Cryovac, and Fresenius Medical Care Holdings, Inc. filed a joint motion (the “Sealed Air/Fresenius Motion”)with the District Court. The Sealed Air/Fresenius Motion does not seek to disturb confirmation of the PISettlement Plan but requests that the District Court amend and clarify certain matters in the District CourtOpinion and the District Court Confirmation Order. Also on February 13, 2012, Grace and the other proponentsof the PI Settlement Plan filed a motion (the “Plan Proponents' Motion”) with the District Court requestingcertain of the same amendments and clarifications sought by the Sealed Air/Fresenius Motion. On February 27,2012, certain asbestos claimants known as the “Libby Claimants” filed a response to the Sealed Air/FreseniusMotion and the Plan Proponents’ Motion (the “Libby Response”). The Libby Response does not oppose theSealed Air/Fresenius Motion or the Plan Proponents’ Motion but indicates, among other things, that: (a) theLibby Claimants have reached a settlement in principle of their objections to the PI Settlement Plan but that thissettlement has not become effective and (b) the Libby Claimants reserve their rights with respect to the PISettlement Plan pending the effectiveness of the Libby Claimants’ settlement. In addition, parties have appealedthe District Court Opinion and the District Court Confirmation Order to the United States Court of Appeals forthe Third Circuit (the “Third Circuit Court of Appeals”). By orders dated February 23, 2012, the Third CircuitCourt of Appeals stayed appeals of the District Court Opinion and the District Court Confirmation Order pendingdisposition of motions filed in the District Court with respect to the District Court Opinion and the District Court
124
SEALED AIR CORPORATION AND SUBSIDIARIES
Notes to Consolidated Financial Statements — (Continued)
Confirmation Order. The District Court has not ruled on the Garlock Reargument Motion, the Sealed Air/Fresenius Motion, or the Plan Proponents’ Motion. In addition, on February 27, 2012, Garlock filed a motion (the“Garlock Stay Motion”) requesting that the District Court stay the District Court Opinion and the District CourtConfirmation Order until the later of 14 days after the disposition of the Garlock Reargument Motion ordisposition of any timely appeal by Garlock of the District Court Opinion and the District Court ConfirmationOrder. The District Court has not ruled on the Garlock Stay Motion.
Although we are optimistic that, if it were to become effective, the PI Settlement Plan would implement theterms of the Settlement agreement, we can give no assurance that this will be the case notwithstanding theconfirmation of the PI Settlement Plan by the Bankruptcy Court and the District Court. The terms of the PISettlement Plan remain subject to amendment. Moreover, the PI Settlement Plan is subject to the satisfaction of anumber of conditions which are more fully set forth in the PI Settlement Plan and include, without limitation, theavailability of exit financing and the approval of the PI Settlement Plan becoming final and no longer subject toappeal. Parties have appealed the District Court Confirmation Order to the Third Circuit Court of Appeals orotherwise challenged the District Court Opinion and the District Court Confirmation Order. Matters relating tothe PI Settlement Plan, the Bankruptcy and District Court Opinions, and the Bankruptcy and District CourtConfirmation Orders may be subject to further appeal, challenge, and proceedings before the District Court, theThird Circuit Court of Appeals, or other courts. Parties may designate various issues to be considered inchallenging the PI Settlement Plan, the Bankruptcy and District Court Opinions, or the Bankruptcy and DistrictCourt Confirmation Orders, including, without limitation, issues relating to releases and injunctions contained inthe PI Settlement Plan.
While the Bankruptcy Court and the District Court have confirmed the PI Settlement Plan, we do not knowwhether or when the Third Circuit Court of Appeals will affirm the District Court Confirmation Order or the DistrictCourt Opinion, whether or when the Bankruptcy and District Court Opinions or the Bankruptcy and District CourtConfirmation Orders will become final and no longer subject to appeal, or whether or when a final plan ofreorganization (whether the PI Settlement Plan or another plan of reorganization) will become effective. Assumingthat a final plan of reorganization (whether the PI Settlement Plan or another plan of reorganization) is confirmed bythe Bankruptcy Court and the District Court, and does become effective, we do not know whether the final plan ofreorganization will be consistent with the terms of the Settlement agreement or if the other conditions to ourobligation to pay the Settlement agreement amount will be met. If these conditions are not satisfied or not waived byus, we will not be obligated to pay the amount contemplated by the Settlement agreement. However, if we do notpay the Settlement agreement amount, we will not be released from the various asbestos related, fraudulent transfer,successor liability, and indemnification claims made against us and all of these claims would remain pending andwould have to be resolved through other means, such as through agreement on alternative settlement terms or trials.In that case, we could face liabilities that are significantly different from our obligations under the Settlementagreement. We cannot estimate at this time what those differences or their magnitude may be. In the event theseliabilities are materially larger than the current existing obligations, they could have a material adverse effect on ourconsolidated financial condition and results of operations. We will continue to review the Grace bankruptcyproceedings (including appeals and other proceedings relating to the PI Settlement Plan, the Bankruptcy and DistrictCourt Opinions, and the Bankruptcy and District Court Confirmation Orders), as well as any amendments orchanges to the PI Settlement Plan or to Bankruptcy and District Court Opinions and Confirmation Orders, to verifycompliance with the Settlement agreement.
Fresenius Claims
In January 2002, we filed a declaratory judgment action against Fresenius Medical Care Holdings, Inc., itsparent, Fresenius AG, a German company, and specified affiliates in New York State court asking the court toresolve a contract dispute between the parties. The Fresenius parties contended that we were obligated toindemnify them for liabilities that they might incur as a result of the 1996 Fresenius transaction mentioned above.
125
SEALED AIR CORPORATION AND SUBSIDIARIES
Notes to Consolidated Financial Statements — (Continued)
The Fresenius parties’ contention was based on their interpretation of the agreements between them and W. R.Grace & Co. — Conn. in connection with the 1996 Fresenius transaction. In February 2002, the Fresenius partiesannounced that they had accrued a charge of $172 million for these potential liabilities, which includedpre-transaction tax liabilities of Grace and the costs of defense of litigation arising from Grace’s Chapter 11 filing.We believe that we were not responsible to indemnify the Fresenius parties under the 1996 agreements and filed theaction to proceed to a resolution of the Fresenius parties’ claims. In April 2002, the Fresenius parties filed a motionto dismiss the action and for entry of declaratory relief in its favor. We opposed the motion, and in July 2003, thecourt denied the motion without prejudice in view of the November 27, 2002 agreement in principle referred toabove. As noted above, under the Settlement agreement, we and the Fresenius parties will exchange mutualreleases, which will release us from any and all claims related to the 1996 Fresenius transaction.
Canadian Claims
In November 2004, the Company’s Canadian subsidiary Sealed Air (Canada) Co./Cie learned that it hadbeen named a defendant in the case of Thundersky v. The Attorney General of Canada, et al. (FileNo. CI04-01-39818), pending in the Manitoba Court of Queen's Bench. Grace and W. R. Grace & Co. — Conn.are also named as defendants. The plaintiff brought the claim as a putative class proceeding and seeks recoveryfor alleged injuries suffered by any Canadian resident, other than in the course of employment, as a result ofGrace’s marketing, selling, processing, manufacturing, distributing and/or delivering asbestos or asbestos-containing products in Canada prior to the Cryovac Transaction. A plaintiff filed another proceeding inJanuary 2005 in the Manitoba Court of Queen’s Bench naming the Company and specified subsidiaries asdefendants. The latter proceeding, Her Majesty the Queen in Right of the Province of Manitoba v. The AttorneyGeneral of Canada, et al. (File No. CI05-01-41069), seeks the recovery of the cost of insured health servicesallegedly provided by the Government of Manitoba to the members of the class of plaintiffs in the Thunderskyproceeding. In October 2005, we learned that six additional putative class proceedings had been brought invarious provincial and federal courts in Canada seeking recovery from the Company and its subsidiariesCryovac, Inc. and Sealed Air (Canada) Co./Cie, as well as other defendants including W. R. Grace & Co. and W.R. Grace & Co. — Conn., for alleged injuries suffered by any Canadian resident, other than in the course ofemployment (except with respect to one of these six claims), as a result of Grace's marketing, selling,manufacturing, processing, distributing and/or delivering asbestos or asbestos-containing products in Canadaprior to the Cryovac transaction. Grace and W. R. Grace & Co. — Conn. have agreed to defend, indemnify andhold harmless the Company and its affiliates in respect of any liability and expense, including legal fees andcosts, in these actions.
In April 2001, Grace Canada, Inc. had obtained an order of the Superior Court of Justice, Commercial List,Toronto (the “Canadian Court”), recognizing the Chapter 11 actions in the United States of America involvingGrace Canada, Inc.’s U.S. parent corporation and other affiliates of Grace Canada, Inc., and enjoining all newactions and staying all current proceedings against Grace Canada, Inc. related to asbestos under the Companies'Creditors Arrangement Act. That order has been renewed repeatedly. In November 2005, upon motion by GraceCanada, Inc., the Canadian Court ordered an extension of the injunction and stay to actions involving asbestosagainst the Company and its Canadian affiliate and the Attorney General of Canada, which had the effect ofstaying all of the Canadian actions referred to above. The parties finalized a global settlement of these Canadianactions (except for claims against the Canadian government). That settlement, which has subsequently beenamended (the “Canadian Settlement”), will be entirely funded by Grace. The Canadian Court issued an Order onDecember 13, 2009 approving the Canadian Settlement. We do not have any positive obligations under theCanadian Settlement, but we are a beneficiary of the release of claims. The release in favor of the Grace parties(including us) will become operative upon the effective date of a plan of reorganization in Grace's United StatesChapter 11 bankruptcy proceeding. As filed, the PI Settlement Plan contemplates that the claims released underthe Canadian Settlement will be subject to injunctions under Section 524(g) of the Bankruptcy Code. Asindicated above, the Bankruptcy Court entered the Bankruptcy Court Confirmation Order on January 31, 2011
126
SEALED AIR CORPORATION AND SUBSIDIARIES
Notes to Consolidated Financial Statements — (Continued)
and the Clarifying Order on February 15, 2011 and the District Court entered the District Court ConfirmationOrder on January 30, 2012. The Canadian Court issued an Order on April 8, 2011 recognizing and giving fulleffect to the Bankruptcy Court's Confirmation Order in all provinces and territories of Canada in accordance withthe Confirmation Order's terms. Notwithstanding the foregoing, the PI Settlement Plan has not become effective,and we can give no assurance that the PI Settlement Plan (or any other plan of reorganization) will becomeeffective. Assuming that a final plan of reorganization (whether the PI Settlement Plan or another plan ofreorganization) does become effective, if the final plan of reorganization does not incorporate the terms of theCanadian Settlement or if the Canadian courts refuse to enforce the final plan of reorganization in the Canadiancourts, and if in addition Grace is unwilling or unable to defend and indemnify the Company and its subsidiariesin these cases, then we could be required to pay substantial damages, which we cannot estimate at this time andwhich could have a material adverse effect on our consolidated financial condition and results of operations.
Additional Matters Related to the Cryovac Transaction
In view of Grace's Chapter 11 filing, we may receive additional claims asserting that we are liable forobligations that Grace had agreed to retain in the Cryovac transaction and for which we may be contingentlyliable. To date, we are not aware of any material claims having been asserted or threatened against us.
Final determinations and accountings under the Cryovac transaction agreements with respect to matterspertaining to the transaction had not been completed at the time of Grace’s Chapter 11 filing in 2001. We havefiled claims in the bankruptcy proceeding that reflect the costs and liabilities that we have incurred or may incurthat Grace and its affiliates agreed to retain or that are subject to indemnification by Grace and its affiliates underthe Cryovac transaction agreements, other than payments to be made under the Settlement agreement. Grace hasalleged that we are responsible for specified amounts under the Cryovac transaction agreements. Subject to theterms of the Settlement agreement, amounts for which we may be liable to Grace may be used to offset theliabilities of Grace and its affiliates to us. We intend to seek indemnification by Grace and its affiliates to theextent permissible under law, the Settlement agreement, and the Cryovac transaction agreements. Except to theextent of any potential setoff or similar claim, we expect that our claims will be as an unsecured creditor ofGrace. Since portions of our claims against Grace and its affiliates are contingent or unliquidated, we cannotdetermine the amount of our claims, the extent to which these claims may be reduced by setoff, how much of theclaims may be allowed, or the amount of our recovery on these claims, if any, in the bankruptcy proceeding.
Environmental Matters
We are subject to loss contingencies resulting from environmental laws and regulations, and we accrue foranticipated costs associated with investigatory and remediation efforts when an assessment has indicated that aloss is probable and can be reasonably estimated. These accruals are not reduced by potential insurancerecoveries, if any. We do not believe that it is reasonably possible that our liability in excess of the amounts thatwe have accrued for environmental matters will be material to our consolidated financial condition or results ofoperations. Environmental liabilities are reassessed whenever circumstances become better defined orremediation efforts and their costs can be better estimated.
We evaluate these liabilities periodically based on available information, including the progress of remedialinvestigations at each site, the current status of discussions with regulatory authorities regarding the methods andextent of remediation and the apportionment of costs among potentially responsible parties. As some of theseissues are decided (the outcomes of which are subject to uncertainties) or new sites are assessed and costs can bereasonably estimated, we adjust the recorded accruals, as necessary. We believe that these exposures are notmaterial to our consolidated financial condition or results of operations. We believe that we have adequatelyreserved for all probable and estimable environmental exposures.
127
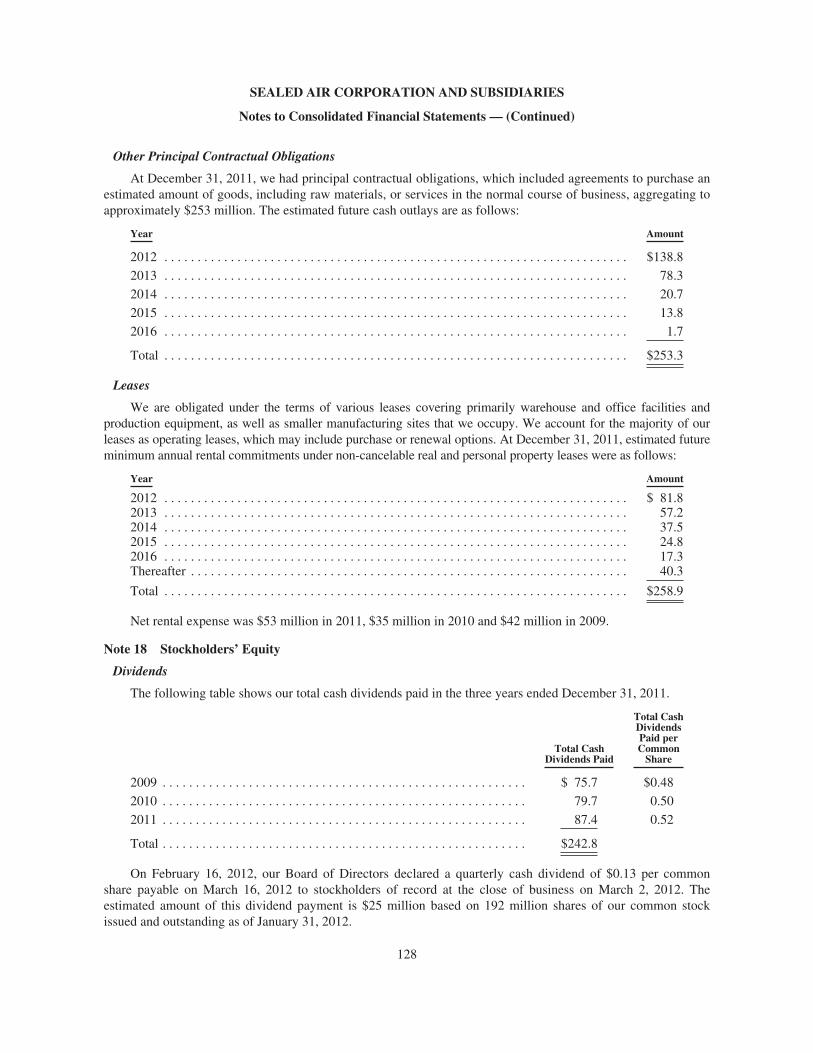
SEALED AIR CORPORATION AND SUBSIDIARIES
Notes to Consolidated Financial Statements — (Continued)
Other Principal Contractual Obligations
At December 31, 2011, we had principal contractual obligations, which included agreements to purchase anestimated amount of goods, including raw materials, or services in the normal course of business, aggregating toapproximately $253 million. The estimated future cash outlays are as follows:
Year Amount
2012 . . . . . . . . . . . . . . . . . . . . . . . . . . . . . . . . . . . . . . . . . . . . . . . . . . . . . . . . . . . . . . . . . . . . . . $138.8
2013 . . . . . . . . . . . . . . . . . . . . . . . . . . . . . . . . . . . . . . . . . . . . . . . . . . . . . . . . . . . . . . . . . . . . . . 78.3
2014 . . . . . . . . . . . . . . . . . . . . . . . . . . . . . . . . . . . . . . . . . . . . . . . . . . . . . . . . . . . . . . . . . . . . . . 20.7
2015 . . . . . . . . . . . . . . . . . . . . . . . . . . . . . . . . . . . . . . . . . . . . . . . . . . . . . . . . . . . . . . . . . . . . . . 13.8
2016 . . . . . . . . . . . . . . . . . . . . . . . . . . . . . . . . . . . . . . . . . . . . . . . . . . . . . . . . . . . . . . . . . . . . . . 1.7
Total . . . . . . . . . . . . . . . . . . . . . . . . . . . . . . . . . . . . . . . . . . . . . . . . . . . . . . . . . . . . . . . . . . . . . . $253.3
Leases
We are obligated under the terms of various leases covering primarily warehouse and office facilities andproduction equipment, as well as smaller manufacturing sites that we occupy. We account for the majority of ourleases as operating leases, which may include purchase or renewal options. At December 31, 2011, estimated futureminimum annual rental commitments under non-cancelable real and personal property leases were as follows:
Year Amount
2012 . . . . . . . . . . . . . . . . . . . . . . . . . . . . . . . . . . . . . . . . . . . . . . . . . . . . . . . . . . . . . . . . . . . . . . $ 81.82013 . . . . . . . . . . . . . . . . . . . . . . . . . . . . . . . . . . . . . . . . . . . . . . . . . . . . . . . . . . . . . . . . . . . . . . 57.22014 . . . . . . . . . . . . . . . . . . . . . . . . . . . . . . . . . . . . . . . . . . . . . . . . . . . . . . . . . . . . . . . . . . . . . . 37.52015 . . . . . . . . . . . . . . . . . . . . . . . . . . . . . . . . . . . . . . . . . . . . . . . . . . . . . . . . . . . . . . . . . . . . . . 24.82016 . . . . . . . . . . . . . . . . . . . . . . . . . . . . . . . . . . . . . . . . . . . . . . . . . . . . . . . . . . . . . . . . . . . . . . 17.3Thereafter . . . . . . . . . . . . . . . . . . . . . . . . . . . . . . . . . . . . . . . . . . . . . . . . . . . . . . . . . . . . . . . . . . 40.3
Total . . . . . . . . . . . . . . . . . . . . . . . . . . . . . . . . . . . . . . . . . . . . . . . . . . . . . . . . . . . . . . . . . . . . . . $258.9
Net rental expense was $53 million in 2011, $35 million in 2010 and $42 million in 2009.
Note 18 Stockholders’ Equity
Dividends
The following table shows our total cash dividends paid in the three years ended December 31, 2011.
Total CashDividends Paid
Total CashDividendsPaid perCommon
Share
2009 . . . . . . . . . . . . . . . . . . . . . . . . . . . . . . . . . . . . . . . . . . . . . . . . . . . . . . . $ 75.7 $0.48
2010 . . . . . . . . . . . . . . . . . . . . . . . . . . . . . . . . . . . . . . . . . . . . . . . . . . . . . . . 79.7 0.50
2011 . . . . . . . . . . . . . . . . . . . . . . . . . . . . . . . . . . . . . . . . . . . . . . . . . . . . . . . 87.4 0.52
Total . . . . . . . . . . . . . . . . . . . . . . . . . . . . . . . . . . . . . . . . . . . . . . . . . . . . . . . $242.8
On February 16, 2012, our Board of Directors declared a quarterly cash dividend of $0.13 per commonshare payable on March 16, 2012 to stockholders of record at the close of business on March 2, 2012. Theestimated amount of this dividend payment is $25 million based on 192 million shares of our common stockissued and outstanding as of January 31, 2012.
128
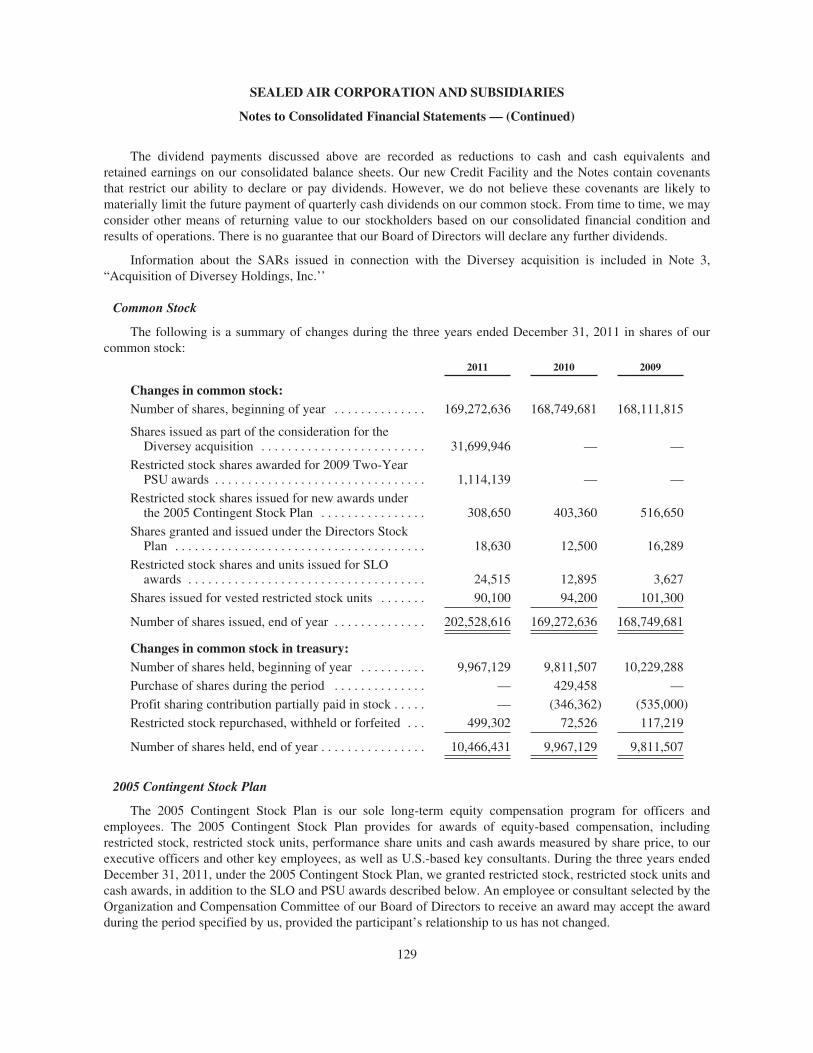
SEALED AIR CORPORATION AND SUBSIDIARIES
Notes to Consolidated Financial Statements — (Continued)
The dividend payments discussed above are recorded as reductions to cash and cash equivalents andretained earnings on our consolidated balance sheets. Our new Credit Facility and the Notes contain covenantsthat restrict our ability to declare or pay dividends. However, we do not believe these covenants are likely tomaterially limit the future payment of quarterly cash dividends on our common stock. From time to time, we mayconsider other means of returning value to our stockholders based on our consolidated financial condition andresults of operations. There is no guarantee that our Board of Directors will declare any further dividends.
Information about the SARs issued in connection with the Diversey acquisition is included in Note 3,“Acquisition of Diversey Holdings, Inc.’’
Common Stock
The following is a summary of changes during the three years ended December 31, 2011 in shares of ourcommon stock:
2011 2010 2009
Changes in common stock:Number of shares, beginning of year . . . . . . . . . . . . . . 169,272,636 168,749,681 168,111,815
Shares issued as part of the consideration for theDiversey acquisition . . . . . . . . . . . . . . . . . . . . . . . . . 31,699,946 — —
Restricted stock shares awarded for 2009 Two-YearPSU awards . . . . . . . . . . . . . . . . . . . . . . . . . . . . . . . . 1,114,139 — —
Restricted stock shares issued for new awards underthe 2005 Contingent Stock Plan . . . . . . . . . . . . . . . . 308,650 403,360 516,650
Shares granted and issued under the Directors StockPlan . . . . . . . . . . . . . . . . . . . . . . . . . . . . . . . . . . . . . . 18,630 12,500 16,289
Restricted stock shares and units issued for SLOawards . . . . . . . . . . . . . . . . . . . . . . . . . . . . . . . . . . . . 24,515 12,895 3,627
Shares issued for vested restricted stock units . . . . . . . 90,100 94,200 101,300
Number of shares issued, end of year . . . . . . . . . . . . . . 202,528,616 169,272,636 168,749,681
Changes in common stock in treasury:Number of shares held, beginning of year . . . . . . . . . . 9,967,129 9,811,507 10,229,288
Purchase of shares during the period . . . . . . . . . . . . . . — 429,458 —
Profit sharing contribution partially paid in stock . . . . . — (346,362) (535,000)
Restricted stock repurchased, withheld or forfeited . . . 499,302 72,526 117,219
Number of shares held, end of year . . . . . . . . . . . . . . . . 10,466,431 9,967,129 9,811,507
2005 Contingent Stock Plan
The 2005 Contingent Stock Plan is our sole long-term equity compensation program for officers andemployees. The 2005 Contingent Stock Plan provides for awards of equity-based compensation, includingrestricted stock, restricted stock units, performance share units and cash awards measured by share price, to ourexecutive officers and other key employees, as well as U.S.-based key consultants. During the three years endedDecember 31, 2011, under the 2005 Contingent Stock Plan, we granted restricted stock, restricted stock units andcash awards, in addition to the SLO and PSU awards described below. An employee or consultant selected by theOrganization and Compensation Committee of our Board of Directors to receive an award may accept the awardduring the period specified by us, provided the participant’s relationship to us has not changed.
129
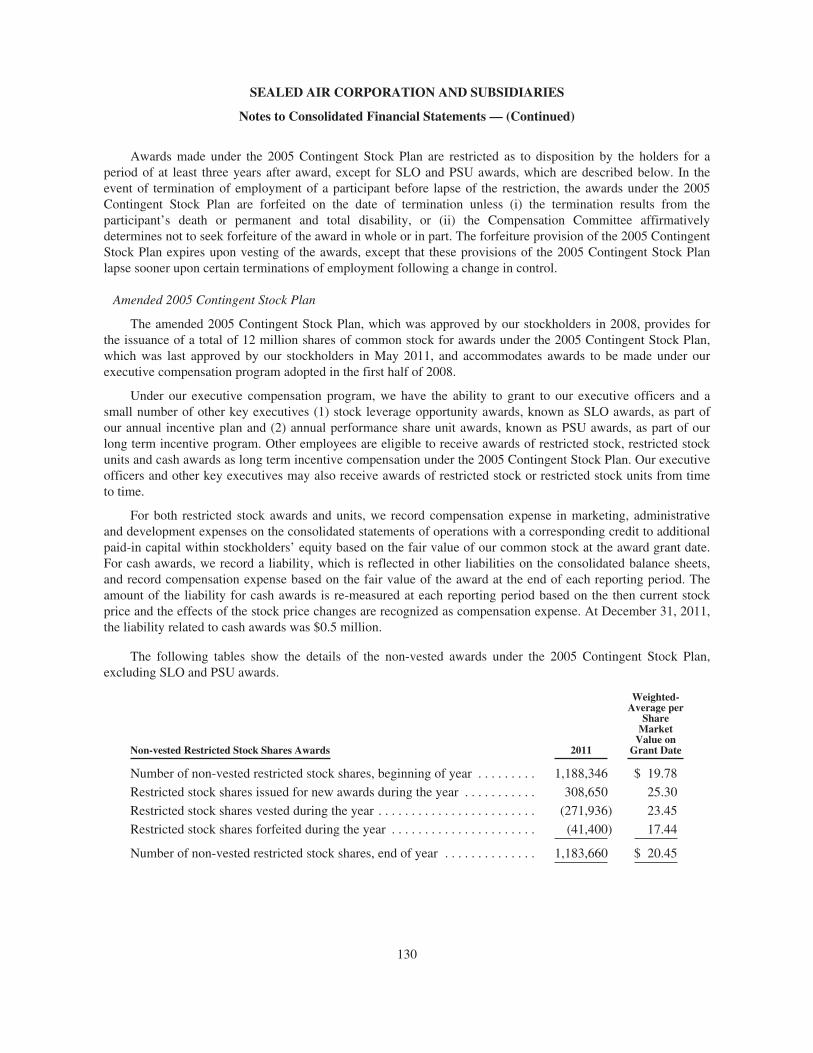
SEALED AIR CORPORATION AND SUBSIDIARIES
Notes to Consolidated Financial Statements — (Continued)
Awards made under the 2005 Contingent Stock Plan are restricted as to disposition by the holders for aperiod of at least three years after award, except for SLO and PSU awards, which are described below. In theevent of termination of employment of a participant before lapse of the restriction, the awards under the 2005Contingent Stock Plan are forfeited on the date of termination unless (i) the termination results from theparticipant’s death or permanent and total disability, or (ii) the Compensation Committee affirmativelydetermines not to seek forfeiture of the award in whole or in part. The forfeiture provision of the 2005 ContingentStock Plan expires upon vesting of the awards, except that these provisions of the 2005 Contingent Stock Planlapse sooner upon certain terminations of employment following a change in control.
Amended 2005 Contingent Stock Plan
The amended 2005 Contingent Stock Plan, which was approved by our stockholders in 2008, provides forthe issuance of a total of 12 million shares of common stock for awards under the 2005 Contingent Stock Plan,which was last approved by our stockholders in May 2011, and accommodates awards to be made under ourexecutive compensation program adopted in the first half of 2008.
Under our executive compensation program, we have the ability to grant to our executive officers and asmall number of other key executives (1) stock leverage opportunity awards, known as SLO awards, as part ofour annual incentive plan and (2) annual performance share unit awards, known as PSU awards, as part of ourlong term incentive program. Other employees are eligible to receive awards of restricted stock, restricted stockunits and cash awards as long term incentive compensation under the 2005 Contingent Stock Plan. Our executiveofficers and other key executives may also receive awards of restricted stock or restricted stock units from timeto time.
For both restricted stock awards and units, we record compensation expense in marketing, administrativeand development expenses on the consolidated statements of operations with a corresponding credit to additionalpaid-in capital within stockholders’ equity based on the fair value of our common stock at the award grant date.For cash awards, we record a liability, which is reflected in other liabilities on the consolidated balance sheets,and record compensation expense based on the fair value of the award at the end of each reporting period. Theamount of the liability for cash awards is re-measured at each reporting period based on the then current stockprice and the effects of the stock price changes are recognized as compensation expense. At December 31, 2011,the liability related to cash awards was $0.5 million.
The following tables show the details of the non-vested awards under the 2005 Contingent Stock Plan,excluding SLO and PSU awards.
Non-vested Restricted Stock Shares Awards 2011
Weighted-Average per
ShareMarket
Value onGrant Date
Number of non-vested restricted stock shares, beginning of year . . . . . . . . . 1,188,346 $ 19.78
Restricted stock shares issued for new awards during the year . . . . . . . . . . . 308,650 25.30
Restricted stock shares vested during the year . . . . . . . . . . . . . . . . . . . . . . . . (271,936) 23.45
Restricted stock shares forfeited during the year . . . . . . . . . . . . . . . . . . . . . . (41,400) 17.44
Number of non-vested restricted stock shares, end of year . . . . . . . . . . . . . . 1,183,660 $ 20.45
130
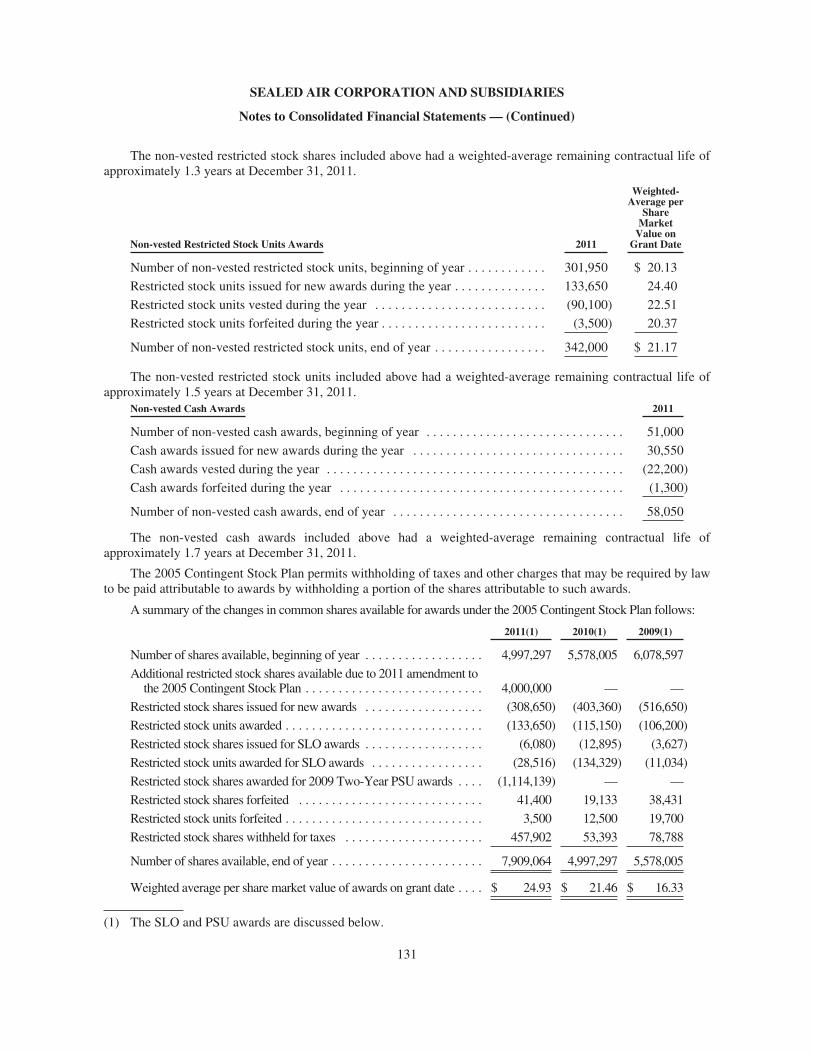
SEALED AIR CORPORATION AND SUBSIDIARIES
Notes to Consolidated Financial Statements — (Continued)
The non-vested restricted stock shares included above had a weighted-average remaining contractual life ofapproximately 1.3 years at December 31, 2011.
Non-vested Restricted Stock Units Awards 2011
Weighted-Average per
ShareMarket
Value onGrant Date
Number of non-vested restricted stock units, beginning of year . . . . . . . . . . . . 301,950 $ 20.13
Restricted stock units issued for new awards during the year . . . . . . . . . . . . . . 133,650 24.40
Restricted stock units vested during the year . . . . . . . . . . . . . . . . . . . . . . . . . . (90,100) 22.51
Restricted stock units forfeited during the year . . . . . . . . . . . . . . . . . . . . . . . . . (3,500) 20.37
Number of non-vested restricted stock units, end of year . . . . . . . . . . . . . . . . . 342,000 $ 21.17
The non-vested restricted stock units included above had a weighted-average remaining contractual life ofapproximately 1.5 years at December 31, 2011.
Non-vested Cash Awards 2011
Number of non-vested cash awards, beginning of year . . . . . . . . . . . . . . . . . . . . . . . . . . . . . . 51,000
Cash awards issued for new awards during the year . . . . . . . . . . . . . . . . . . . . . . . . . . . . . . . . 30,550
Cash awards vested during the year . . . . . . . . . . . . . . . . . . . . . . . . . . . . . . . . . . . . . . . . . . . . . (22,200)
Cash awards forfeited during the year . . . . . . . . . . . . . . . . . . . . . . . . . . . . . . . . . . . . . . . . . . . (1,300)
Number of non-vested cash awards, end of year . . . . . . . . . . . . . . . . . . . . . . . . . . . . . . . . . . . 58,050
The non-vested cash awards included above had a weighted-average remaining contractual life ofapproximately 1.7 years at December 31, 2011.
The 2005 Contingent Stock Plan permits withholding of taxes and other charges that may be required by lawto be paid attributable to awards by withholding a portion of the shares attributable to such awards.
A summary of the changes in common shares available for awards under the 2005 Contingent Stock Plan follows:
2011(1) 2010(1) 2009(1)
Number of shares available, beginning of year . . . . . . . . . . . . . . . . . . 4,997,297 5,578,005 6,078,597
Additional restricted stock shares available due to 2011 amendment tothe 2005 Contingent Stock Plan . . . . . . . . . . . . . . . . . . . . . . . . . . . 4,000,000 — —
Restricted stock shares issued for new awards . . . . . . . . . . . . . . . . . . (308,650) (403,360) (516,650)
Restricted stock units awarded . . . . . . . . . . . . . . . . . . . . . . . . . . . . . . (133,650) (115,150) (106,200)
Restricted stock shares issued for SLO awards . . . . . . . . . . . . . . . . . . (6,080) (12,895) (3,627)
Restricted stock units awarded for SLO awards . . . . . . . . . . . . . . . . . (28,516) (134,329) (11,034)
Restricted stock shares awarded for 2009 Two-Year PSU awards . . . . (1,114,139) — —
Restricted stock shares forfeited . . . . . . . . . . . . . . . . . . . . . . . . . . . . 41,400 19,133 38,431
Restricted stock units forfeited . . . . . . . . . . . . . . . . . . . . . . . . . . . . . . 3,500 12,500 19,700
Restricted stock shares withheld for taxes . . . . . . . . . . . . . . . . . . . . . 457,902 53,393 78,788
Number of shares available, end of year . . . . . . . . . . . . . . . . . . . . . . . 7,909,064 4,997,297 5,578,005
Weighted average per share market value of awards on grant date . . . . $ 24.93 $ 21.46 $ 16.33
(1) The SLO and PSU awards are discussed below.
131
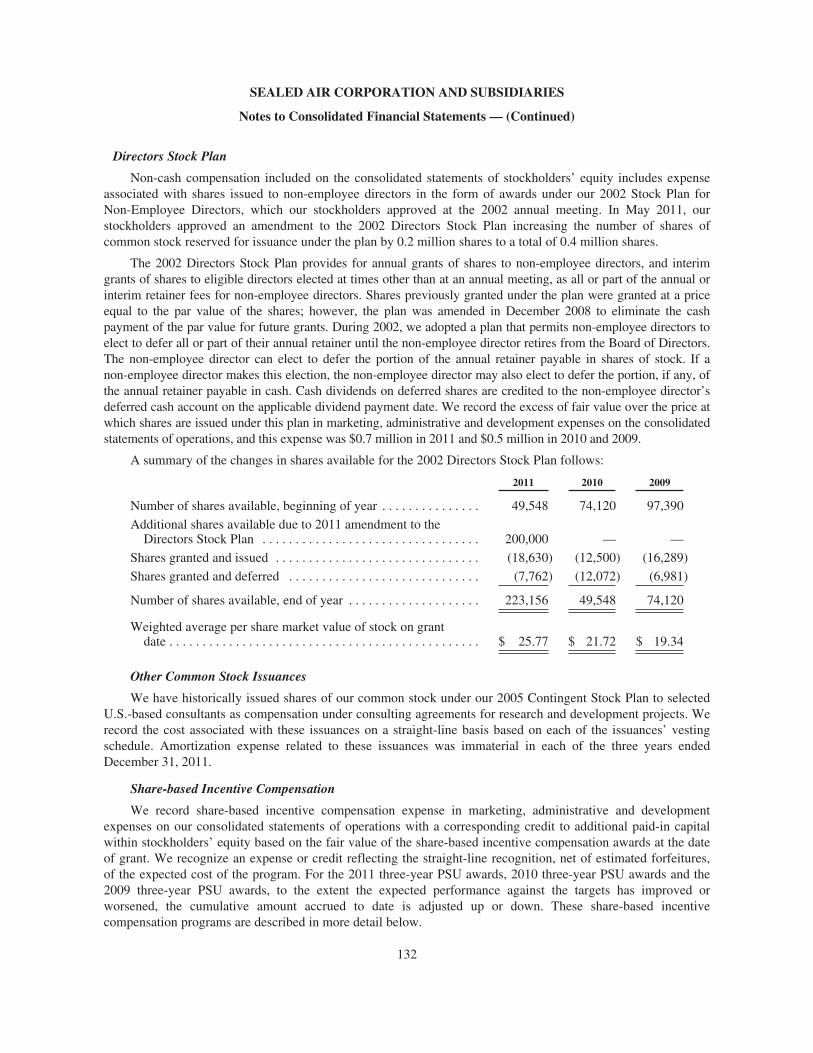
SEALED AIR CORPORATION AND SUBSIDIARIES
Notes to Consolidated Financial Statements — (Continued)
Directors Stock Plan
Non-cash compensation included on the consolidated statements of stockholders’ equity includes expenseassociated with shares issued to non-employee directors in the form of awards under our 2002 Stock Plan forNon-Employee Directors, which our stockholders approved at the 2002 annual meeting. In May 2011, ourstockholders approved an amendment to the 2002 Directors Stock Plan increasing the number of shares ofcommon stock reserved for issuance under the plan by 0.2 million shares to a total of 0.4 million shares.
The 2002 Directors Stock Plan provides for annual grants of shares to non-employee directors, and interimgrants of shares to eligible directors elected at times other than at an annual meeting, as all or part of the annual orinterim retainer fees for non-employee directors. Shares previously granted under the plan were granted at a priceequal to the par value of the shares; however, the plan was amended in December 2008 to eliminate the cashpayment of the par value for future grants. During 2002, we adopted a plan that permits non-employee directors toelect to defer all or part of their annual retainer until the non-employee director retires from the Board of Directors.The non-employee director can elect to defer the portion of the annual retainer payable in shares of stock. If anon-employee director makes this election, the non-employee director may also elect to defer the portion, if any, ofthe annual retainer payable in cash. Cash dividends on deferred shares are credited to the non-employee director’sdeferred cash account on the applicable dividend payment date. We record the excess of fair value over the price atwhich shares are issued under this plan in marketing, administrative and development expenses on the consolidatedstatements of operations, and this expense was $0.7 million in 2011 and $0.5 million in 2010 and 2009.
A summary of the changes in shares available for the 2002 Directors Stock Plan follows:
2011 2010 2009
Number of shares available, beginning of year . . . . . . . . . . . . . . . 49,548 74,120 97,390
Additional shares available due to 2011 amendment to theDirectors Stock Plan . . . . . . . . . . . . . . . . . . . . . . . . . . . . . . . . . 200,000 — —
Shares granted and issued . . . . . . . . . . . . . . . . . . . . . . . . . . . . . . . (18,630) (12,500) (16,289)
Shares granted and deferred . . . . . . . . . . . . . . . . . . . . . . . . . . . . . (7,762) (12,072) (6,981)
Number of shares available, end of year . . . . . . . . . . . . . . . . . . . . 223,156 49,548 74,120
Weighted average per share market value of stock on grantdate . . . . . . . . . . . . . . . . . . . . . . . . . . . . . . . . . . . . . . . . . . . . . . . $ 25.77 $ 21.72 $ 19.34
Other Common Stock Issuances
We have historically issued shares of our common stock under our 2005 Contingent Stock Plan to selectedU.S.-based consultants as compensation under consulting agreements for research and development projects. Werecord the cost associated with these issuances on a straight-line basis based on each of the issuances’ vestingschedule. Amortization expense related to these issuances was immaterial in each of the three years endedDecember 31, 2011.
Share-based Incentive Compensation
We record share-based incentive compensation expense in marketing, administrative and developmentexpenses on our consolidated statements of operations with a corresponding credit to additional paid-in capitalwithin stockholders’ equity based on the fair value of the share-based incentive compensation awards at the dateof grant. We recognize an expense or credit reflecting the straight-line recognition, net of estimated forfeitures,of the expected cost of the program. For the 2011 three-year PSU awards, 2010 three-year PSU awards and the2009 three-year PSU awards, to the extent the expected performance against the targets has improved orworsened, the cumulative amount accrued to date is adjusted up or down. These share-based incentivecompensation programs are described in more detail below.
132
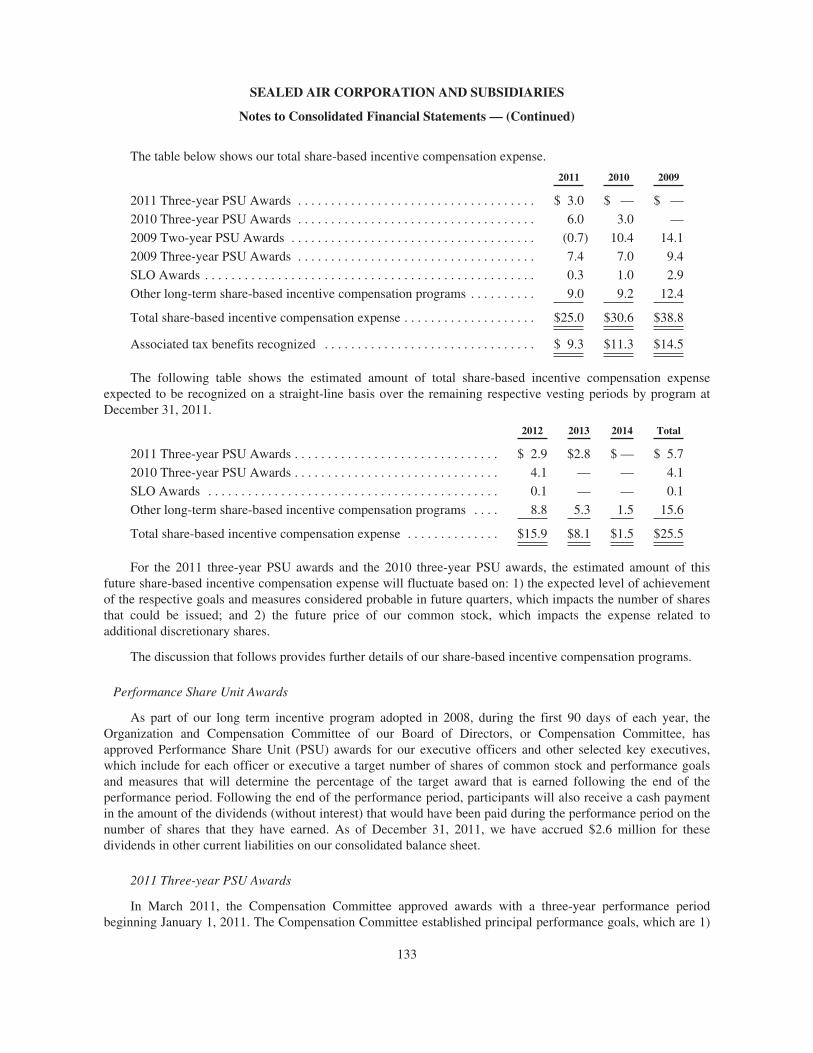
SEALED AIR CORPORATION AND SUBSIDIARIES
Notes to Consolidated Financial Statements — (Continued)
The table below shows our total share-based incentive compensation expense.
2011 2010 2009
2011 Three-year PSU Awards . . . . . . . . . . . . . . . . . . . . . . . . . . . . . . . . . . . . $ 3.0 $ — $ —
2010 Three-year PSU Awards . . . . . . . . . . . . . . . . . . . . . . . . . . . . . . . . . . . . 6.0 3.0 —
2009 Two-year PSU Awards . . . . . . . . . . . . . . . . . . . . . . . . . . . . . . . . . . . . . (0.7) 10.4 14.1
2009 Three-year PSU Awards . . . . . . . . . . . . . . . . . . . . . . . . . . . . . . . . . . . . 7.4 7.0 9.4
SLO Awards . . . . . . . . . . . . . . . . . . . . . . . . . . . . . . . . . . . . . . . . . . . . . . . . . . 0.3 1.0 2.9
Other long-term share-based incentive compensation programs . . . . . . . . . . 9.0 9.2 12.4
Total share-based incentive compensation expense . . . . . . . . . . . . . . . . . . . . $25.0 $30.6 $38.8
Associated tax benefits recognized . . . . . . . . . . . . . . . . . . . . . . . . . . . . . . . . $ 9.3 $11.3 $14.5
The following table shows the estimated amount of total share-based incentive compensation expenseexpected to be recognized on a straight-line basis over the remaining respective vesting periods by program atDecember 31, 2011.
2012 2013 2014 Total
2011 Three-year PSU Awards . . . . . . . . . . . . . . . . . . . . . . . . . . . . . . . $ 2.9 $2.8 $ — $ 5.7
2010 Three-year PSU Awards . . . . . . . . . . . . . . . . . . . . . . . . . . . . . . . 4.1 — — 4.1
SLO Awards . . . . . . . . . . . . . . . . . . . . . . . . . . . . . . . . . . . . . . . . . . . . 0.1 — — 0.1
Other long-term share-based incentive compensation programs . . . . 8.8 5.3 1.5 15.6
Total share-based incentive compensation expense . . . . . . . . . . . . . . $15.9 $8.1 $1.5 $25.5
For the 2011 three-year PSU awards and the 2010 three-year PSU awards, the estimated amount of thisfuture share-based incentive compensation expense will fluctuate based on: 1) the expected level of achievementof the respective goals and measures considered probable in future quarters, which impacts the number of sharesthat could be issued; and 2) the future price of our common stock, which impacts the expense related toadditional discretionary shares.
The discussion that follows provides further details of our share-based incentive compensation programs.
Performance Share Unit Awards
As part of our long term incentive program adopted in 2008, during the first 90 days of each year, theOrganization and Compensation Committee of our Board of Directors, or Compensation Committee, hasapproved Performance Share Unit (PSU) awards for our executive officers and other selected key executives,which include for each officer or executive a target number of shares of common stock and performance goalsand measures that will determine the percentage of the target award that is earned following the end of theperformance period. Following the end of the performance period, participants will also receive a cash paymentin the amount of the dividends (without interest) that would have been paid during the performance period on thenumber of shares that they have earned. As of December 31, 2011, we have accrued $2.6 million for thesedividends in other current liabilities on our consolidated balance sheet.
2011 Three-year PSU Awards
In March 2011, the Compensation Committee approved awards with a three-year performance periodbeginning January 1, 2011. The Compensation Committee established principal performance goals, which are 1)
133
SEALED AIR CORPORATION AND SUBSIDIARIES
Notes to Consolidated Financial Statements — (Continued)
three-year cumulative volume growth of net trade sales and 2) three-year average return on invested capital("ROIC"). These performance goals are outlined in further detail in the Proxy Statement for our 2011 AnnualMeeting of Stockholders. The targeted number of shares of common stock that can be earned is 384,714 sharesfor these 2011 PSU awards. If the threshold level is achieved for either of the two performance goals mentionedabove, then the number of shares earned for each participant can be increased (if the additional goal mentionedbelow is achieved) or decreased (if the additional goal mentioned below is not achieved) by up to 10% of thetarget level at the discretion of the Compensation Committee, or an aggregate of 38,471 shares for allparticipants. The additional goal is a 2013 safety result of a total recordable incident rate (a workplace safetyindicator) (“TRIR”) of 1.20 or better, excluding facilities acquired during the performance period.
The total number of shares to be issued for these awards can range from zero to 200% of the target numberof shares depending on the level of achievement of the performance goals and measures, plus or minus the38,471 additional discretionary shares mentioned above.
The expense included in the table above was calculated using a grant date common stock share price of$26.18 per share on March 11, 2011 and is based on management's estimate as of December 31, 2011 of the levelof probable achievement of the performance goals and measures, which was determined to be at the target level,or 100% achievement (192,357 shares, net of forfeitures), for the ROIC goal and below the target level, or 74%achievement (142,344 shares, net of forfeitures), for the volume goal.
2010 Three-year PSU Awards
In March 2010, the Compensation Committee approved awards with a three-year performance periodbeginning January 1, 2010. The Compensation Committee established principal performance goals, which are 1)three-year cumulative volume growth of net trade sales and 2) three-year average ROIC. These performancegoals are outlined in further detail in the Proxy Statement for our 2011 Annual Meeting of Stockholders. Thetargeted number of shares of common stock that can be earned is 416,160 shares for these 2010 PSU awards. Ifthe threshold level is achieved for either of the two performance goals mentioned above, then the number ofshares earned for each participant can be increased (if the additional goal mentioned below is achieved) ordecreased (if the additional goal mentioned below is not achieved) by up to 10% of the target level at thediscretion of the Compensation Committee, or an aggregate of 41,616 shares for all participants. The additionalgoal is a 2012 safety result of TRIR of 1.20 or better, excluding facilities acquired during the performanceperiod.
The total number of shares to be issued for these awards can range from zero to 200% of the target numberof shares depending on the level of achievement of the performance goals and measures, plus or minus the41,616 additional discretionary shares mentioned above.
The expense included in the table above was calculated using a grant date common stock share price of$20.88 per share on March 8, 2010 and is based on management's estimate as of December 31, 2011 of the levelof probable achievement of the performance goals and measures, which was determined to be at the maximumlevel, or 200% achievement (416,160, net of forfeitures) for the volume goal and at the target level, or 100%achievement (208,080 shares, net of forfeitures) for the ROIC goal.
2009 Three-year PSU Awards
The targeted number of shares of common stock that can be earned is 578,432 for the 2009 three-year PSUaward. The total number of shares to be issued for each PSU for the three-year awards can range from zero to200% of the target number of shares depending on the level of achievement of the operating profit performancegoals and measures. If the threshold level is achieved for the operating performance goals and measures, then thenumber of shares earned for each participant can be increased (if the additional goals mentioned below are
134
SEALED AIR CORPORATION AND SUBSIDIARIES
Notes to Consolidated Financial Statements — (Continued)
achieved) or decreased (if the additional goals mentioned below are not achieved) by up to 10% of the target level atthe discretion of the Compensation Committee, or an aggregate of 57,843 shares for all participants. The additionalgoals are 1) average quarterly inventory days on hand starting December 31, 2008 through the performance periodbelow the average quarterly days on hand for the period December 31, 2007 through December 31, 2008; and 2) asafety result for the final year of the performance period of TRIR of 1.30 or better, excluding facilities acquired duringthe performance period. These provisions are outlined in further detail in the Proxy Statement for our 2010 AnnualMeeting of Stockholders. Probable achievement of the operating profit performance goals and measures based onmanagement’s estimate as of December 31, 2011 was determined to be at the maximum level, or 200% achievement(1,156,865 shares, net of forfeitures). The expense included in the table above for the shares related to the achievementof the operating performance goals and measures was calculated using a common stock share price of $20.88 per shareon March 8, 2010. The expense included in the table above for the shares related to the additional goals was calculatedusing a common stock share price of $17.21 on December 31, 2011, because of their discretionary nature.
2009 Two-year PSU Awards
In February 2011, we issued 1,114,139 shares of common stock for the 2009 two-year PSU awards. Theseawards were based on the achievement of the operating profit performance goals and measures at the maximumlevel, or 200% achievement in the two-year performance period of 2009 through 2010. We concurrently acquired408,751 of these shares of common stock as withholding from employees to satisfy their minimum taxwithholding obligations, as provided for in our 2005 contingent stock plan. These acquired shares are held incommon stock in treasury at a fair market value on the date acquired of $12 million.
Stock Leverage Opportunity Awards
Before the start of each performance year, each of our executive officers and other selected key executivesis eligible to elect to receive all or a portion of his or her annual cash bonus for that year, in increments of 25% ofthe annual bonus, as an award of restricted stock or restricted stock units under the 2005 contingent stock plan inlieu of cash. The portion provided as an equity award may be given a premium to be determined by theCompensation Committee each year and will be rounded up to the nearest whole share. The stock price used inthe calculation of the number of shares will be the closing sale price of our common stock on the New YorkStock Exchange on the first trading day of the performance year. The award will be granted following the end ofthe performance year and after determination by the Compensation Committee of the amount of the annual bonusaward for each executive officer and other selected key executive who has elected to take all or a portion of his orher annual bonus as an equity award, but no later than the March 15 following the end of the performance year.
The equity award will be made in the form of an award of restricted stock or restricted stock units that willvest on the second anniversary of the grant date or earlier in the event of death, disability or retirement fromemployment with us, and the shares subject to the award will not be transferable by the recipient until the later ofvesting or the second anniversary of the grant date. If the recipient ceases to be employed by us before vesting,then the shares will be forfeited, except for certain circumstances following a change in control. The award willbe made in the form of restricted stock unless the award would be taxable to the recipient before the sharesbecome transferable by the recipient, in which case the award will be made in the form of restricted stock units.Recipients who hold SLO awards in the form of restricted stock receive dividends. Recipients who hold SLOawards in the form of restricted stock units receive a cash payment in the amount of the dividends (withoutinterest) on the shares they have earned at about the same time that shares are issued to them following the periodof restriction. As of December 31, 2011, we have accrued for these dividends in other current liabilities on ourconsolidated balance sheet and the amount was immaterial.
For 2011, the Compensation Committee set the SLO award premium at 25%. The 2011 SLO target awardscomprise an aggregate of 77,926 restricted stock shares and restricted stock units as of December 31, 2011. For2010, the Compensation Committee set the SLO award premium at 25%. The 2010 SLO awards that were issuedon March 13, 2011 comprised an aggregate of 34,596 restricted stock shares and restricted stock units.
135
SEALED AIR CORPORATION AND SUBSIDIARIES
Notes to Consolidated Financial Statements — (Continued)
We record compensation expense for these awards in marketing, administrative and development expenseson the consolidated statement of operations with a corresponding credit to additional paid-in-capital withinstockholders’ equity, based on the fair value of the awards at the end of each reporting period, which reflects theeffects of stock price changes.
For the year ended December 31, 2011, compensation expense related to the 2011 SLO awards wasrecognized based on the extent to which the performance goals and measures for our 2011 annual cash bonuseswere considered probable of achievement at December 31, 2011. This expense is being recognized over a fifteenmonth period on a straight-line basis since a majority of the awards will vest at grant date, which will be no laterthan March 15, 2012, due to the retirement eligibility provision.
For the year ended December 31, 2010, compensation expense related to the 2010 SLO awards wasrecognized based on the extent to which the performance goals and measures for 2010 annual cash bonuses wereconsidered probable of achievement at December 31, 2010. This expense was recognized over a fifteen monthperiod on a straight-line basis since a majority of the awards vested at grant date, which was March 13, 2011, dueto the retirement eligibility provision.
Other Long-term Share-based Incentive Compensation
Under our 2005 contingent stock plan, the Compensation Committee may grant our employees awards ofrestricted stock, restricted stock units and cash awards measured by share price as long-term share-basedincentive compensation. Our executive officers and other key executives may also receive awards of restrictedstock or restricted stock units from time to time.
136
SEALED AIR CORPORATION AND SUBSIDIARIES
Notes to Consolidated Financial Statements — (Continued)
Note 19 Net Earnings Per Common Share
The following table sets forth the calculation of basic and diluted net earnings per common share under thetwo-class method for the three years ended December 31, 2011 in millions, except per share data.
2011 2010 2009
Basic Net Earnings Per Common Share:NumeratorNet earnings available to common stockholders . . . . . . . . . . . . . . . . . . . $149.1 $255.9 $244.3Distributed and allocated undistributed net earnings to non-vested
restricted stockholders . . . . . . . . . . . . . . . . . . . . . . . . . . . . . . . . . . . . . (0.9) (1.6) (1.9)
Distributed and allocated undistributed net earnings to commonstockholders . . . . . . . . . . . . . . . . . . . . . . . . . . . . . . . . . . . . . . . . . . . . 148.2 254.3 242.4
Distributed net earnings — dividends paid to common stockholders . . . (86.8) (79.2) (75.6)
Allocation of undistributed net earnings to commonstockholders . . . . . . . . . . . . . . . . . . . . . . . . . . . . . . . . . . . . . . . . . . . . $ 61.4 $175.1 $166.8
DenominatorWeighted average number of common shares outstanding — basic
(1) . . . . . . . . . . . . . . . . . . . . . . . . . . . . . . . . . . . . . . . . . . . . . . . . . . . . . 167.0 158.3 157.2
Basic net earnings per common share:Distributed net earnings to common stockholders . . . . . . . . . . . . . . . . . . $ 0.52 $ 0.50 $ 0.48Allocated undistributed net earnings to common stockholders . . . . . . . . 0.37 1.11 1.06
Basic net earnings per common share: . . . . . . . . . . . . . . . . . . . . . . . . . $ 0.89 $ 1.61 $ 1.54
Diluted Net Earnings Per Common Share:NumeratorDistributed and allocated undistributed net earnings to common
stockholders . . . . . . . . . . . . . . . . . . . . . . . . . . . . . . . . . . . . . . . . . . . . . $148.2 $254.3 $242.4Add: Allocated undistributed net earnings to non-vested restricted
stockholders . . . . . . . . . . . . . . . . . . . . . . . . . . . . . . . . . . . . . . . . . . . . . 0.4 1.1 1.3Interest on 3% Convertible Senior Notes, net of taxes(2) . . . . . . . . . . . . — — 4.4Less: Undistributed net earnings reallocated to non-vested restricted
stockholders . . . . . . . . . . . . . . . . . . . . . . . . . . . . . . . . . . . . . . . . . . . . . (0.3) (1.0) (1.2)
Net earnings available to common stockholders — diluted . . . . . . . . $148.3 $254.4 $246.9
DenominatorWeighted average number of common shares outstanding — basic . . . . 167.0 158.3 157.2Effect of assumed issuance of Settlement agreement shares . . . . . . . . . . 18.0 18.0 18.0Effect of non-vested restricted stock units . . . . . . . . . . . . . . . . . . . . . . . . 0.4 0.4 0.2Effect of conversion of 3% Convertible Senior Notes(2) . . . . . . . . . . . . — — 7.2
Weighted average number of common shares outstanding — diluted . . 185.4 176.7 182.6
Diluted net earnings per common share . . . . . . . . . . . . . . . . . . . . . . . $ 0.80 $ 1.44 $ 1.35
(1) On October 3, 2011, we completed the acquisition of Diversey. Under the terms of the acquisitionagreement, we paid in aggregate, $2.1 billion in cash consideration and an aggregate of 31.7 million shares
137
SEALED AIR CORPORATION AND SUBSIDIARIES
Notes to Consolidated Financial Statements — (Continued)
of our common stock, to the shareholders of Diversey. These shares are issued and outstanding as of October 3,2011 and included in the weighted average number of common shares outstanding — basic in 2011.
(2) On July 19, 2009, we redeemed all of our 3% Convertible Senior Notes due June 2033.
Diluted weighted average number of common shares outstanding provides for the following items if theirinclusion is dilutive: (1) the effect of assumed issuance of 18 million shares of common stock reserved for theSettlement agreement in the three years ended December 31, 2011, (2) the effect of non-vested restricted stockand restricted stock units using the treasury stock method in the three years ended December 31, 2011 and (3) theeffect of conversion of our then-outstanding 3% Convertible Senior Notes due June 2033 in July 2009 in 2009.
PSU Awards
Since the PSU awards discussed in Note 18, “Stockholders’ Equity,” are contingently issuable shares thatare based on a condition other than earnings or market price, these shares will be included in the diluted weightedaverage number of common shares outstanding when they have met the performance conditions as of these dates.The shares for the 2009 three-year PSU awards and the shares for the 2010 three-year PSU awards are includedin the diluted weighted average number of common shares outstanding for the year ended December 31, 2011because the target levels of their respective performance conditions were met as of December 31, 2011. Theshares for the 2011 three-year PSU awards have not been included in the diluted weighted average number ofcommon shares outstanding for the year ended December 31, 2011 because they have not met the target levels oftheir performance conditions as of these dates.
SLO Awards
The shares or units associated with the 2011 SLO awards are considered contingently issuable shares andtherefore are not included in the basic or diluted weighted average number of common shares outstanding for theyear ended December 31, 2011. These shares or units, discussed in Note 18, “Stockholders’ Equity,” will not beincluded in the common shares outstanding until the final determination of the amount of annual incentivecompensation is made in the first quarter of the following year. Once this determination is made, the shares orunits will be included in the basic weighted average number of common shares outstanding if the employee isretirement eligible or in the diluted weighted average number of common shares outstanding if the employee isnot retirement eligible. The numbers of shares or units associated with SLO awards for the 2010 and earlier fiscalyears that were included in the common shares outstanding for year ended December 31, 2011 and 2010 werenominal.
Note 20 Other Expense, net
The following table provides details of other expense, net:
2011 2010 2009
Interest and dividend income . . . . . . . . . . . . . . . . . . . . . . . . . . . . . . . . . . . . . $ 9.0 $ 8.1 $ 7.1Net foreign exchange transaction losses(1) . . . . . . . . . . . . . . . . . . . . . . . . . . (20.0) (5.9) (1.1)Gain on sale of a North American facility . . . . . . . . . . . . . . . . . . . . . . . . . . . 3.9 — —Settlement agreement and related costs . . . . . . . . . . . . . . . . . . . . . . . . . . . . . (0.9) (0.6) (1.8)Noncontrolling interests . . . . . . . . . . . . . . . . . . . . . . . . . . . . . . . . . . . . . . . . . 3.2 2.3 1.8Costs associated with our accounts receivable securitization program . . . . . (0.7) (0.8) (0.7)Other, net . . . . . . . . . . . . . . . . . . . . . . . . . . . . . . . . . . . . . . . . . . . . . . . . . . . . (8.4) (6.0) (5.4)
Other expense, net . . . . . . . . . . . . . . . . . . . . . . . . . . . . . . . . . . . . . . . . . . . . . $(13.9) $(2.9) $(0.1)
(1) The non-cash losses in 2011 includes gains and losses from foreign currency forward contracts entered into tohedge certain intercompany loans, as well as gains and losses on the remeasurement of intercompany loans.
138
SEALED AIR CORPORATION AND SUBSIDIARIES
Notes to Consolidated Financial Statements — (Continued)
Note 21 Related Party Transactions
As a result of the acquisition of Diversey, as of October 3, 2011, SCJ owned approximately 8% of ouroutstanding shares of our common stock and Unilever owned less than 1% of our outstanding shares of ourcommon stock. Our Diversey segment has various transactions with both SCJ and Unilever that are consideredrelated party transactions.
Related Party Transactions with SCJ
The primary related party transactions with SCJ consist of purchases of some raw materials and products forour Diversey segment from SCJ, which expire in 2017. Total inventory purchased from SCJ was $11 million inthe fourth quarter of 2011. In addition, our Diversey segment leases some facilities from SCJ. Charges for theseservices and leases totaled $3 million in the fourth quarter of 2011. Our Diversey segment licenses the use ofcertain trade names, house marks and brand names from SCJ. Payments to SCJ under the license agreementsgoverning the names and marks totaled $1 million in 2011.
Related Party Transactions with Unilever
In connection with a May 2002 acquisition of the DiverseyLever business, Diversey entered into a SalesAgency Agreement with Unilever whereby Diversey acts as Unilever’s sales agent in the sale of Unilever’sconsumer brand cleaning products to institutional and industrial end-users. The original term of the sales agencyagreement was extended until December 31, 2007. On October 11, 2007, Diversey and Unilever executed theUmbrella Agreement pursuant to which the parties agreed to the terms of (i) the New Agency Agreement that issubstantially similar to the Prior Agency Agreement and that applies to Ireland, the United Kingdom, Portugaland Brazil and (ii) the License Agreement under which Unilever agreed to grant us and our affiliates a license toproduce and sell professional packs of Unilever’s consumer brand cleaning products in 31 other countries thatwere subject to the Prior Agency Agreement. Under the Umbrella Agreement, Diversey and its affiliates alsoentered into agreements with Unilever to distribute consumer packs of Unilever’s consumer brand cleaningproducts in the same 31 countries as the License Agreement. The New Agency Agreement, the LicenseAgreement and the consumer pack distribution arrangements took effect on January 1, 2008 and expire in 2018.
Amounts earned under the New Agency Agreement were $6 million in the fourth quarter of 2011. Royaltiespaid under the License Agreement were $1 million in the fourth quarter of 2011.
Related-party receivables and payables, which are included in receivables, net, and accounts payable on ourconsolidated balances sheets at December 31, 2011, consisted of the following:
December 31,2011
Related party receivable – SCJ . . . . . . . . . . . . . . . . . . . . . . . . . . . . . . . . . . . . . . . . . . . . . . $0.1Related party receivable – Unilever . . . . . . . . . . . . . . . . . . . . . . . . . . . . . . . . . . . . . . . . . . 7.7Total related party receivables . . . . . . . . . . . . . . . . . . . . . . . . . . . . . . . . . . . . . . . . . . . . . . $7.8
Related party payable – SCJ . . . . . . . . . . . . . . . . . . . . . . . . . . . . . . . . . . . . . . . . . . . . . . . . $8.0Related party payable – Unilever . . . . . . . . . . . . . . . . . . . . . . . . . . . . . . . . . . . . . . . . . . . . 19.5Total related party payables . . . . . . . . . . . . . . . . . . . . . . . . . . . . . . . . . . . . . . . . . . . . . . . . $27.5
139
Item 9. Changes in and Disagreements With Accountants on Accounting and Financial Disclosure
None.
Item 9A. Controls and Procedures
Disclosure Controls and Procedures
We maintain disclosure controls and procedures, as defined in Rule 13a-15 under the Securities ExchangeAct of 1934, as amended, that are designed to ensure that information required to be disclosed in our reports thatwe file or submit under the Exchange Act is recorded, processed, summarized and reported within the timeperiods specified in the SEC’s rules and forms and that our employees accumulate this information andcommunicate it to our management, including our Chief Executive Officer (our principal executive officer) andour Chief Financial Officer (our principal financial officer), as appropriate, to allow timely decisions regardingthe required disclosure. In designing and evaluating the disclosure controls and procedures, our managementrecognizes that any controls and procedures, no matter how well designed and operated, can provide only“reasonable assurance” of achieving the desired control objectives, and management necessarily must apply itsjudgment in evaluating the cost-benefit relationship of possible controls and procedures.
Evaluation of Disclosure Controls and Procedures
As of the end of the period covered by this report, we carried out an evaluation of the effectiveness of thedesign and operation of our disclosure controls and procedures under Rule 13a-15. Our management, includingour Chief Executive Officer and Chief Financial Officer, supervised and participated in this evaluation. Basedupon that evaluation, our Chief Executive Officer and Chief Financial Officer concluded that our disclosurecontrols and procedures were effective at the “reasonable assurance” level.
Management’s Annual Report on Internal Control over Financial Reporting
Our management is responsible for establishing and maintaining adequate internal control over financial reportingas such term is defined in Rule 13a-15(f) under the Exchange Act. Management evaluated, with the participation of ourChief Executive Officer and Chief Financial Officer, the effectiveness, as of the end of our 2011 fiscal year, of ourinternal control over financial reporting. The suitable recognized control framework on which management’sevaluation of our internal control over financial reporting is based is the Internal Control — Integrated Frameworkissued by the Committee of Sponsoring Organizations of the Treadway Commission, known as COSO. Based uponthat evaluation under the COSO framework, our management concluded that our internal control over financialreporting as of the end of our 2011 fiscal year was effective at the “reasonable assurance” level.
We acquired Diversey on October 3, 2011, and management excluded from our assessment of theeffectiveness of our internal control over financial reporting as of December 31, 2011, Diversey Holdings Inc.’sinternal control over financial reporting associated with total assets of $6.5 billion (of which $4.7 billionrepresented goodwill and intangible assets included within the scope of the assessment) and total net sales of$796 million included in our consolidated financial statements as of and for the year ended December 31, 2011.
Our internal control over financial reporting as of December 31, 2011 has been audited by KPMG LLP, anindependent registered public accounting firm, as stated in their report included in this Annual Report onForm 10-K, which expresses an unqualified opinion on the effectiveness of our internal control over financialreporting as of December 31, 2011.
Changes in Internal Control Over Financial Reporting
The Diversey acquisition on October 3, 2011, resulted in a material change in internal control over financialreporting. Diversey utilizes separate information and accounting systems and processes. With the exception ofthe change in internal control over financial reporting from the Diversey acquisition, there have not been anychanges in our internal control over financial reporting (as such term is defined in Rules 13a-15(f) and 15d-15(f)under the Exchange Act) during the quarter ended December 31, 2011 that have materially affected, or arereasonably likely to material affect, our internal control over financial reporting.
Item 9B. Other Information
None.
140
PART III
Item 10. Directors, Executive Officers and Corporate Governance
Executive Officers of the Registrant
The information appearing in the table below sets forth the current position or positions held by each of ourexecutive officers, the officer’s age as of January 31, 2012, the year in which the officer was first elected to theposition currently held with us or with the former Sealed Air Corporation, now known as Sealed Air Corporation(US) and a wholly-owned subsidiary of the Company, and the year in which such person was first elected anofficer (as indicated in the footnote to the table).
All of our officers serve at the pleasure of the Board of Directors. We have employed all officers for morethan five years except for Dr. Savoca, who was first elected an officer effective July 23, 2008, Mr. Chammas,who was first elected an officer effective December 16, 2010, and Mr. Chidichimo and Mr. Sagnak, who werefirst elected officers effective January 3, 2012.
Before joining us in July 2008, Dr. Savoca was Vice President, Technology, of the Specialty PolymersGroup of Akzo Nobel, a manufacturer of paints, coatings and specialty chemicals from January 2008 throughMay 2008, and prior to that was Vice President, Technology, of National Starch and Chemical Company, amanufacturer of specialty chemicals and starches for use in industrial and commercial applications from January2003 through December 2007. In January 2008, Akzo Nobel acquired National Starch and Chemical Company.
Before joining us in November 2010, Mr. Chammas was the Vice President, Worldwide Supply Chain, forthe Wm. Wrigley Jr. Company, a confectionery company, from October 2008 through October 2010, and prior tothat served in management positions of increasing responsibility in supply chain, operations and procurementwith the Wm. Wrigley Jr. Company from January 2002 until October 2008.
Prior to joining the Company in October 2011 in connection with the Diversey acquisition, Mr. Chidichimowas President, Global Customer Solutions & Innovation of Diversey since December 2010. Prior to that he wasRegional President – Europe, Middle East, Africa from October 2006 of Diversey until November 2010.Mr. Chidichimo, who joined Diversey in 1994, was Regional President – Latin America from July 2005 untilOctober 2006, Vice President of Diversey’s Southern & Andina Latin America sub-region from 2002 until June2005, and managing director of Diversey’s Argentina operations from 1997 until June 2005.
Prior to joining the Company in October 2011 in connection with the Diversey acquisition, Mr. Sagnak wasRegional President – Asia Pacific, Africa, Middle East, Turkey and the Caucasian/Asian Republics (APAT) ofDiversey since December 2010. Prior to that, he held several positions at Diversey including Vice PresidentInstitutional & Laundry Sales & Service – Europe for over two years, Area Vice President – CEETAM (CentralEastern Europe Turkey Africa Middle East) from July 2006 to September 2008 and Managing Director ofTurkey & Middle East for over 3 years prior to that. From September 1995 through March 2003, he served innumerous management positions for Diversey, most recently as Global Customer Development Director –FoodService from February 2000 until February 2003, and National Sales & Marketing Director – Turkey fromSeptember 1995 to January 2000. From January 1990 to September 1995 he held several management positionsin Unilever Turkey, most recently as Group Product Manager – Dental from September 2002 to September 2005.
141
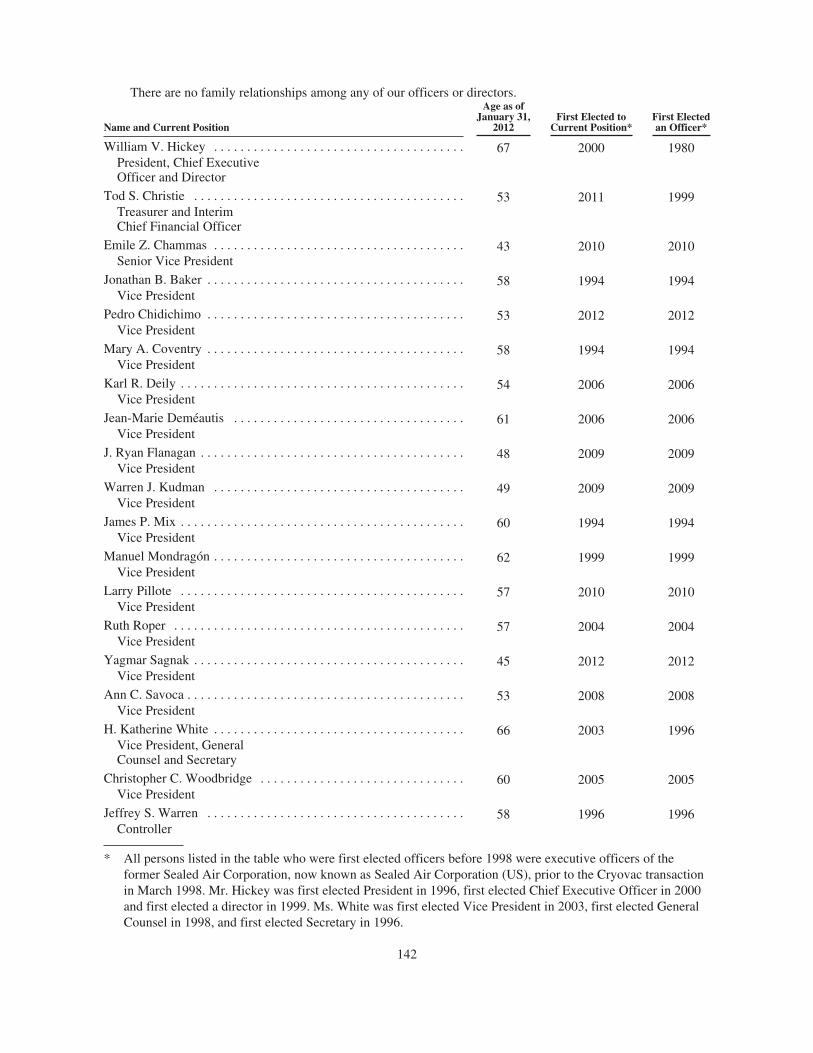
There are no family relationships among any of our officers or directors.
Name and Current Position
Age as ofJanuary 31,
2012First Elected to
Current Position*First Electedan Officer*
William V. Hickey . . . . . . . . . . . . . . . . . . . . . . . . . . . . . . . . . . . . . . 67 2000 1980President, Chief ExecutiveOfficer and Director
Tod S. Christie . . . . . . . . . . . . . . . . . . . . . . . . . . . . . . . . . . . . . . . . . 53 2011 1999Treasurer and InterimChief Financial Officer
Emile Z. Chammas . . . . . . . . . . . . . . . . . . . . . . . . . . . . . . . . . . . . . . 43 2010 2010Senior Vice President
Jonathan B. Baker . . . . . . . . . . . . . . . . . . . . . . . . . . . . . . . . . . . . . . . 58 1994 1994Vice President
Pedro Chidichimo . . . . . . . . . . . . . . . . . . . . . . . . . . . . . . . . . . . . . . . 53 2012 2012Vice President
Mary A. Coventry . . . . . . . . . . . . . . . . . . . . . . . . . . . . . . . . . . . . . . . 58 1994 1994Vice President
Karl R. Deily . . . . . . . . . . . . . . . . . . . . . . . . . . . . . . . . . . . . . . . . . . . 54 2006 2006Vice President
Jean-Marie Deméautis . . . . . . . . . . . . . . . . . . . . . . . . . . . . . . . . . . . 61 2006 2006Vice President
J. Ryan Flanagan . . . . . . . . . . . . . . . . . . . . . . . . . . . . . . . . . . . . . . . . 48 2009 2009Vice President
Warren J. Kudman . . . . . . . . . . . . . . . . . . . . . . . . . . . . . . . . . . . . . . 49 2009 2009Vice President
James P. Mix . . . . . . . . . . . . . . . . . . . . . . . . . . . . . . . . . . . . . . . . . . . 60 1994 1994Vice President
Manuel Mondragón . . . . . . . . . . . . . . . . . . . . . . . . . . . . . . . . . . . . . . 62 1999 1999Vice President
Larry Pillote . . . . . . . . . . . . . . . . . . . . . . . . . . . . . . . . . . . . . . . . . . . 57 2010 2010Vice President
Ruth Roper . . . . . . . . . . . . . . . . . . . . . . . . . . . . . . . . . . . . . . . . . . . . 57 2004 2004Vice President
Yagmar Sagnak . . . . . . . . . . . . . . . . . . . . . . . . . . . . . . . . . . . . . . . . . 45 2012 2012Vice President
Ann C. Savoca . . . . . . . . . . . . . . . . . . . . . . . . . . . . . . . . . . . . . . . . . . 53 2008 2008Vice President
H. Katherine White . . . . . . . . . . . . . . . . . . . . . . . . . . . . . . . . . . . . . . 66 2003 1996Vice President, GeneralCounsel and Secretary
Christopher C. Woodbridge . . . . . . . . . . . . . . . . . . . . . . . . . . . . . . . 60 2005 2005Vice President
Jeffrey S. Warren . . . . . . . . . . . . . . . . . . . . . . . . . . . . . . . . . . . . . . . 58 1996 1996Controller
* All persons listed in the table who were first elected officers before 1998 were executive officers of theformer Sealed Air Corporation, now known as Sealed Air Corporation (US), prior to the Cryovac transactionin March 1998. Mr. Hickey was first elected President in 1996, first elected Chief Executive Officer in 2000and first elected a director in 1999. Ms. White was first elected Vice President in 2003, first elected GeneralCounsel in 1998, and first elected Secretary in 1996.
142
Part of the information required in response to this Item is set forth above and the balance will be includedin our Proxy Statement for our 2012 Annual Meeting of Stockholders under the captions “Election ofDirectors — Information Concerning Nominees” and “Section 16(a) Beneficial Ownership ReportingCompliance,” except as set forth below. All such information is incorporated herein by reference.
We have adopted a Code of Conduct applicable to all of our directors, officers and employees and asupplemental Code of Ethics for Senior Financial Executives applicable to our Chief Executive Officer, ChiefFinancial Officer, Controller, Treasurer, and all other employees performing similar functions for us. The Codeof Conduct and the Code of Ethics for Senior Financial Executives are posted on our website atwww.sealedair.com. We will post any amendments to the Code of Conduct and the Code of Ethics for SeniorFinancial Executives on our website. We will also post any waivers applicable to any of our directors or officers,including the senior financial officers listed above, from provisions of the Code of Conduct or the Code of Ethicsfor Senior Financial Executives on our website.
Our Board of Directors has adopted Corporate Governance Guidelines and charters for its three standingcommittees, the Audit Committee, the Nominating and Corporate Governance Committee, and the CompensationCommittee. Copies of the Corporate Governance Guidelines and the charters are posted on our website atwww.sealedair.com.
Our Audit Committee comprises directors Hank Brown, who serves as chair, Michael Chu, Lawrence R.Codey, Patrick Duff and Kenneth P. Manning. Our Board of Directors has determined that each of the fivemembers of the Audit Committee is an audit committee financial expert in accordance with the standards of theSEC and that each is independent, as defined in the listing standards of the New York Stock Exchange applicableto us and as determined by the Board of Directors.
Item 11. Executive Compensation
The information required in response to this Item will be set forth in our Proxy Statement for our 2012Annual Meeting of Stockholders under the captions “Director Compensation,” “Executive Compensation,”“Compensation Committee Interlocks and Insider Participation” and “Compensation Risks.” Such information isincorporated herein by reference.
Item 12. Security Ownership of Certain Beneficial Owners and Management and Related StockholderMatters
Information required in response to this Item will be set forth in our Proxy Statement for our 2012 AnnualMeeting of Stockholders under the captions “Equity Compensation Plan Information” and “Voting Securities.”Such information is incorporated herein by reference.
Item 13. Certain Relationships and Related Transactions, and Director Independence
The information required in response to this Item will be set forth in our Proxy Statement for our 2012Annual Meeting of Stockholders under the captions “Independence of Directors” and “Certain Relationships andRelated Person Transactions.” Such information is incorporated herein by reference.
Item 14. Principal Accounting Fees and Services
The information required in response to this Item will be included in our Proxy Statement for our 2012Annual Meeting of Stockholders under the captions “Principal Independent Auditor Fees” and “Audit CommitteePre-Approval Policies and Procedures.” Such information is incorporated herein by reference.
143
PART IV
Item 15. Exhibits and Financial Statement Schedules
(a) Documents filed as a part of this Annual Report on Form 10-K:
(1) Financial Statements
See Index to Consolidated Financial Statements and Schedule of this Annual Report on Form 10-K.
(2) Financial Statement Schedule
See Schedule II — Valuation and Qualifying Accounts and Reserves — Years Ended December 31, 2011,2010 and 2009 of this Annual Report on Form 10-K.
(3) Exhibits
ExhibitNumber Description
2.1 Distribution Agreement dated as of March 30, 1998 among the Company, W. R. Grace & Co. —Conn., and W. R. Grace & Co. (Exhibit 2.2 to the Company’s Current Report on Form 8-K, Date ofReport March 31, 1998, File No. 1-12139, is incorporated herein by reference.)
2.2 Agreement and Plan of Merger, dated as of May 31, 2011, by and among Sealed Air Corporation,Solution Acquisition Corp. and Diversey Holdings, Inc. (the schedules and exhibits have beenomitted pursuant to Item 601(b)(2) of Regulation S-K; a copy of any omitted schedule will befurnished supplementally to the Securities and Exchange Commission upon request). (Exhibit 2.1 tothe Company’s Current Report on Form 8-K, Date of Report May 31, 2011, File No. 1-12139, isincorporated herein by reference.)
3.1 Unofficial Composite Amended and Restated Certificate of Incorporation of the Company ascurrently in effect. (Exhibit 3.1 to the Company’s Registration Statement on Form S-3, RegistrationNo. 333-108544, is incorporated herein by reference.)
3.2 Amended and Restated By-Laws of the Company as currently in effect. (Exhibit 3.1 to theCompany’s Current Report on Form 8-K, Date of Report May 20, 2009, File No. 1-12139, isincorporated herein by reference.)
4.1 Indenture, dated as of July 1, 2003, of the Company, as Issuer, to SunTrust Bank, as Trustee,regarding 5.625% Senior Notes Due 2013 and 6.875% Senior Notes Due 2033. (Exhibit 4.1 to theCompany’s Quarterly Report on Form 10-Q for the quarter ended June 30, 2003, File No. 1-12139, isincorporated herein by reference.)
4.2 Indenture, dated as of February 6, 2009, of the Company, as Issuer, to U.S. Bank, NationalAssociation, as Trustee, regarding 12% Senior Notes Due 2014. (Exhibit 4.1 to the Company’sCurrent Report on Form 8-K, Date of Report February 6, 2009, File No. 1-12139, is incorporatedherein by reference.)
4.3 Form of Indenture between the Registrant and U.S. Bank, National Association, as Trustee.(Exhibit 4.2 to the Company’s Registration Statement on Form S-3, Registration No. 333-157851, isincorporated herein by reference.)
4.4 Indenture, dated as of June 18, 2009, of the Company, as Issuer, to U.S. Bank, National Association,as Trustee, regarding the Company’s 7.875% Senior Notes Due 2017. (Exhibit 4.1 to the Company’sCurrent Report on Form 8-K, Date of Report June 12, 2009, File No. 1-12139, is incorporated hereinby reference.)
144
4.5 Registration Rights Agreement, dated as of February 6, 2009, by and among the Company,Davis Selected Advisers, L.P., Geico Indemnity Company and General Re Life Corporation pursuant towhich the Company has agreed to provide resale registration rights with respect to its 12% Senior Notesdue 2014. (Exhibit 4.2 to the Company’s Current Report on Form 8-K, Date of Report February 6,2009, File No. 1-12139, is incorporated herein by reference.)
4.6 Indenture, dated as of October 3, 2011, among Sealed Air, the Guarantors named therein and HSBCBank USA, National Association, as Trustee, governing the 8.125% Senior Notes Due 2019 and8.375% Senior Notes Due 2021. (Exhibit 4.1 to the Company’s Current Report on Form 8-K, Date ofReport October 3, 2011, File No. 1-12139, is incorporated herein by reference.)
4.7 Form of 8.125% Senior Note due 2019. (Exhibit 4.2 to the Company’s Current Report on Form 8-K,Date of Report October 3, 2011, File No. 1-12139, is incorporated herein by reference.)
4.8 Form of 8.375% Senior Note due 2021. (Exhibit 4.3 to the Company’s Current Report on Form 8-K,Date of Report October 3, 2011, File No. 1-12139, is incorporated herein by reference.)
4.9 Registration Rights Agreement among Sealed Air, Commercial Markets Holdco, LLC, SNW Co., Inc.,Clayton, Dubilier & Rice Fund VIII, L.P., CD&R Friends & Family Fund VIII, L.P. and Unilever SwissHoldings AG, dated October 3, 2011 (Exhibit 4.02 to the Company’s Registration Statement on FormS-3, Registration No. 333-177130, is incorporated herein by reference.) . (Exhibit 4.4 to the Company’sCurrent Report on Form 8-K, Date of Report October 3, 2011, File No. 1-12139, is incorporated hereinby reference.)
10.1 Purchase Agreement, dated as of June 12, 2009, by and among the Company, as issuer, and Banc ofAmerica Securities LLC, Citigroup Global Markets Inc., Credit Suisse Securities (USA) LLC, MorganStanley & Co. Incorporated and RBS Securities Inc., for themselves and the other initial purchasersnamed therein regarding the Company’s 7.875% Senior Notes Due 2017. (Exhibit 10.1 to theCompany’s Current Report on Form 8-K, Date of Report June 12, 2009, File No. 1-12139, isincorporated herein by reference.)
10.2 Employee Benefits Allocation Agreement dated as of March 30, 1998 among the Company, W. R.Grace & Co. — Conn. and W. R. Grace & Co. (Exhibit 10.1 to the Company’s Current Report onForm 8-K, Date of Report March 31, 1998, File No. 1-12139, is incorporated herein by reference.)
10.3 Tax Sharing Agreement dated as of March 30, 1998 by and among the Company, W. R. Grace & Co. —Conn. and W. R. Grace & Co. (Exhibit 10.2 to the Company’s Current Report on Form 8-K, Date ofReport March 31, 1998, File No. 1-12139, is incorporated herein by reference.)
10.4 Agreement in Principle, dated November 27, 2002, by and among the Official Committee of AsbestosPersonal Injury Claimants, the Official Committee of Asbestos Property Damage Claimants, theCompany, and the Company’s subsidiary, Cryovac, Inc. (Exhibit 10.22 to the Company’s Annual Reporton Form 10-K for the year ended December 31, 2002, File No. 1-12139, is incorporated herein byreference.)
10.5 Settlement Agreement and Release, dated November 10, 2003, by and among the Official Committee ofAsbestos Personal Injury Claimants, the Official Committee of Asbestos Property Damage Claimants,the Company, and the Company’s subsidiary, Cryovac, Inc. (Exhibit 10.1 to the Company’sAmendment No. 3 to its Registration Statement on Form S-3, Registration No. 333-108544, isincorporated herein by reference.)
10.6 Restricted Stock Plan for Non-Employee Directors of the Company. (Annex E to the Company’s ProxyStatement for the 1998 Annual Meeting of Stockholders, File No. 1-12139, is incorporated herein byreference.)*
145
10.7 Sealed Air Corporation 2002 Stock Plan for Non-Employee Directors, effective May 17, 2002.(Annex A to the Company’s Proxy Statement for the 2002 Annual Meeting of Stockholders, FileNo. 1-12139, is incorporated herein by reference.)*
10.8 Amendment dated April 15, 2004, to the Restricted Stock Plan for Non-Employee Directors of theCompany. (Exhibit 10.1 to the Company’s Quarterly Report on Form 10-Q for the quarter endedJune 30, 2004, File No. 1-12139, is incorporated herein by reference.)*
10.9 Sealed Air Corporation 2002 Stock Plan for Non-Employee Directors, as amended February 19, 2009.(Exhibit 10.13 to the Company’s Annual Report on Form 10-K for the year ended December 31, 2008,File No. 1-12139, is incorporated herein by reference.)*
10.10 Sealed Air Corporation 2002 Stock Plan for Non-Employee Directors, as amended December 16,2009. (Exhibit 10.16 to the Company’s Annual Report on Form 10-K for the year ended December 31,2009, File No. 1-12139, is incorporated herein by reference.)*
10.11 Sealed Air Corporation 2002 Stock Plan for Non-Employee Directors, as amended April 13, 2010.(Exhibit 10.7 to the Company’s Quarterly Report on Form 10-Q for the quarter ended March 31, 2010,File No. 1-12139, is incorporated herein by reference.)*
10.12 Sealed Air Corporation Deferred Compensation Plan for Directors. (Exhibit 10.21 to the Company’sAnnual Report on Form 10-K for the year ended December 31, 2001, File No. 1-12139, isincorporated herein by reference.)*
10.13 Sealed Air Corporation Deferred Compensation Plan for Directors. (Exhibit 10.8 to the Company’sQuarterly Report on Form 10-Q for the quarter ended March 31, 2010, File No. 1-12139, isincorporated herein by reference.)*
10.14 Form of Restricted Stock Purchase Agreement. (Exhibit 4.4 to the Company’s Registration Statementon Form S-8, Registration No. 333-59195, is incorporated herein by reference.)*
10.15 Form of Stock Purchase Agreement for use in connection with the Company’s 2002 Stock Plan forNon-Employee Directors. (Exhibit 10.2 to the Company’s Quarterly Report on Form 10-Q for thequarter ended June 30, 2002, File No. 1-12139, is incorporated herein by reference.)*
10.16 Fees to be paid to the Company’s Non-Employee Directors — 2010. (Exhibit 10.21 to the Company’sAnnual Report on Form 10-K for the year ended December 31, 2009, File No. 1-12139, isincorporated herein by reference.)*
10.17 Fees to be paid to the Company’s Non-Employee Directors — 2011. (Exhibit 10.48 to the Company’sAnnual Report on Form 10-K for the year ended December 31, 2010, File No. 1-12139, isincorporated herein by reference.)*
10.18 Fees to be paid to the Company’s Non-Employee Directors — 2012. (Exhibit 10.18 to the Company’sAnnual Report on Form10-K for the year ended December 31, 2011. File No. 1-12139)*
10.19 2005 Contingent Stock Plan of Sealed Air Corporation, as amended February 19, 2009. (Exhibit 10.20to the Company’s Annual Report on Form 10-K for the year ended December 31, 2008, File No. 1-12139, is incorporated herein by reference.)*
10.20 2005 Contingent Stock Plan of the Company, as amended effective May 18, 2011 (Annex D to theCompany’s Proxy Statement for the 2011 Annual Meeting of Stockholders, File No. 1-12139, isincorporated by reference)*
10.21 Sealed Air Corporation Annual Incentive Plan, adopted February 19, 2008 (Exhibit 10.1 to theCompany’s Current Report on Form 8-K, Date of Report February 19, 2008, File No. 1-12139, isincorporated herein by reference.)*
146
10.22 Performance-Based Compensation Program of the Company, as amended effective May 20, 2008.(Annex E to the Company’s Proxy Statement for the 2008 Annual Meeting of Stockholders, FileNo. 1-12139, is incorporated herein by reference.)*
10.23 Performance-Based Compensation Program of the Company, as amended February 18, 2010.(Exhibit 10.3 to the Company’s Current Report on Form 8-K, Date of Report February 18, 2010, FileNo. 1-12139, is incorporated herein by reference.)*
10.24 Sealed Air Corporation Policy on Recoupment of Incentive Compensation from Executives in theEvent of Certain Restatements, approved March 20, 2008. (Exhibit 10.1 to the Company’s CurrentReport on Form 8-K, Date of Report March 20, 2008, File No. 1-12139, is incorporated herein byreference.)*
10.25 Sealed Air Corporation Policy on Recoupment of Incentive Compensation from Executives in theEvent of Certain Restatements, as amended February 18, 2010. (Exhibit 10.2 to the Company’sCurrent Report on Form 8-K, Date of Report February 18, 2010, File No. 1-12139, is incorporatedherein by reference.)*
10.26 Form of Restricted Stock Agreement under amended 2005 Contingent Stock Plan of Sealed AirCorporation. (Exhibit 4.4 to the Company’s Registration Statement on Form S-8, RegistrationNo. 333-152909, is incorporated herein by reference.)*
10.27 Form of Restricted Stock Unit Agreement under amended 2005 Contingent Stock Plan of Sealed AirCorporation. (Exhibit 4.5 to the Company’s Registration Statement on Form S-8, RegistrationNo. 333-152909, is incorporated herein by reference.)*
10.28 Form of Restricted Stock Agreement, approved December 18, 2008, for awards pursuant to the StockLeverage Opportunity provision of the Company’s annual incentive plan. (Exhibit 10.1 to theCompany’s Current Report on Form 8-K, Date of Report December 18, 2008, File No. 1-12139, isincorporated herein by reference.)*
10.29 Form of Restricted Stock Unit Agreement, approved December 18, 2008, for awards pursuant to theStock Leverage Opportunity provision of the Company’s annual incentive plan. (Exhibit 10.2 to theCompany’s Current Report on Form 8-K, Date of Report December 18, 2008, File No. 1-12139, isincorporated herein by reference.)*
10.30 Form of Restricted Stock Agreement, as amended, under the amended 2005 Contingent Stock Plan ofSealed Air Corporation. (Exhibit 10.3 to the Company’s Current Report on Form 8-K, Date of ReportDecember 18, 2008, File No. 1-12139, is incorporated herein by reference.)*
10.31 Form of Restricted Stock Unit Agreement, as amended, under the amended 2005 Contingent StockPlan of Sealed Air Corporation. (Exhibit 10.4 to the Company’s Current Report on Form 8-K, Date ofReport December 18, 2008, File No. 1-12139, is incorporated herein by reference.)*
10.32 Form of Non-Compete and Confidentiality Agreement for exempt U.S. employees, substantially asexecuted by David H. Kelsey, former Senior Vice President and Chief Financial Officer, of theCompany. (Exhibit 10.29 to the Company’s Annual Report on Form 10-K for the year endedDecember 31, 2005, File No. 1-12139, is incorporated herein by reference.)*
10.33 Form of Sealed Air Corporation Performance Share Units Award Grant 2010-2012. (Exhibit 10.1 tothe Company’s Current Report on Form 8-K, Date of Report April 14, 2010, File No. 1-12139, isincorporated herein by reference.)*
147
10.34 Note Repurchase Agreement, dated as of November 30, 2010, by and among the Company andDavis Selected Advisers, L.P. regarding the Company’s 12% Senior Notes due 2014. (Exhibit 10.1to the Company’s Current Report on Form 8-K, Date of Report November 30, 2010, File No. 1-12139, is incorporated herein by reference.)
10.35 Commitment Letter, dated as of May 31, 2011, by and among Sealed Air Corporation andCitigroup Global Markets Inc. (Exhibit 10.1 to the Company’s Current Report on Form 8-K, Dateof Report May 31, 2011, File No. 1-12139, is incorporated herein by reference.)
10.36 Amended and Restated Commitment Letter, dated as of June 17, 2011, by and among Sealed AirCorporation, Citigroup Global Markets Inc., Bank of America, N.A., Merrill Lynch, Pierce, Fenner& Smith Incorporated, BNP Paribas, BNP Paribas Securities Corp., The Royal Bank of Scotlandplc and RBS Securities Inc. (Exhibit 10.1 to the Company’s Current Report on Form 8-K, Date ofReport June 17, 2011, File No. 1-12139, is incorporated herein by reference.)
10.37 Purchase Agreement, dated as of September 16, 2011, by and among the Company, as issuer, andCitigroup Global Markets Inc. and Merrill Lynch, Pierce, Fenner & Smith Incorporated, forthemselves and the other initial purchasers named therein, regarding Sealed Air Corporation’s8.125% Senior Notes Due 2019 and 8.375% Senior Notes Due 2021 (Exhibit 10.1 to theCompany’s Current Report on Form 8-K, Date of Report September 16, 2011, FileNo. 1-12139, is incorporated herein by reference.)
10.38 Syndicated Facility Agreement, dated as of October 3, 2011, by and among Sealed Air, certainsubsidiaries of Sealed Air party thereto, the lenders party thereto, Citibank, N.A., as agent and theother agents party thereto. (Exhibit 10.1 to the Company’s Current Report on Form 8-K, Date ofReport October 3, 2011, File No. 1-12139, is incorporated herein by reference.)
10.39 Series A Preferred Stock Purchase Agreement, dated as of October 3, 2011, by and amongDiversey Holdings, Inc., Sealed Air and Solution Acquisition Corp. (Exhibit 10.1 to theCompany’s Current Report on Form 8-K, Date of Report October 3, 2011, File No. 1-12139, isincorporated herein by reference.)
12.1 Computation of Ratio of Earnings to Fixed Charges.
21 Subsidiaries of the Company.
23.1 Consent of KPMG LLP.
31.1 Certification of William V. Hickey, Chief Executive Officer of the Company, pursuant toRule 13a-14(a), dated February 29, 2012.
31.2 Certification of Tod S. Christie, Treasurer and Interim Chief Financial Officer of the Company,pursuant to Rule 13a-14(a), dated February 29, 2012.
32 Certification of William V. Hickey, Chief Executive Officer of the Company, and Tod S. Christie,Treasurer and Interim Chief Financial Officer of the Company, pursuant to 18 U.S.C. § 1350,dated February 29, 2012.
101.INS XBRL Instance Document
101.SCH XBRL Taxonomy Extension Schema
101.CAL XBRL Taxonomy Extension Calculation Linkbase
101.LAB XBRL Taxonomy Extension Label Linkbase
101.PRE XBRL Taxonomy Extension Presentation Linkbase
101.DEF XBRL Taxonomy Extension Definition Linkbase
148
* Compensatory plan or arrangement of management required to be filed as an exhibit to this report onForm 10-K.
In accordance with Rule 406T of Regulation S-T, the XBRL related information in Exhibit 101 shall not bedeemed to be “filed” for purposes of Section 18 of the Exchange Act, or otherwise subject to the liability ofthat section, and shall not be deemed to be “filed” or part of any registration statement or other document filedfor purposes of Sections 11 or 12 of the Securities Act or the Exchange Act, except as shall be expressly setforth by specific reference in such filing.
In lieu of filing certain instruments with respect to long-term debt of the kind described in Item 601(b)(4)(iii)of Regulation S-K, the Company agrees to furnish a copy of such instruments to the SEC upon request.
149
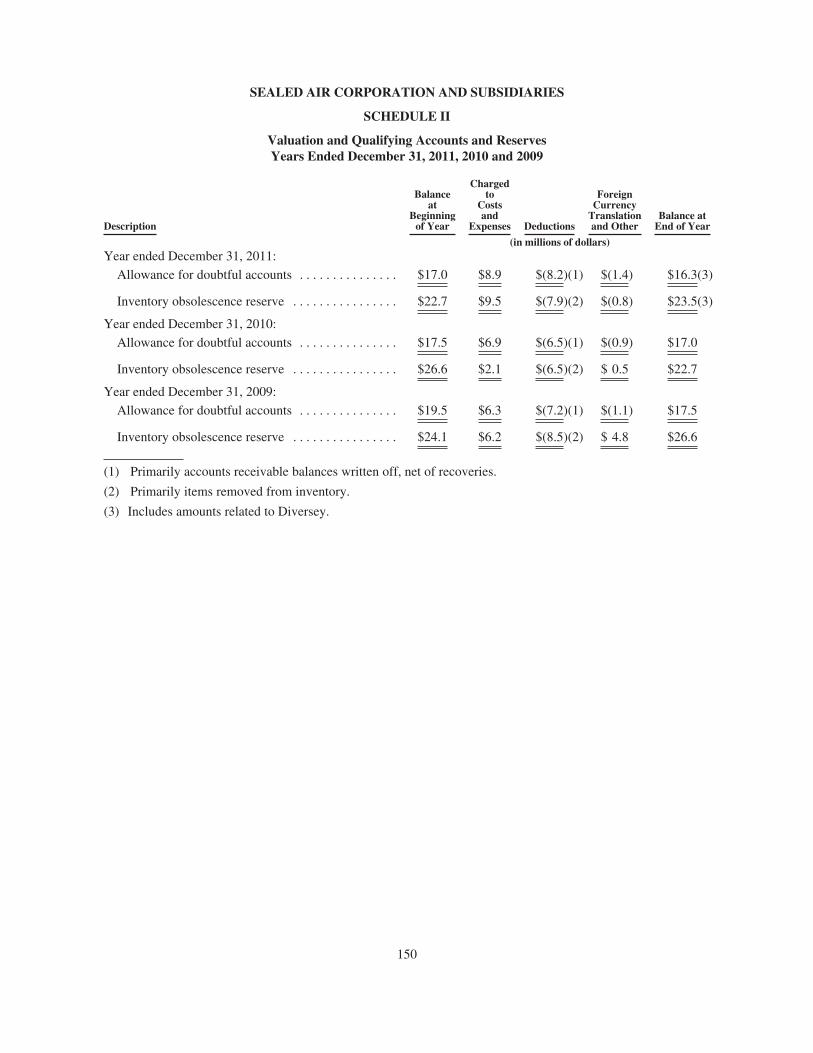
SEALED AIR CORPORATION AND SUBSIDIARIES
SCHEDULE II
Valuation and Qualifying Accounts and ReservesYears Ended December 31, 2011, 2010 and 2009
Description
Balanceat
Beginningof Year
Chargedto
Costsand
Expenses Deductions
ForeignCurrency
Translationand Other
Balance atEnd of Year
(in millions of dollars)Year ended December 31, 2011:
Allowance for doubtful accounts . . . . . . . . . . . . . . . $17.0 $8.9 $(8.2)(1) $(1.4) $16.3(3)
Inventory obsolescence reserve . . . . . . . . . . . . . . . . $22.7 $9.5 $(7.9)(2) $(0.8) $23.5(3)
Year ended December 31, 2010:
Allowance for doubtful accounts . . . . . . . . . . . . . . . $17.5 $6.9 $(6.5)(1) $(0.9) $17.0
Inventory obsolescence reserve . . . . . . . . . . . . . . . . $26.6 $2.1 $(6.5)(2) $ 0.5 $22.7
Year ended December 31, 2009:
Allowance for doubtful accounts . . . . . . . . . . . . . . . $19.5 $6.3 $(7.2)(1) $(1.1) $17.5
Inventory obsolescence reserve . . . . . . . . . . . . . . . . $24.1 $6.2 $(8.5)(2) $ 4.8 $26.6
(1) Primarily accounts receivable balances written off, net of recoveries.
(2) Primarily items removed from inventory.
(3) Includes amounts related to Diversey.
150
SIGNATURES
Pursuant to the requirements of Section 13 or 15(d) of the Securities Exchange Act of 1934, the registrant hasduly caused this report to be signed on its behalf by the undersigned, thereunto duly authorized.
SEALED AIR CORPORATION
(Registrant)
By: /s/ WILLIAM V. HICKEY
William V. HickeyPresident and Chief Executive Officer
Date: February 29, 2012
Pursuant to the requirements of the Securities Exchange Act of 1934, this report has been signed below by thefollowing persons on behalf of the registrant and in the capacities and on the dates indicated.
Signature Title Date
By: /s/ WILLIAM V. HICKEY
William V. Hickey
President, Chief Executive Officer andDirector (Principal Executive Officer)
February 29, 2012
By: /s/ TOD S. CHRISTIE
Tod S. Christie
Treasurer and Interim ChiefFinancial Officer (Principal FinancialOfficer)
February 29, 2012
By: /s/ JEFFREY S. WARREN
Jeffrey S. Warren
Controller (Principal AccountingOfficer)
February 29, 2012
By: /s/ HANK BROWN
Hank Brown
Director February 29, 2012
By: /s/ MICHAEL CHU
Michael Chu
Director February 29, 2012
By: /s/ LAWRENCE R. CODEY
Lawrence R. Codey
Director February 29, 2012
By: /s/ PATRICK DUFF
Patrick Duff
Director February 29, 2012
By: /s/ T. J. DERMOT DUNPHY
T. J. Dermot Dunphy
Director February 29, 2012
By: /s/ JACQUELINE B. KOSECOFF
Jacqueline B. Kosecoff
Director February 29, 2012
By: /s/ KENNETH P. MANNING
Kenneth P. Manning
Director February 29, 2012
By: /s/ WILLIAM J. MARINO
William J. Marino
Director February 29, 2012
By: /s/ JERRY R. WHITAKER
Jerry R. Whitaker
Director February 29, 2012
151

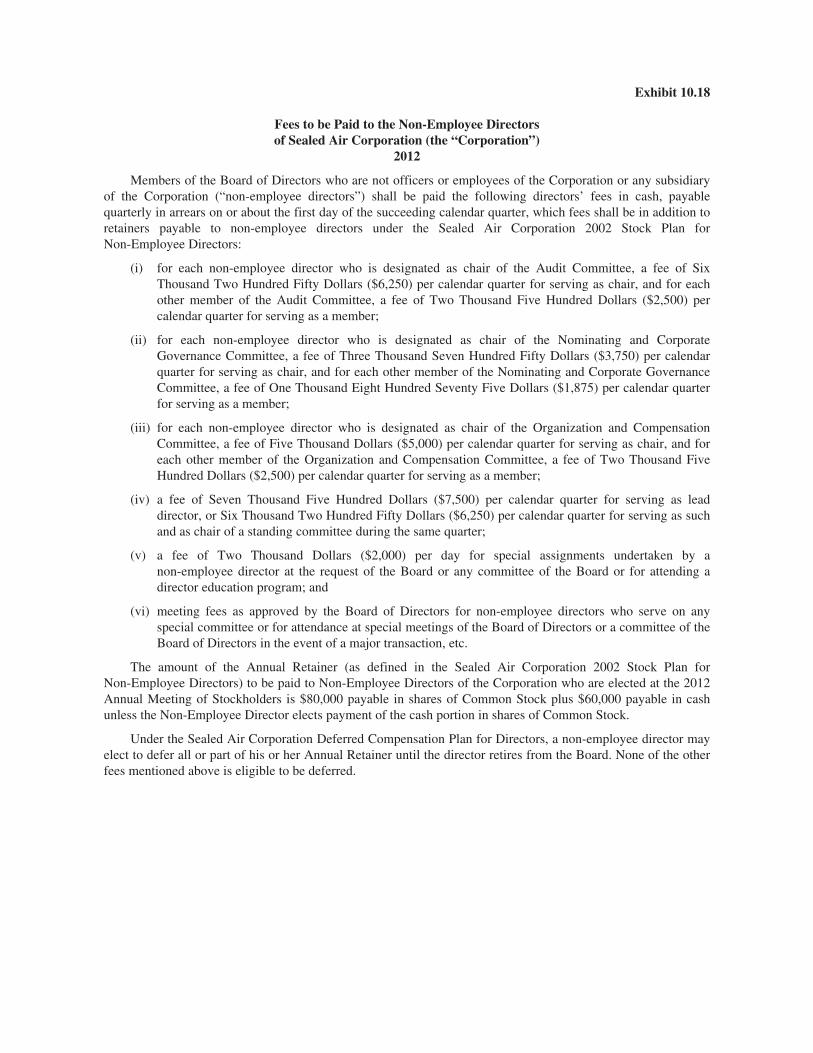
Exhibit 10.18
Fees to be Paid to the Non-Employee Directorsof Sealed Air Corporation (the “Corporation”)
2012
Members of the Board of Directors who are not officers or employees of the Corporation or any subsidiaryof the Corporation (“non-employee directors”) shall be paid the following directors’ fees in cash, payablequarterly in arrears on or about the first day of the succeeding calendar quarter, which fees shall be in addition toretainers payable to non-employee directors under the Sealed Air Corporation 2002 Stock Plan forNon-Employee Directors:
(i) for each non-employee director who is designated as chair of the Audit Committee, a fee of SixThousand Two Hundred Fifty Dollars ($6,250) per calendar quarter for serving as chair, and for eachother member of the Audit Committee, a fee of Two Thousand Five Hundred Dollars ($2,500) percalendar quarter for serving as a member;
(ii) for each non-employee director who is designated as chair of the Nominating and CorporateGovernance Committee, a fee of Three Thousand Seven Hundred Fifty Dollars ($3,750) per calendarquarter for serving as chair, and for each other member of the Nominating and Corporate GovernanceCommittee, a fee of One Thousand Eight Hundred Seventy Five Dollars ($1,875) per calendar quarterfor serving as a member;
(iii) for each non-employee director who is designated as chair of the Organization and CompensationCommittee, a fee of Five Thousand Dollars ($5,000) per calendar quarter for serving as chair, and foreach other member of the Organization and Compensation Committee, a fee of Two Thousand FiveHundred Dollars ($2,500) per calendar quarter for serving as a member;
(iv) a fee of Seven Thousand Five Hundred Dollars ($7,500) per calendar quarter for serving as leaddirector, or Six Thousand Two Hundred Fifty Dollars ($6,250) per calendar quarter for serving as suchand as chair of a standing committee during the same quarter;
(v) a fee of Two Thousand Dollars ($2,000) per day for special assignments undertaken by anon-employee director at the request of the Board or any committee of the Board or for attending adirector education program; and
(vi) meeting fees as approved by the Board of Directors for non-employee directors who serve on anyspecial committee or for attendance at special meetings of the Board of Directors or a committee of theBoard of Directors in the event of a major transaction, etc.
The amount of the Annual Retainer (as defined in the Sealed Air Corporation 2002 Stock Plan forNon-Employee Directors) to be paid to Non-Employee Directors of the Corporation who are elected at the 2012Annual Meeting of Stockholders is $80,000 payable in shares of Common Stock plus $60,000 payable in cashunless the Non-Employee Director elects payment of the cash portion in shares of Common Stock.
Under the Sealed Air Corporation Deferred Compensation Plan for Directors, a non-employee director mayelect to defer all or part of his or her Annual Retainer until the director retires from the Board. None of the otherfees mentioned above is eligible to be deferred.
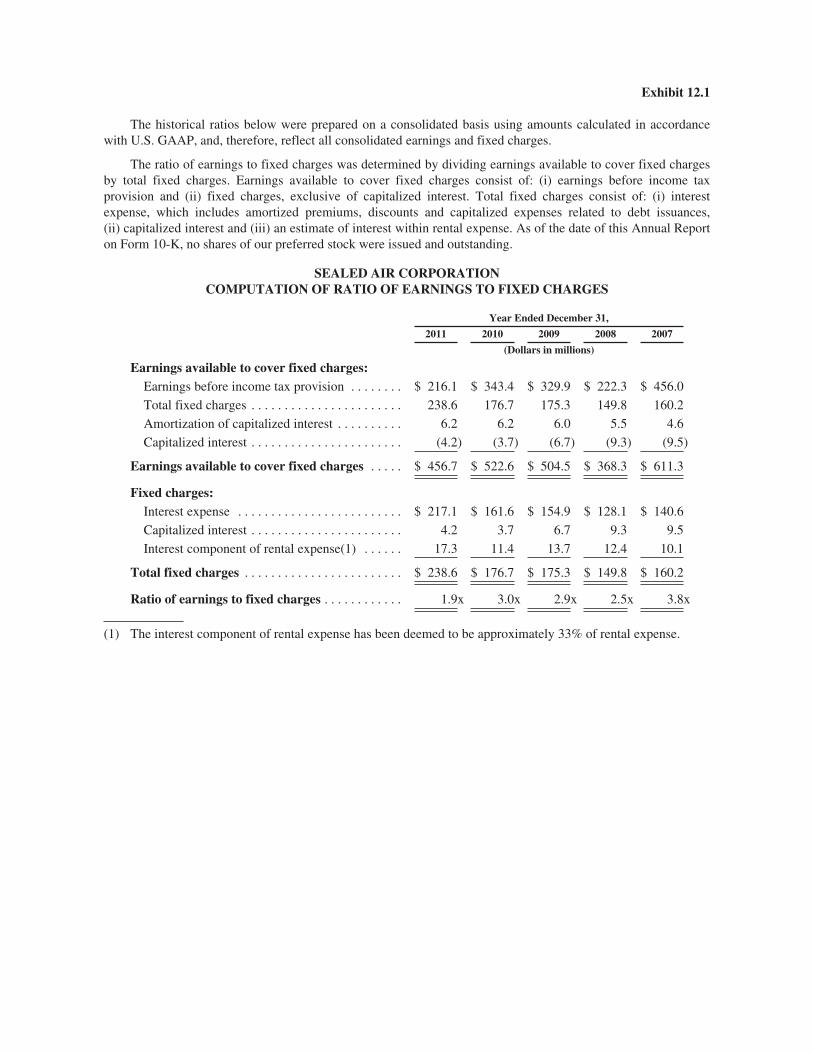
Exhibit 12.1
The historical ratios below were prepared on a consolidated basis using amounts calculated in accordancewith U.S. GAAP, and, therefore, reflect all consolidated earnings and fixed charges.
The ratio of earnings to fixed charges was determined by dividing earnings available to cover fixed chargesby total fixed charges. Earnings available to cover fixed charges consist of: (i) earnings before income taxprovision and (ii) fixed charges, exclusive of capitalized interest. Total fixed charges consist of: (i) interestexpense, which includes amortized premiums, discounts and capitalized expenses related to debt issuances,(ii) capitalized interest and (iii) an estimate of interest within rental expense. As of the date of this Annual Reporton Form 10-K, no shares of our preferred stock were issued and outstanding.
SEALED AIR CORPORATIONCOMPUTATION OF RATIO OF EARNINGS TO FIXED CHARGES
Year Ended December 31,
2011 2010 2009 2008 2007
(Dollars in millions)
Earnings available to cover fixed charges:Earnings before income tax provision . . . . . . . . $ 216.1 $ 343.4 $ 329.9 $ 222.3 $ 456.0
Total fixed charges . . . . . . . . . . . . . . . . . . . . . . . 238.6 176.7 175.3 149.8 160.2
Amortization of capitalized interest . . . . . . . . . . 6.2 6.2 6.0 5.5 4.6
Capitalized interest . . . . . . . . . . . . . . . . . . . . . . . (4.2) (3.7) (6.7) (9.3) (9.5)
Earnings available to cover fixed charges . . . . . $ 456.7 $ 522.6 $ 504.5 $ 368.3 $ 611.3
Fixed charges:Interest expense . . . . . . . . . . . . . . . . . . . . . . . . . $ 217.1 $ 161.6 $ 154.9 $ 128.1 $ 140.6
Capitalized interest . . . . . . . . . . . . . . . . . . . . . . . 4.2 3.7 6.7 9.3 9.5
Interest component of rental expense(1) . . . . . . 17.3 11.4 13.7 12.4 10.1
Total fixed charges . . . . . . . . . . . . . . . . . . . . . . . . $ 238.6 $ 176.7 $ 175.3 $ 149.8 $ 160.2
Ratio of earnings to fixed charges . . . . . . . . . . . . 1.9x 3.0x 2.9x 2.5x 3.8x
(1) The interest component of rental expense has been deemed to be approximately 33% of rental expense.
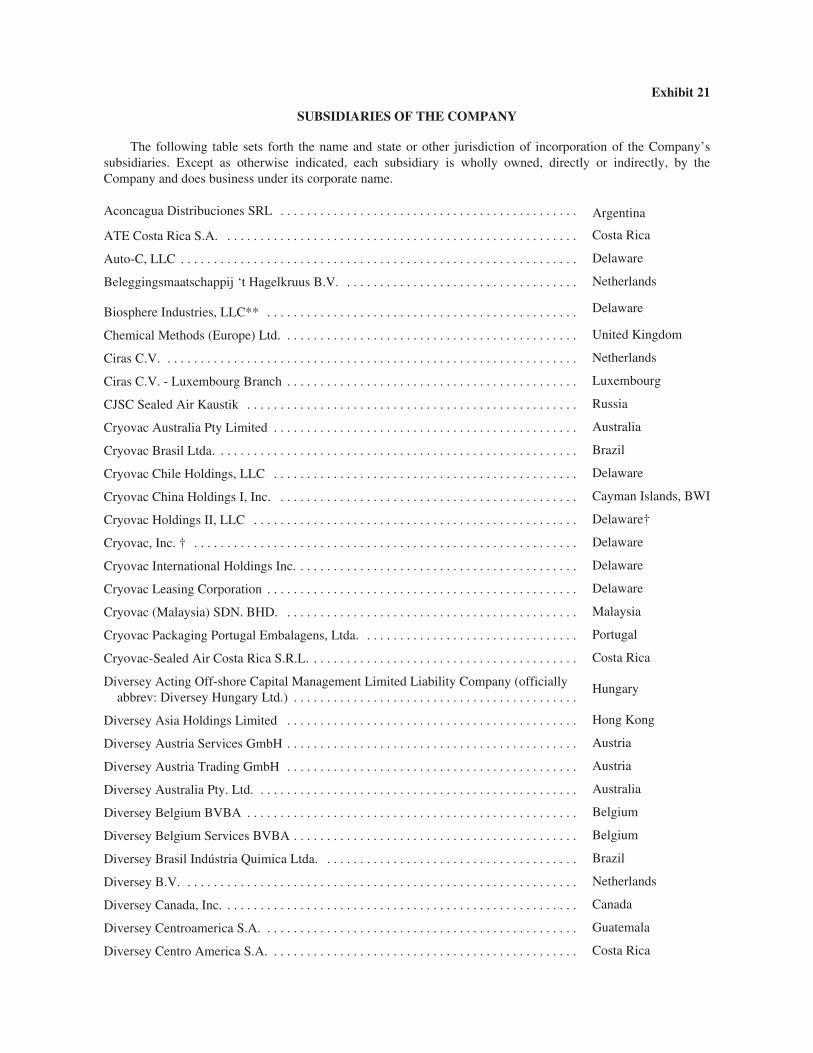
Exhibit 21
SUBSIDIARIES OF THE COMPANY
The following table sets forth the name and state or other jurisdiction of incorporation of the Company’ssubsidiaries. Except as otherwise indicated, each subsidiary is wholly owned, directly or indirectly, by theCompany and does business under its corporate name.
Aconcagua Distribuciones SRL . . . . . . . . . . . . . . . . . . . . . . . . . . . . . . . . . . . . . . . . . . . . . Argentina
ATE Costa Rica S.A. . . . . . . . . . . . . . . . . . . . . . . . . . . . . . . . . . . . . . . . . . . . . . . . . . . . . . Costa Rica
Auto-C, LLC . . . . . . . . . . . . . . . . . . . . . . . . . . . . . . . . . . . . . . . . . . . . . . . . . . . . . . . . . . . . Delaware
Beleggingsmaatschappij ‘t Hagelkruus B.V. . . . . . . . . . . . . . . . . . . . . . . . . . . . . . . . . . . . Netherlands
Biosphere Industries, LLC** . . . . . . . . . . . . . . . . . . . . . . . . . . . . . . . . . . . . . . . . . . . . . . . Delaware
Chemical Methods (Europe) Ltd. . . . . . . . . . . . . . . . . . . . . . . . . . . . . . . . . . . . . . . . . . . . . United Kingdom
Ciras C.V. . . . . . . . . . . . . . . . . . . . . . . . . . . . . . . . . . . . . . . . . . . . . . . . . . . . . . . . . . . . . . . Netherlands
Ciras C.V. - Luxembourg Branch . . . . . . . . . . . . . . . . . . . . . . . . . . . . . . . . . . . . . . . . . . . . Luxembourg
CJSC Sealed Air Kaustik . . . . . . . . . . . . . . . . . . . . . . . . . . . . . . . . . . . . . . . . . . . . . . . . . . Russia
Cryovac Australia Pty Limited . . . . . . . . . . . . . . . . . . . . . . . . . . . . . . . . . . . . . . . . . . . . . . Australia
Cryovac Brasil Ltda. . . . . . . . . . . . . . . . . . . . . . . . . . . . . . . . . . . . . . . . . . . . . . . . . . . . . . . Brazil
Cryovac Chile Holdings, LLC . . . . . . . . . . . . . . . . . . . . . . . . . . . . . . . . . . . . . . . . . . . . . . Delaware
Cryovac China Holdings I, Inc. . . . . . . . . . . . . . . . . . . . . . . . . . . . . . . . . . . . . . . . . . . . . . Cayman Islands, BWI
Cryovac Holdings II, LLC . . . . . . . . . . . . . . . . . . . . . . . . . . . . . . . . . . . . . . . . . . . . . . . . . Delaware†
Cryovac, Inc. † . . . . . . . . . . . . . . . . . . . . . . . . . . . . . . . . . . . . . . . . . . . . . . . . . . . . . . . . . . Delaware
Cryovac International Holdings Inc. . . . . . . . . . . . . . . . . . . . . . . . . . . . . . . . . . . . . . . . . . . Delaware
Cryovac Leasing Corporation . . . . . . . . . . . . . . . . . . . . . . . . . . . . . . . . . . . . . . . . . . . . . . . Delaware
Cryovac (Malaysia) SDN. BHD. . . . . . . . . . . . . . . . . . . . . . . . . . . . . . . . . . . . . . . . . . . . . Malaysia
Cryovac Packaging Portugal Embalagens, Ltda. . . . . . . . . . . . . . . . . . . . . . . . . . . . . . . . . Portugal
Cryovac-Sealed Air Costa Rica S.R.L. . . . . . . . . . . . . . . . . . . . . . . . . . . . . . . . . . . . . . . . . Costa Rica
Diversey Acting Off-shore Capital Management Limited Liability Company (officiallyabbrev: Diversey Hungary Ltd.) . . . . . . . . . . . . . . . . . . . . . . . . . . . . . . . . . . . . . . . . . . .
Hungary
Diversey Asia Holdings Limited . . . . . . . . . . . . . . . . . . . . . . . . . . . . . . . . . . . . . . . . . . . . Hong Kong
Diversey Austria Services GmbH . . . . . . . . . . . . . . . . . . . . . . . . . . . . . . . . . . . . . . . . . . . . Austria
Diversey Austria Trading GmbH . . . . . . . . . . . . . . . . . . . . . . . . . . . . . . . . . . . . . . . . . . . . Austria
Diversey Australia Pty. Ltd. . . . . . . . . . . . . . . . . . . . . . . . . . . . . . . . . . . . . . . . . . . . . . . . . Australia
Diversey Belgium BVBA . . . . . . . . . . . . . . . . . . . . . . . . . . . . . . . . . . . . . . . . . . . . . . . . . . Belgium
Diversey Belgium Services BVBA . . . . . . . . . . . . . . . . . . . . . . . . . . . . . . . . . . . . . . . . . . . Belgium
Diversey Brasil Indústria Quimica Ltda. . . . . . . . . . . . . . . . . . . . . . . . . . . . . . . . . . . . . . . Brazil
Diversey B.V. . . . . . . . . . . . . . . . . . . . . . . . . . . . . . . . . . . . . . . . . . . . . . . . . . . . . . . . . . . . Netherlands
Diversey Canada, Inc. . . . . . . . . . . . . . . . . . . . . . . . . . . . . . . . . . . . . . . . . . . . . . . . . . . . . . Canada
Diversey Centroamerica S.A. . . . . . . . . . . . . . . . . . . . . . . . . . . . . . . . . . . . . . . . . . . . . . . . Guatemala
Diversey Centro America S.A. . . . . . . . . . . . . . . . . . . . . . . . . . . . . . . . . . . . . . . . . . . . . . . Costa Rica
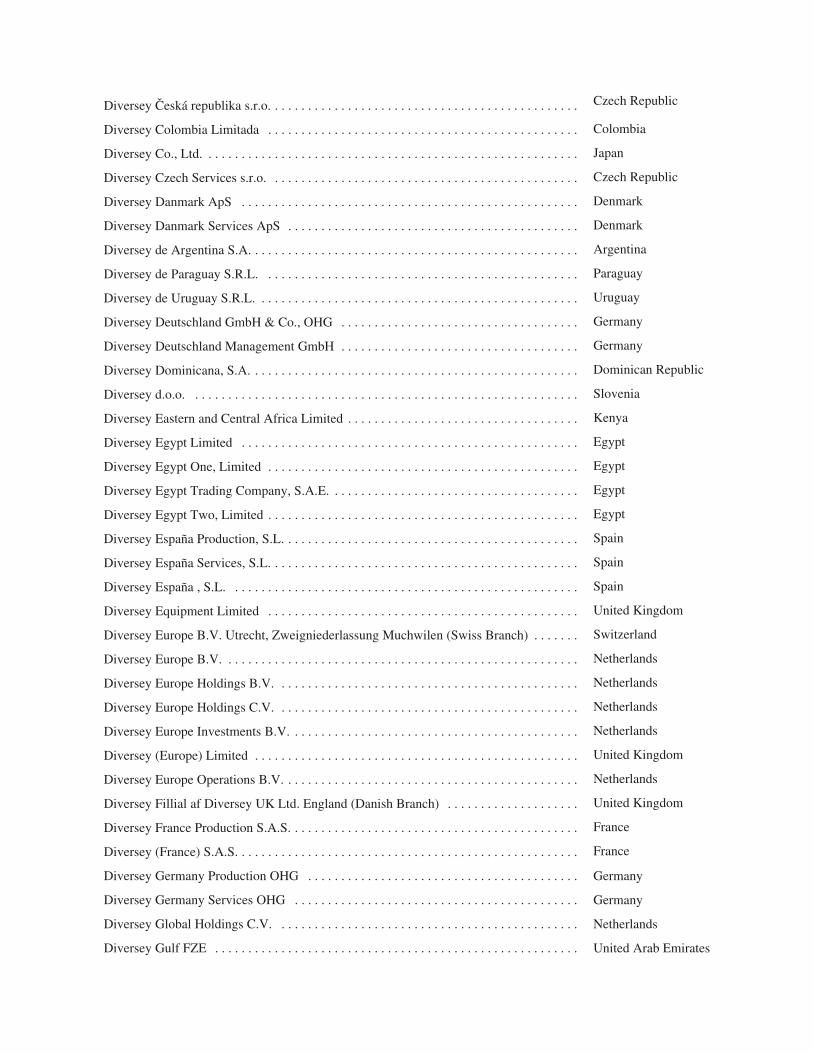
Diversey Ceská republika s.r.o. . . . . . . . . . . . . . . . . . . . . . . . . . . . . . . . . . . . . . . . . . . . . . . Czech Republic
Diversey Colombia Limitada . . . . . . . . . . . . . . . . . . . . . . . . . . . . . . . . . . . . . . . . . . . . . . . Colombia
Diversey Co., Ltd. . . . . . . . . . . . . . . . . . . . . . . . . . . . . . . . . . . . . . . . . . . . . . . . . . . . . . . . . Japan
Diversey Czech Services s.r.o. . . . . . . . . . . . . . . . . . . . . . . . . . . . . . . . . . . . . . . . . . . . . . . Czech Republic
Diversey Danmark ApS . . . . . . . . . . . . . . . . . . . . . . . . . . . . . . . . . . . . . . . . . . . . . . . . . . . Denmark
Diversey Danmark Services ApS . . . . . . . . . . . . . . . . . . . . . . . . . . . . . . . . . . . . . . . . . . . . Denmark
Diversey de Argentina S.A. . . . . . . . . . . . . . . . . . . . . . . . . . . . . . . . . . . . . . . . . . . . . . . . . . Argentina
Diversey de Paraguay S.R.L. . . . . . . . . . . . . . . . . . . . . . . . . . . . . . . . . . . . . . . . . . . . . . . . Paraguay
Diversey de Uruguay S.R.L. . . . . . . . . . . . . . . . . . . . . . . . . . . . . . . . . . . . . . . . . . . . . . . . . Uruguay
Diversey Deutschland GmbH & Co., OHG . . . . . . . . . . . . . . . . . . . . . . . . . . . . . . . . . . . . Germany
Diversey Deutschland Management GmbH . . . . . . . . . . . . . . . . . . . . . . . . . . . . . . . . . . . . Germany
Diversey Dominicana, S.A. . . . . . . . . . . . . . . . . . . . . . . . . . . . . . . . . . . . . . . . . . . . . . . . . . Dominican Republic
Diversey d.o.o. . . . . . . . . . . . . . . . . . . . . . . . . . . . . . . . . . . . . . . . . . . . . . . . . . . . . . . . . . . Slovenia
Diversey Eastern and Central Africa Limited . . . . . . . . . . . . . . . . . . . . . . . . . . . . . . . . . . . Kenya
Diversey Egypt Limited . . . . . . . . . . . . . . . . . . . . . . . . . . . . . . . . . . . . . . . . . . . . . . . . . . . Egypt
Diversey Egypt One, Limited . . . . . . . . . . . . . . . . . . . . . . . . . . . . . . . . . . . . . . . . . . . . . . . Egypt
Diversey Egypt Trading Company, S.A.E. . . . . . . . . . . . . . . . . . . . . . . . . . . . . . . . . . . . . . Egypt
Diversey Egypt Two, Limited . . . . . . . . . . . . . . . . . . . . . . . . . . . . . . . . . . . . . . . . . . . . . . . Egypt
Diversey España Production, S.L. . . . . . . . . . . . . . . . . . . . . . . . . . . . . . . . . . . . . . . . . . . . . Spain
Diversey España Services, S.L. . . . . . . . . . . . . . . . . . . . . . . . . . . . . . . . . . . . . . . . . . . . . . . Spain
Diversey España , S.L. . . . . . . . . . . . . . . . . . . . . . . . . . . . . . . . . . . . . . . . . . . . . . . . . . . . . Spain
Diversey Equipment Limited . . . . . . . . . . . . . . . . . . . . . . . . . . . . . . . . . . . . . . . . . . . . . . . United Kingdom
Diversey Europe B.V. Utrecht, Zweigniederlassung Muchwilen (Swiss Branch) . . . . . . . Switzerland
Diversey Europe B.V. . . . . . . . . . . . . . . . . . . . . . . . . . . . . . . . . . . . . . . . . . . . . . . . . . . . . . Netherlands
Diversey Europe Holdings B.V. . . . . . . . . . . . . . . . . . . . . . . . . . . . . . . . . . . . . . . . . . . . . . Netherlands
Diversey Europe Holdings C.V. . . . . . . . . . . . . . . . . . . . . . . . . . . . . . . . . . . . . . . . . . . . . . Netherlands
Diversey Europe Investments B.V. . . . . . . . . . . . . . . . . . . . . . . . . . . . . . . . . . . . . . . . . . . . Netherlands
Diversey (Europe) Limited . . . . . . . . . . . . . . . . . . . . . . . . . . . . . . . . . . . . . . . . . . . . . . . . . United Kingdom
Diversey Europe Operations B.V. . . . . . . . . . . . . . . . . . . . . . . . . . . . . . . . . . . . . . . . . . . . . Netherlands
Diversey Fillial af Diversey UK Ltd. England (Danish Branch) . . . . . . . . . . . . . . . . . . . . United Kingdom
Diversey France Production S.A.S. . . . . . . . . . . . . . . . . . . . . . . . . . . . . . . . . . . . . . . . . . . . France
Diversey (France) S.A.S. . . . . . . . . . . . . . . . . . . . . . . . . . . . . . . . . . . . . . . . . . . . . . . . . . . . France
Diversey Germany Production OHG . . . . . . . . . . . . . . . . . . . . . . . . . . . . . . . . . . . . . . . . . Germany
Diversey Germany Services OHG . . . . . . . . . . . . . . . . . . . . . . . . . . . . . . . . . . . . . . . . . . . Germany
Diversey Global Holdings C.V. . . . . . . . . . . . . . . . . . . . . . . . . . . . . . . . . . . . . . . . . . . . . . Netherlands
Diversey Gulf FZE . . . . . . . . . . . . . . . . . . . . . . . . . . . . . . . . . . . . . . . . . . . . . . . . . . . . . . . United Arab Emirates
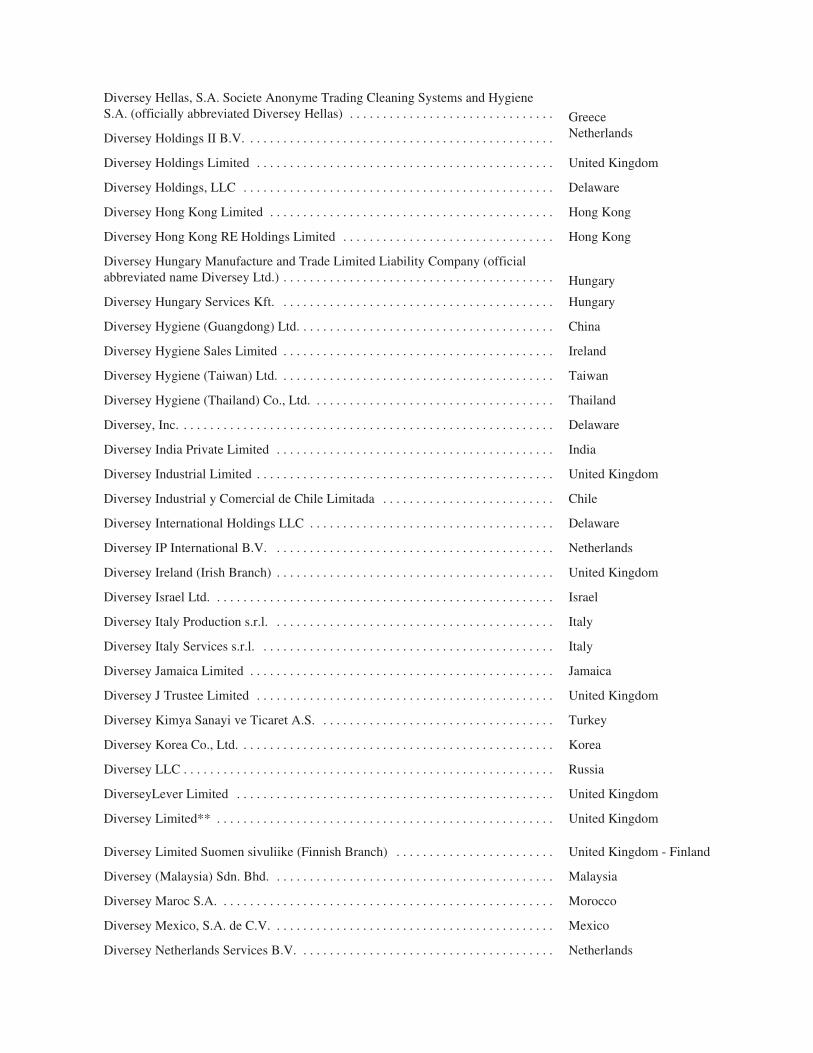
Diversey Hellas, S.A. Societe Anonyme Trading Cleaning Systems and HygieneS.A. (officially abbreviated Diversey Hellas) . . . . . . . . . . . . . . . . . . . . . . . . . . . . . . . Greece
Diversey Holdings II B.V. . . . . . . . . . . . . . . . . . . . . . . . . . . . . . . . . . . . . . . . . . . . . . . Netherlands
Diversey Holdings Limited . . . . . . . . . . . . . . . . . . . . . . . . . . . . . . . . . . . . . . . . . . . . . United Kingdom
Diversey Holdings, LLC . . . . . . . . . . . . . . . . . . . . . . . . . . . . . . . . . . . . . . . . . . . . . . . Delaware
Diversey Hong Kong Limited . . . . . . . . . . . . . . . . . . . . . . . . . . . . . . . . . . . . . . . . . . . Hong Kong
Diversey Hong Kong RE Holdings Limited . . . . . . . . . . . . . . . . . . . . . . . . . . . . . . . . Hong Kong
Diversey Hungary Manufacture and Trade Limited Liability Company (officialabbreviated name Diversey Ltd.) . . . . . . . . . . . . . . . . . . . . . . . . . . . . . . . . . . . . . . . . . Hungary
Diversey Hungary Services Kft. . . . . . . . . . . . . . . . . . . . . . . . . . . . . . . . . . . . . . . . . . Hungary
Diversey Hygiene (Guangdong) Ltd. . . . . . . . . . . . . . . . . . . . . . . . . . . . . . . . . . . . . . . China
Diversey Hygiene Sales Limited . . . . . . . . . . . . . . . . . . . . . . . . . . . . . . . . . . . . . . . . . Ireland
Diversey Hygiene (Taiwan) Ltd. . . . . . . . . . . . . . . . . . . . . . . . . . . . . . . . . . . . . . . . . . Taiwan
Diversey Hygiene (Thailand) Co., Ltd. . . . . . . . . . . . . . . . . . . . . . . . . . . . . . . . . . . . . Thailand
Diversey, Inc. . . . . . . . . . . . . . . . . . . . . . . . . . . . . . . . . . . . . . . . . . . . . . . . . . . . . . . . . Delaware
Diversey India Private Limited . . . . . . . . . . . . . . . . . . . . . . . . . . . . . . . . . . . . . . . . . . India
Diversey Industrial Limited . . . . . . . . . . . . . . . . . . . . . . . . . . . . . . . . . . . . . . . . . . . . . United Kingdom
Diversey Industrial y Comercial de Chile Limitada . . . . . . . . . . . . . . . . . . . . . . . . . . Chile
Diversey International Holdings LLC . . . . . . . . . . . . . . . . . . . . . . . . . . . . . . . . . . . . . Delaware
Diversey IP International B.V. . . . . . . . . . . . . . . . . . . . . . . . . . . . . . . . . . . . . . . . . . . Netherlands
Diversey Ireland (Irish Branch) . . . . . . . . . . . . . . . . . . . . . . . . . . . . . . . . . . . . . . . . . . United Kingdom
Diversey Israel Ltd. . . . . . . . . . . . . . . . . . . . . . . . . . . . . . . . . . . . . . . . . . . . . . . . . . . . Israel
Diversey Italy Production s.r.l. . . . . . . . . . . . . . . . . . . . . . . . . . . . . . . . . . . . . . . . . . . Italy
Diversey Italy Services s.r.l. . . . . . . . . . . . . . . . . . . . . . . . . . . . . . . . . . . . . . . . . . . . . Italy
Diversey Jamaica Limited . . . . . . . . . . . . . . . . . . . . . . . . . . . . . . . . . . . . . . . . . . . . . . Jamaica
Diversey J Trustee Limited . . . . . . . . . . . . . . . . . . . . . . . . . . . . . . . . . . . . . . . . . . . . . United Kingdom
Diversey Kimya Sanayi ve Ticaret A.S. . . . . . . . . . . . . . . . . . . . . . . . . . . . . . . . . . . . Turkey
Diversey Korea Co., Ltd. . . . . . . . . . . . . . . . . . . . . . . . . . . . . . . . . . . . . . . . . . . . . . . . Korea
Diversey LLC . . . . . . . . . . . . . . . . . . . . . . . . . . . . . . . . . . . . . . . . . . . . . . . . . . . . . . . . Russia
DiverseyLever Limited . . . . . . . . . . . . . . . . . . . . . . . . . . . . . . . . . . . . . . . . . . . . . . . . United Kingdom
Diversey Limited** . . . . . . . . . . . . . . . . . . . . . . . . . . . . . . . . . . . . . . . . . . . . . . . . . . . United Kingdom
Diversey Limited Suomen sivuliike (Finnish Branch) . . . . . . . . . . . . . . . . . . . . . . . . United Kingdom - Finland
Diversey (Malaysia) Sdn. Bhd. . . . . . . . . . . . . . . . . . . . . . . . . . . . . . . . . . . . . . . . . . . Malaysia
Diversey Maroc S.A. . . . . . . . . . . . . . . . . . . . . . . . . . . . . . . . . . . . . . . . . . . . . . . . . . . Morocco
Diversey Mexico, S.A. de C.V. . . . . . . . . . . . . . . . . . . . . . . . . . . . . . . . . . . . . . . . . . . Mexico
Diversey Netherlands Services B.V. . . . . . . . . . . . . . . . . . . . . . . . . . . . . . . . . . . . . . . Netherlands
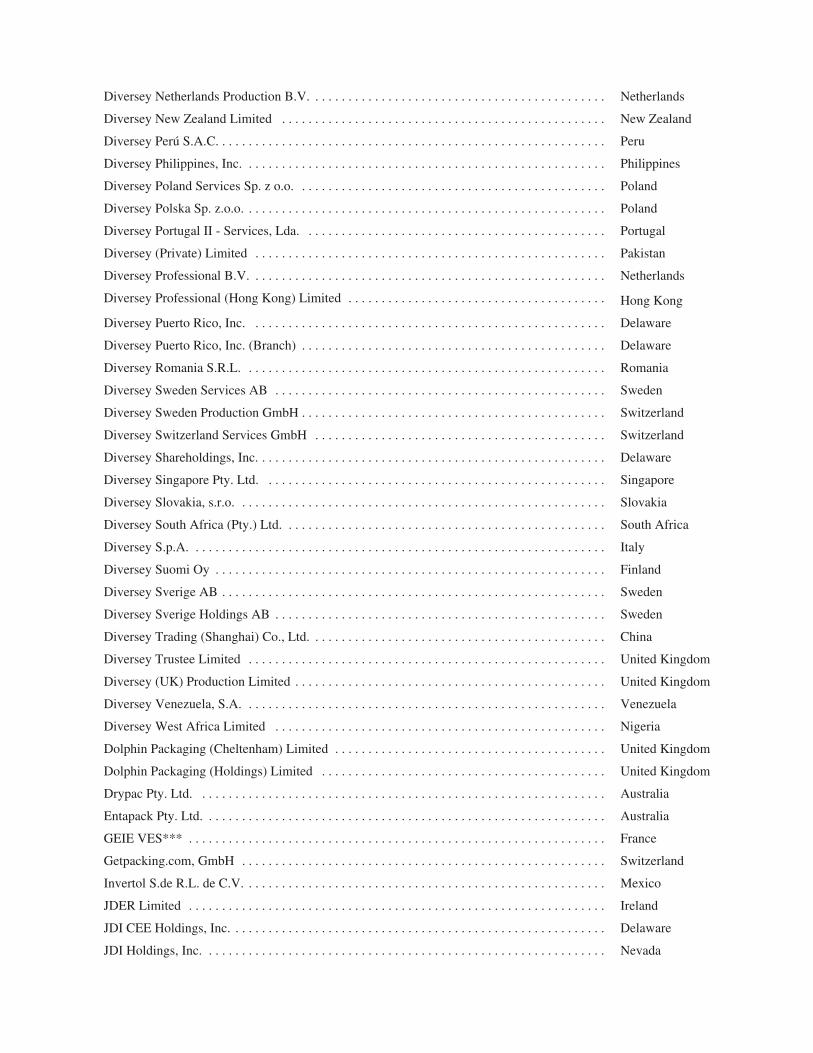
Diversey Netherlands Production B.V. . . . . . . . . . . . . . . . . . . . . . . . . . . . . . . . . . . . . . . . . . . . . Netherlands
Diversey New Zealand Limited . . . . . . . . . . . . . . . . . . . . . . . . . . . . . . . . . . . . . . . . . . . . . . . . . New Zealand
Diversey Perú S.A.C. . . . . . . . . . . . . . . . . . . . . . . . . . . . . . . . . . . . . . . . . . . . . . . . . . . . . . . . . . . Peru
Diversey Philippines, Inc. . . . . . . . . . . . . . . . . . . . . . . . . . . . . . . . . . . . . . . . . . . . . . . . . . . . . . . Philippines
Diversey Poland Services Sp. z o.o. . . . . . . . . . . . . . . . . . . . . . . . . . . . . . . . . . . . . . . . . . . . . . . Poland
Diversey Polska Sp. z.o.o. . . . . . . . . . . . . . . . . . . . . . . . . . . . . . . . . . . . . . . . . . . . . . . . . . . . . . . Poland
Diversey Portugal II - Services, Lda. . . . . . . . . . . . . . . . . . . . . . . . . . . . . . . . . . . . . . . . . . . . . . Portugal
Diversey (Private) Limited . . . . . . . . . . . . . . . . . . . . . . . . . . . . . . . . . . . . . . . . . . . . . . . . . . . . . Pakistan
Diversey Professional B.V. . . . . . . . . . . . . . . . . . . . . . . . . . . . . . . . . . . . . . . . . . . . . . . . . . . . . . Netherlands
Diversey Professional (Hong Kong) Limited . . . . . . . . . . . . . . . . . . . . . . . . . . . . . . . . . . . . . . . Hong Kong
Diversey Puerto Rico, Inc. . . . . . . . . . . . . . . . . . . . . . . . . . . . . . . . . . . . . . . . . . . . . . . . . . . . . . Delaware
Diversey Puerto Rico, Inc. (Branch) . . . . . . . . . . . . . . . . . . . . . . . . . . . . . . . . . . . . . . . . . . . . . . Delaware
Diversey Romania S.R.L. . . . . . . . . . . . . . . . . . . . . . . . . . . . . . . . . . . . . . . . . . . . . . . . . . . . . . . Romania
Diversey Sweden Services AB . . . . . . . . . . . . . . . . . . . . . . . . . . . . . . . . . . . . . . . . . . . . . . . . . . Sweden
Diversey Sweden Production GmbH . . . . . . . . . . . . . . . . . . . . . . . . . . . . . . . . . . . . . . . . . . . . . . Switzerland
Diversey Switzerland Services GmbH . . . . . . . . . . . . . . . . . . . . . . . . . . . . . . . . . . . . . . . . . . . . Switzerland
Diversey Shareholdings, Inc. . . . . . . . . . . . . . . . . . . . . . . . . . . . . . . . . . . . . . . . . . . . . . . . . . . . . Delaware
Diversey Singapore Pty. Ltd. . . . . . . . . . . . . . . . . . . . . . . . . . . . . . . . . . . . . . . . . . . . . . . . . . . . Singapore
Diversey Slovakia, s.r.o. . . . . . . . . . . . . . . . . . . . . . . . . . . . . . . . . . . . . . . . . . . . . . . . . . . . . . . . Slovakia
Diversey South Africa (Pty.) Ltd. . . . . . . . . . . . . . . . . . . . . . . . . . . . . . . . . . . . . . . . . . . . . . . . . South Africa
Diversey S.p.A. . . . . . . . . . . . . . . . . . . . . . . . . . . . . . . . . . . . . . . . . . . . . . . . . . . . . . . . . . . . . . . Italy
Diversey Suomi Oy . . . . . . . . . . . . . . . . . . . . . . . . . . . . . . . . . . . . . . . . . . . . . . . . . . . . . . . . . . . Finland
Diversey Sverige AB . . . . . . . . . . . . . . . . . . . . . . . . . . . . . . . . . . . . . . . . . . . . . . . . . . . . . . . . . . Sweden
Diversey Sverige Holdings AB . . . . . . . . . . . . . . . . . . . . . . . . . . . . . . . . . . . . . . . . . . . . . . . . . . Sweden
Diversey Trading (Shanghai) Co., Ltd. . . . . . . . . . . . . . . . . . . . . . . . . . . . . . . . . . . . . . . . . . . . . China
Diversey Trustee Limited . . . . . . . . . . . . . . . . . . . . . . . . . . . . . . . . . . . . . . . . . . . . . . . . . . . . . . United Kingdom
Diversey (UK) Production Limited . . . . . . . . . . . . . . . . . . . . . . . . . . . . . . . . . . . . . . . . . . . . . . . United Kingdom
Diversey Venezuela, S.A. . . . . . . . . . . . . . . . . . . . . . . . . . . . . . . . . . . . . . . . . . . . . . . . . . . . . . . Venezuela
Diversey West Africa Limited . . . . . . . . . . . . . . . . . . . . . . . . . . . . . . . . . . . . . . . . . . . . . . . . . . Nigeria
Dolphin Packaging (Cheltenham) Limited . . . . . . . . . . . . . . . . . . . . . . . . . . . . . . . . . . . . . . . . . United Kingdom
Dolphin Packaging (Holdings) Limited . . . . . . . . . . . . . . . . . . . . . . . . . . . . . . . . . . . . . . . . . . . United Kingdom
Drypac Pty. Ltd. . . . . . . . . . . . . . . . . . . . . . . . . . . . . . . . . . . . . . . . . . . . . . . . . . . . . . . . . . . . . . Australia
Entapack Pty. Ltd. . . . . . . . . . . . . . . . . . . . . . . . . . . . . . . . . . . . . . . . . . . . . . . . . . . . . . . . . . . . . Australia
GEIE VES*** . . . . . . . . . . . . . . . . . . . . . . . . . . . . . . . . . . . . . . . . . . . . . . . . . . . . . . . . . . . . . . . France
Getpacking.com, GmbH . . . . . . . . . . . . . . . . . . . . . . . . . . . . . . . . . . . . . . . . . . . . . . . . . . . . . . . Switzerland
Invertol S.de R.L. de C.V. . . . . . . . . . . . . . . . . . . . . . . . . . . . . . . . . . . . . . . . . . . . . . . . . . . . . . . Mexico
JDER Limited . . . . . . . . . . . . . . . . . . . . . . . . . . . . . . . . . . . . . . . . . . . . . . . . . . . . . . . . . . . . . . . Ireland
JDI CEE Holdings, Inc. . . . . . . . . . . . . . . . . . . . . . . . . . . . . . . . . . . . . . . . . . . . . . . . . . . . . . . . . Delaware
JDI Holdings, Inc. . . . . . . . . . . . . . . . . . . . . . . . . . . . . . . . . . . . . . . . . . . . . . . . . . . . . . . . . . . . . Nevada
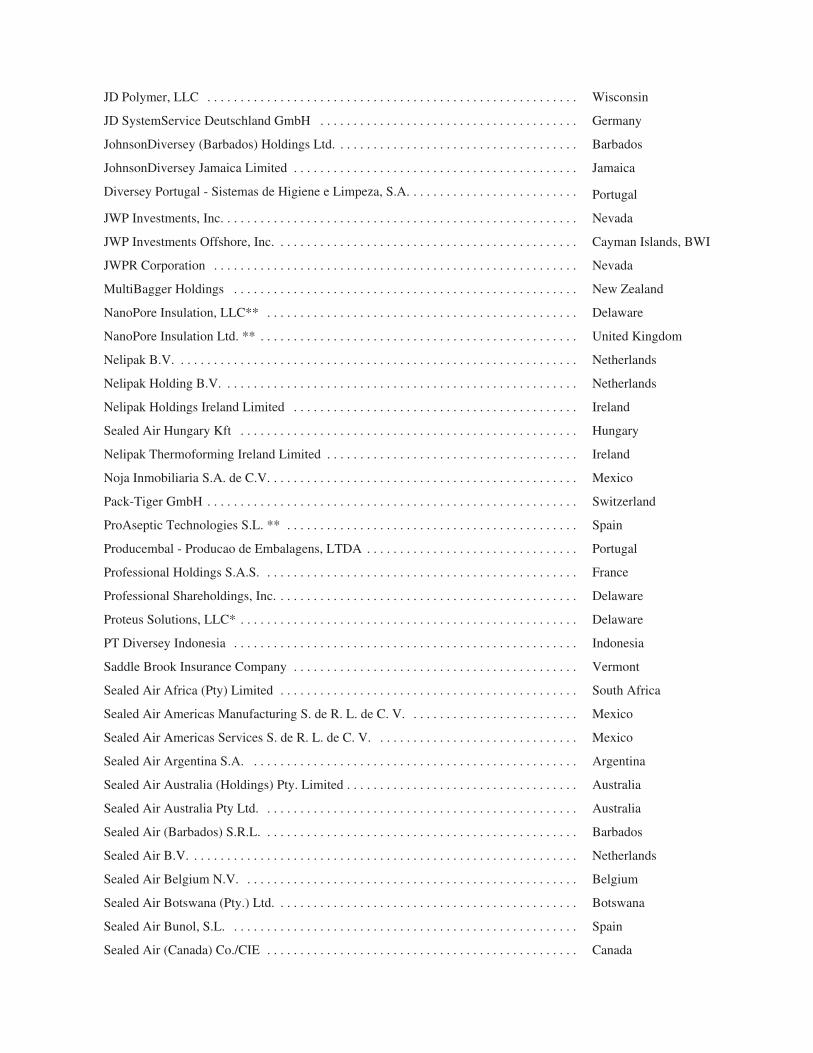
JD Polymer, LLC . . . . . . . . . . . . . . . . . . . . . . . . . . . . . . . . . . . . . . . . . . . . . . . . . . . . . . . . Wisconsin
JD SystemService Deutschland GmbH . . . . . . . . . . . . . . . . . . . . . . . . . . . . . . . . . . . . . . . Germany
JohnsonDiversey (Barbados) Holdings Ltd. . . . . . . . . . . . . . . . . . . . . . . . . . . . . . . . . . . . . Barbados
JohnsonDiversey Jamaica Limited . . . . . . . . . . . . . . . . . . . . . . . . . . . . . . . . . . . . . . . . . . . Jamaica
Diversey Portugal - Sistemas de Higiene e Limpeza, S.A. . . . . . . . . . . . . . . . . . . . . . . . . . Portugal
JWP Investments, Inc. . . . . . . . . . . . . . . . . . . . . . . . . . . . . . . . . . . . . . . . . . . . . . . . . . . . . . Nevada
JWP Investments Offshore, Inc. . . . . . . . . . . . . . . . . . . . . . . . . . . . . . . . . . . . . . . . . . . . . . Cayman Islands, BWI
JWPR Corporation . . . . . . . . . . . . . . . . . . . . . . . . . . . . . . . . . . . . . . . . . . . . . . . . . . . . . . . Nevada
MultiBagger Holdings . . . . . . . . . . . . . . . . . . . . . . . . . . . . . . . . . . . . . . . . . . . . . . . . . . . . New Zealand
NanoPore Insulation, LLC** . . . . . . . . . . . . . . . . . . . . . . . . . . . . . . . . . . . . . . . . . . . . . . . Delaware
NanoPore Insulation Ltd. ** . . . . . . . . . . . . . . . . . . . . . . . . . . . . . . . . . . . . . . . . . . . . . . . . United Kingdom
Nelipak B.V. . . . . . . . . . . . . . . . . . . . . . . . . . . . . . . . . . . . . . . . . . . . . . . . . . . . . . . . . . . . . Netherlands
Nelipak Holding B.V. . . . . . . . . . . . . . . . . . . . . . . . . . . . . . . . . . . . . . . . . . . . . . . . . . . . . . Netherlands
Nelipak Holdings Ireland Limited . . . . . . . . . . . . . . . . . . . . . . . . . . . . . . . . . . . . . . . . . . . Ireland
Sealed Air Hungary Kft . . . . . . . . . . . . . . . . . . . . . . . . . . . . . . . . . . . . . . . . . . . . . . . . . . . Hungary
Nelipak Thermoforming Ireland Limited . . . . . . . . . . . . . . . . . . . . . . . . . . . . . . . . . . . . . . Ireland
Noja Inmobiliaria S.A. de C.V. . . . . . . . . . . . . . . . . . . . . . . . . . . . . . . . . . . . . . . . . . . . . . . Mexico
Pack-Tiger GmbH . . . . . . . . . . . . . . . . . . . . . . . . . . . . . . . . . . . . . . . . . . . . . . . . . . . . . . . . Switzerland
ProAseptic Technologies S.L. ** . . . . . . . . . . . . . . . . . . . . . . . . . . . . . . . . . . . . . . . . . . . . Spain
Producembal - Producao de Embalagens, LTDA . . . . . . . . . . . . . . . . . . . . . . . . . . . . . . . . Portugal
Professional Holdings S.A.S. . . . . . . . . . . . . . . . . . . . . . . . . . . . . . . . . . . . . . . . . . . . . . . . France
Professional Shareholdings, Inc. . . . . . . . . . . . . . . . . . . . . . . . . . . . . . . . . . . . . . . . . . . . . . Delaware
Proteus Solutions, LLC* . . . . . . . . . . . . . . . . . . . . . . . . . . . . . . . . . . . . . . . . . . . . . . . . . . . Delaware
PT Diversey Indonesia . . . . . . . . . . . . . . . . . . . . . . . . . . . . . . . . . . . . . . . . . . . . . . . . . . . . Indonesia
Saddle Brook Insurance Company . . . . . . . . . . . . . . . . . . . . . . . . . . . . . . . . . . . . . . . . . . . Vermont
Sealed Air Africa (Pty) Limited . . . . . . . . . . . . . . . . . . . . . . . . . . . . . . . . . . . . . . . . . . . . . South Africa
Sealed Air Americas Manufacturing S. de R. L. de C. V. . . . . . . . . . . . . . . . . . . . . . . . . . Mexico
Sealed Air Americas Services S. de R. L. de C. V. . . . . . . . . . . . . . . . . . . . . . . . . . . . . . . Mexico
Sealed Air Argentina S.A. . . . . . . . . . . . . . . . . . . . . . . . . . . . . . . . . . . . . . . . . . . . . . . . . . Argentina
Sealed Air Australia (Holdings) Pty. Limited . . . . . . . . . . . . . . . . . . . . . . . . . . . . . . . . . . . Australia
Sealed Air Australia Pty Ltd. . . . . . . . . . . . . . . . . . . . . . . . . . . . . . . . . . . . . . . . . . . . . . . . Australia
Sealed Air (Barbados) S.R.L. . . . . . . . . . . . . . . . . . . . . . . . . . . . . . . . . . . . . . . . . . . . . . . . Barbados
Sealed Air B.V. . . . . . . . . . . . . . . . . . . . . . . . . . . . . . . . . . . . . . . . . . . . . . . . . . . . . . . . . . . Netherlands
Sealed Air Belgium N.V. . . . . . . . . . . . . . . . . . . . . . . . . . . . . . . . . . . . . . . . . . . . . . . . . . . Belgium
Sealed Air Botswana (Pty.) Ltd. . . . . . . . . . . . . . . . . . . . . . . . . . . . . . . . . . . . . . . . . . . . . . Botswana
Sealed Air Bunol, S.L. . . . . . . . . . . . . . . . . . . . . . . . . . . . . . . . . . . . . . . . . . . . . . . . . . . . . Spain
Sealed Air (Canada) Co./CIE . . . . . . . . . . . . . . . . . . . . . . . . . . . . . . . . . . . . . . . . . . . . . . . Canada
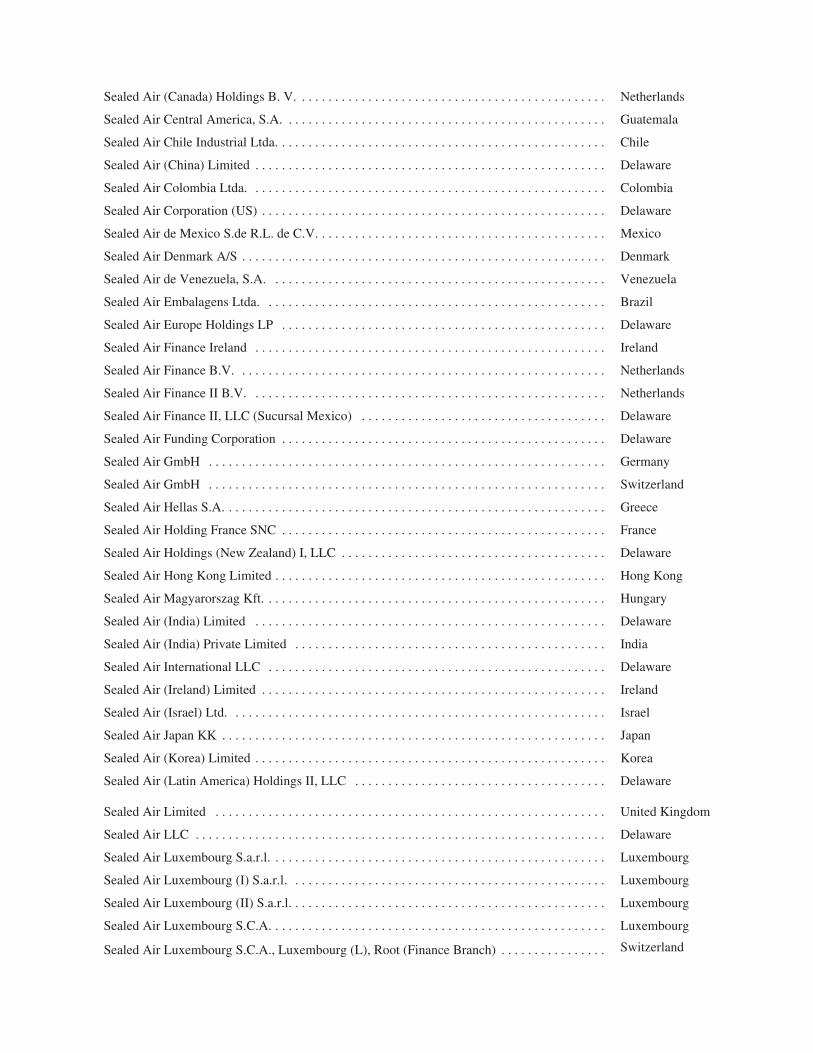
Sealed Air (Canada) Holdings B. V. . . . . . . . . . . . . . . . . . . . . . . . . . . . . . . . . . . . . . . . . . . . . . . Netherlands
Sealed Air Central America, S.A. . . . . . . . . . . . . . . . . . . . . . . . . . . . . . . . . . . . . . . . . . . . . . . . . Guatemala
Sealed Air Chile Industrial Ltda. . . . . . . . . . . . . . . . . . . . . . . . . . . . . . . . . . . . . . . . . . . . . . . . . . Chile
Sealed Air (China) Limited . . . . . . . . . . . . . . . . . . . . . . . . . . . . . . . . . . . . . . . . . . . . . . . . . . . . . Delaware
Sealed Air Colombia Ltda. . . . . . . . . . . . . . . . . . . . . . . . . . . . . . . . . . . . . . . . . . . . . . . . . . . . . . Colombia
Sealed Air Corporation (US) . . . . . . . . . . . . . . . . . . . . . . . . . . . . . . . . . . . . . . . . . . . . . . . . . . . . Delaware
Sealed Air de Mexico S.de R.L. de C.V. . . . . . . . . . . . . . . . . . . . . . . . . . . . . . . . . . . . . . . . . . . . Mexico
Sealed Air Denmark A/S . . . . . . . . . . . . . . . . . . . . . . . . . . . . . . . . . . . . . . . . . . . . . . . . . . . . . . . Denmark
Sealed Air de Venezuela, S.A. . . . . . . . . . . . . . . . . . . . . . . . . . . . . . . . . . . . . . . . . . . . . . . . . . . Venezuela
Sealed Air Embalagens Ltda. . . . . . . . . . . . . . . . . . . . . . . . . . . . . . . . . . . . . . . . . . . . . . . . . . . . Brazil
Sealed Air Europe Holdings LP . . . . . . . . . . . . . . . . . . . . . . . . . . . . . . . . . . . . . . . . . . . . . . . . . Delaware
Sealed Air Finance Ireland . . . . . . . . . . . . . . . . . . . . . . . . . . . . . . . . . . . . . . . . . . . . . . . . . . . . . Ireland
Sealed Air Finance B.V. . . . . . . . . . . . . . . . . . . . . . . . . . . . . . . . . . . . . . . . . . . . . . . . . . . . . . . . Netherlands
Sealed Air Finance II B.V. . . . . . . . . . . . . . . . . . . . . . . . . . . . . . . . . . . . . . . . . . . . . . . . . . . . . . Netherlands
Sealed Air Finance II, LLC (Sucursal Mexico) . . . . . . . . . . . . . . . . . . . . . . . . . . . . . . . . . . . . . Delaware
Sealed Air Funding Corporation . . . . . . . . . . . . . . . . . . . . . . . . . . . . . . . . . . . . . . . . . . . . . . . . . Delaware
Sealed Air GmbH . . . . . . . . . . . . . . . . . . . . . . . . . . . . . . . . . . . . . . . . . . . . . . . . . . . . . . . . . . . . Germany
Sealed Air GmbH . . . . . . . . . . . . . . . . . . . . . . . . . . . . . . . . . . . . . . . . . . . . . . . . . . . . . . . . . . . . Switzerland
Sealed Air Hellas S.A. . . . . . . . . . . . . . . . . . . . . . . . . . . . . . . . . . . . . . . . . . . . . . . . . . . . . . . . . . Greece
Sealed Air Holding France SNC . . . . . . . . . . . . . . . . . . . . . . . . . . . . . . . . . . . . . . . . . . . . . . . . . France
Sealed Air Holdings (New Zealand) I, LLC . . . . . . . . . . . . . . . . . . . . . . . . . . . . . . . . . . . . . . . . Delaware
Sealed Air Hong Kong Limited . . . . . . . . . . . . . . . . . . . . . . . . . . . . . . . . . . . . . . . . . . . . . . . . . . Hong Kong
Sealed Air Magyarorszag Kft. . . . . . . . . . . . . . . . . . . . . . . . . . . . . . . . . . . . . . . . . . . . . . . . . . . . Hungary
Sealed Air (India) Limited . . . . . . . . . . . . . . . . . . . . . . . . . . . . . . . . . . . . . . . . . . . . . . . . . . . . . Delaware
Sealed Air (India) Private Limited . . . . . . . . . . . . . . . . . . . . . . . . . . . . . . . . . . . . . . . . . . . . . . . India
Sealed Air International LLC . . . . . . . . . . . . . . . . . . . . . . . . . . . . . . . . . . . . . . . . . . . . . . . . . . . Delaware
Sealed Air (Ireland) Limited . . . . . . . . . . . . . . . . . . . . . . . . . . . . . . . . . . . . . . . . . . . . . . . . . . . . Ireland
Sealed Air (Israel) Ltd. . . . . . . . . . . . . . . . . . . . . . . . . . . . . . . . . . . . . . . . . . . . . . . . . . . . . . . . . Israel
Sealed Air Japan KK . . . . . . . . . . . . . . . . . . . . . . . . . . . . . . . . . . . . . . . . . . . . . . . . . . . . . . . . . . Japan
Sealed Air (Korea) Limited . . . . . . . . . . . . . . . . . . . . . . . . . . . . . . . . . . . . . . . . . . . . . . . . . . . . . Korea
Sealed Air (Latin America) Holdings II, LLC . . . . . . . . . . . . . . . . . . . . . . . . . . . . . . . . . . . . . . Delaware
Sealed Air Limited . . . . . . . . . . . . . . . . . . . . . . . . . . . . . . . . . . . . . . . . . . . . . . . . . . . . . . . . . . . United Kingdom
Sealed Air LLC . . . . . . . . . . . . . . . . . . . . . . . . . . . . . . . . . . . . . . . . . . . . . . . . . . . . . . . . . . . . . . Delaware
Sealed Air Luxembourg S.a.r.l. . . . . . . . . . . . . . . . . . . . . . . . . . . . . . . . . . . . . . . . . . . . . . . . . . . Luxembourg
Sealed Air Luxembourg (I) S.a.r.l. . . . . . . . . . . . . . . . . . . . . . . . . . . . . . . . . . . . . . . . . . . . . . . . Luxembourg
Sealed Air Luxembourg (II) S.a.r.l. . . . . . . . . . . . . . . . . . . . . . . . . . . . . . . . . . . . . . . . . . . . . . . . Luxembourg
Sealed Air Luxembourg S.C.A. . . . . . . . . . . . . . . . . . . . . . . . . . . . . . . . . . . . . . . . . . . . . . . . . . . Luxembourg
Sealed Air Luxembourg S.C.A., Luxembourg (L), Root (Finance Branch) . . . . . . . . . . . . . . . . Switzerland
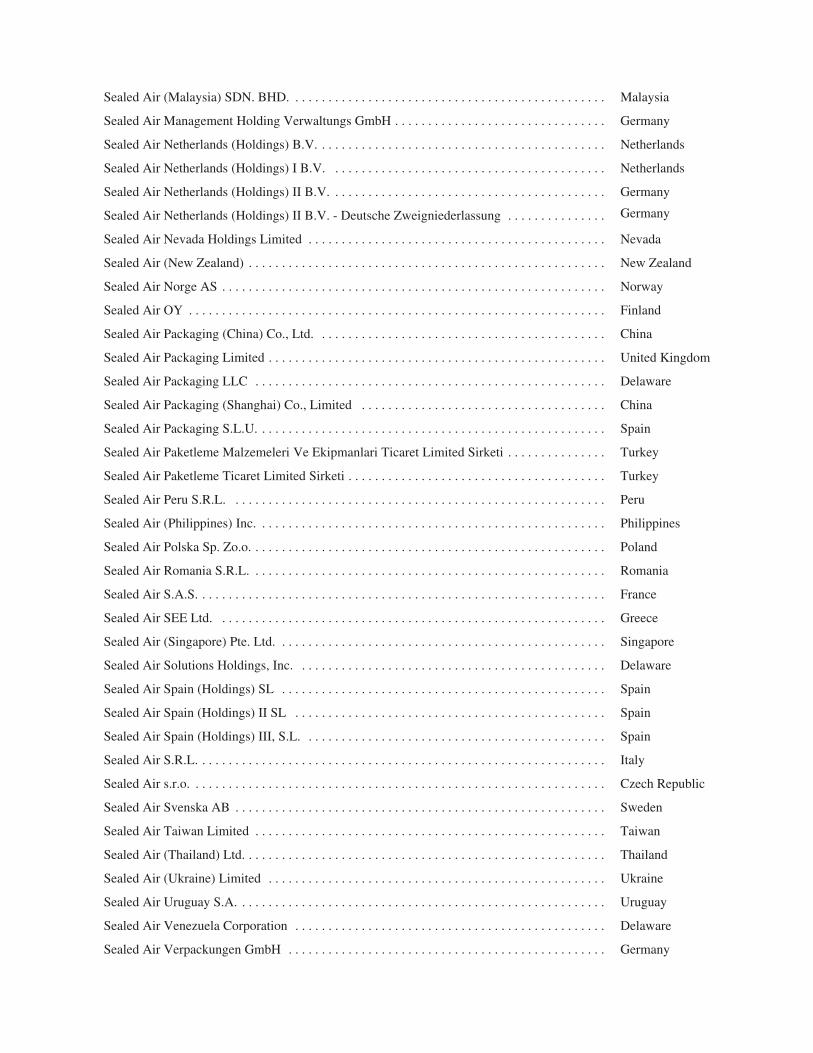
Sealed Air (Malaysia) SDN. BHD. . . . . . . . . . . . . . . . . . . . . . . . . . . . . . . . . . . . . . . . . . . . . . . . Malaysia
Sealed Air Management Holding Verwaltungs GmbH . . . . . . . . . . . . . . . . . . . . . . . . . . . . . . . . Germany
Sealed Air Netherlands (Holdings) B.V. . . . . . . . . . . . . . . . . . . . . . . . . . . . . . . . . . . . . . . . . . . . Netherlands
Sealed Air Netherlands (Holdings) I B.V. . . . . . . . . . . . . . . . . . . . . . . . . . . . . . . . . . . . . . . . . . Netherlands
Sealed Air Netherlands (Holdings) II B.V. . . . . . . . . . . . . . . . . . . . . . . . . . . . . . . . . . . . . . . . . . Germany
Sealed Air Netherlands (Holdings) II B.V. - Deutsche Zweigniederlassung . . . . . . . . . . . . . . . Germany
Sealed Air Nevada Holdings Limited . . . . . . . . . . . . . . . . . . . . . . . . . . . . . . . . . . . . . . . . . . . . . Nevada
Sealed Air (New Zealand) . . . . . . . . . . . . . . . . . . . . . . . . . . . . . . . . . . . . . . . . . . . . . . . . . . . . . . New Zealand
Sealed Air Norge AS . . . . . . . . . . . . . . . . . . . . . . . . . . . . . . . . . . . . . . . . . . . . . . . . . . . . . . . . . . Norway
Sealed Air OY . . . . . . . . . . . . . . . . . . . . . . . . . . . . . . . . . . . . . . . . . . . . . . . . . . . . . . . . . . . . . . . Finland
Sealed Air Packaging (China) Co., Ltd. . . . . . . . . . . . . . . . . . . . . . . . . . . . . . . . . . . . . . . . . . . . China
Sealed Air Packaging Limited . . . . . . . . . . . . . . . . . . . . . . . . . . . . . . . . . . . . . . . . . . . . . . . . . . . United Kingdom
Sealed Air Packaging LLC . . . . . . . . . . . . . . . . . . . . . . . . . . . . . . . . . . . . . . . . . . . . . . . . . . . . . Delaware
Sealed Air Packaging (Shanghai) Co., Limited . . . . . . . . . . . . . . . . . . . . . . . . . . . . . . . . . . . . . China
Sealed Air Packaging S.L.U. . . . . . . . . . . . . . . . . . . . . . . . . . . . . . . . . . . . . . . . . . . . . . . . . . . . . Spain
Sealed Air Paketleme Malzemeleri Ve Ekipmanlari Ticaret Limited Sirketi . . . . . . . . . . . . . . . Turkey
Sealed Air Paketleme Ticaret Limited Sirketi . . . . . . . . . . . . . . . . . . . . . . . . . . . . . . . . . . . . . . . Turkey
Sealed Air Peru S.R.L. . . . . . . . . . . . . . . . . . . . . . . . . . . . . . . . . . . . . . . . . . . . . . . . . . . . . . . . . Peru
Sealed Air (Philippines) Inc. . . . . . . . . . . . . . . . . . . . . . . . . . . . . . . . . . . . . . . . . . . . . . . . . . . . . Philippines
Sealed Air Polska Sp. Zo.o. . . . . . . . . . . . . . . . . . . . . . . . . . . . . . . . . . . . . . . . . . . . . . . . . . . . . . Poland
Sealed Air Romania S.R.L. . . . . . . . . . . . . . . . . . . . . . . . . . . . . . . . . . . . . . . . . . . . . . . . . . . . . . Romania
Sealed Air S.A.S. . . . . . . . . . . . . . . . . . . . . . . . . . . . . . . . . . . . . . . . . . . . . . . . . . . . . . . . . . . . . . France
Sealed Air SEE Ltd. . . . . . . . . . . . . . . . . . . . . . . . . . . . . . . . . . . . . . . . . . . . . . . . . . . . . . . . . . . Greece
Sealed Air (Singapore) Pte. Ltd. . . . . . . . . . . . . . . . . . . . . . . . . . . . . . . . . . . . . . . . . . . . . . . . . . Singapore
Sealed Air Solutions Holdings, Inc. . . . . . . . . . . . . . . . . . . . . . . . . . . . . . . . . . . . . . . . . . . . . . . Delaware
Sealed Air Spain (Holdings) SL . . . . . . . . . . . . . . . . . . . . . . . . . . . . . . . . . . . . . . . . . . . . . . . . . Spain
Sealed Air Spain (Holdings) II SL . . . . . . . . . . . . . . . . . . . . . . . . . . . . . . . . . . . . . . . . . . . . . . . Spain
Sealed Air Spain (Holdings) III, S.L. . . . . . . . . . . . . . . . . . . . . . . . . . . . . . . . . . . . . . . . . . . . . . Spain
Sealed Air S.R.L. . . . . . . . . . . . . . . . . . . . . . . . . . . . . . . . . . . . . . . . . . . . . . . . . . . . . . . . . . . . . . Italy
Sealed Air s.r.o. . . . . . . . . . . . . . . . . . . . . . . . . . . . . . . . . . . . . . . . . . . . . . . . . . . . . . . . . . . . . . . Czech Republic
Sealed Air Svenska AB . . . . . . . . . . . . . . . . . . . . . . . . . . . . . . . . . . . . . . . . . . . . . . . . . . . . . . . . Sweden
Sealed Air Taiwan Limited . . . . . . . . . . . . . . . . . . . . . . . . . . . . . . . . . . . . . . . . . . . . . . . . . . . . . Taiwan
Sealed Air (Thailand) Ltd. . . . . . . . . . . . . . . . . . . . . . . . . . . . . . . . . . . . . . . . . . . . . . . . . . . . . . . Thailand
Sealed Air (Ukraine) Limited . . . . . . . . . . . . . . . . . . . . . . . . . . . . . . . . . . . . . . . . . . . . . . . . . . . Ukraine
Sealed Air Uruguay S.A. . . . . . . . . . . . . . . . . . . . . . . . . . . . . . . . . . . . . . . . . . . . . . . . . . . . . . . . Uruguay
Sealed Air Venezuela Corporation . . . . . . . . . . . . . . . . . . . . . . . . . . . . . . . . . . . . . . . . . . . . . . . Delaware
Sealed Air Verpackungen GmbH . . . . . . . . . . . . . . . . . . . . . . . . . . . . . . . . . . . . . . . . . . . . . . . . Germany
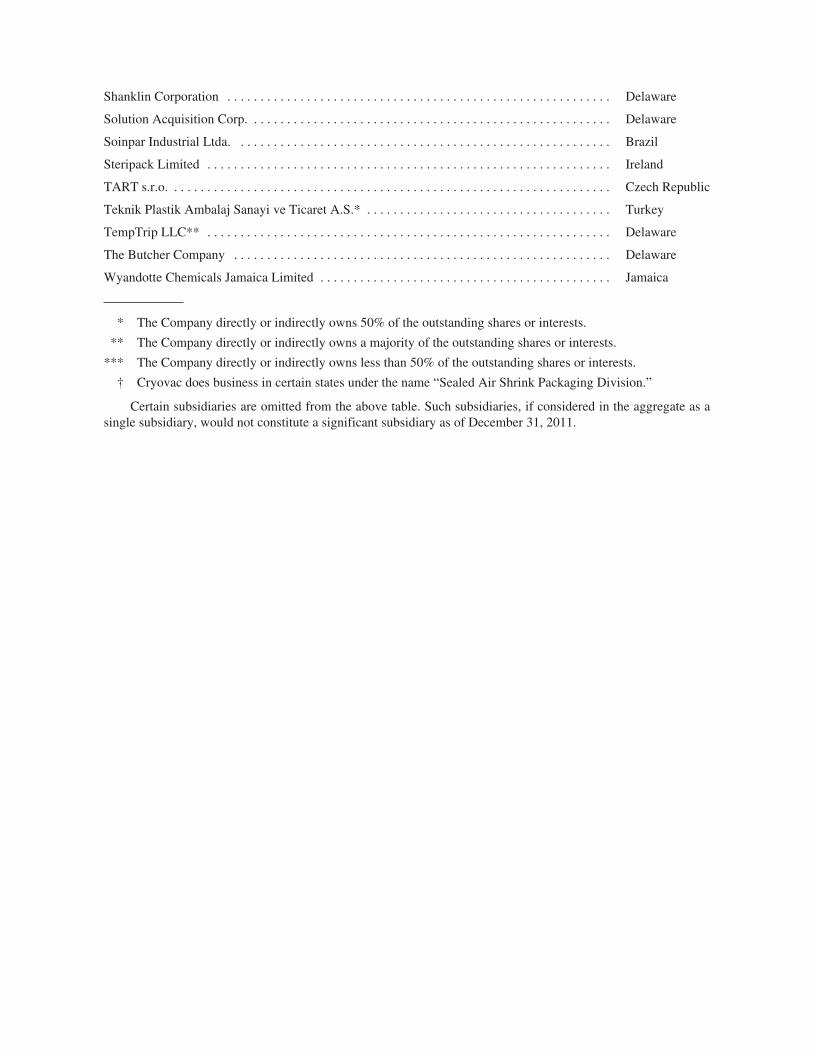
Shanklin Corporation . . . . . . . . . . . . . . . . . . . . . . . . . . . . . . . . . . . . . . . . . . . . . . . . . . . . . . . . . . Delaware
Solution Acquisition Corp. . . . . . . . . . . . . . . . . . . . . . . . . . . . . . . . . . . . . . . . . . . . . . . . . . . . . . . Delaware
Soinpar Industrial Ltda. . . . . . . . . . . . . . . . . . . . . . . . . . . . . . . . . . . . . . . . . . . . . . . . . . . . . . . . . Brazil
Steripack Limited . . . . . . . . . . . . . . . . . . . . . . . . . . . . . . . . . . . . . . . . . . . . . . . . . . . . . . . . . . . . . Ireland
TART s.r.o. . . . . . . . . . . . . . . . . . . . . . . . . . . . . . . . . . . . . . . . . . . . . . . . . . . . . . . . . . . . . . . . . . . Czech Republic
Teknik Plastik Ambalaj Sanayi ve Ticaret A.S.* . . . . . . . . . . . . . . . . . . . . . . . . . . . . . . . . . . . . . Turkey
TempTrip LLC** . . . . . . . . . . . . . . . . . . . . . . . . . . . . . . . . . . . . . . . . . . . . . . . . . . . . . . . . . . . . . Delaware
The Butcher Company . . . . . . . . . . . . . . . . . . . . . . . . . . . . . . . . . . . . . . . . . . . . . . . . . . . . . . . . . Delaware
Wyandotte Chemicals Jamaica Limited . . . . . . . . . . . . . . . . . . . . . . . . . . . . . . . . . . . . . . . . . . . . Jamaica
* The Company directly or indirectly owns 50% of the outstanding shares or interests.
** The Company directly or indirectly owns a majority of the outstanding shares or interests.
*** The Company directly or indirectly owns less than 50% of the outstanding shares or interests.
† Cryovac does business in certain states under the name “Sealed Air Shrink Packaging Division.”
Certain subsidiaries are omitted from the above table. Such subsidiaries, if considered in the aggregate as asingle subsidiary, would not constitute a significant subsidiary as of December 31, 2011.
Exhibit 23.1
CONSENT OF INDEPENDENT REGISTERED PUBLIC ACCOUNTING FIRM
The Board of DirectorsSealed Air Corporation:
We consent to the incorporation by reference in the registration statements (Nos. 333-176275, 333-176267,333-152909, 333-89090, and 333-126890) on Form S-8 and the registration statements (Nos. 333-157851 and333-177130) on Form S-3 of Sealed Air Corporation of our report dated February 29, 2012, with respect to theconsolidated balance sheets of Sealed Air Corporation and subsidiaries as of December 31, 2011 and 2010, andthe related consolidated statements of operations, stockholders’ equity, cash flows and comprehensive income foreach of the years in the three-year period ended December 31, 2011, and the related financial statement schedule,and the effectiveness of internal control over financial reporting as of December 31, 2011, which report appearsin the December 31, 2011 annual report on Form 10-K of Sealed Air Corporation.
Our report dated February 29, 2012 on the effectiveness of internal control over financial reporting as ofDecember 31, 2011, contains an explanatory paragraph that states management excluded from its assessment ofthe effectiveness of Sealed Air Corporation’s internal control over financial reporting as of December 31, 2011,Diversey Holdings Inc.’s internal control over financial reporting associated with total assets of $6.5 billion (ofwhich $4.7 billion represented goodwill and intangible assets included within the scope of the assessment) andtotal net sales of $796 million included in the consolidated financial statements of Sealed Air Corporation andsubsidiaries as of and for the year ended December 31, 2011.
/s/ KPMG LLP
Short Hills, New Jersey
February 29, 2012
Exhibit 31.1
CERTIFICATIONS
I, William V. Hickey, certify that:
1. I have reviewed this Annual Report on Form 10-K of Sealed Air Corporation;
2. Based on my knowledge, this report does not contain any untrue statement of a material fact or omit tostate a material fact necessary to make the statements made, in light of the circumstances under which suchstatements were made, not misleading with respect to the period covered by this report;
3. Based on my knowledge, the financial statements, and other financial information included in this report,fairly present in all material respects the financial condition, results of operations and cash flows of the registrantas of, and for, the periods presented in this report;
4. The registrant’s other certifying officer and I are responsible for establishing and maintaining disclosurecontrols and procedures (as defined in Exchange Act Rules 13a-15(e) and 15d-15(e)) and internal control overfinancial reporting (as defined in Exchange Act Rules 13a-15(f) and 15d-15(f)) for the registrant and have:
(a) Designed such disclosure controls and procedures, or caused such disclosure controls andprocedures to be designed under our supervision, to ensure that material information relating to theregistrant, including its consolidated subsidiaries, is made known to us by others within those entities,particularly during the period in which this report is being prepared;
(b) Designed such internal control over financial reporting, or caused such internal control overfinancial reporting to be designed under our supervision, to provide reasonable assurance regarding thereliability of financial reporting and the preparation of financial statements for external purposes inaccordance with generally accepted accounting principles;
(c) Evaluated the effectiveness of the registrant’s disclosure controls and procedures and presented inthis report our conclusions about the effectiveness of the disclosure controls and procedures, as of the end ofthe period covered by this report based on such evaluation; and
(d) Disclosed in this report any change in the registrant’s internal control over financial reporting thatoccurred during the registrant’s most recent fiscal quarter (the registrant’s fourth fiscal quarter in the case ofan annual report) that has materially affected, or is reasonably likely to materially affect, the registrant’sinternal control over financial reporting; and
5. The registrant’s other certifying officer and I have disclosed, based on our most recent evaluation ofinternal control over financial reporting, to the registrant’s auditors and the audit committee of the registrant’sboard of directors (or persons performing the equivalent functions):
(a) All significant deficiencies and material weaknesses in the design or operation of internal controlover financial reporting which are reasonably likely to adversely affect the registrant’s ability to record,process, summarize and report financial information; and
(b) Any fraud, whether or not material, that involves management or other employees who have asignificant role in the registrant’s internal control over financial reporting.
/S/ WILLIAM V. HICKEY
William V. HickeyPresident and Chief Executive Officer
Date: February 29, 2012

Exhibit 31.2
CERTIFICATIONS
I, Tod S. Christie, certify that:
1. I have reviewed this Annual Report on Form 10-K of Sealed Air Corporation;
2. Based on my knowledge, this report does not contain any untrue statement of a material fact or omit tostate a material fact necessary to make the statements made, in light of the circumstances under which suchstatements were made, not misleading with respect to the period covered by this report;
3. Based on my knowledge, the financial statements, and other financial information included in this report,fairly present in all material respects the financial condition, results of operations and cash flows of the registrantas of, and for, the periods presented in this report;
4. The registrant’s other certifying officer and I are responsible for establishing and maintaining disclosurecontrols and procedures (as defined in Exchange Act Rules 13a-15(e) and 15d-15(e)) and internal control overfinancial reporting (as defined in Exchange Act Rules 13a-15(f) and 15d-15(f)) for the registrant and have:
(a) Designed such disclosure controls and procedures, or caused such disclosure controls andprocedures to be designed under our supervision, to ensure that material information relating to theregistrant, including its consolidated subsidiaries, is made known to us by others within those entities,particularly during the period in which this report is being prepared;
(b) Designed such internal control over financial reporting, or caused such internal control overfinancial reporting to be designed under our supervision, to provide reasonable assurance regarding thereliability of financial reporting and the preparation of financial statements for external purposes inaccordance with generally accepted accounting principles;
(c) Evaluated the effectiveness of the registrant’s disclosure controls and procedures and presented inthis report our conclusions about the effectiveness of the disclosure controls and procedures, as of the end ofthe period covered by this report based on such evaluation; and
(d) Disclosed in this report any change in the registrant’s internal control over financial reporting thatoccurred during the registrant’s most recent fiscal quarter (the registrant’s fourth fiscal quarter in the case ofan annual report) that has materially affected, or is reasonably likely to materially affect, the registrant’sinternal control over financial reporting; and
5. The registrant’s other certifying officer and I have disclosed, based on our most recent evaluation ofinternal control over financial reporting, to the registrant’s auditors and the audit committee of the registrant’sboard of directors (or persons performing the equivalent functions):
(a) All significant deficiencies and material weaknesses in the design or operation of internal controlover financial reporting which are reasonably likely to adversely affect the registrant’s ability to record,process, summarize and report financial information; and
(b) Any fraud, whether or not material, that involves management or other employees who have asignificant role in the registrant’s internal control over financial reporting.
/S/ TOD S. CHRISTIE
Tod S. CHRISTIE
Treasurer and Interim Chief Financial Officer
Date: February 29, 2012
Exhibit 32
Certification of CEO and CFO Pursuant to18 U.S.C. Section 1350,as Adopted Pursuant to
Section 906 of the Sarbanes-Oxley Act of 2002
In connection with the Annual Report on Form 10-K of Sealed Air Corporation (the “Company”) for thefiscal year ended December 31, 2011 as filed with the Securities and Exchange Commission on the date hereof(the “Report”), William V. Hickey, as Chief Executive Officer of the Company, and Tod S. Christie, as InterimChief Financial Officer of the Company, each hereby certifies pursuant to 18 U.S.C. § 1350, as adopted pursuantto § 906 of the Sarbanes-Oxley Act of 2002, that, to the best of his knowledge:
(1) The Report fully complies with the requirements of Section 13(a) or 15(d) of the SecuritiesExchange Act of 1934; and
(2) The information contained in the Report fairly presents, in all material respects, the financialcondition and results of operations of the Company.
By: /S/ WILLIAM V. HICKEY
Name: William V. HickeyTitle: Chief Executive Officer
Date: February 29, 2012
By: /S/ TOD S. CHRISTIE
Name: Tod S. ChristieTitle: Treasurer and Interim ChiefFinancial Officer
Date: February 29, 2012
Annual Report Design by Curran & Connors, Inc. / www.curran-connors.com
STOCK INFORMATION
Our common stock is listed on the New York Stock
Exchange and is traded under the ticker symbol SEE.
As of January 31, 2012, there were approximately
192.1 million shares of our common stock outstand-
ing and approximately 6,000 holders of record of our
common stock.
ANNUAL MEETING
Our Annual Meeting of Stockholders is scheduled to
be held on Thursday, May 17, 2012 at 10:00 am (ET)
at the Saddle Brook Marriott, 138 New Pehle Avenue,
Saddle Brook, New Jersey 07663, USA. This meeting
will be webcast.
INFORMATION RESOURCES
Our website, www.sealedair.com, offers news about
the Company, our products and solutions, and our
citizenship efforts. Our financial news releases,
Annual Reports on Form 10-K, Proxy Statements,
Annual Reviews, Quarterly Reports on Form 10-Q
and other SEC filings are available in the “Investor
Information” section of the web site.
Stockholders who wish to receive paper copies
of the information listed above, without charge,
should contact our Investor Relations Department
by calling (201) 791-7600, by email: investor.relations@
sealedair.com, or by writing to Investor Relations at
the following address:
Sealed Air Corporation
Investor Relations
200 Riverfront Boulevard
Elmwood Park, New Jersey, USA 07407-1033
For additional information, please contact:
Amanda Butler
Executive Director of Investor Relations
at (201) 703-4210
INTERESTED IN LEARNING ABOUT OUR CITIZENSHIP
INITIATIVES?
Please visit the “Citizenship & Environment” section
of our website at www.sealedair.com.
SHAREOWNER ACCOUNT ASSISTANCE
For information and maintenance on your shareholder
of record account, please contact:
Computershare Shareowner Services LLC
Newport Office Center VII
480 Washington Boulevard
Jersey City, New Jersey, USA 07310
(800) 648-8381 (US and Canada)
(201) (680)-6578 (International)
(201) 680-6610 (TDD for hearing impaired)
Automated telephone support services are available
24 hours per day 7 days per week. BNY Mellon
Shareowner Services customer service representa-
tives are available 9:00 a.m. to 7:00 p.m. (ET), Monday
through Friday.
SHAREOWNER INTERNET ACCOUNT ACCESS
For account access via the Internet, please log on to
www.bnymellon.com/shareowner.isd. Once registered,
shareowners can view account history and complete
transactions online.
DIRECT STOCK PURCHASE AND DIVIDEND
REINVESTMENT
BNY Mellon Shareowner Services offers the Investor
Services program for investors of the Sealed Air
Corporation to directly purchase and sell shares of
Sealed Air common stock or reinvest dividends.
To request program material and access enrollment,
you may visit www.bnymellon.com/shareowner/isd
or by contacting BNY Mellon Shareowner Services
at the numbers listed above.
INDEPENDENT REGISTERED PUBLIC ACCOUNTING FIRM
KPMG LLP
STOCKHOLDER INFO
Corporate Headquarters
200 Riverfront Boulevard
Elmwood Park, NJ 07407-1033
(P) 201.791.7600 (F) 201.703.4205
www.sealedair.com
printed on paper with up to 50% recycled content


