Embed Size (px)
Citation preview

This content has been downloaded from IOPscience. Please scroll down to see the full text.
Download details:
IP Address: 144.206.7.195
This content was downloaded on 18/12/2014 at 07:11
Please note that terms and conditions apply.
Search for ALCR-+SR spin polaron resonances in Cd2Re2O7 and FeGa3
View the table of contents for this issue, or go to the journal homepage for more
2014 J. Phys.: Conf. Ser. 551 012022
(http://iopscience.iop.org/1742-6596/551/1/012022)
Home Search Collections Journals About Contact us My IOPscience

Search for ALCR-µ+SR spin polaron resonances in
Cd2Re2O7 and FeGa3
J H Brewer1, V G Storchak2, D G Eshchenko3, R L Lichti4,P W Mengyan4 and D J Arseneau5
1 Department of Physics and Astronomy, University of British Columbia, Vancouver, BC,Canada V6T 1Z12 Kurchatov Institute, Kurchatov Sq. 1, Moscow 123182, Russia3 Bruker BioSpin AG, Industriestrasse 26, 8117 Fallanden, Switzerland4 Department of Physics, Texas Tech University, Lubbock, Texas 79409-1051, USA5 TRIUMF, 4004 Wesbrook Mall, Vancouver, BC, Canada V6T 2A3
E-mail: [email protected]
Abstract. Certain magnetic materials may contain spin polarons (SP) — tiny, stableferromagnetic “droplets” in a paramagnetic or weakly ordered “sea” of more random spins.The positive muon may become associated with SP, giving a unique window on their properties.In this experiment the µ+SR spectroscopy of “avoided level crossing resonance” (µALCR) wasused on several candidate materials to further explore this model. The results leave manyquestions unanswered.
1. IntroductionNumerous semiconducting[1, 2, 3] and metallic[4] magnetic materials have been found to exhibitcharacteristic two-frequency µ+SR precession signals in high transverse magnetic field (HTF-µ+SR), but skepticism remains over the assignment of these spectra to muons associated withde Gennes’ legendary magnetic polarons (MP)[5] or spin polarons (SP). This is understandable,since the SP picture is a radical departure from “conventional wisdom” about both muonium andmagnetism. It is therefore incumbent upon both advocates and adversaries of this interpretationto present as much spectroscopic evidence as possible in support or contradiction of the SPpicture.
In studies of muonium (Mu = µ+e−) in solids and muonated radicals in liquids, the hyperfinefrequency of the species containing the muon is routinely measured in high transverse magneticfield (HTF-µ+SR) as the splitting A between two precession frequencies on opposite sides of themuon Larmor frequency νµ, as shown in Fig. 1. In a SP, the electron’s spin is locked to thatof the local ferromagnetic (FM) “droplet” by a very strong exchange interaction, but the samesort of splitting still appears. Of course, muons in an antiferromagnetic (AFM) crystal withlocal fields parallel or antiparallel to the applied field will produce a similar pattern, so otherconsiderations must help determine which scenario applies.
The basic mechanism of muon avoided level crossing resonance (µALCR) is depicted in Fig. 2.Usually it is assumed that J � A. The opposite is the case in a SP, if J is the exchangeinteraction between the SP electron and the paramagnetic ions comprising the SP. However, if
13th International Conference on Muon Spin Rotation, Relaxation and Resonance IOP PublishingJournal of Physics: Conference Series 551 (2014) 012022 doi:10.1088/1742-6596/551/1/012022
Content from this work may be used under the terms of the Creative Commons Attribution 3.0 licence. Any further distributionof this work must maintain attribution to the author(s) and the title of the work, journal citation and DOI.
Published under licence by IOP Publishing Ltd 1
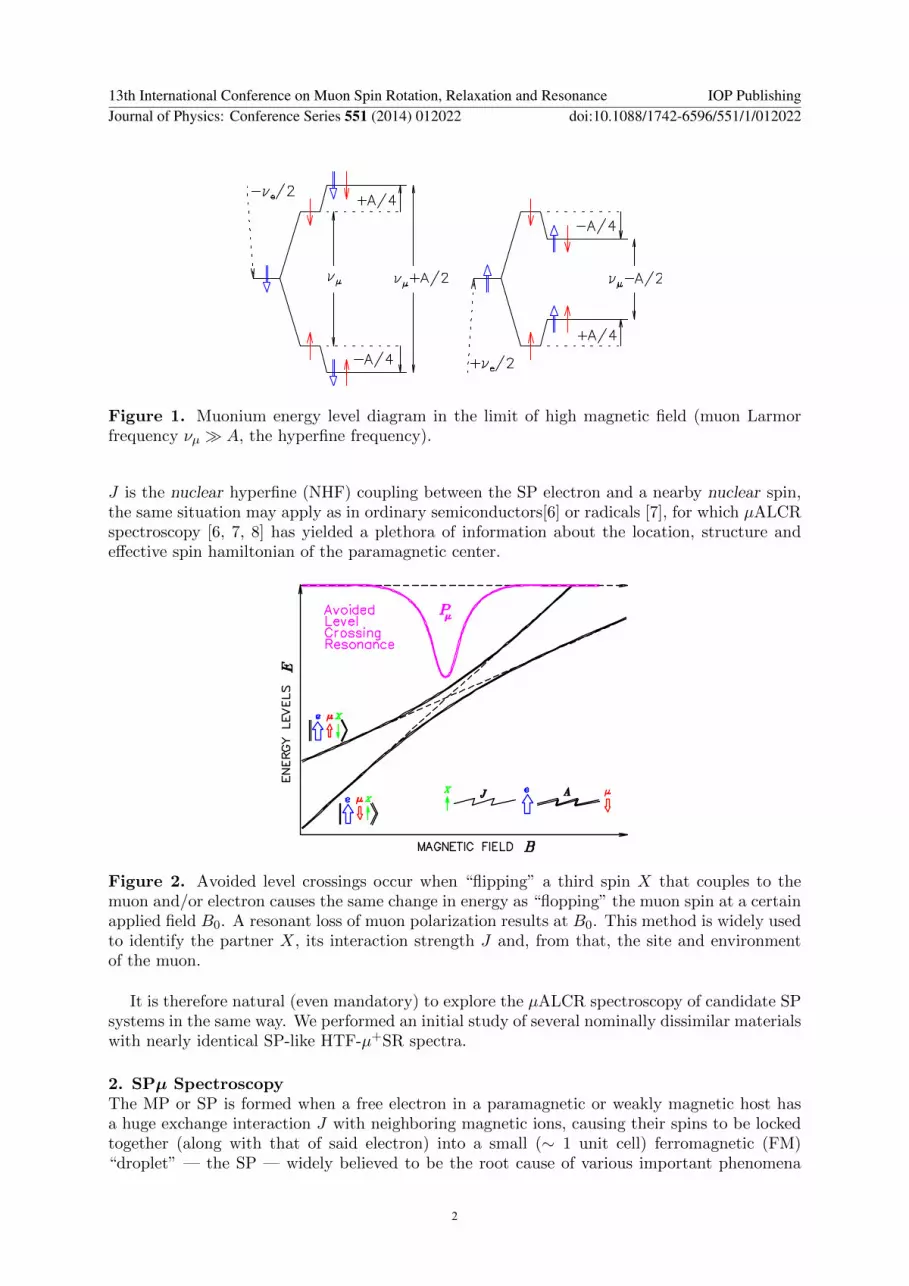
Figure 1. Muonium energy level diagram in the limit of high magnetic field (muon Larmorfrequency νµ � A, the hyperfine frequency).
J is the nuclear hyperfine (NHF) coupling between the SP electron and a nearby nuclear spin,the same situation may apply as in ordinary semiconductors[6] or radicals [7], for which µALCRspectroscopy [6, 7, 8] has yielded a plethora of information about the location, structure andeffective spin hamiltonian of the paramagnetic center.
Figure 2. Avoided level crossings occur when “flipping” a third spin X that couples to themuon and/or electron causes the same change in energy as “flopping” the muon spin at a certainapplied field B0. A resonant loss of muon polarization results at B0. This method is widely usedto identify the partner X, its interaction strength J and, from that, the site and environmentof the muon.
It is therefore natural (even mandatory) to explore the µALCR spectroscopy of candidate SPsystems in the same way. We performed an initial study of several nominally dissimilar materialswith nearly identical SP-like HTF-µ+SR spectra.
2. SPµ SpectroscopyThe MP or SP is formed when a free electron in a paramagnetic or weakly magnetic host hasa huge exchange interaction J with neighboring magnetic ions, causing their spins to be lockedtogether (along with that of said electron) into a small (∼ 1 unit cell) ferromagnetic (FM)“droplet” — the SP — widely believed to be the root cause of various important phenomena
13th International Conference on Muon Spin Rotation, Relaxation and Resonance IOP PublishingJournal of Physics: Conference Series 551 (2014) 012022 doi:10.1088/1742-6596/551/1/012022
2

such as metal-insulator transitions in magnetic semiconductors (MS)[9]. The energy decreasedue to this local FM ordering compensates for the increased kinetic energy of the SP electroncaused by its localization. In some cases the additional electrostatic binding energy of saidelectron to the µ+ assists in the localization; in other cases a SP population exists independentof the muon but the negatively charged SP attracts (and is bound to) the µ+ in a neutral “SPµ”complex, analogous to muonium or muonated radicals.
The ability of HTF-µ+SR to probe the SP depends upon the muon’s incorporation into theSP in a consistent way; thus the system in question is often described as a bound magneticpolaron (BMP). However, this designation is usually taken to imply a SP that is not free tomove through the lattice, which may be a poor picture of the SPµ system in cases where themuon is “bound” to the SP only by the latter’s negative charge, providing only a small extraimpedance to the mobility of this exotic charge carrier.
The two SP candidate materials chosen for this µALCR study are the metallic, magneticallyfrustrated pyrochlore Cd2Re2O7 and the magnetic semiconductor FeGa3, both of whose HTF-µ+SR frequency spectra are shown in Fig. 3.
Figure 3. Left: Frequency spectra of HTF-µ+SR signals in Cd2Re2O7 at H = 1 T[4].The splittings do not change appreciably with H (not shown). Right: HTF-µ+SR frequencyspectra at H = 1 T in the magnetic semiconductor FeGa3. Again the splittings do not changesignificantly with H.
Cd2Re2O7 is a weakly metallic pyrochlore with geometrically frustrated magnetism, a heavyelectron effective mass and a superconducting transition at ∼ 1 K. In the region below ∼ 60 K,where its resistivity follows a T 2 dependence (characteristic of a Fermi liquid regime), the HTF-µ+SR frequency spectrum at H = 5 T shows the splittings characteristic of a SP with a largehyperfine coupling[4].
FeGa3 is a narrow-gap diamagnetic semiconductor for which the gap formation is attributedto strong electron correlations within a narrow 3d band. Below about 10 K an extremely narrowSP band is thought to form; in the same range, characteristic SP splittings are observed in theHTF-µ+SR frequency spectra, with splittings independent of field up to 5 T[3].
Both materials have plentiful nuclear spins which might couple to the SP electron, possiblyproducing a rich µALCR spectrum.
The HTF-µ+SR “signature” of SPµ, like that of Mu or a muonated radical, is a pair offrequencies split about the free muon Larmor frequency (νµ[MHz] = 135.54Bµ[T], where Bµ
13th International Conference on Muon Spin Rotation, Relaxation and Resonance IOP PublishingJournal of Physics: Conference Series 551 (2014) 012022 doi:10.1088/1742-6596/551/1/012022
3

is the local magnetic field at the muon site) by +∆ν+ and −∆ν− with ∆ν+ − ∆ν− = A, theeffective frequency of the µ-e HF interaction. This similarity, plus the fact that SPµ spectra werefirst discovered in MS, may tempt one to attribute such spectra to normal Mu atoms; but thiscannot be the case, first because (as in Cd2Re2O7, shown in Fig. 3[left]) SPµ is seen in metallichosts where the Coulomb attraction of the µ+ is screened by conduction electrons, and secondbecause the fields of large nearby moments in the paramagnetic phase would instantly relax theMu electron if it were not tightly locked to the spins in the FM “droplet”. Very similar spectraare seen in the MS FeGa3 (Fig. 2) at low temperature. It is remarkable that the signatureof SPµ should be observed in such different magnetic systems; usually one does not expect ahitherto undiscovered phenomenon to be quite so ubiquitous. In each instance one can often findalternative explanations for the observed pairs of lines — two sites with different Knight shifts,or one site in an antiferromagnetic environment, or other more exotic interpretations invokingmodification by the µ+ of the local magnetic properties of the host. However, such alternative-hunting fails to explain the remarkable consistency of the HTF-µ+SR spectra observed in suchdiverse magnetic metals, semiconductors and insulators.
3. SP-µALCR ExperimentsWe therefore measured µALCR spectra over a very large field range in the correlated metallicpyrochlore Cd2Re2O7 at 30 K and in the semiconductor FeGa3 at 10 K. The results are shownin Figs. 4 and 5.
Figure 4. µALCR spectrum from 0 to 7 T in metallic Cd2Re2O7 at 30 K, taken on the M15muon channel at TRIUMF with the HiTime µSR spectrometer. Upper right inset: residualsfrom a polynomial fit (red line) to the systematic decrease at high field due to curling up ofelectron orbits. Lower left inset: detail of a broad resonance at ∼ 0.75 T (νµ ≈ 100 MHz≈ ASP /2) and a hint of a smaller resonance at ∼ 1.3 T.
In each case the measurements were made (as usual) by scaling the Forward (F) and backward(B) raw positron count rates and calculating the asymmetry as (B−F )/(B+F ). As is often thecase, this “raw” asymmetry is susceptible to huge systematic longitudinal field (LF) dependencesas positron orbits “curl up” in high fields. Another common problem is stochastic variations dueto instabilities in beamline power supplies or the proton beam drifting on the production target;
13th International Conference on Muon Spin Rotation, Relaxation and Resonance IOP PublishingJournal of Physics: Conference Series 551 (2014) 012022 doi:10.1088/1742-6596/551/1/012022
4

that effect requires use of differential method where the applied LF is rapidly “toggled” betweenH − δH and H + δH. This latter method was not required for these experiments on M15 andthe newly-rebuilt M20, whose power supplies are very stable. Therefore the huge systematicchanges in the “baseline” asymmetry are evident in Figs. 4 and 5.
Figure 5. µALCR spectra from 0 to 3 T at 5 K in FeGa3 (upper curve, red circles) and Ag(lower curve, black squares), taken on the new M20 muon channel at TRIUMF with the HeliosµSR spectrometer. If there is any resonant “dip” in the FeGa3 polarization curve, it is eitherextremely broad or extremely narrow. The decrease in the FeGa3 curve at very low field (seeinset, lower right) is presumably just decoupling from local dipolar fields.
The large, broad resonance in Cd2Re2O7 at ∼ 0.75 T (corresponding to a frequencyνµ ≈ 100 MHz) is consistent with a zero-crossing resonance (ZCR) for muons at a site with alocal field of that magnitude antiparallel to the applied field, as in MnF2 [10]. This would implythat the SP hyperfine splitting ASP in Cd2Re2O7 at low T is not the large (∆νbig ≈ 200 MHz)splitting shown in Fig. 3 but the smaller (ASP = ∆νsmall ∼ 30 MHz) splitting between blueand red peaks in each of the groups on either side of νµ, while ∆νbig comes from local magneticordering at the muon site. If there is actually a smaller resonance at ∼ 1.3 T, it might be a trueµALCR, presumably with X = a Re nuclear moment.
Presumably the H dependence of the asymmetry in Ag is due entirely to systematics andrepresents a calibration for full asymmetry, except for a possible offset due to slight geometricaldifferences. The Ag curve also serves to isolate the rather dramatic effects due to refocussing ofthe muon beam, “curl-up” of positron orbits and other “systematics”. It is therefore unsurprisingthat the FeGa3 asymmetry has the same shape at high LF (above about 1.6 T) except for ageometrical offset. At lower fields, however, considerable asymmetry is lost in FeGa3 (relativeto Ag), in a monotonic drop of about 0.066, nearly half of a typical full asymmetry in suchLF measurements. This is consistent with Mu decoupling in a semiconductor with nearly100% Mu formation and a nearly vacuum-like Mu HF coupling. The additional drop-off asH → 0 is presumably due to decoupling from local nuclear dipolar fields. The HTF-µ+SRsplittings observed for FeGa3 in Fig. 3 are certainly not consistent with a HF coupling of closeto A0 = 4463 MHz for a majority of muons forming vacuum-like Mu atoms.
13th International Conference on Muon Spin Rotation, Relaxation and Resonance IOP PublishingJournal of Physics: Conference Series 551 (2014) 012022 doi:10.1088/1742-6596/551/1/012022
5

4. ConclusionsOur search for rich µALCR structure in these SP candidate materials has been generallyunsuccessful. The NHF couplings between the SP electron and neighboring nuclei may beeither too weak or too anisotropic to engender resonances. There might be extremely narrowresonances that would require scanning the appropriate field range with much smaller step sizes.(We used steps of 4, 10, 50 and 100 G in low, medium and high field regions.) Such a surveywould benefit enormously from a good guess of where such resonances might be expected toappear. Such guesses might benefit in turn from DFT analysis.
References[1] Storchak V G et al. 2009 Phys Rev. B 80 235203[2] Storchak V G et al. 2009 Phys. Rev. B 79 193205[3] Storchak V G et al. 2012 J. Phys. Condens. Matt. 24 185601[4] Storchak V G et al. 2010 Phys. Rev. Lett. 105 76402[5] de Gennes P G 1960 Phys. Rev. B 118 141[6] Kiefl R F et al. 1987 Phys. Rev. Lett. 58 1780[7] Kiefl R F et al. 1986 Phys. Rev. A 34 681[8] Kreitzman S R et al. 1986 Phys. Rev. Lett. 56 181[9] Nagaev E L 2002 Colossal Magnetoresistance and Phase Separation in Magnetic Semiconductors (London:
Imperial College Press)[10] Kiefl R F et al. 1987 Phys. Rev. B 35 2079
13th International Conference on Muon Spin Rotation, Relaxation and Resonance IOP PublishingJournal of Physics: Conference Series 551 (2014) 012022 doi:10.1088/1742-6596/551/1/012022
6


![e ;mu•] ret) - Valle de Elda](https://img.pdfslide.net/doc/110x75/6337bd26fe1f34a1c300ac50/e-mu-ret-valle-de-elda.jpg)


