Embed Size (px)
Citation preview

www.sciencemag.org/cgi/content/full/science.aaa0114/DC1
Supplementary Materials for
Genomic structure in Europeans dating back at least 36,200 years
Andaine Seguin-Orlando, Thorfinn S. Korneliussen, Martin Sikora, Anna-Sapfo Malaspinas, Andrea Manica, Ida Moltke, Anders Albrechtsen, Amy Ko,
Ashot Margaryan, Vyacheslav Moiseyev, Ted Goebel, Michael Westaway, David Lambert, Valeri Khartanovich, Jeffrey D. Wall, Philip R. Nigst, Robert A. Foley,
Marta Mirazon Lahr,* Rasmus Nielsen,* Ludovic Orlando, Eske Willerslev*
*Corresponding author. E-mail: [email protected] (E.W.); [email protected] (R.N.); [email protected] (M.M.L.)
Published 6 November 2014 on Science Express DOI: 10.1126/science.aaa0114
This PDF file includes:
Materials and Methods Supplementary Text Figs. S1 to S26 Tables S1 to S18 References
2
S1: Archaeological context and description of Kostenki 14 The Kostenki-Borshchevo localities
The village of Kostenki and its neighbouring archaeological sites (Kostenki and Borshchevo) are located on the west bank of the Middle Don River, Russia (51°24’ N, 39°02’ E), c. 40 km south of the city of Voronezh (Fig. 1A). The first archaeological site at Kostenki-Borshchevo (K1) was discovered in 1879, and the area has been the focus of archaeological research ever since. To date, twenty-one Upper Paleolithic open-air sites have been studied at Kostenki, and another five are known from Borshchevo (46). The sites are found stratified in fill of two main river terraces at 10-15 m and 15-20 m along the main river channel, as well as in the smaller ravines and gullies that drain the surrounding uplands (47, 48) (Fig. S1). The local Kostenki-Borshchevo stratigraphic sequence can be broadly described (following(48–53) as consisting of six main units (in stratigraphic sequence from bottom to top):
1. Chalky loam deposits (52), sometimes also described as upper alluvium
interstratified with coarse slope deposits (54); 2. Lower Humic Complex/Bed (LHB): stratified loamy deposits with several
humic ‘horizons’; 3. Whitish Loam (WL): homogenous whitish loam with some sub-horizontal
lamination; it can include in its lower part, lenses of in situ or re-worked volcanic ash (Campanian Ignimbrite (CI) Y5 tephra); it forms a marker horizon that separates the Upper and Lower Humic Beds at all sites on the second terrace in the Kostenki-Borshchevo region (50);
4. Upper Humic Complex/Bed (UHB): consists of several humic ‘horizons’ separated by yellowish chalky loam;
5. Cover Loam (CL): a loess-like loam, including several humified horizons in some sites;
6. Modern chernozem: black, highly humic soil, with abundant bioturbation/burrows.
The Y5 CI tephra horizon (known as the “Paleolithic Pompeii”) is found underlying the UHB in the WL at several of the sixteen sites preserved on the second terrace (K1, 2, 6, 7, 8, 9, 10, 11, 12, 13, 14, 15, 16, 17, 18 and B5 (50, 55). This ash layer derives from the CI eruption at Campi Flegrei in Italy, independently dated to c. 39,300 calendar years ago (cal BP) (56–58), and represents a chronostratigraphic marker across parts of southern and eastern Europe as well as southwestern Asia. At Kostenki-Borshchevo, the sediments above the alluvium contain a long sequence of archeological layers of early to late Upper Paleolithic age, dating to > 42,000 to c. 14,000 cal BP (55, 59), stratified above and below the CI Y5 tephra. Most of the archeological layers represent primary buried horizons, and they include features, artifacts and fauna (49, 50, 60). The sites on the second terrace preserve early and mid-Upper Paleolithic assemblages above and below the CI Y5 tephra, in the Lower and Upper Humic Beds, including assemblages attributed to a local ‘Initial Upper Paleolithic’ tradition, the Aurignacian, the Gravettian,

3
and the local Gorodsovian (61). The Cover Loam (including the Gmelin Soil) is archaeologically extremely rich, including Eastern Gravettian artifacts and the famous large structure of Kostenki 1-Layer 1, dated to c. 29,000 cal BP (59), and the Epi-Gravettian features made of mammoth bones at Kostenki 11-Layer 1a, dating to between 19,000 and 14,000 cal BP (62, 63). Eight sites (K3, 4, 19, 21 and B1-4) are found in the soil and younger loess deposits of the first terrace (48) and preserve evidence of middle and late Upper Paleolithic occupations (64).
The Kostenki-Borshchevo sites were used recurrently for over 30,000 years, partly because of the presence of natural springs that attracted animals and people to the area. With their many features, they offer unique insights on the use of the landscape and the exploitation of the large mammals of the steppe-tundra from the earliest phases of the Upper Paleolithic onwards. In particular, the sites of K1, K12, K14 and K15 preserve concentrations of animal bones (horse in K14 and K15, reindeer in K12, mammoth in K1) that clearly indicate kill-butchery events (65). Together with the extensive, well-stratified chronological sequence covering all phases of the Upper Paleolithic, as well as the transition through the Last Glacial Maximum, the Kostenki-Borshchevo locality represents one of the key sources of information about the Upper Paleolithic of Eurasia and the Pleistocene modern human occupation of Eastern Europe.
The Kostenki-Borshchevo sites were used recurrently for over 30,000 years, partly
because of the presence of natural springs that attracted animals and people to the area. With their many features, they offer unique insights on the use of the landscape and the exploitation of the large mammals of the steppe-tundra from the earliest phases of the Upper Paleolithic onwards. In particular, the sites of K1, K12, K14 and K15 preserve concentrations of animal bones (horse in K14 and K15, reindeer in K12, mammoth in K1) that clearly indicate kill-butchery events (65) Together with the extensive, well-stratified chronological sequence covering all phases of the Upper Paleolithic, as well as the transition through the Last Glacial Maximum, the Kostenki-Borshchevo locality represents one of the key sources of information about the Upper Paleolithic of Eurasia and the Pleistocene modern human occupation of Eastern Europe.
The site of Kostenki 14
The site of Kostenki 14 (K14), also called Markina Gora, is located on a promontory on the south flank of the Pokrosvskii Ravine (51, 63), where the sites K1, K12 and K16 are also found. K14 was discovered by P.P. Efimenko in 1928, who worked on the upper archaeological layers of the site; in 1953, Rogachev’s excavations revealed the early Upper Paleolithic layers (51, 63). The site, which is extensive and covers hundreds of meters of sediments along the ravine, has been excavated since the 1950s through a set of trenches (Fig. S2). These can be separated into a western area (where most of the old excavations have taken place) and an eastern area of the post-1998 trench from the work of Sinitsyn and colleagues (51). Four cultural layers have been identified (Fig. S3), although because of the sloping deposition of sediments, these are not all equally visible at different parts of the site. Cultural Layer I (CL I), in the Cover Loam, dates to 27,600 – 26,500 cal BP (66), although this might be a minimum age (52); CL II and CL III are found in the Upper Humic Bed, above the CI Y5 tephra and are dated to 33,600-31,500

4
cal BP and 35,300-33,200 cal BP, respectively(52, 67); CL IV is in the Lower Humic Bed (LHB) below the CI Y5 ash deposit and dates to 32,800-31,800 cal BP (46). On the eastern slope within the LHB two horizons, named CL IVa and CL IVb, have been documented(51, 52, 67).
The oldest archaeological layer in the eastern part of the site, CL IVb, overlies the so-called ‘Horizon of Hearths’ (burnt reddish loam) and is buried on the sloping margins of a paleo-gully (67). CL IVb has been dated by 14C to 42,200 - 39,900 cal BP (52), although this might represent a minimum age for the assemblage. The underlying ‘Horizon of Hearths’ has been dated by 14C to 42,400 - 41,000 cal BP (52) and by OSL to 47,800 - 40,400 cal BP (48) A large number of lithic artifacts of typical Upper Paleolithic character (68) were recovered from CL IVb – based on the production of blades obtained unipolarly, including end scrapers, burins, splintered pieces, bifacial-oval tools, and a substantial bone and antler tool-kit (67, 69). The assemblage includes the head of a female figurine made on a mammoth tusk, and a pendant made on a shell of a Columbellidae gastropod, presently restricted to the Mediterranean, and suggesting long-distance contacts to the south. A human tooth, identified as modern (68) was also found in CL IVb.
Only a few lithic artifacts and faunal remains represent the Cultural Layer in the Fossil Soil (FS), dated by 14C to a minimum of 40,800 - 37,500 cal BP. The Cultural Layer IVa (“Horse Horizon”), also below the CI Y5 tephra and dated by 14C to 39,100 - 36,000 cal BP (52), preserves the remains of over fifty horses. These were found mostly broken, although some retained the original anatomical position, and given the extensive evidence of cut-marks, are suggestive of a preserved kill-butchery event (49, 65).
In the western part of the site, CL IV is a single layer located in the LHB, where early Upper Paleolithic artifacts (unipolar blades, end scrapers, burins, and retouched flakes and blades) and bone tools (an awl made from a horse phalange and fragments of rods with various cross-sections) were found (51).
Associated with the volcanic ash deposits, an Aurignacian layer (Cultural Layer in the Volcanic Ash – LVA) was documented in the eastern area of the K14 site. The finds include personal ornaments, abundant bladelets and tools like end scrapers (68).
CL III is a small assemblage including organic and lithic industries. The bone industry includes fragments of a rod with sub-rectangular cross-section and beads made on the long bones of birds. The lithic assemblage of CL III includes blades and broad end scrapers (51) and is undiagnostic in terms of specific affinities to known traditions.
The overlying CL II is a very rich assemblage with abundant organic tools as well as a huge lithic collection. The lithic technology is a flake-dominated one, and typical ‘Upper Paleolithic’ blades are missing. Various ‘Middle Paleolithic’ tool types (side scrapers, points, and knives) are present in the assemblage, which is currently assigned to the local ‘Gorodsovian’. CL II is well-known for its bone tools, decorated bones and personal ornaments. Among them are ‘shovels’ made from mammoth long bones (51). The uppermost layer, CL I, consists of a large assemblage of mammoth bones and lithics attributed to the ‘Kostenki-Avdeevo’ culture (51).
The archeological remains include animal bones, features (such as hearths), ornaments, mobiliary art, as well as bone and stone artifacts, briefly described below. They also include one of the earliest modern human skeletons known from outside of Africa.

5
The Upper Paleolithic assemblages of Kostenki 14
The Kostenki sites preserve some of the most extensive Paleolithic records in Eastern Europe, but also show a considerable technological diversity. The different localities represent overlapping parts of a sequence extending from the very beginning of the Upper Paleolithic to its end in the region (>40,000 to 14,000 cal BP), but also indicate considerable pene-contemporary variation.
As mentioned in section S2 (‘The archaeological context of Upper Paleolithic
ancient genomes’), the early phases of the western Eurasian Upper Paleolithic (UP) are spatial and technologically complex. Three main groups of industries have been identified within the first Upper Paleolithic assemblages: the Initial Upper Paleolithic (IUP), the Aurignacian Complex (AC), and a number of industries known as ‘transitional industries’ or of very local character and/or undiagnostic features (e.g.,(70, 71) and references therein). The latter ones are partly of unclear Neandertal or modern human association ((72) and references therein). Following Sinitsyn (46, 61), a local ‘Initial Upper Palaeolithic’ (IUP), an ‘Early Upper Palaeolithic’ (EUP) and a ‘Mid-Upper Palaeolithic’ (MUP) have been identified in the Kostenki-Borshchevo region. The ‘IUP’ is currently thought to fall into the chronological window > 40,000 cal BP and is found below the CI Y5 tephra deposits in the Lower Humic Bed (LHB). Archaeological assemblages belonging to this ‘IUP’ cluster are classified into two groups - those described as Spitsynean, and the assemblage of K14-CL IVb. In the case of these two industries, which have only been described in the Kostenki-Borshchevo region and nowhere else, the label ‘IUP’ is largely a chronological attribution. It should be noted here that these Kostenki ‘IUP’ assemblages are quite different from the IUP techno-complex defined by (73) in terms of lithic technology, although further studies are needed to more precisely define these differences. The Kostenki IUP is a local description, whereas the formally defined IUP used more broadly is posited as representing a dispersal by modern humans into Europe (71, 74–78),
The EUP according to (61) is found within the chronological window between
40,000 and 34,000 cal BP and occurs below as well as above the CI Y5 tephra. Archeological assemblages within the EUP are attributed to the Aurignacian and the Streletskaian traditions. While the Aurignacian is well known in most of western Eurasia, the Streletskaian is a local industry, known from several sites in the Kostenki-Borshchevo locality and other regional localities. Within the schema of temporal phases of (61), the MUP dates to two separate time windows – first, between 34,000 and 30,000 cal BP, with assemblages attributed to the Gravettian and the Gorodsovian, and second, between 30,000 and 23,700 cal BP, with a range of localized traditions, including the evolved Gravettian.
In general, the Kostenki-Borshchevo region shows substantial variability in lithic
industries within each phase. The co-existence of several UP techno-complexes is unique to Kostenki; some of these techno-complexes are not known outside the Kostenki-Borshchevo region (e.g., the Gorodsovian), while others are recorded all over western Eurasia (e.g., the Aurignacian). In terms of human behavior, the variability in material

6
culture production is poorly understood, as the meaning of these taxonomic units is unclear. It has been suggested by some (e.g., (50, 70) that the Gorodsovian could represent a functional facies of the contemporary Gravettian.
The spatio-temporal diversity of the Kostenki-Borshchevo Upper Paleolithic
sequence illustrates the complex demography and mobility of early modern human populations in Eurasia, as well as preserving unique evidence of the recurrent use of particularly rich localities in the landscape of the northern plains, which may have acted as regional foci of population ranges at the time.
The Markina Gora skeleton
The skeleton from Kostenki 14 was discovered in 1954 by A.N. Rogachev in a trench on the western portion of the site. The skeleton, of a relatively short man (1.60 m) aged 20-25 years old (79), has a robust skull, with strongly developed supraorbital tori, a deep infraglabellar notch, and short face (Fig. S4). The skeleton was found in a deeply flexed position on its left side with the face to the north and the hands by the face (Fig. S5). The burial pit was characterized by steep walls and an oval shape, about 99 x 39 cm (50). Its long axis was East-West oriented. The skeleton was found at its base and associated with dark red pigment (especially around the skull). The only finds with the skeleton are a few lithic flakes and animal bones. Their presence could be causally linked to the burial event or be the result of rodent activity. Based on this and the non-diagnostic nature of the flakes, no direct association with a particular Paleolithic archeological tradition at the site is possible.
The burial pit’s mouth underlies and is sealed by Cultural Layer III; the pit cuts
through the CI Y5 ash layer and its bottom cuts into the top of the Lower Humic Bed. Therefore, the human remains can be stratigraphically placed as younger than Cultural Layer IVa, younger than the CI Y5 volcanic ash horizon, and older than Cultural Layer III. The skeleton has been directly dated to 33,250 ± 500 radiocarbon years before present (14C BP) (25)which is 38,684 - 36,262 cal BP (Fig. S6), and is thus consistent with its stratigraphic position originating above the CI Y5 tephra dated to c. 39,300 cal BP (56). The close proximity in age of the skeleton and the tephra containing artifacts attributed to the Aurignacian in the eastern part of the site (68) has led to the association between the two. However, CL III, above the skeleton, contains a more blade-based industry generally assigned to the MUP, with possible affinities with the overlying Gorodsovian (CL II). Given the diversity and stratigraphic complexity of the lithic material preserved in the early horizons at Kostenki 14, a general ‘Early Upper Paleolithic/EUP’ archeological context for the Markina Gora skeleton is used here.

7
S2: The archaeological context of Upper Paleolithic ancient genomes
The context in which hominin ancient genomes should be assessed is that of human paleontology and Paleolithic archeology. The former is relatively scarce, making archeology the best indicator of past population parameters. However, as one of the main aims of current ancient genomics is to identify biological and geographical lineages, linkages to archeology are constrained by the fact that these data are not necessarily direct or simple indicators of prehistoric population distributions, contact, cultural affinities and isolation.
The relevant Eurasian Paleolithic entities – i.e. those likely to inform about
Neandertals, Denisovans, other archaic populations and modern humans in Eurasia in the last 100,000 years are the Middle and Upper Paleolithic. Late Eurasian Middle Paleolithic (MP) sites are associated with Neandertals. Defined by an overall particular suite of behaviors, the MP ranges in age from over 200,000 to c. 40,000 cal BP (80–82), although the localised late survival of Neandertal groups until 30,000 cal BP has been reported (e.g., (83)). The Upper Paleolithic (UP) is known from c. 50,000 cal BP in southwest Asia and from c. 48,000 cal BP in Europe(71, 75, 76, 78, 84–87), although in some parts of Europe and Asia it does not become predominant until after 40,000 cal BP. The Upper Paleolithic is considered to record the modern human colonization of southwest Asia, Europe and northern Asia (although direct skeletal associations are few(72) and references therein). The transition between the two can be sharp (particularly in western Europe), but less straightforward in other places, and the presence/absence of Upper Paleolithic technologies is not necessarily a marker of modern or archaic hominins (42). It is, however, the units within each of these that provide the detailed context to which K14 and other ancient genomes discussed here genomes relate.
For tracking the dispersals of modern humans in Eurasia, the characteristics of the
Upper Paleolithic are the main source of information. Terminology for the chronologically overlapping but technologically distinct parts of the first lithic assemblages identified as UP is not universal. For the purposes of the brief summary here we divide the Upper Paleolithic into three informal units that are essentially chronological – early, middle and late.
The Early Upper Paleolithic (EUP) covers the period from c. 50,000 cal BP to
around 30,000 cal BP and encompasses a set of industries that are technologically variable. We describe here the archeological entities involved, largely defined on the basis of lithic technology, and which are relevant to the associations of the K14 skeleton. In addition to these are what have been referred to as ‘Transitional Industries’ (e.g., Châtelperronian, Szeletian, Uluzzian) (72). The position of these industries in relation to the Middle and Upper Paleolithic transition has been extensively debated, and their association with Neandertal remains in some cases (e.g. Châtelperronian) and possibly modern humans in others (e.g. Uluzzian, Lincombian) complicate interpretations even more. As these are not found at Kostenki-Borshchevo, they will not be discussed further.

8
What is probably the earliest of the Western Eurasian EUP is referred to as the ‘Initial Upper Paleolithic’ (IUP), defined technologically as a combination of Levallois production with prismatic blade elements (73). Regional variants exist, for example the Emiran in southwest Asia (88), the Bohunician in Central Europe (84), and a Siberian version known from the Altai Mountains and Baikal region (from the sites of Kara-Bom, Makarovo-4 and Varvarina Gora, for example; (89, 90). The earliest dates for the ‘IUP’ may be older than 50,000 cal BP in southwest Asia (Boker Tatchit, (88)), 49,000-48,000 cal BP or 47,500 cal BP in Europe [depending on whether they pre-date (71) or coincide (78, 85) with the Greenland Interstadial 12 at Bohunice], and as early as 45,000 cal BP in Siberia (89, 91). Despite these very early occurrences, most of the dates center on the period 45,000 - 40,000 cal BP (92); there is no evidence for its persistence beyond 35,000 cal BP. The industry from Kostenki 14 CL IVb (underlying the skeleton and dated to 42,200 - 39,900 cal BP, (52)) has been referred to as IUP (61) but using a different and broader definition than that of Kuhn and colleagues (73).
The key elements of the Western Eurasian ‘IUP’ are its very extensive geographical
distribution (southwest Asia, southeastern and eastern Europe, and Central Asia), mixed technological status (i.e., persistence of Middle Paleolithic aspects in the technology), its early age and – at some sites - prolonged existence (>10,000 years). This prolonged existence might also be an artefact of dating inaccuracies. The ‘IUP’ has been proposed as the signal of the earliest modern human expansion into Europe and northern Asia (71, 74–78, 93). Nevertheless, the archeological record for the transition between the Middle and Upper Paleolithic is not clear-cut, revealing both geographical and spatial variation in the extent to which Upper Paleolithic elements become incorporated in lithic assemblages associated with late Neandertals (as seen for example in the Châtelperronian), or to which Middle Paleolithic aspects of the technology persist at early modern human sites (as seen for example in the ‘IUP’ sites).
A second element of the Western Eurasian EUP is what has been referred to as the
‘Aurignacian Complex’ sensu lato. However, the linkage between the Aurignacian sensu stricto and the other industries implied by the shared name is not accepted by all or fully demonstrated. The Ahmarian-Proto-Aurignacian variant (APA) is characterised by a greater dependence upon large bladelet technology than found in the ‘IUP’ (but lacking the specific markers of the Early Aurignacian), and includes industries like the Ahmarian from the Levant and Anatolia (94), the Kozarnikan from southeastern Europe (95), and the Archaic or Proto-Aurignacian from southern Europe (96). The APA ranges in date from c. 47,000 to 35,000 cal BP(72, 86, 94, 97, 98). These technological entities are strongly Mediterranean in Europe, with little evidence of an existence north of the Alps, but this partly depends on whether the term is broadened to include a greater range of industries. APA assemblages have also been identified as far east as the Zagros, with affinities to the Kozarnikan (99, 100).
The Aurignacian is the major, widespread EUP techno-complex of Western Eurasia.
It is homogenous and unified technologically and culturally, and has been proposed as an ethnically-based entity (101). It is characterized by split-based bone points, carinated end scrapers, and retouched bladelets, and has an associated complex of mobile art and

9
personal ornaments. The earliest Aurignacian is found at Willendorf II dated to 43,500 cal BP (87) the youngest c. 32,000 cal BP (102–106) The Aurignacian is a western Eurasian phenomenon, occurring in western, central and eastern Europe, as well as southwest Asia, and it is found in both the warmer and colder parts of the continent. Kostenki is probably one of the most easterly occurrences of the Aurignacian, and the K14 skeleton occurs in a pit cut through an ephemeral, ashy layer in which Aurignacian lithics were identified in the eastern part of the site (61).
In Northern and Eastern Asia the emergence of the Upper Paleolithic is not so well-known; however, what we do know suggests a connection with parts of the Western Eurasian EUP – the IUP and the APA techno-complexes from southwest Asia and Kostenki (93, 107); but see (92)). Earliest regional cases of the northern and eastern Asian EUP include Kara-Bom in the Altai (49,000 - 45,000 cal BP), Makarovo-4 in the Cis-Baikal (>43,000 cal BP), Varvarina Gora and Kamenka in the Trans-Baikal (>40,000 cal BP), Tolbor 4 in north-central Mongolia (possibly >44,000 cal BP), and Shuidonggou in north China (43,000 - 40,000 cal BP) (89, 91, 108–112). Lithic industries from these sites center on production of blades from parallel, “flat-faced” blade cores, a Levallois-like technology albeit on simply prepared cores with smooth platforms (90, 92, 113–115). Like the EUP in western Eurasia, the lithic tool-kit is composed of distinctive endscrapers, burins, pointed blades with invasive ventral retouch, and occasional bifaces, as well as side scrapers, notches and denticulates (113). Many of these sites also contain bone, antler and ivory tools, ornaments including ostrich-eggshell pendants, ochre concentrations, occasional zoomorphic statuettes, and possibly a musical flute (116–118). These features are obviously distinctive from the region’s earlier Middle Paleolithic, and together they indicate the presence of a well-established EUP tradition across the vast steppes of inner Asia 45,000 - 35,000 cal BP. Whether modern or archaic humans created this record cannot be discerned at present, because no diagnostic human remains have been reported from any inner Asian EUP site, and the two earliest cases of supposed modern humans from Siberia (the Baigara talus, >47,000 cal BP (119) and the Ust’-Ishim femur, 45,000 cal BP (120)) were in re-deposited contexts devoid of artifacts. Nonetheless, the Kostenki genomic analysis reported here implies the existence of a widespread western Eurasian modern human population that extended eastward to Lake Baikal during MIS 3, and the inner Asian EUP may represent the archeological manifestation of that population.
The key elements of the period from about 50,000 to 32,000 cal BP (EUP) are that
there is evidence for different Upper Paleolithic traditions, with quite distinctive distributions but overlapping in time. There is also evidence to suggest a considerable difference between Eastern and Western Eurasia, and a degree of convergence in technological innovations (e.g., (121)). Views differ considerably as to whether the patterns of similarities and differences among various industries that can be observed in the early phases of the Upper Paleolithic represent population dynamics, or local in situ and variable, convergent, adaptive change among modern human groups at the time. The homogeneity of the Aurignacian may be the one case indicative of cultural contact across a large area.

10
By 32,000 cal BP, there is a new form of technology, and a new widespread tradition, the Gravettian, part of the middle Upper Paleolithic (MUP). This is, like the Aurignacian, highly uniform, characterized by blades and bladelets, steeply backed, and often associated with a distinctive set of figurines. The Gravettian is widespread, from western Europe to Russia, with some indications of extending into Siberia (Mal’ta), and suggestions that it can be divided into an Eastern and Western form. The ancient genome extracted from the Ma’lta boy indicates ancestry to both Europeans and Native Americans, the latter not shared by later European Mesolithic groups.
The period of the Gravettian coincides with a major deterioration in climate that
leads to the Last Glacial Maximum (LGM, 25,000 – 15,000 cal BP, with a peak at 20,000 - 18,000 cal BP). Archaeologically, the LGM sensu lato is associated with depopulation of northern latitudes and demographic fragmentation (Lahr & Foley 2003), with sites becoming scarce, and local traditions developing (e.g. the West European Solutrean)(122).
In Siberia, MUP techno-complexes replace those of the EUP around 34,000 cal BP,
but there is much variation in lithic industries from then until the LGM. Considering only well-dated sites in the Yenisei and Baikal regions (e.g., (117, 123, 124)), bladelet technologies become much more common, with full-blown microblade inset technologies appearing just before or after the LGM. This period of climatic deterioration paradoxically is often referred to as the “Golden Age” of the Upper Paleolithic in the area, because many of Siberia’s MUP sites contain incredibly rich inventories of hearths and dwelling features, bone tools, items of personal adornment, and even small female statuettes, or “Venuses”, harkening again a connection across the mammoth-steppe to western Eurasia. The Mal’ta site represents the “type site” for this phase of the Upper Paleolithic, and for decades archeologists and biological anthropologists have hypothesized a link to the Gravettian World far to the west (125–127). Whether the Kostenki-Mal’ta connection is rooted in an eastward expansion of Gravettian-like cultures, or earlier EUP cultures (as argued above), cannot be determined without genomic data from a northern and northeastern Asian EUP individual.
From 15,000 cal BP, climatic conditions improve substantially, although not
consistently, as there is a short period of low temperatures between 12,800 - 11,500 cal BP known as the Younger Dryas. The post-LGM archeological record (the Late Upper Palaeolithic (LUP)) demonstrates the re-population of Europe (128, 129) presumably from southern refugia, such as those proposed in Spain, Italy, southeast Europe and western Asia. The western Eurasian postglacial archeological record is normally divided into the late Upper Paleolithic or Epi-Paleolithic, which sees a large number of local traditions develop (Ahrensburgian, Hamburgian, Epi-Gravettian, Magdalenian, etc.), and the Mesolithic (after 10,000 cal BP), the latter being early Holocene cultural entities (e.g., Azilian, Maglemosian, Tardenoisian). These have generally been considered to represent population expansions within Europe, in contrast to the subsequent expansion of farmers from southwest Asia (Neolithic). The ancient genomes from La Braña (Spain), Loschbour (Luxembourg), and Ajvide and Motala (Sweden) are those of Mesolithic hunter-gatherers.

11
The main aspects of the end of the Pleistocene and the Holocene are the impact of the LGM, and the re-growth and expansion of populations as the climate warmed after 15,000 cal BP, producing an entirely new configuration of populations prior to the arrival of farmers in Europe from the Middle East and their subsequent expansion eastwards. Post-glacial hunter-gatherer populations of Europe expand from glacial refugia, and their distribution, demography and density across Eurasia would have varied considerably, producing very different interactions and genetic outcomes in different areas (130). In comparative terms, it is likely that the level of depopulation was higher in Western Europe than in Asia, and continuity was greater in Asia, but it should be noted that the latter is vast by comparison, and less well researched.

12
S3: Samples and laboratory methodologies applied Samples
The K14 sample used in this study was obtained from the left tibia (dorsal side of the shaft). Note that the tibia was washed before sampling. As described in S1, the skeleton has been directly dated to 38,684 - 36,262 cal BP. According to the complete mitochondrial sequence of the tibia that has been characterized in previous ancient DNA analyses, the K14 individual belonged to mitochondrial haplogroup U2 (131). Two other samples, K1 and K15, were also analyzed but endogenous DNA contents and levels of contamination by modern humans were found incompatible with the characterization of the whole genome sequence by shotgun sequencing. DNA extraction
All pre-PCR steps were conducted at the Centre for GeoGenetics, University of
Copenhagen, Denmark, in state-of-the-art ancient DNA facilities dedicated to the analysis of ancient hominin remains, and separated from any building where fresh DNA or post-PCR DNA is processed. Each extraction session included a mock extraction blank where no bone powder is added to the extraction reagents.
We extracted 89 to 260 mg of bone powder per extraction session, using either a
microdismembrator or low speed drill (Table S1). We first followed the extraction procedure described in (132), which is based on DNA binding to silica pellets in solution. We also performed extraction following the procedure described by Dabney and colleagues (133), which is tailored to ultra-short DNA fragments and performs DNA purification on MinElute (Qiagen) silica-columns (133).
When using silica pellets, we performed a pre-digestion of the sample by incubating
in 5 ml digestion buffer (0.45 M EDTA, 0.25mg/ml proteinase K, 0.5% N-laurylSarcosyl) at 37°C for 30 min or 4h. After spinning 2 min at 2,000 rpm, the supernatant, representing the first fraction, was transferred into a new falcon tube. The remaining pellet was further digested for 24h at 37°C in 5 ml fresh digestion buffer. After spinning 2 min at 2,000 rpm we kept the supernatant, which represented the second fraction. Both first and second fractions were incubated with 50 µl freshly prepared silica pellets and 20 ml of binding buffer (5M Guanidinium thiocyanate, 50 mM Tris, 25 mM NaCl, 15 mM EDTA, 0,8 % TritonX-100, pH 4.0-5.0) for 3h at room temperature. The supernatant was discarded and pellets were washed twice with 1 ml of fresh 80% ethanol before eluting the DNA in 120-130 µl EB incubated 30 min at 37°C.
For the silica column-based approach (30), we pre-digested the sample in 1mL
extraction buffer (0.45M EDTA, 0.25mg/mL proteinase K) for 1h at 37°C. After centrifugation for 2 min at 16,000g, we discarded the supernatant and incubated the pellet for 36 h at 37°C in 1mL of fresh extraction buffer. After centrifugation for 2 min at

13
13,000 rpm, we transferred the supernatant mixed with 13 mL of binding buffer (5M guanidine hydrochloride, 40% isopropanol, 0.05% Tween 20, 90 mM sodium acetate) on a Zymo-Spin V reservoir (Zymo Reasearch) fitted on a MinElute column (Qiagen). The reservoir-MinElute device was centrifuged at 3,000 rpm for a total of up to 8 min. The MinElute column was then placed on a collection tube and centrifuged at 6,000 g for 1 min. The column was washed twice with 750 µl PE and dry-spin at 13,000 rpm. The DNA was eluted twice in 28 or 35 µl EB after 10 min incubation at 37°C.
All extracts were stored at -20°C in siliconized tubes. Each of the following steps
(methylated DNA enrichment, USER treatment, library building and library PCR enrichment) was accompanied by a negative control where the sample is replaced by EB buffer, until the library-building step. Interestingly, DNA libraries constructed on USER-treated extracts generated following in-solution DNA purification showed higher variance in endogenous DNA content (average = 0.820%, range = 0.117-8.029%) than those constructed on USER-treated extracts obtained following purification on silica-columns (average = 0.308%, range = 0.296-0.485%).
Methylated DNA enrichment
It has been recently shown that methylated cytosines can survive after death and be characterized either directly (134, 135) or indirectly by exploiting patterns of post-mortem DNA degradation (136, 137). Methylated cytosines can be used as targets for enriching DNA extracts in DNA fragments of vertebrate origin, and therefore preferentially get access DNA material of human origin. Microbial DNA indeed often dominates ancient DNA extracts, but generally do not show high-densities of 5methyl-cytosines (5mC) at CpG sites in contrast to human DNA. Therefore, we attempted to enrich a fraction of our DNA extracts for 5mCpG sites using the EpiMark Methylated DNA Enrichment kit (NEB, reference E2600) following the manufacturer’s instructions, except for the slight modifications described below. A total of 50 µl of DNA extract was incubated for 20 min at room temperature with 10 µl of pre-bound MBD2-Fc to Protein A Magnetic Beads, in a total volume of 100 µl 1X Bind/Wash Buffer. Beads were concentrated using a magnetic rack and the supernatant, containing the un-methylated DNA fraction, was discarded. Beads were washed twice with 950 µl of a 0.4M KCl solution and methylated DNA was eluted in 150 µl of 1M KCl, after 5 min incubation at room temperature on a rotor. Samples were purified on a MinElute column and eluted in 32.5 µl EB after 15 min incubation at 37°C, and further processed for USER treatment. USER treatment
We removed the most frequent post-mortem DNA damage from 11 out of the 13 DNA extracts (previously enriched or not for methylated DNA), namely cytosines that have been deaminated into uracils, following incubation with Uracil DNA glycosylase and DNA glycosylase-Lyase Endonuclease VIII, as proposed in (137). More specifically, a volume of 32.5 µl of the ancient DNA extract was incubated with 10 µl of USER enzyme mix (1U/ µl, NEB reference M5505) for 3h at 37°C. If not processed

14
immediately for sequencing library building, the repaired DNA solution was stored at +4°C for no more than 16h. Library building and sequencing
Illumina sequencing libraries were built following a protocol described in (138) and based on an end-repair step of 21.25 µl of the DNA solution, a ligation step with 12.5 pmol blunt-ended adapters (139) and an adapter fill-in step. We used the NEBNext DNA Library Prep Master Mix Set for 454 (NEB reference E6070) without the ssDNA isolation module. Libraries were enriched and indexed by performing 8 to 14 PCR cycles in 50 µl reactions using 5U of the AmpliTaq Gold DNA polymerase (Life Technologies) as described in (140). After purification on MinElute columns and elution in 20 µl EB following 15 min incubation at 37°C, library concentration and size were checked on a Bioanalyzer 2100 High-Sensitivity Assay (Agilent). Whenever concentrations were not directly compatible with Illumina sequencing, the purified PCR product was re-amplified in four parallel 50 µl reactions for 6 or 8 additional cycles, before being pooled, purified and checked on the Bioanalyzer again.
Final libraries were pooled with non-human indexed samples and sequenced 100SR
or Rapid 75PE at the Danish National High-Throughput DNA Sequencing Centre, University of Copenhagen, Denmark, on a HiSeq 2500 (Illumina).

15
S4: Read processing and mapping Illumina reads were processed and aligned to the human reference genome hg19
available from the UCSC genome browser (http://hgdownload.cse.ucsc.edu/goldenPath/hg19/chromosomes/) using the PALEOMIX pipeline (141) with default parameters, except for the minimal mapping quality threshold, which was set to 30, and seeding, which was disabled. PALEOMIX implements in an automatic manner all the analyses described in (132, 142), which enabled previous characterizations of ancient and modern genomes. Briefly, Illumina sequencing reads were trimmed for adapter sequences using AdapterRemoval (143). When overlapping for at least 11 nucleotides and with a maximal edit distance of 1, paired-end reads were collapsed and base quality-scores at overlapping positions were recalculated using the quality scores of both reads at each overlapping position (132). Collapsed reads were further treated as single-end reads. Trimmed reads and collapsed reads were aligned against hg19 using bwa version 0.5.9-r26-dev (144), filtered for duplicates and re-aligned around indels using GATK (145). Uncollapsed read pairs were filtered from the final BAM alignment file, as this fraction corresponds to relatively long templates and is therefore likely to be enriched in contaminating templates of modern origin. We repeated the full procedure to generate read alignments against the revised Cambridge reference mitochondrial sequence (rCRS, Accession Nb. = NC_012920). Summary statistics, including the total number of Single End (SE) and Paired-End (PE) reads generated, endogenous DNA content per library (the fraction of high-quality hits mapping uniquely against the reference genomes considered), and the contribution of each library to the final coverage estimate, were directly obtained from PALEOMIX (Table S2).
The existence of nucleotide mis-incorporation and DNA fragmentation patterns,
which represent the signature of post-mortem degradation reactions (33) was investigated using alignment BAM files and mapDamage2 (146) DNA libraries that were not USER-treated showed a progressive decline of CàT substitution rates from read starts, mirrored by a progressive increase of GàA substitution rates towards read ends (Fig. S7). Additionally, genomic positions preceding read start coordinates were found to be enriched in purines, particularly in Guanine residues. Genomic positions following read end coordinates were found to be enriched in pyrimidines, particularly in Cytosine residues. This is in agreement with previous reports, suggesting depurination as the main driver for post-mortem DNA degradation. Read alignments from USER-treated DNA libraries showed CàT and GàA mis-incorporations restricted mostly to read-starts and read-ends (Fig. S8), in line with previous observations suggesting low base excision performance for bases located at the very ends of ancient DNA molecules (139). The base composition of the genomic coordinate preceding read-starts was enriched in cytosine residues, as expected from the enzymatic fragmentation performed, which takes place 3’ of uracil residues. Overall, this indicates that USER treatment significantly reduced the level of nucleotide-misincorporations resulting from post-mortem DNA decay.

16
S5: Mitochondrial DNA analyses We used high-quality hits against the rCRS mitochondrial genome to reconstruct the
mitochondrial sequence of the K14 individual. Briefly, we generated a VCF file to identify sequence variants using samtools and bcftools (147), and called a final mitochondrial consensus sequence based on a majority rule and requiring a minimal depth-of-coverage of 3. The mitochondrial sequence was identical to the one previously reported by Krause and colleagues (33), thus providing independent replication of our results and supporting the authenticity of the data generated. We then mapped all sequence reads against the K14 mitochondrial sequence using PALEOMIX and the methods described above. This provided one of the two input files for contamMix (version 1.0-10). This software was kindly provided by Dr. Philip Johnson and implements the procedure described by Fu and colleagues (148) to estimate the level of DNA contamination based on mitochondrial read alignments, assuming that the data consists of a mixture of endogenous sequence reads and contaminants. The second input file used by contamMix consists of an alignment of 311 whole mitochondrial genomes described in (33) appended with the K14 sequence. Contamination levels were estimated using 4 MCMC chains of 50,000 iterations each. Contamination levels estimated on libraries showing less than 100 mitochondrial hits should be disregarded, as not enough information was available to achieve proper estimates. The contamination level of the 8 libraries that were choosen for downstream analysis are shown in (Table S3).

17
S6: Error and X-based contamination estimation The error rate was estimated by using a method similar to (149). This method is
based on the assumption that the number of derived alleles is the same for all individuals. By comparing the sample of interest and a ‘high quality’ sequenced individual to an outgroup (the chimpanzee), the number of derived alleles can be assessed. The excess of derived alleles in the sample of interest can then roughly be interpreted as relative error rates. For a high quality sample we used an individual from the 1000 genomes project (NA12778.mapped.ILLUMINA.bwa.CEU.low_coverage.20130415.bam). After removing reads with a mapping quality below 35 and base quality below 35, a single base was sampled for each position of the high quality genome. We estimated both the type specific error rates and the overall error rates (Fig. S9) for all USER libraries. For this analysis we discarded reads with a mapping quality below 30 and bases with a quality score below 20 (0.1% and 1% error rate respectively). The method is described in details in the supplementary of (132), and is implemented in the software ANGSD.
From Fig. S8 we observe that the USER treatment still has increased error rates for
the first base pairs in each end. We therefore applied our error estimation by discarding the first 1 to 5 base pairs from each end (Fig. S10). Which shows decreasingly lower error rates and we therefore used the five base pair trimmed version of the data in all subsequent analysis. We also estimated the type specific error rates for all ancient samples (Fig. S11) and the overall error rates (Fig. S12). The analysis was performed using the software ANGSD.
X chromosome-based DNA contamination estimation
We estimated contamination of the Kostenki sample using the method described in (150). This method works for chromosomes that exist in one copy for which we would expect to observe a single base for all sites. Hence for male human samples, like the Kostenki sample, it can be applied to the X chromosome. If multiple different base types are observed at a site, it is interpreted as either the result of sequencing errors or contamination. However, note that human contamination can only cause base discordance at polymorphic sites, whereas it can be assumed that sequencing errors lead to the same discordance rate in polymorphic sites as in their neighboring non-polymorphic sites. For this reason, presence of human contamination will cause an excess base discordance in polymorphic sites compared to their neighboring non-polymorphic sites. The estimation method we used for our analyses takes advantage of this logic: it estimates the extent of contamination based on a comparison of base discordance in a set of known polymorphic sites on the X chromosome to the base discordance rates in the 8 nearest sites to each of polymorphic sites; 4 sites to each side. For more details about the method see the supplementary of (150).

18
The set of known polymorphic sites used in our analyses was identified using 60 unrelated CEPH individuals from the HapMap phase II release 27 data (151). The set was pruned such that no polymorphic sites were less than 10 bases apart. Allele frequencies were also estimated in these individuals.
Before performing the analyses the following filtering was applied to the Kostenki
sample:
• The X chromosome was trimmed to remove the regions that are homologous with the Y chromosome (first and last 5Mb).
• The sites were then filtered based on mappability (100mer), so that no region will map to another region of the genome with an identity above 98%
• Reads with a mapping quality score of less than 30 and bases with a base quality score less than 20 were removed.
• Sites with a read depth of less than 2 or above 40 were removed
The analyses were performed using ANGSD and gave contamination estimates of 2.0% when using all reads (Method 1) and when sampling a single read for each site (Method 2), respectively (Table S4).
Contamination was also estimated for the samples Loschbour, Motala2, Motala 3,
Motala6, Motala9 and Motala12 (Table S5) using the same approach. It was not possible to do so for the samples LBK, Motala1 and Motala4, because they are females. Based on (1) the endogenous content (Table S2), (2) the error rates per library (Fig. S9), the contamination estimates from both the X-based and the mitochondrial analysis we choose eight libraries for downstream analyses.
S7: Y chromosome analysis We used three publically available datasets (152–154), to infer the chromosome Y
haplogroup for K14 (Fig. S13,Table S6). Each dataset consists of a table of SNPs that are phylogenetically informative for a particular haplogroup (hg). For each SNP in the datasets, we then determined whether K14 carries the derived allele by selecting the most frequently occurring base from all covering reads, discarding reads with a mapping quality score below 30 and a base quality score below 30.
For the data from (152) and (153), the informative SNPs are mutations on the branches of the phylogenetic tree relating the individuals sequenced in the respective studies. They therefore do not necessarily reflect diagnostic mutations for a particular haplogroup defined in ISOGG. Nevertheless, they allow us to determine the likely branching point of K14 simply by counting how often K14 matches the derived allele at each branch in the tree. Results for both of theses datasets clearly show that K14 carries the derived alleles for all SNPs on branches ancestral to hg C, but ancestral alleles for the branches leading to more derived haplogroups (Fig. S13). Furthermore, K14 carries the derived allele for four hg C mutations in ISOGG (P255, V183, V199, V232) (Table S6). The MHG

19
individual from La Braña (22) carries the same derived mutations, suggesting that both are members of a closely related lineage within hg C.

20
S8: Array genotype and whole genome reference data Array genotype data:
We included as reference dataset the HGDP data (155) and several other datasets (127, 156–162) that were publicly available from the Estonian Biocenter for download (http://evolbio.ut.ee). We restricted all analyses to populations that had at least 3 individuals. This joint dataset had 2061 individuals from 167 contemporary human populations, and, when combined, gave rise to 514,968 SNP sites. Whole genomes:
For the modern genomes, we used the VCF files (called genotypes) from two studies (34, 127).
For the ancient genomes we combined data from (127, 163–165), i.e., data for the
following individuals: MA1, Lorschbour, La Brana, Motala, Ajv58, Gok2, Iceman, Stuttgart.
When analyzing the whole genomes jointly, we discarded sites that were invariant in
the high depth genomes. Merged genotype and whole genome data:
For both array and whole genome datasets, we merged all ancient genomes with the genotype data by using SAMtools (147) and by sampling a random read for each ancient sample for each SNP position, discarding reads with a mapping quality score below 30 and a base quality score below 30, as well as alleles that did not match either of the observed alleles in the reference datasets.
These datasets were used for model-based clustering analyses (SOM section S10),
Principal Component Analyses (SOM S11), the calculation of D-statistics, f3- and f4 statistics (SOM section S9), TreeMix (SOM section S12), as well as for identifying genomic blocks of archaic hominin origin. (SOM section S13).

21
S9: Analysis of shared ancestry between K14 and modern populations with f3, f4 and D statistics “outgroup” f3 and D-statistics reveal that K14 is most closely related to Northern Europeans
We computed an ‘outgroup f3-statistic’ to obtain a statistic that is informative of the genetic relatedness between a particular sample and each modern population in a reference set. A positive deviation from zero is a function of the shared genetic history of two populations A and B in their unrooted history with the outgroup O. We used the estimator suggested by (36)
𝑓! 𝑂;𝐴,𝐵 =𝑘! − 𝑘! 𝑘! − 𝑘! − ℎ! 𝑛!
2ℎ!
where
ℎ! =𝑘!(𝑛! − 𝑘!)𝑛!(𝑛! − 1)
and kO is the count of allele 1 (arbitrarily chosen) in the outgroup, kA and kB are the
counts in populations A and B, and nO is the total number of alleles in the outgroup at a particular SNP, summed over all SNPs. Standard errors for the f3 estimates were computed with a jacknife approach using blocks of 5Mb as suggested in (36).
We computed this statistic with the K14 individual as population A, one of 167
contemporary populations as B and an African population, Mbuty Pygmy as O. Europeans (Fig. 1C;1D), and in particular Northern Europeans, show the greatest affinity to K14, with a lesser degree of affinity in Central Asians (Fig. S14). When K14 is directly compared to other ancient individuals, using f3(Mbutiy Pygmy; K14, Ancient), MHGs (Loschbour, La Braña) had the highest affinity to K14, suggesting shared ancestry of these ancient individuals with K14 (Fig S14). We also repeated the “outgroup” f3 analysis for each ancient individual. Overall, the patterns of shared ancestry for K14 are similar to those observed for MHGs (La Brana, Ajv58, Loschbour) and MA1 (Fig. S15), except for the latter’s additional strong genetic affinity with Native Americans, which is unique to that genome.
We further explored the relationship between K14 and contemporary populations by
computing D-statistics (36),
𝐷(𝐴,𝐵;𝑋,𝑌) =[ 𝑝! − 𝑝! 𝑝! − 𝑝! ]
𝑝! + 𝑝! − 2𝑝!𝑝! 𝑝! + 𝑝! − 2𝑝!𝑝!
where pA, pB, pX,and pY are the frequencies of allele 1 (arbitrarily chosen from the
two alleles present) in populations A, B, X, and Y, summed over all SNPs. Standard errors
22
for the D estimates were jacknifed over 5Mb blocks. Comparisons involving multiple ancient genomes were restricted to transversion polymorphisms.
We computed this statistic with Mbuti Pygmy as A, K14 as B, and all possible pairs
of contemporary populations as X and Y. This analysis confirmed K14 to be significantly closer to Europeans than populations from other geographic regions (e.g., Z = 12.1, (Han, Lithuanians);Table S7), in all datasets (Table S7-S9). Within Europe, Northern Europeans also appear significantly closer to K14 than southern Europeans (Z = 6.7, (Sardinians, Lithuanians)) (Tables S7; Fig. S16).
f-statistics results are robust to contamination from modern humans We used two complementary approaches to confirm that the key results described above are robust to contamination from modern DNA. First, we repeated the “outgroup” f3 analysis on a dataset filtered for reads of likely ancient origin using PMDTools (166). The model implemented in PMDTools relies on post-mortem DNA damage substitutions (C>T / G>A) to calculate a score for the likelihood of a read to originate from an ancient DNA molecule. Since the K14 libraries were treated with USER to reduce the level of nucleotide misincorporations, we used an untrimmed BAM file to maximize the amount of data available for this analysis. Filtering reads with PMD scores > 3, we obtain 49,050 SNPs for the merge with the reference dataset, corresponding to a ~10 fold reduction compared to the full dataset. Despite this significant reduction, we find that “outgroup” f3 scores for the filtered BAM are highly correlated with the full dataset for all test populations. The only exception is specific to the Iceman, which appears slightly off the slope formed by the other populations (Fig. S17). Second, we calculated contamination-corrected D-statistics of the form D(Mbuti Pygmy, K14; Sardinians, Lithuanians) following (127). Assuming that the contamination originated from an individual with Russian ancestry, we estimated Dcorrected as
𝐷!"##$!%$& =𝐷!!" − 𝑐𝐷!"##$%&
1− 𝑐
where c is the rate of contamination, DK14 is the statistic obtained with K14, and DRussian is the statistic obtained using a randomly sampled individual from the Russian population instead of K14. Fig. S18 shows the result for Dcorrected for contamination rates up to 0.5, demonstrating that even substantially higher rates than the one observed have only marginal effects on the value of the statistic. Intuitively, the reason for the negligible effect is that the value of DRussian (0.019) is not much greater than DK14 (0.011), which means that large values of c are necessary to cancel out the signal of DK14. Contemporary non-Africans are closer to MHGs and MA1 than K14.
We calculated D-statistics of the form D(Mbuti Pygmy, Modern; Ancient, K14), to test whether K14 and an ancient individual form a clade with respect to a modern population. We find that all contemporary non-Africans, except Australo-Melanesians, are closer to either Mal’ta (MA1) or MHGs than to K14, whereas they are equally distant to NEOL and K14 (Fig. S19; Tables S10-S11). A parsimonious explanation would be

23
gene flow from a previously suggested “basal Eurasian” lineage associated with Neolithic farmers into K14, consistent with results from the model-based clustering (SOM S10). f4 and “admixture f3 “ statistics show HG ancestry in Siberians from Yenisei basin
We used f4 statistics of the form f4(Sardinian,Ancient; Modern,Papuan) to measure whether a modern population shares more alleles with contemporary Europeans or an ancient genome. We find that all Siberian and East Asians are equally distant from western MHGs (Fig. 3D, Table S12), supporting the postulated early split between East Asians and western Eurasians. In contrast to MHGs and MA1, many Siberian populations are genetically closer to contemporary Europeans (Sardinians) than to K14 (3.1 < |Z| < 9.9), particularly those from the Yenisei and Ob’ basins (e.g. Shors, Z = 8.0) (Table S12). Furthermore, these populations derive parts of their ancestry from a European “hunter-gatherer” (HG) component inferred in the ADMIXTURE analysis (Fig. S20), with populations showing higher “HG” ancestry proportion also being closer to contemporary Europeans using the f4 statistic (Spearman ρ = 0.96, p = 3.0 x 10⁻¹⁸, Table S13).
To formally test for admixture in the modern Siberian populations, we calculated
“admixture” f3 statistics of the form f3(Test; A, B) as described above (replacing the outgroup with the test population). A significantly negative value of this statistic is evidence for admixture in the test population related to two source populations A and B. We calculated the statistic for all pairs of source populations A and B, which also allows to infer which pair of populations are the best proxies for the mixing populations, i.e. which pair shows the lowest value of f3 (163).
For populations from the Yenisei and Ob basins, we find significant evidence for
admixture with a variety of Siberian and European source populations (Table S14). The best pair of source populations (i.e., the most negative f3 statistic) involves Swedish MHGs (Motala,Ajv58) and Evens (a northeast Siberian population) (e.g. f3(Shors; Evens, Motala) = -0.012, Z = -9.1). Altogether, these results suggest that contemporary Siberian populations from the Yenisei basin derive part of their gene pool from a Eurasian HG population that shares ancestry with K14, but is more closely related to Scandinavian MHGs than to either MA1 or western European MHGs, indicating gene flow between their ancestors and Scandinavian Europe after K14 but prior to the Mesolithic (36.3 > x > 7 ka BP). f4 – ratio statistics for Neandertal ancestry
f4 – ratio statistics were used as previously described by (34) to obtain estimates of Neandertal ancestry for all individuals (Table S15-S16), using Mbuti Pygmies as an African population without Neanderthal admixture. We estimate < 2% of Neandertal ancestry for most individuals, as previously reported (167). However, we found slightly elevated levels both in La Braña and K14, with an estimated 2.4 ± 0.4% in K14 (see also Fig. 4A). We then restricted this analysis to genomic regions without evidence for Neandertal introgressed haplotypes in modern humans, following the coordinates of

24
archaic tracts identified in (168) – labeled akey in Table S17-S18 - and (167) – labeled reich in the Table S17-S18 - and found 0% estimated ancestry for most individuals. For K14 we still detected 0.9 ± 0.4% Neandertal ancestry. Our interpretation is that this is the result if the presence of longer introgressed haplotypes in K14, due to its closer temporal proximity to the admixture event (see SOM S13).

25
S10: Model based clustering of K14 and other ancient individuals Methods
We used a maximum likelihood based approach (ADMIXTURE, (169) to reveal the relationships of K14 and other ancient genomes to modern human genetic diversity in Eurasia and the Americas (see section SOM8 for a description of data processing and data sources). We ran ADMIXTURE assuming 2 to 15 source populations (K=2 to K=15) with 10 replicates each using only the data from contemporary populations. The best of each set of 10 runs, based on the Log-likelihood estimates, is plotted in Fig. S20. Ancient individuals, including K14, were not included in the runs; the cluster membership proportions for these individuals were inferred afterwards using their genotypes and the ancestral allele frequencies for each cluster (see (170) for details).
K14 has four major components, two predominant in contemporary Europeans and two in contemporary Asians
At K = 9, K14 comprises four major components (Fig. 1B). The largest component
belongs to the same ancestral cluster that is predominant in contemporary Eastern Europeans as well as all European MHGs. However, K14 also includes a sizeable component that characterizes contemporary Middle Eastern populations and Neolithic ancient genomes (Gok2, Iceman, Stuttgart), as well as two Asian components, one predominant in contemporary Central Asians and one in Southern Asians, analogous to the ones seen in MA1 (Fig. S20).

26
S11: Principal Component Analysis Methods
Principal Component Analysis (PCA) was used to place K14 in the range of present-day and past human diversity. For each ancient genome, we randomly selected one read at positions that overlapped with SNPs present in the modern reference panel. We then randomly sampled a single haploid genotype from each modern individual to prepare a final matrix including only haploid genotype data across all individuals. For each ancient genome, Principal Component Analysis (PCA) was performed on the matrix of haploid genotypes for all SNPs with data in the ancient individual, using the R function svd. These individual PCAs were then combined using procrustes transformation, as implemented in the R package vegan (http://cran.r-project.org/web/packages/vegan/index.html). PCA plots were generated using R 3.0.2 (R Development Core Team 2011) and projections on the first 2 components are provided in Fig. S21-S23. Results
We found that MHGs and Neolithic farmers cluster with Northern and Southern Europeans respectively, while the UP MA1 fell outside contemporary variation towards Native Americans, as previously described (127). K14 was also found to fall outside the range of contemporary European variation, but was distinct from MA1, clustering most closely with Central Asian populations. (Fig. S21-S23)

27
S12: Treemix Methods
Admixture graphs for the whole genome datasets were inferred using TreeMix (171). We ran TreeMix considering up to 10 migration edges, choosing the best out of 5 replicates for each edge, and without sample size correction (-noss option). The block size for the estimation of the covariance matrix was 1000 SNPs. We forced two migration edges following the results from (127, 149), describing gene flow from MA1 into Native Americans and from Denisovans into Papuans (options -cor_mig and -climb). TreeMix output was plotted with the TreeMix R functions and the total fraction of the variance explained by each model was estimated using the get_f() R function. This ranged from 99.64% (m=2) to 99.85% (m=10). Results
The tree topology resulting from TreeMix, including all ancient humans previously characterized at the genome level, places K14 basal to a pan-Eurasian group in the Prufer et al dataset, but as a sister group to MA1 in the (127) (Fig. S24-S25). For 4 migration edges and above, TreeMix identifies gene flow between Swedish / Western MHG and MA1, supporting genetic affinities between both groups, in line with previous reports (20) and our own analyses. Additionally, K14 showed evidence of gene flow into the ancestral node of the two Neandertal genomes currently available. This most likely reflects the presence of longer Neandertal tract identified in the K14 genome (SOM S13). For 6 migration edges and above, K14 grouped together with MA1, still occupying a basal position with respect to the modern populations listed above and all ancient human genomes. We note however that those results should be treated with caution, since we have not investigated thoroughly the effect of using genomes with heterogenous and high error rates (SOM S6). Furthermore, the variance explained is already high with the two forced migrations, and multiple population pairs are exhibiting increased residuals, which could indicate possible overfitting for the remaining migration edges.

28
S13: Archaic hominin genomic tracts
Genomic tracts from archaic hominin origin (Denisova, Altai Neandertal) were identified scanning ancient human genomes for runs of consecutive archaic alleles, restricting to sites where all African individuals present in our reference panel were homozygous ancestral. We furthermore required that the respective other archaic hominin was also homozygous ancestral, in order to minimize false positive tracts due to shared ancestry of Neandertal and Denisova. To ensure results are comparable between ancient and modern genomes, we randomly sampled a single allele at each site for each diploid modern genome. Archaic tracts were defined as runs of archaic alleles, allowing a maximum gap size of 100 kb between consecutive alleles. Furthermore, to allow for missing archaic alleles due to lack of read coverage or randomly sampling the ancestral allele at heterozygote genotypes, we allowed up to 13 ancestral alleles between consecutive archaic alleles (corresponding to a binomial sampling probability of < 10-4) (Fig. S26).
29
S14: Testing for additional archaic introgression
A qualitative assessment of the low-coverage Kostenki genome suggests there are short (1-100 Kb) regions where the Kostenki 14 (K14) genome falls outside the range of contemporary human genetic variation. One potential explanation for this observation is prior admixture between an unknown (and unsampled) archaic human population and the ancestors of K14. To test this possibility, we sampled a randomly chosen read for each location where K14 had coverage. We then tabulated a list of all locations where the K14 allele did not match the human reference sequence (hg19). We then filtered out all locations where either hg19 or the ancestral allele had missing data, sites where the ancestral allele did not match either the K14 allele or the hg19 allele, and locations that contained SNPs in a panel of 42 unrelated high-coverage modern human genomes sequenced by Complete Genomics (http://www.completegenomics.com/public-data). This resulted in a list of 1.47 million potential K14-specific SNPs. The sites on this list could arise from four main causes:
1. Sequencing errors in the K14 reads 2. Errors caused by postmortem DNA modifications in the K14 reads 3. True private polymorphisms under a model without ancient admixture 4. Private polymorphisms due to introgression from a diverged archaic human
population (i.e., ancient admixture) While Illumina sequencing errors are known to correlate with local sequence content
(172, 173) as a first-order approximation they are randomly distributed across the genome (see also below). Similarly, we know something about errors due to post-mortem DNA damage (31) but these too are roughly randomly distributed across the genome since each individual read is short.
To assess how K14-specific polymorphisms would be distributed under different
demographic models, we modified a standard coalescent simulator (174) to allow for sampling of ancient and modern DNA sequences. We then ran simulations to quantify the correlation in locations of Kostenki-specific mutations under a simple demographic null model. In general, we found that beyond a scale of ~1 Kb, the locations of these mutations were essentially uncorrelated. In contrast, under models that included ancient admixture between modern humans and a diverged archaic human population, simulations produced clusters of K14-specific mutations, with the size of the clusters inversely related to the time of admixture. We then scanned the genome for short regions with elevated numbers of K14-specific mutations.
We partitioned the genome into non-overlapping 1 Kb windows and tabulated the
number of K14-specific mutations for each window. We then tabulated all regions that were 5 Kb or longer that contained an average of 6 Kostenki-specific mutations or more per Kb. This led to the identification of 161 candidate regions (excluding the MHC), with an average length of 10.4 Kb. To assess the approximate significance of these regions, we repeatedly permuted the counts of the number of K14-specific mutations

30
across windows and tabulated how frequent it was to obtain regions that satisfied the criteria described above. We conservatively excluded windows with no K14-specific SNPs from these permutations to account for the uneven distribution of sites with no K14 sample coverage across the genome. In all, genome-wide simulations produced an average of 18.4 regions (average length 6.8 Kb) that fit the test criteria.
Finally, to further test whether our initial assumption that sequencing errors are
randomly distributed across the genome, we compared the coordinates of our 161 candidate regions with a list of ~400,000 genomic locations where duplicate Illumina whole-genome sequence data from the same individual had discrepant genotype calls (without standard filters and with a genotype quality cutoff of GQ ≥ 20; cf. (175)). We filtered out all candidate regions that contained one or more of these discrepant genotype calls. 121 regions failed this filter, with each containing an average of 97 discrepant genotype calls (null expectation of random locations for these Illumina sequencing errors would lead to ~1.2 per region). This left 40 candidates for ancient introgression, with an average length of 6.0 Kb. Given the uncertainty in our assumptions regarding the baseline distributions of sequencing errors and post-mortem DNA damage, and the small size of the identified regions, we do not believe these observations are necessarily inconsistent with a null model of no admixture.
We conclude that any introgression with an unsampled archaic human population,
while theoretically possible, has left a negligible trace in the sampled K14 genome.

31
S15: Estimating Neandertal admixture time We used a new Hidden Markov Model (HMM) method to estimate admixture times
and admixture proportions using maximum likelihood (ML). This method will be described in detail in a forthcoming paper, together with extensive simulations evaluating the method. Here we provide a brief summary of the method:
The method is similar to previous methods (176, 177), but differ from these in several important aspects as detailed below. The HMM has two states, SN and SH, representing segments of the haploid genome of Neandertal and human origin, respectively. The objective is to estimate parameters of this two-state HMM and to use subsequent posterior decoding to infer admixture tracts. In contrast to some previous methods (167), the emission probabilities are not estimated using simulated training data, but are instead estimated directly from observed data. The algorithm therefore has two steps. In the first step emission probabilities are estimated from the 1000 Genomes Project (178). We consider only two possible type of emissions: (A) Sites variable in humans (phased 1000 Genomes v.2) in which the focal haplotype has a derived allele as determined by the 4-way EPO alignments, in which Neandertals contain at least one derived allele as well, and in which all reference African populations are invariant ancestral. (B) Variable sites (including Neandertals) that do not fulfill the conditions in (A). Invariable sites and sites that do not have information to determine if condition (A) is true are considered missing data. The HMM is then applied to these data, after removing sites in linkage disequilibrium, by multiplication of the likelihood function among individuals, using transition probabilities given by (179). The likelihood function is calculated using standard algorithms and optimized using the BFGS algorithm in (180) Notice that individuals may not be independent, they may share the same tracts. However, the estimator should still perform well as a composite likelihood estimator for obtaining point estimates. Using this method we obtain emission probabilities of 0.0155 and 6.67e-9 for observations of type A when in the Neandertal and human state, respectively.
The second step is then to estimate transition probabilities in K14 using maximum likelihood (ML) on the same set of sites as those used for estimating emission probabilities. The transition probability estimates directly provide ML estimates of the admixture proportion and the time of admixture in number of generations (by the invariance principle of maximum likelihood). In particular, the rate of transition from SN to SH, aNH, can be converted to an estimate of the admixture time using the following equation:
aNH = m(t-1) per Morgan, where m is the admixture proportion, and t is the admixture time in generations
(179). There is an implicit assumption here of an exponential distribution of admixture tract lengths; an assumption that is not quite true but which should work reasonably well for the levels of divergence and admixture considered here (see (181) for a discussion of this issue). To enable application to the low-coverage, unphased aDNA, we consider a modified state space in which we only use at most one read for the K14 individual for each position. When more than one read is available for a position, we sample one uniformly at random. As a first approximation, we then assume that K14 is not homozygous for a Neandertal segment any place in the genome. The state space is then

32
reinterpreted as having two states: a state in which K14 is heterozygous for a Neandertal haplotype (SN*) and a state in which both alleles in K14 are of human origin (SH*). The emission probability for state SH* is then identical to the previously described emission probability for SN. However, for state SN*, the emission probabilities are obtained as a 50:50 mixture between those of SN and SH in the previous analysis. Sites that are invariable in the 1000G data are considered missing data. This largely eliminates the effect of errors, and also eliminates the effect of unique mutations on the K14 lineage, ensuring that the previously estimated emission probabilities are applicable to the K14 individual. Using these methods we obtained an estimate of the admixture time of approx. 16,600 years before the sample was deposited, using a generation time of 29 years and a recombination rate of 1.26e-8 bp/generation. The estimate for the age of the Neandertal admixture time is then approx. 54k years.

33
References
46. M. V. Anikovitch, V. V. Popov, N. I. Platonova, \emphPaleolit Kostënkovsko-Borshchëvskogo Raiona v Kontekste Verkhnego Paleolita Evropy [\emphPaleolithic of the Kostenki-Boroshchevo Region in the Context of the Upper Paleolithic of Europe] (Izdatel’stvo “Nestor-Istoriia,” Sankt-Peterburg, 2008).
47. J. F. Hoffecker, M. V. Anikovitch, Kostenki: Geography and Culture. Encycl. Glob. Archaeol., 4319–4323 (2014).
48. V. T. Holliday, J. F. Hoffecker, P. Goldberg, Geoarchaeology of the Kostenki–Borshchevo Sites, Don River Valley, Russia. Geoarchaeology. 22, 181–228 (2007).
49. A. N. Rogachev, \emphThe Multilevel Sites of the Kostenki-Borshevo Region on the Don and the Problem of the Development of Culture in the Upper Paleolithic Epoch on the Russian Plain (in Russian). ) (Akademiya Nauk SSSR, Moscow-Leningrad, 1957), Materials and Researches on the Archaeology of the USSR.
50. R. G. Klein, Man and Culture in the Late Pleistocene: A Case Study (Chandler, San Francisco, 1969).
51. A. A. Sinitsyn, Kostenki 14 (markina gora): Data, problems, and perspectives. Préhistoire Eur. 9, 273–313 (1996).
52. P. Haesaerts, F. Damblon, A. Sinitsyn, Kostienki 14 (Voronezh, Central Russia): new data on stratigraphy and radiocarbon chronology (BAR International Series 1240, 2004; http://scholar.google.com/scholar?q=related:BL07o7M2dioJ:scholar.google.com/&hl=en&num=20&as_sdt=0,5).
53. A. A. Velichko, V. V. Pisareva, S. N. Sedov, A. A. Sinitsyn, S. N. Timireva, aleogeography of kostenki-14 (markina gora). Archaeol. Ethnol. Anthropol. Eurasia. 37, 35–50 (2009).
54. G. I. Lazukov, in Paleolit Kostenkovsko-Borshchevskogo Raiona na Donu 1879-1979, N. D. Praslov, A. N. Rogachev, Eds. (Nauka, Leningrad, 1982), pp. 13–37.
55. J. F. Hoffecker et al., From the Bay of Naples to the River Don: the Campanian Ignimbrite eruption and the Middle to Upper Paleolithic transition in Eastern Europe. J. Hum. Evol. 55, 858–870 (2008).
56. B. De Vivo et al., New constraints on the pyroclastic eruptive history of the Campanian volcanic Plain (Italy). Mineral. Petrol. 73, 47–65 (2001).
57. B. Giaccio, I. Hadjas, M. Peresani, F. G. Fedele, R. Isaia, in When Neanderthals and Modern Humans Met, N. J. Conard, Ed. (Verlag, Tubingen, 2006).

34
58. D. M. Pyle et al., Wide dispersal and deposition of distal tephra during the Pleistocene `Campanian Ignimbrite/Y5’ eruption, Italy. Quat. Sci. Rev. 25, 2713–2728 (2006).
59. A. A. Sinitsyn, N. D. Praslov, Y. S. Svezhentsev, L. D. Sulerzhitskii, in Radiouglerodnaya Khronologiya Paleolita Vostochnoi Evropy i Severnoi Azii. Problemy i Perspektivny, A. A. Sinitsyn, N. D. Praslov, Eds. (Russian Academy of Sciences, St Petersburg, 1997), pp. 21–66.
60. M. V. Anikovitch, The formation of Upper Paleolithic cultures and anatomically modern humans : The East European perspective. Anthropologie. 37, 115–123 (1999).
61. A. A. Sinitsyn, in Mitteilungen der Prähistorischen Kommission: Vol. 72. New aspects of the central and eastern european upper palaeolithic - methods, chronology, technology and subsistence, C. Neugebauer-Maresch, L. R. Owen, Eds. (Österreichische Akademie der Wissenschaften, Vienna, 2010), pp. 27–48.
62. P. P. Efimenko, Kostenki I (Akademiya Nauk SSSR, Moscow, 1958).
63. A. N. Rogachev, A. A. Sinitsyn, in Paleolit Kostenkovsko-Borshchevskogo Raiona na Donu 1879-1979, N. D. Praslov, A. N. Rogachev, Eds. (Akademiya Nauk SSSR, Leningrad, 1982), pp. 145–162.
64. J. F. Hoffecker, Desolate Landscapes: Ice-Age Settlement in Eastern Europe (Rutgers University Press, New Brunswick, 2002; http://books.google.com/books?hl=en&lr=&id=nXuqgInMOXIC&oi=fnd&pg=PR10&dq=Desolate+Landscapes+Ice+Age+settlement+in+Eastern+Europe&ots=UnqhIqMDGH&sig=s-iNIXf0ywYFPoXlm9y9DSTiZsY).
65. J. F. Hoffecker et al., Evidence for kill-butchery events of early Upper Paleolithic age at Kostenki, Russia. J. Archaeol. Sci. 37, 1073–1089 (2010).
66. A. A. Sinitsyn, J. F. Hoffecker, Radiocarbon dating and chronology of the Early Upper Paleolithic at Kostenki. Quat. Int. 152-153, 164–174 (2006).
67. A. A. Sinitsyn, in Acts of the XIVth UISPP Congress (Lie`ge, 2001). General Sessions and Posters. Section 6. The Upper Paleolithic, M. Dewez, P. Noiret, E. Teheux, Eds. (British Archaeological Reports International Series, Oxford, 2004), pp. 181–190.
68. A. A. Sinitsyn, A Palaeolithic “Pompeii” at Kostenki, Russia. Antiquity. 77, 9–214 (2003).
69. A. A. Sinitsyn, in Mitteilungen der Prähistorischen Kommission: Vol. 72. New aspects of the central and eastern european upper palaeolithic - methods, chronology, technology and subsistence, C. Neugebauer-Maresch, L. R. Owen, Eds. (Österreichische Akademie der Wissenschaften, Vienna, 2010), pp. 27–48.

35
70. J. F. Hoffecker, The early upper Paleolithic of eastern Europe reconsidered. Evol. Anthropol. Issues News Rev. 20, 24–39 (2011).
71. P. R. Nigst, The Early Upper Palaeolithic of the Middle Danube Region (Leiden University Press, Leiden, 2012; http://books.google.co.uk/books?id=q-PhuQAACAAJ&dq=intitle:The+Early+Upper+Palaeolithic+of+the+Middle+Danube+region&hl=&cd=1&source=gbs_api).
72. J.-J. Hublin, The modern human colonization of western Eurasia: When and where? Quat. Sci. Rev. DOI:10.1016/j.quascirev.2014.08.011 (2014) (available at http://www.sciencedirect.com/science/article/pii/S0277379114003254).
73. S. L. Kuhn, M. C. Stiner, E. Güleç, Initial Upper Palaeolithic in south-central Turkey and its regional context: a preliminary report. Antiquity. 73, 505–517 (1999).
74. G. B. Tostevin, thesis, Harvard University, Cambridge, Massachusetts (2000).
75. O. Bar-Yosef, in When Neanderthals and modern humans met, N. J. Conard, Ed. (Verlag, Tubingen, 2006), pp. 467–482.
76. J. F. Hoffecker, The spread of modern humans in Europe. Proc. Natl. Acad. Sci. USA. 106, 16040–16045 (2009).
77. U. C. Müller et al., The role of climate in the spread of modern humans into Europe. Quat. Sci. Rev. 30, 273–279 (2011).
78. G. B. Tostevin, \emphSeeing Lithics: A Middle-Range Theory for Testing for Cultural Transmission in the Pleistocene (Oxbow Books, Oxford, 2012).
79. G. F. Debetz, Paleoanthropological finds at Kostenki. Sov. Ethnogr. 1, 43–53 (1955).
80. P. Mellars, The Neanderthal Legacy: An Archaeological Perspective from Western Europe. (Princeton Univ. Press, Princeton, 1996).
81. W. Davies, Palaeoanthropology: The time of the last Neanderthals. Nature. 512, 260–261 (2014).
82. T. Higham et al., The timing and spatiotemporal patterning of Neanderthal disappearance. Nature. 512, 306–309 (2014).
83. C. Finlayson et al., Late survival of Neanderthals at the southernmost extreme of Europe. Nature. 443, 850–853 (2006).
84. G. B. Tostevin, in More than meets the eye. Studies on Upper Palaeolithic Diversity in the Near East, A. N. Goring-Morris, A. Belfer-Cohen, Eds. (Oxbow Books, Oxford, 2003), pp. 54–67.

36
85. D. Richter, G. TOSTEVIN, P. ŠKRDLA, Bohunician technology and thermoluminescence dating of the type locality of Brno-Bohunice (Czech Republic). J. Hum. Evol. 55, 871–885 (2008).
86. C. C. Szmidt, C. Normand, G. S. Burr, G. W. L. Hodgins, S. LaMotta, AMS 14C dating the Protoaurignacian/Early Aurignacian of Isturitz, France. Implications for Neanderthal-modern human interaction and the timing of technical and cultural innovations in Europe. J. Archaeol. Sci. 37, 758–768 (2010).
87. P. R. Nigst et al., Early modern human settlement of Europe north of the Alps occurred 43,500 years ago in a cold steppe-type environment. Proc. Natl. Acad. Sci. USA (2014), doi:10.1073/pnas.1412201111.
88. A. E. Marks, Prehistory and Paleoenvironments in the Central Negev, Israel. (Southern Methodist University Press, Dallas, 1983).
89. T. Goebel, A. P. Derevianko, V. T. Petrin, Dating the middle-to-upper-paleolithic transition at Kara-Bom. Curr. Anthropol. 34, 452–458 (1993).
90. N. Zwyns, \emphLaminar technology and the onset of the Upper Paleolithic in the Altai, Siberia (Leiden University Press, Leiden, 2012).
91. T. Goebel, M. Aksenov, Accelerator radiocarbon dating of the initial Upper Paleolithic in southeast Siberia. Antiquity. 69, 349–357 (1995).
92. S. L. Kuhn, N. Zwyns, Rethinking the initial Upper Paleolithic. Quat. Int. 347, 29–38 (2014).
93. T. Goebel, Anthropology. The missing years for modern humans. Science. 315, 194–196 (2007).
94. N. R. Rebollo et al., New radiocarbon dating of the transition from the Middle to the Upper Paleolithic in Kebara Cave, Israel. J. Archaeol. Sci. 38, 2424–2433 (2011).
95. N. Sirakov et al., Un nouveau faciès lamellaire du début du Paléolithique supérieur dans les Balkans. Paléorient, 131–144 (2007).
96. F. Bon, L’Aurignacien entre mer et Océan. Réflexion sur l’unité des phases anciennes de l’Aurignacien dans le sud de la France. Mém. Société Préhistorique Fr. 10, 253 (2002).
97. J.-L. Guadelli et al., in Les premiers peuplements en Europe. Actes du Colloque international : Données récentes sur les modalités de peuplement et sur le cadre chronostratigraphique, géologique et paléogéographique des industries du Paléolithique ancien et moyen en Europe, N. Molines, M. H. Moncel, J. L. Monnier, Eds. (Universite de Rennes, Rennes, 2005; http://halshs.archives-ouvertes.fr/halshs-00136044), pp. 87–103.

37
98. K. Douka, C. A. Bergman, R. E. M. Hedges, F. B. Wesselingh, T. F. G. Higham, Chronology of Ksar Akil (Lebanon) and implications for the colonization of Europe by anatomically modern humans. PLoS One. 8, e72931 (2013).
99. M. Otte et al., The Aurignacian in the Zagros region: new research at Yafteh cave, Lorestan, Iran. Antiquity. 81, 82–96 (2007).
100. T. Tsanova et al., Le plus petit dénominateur commun: réflexion sur la variabilité des ensembles lamellaires du Paléolitque supérieur ancient d’Eurasie. Un bilan autour des exemples de Kozarnika (Est des Balkans) et Yafteh (Zagros central). L’Anthropologie. 116, 469–509 (2012).
101. M. Vanhaeren, F. d’ Errico, Aurignacian ethno-linguistic geography of Europe revealed by personal ornaments. J. Archaeol. Sci. 33, 1105–1128 (2006).
102. V. Borgia, F. Ranaldo, A. Ronchitelli, U. Wierer, in À la recherche des identités gravettiennes : actualités, questionnements et perspectives : actes de la table ronde sur le Gravettien en France et dans les pays limitrophes, Aix-en-Provence, 6-8 octobre 2008, N. Goutas, L. Klaric, D. Pesesse, P. Guillermin, Eds. (Société préhistorique française, Paris, 2011), Mémoires de la Société préhistorique française ; 52, pp. 161–174.
103. D. Henry-Gambier, D. Sacchi, La Crouzade V-VI (Aude, France) : un des plus anciens fossiles d’anatomie moderne en Europe occidentale. Bull. Mém. Société Anthropol. Paris. 20, 79–104 (2008).
104. W. Davies, R. E. M. Hedges, Dating a type site: fitting Szeleta cave into its regional chronometric context. Praehistorische Zeitschift. 9-10, 35–45 (2008).
105. F. V. Ramírez Rozzi et al., Cutmarked human remains bearing Neandertal features and modern human remains associated with the Aurignacian at Les Rois. J. Anthropol. Sci. Riv. Antropol. JASS Ist. Ital. Antropol. 87, 153–185 (2009).
106. E. Alexandrescu, A. Olariu, G. Skog, K. Stenstrom, R. Hellborg, Human fossil bones from the Muierii Cave and the Cioclovina Cave, Romania. Anthropologie. 114, 341–353 (2010).
107. T. Goebel, in Emergence and Diversity of Modern Human Behavior in Paleolithic Asia, Y. Kaifu, M. Izuho, T. Goebel, H. Sato, A. Ono, Eds. (Texas A&M University Press, College Station, 2014), pp. 437–452.
108. F. Li, S. L. Kuhn, X. Gao, F. Chen, Re-examination of the dates of large blade technology in China: A comparison of Shuidonggou Locality 1 and Locality 2. J. Hum. Evol. 64, 161–168 (2013).
109. F. Li et al., The development of Upper Palaeolithic China: new results from the Shuidonggou site. Antiquity. 87, 368–383 (2013).

38
110. S. Hughes et al., Molecular phylogeny of the extinct giant deer, Megaloceros giganteus. Mol. Phylogenet. Evol. 40, 285–291 (2006).
111. S. A. Gladyshev, J. W. Olsen, A. V. Tabarev, Y. V. Kuzmin, Chronology and periodization of Upper Paleolithic sites in Mongolia. Archaeol. Ethnol. Anthropol. Eurasia. 3, 33–40 (2010).
112. C. Morgan et al., Redating Shuidonggou Locality 1 and Implications for the Initial Upper Paleolithic in East Asia. Radiocarbon. 56, 165–179 (2014).
113. F. T. Goebel, The Middle to Upper Paleolithic Transition in Siberia. Anthropol. Pap. Univ. Alsk. 26, 94–113 (2003).
114. P. J. Brantingham, S. L. Kuhn, K. W. Kerry, \emphThe Early Upper Paleolithic beyond Western Europe (University of California Press, Los Angeles, 2004).
115. O. Bar-Yosef, Y. Wang, Paleolithic Archeology in China. Annu. Rev. Anthropol. 41, 319–335 (2012).
116. I. Buvit, K. Terry, M. Izuho, in Emergence and Diversity of Modern Human Behavior in Paleolithic Asia, Y. Kaifu, M. Izuho, T. Goebel, H. Sato, A. Ono, Eds. (Texas A&M University Press, College Station, 2014), pp. 490–505.
117. K. Terry, thesis, Washington State University (2010).
118. Y. Kaifu, Emergence and Diversity of Modern Human Behavior in Paleolithic Asia (Texas A&M University Press, 2014; http://books.google.dk/books?id=88-6oAEACAAJ).
119. Y. V. Kuzmin, P. A. Kosintsev, D. I. Razhev, G. W. L. Hodgins, The oldest directly-dated human remains in Siberia: AMS 14C age of talus bone from the Baigara locality, West Siberian Plain. J. Hum. Evol. 57, 91–95 (2009).
120. A. Gibbons, Oldest Homo sapiens genome pinpoints neandertal input. Science. 343, 1417 (2014).
121. N. Zwyns, D. Flas, in Les Aurignaciens, M. Otte, Ed. (Editions Errance, Paris, 2010), pp. 271–295.
122. W. Davies, P. J. Gollop, in Neanderthals and Modern Humans in the European Landscape during the Last Glaciation, T. H. van Andel, W. Davies, Eds. (McDonald Institute for Archaeological Research, Cambridge, 2003), pp. 131–146.
123. K. E. Graf, “The Good, the Bad, and the Ugly”: evaluating the radiocarbon chronology of the middle and late Upper Paleolithic in the Enisei River valley, south-central Siberia. J. Archaeol. Sci. 37, 210–223 (2009).

39
124. K. E. Graf, Hunter–gatherer dispersals in the mammoth-steppe: technological provisioning and land-use in the Enisei River valley, south-central Siberia. J. Archaeol. Sci. 37, 210–223 (2010).
125. C. G. Turner, Teeth and prehistory in Asia. Science. 260, 88–96 (1989).
126. M. Mussi, J. Cinq-Mars, P. Bolduc, Echoes from the mammoth steppe: the case of the Balzi Rossi. Univ. Leiden, 106–124 (2000).
127. M. Raghavan et al., Upper Palaeolithic Siberian genome reveals dual ancestry of Native Americans. Nature. 505, 87–91 (2014).
128. R. A. Housley, C. S. Gamble, M. Street, P. Pettitt, Radiocarbon evidence for the Lateglacial Human Recolonisation of Northern Europe. Proc. Prehist. Soc. 63, 25–54 (1997).
129. C. Gamble, W. Davies, P. Pettitt, M. Richards, Climate change and evolving human diversity in Europe during the last glacial. Philos. Trans. R. Soc. Lond. B. Biol. Sci. 359, 243–254 (2004).
130. M. Mirazon Lahr, R. A. Foley, R. Pinhasi, in Archaeogenetics: DNA and the population prehistory of Europe, C. Renfrew, K. Boyle, Eds. (McDonald Institute for Archaeological Research, Cambridge, 2000), pp. 81–88.
131. J. Krause et al., Mitochondrial genomes reveal an explosive radiation of extinct and extant bears near the Miocene-Pliocene boundary. BMC Evol. Biol. 8, 220 (2008).
132. L. Orlando et al., Recalibrating Equus evolution using the genome sequence of an early Middle Pleistocene horse. Nature. 499, 74–78 (2013).
133. J. Dabney et al., Complete mitochondrial genome sequence of a Middle Pleistocene cave bear reconstructed from ultrashort DNA fragments. Proc. Natl. Acad. Sci., 201314445 (2013).
134. B. Llamas et al., High-resolution analysis of cytosine methylation in ancient DNA. PLoS ONE. 7, e30226 (2012).
135. O. Smith et al., Genomic methylation patterns in archaeological barley show de-methylation as a time-dependent diagenetic process. Sci. Rep. 4 (2014), doi:10.1038/srep05559.
136. D. Gokhman et al., Reconstructing the DNA Methylation Maps of the Neandertal and the Denisovan. Science. 344, 523–527 (2014).
137. A. W. Briggs et al., Removal of deaminated cytosines and detection of in vivo methylation in ancient DNA. Nucleic Acids Res., gkp1163 (2009).

40
138. A. Seguin-Orlando et al., Ligation bias in illumina next-generation DNA libraries: implications for sequencing ancient genomes. PloS One. 8, e78575 (2013).
139. M. Meyer, M. Kircher, Illumina sequencing library preparation for highly multiplexed target capture and sequencing. Cold Spring Harb. Protoc. 2010, pdb.prot5448 (2010).
140. J. T. Vilstrup et al., Mitochondrial Phylogenomics of Modern and Ancient Equids. PLoS ONE. 8, e55950 (2013).
141. M. Schubert et al., Characterization of ancient and modern genomes by SNP detection and phylogenomic and metagenomic analysis using PALEOMIX. Nat. Protoc. 9, 1056–1082 (2014).
142. M. Schubert et al., Improving ancient DNA read mapping against modern reference genomes. BMC Genomics. 13, 178 (2012).
143. S. Lindgreen, AdapterRemoval: easy cleaning of next-generation sequencing reads. BMC Res. Notes. 5, 337 (2012).
144. H. Li, R. Durbin, Fast and accurate short read alignment with Burrows-Wheeler transform. Bioinformatics. 25, 1754–1760 (2009).
145. A. McKenna et al., The Genome Analysis Toolkit: A MapReduce framework for analyzing next-generation DNA sequencing data. Genome Res. 20, 1297–1303 (2010).
146. H. Jónsson, A. Ginolhac, M. Schubert, P. L. F. Johnson, L. Orlando, mapDamage2.0: fast approximate Bayesian estimates of ancient DNA damage parameters. Bioinforma. Oxf. Engl. 29, 1682–1684 (2013).
147. H. Li et al., The Sequence Alignment/Map format and SAMtools. Bioinformatics. 25, 2078–2079 (2009).
148. Q. Fu et al., A Revised Timescale for Human Evolution Based on Ancient Mitochondrial Genomes. Curr. Biol. 23, 553–559 (2013).
149. D. Reich et al., Genetic history of an archaic hominin group from Denisova Cave in Siberia. Nature. 468, 1053–1060 (2010).
150. M. Rasmussen et al., An Aboriginal Australian Genome Reveals Separate Human Dispersals into Asia. Science. 334, 94–98 (2011).
151. K. A. Frazer et al., A second generation human haplotype map of over 3.1 million SNPs. Nature. 449, 851–861 (2007).
152. P. Francalacci et al., Low-Pass DNA Sequencing of 1200 Sardinians Reconstructs European Y-Chromosome Phylogeny. Science. 341, 565–569 (2013).
41
153. G. D. Poznik et al., Sequencing Y Chromosomes Resolves Discrepancy in Time to Common Ancestor of Males Versus Females. Science. 341, 562–565 (2013).
154. International Society of Genetic Genealogy. Int. Soc. Genet. Geneal. (2014), (available at http://www.isogg.org Y-DNA Haplogroup Tree 2014, Version: 9.71).
155. J. Z. Li et al., Worldwide Human Relationships Inferred from Genome-Wide Patterns of Variation. Science. 319, 1100–1104 (2008).
156. J. Di Cristofaro et al., Afghan Hindu Kush: Where Eurasian Sub-Continent Gene Flows Converge. PLoS ONE. 8, e76748 (2013).
157. S. A. Fedorova et al., Autosomal and uniparental portraits of the native populations of Sakha (Yakutia): implications for the peopling of Northeast Eurasia. BMC Evol. Biol. 13, 127 (2013).
158. B. Yunusbayev et al., The Caucasus as an asymmetric semipermeable barrier to ancient human migrations. Mol. Biol. Evol., msr221 (2011).
159. G. Chaubey et al., Population Genetic Structure in Indian Austroasiatic speakers: The Role of Landscape Barriers and Sex-specific Admixture. Mol. Biol. Evol., msq288 (2010).
160. M. Rasmussen et al., Ancient human genome sequence of an extinct Palaeo-Eskimo. Nature. 463, 757–762 (2010).
161. M. Metspalu et al., Shared and unique components of human population structure and genome-wide signals of positive selection in South Asia. Am. J. Hum. Genet. 89, 731–744 (2011).
162. D. M. Behar et al., The genome-wide structure of the Jewish people. Nature. 466, 238–242 (2010).
163. I. Lazaridis et al., Ancient human genomes suggest three ancestral populations for present-day Europeans. Nature. 513, 409–413 (2014).
164. P. Skoglund et al., Genomic diversity and admixture differs for Stone-Age Scandinavian foragers and farmers. Science. 344, 747–750 (2014).
165. A. Keller et al., New insights into the Tyrolean Iceman’s origin and phenotype as inferred by whole-genome sequencing. Nat. Commun. 3, 698 (2012).
166. P. Skoglund et al., Separating endogenous ancient DNA from modern day contamination in a Siberian Neandertal. Proc. Natl. Acad. Sci. 111, 2229–2234 (2014).
167. S. Sankararaman et al., The genomic landscape of Neanderthal ancestry in present-day humans. Nature. 507, 354–357 (2014).

42
168. B. Vernot, J. M. Akey, Resurrecting Surviving Neandertal Lineages from Modern Human Genomes. Science. 343, 1017–1021 (2014).
169. D. H. Alexander, J. Novembre, K. Lange, Fast model-based estimation of ancestry in unrelated individuals. Genome Res. (2009), doi:10.1101/gr.094052.109.
170. M. Sikora et al., Population Genomic Analysis of Ancient and Modern Genomes Yields New Insights into the Genetic Ancestry of the Tyrolean Iceman and the Genetic Structure of Europe. PLoS Genet. 10, e1004353 (2014).
171. J. K. Pickrell, J. K. Pritchard, Inference of Population Splits and Mixtures from Genome-Wide Allele Frequency Data. PLoS Genet. 8, e1002967 (2012).
172. J. C. Dohm, C. Lottaz, T. Borodina, H. Himmelbauer, Substantial biases in ultra-short read data sets from high-throughput DNA sequencing. Nucleic Acids Res. 36, e105 (2008).
173. K. Nakamura et al., Sequence-specific error profile of Illumina sequencers. Nucleic Acids Res., gkr344 (2011).
174. R. R. Hudson, Generating samples under a Wright–Fisher neutral model of genetic variation. Bioinformatics. 18, 337–338 (2002).
175. J. D. Wall et al., Estimating genotype error rates from high-coverage next-generation sequence data. Genome Res., gr.168393.113 (2014).
176. A. L. Price et al., Sensitive Detection of Chromosomal Segments of Distinct Ancestry in Admixed Populations. PLoS Genet. 5, e1000519 (2009).
177. S. Sankararaman, G. Kimmel, E. Halperin, M. I. Jordan, On the inference of ancestries in admixed populations. Genome Res. 18, 668–675 (2008).
178. T. 1000 G. P. Consortium, An integrated map of genetic variation from 1,092 human genomes. Nature. 491, 56–65 (2012).
179. S. Gravel, Population Genetics Models of Local Ancestry. Genetics, genetics.112.139808 (2012).
180. R. H. Byrd, P. Lu, J. Nocedal, C. Zhu, A Limited-Memory Algorithm for Bound Constrained Optimization. SIAM J. Sci. Comput. 16, 1190–1208 (1994).
181. M. Liang, R. Nielsen, The Lengths of Admixture Tracts. Genetics. 197, 953–967 (2014).
182. M. Sikora et al., Population Genomic Analysis of Ancient and Modern Genomes Yields New Insights into the Genetic Ancestry of the Tyrolean Iceman and the Genetic Structure of Europe. PLoS Genet. 10, e1004353 (2014).

43
183. M. Raghavan et al., The genetic prehistory of the New World Arctic. Science. 345, 1255832 (2014).

44
Fig. S1 Distribution of the archaeological sites that form the localities of Kostenki-Borshchevo the west bank of the river Don. Abbreviations: K: Kostenki, A: Anosovka, G: Gorodtsovskaya, S: Streletskaya, B: Borshchevo, T: Tel’manskaya. Redrawn after Klein (1969).

45
Fig. S2 Location of excavation trenches at Kostenki 14. The trenches on the western section of the site, which include that excavated by Rogachev in 1954 and where the skeleton was found, preserve a single horizon of Cultural Layer IV below the CI Y5 tephra, divided into two (IVa and IVb) in the eastern portion of the site.

46
Fig. S3 Stratigraphic schema of Kostenki 14, showing Rogachev’s 1954 section, where the human skeleton in the burial (B) was found, and the more recent section excavated by Sinitsyn 1998-2012 on the eastern part of the site and from where the detailed description of the cultural layers derives. Abbreviations: CL: Cover Loam, UHB: Upper Humic Bed, WL: Whitish Loam, LHC: Lower Humic Bed, v: volcanic ash. Cultural Layers (CL) are shown in brown and italic font. Stratigraphic logs not to scale. Figure: PR Nigst, compiled after Sinitsyn (1996) and Haesaerts et al. (2004).

47
Fig. S4 Frontal view of the cranium of Kostenki 14. Courtesy of Vyacheslav Moiseyev, and Ethnography (Kunstkamera) Peter the Great Museum of Anthropology.

48
Fig. S5 Plan of the burial from Kostenki 14 (Markina Gora); redrawn and changed after Klein (1969, Fig. 23).

49
Fig. S6 Calibration graph of the radiocarbon date for Kostenki 14 published by Marom et al. 2006. Calibration curve: IntCal13 (Reimer et al 2013); software: OxCal 4.2.4 (Bronk Ramsey 2009).

50
Fig. S7 An example of DNA fragmentation and mis-incorporation patterns observed on non-USER treated libraries. The sequence data corresponds to library ID K14_TGAACA (see Table S2 for further details).
−A
● ● ● ● ● ● ● ● ●
●
●● ● ● ● ●
● ● ● ●
0.0
0.1
0.2
0.3
0.4
0.5
Frequency
A
● ● ●● ● ● ●
●●
●
●
● ● ● ● ● ●● ● ●
C
● ● ● ● ● ● ●●
●
● ●●
●● ● ●
● ● ● ●
C
● ● ● ● ● ● ● ●● ●
●
● ● ● ● ● ● ● ● ●
0.0
0.1
0.2
0.3
0.4
0.5
G
● ● ● ● ● ● ● ● ●
●
●
● ● ● ● ● ● ● ● ●
0.0
0.1
0.2
0.3
0.4
0.5
Frequency
−10 −9 −8 −7 −6 −5 −4 −3 −2 −1 1 2 3 4 5 6 7 8 9 10
G
● ● ● ● ● ●●
●●
●●
● ● ● ● ●● ● ● ●
−10 −9 −8 −7 −6 −5 −4 −3 −2 −1 1 2 3 4 5 6 7 8 9 10
T
● ● ● ● ● ● ● ●
●
●
●
●●
● ● ● ● ● ● ●
−10 −9 −8 −7 −6 −5 −4 −3 −2 −1 1 2 3 4 5 6 7 8 9 10
T
● ● ● ● ● ● ● ●●
●
●
● ●● ● ●
●● ● ●
0.0
0.1
0.2
0.3
0.4
0.5
−10 −9 −8 −7 −6 −5 −4 −3 −2 −1 1 2 3 4 5 6 7 8 9 10
1 2 3 4 5 6 7 8 9 10 11 12 13 14 15 16 17 18 19 20 21 22 23 24 25
0.00
0.05
0.10
0.15
0.20
0.25
0.30
Frequency
−25
−24
−23
−22
−21
−20
−19
−18
−17
−16
−15
−14
−13
−12
−11
−10 −9 −8 −7 −6 −5 −4 −3 −2 −1
0.00
0.05
0.10
0.15
0.20
0.25
0.30

51
Fig. S8 An example of DNA fragmentation and mis-incorporation patterns observed on USER-treated libraries. The sequence data corresponds to library ID K14_14c_CGTAGT_USER (see table S2 for further details).
−A
● ● ●● ● ● ● ●
●
●
●
●● ● ● ●
● ● ● ●
0.0
0.1
0.2
0.3
0.4
0.5
Frequency
A
●●
● ● ● ● ● ● ●
●
●
● ● ● ● ● ● ● ● ●
C
● ● ● ●● ●
●●
●
●
● ●● ● ●
● ● ● ● ●
C
● ● ● ●●
●● ●
●
●
● ● ● ● ● ● ● ● ● ●
0.0
0.1
0.2
0.3
0.4
0.5
G
● ● ● ● ●●
● ● ●●
●
●
● ● ● ● ● ● ● ●
0.0
0.1
0.2
0.3
0.4
0.5
Frequency
−10 −9 −8 −7 −6 −5 −4 −3 −2 −1 1 2 3 4 5 6 7 8 9 10
G
● ● ● ● ● ● ● ●● ●
●
●● ● ● ● ● ● ● ●
−10 −9 −8 −7 −6 −5 −4 −3 −2 −1 1 2 3 4 5 6 7 8 9 10
T
● ● ● ● ●● ● ● ●
●
●
● ●●
● ●● ● ● ●
−10 −9 −8 −7 −6 −5 −4 −3 −2 −1 1 2 3 4 5 6 7 8 9 10
T
● ● ● ● ●● ● ● ●
●
●
●● ●
● ● ● ●●
●
0.0
0.1
0.2
0.3
0.4
0.5
−10 −9 −8 −7 −6 −5 −4 −3 −2 −1 1 2 3 4 5 6 7 8 9 10
1 2 3 4 5 6 7 8 9 10 11 12 13 14 15 16 17 18 19 20 21 22 23 24 25
0.00
0.05
0.10
0.15
0.20
0.25
0.30
Frequency
−25
−24
−23
−22
−21
−20
−19
−18
−17
−16
−15
−14
−13
−12
−11
−10 −9 −8 −7 −6 −5 −4 −3 −2 −1
0.00
0.05
0.10
0.15
0.20
0.25
0.30

52
Fig. S9 Overall error rates for all USER libraries. The type specific error rates for the different libraries are seen in Fig. S25.
Error rates estimated using an outgroup (Chimp) and a high quality genomeer
ror r
ate
0.00
00.
001
0.00
20.
003
0.00
4
K14_1
4c_T
CGATG_U
SER
K14_1
4c_T
ACGAG_USER
K14_S
6_1_
D_ACTTGA
K14_S
5_2_
B_TTA
GGC
K14_U
SER_Met4
_GAT
CAG
K14_1
0c_C
TCTGC_USER
K14_4
0_TGACGT
K14_U
SER_Met3
_ACTTGA
K14_3
7_ACTGCC
K14_4
4_CTCTA
G
K14_2
_CGAT
GT
K14_3
3_GACCGG
K14_5
0_TTGAAC
K14_1
0_TA
GCTT
K14_1
0c_A
CAGAG_USER
K14_4
2_ACGTGC
K14_A
2_K14
_S2_
1_USER
K14_1
0c_G
AGTAG_U
SER
K14_1
0c_G
CTACT_U
SER
K14_S
5_1_
A_ATCACG
K14_B
3_K14
_S2_
2_MetC
ap_U
SER
K14_S
5_2_
C_15_
TGATCG
K14_1
0c_T
AGCTG_USER
K14_4
_TGACCA
K14_3
9_CGACCT
K14_1
4c_A
CTGCG_USER
K14_3
6_TGCAGG
K14_4
7_CAT
AGA
K14_S
2_1_
USER_37_
ACTGCC
K14_4
9_CAT
CGT
K14_9
_GAT
CAG
K14_1
2_CTTGTA
k14_
48_A
CAGTC
K14_5
_ACAGTG
K14_D
abne
y_D3_
USER_3_T
CTCGC
K14_S
2_1_
USER_36_
TGCAGG
K14_2
4_CGAT
GA
K14_B
1_K14
_S2_
1_USER_A
CAGTG
K14_4
1_TGTCTG
K14_A
4_K14
_S2_
2_USER
K14_S
6_2_
F_CTTGTA
K14_4
6_CACGAA
K14_1
4c_C
AGCAC_USER
K14_1
4c_G
TCGTC_USER
K14_4
5_GAGAAG
K14_8
_ACTTGA
K14_3
5_CTGACA
K14_1
1_GGCTA
C
K14_D
abne
y_D3_
USER_1_C
GATGA
K14_A
1_K14
_S2_
1_USER_C
AGCTA
K14_3
1_GACACT
K14_6
_GCCAAT
K14_1
0c_A
GTGAG_USER
K14_B
4_K14
_S2_
2_MetC
ap_U
SER
K14_U
SER_Met2
_TTA
GGC
K14_7
_CAGAT
C
K14_S
5_2_
C_15_
8_ACTTGA
K14_1
_ATCACG
K14_3
_TTA
GGC
K14_3
4_GAGAT
A
K14_U
SER_Met1
_ATCACG
K14_D
abne
y_D3_
USER_2_T
GCATA
K14_1
4c_C
GTAGT_U
SER
K14_B
2_K14
_S2_
1_USER_G
CCAAT
K14_4
3_TGAT
CC
K14_3
8_GCAACG
K14_S
6_2_
E_GCCAAT
K14_A
3_K14
_S2_
2_USER
K14_D
abne
y_D3_
USER_4_T
GATGC
K14_S
5_2_
C_15_
6_GCCAAT
K14_S
5_2_
C_CAGAT
C

53
Fig. S10 Type specific error rates for different trimmings for all USER libraries. The overall error rates are shown in the legend.
C −> A G −> A T −> A A −> C G −> C T −> C A −> G C −> G T −> G A −> T C −> T G −> T
Error rate using an outgroup and a high quality genome
erro
r rat
e
0.00
000.
0002
0.00
040.
0006
0.00
080.
0010
0.00
12
kos18octBlue.bam 0.18 %kos18octBlue.tr1.bam 0.15 %kos18octBlue.tr2.bam 0.13 %kos18octBlue.tr3.bam 0.11 %kos18octBlue.tr4.bam 0.1 %kos18octBlue.tr5.bam 0.09 %

54
Fig. S11 Type specific error rates for all USER libraries. The type specific error rates for all libraries are seen in Fig. S6.
C −> A G −> A T −> A A −> C G −> C T −> C A −> G C −> G T −> G A −> T C −> T G −> T
Error rate using an outgroup and a high quality genome
erro
r rat
e
0.00
00.
005
0.01
00.
015
0.02
0
'Brana1 0.42 %Brana2 0.63 %iceman 0.25 %Ajv58 1.06 %Gok2 1.56 %MA1 0.31 %E733 0.18 %Loschbour 0.09 %LBK 0.09 %Motala1 0.07 %Motala2 0.06 %Motala3 0.06 %Motala4 0.08 %Motala6 0.09 %Motala9 0.07 %Motala12 0.05 %Kos 0.17 %Kos5bpTrimmed' 0.08 %

55
Fig. S12 Overall error rates for all ancient samples. We have included the untrimmed Kostenki K14 sample for comparison.
Error rate using an outgroup and a high quality genome
erro
r rat
e
0.00
00.
005
0.01
00.
015
'Bra
na1
Bran
a2
icem
an
Ajv5
8
Gok
2
MA1
E733
Losc
hbou
r
LBK
Mot
ala1
Mot
ala2
Mot
ala3
Mot
ala4
Mot
ala6
Mot
ala9
Mot
ala1
2
Kos
Kos5
bpTr
imm
ed'

56
Fig. S13 Barplot of phylogenetically informative SNPs. The bars indicate the number of ancestral and derived mutations observed in K14 for each branch of the tree from (A) Table S1 in (152), and (B) (153) (http://www.popgen.dk/kostenki/figs_online/Poznik_tree.pdf).
0
200
400
600A1
b1b2
b(A
B)T BT CT
DE E1
E1a1 E1
bE1
b1E1
b1b1
E1b1
b1a1
E1b1
b1a1
aE1
b1b1
a1d
E1b1
b1a1
bE1
b1b1
a1b6
E1b1
b1b1
E1b1
b1b1
a2E1
b1b1
b2E1
b1b1
b2a1
E1b1
b1b2
a1a
FK F3 GG
2a G2
G2a
2bG
2a2b
1G
2a3
G2a
3aG
2a3b
1G
2a3b
1a2
G2a
3b1a
1G
2a3b
1a1a
G2a
3b1a
3a IJK IJ I I1
I1a3
a2 I2I2
a1I2
a1a
I2a1
a1I2
a1b
I2a2
aI2
c JJ1
cJ1
c3J1
c3d J2 J2a
J2a2
J2a2
aJ2
a3J2
a3b
J2a3
b1J2
a3h2 J2
bJ2
b2f
J2b2
a1a
KRK L L2 L1a T1 T1b
T1a1 P
Q1a
3c R R1
R1a
1a1
R1a
1a1h
R1a
1a1g
R1a
1a1b
1a1
R1a
1a1b
1a1b
R1b
1R
1b1a
2R
1b1a
2aR
1b1a
2a1a
1R
1b1a
2a1a
1aR
1b1a
2a1a
1a5c
2R
1b1a
2a1a
1bR
1b1a
2a1a
1b4
R1b
1a2a
1a1b
4cR
1b1a
2a1a
1b3
R1b
1a2a
1a1b
3c3
R1b
1a2a
1a1b
3c1b
1R
1b1a
2a1a
1b3c
1R
1b1a
2a1a
1b3d
R1b
1a2a
1a1b
3eR
1b1a
2a1a
1b3e
3R
1b1c
R1b
1c3
R2a
1
Haplogroup
Cou
nt
Ancient alleleAncestralAncestral (Damage)DerivedDerived (Damage)
Kostenki
0
200
400
600
0 1 2 3 4 5 6 7 8 9 10 11 12 13 14 15 16 17 19 20 21 22 23 24 25 26 27 28 29 30 32 33 34 35 36 37 38 39 40 41 42 43 44 46 47 48 49 50 51 52 53 54 55 56 57 58 59 60 61 62 63 64 65 66 67 68 69 70 71 72 73 74 77 78 79 80 81 82 83 84 85 86 87 88 89 90 91 92 93 94 95 96 97 98 99 100
101
102
104
105
106
107
108
109
110
111
112
113
114
115
116
117
118
119
120
121
122
123
124
125
126
127
128
129
130
131
132
133
134
135
Haplogroup
Cou
nt
Ancient alleleAncestralAncestral (Damage)DerivedDerived (Damage)
Kostenki

57
Fig. S14 f3 outgroup plot for the K14 sample, compared to all modern and ancient populations.
SouthAfricaCentralAfricaWestAfrica
EastAfrica
NorthAfrica
Arabia
MiddleEast
SouthEastEurope
SouthEurope
WestEurope
EastEurope
NorthCaucasus
SouthCaucasus
CentralAsia
SouthAsia
SouthEastAsia
EastAsia
Siberia
NorthAmerica
SouthAmerica
Oceania
Ancient
0.0
0.1
0.2
0.3
SanBantuSouthAfrica
BiakaPygmyMandenka
YorubaBantuKenyaEthiopians
EthiopianJewsEgyptiansMozabiteMoroccan
MoroccanJewsYemenis
YemeniJewsSaudisIraniansIranJewsIraqiJewsJordanianSyriansBedouinDruze
PalestinianSamaritans
AshkenaziJewsSephardicJews
LebaneseTurkishCypriots
BulgariansRomanian
RomanianJewsNorthItalian
TuscanSardinianSpanishBasqueFrench
OrcadianHungariansUcranians
BelarusiansEstonians
LithuaniansNWRussianMordoviansChuvashs
MarisAdygeiBalkars
ChechensKumyksLezginsNogais
NorthOssetiansAbhkasiansArmeniansGeorgians
GeorgianJewsAzerbaijanJews
KurdsTurkmensKazakhsUzbeks
UzbekJewsKyrgyzians
UygurHazaraTajiks
BurushoPashtunBalochiBrahuiKalashMakraniPathanSindhiBengaliBhunjia
BrahminsUttaranchalBrahminsUttarPradesh
ChamarDharkarsDusadhKanjarsKurmiKol
KshatriyaMeena
MeghawalMuslimTharus
UttarPradeshScheduledCasteBrahminsTamilNadu
ChenchusDhurwaGond
HakkipikkiNorthKannadi
KurumbaLambadiMalayanPaniya
PiramalaiKallarsPulliyarSakilli
TamilNaduScheduledCasteVelamas
AsurBonda
GadabaHo
JuangKhariaKhasi
MawasiSanthalSavaraNihaliGaroNaga
IndianJewsBurmese
CambodianDaiHan
Han−NChinaLahuMiaoNaxiSheTujiaYi
JapaneseDaur
HezhenOroqen
TuXibo
MongolaMongolians
AltaiansBuryatsDolgans
KetsKhakases
NganassansSelkupsShors
TuviniansNivkhsYakut
EvenkisEvens
YukaghirsKoryaksChukchis
EastGreenlandersWestGreenlanders
MayaPima
ColombianKaritiana
SuruiMelanesian
PapuanMA1
LoschbourBranaMotalaAjv58Gok2
IcemanStuttgart
Population
f3
Kostenki

58
Fig. S15 f3 outgroup maps of the form f3(Mbuti; Ancient, Modern) for MA1, Motala, and Stuttgart genomes, compared to non-African modern populations.
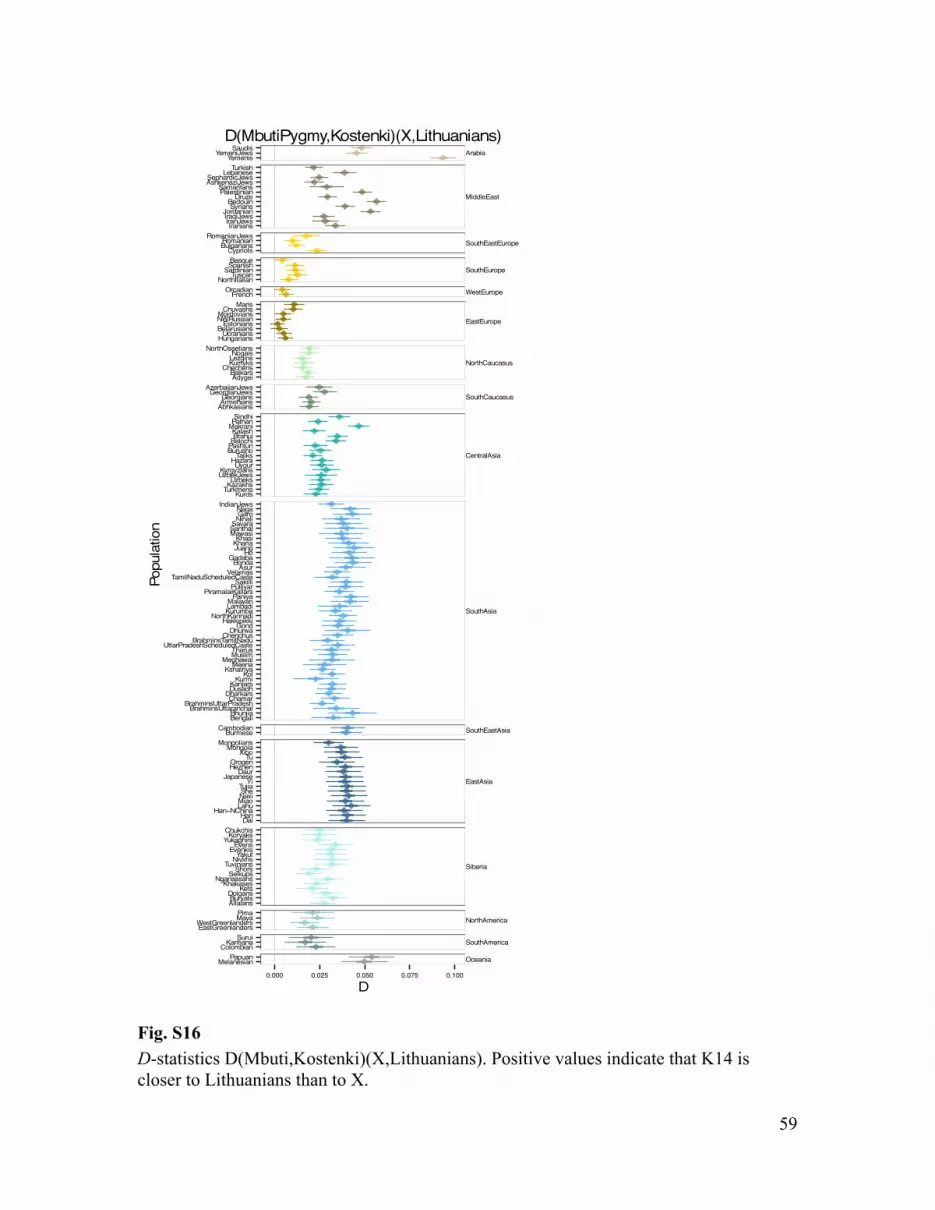
59
Fig. S16 D-statistics D(Mbuti,Kostenki)(X,Lithuanians). Positive values indicate that K14 is closer to Lithuanians than to X.
YemenisYemeniJewsSaudis
IraniansIranJewsIraqiJewsJordanianSyriansBedouinDruzePalestinianSamaritansAshkenaziJewsSephardicJews
LebaneseTurkish
CypriotsBulgariansRomanianRomanianJews
NorthItalianTuscanSardinianSpanishBasque
FrenchOrcadian
HungariansUcraniansBelarusiansEstoniansNWRussianMordoviansChuvashsMaris
AdygeiBalkarsChechensKumyksLezginsNogaisNorthOssetians
AbhkasiansArmeniansGeorgiansGeorgianJewsAzerbaijanJews
KurdsTurkmensKazakhsUzbeksUzbekJewsKyrgyziansUygurHazaraTajiksBurusho
PashtunBalochiBrahuiKalashMakraniPathanSindhi
BengaliBhunjiaBrahminsUttaranchalBrahminsUttarPradeshChamarDharkarsDusadhKanjarsKurmiKolKshatriyaMeenaMeghawalMuslimTharusUttarPradeshScheduledCaste
BrahminsTamilNaduChenchusDhurwaGondHakkipikkiNorthKannadiKurumbaLambadiMalayanPaniyaPiramalaiKallars
PulliyarSakilliTamilNaduScheduledCasteVelamasAsurBondaGadabaHoJuangKhariaKhasi
MawasiSanthalSavaraNihaliGaroNagaIndianJews
BurmeseCambodian
DaiHanHan−NChinaLahuMiaoNaxiSheTujiaYi
JapaneseDaurHezhenOroqenTuXiboMongolaMongolians
AltaiansBuryatsDolgansKetsKhakasesNganassansSelkupsShorsTuviniansNivkhsYakutEvenkisEvensYukaghirsKoryaksChukchis
EastGreenlandersWestGreenlandersMayaPima
ColombianKaritianaSurui
MelanesianPapuan
Arabia
MiddleEast
SouthEastEurope
SouthEurope
WestEurope
EastEurope
NorthCaucasus
SouthCaucasus
CentralAsia
SouthAsia
SouthEastAsia
EastAsia
Siberia
NorthAmerica
SouthAmerica
Oceania
0.000 0.025 0.050 0.075 0.100
D
Population
D(MbutiPygmy,Kostenki)(X,Lithuanians)

60
Fig. S17 Pairwise plot of “outgroup “ f3 statisitcs, for dataset filtered with PMD > 3 (x axis) compared to the full dataset (y axis).
abkady
a58
altarmasJasu
azJbalbao
bKe
bSA
bas
bed
bel
benbhu
biP
bonbrTbrUbrPbra
lbr
bul
bmaburbya
camchache
chnchkchucolcyp
daidaudha
dhudoldrzduseGl
egy
est
etJeth
evkeve
fre
gadgargeJgeo
gk2
gonhkkhanhaChaz
hezho
huniceinJirnirJiqJjap
jorjua
kalkan
karkazketkhs
khrkhakolkorkshkukkurkum
kbakyrlahlamleb
lezlit
losma1
makmal
mdk
mar
mawmaymeemeg
melmiamgamgl
mrd
mor
moJ
mot
moz
musnagnax
nganihnivnogitN
nkdnOs
ruNorc
oropalpanpap
paspatpimpiKpul
romroJ
saksam
san
snt
sar
sausav
selseJshe
shosin
spastusur
syrtajtSCthatutujturtkmtus
tuv
ucr
uSCuyguzJuzb
velwGl
xibyakyeJ
yem
yi
yor
yuk
0.1
0.2
0.1 0.2 0.3Kostenki.PMD
Kostenki
a
a
a
a
a
a
a
a
a
a
a
a
a
a
a
a
a
a
a
a
a
CentralAfricaWestAfricaEastAfricaNorthAfricaArabiaMiddleEastSouthEastEuropeSouthEuropeWestEuropeEastEuropeNorthCaucasusSouthCaucasusCentralAsiaSouthAsiaSouthEastAsiaEastAsiaSiberiaNorthAmericaSouthAmericaOceaniaAncient

61
Fig. S18 Contamination-corrected D-statistics of the form D(Mbuti Pygmy,K14;Sardinian, Lithuanian), for different levels of contamination.
0
0.02
0.04
0.06
0.08
0.1
0.12
0.14
0.16
0.18
0.2
0.22
0.24
0.26
0.28
0.3
0.32
0.34
0.36
0.38
0.4
0.42
0.44
0.46
0.48
0.5
−0.01 0.00 0.01
D
p(C
onta
min
atio
n) N
W R
ussi
an (H
GD
P008
84)
D(MbutiPygmy,Kostenki)(Sardinian,Lithuanian)
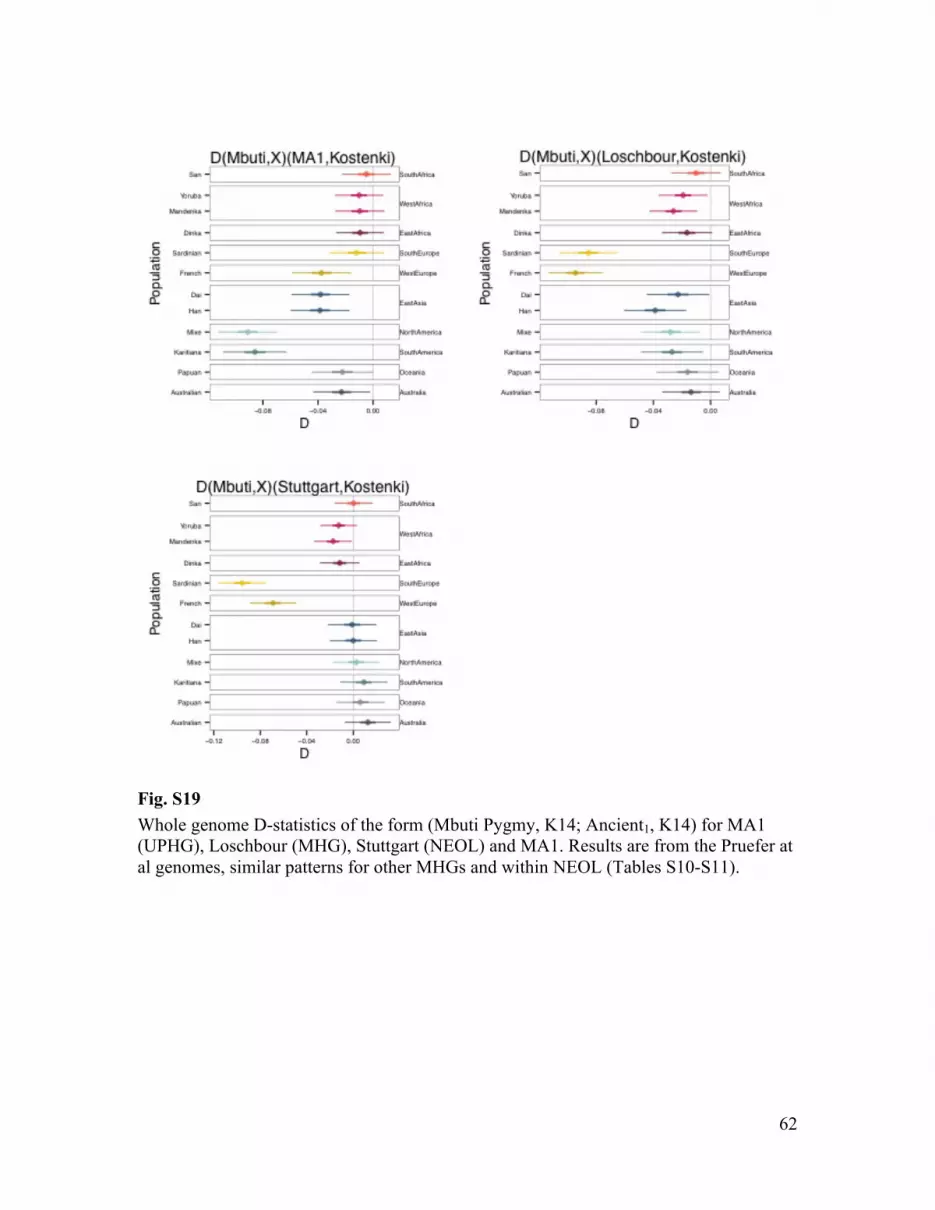
62
Fig. S19 Whole genome D-statistics of the form (Mbuti Pygmy, K14; Ancient1, K14) for MA1 (UPHG), Loschbour (MHG), Stuttgart (NEOL) and MA1. Results are from the Pruefer at al genomes, similar patterns for other MHGs and within NEOL (Tables S10-S11).

63
Fig. S20 ADMIXTURE PLOTS K= 2 to 15. Admixture was first run on modern individuals only, using an LD-pruned subset of SNPs that had data in each ancient individual (101,212 SNPs). Cluster membership of ancients was then inferred by optimizing the likelihood using the P matrix of ancestral allele frequency from the admixture runs (182). Plotted are a subset of key populations representing the inferred clusters

64
Fig. S21 PCA of K14 including a worldwide panel. PCAs where done using homozyogous reference panel (randomly sampled hets) combined with K14 with a sample allele for each position.
brPkshkshkshkshksh kshksh
kolkol kolkol
kolkolkol
kolkolkolkolkol kolkolkol
kolho
est
kankan
cha
chachachachachadusdusdusdusdusdusdusdusdus
abkabkabkabkabkabkabkabkabkabkabkabkabkabkabkabk
abkabkabkabk
alt
alt altaltalt alt altaltaltaltaltalt altalt
alt alt
alt armarmarmarmarm armarmarmarmarmarmarmarm
armarm
armarmarmarmarmarmarmarmarmarmarmarmarmarmarmarmarmarmarmarmasJasJ
asJ asJasJasJasJasJasJasJasJasJasJ asJasJasJasJasJ
azJazJazJazJbalbalbalbalbal
balbalbalbalbal balbalbalbalbalbalbalbal
bal belbelbelbelbelbelbelbelbel
brPbrPbrPbrP
bulbulbulbulbulbulbulbulbulbulbulbulbul
bmabmabma bmabmabmabmabmabma bmabmabma
bma
bmabma
byabyabyabyabyabyabyabyabyabyabyabyabyabyabyabyabyabya bya
chechecheche chechechechechechechechechechechechechechecheche
chnchnchn chn
chk
chk
chkchkchkchk
chk
chkchkchk
chk
chkchkchkchk
chuchu
chu
chuchuchuchuchuchuchuchuchuchuchuchu
chuchu cypcypcypcypcypcypcypcypcypcypcypcyp
pan
brPdusbrPdha
doldoldol
doldol
doldol
doldol doldoleGleGl
eGl
eGl
eGl
eGl
eGl eGleGl
eGl
estestestestestestestestestestestestestest
egy
egyegyegy
egyegy
egy
egy
egyegyegyegy
ethethethetheth
eth
eth
eth
etheth
eth
eth
etheth
etheth
ethetheth
etJ
etJetJetJetJ
etJetJetJetJetJ
etJetJ
eveeveeveeveeveeveeveeveeveeve evkevkevk evk evk
evkevkevkevkevkevk
evk
evk evkevkevk
est est
brP
kolkankankankankankancha
chachacha
gongargar gargar
geJgeJ
geJ
geJgeJgeJgeJgeJ
gon
gongon
dhadhadhadhadhadhadhadhadhadhadhakhs
khs
khs khskhs
khskhs khskhskhs
khskhskhs
khskhs
khs
khs
hazhazhaz
hazhaz brabrabrabrabrabra
bra
brabrabrabra
brabrabra
bra
brabrabra
bra
bra
bra
brabra
bra
brabaobao
bao
bao
bao
bao
baobaobaobaobao
baobao
bao
baobao
baobaobaobaobaobaobao
baohaz
hazhazhaz
hazhaz hazhazhazhaz
hazhazhaz haz hazhazhazhazhazhazhaz
haz makmak
mak
mak
makmak
mak
makmakmakmak
makmak
mak
mak
mak
makmak
makmakmak
makmakmak
sinsinsinsinsin
sin
sin
sinsinsin sinsinsinsinsinsinsin sinsinsinsin sinsin
patpatpatpatpatpatpatpatpatpatpatpatpat
patpatpatpat
patpat
patpatpat kalkalkalkalkalkalkalkalkalkalkalkalkalkalkalkalkalkalkalkalkalkalkal
bur burburburburburburburburburburburburburburburbur burburburburbur
burburbur
mbPmbPbiPbiPmbPbiPbiPbiPbiPbiPmbPmbPbiPbiPbiPmbPbiPbiPmbPbiP
biPmbP
biPmbPmbPbiP
mel
frefrefrefrefrefrefrefrefrefrefrefrefrefrefrefrefrefrefrefrefrefrefrefrefrefrefrefre
pappappappappap
pappappappappappappappappappappappap
drzdrzdrzdrzdrzdrzdrzdrzdrzdrzdrzdrz
drzdrzdrzdrzdrzdrz
drz
drzdrzdrzdrzdrzdrz
drzdrzdrzdrzdrzdrzdrzdrzdrzdrzdrz
drzdrz drzdrzdrzdrz
bedbed
bed
bed
bed
bedbedbedbed
bedbed
bed
bed
bedbedbedbedbed
bed
bedbed
bedbed
bedbedbed
bed
bed
bed
bed
bed
bedbedbed
bed
bed
bed
bedbed
bedbedbedbedbed
melmelmelmelmelmel
sarsarsarsarsarsarsarsarsarsar
palpalpalpalpal
pal
palpalpal
palpal
palpalpalpalpal
pal
palpalpalpalpalpalpal
bed
col
col
colcolcolcol
camcam camcam camcam camcam camcam
pal
pal
palpal
palpal
palpal
pal
palpalpalpalpalpal
pal
pal
palpal
pal
palpal
japjapjapjapjapjapjapjapjapjapjapjapjapjapjapjapjapjapjapjapjapjapjapjapjaphanhanhan
hanhanhanhanhanhanhanhanhanhan
melmel
japjap
orcorcorcorcorcorcorcorcorcorcorcorcorcorcorc
hanhanhanhanhanhanhanhanhanhanhanjap
sursursursursursursursur maymay maymay maymay may
maymay
may
maymay may
maymaymay
maymaymay
maymay
ruNruNruNruNruN ruNruNruNruNruNruNruNruNruNruNruNruNruNruNruNruNruNruNruNruN
mdkmdkmdkmdkmdkmdk
mdkmdkmdkmdkmdkmdkmdkmdk
yoryoryoryoryoryoryoryoryoryoryoryoryoryoryoryoryoryoryoryoryor
yakyakyakyak
yak
yakyakyak
yak
yakyakyakyak yakyak
yakyakyakyakyakyakyakyak yak
yakcol
hanhanhanhanhanhanhan
mbPmbPbiPbiP
san
bSAbSA
karkarkarkarkarkarkarkarkarkarkarkarkarkar
hanhanhan
mel
san
bSAbSAbSAbSAsan
pimpimpimpimpimpimpimpim pimpimpim pimpimpim
sarsarsarsarsarsarsarsarsarsarsarsarsarsarsarsarsarsar
mbPbiPbiPbiP
tujtujtujtujtujtujtujtujtujtuj
itNitNitNitNitNitNitNtustustustustustustustusitNitNitNitNitN
yiyiyiyiyiyiyiyiyiyimiamiamiamiamiamiamiamiamiamia
mdkmdkmdkmdk
oro oroorooroorooroorooro orodau daudaudaudaudaudaudaudaumgamgamga
mgamgamga
mgamgamgamgahezhezhez hezhezhezhezhez
xib
xibxibxibxibxibxibxibxib
mozmozmoz
mozmoz
mozmozmoz
moz
moz
moz
mozmozmozmozmozmozmozmoz
moz
moz
mozmozmozmozmozmoz
mdkmdkmdkmdk
haChaChaChaChaChaChaChaChaChaC
uyg uyguyg uyguyguyg
uyguyguyg uyg
daidaidaidaidaidaidaidaidaidailahlahlahlahlahlahlahlahsheshesheshesheshesheshesheshe
naxnaxnaxnaxnaxnaxnaxnaxtututu tututu tu
tutu tu
basbasbasbasbasbasbasbasbasbasbasbasbasbasbasbasbasbasbasbasbasbasbasbas
ady adyadyady adyadyadyady adyady adyadyadyadyadyady
ady
bKebKebKe
bKe
bKebKe
bKebKe
bKebKebKe
hkkhkkhkkhkk
hohohoho
hunhunhunhunhunhunhunhunhunhunhunhunhunhunhunhunhunhun
inJinJinJ inJinJinJinJinJ
irn
irnirnirn
irn
irn
irn
irn
irn
irnirnirn
irn
irnirn
irnirnirnirnirn
irJirJirJirJiqJiqJiqJiqJiqJiqJiqJiqJiqJiqJiqJ
jor
jor jorjorjorjorjorjor jor
jorjorjor jorjorjor
jorjorjorjorkazkaz kaz
kaz
kazkazkazkazkazkazkazkazkazkaz
kazkazkazkazketketketket
kha kha kha
kyr kyrkyrkyrkyrkyrkyr kyrkyr kyrkyrkyrkyrkyrkyr kyr
kyrkyrkyr nkd
nkdnkdnkdnkdnkdnkdnkd
nkd
korkorkorkorkorkorkorkorkorkor
kor
korkorkor
kor
kor
kor
kor
kukkuk kukkukkukkukkukkuk
kuk kukkukkukkukkuk
kbakbakbakba
kurkurkurkurkurkur
lebleb
lebleb
leb lebleb
lezlezlezlezlezlezlezlezlezlezlezlezlezlezlezlezlezlezlitlitlitlitlitlitlitlitlitlit
mar marmarmarmar marmarmarmarmarmarmar marmarmar
geogeogeogeogeogeogeogeogeogeogeogeo geogeogeogeogeogeogeo geo
mglmglmglmglmglmglmglmglmgl
mrd mrdmrdmrdmrdmrdmrdmrdmrdmrdmrdmrdmrdmrdmrd
mor
mormormor
mor
mor
mor
mormor
moJmoJmoJ
moJmoJmoJmoJmoJmoJmoJmoJ moJmoJ
moJ
moJ
musmusmusmusmus
nagnagnagnag
nganganganganga
nga
nga nganga nga
nga
nganga
nganga
niv
nivniv
nognognognognog nognognognog
nognog nognognognognog
nOsnOsnOsnOsnOsnOsnOsnOsnOsnOsnOsnOsnOsnOsnOs
bonbonbonbon
paspaspas paspas
piKpiKpiKpiKpiKpiKpiKpiK
panpanpanpulpulpulpulpul
romrom
rom
romromrom
rom
romromromromromromromromrom
roJroJ roJ
saksaksaksak
samsamsam
sausausausausau
sau
sausausausau
sau
sau
sausausausau
sau
sausausausel
selsel
sel
sel
sel sel
selsel
selselsel
sel
selselsel
sel
seJseJseJseJseJseJseJseJseJseJseJseJseJseJseJseJseJseJseJ
shoshoshosho
spaspaspaspaspaspa
spaspaspaspaspaspa
syr
syrsyrsyrsyr
syrsyrsyr
syrsyrsyr
syr
syr
syrsyr
syr
taj
tajtajtaj taj
taj tajtajtajtajtaj
tajtaj taj
tajtaj
tajtajtajtaj
turtur turtur turturturtur turtur
tur turturturturturturtur
tur
tkmtkmtkm
tkmtkmtkmtkm
tkmtkmtkm
tkmtkm tkm
tkmtkmtkmtkmtkmtkm
tuvtuv tuv tuvtuvtuv tuvtuv
tuvtuvtuv tuvtuvtuvtuvtuv
ucrucrucrucrucrucrucrucrucrucrucrucrucrucrucrucrucrucrucrucr
uzbuzb
uzbuzbuzb uzbuzbuzb uzbuzb
uzb
uzbuzbuzbuzb
uzbuzbuzbuzbuzb uzbuzbuzb uzb
uzJ uzJ
velvel velvelvelvelvelvelvelvelwGl wGl
wGlwGlwGl
wGlwGl
wGlwGl
wGl
yak
yem
yem
yemyem
yem
yem
yemyemyeJyeJ
yeJyeJyeJyeJyeJyeJyeJyeJyeJyeJyeJyeJyeJ
yukyuk yuk
yuk
yuk
yuk
yukyukyuk
uSCuSCuSC
kos0.000
0.025
0.050
0.075
0.100
−0.04 −0.02 0.00 0.02PC1
PC2
RegionSouthAfricaCentralAfricaWestAfricaEastAfricaNorthAfricaArabiaMiddleEastSouthEastEuropeSouthEuropeWestEuropeEastEurope
NorthCaucasusSouthCaucasusCentralAsiaSouthAsiaSouthEastAsiaEastAsiaSiberiaNorthAmericaSouthAmericaOceania
Kostenki / Russia (450,206 SNPs)

65
Fig. S22 Procrustes PCA of all ancient genomes on modern non-African populations. Bold letters indicate population average PC. Individual PCAs where done using homozyogous reference panel (randomly sampled hets), then combined across ancient individuals using procrustes.
brPkshkshkshkshksh
kshksh
kolkol kol
kolkolkol
kol
kol
kolkol
kolkol kolkolkolkol
ho
est
kankan
chachachachacha
cha dusdusdusdusdusdusdusdusdus
abkabkabkabkabkabkabkabkabkabkabkabkabkabkabkabkabkabkabk
abkalt
alt
altalt
alt altalt
altaltaltaltalt altalt
alt alt
alt
armarmarmarm
armarmarm
armarmarmarm
arm
armarmarmarm
arm
armarmarmarmarmarmarmarmarmarmarmarmarmarmarmarmarmarmasJasJ
asJ asJasJasJasJasJasJasJasJasJasJ asJasJasJ
asJasJ
azJazJazJazJbalbalbalbalbal
balbalbalbalbal balbalbalbalbalbalbalbalbal
belbelbelbelbelbelbelbelbel
brPbrPbrPbrP
bulbulbulbulbulbulbulbul bulbulbulbulbul
bmabmabma bmabmabmabmabmabma
bmabmabma
bma
bmabma
byabyabyabyabyabyabyabyabyabya
byabyabyabyabyabyabyabya bya
chechecheche cheche
chechechechechechechechechechechechecheche
chnchnchnchn
chk
chk
chkchk
chk
chk
chk
chk
chkchk
chk
chkchkchkchk
chuchu chuchuchu chu
chuchu chuchuchuchuchuchuchu chuchu
cypcypcypcypcypcypcypcypcypcypcypcyp
pan
brP
dusbrPdha
dol doldoldol dol doldol
dol dol doldol
eGleGl
eGl
eGl
eGl
eGl
eGleGl
eGl
eGl
estestestestestestestestestestestest estest
eveeveeveeveeveeveeveeveeveeve
evkevkevkevk evk
evkevk
evkevkevkevk
evk
evk evkevkevk
est est
brP
kol
kankankankankankancha
chachacha
gon
gargar gargar
geJgeJgeJgeJgeJgeJgeJgeJ
gon
gongon
dhadhadhadhadhadhadhadhadhadhadha
khs
khs
khs khs
khskhs
khskhskhs
khskhskhs
khskhs khskhs
khs
hazhaz haz hazhaz brabrabra brabrabra
bra
brabra
brabra
brabrabrabrabrabrabrabrabrabrabrabrabrabrabao
baobao baobao
baobaobaobaobao
bao
baobaobaobaobao
baobaobaobaobaobaobaobao
haz hazhaz
haz hazhaz hazhazhaz hazhaz hazhazhaz hazhaz
hazhazhaz
hazhaz haz
makmakmakmak
makmakmakmakmakmak makmakmakmakmak mak
makmakmakmakmak
makmakmak
sinsinsinsinsinsinsinsinsinsinsinsinsinsinsinsin
sin sinsinsin
sinsinsin
patpatpat patpatpatpatpatpatpatpat
patpat
patpat
patpatpat
pat
patpatpat kalkalkalkalkalkalkalkalkalkalkalkalkalkalkalkalkalkalkalkal
kalkalkalburburburburburburburburburbur
bur
burburburburbur
burburburburburburburburbur
mel
frefrefrefrefrefrefrefrefrefrefrefrefrefre
frefrefrefrefrefrefrefrefrefrefrefrefrefre
pappappappap
pap
pappappappappappappappappappappappap
drzdrzdrzdrzdrzdrzdrzdrzdrzdrzdrz
drzdrzdrzdrzdrzdrzdrzdrzdrzdrzdrzdrzdrzdrzdrzdrzdrzdrzdrzdrzdrzdrzdrzdrzdrzdrzdrz drzdrzdrzdrz
bedbedbedbedbed bed
bedbedbed
bedbedbedbedbedbedbedbedbedbedbedbedbedbedbedbedbedbedbedbedbedbed bedbedbedbedbedbed
bedbedbedbedbedbedbed
melmelmelmelmelmel
sarsarsarsarsarsarsarsarsarsar
palpalpalpalpalpalpalpalpalpalpal palpalpalpalpal
palpalpalpalpalpalpalpalbed
col
col
colcolcolcol
camcam camcam camcam camcam camcam
palpalpalpalpalpalpalpalpal
palpalpalpalpalpalpalpalpalpalpalpalpal
japjapjapjapjapjapjapjapjapjapjapjapjapjapjapjapjapjapjapjapjapjapjapjapjap
hanhanhanhan
hanhanhanhanhanhanhanhan
han
melmel
japjap
orcorc
orcorcorcorcorcorcorcorcorcorcorcorcorc
hanhanhanhanhanhanhanhanhanhanhanjap
sursursursursursur
sursur
maymay maymay
maymay
may
may
maymaymaymay
may may
may
may
maymay
may
may
may
ruNruNruNruNruN ruNruNruNruNruNruNruNruNruNruNruNruNruNruNruN ruNruNruNruNruN
yakyak yakyakyak
yakyakyak
yak
yakyakyakyak yakyak
yakyak
yakyakyakyak yakyak yak yak
col
hanhanhan hanhanhanhan
karkarkarkarkarkar
kar
karkarkarkarkarkar
kar
hanhanhan
mel
pimpim
pimpimpim pim
pimpim
pim
pimpim
pimpimpim
sarsarsarsarsarsarsarsarsarsarsarsarsarsarsarsarsarsar
tujtujtujtujtujtujtujtujtujtuj
itNitNitNitNitNitNitNtustustustustustustustusitNitNitNitNitN
yiyi yiyiyiyiyiyiyiyimiamiamiamiamiamiamiamiamiamia
oro
orooroorooroorooro
oro
orodau daudaudaudaudaudaudaudaumgamgamga
mga
mgamga
mgamga
mgamgahez
hez
hez
hezhez
hez
hezhez xib
xibxibxib xibxibxibxibxibhaChaChaChaChaChaChaChaChaChaC
uyg uyguyguyguyguyg uyguyguyg uyg
daidaidaidaidaidaidaidaidaidailahlahlahlahlahlahlahlahsheshesheshesheshe
sheshesheshenaxnaxnaxnaxnaxnaxnaxnax
tututu tututu tututu tu
basbasbas
basbasbasbasbasbasbasbasbasbasbasbasbasbasbasbasbasbasbasbasbas
ady adyadyady adyadyadyady
adyady adyadyadyadyadyadyady
hkkhkkhkkhkk
hohohoho
hunhunhunhunhunhunhunhunhunhunhunhunhunhunhunhunhunhun
inJinJinJ inJinJinJinJinJ
irn
irnirnirnirnirnirn
irnirnirnirnirn irnirn
irnirnirnirnirnirn irJirJirJirJiqJiqJiqJiqJiqJiqJiqJiqJiqJiqJiqJjorjor
jorjorjorjorjorjor jorjorjorjor jorjorjorjorjorjorjorkazkaz kazkaz
kazkazkazkazkaz kazkazkazkazkazkaz
kazkazkaz
ketketketket
kha kha kha
kyr kyrkyrkyrkyrkyrkyr kyrkyr kyrkyrkyrkyrkyrkyr kyrkyr kyrkyr
nkdnkdnkdnkdnkdnkdnkd
nkdnkd
kor
korkorkorkorkorkor
kor
korkor
kor
korkor
korkor
kor
kor
kor
kukkuk kukkukkukkukkuk kukkuk kukkukkuk
kukkuk
kbakbakbakba
kurkurkurkurkurkurlebleblebleb
leb lebleb
lezlezlezlezlezlezlezlezlezlezlezlezlezlezlezlezlezlez
litlitlitlitlitlitlitlitlitlit
mar marmarmarmar marmarmarmarmarmarmar marmarmar
geogeogeogeogeogeogeogeogeogeogeogeogeo
geogeogeogeogeo
geogeo
mglmglmglmglmglmglmgl
mglmgl
mrd mrdmrdmrdmrdmrdmrdmrdmrdmrdmrdmrdmrdmrdmrd
musmusmus
musmusnagnagnagnag
nganganga
nga
nganga
nga nganganganga
nga nganga nga
niv
nivniv
nognognognog nog nog
nognognognognog nognognognog
nog nOsnOsnOsnOsnOsnOsnOsnOsnOsnOsnOsnOsnOsnOsnOs
bonbonbonbon
pas paspas paspas
piKpiKpiKpiKpiKpiK
piKpiK
panpanpanpulpulpulpulpul
romrom
rom
romromrom
rom
romromromromromromromromrom
roJroJ roJ
saksaksak
sak
samsamsam
selsel sel
selselsel sel
selsel
sel selsel selselsel
selsel
seJseJseJseJseJseJseJseJseJseJseJ
seJseJseJseJseJseJseJseJ
shoshoshosho
spaspaspaspaspaspaspaspaspaspaspaspa
syrsyrsyrsyr
syrsyrsyrsyr syrsyr syr
syr
syrsyrsyrsyr
taj
taj tajtaj taj
tajtajtajtajtajtaj
tajtaj taj
tajtajtajtaj tajtaj tur
tur turturturturturtur turturtur turturturtur turturtur
turtkm
tkmtkmtkm tkmtkmtkmtkmtkm
tkm tkmtkm tkmtkmtkmtkmtkmtkmtkmtuvtuv
tuvtuvtuv
tuv
tuvtuvtuvtuvtuvtuvtuv
tuvtuvtuv
ucrucrucrucrucrucrucrucr
ucrucrucrucrucrucrucrucrucr
ucr ucrucr
uzbuzbuzbuzbuzb
uzbuzbuzb
uzbuzbuzb uzbuzbuzb uzb
uzb uzbuzbuzbuzb uzb
uzbuzb uzb uzJ uzJ
velvel velvelvelvelvelvelvelvel
wGlwGl
wGlwGlwGl
wGlwGl
wGlwGl
wGl
yak
yukyuk yukyuk
yukyukyuk
yuk
yuk
uSC uSCuSC
irn irJiqJjorsyrbeddrzpalsamasJseJlebtur cypbulromroJitNtussarspabasfreorchunucrbelestlitruNmrdchumar
adybalchekukleznog nOsabkarmgeogeJazJkurtkmkaz uzb uzJkyr uyghaztaj
bur pasbaobrakalmakpatsinbrPcha
dhaduskankolkshmusuSCchngonhkknkdkba
panpiK
pul sakvel
bon hokhagarnag
inJbmacamdaihanhaClahmianaxshetujyi
japdauhezoro
tuxibmga
mglalt
byadol
ketkhsnga
selsho
tuvnivyakevkeveyuk
korchk
eGlwGl
maypimcol
karsur
melpap
a58/Sweden
gk2/Sweden
ma1/Russia
lbr/Spain
ice/Italykos/Russia
los/Luxemburg
stu/Germany
mot/Sweden
−0.05
0.00
0.05
0.10
−0.04 −0.02 0.00 0.02PC1
PC2
RegionMiddleEastSouthEastEuropeSouthEuropeWestEuropeEastEuropeNorthCaucasusSouthCaucasusCentralAsiaSouthAsiaSouthEastAsiaEastAsiaSiberiaNorthAmericaSouthAmericaOceania
EurasiaAmeOce

66
Fig. S23 Procrustes PCA of all ancient genomes on modern populations from Europe, Middle East and Caucasus. Bold letters indicate population average PC.
est
abkabk abkabk
abkabkabkabkabk
abkabkabkabkabkabk
abkabk
abkabk
abkarm
arm
armarm
armarm
armarm
arm
arm
arm
arm
arm
armarm
arm
arm
armarmarm
armarm
arm
armarmarm
armarm
arm
armarmarm
arm
arm
arm
asJ
asJasJ
asJ
asJasJasJ
asJ
asJ
asJ asJasJ
asJ
asJasJ
asJ
asJ
asJ
azJazJazJazJ
balbalbal
bal
bal
balbal
bal
bal
balbalbal
bal
balbalbalbal
bal
bal
bel belbel
bel
bel
bel
belbelbelbulbulbulbulbul
bul
bulbul
bul
bulbul
bulbul
checheche
che
che
che
cheche
cheche
che
chechechechechechecheche
che
chuchu
chu
chu
chu
chu
chu
chu
chu
chuchu chuchuchuchu
chu
chu
cypcypcyp
cyp
cypcypcypcypcyp cypcypcyp
estest
estestest
estest
estestestest
est
est
est
est
est
geJgeJ
geJ
geJgeJgeJ
geJgeJ
frefrefrefre fre
fre
frefre
frefrefre fre
frefre
frefrefre
frefrefre
fre
fre
fre frefre
frefre
fre
drzdrzdrzdrzdrzdrzdrzdrzdrz drzdrz
drz
drzdrzdrzdrzdrz
drzdrzdrzdrzdrzdrzdrzdrz
drzdrz
drzdrz
drzdrz
drzdrzdrzdrzdrz
drz
drzdrz
drzdrz drz
bed bed
bed
bed
bed
bed
bed
bedbed
bedbed
bed
bed
bed
bedbed
bedbed
bed
bed
bed
bedbed
bedbedbed
bed
bed
bedbed
bed
bed
bed
bed
bedbed
bed
bed
bedbed
bedbedbed
bed
sarsar
sarsarsarsarsar
sarsarsar
pal pal
palpalpal
palpalpalpal
pal
pal
palpal
palpalpal
pal
palpalpal
pal
palpal
pal
bed
palpalpalpalpalpalpalpal
palpalpal
pal
palpalpalpal
palpal
palpal
pal
pal
orcorc
orcorc
orc
orcorc
orcorc
orcorcorc
orcorc
orc
ruNruNruNruNruN
ruN
ruNruN
ruNruNruNruN
ruNruN
ruNruNruNruNruN
ruN
ruN
ruN
ruNruNruN
sarsar
sar
sarsar
sarsarsarsarsarsarsarsarsarsar
sarsarsar
itNitN
itNitNitNitNitNtus
tustus
tustus
tus
tustus
itNitN
itNitN
itN
basbasbas
basbasbasbas
basbas
bas
basbas
basbas
basbasbas
basbasbasbasbasbasbas
ady
ady
ady
adyady
ady
ady
ady
ady
ady
adyadyadyady
adyady
ady
hunhunhun
hunhun hunhunhun
hunhunhun
hunhun
hunhunhun
hun
hun
irn
irnirnirnirn
irn
irn
irnirn
irn
irnirn
irn
irnirn irnirnirnirn
irn
irJirJirJirJ
iqJiqJiqJiqJiqJ
iqJ
iqJ
iqJ
iqJiqJiqJ
jorjor
jorjor
jorjor
jor jor
jorjor jor
jor
jor
jor jorjor
jorjorjor
kuk
kukkukkukkuk
kukkuk
kuk
kukkukkuk
kuk kuk
kuk
lebleblebleb
leb
leb
leb
lez
lezlez
lezlez
lezlezlezlezlezlez
lezlezlezlez
lez
lez
lez
litlit
litlitlit
lit
litlitlitlit
marmarmarmarmar
marmar
mar
mar
marmar
mar
marmar
mar
geogeogeogeo
geo
geogeogeogeo
geo
geogeo
geo
geo
geo geogeogeo
geo
geo
mrd
mrd
mrdmrdmrdmrd
mrd
mrdmrdmrd
mrd
mrdmrdmrd
mrd
nog
nog
nog
nog
nog
nog
nog
nognog
nog
nognog
nognog
nog
nog
nOsnOsnOs
nOsnOsnOsnOs
nOs
nOsnOs
nOsnOsnOsnOs
nOs
rom
rom
rom
romromrom
rom
rom
romromromrom
romromrom rom
roJ
roJ
roJ
samsam
samseJseJseJ
seJseJ
seJ
seJseJseJseJ
seJ
seJseJ
seJ seJ
seJ
seJseJseJ
spaspaspaspaspaspa
spa
spa spaspaspa
spa
syr
syrsyrsyr
syrsyrsyrsyr
syr
syrsyrsyr
syrsyr
syr
syr
turtur
tur tur
turturtur
tur
turtur
turtur
tur
turturtur
tur
tur
tur
ucrucr
ucrucr
ucr
ucrucr
ucr
ucrucr
ucr
ucrucr
ucr
ucr
ucrucr
ucr
ucr
ucr
irn
irJiqJ
jorsyr
bed
drzpalsam
asJseJ
leb
tur
cypbulrom
roJ
itNtus
sar
spa
bas
freorc
hunucrbelest
lit
ruNmrd
chu
mar
adybalchekuklez
nog
nOsabk
arm
geo
geJazJ
a58/Sweden
gk2/Sweden
ma1/Russia
lbr/Spainice/Italy
kos/Russia
los/Luxemburg
stu/Germany
mot/Sweden
−0.10
−0.05
0.00
0.05
0.10
−0.05 0.00 0.05 0.10PC1
PC2
RegionMiddleEastSouthEastEuropeSouthEuropeWestEuropeEastEuropeNorthCaucasusSouthCaucasus
meEurCaucasus

67
Fig. S24 Treemix on Prufer et al genomes. The first two migration edges were incorporated as known migrations in the tree building.
Drift parameter
0.00 0.05 0.10 0.15
Mandenka
IcemanGok2
SanMbutiPygmy
Motala
Loschbour
MA1
Ajv58
Brana
Mixe
Yoruba
French
Denisova
Papuan
AltaiNea
Mezmaiskaya
Dai
Kostenki
Sardinian
Han
Dinka
Stuttgart
chimp
Australian
Karitiana10 s.e.
0
0.5
Migrationweight
chimp
chim
p
San
San
MbutiPygmy
Mbu
tiPyg
my
Mandenka
Man
denk
a
Yoruba
Yoru
ba
Dinka
Din
ka
Sardinian
Sard
inia
n
French
Fren
ch
Han
Han
Dai
Dai
Mixe
Mixe
Karitiana
Karit
iana
Papuan
Papu
an
Australian
Aust
ralia
n
Kostenki
Kost
enki
MA1
MA1
Loschbour
Losc
hbou
r
Brana
Bran
a
Motala
Mot
ala
Ajv58
Ajv5
8
Gok2
Gok
2
Iceman
Icem
an
Stuttgart
Stut
tgar
t
Mezmaiskaya
Mez
mai
skay
a
AltaiNea
Alta
iNea
Denisova
Den
isov
a
−14.9 SE
14.9 SE
m = 0 , 99.56 % variance explained
Drift parameter
0.00 0.05 0.10 0.15
chimpSan
Mezmaiskaya
MA1
Mandenka
Stuttgart
YorubaDinka
Motala
Loschbour
Mixe
Kostenki
Gok2
Dai
Sardinian
AltaiNea
Iceman
BranaAjv58
Han
Denisova
Papuan
French
MbutiPygmy
AustralianKaritiana
10 s.e.
0
0.5
Migrationweight
chimp
chim
p
San
San
MbutiPygmy
Mbu
tiPyg
my
Mandenka
Man
denk
a
Yoruba
Yoru
ba
Dinka
Din
ka
Sardinian
Sard
inia
n
French
Fren
ch
Han
Han
Dai
Dai
Mixe
Mixe
Karitiana
Karit
iana
Papuan
Papu
an
Australian
Aust
ralia
n
Kostenki
Kost
enki
MA1
MA1
Loschbour
Losc
hbou
r
Brana
Bran
a
Motala
Mot
ala
Ajv58
Ajv5
8
Gok2
Gok
2
Iceman
Icem
an
Stuttgart
Stut
tgar
t
Mezmaiskaya
Mez
mai
skay
a
AltaiNea
Alta
iNea
Denisova
Den
isov
a
−6.7 SE
6.7 SE
m = 2 , 99.84 % variance explained
Drift parameter
0.00 0.05 0.10 0.15
French
Han
Iceman
MandenkaMbutiPygmy
Loschbour
AltaiNea
Dai
Yoruba
Brana
chimp
Papuan
Dinka
Stuttgart
Ajv58
MA1
Mixe
Sardinian
San
Denisova
Mezmaiskaya
Kostenki
Motala
Gok2
Australian
Karitiana
10 s.e.
0
0.5
Migrationweight
chimp
chim
p
San
San
MbutiPygmy
Mbu
tiPyg
my
Mandenka
Man
denk
a
Yoruba
Yoru
ba
Dinka
Din
ka
Sardinian
Sard
inia
n
French
Fren
ch
Han
Han
Dai
Dai
Mixe
Mixe
Karitiana
Karit
iana
Papuan
Papu
an
Australian
Aust
ralia
n
Kostenki
Kost
enki
MA1
MA1
Loschbour
Losc
hbou
r
Brana
Bran
a
Motala
Mot
ala
Ajv58
Ajv5
8
Gok2
Gok
2
Iceman
Icem
an
Stuttgart
Stut
tgar
t
Mezmaiskaya
Mez
mai
skay
a
AltaiNea
Alta
iNea
Denisova
Den
isov
a
−6.4 SE
6.4 SE
m = 4 , 99.87 % variance explained

68
Fig. S25 Treemix on Raghavan et al genomes. The first two migration edges were incorporated as known migrations in the tree building.
Drift parameter
0.00 0.05 0.10 0.15
Indian
Dai
Sardinian
San
MA1
Denisova
Han
Motala
Brana
French
chimp
Yoruba
Loschbour
Tajik
Avar
Iceman
Mari
Mandenka
Ajv58
Dinka
Gok2
Kostenki
AltaiNea
Stuttgart
MbutiPygmy
Mezmaiskaya
KaritianaPapuan
10 s.e.
0
0.5
Migrationweight
chimp
chim
p
San
San
MbutiPygmy
Mbu
tiPyg
my
Mandenka
Man
denk
a
Yoruba
Yoru
ba
Dinka
Din
ka
Sardinian
Sard
inia
n
French
Fren
ch
Mari
Mar
i
Avar
Avar
Tajik
Tajik
Indian
Indi
an
Han
Han
Dai
Dai
Karitiana
Karit
iana
Papuan
Papu
an
Kostenki
Kost
enki
MA1
MA1
Loschbour
Losc
hbou
r
Brana
Bran
a
Motala
Mot
ala
Ajv58
Ajv5
8
Gok2
Gok
2
Iceman
Icem
an
Stuttgart
Stut
tgar
t
Mezmaiskaya
Mez
mai
skay
a
AltaiNea
Alta
iNea
Denisova
Den
isov
a
−8.5 SE
8.5 SE
m = 0 , 99.63 % variance explained
Drift parameter
0.00 0.05 0.10 0.15
Stuttgart
Yoruba
Han
Tajik
Dai
Gok2
Mezmaiskaya
San
IcemanSardinian
Denisova
Indian
French
MbutiPygmy
Mandenka
Ajv58
Motala
Brana
Mari
chimp
Kostenki
Dinka
MA1
Loschbour
AltaiNea
Avar
Papuan
Karitiana
10 s.e.
0
0.5
Migrationweight
chimp
chim
p
San
San
MbutiPygmy
Mbu
tiPyg
my
Mandenka
Man
denk
a
Yoruba
Yoru
ba
Dinka
Din
ka
Sardinian
Sard
inia
n
French
Fren
ch
Mari
Mar
i
Avar
Avar
Tajik
Tajik
Indian
Indi
an
Han
Han
Dai
Dai
Karitiana
Karit
iana
Papuan
Papu
an
Kostenki
Kost
enki
MA1
MA1
Loschbour
Losc
hbou
r
Brana
Bran
a
Motala
Mot
ala
Ajv58
Ajv5
8
Gok2
Gok
2
Iceman
Icem
an
Stuttgart
Stut
tgar
t
Mezmaiskaya
Mez
mai
skay
a
AltaiNea
Alta
iNea
Denisova
Den
isov
a
−4.4 SE
4.4 SE
m = 2 , 99.75 % variance explained
Drift parameter
0.00 0.05 0.10 0.15
Mezmaiskaya
Sardinian
chimp
MbutiPygmy
Brana
Ajv58
Han
French
Mandenka
Indian
MA1
Tajik
Loschbour
San
Iceman
Motala
Mari
Denisova
Yoruba
Avar
Kostenki
AltaiNea
Gok2
Dai
Stuttgart
DinkaKaritiana
Papuan
10 s.e.
0
0.5
Migrationweight
chimp
chim
p
San
San
MbutiPygmy
Mbu
tiPyg
my
Mandenka
Man
denk
a
Yoruba
Yoru
ba
Dinka
Din
ka
Sardinian
Sard
inia
n
French
Fren
ch
Mari
Mar
i
Avar
Avar
Tajik
Tajik
Indian
Indi
an
Han
Han
Dai
Dai
Karitiana
Karit
iana
Papuan
Papu
an
Kostenki
Kost
enki
MA1
MA1
Loschbour
Losc
hbou
r
Brana
Bran
a
Motala
Mot
ala
Ajv58
Ajv5
8
Gok2
Gok
2
Iceman
Icem
an
Stuttgart
Stut
tgar
t
Mezmaiskaya
Mez
mai
skay
a
AltaiNea
Alta
iNea
Denisova
Den
isov
a
−4.4 SE
4.4 SE
m = 4 , 99.79 % variance explained
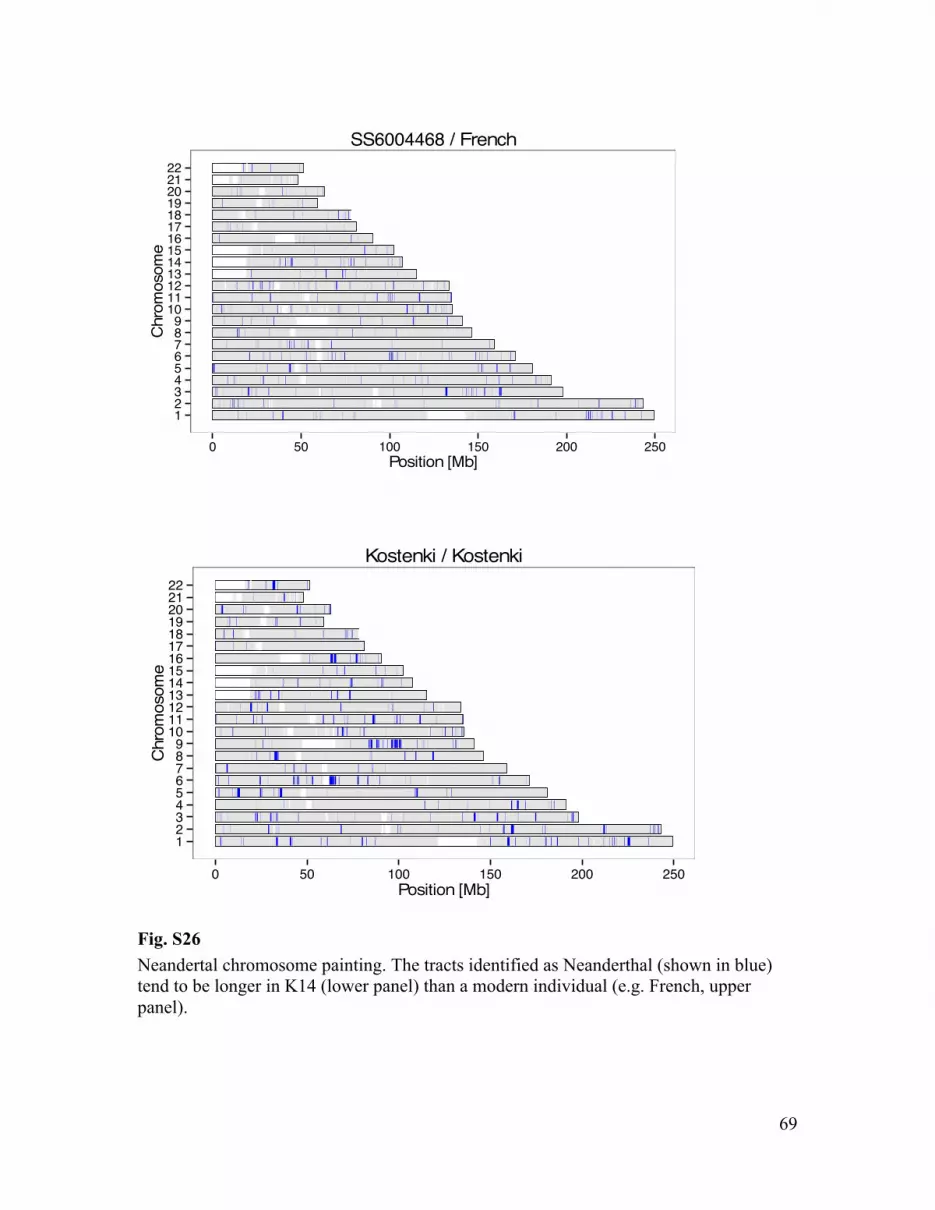
69
Fig. S26 Neandertal chromosome painting. The tracts identified as Neanderthal (shown in blue) tend to be longer in K14 (lower panel) than a modern individual (e.g. French, upper panel).
123456789
10111213141516171819202122
0 50 100 150 200 250Position [Mb]
Chr
omos
ome
SS6004468 / French
123456789
10111213141516171819202122
0 50 100 150 200 250Position [Mb]
Chr
omos
ome
Kostenki / Kostenki
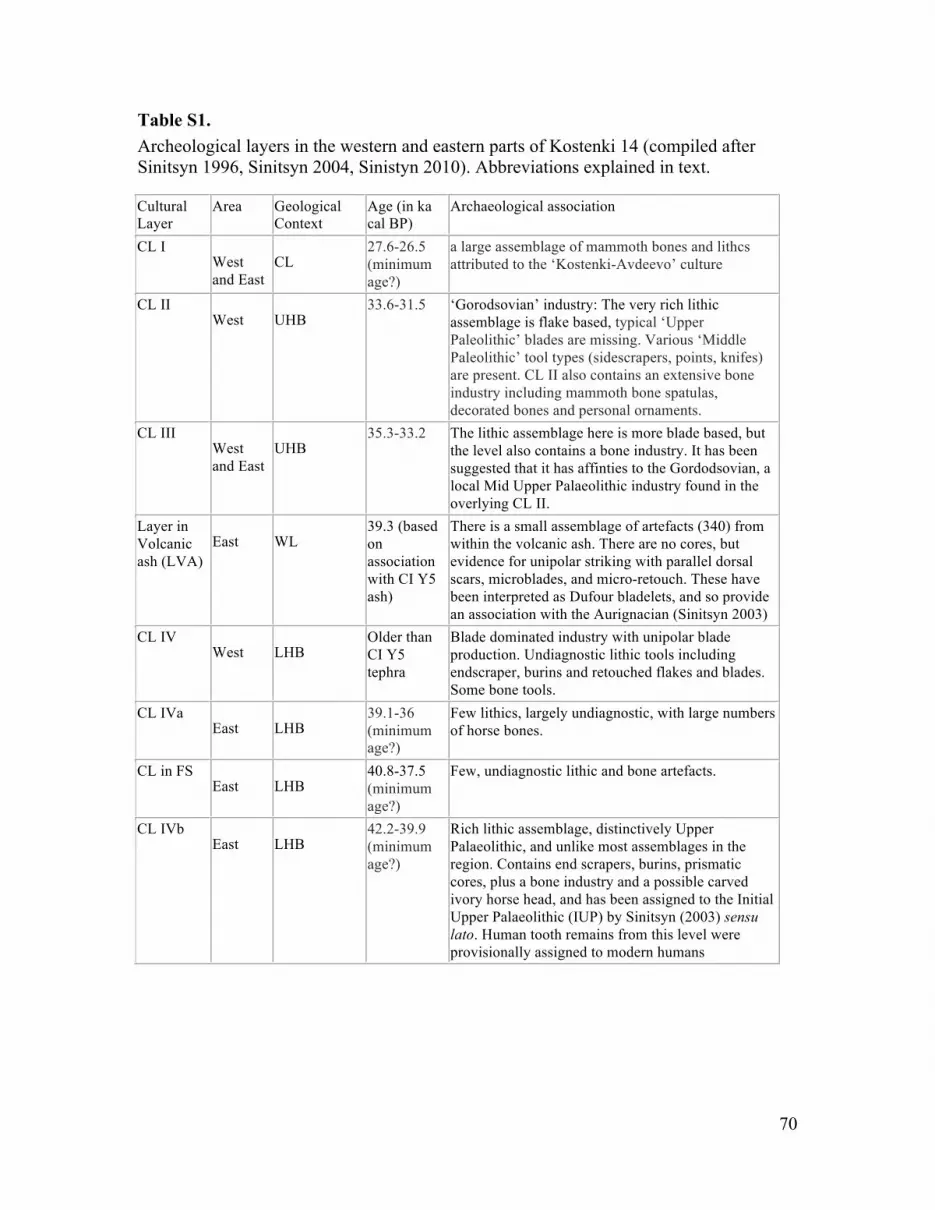
70
Table S1. Archeological layers in the western and eastern parts of Kostenki 14 (compiled after Sinitsyn 1996, Sinitsyn 2004, Sinistyn 2010). Abbreviations explained in text. Cultural Layer
Area Geological Context
Age (in ka cal BP)
Archaeological association
CL I West and East
CL 27.6-26.5 (minimum age?)
a large assemblage of mammoth bones and lithcs attributed to the ‘Kostenki-Avdeevo’ culture
CL II West UHB
33.6-31.5 ‘Gorodsovian’ industry: The very rich lithic assemblage is flake based, typical ‘Upper Paleolithic’ blades are missing. Various ‘Middle Paleolithic’ tool types (sidescrapers, points, knifes) are present. CL II also contains an extensive bone industry including mammoth bone spatulas, decorated bones and personal ornaments.
CL III West and East
UHB 35.3-33.2 The lithic assemblage here is more blade based, but
the level also contains a bone industry. It has been suggested that it has affinties to the Gordodsovian, a local Mid Upper Palaeolithic industry found in the overlying CL II.
Layer in Volcanic ash (LVA)
East WL 39.3 (based on association with CI Y5 ash)
There is a small assemblage of artefacts (340) from within the volcanic ash. There are no cores, but evidence for unipolar striking with parallel dorsal scars, microblades, and micro-retouch. These have been interpreted as Dufour bladelets, and so provide an association with the Aurignacian (Sinitsyn 2003)
CL IV West LHB
Older than CI Y5 tephra
Blade dominated industry with unipolar blade production. Undiagnostic lithic tools including endscraper, burins and retouched flakes and blades. Some bone tools.
CL IVa East LHB
39.1-36 (minimum age?)
Few lithics, largely undiagnostic, with large numbers of horse bones.
CL in FS East LHB
40.8-37.5 (minimum age?)
Few, undiagnostic lithic and bone artefacts.
CL IVb East LHB
42.2-39.9 (minimum age?)
Rich lithic assemblage, distinctively Upper Palaeolithic, and unlike most assemblages in the region. Contains end scrapers, burins, prismatic cores, plus a bone industry and a possible carved ivory horse head, and has been assigned to the Initial Upper Palaeolithic (IUP) by Sinitsyn (2003) sensu lato. Human tooth remains from this level were provisionally assigned to modern humans

71
Table S2. DNA extracts and summary statistics per library. P: silica pellets in solution approach (132).C: silica column-based approach (Dabney et al. 2013). USER: USER treated library (+). MBD: library enriched for methylated cytosines (+). %Endo: proportion of reads generated mapping uniquely against the human reference genome hg19 and passing quality filters. Cov.(X): average fold depth-of-coverage. The DNA libraries that have been selected for performing all downstream analyses based on contamination levels and error rates are indicated in bold. See details in SOM3-6.
Extraction method Extract # USER MBD %Endo. Cov.(X) Length
All NA NA NA NA 1.58% 2.84542 50.3
K14_10c_ACAGAG_USER P 1 + -‐ 0.98% 0.00552 50.2
K14_10c_AGTGAG_USER P 1 + -‐ 0.70% 0.03294 51.9
K14_10c_CTCTGC_USER P 1 + -‐ 0.99% 0.00214 50.7
K14_10c_GAGTAG_USER P 1 + -‐ 0.73% 0.03553 51.3
K14_10c_GCTACT_USER P 1 + -‐ 1.04% 0.00248 51.1
K14_10c_TAGCTG_USER P 1 + -‐ 0.81% 0.02288 50.6
K14_14c_ACTGCG_USER P 1 + -‐ 0.67% 0.03956 51.5
K14_14c_CAGCAC_USER P 1 + -‐ 0.77% 0.03236 51.3
K14_14c_CGTAGT_USER P 1 + -‐ 0.79% 0.02952 50.9
K14_14c_GTCGTC_USER P 1 + -‐ 0.73% 0.02592 51.0
K14_14c_TACGAG_USER P 1 + -‐ 0.73% 0.03290 51.4
K14_14c_TCGATG_USER P 1 + -‐ 1.05% 0.00287 50.5
K14_TGAACA P 1 -‐ -‐ 1.70% 0.00611 55.3
K14_D1_2_CGTATA C 2 -‐ -‐ 0.45% 0.00278 49.9
K14_D1_3_TGATCG C 2 -‐ -‐ 0.43% 0.00237 50.5
K14_D1_CGCTAT C 2 -‐ -‐ 0.44% 0.00313 48.8
K14_D2_2__GTGTAT C 3 -‐ -‐ 0.57% 0.00263 48.3
K14_D2_3_TGCATA C 3 -‐ -‐ 0.49% 0.00296 49.6
K14_D2_TGAACA C 3 -‐ -‐ 0.58% 0.00234 48.5
K14_D3_USER_1_CGATGA C 4 + -‐ 0.49% 0.00388 42.3
K14_D3_USER_2_TGCATA C 4 + -‐ 0.46% 0.00485 42.8
K14_D3_USER_3_TCTCGC C 5 + -‐ 0.30% 0.00283 43.0
K14_D3_USER_4_TGATGC C 5 + -‐ 0.30% 0.00306 43.1
K14_A1_S2_1_USER_CAGCTA P 6 + -‐ 1.22% 0.19670 57.6
K14_A2_S2_1_USER P 6 + -‐ 1.15% 0.18102 56.7
K14_B1_S2_1_USER_ACAGTG P 6 + + 0.06% 0.00097 68.5
K14_B2_S2_1_USER_GCCAAT P 6 + + 0.01% 0.00075 66.6
K14_USER_Met1_ATCACG P 6 + + 0.15% 0.00083 67.5
K14_USER_Met2_TTAGGC P 6 + + 0.05% 0.00055 66.7
K14_S2_1_USER_36_TGCAGG P 6 + -‐ 1.24% 0.17207 58.7
K14_S2_1_USER_37_ACTGCC P 7 + -‐ 1.01% 0.22455 59.1
K14_A3_S2_2_USER P 7 + -‐ 0.56% 0.01776 66.9

72
K14_A4_S2_2_USER P 7 + -‐ 0.33% 0.01758 67.9
K14_B3_S2_2_MetCap_USER P 7 + + 0.05% 0.00112 69.2
K14_B4_S2_2_MetCap_USER P 7 + + 0.02% 0.00090 68.7
K14_USER_Met3_ACTTGA P 7 + + 0.14% 0.00091 67.7
K14_USER_Met4_GATCAG P 7 + + 0.10% 0.00064 66.9
K14_10_TAGCTT P 8 + -‐ 0.12% 0.00030 50.1
K14_11_GGCTAC P 8 + -‐ 0.13% 0.00036 50.6
K14_12_CTTGTA P 8 + -‐ 0.12% 0.00066 51.0
K14_33_GACCGG P 8 + -‐ 0.12% 0.00024 52.3
K14_34_GAGATA P 8 + -‐ 0.12% 0.00038 50.1
K14_35_CTGACA P 8 + -‐ 0.12% 0.00042 49.6
K14_46_CACGAA P 8 + -‐ 0.12% 0.00040 51.2
K14_47_CATAGA P 8 + -‐ 0.12% 0.00030 51.3
K14_48_ACAGTC P 8 + -‐ 0.12% 0.00038 51.2
K14_49_CATCGT P 8 + -‐ 0.12% 0.00065 52.8
K14_50_TTGAAC P 8 + -‐ 0.12% 0.00071 50.9
K14_5_ACAGTG P 8 + -‐ 0.12% 0.00063 49.7
K14_6_GCCAAT P 8 + -‐ 0.12% 0.00080 50.9
K14_7_CAGATC P 8 + -‐ 0.12% 0.00037 48.7
K14_8_ACTTGA P 8 + -‐ 0.12% 0.00040 50.1
K14_9_GATCAG P 8 + -‐ 0.12% 0.00021 50.4
K14_1_ATCACG P 9 + -‐ 0.20% 0.00048 50.4
K14_24_CGATGA P 9 + -‐ 0.20% 0.00066 48.1
K14_2_CGATGT P 9 + -‐ 0.19% 0.00063 50.3
K14_31_GACACT P 9 + -‐ 0.19% 0.00048 49.5
K14_36_TGCAGG P 9 + -‐ 0.20% 0.00054 48.2
K14_37_ACTGCC P 9 + -‐ 0.20% 0.00065 48.6
K14_38_GCAACG P 9 + -‐ 0.19% 0.00054 48.3
K14_39_CGACCT P 9 + -‐ 0.19% 0.00066 49.1
K14_3_TTAGGC P 9 + -‐ 0.19% 0.00050 50.1
K14_40_TGACGT P 9 + -‐ 0.19% 0.00058 49.5
K14_41_TGTCTG P 9 + -‐ 0.19% 0.00055 49.1
K14_42_ACGTGC P 9 + -‐ 0.19% 0.00045 49.3
K14_43_TGATCC P 9 + -‐ 0.19% 0.00077 50.4
K14_44_CTCTAG P 9 + -‐ 0.19% 0.00045 50.1
K14_45_GAGAAG P 9 + -‐ 0.20% 0.00055 48.9
K14_4_TGACCA P 9 + -‐ 0.19% 0.00061 51.5
K14_S5_1_A_ATCACG P 10 + -‐ 2.46% 0.01581 39.3
K14_S5_2_B_TTAGGC P 11 + -‐ 8.03% 0.03772 42.8
K14_S5_2_C_15_TGATCG P 11 + -‐ 4.85% 0.56476 46.4
K14_S5_2_C_CAGATC P 11 + -‐ 3.84% 0.78320 46.0

73
K14_S5_2_C_15_8_ACTTGA P 11 + -‐ 3.62% 0.13211 53.6
K14_S5_2_C_15_6_GCCAAT P 11 + -‐ 2.25% 0.16526 53.5
K14_S6_1_D_ACTTGA P 12 + -‐ 0.97% 0.00586 39.0
K14_S6_2_E_GCCAAT P 13 + -‐ 0.87% 0.00302 42.9
K14_S6_2_F_CTTGTA P 13 + -‐ 0.92% 0.00343 44.0

74
Table S3. Contamination estimates based on the MT for libraries selected for downstream analyses. We used a method described in Fu et al. 2013 (see SOM5 for details). The maximum a posteriori probability estimate (MAP) and the lower and upper bound of the 95% credible interval are shown.
Contamination Estimate based on MT (MAP) 2.5% 97.5%
K14 3.8% 3.1% 4.5% K14_A1_S2_1_USER_CAGCTA 1.0% 0.3% 3.1%
K14_A2_S2_1_USER 1.8% 0.7% 4.0% K14_S2_1_USER_36_TGCAGG 3.0% 1.4% 5.7% K14_S2_1_USER_37_ACTGCC 2.2% 0.9% 4.3%
K14_S5_2_C_15_TGATCG 2.8% 1.8% 4.3% K14_S5_2_C_CAGATC 5.7% 4.5% 7.2%
K14_S5_2_C_15_8_ACTTGA 2.0% 0.6% 5.6% K14_S5_2_C_15_6_GCCAAT 2.0% 0.6% 4.9%

75
Table S4. Contamination estimates for the two X-based methods described in SOM S6. X based contamination estimates for all libraries. See SOM6 for details. For some cases (“-“) contamination could not be estimated because either not enough data was available, or because the sample was a female. Library Method1 SE Method2 SE K14_10c_ACAGAG_USER 0.052 0.04 0.052 0.04 K14_10c_AGTGAG_USER 0.054 0.014 0.057 0.015 K14_10c_CTCTGC_USER 0.136 0.077 0.137 0.078 K14_10c_GAGTAG_USER 0.077 0.016 0.079 0.016 K14_10c_GCTACT_USER 0 0 0 0 K14_10c_TAGCTG_USER 0.047 0.016 0.047 0.015 K14_10_TAGCTT 0.409 0.406 0.409 0.406 K14_11_GGCTAC 0 0 0 0 K14_12_CTTGTA 0.64 0 0.64 0 K14_14c_ACTGCG_USER 0.068 0.015 0.065 0.014 K14_14c_CAGCAC_USER 0.083 0.017 0.086 0.017 K14_14c_CGTAGT_USER 0.056 0.014 0.061 0.015 K14_14c_GTCGTC_USER 0.067 0.017 0.07 0.018 K14_14c_TACGAG_USER 0.047 0.014 0.046 0.013 K14_14c_TCGATG_USER 0.034 0.034 0.034 0.034 K14_1_ATCACG 0.382 0.39 0.382 0.39 K14_24_CGATGA 0.347 0.191 0.347 0.191 K14_2_CGATGT 0.323 0.225 0.323 0.225 K14_31_GACACT 0.634 0.009 0.634 0.009 K14_33_GACCGG 0.435 NA 0.435 NA K14_34_GAGATA 0.47 0.406 0.47 0.406 K14_35_CTGACA 0 0 0 0 K14_36_TGCAGG 0.217 0.251 0.217 0.251 K14_37_ACTGCC 0.535 0.099 0.535 0.099 K14_38_GCAACG 1 0 1 0 K14_39_CGACCT 0.358 0.195 0.358 0.195 K14_3_TTAGGC 0.448 0.241 0.448 0.241 K14_40_TGACGT 0.145 0.148 0.145 0.148 K14_41_TGTCTG 0.227 0.233 0.227 0.233 K14_42_ACGTGC 0.545 0.129 0.545 0.129 K14_43_TGATCC 0.769 0 0.769 0 K14_44_CTCTAG 0.426 0.426 0.426 0.426 K14_45_GAGAAG 0.534 0.162 0.534 0.162

76
K14_46_CACGAA 0 0 0 0 K14_47_CATAGA 0 0 0 0 k14_48_ACAGTC 0.38 0.393 0.38 0.393 K14_49_CATCGT 0 0 0 0 K14_4_TGACCA 0.901 0 0.901 0 K14_50_TTGAAC 0.389 0.27 0.389 0.27 K14_5_ACAGTG 0.34 0.371 0.34 0.371 K14_6_GCCAAT 0.433 0.292 0.433 0.292 K14_7_CAGATC 0 0 0 0 K14_8_ACTTGA 0 0 0 0 K14_9_GATCAG 0 NA 0 NA K14_A1_S2_1_USER_CAGCTA 0.029 0.004 0.029 0.005 K14_A2_S2_1_USER 0.036 0.005 0.034 0.005 K14_A3_S2_2_USER 0.181 0.034 0.175 0.034 K14_A4_S2_2_USER 0.332 0.048 0.33 0.049 K14_B1_S2_1_USER_ACAGTG 0.403 0.157 0.383 0.141 K14_B2_S2_1_USER_GCCAAT 0.342 0.148 0.389 0.16 K14_B3_S2_2_MetCap_USER 0.738 0 0.787 0 K14_B4_S2_2_MetCap_USER 0.871 0 0.821 0 K14_Dabney_D3_USER_1_CGATGA 0.054 0.049 0.054 0.049 K14_Dabney_D3_USER_2_TGCATA 0.18 0.066 0.18 0.066 K14_Dabney_D3_USER_3_TCTCGC 0.042 0.042 0.042 0.042 K14_Dabney_D3_USER_4_TGATGC 0.126 0.071 0.126 0.071 K14_S5_1_A_ATCACG 0.03 0.016 0.03 0.016 K14_S5_2_B_TTAGGC 0.005 0.006 0.005 0.006 K14_S5_2_C_15_6_GCCAAT 0.019 0.004 0.02 0.004 K14_S5_2_C_15_8_ACTTGA 0.02 0.004 0.02 0.005 K14_S5_2_C_15_TGATCG 0.02 0.002 0.02 0.002 K14_S5_2_C_CAGATC 0.028 0.002 0.027 0.003 K14_S6_1_D_ACTTGA 0.049 0.036 0.049 0.036 K14_S6_2_E_GCCAAT 0 0 0 0 K14_S6_2_F_CTTGTA 0.106 0.063 0.106 0.063 K14_USER_Met1_ATCACG 0.691 0 0.691 0 K14_USER_Met2_TTAGGC 0.732 0 0.732 0 K14_USER_Met3_ACTTGA 0.424 0.149 0.441 0.152 K14_USER_Met4_GATCAG 0.224 0.15 0.248 0.157 S2_1_USER_36_TGCAGG 0.031 0.005 0.033 0.005 S2_1_USER_37_ACTGCC 0.04 0.005 0.041 0.005

77
Table S5. X-based contamination estimates for ancient samples (SOM S6). X based contamination estimates. See SOM6 for details. For some cases (“-“) contamination could not be estimated because either not enough data was available, or because the sample was a female. Method 1 Method 2 Sample Estimate SE Estimate SE K14 0.024 0.0011 0.021 0.0019 K14 5bp trimmed 0.020 0.0012 0.020 0.0019 Loschbour 0.0049 0.00028 0.0057 0.00089 Motala1 -‐ -‐ -‐ -‐ Motala2 0.010 0.010 6.6E-‐05 0 Motala3 0.0043 0.0021 0.0073 0.0039 Motala4 -‐ -‐ -‐ -‐ Motala6 6.6E-‐05 0.075 6.6E-‐05 0.075 Motala9 -‐ -‐ -‐ -‐ Motala12 0.0032 0.00053 0.0031 0.00091 Ajv58 0.012 0.0014 0.012 0.0022 Brana1 0.008 0.001 0.004 0.0018 Brana2 0.006 0.0012 0.004 0.0019 E733 0.030 0.0028 0.026 0.0040 Gok2 -‐ -‐ -‐ -‐ Iceman 0.012 0.00069 0.013 0.0013 LBK -‐ -‐ -‐ -‐ MA1 0.013 0.002 0.0087 0.00289

78
Table S6. ISOGG chromosome Y SNPs with derived allele in K14. isoggId haplogroup position mutation K14 depth isDamage L990 A0 14001289 A-‐>G G 2 FALSE L1085 A0-‐T 2790726 T-‐>C C 1 FALSE L1089 A0-‐T 2887280 G-‐>C C 1 FALSE L1105 A0-‐T 7590048 C-‐>T T 1 TRUE L1116 A0-‐T 13888035 A-‐>C C 2 FALSE L1120 A0-‐T 14496439 G-‐>T T 3 FALSE L1121 A0-‐T 14496448 G-‐>A A 2 TRUE L1123 A0-‐T 15425676 C-‐>T T 2 TRUE L1128 A0-‐T 16428812 C-‐>T T 1 TRUE L1129 A0-‐T 16596846 T-‐>C C 3 FALSE L1130 A0-‐T 16661010 T-‐>G G 3 FALSE L1132 A0-‐T 16718811 A-‐>G G 2 FALSE L1137 A0-‐T 19047091 C-‐>T T 2 TRUE L1145 A0-‐T 21739790 C-‐>T T 1 TRUE L1150 A0-‐T 21903971 A-‐>G G 1 FALSE L1155 A0-‐T 22191266 G-‐>C C 1 FALSE L1002 A1 16392856 A-‐>T T 1 FALSE L1004 A1 16773792 T-‐>C C 1 FALSE L1009 A1 18180294 A-‐>G G 1 FALSE L1013 A1 21646577 C-‐>A A 1 FALSE L1053 A1 18759708 C-‐>A A 1 FALSE L1084 A1 22957136 G-‐>A A 1 TRUE L1112 A1 8466995 G-‐>A A 2 TRUE L985 A1 7374927 A-‐>C C 1 FALSE L989 A1 23551003 T-‐>A A 3 FALSE V168 A1 17947672 G-‐>A A 1 TRUE V238 A1 7651556 G-‐>T T 1 FALSE V221 A1b 7589303 G-‐>T T 1 FALSE M141 A1b1a1 21705977 T-‐>A A 2 FALSE M118 A1b1b2b1 21763965 A-‐>T T 3 FALSE V234 B
(Investigation) 7644670 C-‐>T T 1 TRUE
V237 B (Investigation)
7647511 C-‐>T T 1 TRUE
50f2(P) B2b1 23497067 G-‐>C C 2 FALSE L1060 BT 21183571 C-‐>T T 4 TRUE L1061 BT 22191243 G-‐>A A 1 TRUE L957 BT 14079528 C-‐>T T 1 TRUE L969 BT 21674225 T-‐>C C 1 FALSE

79
L977 BT 23302389 A-‐>G G 1 FALSE M299 BT 22748506 T-‐>G G 1 FALSE M42 BT 21866840 A-‐>T T 2 FALSE M91 BT 21907538 del-‐>T T 1 FALSE P97 BT 14886273 G-‐>T T 2 FALSE Page65.1 BT 2657176 T-‐>C C 2 FALSE PF1403 BT 2756519 T-‐>C C 4 FALSE PF1411 BT 17037979 C-‐>T T 1 TRUE V202 BT 2790584 G-‐>C C 1 FALSE P255 C 8685038 G-‐>A A 1 TRUE V183 C 14263271 G-‐>A A 1 TRUE V199 C 2772928 C-‐>A A 2 FALSE V232 C 7629098 T-‐>C C 1 FALSE F3393 C1 23023974 C-‐>A A 1 FALSE CTS3818 CF 15203676 A-‐>G G 3 FALSE CTS6376 CF 16863259 C-‐>G G 2 FALSE M168 CT 14813991 C-‐>T T 2 TRUE M294 CT 22744945 C-‐>T T 2 TRUE 22457 D1b1a2 24464597 C-‐>G G 1 FALSE Z1518 D1b2 8069557 C-‐>T T 4 TRUE M5564 E 23463283 G-‐>A A 1 TRUE Z15165 E1a2 23958822 T-‐>C C 2 FALSE Z14907 E1a2b1a1a1 7787335 G-‐>T T 3 FALSE Z16208 E1b1a1a1c2c3c 22542408 T-‐>A A 4 FALSE CTS2590 E2 14376035 G-‐>A A 1 TRUE P135 F 21618856 C-‐>T T 1 TRUE Z14050 H1b1 14013176 G-‐>A A 1 TRUE Z14173 H1b1 23004423 G-‐>A A 1 TRUE P80 H1b1a 6739899 G-‐>C C 1 FALSE P266 H1b1b 6739738 A-‐>T T 2 FALSE Z14350 H1b2a 16314520 G-‐>T T 3 FALSE Z13393 H3a 17248422 G-‐>T T 1 FALSE CTS616 I2a2a1 6906332 C-‐>G G 1 FALSE L1228 I2a2a2 15446045 C-‐>G G 1 FALSE Z1842 J1a3a 21138032 C-‐>T T 1 TRUE P329 L1a 8466781 G-‐>A A 1 TRUE L58 N
(Investigation) 6670461 T-‐>G G 1 FALSE
N10 O (Private) 21900347 C-‐>G G 1 FALSE P103 O (Private) 15477831 G-‐>C C 5 FALSE M199 Q1a2a1a1c 15031110 del-‐>G G 1 FALSE

80
Table S7. D-statistics for D(Mbuti,K14)(X,Lithuanians). Positive values indicate K14 closer to Lithuanians. p1 p2 p3 p4 D sdJK Z nSites
MbutiPygmy Kostenki San Lithuanians 0.356 0.004 101.3 359444
MbutiPygmy Kostenki BantuSouthAfrica Lithuanians 0.314 0.003 93.3 370007
MbutiPygmy Kostenki MbutiPygmy Lithuanians 0.446 0.003 144.2 375124
MbutiPygmy Kostenki BiakaPygmy Lithuanians 0.345 0.003 105.8 373707
MbutiPygmy Kostenki Mandenka Lithuanians 0.293 0.003 89.9 374355
MbutiPygmy Kostenki Yoruba Lithuanians 0.299 0.003 93.0 374465
MbutiPygmy Kostenki BantuKenya Lithuanians 0.291 0.003 90.8 373029
MbutiPygmy Kostenki Ethiopians Lithuanians 0.170 0.003 66.0 372661
MbutiPygmy Kostenki EthiopianJews Lithuanians 0.166 0.003 63.4 370132
MbutiPygmy Kostenki Egyptians Lithuanians 0.078 0.002 36.7 366456
MbutiPygmy Kostenki Mozabite Lithuanians 0.101 0.002 46.1 372678
MbutiPygmy Kostenki Moroccan Lithuanians 0.106 0.002 45.3 367252
MbutiPygmy Kostenki MoroccanJews Lithuanians 0.032 0.002 17.1 361083
MbutiPygmy Kostenki Yemenis Lithuanians 0.093 0.002 37.5 365290
MbutiPygmy Kostenki YemeniJews Lithuanians 0.046 0.002 21.7 361552
MbutiPygmy Kostenki Saudis Lithuanians 0.048 0.002 24.3 366080
MbutiPygmy Kostenki Iranians Lithuanians 0.034 0.002 18.4 364217
MbutiPygmy Kostenki IranJews Lithuanians 0.028 0.002 11.4 349376
MbutiPygmy Kostenki IraqiJews Lithuanians 0.027 0.002 13.2 356593
MbutiPygmy Kostenki Jordanian Lithuanians 0.053 0.002 29.1 367766
MbutiPygmy Kostenki Syrians Lithuanians 0.039 0.002 21.1 363528
MbutiPygmy Kostenki Bedouin Lithuanians 0.056 0.002 30.7 372048
MbutiPygmy Kostenki Druze Lithuanians 0.029 0.002 16.9 365393
MbutiPygmy Kostenki Palestinian Lithuanians 0.049 0.002 27.4 370956
MbutiPygmy Kostenki Samaritans Lithuanians 0.029 0.003 9.1 345872
MbutiPygmy Kostenki AshkenaziJews Lithuanians 0.022 0.002 12.2 360331
MbutiPygmy Kostenki SephardicJews Lithuanians 0.025 0.002 14.9 362002
MbutiPygmy Kostenki Lebanese Lithuanians 0.039 0.002 17.6 356388
MbutiPygmy Kostenki Turkish Lithuanians 0.022 0.002 12.9 361542
MbutiPygmy Kostenki Cypriots Lithuanians 0.024 0.002 12.7 357847
MbutiPygmy Kostenki Bulgarians Lithuanians 0.012 0.002 7.4 356986
MbutiPygmy Kostenki Romanian Lithuanians 0.010 0.002 6.3 358900
MbutiPygmy Kostenki RomanianJews Lithuanians 0.018 0.003 6.8 347244
MbutiPygmy Kostenki NorthItalian Lithuanians 0.008 0.002 4.7 356188
MbutiPygmy Kostenki Tuscan Lithuanians 0.013 0.002 6.8 353549
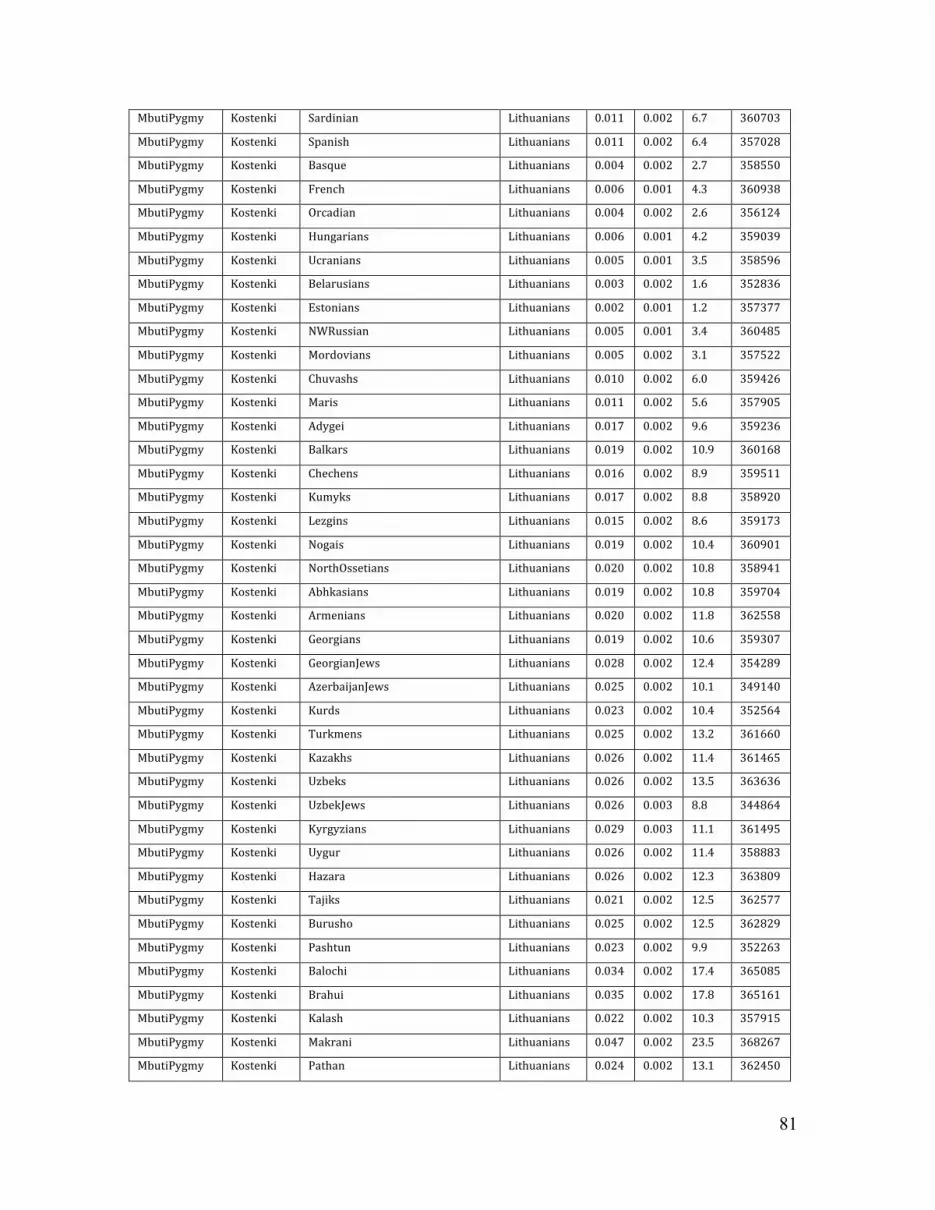
81
MbutiPygmy Kostenki Sardinian Lithuanians 0.011 0.002 6.7 360703
MbutiPygmy Kostenki Spanish Lithuanians 0.011 0.002 6.4 357028
MbutiPygmy Kostenki Basque Lithuanians 0.004 0.002 2.7 358550
MbutiPygmy Kostenki French Lithuanians 0.006 0.001 4.3 360938
MbutiPygmy Kostenki Orcadian Lithuanians 0.004 0.002 2.6 356124
MbutiPygmy Kostenki Hungarians Lithuanians 0.006 0.001 4.2 359039
MbutiPygmy Kostenki Ucranians Lithuanians 0.005 0.001 3.5 358596
MbutiPygmy Kostenki Belarusians Lithuanians 0.003 0.002 1.6 352836
MbutiPygmy Kostenki Estonians Lithuanians 0.002 0.001 1.2 357377
MbutiPygmy Kostenki NWRussian Lithuanians 0.005 0.001 3.4 360485
MbutiPygmy Kostenki Mordovians Lithuanians 0.005 0.002 3.1 357522
MbutiPygmy Kostenki Chuvashs Lithuanians 0.010 0.002 6.0 359426
MbutiPygmy Kostenki Maris Lithuanians 0.011 0.002 5.6 357905
MbutiPygmy Kostenki Adygei Lithuanians 0.017 0.002 9.6 359236
MbutiPygmy Kostenki Balkars Lithuanians 0.019 0.002 10.9 360168
MbutiPygmy Kostenki Chechens Lithuanians 0.016 0.002 8.9 359511
MbutiPygmy Kostenki Kumyks Lithuanians 0.017 0.002 8.8 358920
MbutiPygmy Kostenki Lezgins Lithuanians 0.015 0.002 8.6 359173
MbutiPygmy Kostenki Nogais Lithuanians 0.019 0.002 10.4 360901
MbutiPygmy Kostenki NorthOssetians Lithuanians 0.020 0.002 10.8 358941
MbutiPygmy Kostenki Abhkasians Lithuanians 0.019 0.002 10.8 359704
MbutiPygmy Kostenki Armenians Lithuanians 0.020 0.002 11.8 362558
MbutiPygmy Kostenki Georgians Lithuanians 0.019 0.002 10.6 359307
MbutiPygmy Kostenki GeorgianJews Lithuanians 0.028 0.002 12.4 354289
MbutiPygmy Kostenki AzerbaijanJews Lithuanians 0.025 0.002 10.1 349140
MbutiPygmy Kostenki Kurds Lithuanians 0.023 0.002 10.4 352564
MbutiPygmy Kostenki Turkmens Lithuanians 0.025 0.002 13.2 361660
MbutiPygmy Kostenki Kazakhs Lithuanians 0.026 0.002 11.4 361465
MbutiPygmy Kostenki Uzbeks Lithuanians 0.026 0.002 13.5 363636
MbutiPygmy Kostenki UzbekJews Lithuanians 0.026 0.003 8.8 344864
MbutiPygmy Kostenki Kyrgyzians Lithuanians 0.029 0.003 11.1 361495
MbutiPygmy Kostenki Uygur Lithuanians 0.026 0.002 11.4 358883
MbutiPygmy Kostenki Hazara Lithuanians 0.026 0.002 12.3 363809
MbutiPygmy Kostenki Tajiks Lithuanians 0.021 0.002 12.5 362577
MbutiPygmy Kostenki Burusho Lithuanians 0.025 0.002 12.5 362829
MbutiPygmy Kostenki Pashtun Lithuanians 0.023 0.002 9.9 352263
MbutiPygmy Kostenki Balochi Lithuanians 0.034 0.002 17.4 365085
MbutiPygmy Kostenki Brahui Lithuanians 0.035 0.002 17.8 365161
MbutiPygmy Kostenki Kalash Lithuanians 0.022 0.002 10.3 357915
MbutiPygmy Kostenki Makrani Lithuanians 0.047 0.002 23.5 368267
MbutiPygmy Kostenki Pathan Lithuanians 0.024 0.002 13.1 362450
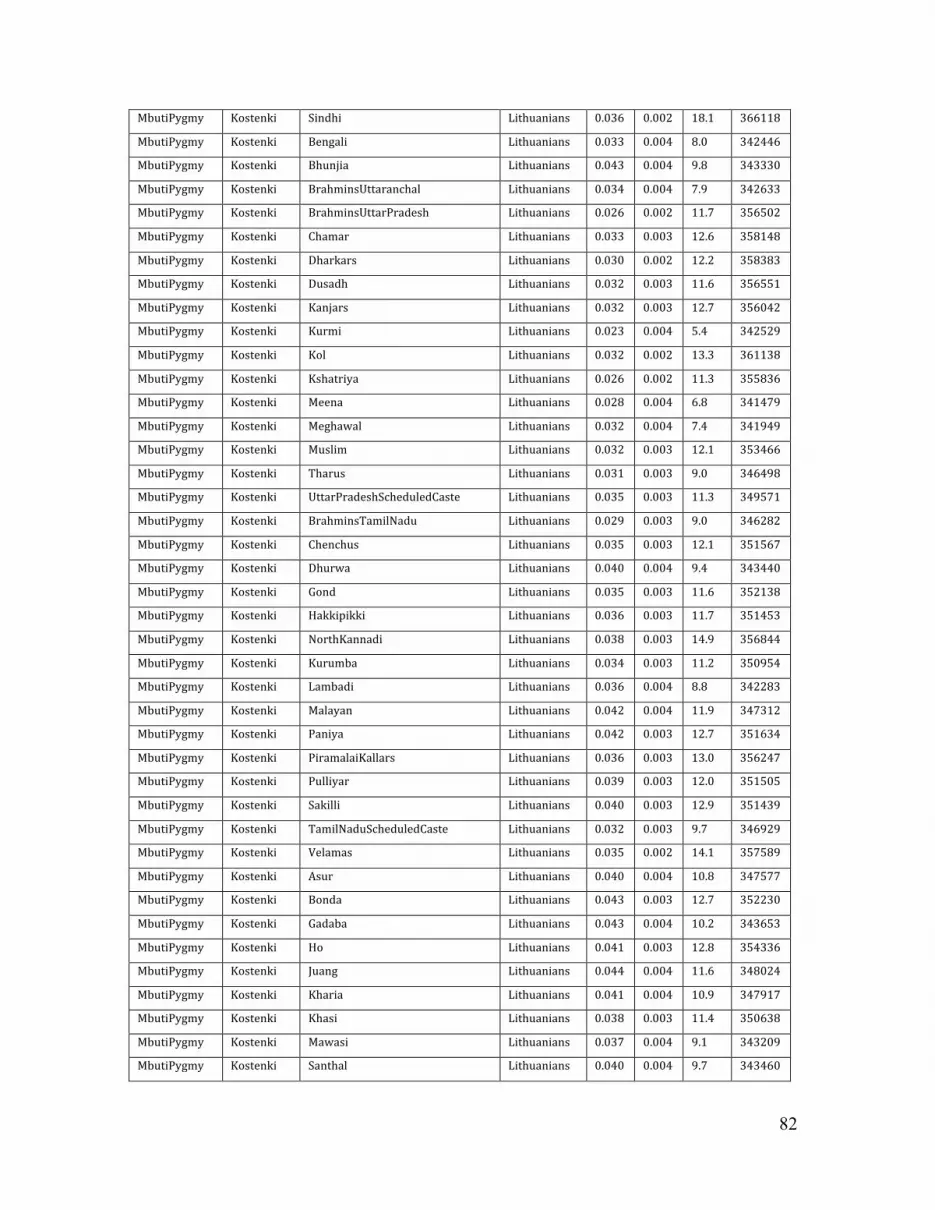
82
MbutiPygmy Kostenki Sindhi Lithuanians 0.036 0.002 18.1 366118
MbutiPygmy Kostenki Bengali Lithuanians 0.033 0.004 8.0 342446
MbutiPygmy Kostenki Bhunjia Lithuanians 0.043 0.004 9.8 343330
MbutiPygmy Kostenki BrahminsUttaranchal Lithuanians 0.034 0.004 7.9 342633
MbutiPygmy Kostenki BrahminsUttarPradesh Lithuanians 0.026 0.002 11.7 356502
MbutiPygmy Kostenki Chamar Lithuanians 0.033 0.003 12.6 358148
MbutiPygmy Kostenki Dharkars Lithuanians 0.030 0.002 12.2 358383
MbutiPygmy Kostenki Dusadh Lithuanians 0.032 0.003 11.6 356551
MbutiPygmy Kostenki Kanjars Lithuanians 0.032 0.003 12.7 356042
MbutiPygmy Kostenki Kurmi Lithuanians 0.023 0.004 5.4 342529
MbutiPygmy Kostenki Kol Lithuanians 0.032 0.002 13.3 361138
MbutiPygmy Kostenki Kshatriya Lithuanians 0.026 0.002 11.3 355836
MbutiPygmy Kostenki Meena Lithuanians 0.028 0.004 6.8 341479
MbutiPygmy Kostenki Meghawal Lithuanians 0.032 0.004 7.4 341949
MbutiPygmy Kostenki Muslim Lithuanians 0.032 0.003 12.1 353466
MbutiPygmy Kostenki Tharus Lithuanians 0.031 0.003 9.0 346498
MbutiPygmy Kostenki UttarPradeshScheduledCaste Lithuanians 0.035 0.003 11.3 349571
MbutiPygmy Kostenki BrahminsTamilNadu Lithuanians 0.029 0.003 9.0 346282
MbutiPygmy Kostenki Chenchus Lithuanians 0.035 0.003 12.1 351567
MbutiPygmy Kostenki Dhurwa Lithuanians 0.040 0.004 9.4 343440
MbutiPygmy Kostenki Gond Lithuanians 0.035 0.003 11.6 352138
MbutiPygmy Kostenki Hakkipikki Lithuanians 0.036 0.003 11.7 351453
MbutiPygmy Kostenki NorthKannadi Lithuanians 0.038 0.003 14.9 356844
MbutiPygmy Kostenki Kurumba Lithuanians 0.034 0.003 11.2 350954
MbutiPygmy Kostenki Lambadi Lithuanians 0.036 0.004 8.8 342283
MbutiPygmy Kostenki Malayan Lithuanians 0.042 0.004 11.9 347312
MbutiPygmy Kostenki Paniya Lithuanians 0.042 0.003 12.7 351634
MbutiPygmy Kostenki PiramalaiKallars Lithuanians 0.036 0.003 13.0 356247
MbutiPygmy Kostenki Pulliyar Lithuanians 0.039 0.003 12.0 351505
MbutiPygmy Kostenki Sakilli Lithuanians 0.040 0.003 12.9 351439
MbutiPygmy Kostenki TamilNaduScheduledCaste Lithuanians 0.032 0.003 9.7 346929
MbutiPygmy Kostenki Velamas Lithuanians 0.035 0.002 14.1 357589
MbutiPygmy Kostenki Asur Lithuanians 0.040 0.004 10.8 347577
MbutiPygmy Kostenki Bonda Lithuanians 0.043 0.003 12.7 352230
MbutiPygmy Kostenki Gadaba Lithuanians 0.043 0.004 10.2 343653
MbutiPygmy Kostenki Ho Lithuanians 0.041 0.003 12.8 354336
MbutiPygmy Kostenki Juang Lithuanians 0.044 0.004 11.6 348024
MbutiPygmy Kostenki Kharia Lithuanians 0.041 0.004 10.9 347917
MbutiPygmy Kostenki Khasi Lithuanians 0.038 0.003 11.4 350638
MbutiPygmy Kostenki Mawasi Lithuanians 0.037 0.004 9.1 343209
MbutiPygmy Kostenki Santhal Lithuanians 0.040 0.004 9.7 343460

83
MbutiPygmy Kostenki Savara Lithuanians 0.038 0.004 10.8 347781
MbutiPygmy Kostenki Nihali Lithuanians 0.037 0.004 10.5 347543
MbutiPygmy Kostenki Garo Lithuanians 0.043 0.004 12.0 352544
MbutiPygmy Kostenki Naga Lithuanians 0.042 0.004 11.6 351954
MbutiPygmy Kostenki IndianJews Lithuanians 0.031 0.002 13.0 356340
MbutiPygmy Kostenki Burmese Lithuanians 0.040 0.003 13.2 360473
MbutiPygmy Kostenki Cambodian Lithuanians 0.041 0.003 12.6 357960
MbutiPygmy Kostenki Dai Lithuanians 0.040 0.003 11.6 356965
MbutiPygmy Kostenki Han Lithuanians 0.040 0.003 12.1 360719
MbutiPygmy Kostenki Han-‐NChina Lithuanians 0.039 0.003 11.3 357277
MbutiPygmy Kostenki Lahu Lithuanians 0.043 0.004 12.0 355253
MbutiPygmy Kostenki Miao Lithuanians 0.039 0.003 11.3 356843
MbutiPygmy Kostenki Naxi Lithuanians 0.041 0.003 12.3 355967
MbutiPygmy Kostenki She Lithuanians 0.040 0.004 11.2 356395
MbutiPygmy Kostenki Tujia Lithuanians 0.040 0.003 11.7 357262
MbutiPygmy Kostenki Yi Lithuanians 0.039 0.003 11.4 357245
MbutiPygmy Kostenki Japanese Lithuanians 0.039 0.003 11.8 360026
MbutiPygmy Kostenki Daur Lithuanians 0.038 0.003 11.5 356631
MbutiPygmy Kostenki Hezhen Lithuanians 0.039 0.003 11.4 355808
MbutiPygmy Kostenki Oroqen Lithuanians 0.035 0.003 10.6 356246
MbutiPygmy Kostenki Tu Lithuanians 0.039 0.003 11.9 357859
MbutiPygmy Kostenki Xibo Lithuanians 0.037 0.003 11.3 356984
MbutiPygmy Kostenki Mongola Lithuanians 0.037 0.003 11.4 357520
MbutiPygmy Kostenki Mongolians Lithuanians 0.030 0.003 10.5 357174
MbutiPygmy Kostenki Altaians Lithuanians 0.027 0.003 10.7 360439
MbutiPygmy Kostenki Buryats Lithuanians 0.032 0.003 10.8 359419
MbutiPygmy Kostenki Dolgans Lithuanians 0.028 0.003 9.9 356555
MbutiPygmy Kostenki Kets Lithuanians 0.021 0.003 6.8 349915
MbutiPygmy Kostenki Khakases Lithuanians 0.023 0.002 9.9 360383
MbutiPygmy Kostenki Nganassans Lithuanians 0.030 0.003 9.5 356017
MbutiPygmy Kostenki Selkups Lithuanians 0.019 0.002 7.7 358335
MbutiPygmy Kostenki Shors Lithuanians 0.023 0.003 7.7 350789
MbutiPygmy Kostenki Tuvinians Lithuanians 0.032 0.003 11.0 359116
MbutiPygmy Kostenki Nivkhs Lithuanians 0.032 0.003 9.7 349377
MbutiPygmy Kostenki Yakut Lithuanians 0.031 0.003 10.9 360251
MbutiPygmy Kostenki Evenkis Lithuanians 0.031 0.003 10.4 357851
MbutiPygmy Kostenki Evens Lithuanians 0.034 0.003 10.1 354634
MbutiPygmy Kostenki Yukaghirs Lithuanians 0.024 0.003 8.8 354862
MbutiPygmy Kostenki Koryaks Lithuanians 0.025 0.003 7.6 356354
MbutiPygmy Kostenki Chukchis Lithuanians 0.025 0.003 8.5 356700
MbutiPygmy Kostenki EastGreenlanders Lithuanians 0.021 0.003 7.0 353691

84
MbutiPygmy Kostenki WestGreenlanders Lithuanians 0.017 0.003 6.3 354838
MbutiPygmy Kostenki Maya Lithuanians 0.024 0.003 7.2 358417
MbutiPygmy Kostenki Pima Lithuanians 0.021 0.004 5.5 351227
MbutiPygmy Kostenki Colombian Lithuanians 0.023 0.004 6.3 350250
MbutiPygmy Kostenki Karitiana Lithuanians 0.017 0.004 4.4 349416
MbutiPygmy Kostenki Surui Lithuanians 0.020 0.004 4.9 347408
MbutiPygmy Kostenki Melanesian Lithuanians 0.050 0.004 11.7 353923
MbutiPygmy Kostenki Papuan Lithuanians 0.054 0.004 12.6 353787

85
Table S8. D-statistics for D(Outgroup,K14)(X,French). Positve values indicate K14 closer to French. Altai Neanderthal whole modern genomes. p1 p2 p3 p4 D sdJK Z nSites
MbutiPygmy Kostenki San French 0.393 0.005 77.1 1172844
MbutiPygmy Kostenki Mandenka French 0.329 0.005 64.2 1145123
MbutiPygmy Kostenki Yoruba French 0.335 0.005 63.5 1155436
MbutiPygmy Kostenki Dinka French 0.321 0.005 62.1 1145195
MbutiPygmy Kostenki Sardinian French 0.013 0.006 2.1 933558
MbutiPygmy Kostenki Han French 0.047 0.006 7.4 970333
MbutiPygmy Kostenki Dai French 0.044 0.006 7.0 969931
MbutiPygmy Kostenki Mixe French 0.029 0.006 4.6 938306
MbutiPygmy Kostenki Karitiana French 0.022 0.006 3.4 927792
MbutiPygmy Kostenki Papuan French 0.058 0.007 8.5 953359
MbutiPygmy Kostenki Australian French 0.056 0.006 8.6 1111101

86
Table S9. D-statistics for D(Outgroup,Kostenki)(X,French). Positive values indicate K14 closer to French. Mal’ta paper whole modern genomes. p1 p2 p3 p4 D sdJK Z nSites
MbutiPygmy Kostenki San French 0.401 0.005 82.9 779767
MbutiPygmy Kostenki Mandenka French 0.327 0.005 64.4 752632
MbutiPygmy Kostenki Yoruba French 0.334 0.005 66.4 763508
MbutiPygmy Kostenki Dinka French 0.309 0.005 59.0 759085
MbutiPygmy Kostenki Sardinian French 0.008 0.006 1.4 615515
MbutiPygmy Kostenki Mari French 0.010 0.006 1.6 132268
MbutiPygmy Kostenki Avar French 0.013 0.006 2.2 330182
MbutiPygmy Kostenki Tajik French 0.010 0.006 1.7 473285
MbutiPygmy Kostenki Indian French 0.030 0.006 5.1 431881
MbutiPygmy Kostenki Han French 0.043 0.006 7.0 647947
MbutiPygmy Kostenki Dai French 0.042 0.006 7.1 648360
MbutiPygmy Kostenki Karitiana French 0.009 0.006 1.4 614932
MbutiPygmy Kostenki Papuan French 0.051 0.007 7.8 632657

87
Table S10: D-statistics for D(Mbuti,Modern)(Ancient, K14); modern genomes from Prufer et al. (2014). p1 p2 p3 p4 D sdJK Z nSites
MbutiPygmy San MA1 Kostenki -‐0.005 0.006 -‐0.8 115571
MbutiPygmy San Loschbour Kostenki -‐0.010 0.006 -‐1.8 166027
MbutiPygmy San Brana Kostenki 0.000 0.006 0.1 120369
MbutiPygmy San Motala Kostenki 0.000 0.006 -‐0.1 152012
MbutiPygmy San Ajv58 Kostenki -‐0.007 0.006 -‐1.1 147098
MbutiPygmy San Gok2 Kostenki -‐0.002 0.005 -‐0.4 98711
MbutiPygmy San Iceman Kostenki -‐0.005 0.006 -‐0.8 158243
MbutiPygmy San Stuttgart Kostenki 0.000 0.005 0.0 171993
MbutiPygmy Mandenka MA1 Kostenki -‐0.010 0.006 -‐1.6 123458
MbutiPygmy Mandenka Loschbour Kostenki -‐0.026 0.006 -‐4.7 177809
MbutiPygmy Mandenka Brana Kostenki -‐0.009 0.005 -‐1.8 129212
MbutiPygmy Mandenka Motala Kostenki -‐0.012 0.005 -‐2.2 163097
MbutiPygmy Mandenka Ajv58 Kostenki -‐0.016 0.006 -‐2.8 158226
MbutiPygmy Mandenka Gok2 Kostenki -‐0.015 0.005 -‐2.7 106163
MbutiPygmy Mandenka Iceman Kostenki -‐0.026 0.005 -‐4.8 170566
MbutiPygmy Mandenka Stuttgart Kostenki -‐0.017 0.005 -‐3.2 184602
MbutiPygmy Yoruba MA1 Kostenki -‐0.010 0.006 -‐1.8 123626
MbutiPygmy Yoruba Loschbour Kostenki -‐0.019 0.006 -‐3.4 177200
MbutiPygmy Yoruba Brana Kostenki -‐0.006 0.006 -‐1.1 128420
MbutiPygmy Yoruba Motala Kostenki -‐0.007 0.005 -‐1.3 162582
MbutiPygmy Yoruba Ajv58 Kostenki -‐0.014 0.006 -‐2.4 157238
MbutiPygmy Yoruba Gok2 Kostenki -‐0.008 0.006 -‐1.5 105653
MbutiPygmy Yoruba Iceman Kostenki -‐0.018 0.005 -‐3.3 169431
MbutiPygmy Yoruba Stuttgart Kostenki -‐0.013 0.005 -‐2.4 182961
MbutiPygmy Dinka MA1 Kostenki -‐0.009 0.006 -‐1.6 123931
MbutiPygmy Dinka Loschbour Kostenki -‐0.017 0.006 -‐2.8 177487
MbutiPygmy Dinka Brana Kostenki -‐0.008 0.006 -‐1.4 128916
MbutiPygmy Dinka Motala Kostenki -‐0.001 0.006 -‐0.1 163195
MbutiPygmy Dinka Ajv58 Kostenki -‐0.012 0.006 -‐2.0 158204
MbutiPygmy Dinka Gok2 Kostenki -‐0.020 0.006 -‐3.6 106048
MbutiPygmy Dinka Iceman Kostenki -‐0.013 0.006 -‐2.4 170270
MbutiPygmy Dinka Stuttgart Kostenki -‐0.012 0.006 -‐2.1 184627
MbutiPygmy Sardinian MA1 Kostenki -‐0.012 0.007 -‐1.8 143868
MbutiPygmy Sardinian Loschbour Kostenki -‐0.085 0.007 -‐12.8 209554

88
MbutiPygmy Sardinian Brana Kostenki -‐0.062 0.007 -‐9.4 151515
MbutiPygmy Sardinian Motala Kostenki -‐0.067 0.007 -‐9.9 192016
MbutiPygmy Sardinian Ajv58 Kostenki -‐0.069 0.007 -‐10.5 186194
MbutiPygmy Sardinian Gok2 Kostenki -‐0.098 0.007 -‐14.9 125867
MbutiPygmy Sardinian Iceman Kostenki -‐0.083 0.006 -‐13.3 201173
MbutiPygmy Sardinian Stuttgart Kostenki -‐0.095 0.007 -‐13.8 219017
MbutiPygmy French MA1 Kostenki -‐0.038 0.007 -‐5.3 147012
MbutiPygmy French Loschbour Kostenki -‐0.094 0.006 -‐14.9 213063
MbutiPygmy French Brana Kostenki -‐0.080 0.006 -‐13.2 154192
MbutiPygmy French Motala Kostenki -‐0.085 0.007 -‐12.4 196072
MbutiPygmy French Ajv58 Kostenki -‐0.086 0.007 -‐12.6 189049
MbutiPygmy French Gok2 Kostenki -‐0.077 0.006 -‐12.0 126985
MbutiPygmy French Iceman Kostenki -‐0.074 0.006 -‐12.3 203734
MbutiPygmy French Stuttgart Kostenki -‐0.069 0.007 -‐10.4 220632
MbutiPygmy Han MA1 Kostenki -‐0.039 0.007 -‐5.4 140727
MbutiPygmy Han Loschbour Kostenki -‐0.039 0.007 -‐5.3 201566
MbutiPygmy Han Brana Kostenki -‐0.024 0.007 -‐3.5 146036
MbutiPygmy Han Motala Kostenki -‐0.026 0.007 -‐4.0 185194
MbutiPygmy Han Ajv58 Kostenki -‐0.026 0.007 -‐3.7 179068
MbutiPygmy Han Gok2 Kostenki -‐0.013 0.007 -‐1.9 119918
MbutiPygmy Han Iceman Kostenki -‐0.004 0.006 -‐0.6 192304
MbutiPygmy Han Stuttgart Kostenki 0.000 0.007 0.0 208439
MbutiPygmy Dai MA1 Kostenki -‐0.038 0.007 -‐5.5 141382
MbutiPygmy Dai Loschbour Kostenki -‐0.023 0.007 -‐3.1 202056
MbutiPygmy Dai Brana Kostenki -‐0.013 0.007 -‐1.9 146239
MbutiPygmy Dai Motala Kostenki -‐0.018 0.007 -‐2.6 185346
MbutiPygmy Dai Ajv58 Kostenki -‐0.021 0.007 -‐3.1 179385
MbutiPygmy Dai Gok2 Kostenki -‐0.009 0.007 -‐1.4 119918
MbutiPygmy Dai Iceman Kostenki -‐0.001 0.007 -‐0.1 191885
MbutiPygmy Dai Stuttgart Kostenki -‐0.001 0.007 -‐0.1 208671
MbutiPygmy Mixe MA1 Kostenki -‐0.091 0.007 -‐12.7 140768
MbutiPygmy Mixe Loschbour Kostenki -‐0.028 0.007 -‐4.1 197906
MbutiPygmy Mixe Brana Kostenki -‐0.025 0.007 -‐3.6 143467
MbutiPygmy Mixe Motala Kostenki -‐0.048 0.007 -‐7.0 183071
MbutiPygmy Mixe Ajv58 Kostenki -‐0.045 0.007 -‐6.5 176551
MbutiPygmy Mixe Gok2 Kostenki -‐0.001 0.007 -‐0.2 117501
MbutiPygmy Mixe Iceman Kostenki 0.001 0.007 0.1 188825
MbutiPygmy Mixe Stuttgart Kostenki 0.003 0.007 0.4 204608
MbutiPygmy Karitiana MA1 Kostenki -‐0.086 0.008 -‐11.2 138927

89
MbutiPygmy Karitiana Loschbour Kostenki -‐0.027 0.007 -‐3.8 195802
MbutiPygmy Karitiana Brana Kostenki -‐0.023 0.007 -‐3.4 142149
MbutiPygmy Karitiana Motala Kostenki -‐0.047 0.007 -‐6.6 181158
MbutiPygmy Karitiana Ajv58 Kostenki -‐0.035 0.007 -‐4.8 174452
MbutiPygmy Karitiana Gok2 Kostenki -‐0.001 0.007 -‐0.2 116412
MbutiPygmy Karitiana Iceman Kostenki 0.006 0.007 0.8 186439
MbutiPygmy Karitiana Stuttgart Kostenki 0.009 0.007 1.3 201830
MbutiPygmy Papuan MA1 Kostenki -‐0.022 0.007 -‐3.0 134960
MbutiPygmy Papuan Loschbour Kostenki -‐0.016 0.007 -‐2.2 193181
MbutiPygmy Papuan Brana Kostenki -‐0.003 0.007 -‐0.4 139878
MbutiPygmy Papuan Motala Kostenki -‐0.012 0.007 -‐1.7 177496
MbutiPygmy Papuan Ajv58 Kostenki -‐0.006 0.007 -‐0.8 171333
MbutiPygmy Papuan Gok2 Kostenki 0.002 0.007 0.2 114673
MbutiPygmy Papuan Iceman Kostenki 0.008 0.007 1.2 184011
MbutiPygmy Papuan Stuttgart Kostenki 0.006 0.007 0.9 199951
MbutiPygmy Australian MA1 Kostenki -‐0.023 0.007 -‐3.3 158792
MbutiPygmy Australian Loschbour Kostenki -‐0.014 0.007 -‐2.0 226708
MbutiPygmy Australian Brana Kostenki -‐0.007 0.007 -‐1.1 164499
MbutiPygmy Australian Motala Kostenki -‐0.010 0.007 -‐1.5 208593
MbutiPygmy Australian Ajv58 Kostenki -‐0.008 0.007 -‐1.2 201471
MbutiPygmy Australian Gok2 Kostenki 0.003 0.007 0.5 134531
MbutiPygmy Australian Iceman Kostenki 0.007 0.006 1.2 215625
MbutiPygmy Australian Stuttgart Kostenki 0.013 0.007 1.9 234191

90
Table S11. D-statistics for D(Mbuti,Modern)(Ancient, K14); modern genomes from Raghavan et al. (2014). p1 p2 p3 p4 D sdJK Z nSites
MbutiPygmy San MA1 Kostenki -‐0.003 0.006 -‐0.6 78821
MbutiPygmy San Loschbour Kostenki -‐0.004 0.006 -‐0.7 112712
MbutiPygmy San Brana Kostenki 0.000 0.006 0.0 80913
MbutiPygmy San Motala Kostenki 0.000 0.006 0.1 103026
MbutiPygmy San Ajv58 Kostenki -‐0.008 0.006 -‐1.3 100277
MbutiPygmy San Gok2 Kostenki -‐0.006 0.006 -‐1.0 65522
MbutiPygmy San Iceman Kostenki 0.002 0.006 0.3 106426
MbutiPygmy San Stuttgart Kostenki -‐0.001 0.006 -‐0.2 116437
MbutiPygmy Mandenka MA1 Kostenki 0.008 0.006 1.4 83168
MbutiPygmy Mandenka Loschbour Kostenki -‐0.004 0.006 -‐0.6 118675
MbutiPygmy Mandenka Brana Kostenki -‐0.002 0.006 -‐0.3 85199
MbutiPygmy Mandenka Motala Kostenki 0.001 0.006 0.2 108818
MbutiPygmy Mandenka Ajv58 Kostenki -‐0.003 0.006 -‐0.5 105677
MbutiPygmy Mandenka Gok2 Kostenki -‐0.006 0.006 -‐1.0 69105
MbutiPygmy Mandenka Iceman Kostenki 0.006 0.005 1.1 112405
MbutiPygmy Mandenka Stuttgart Kostenki -‐0.007 0.006 -‐1.3 123312
MbutiPygmy Yoruba MA1 Kostenki 0.002 0.006 0.3 83661
MbutiPygmy Yoruba Loschbour Kostenki -‐0.010 0.006 -‐1.7 119761
MbutiPygmy Yoruba Brana Kostenki -‐0.010 0.006 -‐1.8 85981
MbutiPygmy Yoruba Motala Kostenki 0.001 0.006 0.2 109603
MbutiPygmy Yoruba Ajv58 Kostenki -‐0.015 0.006 -‐2.5 106470
MbutiPygmy Yoruba Gok2 Kostenki -‐0.006 0.006 -‐1.1 69744
MbutiPygmy Yoruba Iceman Kostenki -‐0.001 0.006 -‐0.2 113172
MbutiPygmy Yoruba Stuttgart Kostenki -‐0.010 0.006 -‐1.7 124127
MbutiPygmy Dinka MA1 Kostenki 0.003 0.006 0.5 85002
MbutiPygmy Dinka Loschbour Kostenki -‐0.004 0.006 -‐0.6 122003
MbutiPygmy Dinka Brana Kostenki 0.001 0.006 0.1 87082
MbutiPygmy Dinka Motala Kostenki -‐0.003 0.006 -‐0.4 111675
MbutiPygmy Dinka Ajv58 Kostenki -‐0.009 0.006 -‐1.4 108309
MbutiPygmy Dinka Gok2 Kostenki -‐0.003 0.006 -‐0.4 70654
MbutiPygmy Dinka Iceman Kostenki -‐0.003 0.006 -‐0.5 115579
MbutiPygmy Dinka Stuttgart Kostenki -‐0.003 0.006 -‐0.5 126353
MbutiPygmy Sardinian MA1 Kostenki -‐0.012 0.007 -‐1.7 97338
MbutiPygmy Sardinian Loschbour Kostenki -‐0.083 0.007 -‐11.9 141445
MbutiPygmy Sardinian Brana Kostenki -‐0.064 0.007 -‐9.4 100800

91
MbutiPygmy Sardinian Motala Kostenki -‐0.057 0.007 -‐8.0 129081
MbutiPygmy Sardinian Ajv58 Kostenki -‐0.070 0.007 -‐9.8 125246
MbutiPygmy Sardinian Gok2 Kostenki -‐0.095 0.006 -‐14.7 82341
MbutiPygmy Sardinian Iceman Kostenki -‐0.078 0.007 -‐11.2 134599
MbutiPygmy Sardinian Stuttgart Kostenki -‐0.094 0.007 -‐13.7 147353
MbutiPygmy French MA1 Kostenki -‐0.022 0.007 -‐3.1 99145
MbutiPygmy French Loschbour Kostenki -‐0.090 0.007 -‐13.2 143888
MbutiPygmy French Brana Kostenki -‐0.072 0.007 -‐10.3 102409
MbutiPygmy French Motala Kostenki -‐0.079 0.007 -‐11.6 131688
MbutiPygmy French Ajv58 Kostenki -‐0.080 0.007 -‐11.8 127610
MbutiPygmy French Gok2 Kostenki -‐0.082 0.007 -‐12.4 83617
MbutiPygmy French Iceman Kostenki -‐0.065 0.007 -‐9.4 136163
MbutiPygmy French Stuttgart Kostenki -‐0.069 0.007 -‐10.2 148652
MbutiPygmy Mari MA1 Kostenki -‐0.043 0.010 -‐4.3 20424
MbutiPygmy Mari Loschbour Kostenki -‐0.068 0.009 -‐7.6 27386
MbutiPygmy Mari Brana Kostenki -‐0.050 0.009 -‐5.6 24704
MbutiPygmy Mari Motala Kostenki -‐0.072 0.009 -‐8.0 25429
MbutiPygmy Mari Ajv58 Kostenki -‐0.063 0.009 -‐7.4 24378
MbutiPygmy Mari Gok2 Kostenki -‐0.053 0.009 -‐5.9 23349
MbutiPygmy Mari Iceman Kostenki -‐0.028 0.009 -‐3.2 26575
MbutiPygmy Mari Stuttgart Kostenki -‐0.040 0.009 -‐4.6 28437
MbutiPygmy Avar MA1 Kostenki -‐0.038 0.007 -‐5.4 52663
MbutiPygmy Avar Loschbour Kostenki -‐0.065 0.007 -‐9.5 71055
MbutiPygmy Avar Brana Kostenki -‐0.047 0.007 -‐6.8 60196
MbutiPygmy Avar Motala Kostenki -‐0.064 0.007 -‐9.2 65910
MbutiPygmy Avar Ajv58 Kostenki -‐0.067 0.007 -‐10.1 63967
MbutiPygmy Avar Gok2 Kostenki -‐0.062 0.007 -‐9.4 56412
MbutiPygmy Avar Iceman Kostenki -‐0.049 0.007 -‐7.3 70373
MbutiPygmy Avar Stuttgart Kostenki -‐0.063 0.007 -‐9.3 73683
MbutiPygmy Tajik MA1 Kostenki -‐0.040 0.007 -‐5.8 75674
MbutiPygmy Tajik Loschbour Kostenki -‐0.049 0.007 -‐7.1 103790
MbutiPygmy Tajik Brana Kostenki -‐0.047 0.007 -‐6.6 82476
MbutiPygmy Tajik Motala Kostenki -‐0.055 0.007 -‐7.8 95973
MbutiPygmy Tajik Ajv58 Kostenki -‐0.056 0.007 -‐8.4 92676
MbutiPygmy Tajik Gok2 Kostenki -‐0.050 0.007 -‐7.4 73103
MbutiPygmy Tajik Iceman Kostenki -‐0.039 0.007 -‐5.8 102026
MbutiPygmy Tajik Stuttgart Kostenki -‐0.048 0.007 -‐7.3 107745
MbutiPygmy Indian MA1 Kostenki -‐0.034 0.007 -‐4.8 67360
MbutiPygmy Indian Loschbour Kostenki -‐0.036 0.006 -‐5.7 92518

92
MbutiPygmy Indian Brana Kostenki -‐0.026 0.007 -‐3.7 72306
MbutiPygmy Indian Motala Kostenki -‐0.030 0.007 -‐4.3 85057
MbutiPygmy Indian Ajv58 Kostenki -‐0.034 0.007 -‐4.9 82312
MbutiPygmy Indian Gok2 Kostenki -‐0.030 0.007 -‐4.5 63444
MbutiPygmy Indian Iceman Kostenki -‐0.017 0.007 -‐2.5 89919
MbutiPygmy Indian Stuttgart Kostenki -‐0.022 0.007 -‐3.2 95204
MbutiPygmy Han MA1 Kostenki -‐0.027 0.008 -‐3.5 96432
MbutiPygmy Han Loschbour Kostenki -‐0.021 0.007 -‐2.8 137766
MbutiPygmy Han Brana Kostenki -‐0.015 0.007 -‐2.1 98190
MbutiPygmy Han Motala Kostenki -‐0.020 0.007 -‐2.9 126212
MbutiPygmy Han Ajv58 Kostenki -‐0.019 0.007 -‐2.7 122220
MbutiPygmy Han Gok2 Kostenki -‐0.007 0.007 -‐0.9 79697
MbutiPygmy Han Iceman Kostenki 0.015 0.007 2.1 129806
MbutiPygmy Han Stuttgart Kostenki 0.000 0.007 0.0 141874
MbutiPygmy Dai MA1 Kostenki -‐0.032 0.007 -‐4.4 96628
MbutiPygmy Dai Loschbour Kostenki -‐0.017 0.007 -‐2.3 137787
MbutiPygmy Dai Brana Kostenki -‐0.017 0.007 -‐2.4 98628
MbutiPygmy Dai Motala Kostenki -‐0.014 0.007 -‐2.0 126306
MbutiPygmy Dai Ajv58 Kostenki -‐0.017 0.007 -‐2.4 122241
MbutiPygmy Dai Gok2 Kostenki -‐0.006 0.007 -‐0.9 80226
MbutiPygmy Dai Iceman Kostenki 0.015 0.007 2.2 130030
MbutiPygmy Dai Stuttgart Kostenki 0.003 0.007 0.5 142047
MbutiPygmy Karitiana MA1 Kostenki -‐0.076 0.008 -‐9.8 94637
MbutiPygmy Karitiana Loschbour Kostenki -‐0.018 0.007 -‐2.4 133143
MbutiPygmy Karitiana Brana Kostenki -‐0.015 0.007 -‐2.1 95149
MbutiPygmy Karitiana Motala Kostenki -‐0.037 0.007 -‐5.1 122668
MbutiPygmy Karitiana Ajv58 Kostenki -‐0.032 0.007 -‐4.6 118349
MbutiPygmy Karitiana Gok2 Kostenki 0.006 0.007 0.8 76768
MbutiPygmy Karitiana Iceman Kostenki 0.022 0.007 3.0 125104
MbutiPygmy Karitiana Stuttgart Kostenki 0.017 0.007 2.4 136584
MbutiPygmy Papuan MA1 Kostenki -‐0.010 0.008 -‐1.3 92223
MbutiPygmy Papuan Loschbour Kostenki -‐0.005 0.008 -‐0.6 131228
MbutiPygmy Papuan Brana Kostenki 0.002 0.008 0.3 93872
MbutiPygmy Papuan Motala Kostenki -‐0.008 0.007 -‐1.1 120638
MbutiPygmy Papuan Ajv58 Kostenki 0.000 0.007 0.0 116730
MbutiPygmy Papuan Gok2 Kostenki 0.007 0.008 0.9 75952
MbutiPygmy Papuan Iceman Kostenki 0.018 0.007 2.4 124203
MbutiPygmy Papuan Stuttgart Kostenki 0.014 0.008 1.9 135598

93
Table S12. f4-statistics f4(Sardinian, Ancient)(Modern, Papuan) for Siberian populations. p1 p2 p3 p4 f4 sdJK Z nSites
Sardinian Kostenki Altaians Papuan 0.004 0.000 8.6 450206
Sardinian Kostenki Buryats Papuan 0.002 0.000 5.3 450206
Sardinian Kostenki Dolgans Papuan 0.003 0.000 6.4 450206
Sardinian Kostenki Kets Papuan 0.003 0.000 6.1 450206
Sardinian Kostenki Khakases Papuan 0.004 0.000 9.7 450206
Sardinian Kostenki Nganassans Papuan 0.002 0.000 4.8 450206
Sardinian Kostenki Selkups Papuan 0.004 0.000 8.0 450206
Sardinian Kostenki Shors Papuan 0.004 0.000 8.0 450206
Sardinian Kostenki Tuvinians Papuan 0.003 0.000 5.8 450206
Sardinian Kostenki Nivkhs Papuan 0.003 0.000 5.9 450206
Sardinian Kostenki Yakut Papuan 0.002 0.000 5.2 450206
Sardinian Kostenki Evenkis Papuan 0.002 0.000 5.1 450206
Sardinian Kostenki Evens Papuan 0.001 0.000 3.1 450206
Sardinian Kostenki Yukaghirs Papuan 0.005 0.000 9.9 450206
Sardinian Kostenki Koryaks Papuan 0.002 0.000 4.2 450206
Sardinian Kostenki Chukchis Papuan 0.003 0.000 5.9 450206
Sardinian MA1 Altaians Papuan 0.000 0.000 1.1 361684
Sardinian MA1 Buryats Papuan 0.000 0.000 -‐0.5 361684
Sardinian MA1 Dolgans Papuan 0.000 0.000 0.3 361684
Sardinian MA1 Kets Papuan -‐0.003 0.000 -‐5.1 361684
Sardinian MA1 Khakases Papuan 0.001 0.000 1.5 361684
Sardinian MA1 Nganassans Papuan -‐0.002 0.000 -‐3.7 361684
Sardinian MA1 Selkups Papuan -‐0.001 0.000 -‐2.1 361684
Sardinian MA1 Shors Papuan -‐0.001 0.001 -‐1.1 361684
Sardinian MA1 Tuvinians Papuan 0.000 0.000 -‐1.2 361684
Sardinian MA1 Nivkhs Papuan 0.000 0.000 0.3 361684
Sardinian MA1 Yakut Papuan 0.000 0.000 -‐0.7 361684
Sardinian MA1 Evenkis Papuan 0.000 0.000 -‐1.0 361684
Sardinian MA1 Evens Papuan -‐0.002 0.000 -‐3.6 361684
Sardinian MA1 Yukaghirs Papuan 0.002 0.000 3.9 361684
Sardinian MA1 Koryaks Papuan -‐0.003 0.000 -‐5.6 361684
Sardinian MA1 Chukchis Papuan -‐0.002 0.000 -‐5.4 361684
Sardinian Loschbour Altaians Papuan 0.000 0.000 0.3 513262
Sardinian Loschbour Buryats Papuan 0.000 0.000 0.7 513262
Sardinian Loschbour Dolgans Papuan 0.000 0.000 -‐0.1 513262

94
Sardinian Loschbour Kets Papuan -‐0.001 0.000 -‐1.9 513262
Sardinian Loschbour Khakases Papuan 0.000 0.000 0.1 513262
Sardinian Loschbour Nganassans Papuan -‐0.001 0.000 -‐1.2 513262
Sardinian Loschbour Selkups Papuan -‐0.001 0.000 -‐1.6 513262
Sardinian Loschbour Shors Papuan 0.000 0.000 -‐0.6 513262
Sardinian Loschbour Tuvinians Papuan 0.000 0.000 0.9 513262
Sardinian Loschbour Nivkhs Papuan 0.000 0.000 -‐0.4 513262
Sardinian Loschbour Yakut Papuan 0.000 0.000 0.6 513262
Sardinian Loschbour Evenkis Papuan 0.000 0.000 -‐0.2 513262
Sardinian Loschbour Evens Papuan 0.000 0.000 -‐0.4 513262
Sardinian Loschbour Yukaghirs Papuan 0.000 0.000 -‐1.1 513262
Sardinian Loschbour Koryaks Papuan 0.000 0.000 -‐0.8 513262
Sardinian Loschbour Chukchis Papuan -‐0.001 0.000 -‐1.4 513262
Sardinian Brana Altaians Papuan 0.000 0.000 1.1 382865
Sardinian Brana Buryats Papuan 0.000 0.000 0.6 382865
Sardinian Brana Dolgans Papuan 0.000 0.000 0.3 382865
Sardinian Brana Kets Papuan -‐0.001 0.000 -‐1.5 382865
Sardinian Brana Khakases Papuan 0.000 0.000 0.3 382865
Sardinian Brana Nganassans Papuan 0.000 0.000 -‐1.0 382865
Sardinian Brana Selkups Papuan 0.000 0.000 -‐1.0 382865
Sardinian Brana Shors Papuan 0.000 0.000 0.0 382865
Sardinian Brana Tuvinians Papuan 0.000 0.000 0.7 382865
Sardinian Brana Nivkhs Papuan 0.000 0.000 -‐0.6 382865
Sardinian Brana Yakut Papuan 0.000 0.000 0.5 382865
Sardinian Brana Evenkis Papuan 0.000 0.000 0.5 382865
Sardinian Brana Evens Papuan -‐0.001 0.000 -‐1.3 382865
Sardinian Brana Yukaghirs Papuan 0.000 0.000 0.0 382865
Sardinian Brana Koryaks Papuan -‐0.001 0.000 -‐1.4 382865
Sardinian Brana Chukchis Papuan 0.000 0.000 -‐1.1 382865
Sardinian Motala Altaians Papuan 0.000 0.000 -‐1.4 465565
Sardinian Motala Buryats Papuan 0.000 0.000 0.1 465565
Sardinian Motala Dolgans Papuan 0.000 0.000 -‐1.1 465565
Sardinian Motala Kets Papuan -‐0.002 0.000 -‐5.5 465565
Sardinian Motala Khakases Papuan -‐0.001 0.000 -‐2.1 465565
Sardinian Motala Nganassans Papuan -‐0.001 0.000 -‐2.6 465565
Sardinian Motala Selkups Papuan -‐0.002 0.000 -‐4.7 465565
Sardinian Motala Shors Papuan -‐0.001 0.000 -‐3.5 465565
Sardinian Motala Tuvinians Papuan 0.000 0.000 -‐1.2 465565
Sardinian Motala Nivkhs Papuan 0.000 0.000 0.1 465565

95
Sardinian Motala Yakut Papuan 0.000 0.000 -‐0.7 465565
Sardinian Motala Evenkis Papuan 0.000 0.000 -‐0.5 465565
Sardinian Motala Evens Papuan -‐0.001 0.000 -‐1.7 465565
Sardinian Motala Yukaghirs Papuan 0.000 0.000 -‐1.1 465565
Sardinian Motala Koryaks Papuan -‐0.001 0.000 -‐3.2 465565
Sardinian Motala Chukchis Papuan -‐0.001 0.000 -‐3.8 465565
Sardinian Ajv58 Altaians Papuan -‐0.001 0.000 -‐2.8 460091
Sardinian Ajv58 Buryats Papuan -‐0.001 0.000 -‐1.5 460091
Sardinian Ajv58 Dolgans Papuan -‐0.001 0.000 -‐2.3 460091
Sardinian Ajv58 Kets Papuan -‐0.002 0.000 -‐5.7 460091
Sardinian Ajv58 Khakases Papuan -‐0.001 0.000 -‐2.7 460091
Sardinian Ajv58 Nganassans Papuan -‐0.002 0.000 -‐4.5 460091
Sardinian Ajv58 Selkups Papuan -‐0.002 0.000 -‐5.2 460091
Sardinian Ajv58 Shors Papuan -‐0.001 0.000 -‐3.0 460091
Sardinian Ajv58 Tuvinians Papuan -‐0.001 0.000 -‐2.5 460091
Sardinian Ajv58 Nivkhs Papuan -‐0.001 0.000 -‐1.7 460091
Sardinian Ajv58 Yakut Papuan -‐0.001 0.000 -‐2.3 460091
Sardinian Ajv58 Evenkis Papuan -‐0.001 0.000 -‐1.9 460091
Sardinian Ajv58 Evens Papuan -‐0.001 0.000 -‐3.0 460091
Sardinian Ajv58 Yukaghirs Papuan -‐0.001 0.000 -‐2.6 460091
Sardinian Ajv58 Koryaks Papuan -‐0.001 0.000 -‐3.8 460091
Sardinian Ajv58 Chukchis Papuan -‐0.002 0.000 -‐4.5 460091
Sardinian Gok2 Altaians Papuan 0.000 0.000 1.2 317281
Sardinian Gok2 Buryats Papuan 0.000 0.000 1.4 317281
Sardinian Gok2 Dolgans Papuan 0.000 0.000 0.9 317281
Sardinian Gok2 Kets Papuan 0.000 0.000 1.0 317281
Sardinian Gok2 Khakases Papuan 0.000 0.000 1.3 317281
Sardinian Gok2 Nganassans Papuan 0.000 0.000 0.1 317281
Sardinian Gok2 Selkups Papuan 0.000 0.000 0.4 317281
Sardinian Gok2 Shors Papuan 0.000 0.000 1.2 317281
Sardinian Gok2 Tuvinians Papuan 0.000 0.000 1.2 317281
Sardinian Gok2 Nivkhs Papuan 0.000 0.000 -‐0.1 317281
Sardinian Gok2 Yakut Papuan 0.000 0.000 1.3 317281
Sardinian Gok2 Evenkis Papuan 0.000 0.000 1.2 317281
Sardinian Gok2 Evens Papuan 0.000 0.000 1.2 317281
Sardinian Gok2 Yukaghirs Papuan 0.000 0.000 0.3 317281
Sardinian Gok2 Koryaks Papuan 0.000 0.000 1.3 317281
Sardinian Gok2 Chukchis Papuan 0.000 0.000 1.3 317281
Sardinian Iceman Altaians Papuan 0.001 0.000 2.1 495464

96
Sardinian Iceman Buryats Papuan 0.001 0.000 2.4 495464
Sardinian Iceman Dolgans Papuan 0.001 0.000 2.3 495464
Sardinian Iceman Kets Papuan 0.001 0.000 2.4 495464
Sardinian Iceman Khakases Papuan 0.001 0.000 2.5 495464
Sardinian Iceman Nganassans Papuan 0.001 0.000 1.9 495464
Sardinian Iceman Selkups Papuan 0.000 0.000 1.6 495464
Sardinian Iceman Shors Papuan 0.001 0.000 1.8 495464
Sardinian Iceman Tuvinians Papuan 0.001 0.000 2.8 495464
Sardinian Iceman Nivkhs Papuan 0.001 0.000 1.8 495464
Sardinian Iceman Yakut Papuan 0.001 0.000 2.6 495464
Sardinian Iceman Evenkis Papuan 0.001 0.000 2.5 495464
Sardinian Iceman Evens Papuan 0.001 0.000 2.5 495464
Sardinian Iceman Yukaghirs Papuan 0.001 0.000 2.4 495464
Sardinian Iceman Koryaks Papuan 0.001 0.000 1.5 495464
Sardinian Iceman Chukchis Papuan 0.001 0.000 2.1 495464
Sardinian Stuttgart Altaians Papuan 0.001 0.000 1.7 513224
Sardinian Stuttgart Buryats Papuan 0.000 0.000 1.4 513224
Sardinian Stuttgart Dolgans Papuan 0.000 0.000 1.5 513224
Sardinian Stuttgart Kets Papuan 0.001 0.000 1.8 513224
Sardinian Stuttgart Khakases Papuan 0.000 0.000 1.5 513224
Sardinian Stuttgart Nganassans Papuan 0.001 0.000 1.6 513224
Sardinian Stuttgart Selkups Papuan 0.001 0.000 1.6 513224
Sardinian Stuttgart Shors Papuan 0.001 0.000 2.5 513224
Sardinian Stuttgart Tuvinians Papuan 0.001 0.000 2.0 513224
Sardinian Stuttgart Nivkhs Papuan 0.001 0.000 2.4 513224
Sardinian Stuttgart Yakut Papuan 0.001 0.000 1.9 513224
Sardinian Stuttgart Evenkis Papuan 0.001 0.000 1.6 513224
Sardinian Stuttgart Evens Papuan 0.000 0.000 1.3 513224
Sardinian Stuttgart Yukaghirs Papuan 0.001 0.000 1.5 513224
Sardinian Stuttgart Koryaks Papuan 0.001 0.000 1.6 513224
Sardinian Stuttgart Chukchis Papuan 0.001 0.000 1.9 513224

97
Table S13. Correlation of f4 (Sardinian, Ancient)(Modern, Papuan) with admixture proportion of “HG” ancestral cluster individual rho p Kostenki 0.96 3.04E-‐18 MA1 -‐0.08 6.68E-‐01 Ajv58 -‐0.77 1.42E-‐07 Motala -‐0.85 6.17E-‐10 Brana -‐0.04 8.29E-‐01 Loschbour -‐0.63 7.43E-‐05

98
Table S14. “admixture” f3 for Siberian populations. For each population, the ten source population pairs with the lowest statistic are shown.. p1 p2 p3 f3 sdJK Z nSites
Altaians Evens Iceman -‐0.021 0.001 -‐31.4 454086
Altaians Evens Gok2 -‐0.021 0.001 -‐28.9 291421
Altaians Basque Evens -‐0.021 0.000 -‐53.7 476000
Altaians Sardinian Evens -‐0.020 0.000 -‐50.8 476077
Altaians Hezhen Ajv58 -‐0.020 0.001 -‐30.7 421937
Altaians NorthItalian Evens -‐0.020 0.000 -‐49.6 475581
Altaians Lithuanians Evens -‐0.020 0.000 -‐49.6 475188
Altaians Orcadian Evens -‐0.020 0.000 -‐51.6 475712
Altaians Evens Stuttgart -‐0.020 0.001 -‐28.8 470609
Altaians Tuscan Evens -‐0.020 0.000 -‐48.8 475140
Buryats Evens Iceman -‐0.007 0.001 -‐9.6 438197
Buryats Evens Gok2 -‐0.007 0.001 -‐8.8 281364
Buryats Evens Stuttgart -‐0.007 0.001 -‐9.3 454149
Buryats Sardinian Evens -‐0.007 0.000 -‐13.7 461963
Buryats Tuscan Evens -‐0.007 0.001 -‐12.9 460782
Buryats Cypriots Evens -‐0.007 0.001 -‐13.1 461247
Buryats Georgians Evens -‐0.006 0.000 -‐13.6 461650
Buryats NorthItalian Evens -‐0.006 0.001 -‐12.9 461363
Buryats Druze Evens -‐0.006 0.000 -‐13.3 462225
Buryats Spanish Evens -‐0.006 0.001 -‐12.7 461366
Chukchis Koryaks EastGreenlanders -‐0.003 0.000 -‐7.9 458150
Chukchis Koryaks WestGreenlanders -‐0.003 0.000 -‐6.8 460322
Chukchis Koryaks Loschbour -‐0.002 0.001 -‐2.2 447305
Chukchis Koryaks Ajv58 -‐0.001 0.001 -‐2.1 400993
Chukchis Koryaks Motala -‐0.001 0.001 -‐1.9 405670
Chukchis Koryaks Gok2 -‐0.001 0.001 -‐1.9 277335
Chukchis Lithuanians Koryaks -‐0.001 0.000 -‐2.6 464586
Chukchis Koryaks Surui -‐0.001 0.001 -‐1.9 450143
Chukchis Belarusians Koryaks -‐0.001 0.000 -‐2.1 464397
Chukchis Orcadian Koryaks -‐0.001 0.000 -‐2.0 466576
Dolgans Evens Gok2 -‐0.012 0.001 -‐14.7 271143
Dolgans Evens Iceman -‐0.012 0.001 -‐14.7 422451
Dolgans Sardinian Evens -‐0.012 0.001 -‐20.7 452492
Dolgans Basque Evens -‐0.011 0.001 -‐21.3 452205
Dolgans Evens Stuttgart -‐0.011 0.001 -‐14.0 437819

99
Dolgans Belarusians Evens -‐0.011 0.001 -‐19.7 450172
Dolgans Spanish Evens -‐0.011 0.001 -‐20.3 451341
Dolgans Tuscan Evens -‐0.011 0.001 -‐20.3 449998
Dolgans NorthItalian Evens -‐0.011 0.001 -‐19.9 451264
Dolgans Lithuanians Evens -‐0.011 0.001 -‐19.4 450406
Evenkis Evens Iceman -‐0.007 0.001 -‐8.8 428009
Evenkis Evens Gok2 -‐0.006 0.001 -‐8.3 274896
Evenkis Sardinian Evens -‐0.006 0.000 -‐12.8 453730
Evenkis Basque Evens -‐0.006 0.000 -‐12.4 453585
Evenkis Spanish Evens -‐0.006 0.001 -‐12.3 452974
Evenkis Evens Stuttgart -‐0.006 0.001 -‐8.5 443624
Evenkis Belarusians Evens -‐0.006 0.000 -‐12.4 452326
Evenkis Evens Loschbour -‐0.006 0.001 -‐8.0 443638
Evenkis Tuscan Evens -‐0.006 0.001 -‐11.7 452171
Evenkis French Evens -‐0.006 0.000 -‐12.5 453936
Evens Nganassans Nivkhs 0.008 0.001 13.2 415903
Evens Hezhen Nganassans 0.009 0.001 15.3 423279
Evens Japanese Nganassans 0.009 0.001 16.5 432185
Evens Daur Nganassans 0.010 0.001 17.4 426299
Evens She Nganassans 0.010 0.001 15.6 424197
Evens Tujia Nganassans 0.010 0.001 16.1 425845
Evens Xibo Nganassans 0.010 0.001 17.9 428999
Evens Han Nganassans 0.010 0.001 17.6 434447
Evens Miao Nganassans 0.010 0.001 17.2 425274
Evens Naga Nganassans 0.010 0.001 16.6 415507
Kets Evens Motala -‐0.005 0.001 -‐3.8 338072
Kets Evens Ajv58 -‐0.004 0.001 -‐2.9 334402
Kets Lithuanians Evens -‐0.002 0.001 -‐2.4 421906
Kets Evens MA1 -‐0.002 0.001 -‐1.6 262682
Kets Orcadian Evens -‐0.002 0.001 -‐1.8 425530
Kets Evens Loschbour -‐0.002 0.001 -‐1.2 373547
Kets Belarusians Evens -‐0.002 0.001 -‐1.5 421650
Kets Oroqen Motala -‐0.001 0.001 -‐0.9 338981
Kets French Evens -‐0.001 0.001 -‐1.2 429059
Kets Ucranians Evens -‐0.001 0.001 -‐1.2 427739
Khakases Basque Evens -‐0.022 0.000 -‐55.2 477854
Khakases Evens Motala -‐0.022 0.001 -‐27.9 428624
Khakases Orcadian Evens -‐0.022 0.000 -‐53.1 477598
Khakases Evens Iceman -‐0.022 0.001 -‐32.0 455875

100
Khakases Lithuanians Evens -‐0.022 0.000 -‐52.3 477070
Khakases Oroqen Motala -‐0.022 0.001 -‐31.3 428640
Khakases French Evens -‐0.022 0.000 -‐55.4 478139
Khakases Evens Gok2 -‐0.022 0.001 -‐28.4 292389
Khakases Evens Stuttgart -‐0.022 0.001 -‐31.1 472427
Khakases Hezhen Motala -‐0.022 0.001 -‐30.7 428577
Koryaks Evens Chukchis 0.016 0.001 29.1 450588
Koryaks Oroqen Chukchis 0.017 0.001 32.3 452831
Koryaks Nivkhs Chukchis 0.018 0.001 30.2 447583
Koryaks Hezhen Chukchis 0.018 0.001 33.6 452168
Koryaks Nganassans Chukchis 0.018 0.001 33.0 456451
Koryaks Daur Chukchis 0.018 0.001 34.4 453800
Koryaks Japanese Chukchis 0.018 0.001 34.9 457166
Koryaks Evenkis Chukchis 0.018 0.001 35.6 458155
Koryaks Tujia Chukchis 0.019 0.001 33.9 453696
Koryaks Naga Chukchis 0.019 0.001 31.0 448441
Nganassans Evens Ajv58 0.007 0.001 8.0 388147
Nganassans Evens Gok2 0.008 0.001 8.1 268343
Nganassans Evens Motala 0.008 0.001 8.0 392871
Nganassans Evens Loschbour 0.008 0.001 8.5 433037
Nganassans Lithuanians Evens 0.008 0.001 12.4 446603
Nganassans Evens Iceman 0.008 0.001 9.8 417811
Nganassans Belarusians Evens 0.008 0.001 12.9 446463
Nganassans Orcadian Evens 0.008 0.001 13.0 447777
Nganassans Hungarians Evens 0.009 0.001 13.6 448516
Nganassans Ucranians Evens 0.009 0.001 13.7 448607
Nivkhs Evens Gok2 0.000 0.001 0.1 216081
Nivkhs Evens Iceman 0.001 0.001 1.0 335331
Nivkhs Evens Loschbour 0.002 0.001 1.4 347894
Nivkhs Sardinian Evens 0.002 0.001 1.9 419671
Nivkhs Belarusians Evens 0.002 0.001 1.9 412685
Nivkhs Tuscan Evens 0.002 0.001 2.1 411353
Nivkhs Basque Evens 0.002 0.001 2.2 419005
Nivkhs NorthItalian Evens 0.002 0.001 2.2 415874
Nivkhs Cypriots Evens 0.003 0.001 2.4 415869
Nivkhs Oroqen Gok2 0.003 0.001 2.1 216932
Selkups Evens Motala -‐0.018 0.001 -‐22.4 419613
Selkups Evens Ajv58 -‐0.017 0.001 -‐22.0 414678
Selkups Lithuanians Evens -‐0.016 0.000 -‐34.3 469068

101
Selkups Orcadian Evens -‐0.016 0.000 -‐35.1 470037
Selkups Evens Loschbour -‐0.016 0.001 -‐19.0 462518
Selkups Belarusians Evens -‐0.015 0.000 -‐34.2 469013
Selkups Evens Iceman -‐0.015 0.001 -‐20.8 446373
Selkups Evens Gok2 -‐0.015 0.001 -‐19.5 286467
Selkups Basque Evens -‐0.015 0.000 -‐34.8 470400
Selkups French Evens -‐0.015 0.000 -‐34.6 470859
Shors Evens Motala -‐0.012 0.001 -‐9.1 347812
Shors Oroqen Motala -‐0.011 0.001 -‐9.0 348475
Shors Hezhen Motala -‐0.011 0.001 -‐8.6 347920
Shors Japanese Motala -‐0.011 0.001 -‐8.8 350077
Shors Tujia Motala -‐0.010 0.001 -‐7.8 348424
Shors Daur Motala -‐0.010 0.001 -‐8.0 348791
Shors She Motala -‐0.010 0.001 -‐7.6 348015
Shors Basque Evens -‐0.010 0.001 -‐10.8 433463
Shors Orcadian Evens -‐0.010 0.001 -‐10.9 431660
Shors Lithuanians Evens -‐0.010 0.001 -‐10.5 428328
Tuvinians Evens Gok2 -‐0.011 0.001 -‐13.9 281243
Tuvinians Evens Iceman -‐0.010 0.001 -‐14.7 438139
Tuvinians Basque Evens -‐0.010 0.000 -‐21.5 462473
Tuvinians Sardinian Evens -‐0.010 0.000 -‐21.4 462627
Tuvinians Cypriots Evens -‐0.010 0.000 -‐21.4 461850
Tuvinians Spanish Evens -‐0.010 0.001 -‐20.4 461932
Tuvinians NorthItalian Evens -‐0.010 0.000 -‐20.9 461968
Tuvinians Tuscan Evens -‐0.010 0.001 -‐19.8 461256
Tuvinians French Evens -‐0.010 0.000 -‐21.2 462811
Tuvinians Orcadian Evens -‐0.010 0.000 -‐20.5 462188
Yakut Evens Gok2 -‐0.007 0.001 -‐10.0 286746
Yakut Evens Iceman -‐0.007 0.001 -‐10.3 447040
Yakut Sardinian Evens -‐0.007 0.000 -‐14.9 468274
Yakut Basque Evens -‐0.007 0.000 -‐15.0 468250
Yakut Tuscan Evens -‐0.007 0.000 -‐14.6 467548
Yakut Spanish Evens -‐0.007 0.000 -‐14.4 467908
Yakut Belarusians Evens -‐0.007 0.000 -‐14.4 467615
Yakut Cypriots Evens -‐0.007 0.000 -‐14.4 467825
Yakut NorthItalian Evens -‐0.007 0.000 -‐14.1 467942
Yakut Georgians Evens -‐0.007 0.000 -‐14.6 468133
Yukaghirs Evens Gok2 -‐0.017 0.001 -‐18.7 267036
Yukaghirs Evens Loschbour -‐0.017 0.001 -‐18.4 431021

102
Yukaghirs Lithuanians Evens -‐0.016 0.001 -‐27.7 448486
Yukaghirs Evens Iceman -‐0.016 0.001 -‐19.1 415742
Yukaghirs Sardinian Evens -‐0.016 0.001 -‐28.3 451497
Yukaghirs Evens Stuttgart -‐0.016 0.001 -‐18.1 431259
Yukaghirs Basque Evens -‐0.016 0.001 -‐28.3 451099
Yukaghirs Belarusians Evens -‐0.015 0.001 -‐27.8 448330
Yukaghirs Orcadian Evens -‐0.015 0.001 -‐26.8 450271
Yukaghirs Evens Ajv58 -‐0.015 0.001 -‐17.8 386510

103
Table S15. f4-ratio for Neanderthal ancestry proportion with modern individuals from (34). a b c o x pNeanderthal sdJK Z nSites
Denisova Mezmaiskaya MbutiPygmy AltaiNea Sardinian 0.017 0.003 5.81 1004976
Denisova Mezmaiskaya MbutiPygmy AltaiNea French 0.016 0.003 5.53 1004799
Denisova Mezmaiskaya MbutiPygmy AltaiNea Han 0.018 0.003 5.90 1004026
Denisova Mezmaiskaya MbutiPygmy AltaiNea Dai 0.015 0.003 5.28 1003078
Denisova Mezmaiskaya MbutiPygmy AltaiNea Kostenki 0.024 0.004 6.69 897672
Denisova Mezmaiskaya MbutiPygmy AltaiNea MA1 0.018 0.004 5.07 711123
Denisova Mezmaiskaya MbutiPygmy AltaiNea Loschbour 0.019 0.003 6.04 1008232
Denisova Mezmaiskaya MbutiPygmy AltaiNea Brana 0.025 0.003 7.61 780227
Denisova Mezmaiskaya MbutiPygmy AltaiNea Motala 0.019 0.003 6.33 913741
Denisova Mezmaiskaya MbutiPygmy AltaiNea Ajv58 0.020 0.003 5.95 894481
Denisova Mezmaiskaya MbutiPygmy AltaiNea Gok2 0.016 0.003 4.87 669789
Denisova Mezmaiskaya MbutiPygmy AltaiNea Iceman 0.017 0.003 5.78 964143
Denisova Mezmaiskaya MbutiPygmy AltaiNea Stuttgart 0.019 0.003 5.89 1007448

104
Table S16. f4-ratio for Neanderthal ancestry proportion with modern individuals from (183). a b c o x pNeanderthall sdJK Z nSites
Denisova Mezmaiskaya MbutiPygmy AltaiNea Sardinian 0.017 0.003 6.01 677063
Denisova Mezmaiskaya MbutiPygmy AltaiNea French 0.016 0.003 5.43 684069
Denisova Mezmaiskaya MbutiPygmy AltaiNea Mari 0.016 0.004 3.74 178064
Denisova Mezmaiskaya MbutiPygmy AltaiNea Avar 0.015 0.003 4.74 424430
Denisova Mezmaiskaya MbutiPygmy AltaiNea Tajik 0.017 0.003 5.69 562447
Denisova Mezmaiskaya MbutiPygmy AltaiNea Indian 0.016 0.003 5.06 505542
Denisova Mezmaiskaya MbutiPygmy AltaiNea Han 0.022 0.003 6.95 683309
Denisova Mezmaiskaya MbutiPygmy AltaiNea Dai 0.017 0.003 5.66 685412
Denisova Mezmaiskaya MbutiPygmy AltaiNea Kostenki 0.023 0.004 6.27 617147
Denisova Mezmaiskaya MbutiPygmy AltaiNea MA1 0.016 0.004 4.27 488737
Denisova Mezmaiskaya MbutiPygmy AltaiNea Loschbour 0.023 0.003 6.64 692763
Denisova Mezmaiskaya MbutiPygmy AltaiNea Brana 0.026 0.004 7.22 534776
Denisova Mezmaiskaya MbutiPygmy AltaiNea Motala 0.022 0.003 6.37 628033
Denisova Mezmaiskaya MbutiPygmy AltaiNea Ajv58 0.022 0.003 6.35 615002
Denisova Mezmaiskaya MbutiPygmy AltaiNea Gok2 0.018 0.003 5.25 457380
Denisova Mezmaiskaya MbutiPygmy AltaiNea Iceman 0.017 0.003 5.49 659874
Denisova Mezmaiskaya MbutiPygmy AltaiNea Stuttgart 0.019 0.003 5.65 692220

105
Table S17. f4-ratio for Neanderthal ancestry proportion with modern individuals from (34); stratified by introgressed regions detected in modern individuals. a b c o x pNeanderthal sdJK Z nSites mask
Denisova Mezmaiskaya MbutiPygmy AltaiNea Sardinian 0,012 0,003 3,55 760521 akey
Denisova Mezmaiskaya MbutiPygmy AltaiNea Sardinian 0,002 0,003 0,48 590808 reich
Denisova Mezmaiskaya MbutiPygmy AltaiNea French 0,010 0,003 2,88 760442 akey
Denisova Mezmaiskaya MbutiPygmy AltaiNea French 0,001 0,003 0,43 590711 reich
Denisova Mezmaiskaya MbutiPygmy AltaiNea Han 0,009 0,004 2,28 759829 akey
Denisova Mezmaiskaya MbutiPygmy AltaiNea Han -‐0,003 0,004 -‐0,74 590238 reich
Denisova Mezmaiskaya MbutiPygmy AltaiNea Dai 0,006 0,003 1,67 759150 akey
Denisova Mezmaiskaya MbutiPygmy AltaiNea Dai -‐0,003 0,003 -‐0,89 589696 reich
Denisova Mezmaiskaya MbutiPygmy AltaiNea Kostenki 0,016 0,004 4,01 678656 akey
Denisova Mezmaiskaya MbutiPygmy AltaiNea Kostenki 0,009 0,004 2,19 528550 reich
Denisova Mezmaiskaya MbutiPygmy AltaiNea MA1 0,009 0,004 2,18 537658 akey
Denisova Mezmaiskaya MbutiPygmy AltaiNea MA1 -‐0,002 0,004 -‐0,46 418394 reich
Denisova Mezmaiskaya MbutiPygmy AltaiNea Loschbour 0,014 0,004 3,77 763076 akey
Denisova Mezmaiskaya MbutiPygmy AltaiNea Loschbour 0,004 0,004 1,09 592803 reich
Denisova Mezmaiskaya MbutiPygmy AltaiNea Brana 0,015 0,004 3,97 589266 akey
Denisova Mezmaiskaya MbutiPygmy AltaiNea Brana 0,004 0,004 0,96 460529 reich
Denisova Mezmaiskaya MbutiPygmy AltaiNea Motala 0,010 0,004 2,86 691658 akey
Denisova Mezmaiskaya MbutiPygmy AltaiNea Motala -‐0,001 0,004 -‐0,21 537548 reich
Denisova Mezmaiskaya MbutiPygmy AltaiNea Ajv58 0,013 0,004 3,22 676605 akey
Denisova Mezmaiskaya MbutiPygmy AltaiNea Ajv58 -‐0,001 0,004 -‐0,25 525607 reich
Denisova Mezmaiskaya MbutiPygmy AltaiNea Gok2 0,006 0,004 1,71 504954 akey
Denisova Mezmaiskaya MbutiPygmy AltaiNea Gok2 -‐0,004 0,004 -‐0,96 396489 reich
Denisova Mezmaiskaya MbutiPygmy AltaiNea Iceman 0,013 0,003 3,83 728952 akey
Denisova Mezmaiskaya MbutiPygmy AltaiNea Iceman 0,003 0,003 0,79 566745 reich
Denisova Mezmaiskaya MbutiPygmy AltaiNea Stuttgart 0,011 0,004 2,85 762518 akey
Denisova Mezmaiskaya MbutiPygmy AltaiNea Stuttgart 0,001 0,004 0,21 592314 reich

106
Table S18. f4-ratio for Neanderthal ancestry proportion with modern individuals from (183); stratified by introgressed regions detected in modern individuals. a b c o x pNean
derthal sdJK Z nSites mask
Denisova Mezmaiskaya MbutiPygmy AltaiNea Sardinian 0,011 0,003 3,22 512216 akey
Denisova Mezmaiskaya MbutiPygmy AltaiNea Sardinian 0,004 0,004 1,00 399938 reich
Denisova Mezmaiskaya MbutiPygmy AltaiNea French 0,008 0,003 2,42 517563 akey
Denisova Mezmaiskaya MbutiPygmy AltaiNea French 0,002 0,004 0,53 404314 reich
Denisova Mezmaiskaya MbutiPygmy AltaiNea Mari 0,009 0,005 1,81 133052 akey
Denisova Mezmaiskaya MbutiPygmy AltaiNea Mari 0,000 0,006 -‐0,02 109600 reich
Denisova Mezmaiskaya MbutiPygmy AltaiNea Avar 0,008 0,004 2,02 318007 akey
Denisova Mezmaiskaya MbutiPygmy AltaiNea Avar -‐0,001 0,004 -‐0,17 254814 reich
Denisova Mezmaiskaya MbutiPygmy AltaiNea Tajik 0,010 0,004 2,76 423368 akey
Denisova Mezmaiskaya MbutiPygmy AltaiNea Tajik 0,001 0,004 0,27 334278 reich
Denisova Mezmaiskaya MbutiPygmy AltaiNea Indian 0,007 0,004 1,93 380613 akey
Denisova Mezmaiskaya MbutiPygmy AltaiNea Indian 0,001 0,004 0,32 300566 reich
Denisova Mezmaiskaya MbutiPygmy AltaiNea Han 0,013 0,004 3,57 517017 akey
Denisova Mezmaiskaya MbutiPygmy AltaiNea Han 0,003 0,004 0,81 403867 reich
Denisova Mezmaiskaya MbutiPygmy AltaiNea Dai 0,007 0,003 2,13 518513 akey
Denisova Mezmaiskaya MbutiPygmy AltaiNea Dai -‐0,001 0,004 -‐0,20 405055 reich
Denisova Mezmaiskaya MbutiPygmy AltaiNea Kostenki 0,015 0,004 3,60 466502 akey
Denisova Mezmaiskaya MbutiPygmy AltaiNea Kostenki 0,007 0,004 1,64 365357 reich
Denisova Mezmaiskaya MbutiPygmy AltaiNea MA1 0,005 0,004 1,12 369742 akey
Denisova Mezmaiskaya MbutiPygmy AltaiNea MA1 -‐0,003 0,004 -‐0,68 289663 reich
Denisova Mezmaiskaya MbutiPygmy AltaiNea Loschbour 0,018 0,004 4,62 524276 akey
Denisova Mezmaiskaya MbutiPygmy AltaiNea Loschbour 0,008 0,004 1,96 409648 reich
Denisova Mezmaiskaya MbutiPygmy AltaiNea Brana 0,015 0,004 3,70 403610 akey
Denisova Mezmaiskaya MbutiPygmy AltaiNea Brana 0,006 0,004 1,35 317686 reich
Denisova Mezmaiskaya MbutiPygmy AltaiNea Motala 0,014 0,004 3,50 475259 akey
Denisova Mezmaiskaya MbutiPygmy AltaiNea Motala 0,003 0,004 0,61 371481 reich
Denisova Mezmaiskaya MbutiPygmy AltaiNea Ajv58 0,013 0,004 3,35 465111 akey
Denisova Mezmaiskaya MbutiPygmy AltaiNea Ajv58 0,002 0,004 0,37 363451 reich
Denisova Mezmaiskaya MbutiPygmy AltaiNea Gok2 0,006 0,004 1,63 344322 akey
Denisova Mezmaiskaya MbutiPygmy AltaiNea Gok2 -‐0,002 0,004 -‐0,50 272486 reich
Denisova Mezmaiskaya MbutiPygmy AltaiNea Iceman 0,011 0,004 3,13 498660 akey
Denisova Mezmaiskaya MbutiPygmy AltaiNea Iceman 0,002 0,004 0,60 390061 reich
Denisova Mezmaiskaya MbutiPygmy AltaiNea Stuttgart 0,010 0,004 2,66 523853 akey
Denisova Mezmaiskaya MbutiPygmy AltaiNea Stuttgart 0,002 0,004 0,38 409283 reich

107
Full Reference List 1. R. G. Klein, Archeology and the evolution of human behavior. Evol. Anthropol. 9, 17–36
(2000). doi:10.1002/(SICI)1520-6505(2000)9:1<17::AID-EVAN3>3.0.CO;2-A
2. P. Mellars, A new radiocarbon revolution and the dispersal of modern humans in Eurasia. Nature 439, 931–935 (2006). Medline doi:10.1038/nature04521
3. M. Rasmussen, X. Guo, Y. Wang, K. E. Lohmueller, S. Rasmussen, A. Albrechtsen, L. Skotte, S. Lindgreen, M. Metspalu, T. Jombart, T. Kivisild, W. Zhai, A. Eriksson, A. Manica, L. Orlando, F. M. De La Vega, S. Tridico, E. Metspalu, K. Nielsen, M. C. Ávila-Arcos, J. V. Moreno-Mayar, C. Muller, J. Dortch, M. T. Gilbert, O. Lund, A. Wesolowska, M. Karmin, L. A. Weinert, B. Wang, J. Li, S. Tai, F. Xiao, T. Hanihara, G. van Driem, A. R. Jha, F. X. Ricaut, P. de Knijff, A. B. Migliano, I. Gallego Romero, K. Kristiansen, D. M. Lambert, S. Brunak, P. Forster, B. Brinkmann, O. Nehlich, M. Bunce, M. Richards, R. Gupta, C. D. Bustamante, A. Krogh, R. A. Foley, M. M. Lahr, F. Balloux, T. Sicheritz-Pontén, R. Villems, R. Nielsen, J. Wang, E. Willerslev, An Aboriginal Australian genome reveals separate human dispersals into Asia. Science 334, 94–98 (2011). Medline doi:10.1126/science.1211177
4. A. E. Marks, Prehistory and Paleoenvironments in the Central Negev, Israel (Southern Methodist University Press, Dallas, 1983).
5. N. R. Rebollo, S. Weiner, F. Brock, L. Meignen, P. Goldberg, A. Belfer-Cohen, O. Bar-Yosef, E. Boaretto, New radiocarbon dating of the transition from the Middle to the Upper Paleolithic in Kebara Cave, Israel. J. Archaeol. Sci. 38, 2424–2433 (2011). doi:10.1016/j.jas.2011.05.010
6. A. Gibbons, Human evolution. Oldest Homo sapiens genome pinpoints Neandertal input. Science 343, 1417 (2014). Medline doi:10.1126/science.343.6178.1417
7. O. Bar-Yosef, A. Belfer-Cohen, D. S. Adler, The implications of the Middle-Upper Paleolithic chronological boundary in the Caucasus to Eurasian prehistory. Anthropologie XLIV, 49–60 (2006).
8. N. Sirakov, T. Tsanova, S. Sirakova, S. Taneva, I. Krumov, I. Dimitrova, N. Kovatcheva, Un nouveau faciès lamellaire du début du Paléolithique supérieur dans les Balkans. Paéorient 2007, 131–144 (2007).
9. S. Benazzi, K. Douka, C. Fornai, C. C. Bauer, O. Kullmer, J. Svoboda, I. Pap, F. Mallegni, P. Bayle, M. Coquerelle, S. Condemi, A. Ronchitelli, K. Harvati, G. W. Weber, Early dispersal of modern humans in Europe and implications for Neanderthal behaviour. Nature 479, 525–528 (2011). Medline doi:10.1038/nature10617
10. S. L. Kuhn, M. C. Stiner, E. Güleç, I. Ozer, H. Yilmaz, I. Baykara, A. Açikkol, P. Goldberg, K. M. Molina, E. Unay, F. Suata-Alpaslan, The early Upper Paleolithic occupations at Uçağizli Cave (Hatay, Turkey). J. Hum. Evol. 56, 87–113 (2009). Medline doi:10.1016/j.jhevol.2008.07.014
11. T. Higham, T. Compton, C. Stringer, R. Jacobi, B. Shapiro, E. Trinkaus, B. Chandler, F. Gröning, C. Collins, S. Hillson, P. O’Higgins, C. FitzGerald, M. Fagan, The earliest

108
evidence for anatomically modern humans in northwestern Europe. Nature 479, 521–524 (2011). Medline doi:10.1038/nature10484
12. S. E. Bailey, T. D. Weaver, J.-J. Hublin, Who made the Aurignacian and other early Upper Paleolithic industries? J. Hum. Evol. 57, 11–26 (2009). Medline doi:10.1016/j.jhevol.2009.02.003
13. C. A. Bergman, C. B. Stringer, Fifty years after: Egbert, an early Upper Palaeolithic juvenile from Ksar Akil, Lebanon. Paéorient 15, 99–111 (1989). doi:10.3406/paleo.1989.4512
14. V. Formicola, Early Aurignatian Deciduous Incisor from Riparo Bombrini at Balzi Rossi (Grimaldi, Italy). Riv. Antropol. 67, 287–292 (1989).
15. D. Henry-Gambier, C. Normand, J.-M. Pétillon, Datation radiocarbone directe et attribution culturelle des vestiges humains paléolithiques de la grotte d’Isturitz (Pyrénées-Atlantiques). Bull. Société Préhistorique Fr. 110, 645–656 (2013).
16. J.-J. Hublin, The earliest modern human colonization of Europe. Proc. Natl. Acad. Sci. U.S.A. 109, 13471–13472 (2012). Medline doi:10.1073/pnas.1211082109
17. C. Yazbeck, Le Paleolithique du Liban: Bilan critique. Paéorient 30, 111–126 (2004). doi:10.3406/paleo.2004.1015
18. P. R. Nigst, P. Haesaerts, F. Damblon, C. Frank-Fellner, C. Mallol, B. Viola, M. Götzinger, L. Niven, G. Trnka, J. J. Hublin, Early modern human settlement of Europe north of the Alps occurred 43,500 years ago in a cold steppe-type environment. Proc. Natl. Acad. Sci. U.S.A. 111, 14394–14399 (2014). Medline doi:10.1073/pnas.1412201111
19. P. Skoglund, H. Malmström, M. Raghavan, J. Storå, P. Hall, E. Willerslev, M. T. Gilbert, A. Götherström, M. Jakobsson, Origins and genetic legacy of Neolithic farmers and hunter-gatherers in Europe. Science 336, 466–469 (2012). Medline doi:10.1126/science.1216304
20. P. Skoglund, H. Malmström, A. Omrak, M. Raghavan, C. Valdiosera, T. Günther, P. Hall, K. Tambets, J. Parik, K. G. Sjögren, J. Apel, E. Willerslev, J. Storå, A. Götherström, M. Jakobsson, Genomic diversity and admixture differs for Stone-Age Scandinavian foragers and farmers. Science 344, 747–750 (2014). Medline doi:10.1126/science.1253448
21. I. Lazaridis, N. Patterson, A. Mittnik, G. Renaud, S. Mallick, K. Kirsanow, P. H. Sudmant, J. G. Schraiber, S. Castellano, M. Lipson, B. Berger, C. Economou, R. Bollongino, Q. Fu, K. I. Bos, S. Nordenfelt, H. Li, C. de Filippo, K. Prüfer, S. Sawyer, C. Posth, W. Haak, F. Hallgren, E. Fornander, N. Rohland, D. Delsate, M. Francken, J. M. Guinet, J. Wahl, G. Ayodo, H. A. Babiker, G. Bailliet, E. Balanovska, O. Balanovsky, R. Barrantes, G. Bedoya, H. Ben-Ami, J. Bene, F. Berrada, C. M. Bravi, F. Brisighelli, G. B. Busby, F. Cali, M. Churnosov, D. E. Cole, D. Corach, L. Damba, G. van Driem, S. Dryomov, J. M. Dugoujon, S. A. Fedorova, I. Gallego Romero, M. Gubina, M. Hammer, B. M. Henn, T. Hervig, U. Hodoglugil, A. R. Jha, S. Karachanak-Yankova, R. Khusainova, E. Khusnutdinova, R. Kittles, T. Kivisild, W. Klitz, V. Kučinskas, A. Kushniarevich, L. Laredj, S. Litvinov, T. Loukidis, R. W. Mahley, B. Melegh, E. Metspalu, J. Molina, J. Mountain, K. Näkkäläjärvi, D. Nesheva, T. Nyambo, L. Osipova, J. Parik, F. Platonov, O. Posukh, V. Romano, F. Rothhammer, I. Rudan, R. Ruizbakiev, H. Sahakyan, A. Sajantila, A. Salas, E. B. Starikovskaya, A. Tarekegn, D. Toncheva, S. Turdikulova, I. Uktveryte, O. Utevska, R. Vasquez, M. Villena, M. Voevoda, C. A. Winkler, L.

109
Yepiskoposyan, P. Zalloua, T. Zemunik, A. Cooper, C. Capelli, M. G. Thomas, A. Ruiz-Linares, S. A. Tishkoff, L. Singh, K. Thangaraj, R. Villems, D. Comas, R. Sukernik, M. Metspalu, M. Meyer, E. E. Eichler, J. Burger, M. Slatkin, S. Pääbo, J. Kelso, D. Reich, J. Krause, Ancient human genomes suggest three ancestral populations for present-day Europeans. Nature 513, 409–413 (2014). Medline doi:10.1038/nature13673
22. I. Olalde, M. E. Allentoft, F. Sánchez-Quinto, G. Santpere, C. W. Chiang, M. DeGiorgio, J. Prado-Martinez, J. A. Rodríguez, S. Rasmussen, J. Quilez, O. Ramírez, U. M. Marigorta, M. Fernández-Callejo, M. E. Prada, J. M. Encinas, R. Nielsen, M. G. Netea, J. Novembre, R. A. Sturm, P. Sabeti, T. Marquès-Bonet, A. Navarro, E. Willerslev, C. Lalueza-Fox, Derived immune and ancestral pigmentation alleles in a 7,000-year-old Mesolithic European. Nature 507, 225–228 (2014). Medline doi:10.1038/nature12960
23. M. Raghavan, P. Skoglund, K. E. Graf, M. Metspalu, A. Albrechtsen, I. Moltke, S. Rasmussen, T. W. Stafford Jr., L. Orlando, E. Metspalu, M. Karmin, K. Tambets, S. Rootsi, R. Mägi, P. F. Campos, E. Balanovska, O. Balanovsky, E. Khusnutdinova, S. Litvinov, L. P. Osipova, S. A. Fedorova, M. I. Voevoda, M. DeGiorgio, T. Sicheritz-Ponten, S. Brunak, S. Demeshchenko, T. Kivisild, R. Villems, R. Nielsen, M. Jakobsson, E. Willerslev, Upper Palaeolithic Siberian genome reveals dual ancestry of Native Americans. Nature 505, 87–91 (2014). Medline doi:10.1038/nature12736
24. A. N. Rogachev, Aleksandrovskoe poselenie drevnekamennogo veka u sela Kostenki na Donu (Moscow-Leningrad, 1955).
25. A. Marom, J. S. O. McCullagh, T. F. G. Higham, A. A. Sinitsyn, R. E. M. Hedges, Single amino acid radiocarbon dating of Upper Paleolithic modern humans. Proc. Natl. Acad. Sci. U.S.A. 109, 6878–6881 (2012). Medline doi:10.1073/pnas.1116328109
26. D. M. Pyle, G. D. Ricketts, V. Margari, T. H. van Andel, A. A. Sinitsyn, N. D. Praslov, S. Lisitsyn, Wide dispersal and deposition of distal tephra during the Pleistocene `Campanian Ignimbrite/Y5′ eruption, Italy. Quat. Sci. Rev. 25, 2713–2728 (2006). doi:10.1016/j.quascirev.2006.06.008
27. A. A. Sinitsyn, J. F. Hoffecker, Radiocarbon dating and chronology of the Early Upper Paleolithic at Kostenki. Quat. Int. 152-153, 164–174 (2006). doi:10.1016/j.quaint.2005.12.007
28. L. B. Vishnyatsky, P. E. Nehorosheve, in The beginning of the Upper Paleolithic on the Russian Plain. (University of California Press, Berkeley, CA, Brantingham PJ, Kuhn SL, Kerry KW., 2004), pp. 80–96.
29. N. Rohland, M. Hofreiter, Ancient DNA extraction from bones and teeth. Nat. Protoc. 2, 1756–1762 (2007). Medline doi:10.1038/nprot.2007.247
30. J. Dabney, M. Knapp, I. Glocke, M. T. Gansauge, A. Weihmann, B. Nickel, C. Valdiosera, N. García, S. Pääbo, J. L. Arsuaga, M. Meyer, Complete mitochondrial genome sequence of a Middle Pleistocene cave bear reconstructed from ultrashort DNA fragments. Proc. Natl. Acad. Sci. U.S.A. 110, 15758–15763 (2013). Medline doi:10.1073/pnas.1314445110
31. A. W. Briggs, U. Stenzel, P. L. Johnson, R. E. Green, J. Kelso, K. Prüfer, M. Meyer, J. Krause, M. T. Ronan, M. Lachmann, S. Pääbo, Patterns of damage in genomic DNA

110
sequences from a Neandertal. Proc. Natl. Acad. Sci. U.S.A. 104, 14616–14621 (2007). Medline doi:10.1073/pnas.0704665104
32. G. R. Feehery, E. Yigit, S. O. Oyola, B. W. Langhorst, V. T. Schmidt, F. J. Stewart, E. T. Dimalanta, L. A. Amaral-Zettler, T. Davis, M. A. Quail, S. Pradhan, A method for selectively enriching microbial DNA from contaminating vertebrate host DNA. PLOS ONE 8, e76096 (2013). Medline doi:10.1371/journal.pone.0076096
33. J. Krause, Q. Fu, J. M. Good, B. Viola, M. V. Shunkov, A. P. Derevianko, S. Pääbo, The complete mitochondrial DNA genome of an unknown hominin from southern Siberia. Nature 464, 894–897 (2010). Medline doi:10.1038/nature08976
34. K. Prüfer, F. Racimo, N. Patterson, F. Jay, S. Sankararaman, S. Sawyer, A. Heinze, G. Renaud, P. H. Sudmant, C. de Filippo, H. Li, S. Mallick, M. Dannemann, Q. Fu, M. Kircher, M. Kuhlwilm, M. Lachmann, M. Meyer, M. Ongyerth, M. Siebauer, C. Theunert, A. Tandon, P. Moorjani, J. Pickrell, J. C. Mullikin, S. H. Vohr, R. E. Green, I. Hellmann, P. L. Johnson, H. Blanche, H. Cann, J. O. Kitzman, J. Shendure, E. E. Eichler, E. S. Lein, T. E. Bakken, L. V. Golovanova, V. B. Doronichev, M. V. Shunkov, A. P. Derevianko, B. Viola, M. Slatkin, D. Reich, J. Kelso, S. Pääbo, The complete genome sequence of a Neanderthal from the Altai Mountains. Nature 505, 43–49 (2014). Medline doi:10.1038/nature12886
35. D. H. Alexander, J. Novembre, K. Lange, Fast model-based estimation of ancestry in unrelated individuals. Genome Res. 19, 1655–1664 (2009). Medline doi:10.1101/gr.094052.109
36. N. J. Patterson, P. Moorjani, Y. Luo, S. Mallick, N. Rohland, Y. Zhan, T. Genschoreck, T. Webster, D. Reich, Ancient admixture in human history. Genetics 2012, genetics.112.145037 (2012).
37. P. Skoglund, B. H. Northoff, M. V. Shunkov, A. P. Derevianko, S. Pääbo, J. Krause, M. Jakobsson, Separating endogenous ancient DNA from modern day contamination in a Siberian Neandertal. Proc. Natl. Acad. Sci. U.S.A. 111, 2229–2234 (2014). Medline doi:10.1073/pnas.1318934111
38. S. Sankararaman, S. Mallick, M. Dannemann, K. Prüfer, J. Kelso, S. Pääbo, N. Patterson, D. Reich, The genomic landscape of Neanderthal ancestry in present-day humans. Nature 507, 354–357 (2014). Medline doi:10.1038/nature12961
39. B. Vernot, J. M. Akey, Resurrecting surviving Neandertal lineages from modern human genomes. Science 343, 1017–1021 (2014). Medline doi:10.1126/science.1245938
40. Q. Fu, H. Li, P. Moorjani, F. Jay, S. M. Slepchenko, A. A. Bondarev, P. L. Johnson, A. Aximu-Petri, K. Prüfer, C. de Filippo, M. Meyer, N. Zwyns, D. C. Salazar-García, Y. V. Kuzmin, S. G. Keates, P. A. Kosintsev, D. I. Razhev, M. P. Richards, N. V. Peristov, M. Lachmann, K. Douka, T. F. Higham, M. Slatkin, J. J. Hublin, D. Reich, J. Kelso, T. B. Viola, S. Pääbo, Genome sequence of a 45,000-year-old modern human from western Siberia. Nature 514, 445–449 (2014). Medline doi:10.1038/nature13810
41. W. W. Howells, Skull Shapes and the Map: Craniometric Analyses in the Dispersion of Modern Homo (Harvard Univ. Press, Cambridge, 1989), Peabody Museum of Archaeology and Ethnology.

111
42. R. A. Foley, M. M. Lahr, Mode 3 technologies and the evolution of modern humans. Camb. Archaeol. J. 7, 3–36 (1997). doi:10.1017/S0959774300001451
43. N. A. Rosenberg, J. K. Pritchard, J. L. Weber, H. M. Cann, K. K. Kidd, L. A. Zhivotovsky, M. W. Feldman, Genetic structure of human populations. Science 298, 2381–2385 (2002). Medline doi:10.1126/science.1078311
44. Q. Fu, M. Meyer, X. Gao, U. Stenzel, H. A. Burbano, J. Kelso, S. Pääbo, DNA analysis of an early modern human from Tianyuan Cave, China. Proc. Natl. Acad. Sci. U.S.A. 110, 2223–2227 (2013). Medline doi:10.1073/pnas.1221359110
45. L. L. Cavalli-Sforza, P. Menozzi, A. Piazza, The History and Geography of Human Genes (Princeton Univ. Press, Princeton, N.J., Abridged edition., 1996).
46. M. V. Anikovitch, V. V. Popov, N. I. Platonova, \emphPaleolit Kostënkovsko-Borshchëvskogo Raiona v Kontekste Verkhnego Paleolita Evropy [\emphPaleolithic of the Kostenki-Boroshchevo Region in the Context of the Upper Paleolithic of Europe] (Izdatel’stvo “Nestor-Istoriia,” Sankt-Peterburg, 2008).
47. J. F. Hoffecker, M. V. Anikovitch, Kostenki: Geography and Culture. Encycl. Glob. Archaeol., 4319–4323 (2014).
48. V. T. Holliday, J. F. Hoffecker, P. Goldberg, R. I. Macphail, S. L. Forman, M. Anikovich, A. Sinitsyn, Geoarchaeology of the Kostenki–Borshchevo Sites, Don River Valley, Russia. Geoarchaeology 22, 181–228 (2007). doi:10.1002/gea.20163
49. A. N. Rogachev, The Multilevel Sites of the Kostenki-Borshevo Region on the Don and the Problem of the Development of Culture in the Upper Paleolithic Epoch on the Russian Plain (in Russian). (Akademiya Nauk SSSR, Moscow-Leningrad, 1957), Materials and Researches on the Archaeology of the USSR.
50. R. G. Klein, Man and Culture in the Late Pleistocene: A Case Study (Chandler, San Francisco, 1969).
51. A. A. Sinitsyn, Kostenki 14 (markina gora): Data, problems, and perspectives. Préhistoire Eur. 9, 273–313 (1996).
52. P. Haesaerts, F. Damblon, A. Sinitsyn, Kostienki 14 (Voronezh, Central Russia): new data on stratigraphy and radiocarbon chronology (BAR International Series 1240, 2004; http://scholar.google.com/scholar?q=related:BL07o7M2dioJ:scholar.google.com/&hl=en&num=20&as_sdt=0,5).
53. A. A. Velichko, V. V. Pisareva, S. N. Sedov, A. A. Sinitsyn, S. N. Timireva, aleogeography of kostenki-14 (markina gora). Archaeol. Ethnol. Anthropol. Eurasia 37, 35–50 (2009). doi:10.1016/j.aeae.2010.02.002
54. G. I. Lazukov, in Paleolit Kostenkovsko-Borshchevskogo Raiona na Donu 1879-1979, N. D. Praslov, A. N. Rogachev, Eds. (Nauka, Leningrad, 1982), pp. 13–37.
55. J. F. Hoffecker, V. T. Holliday, M. V. Anikovich, A. A. Sinitsyn, V. V. Popov, S. N. Lisitsyn, G. M. Levkovskaya, G. A. Pospelova, S. L. Forman, B. Giaccio, From the Bay of Naples to the River Don: The Campanian Ignimbrite eruption and the Middle to Upper Paleolithic transition in Eastern Europe. J. Hum. Evol. 55, 858–870 (2008). Medline doi:10.1016/j.jhevol.2008.08.018

112
56. B. De Vivo, G. Rolandi, P. B. Gans, A. Calvert, W. A. Bohrson, F. J. Spera, H. E. Belkin, New constraints on the pyroclastic eruptive history of the Campanian volcanic Plain (Italy). Mineral. Petrol. 73, 47–65 (2001). doi:10.1007/s007100170010
57. B. Giaccio, I. Hadjas, M. Peresani, F. G. Fedele, R. Isaia, in When Neanderthals and Modern Humans Met, N. J. Conard, Ed. (Verlag, Tubingen, 2006).
58. A. A. Sinitsyn, N. D. Praslov, Y. S. Svezhentsev, L. D. Sulerzhitskii, in Radiouglerodnaya Khronologiya Paleolita Vostochnoi Evropy i Severnoi Azii. Problemy i Perspektivny, A. A. Sinitsyn, N. D. Praslov, Eds. (Russian Academy of Sciences, St Petersburg, 1997), pp. 21–66.
59. M. V. Anikovitch, The formation of Upper Paleolithic cultures and anatomically modern humans : The East European perspective. Anthropologie 37, 115–123 (1999).
60. A. A. Sinitsyn, in Mitteilungen der Prähistorischen Kommission: Vol. 72. New aspects of the central and eastern european upper palaeolithic - methods, chronology, technology and subsistence, C. Neugebauer-Maresch, L. R. Owen, Eds. (Österreichische Akademie der Wissenschaften, Vienna, 2010), pp. 27–48.
61. P. P. Efimenko, Kostenki I (Akademiya Nauk SSSR, Moscow, 1958).
62. A. N. Rogachev, A. A. Sinitsyn, in Paleolit Kostenkovsko-Borshchevskogo Raiona na Donu 1879-1979, N. D. Praslov, A. N. Rogachev, Eds. (Akademiya Nauk SSSR, Leningrad, 1982), pp. 145–162.
63. J. F. Hoffecker, Desolate Landscapes: Ice-Age Settlement in Eastern Europe (Rutgers University Press, New Brunswick, 2002; http://books.google.com/books?hl=en&lr=&id=nXuqgInMOXIC&oi=fnd&pg=PR10&dq=Desolate+Landscapes+Ice+Age+settlement+in+Eastern+Europe&ots=UnqhIqMDGH&sig=s-iNIXf0ywYFPoXlm9y9DSTiZsY).
64. J. F. Hoffecker, I. E. Kuz’mina, E. V. Syromyatnikova, M. V. Anikovich, A. A. Sinitsyn, V. V. Popov, V. T. Holliday, Evidence for kill-butchery events of early Upper Paleolithic age at Kostenki, Russia. J. Archaeol. Sci. 37, 1073–1089 (2010). doi:10.1016/j.jas.2009.12.008
65. A. A. Sinitsyn, in Acts of the XIVth UISPP Congress (Lie`ge, 2001). General Sessions and Posters. Section 6. The Upper Paleolithic, M. Dewez, P. Noiret, E. Teheux, Eds. (British Archaeological Reports International Series, Oxford, 2004), pp. 181–190.
66. A. A. Sinitsyn, A. Palaeolithic, “Pompeii” at Kostenki, Russia. Antiquity 77, 9–214 (2003).
67. A. A. Sinitsyn, in Mitteilungen der Prähistorischen Kommission: Vol. 72. New aspects of the central and eastern european upper palaeolithic - methods, chronology, technology and subsistence, C. Neugebauer-Maresch, L. R. Owen, Eds. (Österreichische Akademie der Wissenschaften, Vienna, 2010), pp. 27–48.
68. J. F. Hoffecker, The early upper Paleolithic of eastern Europe reconsidered. Evol. Anthropol. 20, 24–39 (2011). Medline doi:10.1002/evan.20284
69. P. R. Nigst, The Early Upper Palaeolithic of the Middle Danube Region (Leiden University Press, Leiden, 2012; http://books.google.co.uk/books?id=q-

113
PhuQAACAAJ&dq=intitle:The+Early+Upper+Palaeolithic+of+the+Middle+Danube+region&hl=&cd=1&source=gbs_api).
70. J.-J. Hublin, The modern human colonization of western Eurasia: When and where? Quat. Sci. Rev. DOI:10.1016/j.quascirev.2014.08.011 (2014) (available at http://www.sciencedirect.com/science/article/pii/S0277379114003254).
71. S. L. Kuhn, M. C. Stiner, E. Güleç, Initial Upper Palaeolithic in south-central Turkey and its regional context: A preliminary report. Antiquity 73, 505–517 (1999).
72. G. B. Tostevin, thesis, Harvard University, Cambridge, Massachusetts (2000).
73. O. Bar-Yosef, in When Neanderthals and modern humans met, N. J. Conard, Ed. (Verlag, Tubingen, 2006), pp. 467–482.
74. J. F. Hoffecker, The spread of modern humans in Europe. Proc. Natl. Acad. Sci. U.S.A. 106, 16040–16045 (2009). Medline doi:10.1073/pnas.0903446106
75. U. C. Müller, J. Pross, P. C. Tzedakis, C. Gamble, U. Kotthoff, G. Schmiedl, S. Wulf, K. Christanis, The role of climate in the spread of modern humans into Europe. Quat. Sci. Rev. 30, 273–279 (2011). doi:10.1016/j.quascirev.2010.11.016
76. G. B. Tostevin, \emphSeeing Lithics: A Middle-Range Theory for Testing for Cultural Transmission in the Pleistocene (Oxbow Books, Oxford, 2012).
77. G. F. Debetz, Paleoanthropological finds at Kostenki. Sov. Etnogr. 1, 43–53 (1955).
78. P. Mellars, The Neanderthal Legacy: An Archaeological Perspective from Western Europe (Princeton Univ. Press, Princeton, 1996).
79. W. Davies, Palaeoanthropology: The time of the last Neanderthals. Nature 512, 260–261 (2014). Medline doi:10.1038/512260a
80. T. Higham, K. Douka, R. Wood, C. B. Ramsey, F. Brock, L. Basell, M. Camps, A. Arrizabalaga, J. Baena, C. Barroso-Ruíz, C. Bergman, C. Boitard, P. Boscato, M. Caparrós, N. J. Conard, C. Draily, A. Froment, B. Galván, P. Gambassini, A. Garcia-Moreno, S. Grimaldi, P. Haesaerts, B. Holt, M. J. Iriarte-Chiapusso, A. Jelinek, J. F. Jordá Pardo, J. M. Maíllo-Fernández, A. Marom, J. Maroto, M. Menéndez, L. Metz, E. Morin, A. Moroni, F. Negrino, E. Panagopoulou, M. Peresani, S. Pirson, M. de la Rasilla, J. Riel-Salvatore, A. Ronchitelli, D. Santamaria, P. Semal, L. Slimak, J. Soler, N. Soler, A. Villaluenga, R. Pinhasi, R. Jacobi, The timing and spatiotemporal patterning of Neanderthal disappearance. Nature 512, 306–309 (2014). Medline doi:10.1038/nature13621
81. C. Finlayson, F. G. Pacheco, J. Rodríguez-Vidal, D. A. Fa, J. M. Gutierrez López, A. Santiago Pérez, G. Finlayson, E. Allue, J. Baena Preysler, I. Cáceres, J. S. Carrión, Y. Fernández Jalvo, C. P. Gleed-Owen, F. J. Jimenez Espejo, P. López, J. A. López Sáez, J. A. Riquelme Cantal, A. Sánchez Marco, F. G. Guzman, K. Brown, N. Fuentes, C. A. Valarino, A. Villalpando, C. B. Stringer, F. Martinez Ruiz, T. Sakamoto, Late survival of Neanderthals at the southernmost extreme of Europe. Nature 443, 850–853 (2006). Medline doi:10.1038/nature05195

114
82. G. B. Tostevin, in More than meets the eye. Studies on Upper Palaeolithic Diversity in the Near East, A. N. Goring-Morris, A. Belfer-Cohen, Eds. (Oxbow Books, Oxford, 2003), pp. 54–67.
83. D. Richter, G. Tostevin, P. Skrdla, Bohunician technology and thermoluminescence dating of the type locality of Brno-Bohunice (Czech Republic). J. Hum. Evol. 55, 871–885 (2008). Medline doi:10.1016/j.jhevol.2008.04.008
84. C. C. Szmidt, C. Normand, G. S. Burr, G. W. L. Hodgins, S. LaMotta, AMS 14C dating the Protoaurignacian/Early Aurignacian of Isturitz, France. Implications for Neanderthal-modern human interaction and the timing of technical and cultural innovations in Europe. J. Archaeol. Sci. 37, 758–768 (2010). doi:10.1016/j.jas.2009.11.006
85. T. Goebel, A. P. Derevianko, V. T. Petrin, Dating the middle-to-upper-paleolithic transition at Kara-Bom. Curr. Anthropol. 34, 452–458 (1993). doi:10.1086/204192
86. N. Zwyns, \emphLaminar technology and the onset of the Upper Paleolithic in the Altai, Siberia (Leiden University Press, Leiden, 2012).
87. T. Goebel, M. Aksenov, Accelerator radiocarbon dating of the initial Upper Paleolithic in southeast Siberia. Antiquity 69, 349–357 (1995).
88. S. L. Kuhn, N. Zwyns, Rethinking the initial Upper Paleolithic. Quat. Int. 347, 29–38 (2014). doi:10.1016/j.quaint.2014.05.040
89. T. Goebel, Anthropology. The missing years for modern humans. Science 315, 194–196 (2007). Medline doi:10.1126/science.1137564
90. F. Bon, L’Aurignacien entre mer et Océan. Réflexion sur l’unité des phases anciennes de l’Aurignacien dans le sud de la France. Mém. Société Préhistorique Fr. 10, 253 (2002).
91. J.-L. Guadelli et al., in Les premiers peuplements en Europe. Actes du Colloque international : Données récentes sur les modalités de peuplement et sur le cadre chronostratigraphique, géologique et paléogéographique des industries du Paléolithique ancien et moyen en Europe, N. Molines, M. H. Moncel, J. L. Monnier, Eds. (Universite de Rennes, Rennes, 2005; http://halshs.archives-ouvertes.fr/halshs-00136044), pp. 87–103.
92. K. Douka, C. A. Bergman, R. E. M. Hedges, F. P. Wesselingh, T. F. G. Higham, Chronology of Ksar Akil (Lebanon) and implications for the colonization of Europe by anatomically modern humans. PLOS ONE 8, e72931 (2013). Medline doi:10.1371/journal.pone.0072931
93. M. Otte et al., The Aurignacian in the Zagros region: New research at Yafteh cave, Lorestan, Iran. Antiquity 81, 82–96 (2007).
94. T. Tsanova, N. Zwyns, L. Eizenberg, N. Teyssandier, F. Le Brun-Ricalens, M. Otte, Le plus petit dénominateur commun: Réflexion sur la variabilité des ensembles lamellaires du Paléolitque supérieur ancient d’Eurasie. Un bilan autour des exemples de Kozarnika (Est des Balkans) et Yafteh (Zagros central). Anthropologie 116, 469–509 (2012). doi:10.1016/j.anthro.2011.10.005

115
95. M. Vanhaeren, F. d’Errico, Aurignacian ethno-linguistic geography of Europe revealed by personal ornaments. J. Archaeol. Sci. 33, 1105–1128 (2006). doi:10.1016/j.jas.2005.11.017
96. V. Borgia, F. Ranaldo, A. Ronchitelli, U. Wierer, in À la recherche des identités gravettiennes: Actualités, questionnements et perspectives: Actes de la table ronde sur le Gravettien en France et dans les pays limitrophes, Aix-en-Provence, 6-8 Octobre 2008, N. Goutas, L. Klaric, D. Pesesse, P. Guillermin, Eds. (Société préhistorique française, Paris, 2011), Mémoires de la Société préhistorique française; 52, pp. 161–174.
97. D. Henry-Gambier, D. Sacchi, V.-V. I. La Crouzade, (Aude, France) : Un des plus anciens fossiles d’anatomie moderne en Europe occidentale. Bull. Mem. Soc. Anthropol. Paris 20, 79–104 (2008).
98. W. Davies, R. E. M. Hedges, Dating a type site: Fitting Szeleta cave into its regional chronometric context. Praehistorische Zeitschift 9-10, 35–45 (2008).
99. F. V. Ramírez Rozzi, F. d’Errico, M. Vanhaeren, P. M. Grootes, B. Kerautret, V. Dujardin, Cutmarked human remains bearing Neandertal features and modern human remains associated with the Aurignacian at Les Rois. J. Anthropol. Sci. 87, 153–185 (2009). Medline
100. E. Alexandrescu, A. Olariu, G. Skog, K. Stenstrom, R. Hellborg, Human fossil bones from the Muierii Cave and the Cioclovina Cave, Romania. Anthropologie 114, 341–353 (2010). doi:10.1016/j.anthro.2010.05.004
101. T. Goebel, in Emergence and Diversity of Modern Human Behavior in Paleolithic Asia, Y. Kaifu, M. Izuho, T. Goebel, H. Sato, A. Ono, Eds. (Texas A&M University Press, College Station, 2014), pp. 437–452.
102. F. Li, S. L. Kuhn, X. Gao, F. Y. Chen, Re-examination of the dates of large blade technology in China: A comparison of Shuidonggou Locality 1 and Locality 2. J. Hum. Evol. 64, 161–168 (2013). Medline doi:10.1016/j.jhevol.2012.11.001
103. F. Li et al., The development of Upper Palaeolithic China: New results from the Shuidonggou site. Antiquity 87, 368–383 (2013).
104. S. Hughes, T. J. Hayden, C. J. Douady, C. Tougard, M. Germonpré, A. Stuart, L. Lbova, R. F. Carden, C. Hänni, L. Say, Molecular phylogeny of the extinct giant deer, Megaloceros giganteus. Mol. Phylogenet. Evol. 40, 285–291 (2006). Medline doi:10.1016/j.ympev.2006.02.004
105. S. A. Gladyshev, J. W. Olsen, A. V. Tabarev, Y. V. Kuzmin, Chronology and periodization of Upper Paleolithic sites in Mongolia. Archaeol. Ethnol. Anthropol. Eurasia 38, 33–40 (2010). doi:10.1016/j.aeae.2010.10.003
106. C. Morgan et al., Redating Shuidonggou Locality 1 and Implications for the Initial Upper Paleolithic in East Asia. Radiocarbon 56, 165–179 (2014). doi:10.2458/56.16270
107. F. T. Goebel, The Middle to Upper Paleolithic Transition in Siberia. Anthropol. Pap. Univ. Alsk. 26, 94–113 (2003).
108. P. J. Brantingham, S. L. Kuhn, K. W. Kerry, \emphThe Early Upper Paleolithic beyond Western Europe (University of California Press, Los Angeles, 2004).

116
109. O. Bar-Yosef, Y. Wang, Paleolithic Archeology in China. Annu. Rev. Anthropol. 41, 319–335 (2012). doi:10.1146/annurev-anthro-092611-145832
110. I. Buvit, K. Terry, M. Izuho, in Emergence and Diversity of Modern Human Behavior in Paleolithic Asia, Y. Kaifu, M. Izuho, T. Goebel, H. Sato, A. Ono, Eds. (Texas A&M University Press, College Station, 2014), pp. 490–505.
111. K. Terry, thesis, Washington State University (2010).
112. Y. Kaifu, Emergence and Diversity of Modern Human Behavior in Paleolithic Asia (Texas A&M University Press, 2014; http://books.google.dk/books?id=88-6oAEACAAJ).
113. Y. V. Kuzmin, P. A. Kosintsev, D. I. Razhev, G. W. L. Hodgins, The oldest directly-dated human remains in Siberia: AMS 14C age of talus bone from the Baigara locality, West Siberian Plain. J. Hum. Evol. 57, 91–95 (2009). Medline doi:10.1016/j.jhevol.2009.04.003
114. N. Zwyns, D. Flas, in Les Aurignaciens, M. Otte, Ed. (Editions Errance, Paris, 2010), pp. 271–295.
115. W. Davies, P. J. Gollop, in Neanderthals and Modern Humans in the European Landscape during the Last Glaciation, T. H. van Andel, W. Davies, Eds. (McDonald Institute for Archaeological Research, Cambridge, 2003), pp. 131–146.
116. K. E. Graf, “The Good, the Bad, and the Ugly”: Evaluating the radiocarbon chronology of the middle and late Upper Paleolithic in the Enisei River valley, south-central Siberia. J. Archaeol. Sci. 37, 210–223 (2009). doi:10.1016/j.jas.2009.09.034
117. K. E. Graf, Hunter–gatherer dispersals in the mammoth-steppe: Technological provisioning and land-use in the Enisei River valley, south-central Siberia. J. Archaeol. Sci. 37, 210–223 (2010). doi:10.1016/j.jas.2009.09.034
118. C. G. Turner 2nd, Teeth and prehistory in Asia. Sci. Am. 260, 88–96 (1989). Medline doi:10.1038/scientificamerican0289-88
119. M. Mussi, J. Cinq-Mars, P. Bolduc, Echoes from the mammoth steppe: the case of the Balzi Rossi. Univ. Leiden, 106–124 (2000).
120. M. Raghavan, P. Skoglund, K. E. Graf, M. Metspalu, A. Albrechtsen, I. Moltke, S. Rasmussen, T. W. Stafford Jr., L. Orlando, E. Metspalu, M. Karmin, K. Tambets, S. Rootsi, R. Mägi, P. F. Campos, E. Balanovska, O. Balanovsky, E. Khusnutdinova, S. Litvinov, L. P. Osipova, S. A. Fedorova, M. I. Voevoda, M. DeGiorgio, T. Sicheritz-Ponten, S. Brunak, S. Demeshchenko, T. Kivisild, R. Villems, R. Nielsen, M. Jakobsson, E. Willerslev, Upper Palaeolithic Siberian genome reveals dual ancestry of Native Americans. Nature 505, 87–91 (2014). Medline doi:10.1038/nature12736
121. R. A. Housley, C. S. Gamble, M. Street, P. Pettitt, Radiocarbon evidence for the Lateglacial Human Recolonisation of Northern Europe. Proc. Prehist. Soc. 63, 25–54 (1997). doi:10.1017/S0079497X0000236X
122. C. Gamble, W. Davies, P. Pettitt, M. Richards, Climate change and evolving human diversity in Europe during the last glacial. Philos. Trans. R. Soc. Lond. B Biol. Sci. 359, 243–254 (2004). Medline doi:10.1098/rstb.2003.1396

117
123. M. Mirazon Lahr, R. A. Foley, R. Pinhasi, in Archaeogenetics: DNA and the population prehistory of Europe, C. Renfrew, K. Boyle, Eds. (McDonald Institute for Archaeological Research, Cambridge, 2000), pp. 81–88.
124. J. Krause, T. Unger, A. Noçon, A. S. Malaspinas, S. O. Kolokotronis, M. Stiller, L. Soibelzon, H. Spriggs, P. H. Dear, A. W. Briggs, S. C. Bray, S. J. O’Brien, G. Rabeder, P. Matheus, A. Cooper, M. Slatkin, S. Pääbo, M. Hofreiter, Mitochondrial genomes reveal an explosive radiation of extinct and extant bears near the Miocene-Pliocene boundary. BMC Evol. Biol. 8, 220 (2008). Medline doi:10.1186/1471-2148-8-220
125. L. Orlando, A. Ginolhac, G. Zhang, D. Froese, A. Albrechtsen, M. Stiller, M. Schubert, E. Cappellini, B. Petersen, I. Moltke, P. L. Johnson, M. Fumagalli, J. T. Vilstrup, M. Raghavan, T. Korneliussen, A. S. Malaspinas, J. Vogt, D. Szklarczyk, C. D. Kelstrup, J. Vinther, A. Dolocan, J. Stenderup, A. M. Velazquez, J. Cahill, M. Rasmussen, X. Wang, J. Min, G. D. Zazula, A. Seguin-Orlando, C. Mortensen, K. Magnussen, J. F. Thompson, J. Weinstock, K. Gregersen, K. H. Røed, V. Eisenmann, C. J. Rubin, D. C. Miller, D. F. Antczak, M. F. Bertelsen, S. Brunak, K. A. Al-Rasheid, O. Ryder, L. Andersson, J. Mundy, A. Krogh, M. T. Gilbert, K. Kjær, T. Sicheritz-Ponten, L. J. Jensen, J. V. Olsen, M. Hofreiter, R. Nielsen, B. Shapiro, J. Wang, E. Willerslev, Recalibrating Equus evolution using the genome sequence of an early Middle Pleistocene horse. Nature 499, 74–78 (2013). Medline doi:10.1038/nature12323
126. B. Llamas, M. L. Holland, K. Chen, J. E. Cropley, A. Cooper, C. M. Suter, High-resolution analysis of cytosine methylation in ancient DNA. PLOS ONE 7, e30226 (2012). Medline doi:10.1371/journal.pone.0030226
127. O. Smith, A. J. Clapham, P. Rose, Y. Liu, J. Wang, R. G. Allaby, Genomic methylation patterns in archaeological barley show de-methylation as a time-dependent diagenetic process. Sci. Rep. 4, 5559 (2014). 10.1038/srep05559 Medline doi:10.1038/srep05559
128. D. Gokhman, E. Lavi, K. Prüfer, M. F. Fraga, J. A. Riancho, J. Kelso, S. Pääbo, E. Meshorer, L. Carmel, Reconstructing the DNA methylation maps of the Neandertal and the Denisovan. Science 344, 523–527 (2014). Medline doi:10.1126/science.1250368
129. A. W. Briggs et al., Removal of deaminated cytosines and detection of in vivo methylation in ancient DNA. Nucleic Acids Res. 38, e87 (2009). Medline
130. A. Seguin-Orlando, M. Schubert, J. Clary, J. Stagegaard, M. T. Alberdi, J. L. Prado, A. Prieto, E. Willerslev, L. Orlando, Ligation bias in illumina next-generation DNA libraries: Implications for sequencing ancient genomes. PLOS ONE 8, e78575 (2013). Medline doi:10.1371/journal.pone.0078575
131. M. Meyer, M. Kircher, Illumina sequencing library preparation for highly multiplexed target capture and sequencing. Cold Spring Harb. Protoc. 2010, pdb.prot5448 (2010).
132. J. T. Vilstrup, A. Seguin-Orlando, M. Stiller, A. Ginolhac, M. Raghavan, S. C. Nielsen, J. Weinstock, D. Froese, S. K. Vasiliev, N. D. Ovodov, J. Clary, K. M. Helgen, R. C. Fleischer, A. Cooper, B. Shapiro, L. Orlando, Mitochondrial phylogenomics of modern and ancient equids. PLOS ONE 8, e55950 (2013). Medline doi:10.1371/journal.pone.0055950

118
133. M. Schubert, L. Ermini, C. Der Sarkissian, H. Jónsson, A. Ginolhac, R. Schaefer, M. D. Martin, R. Fernández, M. Kircher, M. McCue, E. Willerslev, L. Orlando, Characterization of ancient and modern genomes by SNP detection and phylogenomic and metagenomic analysis using PALEOMIX. Nat. Protoc. 9, 1056–1082 (2014). Medline doi:10.1038/nprot.2014.063
134. M. Schubert, A. Ginolhac, S. Lindgreen, J. F. Thompson, K. A. Al-Rasheid, E. Willerslev, A. Krogh, L. Orlando, Improving ancient DNA read mapping against modern reference genomes. BMC Genomics 13, 178 (2012). Medline doi:10.1186/1471-2164-13-178
135. S. Lindgreen, AdapterRemoval: Easy cleaning of next-generation sequencing reads. BMC Res. Notes 5, 337 (2012). Medline doi:10.1186/1756-0500-5-337
136. H. Li, R. Durbin, Fast and accurate short read alignment with Burrows-Wheeler transform. Bioinformatics 25, 1754–1760 (2009). Medline doi:10.1093/bioinformatics/btp324
137. A. McKenna, M. Hanna, E. Banks, A. Sivachenko, K. Cibulskis, A. Kernytsky, K. Garimella, D. Altshuler, S. Gabriel, M. Daly, M. A. DePristo, The Genome Analysis Toolkit: A MapReduce framework for analyzing next-generation DNA sequencing data. Genome Res. 20, 1297–1303 (2010). Medline doi:10.1101/gr.107524.110
138. H. Jónsson, A. Ginolhac, M. Schubert, P. L. F. Johnson, L. Orlando, mapDamage2.0: Fast approximate Bayesian estimates of ancient DNA damage parameters. Bioinformatics 29, 1682–1684 (2013). Medline doi:10.1093/bioinformatics/btt193
139. H. Li, B. Handsaker, A. Wysoker, T. Fennell, J. Ruan, N. Homer, G. Marth, G. Abecasis, R. Durbin; 1000 Genome Project Data Processing Subgroup, The Sequence Alignment/Map format and SAMtools. Bioinformatics 25, 2078–2079 (2009). Medline doi:10.1093/bioinformatics/btp352
140. Q. Fu, A. Mittnik, P. L. Johnson, K. Bos, M. Lari, R. Bollongino, C. Sun, L. Giemsch, R. Schmitz, J. Burger, A. M. Ronchitelli, F. Martini, R. G. Cremonesi, J. Svoboda, P. Bauer, D. Caramelli, S. Castellano, D. Reich, S. Pääbo, J. Krause, A revised timescale for human evolution based on ancient mitochondrial genomes. Curr. Biol. 23, 553–559 (2013). Medline doi:10.1016/j.cub.2013.02.044
141. D. Reich, R. E. Green, M. Kircher, J. Krause, N. Patterson, E. Y. Durand, B. Viola, A. W. Briggs, U. Stenzel, P. L. Johnson, T. Maricic, J. M. Good, T. Marques-Bonet, C. Alkan, Q. Fu, S. Mallick, H. Li, M. Meyer, E. E. Eichler, M. Stoneking, M. Richards, S. Talamo, M. V. Shunkov, A. P. Derevianko, J. J. Hublin, J. Kelso, M. Slatkin, S. Pääbo, Genetic history of an archaic hominin group from Denisova Cave in Siberia. Nature 468, 1053–1060 (2010). Medline doi:10.1038/nature09710
142. K. A. Frazer, D. G. Ballinger, D. R. Cox, D. A. Hinds, L. L. Stuve, R. A. Gibbs, J. W. Belmont, A. Boudreau, P. Hardenbol, S. M. Leal, S. Pasternak, D. A. Wheeler, T. D. Willis, F. Yu, H. Yang, C. Zeng, Y. Gao, H. Hu, W. Hu, C. Li, W. Lin, S. Liu, H. Pan, X. Tang, J. Wang, W. Wang, J. Yu, B. Zhang, Q. Zhang, H. Zhao, H. Zhao, J. Zhou, S. B. Gabriel, R. Barry, B. Blumenstiel, A. Camargo, M. Defelice, M. Faggart, M. Goyette, S. Gupta, J. Moore, H. Nguyen, R. C. Onofrio, M. Parkin, J. Roy, E. Stahl, E. Winchester, L. Ziaugra, D. Altshuler, Y. Shen, Z. Yao, W. Huang, X. Chu, Y. He, L. Jin, Y. Liu, Y. Shen, W. Sun, H. Wang, Y. Wang, Y. Wang, X. Xiong, L. Xu, M. M. Waye, S. K. Tsui, H. Xue, J. T. Wong, L. M. Galver, J. B. Fan, K. Gunderson, S. S. Murray, A. R. Oliphant,

119
M. S. Chee, A. Montpetit, F. Chagnon, V. Ferretti, M. Leboeuf, J. F. Olivier, M. S. Phillips, S. Roumy, C. Sallée, A. Verner, T. J. Hudson, P. Y. Kwok, D. Cai, D. C. Koboldt, R. D. Miller, L. Pawlikowska, P. Taillon-Miller, M. Xiao, L. C. Tsui, W. Mak, Y. Q. Song, P. K. Tam, Y. Nakamura, T. Kawaguchi, T. Kitamoto, T. Morizono, A. Nagashima, Y. Ohnishi, A. Sekine, T. Tanaka, T. Tsunoda, P. Deloukas, C. P. Bird, M. Delgado, E. T. Dermitzakis, R. Gwilliam, S. Hunt, J. Morrison, D. Powell, B. E. Stranger, P. Whittaker, D. R. Bentley, M. J. Daly, P. I. de Bakker, J. Barrett, Y. R. Chretien, J. Maller, S. McCarroll, N. Patterson, I. Pe’er, A. Price, S. Purcell, D. J. Richter, P. Sabeti, R. Saxena, S. F. Schaffner, P. C. Sham, P. Varilly, D. Altshuler, L. D. Stein, L. Krishnan, A. V. Smith, M. K. Tello-Ruiz, G. A. Thorisson, A. Chakravarti, P. E. Chen, D. J. Cutler, C. S. Kashuk, S. Lin, G. R. Abecasis, W. Guan, Y. Li, H. M. Munro, Z. S. Qin, D. J. Thomas, G. McVean, A. Auton, L. Bottolo, N. Cardin, S. Eyheramendy, C. Freeman, J. Marchini, S. Myers, C. Spencer, M. Stephens, P. Donnelly, L. R. Cardon, G. Clarke, D. M. Evans, A. P. Morris, B. S. Weir, T. Tsunoda, J. C. Mullikin, S. T. Sherry, M. Feolo, A. Skol, H. Zhang, C. Zeng, H. Zhao, I. Matsuda, Y. Fukushima, D. R. Macer, E. Suda, C. N. Rotimi, C. A. Adebamowo, I. Ajayi, T. Aniagwu, P. A. Marshall, C. Nkwodimmah, C. D. Royal, M. F. Leppert, M. Dixon, A. Peiffer, R. Qiu, A. Kent, K. Kato, N. Niikawa, I. F. Adewole, B. M. Knoppers, M. W. Foster, E. W. Clayton, J. Watkin, R. A. Gibbs, J. W. Belmont, D. Muzny, L. Nazareth, E. Sodergren, G. M. Weinstock, D. A. Wheeler, I. Yakub, S. B. Gabriel, R. C. Onofrio, D. J. Richter, L. Ziaugra, B. W. Birren, M. J. Daly, D. Altshuler, R. K. Wilson, L. L. Fulton, J. Rogers, J. Burton, N. P. Carter, C. M. Clee, M. Griffiths, M. C. Jones, K. McLay, R. W. Plumb, M. T. Ross, S. K. Sims, D. L. Willey, Z. Chen, H. Han, L. Kang, M. Godbout, J. C. Wallenburg, P. L’Archevêque, G. Bellemare, K. Saeki, H. Wang, D. An, H. Fu, Q. Li, Z. Wang, R. Wang, A. L. Holden, L. D. Brooks, J. E. McEwen, M. S. Guyer, V. O. Wang, J. L. Peterson, M. Shi, J. Spiegel, L. M. Sung, L. F. Zacharia, F. S. Collins, K. Kennedy, R. Jamieson, J. Stewart; International HapMap Consortium, A second generation human haplotype map of over 3.1 million SNPs. Nature 449, 851–861 (2007). Medline doi:10.1038/nature06258
143. P. Francalacci, L. Morelli, A. Angius, R. Berutti, F. Reinier, R. Atzeni, R. Pilu, F. Busonero, A. Maschio, I. Zara, D. Sanna, A. Useli, M. F. Urru, M. Marcelli, R. Cusano, M. Oppo, M. Zoledziewska, M. Pitzalis, F. Deidda, E. Porcu, F. Poddie, H. M. Kang, R. Lyons, B. Tarrier, J. B. Gresham, B. Li, S. Tofanelli, S. Alonso, M. Dei, S. Lai, A. Mulas, M. B. Whalen, S. Uzzau, C. Jones, D. Schlessinger, G. R. Abecasis, S. Sanna, C. Sidore, F. Cucca, Low-pass DNA sequencing of 1200 Sardinians reconstructs European Y-chromosome phylogeny. Science 341, 565–569 (2013). Medline doi:10.1126/science.1237947
144. G. D. Poznik, B. M. Henn, M. C. Yee, E. Sliwerska, G. M. Euskirchen, A. A. Lin, M. Snyder, L. Quintana-Murci, J. M. Kidd, P. A. Underhill, C. D. Bustamante, Sequencing Y chromosomes resolves discrepancy in time to common ancestor of males versus females. Science 341, 562–565 (2013). Medline doi:10.1126/science.1237619
145. International Society of Genetic Genealogy, Int. Soc. Genet. Geneal. (2014), (available at http://www.isogg.org Y-DNA Haplogroup Tree 2014, Version: 9.71).
146. J. Z. Li, D. M. Absher, H. Tang, A. M. Southwick, A. M. Casto, S. Ramachandran, H. M. Cann, G. S. Barsh, M. Feldman, L. L. Cavalli-Sforza, R. M. Myers, Worldwide human

120
relationships inferred from genome-wide patterns of variation. Science 319, 1100–1104 (2008). Medline doi:10.1126/science.1153717
147. J. Di Cristofaro, E. Pennarun, S. Mazières, N. M. Myres, A. A. Lin, S. A. Temori, M. Metspalu, E. Metspalu, M. Witzel, R. J. King, P. A. Underhill, R. Villems, J. Chiaroni, Afghan Hindu Kush: Where Eurasian sub-continent gene flows converge. PLOS ONE 8, e76748 (2013). Medline doi:10.1371/journal.pone.0076748
148. S. A. Fedorova, M. Reidla, E. Metspalu, M. Metspalu, S. Rootsi, K. Tambets, N. Trofimova, S. I. Zhadanov, B. Hooshiar Kashani, A. Olivieri, M. I. Voevoda, L. P. Osipova, F. A. Platonov, M. I. Tomsky, E. K. Khusnutdinova, A. Torroni, R. Villems, Autosomal and uniparental portraits of the native populations of Sakha (Yakutia): Implications for the peopling of Northeast Eurasia. BMC Evol. Biol. 13, 127 (2013). Medline doi:10.1186/1471-2148-13-127
149. B. Yunusbayev et al., The Caucasus as an asymmetric semipermeable barrier to ancient human migrations. Mol. Biol. Evol. 29, 359–365 (2011). Medline
150. G. Chaubey et al., Population genetic structure in Indian Austroasiatic speakers: The role of landscape barriers and sex-specific admixture. Mol. Biol. Evol. 28, 1013–1024 (2010). Medline
151. M. Rasmussen, Y. Li, S. Lindgreen, J. S. Pedersen, A. Albrechtsen, I. Moltke, M. Metspalu, E. Metspalu, T. Kivisild, R. Gupta, M. Bertalan, K. Nielsen, M. T. Gilbert, Y. Wang, M. Raghavan, P. F. Campos, H. M. Kamp, A. S. Wilson, A. Gledhill, S. Tridico, M. Bunce, E. D. Lorenzen, J. Binladen, X. Guo, J. Zhao, X. Zhang, H. Zhang, Z. Li, M. Chen, L. Orlando, K. Kristiansen, M. Bak, N. Tommerup, C. Bendixen, T. L. Pierre, B. Grønnow, M. Meldgaard, C. Andreasen, S. A. Fedorova, L. P. Osipova, T. F. Higham, C. B. Ramsey, T. V. Hansen, F. C. Nielsen, M. H. Crawford, S. Brunak, T. Sicheritz-Pontén, R. Villems, R. Nielsen, A. Krogh, J. Wang, E. Willerslev, Ancient human genome sequence of an extinct Palaeo-Eskimo. Nature 463, 757–762 (2010). Medline doi:10.1038/nature08835
152. M. Metspalu, I. G. Romero, B. Yunusbayev, G. Chaubey, C. B. Mallick, G. Hudjashov, M. Nelis, R. Mägi, E. Metspalu, M. Remm, R. Pitchappan, L. Singh, K. Thangaraj, R. Villems, T. Kivisild, Shared and unique components of human population structure and genome-wide signals of positive selection in South Asia. Am. J. Hum. Genet. 89, 731–744 (2011). Medline doi:10.1016/j.ajhg.2011.11.010
153. D. M. Behar, B. Yunusbayev, M. Metspalu, E. Metspalu, S. Rosset, J. Parik, S. Rootsi, G. Chaubey, I. Kutuev, G. Yudkovsky, E. K. Khusnutdinova, O. Balanovsky, O. Semino, L. Pereira, D. Comas, D. Gurwitz, B. Bonne-Tamir, T. Parfitt, M. F. Hammer, K. Skorecki, R. Villems, The genome-wide structure of the Jewish people. Nature 466, 238–242 (2010). Medline doi:10.1038/nature09103
154. I. Lazaridis, N. Patterson, A. Mittnik, G. Renaud, S. Mallick, K. Kirsanow, P. H. Sudmant, J. G. Schraiber, S. Castellano, M. Lipson, B. Berger, C. Economou, R. Bollongino, Q. Fu, K. I. Bos, S. Nordenfelt, H. Li, C. de Filippo, K. Prüfer, S. Sawyer, C. Posth, W. Haak, F. Hallgren, E. Fornander, N. Rohland, D. Delsate, M. Francken, J. M. Guinet, J. Wahl, G. Ayodo, H. A. Babiker, G. Bailliet, E. Balanovska, O. Balanovsky, R. Barrantes, G. Bedoya, H. Ben-Ami, J. Bene, F. Berrada, C. M. Bravi, F. Brisighelli, G. B. Busby, F.

121
Cali, M. Churnosov, D. E. Cole, D. Corach, L. Damba, G. van Driem, S. Dryomov, J. M. Dugoujon, S. A. Fedorova, I. Gallego Romero, M. Gubina, M. Hammer, B. M. Henn, T. Hervig, U. Hodoglugil, A. R. Jha, S. Karachanak-Yankova, R. Khusainova, E. Khusnutdinova, R. Kittles, T. Kivisild, W. Klitz, V. Kučinskas, A. Kushniarevich, L. Laredj, S. Litvinov, T. Loukidis, R. W. Mahley, B. Melegh, E. Metspalu, J. Molina, J. Mountain, K. Näkkäläjärvi, D. Nesheva, T. Nyambo, L. Osipova, J. Parik, F. Platonov, O. Posukh, V. Romano, F. Rothhammer, I. Rudan, R. Ruizbakiev, H. Sahakyan, A. Sajantila, A. Salas, E. B. Starikovskaya, A. Tarekegn, D. Toncheva, S. Turdikulova, I. Uktveryte, O. Utevska, R. Vasquez, M. Villena, M. Voevoda, C. A. Winkler, L. Yepiskoposyan, P. Zalloua, T. Zemunik, A. Cooper, C. Capelli, M. G. Thomas, A. Ruiz-Linares, S. A. Tishkoff, L. Singh, K. Thangaraj, R. Villems, D. Comas, R. Sukernik, M. Metspalu, M. Meyer, E. E. Eichler, J. Burger, M. Slatkin, S. Pääbo, J. Kelso, D. Reich, J. Krause, Ancient human genomes suggest three ancestral populations for present-day Europeans. Nature 513, 409–413 (2014). Medline doi:10.1038/nature13673
155. A. Keller, A. Graefen, M. Ball, M. Matzas, V. Boisguerin, F. Maixner, P. Leidinger, C. Backes, R. Khairat, M. Forster, B. Stade, A. Franke, J. Mayer, J. Spangler, S. McLaughlin, M. Shah, C. Lee, T. T. Harkins, A. Sartori, A. Moreno-Estrada, B. Henn, M. Sikora, O. Semino, J. Chiaroni, S. Rootsi, N. M. Myres, V. M. Cabrera, P. A. Underhill, C. D. Bustamante, E. E. Vigl, M. Samadelli, G. Cipollini, J. Haas, H. Katus, B. D. O’Connor, M. R. Carlson, B. Meder, N. Blin, E. Meese, C. M. Pusch, A. Zink, New insights into the Tyrolean Iceman’s origin and phenotype as inferred by whole-genome sequencing. Nat. Commun. 3, 698 (2012). Medline doi:10.1038/ncomms1701
156. M. Sikora, M. L. Carpenter, A. Moreno-Estrada, B. M. Henn, P. A. Underhill, F. Sánchez-Quinto, I. Zara, M. Pitzalis, C. Sidore, F. Busonero, A. Maschio, A. Angius, C. Jones, J. Mendoza-Revilla, G. Nekhrizov, D. Dimitrova, N. Theodossiev, T. T. Harkins, A. Keller, F. Maixner, A. Zink, G. Abecasis, S. Sanna, F. Cucca, C. D. Bustamante, Population genomic analysis of ancient and modern genomes yields new insights into the genetic ancestry of the Tyrolean Iceman and the genetic structure of Europe. PLOS Genet. 10, e1004353 (2014). Medline doi:10.1371/journal.pgen.1004353
157. J. K. Pickrell, J. K. Pritchard, Inference of population splits and mixtures from genome-wide allele frequency data. PLOS Genet. 8, e1002967 (2012). Medline doi:10.1371/journal.pgen.1002967
158. J. C. Dohm, C. Lottaz, T. Borodina, H. Himmelbauer, Substantial biases in ultra-short read data sets from high-throughput DNA sequencing. Nucleic Acids Res. 36, e105 (2008). Medline doi:10.1093/nar/gkn425
159. K. Nakamura, T. Oshima, T. Morimoto, S. Ikeda, H. Yoshikawa, Y. Shiwa, S. Ishikawa, M. C. Linak, A. Hirai, H. Takahashi, M. Altaf-Ul-Amin, N. Ogasawara, S. Kanaya, Sequence-specific error profile of Illumina sequencers. Nucleic Acids Res. 39, e90 (2011). Medline doi:10.1093/nar/gkr344
160. R. R. Hudson, Generating samples under a Wright-Fisher neutral model of genetic variation. Bioinformatics 18, 337–338 (2002). Medline doi:10.1093/bioinformatics/18.2.337

122
161. J. D. Wall et al., Estimating genotype error rates from high-coverage next-generation sequence data. Genome Res., gr.168393.113 (2014).
162. A. L. Price, A. Tandon, N. Patterson, K. C. Barnes, N. Rafaels, I. Ruczinski, T. H. Beaty, R. Mathias, D. Reich, S. Myers, Sensitive detection of chromosomal segments of distinct ancestry in admixed populations. PLOS Genet. 5, e1000519 (2009). Medline doi:10.1371/journal.pgen.1000519
163. S. Sankararaman, G. Kimmel, E. Halperin, M. I. Jordan, On the inference of ancestries in admixed populations. Genome Res. 18, 668–675 (2008). Medline doi:10.1101/gr.072751.107
164. G. R. Abecasis, A. Auton, L. D. Brooks, M. A. DePristo, R. M. Durbin, R. E. Handsaker, H. M. Kang, G. T. Marth, G. A. McVean; 1000 Genomes Project Consortium, An integrated map of genetic variation from 1,092 human genomes. Nature 491, 56–65 (2012). Medline doi:10.1038/nature11632
165. S. Gravel, Population genetics models of local ancestry. Genetics, genetics.112.139808 (2012).
166. R. H. Byrd, P. Lu, J. Nocedal, C. Zhu, A limited-memory algorithm for bound constrained optimization. SIAM J. Sci. Comput. 16, 1190–1208 (1994). doi:10.1137/0916069
167. M. Liang, R. Nielsen, The lengths of admixture tracts. Genetics 197, 953–967 (2014). Medline doi:10.1534/genetics.114.162362
168. P. Reimer et al., IntCal13 and Marine13 Radiocarbon Age Calibration Curves 0–50,000 Years cal BP. Radiocarbon 55, 1869–1887 (2013). doi:10.2458/azu_js_rc.55.16947
169. C. Bronk Ramsey, Bayesian analysis of radiocarbon dates. Radiocarbon 51, 337–360 (2009).
170. M. Sikora, M. L. Carpenter, A. Moreno-Estrada, B. M. Henn, P. A. Underhill, F. Sánchez-Quinto, I. Zara, M. Pitzalis, C. Sidore, F. Busonero, A. Maschio, A. Angius, C. Jones, J. Mendoza-Revilla, G. Nekhrizov, D. Dimitrova, N. Theodossiev, T. T. Harkins, A. Keller, F. Maixner, A. Zink, G. Abecasis, S. Sanna, F. Cucca, C. D. Bustamante, Population genomic analysis of ancient and modern genomes yields new insights into the genetic ancestry of the Tyrolean Iceman and the genetic structure of Europe. PLOS Genet. 10, e1004353 (2014). Medline doi:10.1371/journal.pgen.1004353
171. M. Raghavan, M. DeGiorgio, A. Albrechtsen, I. Moltke, P. Skoglund, T. S. Korneliussen, B. Grønnow, M. Appelt, H. C. Gulløv, T. M. Friesen, W. Fitzhugh, H. Malmström, S. Rasmussen, J. Olsen, L. Melchior, B. T. Fuller, S. M. Fahrni, T. Stafford Jr., V. Grimes, M. A. Renouf, J. Cybulski, N. Lynnerup, M. M. Lahr, K. Britton, R. Knecht, J. Arneborg, M. Metspalu, O. E. Cornejo, A. S. Malaspinas, Y. Wang, M. Rasmussen, V. Raghavan, T. V. Hansen, E. Khusnutdinova, T. Pierre, K. Dneprovsky, C. Andreasen, H. Lange, M. G. Hayes, J. Coltrain, V. A. Spitsyn, A. Götherström, L. Orlando, T. Kivisild, R. Villems, M. H. Crawford, F. C. Nielsen, J. Dissing, J. Heinemeier, M. Meldgaard, C. Bustamante, D. H. O’Rourke, M. Jakobsson, M. T. Gilbert, R. Nielsen, E. Willerslev, The genetic prehistory of the New World Arctic. Science 345, 1255832 (2014). Medline doi:10.1126/science.1255832

123
172. J. C. Dohm, C. Lottaz, T. Borodina, H. Himmelbauer, Substantial biases in ultra-short read data sets from high-throughput DNA sequencing. Nucleic Acids Res. 36, e105 (2008). Medline doi:10.1093/nar/gkn425
173. K. Nakamura, T. Oshima, T. Morimoto, S. Ikeda, H. Yoshikawa, Y. Shiwa, S. Ishikawa, M. C. Linak, A. Hirai, H. Takahashi, M. Altaf-Ul-Amin, N. Ogasawara, S. Kanaya, Sequence-specific error profile of Illumina sequencers. Nucleic Acids Res. 39, e90 (2011). Medline doi:10.1093/nar/gkr344
174. R. R. Hudson, Generating samples under a Wright-Fisher neutral model of genetic variation. Bioinformatics 18, 337–338 (2002). Medline doi:10.1093/bioinformatics/18.2.337
175. J. D. Wall et al., Estimating genotype error rates from high-coverage nextgeneration sequence data. Genome Res., gr.168393.113 (2014).
176. A. L. Price, A. Tandon, N. Patterson, K. C. Barnes, N. Rafaels, I. Ruczinski, T. H. Beaty, R. Mathias, D. Reich, S. Myers, Sensitive detection of chromosomal segments of distinct ancestry in admixed populations. PLOS Genet. 5, e1000519 (2009). Medline doi:10.1371/journal.pgen.1000519
177. S. Sankararaman, G. Kimmel, E. Halperin, M. I. Jordan, On the inference of ancestries in admixed populations. Genome Res. 18, 668–675 (2008). Medline doi:10.1101/gr.072751.107
178. G. R. Abecasis, A. Auton, L. D. Brooks, M. A. DePristo, R. M. Durbin, R. E. Handsaker, H. M. Kang, G. T. Marth, G. A. McVean; 1000 Genomes Project Consortium, An integrated map of genetic variation from 1,092 human genomes. Nature 491, 56–65 (2012). Medline doi:10.1038/nature11632
179. S. Gravel, Population Genetics Models of Local Ancestry. Genetics, genetics.112.139808 (2012).
180. R. H. Byrd, P. Lu, J. Nocedal, C. Zhu, A Limited-Memory Algorithm for Bound Constrained Optimization. SIAM J. Sci. Comput. 16, 1190–1208 (1994). doi:10.1137/0916069
181. M. Liang, R. Nielsen, The Lengths of Admixture Tracts. Genetics 197, 953–967 (2014). Medline doi:10.1534/genetics.114.162362
182. M. Sikora, M. L. Carpenter, A. Moreno-Estrada, B. M. Henn, P. A. Underhill, F. Sánchez-Quinto, I. Zara, M. Pitzalis, C. Sidore, F. Busonero, A. Maschio, A. Angius, C. Jones, J. Mendoza-Revilla, G. Nekhrizov, D. Dimitrova, N. Theodossiev, T. T. Harkins, A. Keller, F. Maixner, A. Zink, G. Abecasis, S. Sanna, F. Cucca, C. D. Bustamante, Population genomic analysis of ancient and modern genomes yields new insights into the genetic ancestry of the Tyrolean Iceman and the genetic structure of Europe. PLOS Genet. 10, e1004353 (2014). Medline doi:10.1371/journal.pgen.1004353
183. M. Raghavan, M. DeGiorgio, A. Albrechtsen, I. Moltke, P. Skoglund, T. S. Korneliussen, B. Grønnow, M. Appelt, H. C. Gulløv, T. M. Friesen, W. Fitzhugh, H. Malmström, S. Rasmussen, J. Olsen, L. Melchior, B. T. Fuller, S. M. Fahrni, T. Stafford Jr., V. Grimes, M. A. Renouf, J. Cybulski, N. Lynnerup, M. M. Lahr, K. Britton, R. Knecht, J. Arneborg, M. Metspalu, O. E. Cornejo, A. S. Malaspinas, Y. Wang, M. Rasmussen, V. Raghavan,
124
T. V. Hansen, E. Khusnutdinova, T. Pierre, K. Dneprovsky, C. Andreasen, H. Lange, M. G. Hayes, J. Coltrain, V. A. Spitsyn, A. Götherström, L. Orlando, T. Kivisild, R. Villems, M. H. Crawford, F. C. Nielsen, J. Dissing, J. Heinemeier, M. Meldgaard, C. Bustamante, D. H. O’Rourke, M. Jakobsson, M. T. Gilbert, R. Nielsen, E. Willerslev, The genetic prehistory of the New World Arctic. Science 345, 1255832 (2014). Medline doi:10.1126/science.1255832


