Embed Size (px)
Citation preview
AZORES 1998 - INTERNATIONAL SEMINAR ON SEISMIC RISK AND REHABILITATION OF STONE MASONRY HOUSING
1
SUMMARY
The western part of the Eurasia-Nubia plate boundary, with different tectonic styles, extends from the Azores Islands to the Strait of Gibraltar. Based on focal mechanism of large earthquakes, we observe the conversion of an extensional regime (Strike-slip and normal dip-slip motion) near to the Azores to a compressional regime (strike-slip and inverse dip-slip motion) in the east of the Atlantic Ocean (Gulf of Cádiz). The segmentation of this plate boundary is defined by a clear seismicity, which is mainly controlled by the tectonic activity existing along the Azores Gibraltar Fracture Zone (AGFZ), which extends from the Azores Islands to the Strait of Gibraltar. Seismic activity and moment tensor solutions of earthquakes indicate that present-day intraplate collisional coupling in the Western Mediterranean region is most pronounced in western Iberia and the offshore Atlantic marked by NW to N-directed horizontal compressional stresses. This is also reflected by the occurrence of historical and instrumental earthquakes, in particular by the recent earthquakes occurred on 1980 (Mw6.8), 1997 (Mw6.2), 1998 (Mw6.2) and 2007 (Mw6.3, Mw=6.1) in the Azores Islands and on 1969 (Mw7.8) and 2007 (Mw6.1) off coast of South-Western Portugal. In this work we discuss the seismic activity of the Azores region in the context of the Eurasia-Nubia plate boundary. 1. INTRODUTION
The western part of the Eurasia-Nubia plate boundary, with different tectonic styles, extends from the Azores Islands to the Strait of Gibraltar. The interaction between Iberia and Africa results in a complex region located in the western part of the Eurasian-African plate boundary. This region corresponds to the transition from an oceanic boundary (between the Azores and the Gorringe Bank), to a continental boundary where Iberia and Africa meet. The plate boundary is very well delimited in the oceanic part, from the Azores Islands along the Azores-Gibraltar fault to approximately 12ºW (west of the Strait of Gibraltar). From 12°W to 3.5°E, including the Iberia-African region and extending to the western part of Algeria, the boundary is more diffuse and forms a wider area of deformation (Buforn et al., 2004; Borges et al., 2007).
In this paper we have divided the western part of the Eurasia-Nubia plate boundary, from the Mid-Atlantic Ridge in the west to the Algiers area in the east, into six zones: zone I (from 30oW to 27oW, Triple junction to Terceira Island ), zone II (from 27oW to 23oW), zone III (from 23oW to 11oW, Gloria Fault t), zone IV (from 11oW to 6oW, Gorringe Bank to Cadiz), zone V (from 6oW to 1oW, Betic, Rif Cordilleras and Alboran Sea) and VI (from 1oW to 3.5oE, northwest Algeria and Tell Mountains). We will examine the different characteristics of these six areas using observations and change of seismicity and focal mechanisms (Fig. 1 and Fig. 2).
This work is a review and an update of two papers published recently by Buforn et al. (2004) and Borges et al. (2007).
2. THE AZORES REGION 2.1 Seismicity and tectonic setting
SEISMIC ACTIVITY IN THE AZORES REGION IN THE CONTEXT OF THE WESTERN PART OF THE EURASIA-NUBIA PLATE BOUNDARY M. Bezzeghoud, J. F. Borges, B. Caldeira Centro de Geofísica de Évora/Dept. de Física, Universidade de Évora
E. Buforn, A. Udias Dpt. de Geofísica y Meteorología, Universidad Complutense de Madrid
AZORES 1998 - INTERNATIONAL SEMINAR ON SEISMIC RISK AND REHABILITATION OF STONE MASONRY HOUSING
2
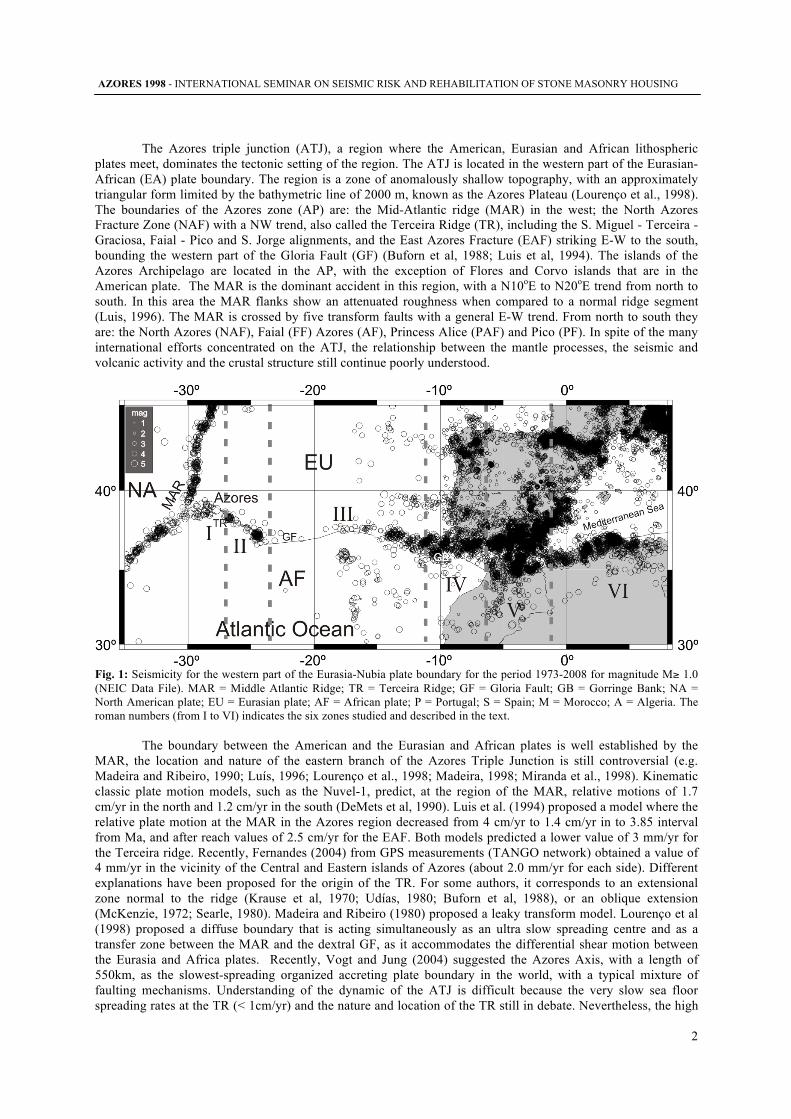
The Azores triple junction (ATJ), a region where the American, Eurasian and African lithospheric plates meet, dominates the tectonic setting of the region. The ATJ is located in the western part of the Eurasian-African (EA) plate boundary. The region is a zone of anomalously shallow topography, with an approximately triangular form limited by the bathymetric line of 2000 m, known as the Azores Plateau (Lourenço et al., 1998). The boundaries of the Azores zone (AP) are: the Mid-Atlantic ridge (MAR) in the west; the North Azores Fracture Zone (NAF) with a NW trend, also called the Terceira Ridge (TR), including the S. Miguel - Terceira - Graciosa, Faial - Pico and S. Jorge alignments, and the East Azores Fracture (EAF) striking E-W to the south, bounding the western part of the Gloria Fault (GF) (Buforn et al, 1988; Luis et al, 1994). The islands of the Azores Archipelago are located in the AP, with the exception of Flores and Corvo islands that are in the American plate. The MAR is the dominant accident in this region, with a N10oE to N20oE trend from north to south. In this area the MAR flanks show an attenuated roughness when compared to a normal ridge segment (Luis, 1996). The MAR is crossed by five transform faults with a general E-W trend. From north to south they are: the North Azores (NAF), Faial (FF) Azores (AF), Princess Alice (PAF) and Pico (PF). In spite of the many international efforts concentrated on the ATJ, the relationship between the mantle processes, the seismic and volcanic activity and the crustal structure still continue poorly understood.
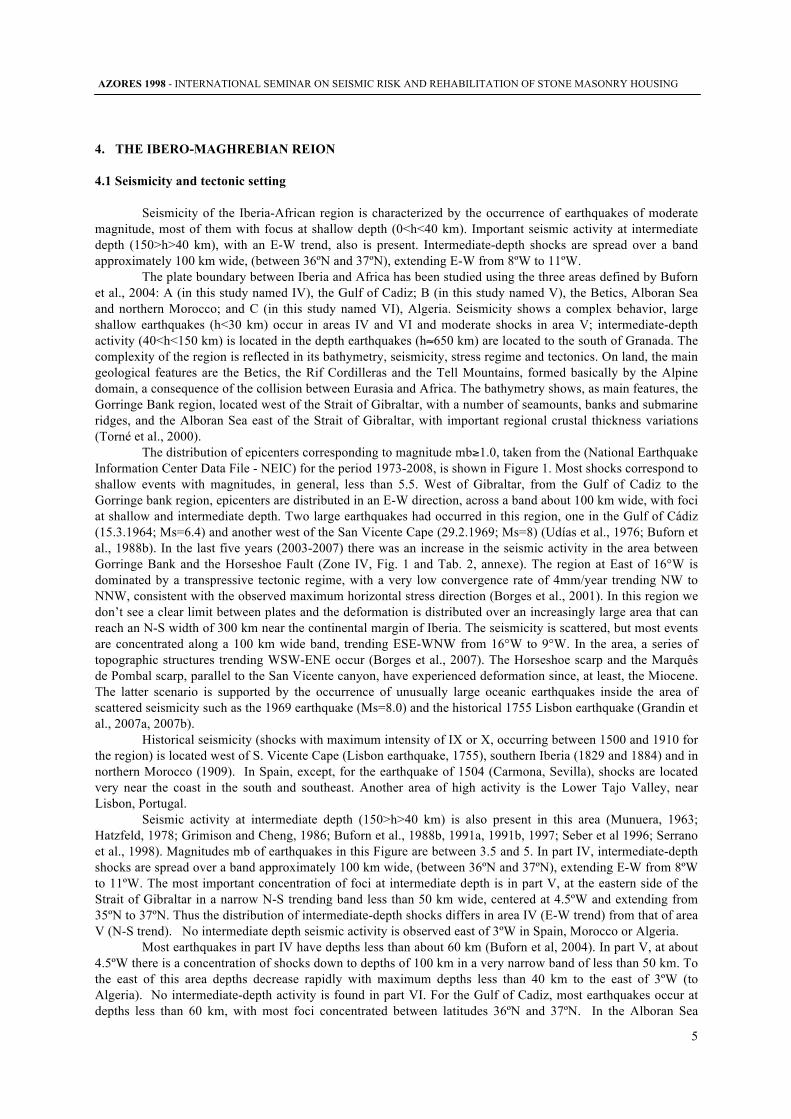
Fig. 1: Seismicity for the western part of the Eurasia-Nubia plate boundary for the period 1973-2008 for magnitude M≥ 1.0 (NEIC Data File). MAR = Middle Atlantic Ridge; TR = Terceira Ridge; GF = Gloria Fault; GB = Gorringe Bank; NA = North American plate; EU = Eurasian plate; AF = African plate; P = Portugal; S = Spain; M = Morocco; A = Algeria. The roman numbers (from I to VI) indicates the six zones studied and described in the text.
The boundary between the American and the Eurasian and African plates is well established by the
MAR, the location and nature of the eastern branch of the Azores Triple Junction is still controversial (e.g. Madeira and Ribeiro, 1990; Luís, 1996; Lourenço et al., 1998; Madeira, 1998; Miranda et al., 1998). Kinematic classic plate motion models, such as the Nuvel-1, predict, at the region of the MAR, relative motions of 1.7 cm/yr in the north and 1.2 cm/yr in the south (DeMets et al, 1990). Luis et al. (1994) proposed a model where the relative plate motion at the MAR in the Azores region decreased from 4 cm/yr to 1.4 cm/yr in to 3.85 interval from Ma, and after reach values of 2.5 cm/yr for the EAF. Both models predicted a lower value of 3 mm/yr for the Terceira ridge. Recently, Fernandes (2004) from GPS measurements (TANGO network) obtained a value of 4 mm/yr in the vicinity of the Central and Eastern islands of Azores (about 2.0 mm/yr for each side). Different explanations have been proposed for the origin of the TR. For some authors, it corresponds to an extensional zone normal to the ridge (Krause et al, 1970; Udías, 1980; Buforn et al, 1988), or an oblique extension (McKenzie, 1972; Searle, 1980). Madeira and Ribeiro (1980) proposed a leaky transform model. Lourenço et al (1998) proposed a diffuse boundary that is acting simultaneously as an ultra slow spreading centre and as a transfer zone between the MAR and the dextral GF, as it accommodates the differential shear motion between the Eurasia and Africa plates. Recently, Vogt and Jung (2004) suggested the Azores Axis, with a length of 550km, as the slowest-spreading organized accreting plate boundary in the world, with a typical mixture of faulting mechanisms. Understanding of the dynamic of the ATJ is difficult because the very slow sea floor spreading rates at the TR (< 1cm/yr) and the nature and location of the TR still in debate. Nevertheless, the high
AZORES 1998 - INTERNATIONAL SEMINAR ON SEISMIC RISK AND REHABILITATION OF STONE MASONRY HOUSING
3
level of seismicity along the MAR and the TR (Fig. 1) is strongly associated with the seafloor spreading, origin of the northeasterward motion of the Eurasian plate with respect to Africa plate (Buforn et al., 2004). This was also supported by Fernandes (2004), who proposed an elastic model with two possible configurations of the location of the ATJ: along the extension of the TR at Graciosa latitude or in the FF at Faial latitude (Fig. 1).
The seismicity of the Azores region is associated with the boundary between the Eurasian, African and American plates (Fig. 1). In general, the seismicity is of moderate magnitude and of shallow depth (h < 30 km). Since 1920 only two earthquakes have had Ms ~ 7, one on 8 May 1939, with its epicentre east of Santa María Island, and the other on 1 January 1980, with its epicentre between Terceira and Graciosa Islands. Most seismic activity is located on the Mid-Atlantic Ridge and on the North Azores fracture zone continuing into the Terceira Ridge (TR), while the East Azores fracture zone is practically inactive (Fig. 1). From historical seismicity, we know that large shocks have occurred in the Azores with maximum intensities of X (modified Mercalli - MM) (Nunes and Ribeiro, 2001). In Fig. 1, instrumental earthquakes for the period 1973-2008 (National Earthquake Information Center Data File - NEIC) with magnitudes greater than 1.0 are shown. We observe that the seismicity follow the same trend as the islands: approximately ENE from the Mid-Atlantic Ridge to Terceira Island (where the 1980 and 1998 shocks were located) and SE from Terceira Island to San Miguel Island (the 1997 earthquake was located SE of Terceira Island). Seismicity stops at 24oW where the TR joins with the Gloria fault, which is considered seismically inactive (Fig. 1).
2.2 Focal mechanisms
Focal mechanisms of the 1980, 1997 and 1998 earthquakes, together with those obtained by other
authors for the period 1990-2002, have been used by Borges et al., 2007 in order to obtain a seismotectonic model for the Azores region. The interested zone is the eastern Azores Plateau, the region delimited by the bathymetric line (2000 m). For this reason only focal mechanism showed in the Fig. 2 and given in Table 1 (annexe) are considered. In this study we updated the list of focal mechanisms for the period 2002-2007 (Fig. 2). These mechanisms have been obtained from waveform inversion, centroid moment tensor inversion and polarities.
The strike-slip motion obtained for the 1980 and 1998 earthquakes and normal faulting for the 1997 event are in agreement with the characteristic of the stress regime in the Azores region. From the triple junction to Terceira Island (Fig. 2), we can observe that most of them correspond to strike-slip solutions with planes trending in NNW-SSE and NNE-SSW directions, with the exception of one event, with normal mechanism. The other earthquakes with a normal character are located at the north of the TR boundary, far away of those with a strike slip character. The 1980 earthquake is the largest in the zone I, with a magnitude Mw=6.9. One problem for this region is the selection of the fault plane for the 1980 and 1998 shocks. The aftershock distribution obtained for the 1980 event by Hirn et al (1980) suggests the NNW-SSE as fault plane. For the 1998 shock, Vales et al (2001) obtained two alignments for the aftershocks, both with same trend as the two planes obtained from focal mechanisms. The directivity function obtained by Borges et al. (2007) shows the NNW-SSE as the fault plane for both events, with the rupture propagating to SSW.
2.3 Moment tensor
In order to quantify the results of focal mechanism, the total seismic moment have been estimated. A
solution is the use of total seismic moment for the area defined as the sum of the moment tensors calculated from individual solutions (Borges et al., 2007). Larger earthquakes with high values of M0 make a larger contribution in the estimation of total seismic moment tensor.
In accord with previous results, we have divided the whole region into two zones (zone I and zone II). In zone I, the total seismic moment tensor obtained corresponds to left-lateral strike-slip faulting with horizontal pressure and tension axes in E-W and N-S direction. The amount of non-DC (CLVD) is 8 %, which may confirm the focal mechanism represented on Figure 2 as representative of the faulting in region I. For zone II, the total moment tensor corresponds to normal faulting, with a horizontal tension axis trending to NE-SW, normal to the TR, with a CLVD amount of 12 %. The low amount of CLVD obtained for both regions confirms the mechanisms plotted in Figure 2 as representative of the stress regime and, in consequence, the change between the two areas.
This rotation on the tension and pressure axis from region I to region II is in agreement with the results obtained by Lourenço et al (1998) from morphological features based on the linear volcanic ridges orientations. For these authors, the orientation of the spreading axis calculated from Nuvel-1 model (DeMets, 1990) gives a similar value for T axis in region II, but in our case the tension axis in region I is more N-S.
AZORES 1998 - INTERNATIONAL SEMINAR ON SEISMIC RISK AND REHABILITATION OF STONE MASONRY HOUSING
4
2.4 Slip velocity
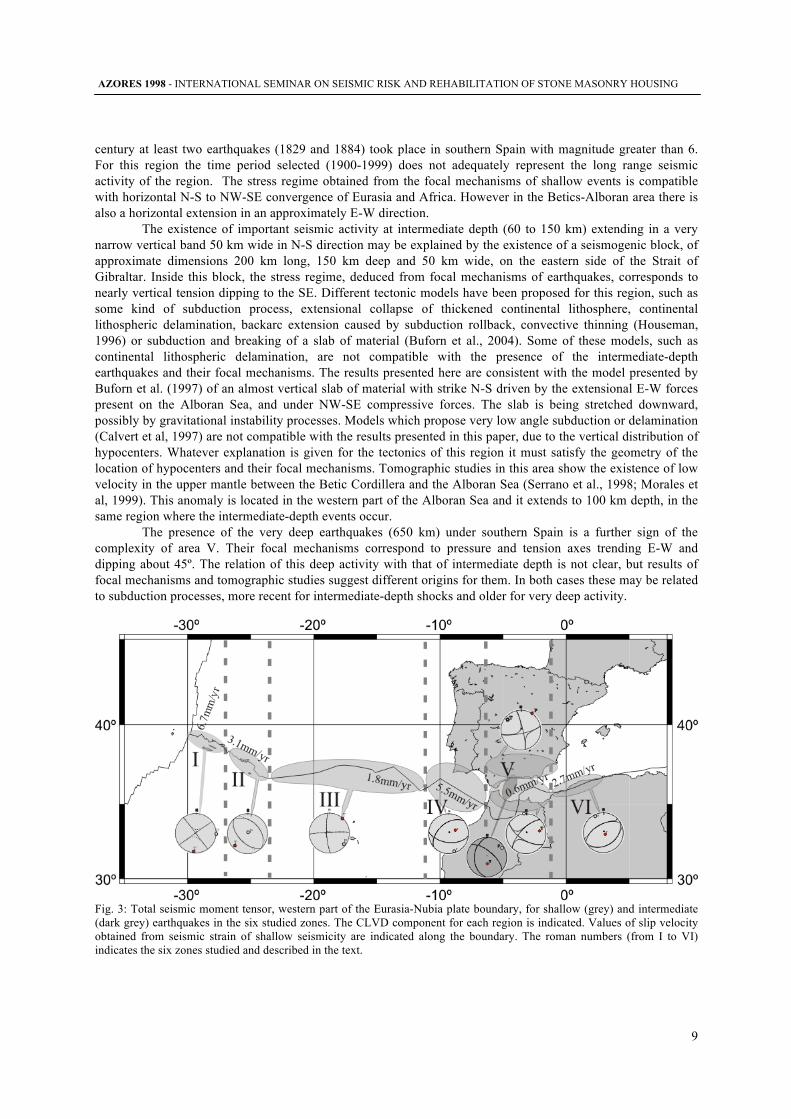
From seismicity and focal mechanisms the average slip velocity was estimated for regions I and II using data from earthquakes with a magnitude Ms≥4.0, in accord with the methodology described in Buforn et al., 2004 and Borges et al., 2007. For shocks without estimation of seismic moment, Mo, an empirical relation between Mo and Ms is derived for Azores earthquakes in the instrumental period (1973-1997) greater than Ms=4.4 (Borges, 2003). The period used is T=84 years (1923-2007) and the area corresponds to a vertical fault 10 km in width and 172 and 250 km in length for regions I and II, respectively. In Figure 3, velocities obtained are plotted.
In region I, a value of 6.7 mm/yr has been obtained versus a value of 3.1 mm/yr in region II confirming that most of the moment release occurs during largest earthquakes: the 1980 and 1939 earthquakes, for the region I and II, respectively. From historical and instrumental seismicity, we know (Tab. 1, annexe) that large earthquakes have occurred in both zones. In our case, we obtained a larger velocity in region I in comparison with the velocity of region II. In consequence, the different velocities obtained are characteristic of the region and correspond to the energy released on the seismic rupture. 3. CENTRAL REGION 3.1 Seismicity and tectonic setting
The central region, between the latitudes 23oW and 11oW, starts with the Gloria Fault (GF), habitually considered as an extension of East Azores Fracture Zone (Fig. 1). This accident, whose orientation is approximately EW, is marked clearly by the topography of the ocean bottom, until longitude of 18oW. From this longitude we observe a complex bathymetry, dominated by large submarine mountains and extended abyssal plains, where it’s difficult to identify as a clear path. Along this fracture are identified various NS parallel branches whose profiles contain significant recent scarps (Searle, 1980). Gloria Fault is a right lateral transform fault (Buforn et al., 1988). This fault shows no recent seismicity (Fig. 1), this may be due, not to the immobility of the fault, but to the high return period of earthquakes of strong magnitude, which should be more than 80 years, a period with instrumental data (Argus et al., 1989). This interpretation is reinforced by the occurrence of several earthquakes felt in the island of Santa Maria (which show a significant seismic activity in the east of the island, as the earthquake on May 8, 1939, (Ms = 7.9) occurred at the eastern extremity of GF (felt in Santa Maria with maximum intensity VII, Nunes and Ribeiro, 2001). The existence of the earthquake on November 25, 1941, with Ms 8.4, whose epicenter is located at the eastern extremity of the GF, argues this interpretation. The strong magnitude of this earthquake and the associated seismic deformation may result because the relative quietness of that fault. Another hypothesis for this behavior, although less likely, is to consider the aseismicity or the accumulated deformation generated by various low magnitude events (not detectable by global or regional seismic network). The Gloria Fault is characterized by a seismic gap that extends from the 23oW to 20oW. From this meridian to the 11oW border cards and presents an EW orientation includes several earthquakes, some of strong magnitude as the events occurred on the May 20, 1931 (Ms = 7.1), November 25, 1941 (Ms = 8.4) and May 25, 1975 (Ms=7.9). 3.2 Moment tensor and slip velocity
The moment tensor of the central region was estimated, as in the previous section, by the sum of the moment tensors of seismic events in the region. The analysis of this moment tensor shows a strike slip mechanism with a very small non-DC component (0.3%), which confirms the homogeneity of the mechanisms of this region, outcome already clear from individual focal mechanisms showed in the Figure 2. In this case, the total seismic moment tensor is controlled by the largest events (Ms=7.1 and 8.4), described in the previous section. The total moment tensor of the central region is illustrated in Figure 3.
Due to the small number of events in the central region, the slip velocity was estimated using the relationship Ms/Mo, given by Buforn et al. (1988), for whole region Azores-Gibraltar. For the central region we obtain a slip velocity of 1.8 cm/yr (Borges, 2003).
AZORES 1998 - INTERNATIONAL SEMINAR ON SEISMIC RISK AND REHABILITATION OF STONE MASONRY HOUSING
5
4. THE IBERO-MAGHREBIAN REION 4.1 Seismicity and tectonic setting
Seismicity of the Iberia-African region is characterized by the occurrence of earthquakes of moderate magnitude, most of them with focus at shallow depth (0<h<40 km). Important seismic activity at intermediate depth (150>h>40 km), with an E-W trend, also is present. Intermediate-depth shocks are spread over a band approximately 100 km wide, (between 36ºN and 37ºN), extending E-W from 8ºW to 11ºW.
The plate boundary between Iberia and Africa has been studied using the three areas defined by Buforn et al., 2004: A (in this study named IV), the Gulf of Cadiz; B (in this study named V), the Betics, Alboran Sea and northern Morocco; and C (in this study named VI), Algeria. Seismicity shows a complex behavior, large shallow earthquakes (h<30 km) occur in areas IV and VI and moderate shocks in area V; intermediate-depth activity (40<h<150 km) is located in the depth earthquakes (h≈650 km) are located to the south of Granada. The complexity of the region is reflected in its bathymetry, seismicity, stress regime and tectonics. On land, the main geological features are the Betics, the Rif Cordilleras and the Tell Mountains, formed basically by the Alpine domain, a consequence of the collision between Eurasia and Africa. The bathymetry shows, as main features, the Gorringe Bank region, located west of the Strait of Gibraltar, with a number of seamounts, banks and submarine ridges, and the Alboran Sea east of the Strait of Gibraltar, with important regional crustal thickness variations (Torné et al., 2000).
The distribution of epicenters corresponding to magnitude mb≥1.0, taken from the (National Earthquake Information Center Data File - NEIC) for the period 1973-2008, is shown in Figure 1. Most shocks correspond to shallow events with magnitudes, in general, less than 5.5. West of Gibraltar, from the Gulf of Cadiz to the Gorringe bank region, epicenters are distributed in an E-W direction, across a band about 100 km wide, with foci at shallow and intermediate depth. Two large earthquakes had occurred in this region, one in the Gulf of Cádiz (15.3.1964; Ms=6.4) and another west of the San Vicente Cape (29.2.1969; Ms=8) (Udías et al., 1976; Buforn et al., 1988b). In the last five years (2003-2007) there was an increase in the seismic activity in the area between Gorringe Bank and the Horseshoe Fault (Zone IV, Fig. 1 and Tab. 2, annexe). The region at East of 16°W is dominated by a transpressive tectonic regime, with a very low convergence rate of 4mm/year trending NW to NNW, consistent with the observed maximum horizontal stress direction (Borges et al., 2001). In this region we don’t see a clear limit between plates and the deformation is distributed over an increasingly large area that can reach an N-S width of 300 km near the continental margin of Iberia. The seismicity is scattered, but most events are concentrated along a 100 km wide band, trending ESE-WNW from 16°W to 9°W. In the area, a series of topographic structures trending WSW-ENE occur (Borges et al., 2007). The Horseshoe scarp and the Marquês de Pombal scarp, parallel to the San Vicente canyon, have experienced deformation since, at least, the Miocene. The latter scenario is supported by the occurrence of unusually large oceanic earthquakes inside the area of scattered seismicity such as the 1969 earthquake (Ms=8.0) and the historical 1755 Lisbon earthquake (Grandin et al., 2007a, 2007b).
Historical seismicity (shocks with maximum intensity of IX or X, occurring between 1500 and 1910 for the region) is located west of S. Vicente Cape (Lisbon earthquake, 1755), southern Iberia (1829 and 1884) and in northern Morocco (1909). In Spain, except, for the earthquake of 1504 (Carmona, Sevilla), shocks are located very near the coast in the south and southeast. Another area of high activity is the Lower Tajo Valley, near Lisbon, Portugal.
Seismic activity at intermediate depth (150>h>40 km) is also present in this area (Munuera, 1963; Hatzfeld, 1978; Grimison and Cheng, 1986; Buforn et al., 1988b, 1991a, 1991b, 1997; Seber et al 1996; Serrano et al., 1998). Magnitudes mb of earthquakes in this Figure are between 3.5 and 5. In part IV, intermediate-depth shocks are spread over a band approximately 100 km wide, (between 36ºN and 37ºN), extending E-W from 8ºW to 11ºW. The most important concentration of foci at intermediate depth is in part V, at the eastern side of the Strait of Gibraltar in a narrow N-S trending band less than 50 km wide, centered at 4.5ºW and extending from 35ºN to 37ºN. Thus the distribution of intermediate-depth shocks differs in area IV (E-W trend) from that of area V (N-S trend). No intermediate depth seismic activity is observed east of 3ºW in Spain, Morocco or Algeria.
Most earthquakes in part IV have depths less than about 60 km (Buforn et al, 2004). In part V, at about 4.5ºW there is a concentration of shocks down to depths of 100 km in a very narrow band of less than 50 km. To the east of this area depths decrease rapidly with maximum depths less than 40 km to the east of 3ºW (to Algeria). No intermediate-depth activity is found in part VI. For the Gulf of Cadiz, most earthquakes occur at depths less than 60 km, with most foci concentrated between latitudes 36ºN and 37ºN. In the Alboran Sea
AZORES 1998 - INTERNATIONAL SEMINAR ON SEISMIC RISK AND REHABILITATION OF STONE MASONRY HOUSING
6
depths increase to values around 100 km, with an important concentration of hypocenters between 60 and 100 km, occurs between latitudes 35ºN and 37ºN. There is an apparent gap between 30 and 50 km, for the same latitudes but this may be due to the crustal model used in the hypocentral determinations. 4.2 Focal mechanisms
The fault plane solutions show predominantly thrusting motion (Gulf of Cadiz and Algeria regions),
with an average horizontal compression in the NNW-SSE direction (Fig. 2). There exist some strike-slip mechanisms, which are also compatible with a horizontal compression in the NNW-SSE direction. For these earthquakes tension axes are also horizontal in the NNE-SSW direction. Strike-slip solutions have a predominantly E-W plane with right-lateral motion, the northern block moving east. In the Betics, Alboran Sea and northern Morocco, focal mechanisms show a greater variety of solutions as normal faulting, strike-slip mechanisms with a large component of normal motion, reverse faulting, strike-slip with a large component of reverse motion, and pure strike-slip faulting. Thus a normal component of motion is present in 15 shocks. In this respect area V differs from IV and VI, where the predominant motion is of reverse character. Most solutions in area V are compatible with a stress pattern consisting of a general horizontal tension axis in the E-W direction and a horizontal pressure axis in the NW-SE direction. Solutions with a large normal component and vertical P axis are more frequent on the south coast of Spain and the in Alboran Sea.
From the results of focal mechanisms for shallow earthquakes shown in Figure 2 and Table 1 (annexe), we observe the following (Buforn et al., 2004): 1) for areas IV and VI most solutions correspond to reverse faulting, with only three mechanisms of pure strike slip in area IV and five in area VI; a single solution corresponding to a normal motion is found in area IV and there is a total absence of this type of faulting in area VI; 2) in the area V the stress regime is more complex, strike-slip is the predominant motion and with a large component of normal and reverse faulting. A normal component is most frequent; it is present in 18 cases while reverse component is only present in 10 cases. Five mechanisms show pure normal faulting and four pure reverse faulting.
Focal mechanisms for 35 selected intermediate-depth events (mb≥3.5, Buforn et al., 2004) are shown in Figure 2 and listed in Table 1 (annexe). Most solutions correspond to earthquakes located very near the Spanish coast, where the concentration of epicenters is greater. Twelve of these solutions were obtained by modelling and inversion of body waves (Tab. 1, annexe) and the rest from first motion of P waves. Most solutions correspond to dip-slip motion, 7 to normal component and 9 to reverse component of motion. In most solutions the nearly vertical nodal plane has a mean orientation NE-SW. Only four shocks have an appreciable strike-slip component of motion. A nearly vertical tension axis has been obtained for 15 earthquakes (7 of them estimated from modelling or inversion of body waves).
A similar study has been carried out for the intermediate-depth events. The most of the mechanisms correspond to dip-slip solutions, with a greater component of reverse motions. Only three solutions correspond to pure normal motion while 10 correspond to reverse motion. About 12 solutions correspond to motion on a nearly vertical or horizontal plane. 4.3 Moment Tensor
The total seismic moment tensor, for the three areas (IV, V and VI), have been estimated using the methodology described in section 2.3 and the solutions of Table 1 (annexe). Results are shown in Figure 3. For area IV the seismic moment tensor obtained corresponds to thrusting motion. This result is due to the solution of the 1969 earthquake. A similar result have been obtained for area VI; the total seismic moment tensor shows thrusting motion due to the solutions of the earthquakes in the El Asnam region, especially that of the 1980 earthquake. The small non-DC components obtained (0.5% and 5.6% respectively) confirm that solutions obtained for both regions are very similar and that large earthquakes control the stress regime in areas IV and VI (Fig. 3).
In order to obtain coherent results, for area V it was necessary, to subdivide the region into two: one part corresponds to the Betics and the other to the Alboran Sea and Morocco. For the Betics the stress regime corresponds to strike-slip faulting with a component of reverse motion, with the pressure axis nearly horizontal and oriented in N-S direction. For Alboran and Morocco the total moment tensor shows strike-slip motion with a small component of normal motion and horizontal tension axis oriented in a NE-SW direction. The amount of non-DC component is 8.4% and 9.8% for the Betics and Alboran and Morocco respectively. The non-DC values
AZORES 1998 - INTERNATIONAL SEMINAR ON SEISMIC RISK AND REHABILITATION OF STONE MASONRY HOUSING
7
obtained for both parts of area V, each less than 15 %, indicates that for these regions the total seismic moment tensor obtained can be considered to represent the stress regime in the area. Thus in the three areas (IV, V and VI) there is a common orientation of the pressure axis which is horizontal and trending N-S to NW-SE. The tension axis is nearly vertical in areas IV and VI, and nearly horizontal in V trending E-W to NE-SW.
A similar study has been carried out for the intermediate-depth events. From the total seismic moment tensor, a solution is obtained with a steeply dipping plane oriented NW-SE and a near horizontal plane. The pressure axis is horizontal and trending to the NE and the tension axis is almost vertical, with a small dip to the SE. The amount of non-DC component (0.8%) indicates that the stress regime resulting from the focal mechanism solutions for the intermediate-depth events is fairly uniform and may be represented by the solution shown in Figure 3.
For very deep earthquakes the total seismic moment tensor has not been estimated. The reason is the small number (only four earthquakes) similar solutions of focal mechanism and the large magnitude of the 1954 earthquake. In this case the total seismic moment tensor is controlled by the largest event, with M=7, versus values of less than 5 for the other three earthquakes. 4.4 Slip velocity
From the seismicity and focal mechanisms of shallow and intermediate-depth events, different behavior of the plate boundary in the three areas IV, V and VI from the Gulf of Cadiz to Algeria may be deduced. In order to quantify the characteristics of the seismicity in these three areas, the seismic moment rate and slip velocity have been estimated for each of them (Fig. 3). The moment rate was estimated from shallow earthquakes occurring in each area during the period 1900-1999 with magnitude mb≥5.0. We used an empirical relation between magnitude mb and scalar seismic moment Mo obtained from events with Mo values determined from spectra of body waves. The relation is similar to that obtained by other authors (Buforn et al. 1988a; 2004).
The moment rate M0 was estimated by dividing the sum of the scalar seismic moment in each of the three areas by the time period (100 years) and the average slip velocity was estimated using the methodology described by Buforn et al. (2004).
For areas IV and VI the same order of magnitude for the moment rate was obtained: 9.2x10¹⁷ Nm/yr for IV and 3.7x10¹⁷ Nm/yr for VI. These values are conditioned by the large earthquakes that occurred in area IV in 1964 and 1969 and in area VI in 1954 and 1980. However, for area V the moment rate (1.4x10¹⁶ Nm/yr) is nearly two orders of magnitude lower than that obtained for IV and one order of magnitude lower than that for VI. This is due to the fact that the maximum magnitude of earthquakes during the 20th century in area V is lower than 6 (largest shallow earthquake was Ms = 5.1 in 1951).
Values of slip velocity for the Ibero-Maghrebian area are listed in Table 3: 5.5 mm/yr and 2.7 mm/yr for areas IV and VI and 0.6 mm/yr for area V. We have compared these results with the relative motions of Africa with relation to Eurasia predicted by the models NUVEL-1a (DeMets et al., 1990) and DEOSK2 (Buforn et. al., 2004). These values have been estimated at the following points: 36.25ºN, -8.5ºW for area IV; 37.0ºN, -2.5ºW for area V and 36.25ºN, 1.25ºE for area VI. For area IV, similar values are obtained in our study and by NUVEL-1a and DEOSK2, about 5mm/yr in each case. For area VI our velocity of 2.7mm/yr is approximately 50% of the value obtained using NUVEL-1a and DEOSK2 models. But the largest difference occurs in area V, where the velocity predicted by the models is very similar (5.2 mm/yr and 5.4 mm/yr respectively) while our estimations give only 0.6 mm/yr, that is, only about 10% of the modeled values. This may indicate that only a small fraction of the deformation was released seismically during the 20th century.
5. DISCUSSION AND CONCLUSION 5.1 Azores region
The Azores-Gibraltar-North Algeria boundary zone, which can be divided into six zones, with a change in the seismicity. Two types of mechanisms are observed in the Azores plateau, one in the Central region and three in the Iberian–Maghrebian region for shallow depth earthquakes and one for the intermediate depth earthquakes localized in the Alboran sea, including the SW continental margin.
AZORES 1998 - INTERNATIONAL SEMINAR ON SEISMIC RISK AND REHABILITATION OF STONE MASONRY HOUSING
8
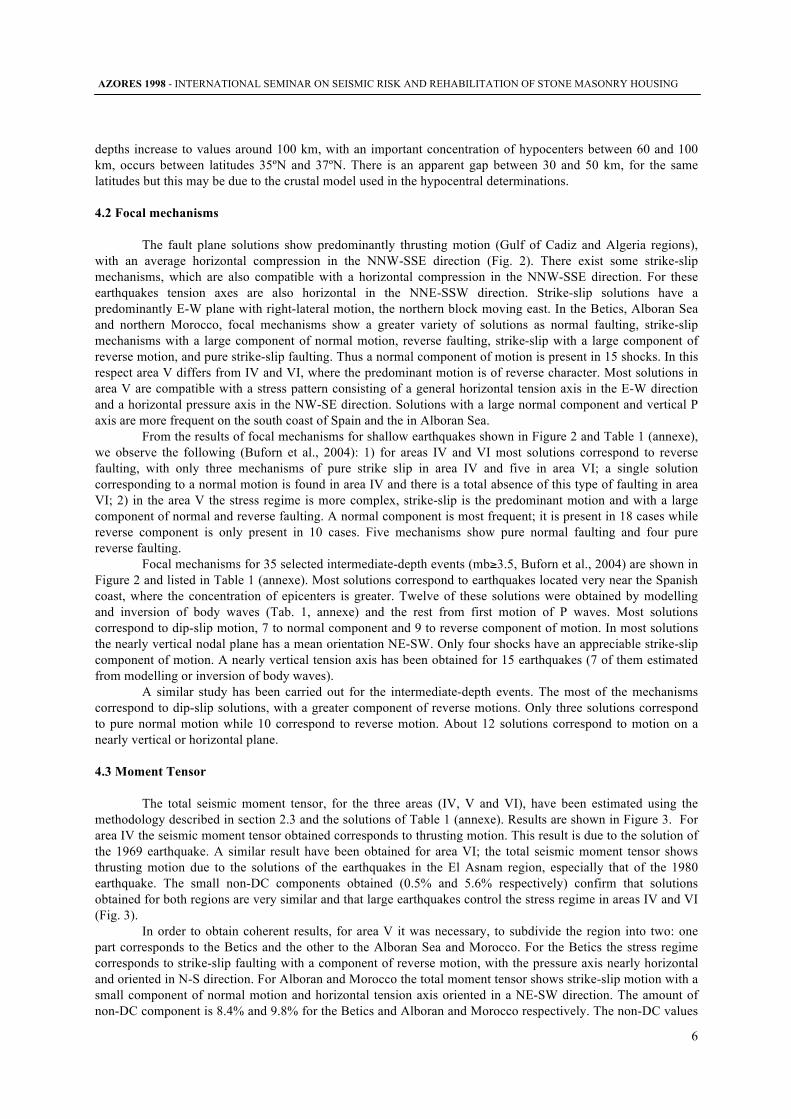
Fig. 2: Focal mechanisms, in the western part of the Eurasia-Nubia plate boundary, for shallow earthquakes (h<40 km) and mb≥5.0, before 1975 and mb≥4.0 after 1975, for intermediate depth earthquakes (40<h<150 km) and for very deep depth earthquakes (h>600 km). Size is proportional to magnitude. Solutions parameters for focal mechanisms are listed in Table 1 (annexe). P = Portugal; S = Spain; M = Morocco; A = Algeria. MAR, TR, GF, GB, NA, EU e AF as in Figure 1.
Azores region: Zone I is ENE-WSW in direction, and zone II NW-SE. Earthquakes located in region I
show a left-lateral strike-slip motion with horizontal extension in a N-S to NNE-SSW direction and horizontal E-W compression. This different stress pattern is also present in the velocities estimated from seismic data for regions I and II, faster in region I, 6.7 mm/yr, versus 3.1 mm/yr in region II. However the regional stress pattern corresponds to a horizontal extension with an average velocity for the whole of the region of 2.3 mm/yr.
Central region: Zone III is characterized by a large linear feature and a very scarce seismicity (Gloria
fault) controlled by right strike slip motion due to some larges historical events (1939, Ms=7.9; 1941, Ms=8.41; 975, Ms=7.9). From the latitude of 18oW, it is possible to identify two alignments of earthquakes: 1) the first, oriented towards EW, is the extension of the GF and should correspond to the border of plates; 2) the second, oriented NW-SE, correspond to a fracture that begins near the GF and reaches the Moroccan coast in Agadir. Both alignments, conjugated with the seismic activity associated to the Atlas Mountains, should define the limits of a sub-triangular plate (Buforn et al., 1988). For the central region we obtain a velocity slip of 1.8 cm/yr. This value is less than 3.39 cm/yr, obtained by Buforn et al. (1988) (probably due to lower period of time considered used and the high scalar seismic moment of the event 1 - Mo = 1, 6 × 10¹⁹ Nm). This value is also less than 2.3 cm/yr given by NUVEL model-I (DeMets et al., 1990).
Ibero-Maghrebian region: in the Gulf of Cadiz and Algeria (zones IV and VI) the plate boundary
between Eurasia and Africa corresponds to a narrow band well defined by the seismicity, where large earthquakes (M>7) occur in association with horizontal compression N-S to NNW-SSE due to the convergence of Eurasia and Africa. The intermediate-depth earthquakes, with a distribution in the E-W direction and delimited by a narrow band less than 20 km wide that broadens as we move to the Strait of Gibraltar, may also be associated with the convergence process of the Eurasia-Africa plates. In these areas (IV and VI) the material is relatively rigid and the stresses are released by larger earthquakes. In area V the plate boundary is more diffuse and corresponds to a wider area that includes the Betics, the Alboran Sea and the Rif. It is difficult in this case identify a simple line that corresponds to the plate boundary. In this area (V), the material is more fragmented, with a large number of small faults, and consequently the stresses are released by frequent small to moderate earthquakes. As a consequence the plate boundary is not well defined in area V and it corresponds to a wide area where deformation is manifested by the continuous occurrence of small earthquakes, and only occasionally, some moderate events occur. However, in the past, also large events have occurred in this area as shown by the historical seismicity and the lack of large earthquakes in the 1900-1999 period and the consequent low values of slip velocity, may be only due to an anomalous period of seismic quiescence during the last century. In the 19th
AZORES 1998 - INTERNATIONAL SEMINAR ON SEISMIC RISK AND REHABILITATION OF STONE MASONRY HOUSING
9
century at least two earthquakes (1829 and 1884) took place in southern Spain with magnitude greater than 6. For this region the time period selected (1900-1999) does not adequately represent the long range seismic activity of the region. The stress regime obtained from the focal mechanisms of shallow events is compatible with horizontal N-S to NW-SE convergence of Eurasia and Africa. However in the Betics-Alboran area there is also a horizontal extension in an approximately E-W direction.
The existence of important seismic activity at intermediate depth (60 to 150 km) extending in a very narrow vertical band 50 km wide in N-S direction may be explained by the existence of a seismogenic block, of approximate dimensions 200 km long, 150 km deep and 50 km wide, on the eastern side of the Strait of Gibraltar. Inside this block, the stress regime, deduced from focal mechanisms of earthquakes, corresponds to nearly vertical tension dipping to the SE. Different tectonic models have been proposed for this region, such as some kind of subduction process, extensional collapse of thickened continental lithosphere, continental lithospheric delamination, backarc extension caused by subduction rollback, convective thinning (Houseman, 1996) or subduction and breaking of a slab of material (Buforn et al., 2004). Some of these models, such as continental lithospheric delamination, are not compatible with the presence of the intermediate-depth earthquakes and their focal mechanisms. The results presented here are consistent with the model presented by Buforn et al. (1997) of an almost vertical slab of material with strike N-S driven by the extensional E-W forces present on the Alboran Sea, and under NW-SE compressive forces. The slab is being stretched downward, possibly by gravitational instability processes. Models which propose very low angle subduction or delamination (Calvert et al, 1997) are not compatible with the results presented in this paper, due to the vertical distribution of hypocenters. Whatever explanation is given for the tectonics of this region it must satisfy the geometry of the location of hypocenters and their focal mechanisms. Tomographic studies in this area show the existence of low velocity in the upper mantle between the Betic Cordillera and the Alboran Sea (Serrano et al., 1998; Morales et al, 1999). This anomaly is located in the western part of the Alboran Sea and it extends to 100 km depth, in the same region where the intermediate-depth events occur.
The presence of the very deep earthquakes (650 km) under southern Spain is a further sign of the complexity of area V. Their focal mechanisms correspond to pressure and tension axes trending E-W and dipping about 45º. The relation of this deep activity with that of intermediate depth is not clear, but results of focal mechanisms and tomographic studies suggest different origins for them. In both cases these may be related to subduction processes, more recent for intermediate-depth shocks and older for very deep activity.
Fig. 3: Total seismic moment tensor, western part of the Eurasia-Nubia plate boundary, for shallow (grey) and intermediate (dark grey) earthquakes in the six studied zones. The CLVD component for each region is indicated. Values of slip velocity obtained from seismic strain of shallow seismicity are indicated along the boundary. The roman numbers (from I to VI) indicates the six zones studied and described in the text.
AZORES 1998 - INTERNATIONAL SEMINAR ON SEISMIC RISK AND REHABILITATION OF STONE MASONRY HOUSING
10
Western part of the Eurasia-Nubia plate boundary: The change in the seismicity along the Azores-Gibraltar-Algeria Plate boundary zone confirms that the present plate movement is transtensional in the Azores, dextral along the Gloria transform and convergent between the SW Atlantic margin and the Ibero-Maghrebian zone (Fig. 3). The convergence rate decreases west (Azores plateau) to east (Ibero-Maghrebian zone) (Fig. 3, Tab. 3). Energy released by aseismic process, in the form of folding, thickening, plastic deformation or slow aseismic slip, which is not include in our estimation of slip velocity. This means that seismic strain analyses may underestimate the geological deformation. The velocity obtained in this work may be considered as instantaneous and independent from this derived from geodetic data. In addition, the slip rate assumes that the earthquake cycle is much shorter than the history of available earthquakes. For the Azores region this condition is not met. Due to the uncertainty we have on large historic earthquakes (Tab. 1, annexe), only instrumental period has been used for this estimation. The adequacy of seismic catalogues to estimate earthquake recurrence rate depends on the area of the region, catalogue duration, and regional strain rates (Ward, 1998). To define a catalogue adequacy parameter Asshar et al. (2006) suggest to consider the product of the duration of the earthquake record, the area of the region, and the average strain rate, as estimated by space geodetic methods. Given the shortness of the catalogue duration and variability in absolute rates, spatial similarity between geodetic deformation and seismicity is not necessarily expected. We do not attempt in this article to revise seismic estimates for Azores-Gibraltar-Algeria Plate boundary; however, analyse of seismic versus aseismic deformation inferred from earthquakes and geodetic data is an interesting study we suggest for a future work. 6. ACKNOWLEDGMENTS This work has been partially funded in part by the Fundação para a Ciencia e Tecnologia (FCT) of the Ministerio da Ciencia, Tecnologia e Ensino Superior (MCTES, Potugal) and the Ministerio de Ciencia y Tecnología (Spain) through the following projects: SEISMOLITOS-FCT-2004, POCTI/CTE-GIN/59750/2004, POCTI/CTE-GIN/55994/2004, acções Integradas Luso-Espanholas CRUP/E-112/08 e HP2007-089. 7. REFERENCES Aasha P., J. G. Anderson and C. Kremer (2006). Comparison of seismic and geodetic scalar moment rates across the Basin and Range Province. Bul. Seis. Soc. Am., 96, 1, 11-32. Argus, D., Gordon, R., DeMets, C. and Stein, S. (1989). Closure of the Africa-Eurasia-North America plate motion circuit and tectonics of the Gloria fault. J. Geophys. Res. 94, 5585-5602. Bezzeghoud, M. and Buforn, E. (1999). Source parameters of the 1992 Melilla (Spain, Mw=4.8), 1994 Alhoceima (Morocco, Mw=5.8) and 1994 Mascara (Algeria, Mw=5.7) earthquakes and seismotectonic implications. Bull. Seism. Soc. Am. 89, 359-372. Buforn, E., Bezzeghoud, M., Udías, A. and Pro, C. (2004). Seismic sources on the Iberia-African plate boundary and their tectonic implications. Pure Appl. Geophys. 161, 623-646. Buforn, E., Coca, P., Udías, A. and Lasa, C. (1997). Source mechanism of intermediate and deep earthquakes in southern Spain. J. Seism. 1, 113-130. Buforn, E., Udías, A. and Madariaga, R. (1991a). Intermediate and deep earthquakes in Spain. Pageoph 136, 375-393. Buforn, E., Udías, A., Mézcua, J. and Madariaga, R. (1991b). A deep earthquake under south Spain, 8 March 1990. Bull. Seism. Soc. Am., 81, 1403-1407. Buforn, E., Udías, A. and Colombás, M.A. (1988). Seismicity, source mechanisms and seismotectonics of the Azores-Gibraltar plate boundary. Tectonophysics, 152, 89-118 Buforn, E., Udías, A. and Colombás, M.A. (1988a). Seismicity, source mechanisms and seismotectonics of the Azores-Gibraltar plate boundary. Tectonophysics, 152, 89-118. Buforn, E., Udías, A. and Mézcua, J. (1988b). Seismicity and focal mechanisms in south Spain. Bull. Seism. Soc. Am., 78, 2008-2224. Buforn, E. and Sanz de Galdeano, C. (2001). Focal mechanism of Mula (Murcia, Spain) earthquake of February 2, 1999. J. Seism. 5, 277-280. Borges J. F., M. Bezzeghoud, E. Buforn, C. Pro and A. Fitas, 2007. The 1980, 1997 and 1998 Azores earthquakes and its seismotectonic implications. Tectonophysics, 435, 37-54. Borges, J. (2003). Fonte sísmica em Portugal. Algunas implicaçoes na Geodinâmica Açores-Gibraltar. Ph.D., University of Évora, Portugal, 307 pp Borges, J.F., Fitas, A., Bezzeghoud, M. and Teves-Costa, P. (2001). Seismotectonics of Portugal and its adjacent area. Tectonophysics 337, 373-387. Calvert, A., Gomez, F., Seber, D., Barazangi, M., Jabour, N., Ibenbrahim, A., and Demnati (1997). An integrate geophysical investigation of recent seismicity in the Al-Hoceima region of north Morocco. Bull. Seism. Soc. Am., 87, 637-651. DeMets, C., Gordon, R., Argus, D. and Stein, S. (1990). Current plate motions. Geophys. J. Int., 101, 425-478.
AZORES 1998 - INTERNATIONAL SEMINAR ON SEISMIC RISK AND REHABILITATION OF STONE MASONRY HOUSING
11
Fernandes, R.M.S. (2004). Present-day kinematic at the Azores-Gibraltar plate boundary as derived from GPS observations. Ph.D. University Delft, 202pp. Grimison, N. and Cheng, W. (1986). The Azores-Gibraltar plate boundary: focal mechanisms, depths of earthquakes and their tectonic implications. J. Geophys. Res. 91, 2029-2047. Hatzfeld, D. (1978). Etude sismotectonique de la zone de collision Ibero-Maghrébine. Ph. D. Thesis, Grenoble (France) 281pp. Houseman, G. (1996). From mountains to basin. Nature, 379, 771-772 Krause, D. C. and Watkins, N.D. (1970). North Atlantic crustal genesis in the vicinity of the Azores. Geophys. J.R. Astr. Soc. 19, 261-283. Lourenço, N., Miranda, J.M., Luis, J.F., Ribeiro, A., Mendes Victor, L., Madeira, J. and Needham, D. (1998). Morpho-tectonic analysis of the Azores Volcanic Plateau from a new bathymetric compilation of the area. Marine Geophy. Res. 20, 141-156. Luis, J.F., Miranda, J.M., Galdeano, A., Patriat, P., Rossignol, J.C. and Mendes Victor, L (1994). The Azores triple junction since 10 Ma from an aeromagnetic survey of the Mid-Atlantic Ridge. Earth Plan. Sci. Lett. 125, 439-459. Luis, J.F. (1996). Le Plateau des Açores et le triple point associé : analyse géophysique et evolution. Ph.D. Université Denis Diderot, Paris VII, 201 pp. Machado, F. and Silveira, E. (1982). O terremoto de 1 Jan. 1980 e a tectónicas dos Açores. Açoreana 6, 155-170. Madeira, J. and Ribeiro, A. (1980). Geodynamics models for the Azores triple junction: a contribution from tectonics. In: G. Boillot and J.M. Fontboté (eds), Alpine evolution of Iberia and its continental margins. Tectonophysics 184, 405-415. Matias L.M., Olivet J.-L., Aslanian D., Fidalgo L. (2005). PLACA: a white box for plate reconstruction and best-fit pole determination. Computers & Geosciences 31 (2005) 437–452 McKenzie, D. (1972) Active tectonics of the Mediterranean region. Geophys. J. R. Astron. Soc. 30, 109-185. Miranda, J.M., Mendes Victor, L., Simoes, J.Z., Luis, J.F., Matías, L., Shimamura, H., Shiobara, H., Nemoto, H., Mochizuki, H., Hirn, A., and Lepine, J.C. (1998). Tectonic setting of the Azores Plateau deduced from OBS survey. Marine Geophys. Res. 20, 171-182. Morales, J., Serrano, I., Jabaloy, A., Galindo-Zaldivar, J., Zhao, D., Torcal, F., Vidal, F. and Gonzalez-Lodeiro, F. (1999). Active continental subduction beneath the Betic Cordillera and the Alboran Sea. Geology, 27, 735-738. Munuera, J.M. (1963). Datos básicos para un estudio de sismicidad en la región de la Península Ibérica. Mem. Inst. Geog. Cat., Madrid, 32, 93pp. Nunes, J.C. and Ribeiro, E. (2001). Caracterizaçao da sismicidade instrumental dos Açores no periodo 1950-1980. SISMICA, Encontro Nacional de Sismología e Enghenaria Sísmica, Açores. Searle, R. (1980). Tectonic pattern of the Azores spreading centre and triple junction. Earth Plan. Sci. Lett. 51, 415-434. Seber, D., Barazangi, M., Ibenbrahim, and Demnati, A. (1996). Geophysical evidence for lithospheric delamination beneath the Alboran Sea and Rif-Betic mountains. Nature 379, 785-790. Serrano, I., Morales, J., Zhao, D., Torcal, F. and Vidal, F. (1998). P-wave tomographic images in the Central Betics-Alboran Sea (south Spain) using local earthquakes: contribution for a continental collision. Geophys. Res. Lett. 25., 4031-4034. Torné, M., Fernandez, M., Comas, M.C. and Soto, J.I. (2000). Lithospheric structure beneath the Alboran basin: results from 3D gravity modeling and tectonic revelance. J. Geophys. Res. 105, 3209-3228. Udías, A. (1980). Seismic stresses in the region Azores-Spain-Western Mediterranean. Rock Mechanics 9, 75-84 Udías, A., López Arroyo, A. and Mézcua, J. (1976). Seismotectonics of the Azores-Alboran region. Tectonophysics 31, 259-289 Vales, D. L., Matías, L., Carrilho, F., Madeira, J., Morais, I., Senos, L. (2001). Relocalizaçao hipocentral e mecanismos focais da sequencia sismica que se seguiu ao sismo do Faial em 1998. 2º Simposium de Meteorología e Geofísica. APMG 56-63. Vogt, P.R., and W. Y. Jung (2004). The Terceira Rift as Hyper-Slow, Hotspot-Dominated Oblique Spreading Axis: A Comparison With Other Slow-Spreading Plate Boundaries, Earth and Planet Sci. Lett. 218, 77-90, doi:10.1016/S0012-821X(03)00627. Ward, S. N. (1998). On the consistency of earthquake moment rates, geological fault data, and space geodetic strain: the United States, Geophys. J.Int., 134, 172-186.
AZORES 1998 - INTERNATIONAL SEMINAR ON SEISMIC RISK AND REHABILITATION OF STONE MASONRY HOUSING
12
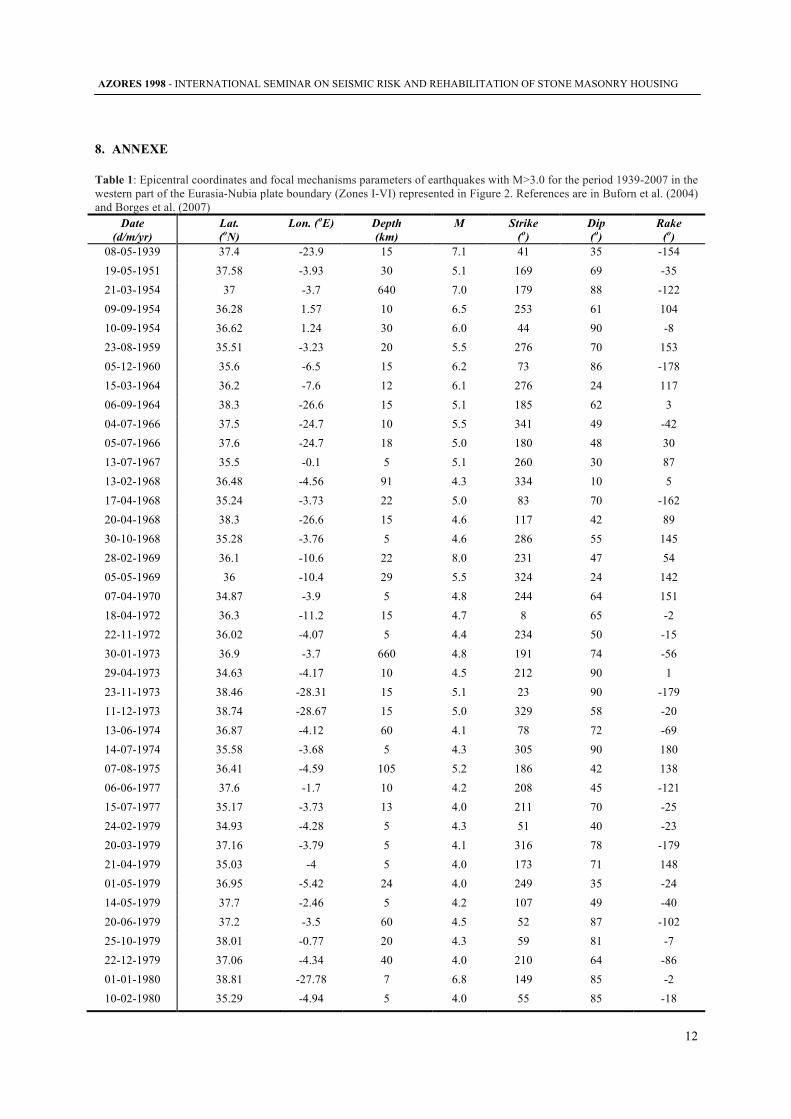
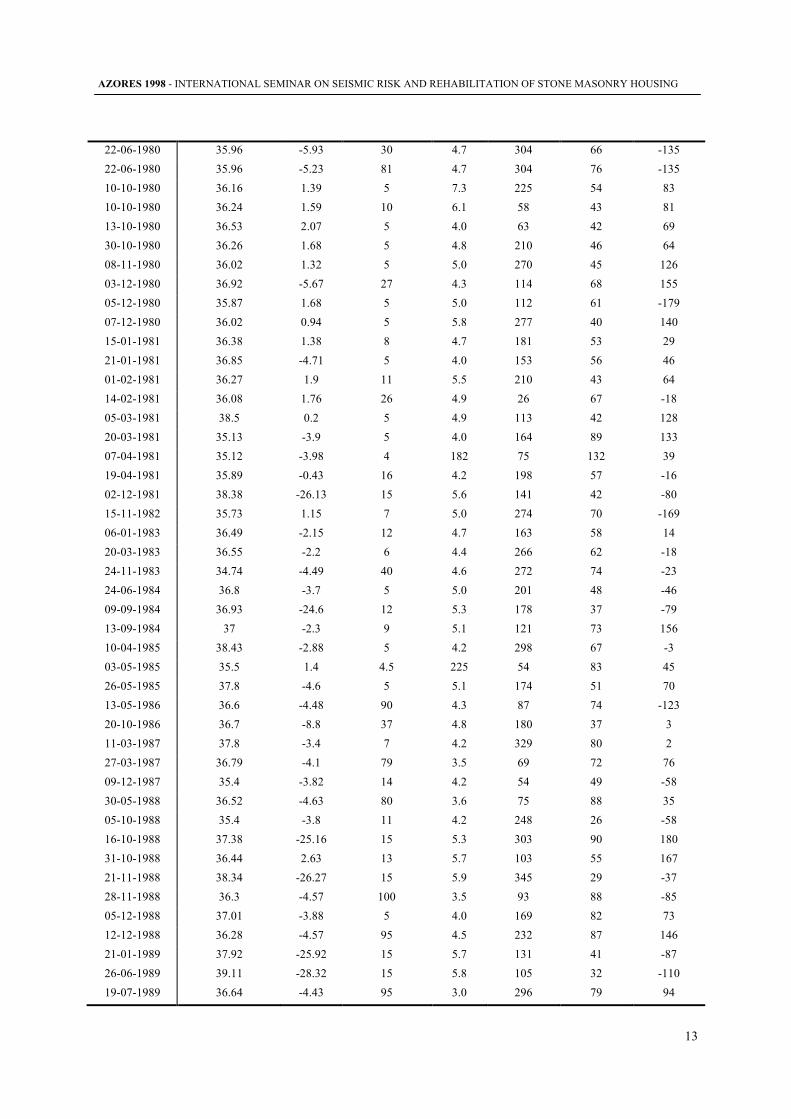
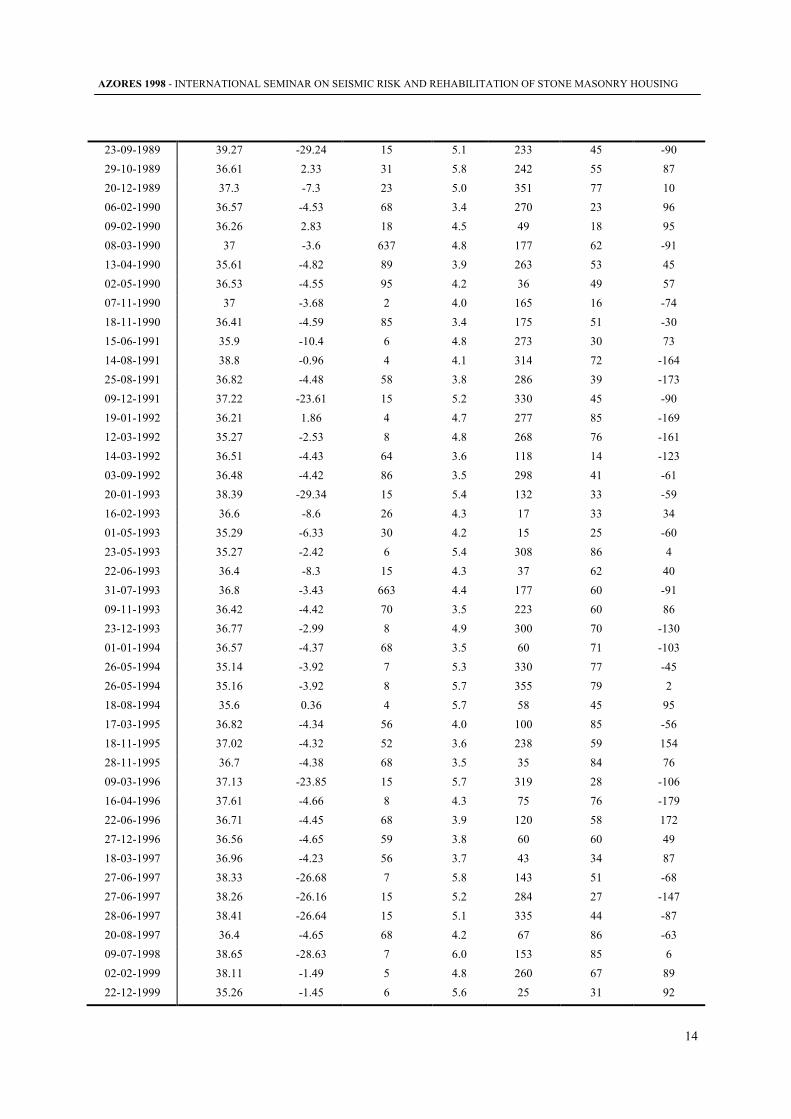
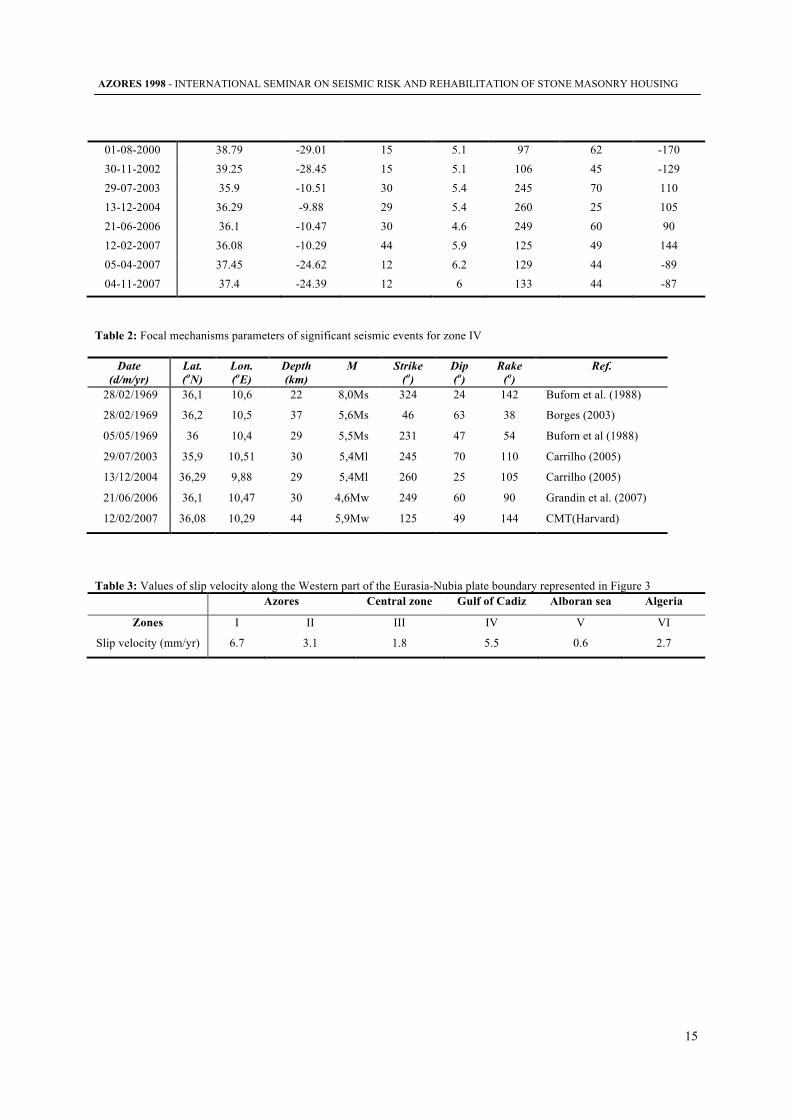
8. ANNEXE Table 1: Epicentral coordinates and focal mechanisms parameters of earthquakes with M>3.0 for the period 1939-2007 in the western part of the Eurasia-Nubia plate boundary (Zones I-VI) represented in Figure 2. References are in Buforn et al. (2004) and Borges et al. (2007)
Date (d/m/yr)
Lat. (oN)
Lon. (oE) Depth (km)
M
Strike (o)
Dip (o)
Rake (o)
08-05-1939 37.4 -23.9 15 7.1 41 35 -154 19-05-1951 37.58 -3.93 30 5.1 169 69 -35 21-03-1954 37 -3.7 640 7.0 179 88 -122 09-09-1954 36.28 1.57 10 6.5 253 61 104 10-09-1954 36.62 1.24 30 6.0 44 90 -8 23-08-1959 35.51 -3.23 20 5.5 276 70 153 05-12-1960 35.6 -6.5 15 6.2 73 86 -178 15-03-1964 36.2 -7.6 12 6.1 276 24 117 06-09-1964 38.3 -26.6 15 5.1 185 62 3 04-07-1966 37.5 -24.7 10 5.5 341 49 -42 05-07-1966 37.6 -24.7 18 5.0 180 48 30 13-07-1967 35.5 -0.1 5 5.1 260 30 87 13-02-1968 36.48 -4.56 91 4.3 334 10 5 17-04-1968 35.24 -3.73 22 5.0 83 70 -162 20-04-1968 38.3 -26.6 15 4.6 117 42 89 30-10-1968 35.28 -3.76 5 4.6 286 55 145 28-02-1969 36.1 -10.6 22 8.0 231 47 54 05-05-1969 36 -10.4 29 5.5 324 24 142 07-04-1970 34.87 -3.9 5 4.8 244 64 151 18-04-1972 36.3 -11.2 15 4.7 8 65 -2 22-11-1972 36.02 -4.07 5 4.4 234 50 -15 30-01-1973 36.9 -3.7 660 4.8 191 74 -56 29-04-1973 34.63 -4.17 10 4.5 212 90 1 23-11-1973 38.46 -28.31 15 5.1 23 90 -179 11-12-1973 38.74 -28.67 15 5.0 329 58 -20 13-06-1974 36.87 -4.12 60 4.1 78 72 -69 14-07-1974 35.58 -3.68 5 4.3 305 90 180 07-08-1975 36.41 -4.59 105 5.2 186 42 138 06-06-1977 37.6 -1.7 10 4.2 208 45 -121 15-07-1977 35.17 -3.73 13 4.0 211 70 -25 24-02-1979 34.93 -4.28 5 4.3 51 40 -23 20-03-1979 37.16 -3.79 5 4.1 316 78 -179 21-04-1979 35.03 -4 5 4.0 173 71 148 01-05-1979 36.95 -5.42 24 4.0 249 35 -24 14-05-1979 37.7 -2.46 5 4.2 107 49 -40 20-06-1979 37.2 -3.5 60 4.5 52 87 -102 25-10-1979 38.01 -0.77 20 4.3 59 81 -7 22-12-1979 37.06 -4.34 40 4.0 210 64 -86 01-01-1980 38.81 -27.78 7 6.8 149 85 -2 10-02-1980 35.29 -4.94 5 4.0 55 85 -18
AZORES 1998 - INTERNATIONAL SEMINAR ON SEISMIC RISK AND REHABILITATION OF STONE MASONRY HOUSING
13
22-06-1980 35.96 -5.93 30 4.7 304 66 -135 22-06-1980 35.96 -5.23 81 4.7 304 76 -135 10-10-1980 36.16 1.39 5 7.3 225 54 83 10-10-1980 36.24 1.59 10 6.1 58 43 81 13-10-1980 36.53 2.07 5 4.0 63 42 69 30-10-1980 36.26 1.68 5 4.8 210 46 64 08-11-1980 36.02 1.32 5 5.0 270 45 126 03-12-1980 36.92 -5.67 27 4.3 114 68 155 05-12-1980 35.87 1.68 5 5.0 112 61 -179 07-12-1980 36.02 0.94 5 5.8 277 40 140 15-01-1981 36.38 1.38 8 4.7 181 53 29 21-01-1981 36.85 -4.71 5 4.0 153 56 46 01-02-1981 36.27 1.9 11 5.5 210 43 64 14-02-1981 36.08 1.76 26 4.9 26 67 -18 05-03-1981 38.5 0.2 5 4.9 113 42 128 20-03-1981 35.13 -3.9 5 4.0 164 89 133 07-04-1981 35.12 -3.98 4 182 75 132 39 19-04-1981 35.89 -0.43 16 4.2 198 57 -16 02-12-1981 38.38 -26.13 15 5.6 141 42 -80 15-11-1982 35.73 1.15 7 5.0 274 70 -169 06-01-1983 36.49 -2.15 12 4.7 163 58 14 20-03-1983 36.55 -2.2 6 4.4 266 62 -18 24-11-1983 34.74 -4.49 40 4.6 272 74 -23 24-06-1984 36.8 -3.7 5 5.0 201 48 -46 09-09-1984 36.93 -24.6 12 5.3 178 37 -79 13-09-1984 37 -2.3 9 5.1 121 73 156 10-04-1985 38.43 -2.88 5 4.2 298 67 -3 03-05-1985 35.5 1.4 4.5 225 54 83 45 26-05-1985 37.8 -4.6 5 5.1 174 51 70 13-05-1986 36.6 -4.48 90 4.3 87 74 -123 20-10-1986 36.7 -8.8 37 4.8 180 37 3 11-03-1987 37.8 -3.4 7 4.2 329 80 2 27-03-1987 36.79 -4.1 79 3.5 69 72 76 09-12-1987 35.4 -3.82 14 4.2 54 49 -58 30-05-1988 36.52 -4.63 80 3.6 75 88 35 05-10-1988 35.4 -3.8 11 4.2 248 26 -58 16-10-1988 37.38 -25.16 15 5.3 303 90 180 31-10-1988 36.44 2.63 13 5.7 103 55 167 21-11-1988 38.34 -26.27 15 5.9 345 29 -37 28-11-1988 36.3 -4.57 100 3.5 93 88 -85 05-12-1988 37.01 -3.88 5 4.0 169 82 73 12-12-1988 36.28 -4.57 95 4.5 232 87 146 21-01-1989 37.92 -25.92 15 5.7 131 41 -87 26-06-1989 39.11 -28.32 15 5.8 105 32 -110 19-07-1989 36.64 -4.43 95 3.0 296 79 94
AZORES 1998 - INTERNATIONAL SEMINAR ON SEISMIC RISK AND REHABILITATION OF STONE MASONRY HOUSING
14
23-09-1989 39.27 -29.24 15 5.1 233 45 -90 29-10-1989 36.61 2.33 31 5.8 242 55 87 20-12-1989 37.3 -7.3 23 5.0 351 77 10 06-02-1990 36.57 -4.53 68 3.4 270 23 96 09-02-1990 36.26 2.83 18 4.5 49 18 95 08-03-1990 37 -3.6 637 4.8 177 62 -91 13-04-1990 35.61 -4.82 89 3.9 263 53 45 02-05-1990 36.53 -4.55 95 4.2 36 49 57 07-11-1990 37 -3.68 2 4.0 165 16 -74 18-11-1990 36.41 -4.59 85 3.4 175 51 -30 15-06-1991 35.9 -10.4 6 4.8 273 30 73 14-08-1991 38.8 -0.96 4 4.1 314 72 -164 25-08-1991 36.82 -4.48 58 3.8 286 39 -173 09-12-1991 37.22 -23.61 15 5.2 330 45 -90 19-01-1992 36.21 1.86 4 4.7 277 85 -169 12-03-1992 35.27 -2.53 8 4.8 268 76 -161 14-03-1992 36.51 -4.43 64 3.6 118 14 -123 03-09-1992 36.48 -4.42 86 3.5 298 41 -61 20-01-1993 38.39 -29.34 15 5.4 132 33 -59 16-02-1993 36.6 -8.6 26 4.3 17 33 34 01-05-1993 35.29 -6.33 30 4.2 15 25 -60 23-05-1993 35.27 -2.42 6 5.4 308 86 4 22-06-1993 36.4 -8.3 15 4.3 37 62 40 31-07-1993 36.8 -3.43 663 4.4 177 60 -91 09-11-1993 36.42 -4.42 70 3.5 223 60 86 23-12-1993 36.77 -2.99 8 4.9 300 70 -130 01-01-1994 36.57 -4.37 68 3.5 60 71 -103 26-05-1994 35.14 -3.92 7 5.3 330 77 -45 26-05-1994 35.16 -3.92 8 5.7 355 79 2 18-08-1994 35.6 0.36 4 5.7 58 45 95 17-03-1995 36.82 -4.34 56 4.0 100 85 -56 18-11-1995 37.02 -4.32 52 3.6 238 59 154 28-11-1995 36.7 -4.38 68 3.5 35 84 76 09-03-1996 37.13 -23.85 15 5.7 319 28 -106 16-04-1996 37.61 -4.66 8 4.3 75 76 -179 22-06-1996 36.71 -4.45 68 3.9 120 58 172 27-12-1996 36.56 -4.65 59 3.8 60 60 49 18-03-1997 36.96 -4.23 56 3.7 43 34 87 27-06-1997 38.33 -26.68 7 5.8 143 51 -68 27-06-1997 38.26 -26.16 15 5.2 284 27 -147 28-06-1997 38.41 -26.64 15 5.1 335 44 -87 20-08-1997 36.4 -4.65 68 4.2 67 86 -63 09-07-1998 38.65 -28.63 7 6.0 153 85 6 02-02-1999 38.11 -1.49 5 4.8 260 67 89 22-12-1999 35.26 -1.45 6 5.6 25 31 92
AZORES 1998 - INTERNATIONAL SEMINAR ON SEISMIC RISK AND REHABILITATION OF STONE MASONRY HOUSING
15
01-08-2000 38.79 -29.01 15 5.1 97 62 -170 30-11-2002 39.25 -28.45 15 5.1 106 45 -129 29-07-2003 35.9 -10.51 30 5.4 245 70 110 13-12-2004 36.29 -9.88 29 5.4 260 25 105 21-06-2006 36.1 -10.47 30 4.6 249 60 90 12-02-2007 36.08 -10.29 44 5.9 125 49 144 05-04-2007 37.45 -24.62 12 6.2 129 44 -89 04-11-2007 37.4 -24.39 12 6 133 44 -87
Table 2: Focal mechanisms parameters of significant seismic events for zone IV
Table 3: Values of slip velocity along the Western part of the Eurasia-Nubia plate boundary represented in Figure 3 Azores Central zone Gulf of Cadiz Alboran sea Algeria
Zones I II III IV V VI
Slip velocity (mm/yr) 6.7 3.1 1.8 5.5 0.6 2.7
Date (d/m/yr)
Lat. (oN)
Lon. (oE)
Depth (km)
M
Strike (o)
Dip (o)
Rake (o)
Ref.
28/02/1969 36,1 10,6 22 8,0Ms 324 24 142 Buforn et al. (1988)
28/02/1969 36,2 10,5 37 5,6Ms 46 63 38 Borges (2003)
05/05/1969 36 10,4 29 5,5Ms 231 47 54 Buforn et al (1988)
29/07/2003 35,9 10,51 30 5,4Ml 245 70 110 Carrilho (2005)
13/12/2004 36,29 9,88 29 5,4Ml 260 25 105 Carrilho (2005)
21/06/2006 36,1 10,47 30 4,6Mw 249 60 90 Grandin et al. (2007)
12/02/2007 36,08 10,29 44 5,9Mw 125 49 144 CMT(Harvard)


