Embed Size (px)
Citation preview

Optica Applicata, Vol. XLIV, No. 1, 2014
DOI: 10.5277/oa140114
Selected nonapeptides in terahertz light
B. FUGLEWICZ1, E.F. PLI SKI
2, P.P. JARZĄB2*, S. PLI SKA
1, M. CEBRAT
3, K. NOWAK2, L. AUGUSTYN
2, M.J. WALCZAKOWSKI5,
M. MIKULICS4, N. PAŁKA
5, M. SZUSTAKOWSKI5
1Wrocław Medical University, Wrocław, 50-367, Poland
2Wrocław University of Technology, Wrocław, 50-370, Poland
3University of Wrocław, Wrocław, 50-383, Poland
4Jülich Research Centre, 52425 Jülich, Germany
5Military University of Technology, Warsaw, 00-908, Poland
*Corresponding author: [email protected]
Eight synthetic histidine analogues of oxytocin and vasopressin are subject of investigations.The spectra of the peptides have been investigated in the terahertz band. The results are obtainedin the terahertz time-domain spectroscopy arrangement.
Keywords: terahertz spectroscopy, peptides, oxytocin, vasopressin, derivatives.
1. Introduction
The region of the electromagnetic spectrum has been called far infrared (FIR) inthe past, while nowadays it is known as the terahertz band [1–3]. It occupies a regionfrom 10 to 300 cm–1. It is necessary to emphasize that usually chemists are interestedin the band from 300 to 3000 cm–1, roughly saying, where molecular vibrations canbe observed (e.g., stretching modes). The terahertz region is a bit different, and inter-esting rather for physicists and specialists in biomedicine. In this region, intermolecu-lar vibrations can be observed. Moreover, the structure of the investigated moleculescan be deduced from the terahertz spectra [4]. The terahertz technique can be helpfulto identify unique biologic signatures. The terahertz waves have been used to investi-gate pharmaceutical compounds [5–8] and amino acids [9–12]. Much larger molecules,as for example peptides, have been investigated as well [12–14]. The terahertz spec-troscopy is also a valuable technique to monitor proteins and even DNA struc-tures [15–18]. We have selected the analogues of oxytocin (OT) and vasopressin (VP)

160 B. FUGLEWICZ et al.
for our terahertz studies. Oxytocin [(Cys-Tyr-Ile-Gln-Asn-Cys)-Pro-Leu-Gly-NH2]and vasopressin [(Cys-Tyr-Phe-Gln-Asn-Cys)-Pro-Arg-Gly-NH2] are peptide hor-mones, playing an important role in the human body. Impaired secretion of thesehormones leads to serious illnesses. Therefore, the analogues of these peptides are de-veloped, with increased activity and selectivity, and decreased side effects. Researcheson the development of peptide analogues with the most favorable pharmacologicalproperties typically rely on changes in the amino acid sequence [19]. Such changesaffect not only the biological activity of the analogue, but also its physicochemicalproperties. Involvement of vasopressin and oxytocin in the regulation of human uterineactivity is a known effect. OT and VP hormones are intensively investigated using dif-ferent methods and methodologies. E.g., the structure-activity relationship of the pep-tide hormone oxytocin is constantly investigated using NMR experiments [20], or canbe a target of numerous patents as in the case of vasopressin [21]. Both studied peptidesare nonapeptides. The level of the molecule complexity is a challenge for the terahertztechnique. Both molecules are very similar. Oxytocin differs from vasopressin onlyby two amino acids. Isoleucine in the third position is replaced by phenylalanine, andleucine in the eighth position is replaced with arginine in oxytocin and vasopressinchains, respectively.
In our experiment, four analogues of both oxytocin and vasopressin were synthe-sized. In all derivatives, one of cysteines is exchanged with histidine in the peptidesequence. A carboxyl group (C-terminus) of the selected derivatives was blocked withan amide group, similarly like in native oxytocin and vasopressin hormones, whilethe amino group (N-terminus) was either left free or blocked with an acetyl group.In that way, altogether eight derivatives have been synthesized and considered in ourinvestigations. The synthesized derivatives differ in some details. In half cases,cysteine and histidine occupy 1st and 6th positions, respectively. In other half cases,the cysteine and histidine are mutually exchanged, as it is shown in Table 1. Other ami-no acids in both oxytocin and vasopressin are left on their native positions.
The aim of our study is to examine how the changes in the amino acid sequenceof the peptide chain affect the spectra of the peptides in the terahertz “finger print”region.
T a b l e 1. Sequences and modifications of investigated peptides.
Oxytocin analogues
Os17 Cys-Tyr-Ile-Gln-Asn-His-Pro-Leu-Gly-NH2
Os18 Ac-Cys-Tyr-Ile-Gln-Asn-His-Pro-Leu-Gly-NH2
Os19 His-Tyr-Ile-Gln-Asn-Cys-Pro-Leu-Gly-NH2
Os20 Ac-His-Tyr-Ile-Gln-Asn-Cys-Pro-Leu-Gly-NH2
Vasopressin analogues
Os21 Cys-Tyr-Phe-Gln-Asn-His-Pro-Arg-Gly-NH2
Os22 Ac-Cys-Tyr-Phe-Gln-Asn-His-Pro-Arg-Gly-NH2
Os23 His-Tyr-Phe-Gln-Asn-Cys-Pro-Arg-Gly-NH2
Os24 Ac-His-Tyr-Phe-Gln-Asn-Cys-Pro-Arg-Gly-NH2

Selected nonapeptides in terahertz light 161
2. Theoretical assumptions of the experiment
Figure 1 shows schematically a typical arrangement of the terahertz spectrometerworking in the system called a terahertz time domain spectroscopy (THz-TDS) [22].The device works in the same way as any optical interferometer. The most appropriatearrangement is a Mach–Zehnder interferometer, where the beam is carried out withtwo separated arms and radiation does not pass through the sample twice, as it is inthe case of the Michelson interferometer. The difference lies in the fact that some partof one arm beam is converted into terahertz beam (see arms 1 and 2). The signal de-tection method is the same as in any interferometer. This can be a screen or justan optical detector where the two beams meet together (here: Rx antenna). The mea-surement system is driven with a laser pulse of a wavelength around 780 nm.
Laser pulses have a 100 fs time duration and below and they are generated withthe time repetition of approximately 80 MHz. The pulses are split on a cubic beam split-ter (BS) and addressed in two arms of the interferometer, respectively 1 and 3. A beamarm 1 – still optical – is focused with a microscopic lens (S) at the semiconductormaterial with a miniature dipole antenna (Tx) with a length of about 100–200 µmtechnologically imposed at the surface of the LT-GaAs used as a semiconductor.A semiconductor material is usually a specially prepared gallium arsenide plate. Dueto a short duration time of the pulse so produced, its spectrum can be in the terahertzrange. Starting from Tx antenna, the arm 2 is called THz one, but it is an extension ofthe arm 1. Still we have two arms of the interferometer: the arms 1 + 2 and the arm 3.
If we insert on the path 2 (see Fig. 1) the test material, it will leave absorption linesin the spectrum of the pulse with the distribution characteristic for the investigated me-dium. Mathematically, in the Rx antenna receiving signals we measure there is a con-volution of two functions – terahertz and optical signals – without a sample,as a reference signal. It is known that the conversion of such signals from a time domainto a frequency domain shows that convolution functions can be reduced to their ordi-nary multiplication what makes the calculation easier.
Fig. 1. The arrangement of the terahertz spectrometer; Tx, Rx – terahertz transmitter and receiver, respec-tively, BS – cubic beam splitter, S – lens, DL – optical delay line, PM – off-axis parabolic mirror.
PM Sample PM
2 2
Tx Rx
STHz
PM PM
THzS
1
BS3
DL
La
ser
ErefTHz Eprob

162 B. FUGLEWICZ et al.
The signals are recalculated using the Fourier transform, which converts the pulsesin the time domain to the frequency domain. They can be expressed as:
(1)
and
(2)
where and are the amplitudes of the reference signal and the signal withthe sample medium, respectively, ϕref and ϕmed are the phases of the reference signaland the signal with the sample medium, respectively.
Figure 2 explains schematically the measuring and calculation methods. In Fig. 2a,an exciting pulse Epob(t) creates a terahertz signal in the Tx antenna. In the setupwithout a sample, the signal is treated as a reference signal . The sameoptical exciting signal Epob is taken as a probing signal Eprob, when it is delivered tothe receiving antenna Rx. Signals and Eprob meet together at the receivingantenna Rx, where a homodyne detection is realized. After that, the obtained signalis recalculated into a frequency domain using fast Fourier transform (FFT)
The same procedure is carried out on the setup with the samplemedium of d thick. The obtained signal is transformed into a frequency domain
After the deconvolution operation we have:
(3)
ErefTHz
ω( ) E0ref
ω( ) jϕref–( )exp=
EmedTHz
ω( ) E0med
ω( ) jϕmed–( )exp=
E0ref
E0med
a
b
Fig. 2. Coherent homodyne detection – the measuring and calculations of (a) the reference signal (withoutthe sample), where d – a space for the sample and (b) the signal with the sample, where d – thickness ofthe sample. FFT – fast Fourier transform operation on the measured signal.
Epob(t)
Tx
ETHzgen (t)
d
EThzref
(t)
Eprob(t)
RxETHz
ref (t) FFT ETHzref
(ω)
EThzmed (t)
ETHzmed (ω)
Epob(t)
Tx
ETHzgen (t)
d
Eprob(t)
RxFFTEThz
med (t)
EgenTHz t( ) Eref
THz t( )
ErefTHz t( )
ErefTHz t( ) Eref
THz ω( ).→
EmedTHz
EmedTHz t( ) Emed
THz ω( ).→
EmedTHz
ω( )
ErefTHz
ω( )---------------------------
E0med
ω( )
E0ref
ω( )-------------------------- j ϕmed ϕref–( )–exp=
Selected nonapeptides in terahertz light 163
The spectrum of the investigated sample is expressed as an absorption coefficient αversus frequency ω
(4)
3. Measurements
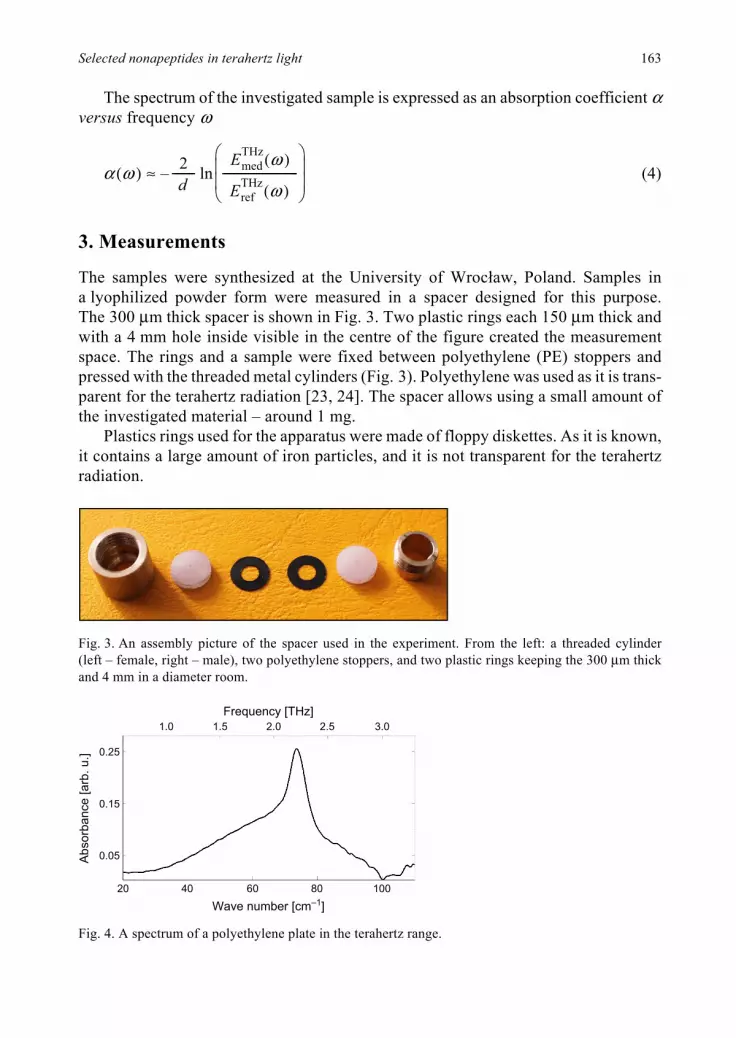
The samples were synthesized at the University of Wrocław, Poland. Samples ina lyophilized powder form were measured in a spacer designed for this purpose.The 300 µm thick spacer is shown in Fig. 3. Two plastic rings each 150 µm thick andwith a 4 mm hole inside visible in the centre of the figure created the measurementspace. The rings and a sample were fixed between polyethylene (PE) stoppers andpressed with the threaded metal cylinders (Fig. 3). Polyethylene was used as it is trans-parent for the terahertz radiation [23, 24]. The spacer allows using a small amount ofthe investigated material – around 1 mg.
Plastics rings used for the apparatus were made of floppy diskettes. As it is known,it contains a large amount of iron particles, and it is not transparent for the terahertzradiation.
α ω( )2d
--------Emed
THzω( )
ErefTHz
ω( )---------------------------
⎝ ⎠⎜ ⎟⎜ ⎟⎛ ⎞ln–≈
Fig. 3. An assembly picture of the spacer used in the experiment. From the left: a threaded cylinder(left – female, right – male), two polyethylene stoppers, and two plastic rings keeping the 300 µm thickand 4 mm in a diameter room.
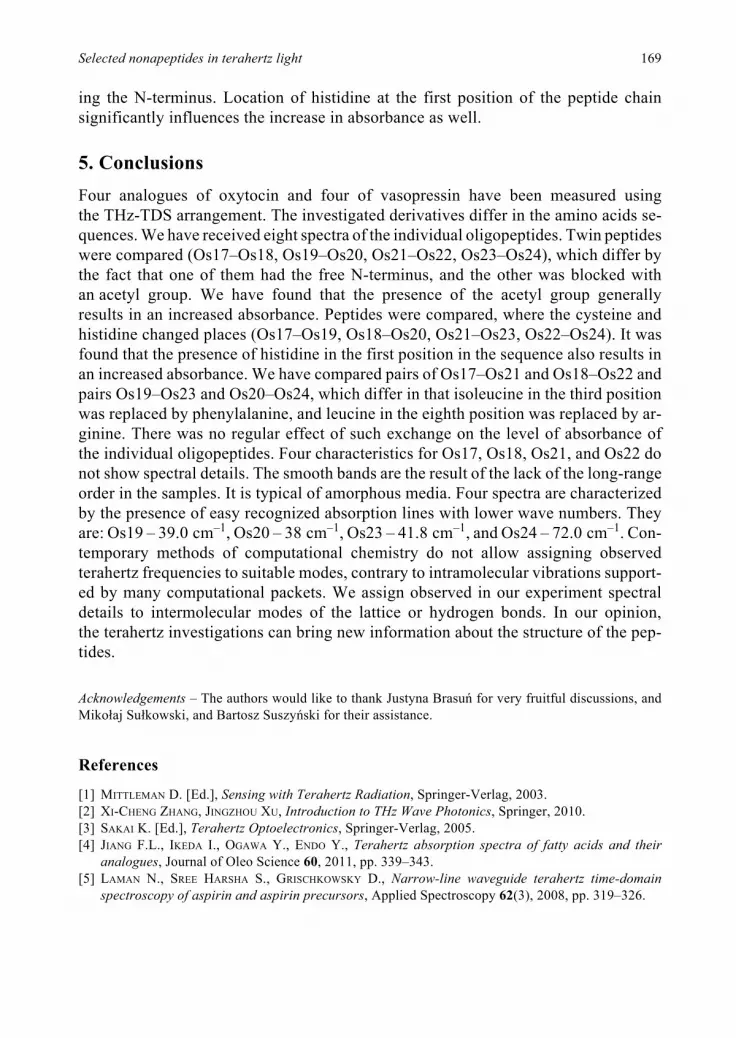
Fig. 4. A spectrum of a polyethylene plate in the terahertz range.
1.0 1.5 2.0 2.5 3.0
0.25
0.15
0.05
20 40 60 80 100
Frequency [THz]
Ab
so
rba
nce
[a
rb.
u.]
Wave number [cm–1]

164 B. FUGLEWICZ et al.
Polyethylene is commonly used in THz system components, but then the measuredabsorbance data are limited to a narrow spectral range, below 67 cm–1 [25]. It was con-firmed by our results. Figure 4 shows the absorbance of two 2 mm thick PE plates usedin our experiment. As it is seen, the characteristic shows a strong absorption peakaround 75 cm–1. To avoid the influence of the PE effect on a shape of the measuredspectrum, the process of the deconvolution was used in the computational procedure– see Eq. (3). Measurements were performed with the spacer equipped with PE stop-pers without the sample to obtain the reference signal , and next with the samestopper filled with the investigated material to get a measured signal . The spec-trum of the investigated material was obtained according to Eq. (4). In that way,the influence of the PE on the investigated material was eliminated.
4. Results and discussion
Table 1 shows the sequences of the eight peptides used in the experiment. Somesimilarities and differences can be recognized in the structure of investigated peptides.Os17 and Os18 analogues of oxytocin have the same amino acid sequences, but theydiffer in the N-terminus only. In the case of Os17, the end is free, and in the case ofOs18, it is blocked with an acetyl group. In this pair, the cysteine and histidine occupypositions 1st and 6th, respectively.
In the Os19 and Os20 pair, the cysteine and histidine are mutually exchanged.And, like in the previous configuration, the Os20 N-terminus was blocked withan acetyl group.
Analogues of vasopressin are different from oxytocin analogues by the fact thatisoleucine in the third position was replaced by phenylalanine, and leucine in the eighthposition was replaced with arginine.
As in the case of Os18 and Os20, in the Os22 and Os24 peptide N-termini wereblocked with an acetyl group.
ErefTHz
EmedTHz
Fig. 5. Diagram of the investigated molecules. Amino acid sequences of the nonapeptides: C – cysteine,Y – tyrosine, I – isoleucine, Q – glutamine, N – asparagine, H – histidine, P – proline, L – leucine,G – glycine, Ac – acetyl, F – phenyloalanine, R – arginine; a and b figuratively illustrated methodologyof the measurements.
a
b

Selected nonapeptides in terahertz light 165
The selection of peptides as shown above allows estimating the influence ofthe blocking of the peptide N-terminus with an acetyl group. The selection of the pep-tide pairs is illustrated in Fig. 5.
The Os17 and Os18 are comparable (Fig. 6a). As it is seen, the absorbance ofthe both peptides increases monotonically with a wave number. The absorbance forOs18 is slightly higher.
In the case of Os19 and Os20 (Fig. 6b), the observed differences are significant.Contrary to the previous pair, Os19 peptide with a free N-terminus shows higher valuesof absorbance in the whole investigated frequency region. In addition, the absorbancecharacteristic of Os19 is practically flat in the region of 80–100 cm–1, while forOs20 it slightly increases. A 39.0 cm–1 absorption line is recognized for Os19, and38.0 cm–1 absorption line is recognized for Os20.
In the case of vasopressin analogues, the differences in absorbance are significantlyhigh – see Figs. 6c and 6d for Os21–Os22 and Os22–Os23 pairs, respectively. For bothpairs, peptides with N-termini blocked by an acetyl group show a higher absorbance,it means, for Os22 and Os24 peptides. Characteristics for Os21 and Os22 do not showspectral details, like Os17 and Os 18. The smooth bands are the result of the lack ofthe long-range order in the samples. It is typical of amorphous media, what is expectedhere [26].
Fig. 6. Terahertz spectra of pairs of Os17–Os18 (a), Os19–Os20 (b), Os21–Os22 (c) and Os23–Os24 (d)peptides.
1.0 1.5 2.0 2.5 3.0
1.5
1.0
0.5
20 40 60 80 100
Frequency [THz]
Ab
so
rba
nce
[a
rb.
u.]
Wave number [cm–1]
Os17
Os18
a
1.0 1.5 2.0 2.5 3.0
1.0
0.6
0.2
20 40 60 80 100
Frequency [THz]
Ab
so
rba
nce
[a
rb.
u.]
Wave number [cm–1]
Os20
Os19
b
1.0 1.5 2.0 2.5 3.0
2.0
1.0
0.5
20 40 60 80 100
Frequency [THz]
Ab
so
rba
nce
[a
rb.
u.]
Wave number [cm–1]
Os21
Os22
c
1.0 1.5 2.0 2.5 3.0
2.5
1.5
0.5
20 40 60 80 100
Frequency [THz]
Ab
so
rba
nce
[a
rb.
u.]
Wave number [cm–1]
Os23
Os24
d
1.5

166 B. FUGLEWICZ et al.
As it is seen, Os23 and Os24 absorbance characteristics are practically the sameto approximatelly 45.0 cm–1. Above this value, the dramatic increase in the absorbancefor Os24 is observed, while the absorbance characteristic for Os23 remains almost flat.The Os23 spectrum shows 41.8 cm–1, while a 72.0 cm–1 strong peak is observed forOs24 peptide.
In the case of Os19, and Os23 and peptides, where the amino group (N-terminus)was left free, and in the case of Os20, Os24 ones with N-terminus blocked with an acetylgroup, histidine was placed at the first place, and (as it is seen in Figs. 6b and 6d)four absorption peaks are easy recognized: Os19 – 39.0 cm–1, Os23 – 41.8 cm–1,Os20 – 38.0 cm–1, and Os24 – 72.0 cm–1.
Definitive assignment of the observed modes is difficult because of the lack ofreliable algorithms (suitable for simulations of lattice dynamics), which are able torecognize frequencies originated from intermolecular vibrations [8].
Observed spectra in our experiment are likely due to intermolecular modes ofthe lattice or hydrogen bonds. But it is difficult to estimate whether they are due tohydrogen bond stretching or bending, or bond torsion, or skeletal deformations [27].
In the paper [28] some number of amino acids has been investigated. Vibrationalmodes below 220 cm–1 are shown, and their interpretation is given. They are consid-ered as the hydrogen bond modes, while modes above 220 cm–1 up to 650 cm–1 areassigned to collective vibrations as: COO– vibrations (220–270 cm–1), CCα N defor-mations (270–380 cm–1), modes (380–480 cm–1), COO– rock/bend/wag vibra-tions (480–650 cm–1). Similarly in the papers [7, 17, 29] hydrogen bonds are responsiblefor modes below 100 cm–1.
Spectra of investigated peptides can be also analyzed for other compositions ofpeptide pairs. For the next analysis Os17–Os19, Os18–Os20, Os21–Os23, Os22–Os24pairs are selected. Locations of cysteine and histidine are exchanged mutually inthe pairs. Figure 7 illustrates the idea.
For the three investigated pairs (Os17–Os19, Os21–Os23, Os22–Os24 – seeFigs. 8a, 8b, and 8c, respectively) higher absorbance is observed for those peptideswhere histidine occupies the first position in the amino-acid sequence, and cysteine
NH3+
Fig. 7. The Os17–Os19, Os18–Os20, Os21–Os23, Os22–Os24 pairs selected for analysis.

Selected nonapeptides in terahertz light 167
the sixth position. This property does not depend on the state of the N-terminus –whether it is blocked or not.
For the Os18–Os20 pair (see Fig. 8d) higher absorbance is observed for the peptidewith the cysteine occupying the first position of the amino-acid sequence, and histidinethe sixth position. But in this case, the N-termini are blocked with an acetyl group forboth peptides.
Another possibility is to compare the spectra of oxytocin analogues to the corre-sponding spectra of vasopressin analogues, as it is shown in Fig. 9.
Fig. 8. Terahertz absorbance spectra of the pairs of Os17–Os19 (a), Os21–Os23 (b), Os22–Os24 (c) andOs18–Os20 (d) peptides.
1.0 1.5 2.0 2.5 3.0
1.5
1.0
0.5
20 40 60 80 100
Frequency [THz]A
bso
rba
nce
[a
rb.
u.]
Wave number [cm–1]
Os17
Os19
a
1.0 1.5 2.0 2.5 3.0
1.0
0.6
0.2
20 40 60 80 100
Frequency [THz]
Ab
so
rba
nce
[a
rb.
u.]
Wave number [cm–1]
Os21
Os23
b
1.0 1.5 2.0 2.5 3.0
2.5
0.5
20 40 60 80 100
Frequency [THz]
Ab
so
rba
nce
[a
rb.
u.]
Wave number [cm–1]
Os22
Os24
c
1.0 1.5 2.0 2.5 3.0
1.5
1.0
0.5
20 40 60 80 100
Frequency [THz]
Ab
so
rba
nce
[a
rb.
u.]
Wave number [cm–1]
Os20
Os18
d
1.5
Fig. 9. The Os17–Os21, Os18–Os22, Os19–Os23, Os20–Os24 pairs selected for analysis.

168 B. FUGLEWICZ et al.
Figure 10a demonstrates spectra of both Os17 and Os21 oxytocin derivatives.The peptides have free N-termini and the cysteine appears at the first position ofthe sequence (see Fig. 9).
Similarly, Fig. 10b demonstrates spectra of both Os19 and Os23, but in this case,the first position of the peptides is occupied by histidine (see Fig. 9); oxytocin spectra(Os17 and Os19) have higher value of absorbance in the frequency band. In the caseof Os19 and Os23 pair, the Os23 peptide has higher absorbance values than Os19 inthe range to 53.0 cm–1. An absorption line is observed at 41.8 cm–1 for Os23.
A different picture is observed for Os18 and Os22 pair and for Os20 and Os24 one– see Fig. 11.
Spectra of vasopressin analogues Os22 and Os24, see Figures 11a and 11b,respectively, have higher values of absorbance than oxytocin analogues Os18 andOs20 in all observed frequency ranges. It can be an evidence that the exchange of iso-leucine (at the third position of the chain) with phenyloalanine, and the exchange ofleucine (at the eight position of the peptide chain) with arginine have little effect onthe values of absorbance of the investigated peptides. Decisive influence on the in-crease in absorbance of investigated peptides is the presence of the acetyl group block-
Fig. 10. Terahertz absorbance spectra of the pairs of Os17–Os21 (a), and Os19–Os23 (b) peptides.
1.0 1.5 2.0 2.5 3.0
1.5
1.0
0.5
20 40 60 80 100
Frequency [THz]
Ab
so
rba
nce
[a
rb.
u.]
Wave number [cm–1]
Os21
Os17
a
1.0 1.5 2.0 2.5 3.0
1.0
0.6
0.4
20 40 60 80 100
Frequency [THz]
Ab
so
rba
nce
[a
rb.
u.]
Wave number [cm–1]
Os23
Os19
b
0.8
Fig. 11. Terahertz absorbance spectra of the pairs of Os18–Os22 (a), and Os20–Os24 (b) peptides.
1.0 1.5 2.0 2.5 3.0
1.5
1.0
0.5
20 40 60 80 100
Frequency [THz]
Ab
so
rba
nce
[a
rb.
u.]
Wave number [cm–1]
Os18
Os22
a
1.0 1.5 2.0 2.5 3.0
2.5
1.5
0.5
20 40 60 80 100
Frequency [THz]
Ab
so
rba
nce
[a
rb.
u.]
Wave number [cm–1]
Os20
Os24
b
2.0
Selected nonapeptides in terahertz light 169
ing the N-terminus. Location of histidine at the first position of the peptide chainsignificantly influences the increase in absorbance as well.
5. Conclusions
Four analogues of oxytocin and four of vasopressin have been measured usingthe THz-TDS arrangement. The investigated derivatives differ in the amino acids se-quences. We have received eight spectra of the individual oligopeptides. Twin peptideswere compared (Os17–Os18, Os19–Os20, Os21–Os22, Os23–Os24), which differ bythe fact that one of them had the free N-terminus, and the other was blocked withan acetyl group. We have found that the presence of the acetyl group generallyresults in an increased absorbance. Peptides were compared, where the cysteine andhistidine changed places (Os17–Os19, Os18–Os20, Os21–Os23, Os22–Os24). It wasfound that the presence of histidine in the first position in the sequence also results inan increased absorbance. We have compared pairs of Os17–Os21 and Os18–Os22 andpairs Os19–Os23 and Os20–Os24, which differ in that isoleucine in the third positionwas replaced by phenylalanine, and leucine in the eighth position was replaced by ar-ginine. There was no regular effect of such exchange on the level of absorbance ofthe individual oligopeptides. Four characteristics for Os17, Os18, Os21, and Os22 donot show spectral details. The smooth bands are the result of the lack of the long-rangeorder in the samples. It is typical of amorphous media. Four spectra are characterizedby the presence of easy recognized absorption lines with lower wave numbers. Theyare: Os19 – 39.0 cm–1, Os20 – 38 cm–1, Os23 – 41.8 cm–1, and Os24 – 72.0 cm–1. Con-temporary methods of computational chemistry do not allow assigning observedterahertz frequencies to suitable modes, contrary to intramolecular vibrations support-ed by many computational packets. We assign observed in our experiment spectraldetails to intermolecular modes of the lattice or hydrogen bonds. In our opinion,the terahertz investigations can bring new information about the structure of the pep-tides.
Acknowledgements – The authors would like to thank Justyna Brasu for very fruitful discussions, andMikołaj Sułkowski, and Bartosz Suszy ski for their assistance.
References
[1] MITTLEMAN D. [Ed.], Sensing with Terahertz Radiation, Springer-Verlag, 2003.[2] XI-CHENG ZHANG, JINGZHOU XU, Introduction to THz Wave Photonics, Springer, 2010.[3] SAKAI K. [Ed.], Terahertz Optoelectronics, Springer-Verlag, 2005.[4] JIANG F.L., IKEDA I., OGAWA Y., ENDO Y., Terahertz absorption spectra of fatty acids and their
analogues, Journal of Oleo Science 60, 2011, pp. 339–343.[5] LAMAN N., SREE HARSHA S., GRISCHKOWSKY D., Narrow-line waveguide terahertz time-domain
spectroscopy of aspirin and aspirin precursors, Applied Spectroscopy 62(3), 2008, pp. 319–326.

170 B. FUGLEWICZ et al.
[6] YAO-CHUN SHEN, Terahertz pulsed spectroscopy and imaging for pharmaceutical applications:
a review, International Journal of Pharmaceutics 417(1–2), 2011, pp. 48–60.[7] STRACHAN C.J., RADES T., NEWNHAM D.A., GORDON K.C., PEPPER M., TADAY P.F., Using terahertz
pulsed spectroscopy to study crystallinity of pharmaceutical materials, Chemical PhysicsLetters 390(1–3), 2004, pp. 20–24.
[8] ZEITLER J.A., TADAY P.F., NEWNHAM D.A., PEPPER M., GORDON K.C., RADES T., Terahertz pulsed
spectroscopy and imaging in the pharmaceutical settings – a review, Journal of Pharmacy andPharmacology 59(2), 2007, pp. 209–223.
[9] KORTER T.M., BALU R., CAMPBELL M.B., BEARD M.C., GREGURICK S.K., HEILWEIL E.J., Terahertz
spectroscopy of solid serine and cysteine, Chemical Physics Letters 418(1–3), 2006, pp. 65–70. [10] NISHIZAWA J., SASAKI T., TANNO T., Coherent terahertz-wave generation from semiconductors and
its applications in biological sciences, Journal of Physics and Chemistry of Solids 69(2–3), 2008,pp. 693–701.
[11] TRUE A.B., SCHROECK K., FRENCH T.A., SCHMUTTENMAER C.A., Terahertz spectroscopy of histidine
enantiomers and polymorphs, Journal of Infrared, Millimeter and Terahertz Waves 32(5), 2011,pp. 691–698.
[12] KUTTERUF M.R., BROWN C.M., IWAKI L.K., CAMPBELL M.B., KORTER T.M., HEILWEIL E.J., Terahertz
spectroscopy of short-chain polypeptides, Chemical Physics Letters 375(3–4), 2003, pp. 337–343. [13] BORN B., WEINGÄRTNER H., BRÜNDERMANN E., HAVENITH M., Solvation dynamics of model peptides
probed by terahertz spectroscopy. Observation of the onset of collective network motions, Journalof the American Chemical Society 131(10), 2009, pp. 3752–3755.
[14] TAO DING, RUOYU LI, ZEITLER J.A., HUBER T.L., GLADDEN L.F., MIDDELBERG A.P.J., FALCONER R.J.,Terahertz and far infrared Spectroscopy of alanine-rich peptides having variable ellipticity, OpticsExpress 18(26), 2010, pp. 27431–27444.
[15] EBBINGHAUS S., SEUNG JOONG KIM, HEYDEN M., XIN YU, GRUEBELE M., LEITNER D.M., HAVENITH M.,Protein sequence- and pH-dependent hydration probed by terahertz spectroscopy, Journal ofthe American Chemical Society 130(8), 2008, pp. 2374–2375.
[16] GLOBUS T., WOOLARD D., CROWE T.W., KHROMOVA T., GELMONT B., HESLER J., Terahertz Fourier
transform characterization of biological materials in a liquid phase, Journal of Physics D: AppliedPhysics 39(15), 2006, pp. 3405–3413.
[17] BRANDT N.N., CHIKISHEV A.YU., KARGOVSKY A.V., NAZAROV M.M., PARASHCHUK O.D.,SAPOZHNIKOV D.A., SMIRNOVA I.N., SHKURINOV A.P., SUMBATYAN N.V., Terahertz time-domain and
Raman spectroscopy of the sulfur-containing peptide dimers: Low-frequency markers of disulfide
bridges, Vibrational Spectroscopy 47(1), 2008, pp. 53–58. [18] KAWAGUCHI S., KAMBARA O., PONSECA JR. C.S., SHIBATA M., KANDORI H., TOMINAGA K., Low-fre-
quency dynamics of biological molecules studied by terahertz time-domain spectroscopy, Spectros-copy 24(1–2), 2010, pp. 153–158.
[19] SIEMION I.Z., CEBRAT M., WIECZOREK Z., Cyclolinopeptides and their analogs – a new family of
peptide immunosuppressants affecting the calcineurin system, Archivum Immunologiae et TherapiaExperimentalis 47, 1999, pp. 143–153.
[20] WITTELSBERGER A., PATINY L., SLANINOVA J., BARBERIS C., MUTTER M., Introduction of a cis-prolyl
mimic in position 7 of the peptide hormone oxytocin does not result in antagonistic activity, Journalof Medicinal Chemistry 48(21), 2005, pp. 6553–6562.
[21] WISNIEWSKI K., SCHTEINGART C., LAPORTE R., GALYEAN R.F., RIVIERE P., Peptidics Vasopressin
Receptor Agonists, USA Patent, No. US 2009/0054309 A1. [22] DEXHEIMER S.L., Terahertz Spectroscopy: Principles and Applications, CRC Press, 2008.[23] KITAGAWA J., OHKUBO T., ONUMA M., KADOYA Y., THz spectroscopic characterization of biomole-
cule/water systems by compact sensor chips, Applied Physics Letters 89(4), 2006, article 041114.[24] ZEITLER J.A., KOGERMANN K., RANTANEN J., RADES T., TADAY P.F., PEPPER M., AALTONEN J.,
STRACHAN C.J., Drug hydrate systems and dehydration processes studied by terahertz pulsed
spectroscopy, International Journal of Pharmaceutics 334(1–2), 2007, pp. 78–84.
Selected nonapeptides in terahertz light 171
[25] FLANDERS B.N., CHEVILLE R.A., GRISCHKOWSKY D., SCHERER N.F., Pulsed terahertz transmission
spectroscopy of liquid CHCl3, CCl4, and their mixtures, Journal of Physical Chemistry 100(29),1996, pp. 11824–11835.
[26] WALTHER M., FISHER B.M., UHD JEPSEN P., Noncovalent intermolecular forces in polycrystalline and
amorphous saccharides in the far infrared, Chemical Physics 288(2–3), 2003, pp. 261–268.[27] SHEN S.C., SANTO L., GENZEL L., THz spectra for some bio-molecules, Journal of Infrared, Millimeter,
and Terahertz Waves 28(8), 2007, pp. 595–610.[28] MATEI A., DRICHKO N., GOMPF B., DRESSEL M., Far-infrared spectra of amino acids, Chemical
Physics 316(1–3), 2005, pp. 61–71.[29] BUONTEMPO U., CARERI G., FASELLA P., FERRARO A., Far-infrared spectra of some globular proteins,
Biopolymers 10(12), 1971, pp. 2377–2386.
Received April 26, 2013
in revised form August 7, 2013


