Embed Size (px)
Citation preview

Selective renal vasoconstriction, exaggerated natriuresis
and excretion rates of exosomic proteins in essential
hypertension
M. Damkjær,1,* P. H. Jensen,1,2,* V. Schw€ammle,2 R. R. Sprenger,2 I. A. Jacobsen,3
O. N. Jensen2 and P. Bie1
1 Department of Cardiovascular and Renal Research, Institute of Molecular Medicine, University of Southern Denmark, Odense,
Denmark
2 Department of Biochemistry and Molecular Biology, University of Southern Denmark, Odense, Denmark
3 Department of Endocrinology, Odense University Hospital, Odense, Denmark
Received 5 April 2014,
revision requested 21 April 2014,
revision received 7 July 2014,
accepted 8 July 2014
Correspondence: P. Bie, Depart-
ment of Cardiovascular and Renal
Research, Institute of Molecular
Medicine, University of Southern
Denmark, 21 Winslowparken,
5000 Odense C, Denmark.
E-mail: [email protected]
*These authors contributed
equally to this manuscript.
Abstract
Aim: In essential hypertension (EH), the regulation of renal sodium excre-
tion is aberrant. We hypothesized that in mild EH, (i) abnormal dynamics
of plasma renin concentration (PRC) and atrial natriuretic peptide (ANP)
are responsible for the exaggerated natriuresis, and (ii) exosomic protein
patterns reflect the renal tubular abnormality involved in the dysregulation
of sodium excretion.Methods: After 2-week drug washout and 4-day diet, systemic and renal
hemodynamics, cardio-renal hormones, glomerular filtration and renal
excretion were studied in male patients during saline loading (SL). Excre-
tion rates of exosome-related urinary proteins including apical membrane
transporters were determined by proteomics-based methods.Results: In patients, baseline renal vascular conductance was reduced
(�44%, P < 0.001), but non-renal vascular conductances were normal
while PRC was reduced and ANP elevated (both P < 0.01). SL induced
exaggerated natriuresis and reduced PRC (P < 0.01), at normal suppres-
sion rate. SL increased arterial pressure in patients (+11 mmHg,
P < 0.001), but not in controls; however, during time control, patients
showed identical increases (+10 mmHg, P < 0.005) apparently dissociating
arterial pressure from natriuresis.
At baseline, excretion rates of 438 proteins ranged from 0.07 to
49.8 pmol (mmol creatinine)�1; 12 proteins were found in all subjects,
and 21 proteins were found in two or more patients, but not in controls.
In patients, the excretion rate of retinoic acid-induced gene 2 protein was
reduced, and excretion rates of other proteins showed increased variances
compatible with pathophysiological and clinical applicability.Conclusion: Essential hypertension patients exhibit selective renal vaso-
constriction and individually varying excretion rates of several exosome-
related proteins. Hormonal changes, rather than arterial pressure, seem to
cause exaggeration of natriuresis.
Keywords hormones, hypertension, kidney, proteomics, renin, vascular
resistance.
© 2014 Scandinavian Physiological Society. Published by John Wiley & Sons Ltd, doi: 10.1111/apha.12345 1
Acta Physiol 2014

The link between acute and chronic renal sodium han-
dling and essential hypertension (EH) is unclear, but
so are even the mechanisms of normal sodium homeo-
stasis (Damkjaer et al. 2013). Although serious flaws
seem to exist in most trials, which have attempted to
establish the relation between sodium intakes to blood
pressure-related cardiovascular disease (CVD) (Cobb
et al. 2014), the concept of a positive relation between
sodium intake and arterial blood pressure driving
CVD remains widely accepted (Strom et al. 2013,
Cook et al. 2014) and referred to as ‘salt sensitivity’.
Surprisingly, a standardized test for presence of salt
sensitivity does not exist; multiple protocols including
intravenous SL or changes in dietary intake have been
applied with and without the use of diuretics. Possibly
related to this lack of standardization, a consistent
role of the renin angiotensin aldosterone system
(RAAS) in the development of EH has not been estab-
lished although the RAAS is a pivotal element of
sodium homeostasis. Recent experimental evidence
shows that levels of circulating AngII, which are not
immediately vasoactive, act on the CNS to increase
sympathetic drive to the kidney (Malpas 2010) possi-
bly in an organ selective manner. Organ-specific
changes in sympathetic nerve traffic have been demon-
strated convincingly (Ramchandra et al. 2009, 2013,
Yoshimoto et al. 2010a,b), recently also in response
to sodium loading (Frithiof et al. 2014). It has been
known since the 50s that in EH, the natriuretic
response to acute SL is exaggerated (Green et al.
1952, Solomon et al. 1960). In case increased renal
sympathetic tone is a primary element of the aetiology
of EH, the exaggeration of the natriuretic response to
saline is puzzling and suitable as basis for a working
hypothesis with regard to the dynamics of the hor-
monal response to sodium loading.
A certain degree of sodium retention often is assumed
to be involved in hypertension (Johnson et al. 2008,
Herrera & Coffman 2012), but precise measurements
of body fluid compartments are technically difficult and
not all studies of EH demonstrate (alterations compati-
ble with) increases in total body sodium. Normally,
hypertension per se with or without sodium retention
would be expected to suppress renin system activity and
elevate plasma natriuretic peptide concentrations. As
such changes are not constant findings, malfunctions of
the hormonal regulation of kidney function seem to be
a part of EH. However, standardization of patients
with regard to sex, degree of EH and target organ dam-
age as well as of circumstances (dietary regimen, body
position, SL) is essential for studies of hormonal regula-
tion; therefore, the study included only highly selected
patients without signs of organ damage.
Urinary exosomes are membrane-limited nanoparti-
cles derived from the apical membrane endocytotic
pathway (Raposo & Stoorvogel 2013). Released con-
tinuously from cells facing the lumen of the renal
tubules, the exosome-related proteins may reflect cel-
lular events crucial for NaCl and water transport and
may even play a role in intercellular signalling (van
Balkom et al. 2011). The patterns of excretion of
these may be valuable indicators of renal functions
because it can be assumed that all such proteins are of
renal origin. Methodological advances within proteo-
mics now allow label-free absolute quantification of
multiple proteins (Creskey et al. 2012) to be applied
to urine samples; the results include absolute rates of
excretion in picomoles per hour as well as per milli-
mole of excreted creatinine possibly reflecting patho-
physiological events in the kidney (Alvarez et al.
2013, Hogan et al. 2014, Wood et al. 2013). It
seemed attractive to associate urinary protein profiles
also with the dynamic operation of renal regulation
with the response to an acute salt load in EH.
We hypothesized that in EH, the homeostatic, neu-
rohumoral pathways to the kidney, for example,
AngII and aldosterone, are distorted generating a
baseline condition of relative antinatriuresis and that
augmented responses to SL [e.g. deactivation of RAAS
and secretion of atrial natriuretic peptide (ANP)] are
responsible for the exaggeration of the natriuretic
response. Furthermore, it was hypothesized that in
EH, the urinary rates of excretion of specific, mem-
brane-associated proteins are different from those of
control subjects reflecting the tubular molecular mech-
anisms involved.
Methods
The present setting is defined by selected, mildly
hypertensive, male patients without signs of organ
damage being exposed to slow, body mass-adjusted
volume expansion in the sitting position after meta-
bolic standardization including low normal sodium
intake. Full time control measurements in the patients
and parallel measurements in a matched control group
are included for comparisons.
Patients
Eleven patients with mild, monosymptomatic hyper-
tension were studied. Middle-aged (40–60 years),
male, non-smoking patients with EH grade I–II were
recruited from the local outpatient clinic. The diagno-
sis of EH was based on the criteria defined by the
European Society of Hypertension (Mancia et al.
2007). Exclusion criteria were body mass index (BMI)
>28, abdominal circumference >100 cm, any anam-
nestic information of co-morbidity, any sign of target
organ damage by echocardiography, elevated plasma
© 2014 Scandinavian Physiological Society. Published by John Wiley & Sons Ltd, doi: 10.1111/apha.123452
Hemodynamics and proteomics in hypertension · M Damkjær et al. Acta Physiol 2014

creatinine (no value exceeded 110 lmol L�1) or
microalbuminuria. Twelve healthy age and BMI-
matched males were recruited as control group. None
of the control subjects had any past medical history,
and all were normotensive and had normal plasma
sodium, potassium and creatinine concentrations. For
details, see Table S1 in Data S1.
Experimental protocol
Prior to the investigation, all drugs were withheld for
18 days. In the period of drug withdrawal, the
patients were seen by a physician at the outpatient
clinic up to twice weekly for recordings of ambulatory
blood pressure. If systolic blood pressure exceeded
180 mmHg or diastolic pressure exceeded 110 mmHg,
the patient immediately resumed regular medication
and thereby dropped out of the study. During the last
4 days, the subjects received a low-salt diet providing
a daily intake of 50–60 mmol Na+; 24-h urinary
sodium excretion (07:00–07:00 hour) was measured
immediately prior to investigation to assess dietary
compliance. Patients were studied on two consecutive
days (time control and SL). Day 1 was the control
day. After instrumentation, followed by bolus injec-
tions of para-aminohippurate (PAH) and 51Cr-EDTA
(see below), cardiovascular, hormonal and renal vari-
ables were sampled for six consecutive hours. On day
2, sampling of baseline variables for 1 h was followed
by infusion of saline (135 mmol L�1, i.e. slightly
hypotonic) intravenously for 4 h as described previ-
ously (Damkjær et al. 2012). Cardiac output (CO)
was measured continuously by impedance cardiogra-
phy (PhysioFlow PF-03; Manatec Biomedical, Macher-
en, France), the mean difference between the CO
values obtained in normal subjects at rest by the direct
Fick method and PhysioFlow methods has been found
to be negligible (0.07 L min�1) (Charloux et al.
2000). Blood pressures was measured every 10 min by
automated oscillometry, glomerular filtration rate
(GFR) by the clearance of constantly infused51Cr-EDTA and effective renal plasma flow (ERPF) by
clearance of infused p-aminohippurate (PAH). Derived
variables include systemic vascular resistance, effective
renal blood flow (ERBF) renal vascular resistance
(RVR) as well as renal and non-renal vascular conduc-
tances. RVR was estimated as mean arterial blood
pressure (MABP)/ERBF. ERBF was estimated as the
ERPF divided by (1 � haematocrit) which was set at
0.45 for all subjects. Osmolality, electrolytes and hor-
mones were determined by routine methods. The sub-
jects were given 100 mL of glucose solution (10%)
orally every 30 min throughout the experiment to (i)
maintain the standardized degree of hydration, (ii)
generate a uniform diuresis facilitating the clearance
measurements and (iii) suppress the feeling of hunger,
which otherwise would have occurred during the
experiment. For other details, see Data S1.
Proteomic analysis of exosomal proteins
Urinary exosomes were isolated by centrifugation and
repeated ultracentrifugation steps (Pisitkun et al.
2004, Gonzales et al. 2009), resulting in microgram
quantities of exosomic protein per sample. After
depletion of Tamm–Horsfall protein and enzymatic
digestion, peptides were concentrated and desalted
prior to mass spectrometric (MS) analysis using cus-
tomized microcolumns (Gobom et al. 1999). One
microgram of each sample was analysed by liquid
chromatography tandem mass spectrometry in a high/
low collision energy switching mode [LC-MSE (Silva
et al. 2006)]. Each sample was spiked with 100 fmol
yeast enolase as internal standard to enable determina-
tion of protein concentrations and to address technical
variation (Silva et al. 2006). The data were processed
and searched with ProteinLynx Global Server (PLGS,
version 2.4; Waters, Milford, MA, USA). Protein iden-
tifications were obtained by searching the human
SwissProt entries of a UniProt database (release
2010_05) modified to include known N-terminal pro-
cessing of proteins using the protein maturation device
software tool (Martens et al. 2005, Reisinger & Mar-
tens 2009). The output from the PLGS Ion Accounting
algorithm (Li et al. 2009) was used for further analy-
sis, which was limited to proteins identified in at least
two of three triplicates. Peptide identifications were
performed with <10 ppm mass deviation. The ‘top3/
HI3’ method embedded in PLGS was used for label-
free absolute protein quantification as preferred
method providing direct proportionality to protein
abundance over the full quantification range with
good accuracy and precision (Ahrne et al. 2013). Pro-
tein excretion rates were calculated and normalized to
creatinine excretion (pmol protein (mmol creati-
nine)�1). For details, see Data S1.
Statistics
Data are presented as mean � SEM and were analy-
sed by GRAPHPAD PRISM (GraphPad Software, San
Diego, CA, USA). Comparisons between two groups
were performed by Student’s t-test. Differences
between variances were assessed by F-test, and if
appropriate, Welch’s correction for uneven variances
was applied. Time-dependent changes were analysed
by two-way ANOVA. Differences were considered signif-
icant at P < 0.05. A number of hypotheses were
tested, but obviously these were not independent. No
correction for multiple testing was performed.
© 2014 Scandinavian Physiological Society. Published by John Wiley & Sons Ltd, doi: 10.1111/apha.12345 3
Acta Physiol 2014 M Damkjær et al. ·Hemodynamics and proteomics in hypertension

Results
Essential hypertension patients and control subjects
were indistinguishable with regard to age, body mass,
plasma sodium and potassium concentrations, as well
as to 24-h renal sodium excretion (Table S1).
Baseline cardio-renal function
Heart rate and cardiac output were very similar in the
two groups. In EH, MABP was elevated modestly due
to an 18% increase in total peripheral resistance
(Table 1). This was analysed further in terms of con-
ductances. At baseline, the numerically lower ERPF in
patients (509 � 92 mL min�1) was not statistically
different form controls (613 � 109 mL min�1). How-
ever, partly due to the contribution of the elevated
MABP, renal vascular conductances were markedly
different (8 � 2 and 15 � 3 ml (mmHg min)�1 in
patients and controls, respectively, P < 0.01, Table 1),
that is, reduced by 44% in the patients. The non-renal
vascular conductances in patients and controls were
similar (Table 1). Consequently, the increase in total
peripheral resistance in EH was due to renal vasocon-
striction. Over the course of the experiment, GFR in
patients was reduced (P < 0.05) and calculated filtered
load of sodium was 28% less than in controls
(P < 0.01); however, the baseline sodium excretion
rate was unaffected. The calculated fractional sodium
excretion (FENa) was 0.06 � 0.01% in patients and
0.05 � 0.01% in control subjects (P = ns). In patients
at baseline, plasma renin concentration (PRC) aver-
aged 61% of that of control subjects (P < 0.01), while
plasma ANP was elevated (+84%, P < 0.001).
Cardio-renal response to saline infusion
In control subjects (n = 12), the SL left MABP
unchanged (87 � 2 to 88 � 2 mmHg, Fig. 1). In
patients (n = 11), a significant increase in MABP
occurred (105 � 2 to 116 � 3 mmHg, P < 0.001,
Fig. 1). However, during the time control study of the
patients, MABP increased similarly (105 � 2 to
115 � 3 mmHg, P < 0.005, Figure S1) without any
change in sodium excretion. This does not indicate that
the rise in MABP occurring during SL was without any
effect on the rate of excretion of sodium, but it does
show that spontaneous changes in MABP are not driv-
ing sodium excretion under the present circumstances.
Based on the results obtained by two-way ANOVA,
renal plasma flow in patients was lower than in con-
trol subjects (Fig. 1). After SL, ERPF in patients were
markedly lower than in controls (final values, t-test,
P = 0.02). By two-way ANOVA, the trends towards
decrease and increase in renal conductances within the
EH patients and the control subjects, respectively, did
not reach statistical significance (Table 2).
As expected, the patients showed exaggerated
natriuresis (Fig. 1 and Figure S1): the 2.3-fold increase in
sodium excretion in the patients (63–141 lmol min�1,
P < 0.001) was significantly larger (P < 0.01) than
the 1.4-fold change in the control group
Table 1 Baseline values during low-sodium diet in control subjects (CON) and patients with essential hypertension (EH). Val-
ues are mean � SEM, n = 11 (EH) and 12 (CON)
Variable CON EH Diff. (%) P<
Mean arterial blood pressure (mmHg) 87 � 2 104 � 2 +20 0.001
Systolic blood pressure (mmHg) 123 � 3 140 � 2 +14 0.001
Diastolic blood pressure (mmHg) 69 � 2 86 � 2 +27 0.01
Heart rate (bpm) 71 � 2 70 � 3 – ns
Cardiac output (L min�1) 4.9 � 0.2 5.0 � 0.2 – ns
Total peripheral resistance (mmHg (L min�1)�1) 17.7 � 0.6 20.9 � 1.0 +18 0.01
Total peripheral conductance (mL (min 9 mmHg)�1) 57.5 � 2.1 48.7 � 2.1 �15 0.01
Renal vascular conductance (mL (min 9 mmHg)�1) 14.6 � 2.8 8.2 � 1.7 �44 0.01
Extrarenal vascular conductance (mL (min 9 mmHg)�1) 42.7 � 3.0 40.5 � 2.4 – ns
Effective renal plasma flow (mL min�1) 613 � 109 509 � 92 – ns
Glomerular filtration rate (mL min�1) 127 � 8 86 � 9 �32 0.05
Filtered load of sodium (mmol min�1) 17 � 1 12 � 1 �28 0.01
Plasma renin activity (mIU L�1) 75 � 5 44 � 7 �39 0.01
Plasma aldosterone concentration (pg mL�1) 186 � 22 138 � 13 – ns
Plasma ANP concentration (pg mL�1) 25 � 4 46 � 6 +84 0.001
Plasma noradrenaline concentration (nmol L�1) 2.49 � 0.25 3.79 � 0.51 +52 0.05
Plasma vasopressin concentration (pg mL�1) 2.9 � 0.5 2.1 � 0.5 – ns
ANP, atrial natriuretic peptide; Diff., Difference (EH – CON); ns, non-significant. Values are mean � SE. See text for details.
© 2014 Scandinavian Physiological Society. Published by John Wiley & Sons Ltd, doi: 10.1111/apha.123454
Hemodynamics and proteomics in hypertension · M Damkjær et al. Acta Physiol 2014

(49–71 lmol min�1, P < 0.01). During the time control
sessions, sodium excretion did not change (Figure S1).
During SL of patients and controls, the relative
decreases in PRC (Pt: �38%, Con: �48%) and plasma
aldosterone (Pt: �52%, Con: �49%) were similar
(Fig. 1). The time courses of the suppression of renin
secretion during saline infusion to EH and control sub-
jects were virtually identical (Fig. 1). During the time
0 1 2 3 4 5 63.5
4.0
4.5
5.0
5.5
h
Car
diac
out
put (
l/min
) Saline loading
0 1 2 3 4 5 660
80
100
120
140
h
GFR
(ml/m
in)
Saline loading
0 1 2 3 4 5 6200
400
600
800
1000
h
ERPF
(ml/m
in)
Saline loading
0 1 2 3 4 5 60
50
100
150
h
Perc
ent c
hang
e A
ldo
Saline loading
0 1 2 3 4 5 60
50
100
150
h
Perc
ent c
hang
e re
nin
Saline loading
0 1 2 3 4 5 680
100
120
140
160
h
Perc
ent c
hang
e N
A
Saline loading
0 1 2 3 4 5 6
85
105
125
h
MA
BP
(mm
Hg)
Saline loading(a) (b) (c)
(e)
***
0 1 2 3 4 5 60
50
100
150
200
h
NaE
x (µ
mol
/min
)
Saline loading(f)(d)
(g) (h) (i)
****
***
+++
****
*
0 1 2 3 4 5 655
60
65
70
75
h
Hea
rt ra
te (b
pm)
Saline loading
*
**
+
**
*
Figure 1 Cardio-renal responses to saline infusion in hypertensive patients (red) and control subjects (black). (a) mean arterial
blood pressure (MABP); dotted blue line: MABP in hypertensive patients during the time control day. (b) cardiac output (CO).
(c) heart rate (HR). (d) effective renal plasma flow (ERPF). (e) glomerular filtration rate (GFR). (f) renal sodium excretion
(NaEx). (g) per cent change from baseline value in plasma renin. (h) per cent change from baseline value in plasma aldosterone.
(i) per cent change from baseline value in plasma noradrenaline. Within series statistically significant change from baseline
value: *P < 0.05, **P < 0.01, ***P < 0.001. Statistically significant difference between experimental series: +P < 0.05,
++P < 0.01.
Table 2 Hemodynamics before and after saline loading
Variable Unit
Control subjects Hypertensive pts.
P-value after vs.
before
Before After Before After Controls Patients
Mean arterial blood pressure mmHg 87 � 2 88 � 2 105** � 2 116** � 3 ns <0.001
Total peripheral resistance mmHg min L�1 17.8 � 0.6 21.5 � 1.3 21.0* � 1.0 26.2* � 1.0 <0.01 <0.001
Total conductance ml (mmHg min)�1 57.5 � 2.1 47.5 � 2.5 48.7* � 2.1 38.2* � 1.5 <0.01 <0.001
Renal conductance ml (mmHg min)�1 14.6 � 2.8 17.4 � 2.1 8.2* � 1.7 7.5* � 1.7 ns ns
Extrarenal conductance ml (mmHg min)�1 42.7 � 3.0 30.1 � 2.8 40.5 � 2.4 30.7 � 3.1 <0.01 <0.01
Values are mean � SE, n = 9 or 10. Different from corresponding values in control subjects at *P < 0.01, **P < 0.001.
© 2014 Scandinavian Physiological Society. Published by John Wiley & Sons Ltd, doi: 10.1111/apha.12345 5
Acta Physiol 2014 M Damkjær et al. ·Hemodynamics and proteomics in hypertension
control sessions, PRC did not change significantly (Fig-
ure S1). In patients, the saline infusion increased plasma
noradrenaline by 23 � 10% (Fig. 1) in contrast to the
control subjects (Fig. 1). In patients, SL did not change
plasma ANP (46 � 6 to 45 � 7 pg mL�1). In every
control subject, the saline caused a modest increase in
plasma ANP (average 25 � 4 to 30 � 6 pg mL�1,
P < 0.05).
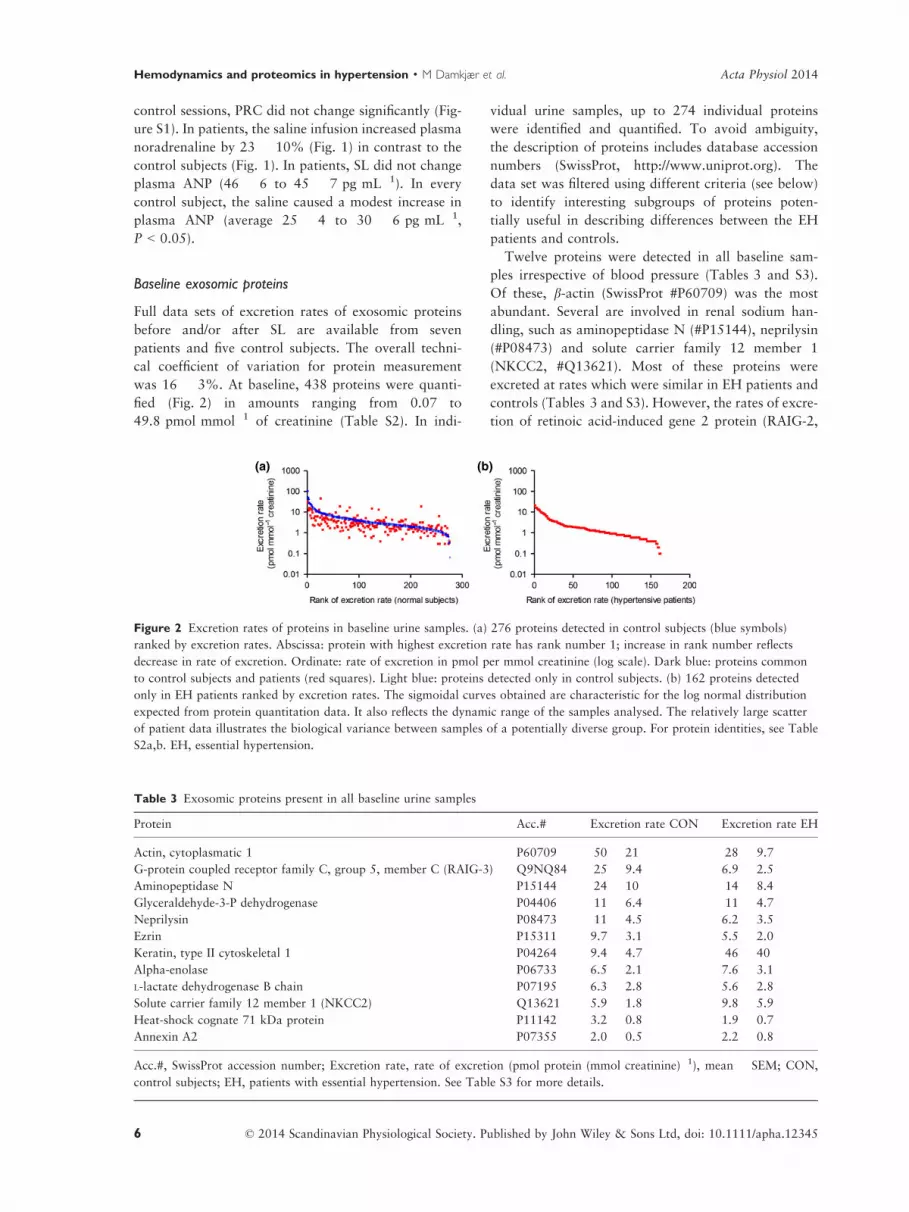
Baseline exosomic proteins
Full data sets of excretion rates of exosomic proteins
before and/or after SL are available from seven
patients and five control subjects. The overall techni-
cal coefficient of variation for protein measurement
was 16 � 3%. At baseline, 438 proteins were quanti-
fied (Fig. 2) in amounts ranging from 0.07 to
49.8 pmol mmol�1 of creatinine (Table S2). In indi-
vidual urine samples, up to 274 individual proteins
were identified and quantified. To avoid ambiguity,
the description of proteins includes database accession
numbers (SwissProt, http://www.uniprot.org). The
data set was filtered using different criteria (see below)
to identify interesting subgroups of proteins poten-
tially useful in describing differences between the EH
patients and controls.
Twelve proteins were detected in all baseline sam-
ples irrespective of blood pressure (Tables 3 and S3).
Of these, b-actin (SwissProt #P60709) was the most
abundant. Several are involved in renal sodium han-
dling, such as aminopeptidase N (#P15144), neprilysin
(#P08473) and solute carrier family 12 member 1
(NKCC2, #Q13621). Most of these proteins were
excreted at rates which were similar in EH patients and
controls (Tables 3 and S3). However, the rates of excre-
tion of retinoic acid-induced gene 2 protein (RAIG-2,
(a) (b)
Figure 2 Excretion rates of proteins in baseline urine samples. (a) 276 proteins detected in control subjects (blue symbols)
ranked by excretion rates. Abscissa: protein with highest excretion rate has rank number 1; increase in rank number reflects
decrease in rate of excretion. Ordinate: rate of excretion in pmol per mmol creatinine (log scale). Dark blue: proteins common
to control subjects and patients (red squares). Light blue: proteins detected only in control subjects. (b) 162 proteins detected
only in EH patients ranked by excretion rates. The sigmoidal curves obtained are characteristic for the log normal distribution
expected from protein quantitation data. It also reflects the dynamic range of the samples analysed. The relatively large scatter
of patient data illustrates the biological variance between samples of a potentially diverse group. For protein identities, see Table
S2a,b. EH, essential hypertension.
Table 3 Exosomic proteins present in all baseline urine samples
Protein Acc.# Excretion rate CON Excretion rate EH
Actin, cytoplasmatic 1 P60709 50 � 21 28 � 9.7
G-protein coupled receptor family C, group 5, member C (RAIG-3) Q9NQ84 25 � 9.4 6.9 � 2.5
Aminopeptidase N P15144 24 � 10 14 � 8.4
Glyceraldehyde-3-P dehydrogenase P04406 11 � 6.4 11 � 4.7
Neprilysin P08473 11 � 4.5 6.2 � 3.5
Ezrin P15311 9.7 � 3.1 5.5 � 2.0
Keratin, type II cytoskeletal 1 P04264 9.4 � 4.7 46 � 40
Alpha-enolase P06733 6.5 � 2.1 7.6 � 3.1
L-lactate dehydrogenase B chain P07195 6.3 � 2.8 5.6 � 2.8
Solute carrier family 12 member 1 (NKCC2) Q13621 5.9 � 1.8 9.8 � 5.9
Heat-shock cognate 71 kDa protein P11142 3.2 � 0.8 1.9 � 0.7
Annexin A2 P07355 2.0 � 0.5 2.2 � 0.8
Acc.#, SwissProt accession number; Excretion rate, rate of excretion (pmol protein (mmol creatinine)�1), mean � SEM; CON,
control subjects; EH, patients with essential hypertension. See Table S3 for more details.
© 2014 Scandinavian Physiological Society. Published by John Wiley & Sons Ltd, doi: 10.1111/apha.123456
Hemodynamics and proteomics in hypertension · M Damkjær et al. Acta Physiol 2014

#Q9NZH0) and syntenin-1 (#O00560) were signifi-
cantly lower in patients than in controls (Table S4,
Fig. 3c,d). For other proteins, RAIG-3 (#Q9NQ84),
NKCC2 and TSC (#P55017), the pattern of excretion
at baseline in EH appeared different from the corre-
sponding pattern in the controls: the average rates of
excretion were 4–25 pmol (mmol creatinine)�1 and
statistically indistinguishable (Fig. 3, Tables 3, S3 and
S4), but the variances were markedly larger in EH (all
P < 0.03). Notably, it is the same four patients who
exhibit low rates of excretion of the proteins shown in
Fig. 3. See Data S1 for details on protein function.
Other proteins of interest were the 21 proteins
found in the baseline samples of two or three
patients, but not of any control subject (Tables 4
and S5) including S100-A9 (calgranulin B, #P06702)
and alcohol dehydrogenase class III (ADH5,
#P11766).
Exosomic response to saline infusion
In general, the urinary concentrations of the individual
proteins decreased during SL, while urine flow
increased substantially. Therefore, the rates of excretion
of individual proteins did not change markedly with SL.
Notably, the excretion rates of a number of V-H+AT-
Pase subunits did not follow this pattern (Figure S2,
Table S6). See Data S1 for further details.
A number of proteins were common, but not ubiq-
uitous; 17 proteins were found in all five control sub-
jects and in five or six of the seven EH patients (Table
S4), including dipeptidyl peptidase IV (DPP4,
#P27487), which was excreted at rates averaging 3.6–
7.6 pmol (mmol creatinine)�1 apparently independent
of blood pressure and SL.
Ninety-three proteins were identified once in the
baseline samples from patients, but not in controls,
and remain potentially interesting (Table S7).
Discussion
Our study had two objectives: firstly to assess under
carefully controlled conditions the mechanisms
responsible for the exaggerated natriuresis of EH and
secondly to provide proof of concept of proteomics-
based quantitative measurements of exosomic proteins
as a tool in hypertension research.
Circulatory, renal and endocrine dynamics and
exaggerated natriuresis
The novel hemodynamic and hormonal results are (i)
that the increase in RVR in EH is solely responsible
for the increase in total peripheral resistance, (ii) that
baseline renin system activity and plasma ANP reflect
an endocrine setting favouring natriuresis and likely to
(a) (b)
(c) (d)
Figure 3 Baseline excretion rates of
individual proteins in hypertensive
patients and normotensive controls. (a)
solute carrier family 12 member 1
(NKCC2, #Q13621). (b) solute carrier
family 12 member 3 (TSC, #P55017).
Note log scale of Y axes. (c) retinoic
acid-induced gene 2 protein (RAIG-2,
#Q9NZH0). (d) syntenin-1 protein
(#O00560). (a, b) diuretic-sensitive pro-
teins; (c, d) unknown renal function.
Mean values � SEM.
© 2014 Scandinavian Physiological Society. Published by John Wiley & Sons Ltd, doi: 10.1111/apha.12345 7
Acta Physiol 2014 M Damkjær et al. ·Hemodynamics and proteomics in hypertension

provide at least part of the background for the exag-
geration of the natriuretic response to saline infusion,
(iii) that the time course of the deactivation of the
renin system during SL in patients was virtually identi-
cal to that of controls and (iv) that the increase in
blood pressure seen during SL unexpectedly occurred
also during the control day where renin system activ-
ity and sodium excretion did not change. The EH
patients showed increased total peripheral resistance
and decreases in GFR and filtered load of sodium as
expected (Goldring et al. 1941, Lowenstein et al.
1967, London et al. 1984).
The study focused on volume expansion in mild,
uncomplicated EH; patients were highly selected to
avoid the confounding effect of target organ damage,
including microalbuminuria. In addition, electrolyte
intake was standardized to low normal values
(Whelton et al. 2012) facilitating measurements of the
dynamic deactivation of the renin system, SL was per-
formed at individual rates of infusion adjusted to body
mass, and the concentration of sodium chloride in the
infusate was adjusted to provide sodium concentra-
tions slightly below those of plasma. Furthermore, the
subjects were investigated in the sitting position.
Together, this provides an unprecedented background
for disclosure of the volume-mediated reactivity of the
renin system and the associated renal excretory
responses.
Under less controlled conditions including more het-
erogeneous groups of patients, EH is assumed to be
associated with varying levels of renin system activity
(Laragh & Sealey 2011). In addition, early measure-
ments of strongly stimulated plasma renin levels (after
low-salt diet and standing) seemed to warrant subdivi-
sion of patients with EH (cf. Tuck et al., 1976). How-
ever, with the present standardization, PRC was
clearly reduced and plasma ANP concentrations
undoubtedly increased, thus providing a pronatriuretic
endocrine setting. It is well known that the natriuretic
effect of ANP is markedly augmented when renin sys-
tem activity is reduced (Bie et al. 1990). The notion of
normal function of the renin system in our patients is
supported by the finding that the acute deactivation of
the renin system during saline infusion was superim-
posable to the response of the normotensive controls.
Increased levels of plasma renin have been reported
before (Schalekamp et al. 1970, Birkenhager et al.
1972), and the differences between these and other
studies may be related to patient selection and stan-
dardization procedures. The present selection is very
restrictive, but the conditions of low normal salt
intake and seated position seem realistic for normal
life. It seems plausible, therefore, that the renal vaso-
constriction in the present hypertensive patients con-
stitutes a primary, renin-independent, inappropriate
antinatriuretic mechanism, which is counterbalanced
by homeostatically appropriate changes in the endo-
crine regulation of sodium excretion. This renal vaso-
constriction may well be neurogenic in consonance
with the original analysis of Hollenberg (Hollenberg
& Adams 1976) and the experimental studies of Esler
et al. (1989). The new twist is that the (inappropriate)
vasoconstriction apparently is occurring solely in the
kidney.
The reports on hemodynamic changes in EH are
numerous, and cardiac output and renal blood flow
have been measured simultaneously in a number of
studies (e.g. Sullivan et al. 1976, Schalekamp et al.
1977, London et al. 1984, van den Meiracker et al.
1989), but non-renal and renal vascular conductances
do not seem to have been assessed previously. Notably,
the extensive analysis of renal hemodynamics in EH
Table 4 Exosomic proteins occurring in baseline urine
samples from at least two patients, but not from any control
subjects
Protein name Acc.#
Excretion
rate
Protein S100-A9 P06702 6.3
Heat-shock protein b-1 P04792 3.7
Alcohol dehydrogenase class 3 P11766 2.6
Lysosome membrane protein 2 Q14108 2.1
Destrin P60981 2.0
Rho GDP-dissociation inhibitor 1 P52565 1.9
Aspartate aminotransferase,
cytoplasmatic
P17174 1.8
Multivesicular body subunit 12A Q96EY5 1.8
Rho-related GTP binding protein
RhoC
P08134 1.7
3-hydroxybutyrate dehydrogenase
type 2
Q9BUT1 1.4
Aldo-ketoreductase family 1
member C3
P42330 1.3
Elongation factor 2 P13639 1.3
Flavin reductase (NADPH) P30043 1.3
Protein NDGR1 Q92597 1.3
D-3-phosphoglycerate dehydrogenase O43175 1.1
Phenazine biosynthesis-like
domain containing protein
P30039 0.9
Unconventional myosin-Ib O43795 0.9
Myosin-9 P35579 0.8
Heat-shock-related 70 kDa protein 2 P54652 0.6
Epidermal growth factor receptor
kinase substrate 8-like protein 1
Q8TE68 0.5
V-type proton ATPase subunit d2 Q8N8Y2 0.4
Acc.#, SwissProt accession number; Excretion rate, rate of
excretion (pmol protein (mmol creatinine)�1), mean values
from two or three patients. No protein occurred in more
than three patients.
See Table S5 for more details.
© 2014 Scandinavian Physiological Society. Published by John Wiley & Sons Ltd, doi: 10.1111/apha.123458
Hemodynamics and proteomics in hypertension · M Damkjær et al. Acta Physiol 2014

performed by the group of Hollenberg did not include
renal conductance (cf. Williams et al. 1982, Shoback
et al. 1983, Rydstedt et al. 1986). Our finding that
renal vascular conductance was reduced to an extent
accounting for all the increase in total peripheral resis-
tance supports the notion that renal vasoconstriction is
an essential early element in the development of EH.
In EH, the SL increased blood pressure in contrast
to the control subjects seemingly indicating ‘salt sensi-
tivity’ in EH. However, this may be incorrect; during
the control day, blood pressure increased similarly,
but renal sodium excretion remained unchanged. This
demonstrates firstly that a peculiar diurnal blood pres-
sure rhythm was apparent in the EH patients and, sec-
ondly, that under the present conditions of small
changes (10–12 mmHg) in arterial blood pressure,
these do not necessarily contribute to drive renal
sodium excretion. Consequently, sodium excretion
seems to be regulated primarily by renovascular and
neurohumoral mechanisms.
Together, the hemodynamic and neurohumoral
results indicate that selective renal vasoconstriction
most likely driven by sympathetic nerve activity, or
renal vasomotor events independent hereof, is an early
– if not a primary – process of mild EH and that the
pro-natriuretic setting is an appropriate, compensatory
reaction. The concentration of noradrenaline in
plasma is not a reliable marker of ‘sympathetic drive’,
much less an index of renal nerve activity. Neverthe-
less, the modest increase in plasma noradrenaline in
hypertensive patients at least is compatible with
increased renal sympathetic tone.
Quantitative measurements of exosomic proteins
In recent years, proteomic methods have been applied
to the study of urinary proteins (Valente et al. 2012,
Carty et al. 2013) also of the proteins associated with
exosomes (Moon et al. 2011b, Raj et al. 2012, Rai-
mondo et al. 2013). The novel aspects of the present
study include (i) the measurement of the rates of
excretion for hundreds of individual exosome-related
proteins present in one human urine sample, (ii) the
different excretion patterns of proteins known to be
relevant to hypertension (bumetanide- and thiazide-
sensitive renal ion channel proteins) and (iii) the
excretion patterns of several members of the G-protein
coupled receptor family not previously associated with
EH.
A limited element of probability is involved in the
identification of proteins by mass spectrometry. We
applied conservative criteria for the identification of
individual proteins. Only proteins identified by a mini-
mum of three peptides in at least two of three techni-
cal replicates were analysed further. The MSE data
acquisition strategy enabled reproducible absolute
quantification of protein amounts, in turn making it
possible to calculate excretion rates per unit creatinine,
per unit b-actin and per hour. For the majority of the
proteins, rates of excretion were in the order of 1–
10 pmol mmol�1 of creatinine (Fig. 2). Remarkably,
the excretion rates of most proteins were unaffected by
the about threefold increase in urine flow occurring dur-
ing the SL, indicating that the appearance of exosomic
proteins in the urine is not flow dependent. So-called
household proteins [b-actin and glyceraldehyde-3-P
dehydrogenase (GAPDH)] were among the most abun-
dant proteins present in all baseline samples. GAPDH
may not be entirely ‘household’ (Nicholls et al. 2012),
as it may be part of the potassium channel (ROMK2)
supramolecular complex in the thick ascending loop of
Henle (Renigunta et al. 2011). The abundance of b-actin allows the use of this protein for normalization.
The proteomics approach has been applied to the
analysis of pooled normal human urine from eight
subjects by the group of Pisitkun and Knepper (Gonz-
ales et al. 2009); after elaborate fractionation, they
identified more than 1100 proteins, that is, several
times the number of proteins found in this study.
Using quantitative methods similar to this study,
Moon et al. (2011a)reported to have identified almost
1900 exosomic proteins; however, ambiguous proteins
seem to be included; after proper filtering, the result
was a total of 358 unique proteins, that is, slightly
lower than the present 438 proteins. Among these,
specific groups of proteins included the subset of pro-
teins found in this study in all baseline samples and
the group occurring only in the baseline samples from
patients. Twenty-seven of these 33 proteins (Tables 3
and 4) were also found by Gonzales et al. (2009); the
most notable exception is that the form of actin (cyto-
plasmatic 1, #P60709), found most abundantly in our
study and potentially useful for normalization, does
not occur in the lists of Gonzales et al. (2009). Nota-
bly, this particular protein was present in all four nor-
mal subjects from which individual data were
reported by Moon et al. (2011a). The reason for these
discrepancies is not known, but their existence calls for
elaborate standardization of protocols for sampling,
extraction and measurements. In the study of Gonzales
et al. (2009), a total of 177 proteins were assumed to
be associated with diseases (34 with renal diseases)
based on presence on the ‘Online Mendelian Inheri-
tance in Man’ database. Some of these were found in
this study; of the proteins common to all baseline sam-
ples, two of 12 (neprilysin and NKCC2, Table 3)
belonged to these disease-related proteins; however,
among the proteins occurring in baseline samples only
from patients, a similar fraction (four of 21) was ‘dis-
ease related’ (#O43175, #P04792, #P35579, #Q92597,
© 2014 Scandinavian Physiological Society. Published by John Wiley & Sons Ltd, doi: 10.1111/apha.12345 9
Acta Physiol 2014 M Damkjær et al. ·Hemodynamics and proteomics in hypertension

Table 4). Urine samples of hypertensive patients do not
appear to show predominance of individual disease-
related exosomic proteins. Studies of the abundance of
exosome proteins by immunological methods (McKee
et al. 2000, Esteva-Font et al. 2010, van der Lubbe
et al. 2012) have confirmed the presence of sodium
transporters (NKCC2 and TSC), but not provided the
sufficient basis for clinical applications.
In hypertensive patients, the level of excretion of
RAIG-2 protein (RAIG-2) was significantly (P < 0.05)
reduced. RAIG-2 is a G-protein coupled receptor
(family C, group 5, member B, GPRC5B), and its spe-
cific function is unknown, but it has recently been
shown to be elevated in acute renal injury (Kwon
et al. 2014). RAIG-3 (Tables 3 and S3) is another
related G-protein coupled receptor (family C, group 5,
member C) for which gene transcription is induced by
retinoic acid (Robbins et al. 2000); in normal subjects,
the rate of excretion averaged 25 pmol (mmol creati-
nine)�1, but the excretion rates of RAIG-3 were very
low in some patients. Retinoids, including retinoic
acid (all-trans-retinoic acid), are derivates of vitamin
A (retinol) exerting antiproliferative and anti-inflam-
matory actions via retinoid acid receptors (among oth-
ers); retinoid receptors are expressed in the kidney,
where they modify the expression of target genes via
modulation of gene transcription (Dechow et al.
2001). Treatment with retinoic acid has been found to
blunt glomerulosclerosis after 5/6 nephrectomy (Liu
et al. 2011) as well as cardiac remodelling after aortic
constriction (Choudhary et al. 2008) and to decrease
AngII synthesis and receptor expression in a nephritis
model (Dechow et al. 2001). Assuming that urinary
RAIG-2 reflects the activity of retinoic acid dependent
renal pathway(s), we may hypothesize that these path-
ways, in addition to their roles in organ differentiation
and pathophysiology (Gudas 2012), are associated
with the aetiology of EH. Irrespective of molecular
mechanics, RAIG proteins seem to be potential uri-
nary biomarkers of the disease.
Overall, the excretion rates of syntenin are signifi-
cantly lover (P < 0.05) in hypertension (Fig. 3d). Syn-
tenin is a PDZ domain containing adapter protein
involved in intracellular and cell surface targeting
(Sarkar et al. 2004) notably playing an important role
in exosome formation together with ALIX [apoptosis-
linked gene 2 (ALG-2) interacting protein X] (Baietti
et al. 2012, Hurley & Odorizzi 2012). The functional
significance of a possible reduction in the abundance
of syntenin-ALIX-dependent exosomes in the urine in
some of the patients remains unclear.
Other proteins were excreted in conspicuous patterns
in hypertensive patients, for example, the thiazide-sen-
sitive NaCl co-transporter (TSC) for which the variance
of the excretion data in the hypertensive patients was
significantly higher than in controls. The fact that the
same patients exhibited low excretion rates for several
proteins (Fig. 3) indicates a coupling between excretion
patterns. These results support the assumptions that the
excretion rates of individual proteins follow different
distributions in clinically similar EH patients and that
these proteins are potentially useful as means of identifi-
cation of patient subgroups.
This study has several limitations. Firstly, admixture
of proteins from the reproductive tract and the epithe-
lium of the urinary tract undoubtedly occurred, how-
ever, at present to an unknown extent. Secondly,
proteins may remain undetected by the present
method, but still be measured by sensitive antibody-
based techniques. Thirdly, our results demonstrate the
methodological feasibility of quantitative studies of
large ensembles of proteins, but do not prove the exis-
tence of exosomic proteins specific for EH. However,
162 exosome-associated proteins were found in the
urine of all seven hypertensive patients, but not in any
of the samples from any of five normotensive controls.
Although it is very likely that this number is substan-
tially higher than the real difference between the two
groups, it is equally likely that the list includes poten-
tial biomarkers valuable for diagnosis, subdivision and
treatment of patients with EH.
Perspectives on mild, uncomplicated EH
The present results are compatible with the notions (i)
that an early pathophysiological mechanism is selec-
tive renal vasoconstriction mediated by renal nerves,
(ii) that changes in renin system activity and natri-
uretic peptide concentrations contribute to the exag-
geration of natriuresis and (iii) that the excretion rates
of specific proteins of renal origin with or without
known functions may serve to identify subgroups of
patients.
Conflict of interest
None.
The technical assistance of Eva C. Østerlund, Bodil Kristen-
sen and Charlotte Nielsen is greatly appreciated. We thank
Dr. Alexei Bagrov, National Institute of Aging, NIH, Balti-
more, MD, for the analyses of marinobufagenin.
Funding
The work was supported by the Danish Cardiovascu-
lar Research Academy (DaCRA), the Faculty of
Health Sciences, University of Southern Denmark
(SDU), the SDU Center for Clinical Proteomics, Lisa
and Gudmund Jørgensens Foundation, and Annie and
Otto Detlefs’ Foundation.
© 2014 Scandinavian Physiological Society. Published by John Wiley & Sons Ltd, doi: 10.1111/apha.1234510
Hemodynamics and proteomics in hypertension · M Damkjær et al. Acta Physiol 2014

References
Ahrne, E., Molzahn, L., Glatter, T. & Schmidt, A. 2013.
Critical assessment of proteome-wide label-free absolute
abundance estimation strategies. Proteomics 13, 2567–
2578.
Alvarez, S., Suazo, C., Boltansky, A., Ursu, M., Carvajal, D.,
Innocenti, G., Vukusich, A., Hurtado, M., Villanueva, S.,
Carreno, J.E., Rogelio, A. & Irarrazabal, C.E. 2013. Urinary
exosomes as a source of kidney dysfunction biomarker in
renal transplantation. Transplant Proc 45, 3719–3723.
Baietti, M.F., Zhang, Z., Mortier, E., Melchior, A., Degeest,
G., Geeraerts, A., Ivarsson, Y., Depoortere, F., Coomans,
C., Vermeiren, E., Zimmermann, P. & David, G. 2012.
Syndecan-syntenin-ALIX regulates the biogenesis of exo-
somes. Nat Cell Biol 14, 677–685.
van Balkom, B.W.M., Pisitkun, T., Verhaar, M.C. & Knep-
per, M.A. 2011. Exosomes and the kidney: prospects for
diagnosis and therapy of renal diseases. Kidney Int 80,
1138–1145.
Bie, P., Wang, B.C., Leadley, R.J. & Goetz, K.L. 1990.
Enhanced atrial peptide natriuresis during angiotensin and
aldosterone blockade in dogs. Am J Physiol Reg Int Comp
Physiol 258, R1101–R1107.
Birkenhager, W.H., Schalekamp, M.A., Krauss, X.H., Kol-
sters, G., Schalekamp-Kuyken, M.P., Kroon, B.J. & Teu-
lings, F.A. 1972. Systemic and renal haemodynamics, body
fluids and renin in benign essential hypertension with special
reference to natural history. Eur J Clin Invest 2, 115–122.
Carty, D.M., Schiffer, E. & Delles, C. 2013. Proteomics in
hypertension. J Hum Hypertens 27, 211–216.
Charloux, A., Lonsdorfer-Wolf, E., Richard, R., Lampert, E.,
Oswald-Mammosser, M., Mettauer, B., Geny, B. & Lons-
dorfer, J. 2000. A new impedance cardiograph device for
the non-invasive evaluation of cardiac output at rest and
during exercise: comparison with the “direct” Fick
method. Eur J Appl Physiol 82, 313–320.
Choudhary, R., Palm-Leis, A., Scott, R.C., Guleria, R.S.,
Rachut, E., Baker, K.M. & Pan, J. 2008. All-trans retinoic
acid prevents development of cardiac remodeling in aortic
banded rats by inhibiting the renin-angiotensin system. Am
J Physiol Heart Circ Physiol 294, H633–H644.
Cobb, L.K., Anderson, C.A., Elliott, P., Hu, F.B., Liu, K.,
Neaton, J.D., Whelton, P.K., Woodward, M., Appel, L.J.
& American Heart Association Council on Lifestyle and
Metabolic Health. 2014. Methodological issues in cohort
studies that relate sodium intake to cardiovascular disease
outcomes: a science advisory from the American heart
association. Circulation 129, 1173–1186.
Cook, N.R., Appel, L.J. & Whelton, P.K. 2014. Lower levels
of sodium intake and reduced cardiovascular risk. Circula-
tion 129, 981–989.
Creskey, M.C., Li, C., Wang, J., Girard, M., Lorbetskie, B.,
Gravel, C., Farnsworth, A., Li, X., Smith, D.G.S. & Cyr,
T.D. 2012. Simultaneous quantification of the viral
antigens hemagglutinin and neuraminidase in influenza
vaccines by LC–MSE. Vaccine 30, 4762–4770.
Damkjær, M., Vafaee, M., Braad, P.E., Petersen, H., Høil-
und-Carlsen, P.F. & Bie, P. 2012. Renal cortical and
medullary blood flow during modest saline loading in
humans. Acta Physiol (Oxf) 205, 472–483.
Damkjaer, M., Isaksson, G.L., Stubbe, J., Jensen, B.L., Asser-
sen, K. & Bie, P. 2013. Renal renin secretion as regulator
of body fluid homeostasis. Pflugers Archiv 465, 153–165.
Dechow, C., Morath, C., Peters, J., Lehrke, I., Waldherr, R.,
Haxsen, V., Ritz, E. & Wagner, J. 2001. Effects of all-
trans retinoic acid on renin-angiotensin system in rats with
experimental nephritis. Am J Physiol Renal Physiol 281,
F909–F919.
Esler, M., Lambert, G. & Jennings, G. 1989. Regional nor-
epinephrine turnover in human hypertension. Clin Exp
Hypertens A 11(Suppl 1), 75–89.
Esteva-Font, C., Wang, X., Ars, E., Guillen-Gomez, E., Sans,
L., Gonzalez Saavedra, I., Torres, F., Torra, R., Masilama-
ni, S., Ballarin, J.A. & Fernandez-Llama, P. 2010. Are
sodium transporters in urinary exosomes reliable markers
of tubular sodium reabsorption in hypertensive patients?.
Nephron Physiol 114, 25–34.
Frithiof, R., Xing, T., McKinley, M.J., May, C.N. & Ramch-
andra, R. 2014. Intracarotid hypertonic sodium chloride
differentially modulates sympathetic nerve activity to the
heart and kidney. Am J Physiol Regul Integr Comp Physiol
306, R567–R575.
Gobom, J., Nordhoff, E., Mirgorodskaya, E., Ekman, R. &
Roepstorff, P. 1999. Sample purification and preparation
technique based on nano-scale reversed-phase columns for
the sensitive analysis of complex peptide mixtures by
matrix-assisted laser desorption/ionization mass spectrome-
try. J Mass Spectrom 34, 105–116.
Goldring, W., Chasis, H., Ranges, H.A. & Smith, H.W.
1941. Effective renal blood flow in subjects with essential
hypertension. J Clin Invest 20, 637–653.
Gonzales, P.A., Pisitkun, T., Hoffert, J.D., Tchapyjnikov, D.,
Star, R.A., Kleta, R., Wang, N.S. & Knepper, M.A. 2009.
Large-scale proteomics and phosphoproteomics of urinary
exosomes. J Am Soc Nephrol 20, 363–379.
Green, D.M., Wedell, H.G., Wald, M.H. & Learned, B.
1952. The relation of water and sodium excretion in blood
pressure in human subjects. Circulation 6, 919–924.
Gudas, L.J. 2012. Emerging roles for retinoids in regenera-
tion and differentiation in normal and disease states. Bio-
chim Biophys Acta 1821, 213–221.
Herrera, M. & Coffman, T.M. 2012. The kidney and hyper-
tension: novel insights from transgenic models. Curr Opin
Nephrol Hypertens 21, 171–178.
Hogan, M.C., Johnson, K.L., Zenka, R.M., Cristine Charles-
worth, M., Madden, B.J., Mahoney, D.W., Oberg, A.L.,
Huang, B.Q., Leontovich, A.A., Nesbitt, L.L., Bakeberg,
J.L., McCormick, D.J., Robert Bergen, H. & Ward, C.J.
2014. Subfractionation, characterization, and in-depth pro-
teomic analysis of glomerular membrane vesicles in human
urine. Kidney Int 85, 1225–1237.
Hollenberg, N.K. & Adams, D.F. 1976. The renal circulation
in hypertensive disease. Am J Med 60, 773–784.
Hurley, J.H. & Odorizzi, G. 2012. Get on the exosome bus
with ALIX. Nat Cell Biol 14, 654–655.
Johnson, R.J., Feig, D.I., Nakagawa, T., Sanchez-Lozada,
L.G. & Rodriguez-Iturbe, B. 2008. Pathogenesis of
© 2014 Scandinavian Physiological Society. Published by John Wiley & Sons Ltd, doi: 10.1111/apha.12345 11
Acta Physiol 2014 M Damkjær et al. ·Hemodynamics and proteomics in hypertension

essential hypertension: historical paradigms and modern
insights. J Hypertens 26, 381–391.
Kwon, S.H., Liu, K.D. & Mostov, K.E. 2014. Intercellular
transfer of GPRC5B via exosomes drives HGF-mediated
outward growth. Curr Biol 24, 199–204.
Laragh, J.H. & Sealey, J.E. 2011. The plasma renin test
reveals the contribution of body sodium-volume content
(V) and renin-angiotensin (R) vasoconstriction to long-term
blood pressure. Am J Hypertens 24, 1164–1180.
Li, G.-Z., Vissers, J.P.C., Silva, J.C., Golick, D., Gorenstein,
M.V. & Geromanos, S.J. 2009. Database searching and
accounting of multiplexed precursor and product ion spec-
tra from the data independent analysis of simple and com-
plex peptide mixtures. Proteomics 9, 1696–1719.
Liu, X., Lu, L., Tao, B.-B., Zhou, A.-L. & Zhu, Y.-C. 2011.
Amelioration of glomerulosclerosis with all-trans retinoic
acid is linked to decreased plasminogen activator inhibitor-
1 and [alpha]-smooth muscle actin. Acta Pharmacol Sin
32, 70–78.
London, G.M., Safar, M.E., Sassard, J.E., Levenson, J.A. &
Simon, A.C. 1984. Renal and systemic hemodynamics in
sustained essential hypertension. Hypertension 6, 743–754.
Lowenstein, J., Steinmetz, P.R., Effros, R.M., Demeester, M.,
Chasis, H., Baldwin, D.S. & Gomez, D.M. 1967. The dis-
tribution of intrarenal blood flow in normal and hyperten-
sive man. Circulation 35, 250–259.
van der Lubbe, N., Jansen, P.M., Salih, M., Fenton, R.A.,
van den Meiracker, A.H., Danser, A.H.J., Zietse, R. &
Hoorn, E.J. 2012. The phosphorylated sodium chloride
cotransporter in urinary exosomes is superior to prostasin
as a marker for aldosteronism/novelty and significance.
Hypertension 60, 741–748.
Malpas, S.C. 2010. Sympathetic nervous system overactivity
and its role in the development of cardiovascular disease.
Physiol Rev 90, 513–557.
Mancia, G., De Backer, G., Dominiczak, A., Cifkova, R.,
Fagard, R., Germano, G., Grassi, G., Heagerty, A.M.,
Kjeldsen, S.E., Laurent, S. et al. 2007. 2007 Guidelines for
the management of arterial hypertension. Eur Heart J 28,
1462–1536.
Martens, L., Vandekerckhove, J. & Gevaert, K. 2005.
DBToolkit: processing protein databases for peptide-centric
proteomics. Bioinformatics 21, 3584–3585.
McKee, J.A., Kumar, S., Ecelbarger, C.A., Fernandez-Llama,
P., Terris, J. & Knepper, M.A. 2000. Detection of Na(+)
transporter proteins in urine. J Am Soc Nephrol 11, 2128–
2132.
van den Meiracker, A.H., Man in’t Veld, A.J., Boomsma, F.,
Fischberg, D.J., Molinoff, P.B. & Schalekamp, M.A. 1989.
Hemodynamic and beta-adrenergic receptor adaptations
during long-term beta-adrenoceptor blockade. Studies with
acebutolol, atenolol, pindolol, and propranolol in hyper-
tensive patients. Circulation 80, 903–914.
Moon, P.-G., Lee, J.-E., You, S., Kim, T.-K., Cho, J.-H.,
Kim, I.-S., Kwon, T.-H., Kim, C.-D., Park, S.-H., Hwang,
D., Kim, Y.-L. & Baek, M.-C. 2011a. Proteomic analysis
of urinary exosomes from patients of early IgA nephropa-
thy and thin basement membrane nephropathy. Proteomics
11, 2459–2475.
Moon, P.-G., You, S., Lee, J.-E., Hwang, D. & Baek, M.-C.
2011b. Urinary exosomes and proteomics. Mass Spectrom
Rev 30, 1185–1202.
Nicholls, C., Li, H. & Liu, J.-P. 2012. GAPDH: a common
enzyme with uncommon functions. Clin Exp Pharmacol
Physiol 39, 674–679.
Pisitkun, T., Shen, R.-F. & Knepper, M.A. 2004. Identifica-
tion and proteomic profiling of exosomes in human urine.
Proc Natl Acad Sci USA 101, 13368–13373.
Raimondo, F., Corbetta, S., Morosi, L., Chinello, C., Gianaz-
za, E., Castoldi, G., Di Gioia, C., Bombardi, C., Stella, A.,
Battaglia, C., Bianchi, C., Magni, F. & Pitto, M. 2013.
Urinary exosomes and diabetic nephropathy: a proteomic
approach. Mol BioSyst 9, 1139–1146.
Raj, D.A., Fiume, I., Capasso, G. & Pocsfalvi, G. 2012. A mul-
tiplex quantitative proteomics strategy for protein biomar-
ker studies in urinary exosomes. Kidney Int 81, 1263–1272.
Ramchandra, R., Hood, S.G., Frithiof, R. & May, C.N.
2009. Discharge properties of cardiac and renal sympa-
thetic nerves and their impaired responses to changes in
blood volume in heart failure. Am J Physiol Regul Integr
Comp Physiol 297, R665–R674.
Ramchandra, R., Hood, S.G., Frithiof, R., McKinley, M.J. &
May, C.N. 2013. The role of the paraventricular nucleus
of the hypothalamus in the regulation of cardiac and renal
sympathetic nerve activity in conscious normal and heart
failure sheep. J Physiol 591, 93–107.
Raposo, G. & Stoorvogel, W. 2013. Extracellular vesicles:
exosomes, microvesicles, and friends. J Cell Biol 200, 373–
383.
Reisinger, F. & Martens, L. 2009. Database on demand – an
online tool for the custom generation of FASTA-formatted
sequence databases. Proteomics 9, 4421–4424.
Renigunta, A., Mutig, K., Rottermann, K., Schlichth€orl, G.,
Preisig-M€uller, R., Daut, J., Waldegger, S. & Renigunta,
V. 2011. The glycolytic enzymes glyceraldehyde 3-phos-
phate dehydrogenase and enolase interact with the renal
epithelial K+ channel ROMK2 and regulate its function.
Cell Physiol Biochem 28, 663–672.
Robbins, M.J., Michalovich, D., Hill, J., Calver, A.R., Med-
hurst, A.D., Gloger, I., Sims, M., Middlemiss, D.N. & Panga-
los, M.N. 2000. Molecular cloning and characterization of
two novel retinoic acid-inducible orphan G-protein-coupled
receptors (GPRC5B and GPRC5C).Genomics 67, 8–18.
Rydstedt, L.L., Williams, G.H. & Hollenberg, N.K. 1986.
Renal and endocrine response to saline infusion in essential
hypertension. Hypertension 8, 217–222.
Sarkar, D., Boukerche, H., Su, Z.Z. & Fisher, P.B. 2004.
mda-9/syntenin: recent insights into a novel cell signaling
and metastasis-associated gene. Pharmacol Ther 104, 101–
115.
Schalekamp, M.A., Schalekamp-Kuyken, M.P. & Birkenhag-
er, W.H. 1970. Abnormal renal haemodynamics and renin
suppression in hypertensive patients. Clin Sci 38, 101–110.
Schalekamp, M., Birkenh€ager, W., Zaal, G. & Kolsters, G.
1977. Haemodynamic characteristics of low-renin hyper-
tension. Clin Sci Mol Med 52, 405–412.
Shoback, D.M., Williams, G.H., Moore, T.J., Dluhy, R.G.,
Podolsky, S. & Hollenberg, N.K. 1983. Defect in the
© 2014 Scandinavian Physiological Society. Published by John Wiley & Sons Ltd, doi: 10.1111/apha.1234512
Hemodynamics and proteomics in hypertension · M Damkjær et al. Acta Physiol 2014

sodium-modulated tissue responsiveness to angiotensin II
in essential hypertension. J Clin Invest 72, 2115–2124.
Silva, J.C., Gorenstein, M.V., Li, G.-Z., Vissers, J.P.C. &
Geromanos, S.J. 2006. Absolute quantification of proteins
by LCMSE. Mol Cell Proteomics 5, 144–156.
Solomon, P., Belsky, J.L. & Bleifer, K.H. 1960. The response
to the administration of an isotonic sodium chloride-lactate
solution in patients with essential hypertension. J Clin
Invest 39, 876–884.
Strom, B.L., Yaktine, A.L. & Oria, M. 2013. Sodium Intake
in Populations: Assessment of Evidence. Institute of Medi-
cine, Washington, DC.
Sullivan, J.M., Adams, D.F. & Hollenberg, N.K. 1976. beta-
adrenergic blockade in essential hypertension: reduced
renin release despite renal vasoconstriction. Circ Res 39,
532–536.
Tuck, M.L., Williams, G.H., Dluhy, R.G., Greenfield, M. &
Moore, T.J. 1976. A delayed suppression of the renin-
aldosterone axis following saline infusion in human hyper-
tension. Circ Res 39, 711–717.
Valente, M.A.E., Damman, K., Dunselman, P.H.J.M., Hil-
lege, H.L. & Voors, A.A. 2012. Urinary proteins in heart
failure. Prog Cardiovasc Dis 55, 44–55.
Whelton, P.K., Appel, L.J., Sacco, R.L., Anderson, C.A.M.,
Antman, E.M., Campbell, N., Dunbar, S.B., Frohlich,
E.D., Hall, J.E., Jessup, M. et al. 2012. Sodium, blood
pressure, and cardiovascular disease. Circulation 126,
2880–2889.
Williams, G.H., Tuck, M.L., Sullivan, J.M., Dluhy, R.G. &
Hollenberg, N.K. 1982. Parallel adrenal and renal abnor-
malities in young patients with essential hypertension. Am
J Med 72, 907–914.
Wood, S.L., Knowles, M.A., Thompson, D., Selby, P.J. &
Banks, R.E. 2013. Proteomic studies of urinary biomarkers
for prostate, bladder and kidney cancers. Nat Rev Urol 10,
206–218.
Yoshimoto, M., Miki, K., Fink, G.D., King, A. & Osborn,
J.W. 2010a. Chronic angiotensin II infusion causes differ-
ential responses in regional sympathetic nerve activity in
rats. Hypertension 55, 644–651.
Yoshimoto, M., Nagata, K. & Miki, K. 2010b. Differential
control of renal and lumbar sympathetic nerve activity dur-
ing freezing behavior in conscious rats. Am J Physiol Regul
Integr Comp Physiol 299, R1114–R1120.
Supporting Information
Additional Supporting Information may be found in
the online version of this article:
Figure S1. Hemodynamics, plasma hormones and
renal sodium excretion in hypertensive patients during
time control (blue) and saline infusion (Na-load in red).
Figure S2. Changes in excretion rates of V-ATPase
subunits with saline loading in three control subjects
(panel a) and five hypertensive patients (panel b).
Data S1. Methods.
Table S1. Entry characteristics of hypertensive
patients (EH) and control subjects (CON).
Table S2. Exosomic proteins detected in baseline
samples and ranked according to abundance.
Table S3. Exosomic proteins present in all baseline
samples ranked according to abundance in control
subjects.
Table S4. Exosomic proteins present in all baseline
samples of normal subjects, but not all patients.
Table S5. Exosomic proteins occurring in baseline
urine samples from at least 2 patients, but not from
any control subjects.
Table S6. Excretion rates of exosomic V-ATPase
subunits in hypertensives and control subjects, at base-
line and after saline loading.
Table S7. Proteins identified in baseline sample from
one hypertensive patient, but not in any control sub-
ject.
Table S8. Raw peptide and protein data.
Table S9. Excretion rates (pmol mmol�1 creatinine)
with standard deviation and coefficient of variation
(CV) for controls (C) and patients (P) after n ≥ 2 fil-
tering of technical replicates and normalization of
determined absolute protein amounts by measured
creatine levels.
Table S10. Excretion rates (pmol mmol�1 creati-
nine) for proteins identified in ≥2 replicate runs for
individual controls (C) and patients (P), before and
after saline loading, as well as per group
(mean � SEM).
© 2014 Scandinavian Physiological Society. Published by John Wiley & Sons Ltd, doi: 10.1111/apha.12345 13
Acta Physiol 2014 M Damkjær et al. ·Hemodynamics and proteomics in hypertension


