Embed Size (px)
Citation preview

Seneca’sError:
An Affective Model ofCognitive Resistance
Robert Jan de Boer
Seneca’s Error: An A
ffective Model of C
ognitive Resistance R
obert Jan de Boer
Boer, RJ_Omslag 22-03-12 12:20 Pagina 1
Proefschrift
ter verkrijging van de graad van doctor aan de Technische Universiteit Delft,
op gezag van de Rector Magnificus Prof. ir. K.C.A.M. Luyben, voorzitter van het College voor Promoties,
in het openbaar te verdedigen op maandag 7 mei 2012 om 15:00 uur
door Robert Jan DE BOER,
ingenieur luchtvaart en ruimtevaarttechniek, geboren te Vlaardingen.
Seneca’s Error:
An Affective Model of
Cognitive Resistance

Dit proefschrift is goedgekeurd door de promotoren:
Prof.mr.dr.ir. S.C. Santema Prof.dr. P.G. Badke-Schaub
Samenstelling promotiecommissie:
Rector Magnificus, voorzitter Prof.dr. P.G. Badke-Schaub, Technische Universiteit Delft, promotor Prof.mr.dr.ir. S.C. Santema, Technische Universiteit Delft, promotor Prof.Dr.-Ing. G. Eitelberg, Technische Universiteit Delft Prof.dr. A.H. Fischer, Universiteit van Amsterdam Prof.dr. K. Lauche, Radboud Universiteit Nijmegen Prof.dr.ir. M.J.L. van Tooren, Technische Universiteit Delft Dr. G. Hofinger, V. Menschen in komplexen Arbeitswelten e.V., Duitsland Prof.dr. P.J. Stappers, Technische Universiteit Delft, reservelid
ISBN: 978-90-6464-545-7
Cover: Ferdinand van Nispen, Citroenvlinder-DTP.nl, Bilthoven Print: GVO | Ponsen & Looijen, Ede
Copyright © 2012 by R.J. de Boer
Errare humanum est, sed perseverare diabolicum
To err is human, but to persist in the mistake is diabolical
Seneca the Younger, circa 3 BC – 65 AD
This thesis describes how human beings change their mind. As any designer will know from his or her own experience, this does not always come naturally. Therefore this dissertation aims to modify Seneca’s assertion: not only to err is human, but it is also human to persist in this mistake despite evidence to the contrary. I will argue that changing one’s mind is regulated through emotions, building on Damasio’s thoughts that emotions are essential to rational thinking and everyday behavior. His landmark book “Descarte’s Error“ (1994) inspired the title of the current work. Part of my motivation for this research has been prompted by my own experience in industry, where I have been lucky enough to collaborate with many talented, friendly and rather stubborn1 engineers for over 20 years. In countless interactions I witnessed how emotions seemed to moderate the way that designers were able to align their thoughts and collaborate.
1 Needless to say I am an engineer myself.

Contents
1. Introduction ........................................................................................................... 1
1.1. Research Motivation .............................................................................................. 1
1.2. Research Aim .......................................................................................................... 3
1.3. Scientific Contribution ............................................................................................ 4
1.4. Practical Contribution ............................................................................................. 9
1.5. Structure of this Dissertation ................................................................................ 10
2. Research Design ................................................................................................... 13
2.1. Research Framework ............................................................................................ 13
2.1.1. Mental models ............................................................................................. 13
2.1.2. Cognitive resistance ..................................................................................... 23
2.1.3. Initial research framework ........................................................................... 30
2.2. Research Questions .............................................................................................. 31
2.3. Research Approach ............................................................................................... 32
2.3.1. Review of literature ...................................................................................... 33
2.3.2. Experimental approach ................................................................................ 35
2.3.3. Overview of the research process ................................................................ 36
2.4. Summary .............................................................................................................. 36
3. Components of cognitive resistance ..................................................................... 37
3.1. Perception ............................................................................................................ 37
3.2. Emotions ............................................................................................................... 39
3.2.1. Existing definitions of emotion ..................................................................... 39
3.2.2. Defining emotional responses ...................................................................... 42
3.2.3. Emotion as a component of cognitive resistance ........................................ 51
3.3. Conclusion ............................................................................................................ 62
4. Interaction between components ......................................................................... 65
4.1. Modeling cognitive resistance .............................................................................. 65
4.1.1. A schematic description of cognitive resistance .......................................... 66
4.1.2. A dynamic model of cognitive resistance ..................................................... 67
4.2. Emotion types ....................................................................................................... 75
4.2.1. Taxonomy of emotion types ......................................................................... 75
4.2.2. Relevant emotion types ............................................................................... 80
4.3. Conclusion ............................................................................................................ 83
5. Factors influencing cognitive resistance ................................................................ 89
5.1. Identification of factors from the literature ......................................................... 89
5.2. Symptoms of cognitive resistance ........................................................................ 92
5.3. Remaining other factors ....................................................................................... 94
5.3.1. Categorization of other factors .................................................................... 94
5.3.2. Personality characteristics ............................................................................ 97
5.4. Conclusion .......................................................................................................... 100
6. Introduction to the experimental study .............................................................. 103
6.1. Objective of the experimental study ................................................................... 103
6.2. Experimental task ............................................................................................... 105
6.2.1. Choice of tasks ............................................................................................ 105
6.2.2. Number reduction task .............................................................................. 108
6.2.3. Suitability for the current research ............................................................ 112
6.3. Measures ............................................................................................................ 115
6.4. Participant population ........................................................................................ 120
6.5. Procedure ........................................................................................................... 121
6.6. Tools and materials ............................................................................................ 123
7. Results of study 1 ............................................................................................... 127
7.1. Participants ........................................................................................................ 127
7.2. Manipulation check ............................................................................................ 133
7.3. Results ................................................................................................................ 141
7.4. Discussion ........................................................................................................... 146
7.4.1. Validation of propositions .......................................................................... 146
7.4.2. Limitations of study 1 ................................................................................. 148
8. Results of study 2 ............................................................................................... 149
8.1. Participants ........................................................................................................ 149
8.1.1. Mental model establishment after study 1 ................................................ 150
8.1.2. Study 2 ........................................................................................................ 152
8.2. Manipulation check ............................................................................................ 152
8.3. Results ................................................................................................................ 160
8.4. Discussion ........................................................................................................... 163
8.4.1. Validation of propositions .......................................................................... 164
8.4.2. Limitations of study 2 ................................................................................. 165
9. Answers to the research questions ..................................................................... 167
9.1. Components of cognitive resistance ................................................................... 167
9.2. Interaction of components ................................................................................. 168
9.3. Environmental and intra‐subject factors ............................................................ 171
9.4. Answer to the main research question ............................................................... 174
10. Conclusions .................................................................................................... 175
10.1. The construct of cognitive resistance ............................................................. 175
10.2. Affective model ............................................................................................... 179
10.3. Trait Neuroticism ............................................................................................ 182
10.4. Evaluation of the research approach ............................................................. 186
10.5. Scientific Contribution and further work ........................................................ 189
10.6. Practical relevance ......................................................................................... 192
References ................................................................................................................ 195
Appendix A: Formalized OCC Model ........................................................................... 215
Appendix B: Modified Classification of Emotions ........................................................ 217
Appendix C: Amsterdam Dynamic Facial Expression Set ............................................. 218
Appendix D: Screen shots of the number reduction task ............................................. 219
Appendix E: Self‐report form ..................................................................................... 220
Appendix F: Study 1 measures of emotion ................................................................. 221
Appendix G: Study 1 results at reflection .................................................................... 227
Appendix H: Study 2 measures of emotion ................................................................. 230
Summary ................................................................................................................... 233
Nederlandse Samenvatting ........................................................................................ 239
Acknowledgements ................................................................................................... 245
About the author ....................................................................................................... 247
1
1. Introduction
The aim of this research is to contribute to the body of knowledge on mental models in the fields of design methodology, engineering psychology and human factors by studying the resistance of mental models to change. In this work the term cognitive resistance is introduced as the capacity to endure stimuli from the environment that contradict the mental model, and its episodic nature is investigated. Three main points have been addressed in the current research: the identification of the components of cognitive resistance, an investigation into their interaction, and the identification of environmental and intra-subject factors that influence cognitive resistance. These issues are investigated from a theoretical and from an experimental perspective.
In the rest of this chapter the motivation for this research is presented (section 1.1), and the research problem is defined (section 1.2). The expected contribution by this research to science is presented in section 1.3, followed by the practical contribution (section 1.4). This chapter concludes with an overview of the subsequent chapters (section 1.5).
1.1. Research Motivation
Humans are able to reason and solve problems because they construct simplified representations of the world around them in working memory (Boos, 2007; Johnson-Laird, 1983, 2006a). These so-called mental models reduce cognitive workload, and they are inherently stable in the face of contrary evidence and so the assumptions underlying the mental model may diverge from reality under dynamic circumstances. As a consequence, humans regularly show behavior that in hindsight is incompatible with the state of the world at that time, even though the signals from the environment have surpassed the perception threshold. This type of behavior is well known in the areas of manual control (e.g. driving a car or flying an airplane by hand) and supervisory control (e.g. monitoring a process plant or routine air traffic control), and has variably been labeled: belief persistence, change blindness, sticking to plans, cognitive mismatch, fixation or
2
cognitive lockup. Due to the time-criticality2 of manual and supervisory control, previous research has focused on measures to avoid this phenomenon (e.g. Blom, Daams, & Nijhuis, 2000; Martens, 2007; Meij, 2004; Woods, Dekker, Johannesen, Cook, & Sarter, 2010). In contrast, in the field of design engineering, the discrepancy between the mental model and reality may continue for prolonged periods, due to four reasons:
the period between behavior and feedback is generally longer compared to manual or supervisory control situations due to a lack of proximity in time and space (Leveson, 2004), even more so as virtual collaboration becomes more frequent than co-location (Lauche, Bohemia, Connor, & Badke-Schaub, 2008);
the signals that contradict the current mental model in design engineering generally arise from an interaction with others (Bond and Ricci 1992; Bucciarelli 1994; Tooren 2004; Kleinsmann 2006; Tooren and Hinte 2008) - even in an automated design environment (Curran, Verhagen, van Tooren, & van der Laan, 2010) - and are therefore often weaker than in the context of manual or supervisory control;
the use of protocols is less well established in design engineering than in control situations, leading to ambiguity about “intended outcomes” (Reason, 1990) and difficulties in identifying erroneous behavior except in hindsight; and
in design engineering preserving the mental model may be justified as a result of satisficing behavior (Simon, 1969; Visser, 2009), obscure requirements, trial and error, or postponement of analysis (Kopecka, Santema, & Buijs, 2011).
Given the possibly prolonged period of discrepancy between the mental model and reality in design engineering, the study of this phenomenon as it unfolds seems justified. The results of this research may also be of use in the domains of manual and supervisory control.
2 Blom et al (2000) reports empirical data up to 150 seconds in an ATC task.
3
1.2. Research Aim
The aim of this research is to contribute to the body of knowledge on mental models by studying the resistance of mental models to change. In this work the term cognitive resistance is introduced as the capacity to endure stimuli from the environment that contradict the mental model. The author is not aware of earlier studies that have investigated cognitive resistance as it unfolds, and therefore the current research is aimed at discovering the episodic nature of cognitive resistance through an investigation of the literature and an explorative experimental study. This investigation is based on the assumption that cognitive resistance can be either beneficial or detrimental, depending on the circumstances. An initial scan of the literature suggests that there is a lack of a clear definition of cognitive resistance that differentiates it from other types of phenomena, that supports the identification of cognitive resistance and contrasts it against non-existence, and that specifies when cognitive resistance begins and when it ends. Numerous case studies discuss cognitive resistance in the context of errors, which shows a bias towards the detrimental consequences of cognitive resistance.
The literature study is aimed at identifying the components of cognitive resistance so that a theoretical foundation is created for this phenomenon that matches “real” physiological and neurological processes. A qualitative field study is not attempted at this stage because unambiguous identification of cognitive resistance is difficult due to the lack of a clear definition and the bias towards the detrimental consequences of cognitive resistance. Rather, an explorative experimental study is aimed at generating cognitive resistance in a time scale suitable for research, validating the defining characteristics of this phenomenon, and understanding the interaction of the components. The results of the exploratory experimental study will be supplement with my own experiences in practice in the final chapter.
The main research question that is answered in this research is:
RQ How do the components of cognitive resistance interact?
4
To fulfill the research aim three main points are addressed: the identification of the components of cognitive resistance, an investigation into their interaction, and the identification of environmental and intra-subject factors that influence cognitive resistance.
The current research is focused on the domain on design engineering, because in this domain the discrepancy between the mental model and reality may continue for prolonged periods, my previous experience in this domain3 has inspired the current research, and this is the focus for research at the Faculty of Industrial Design Engineering at the Delft University of Technology. Design engineering is defined as an iterative decision making process in which basic sciences, mathematics, and engineering sciences are applied to translate performance requirements and other constraints into a complete set of instructions that can be used to manufacture the target system. (Gemser & Leenders, 2001; Hales & Gooch, 2004). Due to the circumstances under which design engineering activities are performed, design engineering problems have often been labeled as ill-defined, wicked or complex (Altfeld, 2010; Badke-Schaub, 2005; Bucciarelli, 1994; Cross, 1989/2008; Détienne, 2006; Kopecka et al., 2011; Roozenburg & Eekels, 2003; Simon, 1973; Suwa, Gero, & Purcell, 2000).
1.3. Scientific Contribution
This section will discuss the positioning of this research within, and contribution towards, the existing knowledge bases of design methodology, cognitive psychology and human factors.
Design methodology
Mental models have only recently been introduced to the discipline of design methodology. A school of thought from the Netherlands, UK and Germany has focused on team or shared mental models in design engineering teams. Stempfle and Badke-Schaub (2002) were one of the first to mention the need for alignment of the team members’ individual mental models to create a shared understanding and improve team performance. Smulders (2007; 2006) has investigated the
3 Director of Engineering, Fokker Aerostructures b.v., 2002 – 2007.
5
synchronization of mental models in the transition of knowledge from product development to manufacturing. Badke-Schaub and colleagues (Badke-Schaub, Lauche, Neumann, & Ahmed, 2009; Neumann, Badke-Schaub, & Lauche, 2006, 2008) have measured shared representations in design engineering teams. The authors conclude that cohesiveness is an important factor for team performance, and that the need for explicit coordination diminishes as a common understanding is generated. Several authors have proposed a partitioning of team mental models in specific sub models for task, process, team member and competence (Bierhals, Schuster, Kohler, & Badke-Schaub, 2007); or task, process, team, competence, or context (Badke-Schaub, Neumann, Lauche, & Mohammed, 2007). Boos (2007) introduces the concept of trade-offs to team mental models in design engineering. The author suggests that the optimum for the measure of sharedness for team mental models differs depending on the nature of the task and the development stage of the team.
As Marshall (2007) points out, the team mental model (TMM) construct in many existing studies of design engineering teams “tends to draw upon problematic assumptions from conventional cognitive psychology”. He suggests that “too little attention has been paid to how TMM’s are formed, reproduced, [or] modified”; that existing studies tend to treat “team cognition as a straightforward aggregate of the individual cognitions of its members”; and that experimental methods to investigate team mental models are too simplified and abstract to emulate the complex and dynamic team processes of an ‘intact activity system’.
Very few studies have reported on the individual’s mental model in design engineering; the exceptions discuss the individual’s mental model as a prelude to empirical work on team mental models. Badke-Schaub et al. (2007) discuss some of the properties of mental models, touching upon the consequences of the simplification of reality that is inherent in cognitive resistance. Boos (2007) discusses the trade-off between simplification and accuracy in mental models, explaining that there is a cost associated with both. Several others studies report the consequences of a cognitive resistance in the design engineering context (e.g. Cardoso, Badke-Schaub, & Luz, 2009; Chrysikou & Weisberg, 2005). Lawson suggests that to overcome cognitive resistance experience, skill and “an attitude” are required, and that these are “not necessarily easily acquired or remembered” (Lawson, 2006 p.299), but refrains from suggestions how to do so.
6
Authors like Donald Schön suggest that emotions may contribute to the resolution of cognitive resistance. In Reflective Practice the designer reflects on his own work to enable progress after “pleasing […] or unwanted” surprises. Other authors, building on Schön’s work, have discussed the effect of different emotions on the outcome of design engineering processes (e.g. C. Akin, 2008; Cross, 2001; Kleinsmann, 2006; Valkenburg, 2000; Wickelgren, 2005). While these examples capture the real and significant role that emotions play in design engineering, little theoretical foundation is as yet available to understand the interaction between emotions and cognition and their effect on performance (Visser, 2006).
Interestingly, attempts at the Faculty of Industrial Design Engineering of the Delft University of Technology to further Schön’s work have focused on the activities after the trigger, rather than surprise and other emotions as the antecedences to reflection (e.g. Dorst, 1997; Kleinsmann, 2006; Valkenburg, 2000). More recently, attempts have been made to relate emotions to design performance through the analysis of verbal protocols (Dong, Kleinsmann, & Valkenburg, 2009; e.g. Kleinsmann & Dong, 2007), but not in the context of cognitive resistance.
The current investigation adds to previous work on the cognitive processes of individual design engineers (e.g. Badke-Schaub, 2004; Cardoso et al., 2009) and understanding team collaboration in design engineering (e.g. Badke-Schaub, Goldschmidt, & Meijer, 2007, 2010; Badke-Schaub, Neumann et al., 2007; Bierhals et al., 2007; Neumann et al., 2006), by researching cognitive resistance, and the effect of emotions, in individuals as a prerequisite to improving the understanding of the creation of team mental models. Significantly, this research answers the calls made by various researchers of the Faculty of Industrial Design Engineering to extend the application of psychological theories and findings into the domain of design engineering (Flach, Dekker, & Stappers, 2008; Hohn, 1999; Lauche, 2007).
Cognitive Psychology
Craik (1943/1967) described ‘mental models’ as a way to mentally test alternatives to a technical problem by forming a cognitive model of the artifact. The construct was elaborated by the cognitive psychologist Johnson-Laird in the
7
early eighties of the previous century in an influential book entitled ‘Mental models’ (1983). In this book he proposed a “mental model theory of reasoning” which is able to account for non-Bayesian behavior in human reasoning such as the cognitive biases that were described by Tversky and Kahneman (1974), bounded rationality in decision making (Simon 1955; Arthur 1994; Nelson 2008), and other human errors.
In terms that have recently become popular with cognitive scientists, mental models are constructed by an unconscious process (dubbed system 1) that is relatively undemanding of cognitive capacity, and considered associative, automatic, relatively fast, and acquired through inheritance or experience. The second, explicit process (system 2) enlists from working memory the mental model, and is generally considered analytic, controlled, relatively slow, and acquired by formal tuition (Darlow & Sloman, 2010; Evans, 2003; Frankish & Evans, 2009; Kahneman & Frederick, 2002; Stanovich & West, 2000). Dijksterhuis and Nordgren (2006), although refraining from using the terms “system 1” and “system 2”, illustrate the powers of unconscious thought in decision making. The mental model theory aligns with dual process theories of reasoning in that it assumes (at least) two different types of reasoning: rapid intuitive interferences and slower deliberate interferences (Evans, 2008; Frankish & Evans, 2009; Johnson-Laird, 2010). A mental model is constructed through the first, unconscious process. This yields a representation in working memory, which is then accessible in consciousness for further processing by the second system (Bargh & Chartrand, 1999; Johnson-Laird, 2006a). Cognitive resistance describes the phenomenon of switching between system 1 and system 2.
The current research contributes to the field of cognitive psychology by providing a theoretical and empirical model of cognitive resistance as a switch between “system 1” and “system 2”.
Human factors
Cognitive resistance is one of the most critical features of humans in relation to the design and operation of complex socio-technical systems (Leveson, 2004; Woods et al., 2010), but which has attracted limited research efforts (Dekker, 2006; Key Dismukes, 2010; Woods et al., 2010 p.120).
8
Simons and colleagues (e.g. Mitroff, Simons, & Levin, 2004; Simons & Chabris, 1999; Simons, Hannula, Warren, & Day, 2007) initiated a vein of research into inattentional blindness and change blindness. Inattentional blindness refers to the phenomenon that people do not notice unattended objects or events, even though they may be relevant for their task. In change blindness observers are not aware of a change that took place, even though the change is clearly visible. Simons and Chabris are particularly well known for the study in which a person in a gorilla suit walks in between basketball players. Test participants that are counting the passes in the basketball game generally do not see the gorilla. The authors show that the study results are not related to spatial proximity, but rather that observers fail to report unexpected, suprathreshold objects when they are engaged in another task.
Meij (2004) investigated cognitive lockup in supervisory control tasks. Cognitive lockup is defined as the tendency to focus on a subpart of a system and ignore the rest of it. The author investigates three possible paradigms for this phenomenon: planning, task-switching and decision making. The author found support for perceived high switching costs that hinder people in reassessing a situation. Martens (2007) investigated the lack of response to clearly visible and relevant visual information in the context of driving a car. The author finds that expectancy is a strong factor in responding to a salient visual cue. Dekker (2009) conducted an investigation into the human factors aspects of the accident of a Boeing 737-800 near Amsterdam Schiphol Airport in February 2009 for the Dutch Safety Board. The author found that the case fitted the phenomenon of automation surprise, where the automation does something without immediately preceding crew input related to the automation’s action, and in which that automation action is inconsistent with crew expectations. Factors contributing to this case of automation surprise included: system behavior that was initially consistent with pilot expectations, training and reference material that was inconsistent with subsequent system behavior, and relatively (but not unacceptably) high work load.
Whereas these studies illustrate the factors of task design that influence cognitive resistance, none of these investigations have delved into the episodic nature of cognitive resistance. Therefore the current research contributes to the
9
field of human factors by providing a theoretical and empirical model of cognitive resistance as it unfolds.
1.4. Practical Contribution
This section will discuss the contribution of this research to design practice and system safety.
Design practice
It is envisaged that the results of the current work will help designers and managers to recognize cognitive resistance when it occurs. This will help them to understand their own reactions and that of others when mental models are challenged. Through the increased understanding of cognitive resistance teams can recognize how the establishment of their team mental model is progressing.
This research may also lead to a better execution of design reviews and project portfolio management by ensuring that unfavorable decisions by a review board are comprehended by the designers, and not obstructed by cognitive resistance (Biyalogorsky, Boulding, & Staelin, 2006; Kester, Hultink, & Lauche, 2009). It is expected that the results of the current study will contribute to a better understanding of the emotions that are implicated in such decision processes, thereby aiding managers in this difficult task.
System safety
This study addresses cognitive resistance, which is one of the most critical features of humans in relation to the design and operation of complex socio-technical systems (Leveson, 2004). If the divergence between a mental model and reality due to cognitive resistance leads to an undesirable state of the system this is often classified as a ‘human error’ in hindsight, even though this divergence may reflect a certain expertise by the operator (Woods et al., 2010). The negative consequences of the divergence have been well documented in relation to incidents in aerospace (Columbia Accident Investigation Board, 2003; Dekker, 2000; Dhillon, 2009; Nelson, 2008; Rogers et al., 1986; C. D. Wickens, 2009); and non-aviation incidents (Hales & Gooch, 2004; Martens, 2007; Schraagen, 2009). Examples of the positive effects of cognitive resistance are much less frequently documented, probably because this state is a prerequisite
10
for successful cognitive reasoning, and the norm rather than the exception (Reason, 1990).
It is expected that the results of the present study will facilitate a better understanding of ‘human error’, reduce the hindsight bias often encountered in incident investigations, and therefore contribute to the safe operation of many complex systems.
Artificial Intelligence and augmented cognition
To improve safety in complex socio-technical systems efforts are under way to generate mathematical models of multi-agent interaction (e.g. Bosse, Jonker, Van Der Meiji, Sharpanskykh, & Treur, 2009). One such recent initiative relates to air traffic management, where pilots and air traffic controllers need to share information and cooperate (Stroeve, Everdij, Blom, & Days, 2011). The mathematical model of cognitive resistance that is generated by the current research may be useful in this context.
In supervisory control tasks of highly automated systems it is extremely difficult to develop static support concepts that cover all critical situations. A solution may be provided by augmented cognition, in which the information flow is modulated according to the cognitive state of the user (e.g. over- or underload). The results of the current study can facilitate the development of such dynamic support systems for the interaction between humans and complex machines in supervisory control tasks (Grootjen, Neerincx, Weert, & Truong, 2007).
1.5. Structure of this Dissertation
This chapter provided a general introduction to the research. The motivation for this research was explained, the research aim was presented, and the contributions to science and practice were discussed. In the next chapter, the research design is presented. This includes the research framework, the research questions and the research approach.
The review of literature is presented in chapters 3, 4 and 5. In chapter 3 the components of cognitive resistance are identified. In chapter 4 the interaction between the components of cognitive resistance is determined. In chapter 5

11
other environmental and intra-subject factors that influence cognitive resistance are identified.
The experimental study is presented in chapter 6, 7, and 8. In chapter 6 the experimental design is presented. In chapter 7 the results of the first study are discussed. The results of the second study are presented in chapter 8.
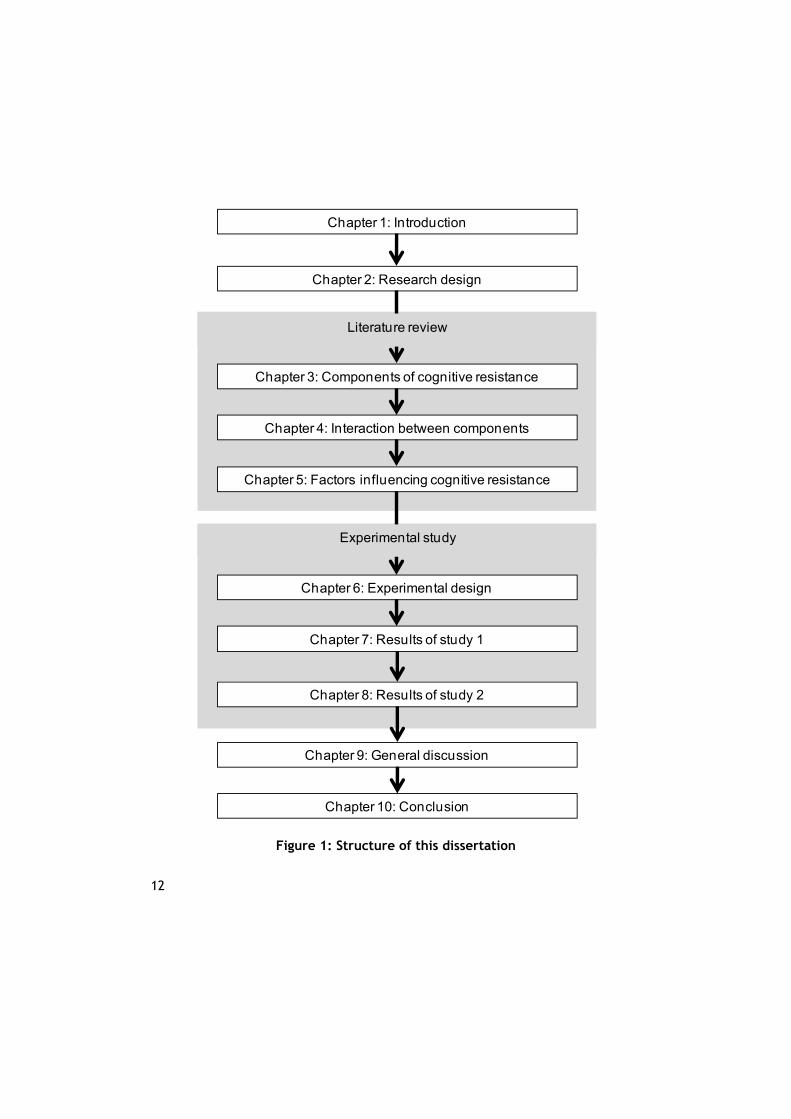
This dissertation is concluded in chapter 9 with a general discussion of the answers to the research questions and in chapter 10 with conclusions. The structure of this dissertation is schematically represented in Figure 1.
12
Figure 1: Structure of this dissertation
Chapter 2: Research design
Chapter 3: Components of cognitive resistance
Chapter 4: Interaction between components
Chapter 5: Factors influencing cognitive resistance
Chapter 6: Experimental design
Chapter 7: Results of study 1
Chapter 9: General discussion
Chapter 8: Results of study 2
Chapter 1: Introduction
Chapter 10: Conclusion
Experimental study
Literature review
13
2. Research Design
The aim of this research is to contribute to the body of knowledge on mental models in the fields of design methodology, engineering psychology and human factors by studying the resistance of mental models to change. In this chapter the research design is presented. First the constructs that are utilized in this research are defined in more detail and the research framework is created (section 2.1). The framework allows the definition of the research questions that are to be answered in this study (section 2.2). In section 2.3 the approach will be presented to answer the research questions. This chapter is concluded in section 2.4.
2.1. Research Framework
In this section the research framework is presented from which the research questions and the research approach are generated. As a first step the construct of a mental model will be elaborated. The defining characteristics of a mental model are generated by a review of the literature, and differences are indicated with similar constructs. Subsequently, the construct for cognitive resistance is defined. An elaboration of reflection and contradictory stimuli is also required because these define cognitive resistance. The research framework is then generated from these definitions.
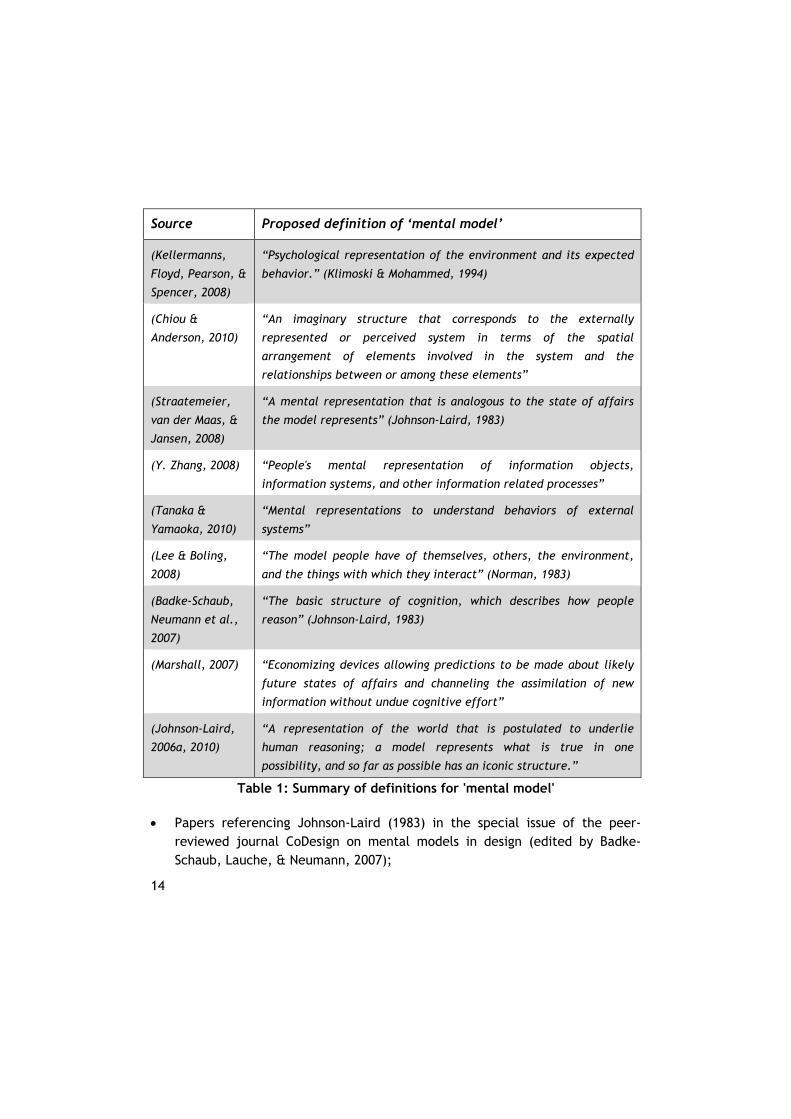
2.1.1. Mental models A review of the literature to define the constructs ‘mental model’ and ‘ resistance’ has been initiated from the book Mental Models (Johnson-Laird, 1983). A succinct, exact definition of the construct of ‘mental model’ is not available in this work, so to elaborate on the construct and to update it more recent works are referenced. These have been identified through three paths:
Using the search terms “definition of (a) mental model(s)” or “define mental model(s)” on all journal articles published in 2008 or later referencing Johnson-Laird (1983);
14
Source Proposed definition of ‘mental model’
(Kellermanns,
Floyd, Pearson, &
Spencer, 2008)
“Psychological representation of the environment and its expected
behavior.” (Klimoski & Mohammed, 1994)
(Chiou &
Anderson, 2010)
“An imaginary structure that corresponds to the externally
represented or perceived system in terms of the spatial
arrangement of elements involved in the system and the
relationships between or among these elements”
(Straatemeier,
van der Maas, &
Jansen, 2008)
“A mental representation that is analogous to the state of affairs
the model represents” (Johnson-Laird, 1983)
(Y. Zhang, 2008) “People's mental representation of information objects,
information systems, and other information related processes”
(Tanaka &
Yamaoka, 2010)
“Mental representations to understand behaviors of external
systems”
(Lee & Boling,
2008)
“The model people have of themselves, others, the environment,
and the things with which they interact” (Norman, 1983)
(Badke-Schaub,
Neumann et al.,
2007)
“The basic structure of cognition, which describes how people
reason” (Johnson-Laird, 1983)
(Marshall, 2007) “Economizing devices allowing predictions to be made about likely
future states of affairs and channeling the assimilation of new
information without undue cognitive effort”
(Johnson-Laird,
2006a, 2010)
“A representation of the world that is postulated to underlie
human reasoning; a model represents what is true in one
possibility, and so far as possible has an iconic structure.”
Table 1: Summary of definitions for 'mental model'
Papers referencing Johnson-Laird (1983) in the special issue of the peer-reviewed journal CoDesign on mental models in design (edited by Badke-Schaub, Lauche, & Neumann, 2007);
15
The most recent writings by Johnson-Laird (book and journal: 2006a, 2010).
This search yields ten references4. The definitions of mental models are summarized in Table 1 from different publications, as the mental model definition is considered to be dependent upon the domain in which the construct is applied (Rouse & Morris, 1986).
From Table 1 follows that there is general agreement about the mental model construct from this selection of papers. This is not surprising as they were selected on the basis of a reference to Johnson-Laird (1983) . However, the construct is not sufficiently described in these references to discriminate between the existence of a mental model and a lack of a mental model (as is necessary for the purpose of this research). Therefore the review of literature needs to continue to identify the defining characteristics of mental models in the next paragraph. Constructs that are also termed ‘mental model’ but that do not share the same characteristics as the construct utilized in this research are discussed in the paragraphs thereafter, as well as constructs that are quite similar but are not termed ‘mental model’.
Mental model characteristics
The identification of mental model characteristics is required to discriminate between the existence of a mental model and a lack of a mental model, and thus identify the extent of cognitive resistance. The identification of mental model characteristics is executed through a review of the literature.
The existence of mental models can be explained by the limited processing capacity of the human mind (Johnson-Laird, 2006b; Miller, 1956; Newell & Simon, 1972). In real life we are bombarded by a plethora of stimuli from which we need to distill some sense of coherence - yet minimize our cognitive load (Boos, 2007; Nokes, Schunn, & Chi, 2010). Necessarily, mental models are simplifications of reality (Badke-Schaub, Neumann et al., 2007). Mental models are parsimonious
4 This relatively low number is justified by the similarity between definitions, and their low utility for this research, as will be discussed later.
16
and holistic5, which is in fact their utility, because as they contain less information they are easier to work with and free resources for other cognitive processes (Boos, 2007; Johnson-Laird, 2006b). Mental models allow the integration of new perceptions with existing information to create an overall impression and retain a coherent view of reality (Boos, 2007; Higgins, 2000). Mental models reduce complexity and therefore stress, and allow us to “go beyond the information given” to give us a feeling of competence and control (Dörner, 1999 p.401).
On the down side, mental models also entail a risk of conjuring too much in our imagination (Chi, 2000; Hadjichristidis, Sloman, Stevenson, & Over, 2004; Higgins, 2000). Mental models are inherently stable in the face of contrary evidence because they guide our attention, our thinking and thus our actions (Dörner, 1997; e.g. Higgins, 2000; Johnson-Laird, 2006a; Schraagen, 2009; Stempfle & Badke-Schaub, 2002). They are essentially built to pursue a given goal based on data extracted from the environment. As a result, essential features of a problem are overemphasized whereas the peripheral data may be neglected (Besnard, Greathead, & Baxter, 2004). We risk missing new information (Schraagen, 2009) and are inhibited to try alternative approaches even when warranted (Cardoso et al., 2009; Chrysikou & Weisberg, 2005; Jansson & Smith, 1991). The simplification of reality is not a conscious act, but an autonomous part of the human information processing function (Dijksterhuis & Nordgren, 2006; Martens, 2007). Crucial to the theory of mental models is that we usually represent only one possibility in our mind when reasoning, even when multiple options are available (Johnson-Laird, 2006a). There is usually only a mental model for the current task.
The creation and termination of a mental model is an autonomous, involuntary process that is not subject to self-reflection:
The process of construction is unconscious, but it yields a representation, and this mental model enables us to draw a
5 Meaning that the model only makes sense as a whole; the constituent parts are unimportant and not easily accessible.
17
conclusion, by another unconscious process. […] In general, the world in our conscious minds is a sequence of representations that result from a set of processes, and the world in our unconscious mind is the set of processes themselves. (Johnson-Laird, 2006a p.53)
Individuals are not aware of the creation or termination of mental models and cannot control these processes, just as we are not aware of many high-level processes in problem solving and creative thinking (Bargh & Chartrand, 1999; Lewicki, Hill, & Czyzewska, 1992). The mental model itself is accessible for cognitive thought because it is in working memory, and it is used as a building block in subsequent steps (Johnson-Laird, 2010).
Based on the defining characteristics that have been identified in the literature and are listed above, the following definition6 of mental models is proposed:
Mental models are simplified, holistic, resilient internal representations of reality in working memory that are created and demised subconsciously, that
guide our thinking and action, and that free up cognitive resources.
This definition closely follows Johnson-Laird (1983, 2006a, 2010; 1993) and what has been used earlier by the section for Design Methodology at the School of Industrial Design Engineering of the Delft University of Technology (e.g. Badke-Schaub, Neumann et al., 2007; Neumann et al., 2006). However, the stated definition does not align with the definition for mental models that is utilized in other domains. This will be explored in the next paragraph.
Differing constructs with the same name
Significant differences were reported in the use of the ‘mental model’ construct in different domains ( see also Badke-Schaub, Neumann et al., 2007; Rouse &
6 In the rest of this thesis we do not differentiate between the definition of a mental model: “simplified, holistic, internal representations of reality in working memory”; and the characteristics of a mental model: “created and demised subconsciously, guide thinking and action, free up cognitive resources, and resilient to contradictory stimuli”.
18
Morris, 1986). It is necessary to identify the differences and similarities in the use of the term across the fields of psychology and human factors, because both fields have generated abundant literature on cognitive resistance which may otherwise be misinterpreted.
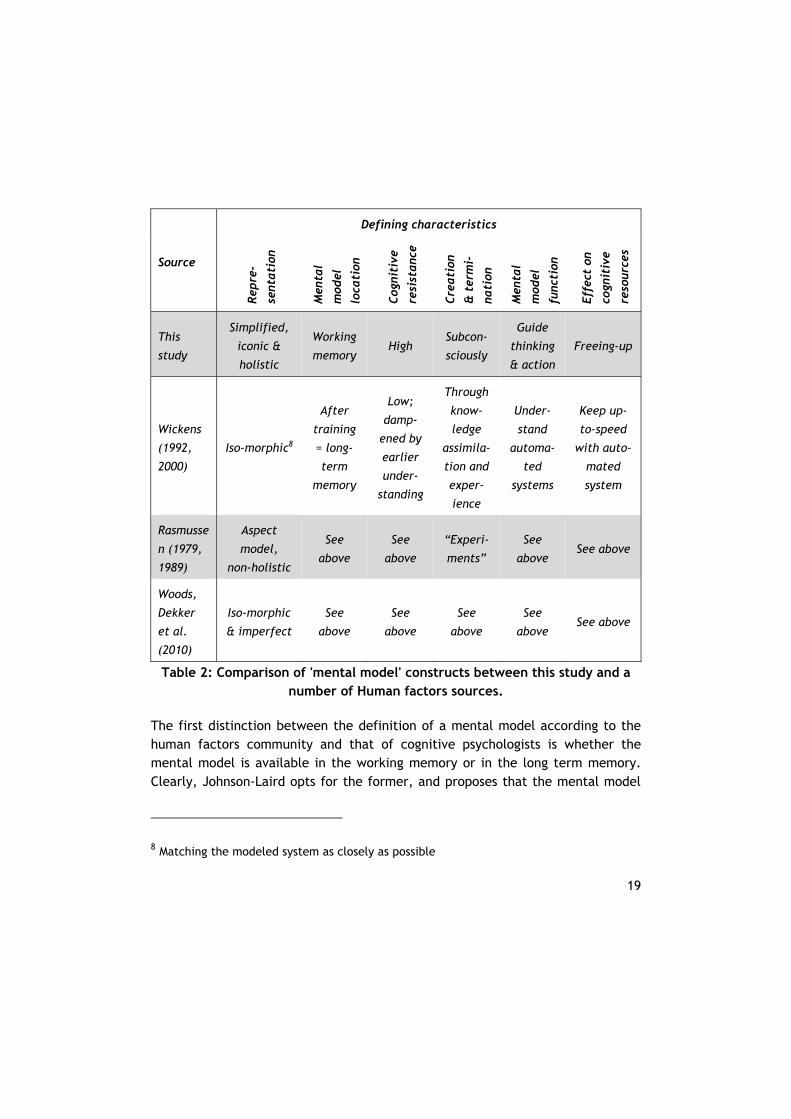
The mental model construct in human factors is aimed at improving operator interaction with a machine. The Human factors definition of a mental model is given for a number of sources in Table 2 and compared to the definition that was generated in the previous paragraph for each of the defining characteristics of a mental model. The sources are representative for a larger set from the Human factors community because these authors are well-cited and mirror a wider selection of papers, as is illustrated in the discussion following the table7.
The table shows a distinction between the applications of the mental model construct in the Human factors community compared to cognitive psychology. The table shows that the definitions of a mental model given by the three sources from the Human factors community are in general agreement. These authors focus on the mental model that a user or operator has of the system being monitored; it is “a mental representation of the way that the (relevant part of the) world works” (Woods et al., 2010). Although this seems similar to what the cognitive psychologists imply, four important differences between these authors and cognitive psychologists are discernible.
7 The much-cited MIT scientist Peter Senge (2008) has introduced yet another mental model construct which resembles a mind-set or set of core beliefs and is apparently even less susceptible to change by external stimuli than the human factors’ mental model construct. Senge’s mental models reside “beneath the surface”, are usually invisible, and may even be actively denied.
19
Source
Defining characteristics
Rep
re-
sent
ati
on
Men
tal
mod
el
loca
tion
Cog
niti
ve
resi
stanc
e
Cre
ati
on
& t
erm
i-
nati
on
Men
tal
mod
el
func
tion
Eff
ect
on
cogn
itiv
e
reso
urce
s
This
study
Simplified,
iconic &
holistic
Working
memory High
Subcon-
sciously
Guide
thinking
& action
Freeing-up
Wickens
(1992,
2000)
Iso-morphic8
After
training
= long-
term
memory
Low;
damp-
ened by
earlier
under-
standing
Through
know-
ledge
assimila-
tion and
exper-
ience
Under-
stand
automa-
ted
systems
Keep up-
to-speed
with auto-
mated
system
Rasmusse
n (1979,
1989)
Aspect
model,
non-holistic
See
above
See
above
“Experi-
ments”
See
above See above
Woods,
Dekker
et al.
(2010)
Iso-morphic
& imperfect
See
above
See
above
See
above
See
above See above
Table 2: Comparison of 'mental model' constructs between this study and a number of Human factors sources.
The first distinction between the definition of a mental model according to the human factors community and that of cognitive psychologists is whether the mental model is available in the working memory or in the long term memory. Clearly, Johnson-Laird opts for the former, and proposes that the mental model
8 Matching the modeled system as closely as possible
20
is available for further processing (see also Vandierendonck, Dierckx, & Van der Beken, 2006)9. In contrast, what many human factors authors have termed a mental model is generated and stored over time in long term memory (Doyle & Ford, 1998), and closely linked to previous results (Rasmussen, 1979; Rasmussen & Vicente, 1989), background knowledge (Wilson & Rutherford, 1989), and representations of organized knowledge (Klein & Hoffman, 2008a)10. The influential book on mental models edited by Gentner and Stevens (1983) is at the tipping point of human factors and cognitive psychology (see also Moray, 1997; Rutherford & Wilson, 1991) as it is “fundamentally concerned with understanding human knowledge about the world” (which suggests longer term learning) but its “applied utility” is “understanding why operators of nuclear plants do not always correctly interpret the instruments” (which suggests applying working memory to reason correctly). Similarly Bainbridge (1992) has defined mental models quite broadly to include both the human factors and cognitive psychologist viewpoint: “They might include concepts, propositions, scripts, frames, or mental images”.
A second distinction is regarding to creation and termination of the mental model. Johnson-Laird and other cognitive psychologists suggest that the creation and termination of a mental model is an autonomous, involuntary process that is not subject to self-reflection (Bargh & Chartrand, 1999; Johnson-Laird, 1983; Lewicki et al., 1992). Introspection is impossible “because the mechanisms [by which we reason] are unconscious” (Johnson-Laird, 2006a p.268). In contrast, Wickens and Hollands (2000) and Woods et al. (2010) suggest that mental models are created through knowledge assimilation and experience. Rasmussen (Rasmussen, 1979; Rasmussen & Vicente, 1989) suggests that operators “experiment” to build their mental model. Both these latter descriptions from the human factors community imply that the mental model is available for introspection (Doyle & Ford, 1998 p.18).
9 Both Johnson-Laird and Vandierendonck e.a. suggest that there is a tight coupling between working memory and long-term memory. According to Johnson-Laird (2006a, p.428) mental models of “complex systems are a form of knowledge representation in long-term memory”, suggesting some alignment with the HF community. 10 More recently, human factors authors (e.g. Heiligers, Van Holten et al. 2009) have reintroduced the term ‘mental model’ as the short-term representation of reality in working memory.
21
A third distinction follows from the differences in mental model location and mental model creation: the type of representation. Whereas the cognitive psychologists stress the holistic nature of mental models (Chi, 2000; Higgins, 2000; Johnson-Laird, 1983, 2006b), the human factors community describes the isomorphic character of mental models on aspects of the complex system (Rasmussen, 1979; Rasmussen & Vicente, 1989; Wickens & Hollands, 2000; Woods et al., 2010).
These differences imply a fourth, important distinction: that of mental model stability. The limited resources of working memory and the holistic nature of the mental model mean that for cognitive psychologists, the mental model is relatively stable (Boos, 2007; Higgins, 2000). In contrast, the mental model construct in Human factors is assumed to grow as knowledge and experience is assimilated, to be dampened exclusively (if at all) by earlier understanding (e.g. Doyle & Ford, 1998).
The current research aims to study the resistance of mental models to change. It is therefore important to stress that:
The mental model construct utilized in this research differs from the construct by the same name that is commonly applied in the human factors community on
four points: it is available in working memory, it is created and terminated subconsciously, it is a holistic representation, and it is relatively resilient.
Constructs that are quite similar to the construct utilized in this research but are not termed ‘mental model’ are discussed in the next paragraph.
Similar constructs with different names
Other constructs have been utilized in the literature that seem to share the defining characteristics of mental models, but are not called ‘mental models’. It is necessary to identify these across the fields of psychology and human factors, because both fields have generated abundant literature on cognitive resistance which may otherwise be erroneously rejected.
Neisser (1976) defines a construct similar to mental models called schemata, building on earlier work by Bartlett, Piaget and Kant. Neisser (1978) defines
22
perception as “a plan for obtaining more information”. Schemata are anticipations of what is relevant. They direct exploratory activities (i.e. where to look or what to touch). In turn, feedback from these samples of the environment modifies the schemata in what Neisser has termed the perceptual cycle.
According to Mandler (1984), schemas are sub-consciously activated (into working memory) by recognition to support “transformational and processing duties” (i.e. thinking and action). Schemas are “bounded and distinct”, “whole”, and can vary from quite abstract to concrete. Mandler suggests that “schemas are built up in the course of interaction with the environment”, possibly (but apparently not exclusively) “as a result of prior experiences”. Johnson-Laird (2006a p.428) defines that mental models are “the end result of perception and of understanding a description” (the latter part implying reliance on previous experiences). Taken together, the constructs of ‘schemata’/‘schemas’ and ‘mental models’ seem very similar, with Mandler emphasizing the activation of pre-existing schemas, while mental models according to Johnson-Laird are built in the course of the interaction with the environment, much like Neisser suggests. In his 1983 book, Johnson-Laird abundantly applies the term ‘schema’ but more narrowly than Mandler and Neisser to mean ‘method of comprehension’, implying that the activated schema is a first step in constructing a mental model and is incorporated in it. In Johnson-Laird’s later work (2006a, 2010) the term is not utilized, lending credit to the suggestion that the constructs of ‘mental model’ and ‘schema’ are very similar11. Mandler mentions ‘frames’ and ‘scripts’ as synonyms of schemas.
Due to the application of ‘mental model’ for longer-term knowledge, the human factors community has devised other terms for the internal representation in working memory that is manipulated through cognitive processes and which might be likened to Johnson-Laird’s approach. The most common of these within aviation and increasingly in other domains is situation awareness12 (Endsley,
11 Cannon-Bowers, Salas et al. (1993) indicate that in contrast to scripts, “mental models are manipulable”. However, they seem to be applying the Human Factors definition of a mental model (despite referencing Johnson-Laird). 12 Sometimes termed ‘situational awareness’; developed through the act of ‘situation assessment’.

23
1995; Endsley & Connors, 2008; Schaub, 2008; Wickens, 2008). Situation awareness has been described as “the operator’s internal model of the state of the environment” (Endsley, 2000). Situation awareness is established in working memory from perception interacting with knowledge and expertise from long term memory (Vidulich, Wickens, Tsang, & Flach, 2010). Situation awareness therefore seems to share some of the defining characteristics with the mental model construct utilized in the current research, but its application is generally limited to the “perception of the elements in the environment within a volume of time and space, the comprehension of their meaning and the projection of their status in the near future” (Endsley, 1995).
In summary, the mental model construct seems to share some or all of its defining characteristics with similar constructs like ‘schemata’, ‘schema’, ‘scripts’, ‘frames’, and ‘situation awareness’.
2.1.2. Cognitive resistance This research is aimed at understanding changes to a mental model in the context of a dynamic reality. Mental models are inherently stable in the face of contrary evidence because they guide our attention, our thinking and thus our actions (Dörner, 1997; e.g. Higgins, 2000; Johnson-Laird, 2006a; Schraagen, 2009; Stempfle & Badke-Schaub, 2002). “[Mental] models abstracting from concrete reality help to cope not only with a specific situation but also with the bombardment of multiple situations characteristic of modern academic, business, public service and even social events”, but oversimplification of reality “can result in going too far, or in the wrong direction beyond the information given” (Boos, 2007). We continue to use an existing mental model even if it is diverging from reality, although the probability that the mental model will be given up or modified increases as the deviation between reality and the mental model becomes larger. In this paragraph we define a construct that indicates the degree of divergence with reality that can be endured by the mental model.
Discrepancies between reality and a mental model
The discrepancy between reality and a mental model has been described by many authors (particularly from the Human factors community) in different terms. A literature review has been conducted to identify descriptions of the discrepancy between reality and a mental model. Sources have been identified
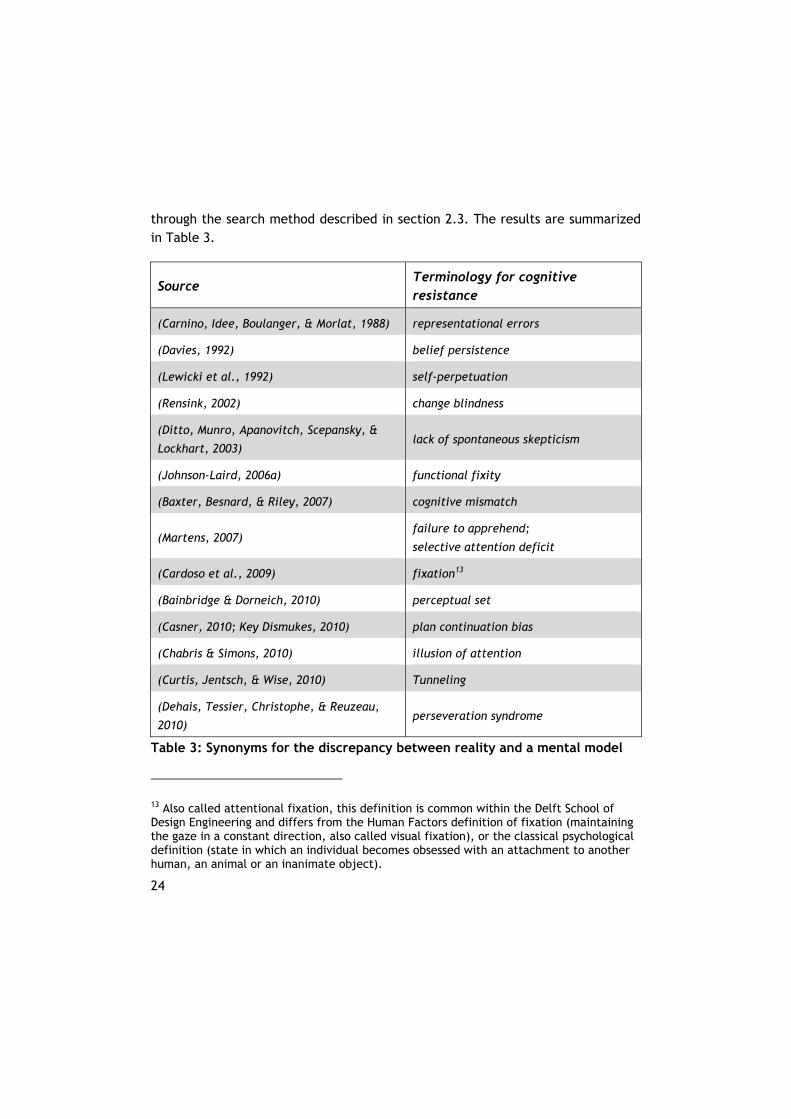
24
through the search method described in section 2.3. The results are summarized in Table 3.
Source Terminology for cognitive resistance
(Carnino, Idee, Boulanger, & Morlat, 1988) representational errors
(Davies, 1992) belief persistence
(Lewicki et al., 1992) self-perpetuation
(Rensink, 2002) change blindness
(Ditto, Munro, Apanovitch, Scepansky, &
Lockhart, 2003) lack of spontaneous skepticism
(Johnson-Laird, 2006a) functional fixity
(Baxter, Besnard, & Riley, 2007) cognitive mismatch
(Martens, 2007) failure to apprehend;
selective attention deficit
(Cardoso et al., 2009) fixation13
(Bainbridge & Dorneich, 2010) perceptual set
(Casner, 2010; Key Dismukes, 2010) plan continuation bias
(Chabris & Simons, 2010) illusion of attention
(Curtis, Jentsch, & Wise, 2010) Tunneling
(Dehais, Tessier, Christophe, & Reuzeau,
2010) perseveration syndrome
Table 3: Synonyms for the discrepancy between reality and a mental model
13 Also called attentional fixation, this definition is common within the Delft School of Design Engineering and differs from the Human Factors definition of fixation (maintaining the gaze in a constant direction, also called visual fixation), or the classical psychological definition (state in which an individual becomes obsessed with an attachment to another human, an animal or an inanimate object).
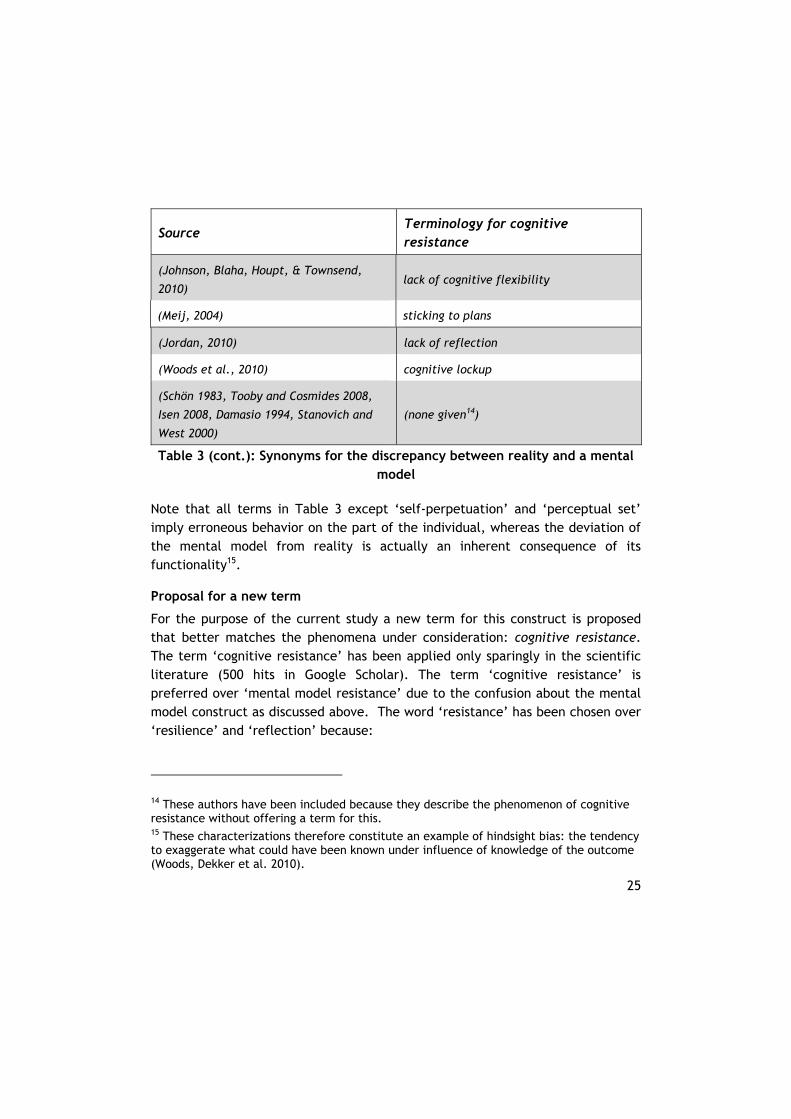
25
Source Terminology for cognitive resistance
(Johnson, Blaha, Houpt, & Townsend,
2010) lack of cognitive flexibility
(Meij, 2004) sticking to plans
(Jordan, 2010) lack of reflection
(Woods et al., 2010) cognitive lockup
(Schön 1983, Tooby and Cosmides 2008,
Isen 2008, Damasio 1994, Stanovich and
West 2000)
(none given14)
Table 3 (cont.): Synonyms for the discrepancy between reality and a mental model
Note that all terms in Table 3 except ‘self-perpetuation’ and ‘perceptual set’ imply erroneous behavior on the part of the individual, whereas the deviation of the mental model from reality is actually an inherent consequence of its functionality15.
Proposal for a new term
For the purpose of the current study a new term for this construct is proposed that better matches the phenomena under consideration: cognitive resistance. The term ‘cognitive resistance’ has been applied only sparingly in the scientific literature (500 hits in Google Scholar). The term ‘cognitive resistance’ is preferred over ‘mental model resistance’ due to the confusion about the mental model construct as discussed above. The word ‘resistance’ has been chosen over ‘resilience’ and ‘reflection’ because:
14 These authors have been included because they describe the phenomenon of cognitive resistance without offering a term for this. 15 These characterizations therefore constitute an example of hindsight bias: the tendency to exaggerate what could have been known under influence of knowledge of the outcome (Woods, Dekker et al. 2010).
26
Resilience in psychology is generally used in a positive fashion to describe the strength to overcome setbacks (e.g. Kahneman, 2011 p.263; Masten, 2009). The term is therefore considered unsuitable for the description of the current phenomenon that implies both positive and negative consequences (to be further discussed in chapter 10), even though the term aligns with definitions of resilience in engineering, ecology and organizational science;
Reflection is considered too narrow even though the current phenomenon seems to match what is tested in the Cognitive Reflection Test (Frederick, 2005) to differentiate between system 1 and system 2 thinking (which is explained in more detail in section 3.2).
In this work, cognitive resistance is defined as the capacity to endure contradictory stimuli from the environment: new perceptions are ignored, or interpreted in such a way that they fit the existing mental model. A measure for cognitive resistance requires us to mark the limit to the endurance of contradictory stimuli from the environment. This will be addressed next.
Reflection
Mental models are created and demised in an autonomous, involuntary process. Mental models – once established - cannot be modified because of their holistic nature. Therefore, ‘mental models’ that we are consciously aware of by definition no longer exist; they have already been – subconsciously - demised. This is the case if we become aware of a divergence between reality and the assumptions underlying a (previously existing) mental model. Based on Schön’s Reflective Practice (1983), it is suggested that reflection marks the demise of an existing mental model. Schön describes reflection as a reaction to “something [that] falls outside the range of ordinary expectations” (p.68). The author explains:
The practitioner allows himself to experience surprise, puzzlement or confusion in a situation that he finds uncertain or unique. He reflects on the phenomena before him, and on his prior understandings which have been implicit in his behavior. (Schön, 1983 p.69)
27
This use of the term ‘reflection’ to mark the end of cognitive resistance is justified because the term implies a conscious awareness of the discrepancy between expectations and reality. A similar definition of ‘reflection’ is used by other authors as an antecedent for learning (e.g. Argyris & Schon, 1974; Kolb, 1984; van Staveren, 2007). Reflection differs from introspection in that the assumptions underlying the mental model are the subject of conscious thought processes, not the mental model itself (cf. Johnson-Laird, 2006a p.53) Reflection can be identified by effortful conscious reasoning, hesitation, and low self-efficacy (Chi, 2000; Ramalingam, LaBelle, & Wiedenbeck, 2004). Given the stable nature of mental models, and the fact that the processes for creating and terminating mental models are subconscious, the demise of the mental model is expected to be abrupt and reflection to occur suddenly.
Contradictory stimuli
Mental model demise and reflection require a discrepancy between reality and the existing mental model. Under the dynamic circumstances of real life, changes will occur while the existing mental model is preserved, leading to a discrepancy between reality and the mental model. Reality is represented by stimuli. At the onset and for the duration of cognitive resistance until reflection, these stimuli (for cognitive resistance to exist) contradict the existing mental model. These stimuli can vary in strength and salience, both in absolute terms and in relation to background noise, which has an effect on the probability of perception (and therefore reflection) independent of cognitive resistance. A measure for cognitive resistance therefore requires us to standardize the contradictory stimuli in terms of number, signal strength, signal-to-noise ratio, salience, duration, etc.; and to assign a value to the accumulation of contradictory stimuli.
Definition of cognitive resistance
The discussion in the previous paragraphs allows us to define the construct of cognitive resistance as follows:
Cognitive resistance is defined by the capacity to endure contradictory stimuli until reflection on the assumptions underlying the mental model.
28
The mental model is preserved if a mental model is established and it has not been reflected upon. A mental model is preserved through either a lack of contradictory stimuli or through cognitive resistance.
Based on this definition, cognitive resistance can be operationalized by subjecting an existing mental model to contradictory stimuli until reflection occurs. Cognitive resistance can vary from zero (i.e. immediate reflection upon a contradictory stimulus) to infinity (i.e. no reflection on the assumptions underlying the mental model despite countless contradictory stimuli).
Mathematical formulation
Cognitive resistance can be modeled mathematically by calculating the probability of reflection under duress of contradictory stimuli. Five possible formulations have been identified in the literature: the normal distribution, the logistics distribution, the log-normal distribution, a log-logistics distribution or an exponential distribution.
In general, it is assumed that for human signal detection the psychometric curve follows the cumulative normal distribution (Macmillan & Creelman, 2005). The normal distribution is often approximated by the logistics distribution (Taylor & Creelman, 1967), and is particularly valid around the thresholds of perception (for example in determining vestibular thresholds, de Boer, 1988). At higher signal values other distributions seem more appropriate. The log-normal distribution is used to model the operator’s reaction time to an alarm (so-called time-reliability correlation, Dougherty Jr & Fragola, 1988; Hollnagel, 2009). For the detection of cracks as a function of crack length it was found that the very similar log-logistic distribution was the most acceptable (Georgio, 2006). The log-normal and log-logistic probability distributions are characterized by a peak in the probability function that occurs after some delay, reflecting in the time-reliability correlation the time that is taken to implement the perceptual, cognitive and motor processes after the triggering event. In contrast, human reliability under the assumption of a constant error rate is often modeled through an exponential distribution (Dhillon, 2009). In this case the probability function decreases monotonically with increasing time from the triggering event, and is memoryless.
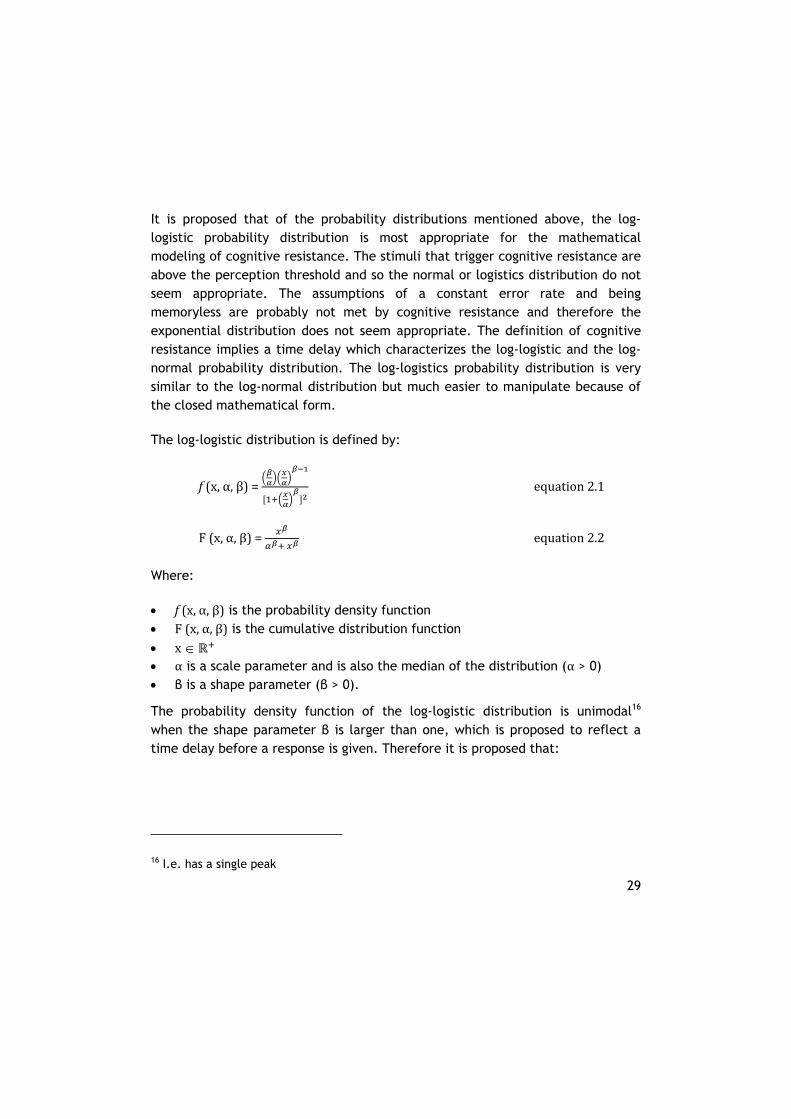
29
It is proposed that of the probability distributions mentioned above, the log-logistic probability distribution is most appropriate for the mathematical modeling of cognitive resistance. The stimuli that trigger cognitive resistance are above the perception threshold and so the normal or logistics distribution do not seem appropriate. The assumptions of a constant error rate and being memoryless are probably not met by cognitive resistance and therefore the exponential distribution does not seem appropriate. The definition of cognitive resistance implies a time delay which characterizes the log-logistic and the log-normal probability distribution. The log-logistics probability distribution is very similar to the log-normal distribution but much easier to manipulate because of the closed mathematical form.
The log-logistic distribution is defined by:
f(x,α,β)= equation2.1
F(x,α,β)= equation2.2
Where:
f(x,α,β) is the probability density function F(x,α,β) is the cumulative distribution function x œ α is a scale parameter and is also the median of the distribution (α > 0) β is a shape parameter (β > 0).
The probability density function of the log-logistic distribution is unimodal16 when the shape parameter β is larger than one, which is proposed to reflect a time delay before a response is given. Therefore it is proposed that:
16 I.e. has a single peak
30
Cognitive resistance is best modeled mathematically by a log-logistic distributed probability of reflection as a function of contradictory stimuli with a shape
parameter β > 1.
This proposition will be validated in an experimental study (chapter 6).
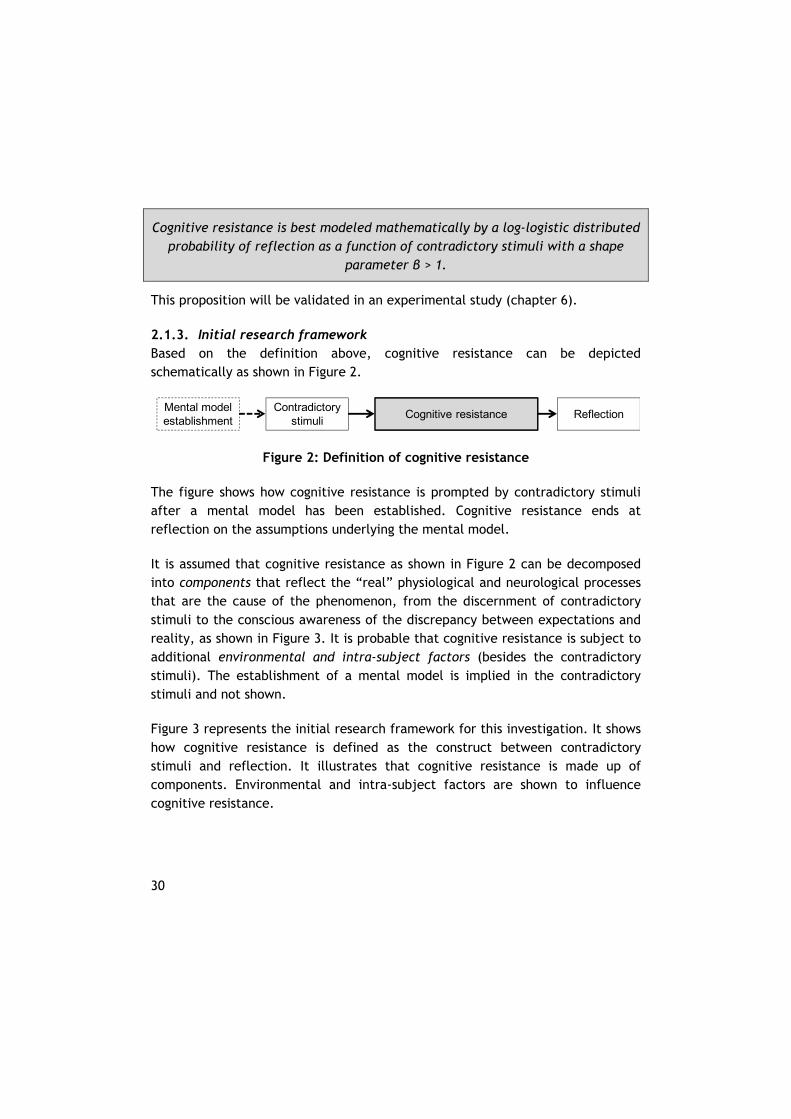
2.1.3. Initial research framework Based on the definition above, cognitive resistance can be depicted schematically as shown in Figure 2.
Figure 2: Definition of cognitive resistance
The figure shows how cognitive resistance is prompted by contradictory stimuli after a mental model has been established. Cognitive resistance ends at reflection on the assumptions underlying the mental model.
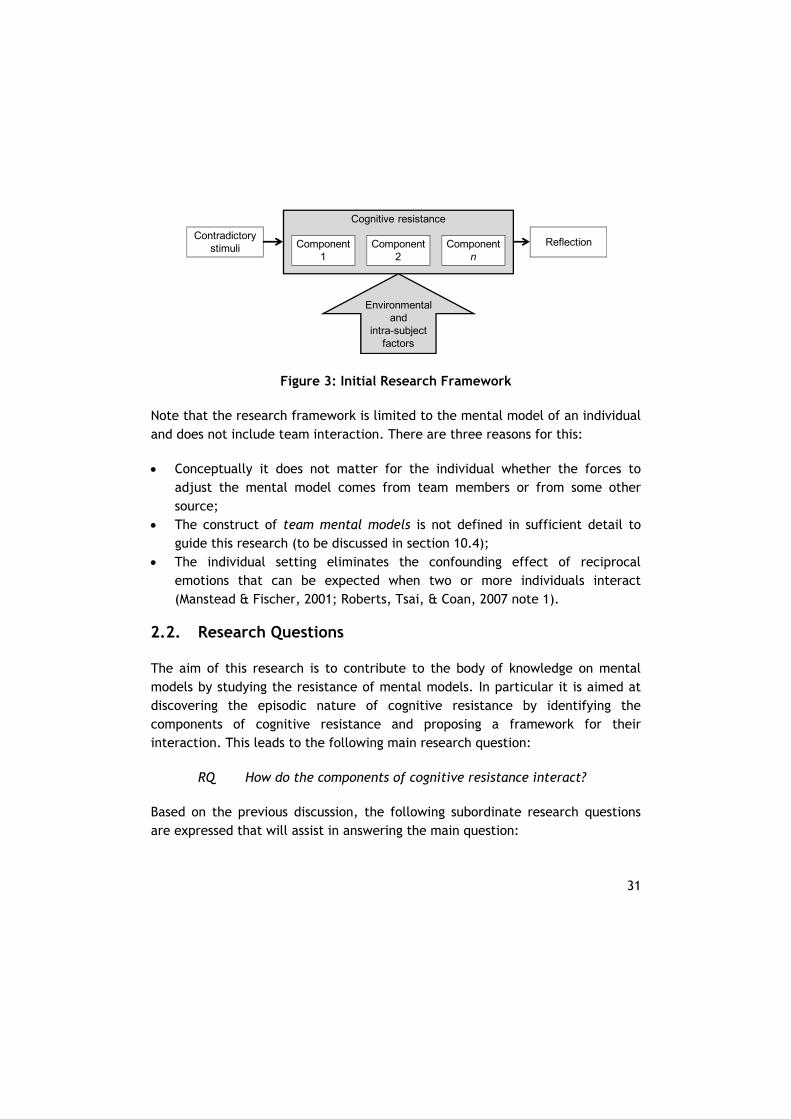
It is assumed that cognitive resistance as shown in Figure 2 can be decomposed into components that reflect the “real” physiological and neurological processes that are the cause of the phenomenon, from the discernment of contradictory stimuli to the conscious awareness of the discrepancy between expectations and reality, as shown in Figure 3. It is probable that cognitive resistance is subject to additional environmental and intra-subject factors (besides the contradictory stimuli). The establishment of a mental model is implied in the contradictory stimuli and not shown.
Figure 3 represents the initial research framework for this investigation. It shows how cognitive resistance is defined as the construct between contradictory stimuli and reflection. It illustrates that cognitive resistance is made up of components. Environmental and intra-subject factors are shown to influence cognitive resistance.
Cognitive resistanceContradictory
stimuli Reflection
Mental model establishment
31
Figure 3: Initial Research Framework
Note that the research framework is limited to the mental model of an individual and does not include team interaction. There are three reasons for this:
Conceptually it does not matter for the individual whether the forces to adjust the mental model comes from team members or from some other source;
The construct of team mental models is not defined in sufficient detail to guide this research (to be discussed in section 10.4);
The individual setting eliminates the confounding effect of reciprocal emotions that can be expected when two or more individuals interact (Manstead & Fischer, 2001; Roberts, Tsai, & Coan, 2007 note 1).
2.2. Research Questions
The aim of this research is to contribute to the body of knowledge on mental models by studying the resistance of mental models. In particular it is aimed at discovering the episodic nature of cognitive resistance by identifying the components of cognitive resistance and proposing a framework for their interaction. This leads to the following main research question:
RQ How do the components of cognitive resistance interact?
Based on the previous discussion, the following subordinate research questions are expressed that will assist in answering the main question:
Cognitive resistance
Component1
Contradictory stimuli Component
2Component
nReflection
Environmental and
intra-subject factors
32
RQ1 What are the components of cognitive resistance? It is assumed that cognitive resistance represents a “real” physiological
and neurological process, and that it is comprised of a number of components that can be identified and delineated. Therefore these components are investigated. Based on Reflective Practice and case study reports, it is hypothesized that emotion may be one of these components.
RQ2 What is the interaction between components of cognitive resistance? The answer to this research question allows us to identify whether, and if
so which effect each of the components have on cognitive resistance. This research question will be answered both from a theoretical perspective and through an experimental approach.
RQ3 What environmental and intra-subject factors influence cognitive
resistance? The identification of environmental and intra-subject factors that
influence cognitive resistance serves two purposes: it improves our understanding of cognitive resistance, and it makes it possible to reduce the confounding effect of these factors from the interaction of the components of cognitive resistance in the experimental study.
The results of this study will answer these research questions and contribute to our knowledge of how individuals adjust their mental models under influence of contradictory stimuli.
2.3. Research Approach
The current research is aimed at discovering the episodic nature of cognitive resistance. The author is not aware of earlier studies that have investigated cognitive resistance as it unfolds. Therefore the approach that is utilized in the current research includes an investigation of the literature from a broad range of perspectives to identify the constituent parts of cognitive resistance and define a proposition about their interaction. The experimental study that is utilized in the current research is then aimed at validating these results, based on a simplified task that simulates some of the characteristics of design engineering.
33
2.3.1. Review of literature As indicated earlier, this research is inspired by two seminal works: Mental Models (Johnson-Laird, 1983) and The Reflective Practitioner (Schön, 1983). These have been used as a starting point for the review of literature to identify more recent relevant literature. Additionally, the theory on emotions has been reviewed starting from three seminal works from the field of psychology. This approach is chosen because of the multi-disciplinary nature of this investigation. In this section these choices are justified.
The mental model theory of reasoning
Johnson-Laird (1983) has proposed the mental model construct that has laid the basis for much of the work on team mental models inside and outside design, including research that is conducted at the Delft Design School (e.g. Badke-Schaub, 2004; Badke-Schaub, Lauche et al., 2007; Janis A. Cannon-Bowers & Salas, 2001; Cardoso et al., 2009). As discussed previously, the construct of cognitive resistance is based on these ideas. Johnson-Laird’s 1983 book is quite influential (7000 cites) and is still increasingly being cited (see Figure 4 right) even though it has been succeeded by more recent work (Johnson-Laird, 2006a).
Reflective Practice
‘Reflective Practice’ describes a cycle of reflection and experimentation while actually engaged in a task (Schön, 1983). The author suggests that unexpected results are the trigger for engaging in this mode of thinking: “stimulated by surprise, [designers] turn thought back on action”. These ideas are relevant for the current investigation into cognitive resistance, as will be discussed below. Schön’s book The Reflective Practitioner (1983) has been very influential in providing an alternative to the normative approach to design that was common up to that time, having been frequently cited since first publication17 (>23 000 times; of which 2020 times for the domain of engineering, mathematics and computer science). Authors continue to build on Schön’s ideas (e.g. C. Akin, 2008; Cross, 1989/2008); in fact the number of citations has grown in recent years, as is shown in Figure 4 (left). Specifically within the Delft Design School
17 All citation scores are derived from Google Scholar in July and August 2011.
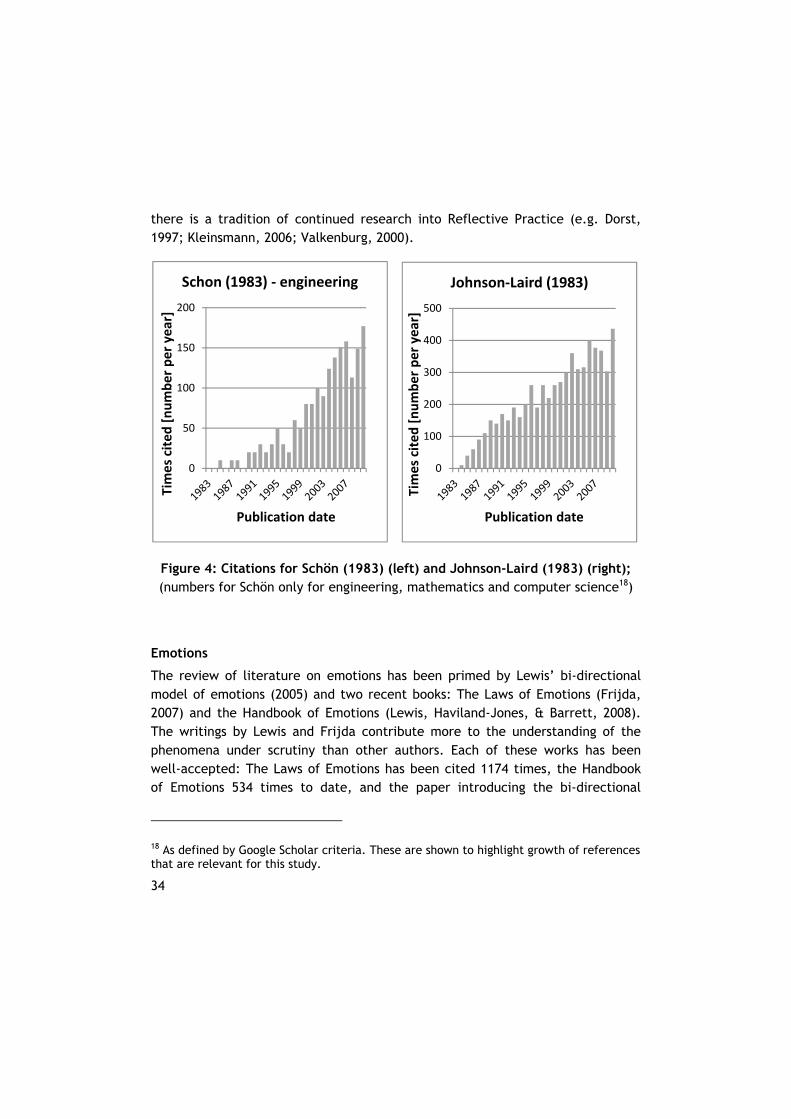
34
there is a tradition of continued research into Reflective Practice (e.g. Dorst, 1997; Kleinsmann, 2006; Valkenburg, 2000).
Figure 4: Citations for Schön (1983) (left) and Johnson-Laird (1983) (right); (numbers for Schön only for engineering, mathematics and computer science18)
Emotions
The review of literature on emotions has been primed by Lewis’ bi-directional model of emotions (2005) and two recent books: The Laws of Emotions (Frijda, 2007) and the Handbook of Emotions (Lewis, Haviland-Jones, & Barrett, 2008). The writings by Lewis and Frijda contribute more to the understanding of the phenomena under scrutiny than other authors. Each of these works has been well-accepted: The Laws of Emotions has been cited 1174 times, the Handbook of Emotions 534 times to date, and the paper introducing the bi-directional
18 As defined by Google Scholar criteria. These are shown to highlight growth of references that are relevant for this study.
0
50
100
150
200
Times cited [number per year]
Publication date
Schon (1983) ‐ engineering
0
100
200
300
400
500
Times cited [number per year]
Publication date
Johnson‐Laird (1983)
35
model of emotions 216 times. The Handbook of Emotions is in its third edition and includes contributions from many (if not all) frequently-cited emotion psychologists.
Approach
The works introduced above have been used as a starting point for the review of literature to identify further relevant literature, going both backwards (references) and forward (items citing). The preferred search engine is Google Scholar, due to its speed, ease of use, and because it includes both papers and books19. Preference has been given to sources that have been cited more frequently and are of recent date. The search was considered complete when search paths converged and the same article and/or author were identified through different routes. This approach is chosen (rather than limiting references to those from a pre-selection of journals) because of the multi-disciplinary nature of this investigation. The timeframe has been limited up to December 2010. In total more than 800 works have been included in the study, of which 380 are referenced in this dissertation. Source articles have been found in a multitude of journals and also include edited books.
2.3.2. Experimental approach The second phase of this investigation is an experimental study. It is based on a simplified task that is aimed at instilling cognitive resistance in the participants in an appropriate timescale. The manipulation requires the participants to be unaware of the real objective of the task (i.e. generate cognitive resistance), otherwise they will be sensitized to the contradictory stimuli. Two post-facto quasi experiments have been conducted with an artificial task that simulates some aspects of design activities. The task is elaborated in more detail in chapter 6. Participants in the experiment are selected from the domain of design engineering, because in this domain the discrepancy between the mental model and reality may continue for prolonged periods, this domain has inspired the current research, and this domain is the focus for research at the Faculty of Industrial Design Engineering at the Delft University of Technology.
19 A major disadvantage of Google Scholar is that it does not allow automated queries – and rapidly repeated manual operation is apparently assessed as such.
36
2.3.3. Overview of the research process This research was prompted by my experience in industry where I observed many team interactions, and intervened in some. The actual research started in 2007 with a number of preliminary experiments into the interaction of emotions and team performance (de Boer & Badke-Schaub, 2008a). Although a correlation between the ‘emotional alignment’ of the actors and team performance was detectable, the mechanisms were insufficiently clear to allow a proper understanding of the relationship. Therefore, further work was undertaken at an individual level to research the effect of emotion on the resistance of mental models. A software tool was commissioned in 2008 to allow experimental manipulation of mental models. Pilot experiments were held towards the end of that year to validate the parameters. Actual experiments were conducted throughout 2009 and 2010. In parallel, relevant literature was accumulated and studied. In 2011, this dissertation was written. Intermediate results of this research have been peer reviewed and presented at different conferences in the domains of aerospace engineering, design engineering and psychology (de Boer, 2011; de Boer & Badke-Schaub, 2008b; de Boer, Badke-Schaub, & Santema, 2010a; de Boer, Badke-Schaub, & Santema, 2010b).
2.4. Summary
In this chapter the research framework is presented. The constructs of a mental model and cognitive resistance have been defined. Reflection and contradictory stimuli have been elaborated upon, and the initial research framework has been constructed from these. From the framework the research questions and the research approach have been generated. The research approach includes a literature review and an experimental study. An overview of the research process has been given. In the next chapter the components of cognitive resistance will be investigated.
37
3. Components of cognitive resistance
In this chapter it is endeavored to answer the first research question: What are the components of cognitive resistance? Figure 3 (page 31) represents the initial research framework for this investigation. It shows how cognitive resistance is defined as the construct that separates contradictory stimuli from reflection, and how cognitive resistance is assumed to be made up of components.
In this chapter the constituent parts of cognitive resistance of cognitive resistance are identified through a review of the literature from a broad range of perspectives. Starting point is perception, because discernment of contradictory stimuli is a necessary condition for the mental model to be challenged. This is addressed in section 3.1.
Based on Reflective Practice and case study reports, it is hypothesized that emotion may be one of the components of cognitive resistance. Therefore, in section 3.2 the literature is reviewed with the purpose of identifying support for or opposition against this proposition. First the use of the term emotion in the literature is investigated, to identify in which sense the term may be relevant for cognitive resistance. Two different uses of the term are identified: to denote an emotional response and to describe emotion type. A definition of an emotional response is generated from the literature. Support for or opposition against the proposition that emotion may be one of the components of cognitive resistance is investigated, based on the segregation between emotional response and emotion type.
In the last section of this chapter (section 3.3) conclusions are drawn regarding the components of cognitive resistance and the research framework is revised.
3.1. Perception
Perception of contradictory stimuli is a necessary condition for the mental model to be challenged, and therefore a component of cognitive resistance. Under the dynamic circumstances of real life individuals “must amass and integrate uncertain, incomplete, and changing evidence” (Woods et al., 2010) and identify
38
their relevance to the existing mental model. Perception represents a physiological process that starts with an environmental stimulus that surpasses an individual’s perception threshold and leads to neural activation. The sensory information is then processed to see whether it is ‘recognized’, in which case we become consciously aware of stimuli (e.g. Chabris & Simons, 2010; Goldstein, 2009; Martens, 2007; Vidulich et al., 2010; Wickens & Hollands, 2000). The perception process can therefore be decomposed into primary perception and stimulus matching:
Primary perception is defined as the physiological process that starts with an environmental stimulus that surpasses the perception threshold and leads to
neural activation. Stimulus matching is the subconscious neurological process in which it is attempted to recognize the neural activation as relevant.
Primary perception for visual stimuli takes place in the retina of the eyes and the optic nerve and leading to neural activation in the visual cortex. Primary perception for auditory stimuli takes place in the organ of Corti in the ears and the auditory nerve, leading to neural activation in the auditory cortex. Stimulus matching for visual stimuli is purported to take place at the end of the ventral stream in the inferior temporal cortex; for auditory stimuli in the auditory cortex (A. Wickens, 2009). Stimulus matching is not always successful, even though primary perception has been accomplished.
The definition of cognitive resistance requires that the environmental stimulus surpasses an individual’s perception threshold and leads to neural activation but that this does not lead to conscious awareness of the stimulus. From the above it follows:
Primary perception and stimulus matching are components of cognitive resistance.
Primary perception is a necessary component of cognitive resistance. Stimulus matching can be either successful (and therefore lead to conscious perception, awareness of the discrepancy with reality, and reflection) or not (therefore the
39
mental model is preserved). In the next section other potential components of cognitive resistance are investigated.
3.2. Emotions
Based on Reflective Practice and case study reports, it is hypothesized that emotion may be one of the components of cognitive resistance. In this section the literature is reviewed with the purpose of identifying support for or opposition against this proposition. First existing definitions of emotion in the literature are investigated, to identify in which sense the term may be relevant for cognitive resistance. Two different uses of the term are identified: to denote an emotional response and to describe emotion type. A definition of an emotional response is generated from the literature. Support for or opposition against the proposition is investigated, based on the segregation between emotional response and emotion type.
3.2.1. Existing definitions of emotion A study into existing descriptions of emotions published in 1981 identified 92 different definitions of emotions (Kleinginna & Kleinginna, 1981), and many more have been developed since then (Frijda, 2008). Therefore, the literature review has been centered on recent definitions from frequently-cited emotion psychologists. Sources have been identified through the search method that has been initiated from Frijda (2007) and Lewis et al. (2008), as described in section 2.3. The resulting yield of recent definitions from frequently-cited emotion psychologists is summarized in the table below:
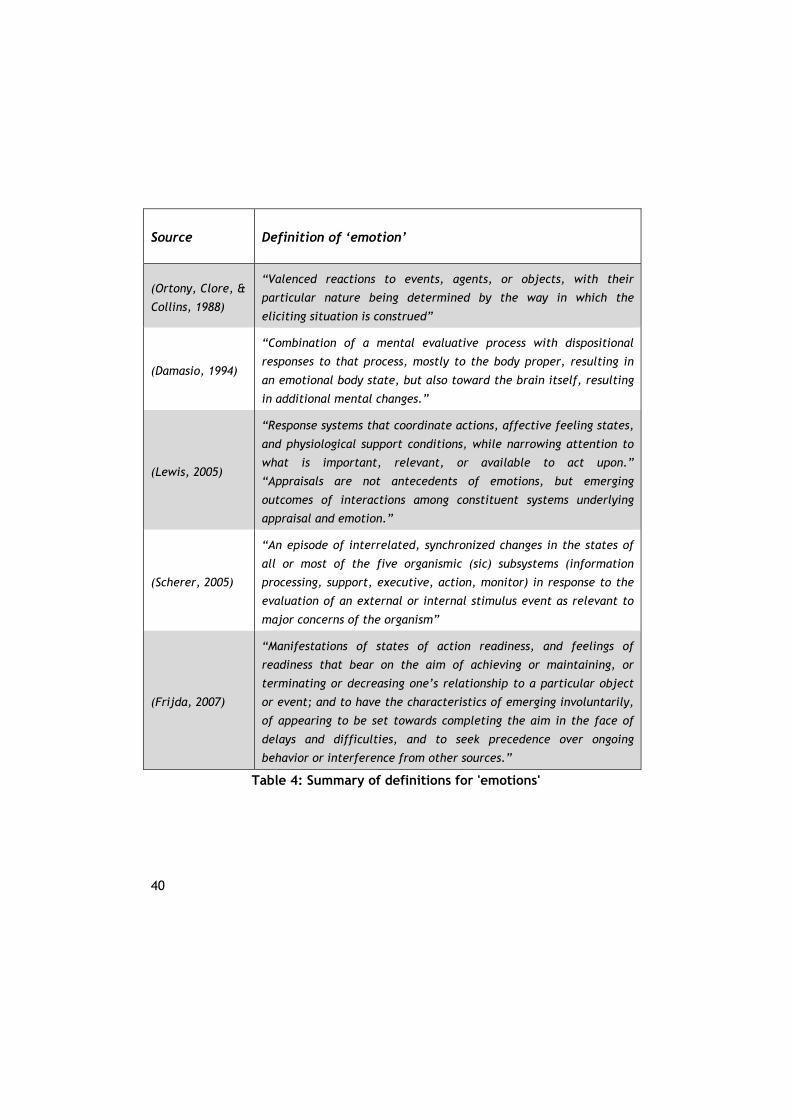
40
Source Definition of ‘emotion’
(Ortony, Clore, &
Collins, 1988)
“Valenced reactions to events, agents, or objects, with their
particular nature being determined by the way in which the
eliciting situation is construed”
(Damasio, 1994)
“Combination of a mental evaluative process with dispositional
responses to that process, mostly to the body proper, resulting in
an emotional body state, but also toward the brain itself, resulting
in additional mental changes.”
(Lewis, 2005)
“Response systems that coordinate actions, affective feeling states,
and physiological support conditions, while narrowing attention to
what is important, relevant, or available to act upon.”
“Appraisals are not antecedents of emotions, but emerging
outcomes of interactions among constituent systems underlying
appraisal and emotion.”
(Scherer, 2005)
“An episode of interrelated, synchronized changes in the states of
all or most of the five organismic (sic) subsystems (information
processing, support, executive, action, monitor) in response to the
evaluation of an external or internal stimulus event as relevant to
major concerns of the organism”
(Frijda, 2007)
“Manifestations of states of action readiness, and feelings of
readiness that bear on the aim of achieving or maintaining, or
terminating or decreasing one’s relationship to a particular object
or event; and to have the characteristics of emerging involuntarily,
of appearing to be set towards completing the aim in the face of
delays and difficulties, and to seek precedence over ongoing
behavior or interference from other sources.”
Table 4: Summary of definitions for 'emotions'
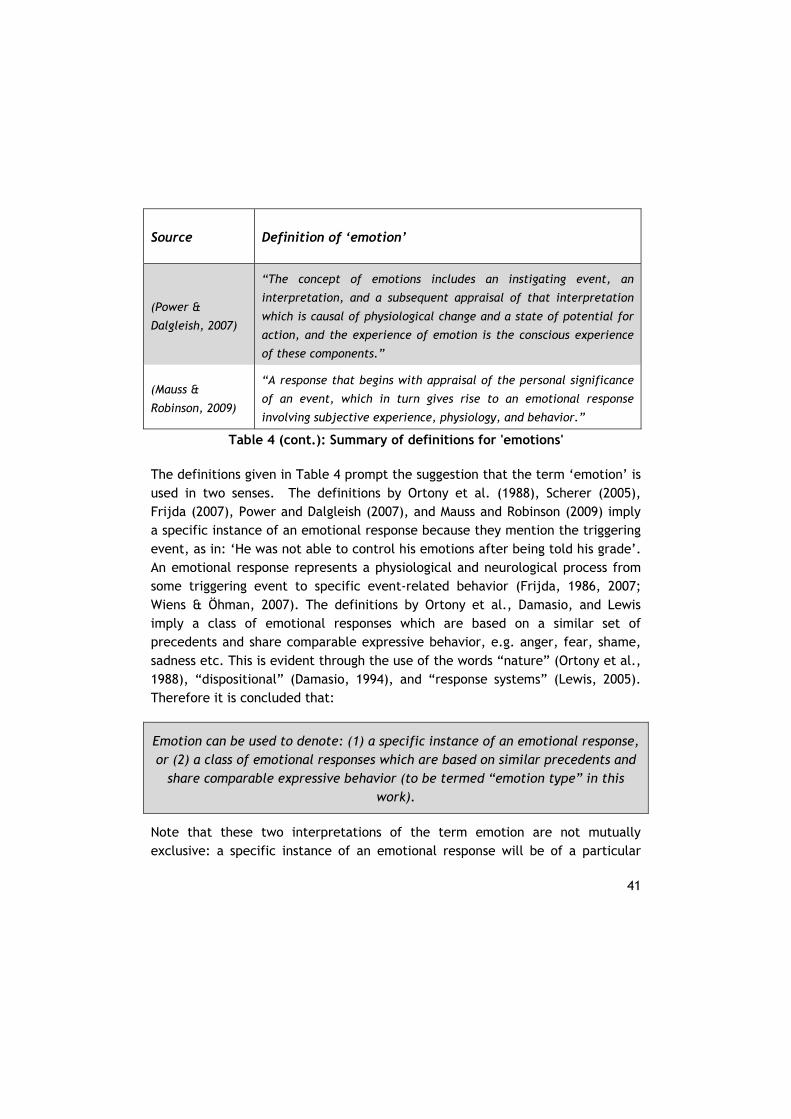
41
Source Definition of ‘emotion’
(Power &
Dalgleish, 2007)
“The concept of emotions includes an instigating event, an
interpretation, and a subsequent appraisal of that interpretation
which is causal of physiological change and a state of potential for
action, and the experience of emotion is the conscious experience
of these components.”
(Mauss &
Robinson, 2009)
“A response that begins with appraisal of the personal significance
of an event, which in turn gives rise to an emotional response
involving subjective experience, physiology, and behavior.”
Table 4 (cont.): Summary of definitions for 'emotions'
The definitions given in Table 4 prompt the suggestion that the term ‘emotion’ is used in two senses. The definitions by Ortony et al. (1988), Scherer (2005), Frijda (2007), Power and Dalgleish (2007), and Mauss and Robinson (2009) imply a specific instance of an emotional response because they mention the triggering event, as in: ‘He was not able to control his emotions after being told his grade’. An emotional response represents a physiological and neurological process from some triggering event to specific event-related behavior (Frijda, 1986, 2007; Wiens & Öhman, 2007). The definitions by Ortony et al., Damasio, and Lewis imply a class of emotional responses which are based on a similar set of precedents and share comparable expressive behavior, e.g. anger, fear, shame, sadness etc. This is evident through the use of the words “nature” (Ortony et al., 1988), “dispositional” (Damasio, 1994), and “response systems” (Lewis, 2005). Therefore it is concluded that:
Emotion can be used to denote: (1) a specific instance of an emotional response, or (2) a class of emotional responses which are based on similar precedents and
share comparable expressive behavior (to be termed “emotion type” in this work).
Note that these two interpretations of the term emotion are not mutually exclusive: a specific instance of an emotional response will be of a particular
42
type, and a particular type of emotion is only observable as an emotional response. The segregation of the term emotion into its two interpretations is relevant to the current research because either or both interpretations may constitute a component of cognitive resistance.
3.2.2. Defining emotional responses In the previous paragraph it was identified that the term emotion can be used to denote a specific instance of an emotional response, or a class of emotional responses. In this paragraph a definition of the construct of emotional response is generated by a review of the literature. This is necessary to find support for or opposition against the proposition that an emotional response is a component of cognitive resistance, and in particular to be able to differentiate it from other types of affective phenomena (e.g. moods or feelings).
Recent definitions of emotion from frequently-cited emotion psychologists have been summarized in the previous paragraph. From this it can be concluded that there is general agreement about the construct of emotions despite the fact that there seems to be much debate within the domain (Frijda, 2008). However, each of these definitions is limited in its ability to differentiate it from other types of affective phenomena, to identify the existence of an emotional response and contrast it against a non-emotional background, and to specify when an emotion begins and when it ends (cf. Sander & Scherer, 2005). Therefore, the defining characteristics of an emotional response are derived from the literature. From the definitions presented in the previous paragraph eight defining characteristics follow, as presented in Table 5.
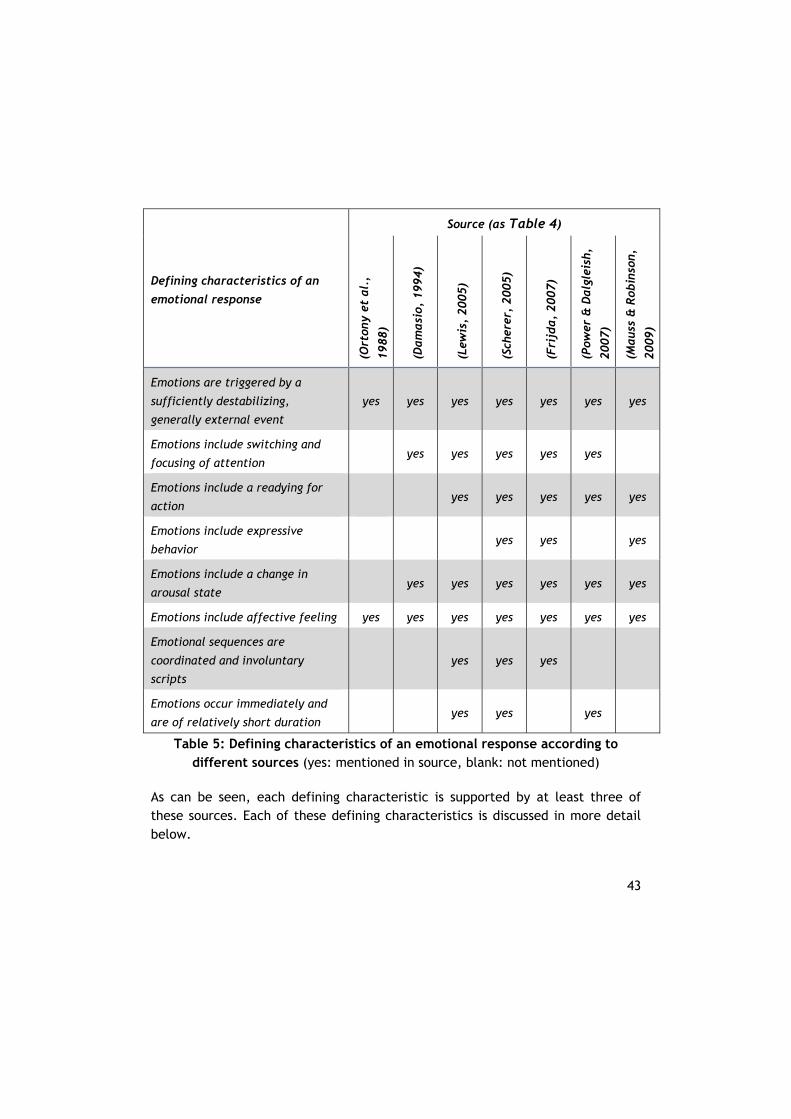
43
Defining characteristics of an
emotional response
Source (as Table 4)
(Ort
ony
et a
l.,
1988)
(Dam
asi
o, 1
994)
(Lew
is,
2005)
(Sch
erer
, 2005)
(Fri
jda,
2007)
(Pow
er &
Dalg
leis
h,
2007)
(Maus
s &
Rob
inso
n,
2009)
Emotions are triggered by a
sufficiently destabilizing,
generally external event
yes yes yes yes yes yes yes
Emotions include switching and
focusing of attention yes yes yes yes yes
Emotions include a readying for
action yes yes yes yes yes
Emotions include expressive
behavior yes yes yes
Emotions include a change in
arousal state yes yes yes yes yes yes
Emotions include affective feeling yes yes yes yes yes yes yes
Emotional sequences are
coordinated and involuntary
scripts yes yes yes
Emotions occur immediately and
are of relatively short duration yes yes yes
Table 5: Defining characteristics of an emotional response according to different sources (yes: mentioned in source, blank: not mentioned)
As can be seen, each defining characteristic is supported by at least three of these sources. Each of these defining characteristics is discussed in more detail below.
44
Emotional responses are triggered by a sufficiently destabilizing, generally external event
Emotional responses are triggered by events, objects or actions that are evaluated as relevant to the concerns of the individual. Concerns can be inferred from what elicits emotions or from what people strive for, and are triggered by a subjective (rather than an objective) reality (P. L. Harris, 2008; Roseman & Smith, 2001). The “processes in or by the individual that intervene between events as such, and emotional experiences and other emotional responses” are referred to as appraisals20 (Frijda, 2007). An appraisal is subconscious and precedes (conscious) cognition (Grandjean & Scherer, 2008; Lazarus, 2001). Generally, the triggering event is external to the individual; but in some cases it can be embodied, as in thought, memory or fantasy (Frijda, 2007). Only if goals or core values and beliefs are at stake will the individual become aroused (Lazarus, 2001). This implies a threshold effect: a triggering event will only lead to a specific instance of an emotional response if it is sufficiently destabilizing (Lewis, 2005; Niedenthal, 2008). This is not only dependent upon how (un)desirable the stimulus is (relative to the individual’s concerns), but also its salience and unexpectedness. Additionally, the destabilizing effect is determined by context, ongoing events and earlier experience, as well as current activation, mood and personality dispositions (Frijda, 2007; Lewis, 2005; Ortony et al., 1988).
Many authors (e.g. Oatley, 2007; Scherer, 2005) now include the appraisal as a component of emotion or at least as an element of the “ongoing appraisal–emotion stream” (Lewis, 2005), despite the fact that appraisals are made continuously, and are not specific to emotion elicitation (Frijda, 2007). Recent models of emotions include an internal feedback loop from the emotional response back to appraisal (e.g. Laird & Strout, 2007; Scherer, 2001; Smith & Kirby, 2001). Lewis (2005) has presented such a model that encompasses multiple feedback loops and interactions (and is therefore termed bi-directional). In this model the appraisal and emerging emotional interpretation are intertwined during the process, and interpretations (also) lead to appraisals rather than just
20 In some literature termed “primary appraisal” to differentiate from “secondary appraisal”: a conscious evaluation and coping process later in the emotional sequence.
45
the other way around. An emotional interpretation is realized (i.e. an emotion is recognized by the self as such) after a phase of self-amplification. The strength of Lewis’ bi-directional model lies in its mirroring of neurobiological processes and the realistic dynamic characteristics of the emotional sequence. The model has generally been well received within the community of emotion psychologists (e.g. Frijda, 2007; Izard, Trentacosta, & King, 2005; Panksepp, 2005), although it has been criticized for “the lack of a specification on when an emotion begins and when it ends, as well as of the difference between an emotion episode and the non-emotional background of an individual’s experience” (Sander & Scherer, 2005)21.
Note that although a threshold effect has been broadly accepted amongst emotion theorists, this is not taken into account in much of the empirical work using photos or film as stimulus (e.g. Bailenson et al., 2008; Bradley & Lang, 2007; Lang, Bradley, & Cuthbert, 2008; Schiano, Ehrlich, & Sheridan, 2004). A recent exception is the study by Westerink et al. (2009) which included a method to detect ‘emotional events’ in daily life routines.
Emotional responses include switching and focusing of attention
Emotional responses are indisputably associated with a redirection of attention to relevant aspects of the environment. According to some authors this could be the main function of emotions (Frijda, 1986; Izard, 1977; Lewis, 2005). Emotions seek precedence over ongoing behavior or interference from other sources, and sensitizes consciousness for relevant events (Frijda, 2007). The attention that emotional responses bring about allows us to urgently deal with whatever meaning the event, object or action that caused the emotion has for us. “There is little or no latitude to be aware of one’s feelings: one is aware of their object
21 Although Lewis is not explicit on these points in the initial article or his response to the comments, the criticism by Sander and Scherer may be countered by (1) assuming that the self-amplification of an emotion is subject to threshold effects and is triggered by a sufficiently destabilizing event - the start of an emotion is marked by surpassing the threshold; and (2) some common agreement is made about when the stabilization phase of an emotion ends, for instance the intensity of the emotion drops below the threshold value, or the intensity of the emotion decays to half the maximum value (both criteria allow for the reactivation of emotion by further ‘superliminal’ appraisals).
46
[…] One may not even identify one’s experience as an emotion” (Frijda, 2007 p.201).
Emotional responses include a readying for action
Emotions are states that “bear on the aim of achieving or maintaining, or terminating or decreasing one’s relationship to a particular object or event” (Frijda, 2007). Emotional responses therefore include a tendency or readiness for action (Lewis, 2005; Scherer, 2005). The individual prepares to achieve his aim by potentiating actions, involving either complete muscular activity or limited to potentiating of the central nervous system only. Nevertheless, whether the action is actually executed or not is irrelevant for the definition of emotion: regulation processes moderate all instances of emotional responses (James J. Gross & Thompson, 2007). Because the appraisal process is subconscious, we may not be (immediately) aware of the reasons for action. We may persist in our actions even though there may be good reason to not do so (Frijda, 2007). Hofinger (2003) considers an emotion as a holistic evaluation of the situation, that allows for swifter and more complete processing of information than consciousness, and leads to strong impulses for action.
Emotional responses include expressive behavior
Facial expressions are considered by evolutionists as a primary component of emotion from Darwin’s first writings (1872). Other authors (e.g. Frijda, 2007; Lewis, 2005) consider facial expressions and whole-body movement a component of the program to prepare for action. Facial expressions are considered reliable markers of emotion that correlate with subjective experience, are part of the coherent emotional response, and serve many interpersonal functions (Ekman, 2007) – although Larsen et al. (2008) suggest that “many emotional reactions are not accompanied by visual facial actions”. Expressive behavior will evoke a response from others, and signal them to act appropriately to modify the relationship from their side. In a sense, expressive behavior is an ‘incentive’ to others for desired social behavior (Frijda, 2007; Matsumoto, Keltner, Shiota, O’Sullivan, & Frank, 2008). Most authors agree that emotion proper includes expressive behavior (Lewis, 2005; Scherer, 2005). Perlovsky (2006) however seems to suggest that emotional responses lead to but do not include expressive behavior: “facial expressions, higher voice pitch, exaggerated gesticulation […] are outward signs of emotions, serving for communication”.
47
Emotional responses include a change in arousal state
The autonomous physiological response to the emotional event includes changes in heart rate, transpiration, hormone levels, muscle contraction (particularly of the face, e.g. startle reflex) and breathing (Comer & Gould, 2010; Pecchinenda, 2001). These changes have been hypothesized to correlate with a readying for action. There is some debate whether specific emotion types each have a corresponding, unique pattern of arousal (see Barrett, Mesquita, Ochsner, & Gross, 2007). Physiological measurements have been shown to be predictive of the emotions experienced (Bailenson et al., 2008).
Emotional responses generally include affective feeling
Emotional responses are associated with pleasure, pain, fear or other feelings. These signal a sense of urgency and motivate movement towards - or withdrawal from - an object or event (Frijda, 2007). Feelings support our cognitive decision making by offering us an intrinsic reward or penalty (Bechara & Damasio, 2005; Damasio, 1994; Loewenstein, 2007) and by biasing cognition (Dolan, 2002; Duncan & Barrett, 2007). Emotional responses have this effect even if we are not aware of the affect associated with the emotion (Frijda, 2007).
Although emotional responses are generally associated with affect, there is some debate whether affect is a necessary condition for emotions. For instance, surprise is defined as an emotion by some authors (e.g. Frijda, 2007; Izard, 2007) but not by others (e.g. J. T. Larsen et al., 2008; Steunebrink, 2010). Other non-valenced emotion types include curiosity, amazement, and astonishment (high activation); and passiveness, deference and composure (low activation) (Desmet, 2002). Ortony et al. (1988 p.32, p.125-127) exclude all non-valenced responses on the (tautological) grounds that emotions are by definition valenced.
Emotional sequences are coordinated and involuntary scripts
The scripted, coordinated and involuntary nature of emotional responses is not disputed. We become aware of an emotion and its cause, but never of the transition to an emotion (Johnson-Laird, 2006a p.88). An emotion is not characterized by each individual component, but as an orchestrated superordinate program (Tooby & Cosmides, 2008). Response synchronization is believed to be one of the most important features of emotion (Frijda, 2008; Scherer, 2005). The scripting of emotions implies that similar circumstances will
48
generate similar appraisals and a similar emotional response for an individual in different instances (Frijda, 2007; Niedenthal, 2008).
Conventionally, emotion intensity is described as a continuum (e.g. Bradley & Lang, 2007; Sabatinelli, Bradley, Fitzsimmons, & Lang, 2005; Sonnemans & Frijda, 1994). However, Lewis (2005) suggests that emotional responses pass through ‘phase transitions’, suggesting discontinuity in the experience of emotions, and emotional intensity levels that therefore do not necessarily start from zero. This implies that the emotional sequence is marked by a discrete and sudden change in behavior and arousal that clearly contrasts with previous states.
Emotional responses occur immediately and are of relatively short duration
Most authors agree to the short-term experience of an emotion, certainly in contrast to other affective phenomena (Niedenthal, Barsalou, Ric, & Krauth-Gruber, 2005). The response to the triggering event is more or less immediate: appraisal processes require 100 – 600 milliseconds (Grandjean & Scherer, 2008) and the emergence of an emotional interpretation takes 600 - 800 milliseconds (Lewis, 2005). The duration of an emotional sequence (in which the characteristics described in the previous paragraphs are manifest) is typically identified in terms of seconds to minutes. Ekman states that “the great majority of expressions of felt emotions last between ½ to 4 seconds duration” (Scherer & Ekman, 1984). Lewis’ bi-directional model of emotions predicts that there are effectively two time scales: the emotional interpretation emerges in real time and learning effects endure for much longer (Lewis, 2005). The total duration of the emotional sequence must be relatively short in comparison with moods and other affective phenomena in order not to tax the resources of the individual, as emotions imply massive response mobilization, and to allow flexibility in behavior (Scherer, 2005).
Frijda (2007 p.187) contends that an “emotional sequence” may last for minutes or sometimes even hours. He has included the description of a “state of readiness” lasting several hours that is linked to a single event. A clear and shared specification of when an emotional response ends (cf. Sander & Scherer, 2005) is lacking in the literature, although different suggestions can be made (see footnote 21).
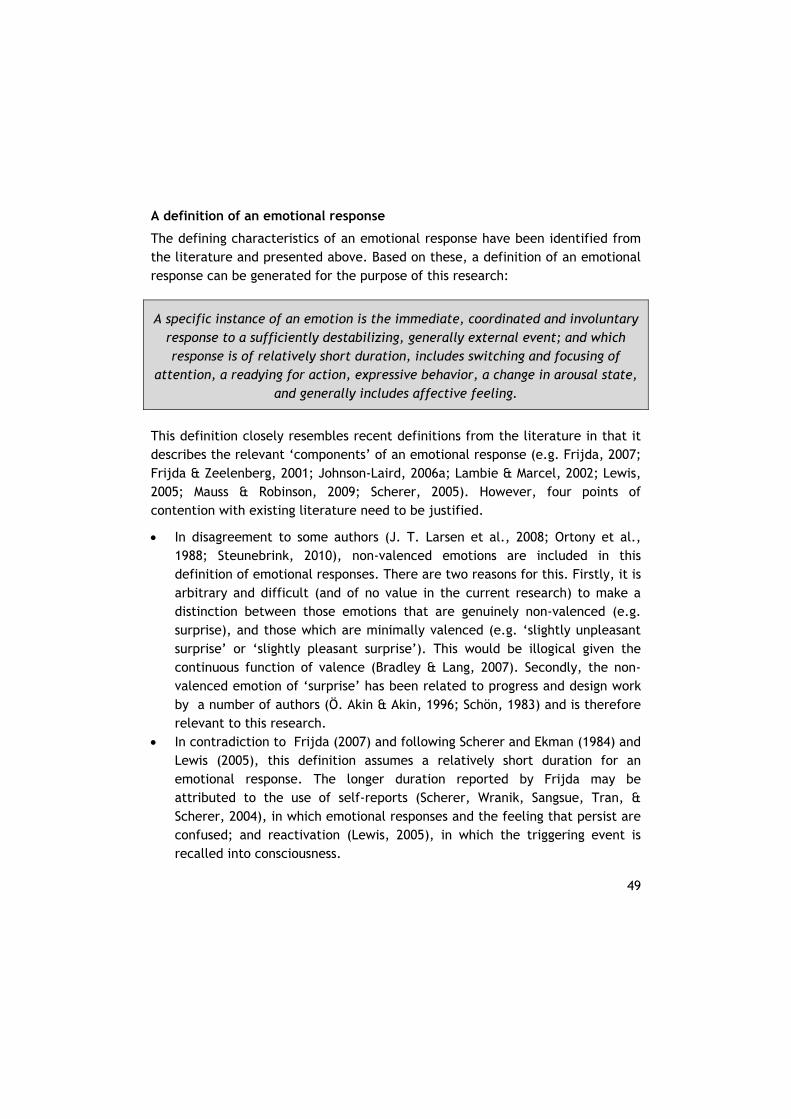
49
A definition of an emotional response
The defining characteristics of an emotional response have been identified from the literature and presented above. Based on these, a definition of an emotional response can be generated for the purpose of this research:
A specific instance of an emotion is the immediate, coordinated and involuntary response to a sufficiently destabilizing, generally external event; and which response is of relatively short duration, includes switching and focusing of
attention, a readying for action, expressive behavior, a change in arousal state, and generally includes affective feeling.
This definition closely resembles recent definitions from the literature in that it describes the relevant ‘components’ of an emotional response (e.g. Frijda, 2007; Frijda & Zeelenberg, 2001; Johnson-Laird, 2006a; Lambie & Marcel, 2002; Lewis, 2005; Mauss & Robinson, 2009; Scherer, 2005). However, four points of contention with existing literature need to be justified.
In disagreement to some authors (J. T. Larsen et al., 2008; Ortony et al., 1988; Steunebrink, 2010), non-valenced emotions are included in this definition of emotional responses. There are two reasons for this. Firstly, it is arbitrary and difficult (and of no value in the current research) to make a distinction between those emotions that are genuinely non-valenced (e.g. surprise), and those which are minimally valenced (e.g. ‘slightly unpleasant surprise’ or ‘slightly pleasant surprise’). This would be illogical given the continuous function of valence (Bradley & Lang, 2007). Secondly, the non-valenced emotion of ‘surprise’ has been related to progress and design work by a number of authors (Ö. Akin & Akin, 1996; Schön, 1983) and is therefore relevant to this research.
In contradiction to Frijda (2007) and following Scherer and Ekman (1984) and Lewis (2005), this definition assumes a relatively short duration for an emotional response. The longer duration reported by Frijda may be attributed to the use of self-reports (Scherer, Wranik, Sangsue, Tran, & Scherer, 2004), in which emotional responses and the feeling that persist are confused; and reactivation (Lewis, 2005), in which the triggering event is recalled into consciousness.
50
Ortony et al. (1988) include affective states in their examples of emotions that do not necessarily include a tendency to act and/or meet the threshold criteria (e.g. admiration). Following most authors both a tendency to act (e.g. Frijda, 2007) and threshold criteria (Lewis, 2005) are included in the definition above.
Following Frijda (2007) but in contrast to Scherer (2005), Lewis (2005) and Oatley (2007) , an appraisal is considered to be antecedent to an emotional response (and not included in the definition of an emotional response, as suggested by Lewis (2005) in his bi-directional model of emotion.
The emotional response includes expressive behavior (as follows from the definition and most of the literature) but not other behavior. The blurred distinction between ‘expressive behavior’ and ‘other behavior’ undermines the clarity of the definition of an emotional response. Some additional precision is achieved if expressive behavior can be segregated from other behavior, for instance by using the listing (“motor expression”) by Scherer and assume that this listing is exhaustive:
“Smiling, Mouth opening, Mouth closing, Mouth tensing, Frown, Eyes closing, Eyes opening, Tears, Other changes in face, Voice volume increasing, Voice volume decreasing, Voice trembling, Voice being assertive, Other changes in voice, Abrupt bodily movements, Moving towards people or things, Withdrawing from people or things, Moving against people or things, Other changes in gesture, Silence, Short utterance, Long utterance, Speech melody change, Speech disturbance, Speech tempo changes” (Scherer, 2005).
The proposed definition of an emotional response serves to differentiate emotions from other affective phenomena (Scherer, 2005):
Feelings are affective states that are generally a component of an emotional response, but can also exist independently of the other attributes (in which case they are not constituents of a specific emotional response).
Moods are in comparison to emotions of longer duration and are less distinctly triggered by an event.
51
Personality traits are life-long dispositional characteristics that are linked to an individual.
Preferences, attitudes or sentiments are relatively enduring beliefs and predispositions towards specific objects or persons.
“Biological affects” such as hunger and thirst do not entail an immediate response to an event.
The definition of an emotional response given above does not explicitly differentiate between emotions and reflexes such as pain (cf Loewenstein, 2007). However the triggering event can help us distinguish these specific cases. Note that the presence of just one of the defining characteristics of an emotional response is insufficient to identify a response as “emotional”. Neither is the absence of any one characteristics sufficient to establish that an emotion has not occurred (Ekman, 2007).
3.2.3. Emotion as a component of cognitive resistance In the previous paragraphs existing definitions of emotion in the literature have been investigated. Two different interpretations of the term have been identified: to denote an emotional response and to describe emotion type. A definition of an emotional response has been generated. Based on Reflective Practice and case study reports, it is hypothesized that emotion may be one of the components of cognitive resistance.
In this paragraph the results of the review of literature is presented identifying support for or opposition against the proposition that an emotional response and/or emotion type are components of cognitive resistance. First the sources from those shown in Table 3 (page 24) are identified that do, or do not, give support for the proposition that emotions are components of cognitive resistance. The sources that do support the proposition are then each discussed in more detail. Finally, a division is made between emotional response and emotion type for each of these sources.
Sources are identified that do, or do not, give support for the proposition that emotions are components of cognitive resistance. Sources have been identified through the search method described in section 2.3, and include all the sources
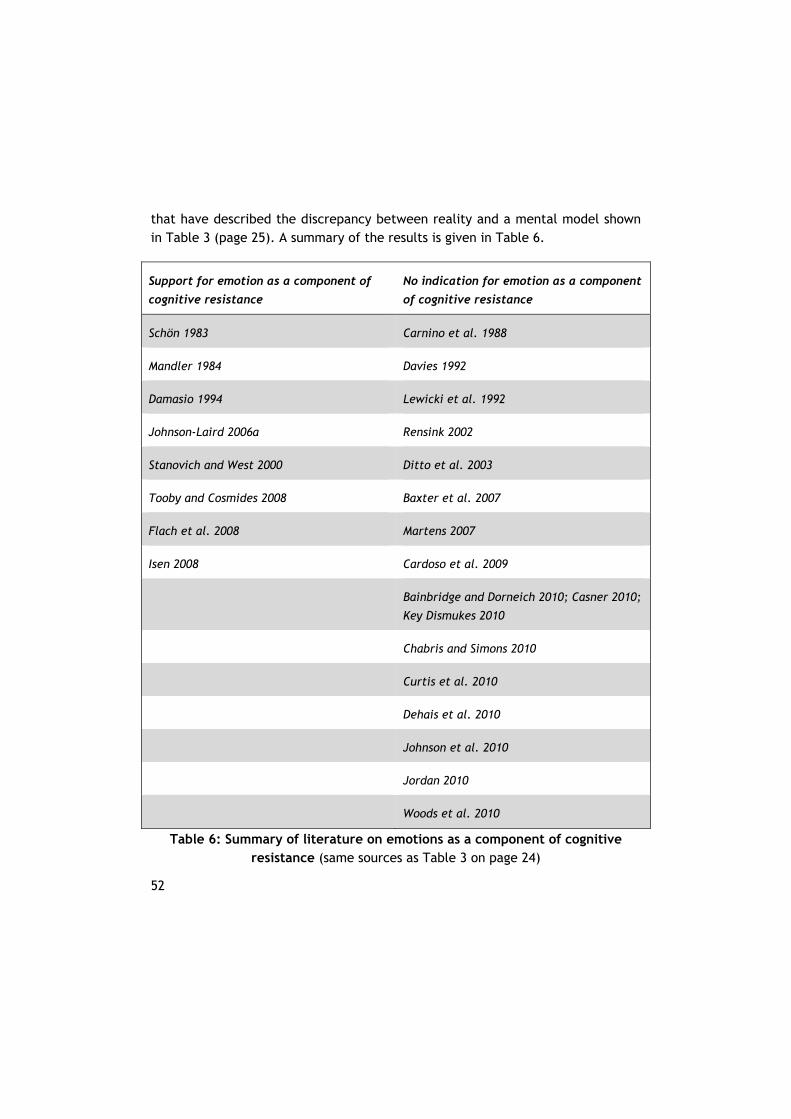
52
that have described the discrepancy between reality and a mental model shown in Table 3 (page 25). A summary of the results is given in Table 6.
Support for emotion as a component of
cognitive resistance
No indication for emotion as a component
of cognitive resistance
Schön 1983 Carnino et al. 1988
Mandler 1984 Davies 1992
Damasio 1994 Lewicki et al. 1992
Johnson-Laird 2006a Rensink 2002
Stanovich and West 2000 Ditto et al. 2003
Tooby and Cosmides 2008 Baxter et al. 2007
Flach et al. 2008 Martens 2007
Isen 2008 Cardoso et al. 2009
Bainbridge and Dorneich 2010; Casner 2010;
Key Dismukes 2010
Chabris and Simons 2010
Curtis et al. 2010
Dehais et al. 2010
Johnson et al. 2010
Jordan 2010
Woods et al. 2010
Table 6: Summary of literature on emotions as a component of cognitive resistance (same sources as Table 3 on page 24)
53
Some of the sources that have described the discrepancy between reality and a mental model shown in Table 3 (page 25) give support to the proposition that emotions are a component of cognitive resistance, but many other authors are not specific about a role of emotions in cognitive resistance. The references that support the proposition that emotion is a component of cognitive resistance have been grouped as follows:
Reflective Practice (Schön, 1983) is very influential in design methodology, and authors continue to build on these ideas. Specifically within the Delft Design School there is a tradition of continued research into Reflective Practice (e.g. Dorst, 1997; Kleinsmann, 2006; Valkenburg, 2000).
Mandler’s Theory of Discrepancy and Interruption (Mandler, 1984) replicates Schön’s thinking, reserving a central role for interruptions. Mandler’s contribution to emotion theory has been influential because it “provides a transition to more goal-based approaches to emotion” (Power & Dalgleish, 2007). His work on emotions is still being cited, although according to Power and Dalgleish it has been superseded by more recent theories.
The Somatic Marker Hypothesis (Damasio, 1994) has been influential22 in highlighting the role of affect in rational decision making. The hypothesis was posited to account for the role of emotion in the decision-making process (Bechara & Damasio, 2005; Damasio, 1994). However, despite the prominence of Damasio’s work, the “somatic marker” construct is suggested by some to be not much different to a feeling or emotion (e.g. Frijda, 2007 p.208; Rick & Loewenstein, 2008).
The Communicative Theory of Emotions is less well cited than the works described earlier, but it complements Johnson-Laird’s Mental Model theory (Johnson-Laird, 2006a) that is the basis for this dissertation and so is included in the review of literature (Johnson-Laird & Oatley, 2008; see also Oatley & Johnson-Laird, 1996).
22 Particularly through a seminal article in Science (Bechara, Damasio et al. 1997) that has been cited 1790 times and his popular books Descarte’s Error (Damasio 1994) and Looking for Spinoza (Damasio 2003) that have been cited more than 12 068 and 1742 times respectively.
54
The Dual Process Theory of Reasoning (Stanovich & West, 2000) has attracted much research within psychology, and according to Johnson-Laird (2010) aligns with the Mental Model Theory of Reasoning. It has therefore been included in te review of literature.
The functional nature of emotions reflects the paradigm of evolutionary psychologists (e.g. Tooby & Cosmides, 2008). They suggest that emotions are a flexible response to stimuli from the environment. A large discrepancy between reality and an existent mental model can be life-threatening, and may be signaled by emotions.
Model of Intentional Dynamics (Flach et al., 2008): Although the human factors community has offered a comprehensive description of the phenomena regarding cognitive resistance (as discussed in section 2.1), no concrete theories or models are available that can explain these phenomena (Bainbridge & Dorneich, 2010; Woods et al., 2010). One recent exception is perhaps the model proposed by Flach, Dekker and Stappers (2008). This model, although only 5 cites, is of interest for this study because the background of the authors (psychology, human factors and a design methodology) reflect the focus of this study, and it proposes an effect of emotions on cognitive resistance.
The effect of emotion on decision making and problem solving (e.g. Isen, 2008)
Each of these theories is discussed in more detail below.
Reflective Practice
Donald Schön (1983) has suggested that (lack of) emotional behavior is a component of cognitive resistance. He suggests that surprise is the trigger for engaging in a reflective mode of thinking (i.e. demise of the existing mental model):
When intuitive, spontaneous performance yields nothing more than the results expected for it, then we tend not to think about it. But when intuitive performance leads to surprises, pleasing and promising or unwanted, we may respond by reflection-in-action. (Schön, 1983 p.56)
55
From this description follows that according to Schön, surprise is a necessary condition for reflection, and therefore ‘being surprised’ reduces cognitive resistance. Other emotional responses such as anger similarly seem to have an effect cognitive resistance:
Participants in the game not infrequently became attached to a particular reading of the prototype, and treated an alternative reading as a threat, which provoked an angry and defensive reaction. (Schön, 1992 p.145)
Other authors, building on Schön’s work, have corroborated the effect of different emotions on cognitive resistance in design. Akin (2008) describes the surprise in what he calls the “Aha! Response” when existing ideas are successfully challenged. Kleinsmann (2006 p.170–179), presents an example where reflection is inhibited and current thinking persists due to anger. Each of these cases highlights that conflicts may arise in team settings due to the challenges to the mental models of the individual team members. In some cases these emotions may initially seem disruptive, but actually turn out to be fruitful (cf. Tuckman & Jensen, 1977), because they support the development of the team mental model (Badke-Schaub et al., 2010; Boos, 2007).
In summary, Reflective Practice proposes that emotions are a component of cognitive resistance.
Mandler’s Theory of Discrepancy and Interruption
Mandler (1984) proposes that “interruption is a sufficient and necessary condition for the occurrence of autonomic arousal”. He proposes:
“A new input that activates a new schema may be interrupting, if the new schema is incompatible with the old, if it contradicts the operation of the old structure or, more generally, if it provides evidence that it […] cannot be assimilated by the existing structures.”
In contrast to Reflective Practice, Mandler suggests that the interruption may lead to different, specific types of emotion, depending on “factors other than
56
the interruption itself”. The emotions can be either positively or negatively valenced. Mandler does not qualify the effect of different interruptions according to elicited emotion types.
Somatic Marker Hypothesis
This theory states that previous emotional experiences are reactivated whenever individuals face a situation that has previously been “categorized” (i.e. marked somatically). This then supports future decision-making in a similar context (Bechara, Damasio, & Damasio, 2000; Damasio, 1994). Research findings indicate that an emotional response is triggered before conscious reflection. The Somatic Marker Hypothesis therefore supports the proposition that emotions are a necessary condition for reflection, and that the probability of reflection is moderated by emotion type.
The Communicative Theory of Emotions
According to the Communicative Theory of Emotions, subconscious evaluations trigger emotions as signals to direct attention, mobilize the body, and to prepare for appropriate behavior (Johnson-Laird & Oatley, 2008; Oatley & Johnson-Laird, 1996). Emotions set the brain into specific states to coordinate our multiple goals, given our limited intellectual resources, and initiate reasoning (Johnson-Laird, 2006a p.87). The Communicative Theory of Emotions proposes that emotions are triggered subconsciously to activate consciousness, implying a role in reflection and demise of the mental model. The type of emotion influences our intentions. The Communicative Theory of Emotions supports the proposition that emotions are a necessary condition for reflection, and that the probability of reflection is moderated by emotion type.
The Dual Process Theory of Reasoning
In dual process terms, system 1 and system 2 are in conflict if the inherent resistance of the mental model leads to a sufficiently large mismatch with reality. Different authors have shown that affective processing is engaged if system 1 and system 2 are in conflict. This is even the case when deliberate thought processes are restrained and individuals respond intuitively, i.e. they reject the challenge to the mental model (Duncan & Barrett, 2007; Fugelsang & Dunbar, 2005; Goel & Dolan, 2003; de Neys & Franssens, 2009; de Neys, Vartanian, & Goel, 2008; Pessoa, Japee, Sturman, & Ungerleider, 2006). There is
57
no activation of these specific brain regions without conflict, i.e. if the conflicting stimuli are not perceived because they do not surpass the perception threshold. Baumeister and Masicampo (2010) have recently proposed that conscious thought influences behavior only indirectly. They suggest that emotions “serve to stimulate conscious reflection on past and future events” and serve as feedback to learn from past actions, as a bridge between subconscious (system 1) and conscious thought (system 2). For instance, negative emotions seem to stimulate counterfactual and detail-oriented thinking, and regret and guilt promote learning (Baumeister, Vohs, & Nathan DeWall, 2007).
In summary, the Dual Process Theory proposes that emotions signal a discrepancy between reality and the mental model. The emotion elicitation precedes conscious reflection, and may or may not lead to mental model demise. No emotion is elicited if the challenging stimuli are sub-threshold. The type of emotional response biases cognition. The Dual Process Theory therefore supports the proposition that emotions are a necessary condition for reflection, and that the probability of reflection is moderated by emotion type.
The functional nature of emotions
Emotions are considered by evolutionary psychologists to be functional in terms of our evolutionary, biological and/or social survival: they stimulate behavior that allows us to pass on our genes, to stay alive at least long enough to reproduce and care for our offspring, and to maintain social cohesion in support of our fitness and survival (Turner, 2000). Emotions enable a more flexible response to particular stimuli than reflexes or habits permit because they are goal-oriented rather than action-specific (Rolls, 2007). The elicitation of emotions costs energy and so from a purely biological point of view would appear to require clear benefits.
Most authors, starting with Charles Darwin (1872), at least agree that emotions were originally functional for the survival of the species. Frijda (2008) similarly agrees that “emotions are largely viewed as adaptively useful23, or at least have been in the evolutionary past.” Some emotions may now be “mere obsolete
23 In the meaning of “functional for survival”
58
remnants”, although “by and large, emotions and emotional actions are still generally adaptive in about the original sense”. Frijda goes on to state that other emotions like joy, excitement, curiosity and grief are functional in the non-adaptive sense (i.e. functional but not necessary for the individual’s survival). Oatley (2007) extends this label to most (if not all) emotions, stating that emotions are predominantly aimed at mediating social relationships and are deemed functional in the context of our interdependency with other human beings.
In contrast, other authors (e.g. Tooby & Cosmides, 2008) consider even these emotions “adaptive” from an evolutionary-psychological point of view, because they promote the reproduction of genes in the self, children and relatives (instead of just the survival of individuals). Those able to “read the intentions of others and engage their solicitude would be more likely to survive and prosper” (Hrdy, 2007). Emotions support “social survival” by helping to form and maintain social relationships and a social position relative to others (Fischer & Manstead, 2008). Even though all or at least most emotion types can be deemed functional from a biological perspective, this of course does not imply that in all specific instances emotions are useful or advantageous. This is dependent upon the specific circumstances and the emotion regulation that is embedded in this specific occurrence of the emotion (J. J. Gross, 2008).
A large discrepancy between reality and an existent mental model can be life-threatening. Therefore, an intervening effect of emotions on mental model preservation or demise can be considered functional in the biological sense.
Model of Intentional Dynamics
The model of “Intentional Dynamics” (depicted in Figure 5) explains how both error and surprise are inevitable as individuals struggle to keep pace with changes in a dynamic environment. The authors consider this model a first step to merge the theories of cognitive psychology with the practical concerns of human factors.
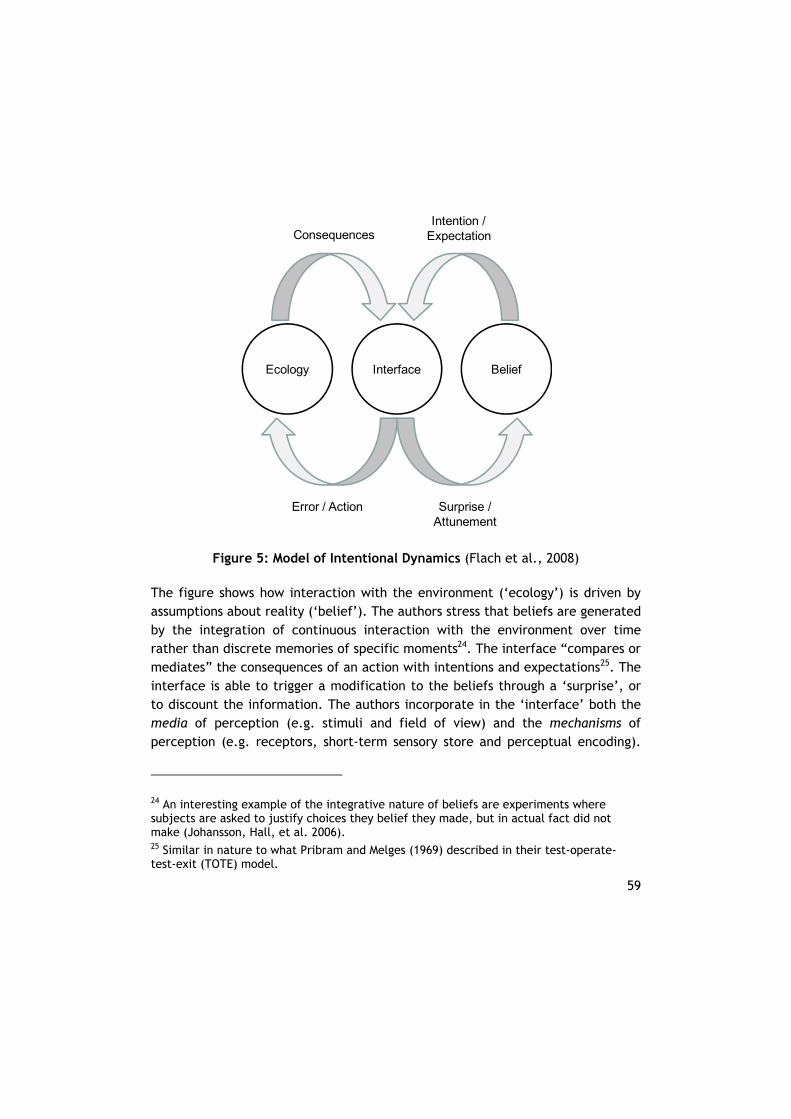
59
Figure 5: Model of Intentional Dynamics (Flach et al., 2008)
The figure shows how interaction with the environment (‘ecology’) is driven by assumptions about reality (‘belief’). The authors stress that beliefs are generated by the integration of continuous interaction with the environment over time rather than discrete memories of specific moments24. The interface “compares or mediates” the consequences of an action with intentions and expectations25. The interface is able to trigger a modification to the beliefs through a ‘surprise’, or to discount the information. The authors incorporate in the ‘interface’ both the media of perception (e.g. stimuli and field of view) and the mechanisms of perception (e.g. receptors, short-term sensory store and perceptual encoding).
24 An interesting example of the integrative nature of beliefs are experiments where subjects are asked to justify choices they belief they made, but in actual fact did not make (Johansson, Hall, et al. 2006). 25 Similar in nature to what Pribram and Melges (1969) described in their test-operate-test-exit (TOTE) model.
Ecology Interface Belief
Consequences
Error / Action Surprise / Attunement
Intention / Expectation
60
The Model of Intentional Dynamics suggests that mental models (beliefs) are maintained as long as there is no contradictory feedback from the environment (‘ecology’). On perception of ‘surprising’ feedback, current beliefs are reflected upon and may or may not be modified. No other types of emotions are mentioned. The Model of Intentional Dynamics therefore supports the proposition that emotions are a necessary condition for reflection.
The effect of emotion on decision making and problem solving
Isen (2008) reviews studies that have found that positive affect “leads people to be more flexible thinkers and decision makers […] thus [able] to respond effectively to complex or changing circumstances.” However, other studies referenced by the author present a different view, in that positive affect leads to more pronounced application of heuristics. The author explains the apparent contradiction by suggesting that “the influence of affect depends on […] this state in conjunction with several aspects of the situation that together influence the person’s motives or goals, judgments, expectations and choices.” Note that the author uses the terms “affect” and “emotion” interchangeably, and that this term designates a pre-existing condition in the individual rather than a state that is triggered by the contradictory stimulus.
Emotional response and emotion type as components of cognitive resistance
The distinction between an emotional response and an emotion type that was developed earlier in this section allows a better identification of the components of cognitive resistance. For each of the sources from Table 6 that support the proposition that emotion is a component of cognitive resistance it is investigated whether the term “emotion“ is used to denote an emotional response and/or an emotion type. The results are given in Table 7.
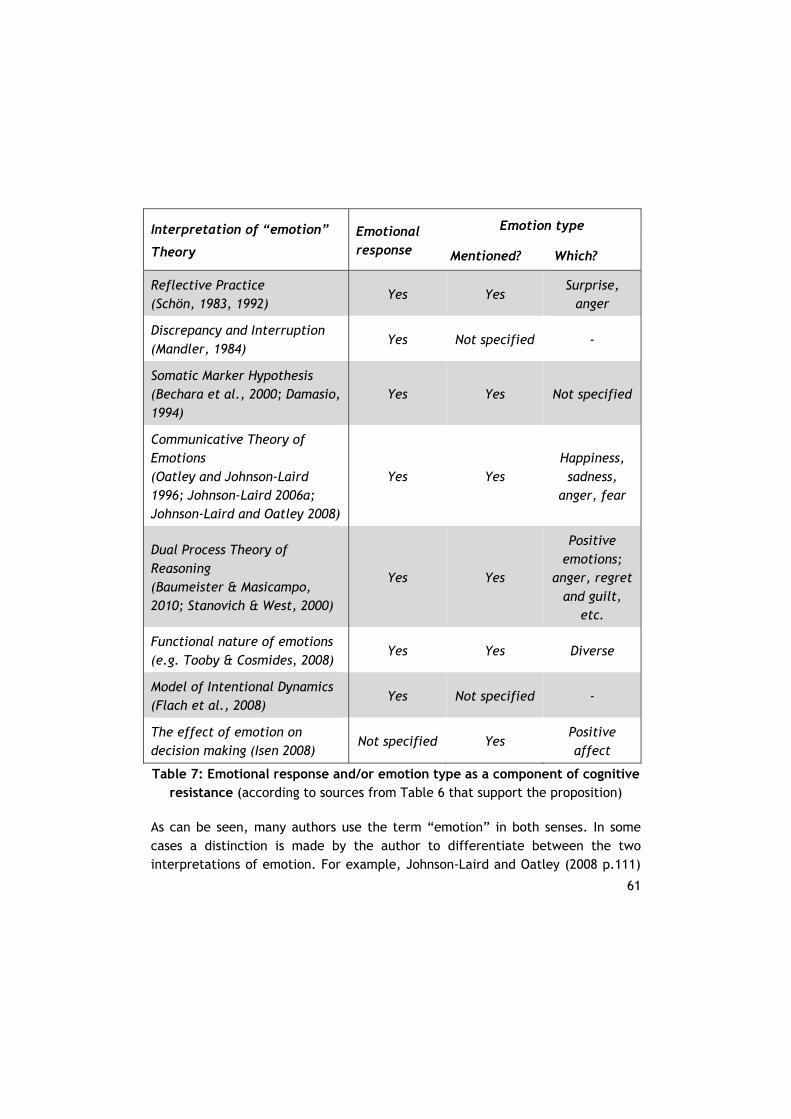
61
Interpretation of “emotion”
Theory
Emotional response
Emotion type
Mentioned? Which?
Reflective Practice (Schön, 1983, 1992)
Yes Yes Surprise,
anger
Discrepancy and Interruption (Mandler, 1984)
Yes Not specified -
Somatic Marker Hypothesis (Bechara et al., 2000; Damasio, 1994)
Yes Yes Not specified
Communicative Theory of Emotions (Oatley and Johnson-Laird 1996; Johnson-Laird 2006a; Johnson-Laird and Oatley 2008)
Yes Yes Happiness, sadness,
anger, fear
Dual Process Theory of Reasoning (Baumeister & Masicampo, 2010; Stanovich & West, 2000)
Yes Yes
Positive emotions;
anger, regret and guilt,
etc.
Functional nature of emotions (e.g. Tooby & Cosmides, 2008)
Yes Yes Diverse
Model of Intentional Dynamics (Flach et al., 2008)
Yes Not specified -
The effect of emotion on decision making (Isen 2008)
Not specified Yes Positive affect
Table 7: Emotional response and/or emotion type as a component of cognitive resistance (according to sources from Table 6 that support the proposition)
As can be seen, many authors use the term “emotion” in both senses. In some cases a distinction is made by the author to differentiate between the two interpretations of emotion. For example, Johnson-Laird and Oatley (2008 p.111)
62
use the term “nature” to identify the type of emotion and differentiate it from an emotional response. The table shows that the proposition that emotion types are expected to have an effect on cognitive resistance is supported by six different sources. A number of emotion types are mentioned by each author. However, the literature is not very specific about which effect of emotion types on cognitive resistance to expect. This will be addressed in chapter 654.
In this paragraph the literature has been reviewed with the purpose of identifying support for or opposition against the proposition that an emotional response and/or emotion type are components of cognitive resistance. On the basis of Table 7 it is proposed that:
Emotional response and emotion type are components of cognitive resistance.
This conclusion is supported by the sources listed in Table 6 and Table 7.
3.3. Conclusion
In this chapter the first research question is answered: What are the components of cognitive resistance? In this section of this chapter the conclusions regarding the components of cognitive resistance are presented based on a review of the literature. The research framework is revised and the next steps of this study are introduced.
Answer to the first research question
The first research question stated:
RQ1 What are the components of cognitive resistance?
In section 3.1 primary perception and stimulus matching have been identified as components of cognitive resistance. In section 3.2 emotional response and emotion type have been identified as components of cognitive resistance. Appraisals are a necessary condition for an emotional response and so are also identified as a component of cognitive resistance. As yet it has not been assessed
63
whether all these components are mutually exclusive and collectively exhaustive. This will be attempted below.
Primary perception and stimulus matching are defined so that they are mutually exclusive, yet directly consecutive. Primary perception starts with a contradictory stimulus that surpasses an individual’s perception threshold. Therefore no additional components of cognitive resistance precede primary perception. Stimulus matching precedes reflection; therefore no additional components of cognitive resistance follow stimulus matching.
Appraisal and emotional response are defined so that they are mutually exclusive, yet directly consecutive. According to Lewis (2005) the trigger for an emotional response is neural activation (i.e. through primary perception) “as long as it induces a self-amplifying interaction among appraisal and emotion elements.” Therefore an appraisal directly follows primary perception and is directly followed by an emotional response (if the trigger is sufficiently destabilizing). It is proposed that appraisal and stimulus matching are different processes because these occur in different brain areas, even if there but there are many interconnections. The limbic system is associated with appraisal and emotion, the cortex with conscious awareness (A. Wickens, 2009). Emotional response and emotion type are not mutually exclusive: a specific instance of an emotional response will be of a particular type, and a particular type of emotion is only exists as an emotional response.
In conclusion it is proposed that:
The components of cognitive resistance are primary perception, stimulus matching, appraisal and emotions (in the sense of an emotional response and
emotion type).
Revised research framework
Figure 3 (page 31) represents the initial research framework for this investigation. It shows how cognitive resistance is defined as the construct between contradictory stimuli and reflection. It illustrates that cognitive resistance is made up of components. In this section the components of cognitive
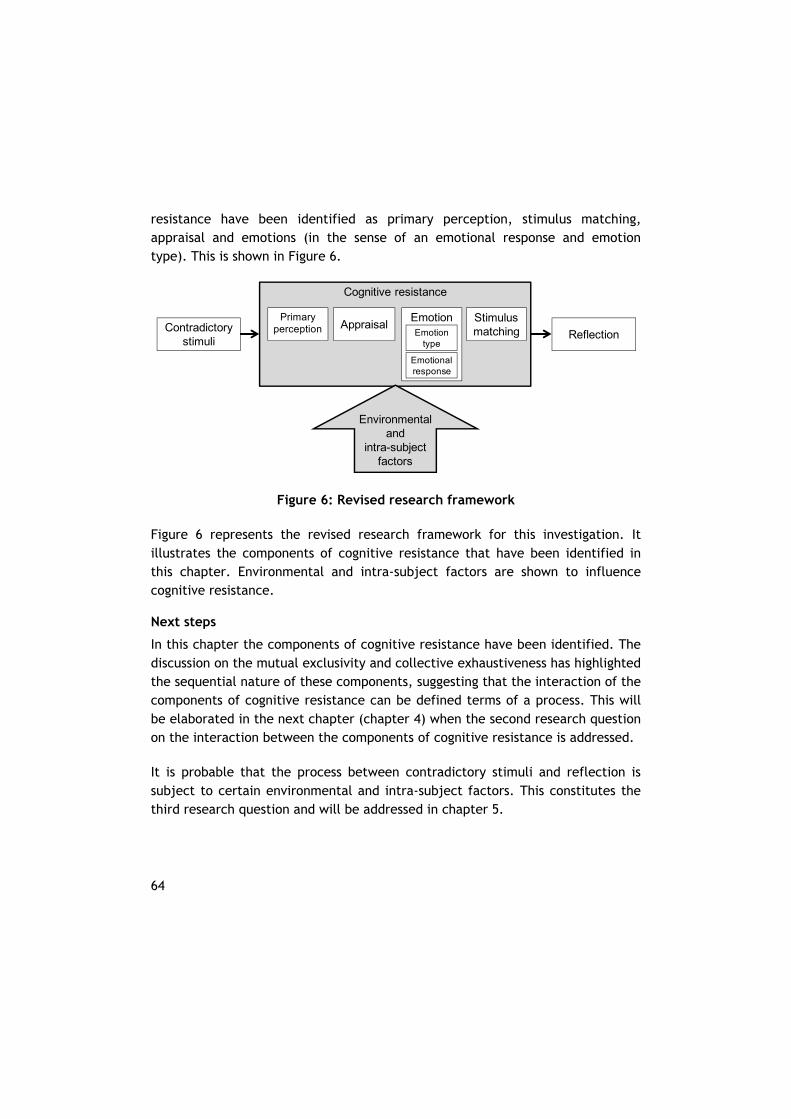
64
resistance have been identified as primary perception, stimulus matching, appraisal and emotions (in the sense of an emotional response and emotion type). This is shown in Figure 6.
Figure 6: Revised research framework
Figure 6 represents the revised research framework for this investigation. It illustrates the components of cognitive resistance that have been identified in this chapter. Environmental and intra-subject factors are shown to influence cognitive resistance.
Next steps
In this chapter the components of cognitive resistance have been identified. The discussion on the mutual exclusivity and collective exhaustiveness has highlighted the sequential nature of these components, suggesting that the interaction of the components of cognitive resistance can be defined terms of a process. This will be elaborated in the next chapter (chapter 4) when the second research question on the interaction between the components of cognitive resistance is addressed.
It is probable that the process between contradictory stimuli and reflection is subject to certain environmental and intra-subject factors. This constitutes the third research question and will be addressed in chapter 5.
Cognitive resistance
Primary perceptionContradictory
stimuli Reflection
Environmental and
intra-subject factors
EmotionEmotion
type
Emotionalresponse
Stimulus matching
Appraisal
65
4. Interaction between components
In the previous chapter the components of cognitive resistance have been identified as primary perception, stimulus matching, appraisal and emotions (in the sense of an emotional response and emotion type). In this chapter it is endeavored to answer the second research question: What is the interaction between components of cognitive resistance?
This chapter starts in section 4.1 with a schematic description of cognitive resistance, based on the discussion in the previous chapter that has highlighted the sequential nature of the components of cognitive resistance. The schematic depiction does not indicate how emotion type has an effect on cognitive resistance. To identify the mechanism of this effect, cognitive resistance is subsequently modeled dynamically using a reinforcement learning framework. This model requires an investigation of the rewards or penalties associated with different emotion types. In section 4.2 a taxonomy of emotion types that is appropriate for the current research is identified. This classification allows the selection of emotion types that are relevant for the current investigation. In the concluding section (4.3) the rewards or penalties associated with the selected emotion types are applied and the schematic depiction of cognitive resistance is elaborated with the results from the reinforcement learning framework. Predictions are derived for the interaction between the components of cognitive resistance.
4.1. Modeling cognitive resistance
In this section a schematic description of cognitive resistance is presented, based on the discussion in chapter 3 that has highlighted the sequential nature of the components of cognitive resistance. The schematic depiction does not indicate how emotion type has an effect on cognitive resistance, as has been identified in Table 7 (page 61). To identify the mechanism of this effect, cognitive resistance is subsequently modeled dynamically using a reinforcement learning framework. This model permits the analysis of the episodic nature of cognitive resistance. The effect of emotion type on cognitive resistance is modeled using value functions for future rewards, which are proposed to be dependent upon the
66
emotion types that are elicited in the course of cognitive resistance. Therefore a further investigation into emotion types is warranted, which will be presented in the section after this (section 4.2).
4.1.1. A schematic description of cognitive resistance In chapter 3 primary perception and stimulus matching have been defined so that they are directly consecutive. Primary perception starts with a contradictory stimulus that surpasses an individual’s perception threshold, leading to neural activation. The stimulus is then matched subconsciously, which can be either successful (and therefore lead to conscious perception, awareness of the discrepancy with reality, and reflection) or not (and therefore the mental model is preserved). An emotional response is triggered by the neural activation of primary perception if appraised as sufficiently destabilizing. Although an emotional response includes switching and focusing of attention, and sensitizes consciousness for relevant events (section 3.2), this does not imply that an emotional response always or directly leads to reflection on the assumptions underlying the existing mental model. Rather, the sensitivity of primary perception for (consecutive) contradictory stimuli is increased, for instance by involuntarily turning the ears or focusing the eyes.
The interaction of the components of cognitive resistance as described above is shown schematically in Figure 7.
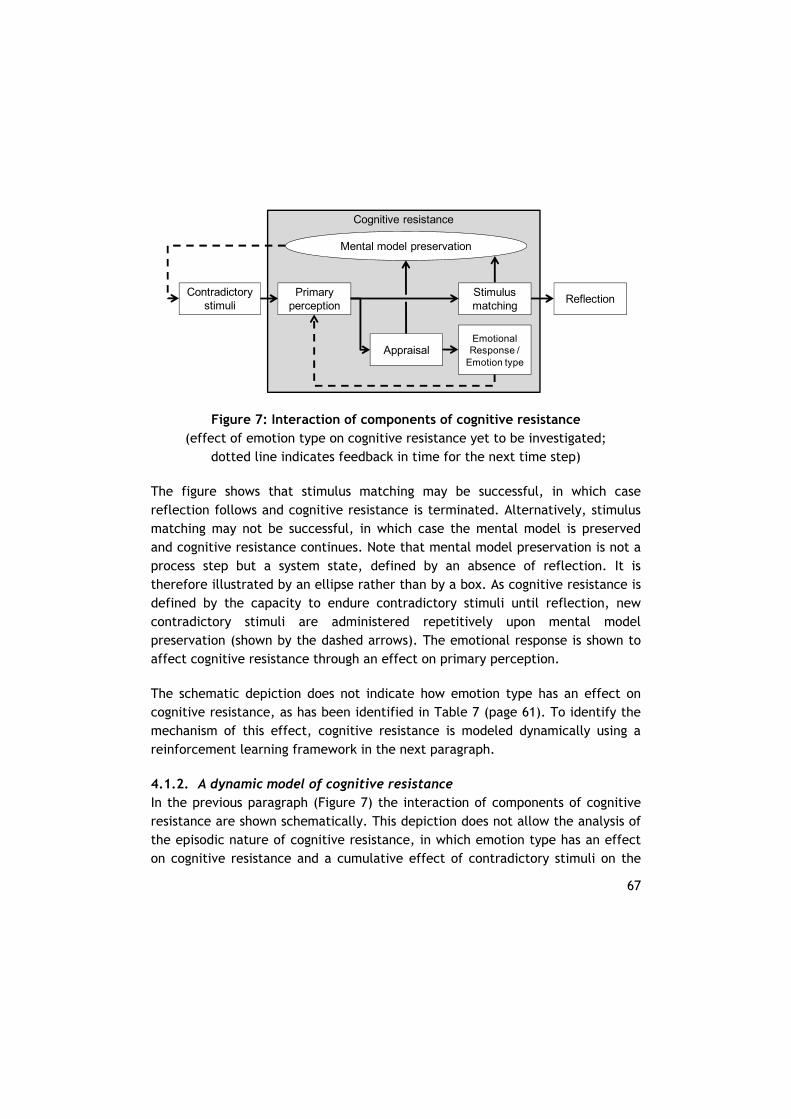
67
Figure 7: Interaction of components of cognitive resistance (effect of emotion type on cognitive resistance yet to be investigated;
dotted line indicates feedback in time for the next time step)
The figure shows that stimulus matching may be successful, in which case reflection follows and cognitive resistance is terminated. Alternatively, stimulus matching may not be successful, in which case the mental model is preserved and cognitive resistance continues. Note that mental model preservation is not a process step but a system state, defined by an absence of reflection. It is therefore illustrated by an ellipse rather than by a box. As cognitive resistance is defined by the capacity to endure contradictory stimuli until reflection, new contradictory stimuli are administered repetitively upon mental model preservation (shown by the dashed arrows). The emotional response is shown to affect cognitive resistance through an effect on primary perception.
The schematic depiction does not indicate how emotion type has an effect on cognitive resistance, as has been identified in Table 7 (page 61). To identify the mechanism of this effect, cognitive resistance is modeled dynamically using a reinforcement learning framework in the next paragraph.
4.1.2. A dynamic model of cognitive resistance In the previous paragraph (Figure 7) the interaction of components of cognitive resistance are shown schematically. This depiction does not allow the analysis of the episodic nature of cognitive resistance, in which emotion type has an effect on cognitive resistance and a cumulative effect of contradictory stimuli on the
Cognitive resistance
Primary perception
Contradictory stimuli
Emotional Response /
Emotion type
Mental model preservation
ReflectionStimulus matching
Appraisal
68
probability of reflection is assumed. This will be investigated using a reinforcement learning framework, as this is a broadly applicable tool to frame the problem of learning from interaction to achieve a goal (Sutton & Barto, 1998).
A reinforcement learning framework assumes a learner / decision-maker (called agent) that interacts with an environment (comprising everything outside the agent). The agent and environment interact continually, the agent selecting actions and the environment responding to those actions by presenting new situations (or system states) and giving rise to rewards. In reinforcement learning it is presumed that the actions of the agent are driven by its expectations of future rewards and the aim to maximize these. The real future returns are not initially known by the agent until it gains experience about the probabilities and rewards associated with state transitions through repetitive trials, and updates its expectations accordingly. The convergence between the real rewards and the agent’s estimation of the rewards constitutes ‘learning’ in the reinforcement learning framework (Sutton & Barto, 1998).
In the remainder of this paragraph, a reinforcement learning framework is developed for cognitive resistance. Subsequently, the real reward function and the agent’s estimation of the rewards are addressed. These results suggest how emotion type has an effect on cognitive resistance.
Reinforcement learning framework of cognitive resistance
In the context of cognitive resistance the agent is proposed to be the subconscious controller of the process step “stimulus matching”. This controller maintains an optimum balance (the goal) between ignoring irrelevant stimuli (thereby saving resources) and acting (i.e. reflecting) upon significant stimuli in the interest of survival. The agent is expected to adapt its behavior over time, depending on the perseverance of contradictory stimuli. The framework requires that the reward mechanism is external to the agent (Sutton & Barto, 1998 p.53). In the current case the subconscious controller that matches stimuli should be independent of the appraisal mechanism that triggers emotional responses. This is justified for the current context by the suggestion that these processes occur in separate brain areas: the limbic system for appraisal and emotional response and the cortex for stimuli matching (A. Wickens, 2009). The use of the
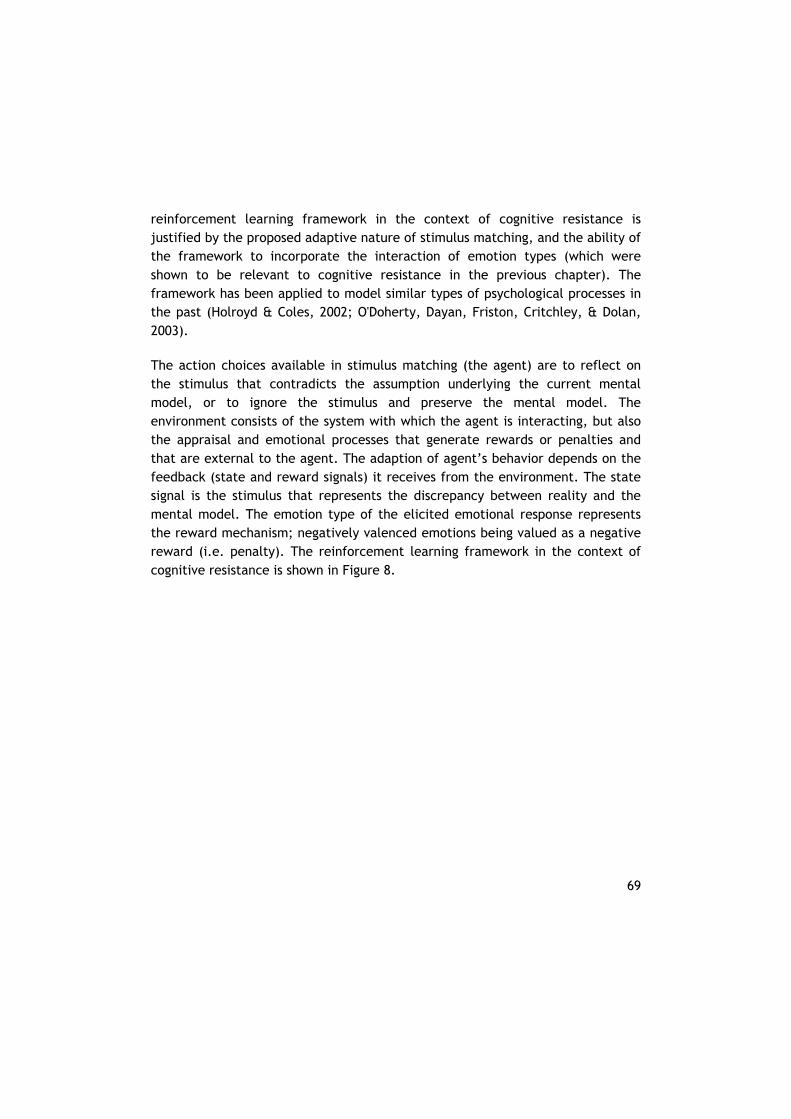
69
reinforcement learning framework in the context of cognitive resistance is justified by the proposed adaptive nature of stimulus matching, and the ability of the framework to incorporate the interaction of emotion types (which were shown to be relevant to cognitive resistance in the previous chapter). The framework has been applied to model similar types of psychological processes in the past (Holroyd & Coles, 2002; O'Doherty, Dayan, Friston, Critchley, & Dolan, 2003).
The action choices available in stimulus matching (the agent) are to reflect on the stimulus that contradicts the assumption underlying the current mental model, or to ignore the stimulus and preserve the mental model. The environment consists of the system with which the agent is interacting, but also the appraisal and emotional processes that generate rewards or penalties and that are external to the agent. The adaption of agent’s behavior depends on the feedback (state and reward signals) it receives from the environment. The state signal is the stimulus that represents the discrepancy between reality and the mental model. The emotion type of the elicited emotional response represents the reward mechanism; negatively valenced emotions being valued as a negative reward (i.e. penalty). The reinforcement learning framework in the context of cognitive resistance is shown in Figure 8.
70
Figure 8: Reinforcement learning framework for cognitive resistance
The agent is expected to behave so as to maximize its expected future rewards. A distinction needs to be made between the real returns that actually follow from the agent’s actions, and the agent’s estimation of the expected returns. First the real returns in the context of cognitive resistance are discussed. Thereafter the agent’s estimation of the expected return follows, and the effect on his behavior.
Real returns
The return for the agent depends on the actions he selects: either to reflect on the stimulus or to preserve the mental model at each time step26 that he encounters a contradictory stimulus. It is proposed that reflection results in a significant negative reward (i.e. a penalty) due to the additional burden on the mental processes. Additionally it is proposed that negatively valenced emotions constitute a negative reward and positively valenced emotions represent a positive reward. If the agent chooses to reflect, the episode is terminated. If the agent chooses to preserve the mental model, the episode continues, as cognitive
26 An analogous analysis is warranted in the context of continuous time.
(Environment)
rt+1
Neural activation(State st)
Mental model preservation or
reflection(Action at)
st+1
Stimulus matching(Agent)
Emotion type (Reward rt)
Contradictory stimuli
Appraisal & emotional response
Primary perception
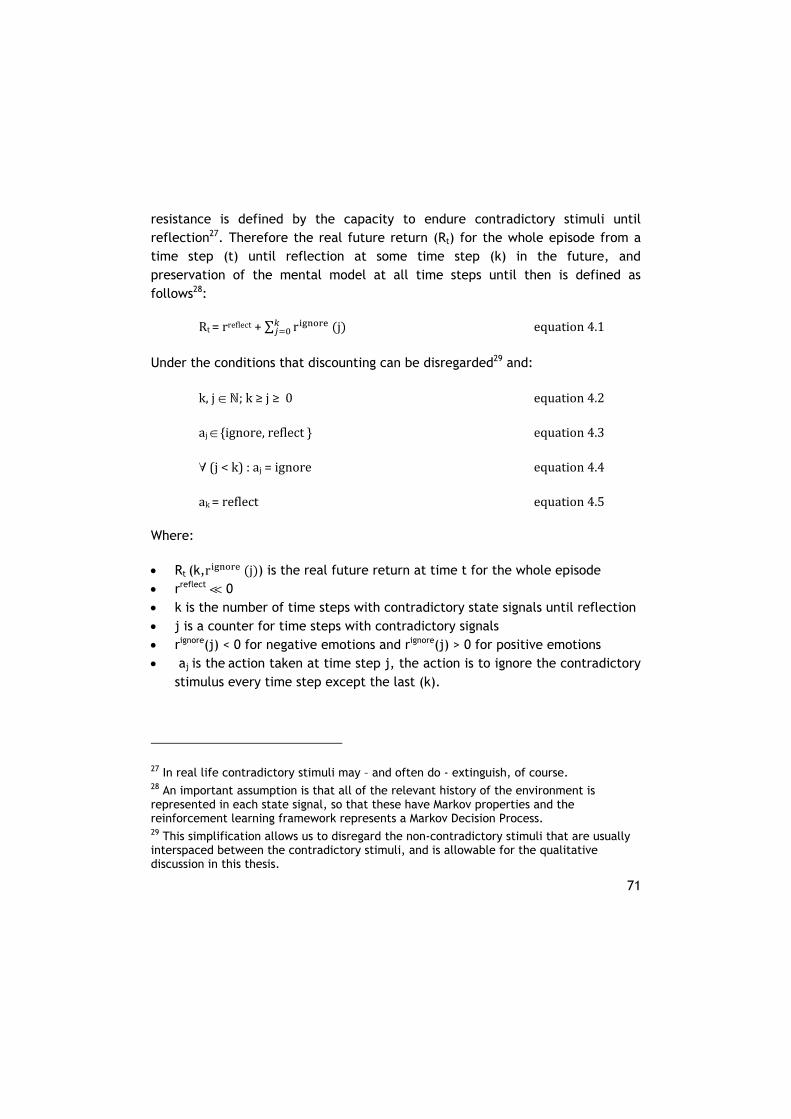
71
resistance is defined by the capacity to endure contradictory stimuli until reflection27. Therefore the real future return (Rt) for the whole episode from a time step (t) until reflection at some time step (k) in the future, and preservation of the mental model at all time steps until then is defined as follows28:
Rt=rreflect+∑ r j equation4.1
Under the conditions that discounting can be disregarded29 and:
k,jœ ;k≥j≥0 equation4.2
ajœ{ignore,reflect} equation4.3
"(j<k):aj=ignore equation4.4
ak=reflect equation4.5
Where:
Rt (k,r j ) is the real future return at time t for the whole episode rreflect á 0 k is the number of time steps with contradictory state signals until reflection j is a counter for time steps with contradictory signals rignore(j) < 0 for negative emotions and rignore(j) > 0 for positive emotions aj is the action taken at time step j, the action is to ignore the contradictory
stimulus every time step except the last (k).
27 In real life contradictory stimuli may – and often do - extinguish, of course. 28 An important assumption is that all of the relevant history of the environment is represented in each state signal, so that these have Markov properties and the reinforcement learning framework represents a Markov Decision Process. 29 This simplification allows us to disregard the non-contradictory stimuli that are usually interspaced between the contradictory stimuli, and is allowable for the qualitative discussion in this thesis.
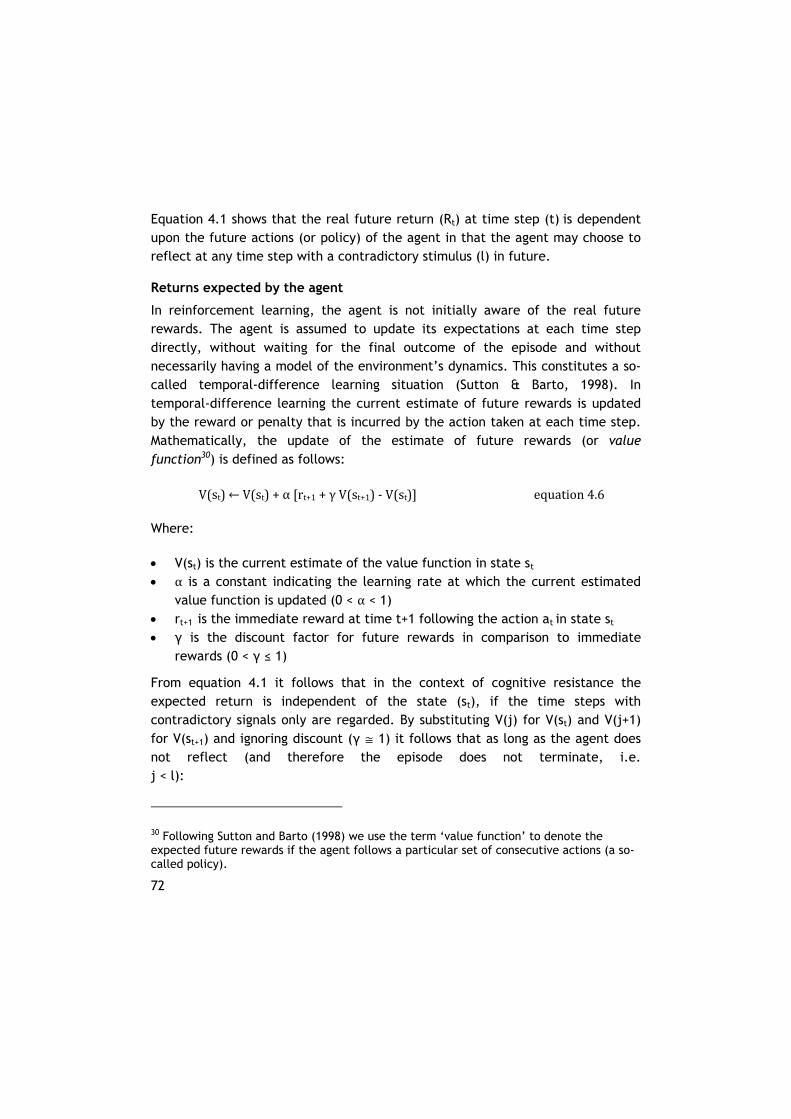
72
Equation 4.1 shows that the real future return (Rt) at time step (t) is dependent upon the future actions (or policy) of the agent in that the agent may choose to reflect at any time step with a contradictory stimulus (l) in future.
Returns expected by the agent
In reinforcement learning, the agent is not initially aware of the real future rewards. The agent is assumed to update its expectations at each time step directly, without waiting for the final outcome of the episode and without necessarily having a model of the environment’s dynamics. This constitutes a so-called temporal-difference learning situation (Sutton & Barto, 1998). In temporal-difference learning the current estimate of future rewards is updated by the reward or penalty that is incurred by the action taken at each time step. Mathematically, the update of the estimate of future rewards (or value function30) is defined as follows:
V(st)←V(st)+α[rt+1+γV(st+1)‐V(st)] equation4.6
Where:
V(st) is the current estimate of the value function in state st α is a constant indicating the learning rate at which the current estimated
value function is updated (0 < α < 1) rt+1 is the immediate reward at time t+1 following the action at in state st γ is the discount factor for future rewards in comparison to immediate
rewards (0 < γ ≤ 1)
From equation 4.1 it follows that in the context of cognitive resistance the expected return is independent of the state (st), if the time steps with contradictory signals only are regarded. By substituting V(j) for V(st) and V(j+1) for V(st+1) and ignoring discount (γ @ 1) it follows that as long as the agent does not reflect (and therefore the episode does not terminate, i.e. j < l):
30 Following Sutton and Barto (1998) we use the term ‘value function’ to denote the expected future rewards if the agent follows a particular set of consecutive actions (a so-called policy).
73
Vignore(j+1)=Vignore(j)+ .r j 1 equation4.7
"j:sj=contradictorystimulus equation4.8
The agent’s expected total return for each of his choice of actions (aj œ {ignore, reflect }) is therefore:
"j>0:Vignore(j)=Vignore(j‐1)+ .r j equation4.9
Vreflect(j)=r equation4.10
Where:
Va(j) is the current estimate of the value function for action a at time j; Vignore (0) is as yet undefined
j is a counter for time steps with contradictory signals only; j œ α is a constant indicating the learning rate at which the current estimated
value function is updated (0 < α < 1) r j is the immediate reward at time j following the action to ignore at
time j-1, varying with the time steps (j). r reflect is a significant negative constant reflecting the penalty of reflection
(rreflect á 0)
The agent is expected to choose a sequence of actions (a policy) that is greedy and therefore predominantly aims to maximize total return (Sutton & Barto, 1998):
Vignore(j)>Vreflect(j)aj=ignore equation4.11
Vignore(j)<Vreflect(j)aj=reflect equation4.12
The agent will choose to ignore the contradictory stimulus at j=0 (necessary for cognitive resistance to occur) under the condition that:
74
Vignore(0)>Vreflect(0)=r a0=ignore equation4.13
The agent knows by previous experience that reflection will result in a significant negative reward due to the additional burden on its mental processes (rreflect á 0). For equation 4.13 and equation 4.11 to be true, the agent may assume – based on previous experience - that the contradictory stimulus is temporary and will go away. As the contradictory stimuli persevere, the agent will update its expectancy for future rewards with the repetitive rewards and penalties that it is experiencing according to equation 4.9. As indicated above, negatively valenced emotions constitute a negative reward: rignore(j) < 0; positively valenced emotions represent a positive reward rignore(j) > 0. At some point the expected penalties for preservation may exceed the penalty for reflection (i.e. equation 4.12 is true), and the agent will choose reflection instead of preservation. The value of rignore(j) is proposed to depend on the emotion type that is elicited during cognitive resistance.
Summary
In this paragraph a dynamic model for cognitive resistance was developed using a reinforcement learning framework to allow the analysis of the episodic nature of cognitive resistance, in which emotion type has an effect on cognitive resistance and a cumulative effect of contradictory stimuli on the probability of reflection is assumed. The agent is proposed to be the subconscious controller of the process step “stimulus matching”. This controller maintains an optimum balance (the goal) between ignoring irrelevant stimuli (thereby saving resources) and acting (i.e. reflecting) upon significant stimuli in the interest of survival. The agent is expected to adapt its behavior over time, depending on the perseverance of contradictory stimuli. The return for the agent depends on the actions he selects. It is proposed that reflection results in a significant negative reward (i.e. a penalty) due to the additional burden on the mental processes. Negatively valenced emotions constitute a negative reward and positively valenced emotions represent a positive reward. The episode continues until the agent chooses to reflect.
The agent is expected to select preservation of the mental model on the basis of prior experience (reflecting on a mental model requires a lot of effort, contradictory stimuli may not persist). However, as the contradictory stimuli
75
persist, the expected returns are adjusted until the penalty for reflection is less than the expected penalty to preserve the mental model. According to equation 4.9 the value function for the action to ignore is updated at each contradictory signal by . r j . In other words, the speed of temporal-learning in the
context of cognitive resistance is largely defined by the learning rate α and the rewards or penalties rignore(j) relative to rreflect, which is proposed to depend on the emotion type that is elicited during cognitive resistance, as shown in Table 7 on page 61.
A further investigation into emotion types is warranted to identify the rewards or penalties associated with different emotion types. This is presented in the next section. The results are used to predict the agent’s behavior in section 4.3. We return to the learning rate α in chapter 5.
4.2. Emotion types
In section 3.2 it was determined from the literature that emotion types are a component of cognitive resistance. It is proposed (as shown in Table 7 on page 61) that different emotions types each have a distinct effect on cognitive resistance. This effect has been modeled dynamically using a reinforcement learning framework (section 4.1), which requires a further investigation to identify the rewards or penalties associated with different emotion types.
A challenge in the investigation of the rewards or penalties associated with different emotion types is the large number of possible emotions. For instance, Desmet (2002) initially listed 282 unambiguous emotions in a study to discover emotions that are relevant to product experience. Therefore this section starts with the identification of a taxonomy of emotion types that is appropriate for the current research. This classification allows the selection of emotion types that are relevant for the current investigation.
4.2.1. Taxonomy of emotion types In this paragraph a taxonomy of emotion types that is appropriate for the current research is identified, from which to select the emotion types that are relevant for the current investigation. A classification that is suitable for this research fulfills the following requirements:
76
The taxonomy should generate classes that are mutually exclusive and collectively exhaustive, so that the classification of emotions is unambiguous;
The taxonomy should enable identification and classification of the emotion type by an external observer, so that the effect of emotions on cognitive resistance can be experimentally described31;
The taxonomy should categorize emotional responses into classes which are assumed to share a similar intervening effect on cognitive resistance.
The available literature is explored to identify existing taxonomies of emotions, and determine whether these fulfill these requirements.
Three theories32 for taxonomies of emotion types have been listed by Frijda (2008): basic emotions, multi-componential view, and the hierarchical approach. Each of these will be discussed below, and then a classification suitable for this research is proposed.
Basic emotions
The theory of basic emotions proposes that “various components [of emotions] from solidly coherent packets, each based on a common neural and neurohumoral disposition” (Frijda, 2008). Taxonomies founded on basic emotions are rooted in an evolutionary tradition. Ekman pioneered the concept of basic emotions in the 1970’s (Lazarus, 2001), each based on a distinctive set of facial expressions (Griffiths, 2007). Idzard (2007) uses the term to refer to emotions that supposedly have “evolutionarily neurobiological substrates, as well as an evolved feeling component and capacity for expressive and other behavioral actions of evolutionary origin.” Her set of basic emotions consist of: interest, joy/happiness, sadness, anger, disgust, and fear. Similar sets have been derived on like grounds by Plutchnik (2001) and Panksepp (2008). Oatley, together with Johnson-Laird (Johnson-Laird, 2006a; Oatley & Johnson-Laird, 1996), suggests four basic free-floating33 emotions (happiness, sadness, anger and fear) and five
31 Self-reports (as utilized in some other studies) are considered to be unreliable for the current investigation because cognitive resistance is largely a subconscious process. 32 Frijda (2008) calls these “hypotheses” but we prefer the term “theory” in alignment with Dul and Hak (2008). 33 Object free, i.e. not targeted at any object
77
additional object-related basic emotions (attachment, parental love, sexual attraction, disgust and interpersonal rejection). Their taxonomy is based on an evolutionary analysis of inter-personal communication and builds on Johnson-Laird’s mental model theory of reasoning. No justification for basic emotions has yet been found on the basis of unique neurological constellations (Barrett & Wager, 2006).
In all these taxonomies mixed emotions (made up of the basic emotions) are possible. This makes it difficult to allocate the observed emotions into specific categories, and therefore these taxonomies are less suitable for the purpose of this research.
Multi-componential theory
The second theory posits that emotions are “bundles of component processes [that] fuzzily cover sub regions of the multi-componential space” (Frijda, 2008). The emotions are defined and identified by the appraisal that precedes the emotion elicitation (Scherer, 2005).
Scherer (2005) has suggested a classification that is based on similarity ratings of emotion terms as they were defined in a study on appraisal criteria. In fact other authors suggest that like emotion types (assessed in terms of expressive behavior and action tendency) are not always elicited by similar appraisal patterns (Frijda & Zeelenberg, 2001). Therefore this taxonomy does not predict a consistent intervening effect and may not be mutually exclusive and collectively exhaustive. In addition, appraisal processes are hidden from external observers and therefore this classification relies primarily on self-reports.
Ortony, Clore and Collins (1988) focus on the causing entities of emotions: events, actions of agents34 (self or other people, animals, objects and abstractions that one can blame35), and aspects of objects. Their basic classes of
34 Note that the use of “agent” in this section differs from that in the reinforcement learning framework. 35 In formal terms agents are “construed as causally efficacious”, i.e. understood to be the cause of some kind of consequence. Note that the use of “agent” in this section differs from that in the reinforcement learning framework.
78
emotions are pleased/displeased (response to events), approving/disapproving (response to agents), and liking/disliking (response to objects). Each of the basic classes is further broken down, e.g. focusing on other or on self etc. Steunebrink (2010) builds on this so-called OCC model36 to make it more logically formal, that is: mutually exclusive and collectively exhaustive. He has adapted the structure of the classification to account for the eliciting conditions of emotions which are visible to an external observer. A representation of the taxonomy is included in Appendix A: Formalized OCC Model.
Hierarchical theory
The hierarchical theory is similar to the multi-componential view except “components differ in their organizational power, […] some emotions are more central than others” (Frijda, 2008). According to the author this theory “fits the functional interpretation of different emotions” as suggested by Damasio (2003). Frijda (1986, 2007) proposes that the core of emotions are states of action readiness and that this organizes all other components. Action readiness implies the organism’s behavioral intent towards some desirable future state. Action readiness modes include approach, withdraw, oppose etc. Emotions can be mapped on these modes, for instance: happiness, fear, and anger map on approach, withdraw, and oppose respectively. There is not a one-on-one mapping, however; different emotions may share the same action tendency, and therefore this is not a classification that is mutually exclusive and collectively exhaustive.
A classification of emotion types
In this paragraph different taxonomies for emotion types have been presented from the literature, and compared with the requirements for this research. A taxonomy of emotion types that is adequate for this research generates classes that are mutually exclusive and collectively exhaustive, enables identification and classification of the emotion type by an external observer, and categorizes emotional responses into classes which are assumed to share a similar intervening effect on mental model preservation or demise.
36 After the initial letter of the family names of the authors
79
Of the taxonomies presented above, the Formalized OCC Model (Ortony et al., 1988; Steunebrink, 2010) best supports this research. The formal logic of this taxonomy generates classes that are mutually exclusive and collectively exhaustive, and the eliciting conditions that differentiate the emotion types can be monitored by an external observer. However, modifications to the Formalized OCC Model are required to make it suitable as a classification of emotion types for this research:
The original OCC model does not include non-valenced emotional responses such as surprise (the non-valenced response to consequences of an actual event which is unexpected), interest (the non-valenced response to consequences of an actual event) and anticipation (the non-valenced response to consequences of a prospective event). However, as discussed previously in section 3.2, these necessarily need to be included for the current investigation, despite the objections of the original authors (Ortony et al., 1988).
The formalized OCC model differentiates emotions according to the causing entities of emotions: events, actions of agents, and aspects of objects. Of these, events are relevant because stimuli contradicting an existing mental model can be typified as such. Actions of agents are equally relevant, because the person or system generating the stimulus can be blamed for the contradictory signal. The self can be held responsible for having established an incorrect mental model. Aspects of objects, however, are deemed less relevant to the current study and are therefore excluded.
Emotions relating to presumptions about consequences for others (gloating, pity etc.) are not relevant in this research, because the current investigation is focused on participants that are not interacting with other individuals.
The resulting categorization of emotions is depicted in Appendix B: Modified Classification of Emotions. This categorization is compliant with the requirements for this research regarding mutual exclusivity and collective exhaustion, identification and classification by an external observer, and classes which a priori do not challenge the assumption of a similar intervening effect. This classification therefore allows the selection of emotion types that are relevant for the current investigation.
80
4.2.2. Relevant emotion types The categorization of emotions derived in the previous paragraph and depicted in Appendix B: Modified Classification of Emotions is considered appropriate for the purpose of this research. However not all the emotion types defined in this taxonomy are relevant in the context of the current investigation in which stimuli that challenge the (assumptions underlying) the mental model, and are therefore eliminated.
Only actual stimuli are being considered in this research. To simplify matters, prospective events (leading to hope or fear) are not considered. The experimental design will need to reflect this.
Responses relating to the confirmation of prospective events are also excluded, on the grounds that the subjective reality represented by the mental model does not allow for prospective alternatives. There can only be one mental model for the current task.
The challenge to the mental model is relevant to the self only. Therefore the (un)desirability of the event for others is not included in this research.
A response to the actions of agents (if any) will be fused with the response caused by the stimulus itself (the event). Singular responses to the actions of agents (shame and reproach) are excluded as separate categories.
Positively valenced responses (joy, pride/gratification37 and gratitude38) are expected to be elicited infrequently when a mental model is challenged, and are therefore grouped together as joy.
As a consequence of this truncation 19 of the emotion types shown in Appendix B: Modified Classification of Emotions are disregarded. The five remaining emotion types are expected to be relevant in the challenge to mental models, and are shown in Table 8:
37 In response to action of self 38 In response to action of other
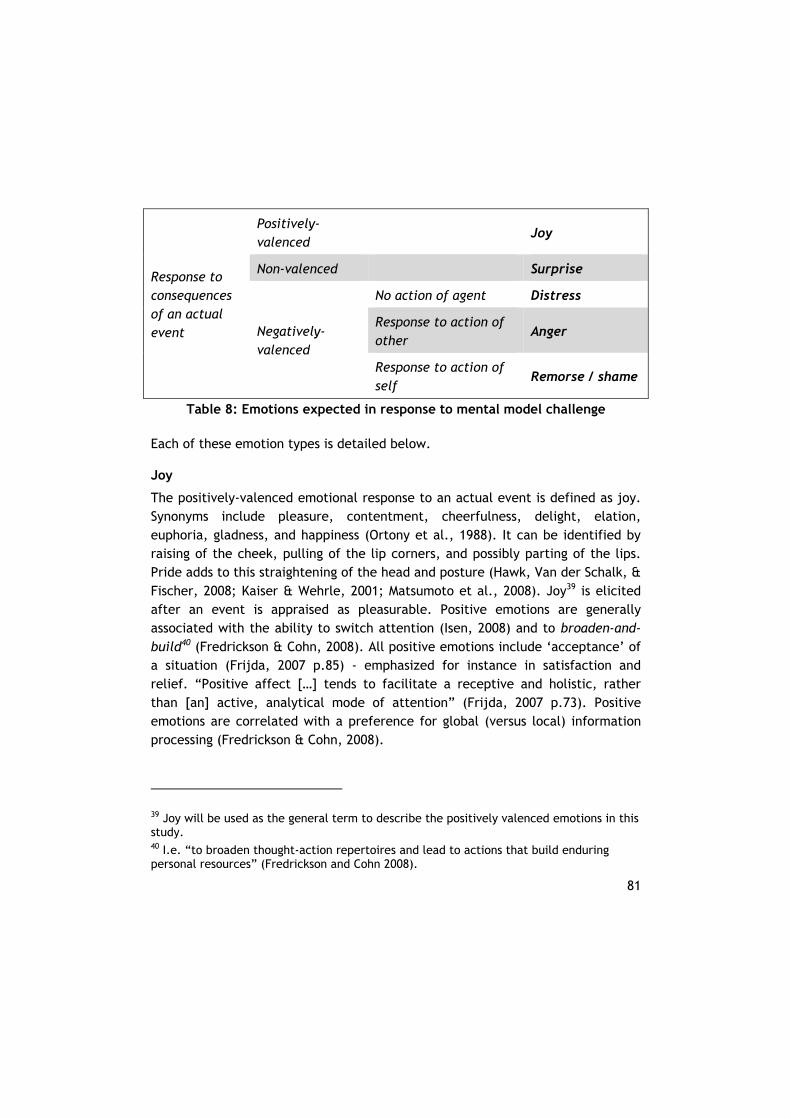
81
Response to consequences of an actual event
Positively-valenced
Joy
Non-valenced Surprise
Negatively-valenced
No action of agent Distress
Response to action of other
Anger
Response to action of self
Remorse / shame
Table 8: Emotions expected in response to mental model challenge
Each of these emotion types is detailed below.
Joy
The positively-valenced emotional response to an actual event is defined as joy. Synonyms include pleasure, contentment, cheerfulness, delight, elation, euphoria, gladness, and happiness (Ortony et al., 1988). It can be identified by raising of the cheek, pulling of the lip corners, and possibly parting of the lips. Pride adds to this straightening of the head and posture (Hawk, Van der Schalk, & Fischer, 2008; Kaiser & Wehrle, 2001; Matsumoto et al., 2008). Joy39 is elicited after an event is appraised as pleasurable. Positive emotions are generally associated with the ability to switch attention (Isen, 2008) and to broaden-and-build40 (Fredrickson & Cohn, 2008). All positive emotions include ‘acceptance’ of a situation (Frijda, 2007 p.85) - emphasized for instance in satisfaction and relief. “Positive affect […] tends to facilitate a receptive and holistic, rather than [an] active, analytical mode of attention” (Frijda, 2007 p.73). Positive emotions are correlated with a preference for global (versus local) information processing (Fredrickson & Cohn, 2008).
39 Joy will be used as the general term to describe the positively valenced emotions in this study. 40 I.e. “to broaden thought-action repertoires and lead to actions that build enduring personal resources” (Fredrickson and Cohn 2008).
82
Surprise
The non-valenced emotional response to an unexpected actual event is defined as surprise. It includes attentional activity, novelty and unexpectedness. It can be identified by a raise of the inner and outer eyebrow, raising of the eyelids and a parting of the lips; and possibly hissing, blowing and expressiveness of the hands. (Hawk et al., 2008; Kaiser & Wehrle, 2001; Ludden, Schifferstein, & Hekkert, 2009; Matsumoto et al., 2008). Surprise is elicited after a violation of expectancy (Lewis, 2008b). It is associated with a tendency to attend to the cause of the surprise, bringing the event into consciousness, as described in much of the design literature.
Distress
Distress is defined as negative affect about an undesirable event. Synonyms include depressed, distressed, displeased, dissatisfied, distraught, feeling bad, feeling uncomfortable, grief, regret, sad, unhappy, etc. (Ortony et al., 1988). The associated facial expression includes lowering of the eyebrows and closing of the eyelids; possibly followed by raising of the inner eyebrow, depression of the corners of the lips, drooping of the eyelids and downwards movement of the eyes (Hawk et al., 2008; Kaiser & Wehrle, 2001; Matsumoto et al., 2008). Distress (or sadness) is not directed at an agent, but is a response to an event (Ortony et al., 1988).
Anger
Anger is a negatively-valenced compound response to a consequence of an actual event and the attribution of its cause to the action of an other agent. Synonyms include annoyance, exasperation, fury, indignation, irritation, offended, etc. (Ortony et al., 1988). Anger’s adaptive function is to oppose, overcome and master obstacles (Lemerise & Dodge, 2008). It is shown by lowering of the eyebrows, rising of the chin, eyelids and/ or nostrils, and tightening of the lips (Hawk et al., 2008; Kaiser & Wehrle, 2001; Matsumoto et al., 2008). Anger is aimed at repelling the other agent (Lemerise & Dodge, 2008).
Remorse
Remorse is the negatively-valenced compound response to a consequence of an actual event and the attribution of its cause to the action of self. It is a mixed emotion of shame and distress. Synonyms include penitent, self-anger,
83
embarrassment etc. (Ortony et al., 1988). It is shown by pulling of the lip corners and dimples in the cheeks, collapsing or turning away of the body, lowering or hiding of the head, touching hair or head, and a lack of motion in eyes (Hawk et al., 2008; Lewis, Alessandri, & Sullivan, 1992). There may be blushing visible, but also (possibly vain) attempts at avoiding the appearance of shame or embarrassment by restless movements, banter and laughter (Darwin, 1872; Hahn, 2008). Remorse is focused on blaming oneself, trying to undo the situation, and even wishing to disappear (Lewis, 2008a).
Summary
Previously it was determined that emotion types are a component of cognitive resistance, and that different emotions types each have a distinct effect on cognitive resistance. A taxonomy of emotion types that is appropriate for the current research was also identified. In this paragraph the emotion types that are relevant for the current investigation have been selected. These are joy, surprise, distress, anger and remorse/shame. From the descriptions of these emotions given above it follows that:
Joy is positively valenced, therefore associated with a (positive) reward; Distress is generally moderately negatively valenced and therefore associated
with a moderate penalty; Anger is generally strongly negatively valenced and associated with a high
penalty; Remorse is also strongly negatively valenced and associated with a high
penalty; and Surprise is not associated with a penalty or reward but with a tendency to
attend to the cause, bringing the event into consciousness.
If no emotion is elicited then the associated reward or penalty is close to zero, and there is limited tendency to attend to the cause.
4.3. Conclusion
In this chapter the second research question is answered: What is the interaction between components of cognitive resistance? In this section of this chapter conclusions are drawn regarding the interaction of components of cognitive
84
resistance based on a review of the literature, and the next steps of this study are identified.
Answer to the second research question
The second research question stated:
RQ2 What is the interaction between components of cognitive resistance?
In section 4.1 a schematic description of cognitive resistance is presented, based on the discussion in chapter 3 that has highlighted the sequential nature of the components of cognitive resistance. The schematic depiction does not indicate how emotion type has an effect on cognitive resistance. To identify the mechanism of this effect, cognitive resistance has subsequently been modeled dynamically using a reinforcement learning framework. This model requires an investigation of the rewards or penalties associated with different emotion types. In section 4.2 a taxonomy of emotion types that is appropriate for the current research has been identified. This classification allows the selection of emotion types that are relevant for the current investigation: joy, surprise, distress, anger and remorse/shame. In this section the rewards or penalties associated with the selected emotion types are applied, and the schematic depiction of cognitive resistance is elaborated with the results from the reinforcement learning framework. Predictions are derived for the interaction between the components of cognitive resistance.
The schematic description of cognitive resistance shown in Figure 7 on page 67 does not indicate how emotion type has an effect on cognitive resistance, as has been identified in Table 7 (page 61). Based on the mechanism of this effect as modeled in the reinforcement learning framework, cognitive resistance can now be depicted schematically as shown below:
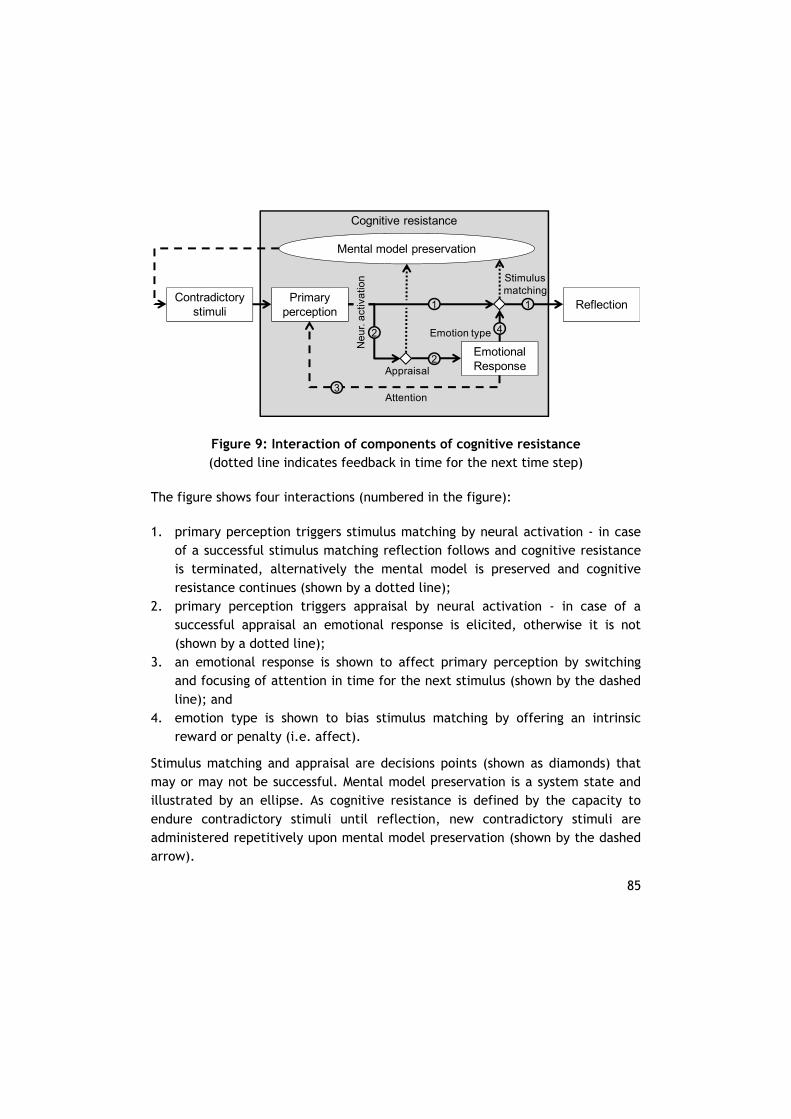
85
Figure 9: Interaction of components of cognitive resistance (dotted line indicates feedback in time for the next time step)
The figure shows four interactions (numbered in the figure):
1. primary perception triggers stimulus matching by neural activation - in case of a successful stimulus matching reflection follows and cognitive resistance is terminated, alternatively the mental model is preserved and cognitive resistance continues (shown by a dotted line);
2. primary perception triggers appraisal by neural activation - in case of a successful appraisal an emotional response is elicited, otherwise it is not (shown by a dotted line);
3. an emotional response is shown to affect primary perception by switching and focusing of attention in time for the next stimulus (shown by the dashed line); and
4. emotion type is shown to bias stimulus matching by offering an intrinsic reward or penalty (i.e. affect).
Stimulus matching and appraisal are decisions points (shown as diamonds) that may or may not be successful. Mental model preservation is a system state and illustrated by an ellipse. As cognitive resistance is defined by the capacity to endure contradictory stimuli until reflection, new contradictory stimuli are administered repetitively upon mental model preservation (shown by the dashed arrow).
Cognitive resistance
Primary perception
Contradictory stimuli
Emotional Response
Mental model preservation
Reflection
Emotion type
Stimulus matching
AppraisalN
eu
r. a
ctiv
atio
n
Attention
1 1
2
2
3
4
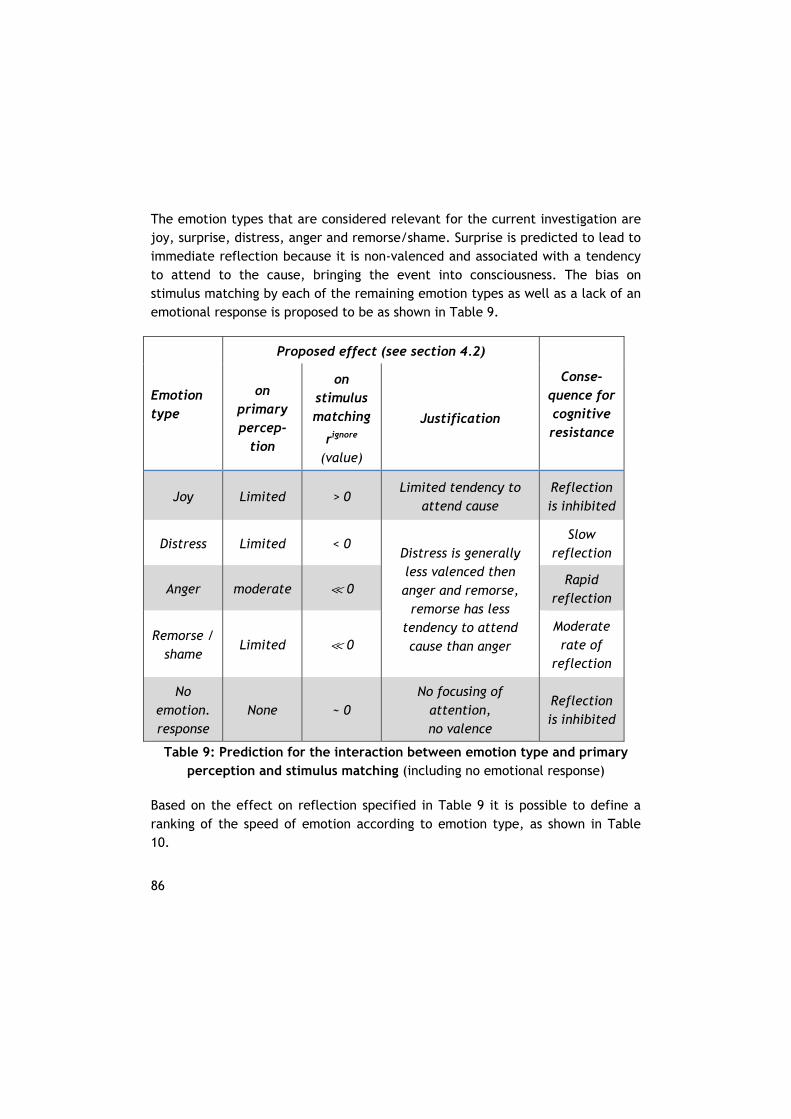
86
The emotion types that are considered relevant for the current investigation are joy, surprise, distress, anger and remorse/shame. Surprise is predicted to lead to immediate reflection because it is non-valenced and associated with a tendency to attend to the cause, bringing the event into consciousness. The bias on stimulus matching by each of the remaining emotion types as well as a lack of an emotional response is proposed to be as shown in Table 9.
Emotion type
Proposed effect (see section 4.2)
Conse-quence for cognitive resistance
on primary percep-
tion
on stimulus matching
rignore (value)
Justification
Joy Limited > 0 Limited tendency to
attend cause Reflection is inhibited
Distress Limited < 0 Distress is generally less valenced then anger and remorse,
remorse has less tendency to attend cause than anger
Slow reflection
Anger moderate á 0 Rapid
reflection
Remorse / shame
Limited á 0 Moderate rate of
reflection
No emotion. response
None ~ 0 No focusing of
attention, no valence
Reflection is inhibited
Table 9: Prediction for the interaction between emotion type and primary perception and stimulus matching (including no emotional response)
Based on the effect on reflection specified in Table 9 it is possible to define a ranking of the speed of emotion according to emotion type, as shown in Table 10.
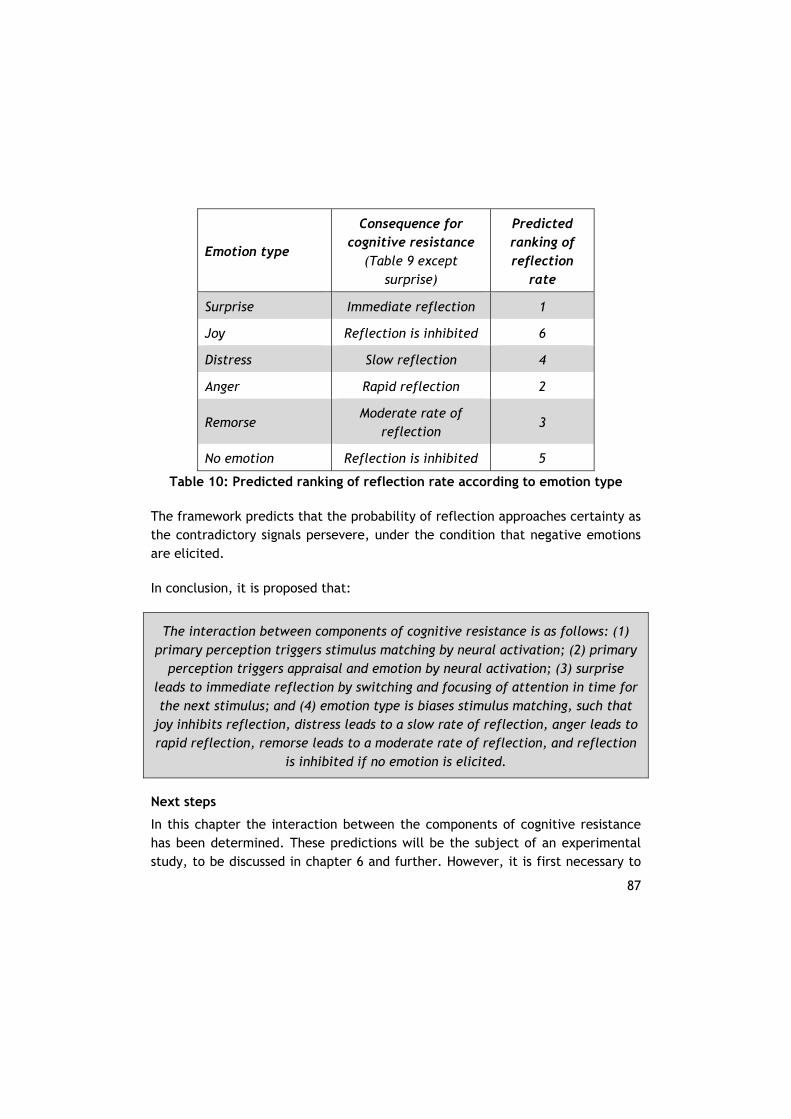
87
Emotion type
Consequence for cognitive resistance
(Table 9 except surprise)
Predicted ranking of reflection
rate
Surprise Immediate reflection 1
Joy Reflection is inhibited 6
Distress Slow reflection 4
Anger Rapid reflection 2
Remorse Moderate rate of
reflection 3
No emotion Reflection is inhibited 5
Table 10: Predicted ranking of reflection rate according to emotion type
The framework predicts that the probability of reflection approaches certainty as the contradictory signals persevere, under the condition that negative emotions are elicited.
In conclusion, it is proposed that:
The interaction between components of cognitive resistance is as follows: (1) primary perception triggers stimulus matching by neural activation; (2) primary
perception triggers appraisal and emotion by neural activation; (3) surprise leads to immediate reflection by switching and focusing of attention in time for the next stimulus; and (4) emotion type is biases stimulus matching, such that
joy inhibits reflection, distress leads to a slow rate of reflection, anger leads to rapid reflection, remorse leads to a moderate rate of reflection, and reflection
is inhibited if no emotion is elicited.
Next steps
In this chapter the interaction between the components of cognitive resistance has been determined. These predictions will be the subject of an experimental study, to be discussed in chapter 6 and further. However, it is first necessary to

88
identify the environmental and intra-subject factors that influence cognitive resistance, because this makes it possible to reduce their confounding effect in the experimental study. The identification of environmental and intra-subject factors that influence cognitive resistance also improves the understanding of cognitive resistance. These will be addressed in the next chapter 5.
89
5. Factors influencing cognitive resistance
In the previous chapters of this dissertation the components of cognitive resistance (chapter 3) were identified, and the interaction between components of cognitive resistance (chapter 4) was defined. As shown in the revised research framework (Figure 6 on page 64), environmental and intra-subject factors are assumed to influence cognitive resistance. In this chapter it is endeavored to answer the third research question: What environmental and intra-subject factors influence cognitive resistance? The identification of these factors serves two purposes:
it makes it possible to reduce the confounding effect of these environmental and intra-subject factors in the experimental study; and
it contributes to the knowledge of cognitive resistance.
Starting point for this chapter is a review of the literature with the purpose of identifying environmental and intra-subject factors that influence cognitive resistance (section 5.1). Some of these factors do not actually influence cognitive resistance, but occur together with cognitive resistance whenever reflection is delayed. These so-called symptoms are addressed in section 5.2. The remaining factors can be sorted into groups according to the means of manipulation (section 5.3). In the last section of this chapter conclusions are drawn regarding the influence of environmental and intra-subject factors on cognitive resistance and the research question is answered.
5.1. Identification of factors from the literature
Cognitive resistance is expected to vary from situation to situation and from individual to individual. Neither Johnson–Laird (1983, 2006a) nor Schön (1983) is explicit about the environmental and intra-subject factors that influence cognitive resistance. A search is therefore initiated in the theory for these factors. These are presented in Table 11 from the sources listed in Table 3 on page 25.
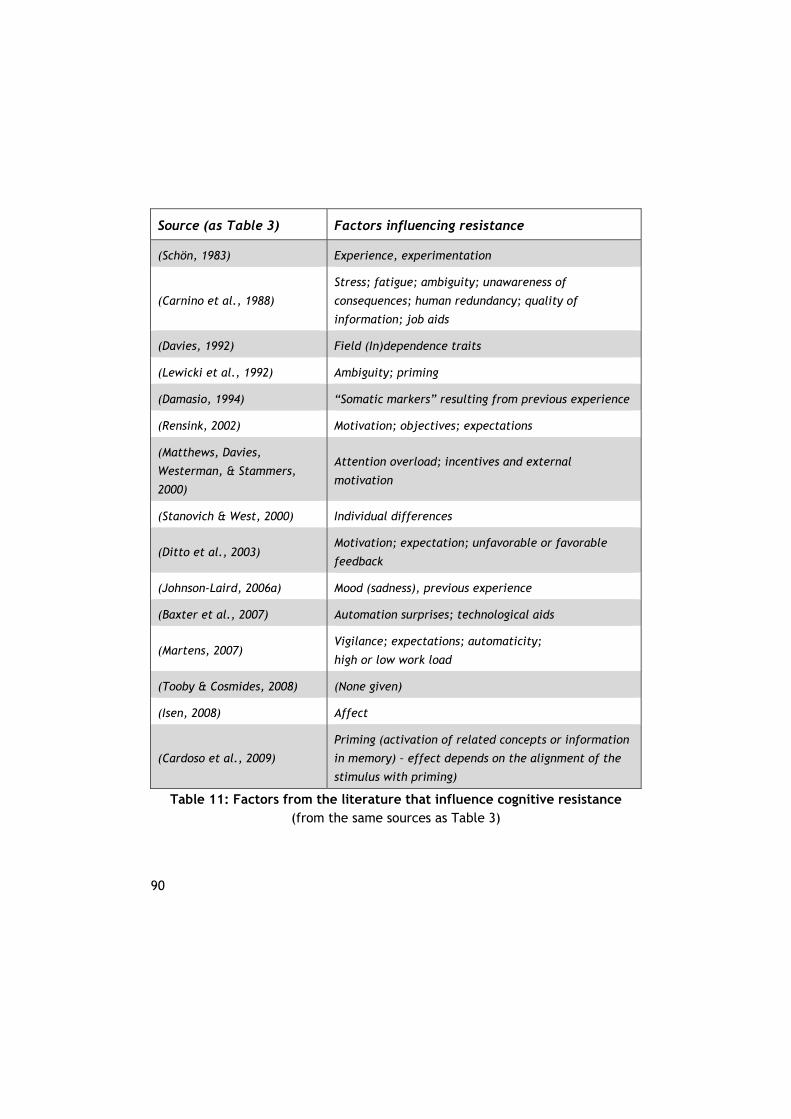
90
Source (as Table 3) Factors influencing resistance
(Schön, 1983) Experience, experimentation
(Carnino et al., 1988)
Stress; fatigue; ambiguity; unawareness of
consequences; human redundancy; quality of
information; job aids
(Davies, 1992) Field (In)dependence traits
(Lewicki et al., 1992) Ambiguity; priming
(Damasio, 1994) “Somatic markers” resulting from previous experience
(Rensink, 2002) Motivation; objectives; expectations
(Matthews, Davies,
Westerman, & Stammers,
2000)
Attention overload; incentives and external
motivation
(Stanovich & West, 2000) Individual differences
(Ditto et al., 2003) Motivation; expectation; unfavorable or favorable
feedback
(Johnson-Laird, 2006a) Mood (sadness), previous experience
(Baxter et al., 2007) Automation surprises; technological aids
(Martens, 2007) Vigilance; expectations; automaticity;
high or low work load
(Tooby & Cosmides, 2008) (None given)
(Isen, 2008) Affect
(Cardoso et al., 2009)
Priming (activation of related concepts or information
in memory) – effect depends on the alignment of the
stimulus with priming)
Table 11: Factors from the literature that influence cognitive resistance (from the same sources as Table 3)
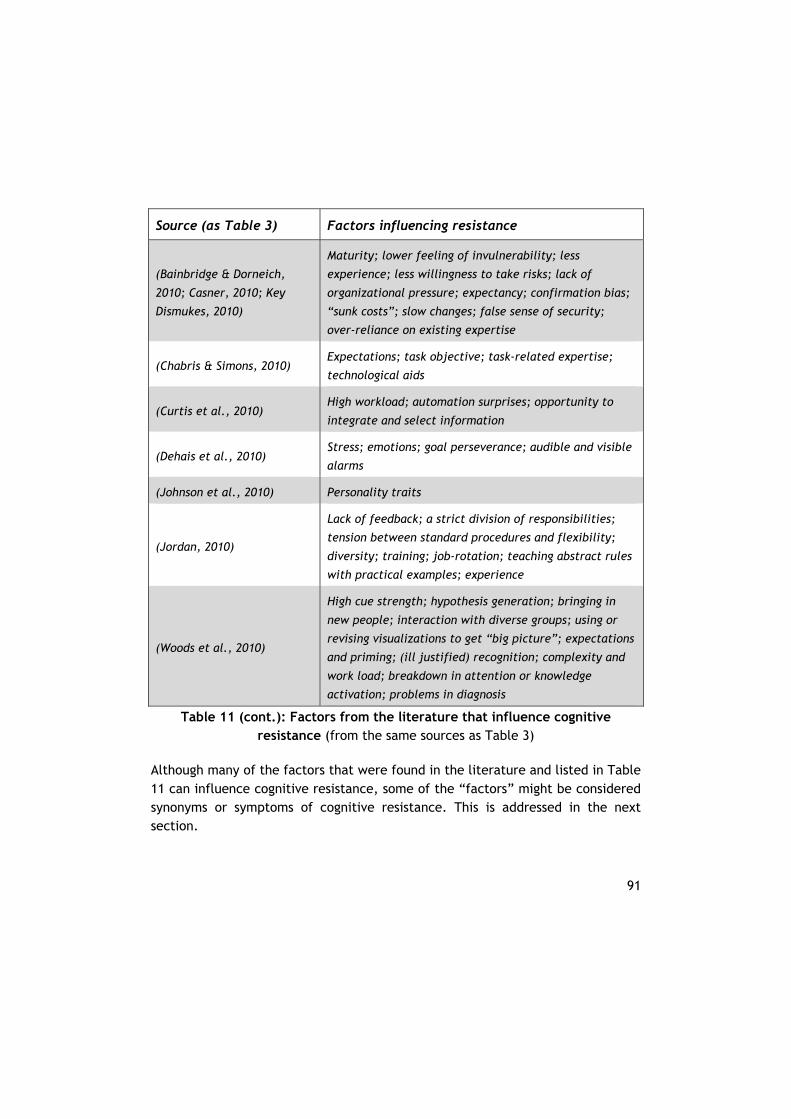
91
Source (as Table 3) Factors influencing resistance
(Bainbridge & Dorneich,
2010; Casner, 2010; Key
Dismukes, 2010)
Maturity; lower feeling of invulnerability; less
experience; less willingness to take risks; lack of
organizational pressure; expectancy; confirmation bias;
“sunk costs”; slow changes; false sense of security;
over-reliance on existing expertise
(Chabris & Simons, 2010) Expectations; task objective; task-related expertise;
technological aids
(Curtis et al., 2010) High workload; automation surprises; opportunity to
integrate and select information
(Dehais et al., 2010) Stress; emotions; goal perseverance; audible and visible
alarms
(Johnson et al., 2010) Personality traits
(Jordan, 2010)
Lack of feedback; a strict division of responsibilities;
tension between standard procedures and flexibility;
diversity; training; job-rotation; teaching abstract rules
with practical examples; experience
(Woods et al., 2010)
High cue strength; hypothesis generation; bringing in
new people; interaction with diverse groups; using or
revising visualizations to get “big picture”; expectations
and priming; (ill justified) recognition; complexity and
work load; breakdown in attention or knowledge
activation; problems in diagnosis
Table 11 (cont.): Factors from the literature that influence cognitive resistance (from the same sources as Table 3)
Although many of the factors that were found in the literature and listed in Table 11 can influence cognitive resistance, some of the “factors” might be considered synonyms or symptoms of cognitive resistance. This is addressed in the next section.
92
5.2. Symptoms of cognitive resistance
Table 11 shows a number of “factors” that were found in the literature that are considered synonyms or symptoms of cognitive resistance. A person’s thoughts, behavior and actions will continue to be guided by the existing mental model during the time between the first contradictory stimulus and reflection, even though the mental model diverges from reality. These symptoms occur together with cognitive resistance whenever reflection is delayed, and are not existent before the discrepancy between reality and the existing mental model is evident (i.e. only after onset of the contradictory stimuli). Therefore it is proposed that:
The “symptoms of cognitive resistance” describe the ongoing behavior that is guided by the existing mental model and are existent only after onset of the contradictory stimuli, and are therefore encompassed in the term cognitive
resistance.
The factors extracted from Table 11 that are considered symptoms of cognitive resistance are shown in Table 12.
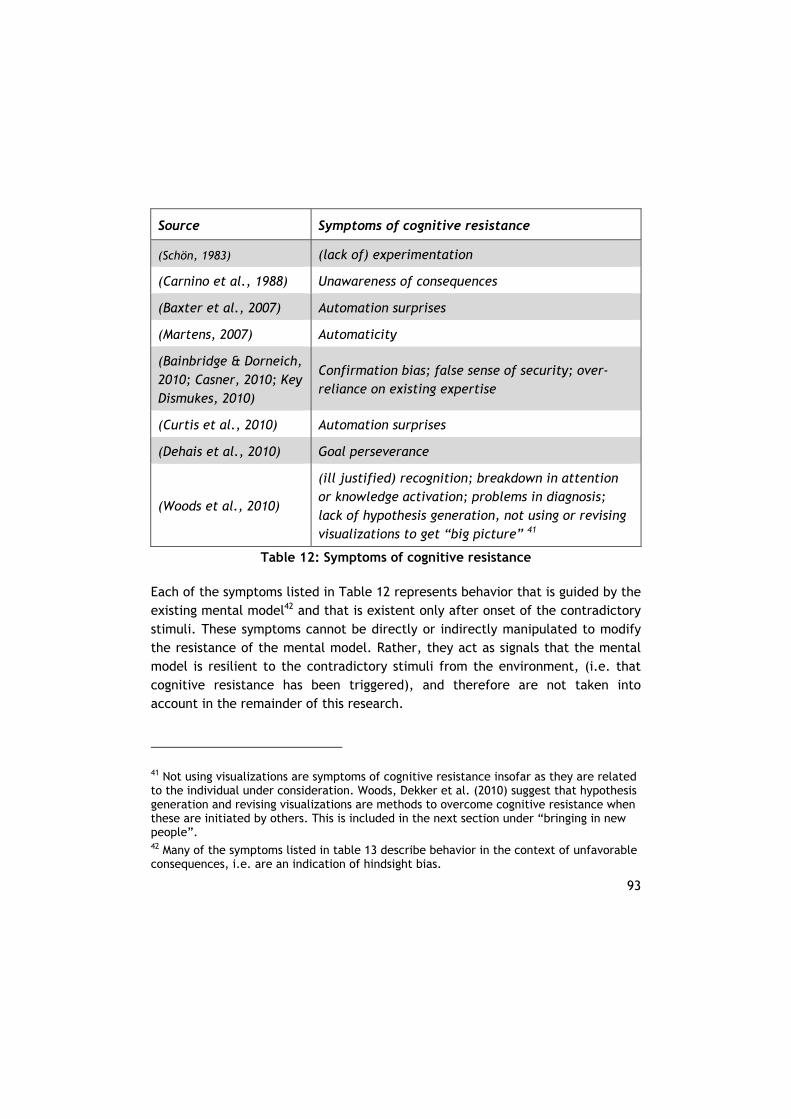
93
Source Symptoms of cognitive resistance
(Schön, 1983) (lack of) experimentation
(Carnino et al., 1988) Unawareness of consequences
(Baxter et al., 2007) Automation surprises
(Martens, 2007) Automaticity
(Bainbridge & Dorneich, 2010; Casner, 2010; Key Dismukes, 2010)
Confirmation bias; false sense of security; over-reliance on existing expertise
(Curtis et al., 2010) Automation surprises
(Dehais et al., 2010) Goal perseverance
(Woods et al., 2010)
(ill justified) recognition; breakdown in attention or knowledge activation; problems in diagnosis; lack of hypothesis generation, not using or revising visualizations to get “big picture” 41
Table 12: Symptoms of cognitive resistance
Each of the symptoms listed in Table 12 represents behavior that is guided by the existing mental model42 and that is existent only after onset of the contradictory stimuli. These symptoms cannot be directly or indirectly manipulated to modify the resistance of the mental model. Rather, they act as signals that the mental model is resilient to the contradictory stimuli from the environment, (i.e. that cognitive resistance has been triggered), and therefore are not taken into account in the remainder of this research.
41 Not using visualizations are symptoms of cognitive resistance insofar as they are related to the individual under consideration. Woods, Dekker et al. (2010) suggest that hypothesis generation and revising visualizations are methods to overcome cognitive resistance when these are initiated by others. This is included in the next section under “bringing in new people”. 42 Many of the symptoms listed in table 13 describe behavior in the context of unfavorable consequences, i.e. are an indication of hindsight bias.
94
A special case of cognitive resistance is an automation surprise. Automation surprises are defined as “those cases where the automation does something without immediately preceding crew input related to the automation’s action, and in which that automation action is inconsistent with crew expectations” (Dekker, 2009). The direct cause of an automation surprise is a mismatch between the individual’s understanding of a complex system and the system’s actual performance (D. Harris, 2011). The individual’s understanding leads to a mental model of the current state of the complex system and a prediction of future behavior. This mental model will be resilient to signals that the complex system it is not performing according to expectations, leading to a delay in response. When finally the individual does reflect on the situation, he is “surprised”, i.e. he is triggered through emotion that reality is diverging from his mental model. Automation surprise is therefore both a symptom of cognitive resistance and a factor that can be designed into or (preferably) out of a task by reducing the mismatch between the individual’s understanding of a systems and its actual performance. Therefore, automation surprise – although listed in Table 12 as a symptom - will also be included as one of the confounding environmental and intra-subject factors that needs to be addressed in the next section.
5.3. Remaining other factors
With the exception of those factors that are considered symptoms of cognitive resistance (as discussed in the previous section and listed in Table 12), the factors mentioned in Table 11 are reported in the literature to influence cognitive resistance. They are existent before onset of the contradictory stimuli and do not describe ongoing behavior during cognitive resistance. These factors can be directly or indirectly manipulated to modify the resistance of the mental model. A grouping based on the means of manipulation seems useful, so that the understanding of cognitive resistance is improved and the confounding effect of these factors can be minimized.
5.3.1. Categorization of other factors Many factors in Table 11 are expected to have an influence on cognitive resistance through the design of the task:
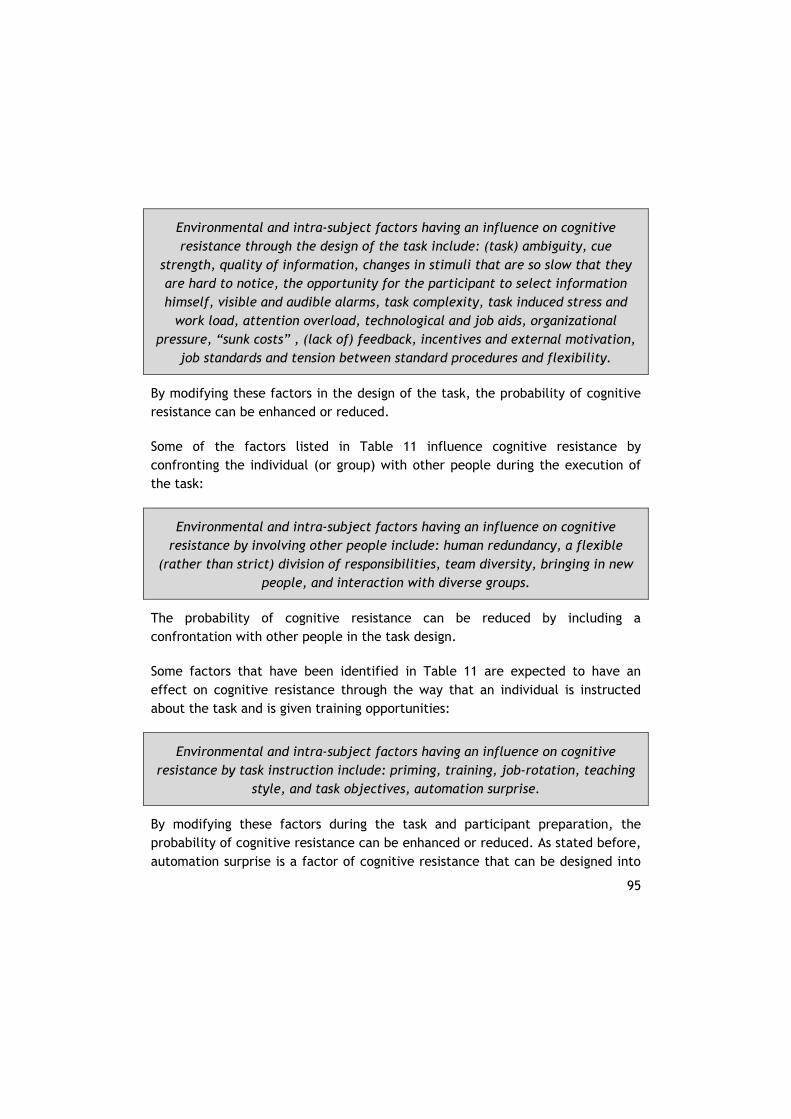
95
Environmental and intra-subject factors having an influence on cognitive resistance through the design of the task include: (task) ambiguity, cue
strength, quality of information, changes in stimuli that are so slow that they are hard to notice, the opportunity for the participant to select information himself, visible and audible alarms, task complexity, task induced stress and
work load, attention overload, technological and job aids, organizational pressure, “sunk costs” , (lack of) feedback, incentives and external motivation,
job standards and tension between standard procedures and flexibility.
By modifying these factors in the design of the task, the probability of cognitive resistance can be enhanced or reduced.
Some of the factors listed in Table 11 influence cognitive resistance by confronting the individual (or group) with other people during the execution of the task:
Environmental and intra-subject factors having an influence on cognitive resistance by involving other people include: human redundancy, a flexible
(rather than strict) division of responsibilities, team diversity, bringing in new people, and interaction with diverse groups.
The probability of cognitive resistance can be reduced by including a confrontation with other people in the task design.
Some factors that have been identified in Table 11 are expected to have an effect on cognitive resistance through the way that an individual is instructed about the task and is given training opportunities:
Environmental and intra-subject factors having an influence on cognitive resistance by task instruction include: priming, training, job-rotation, teaching
style, and task objectives, automation surprise.
By modifying these factors during the task and participant preparation, the probability of cognitive resistance can be enhanced or reduced. As stated before, automation surprise is a factor of cognitive resistance that can be designed into
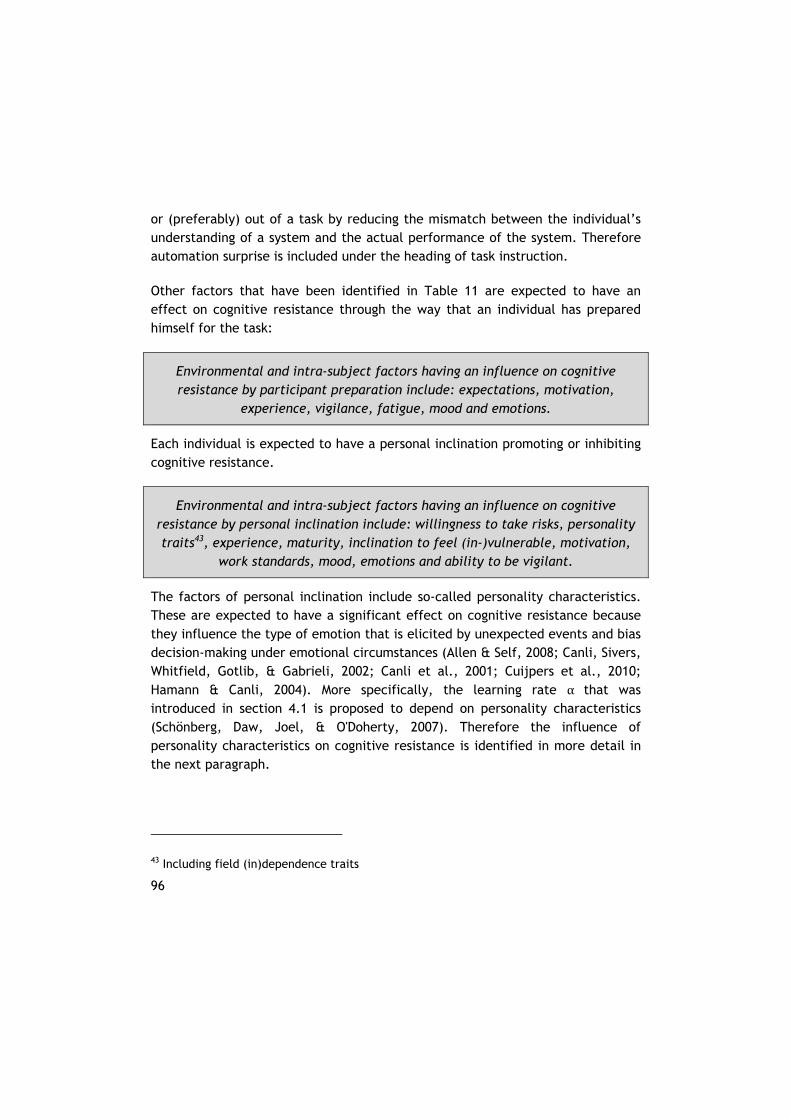
96
or (preferably) out of a task by reducing the mismatch between the individual’s understanding of a system and the actual performance of the system. Therefore automation surprise is included under the heading of task instruction.
Other factors that have been identified in Table 11 are expected to have an effect on cognitive resistance through the way that an individual has prepared himself for the task:
Environmental and intra-subject factors having an influence on cognitive resistance by participant preparation include: expectations, motivation,
experience, vigilance, fatigue, mood and emotions.
Each individual is expected to have a personal inclination promoting or inhibiting cognitive resistance.
Environmental and intra-subject factors having an influence on cognitive resistance by personal inclination include: willingness to take risks, personality traits43, experience, maturity, inclination to feel (in-)vulnerable, motivation,
work standards, mood, emotions and ability to be vigilant.
The factors of personal inclination include so-called personality characteristics. These are expected to have a significant effect on cognitive resistance because they influence the type of emotion that is elicited by unexpected events and bias decision-making under emotional circumstances (Allen & Self, 2008; Canli, Sivers, Whitfield, Gotlib, & Gabrieli, 2002; Canli et al., 2001; Cuijpers et al., 2010; Hamann & Canli, 2004). More specifically, the learning rate α that was introduced in section 4.1 is proposed to depend on personality characteristics (Schönberg, Daw, Joel, & O'Doherty, 2007). Therefore the influence of personality characteristics on cognitive resistance is identified in more detail in the next paragraph.
43 Including field (in)dependence traits
97
5.3.2. Personality characteristics Personality traits are characteristics that describe ways in which people are different from each other and that are reasonably stable over time and consistent over situations (Soldz & Vaillant, 1999). In general, traits are operationalized by (and even often equaled to) scores on a personality inventory. The personality taxonomy that has received the most attention and support over the last twenty years is the five-factor model, also called the Big Five (R. J. Larsen & Buss, 2008; Rothstein & Goffin, 2006). The five personality factors (Extraversion44, Neuroticism45, Agreeableness, Conscientiousness, and Openness to experience) have evolved after an extensive lexical and statistical analysis since the 1930’s (Digman, 1990). The NEO PI-R test is a popular measure of these five factors and six facets within each factor (Costa & McCrae, 1995; McCrae & Costa, 1987; McCrae & John, 1992).The NEO PI-R test is the de facto standard within psychology for personality traits because many developers of personality tests publish data on the relationship of their tests with it (R. J. Larsen & Buss, 2008). Many recent studies have applied this inventory, or correlated their findings with it (e.g. Cuijpers et al., 2010; Hamann & Canli, 2004).
Influence on emotions
Personality traits have been shown to moderate emotion elicitation in a number of studies. In particular high trait Neuroticism and low Extraversion is related to more pronounced negative emotions, less effective emotion regulation (Kokkonen & Pulkkinen, 2001), and more avoidance/withdrawal action tendencies (Carver, 2006). Penley and Tomaka (2002) show that Neuroticism is correlated with negative emotions, and specifically guilt, shame, fear and self-disgust. Extraversion and Openness are inversely correlated with specific negative emotions of shame or self-disgust. Positive emotions correlate with Extraversion (Shiota, Keltner, & John, 2006) and Conscientiousness (Penley & Tomaka, 2002), and inversely with Neuroticism (Shiota et al., 2006). Canli and colleagues (Canli et al., 2002; Canli et al., 2001; Hamann & Canli, 2004) show with functional magnetic resonance imaging that Extraversion is correlated with brain reactivity
44 Also called Surgency or Expressiveness 45 Also called Emotional Stability (inverse)
98
to positive stimuli, and Neuroticism is correlated with brain reactivity to negative stimuli.
In summary high Neuroticism has been described to correlate positively with the elicitation of negative emotions and negatively with the elicitation of positive emotions. Negative emotions can be modeled in a reinforcement learning framework by negative values for the rewards following the action to ignore (rignore < 0 inequation 4.16), and this predicts an increase in the rate of reflection for those high in Neuroticism.
Influence on cognitive style
Personality traits, particularly trait Neuroticism, have also been shown to be correlated with cognitive styles:
It is expected that people who are generally higher on Neuroticism are less likely to stick with their previous decision (Wong, Yik, & Kwong, 2006).
De Lange and van Knippenberg (2009) found that the performance of action-oriented individuals with a promotion focus is not impeded by previous errors46. Both action-orientation and promotion focus are correlated with low Neuroticism (Diefendorff, Hall, Lord, & Strean, 2000; R. J. Larsen & Buss, 2008).
Neuroticism correlates with better performance on local (rather than global) perception tasks (Basso, Schefft, Ris, & Dember, 1996; Compton & Weissman, 2002). Local information processing is related to attention to detail, rather than grasping the ‘big picture’ (Kimchi, 1992; Navon, 1977).
Davies (1985) found significantly more cognitive restructuring abilities (i.e. the skill to generate alternative explanations for perceived phenomena and to counter belief persistence) in field-independents than in field-dependents. Field-independence is defined as relying on internal (bodily) cues rather than external perceptions (Witkin & Goodenough, 1981). Field-independent people have greater skill in cognitive analysis and structuring
46 Action oriented individuals make decisions and initiate difficult actions relatively quickly under demanding or difficult conditions. Individuals with a promotion focus are concerned with advancement, growth and accomplishment.
99
(Witkin & Goodenough, 1977; L. Zhang, 2004). Field independence is correlated with Neuroticism (R. J. Larsen & Buss, 2008).
Baron-Cohen (2002) introduced the term systemizing: a conscious, inductive process to translate consecutive events into a reliable pattern of association to generate predictable results. Those scoring high in Neuroticism are more inclined to systemize47 (Austin, 2005; Baron-Cohen, Richler, Bisarya, Gurunathan, & Wheelwright, 2003; Wheelwright et al., 2006).
Greifender & Bless (2008) report that individuals with low levels of non-clinical depressive symptoms48 are prone to use ease-of-retrieval heuristics more than those with higher symptomatology, who base their judgment on actual content.
High Neuroticism is expected to correlate with cognitive styles that increase the rate of reflection, and can therefore be modeled in a reinforcement learning framework by an increased learning rate (α in equation 4.16). Therefore it is suggested that:
High Neuroticism correlates with a high rate of reflection.
The expected influence of personality characteristics, particularly Neuroticism, on the rate of reflection makes it necessary to identify measures to mitigate their confounding effect in the experimental study. Mitigation is possible indirectly through the a-priori and/or retroactive selection of participants. Retroactive grouping can be based on a personality inventory.
47 Baron-Cohen and colleagues identified a correlation between systemizing and the Asperger Quotient (a measure of the degree to which an adult with normal intelligence has the traits associated with the autistic spectrum, i.e. difficulties in reciprocal social interaction, communication, and the presence of stereotyped behavior, interests, and activities. Underlying assumption is the existence of a continuum from normality to specific traits, with clinical cases being at the far extreme). Asperger Quotient scores correlate with Neuroticism, Extraversion (inverse) and Agreeableness (inverse) of the Five Factor model (Austin 2005). 48 Generally reported to correlate with high Neuroticism
100
A-priori selection of participants is achieved by recruiting them from populations that are expected to have common personality characteristics, particularly Neuroticism. The average personality traits of engineers have been shown to divert from those of the general population (e.g. Baron-Cohen, Wheelwright, Burtenshaw, & Hobson, 2007; de Fruyt & Mervielde, 1996; Nowaczyk, 1996). Engineers have been shown to have elevated scores for Neuroticism (Austin, 2005). Field independents are more common in engineering and exact sciences (R. J. Larsen & Buss, 2008). Selection of participants from a limited number of design-related engineering disciplines (such as aerospace engineering and design engineering) is therefore appropriate.
5.4. Conclusion
This chapter is aimed at answering the third research question: What environmental and intra-subject factors influence cognitive resistance? In this section of this chapter conclusions are drawn regarding the other factors of cognitive resistance based on a review of the literature, and the next steps of this study are identified.
Answer to the third research question
The third research question stated:
RQ3 What environmental and intra-subject factors influence cognitive resistance?
The identification of environmental and intra-subject factors that influence cognitive resistance serves two purposes: it makes it possible to reduce the confounding effect of these factors from the interaction of the components of cognitive resistance in the experimental study, and it contributes to the knowledge of cognitive resistance.
The literature is reviewed with the purpose of identifying environmental and intra-subject factors that influence cognitive resistance. The factors that were originally identified through a search of the literature have been shown in Table 11. Several of the factors that have been mentioned in the literature appear to be symptoms or synonyms of cognitive resistance. They describe ongoing
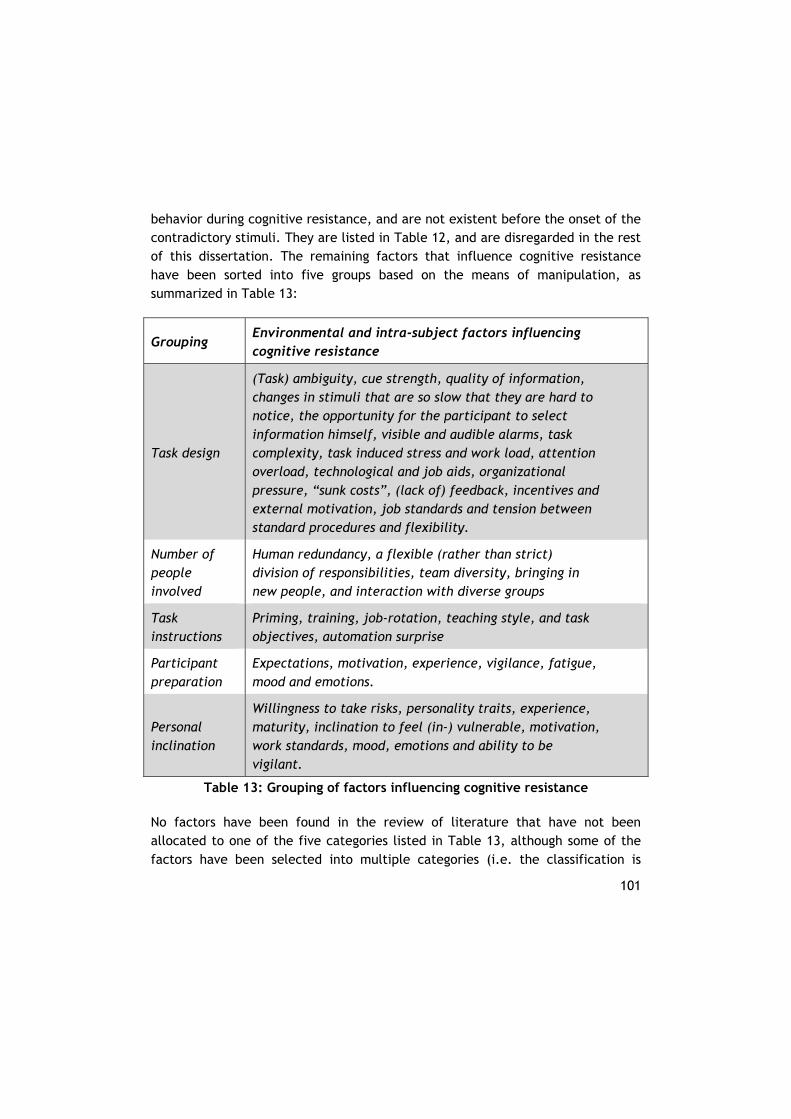
101
behavior during cognitive resistance, and are not existent before the onset of the contradictory stimuli. They are listed in Table 12, and are disregarded in the rest of this dissertation. The remaining factors that influence cognitive resistance have been sorted into five groups based on the means of manipulation, as summarized in Table 13:
Grouping Environmental and intra-subject factors influencing cognitive resistance
Task design
(Task) ambiguity, cue strength, quality of information, changes in stimuli that are so slow that they are hard to notice, the opportunity for the participant to select information himself, visible and audible alarms, task complexity, task induced stress and work load, attention overload, technological and job aids, organizational pressure, “sunk costs”, (lack of) feedback, incentives and external motivation, job standards and tension between standard procedures and flexibility.
Number of people involved
Human redundancy, a flexible (rather than strict) division of responsibilities, team diversity, bringing in new people, and interaction with diverse groups
Task instructions
Priming, training, job-rotation, teaching style, and task objectives, automation surprise
Participant preparation
Expectations, motivation, experience, vigilance, fatigue, mood and emotions.
Personal inclination
Willingness to take risks, personality traits, experience, maturity, inclination to feel (in-) vulnerable, motivation, work standards, mood, emotions and ability to be vigilant.
Table 13: Grouping of factors influencing cognitive resistance
No factors have been found in the review of literature that have not been allocated to one of the five categories listed in Table 13, although some of the factors have been selected into multiple categories (i.e. the classification is
102
exhaustive but not mutually exclusive). This is allowable because the classification aims to support the identification of mitigating measures, and multiple measures may be required for a single factor that influences cognitive resistance. In conclusion it is proposed that:
The environmental and intra-subject factors that influence cognitive resistance include, and are limited to, aspects of task design, number of people involved,
task instructions, participant preparation and personal inclination.
All of the environmental and intra-subject factors that influence cognitive resistance can be reasonably mitigated in an experimental study of cognitive resistance except personal inclination, in particular personality traits, which are expected to have a significant effect on cognitive resistance. The predicted correlation of Neuroticism with a high rate of reflection makes it necessary in an experimental study to select participants from a limited number of design-related engineering disciplines (such as aerospace engineering and design engineering), and to administer a trait inventory that permits retroactive selection of the participants.
Next steps
In this chapter the environmental and intra-subject factors that influence cognitive resistance have been identified. The results support the understanding of cognitive resistance by indicating which direct or indirect means of manipulation are available to influence cognitive resistance. The results also make it possible to reduce the confounding effect of the factors on the interaction of the components of cognitive resistance. This supports the experimental validation of the results of chapters 3 and 4, which is subject of the coming chapters.
103
6. Introduction to the experimental study
In the previous chapters of this dissertation the components of cognitive resistance have been identified (chapter 3) and the interaction between these components has been defined (chapter 4). The results are based on a review of the literature. In this and the following chapters it is endeavored to validate these results through an exploratory experimental study. The identification of factors that influence cognitive resistance in chapter 5 makes it possible to reduce their confounding effect in the experimental investigation.
The current chapter is a general introduction to the experimental study in which the general research design is presented. The objectives of the experimental study are first addressed (section 6.1). An appropriate experimental task is identified by matching the objectives of the experimental study with tasks that have been described in the literature (section 6.2). Measures for contradictory stimuli, establishment of a mental model, reflection, emotions and personality characteristics are devised (section 6.3). The selection of participants is described (section 6.4), and the procedure (section 6.5) and tools (section 6.6) are discussed.
The results for each of the two studies that have been conducted are presented in the subsequent chapters (chapters 7 and 8). Chapter 9 follows with a general discussion of the answers to the research questions, and conclusions are given in chapter 10.
6.1. Objective of the experimental study
The explorative experimental study is aimed at triggering and maintaining cognitive resistance in a suitable time scale, validating the defining characteristics of this phenomenon, and understanding the interaction of the components. Initial objective of the exploratory experimental study is therefore to generate cognitive resistance in a time scale that allows the study of its episodic nature. Assuming that this is successful, it is then aimed to answer the main research question that was defined as follows:
104
RQ How do the components of cognitive resistance interact?
The following subordinate research questions were expressed to assist in answering the main question:
RQ1 What are the components of cognitive resistance? From the literature study (chapter 3) it follows that the
components of cognitive resistance are primary perception, stimulus matching, appraisal and emotions (in the sense of an emotional response and emotion type). These represent “real” physiological and neurological processes. The experimental study is not aimed at systematically testing the validity of this proposition, but finding general qualitative support.
RQ2 What is the interaction between components of cognitive
resistance? The proposed interaction between the components of cognitive
resistance is schematically shown in Figure 9 and described in Table 9 (page 86) in chapter 4. The objective of the experimental study is to validate these predictions.
RQ3 What environmental and intra-subject factors influence cognitive
resistance? The experimental study is aimed at validating the predicted
correlation between high Neuroticism and a high rate of reflection (chapter 5). The experimental design should minimize the confounding effect of other environmental and intra-subject factors.
In summary, the objective of the experimental study is to validate the propositions that follow from the study of the literature as reported in chapters 3, 4 and 5. Although the nature of this study is exploratory, it is useful to determine limits that make it possible to decide whether an experimental finding can be considered as confirming evidence or not. These criteria are set below:
105
The time scale of cognitive resistance should allow a statistically significant match with a unimodal log-logistic distribution;
The components of cognitive resistance are identified qualitatively; The effect of emotions (versus no emotional response) on cognitive
resistance should be statistically significant; The effect of different emotion types on cognitive resistance should be
statistically significant; The ranking of the emotion types should be as predicted; and The effect of Neuroticism on cognitive resistance should be statistically
significant.
These limits are addressed in chapter 7, 8 and 9.
6.2. Experimental task
An experimental task is sought that allows validation of the propositions that have been listed in section 6.1. and meets other requirements. Different potential experimental tasks have been identified through a review of the literature. The most suitable task is described in more detail, and it is ascertained that it is appropriate for the experimental design in the current investigation.
6.2.1. Choice of tasks The experimental study aims to validate the propositions that have been listed in section 6.1. To enable validation of the answers to the review questions, the experimental study will include measures that define the bounds of cognitive resistance, i.e. it must be possible to accurately identify mental model establishment, contradictory stimuli and reflection. Measures of an emotional response and identification of emotion type should be readily available without the use of self-reports (cf. sections 1.1 and 3.2). Additionally, the experimental study will meet the following requirements:
resemble problem-solving in design: the problem is ill-defined, multiple outcomes are possible, constraints interact, and there are no clear-cut criteria for resolving conflicts (Altfeld, 2010; Badke-Schaub, 2005; Détienne,
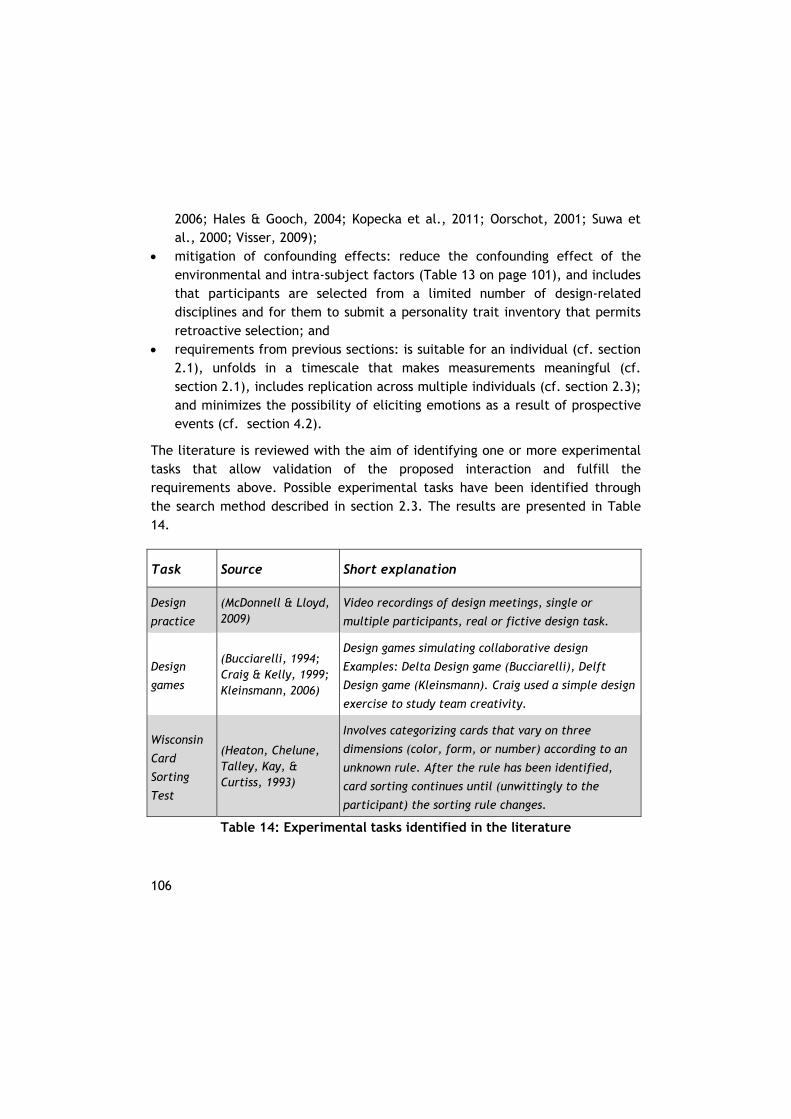
106
2006; Hales & Gooch, 2004; Kopecka et al., 2011; Oorschot, 2001; Suwa et al., 2000; Visser, 2009);
mitigation of confounding effects: reduce the confounding effect of the environmental and intra-subject factors (Table 13 on page 101), and includes that participants are selected from a limited number of design-related disciplines and for them to submit a personality trait inventory that permits retroactive selection; and
requirements from previous sections: is suitable for an individual (cf. section 2.1), unfolds in a timescale that makes measurements meaningful (cf. section 2.1), includes replication across multiple individuals (cf. section 2.3); and minimizes the possibility of eliciting emotions as a result of prospective events (cf. section 4.2).
The literature is reviewed with the aim of identifying one or more experimental tasks that allow validation of the proposed interaction and fulfill the requirements above. Possible experimental tasks have been identified through the search method described in section 2.3. The results are presented in Table 14.
Task Source Short explanation
Design
practice
(McDonnell & Lloyd, 2009)
Video recordings of design meetings, single or
multiple participants, real or fictive design task.
Design
games
(Bucciarelli, 1994; Craig & Kelly, 1999; Kleinsmann, 2006)
Design games simulating collaborative design
Examples: Delta Design game (Bucciarelli), Delft
Design game (Kleinsmann). Craig used a simple design
exercise to study team creativity.
Wisconsin
Card
Sorting
Test
(Heaton, Chelune, Talley, Kay, & Curtiss, 1993)
Involves categorizing cards that vary on three
dimensions (color, form, or number) according to an
unknown rule. After the rule has been identified,
card sorting continues until (unwittingly to the
participant) the sorting rule changes.
Table 14: Experimental tasks identified in the literature
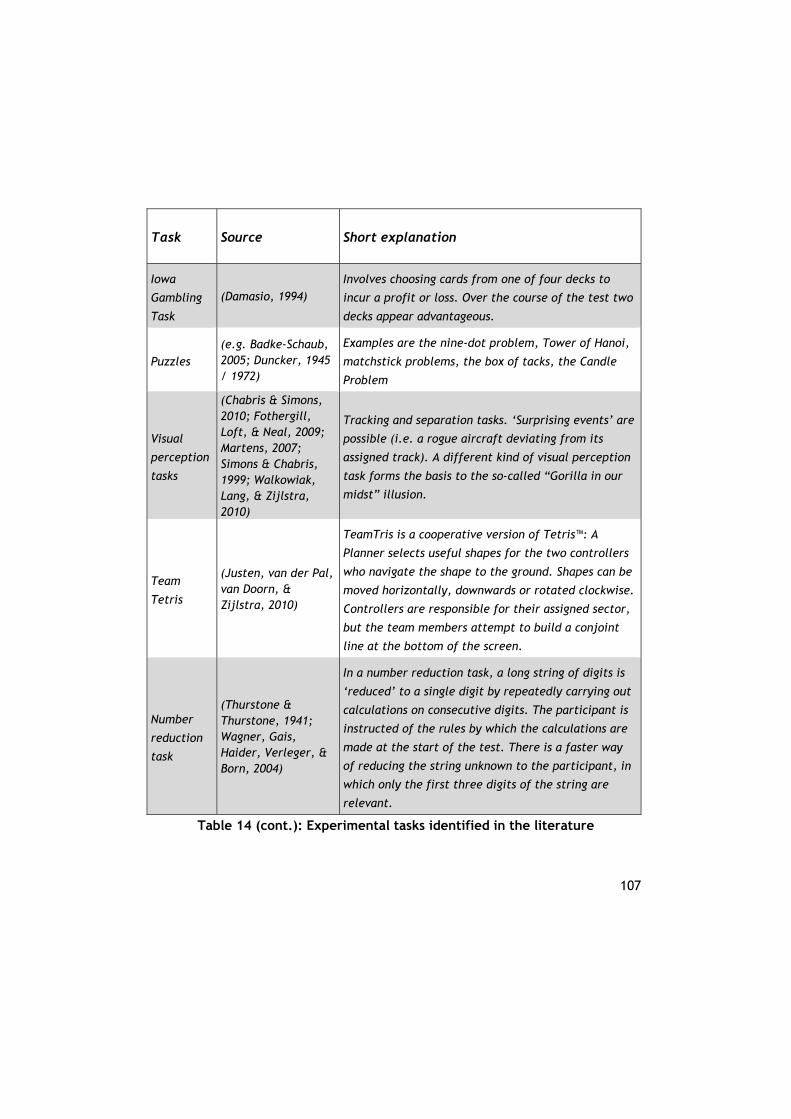
107
Task Source Short explanation
Iowa
Gambling
Task
(Damasio, 1994) Involves choosing cards from one of four decks to
incur a profit or loss. Over the course of the test two
decks appear advantageous.
Puzzles (e.g. Badke-Schaub, 2005; Duncker, 1945 / 1972)
Examples are the nine-dot problem, Tower of Hanoi,
matchstick problems, the box of tacks, the Candle
Problem
Visual
perception
tasks
(Chabris & Simons, 2010; Fothergill, Loft, & Neal, 2009; Martens, 2007; Simons & Chabris, 1999; Walkowiak, Lang, & Zijlstra, 2010)
Tracking and separation tasks. ‘Surprising events’ are
possible (i.e. a rogue aircraft deviating from its
assigned track). A different kind of visual perception
task forms the basis to the so-called “Gorilla in our
midst” illusion.
Team
Tetris
(Justen, van der Pal, van Doorn, & Zijlstra, 2010)
TeamTris is a cooperative version of Tetris™: A
Planner selects useful shapes for the two controllers
who navigate the shape to the ground. Shapes can be
moved horizontally, downwards or rotated clockwise.
Controllers are responsible for their assigned sector,
but the team members attempt to build a conjoint
line at the bottom of the screen.
Number
reduction
task
(Thurstone & Thurstone, 1941; Wagner, Gais, Haider, Verleger, & Born, 2004)
In a number reduction task, a long string of digits is
‘reduced’ to a single digit by repeatedly carrying out
calculations on consecutive digits. The participant is
instructed of the rules by which the calculations are
made at the start of the test. There is a faster way
of reducing the string unknown to the participant, in
which only the first three digits of the string are
relevant.
Table 14 (cont.): Experimental tasks identified in the literature
108
The most suitable task for the experimental design needs to be selected from the tasks listed in Table 14:
design practice and design games lack structure, which makes it difficult to accurately identify mental model establishment, contradictory stimuli and reflection and therefore define the bounds of cognitive resistance;
Wisconsin Card Sorting Test and Iowa Gambling Task do not resemble problem-solving in design, because there are pre-defined solutions to fulfill the task objective, the initial problem statement is phrased in terms that are directly appropriate for the generation of a solution, and there are clear-cut criteria for resolving the conflict that occurs during the test execution;
puzzles are unsuitable as a task in this research because these tasks do not allow a mental model to be established until the task is completed;
visual perception tasks do not unfold in a timescale that makes measurements meaningful;
Team Tetris requires a collaborative effort, making it unsuitable for the current – individual – research; and
number reduction task seems the most suitable task because it allows reflection to be identified through an abrupt change in response times and includes some of the complexity of design problem-solving.
The Number Reduction is presented in more detail below, before it is subsequently ascertained whether it is appropriate for the experimental design in the current investigation.
6.2.2. Number reduction task Wagner and colleagues used a modified version of the number reduction task originally developed by Thurstone and Thurstone (1941) to identify the effect of sleep on insight (Wagner et al., 2004). Insight is a construct denoting “a mental restructuring that leads to a sudden gain of explicit knowledge allowing qualitatively changed behavior”. It is proposed that the construct of insight closely resembles the definition of reflection. According to these authors, the task includes some of the complexity of design problem-solving:
[The manipulation in the number reduction task] was abstract, that is, dependent on relational patterns rather than on fixed
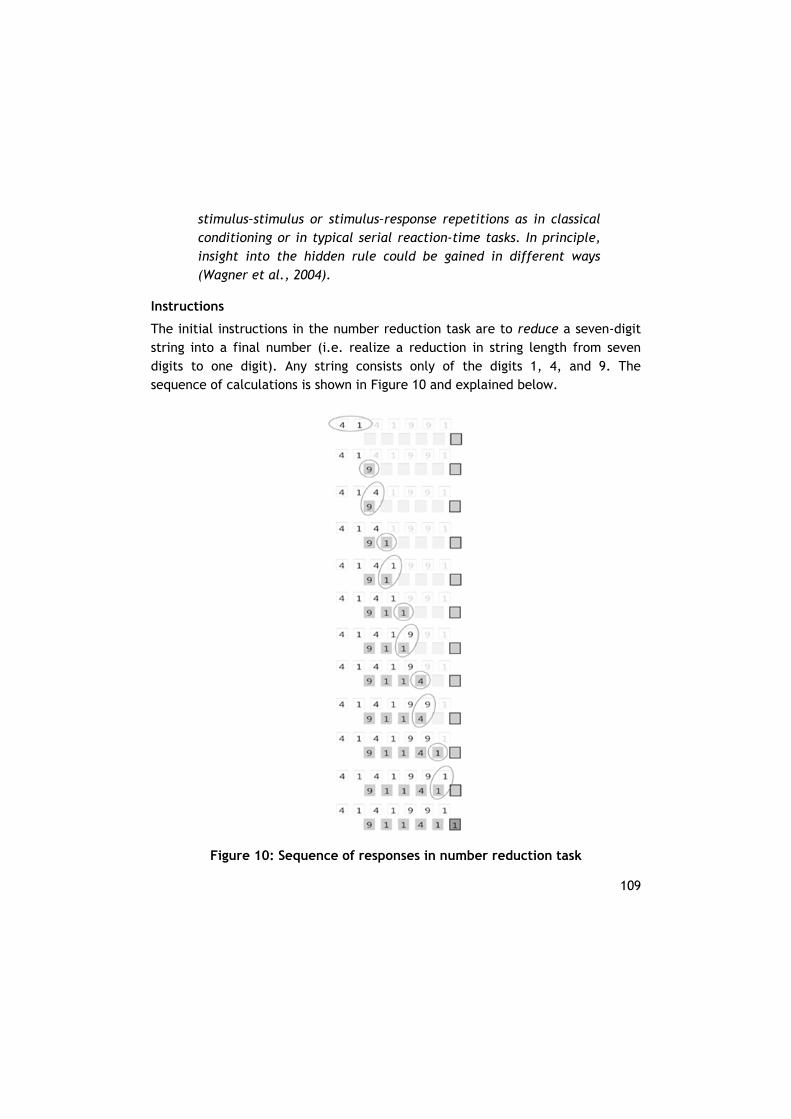
109
stimulus–stimulus or stimulus–response repetitions as in classical conditioning or in typical serial reaction-time tasks. In principle, insight into the hidden rule could be gained in different ways (Wagner et al., 2004).
Instructions
The initial instructions in the number reduction task are to reduce a seven-digit string into a final number (i.e. realize a reduction in string length from seven digits to one digit). Any string consists only of the digits 1, 4, and 9. The sequence of calculations is shown in Figure 10 and explained below.
Figure 10: Sequence of responses in number reduction task
110
The first two digits of the initial string are reduced into a new digit by one of two simple rules:
The “same” rule: if the two input digits are the same, then the resulting digit is the same;
The “different” rule: if the two input digits are different, then the result is the third, different digit.
The calculated digit is stored diagonally under and to the right of the first two digits. This number is combined with the digit in position three of the original string to calculate the next digit using the two rules again. The result is combined with the digit in position four of the original string, and so on until the sixth digit has been derived. This digit constitutes the final answer thereby having reduced the input string into a single number. On entering the last digit, the box turns green (correct) or red (incorrect) and a sound indicates the same; the next string appears automatically. It is expected that the participant will establish a mental model of the task and automate the responses to the strings.
The participant is required to reduce ten strings within 30 seconds with no more than one mistake. Feedback on performance is given to the participant after every set of ten strings. However, it is impossible to complete a set of ten strings within the given time by applying the two rules sequentially for each string, thereby challenging the mental model that was established. This comprises the experimental manipulation for study 1.
Unknown to the participants, there is a pattern in the strings such that the answers are symmetrical in the form abccba, so-called “hidden rule strings”. This allows a short-cut from six repetitive calculations for each string to only one, if the participants identify this hidden rule in the calculations. Study 2 continues on from study 1 after the learned mental model has been demised and the participant has experience reflection. It is expected that the participants will recognize the hidden rule after a limited amount of time and accordingly create a mental model of the hidden rule. After two sets of ten strings in which the task objectives have been met, the hidden rule strings will be replaced with random strings (in which the hidden rule is no longer valid). This comprises the experimental task for study 2, in which the “hidden rule” mental model is
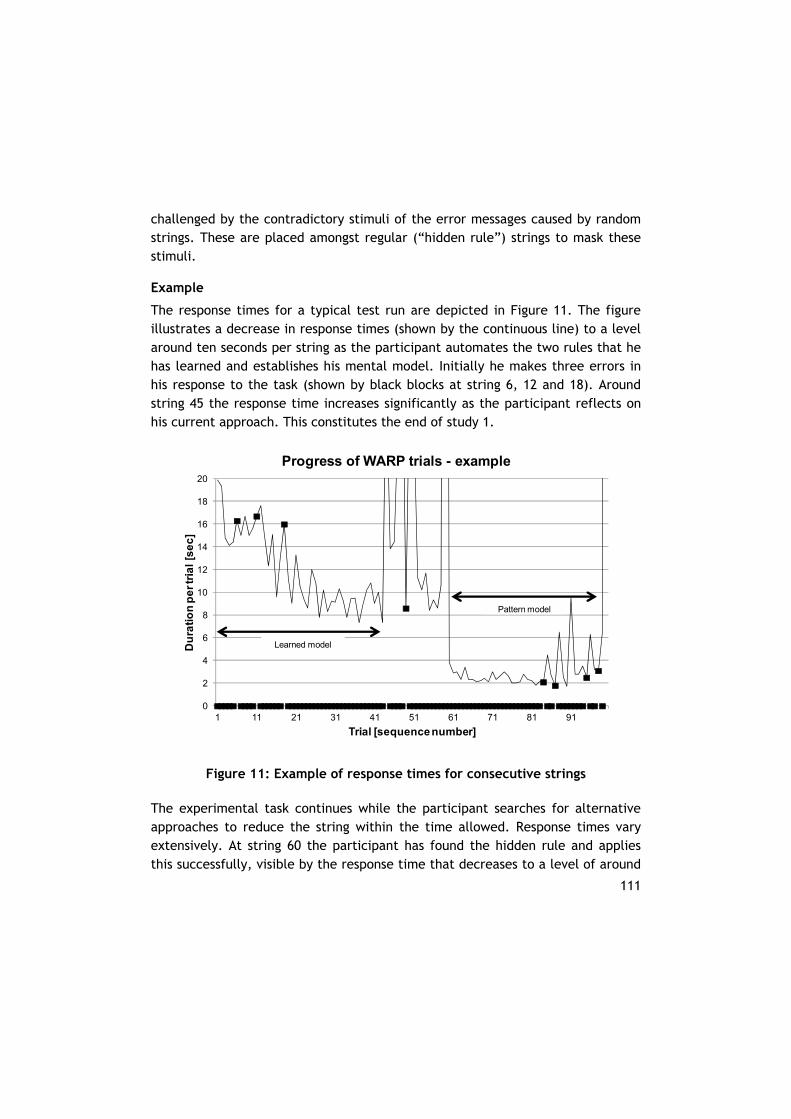
111
challenged by the contradictory stimuli of the error messages caused by random strings. These are placed amongst regular (“hidden rule”) strings to mask these stimuli.
Example
The response times for a typical test run are depicted in Figure 11. The figure illustrates a decrease in response times (shown by the continuous line) to a level around ten seconds per string as the participant automates the two rules that he has learned and establishes his mental model. Initially he makes three errors in his response to the task (shown by black blocks at string 6, 12 and 18). Around string 45 the response time increases significantly as the participant reflects on his current approach. This constitutes the end of study 1.
Figure 11: Example of response times for consecutive strings
The experimental task continues while the participant searches for alternative approaches to reduce the string within the time allowed. Response times vary extensively. At string 60 the participant has found the hidden rule and applies this successfully, visible by the response time that decreases to a level of around
0
2
4
6
8
10
12
14
16
18
20
1 11 21 31 41 51 61 71 81 91
Du
rati
on
pe
r tri
al
[se
c]
Trial [sequence number]
Progress of WARP trials - example
Learned model
Pattern model
112
two seconds per string. Between string 60 and string 85 the participant continues to apply the hidden rule successfully and fortifies his mental model. At string 85 the software challenges the participant’s mental model by generating error messages (shown by a black block) despite the correct application of the hidden rule. The participant continues to apply the hidden rule, visible by the fact that the response times remain under ten seconds, although they are more erratic. The system offers strings that do and that do not comply with the hidden rule in a random fashion, the contradictory stimuli are therefore not completely salient. The mental model is preserved as long as the participant responds within ten seconds. After the error message at string 98 the response time increases significantly, indicating reflection. This constitutes the end of study 2. The example shows that the experimental manipulation was successful in this particular case.
Modifications in comparison to Wagner
In the original experimental design (Wagner et al., 2004) only 22% of the respondents achieved insight in the base condition within a reasonable amount of time49. This was deemed too low and therefore changes were made in the design of the task. These modifications include a reduction of the string length compared to that used by Wagner, addition of a time indicator on the left hand side of the screen and a (factually incorrect) statement at each feedback that “up to now all participants have been able to fulfill this objective”. Preliminary experiments were undertaken to ensure that the experimental manipulation after these modifications was successful.
6.2.3. Suitability for the current research The number reduction task seems the most suitable task out of those that were identified in the course of the review of literature. The task has been presented in more detail in the previous paragraph. In this paragraph it is ascertained whether the number reduction task allows us to validate the proposed interaction between the components of mental model, resembles problem-solving in design, and complies with other requirements that were specified
49 This increased to 60% after Wagner’s experimental manipulation consisting of 8 hours of sleep instead of wakefulness.
113
earlier in this section, and that it is therefore appropriate for the experimental design in the current investigation.
Validation of the proposed interaction
The number reduction task allows validation of the propositions that have been generated in response to the review questions because measures are available that define the bounds of cognitive resistance, i.e. it is possible to accurately identify mental model establishment, contradictory stimuli and reflection:
Mental model establishment is evident through consistency in behavior, as in Figure 11;
the contradictory stimuli are generated by the software and are logged in a unique file during the course of each experiment; and
reflection is evident through an abrupt reduction in response time (Figure 11).
The task enables identification of an emotional response and of emotion type by an external observer using video recordings, but also makes it possible to include automatic measures of emotion. This will be elaborated upon in section 6.3.
Resemblance to problem-solving in design
The number reduction task somewhat resembles problem-solving in design because the problem is ill-defined, multiple outcomes are possible, constraints interact, and there are no clear-cut criteria for resolving conflicts. However, the task is starkly simplified compared to regular design tasks, is based on numbers only, and requires a rate of response that is not typical for design.
Mitigation of confounding effects
The number reduction task makes it possible to minimize the confounding effect of the environmental and intra-subject factors identified in chapter 5. The task design allows for a high level of standardization so that these factors have a constant effect across all experimental manipulations. The task will be executed on an individual basis so that the confounding effect of other people is minimized. The way that an individual is instructed about the task and is given training opportunities is standardized so that the effect of these factors is kept constant. The number reduction task is not well known and so it is probable that
114
none of the potential participants has executed the task before (a check is included in the preparation protocol). An individual’s preparation for the task will be standardized from the time that he or she arrives at the test location. By taking sufficient time, effects from prior experiences will have decayed. It is envisaged that this will help to maintain some consistency across participants in expectations, motivation, experience, vigilance, fatigue, mood and emotions but some confounding effects will probably remain. The participants will be selected from a limited number of design-related disciplines (aerospace engineering, design engineering), and a personality trait inventory will be administered that permits retroactive selection of the -participants.
Other requirements from previous sections
The number reduction task fulfills the requirements that follow from previous sections. The task is limited to an individual and does not include team interaction (cf. section 2.1). It ensures that the process of contradictory stimuli to reflection unfolds in a timescale that makes measurements meaningful (cf. section 2.1). The experimental study can be easily replicated (cf. section 2.3). In pre-trials it has been shown that the participant’s work load is satisfactorily high so that there is a minimal possibility of eliciting emotions on prospective events (cf. section 4.2).
Conclusion
In conclusion it is proposed that:
The number reduction task is an appropriate experimental task for the current investigation because it enables the validation of the propositions that have been generated in response to the review questions, somewhat resembles
problem-solving in design, permits the mitigation of confounding environmental and intra-subject factors, and complies with the other requirements that were
specified earlier in this work.
The number reduction task may be sensitive to numerical skills and prior experience with such tasks. This is taken into account in the subject preparation.
115
6.3. Measures
In section 6.2 it was identified that the number reduction task is an appropriate experimental task that matches the objectives of the experimental study. The number reduction task makes it is possible to devise suitable measures for contradictory stimuli, establishment of a mental model, reflection, emotions and personality characteristics. This will be elaborated upon in this section.
Contradictory stimuli
The contradictory stimuli in the number reduction task vary for study 1 and study 2. All relevant data is logged by the software.
The stimuli in study 1 consist of the feedback on performance that is given after every set of ten strings. The system shows for the previous set of ten strings the number of erroneous responses against the maximum number of errors permitted (1), and the time taken to complete the previous set of ten strings against the time allowed (30 seconds). A (factually incorrect) statement is given at each feedback that “up to now all participants have been able to fulfill this objective”. All the stimuli in this study are contradictory because it is impossible to complete a set of ten strings within the given time by applying the two rules sequentially for each string. The salience of the visual stimuli is constant terms of legibility and color coding.
The stimuli in study 2 consist of the feedback signals from the system following the response of the participant to every string. They consist of visual cues (the last box turns green or red) and audible cues (a sound indicates whether the answer was correct or incorrect). The salience of the visual stimuli is constant terms of legibility and color coding. The salience of the audible stimuli is constant terms of volume and tone.
Mental model establishment
The establishment of the mental model is evident through consistency in behavior. This is described separately for study 1 and for study 2.
The response times per string in study 1 will initially decrease exponentially according to the Power Law of Practice proposed by Newell and Rosenbloom
116
(1981). Compliance with the power law is an indication for automaticity and therefore an established “learned” mental model. The Power Law is in the form:
TS=aS‐b equation6.1
Where:
S is the string number T is the Response Time for string number S a and b are constants
Based on preliminary experiments and earlier work by Wagner et al. (2004) the participants are expected to achieve response times of less than 10 seconds per string in study 1.
The response times in study 2 are expected to initially be constant and at a level less than 4 seconds per string, indicating that the mental model of the “hidden rule” has been established. In study 2 error messages are generated as a result of mental model preservation in combination with non-compliant strings. There may be a rise in response times as a consequence of errors (de Lange & van Knippenberg, 2009), even if these errors do not lead to immediate reflection.
Reflection
As discussed in section 2.1, reflection is assumed to be rather abrupt, and observable through a sudden change in behavior that can be monitored through the software. In study 1, reflection is defined as a response time of over 10 seconds and a deviation from the power curve (equation 6.1) of more than 50% (to ensure that high response times at the beginning of the test are not unduly registered as reflection. In study 2, reflection is defined as a response time of over 10 seconds.
Emotions
The literature review has generated a number of measures of emotion that have been applied in previous research. In particular, Mauss and Robinson (2009) in a recent review have identified the applicability of different measures for emotions, as shown in Table 15.
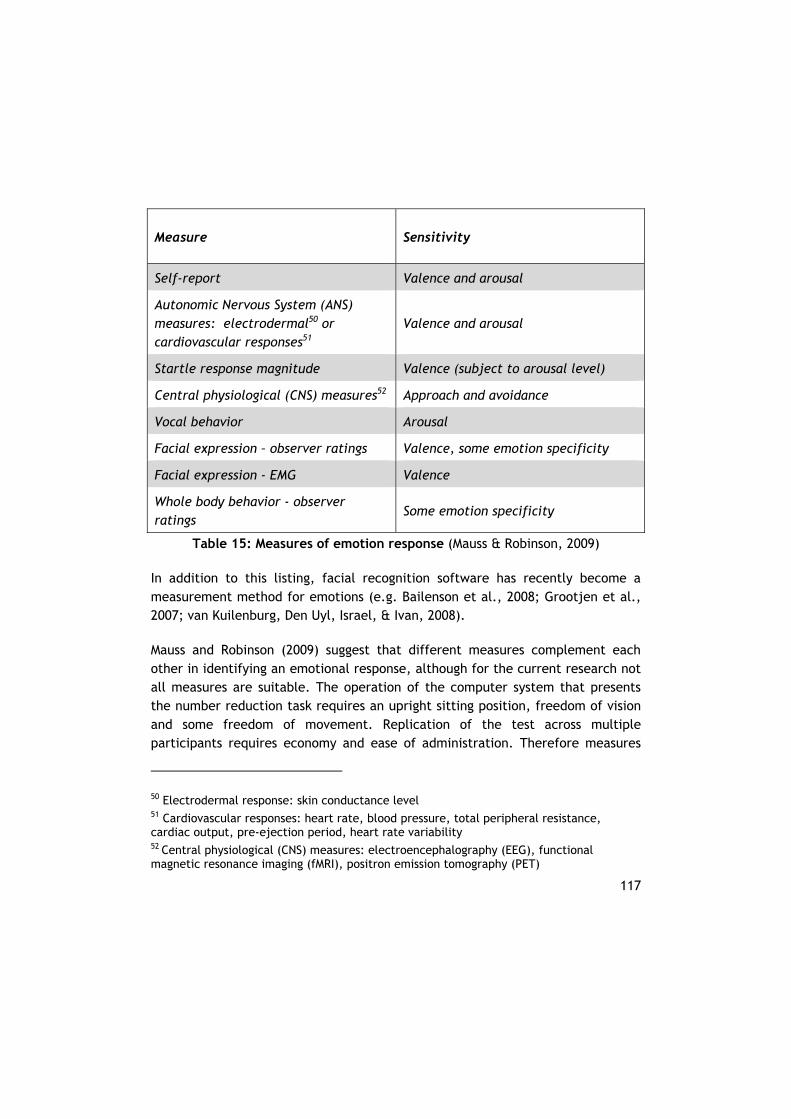
117
Measure Sensitivity
Self-report Valence and arousal
Autonomic Nervous System (ANS) measures: electrodermal50 or cardiovascular responses51
Valence and arousal
Startle response magnitude Valence (subject to arousal level)
Central physiological (CNS) measures52 Approach and avoidance
Vocal behavior Arousal
Facial expression – observer ratings Valence, some emotion specificity
Facial expression - EMG Valence
Whole body behavior - observer ratings
Some emotion specificity
Table 15: Measures of emotion response (Mauss & Robinson, 2009)
In addition to this listing, facial recognition software has recently become a measurement method for emotions (e.g. Bailenson et al., 2008; Grootjen et al., 2007; van Kuilenburg, Den Uyl, Israel, & Ivan, 2008).
Mauss and Robinson (2009) suggest that different measures complement each other in identifying an emotional response, although for the current research not all measures are suitable. The operation of the computer system that presents the number reduction task requires an upright sitting position, freedom of vision and some freedom of movement. Replication of the test across multiple participants requires economy and ease of administration. Therefore measures
50 Electrodermal response: skin conductance level 51 Cardiovascular responses: heart rate, blood pressure, total peripheral resistance, cardiac output, pre-ejection period, heart rate variability 52 Central physiological (CNS) measures: electroencephalography (EEG), functional magnetic resonance imaging (fMRI), positron emission tomography (PET)
118
that require cumbersome or complex registration systems and protocols are ruled out, such as facial electromyography (EMG) and central physiological measures such as EEG, fMRI and PET. The startle response does not identify discrete emotional states and has a high arousal threshold. Whole-body behavior will be constrained due to the sitting position of the participant. In pre-trials facial recognition software has not proven to be adequate for this research (de Boer, 2009a). Although electrodermal responses have been used successfully in other experiments (e.g. Bechara, Damasio, Tranel, & Damasio, 1997; Crosby, 2001), in this study preference has been given to cardiovascular measures: a vaster body of literature is available on cardiovascular measures in comparison to electrodermal responses53 (e.g. Bradley & Lang, 2007; Camm, Malik, & et. al., 1996; Lang et al., 2008), and cardiovascular measures are very easy to register with present-day wireless heart monitors used in sports and recreation (Weippert et al., 2010). Due to the short interval between repetitive stimuli in this experimental task, cardiovascular measures are constrained to the time-domain (rather than frequency domain analyses that are suitable for recording periods longer than five minutes; Camm et al., 1996). As discussed in section 3.2, in this research we differentiate between emotional responses and emotion types.
To identify emotional responses (versus sub-threshold non-emotional responses) it is assumed that the measures of arousal listed in Table 15 are appropriate. These are self-reports, ANS measures and (vocal) behavior. The primary measures for emotion response are observer ratings. These are based on a visual / auditory recognition of an emotional response by two independent observers (Hawk et al., 2008; Matsumoto et al., 2008). In addition, novel self-report and ANS measures for emotion response are attempted in this study:
Self-report of a change in affect felt by a participant; and Heart Rate Variability (Bradley, Codispoti, Cuthbert, & Lang, 2001;
Codispoti, Surcinelli, & Baldaro, 2008).
53 "Skin conductance response" in combination with “emotion” has 1460 hits in Google Scholar since 2007 in comparison to 6310 hits for "Heart Rate Variability" in combination with emotion.
119
The measures of valence and emotion specificity included in Table 15 are considered measures of emotion type: Autonomic Nervous System (ANS) measures, self-reports, facial expression and behavior. The primary measures of emotion type in the current study are observer ratings. These are based on a visual / auditory recognition of an emotional response by two independent observers (Hawk et al., 2008; Matsumoto et al., 2008). There is some debate about the specificity of ANS measures such as cardiovascular response (J. T. Larsen et al., 2008; Mauss & Robinson, 2009) and therefore cardiovascular response will not be used as a measure of emotion type in this research. Self-reports as a measure of emotion type will not be used in this research because the reliability of self-reports is limited to cases where emotions are strongly experienced (Bonanno & Keltner, 2004; Mauss & Robinson, 2009), and the participant may confuse emotional experience with his or her emotional expression (Brody & Hall, 2008).
Personality traits
In general, long-term personality characteristics are operationalized by (and even often equaled to) scores on a personality inventory. The Five Factor Model is the de facto standard within psychology for personality traits and has been discussed previously in section 5.3. In this study the Reflector Big Five Personality test (PiCompany, 2007; Smid, 2010) will be applied through a web portal provided by PiCompany54. The questionnaire and scoring of this instrument closely follows the NEO-PI-R of Costa et al. (1992) and is adapted for workplace situations (Egberink, 2010). It was selected as tool because it is available in equivalent Dutch and English language versions and is web-based, allowing for flexibility in administration. The instrument returns a score over the Big Five factors (Emotional Stability, Extraversion, Openness to Experience, Agreeableness, and Conscientiousness) and four or five facets within each of these. Results are presented as a T-score relative to a norm group of 500 Dutch working adults that is balanced for job function, industrial sector, age and gender (PiCompany, 2007).
54 www.picompany.nl

120
6.4. Participant population
Participants were recruited from design engineering populations at universities and in industry. Participation was limited to participants who had an educational level sufficient to be accepted at a Dutch academic institution55 to ensure that general intelligence does not confound the results. All the subjects that applied to participate fulfilled the criteria regarding educational level, and all were accepted for the test.
Student participants were recruited through notice boards on which participation for research is regularly requested at the faculties of Aerospace Engineering and Industrial Design Engineering and also the central library of the Delft University of Technology, and the honors track Aviation Engineering at the Amsterdam University of Applied Sciences56. They were asked to participate in “research into the interaction between cognition and emotion”, and were informed that the test included measurements through a heart rate monitor. Students were offered payment according to the common rate for participating in experimental studies at the Delft University of Technology (€ 10 per hour).
Industry participants were recruited by contacts at several companies, who asked for volunteers on behalf of the researchers. Participants from industry were mainly recruited from aerospace companies to ensure that their experience reflects the design of complex systems. Industry participants were not reimbursed by the researcher, although the time spent on the test was partly considered working time by company management.
The participant population differed for studies 1 and 2. Therefore, the participants are described in more detail in sections 7.1 and 8.1.
55 Dutch academic institutions are defined as research institutions granting a Master’s degree and so exclude universities of applied sciences (for exception see next note). 56 These subjects were selected for an honors track and therefore also considered to have an educational level sufficient to be accepted at a Dutch academic institution.
121
6.5. Procedure
General preparation
The tests took place in a designated room at one of the educational institutions or at a company site. The rooms were closed with a door and inside windows were blinded to eliminate distractions and lack of privacy. The experimental set-up was erected at the start of the day. Participants were scheduled for specific times in the course of the day.
Briefing, informed consent and participant preparation
Upon arrival, the participants were briefed in writing about the experiment, and their consent was requested according to the general requirements defined by the U.S. Department of Health and Human Services57. The briefing included a general introduction of the research objective, an overview of the tests to be conducted, and a short presentation of both the personality test and the number reduction task. The participants were informed that the duration for the personality test was expected to be 30 minutes and the duration for the number reduction task no longer than 60 minutes. Following recommendations from the manufacturer of the heart rate monitors and the producer of the personality instrument, three disclaimers were included in the briefing:
participants wearing a pacemaker, defibrillator, or other implanted electronic device were excluded from the measurements and informed that they used the transmitter belt at their own risk - no subjects volunteered such information;
neither the heart rate transmitter belts, the operators nor the analysis were intended to or suitable for obtaining measurements that identify health related issues and/or require medical precision; and
the operator is not qualified to give feedback on the results of the personality test, nor will a report be generated even though this may be mentioned by the software - this study is not intended to or suitable for giving feedback on individual personality characteristics.
57 U.S. Department of Health and Human Services 2005, 45 C.F.R. § 46.116: General requirements for informed consent.
122
The participants were further informed about the privacy of the generated data. Specifically, they were informed that all data, including heart rate data, video/photo material and personality test results are stored on password protected computers that are not publicly accessible, and that all data that can identify individuals such as name, age or gender is removed from the records. Data will only be reported at an aggregate level, and no reference will be made in oral or written reports that could link individual participants to the study.
Participants were invited to ask any questions that remain, retain the written briefing and to sign the consent form. It was stressed that participation is entirely voluntary, and participants were requested to carefully consider their involvement. Refusal to participate, or discontinuation at any time, will involve no penalty or loss of benefits to which the participant was otherwise entitled, and could be indicated at any time.
After signing the informed consent form, participants were requested to fill in general data: age, gender, education discipline, level of education and current function. They were then invited to put on the heart rate monitor under their clothes. All female participants were either referred to a nearby bathroom or left alone in the room (in case this was sufficiently blinded); these options were also available to male participants but rarely made use of. Through the monitoring software on the observer laptop it was evident that the heart rate monitoring system was working satisfactorily.
Personality Test
In general the personality test was administered first. The test was available in English or Dutch, as preferred by the participant. Depending on the language of choice, the participant was given the login details for the portal, and given ample opportunity to answer the questionnaire. For certain participants not fluent in either Dutch or English, the researcher was available to translate the statements upon request. In case of tight scheduling, the personality test was administered in a separate room on a random computer connected to the internet. Test results were processed in batches by PiCompany and returned by email.
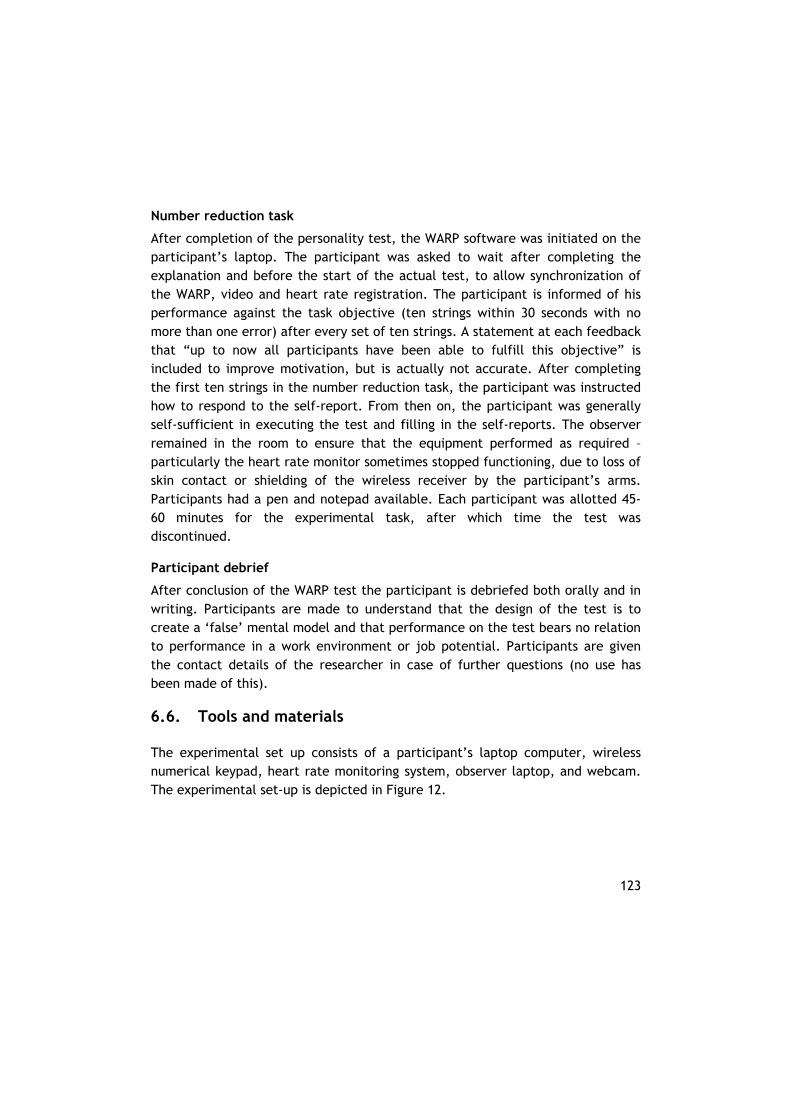
123
Number reduction task
After completion of the personality test, the WARP software was initiated on the participant’s laptop. The participant was asked to wait after completing the explanation and before the start of the actual test, to allow synchronization of the WARP, video and heart rate registration. The participant is informed of his performance against the task objective (ten strings within 30 seconds with no more than one error) after every set of ten strings. A statement at each feedback that “up to now all participants have been able to fulfill this objective” is included to improve motivation, but is actually not accurate. After completing the first ten strings in the number reduction task, the participant was instructed how to respond to the self-report. From then on, the participant was generally self-sufficient in executing the test and filling in the self-reports. The observer remained in the room to ensure that the equipment performed as required – particularly the heart rate monitor sometimes stopped functioning, due to loss of skin contact or shielding of the wireless receiver by the participant’s arms. Participants had a pen and notepad available. Each participant was allotted 45-60 minutes for the experimental task, after which time the test was discontinued.
Participant debrief
After conclusion of the WARP test the participant is debriefed both orally and in writing. Participants are made to understand that the design of the test is to create a ‘false’ mental model and that performance on the test bears no relation to performance in a work environment or job potential. Participants are given the contact details of the researcher in case of further questions (no use has been made of this).
6.6. Tools and materials
The experimental set up consists of a participant’s laptop computer, wireless numerical keypad, heart rate monitoring system, observer laptop, and webcam. The experimental set-up is depicted in Figure 12.
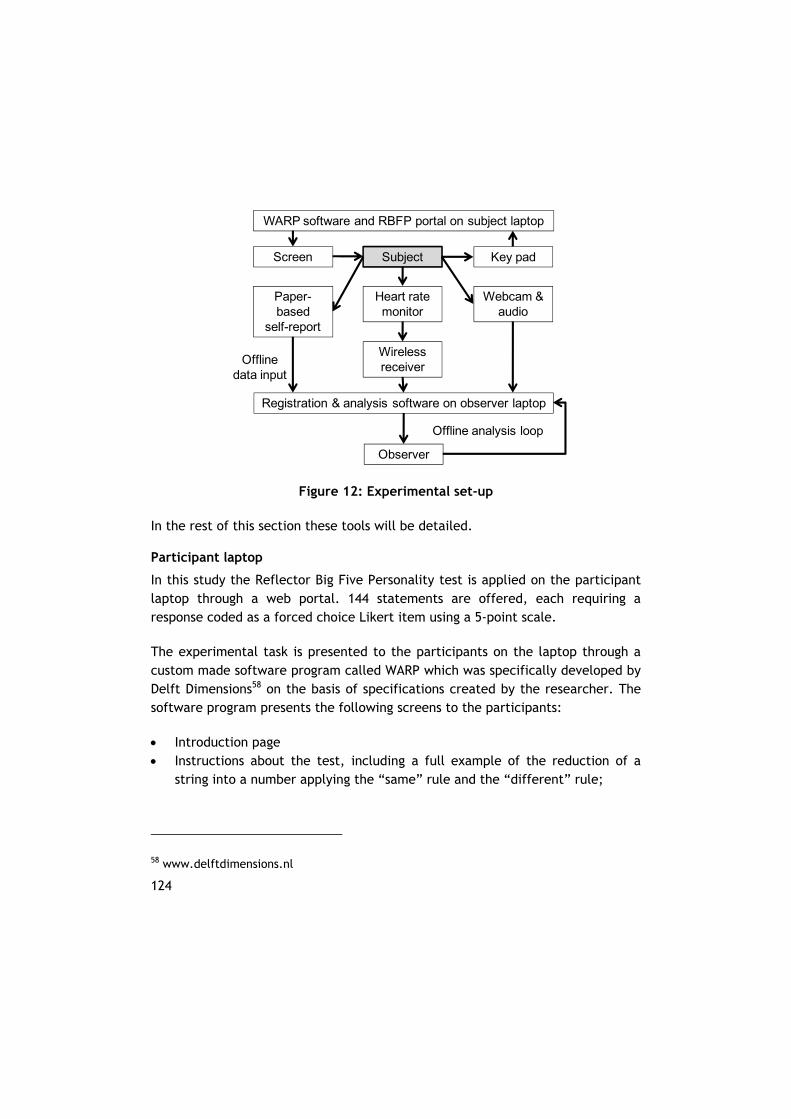
124
Figure 12: Experimental set-up
In the rest of this section these tools will be detailed.
Participant laptop
In this study the Reflector Big Five Personality test is applied on the participant laptop through a web portal. 144 statements are offered, each requiring a response coded as a forced choice Likert item using a 5-point scale.
The experimental task is presented to the participants on the laptop through a custom made software program called WARP which was specifically developed by Delft Dimensions58 on the basis of specifications created by the researcher. The software program presents the following screens to the participants:
Introduction page Instructions about the test, including a full example of the reduction of a
string into a number applying the “same” rule and the “different” rule;
58 www.delftdimensions.nl
Subject
Heart ratemonitor
Key padScreen
WARP software and RBFP portal on subject laptop
Wirelessreceiver
Webcam & audio
Registration & analysis software on observer laptop
Observer
Offline analysis loop
Paper-based
self-report
Offline data input
125
The experimental task - the time taken for the current set of ten strings is indicated in numbers and also by a time indicator on the left hand side of the screen during the experimental task (Appendix D: Screen shots of the number reduction task, top figure);
Feedback pages after every ten sets, that report the performance (time taken and errors made) versus the task objective and that allow for self-reporting (Appendix D: Screen shots of the number reduction task, bottom figure);
A close out page that only appears in case the maximum test duration is exceeded (60 minutes).
Responses are given through a wireless numerical key pad that is positioned in front of the computer screen by the participant. The software logs clock time, elapsed time since the start of the session, elapsed time for this set of ten strings, number of errors in this set of ten strings, the composition (in digits 1, 4, and 9) of the strings in the set, duration per string, and the exact response per string (including the use of the tab key).
Suunto heart rate monitors
Heart rate measurements are conducted using the Suunto Team Track Pro system, consisting of wireless heart rate monitors using ANT technology, a Team Pod receiver, and software for monitoring and analysis of the heart rate data. The system transmits and receives the inter-beat (R-R) interval in real time, and data is recorded on a PC against the current time in heart beats per minute and in inter-beat intervals in milliseconds. The system has been found to be reliable for heart rate (variability) analysis (Weippert et al., 2010). The monitor is worn on the chest against the bare skin. Conductive paste is used to ensure that the sensors receive a signal.
Self-reports
Participants are requested after each set of ten strings to report their current feeling on paper. The required response consists of answers to the following questions:
What will you do now? - open question allowing for free text input;
126
How are you feeling? - continuous (interval) scale from -5 to +5 requesting a digit response;
How confident are you in meeting the task objective? - continuous (interval) scale presented as Likert items.
The self report form is reproduced in Appendix E: Self-report form.
Video registration and analysis
The participants were registered using a video camera with analogue to digital transformation or a webcam. Both systems included an audio channel. Coding and analysis of the video registration was conducted separately, after completion of the experiments. Analysis of the video was conducted using Interact software with the Highlight Movie Creator add-on, both by Mangold59. By combining time and response data exported from WARP with the video in Interact, it was easy to find and code specific events.
59 www.mangold.de
127
7. Results of study 1
Two studies have been conducted within the scope of the experimental study. The general set-up of the experimental study that is common to both studies has been discussed in the previous chapter. In this chapter the participants for study 1 are discussed in more detail (section 7.1) and it is ensured that the manipulation has been successful (section 7.2). The results of study 1 are then presented (section 7.3) and these are discussed in the concluding section (7.4). A more general discussion follows in chapter 9 for both studies combined, after the results for study 2 have been presented in the next chapter.
7.1. Participants
In total 81 participants participated in study 1, as depicted in Table 16 (page 128). The interaction between the various participant variables is discussed in the next paragraph.
Correlations between descriptive variables
As can be expected, there are significant correlations between age and educationlevel: X2(df =12, N=81) = 66, exact p < 0.001; age and current function: X2(df =12, N=81) = 79, exact p < 0.001; and current function and education level: X2(df =16, N=81) = 98, exact p < 0.001. Due to the fact that participants were recruited from companies active in aerospace engineering (and not other types of design companies), there is a correlation between age and education discipline: X2(df =9, N=81) = 29, exact p < 0.001; education level and education discipline: X2(df =12, N=81) = 45, exact p < 0.001; and current function and education discipline: X2(df =12, N=81) = 40, exact p < 0.001.
Design Engineering attracts relatively more females than does Aerospace Engineering. This is apparent in the participant population for gender and education discipline: X2(df =3, N=81) = 16, exact p < 0.001; and summarized in Table 17 (page 129). In combination with the fact that participants were recruited from companies active in aerospace engineering, this leads to correlations between gender and age: X2(df =3, N=81) = 8.1, exact p = 0.007;
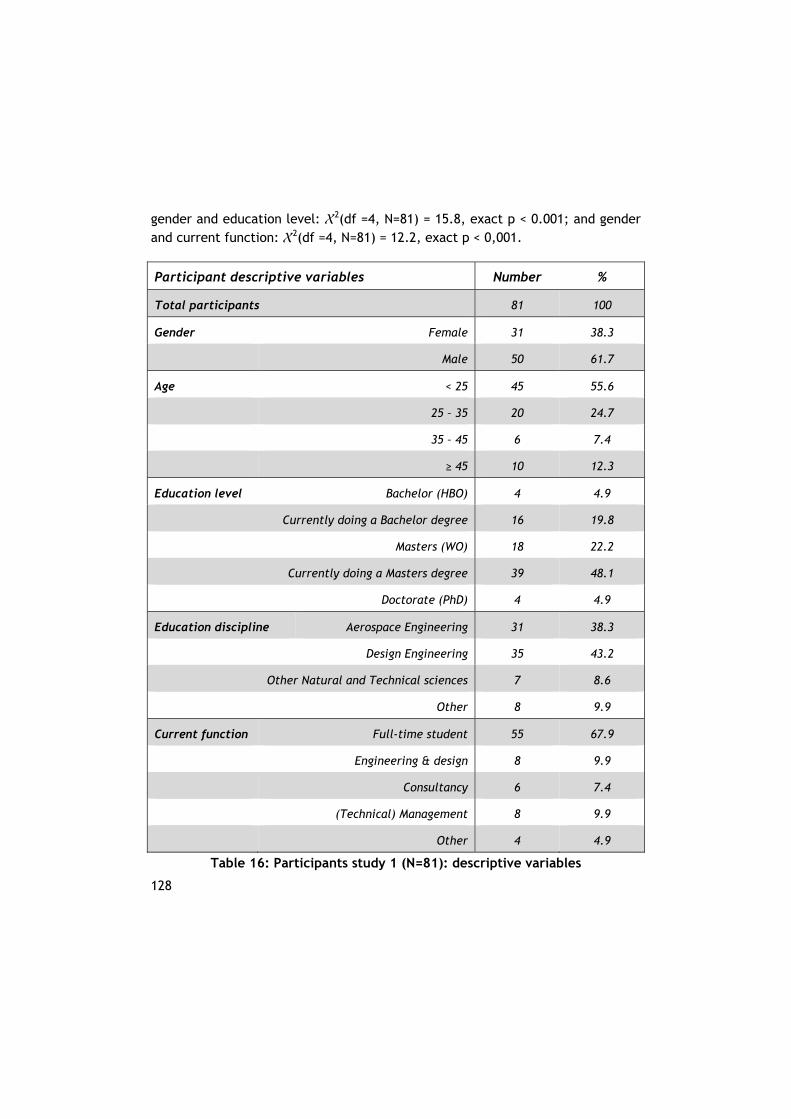
128
gender and education level: X2(df =4, N=81) = 15.8, exact p < 0.001; and gender and current function: X2(df =4, N=81) = 12.2, exact p < 0,001.
Participant descriptive variables Number %
Total participants 81 100
Gender Female 31 38.3
Male 50 61.7
Age < 25 45 55.6
25 – 35 20 24.7
35 – 45 6 7.4
≥ 45 10 12.3
Education level Bachelor (HBO) 4 4.9
Currently doing a Bachelor degree 16 19.8
Masters (WO) 18 22.2
Currently doing a Masters degree 39 48.1
Doctorate (PhD) 4 4.9
Education discipline Aerospace Engineering 31 38.3
Design Engineering 35 43.2
Other Natural and Technical sciences 7 8.6
Other 8 9.9
Current function Full-time student 55 67.9
Engineering & design 8 9.9
Consultancy 6 7.4
(Technical) Management 8 9.9
Other 4 4.9
Table 16: Participants study 1 (N=81): descriptive variables
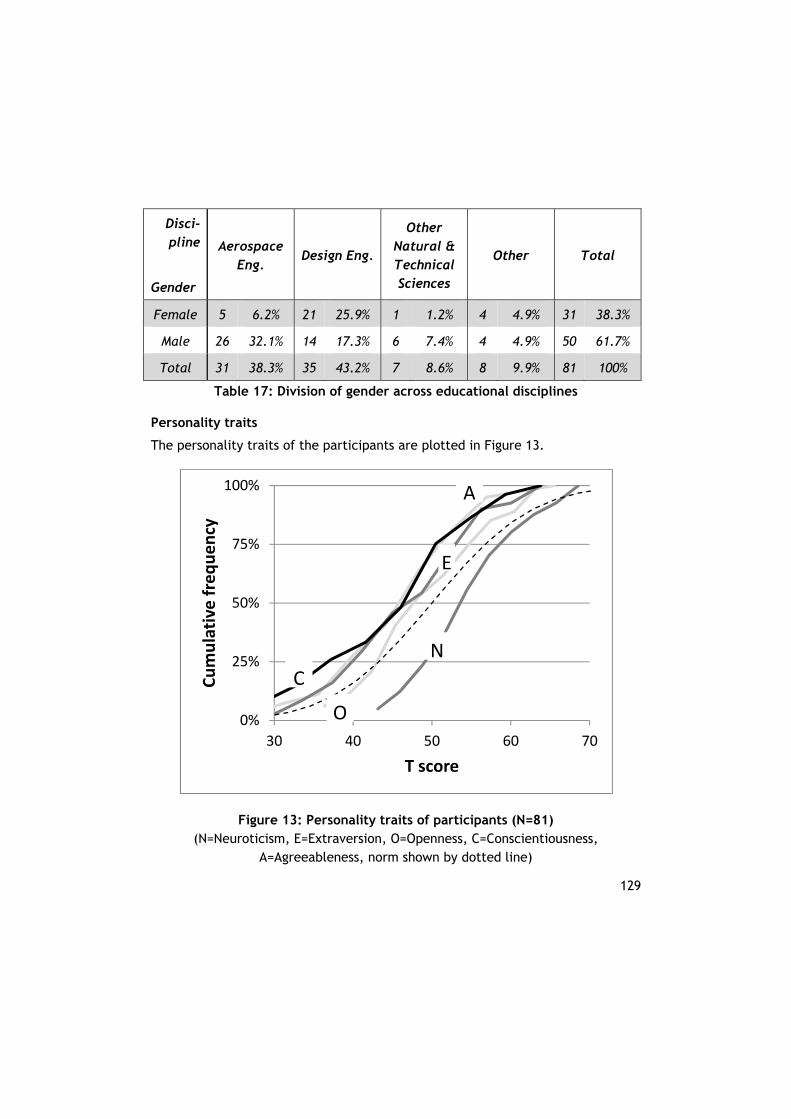
129
Disci-pline
Gender
Aerospace Eng.
Design Eng.
Other Natural & Technical Sciences
Other Total
Female 5 6.2% 21 25.9% 1 1.2% 4 4.9% 31 38.3%
Male 26 32.1% 14 17.3% 6 7.4% 4 4.9% 50 61.7%
Total 31 38.3% 35 43.2% 7 8.6% 8 9.9% 81 100%
Table 17: Division of gender across educational disciplines
Personality traits
The personality traits of the participants are plotted in Figure 13.
Figure 13: Personality traits of participants (N=81) (N=Neuroticism, E=Extraversion, O=Openness, C=Conscientiousness,
A=Agreeableness, norm shown by dotted line)
0%
25%
50%
75%
100%
30 40 50 60 70
Cumulative frequency
T score
N
C
O
E
A
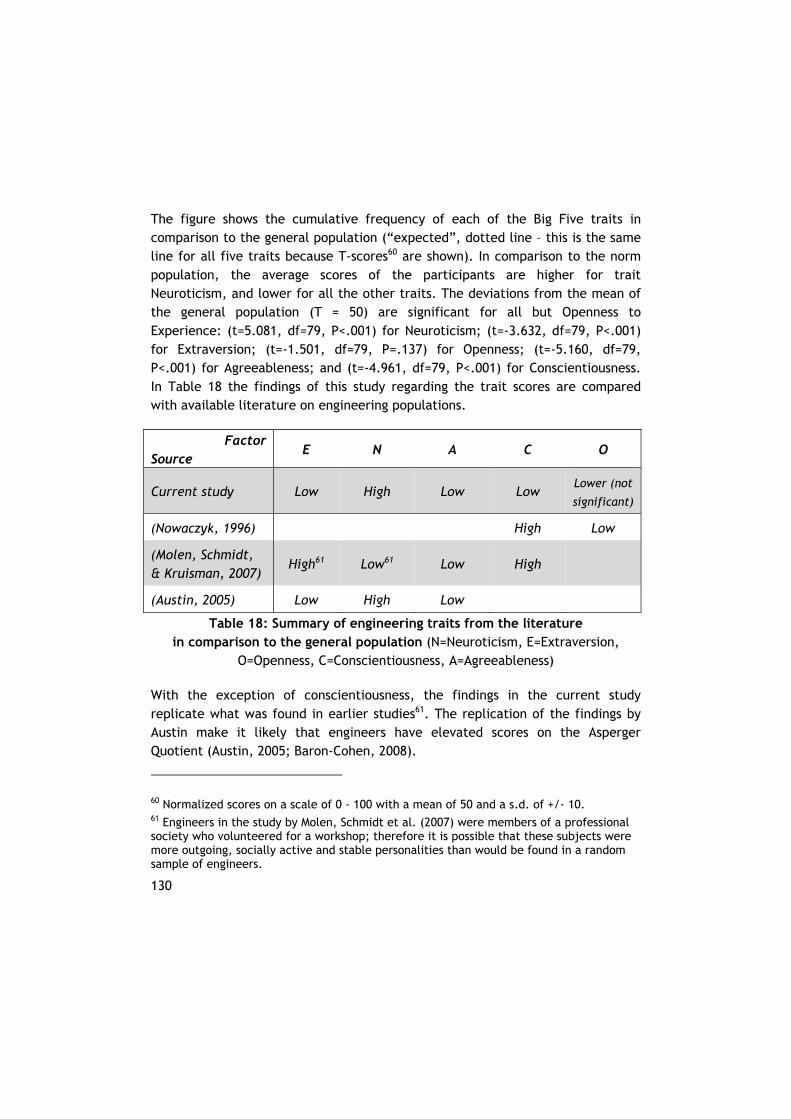
130
The figure shows the cumulative frequency of each of the Big Five traits in comparison to the general population (“expected”, dotted line – this is the same line for all five traits because T-scores60 are shown). In comparison to the norm population, the average scores of the participants are higher for trait Neuroticism, and lower for all the other traits. The deviations from the mean of the general population (T = 50) are significant for all but Openness to Experience: (t=5.081, df=79, P<.001) for Neuroticism; (t=-3.632, df=79, P<.001) for Extraversion; (t=-1.501, df=79, P=.137) for Openness; (t=-5.160, df=79, P<.001) for Agreeableness; and (t=-4.961, df=79, P<.001) for Conscientiousness. In Table 18 the findings of this study regarding the trait scores are compared with available literature on engineering populations.
Factor Source
E N A C O
Current study Low High Low Low Lower (not
significant)
(Nowaczyk, 1996) High Low
(Molen, Schmidt, & Kruisman, 2007)
High61 Low61 Low High
(Austin, 2005) Low High Low
Table 18: Summary of engineering traits from the literature in comparison to the general population (N=Neuroticism, E=Extraversion,
O=Openness, C=Conscientiousness, A=Agreeableness)
With the exception of conscientiousness, the findings in the current study replicate what was found in earlier studies61. The replication of the findings by Austin make it likely that engineers have elevated scores on the Asperger Quotient (Austin, 2005; Baron-Cohen, 2008).
60 Normalized scores on a scale of 0 - 100 with a mean of 50 and a s.d. of +/- 10. 61 Engineers in the study by Molen, Schmidt et al. (2007) were members of a professional society who volunteered for a workshop; therefore it is possible that these subjects were more outgoing, socially active and stable personalities than would be found in a random sample of engineers.
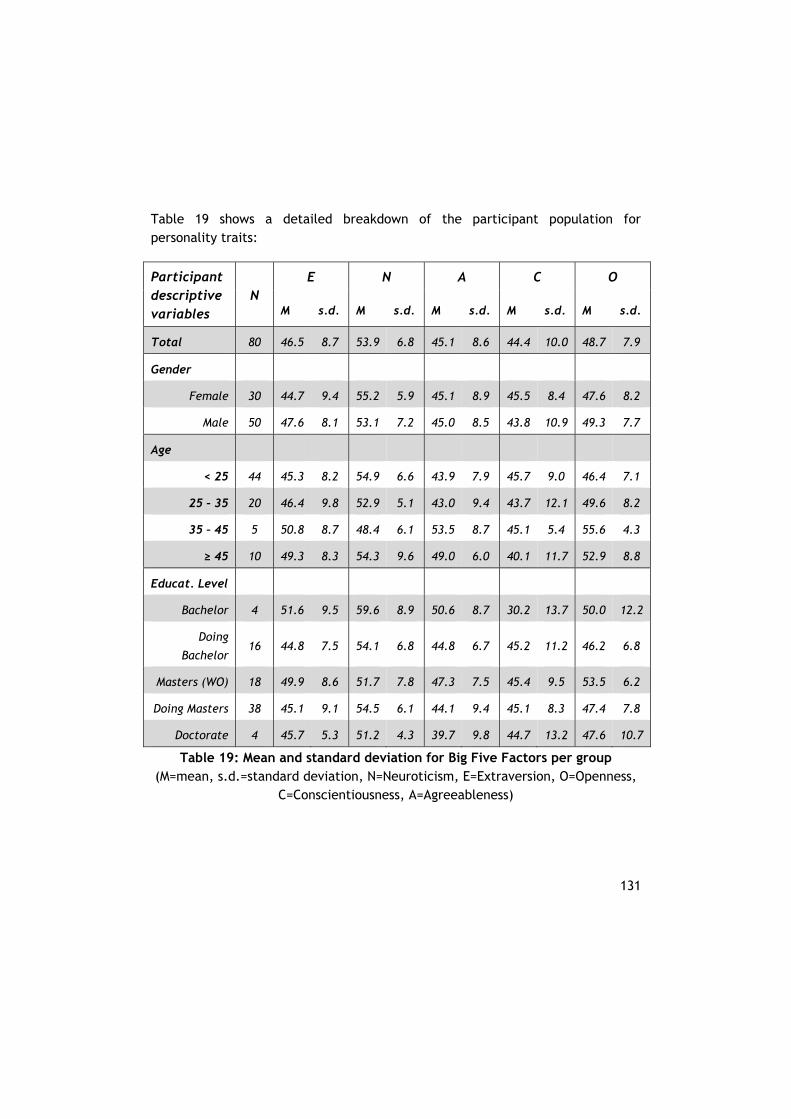
131
Table 19 shows a detailed breakdown of the participant population for personality traits:
Participant descriptive variables
N E N A C O
M s.d. M s.d. M s.d. M s.d. M s.d.
Total 80 46.5 8.7 53.9 6.8 45.1 8.6 44.4 10.0 48.7 7.9
Gender
Female 30 44.7 9.4 55.2 5.9 45.1 8.9 45.5 8.4 47.6 8.2
Male 50 47.6 8.1 53.1 7.2 45.0 8.5 43.8 10.9 49.3 7.7
Age
< 25 44 45.3 8.2 54.9 6.6 43.9 7.9 45.7 9.0 46.4 7.1
25 – 35 20 46.4 9.8 52.9 5.1 43.0 9.4 43.7 12.1 49.6 8.2
35 – 45 5 50.8 8.7 48.4 6.1 53.5 8.7 45.1 5.4 55.6 4.3
≥ 45 10 49.3 8.3 54.3 9.6 49.0 6.0 40.1 11.7 52.9 8.8
Educat. Level
Bachelor 4 51.6 9.5 59.6 8.9 50.6 8.7 30.2 13.7 50.0 12.2
Doing
Bachelor 16 44.8 7.5 54.1 6.8 44.8 6.7 45.2 11.2 46.2 6.8
Masters (WO) 18 49.9 8.6 51.7 7.8 47.3 7.5 45.4 9.5 53.5 6.2
Doing Masters 38 45.1 9.1 54.5 6.1 44.1 9.4 45.1 8.3 47.4 7.8
Doctorate 4 45.7 5.3 51.2 4.3 39.7 9.8 44.7 13.2 47.6 10.7
Table 19: Mean and standard deviation for Big Five Factors per group (M=mean, s.d.=standard deviation, N=Neuroticism, E=Extraversion, O=Openness,
C=Conscientiousness, A=Agreeableness)
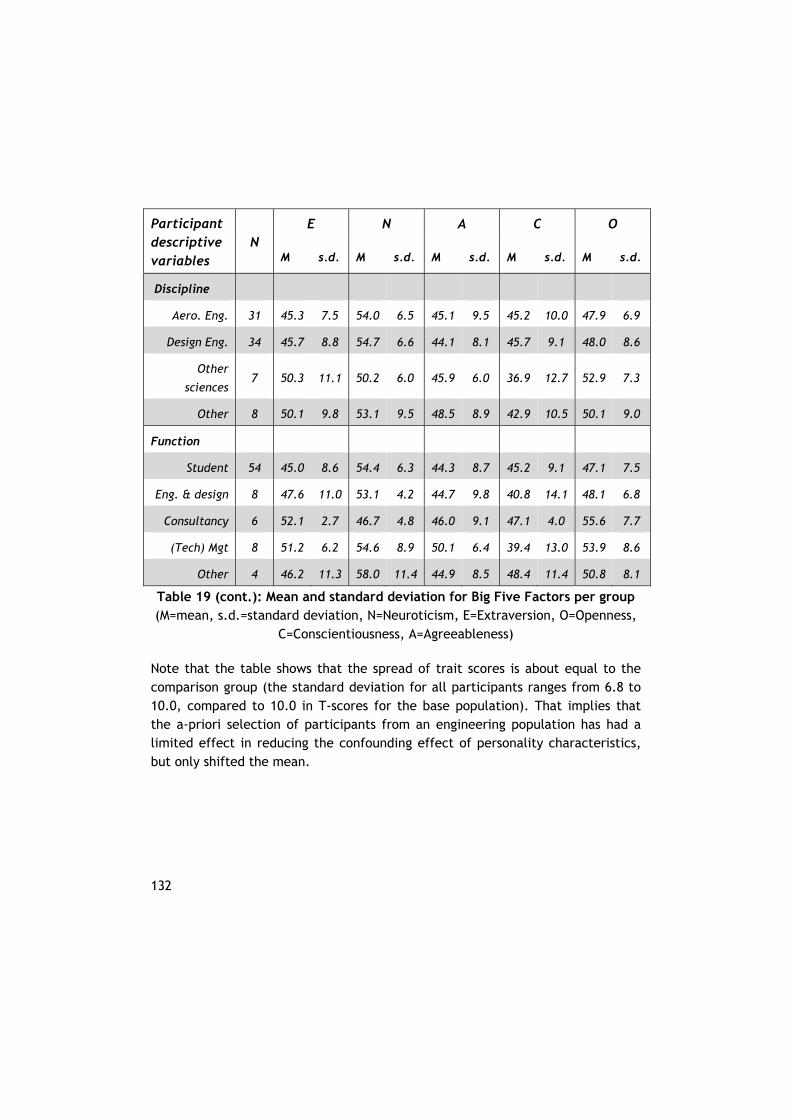
132
Participant descriptive variables
N E N A C O
M s.d. M s.d. M s.d. M s.d. M s.d.
Discipline
Aero. Eng. 31 45.3 7.5 54.0 6.5 45.1 9.5 45.2 10.0 47.9 6.9
Design Eng. 34 45.7 8.8 54.7 6.6 44.1 8.1 45.7 9.1 48.0 8.6
Other
sciences 7 50.3 11.1 50.2 6.0 45.9 6.0 36.9 12.7 52.9 7.3
Other 8 50.1 9.8 53.1 9.5 48.5 8.9 42.9 10.5 50.1 9.0
Function
Student 54 45.0 8.6 54.4 6.3 44.3 8.7 45.2 9.1 47.1 7.5
Eng. & design 8 47.6 11.0 53.1 4.2 44.7 9.8 40.8 14.1 48.1 6.8
Consultancy 6 52.1 2.7 46.7 4.8 46.0 9.1 47.1 4.0 55.6 7.7
(Tech) Mgt 8 51.2 6.2 54.6 8.9 50.1 6.4 39.4 13.0 53.9 8.6
Other 4 46.2 11.3 58.0 11.4 44.9 8.5 48.4 11.4 50.8 8.1
Table 19 (cont.): Mean and standard deviation for Big Five Factors per group (M=mean, s.d.=standard deviation, N=Neuroticism, E=Extraversion, O=Openness,
C=Conscientiousness, A=Agreeableness)
Note that the table shows that the spread of trait scores is about equal to the comparison group (the standard deviation for all participants ranges from 6.8 to 10.0, compared to 10.0 in T-scores for the base population). That implies that the a-priori selection of participants from an engineering population has had a limited effect in reducing the confounding effect of personality characteristics, but only shifted the mean.
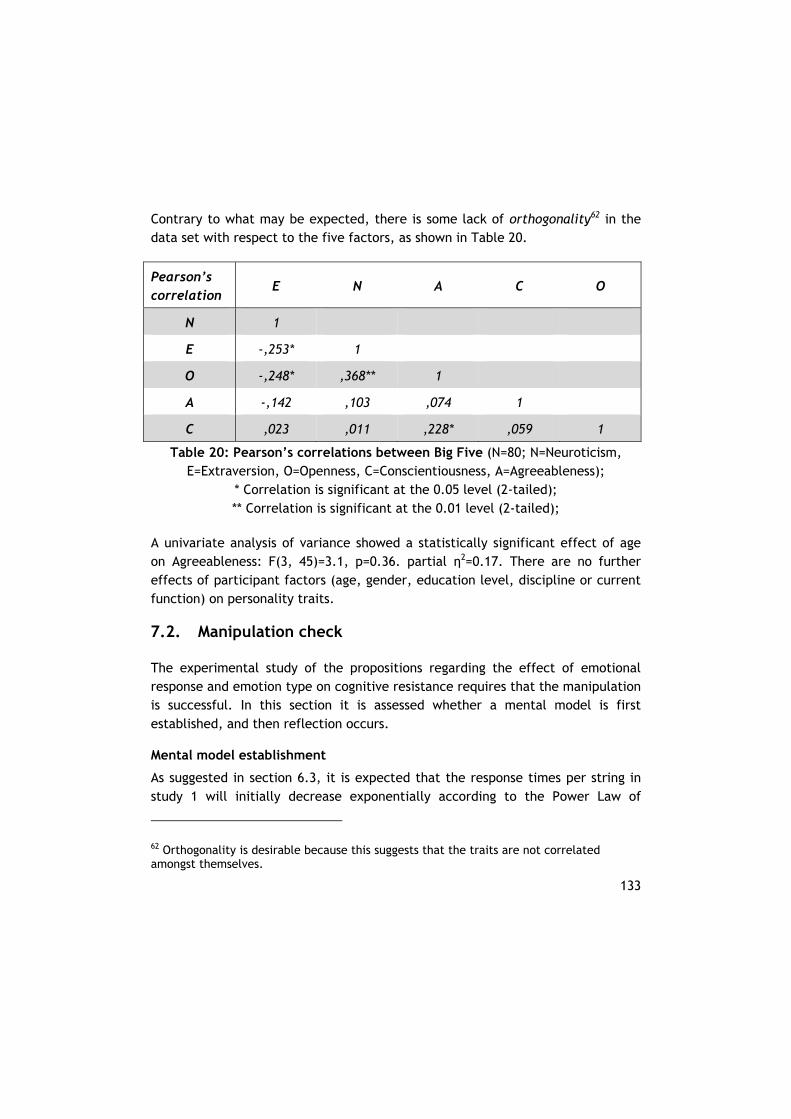
133
Contrary to what may be expected, there is some lack of orthogonality62 in the data set with respect to the five factors, as shown in Table 20.
Pearson’s correlation
E N A C O
N 1
E -,253* 1
O -,248* ,368** 1
A -,142 ,103 ,074 1
C ,023 ,011 ,228* ,059 1
Table 20: Pearson’s correlations between Big Five (N=80; N=Neuroticism, E=Extraversion, O=Openness, C=Conscientiousness, A=Agreeableness);
* Correlation is significant at the 0.05 level (2-tailed); ** Correlation is significant at the 0.01 level (2-tailed);
A univariate analysis of variance showed a statistically significant effect of age on Agreeableness: F(3, 45)=3.1, p=0.36. partial η2=0.17. There are no further effects of participant factors (age, gender, education level, discipline or current function) on personality traits.
7.2. Manipulation check
The experimental study of the propositions regarding the effect of emotional response and emotion type on cognitive resistance requires that the manipulation is successful. In this section it is assessed whether a mental model is first established, and then reflection occurs.
Mental model establishment
As suggested in section 6.3, it is expected that the response times per string in study 1 will initially decrease exponentially according to the Power Law of
62 Orthogonality is desirable because this suggests that the traits are not correlated amongst themselves.
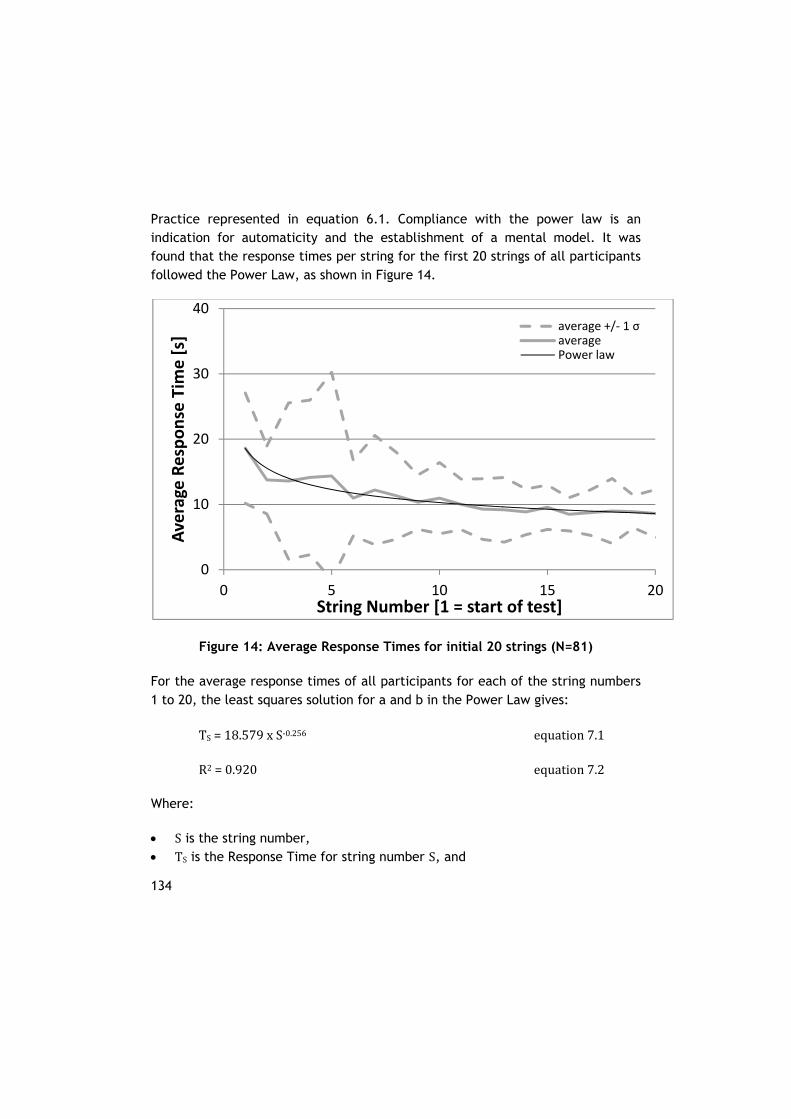
134
Practice represented in equation 6.1. Compliance with the power law is an indication for automaticity and the establishment of a mental model. It was found that the response times per string for the first 20 strings of all participants followed the Power Law, as shown in Figure 14.
Figure 14: Average Response Times for initial 20 strings (N=81)
For the average response times of all participants for each of the string numbers 1 to 20, the least squares solution for a and b in the Power Law gives:
TS=18.579xS‐0.256 equation7.1
R2=0.920 equation7.2
Where:
S is the string number, TS is the Response Time for string number S, and
0
10
20
30
40
0 5 10 15 20
Average Response Tim
e [s]
String Number [1 = start of test]
average +/‐ 1 σaveragePower law
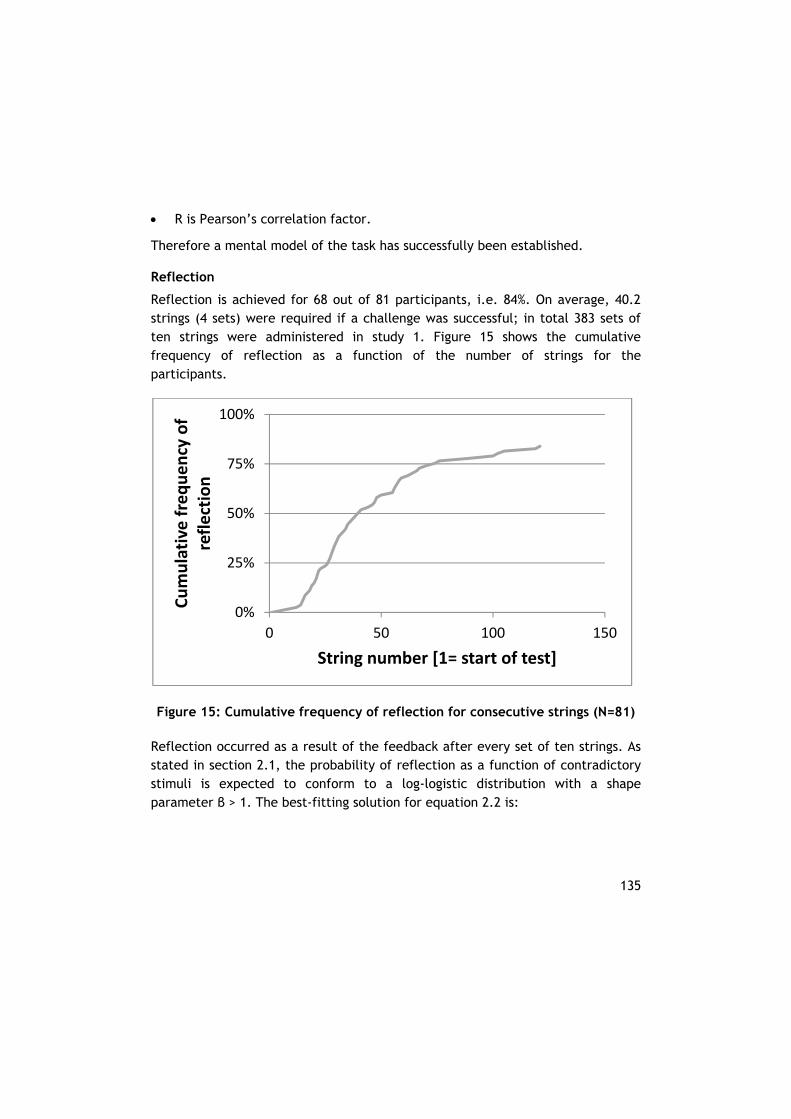
135
R is Pearson’s correlation factor.
Therefore a mental model of the task has successfully been established.
Reflection
Reflection is achieved for 68 out of 81 participants, i.e. 84%. On average, 40.2 strings (4 sets) were required if a challenge was successful; in total 383 sets of ten strings were administered in study 1. Figure 15 shows the cumulative frequency of reflection as a function of the number of strings for the participants.
Figure 15: Cumulative frequency of reflection for consecutive strings (N=81)
Reflection occurred as a result of the feedback after every set of ten strings. As stated in section 2.1, the probability of reflection as a function of contradictory stimuli is expected to conform to a log-logistic distribution with a shape parameter β > 1. The best-fitting solution for equation 2.2 is:
0%
25%
50%
75%
100%
0 50 100 150
Cumulative frequency of
reflection
String number [1= start of test]
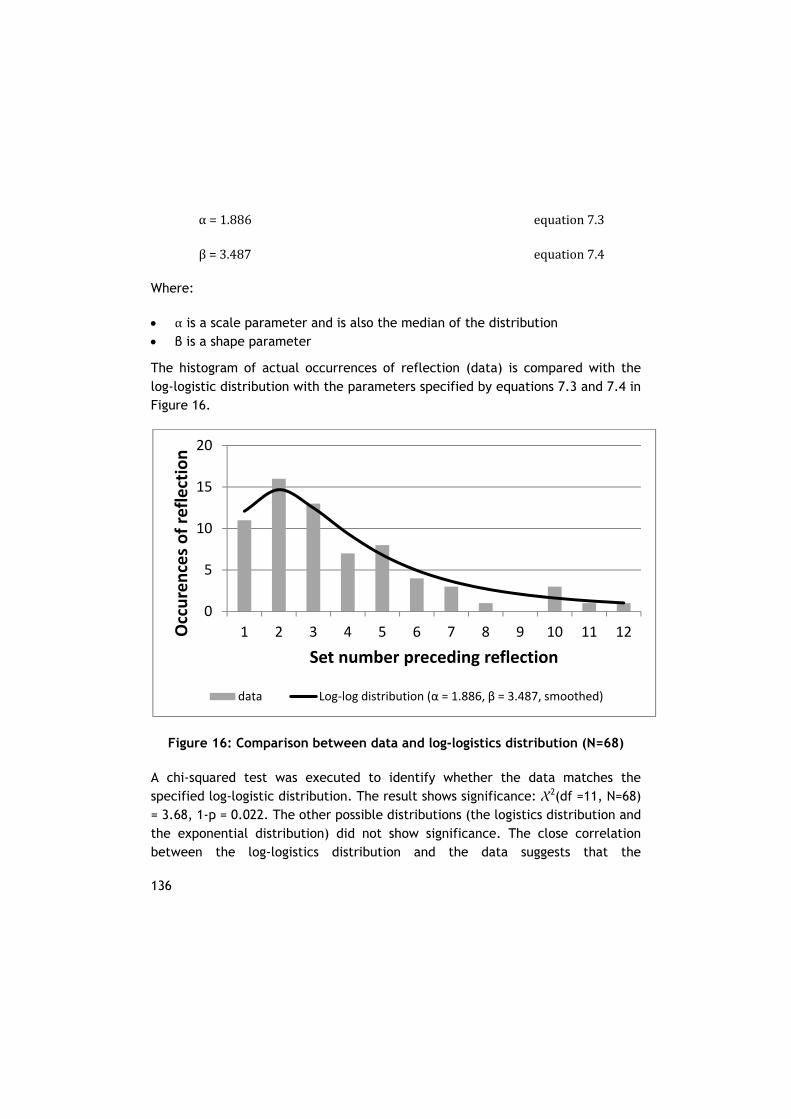
136
α=1.886 equation7.3
β=3.487 equation7.4
Where:
α is a scale parameter and is also the median of the distribution β is a shape parameter
The histogram of actual occurrences of reflection (data) is compared with the log-logistic distribution with the parameters specified by equations 7.3 and 7.4 in Figure 16.
Figure 16: Comparison between data and log-logistics distribution (N=68)
A chi-squared test was executed to identify whether the data matches the specified log-logistic distribution. The result shows significance: X2(df =11, N=68) = 3.68, 1-p = 0.022. The other possible distributions (the logistics distribution and the exponential distribution) did not show significance. The close correlation between the log-logistics distribution and the data suggests that the
0
5
10
15
20
1 2 3 4 5 6 7 8 9 10 11 12Occurences of reflection
Set number preceding reflection
data Log‐log distribution (α = 1.886, β = 3.487, smoothed)
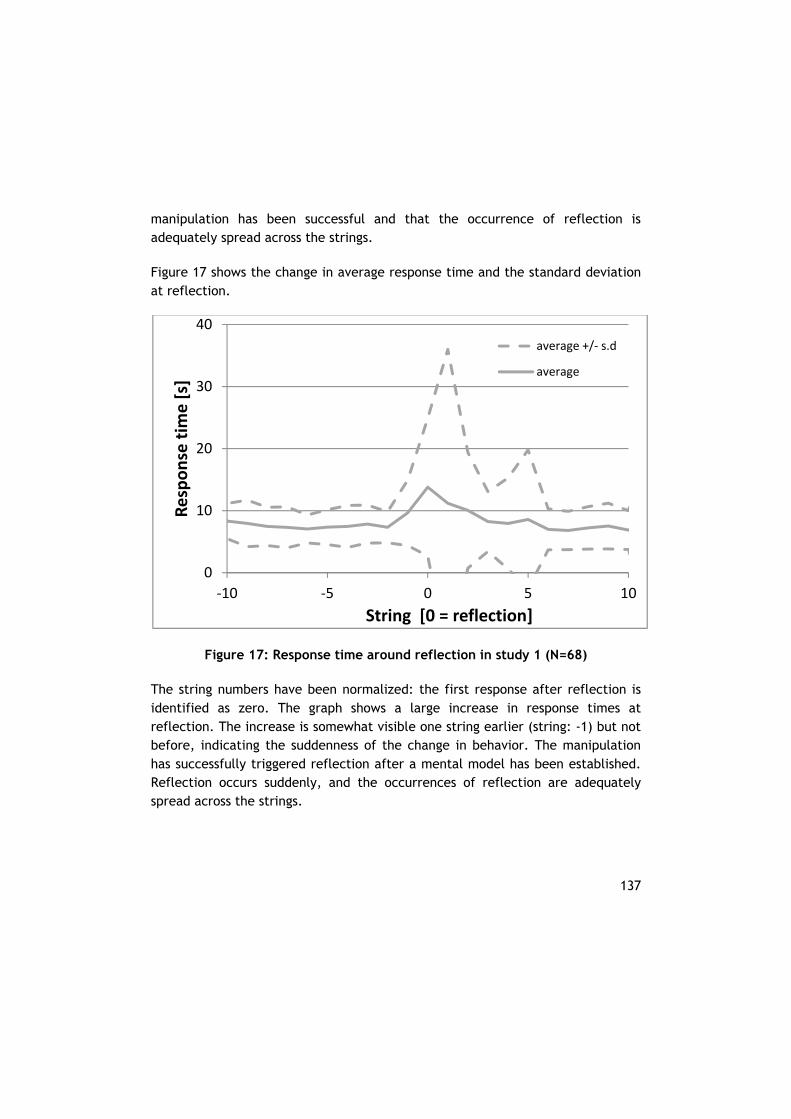
137
manipulation has been successful and that the occurrence of reflection is adequately spread across the strings.
Figure 17 shows the change in average response time and the standard deviation at reflection.
Figure 17: Response time around reflection in study 1 (N=68)
The string numbers have been normalized: the first response after reflection is identified as zero. The graph shows a large increase in response times at reflection. The increase is somewhat visible one string earlier (string: -1) but not before, indicating the suddenness of the change in behavior. The manipulation has successfully triggered reflection after a mental model has been established. Reflection occurs suddenly, and the occurrences of reflection are adequately spread across the strings.
0
10
20
30
40
‐10 ‐5 0 5 10
Response tim
e [s]
String [0 = reflection]
average +/‐ s.d
average
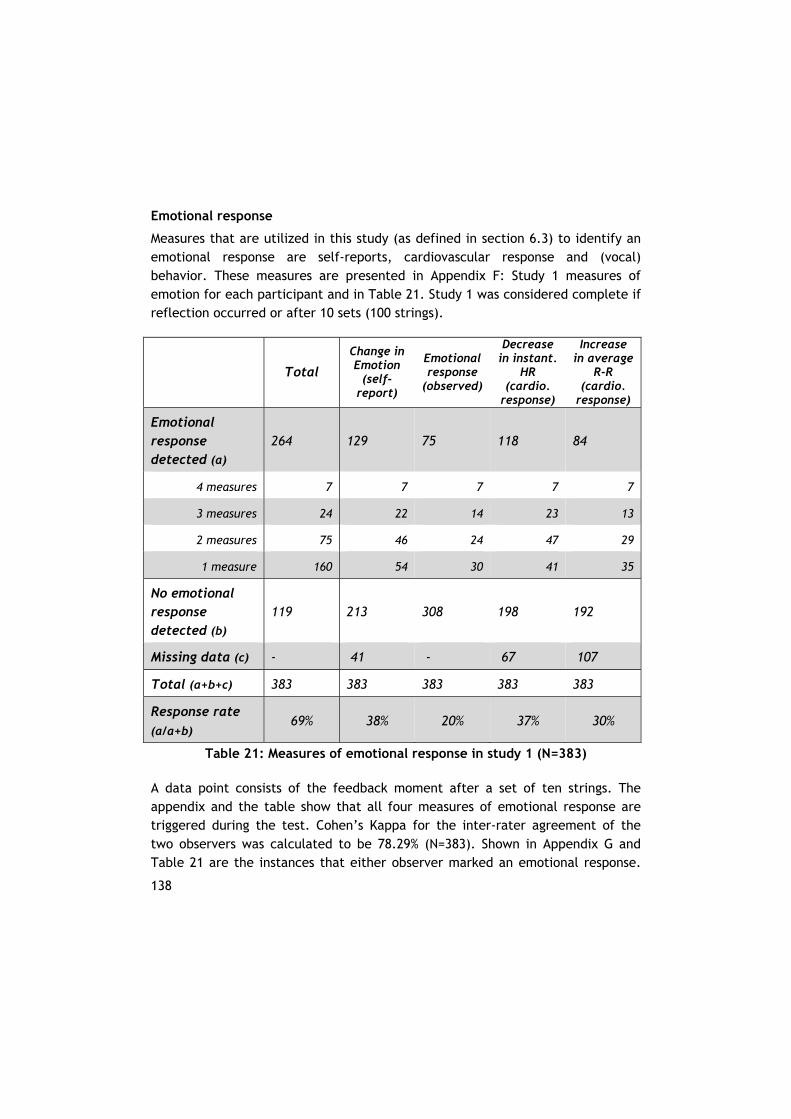
138
Emotional response
Measures that are utilized in this study (as defined in section 6.3) to identify an emotional response are self-reports, cardiovascular response and (vocal) behavior. These measures are presented in Appendix F: Study 1 measures of emotion for each participant and in Table 21. Study 1 was considered complete if reflection occurred or after 10 sets (100 strings).
Total
Change in Emotion
(self-report)
Emotional response
(observed)
Decrease in instant.
HR (cardio.
response)
Increase in average
R-R (cardio.
response)
Emotional response detected (a)
264 129 75 118 84
4 measures 7 7 7 7 7
3 measures 24 22 14 23 13
2 measures 75 46 24 47 29
1 measure 160 54 30 41 35
No emotional response detected (b)
119 213 308 198 192
Missing data (c) - 41 - 67 107
Total (a+b+c) 383 383 383 383 383
Response rate (a/a+b)
69% 38% 20% 37% 30%
Table 21: Measures of emotional response in study 1 (N=383)
A data point consists of the feedback moment after a set of ten strings. The appendix and the table show that all four measures of emotional response are triggered during the test. Cohen’s Kappa for the inter-rater agreement of the two observers was calculated to be 78.29% (N=383). Shown in Appendix G and Table 21 are the instances that either observer marked an emotional response.
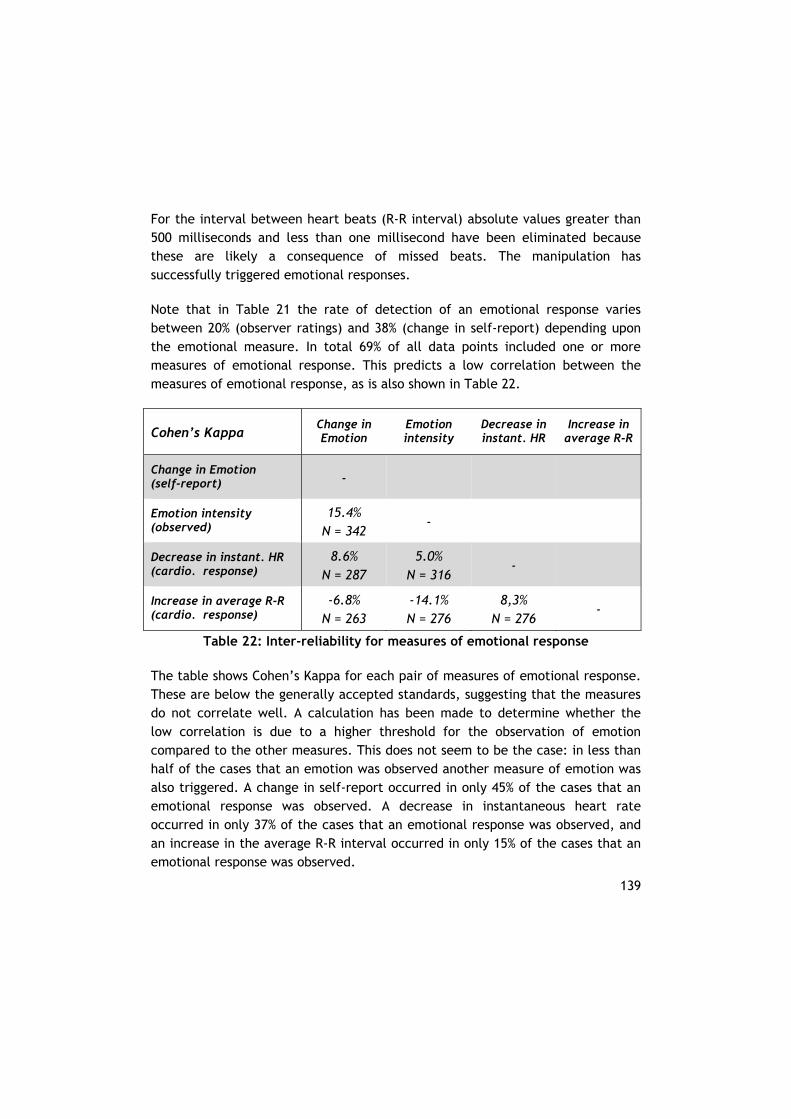
139
For the interval between heart beats (R-R interval) absolute values greater than 500 milliseconds and less than one millisecond have been eliminated because these are likely a consequence of missed beats. The manipulation has successfully triggered emotional responses.
Note that in Table 21 the rate of detection of an emotional response varies between 20% (observer ratings) and 38% (change in self-report) depending upon the emotional measure. In total 69% of all data points included one or more measures of emotional response. This predicts a low correlation between the measures of emotional response, as is also shown in Table 22.
Cohen’s Kappa Change in Emotion
Emotion intensity
Decrease in instant. HR
Increase in average R-R
Change in Emotion (self-report) -
Emotion intensity (observed)
15.4% N = 342
-
Decrease in instant. HR (cardio. response)
8.6% N = 287
5.0% N = 316
-
Increase in average R-R (cardio. response)
-6.8% N = 263
-14.1% N = 276
8,3% N = 276
-
Table 22: Inter-reliability for measures of emotional response
The table shows Cohen’s Kappa for each pair of measures of emotional response. These are below the generally accepted standards, suggesting that the measures do not correlate well. A calculation has been made to determine whether the low correlation is due to a higher threshold for the observation of emotion compared to the other measures. This does not seem to be the case: in less than half of the cases that an emotion was observed another measure of emotion was also triggered. A change in self-report occurred in only 45% of the cases that an emotional response was observed. A decrease in instantaneous heart rate occurred in only 37% of the cases that an emotional response was observed, and an increase in the average R-R interval occurred in only 15% of the cases that an emotional response was observed.
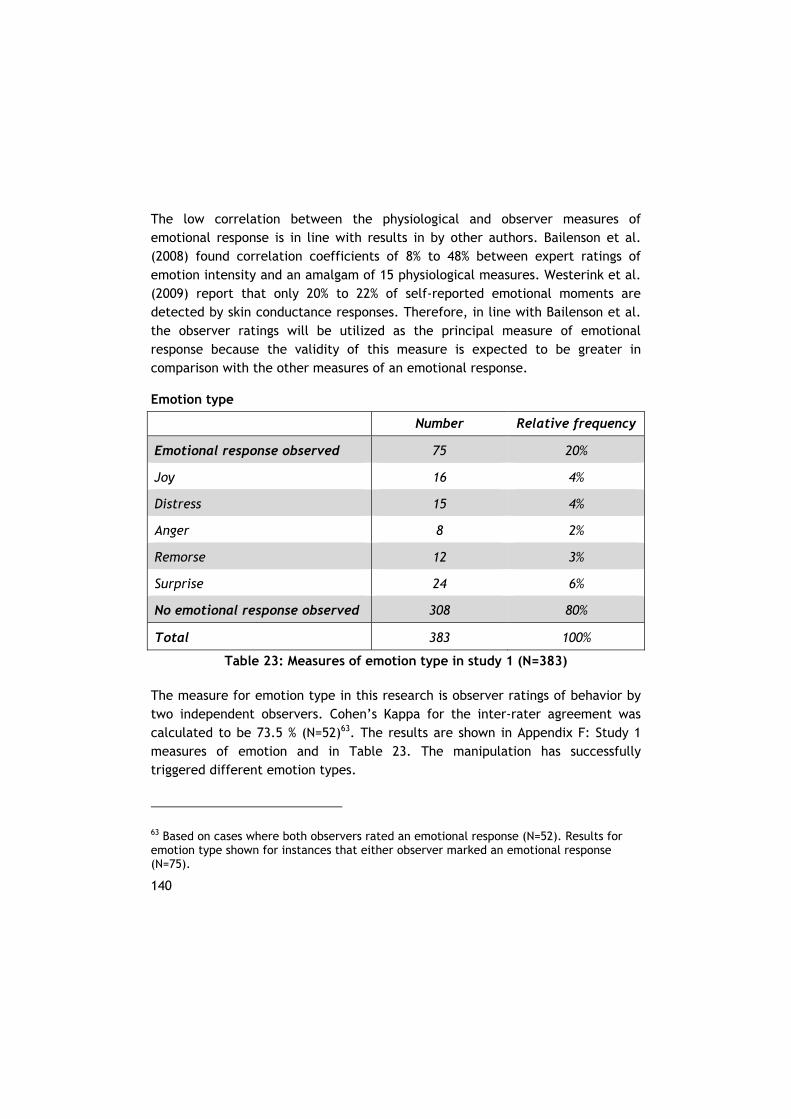
140
The low correlation between the physiological and observer measures of emotional response is in line with results in by other authors. Bailenson et al. (2008) found correlation coefficients of 8% to 48% between expert ratings of emotion intensity and an amalgam of 15 physiological measures. Westerink et al. (2009) report that only 20% to 22% of self-reported emotional moments are detected by skin conductance responses. Therefore, in line with Bailenson et al. the observer ratings will be utilized as the principal measure of emotional response because the validity of this measure is expected to be greater in comparison with the other measures of an emotional response.
Emotion type
Number Relative frequency
Emotional response observed 75 20%
Joy 16 4%
Distress 15 4%
Anger 8 2%
Remorse 12 3%
Surprise 24 6%
No emotional response observed 308 80%
Total 383 100%
Table 23: Measures of emotion type in study 1 (N=383)
The measure for emotion type in this research is observer ratings of behavior by two independent observers. Cohen’s Kappa for the inter-rater agreement was calculated to be 73.5 % (N=52)63. The results are shown in Appendix F: Study 1 measures of emotion and in Table 23. The manipulation has successfully triggered different emotion types.
63 Based on cases where both observers rated an emotional response (N=52). Results for emotion type shown for instances that either observer marked an emotional response (N=75).
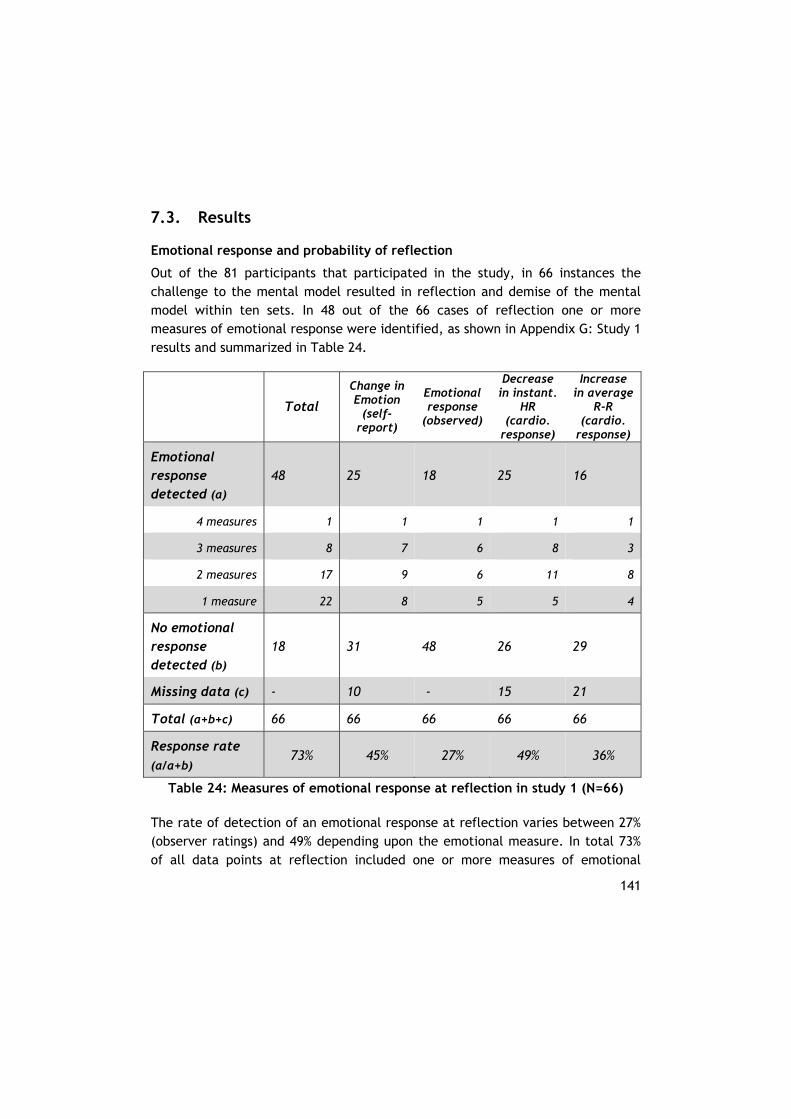
141
7.3. Results
Emotional response and probability of reflection
Out of the 81 participants that participated in the study, in 66 instances the challenge to the mental model resulted in reflection and demise of the mental model within ten sets. In 48 out of the 66 cases of reflection one or more measures of emotional response were identified, as shown in Appendix G: Study 1 results and summarized in Table 24.
Total
Change in Emotion
(self-report)
Emotional response
(observed)
Decrease in instant.
HR (cardio.
response)
Increase in average
R-R (cardio.
response)
Emotional response detected (a)
48 25 18 25 16
4 measures 1 1 1 1 1
3 measures 8 7 6 8 3
2 measures 17 9 6 11 8
1 measure 22 8 5 5 4
No emotional response detected (b)
18 31 48 26 29
Missing data (c) - 10 - 15 21
Total (a+b+c) 66 66 66 66 66
Response rate (a/a+b)
73% 45% 27% 49% 36%
Table 24: Measures of emotional response at reflection in study 1 (N=66)
The rate of detection of an emotional response at reflection varies between 27% (observer ratings) and 49% depending upon the emotional measure. In total 73% of all data points at reflection included one or more measures of emotional
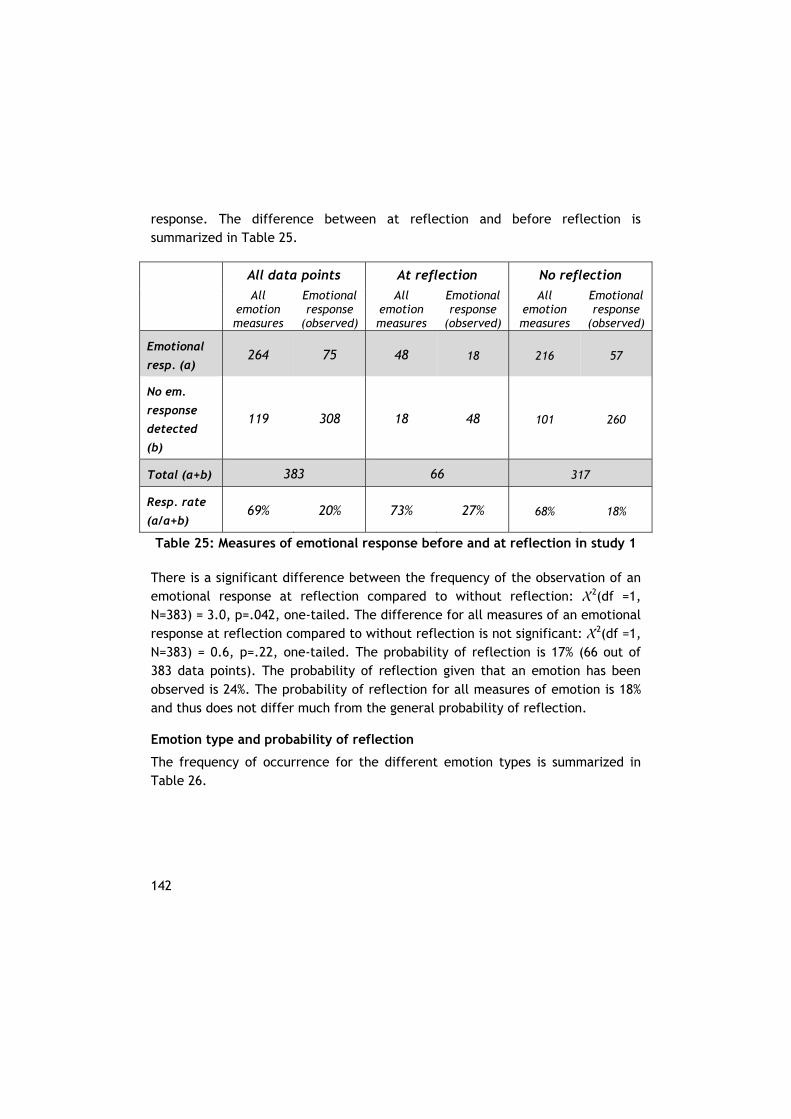
142
response. The difference between at reflection and before reflection is summarized in Table 25.
All data points At reflection No reflection
All
emotion measures
Emotional response
(observed)
All emotion measures
Emotional response
(observed)
All emotion measures
Emotional response
(observed)
Emotional
resp. (a) 264 75 48 18 216 57
No em.
response
detected
(b)
119 308 18 48 101 260
Total (a+b) 383 66 317
Resp. rate
(a/a+b) 69% 20% 73% 27% 68% 18%
Table 25: Measures of emotional response before and at reflection in study 1
There is a significant difference between the frequency of the observation of an emotional response at reflection compared to without reflection: X2(df =1, N=383) = 3.0, p=.042, one-tailed. The difference for all measures of an emotional response at reflection compared to without reflection is not significant: X2(df =1, N=383) = 0.6, p=.22, one-tailed. The probability of reflection is 17% (66 out of 383 data points). The probability of reflection given that an emotion has been observed is 24%. The probability of reflection for all measures of emotion is 18% and thus does not differ much from the general probability of reflection.
Emotion type and probability of reflection
The frequency of occurrence for the different emotion types is summarized in Table 26.
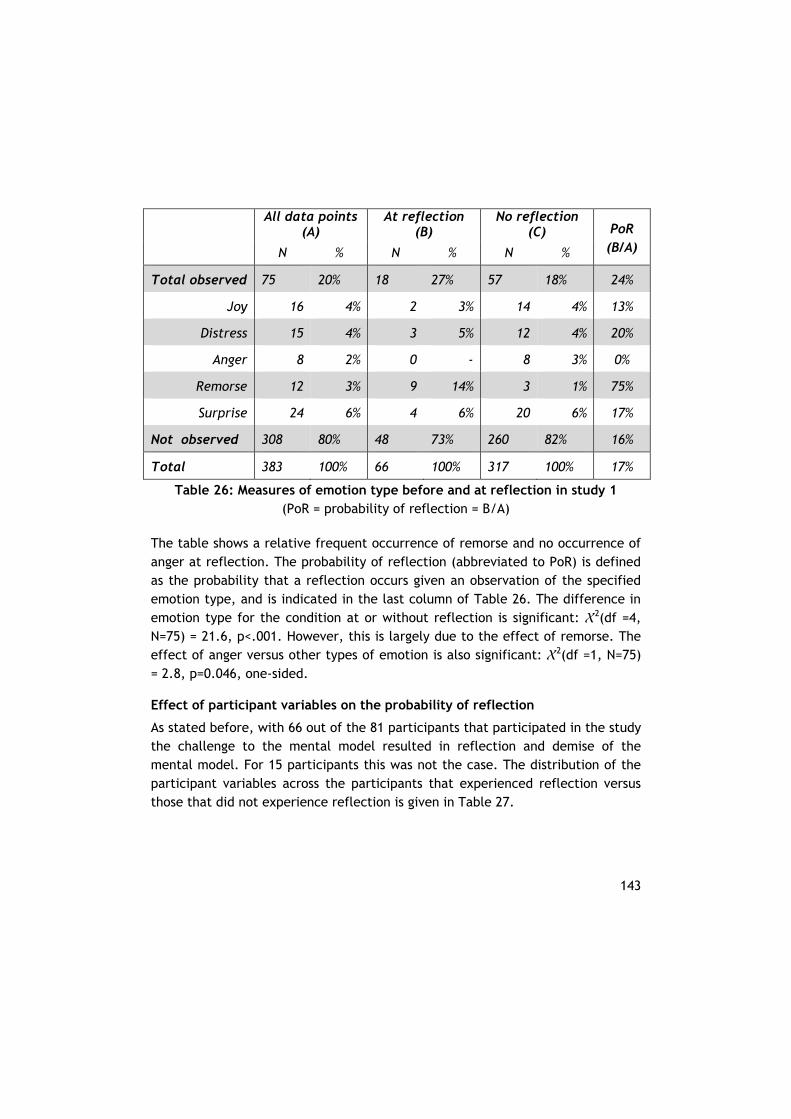
143
All data points
(A) At reflection
(B) No reflection
(C) PoR (B/A) N % N % N %
Total observed 75 20% 18 27% 57 18% 24%
Joy 16 4% 2 3% 14 4% 13%
Distress 15 4% 3 5% 12 4% 20%
Anger 8 2% 0 - 8 3% 0%
Remorse 12 3% 9 14% 3 1% 75%
Surprise 24 6% 4 6% 20 6% 17%
Not observed 308 80% 48 73% 260 82% 16%
Total 383 100% 66 100% 317 100% 17%
Table 26: Measures of emotion type before and at reflection in study 1 (PoR = probability of reflection = B/A)
The table shows a relative frequent occurrence of remorse and no occurrence of anger at reflection. The probability of reflection (abbreviated to PoR) is defined as the probability that a reflection occurs given an observation of the specified emotion type, and is indicated in the last column of Table 26. The difference in emotion type for the condition at or without reflection is significant: X2(df =4, N=75) = 21.6, p<.001. However, this is largely due to the effect of remorse. The effect of anger versus other types of emotion is also significant: X2(df =1, N=75) = 2.8, p=0.046, one-sided.
Effect of participant variables on the probability of reflection
As stated before, with 66 out of the 81 participants that participated in the study the challenge to the mental model resulted in reflection and demise of the mental model. For 15 participants this was not the case. The distribution of the participant variables across the participants that experienced reflection versus those that did not experience reflection is given in Table 27.
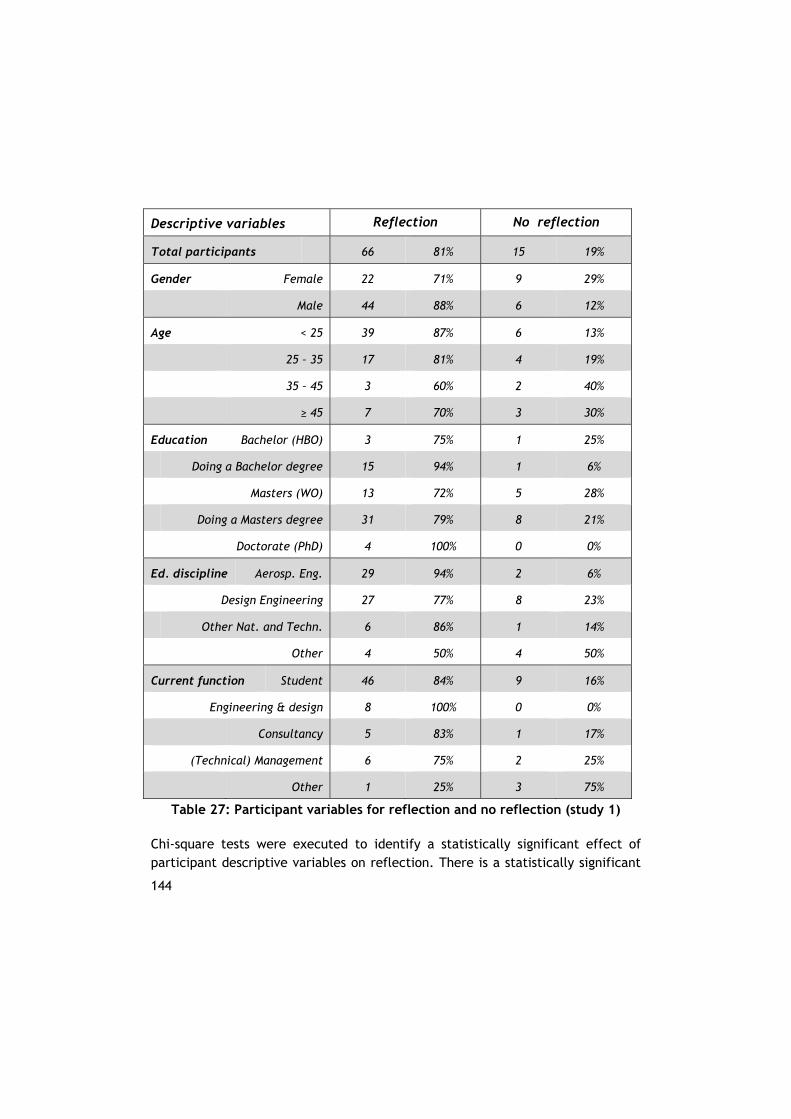
144
Descriptive variables Reflection No reflection
Total participants 66 81% 15 19%
Gender Female 22 71% 9 29%
Male 44 88% 6 12%
Age < 25 39 87% 6 13%
25 – 35 17 81% 4 19%
35 – 45 3 60% 2 40%
≥ 45 7 70% 3 30%
Education Bachelor (HBO) 3 75% 1 25%
Doing a Bachelor degree 15 94% 1 6%
Masters (WO) 13 72% 5 28%
Doing a Masters degree 31 79% 8 21%
Doctorate (PhD) 4 100% 0 0%
Ed. discipline Aerosp. Eng. 29 94% 2 6%
Design Engineering 27 77% 8 23%
Other Nat. and Techn. 6 86% 1 14%
Other 4 50% 4 50%
Current function Student 46 84% 9 16%
Engineering & design 8 100% 0 0%
Consultancy 5 83% 1 17%
(Technical) Management 6 75% 2 25%
Other 1 25% 3 75%
Table 27: Participant variables for reflection and no reflection (study 1)
Chi-square tests were executed to identify a statistically significant effect of participant descriptive variables on reflection. There is a statistically significant
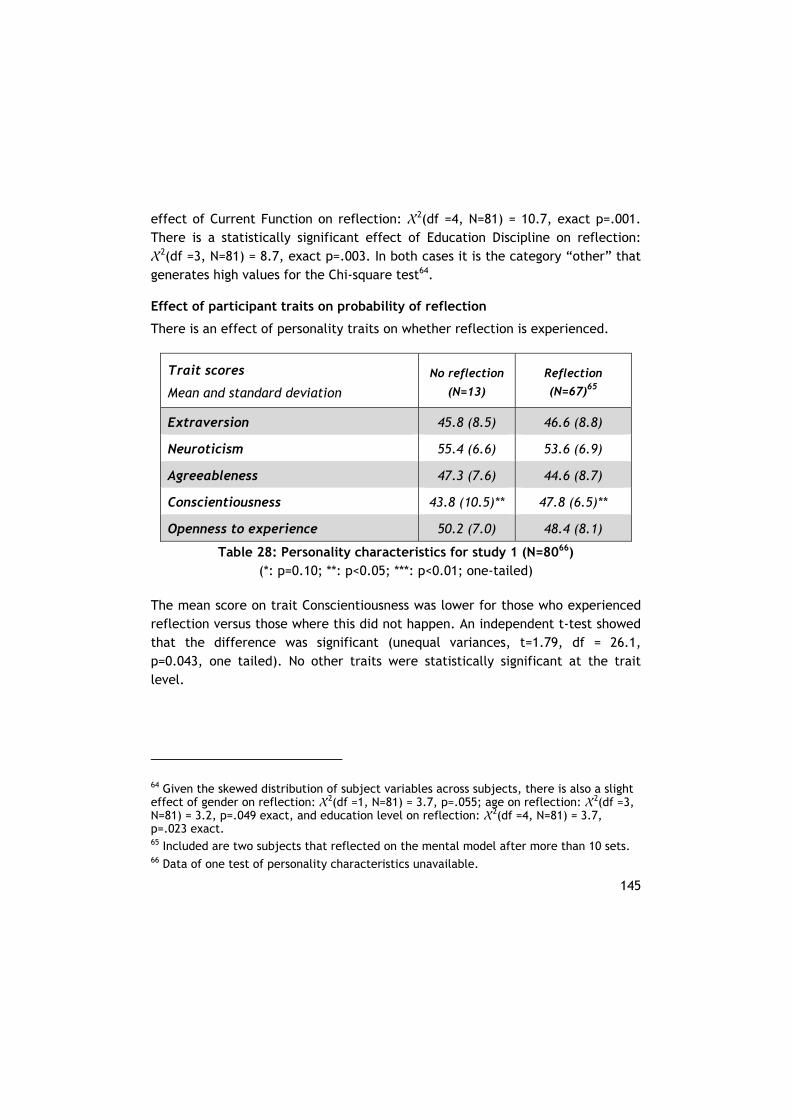
145
effect of Current Function on reflection: X2(df =4, N=81) = 10.7, exact p=.001. There is a statistically significant effect of Education Discipline on reflection: X2(df =3, N=81) = 8.7, exact p=.003. In both cases it is the category “other” that generates high values for the Chi-square test64.
Effect of participant traits on probability of reflection
There is an effect of personality traits on whether reflection is experienced.
Trait scores
Mean and standard deviation
No reflection
(N=13)
Reflection
(N=67)65
Extraversion 45.8 (8.5) 46.6 (8.8)
Neuroticism 55.4 (6.6) 53.6 (6.9)
Agreeableness 47.3 (7.6) 44.6 (8.7)
Conscientiousness 43.8 (10.5)** 47.8 (6.5)**
Openness to experience 50.2 (7.0) 48.4 (8.1)
Table 28: Personality characteristics for study 1 (N=8066) (*: p=0.10; **: p<0.05; ***: p<0.01; one-tailed)
The mean score on trait Conscientiousness was lower for those who experienced reflection versus those where this did not happen. An independent t-test showed that the difference was significant (unequal variances, t=1.79, df = 26.1, p=0.043, one tailed). No other traits were statistically significant at the trait level.
64 Given the skewed distribution of subject variables across subjects, there is also a slight effect of gender on reflection: X2(df =1, N=81) = 3.7, p=.055; age on reflection: X2(df =3, N=81) = 3.2, p=.049 exact, and education level on reflection: X2(df =4, N=81) = 3.7, p=.023 exact. 65 Included are two subjects that reflected on the mental model after more than 10 sets. 66 Data of one test of personality characteristics unavailable.
146
7.4. Discussion
In study 1 it is aimed to validate the propositions that have been generated through the review of the literature in response to the research questions. This is addressed in this section. The limitations to study 1 are also discussed. The results of study 2 are addressed in chapter 8. A general discussion follows in chapter 9 on the answers to the research questions.
7.4.1. Validation of propositions In study 1 it is aimed to validate the propositions on the components of cognitive (chapter 3), the interaction between the components of cognitive resistance (chapter 4), and the environmental and intra-subject factors that influence cognitive resistance (chapter 5). The validation of each of these propositions is discussed below.
Components of cognitive resistance
The results of study 1 support the proposition of chapter 3 that the components of cognitive resistance are primary perception, stimulus matching, appraisal and emotions in the sense of an emotional response and emotion type. Primary perception is a prerequisite for emotion elicitation and reflection. Stimulus matching is a prerequisite for reflection. Appraisal is a prerequisite for emotion elicitation. Emotions have been elicited in the course of cognitive resistance, and it was possible to describe them in terms of an emotional response as well as emotion type (Table 21 and Table 23). Reflection occurred (Figure 15)Figure 22: Cumulative frequency of reflection for consecutive error messages (N=29), marking the end of cognitive resistance.
Interaction of components
The results of study 1 support the first two propositions on the interaction between the components of cognitive resistance (chapter 4):
reflection has occurred as a result of contradictory stimuli (Figure 15), validating the effect of neural activation of primary perception on stimulus matching; and
147
emotional responses have been elicited as a result of contradictory stimuli prior to reflection (Table 21), validating the effect of neural activation of primary perception on appraisal and emotional response.
However, the results of study 1 only partly support the last two propositions on the interaction between the components of cognitive resistance:
surprise does not lead to a higher than average rate of reflection, although this was expected (Table 26); and
emotion type does not biases stimulus matching as predicted (Table 26), although reflection is inhibited if no emotion is elicited (Table 25).
In summary, the propositions on the interaction between the components of cognitive resistance have not been conclusively validated by the results of study 1.
Environmental and intra-subject factors
The results of study 1 give limited support to the proposition that the environmental and intra-subject factors that influence cognitive resistance are limited to the listed aspects (task design, number of people involved, task instructions, participant preparation and personal inclination) because no other effects were identified. The results of study 1 do not support the proposition that high Neuroticism correlates with a high rate of reflection (chapter 5). Rather, the results of study 1 (Table 28) showed a significant effect of lower Conscientiousness on the probability of reflection.
A probable explanation is that more conscientiousness participants are expected to adhere longer to the instructions given by the system and the researcher. An effect was also seen of current function. This effect may be correlated: there is an effect of current function on trait Conscientiousness for the group technical management and engineering & design (N=16, mean=40.1, s.d.=13.1) versus all others (N=64, mean=45.5, s.d.=8.9): unequal variances, t=1.56, df = 18.6, p=0.065, one tailed. The participants that fulfill management and engineering & design functions are expected to adhere less to the instructions given by the system or the researcher than other participant groups (such as students).
148
7.4.2. Limitations of study 1 The design of study 1 included several limitations.
Participants
The bandwidth of trait scores has not been reduced by a-priori selection of participants from the engineering population, but is about equal to the normal population.
Manipulation
The manipulation in study 1 resulted in a delay between feedback (after every set of ten strings) and reflection (at any point within the sets). As the emotion measures were related to the moment of feedback (and not reflection per se), this may have resulted in not matching the predictions. Additionally, the effect of Conscientiousness and current function on reflection suggests that the manipulation in study 1 was somewhat confounded by a bias to follow instructions given by the system and the researcher.
Measures
The measures for reflection were satisfactory, and reflection was clearly observable from the sudden change in response times.
The measures for emotional response had insufficient inter-measure reliability to be useful. The heart rate measures were based on earlier studies with quite a different manipulation (using affective pictures as stimuli) and time scales. The self-report measure of emotional response was operationalized in a novel way; this approach could not be validated. The observer ratings of emotional response and for emotion type have been taken as ‘ground truths’ given the validity and reliability reported in other studies, and the acceptable inter-rater reliability found for this study.
Tools and materials
The heart rate monitors did not always work satisfactorily. There were masking effects if participants had their arm between the monitor and the receiving pod. Initial video quality (using a low resolution webcam) was poor but adequate. This was not seen to effect inter-rater reliability.
149
8. Results of study 2
Two studies have been conducted within the scope of the experimental study. Study 2 continues on from study 1 for those participants that have reflected on the initial mental model and have established a new mental model. Establishment of the new mental model requires that the participant detects a pattern in the strings and uses the so-called ‘hidden rule’ to calculate the answer from the first two digits of the string. As discussed in 6.2, there is a pattern in the strings such that the answers are symmetrical in the form abccba, so-called “hidden rule strings”, that is unknown to the participants. This allows a short-cut from six repetitive calculations for each string to only one, if the participants identify this hidden rule. After two sets in which the task objectives have been met and the participant responds at a constant level within 30 seconds for ten strings, some of the hidden rule strings will be replaced with random strings (in which the hidden rule is no longer valid) by the software. This comprises the experimental task for study 2, in which the “hidden rule” mental model is challenged by the contradictory stimuli of the error messages.
The general set-up of the experimental study that is common to both studies has been discussed in the chapter 6. In this chapter the participants for study 2 are discussed in more detail (section 8.1) and ensure the manipulation has been successful (section 8.2). Then the results of study 1 are presented (section 8.3) and these are discussed in the concluding section (8.4). A more general discussion follows in chapter 9 for both studies combined.
8.1. Participants
Study 2 continues on after study 1, but requires the identification of the hidden rule in the strings (the answers are symmetrical in the form abccba). The recognition of this rule allows the participant to establish a new mental model of the task. In this section it is investigated which participants were able to establish a new mental model, and are therefore eligible for study 2. As shown in Figure 18, not all the participants in study 1 qualified for study 2.
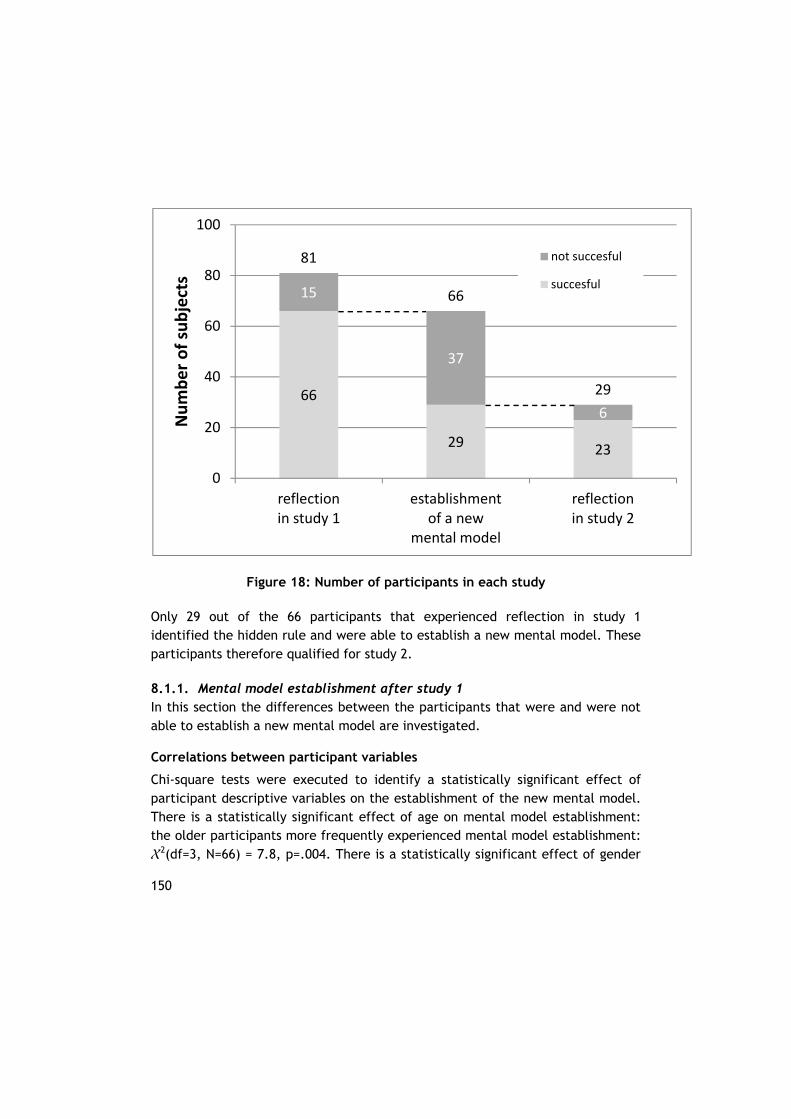
150
Figure 18: Number of participants in each study
Only 29 out of the 66 participants that experienced reflection in study 1 identified the hidden rule and were able to establish a new mental model. These participants therefore qualified for study 2.
8.1.1. Mental model establishment after study 1 In this section the differences between the participants that were and were not able to establish a new mental model are investigated.
Correlations between participant variables
Chi-square tests were executed to identify a statistically significant effect of participant descriptive variables on the establishment of the new mental model. There is a statistically significant effect of age on mental model establishment: the older participants more frequently experienced mental model establishment: X2(df=3, N=66) = 7.8, p=.004. There is a statistically significant effect of gender
66
29 23
15
37
6
81
66
29
0
20
40
60
80
100
reflection in study 1
establishment of a new
mental model
reflection in study 2
Number of subjects
not succesful
succesful
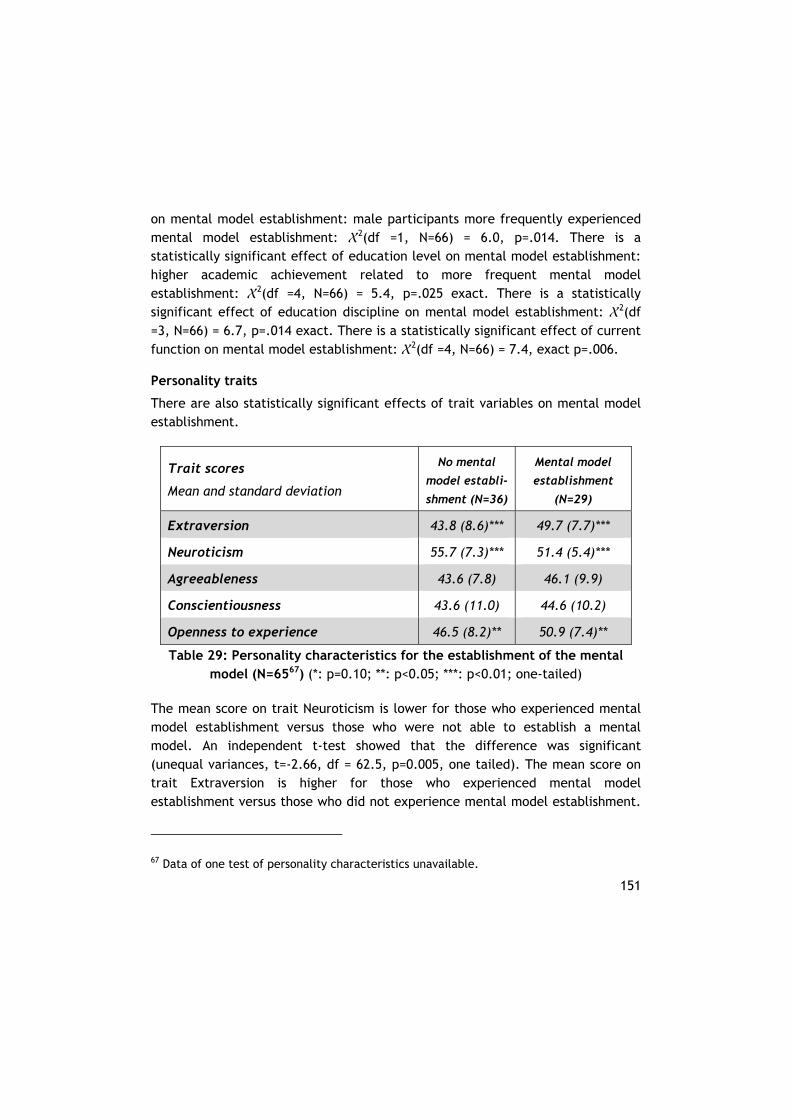
151
on mental model establishment: male participants more frequently experienced mental model establishment: X2(df =1, N=66) = 6.0, p=.014. There is a statistically significant effect of education level on mental model establishment: higher academic achievement related to more frequent mental model establishment: X2(df =4, N=66) = 5.4, p=.025 exact. There is a statistically significant effect of education discipline on mental model establishment: X2(df =3, N=66) = 6.7, p=.014 exact. There is a statistically significant effect of current function on mental model establishment: X2(df =4, N=66) = 7.4, exact p=.006.
Personality traits
There are also statistically significant effects of trait variables on mental model establishment.
Trait scores
Mean and standard deviation
No mental
model establi-
shment (N=36)
Mental model
establishment
(N=29)
Extraversion 43.8 (8.6)*** 49.7 (7.7)***
Neuroticism 55.7 (7.3)*** 51.4 (5.4)***
Agreeableness 43.6 (7.8) 46.1 (9.9)
Conscientiousness 43.6 (11.0) 44.6 (10.2)
Openness to experience 46.5 (8.2)** 50.9 (7.4)**
Table 29: Personality characteristics for the establishment of the mental model (N=6567) (*: p=0.10; **: p<0.05; ***: p<0.01; one-tailed)
The mean score on trait Neuroticism is lower for those who experienced mental model establishment versus those who were not able to establish a mental model. An independent t-test showed that the difference was significant (unequal variances, t=-2.66, df = 62.5, p=0.005, one tailed). The mean score on trait Extraversion is higher for those who experienced mental model establishment versus those who did not experience mental model establishment.
67 Data of one test of personality characteristics unavailable.
152
An independent t-test showed that the difference was significant (unequal variances, t=2.90, df = 62.2, p=0.003, one tailed). The mean score on trait Openness is higher for those who experienced mental model establishment versus those who did not experience mental model establishment. An independent t-test showed that the difference was significant (unequal variances, t=2.28, df = 62.1, p=0.013, one tailed).
8.1.2. Study 2 The participant variables for the 29 participants that were able to establish a new mental model and thus participated in study 2 are depicted in Table 16 (page 153). Chi-square tests were executed to identify a statistically significant effect of participant descriptive variables on reflection. No statistically significant effects of participant variables on reflection for study 2 have been identified.
8.2. Manipulation check
The experimental study of the propositions regarding the effect of emotional response and emotion type on cognitive resistance requires that the experimental manipulation of study 2 is successful. In this section it is assessed whether a mental model is first established, and then reflection occurs for study 2.
Mental model establishment
Mental model establishment requires that the participant detects a pattern in the strings and uses the so-called ‘hidden rule’ to calculate the answer from the first two digits of the string. The response times in study 2 are expected to initially be constant and at a level less than 4 seconds per string, indicating that the hidden rule is being applied and that the mental model of the pattern has been established. Figure 19 (page 154) shows that this is indeed the case for the 29 participants that qualified for study 2.
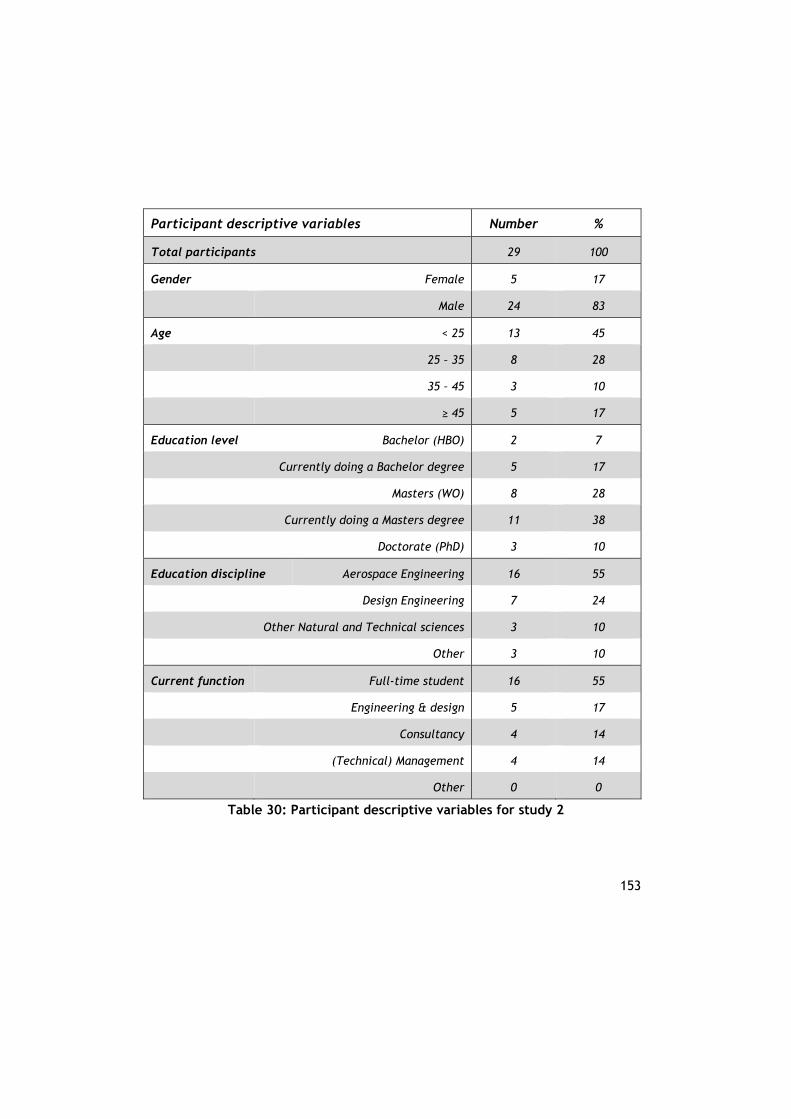
153
Participant descriptive variables Number %
Total participants 29 100
Gender Female 5 17
Male 24 83
Age < 25 13 45
25 – 35 8 28
35 – 45 3 10
≥ 45 5 17
Education level Bachelor (HBO) 2 7
Currently doing a Bachelor degree 5 17
Masters (WO) 8 28
Currently doing a Masters degree 11 38
Doctorate (PhD) 3 10
Education discipline Aerospace Engineering 16 55
Design Engineering 7 24
Other Natural and Technical sciences 3 10
Other 3 10
Current function Full-time student 16 55
Engineering & design 5 17
Consultancy 4 14
(Technical) Management 4 14
Other 0 0
Table 30: Participant descriptive variables for study 2
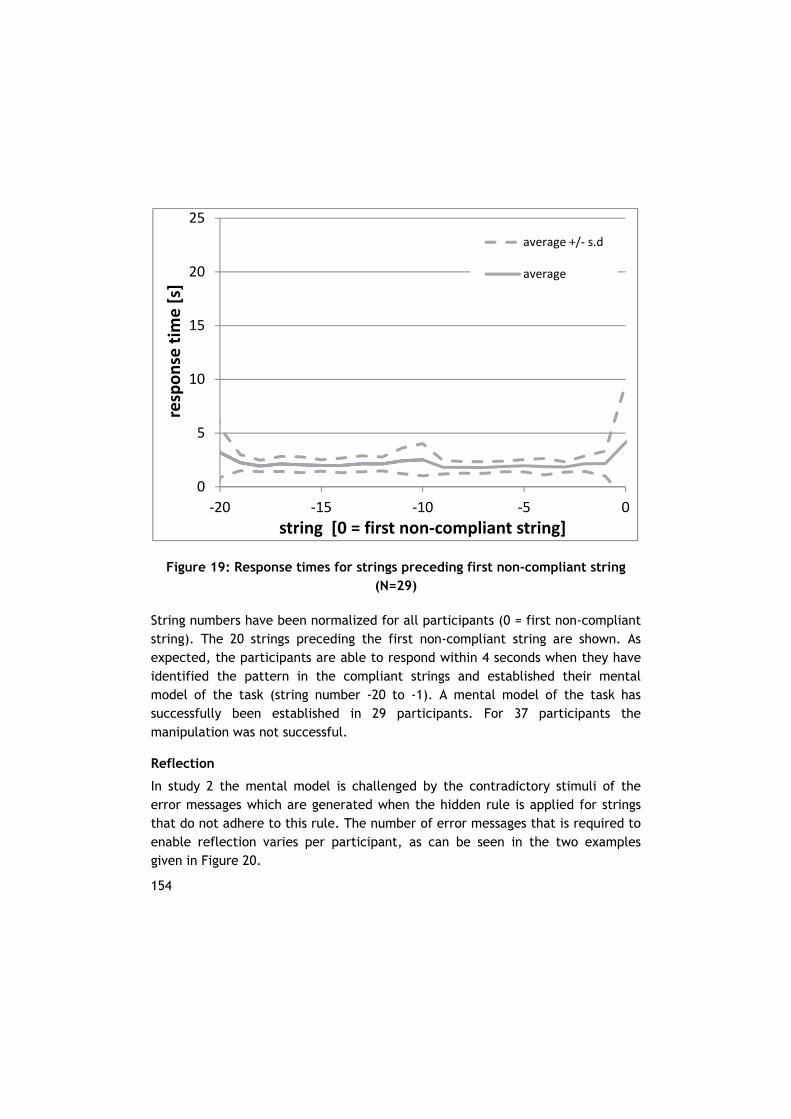
154
Figure 19: Response times for strings preceding first non-compliant string (N=29)
String numbers have been normalized for all participants (0 = first non-compliant string). The 20 strings preceding the first non-compliant string are shown. As expected, the participants are able to respond within 4 seconds when they have identified the pattern in the compliant strings and established their mental model of the task (string number -20 to -1). A mental model of the task has successfully been established in 29 participants. For 37 participants the manipulation was not successful.
Reflection
In study 2 the mental model is challenged by the contradictory stimuli of the error messages which are generated when the hidden rule is applied for strings that do not adhere to this rule. The number of error messages that is required to enable reflection varies per participant, as can be seen in the two examples given in Figure 20.
0
5
10
15
20
25
‐20 ‐15 ‐10 ‐5 0
response tim
e [s]
string [0 = first non‐compliant string]
average +/‐ s.d
average
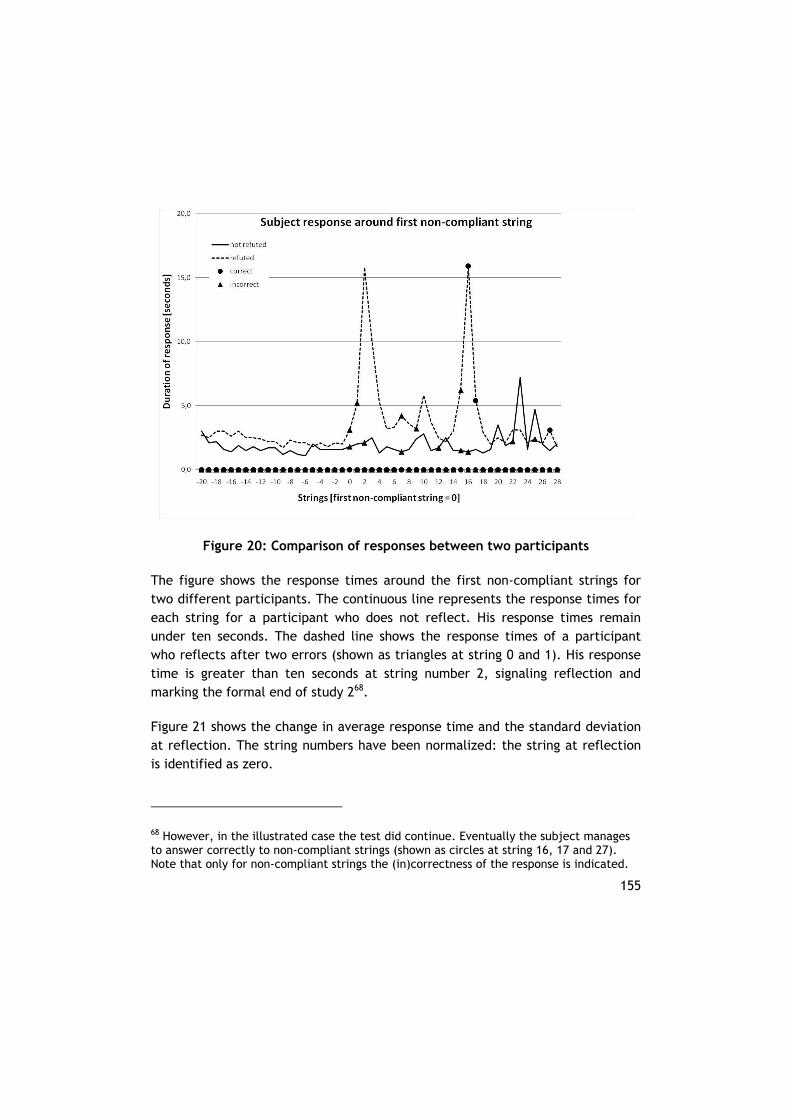
155
Figure 20: Comparison of responses between two participants
The figure shows the response times around the first non-compliant strings for two different participants. The continuous line represents the response times for each string for a participant who does not reflect. His response times remain under ten seconds. The dashed line shows the response times of a participant who reflects after two errors (shown as triangles at string 0 and 1). His response time is greater than ten seconds at string number 2, signaling reflection and marking the formal end of study 268.
Figure 21 shows the change in average response time and the standard deviation at reflection. The string numbers have been normalized: the string at reflection is identified as zero.
68 However, in the illustrated case the test did continue. Eventually the subject manages to answer correctly to non-compliant strings (shown as circles at string 16, 17 and 27). Note that only for non-compliant strings the (in)correctness of the response is indicated.
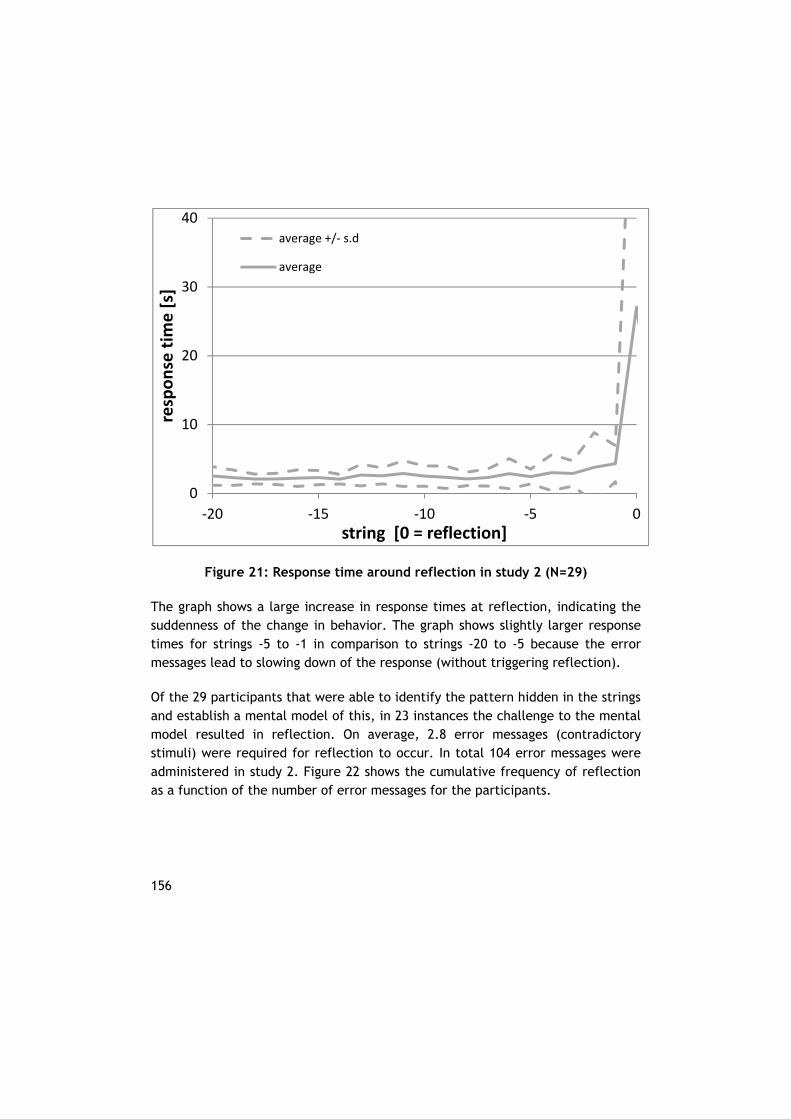
156
Figure 21: Response time around reflection in study 2 (N=29)
The graph shows a large increase in response times at reflection, indicating the suddenness of the change in behavior. The graph shows slightly larger response times for strings -5 to -1 in comparison to strings -20 to -5 because the error messages lead to slowing down of the response (without triggering reflection).
Of the 29 participants that were able to identify the pattern hidden in the strings and establish a mental model of this, in 23 instances the challenge to the mental model resulted in reflection. On average, 2.8 error messages (contradictory stimuli) were required for reflection to occur. In total 104 error messages were administered in study 2. Figure 22 shows the cumulative frequency of reflection as a function of the number of error messages for the participants.
0
10
20
30
40
‐20 ‐15 ‐10 ‐5 0
response tim
e [s]
string [0 = reflection]
average +/‐ s.d
average
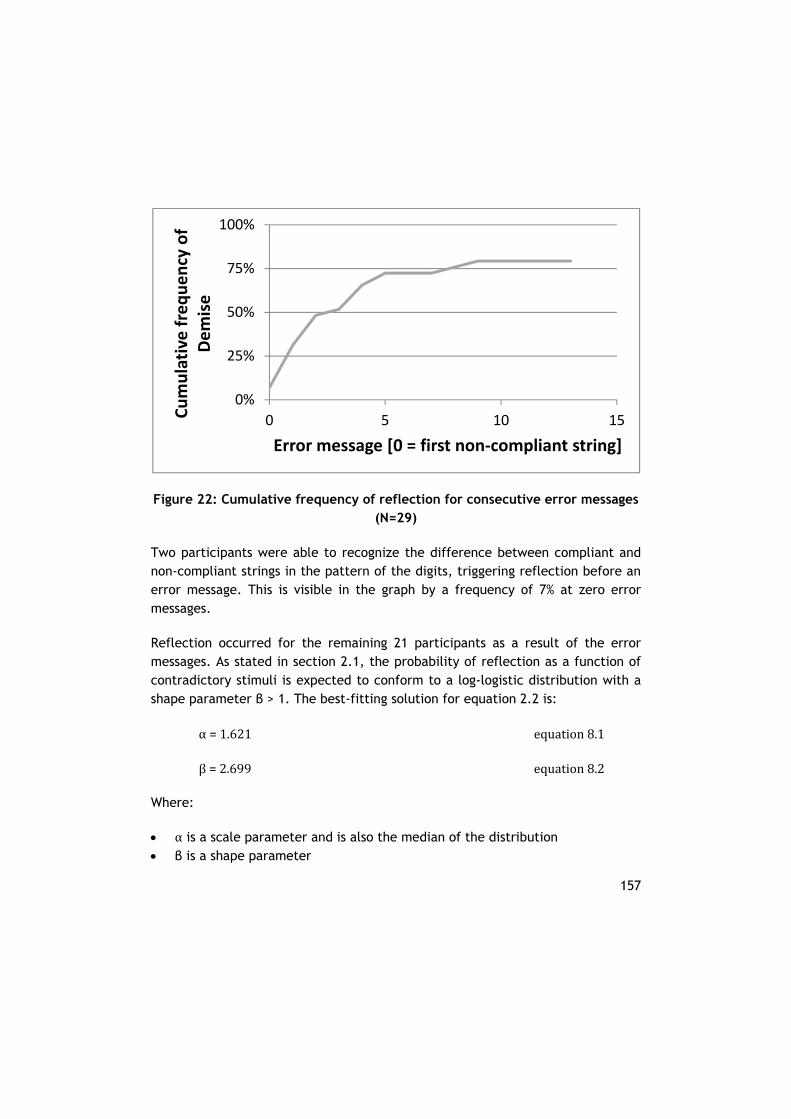
157
Figure 22: Cumulative frequency of reflection for consecutive error messages (N=29)
Two participants were able to recognize the difference between compliant and non-compliant strings in the pattern of the digits, triggering reflection before an error message. This is visible in the graph by a frequency of 7% at zero error messages.
Reflection occurred for the remaining 21 participants as a result of the error messages. As stated in section 2.1, the probability of reflection as a function of contradictory stimuli is expected to conform to a log-logistic distribution with a shape parameter β > 1. The best-fitting solution for equation 2.2 is:
α=1.621 equation8.1
β=2.699 equation8.2
Where:
α is a scale parameter and is also the median of the distribution β is a shape parameter
0%
25%
50%
75%
100%
0 5 10 15Cumulative frequency of
Demise
Error message [0 = first non‐compliant string]
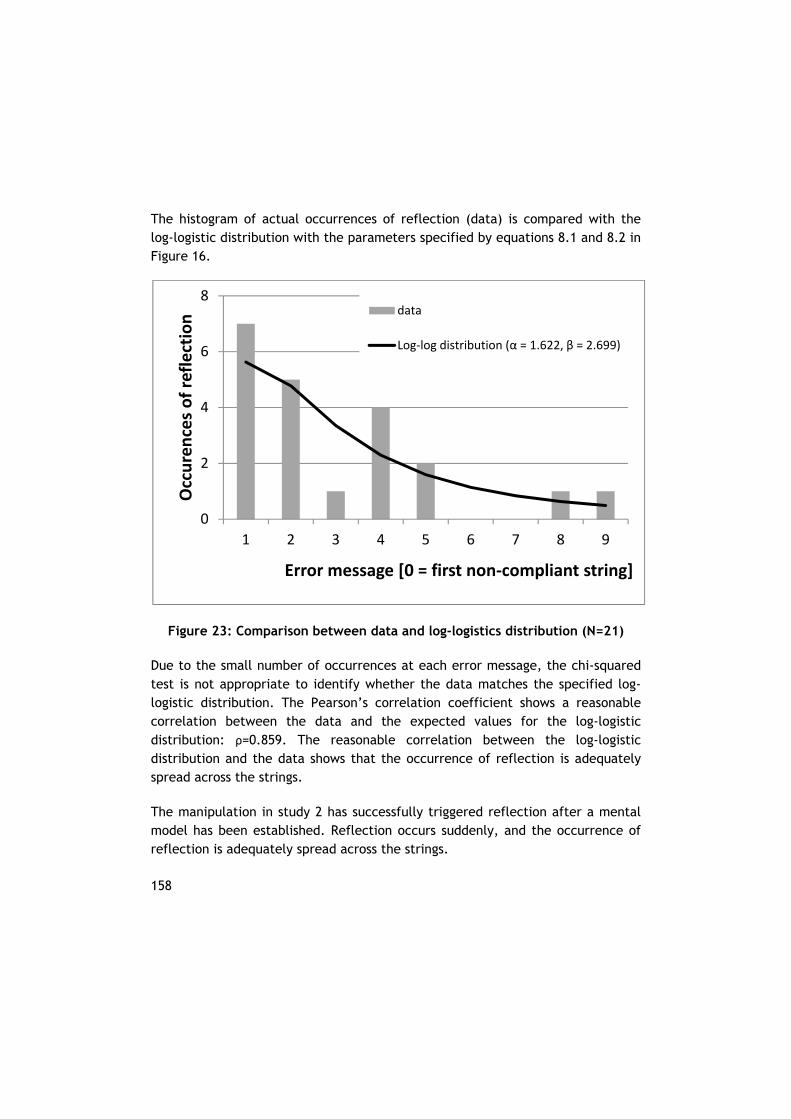
158
The histogram of actual occurrences of reflection (data) is compared with the log-logistic distribution with the parameters specified by equations 8.1 and 8.2 in Figure 16.
Figure 23: Comparison between data and log-logistics distribution (N=21)
Due to the small number of occurrences at each error message, the chi-squared test is not appropriate to identify whether the data matches the specified log-logistic distribution. The Pearson’s correlation coefficient shows a reasonable correlation between the data and the expected values for the log-logistic distribution: ρ=0.859. The reasonable correlation between the log-logistic distribution and the data shows that the occurrence of reflection is adequately spread across the strings.
The manipulation in study 2 has successfully triggered reflection after a mental model has been established. Reflection occurs suddenly, and the occurrence of reflection is adequately spread across the strings.
0
2
4
6
8
1 2 3 4 5 6 7 8 9
Occurences of reflection
Error message [0 = first non‐compliant string]
data
Log‐log distribution (α = 1.622, β = 2.699)
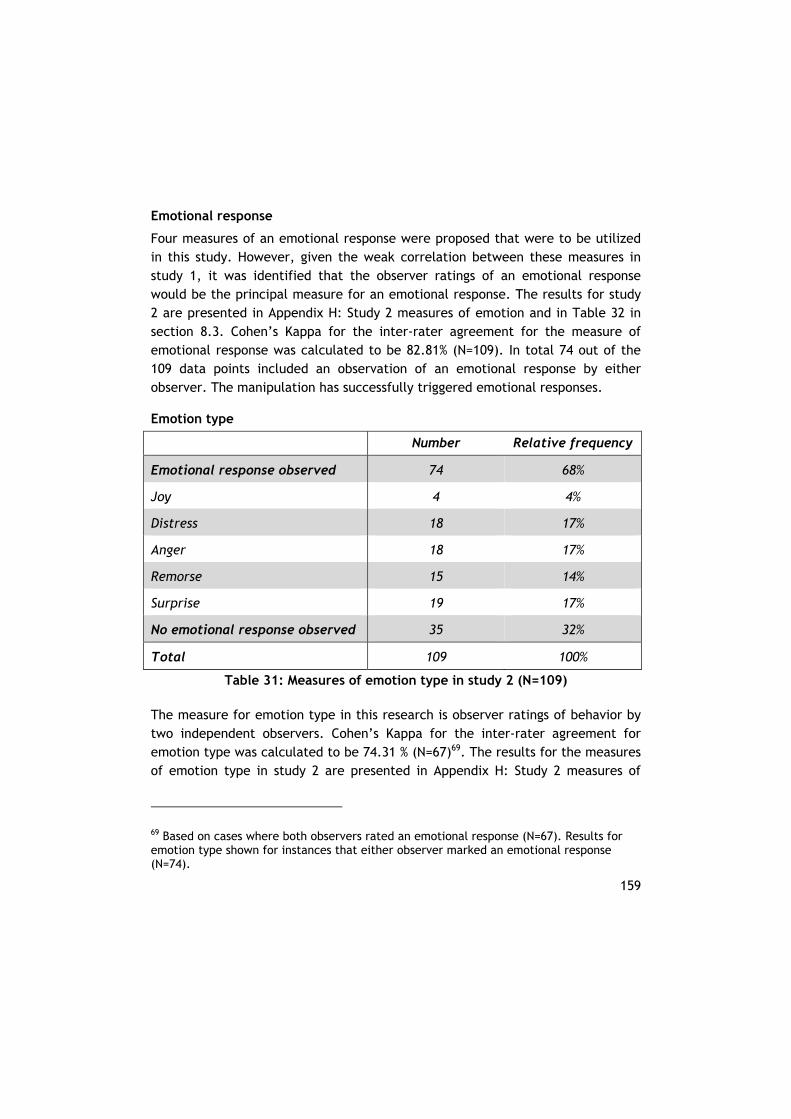
159
Emotional response
Four measures of an emotional response were proposed that were to be utilized in this study. However, given the weak correlation between these measures in study 1, it was identified that the observer ratings of an emotional response would be the principal measure for an emotional response. The results for study 2 are presented in Appendix H: Study 2 measures of emotion and in Table 32 in section 8.3. Cohen’s Kappa for the inter-rater agreement for the measure of emotional response was calculated to be 82.81% (N=109). In total 74 out of the 109 data points included an observation of an emotional response by either observer. The manipulation has successfully triggered emotional responses.
Emotion type
Number Relative frequency
Emotional response observed 74 68%
Joy 4 4%
Distress 18 17%
Anger 18 17%
Remorse 15 14%
Surprise 19 17%
No emotional response observed 35 32%
Total 109 100%
Table 31: Measures of emotion type in study 2 (N=109)
The measure for emotion type in this research is observer ratings of behavior by two independent observers. Cohen’s Kappa for the inter-rater agreement for emotion type was calculated to be 74.31 % (N=67)69. The results for the measures of emotion type in study 2 are presented in Appendix H: Study 2 measures of
69 Based on cases where both observers rated an emotional response (N=67). Results for emotion type shown for instances that either observer marked an emotional response (N=74).
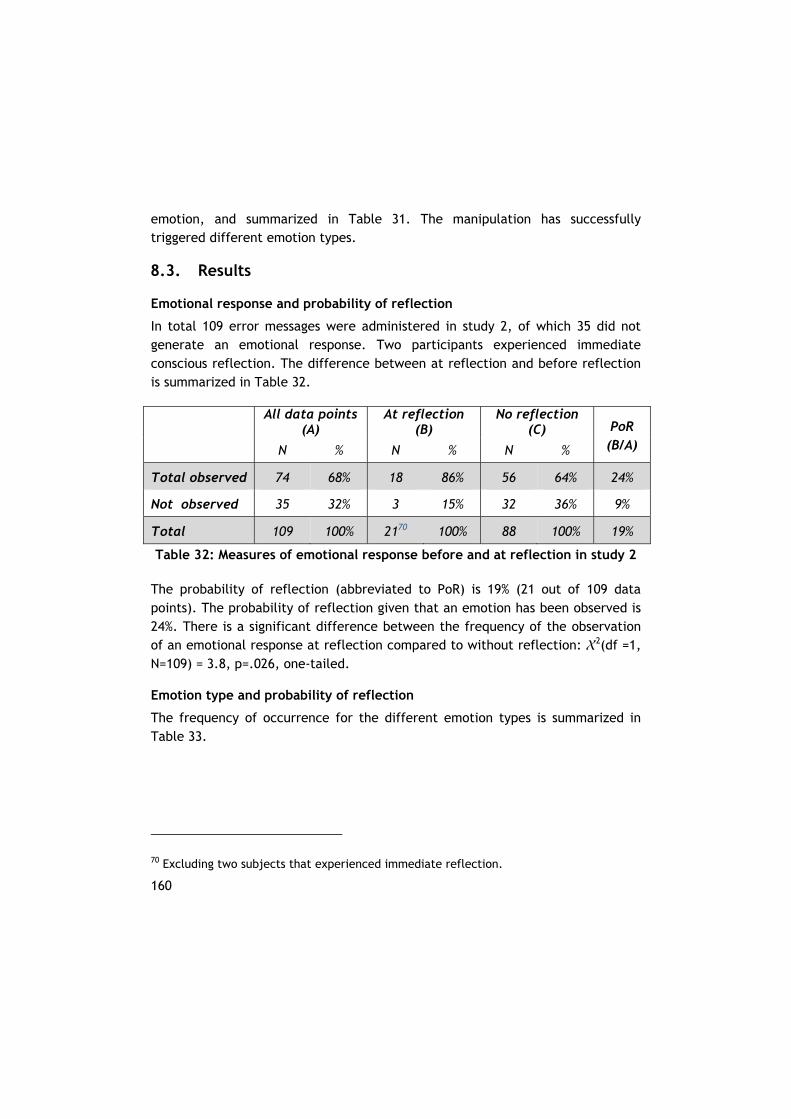
160
emotion, and summarized in Table 31. The manipulation has successfully triggered different emotion types.
8.3. Results
Emotional response and probability of reflection
In total 109 error messages were administered in study 2, of which 35 did not generate an emotional response. Two participants experienced immediate conscious reflection. The difference between at reflection and before reflection is summarized in Table 32.
All data points
(A) At reflection
(B) No reflection
(C) PoR (B/A) N % N % N %
Total observed 74 68% 18 86% 56 64% 24%
Not observed 35 32% 3 15% 32 36% 9%
Total 109 100% 2170 100% 88 100% 19%
Table 32: Measures of emotional response before and at reflection in study 2
The probability of reflection (abbreviated to PoR) is 19% (21 out of 109 data points). The probability of reflection given that an emotion has been observed is 24%. There is a significant difference between the frequency of the observation of an emotional response at reflection compared to without reflection: X2(df =1, N=109) = 3.8, p=.026, one-tailed.
Emotion type and probability of reflection
The frequency of occurrence for the different emotion types is summarized in Table 33.
70 Excluding two subjects that experienced immediate reflection.
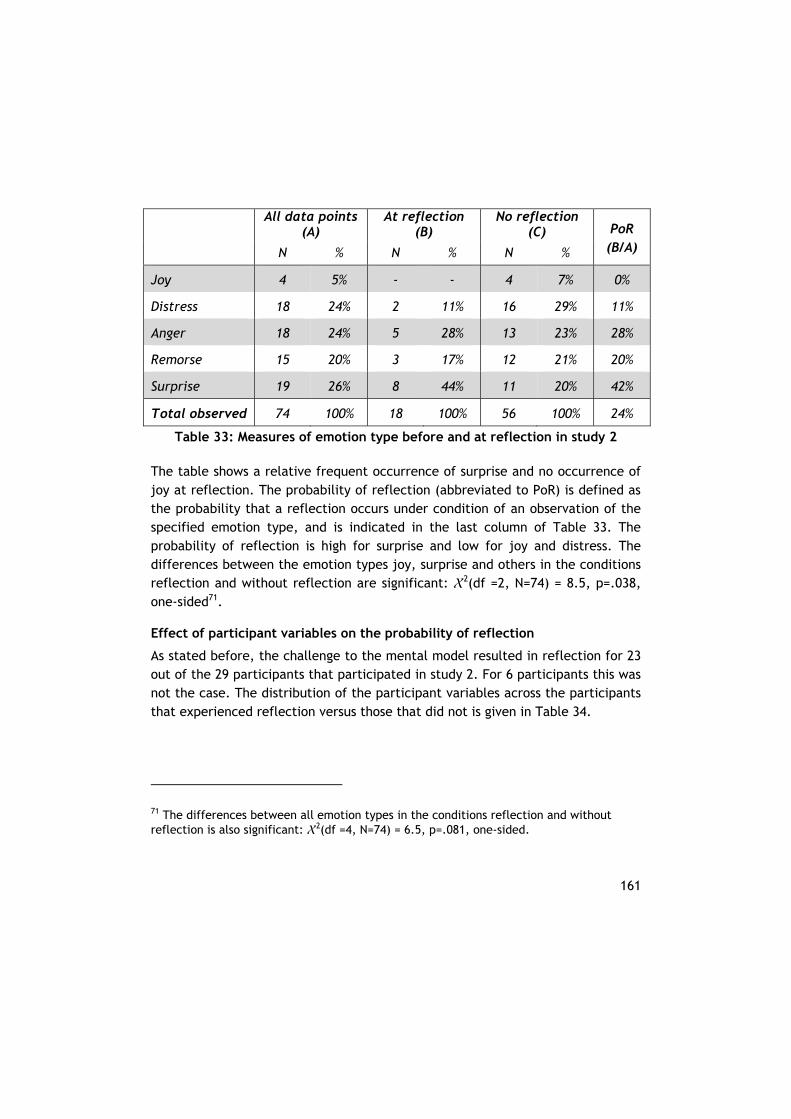
161
All data points
(A) At reflection
(B) No reflection
(C) PoR (B/A) N % N % N %
Joy 4 5% - - 4 7% 0%
Distress 18 24% 2 11% 16 29% 11%
Anger 18 24% 5 28% 13 23% 28%
Remorse 15 20% 3 17% 12 21% 20%
Surprise 19 26% 8 44% 11 20% 42%
Total observed 74 100% 18 100% 56 100% 24%
Table 33: Measures of emotion type before and at reflection in study 2
The table shows a relative frequent occurrence of surprise and no occurrence of joy at reflection. The probability of reflection (abbreviated to PoR) is defined as the probability that a reflection occurs under condition of an observation of the specified emotion type, and is indicated in the last column of Table 33. The probability of reflection is high for surprise and low for joy and distress. The differences between the emotion types joy, surprise and others in the conditions reflection and without reflection are significant: X2(df =2, N=74) = 8.5, p=.038, one-sided71.
Effect of participant variables on the probability of reflection
As stated before, the challenge to the mental model resulted in reflection for 23 out of the 29 participants that participated in study 2. For 6 participants this was not the case. The distribution of the participant variables across the participants that experienced reflection versus those that did not is given in Table 34.
71 The differences between all emotion types in the conditions reflection and without reflection is also significant: X2(df =4, N=74) = 6.5, p=.081, one-sided.
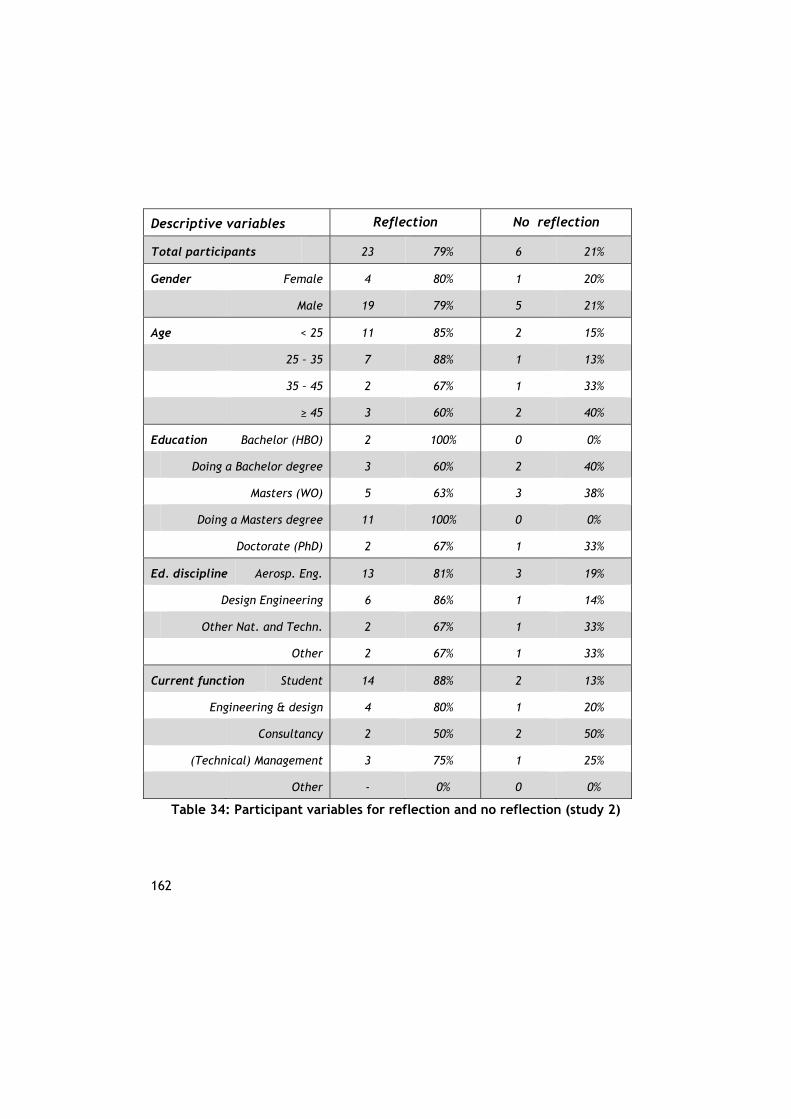
162
Descriptive variables Reflection No reflection
Total participants 23 79% 6 21%
Gender Female 4 80% 1 20%
Male 19 79% 5 21%
Age < 25 11 85% 2 15%
25 – 35 7 88% 1 13%
35 – 45 2 67% 1 33%
≥ 45 3 60% 2 40%
Education Bachelor (HBO) 2 100% 0 0%
Doing a Bachelor degree 3 60% 2 40%
Masters (WO) 5 63% 3 38%
Doing a Masters degree 11 100% 0 0%
Doctorate (PhD) 2 67% 1 33%
Ed. discipline Aerosp. Eng. 13 81% 3 19%
Design Engineering 6 86% 1 14%
Other Nat. and Techn. 2 67% 1 33%
Other 2 67% 1 33%
Current function Student 14 88% 2 13%
Engineering & design 4 80% 1 20%
Consultancy 2 50% 2 50%
(Technical) Management 3 75% 1 25%
Other - 0% 0 0%
Table 34: Participant variables for reflection and no reflection (study 2)
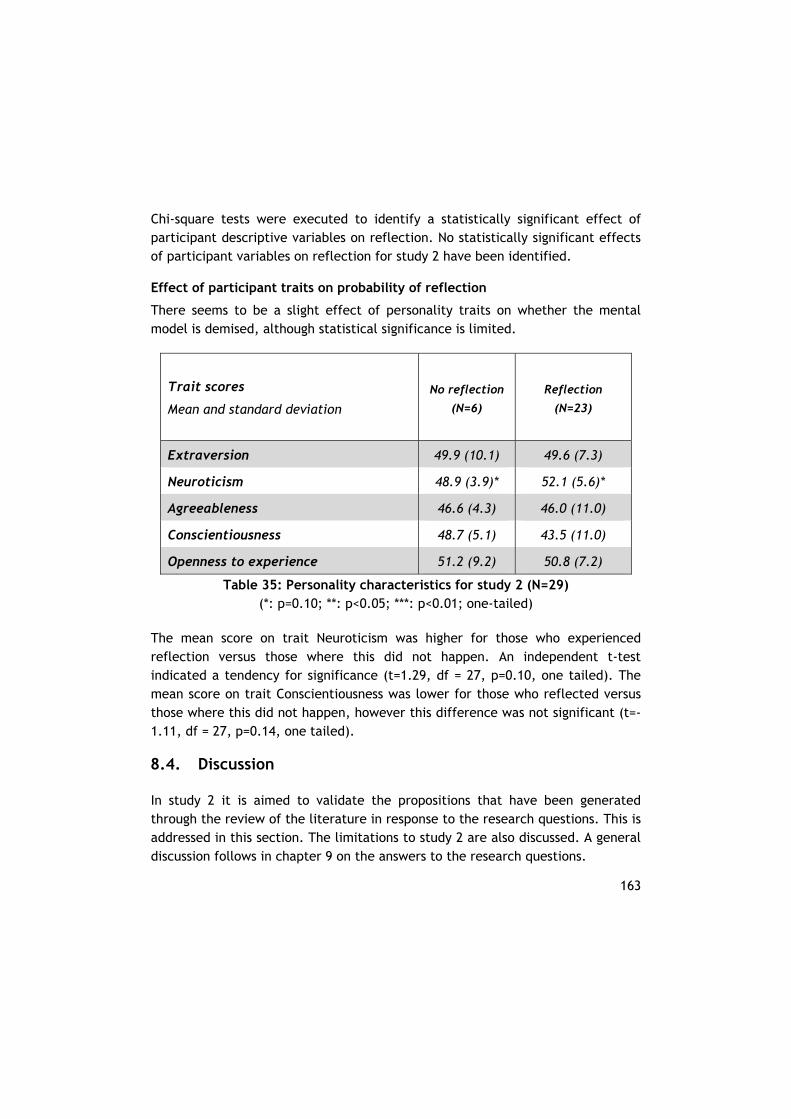
163
Chi-square tests were executed to identify a statistically significant effect of participant descriptive variables on reflection. No statistically significant effects of participant variables on reflection for study 2 have been identified.
Effect of participant traits on probability of reflection
There seems to be a slight effect of personality traits on whether the mental model is demised, although statistical significance is limited.
Trait scores
Mean and standard deviation
No reflection
(N=6)
Reflection
(N=23)
Extraversion 49.9 (10.1) 49.6 (7.3)
Neuroticism 48.9 (3.9)* 52.1 (5.6)*
Agreeableness 46.6 (4.3) 46.0 (11.0)
Conscientiousness 48.7 (5.1) 43.5 (11.0)
Openness to experience 51.2 (9.2) 50.8 (7.2)
Table 35: Personality characteristics for study 2 (N=29) (*: p=0.10; **: p<0.05; ***: p<0.01; one-tailed)
The mean score on trait Neuroticism was higher for those who experienced reflection versus those where this did not happen. An independent t-test indicated a tendency for significance (t=1.29, df = 27, p=0.10, one tailed). The mean score on trait Conscientiousness was lower for those who reflected versus those where this did not happen, however this difference was not significant (t=-1.11, df = 27, p=0.14, one tailed).
8.4. Discussion
In study 2 it is aimed to validate the propositions that have been generated through the review of the literature in response to the research questions. This is addressed in this section. The limitations to study 2 are also discussed. A general discussion follows in chapter 9 on the answers to the research questions.
164
8.4.1. Validation of propositions In study 2 it is aimed to overcome the limitations of study 1 and validate the propositions on the components of cognitive resistance (chapter 3), the interaction between the components of cognitive resistance (chapter 4), and the environmental and intra-subject factors that influence cognitive resistance (chapter 5). The validation of each of these propositions is discussed below.
Components of cognitive resistance
The results of study 2 support the proposition that the components of cognitive resistance are primary perception, stimulus matching, appraisal and emotions in the sense of an emotional response and emotion type. Primary perception is a prerequisite for emotion elicitation and reflection. Stimulus matching is a prerequisite for reflection. Appraisal is a prerequisite for emotion elicitation. Emotions have been elicited in the course of cognitive resistance, and it was possible to describe them in terms of an emotional response as well as emotion type (Table 31). Reflection occurred (Figure 22)Figure 22: Cumulative frequency of reflection for consecutive error messages (N=29), marking the end of cognitive resistance.
Interaction of components
The results of study 2 support the propositions on the interaction between the components of cognitive resistance (chapter 4):
reflection has occurred as a result of contradictory stimuli (Figure 15), validating the effect of neural activation of primary perception on stimulus matching; and
emotional responses have been elicited as a result of contradictory stimuli prior to reflection (Table 31), validating the effect of neural activation of primary perception on appraisal and emotional response.
surprise leads to a high probability of reflection, as was expected (Table 33); and
joy did not lead to reflection, distress leads to a low probability of reflection, anger and remorse lead to moderate probabilities of reflection (Table 32), and the probability of reflection is low if no emotion is elicited (Table 33) , as was expected.
165
In summary, the propositions on the interaction between the components of cognitive resistance have been reasonably validated by the results of study 2.
Effect of other environmental and intra-subject factors
The results of study 2 give limited support to the proposition that the environmental and intra-subject factors that influence cognitive resistance are limited to the listed aspects because no other effects were identified. The results of study 2 support the proposition that high Neuroticism correlates with a high rate of reflection (chapter 5). An independent t-test showed a tendency for significance (Table 35).
8.4.2. Limitations of study 2 The design of study 2 addressed some of the limitations of study 1.
Number of participants
A severe limitation to the validity of the results of study 2 is the number of participants (N=29), due to the limited number of participants that were able to identify the pattern in the strings and therefore establish a mental model (see Figure 18).
Manipulation
The manipulation in study 2 minimized the delay between feedback (after every error message) and reflection. The presumed confounding effect of the instructions given by the system or the researcher was reduced.
Measures
As in study 1, the measures for reflection were satisfactory, and reflection was clearly observable from the sudden change in response times. For emotional response and emotion type only observer ratings were utilized; these had a satisfactory inter-rater reliability.

166
167
9. Answers to the research questions
In this chapter the results of the experimental study reported in chapters 6, 7 and 8 are compared to the results of the literature review as reported in chapters 2, 3, 4 and 5. The components of cognitive resistance are discussed first (section 9.1), in answer to the first research question. In section 9.2 the interaction of these components is deliberated. The environmental and intra-subject factors that influence cognitive resistance are the subject of section 9.3. The overall research question of the current research is addressed in section 9.4.
9.1. Components of cognitive resistance
The first research question stated:
RQ1 What are the components of cognitive resistance?
In chapter 3 it was proposed that the components of cognitive resistance are primary perception, stimulus matching, appraisal and emotions (in the sense of an emotional response and emotion type). The experimental study is not aimed at systematically testing the validity of this proposition, but has found general qualitative support in both study 1 and study 2:
primary perception is a prerequisite for emotion elicitation and reflection; appraisal is a prerequisite for emotion elicitation; stimulus matching is a prerequisite for reflection; and emotions have been elicited in the course of cognitive resistance, and it was
possible to describe them in terms of an emotional response as well as emotion type.
It was proposed in chapter 3 that appraisal and stimulus matching are different processes because these occur in different brain areas, even if there are many interconnections. The results of study 1 and 2 support this proposition because successful stimulus matching (i.e. reflection) and a successful appraisal (i.e. elicitation of an emotional response) occur largely independent of each other (see Table 24 and Table 32). Therefore it has been found that:
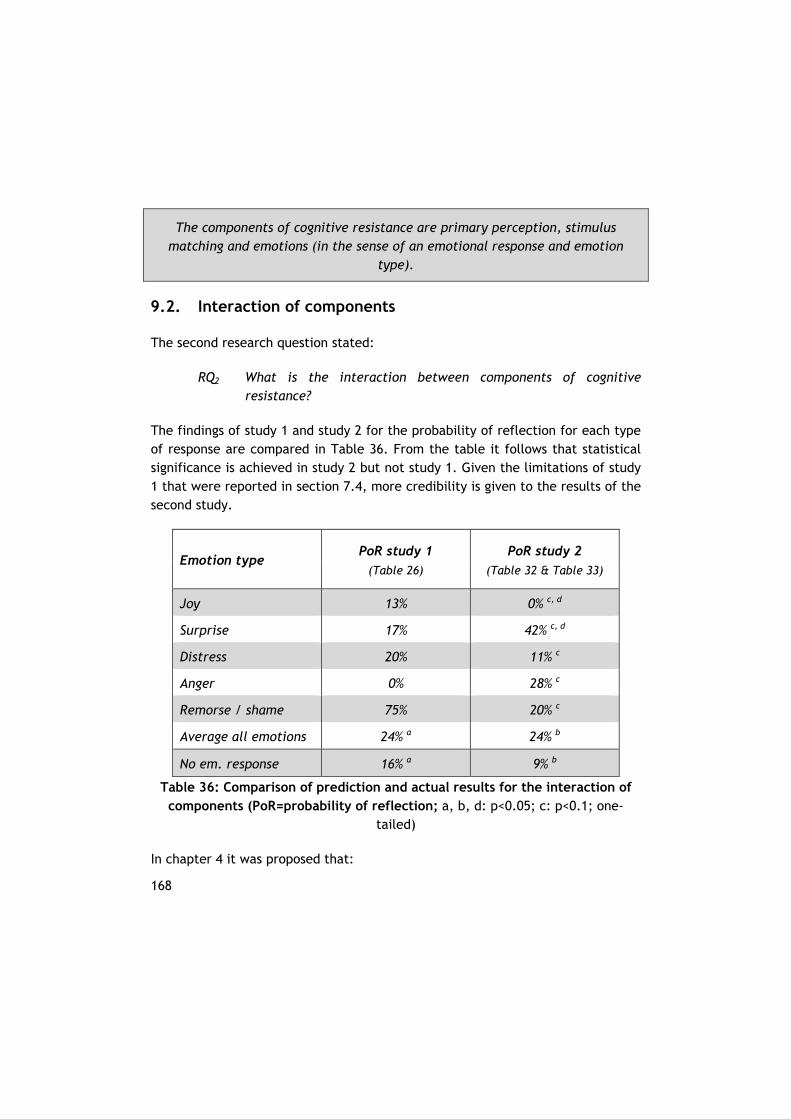
168
The components of cognitive resistance are primary perception, stimulus matching and emotions (in the sense of an emotional response and emotion
type).
9.2. Interaction of components
The second research question stated:
RQ2 What is the interaction between components of cognitive resistance?
The findings of study 1 and study 2 for the probability of reflection for each type of response are compared in Table 36. From the table it follows that statistical significance is achieved in study 2 but not study 1. Given the limitations of study 1 that were reported in section 7.4, more credibility is given to the results of the second study.
Emotion type PoR study 1
(Table 26) PoR study 2
(Table 32 & Table 33)
Joy 13% 0% c, d
Surprise 17% 42% c, d
Distress 20% 11% c
Anger 0% 28% c
Remorse / shame 75% 20% c
Average all emotions 24% a 24% b
No em. response 16% a 9% b
Table 36: Comparison of prediction and actual results for the interaction of components (PoR=probability of reflection; a, b, d: p<0.05; c: p<0.1; one-
tailed)
In chapter 4 it was proposed that:
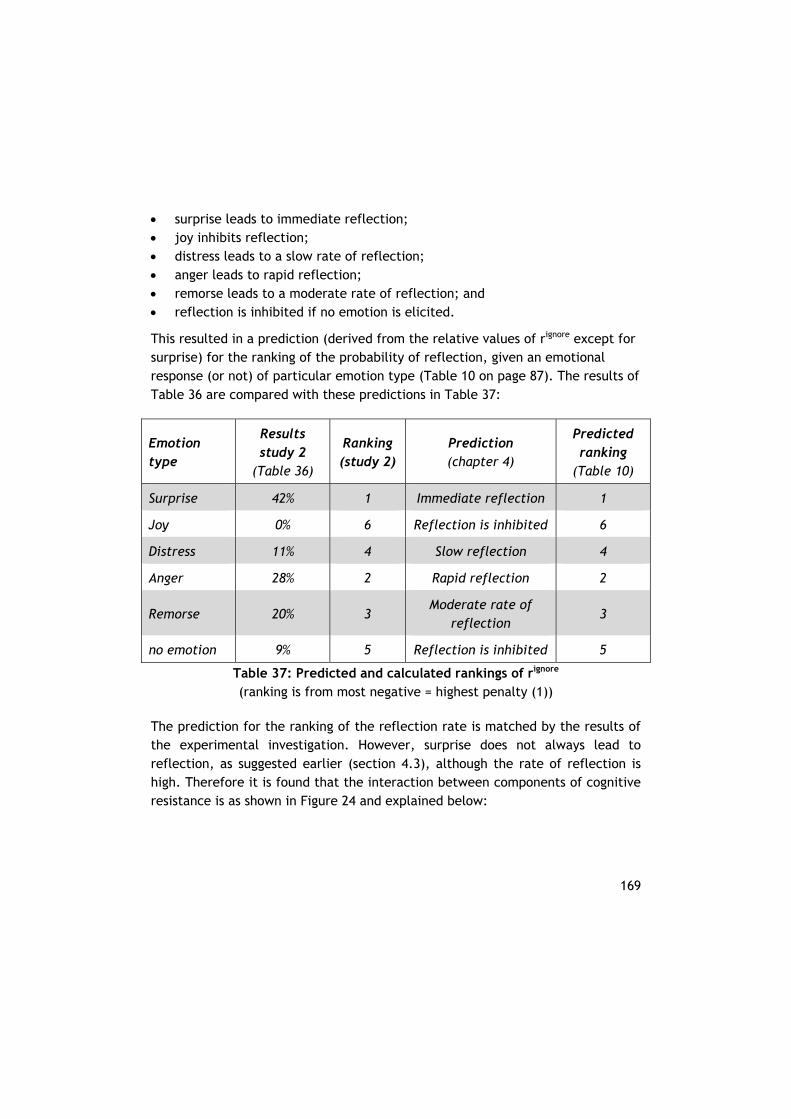
169
surprise leads to immediate reflection; joy inhibits reflection; distress leads to a slow rate of reflection; anger leads to rapid reflection; remorse leads to a moderate rate of reflection; and reflection is inhibited if no emotion is elicited.
This resulted in a prediction (derived from the relative values of rignore except for surprise) for the ranking of the probability of reflection, given an emotional response (or not) of particular emotion type (Table 10 on page 87). The results of Table 36 are compared with these predictions in Table 37:
Emotion type
Results study 2
(Table 36)
Ranking (study 2)
Prediction (chapter 4)
Predicted ranking
(Table 10)
Surprise 42% 1 Immediate reflection 1
Joy 0% 6 Reflection is inhibited 6
Distress 11% 4 Slow reflection 4
Anger 28% 2 Rapid reflection 2
Remorse 20% 3 Moderate rate of
reflection 3
no emotion 9% 5 Reflection is inhibited 5
Table 37: Predicted and calculated rankings of rignore (ranking is from most negative = highest penalty (1))
The prediction for the ranking of the reflection rate is matched by the results of the experimental investigation. However, surprise does not always lead to reflection, as suggested earlier (section 4.3), although the rate of reflection is high. Therefore it is found that the interaction between components of cognitive resistance is as shown in Figure 24 and explained below:
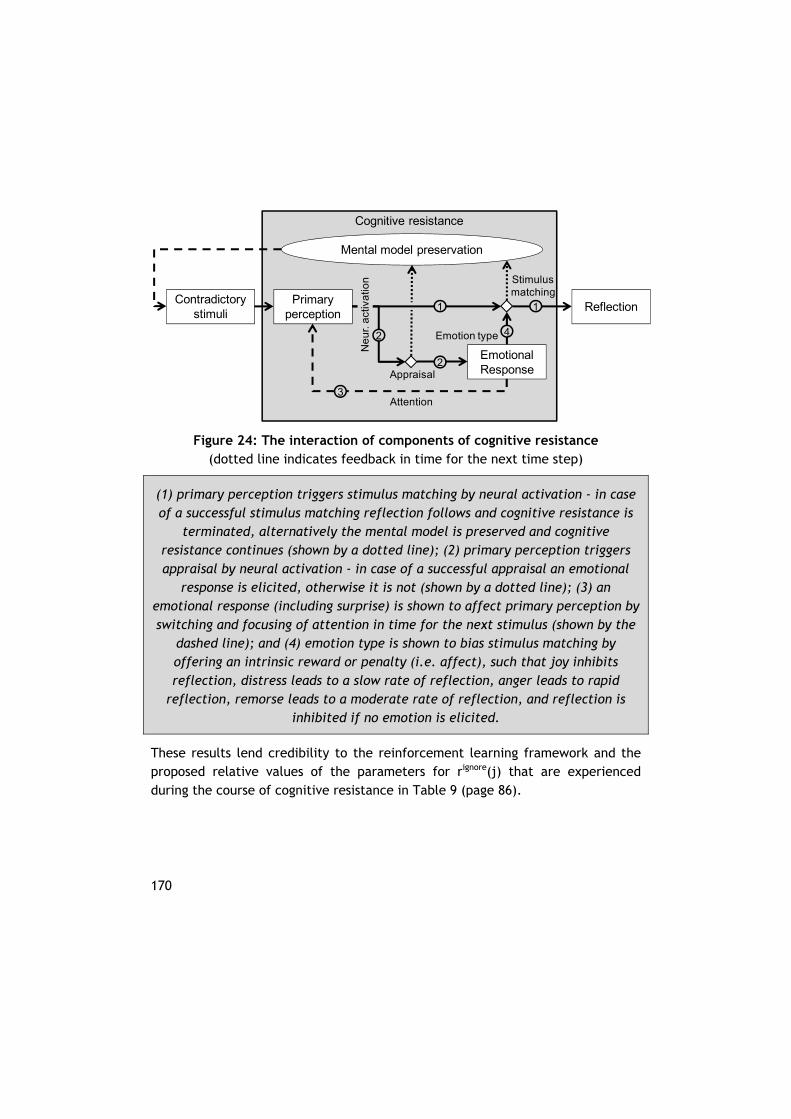
170
Figure 24: The interaction of components of cognitive resistance (dotted line indicates feedback in time for the next time step)
(1) primary perception triggers stimulus matching by neural activation - in case of a successful stimulus matching reflection follows and cognitive resistance is
terminated, alternatively the mental model is preserved and cognitive resistance continues (shown by a dotted line); (2) primary perception triggers appraisal by neural activation - in case of a successful appraisal an emotional
response is elicited, otherwise it is not (shown by a dotted line); (3) an emotional response (including surprise) is shown to affect primary perception by switching and focusing of attention in time for the next stimulus (shown by the
dashed line); and (4) emotion type is shown to bias stimulus matching by offering an intrinsic reward or penalty (i.e. affect), such that joy inhibits reflection, distress leads to a slow rate of reflection, anger leads to rapid
reflection, remorse leads to a moderate rate of reflection, and reflection is inhibited if no emotion is elicited.
These results lend credibility to the reinforcement learning framework and the proposed relative values of the parameters for rignore(j) that are experienced during the course of cognitive resistance in Table 9 (page 86).
Cognitive resistance
Primary perception
Contradictory stimuli
Emotional Response
Mental model preservation
Reflection
Emotion type
Stimulus matching
AppraisalN
eu
r. a
ctiv
atio
n
Attention
1 1
2
2
3
4
171
9.3. Environmental and intra-subject factors
The third research question stated:
RQ3 What environmental and intra-subject factors influence cognitive resistance?
From the literature it was proposed that the environmental and intra-subject factors that influence cognitive resistance include, and are limited to, aspects of task design, number of people involved, task instructions, participant preparation and personal inclination (chapter 5). The experimental study is aimed at validating the predicted correlation between high Neuroticism and a high rate of reflection. The correlations between personality traits and reflection in studies 1 and 2 are summarized in Table 38.
As explained in section 7.4 the effect of lower Conscientiousness on the probability of reflection in study 1 may be due to the fact that conscientiousness participants adhere longer to the instructions given by the system and the researcher. This effect is still visible in the means for Conscientiousness in study 2 but not statistically significant. If study 1 is disregarded, then it can be concluded from Table 38 that higher Neuroticism is related to a lower probability of establishing a mental model and higher probability of demise of a mental model. This suggests that those high in Neuroticism are biased to less automaticity compared to others.
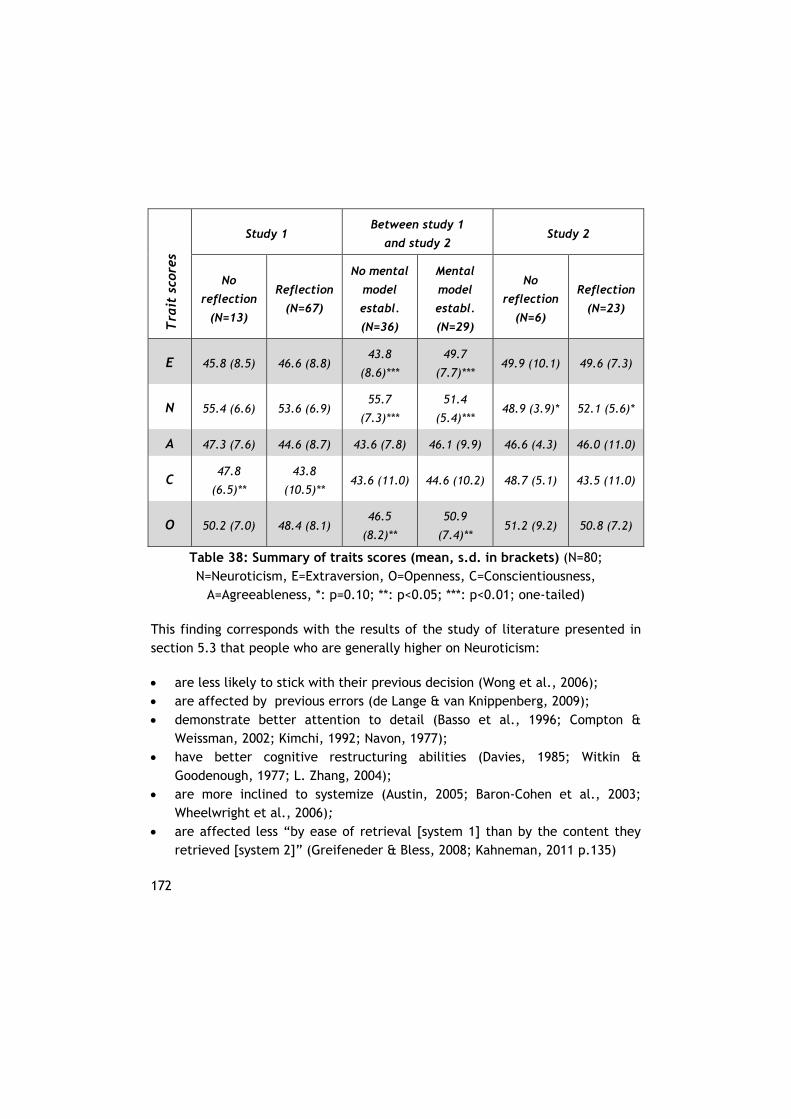
172
Tra
it s
core
s
Study 1 Between study 1
and study 2 Study 2
No
reflection
(N=13)
Reflection
(N=67)
No mental
model
establ.
(N=36)
Mental
model
establ.
(N=29)
No
reflection
(N=6)
Reflection
(N=23)
E 45.8 (8.5) 46.6 (8.8) 43.8
(8.6)***
49.7
(7.7)*** 49.9 (10.1) 49.6 (7.3)
N 55.4 (6.6) 53.6 (6.9) 55.7
(7.3)***
51.4
(5.4)*** 48.9 (3.9)* 52.1 (5.6)*
A 47.3 (7.6) 44.6 (8.7) 43.6 (7.8) 46.1 (9.9) 46.6 (4.3) 46.0 (11.0)
C 47.8
(6.5)**
43.8
(10.5)** 43.6 (11.0) 44.6 (10.2) 48.7 (5.1) 43.5 (11.0)
O 50.2 (7.0) 48.4 (8.1) 46.5
(8.2)**
50.9
(7.4)** 51.2 (9.2) 50.8 (7.2)
Table 38: Summary of traits scores (mean, s.d. in brackets) (N=80; N=Neuroticism, E=Extraversion, O=Openness, C=Conscientiousness,
A=Agreeableness, *: p=0.10; **: p<0.05; ***: p<0.01; one-tailed)
This finding corresponds with the results of the study of literature presented in section 5.3 that people who are generally higher on Neuroticism:
are less likely to stick with their previous decision (Wong et al., 2006); are affected by previous errors (de Lange & van Knippenberg, 2009); demonstrate better attention to detail (Basso et al., 1996; Compton &
Weissman, 2002; Kimchi, 1992; Navon, 1977); have better cognitive restructuring abilities (Davies, 1985; Witkin &
Goodenough, 1977; L. Zhang, 2004); are more inclined to systemize (Austin, 2005; Baron-Cohen et al., 2003;
Wheelwright et al., 2006); are affected less “by ease of retrieval [system 1] than by the content they
retrieved [system 2]” (Greifeneder & Bless, 2008; Kahneman, 2011 p.135)
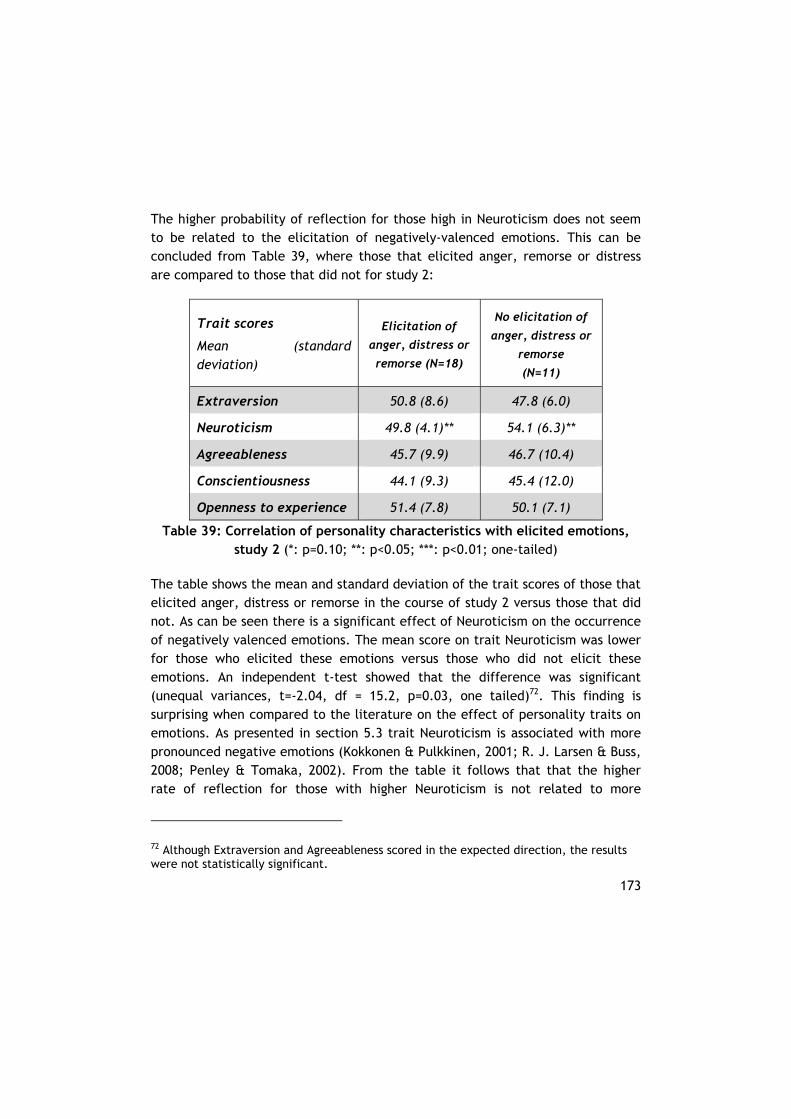
173
The higher probability of reflection for those high in Neuroticism does not seem to be related to the elicitation of negatively-valenced emotions. This can be concluded from Table 39, where those that elicited anger, remorse or distress are compared to those that did not for study 2:
Trait scores
Mean (standard deviation)
Elicitation of
anger, distress or
remorse (N=18)
No elicitation of
anger, distress or
remorse
(N=11)
Extraversion 50.8 (8.6) 47.8 (6.0)
Neuroticism 49.8 (4.1)** 54.1 (6.3)**
Agreeableness 45.7 (9.9) 46.7 (10.4)
Conscientiousness 44.1 (9.3) 45.4 (12.0)
Openness to experience 51.4 (7.8) 50.1 (7.1)
Table 39: Correlation of personality characteristics with elicited emotions, study 2 (*: p=0.10; **: p<0.05; ***: p<0.01; one-tailed)
The table shows the mean and standard deviation of the trait scores of those that elicited anger, distress or remorse in the course of study 2 versus those that did not. As can be seen there is a significant effect of Neuroticism on the occurrence of negatively valenced emotions. The mean score on trait Neuroticism was lower for those who elicited these emotions versus those who did not elicit these emotions. An independent t-test showed that the difference was significant (unequal variances, t=-2.04, df = 15.2, p=0.03, one tailed)72. This finding is surprising when compared to the literature on the effect of personality traits on emotions. As presented in section 5.3 trait Neuroticism is associated with more pronounced negative emotions (Kokkonen & Pulkkinen, 2001; R. J. Larsen & Buss, 2008; Penley & Tomaka, 2002). From the table it follows that that the higher rate of reflection for those with higher Neuroticism is not related to more
72 Although Extraversion and Agreeableness scored in the expected direction, the results were not statistically significant.
174
pronounced negative emotions and more severe penalties (rignore) in equation 4.0. Therefore it is suggested that higher Neuroticism is related to a higher learning rate α with which the current estimated value function is updated and/or a lower initial estimate of the value function Vignore (0).
9.4. Answer to the main research question
The main research question for the current research is:
RQ How do the components of cognitive resistance interact?
The aim of the current research is to contribute to the body of knowledge on mental models by studying the resistance of mental models. In particular it is aimed at discovering the episodic nature of cognitive resistance by identifying the components of cognitive resistance and proposing a framework for their interaction.
This research has generated answers to the subordinate research questions regarding the components of cognitive resistance, their interaction, and other factors. With the findings of the previous sections, the main research question has also been answered. However, even though the reinforcement learning framework described in chapter 4 has been used to define the outcome of the interaction (section 9.2) in terms of a probability of (instantaneous) reflection for each type of response, the episodic nature of cognitive resilience has not yet been discussed in terms of the results of the experimental study. This will be carried out in the next chapter.
175
10. Conclusions
In the previous chapter the results of the experimental study have been compared to the results of the literature review, and the research questions have been addressed. In this chapter conclusion regarding the wider application of the research findings are drawn and future work is identified. The research approach is also evaluated and limitations of the current research are identified.
10.1. The construct of cognitive resistance
In section 2.1 ‘cognitive resistance’ was introduced as a novel construct to describe the capacity to endure a discrepancy between reality and a mental model. In this section the deployment of this construct is justified.
Cognitive resistance has been defined as the capacity to endure contradictory stimuli until reflection on the assumptions underlying the mental model. It was predicted that cognitive resistance could best be modeled mathematically by a unimodal log-logistic distributed probability of reflection as a function of contradictory stimuli. The results of both experimental studies have validated this prediction, and show that cognitive resistance corresponds with performance on similar human signal detection tasks like crack identification and responding to alarm signals.
The construct represents a “real” physiological and neurological process from the discernment of contradictory stimuli to the conscious awareness of the discrepancy between expectations and reality. The change in sensitivity for contradictory stimuli during cognitive resistance and after reflection can be illustrated using a so-called Receiver Operating Characteristic curve (ROC curve, Fogarty, Baker, & Hudson, 2005; Proctor & Van Zandt, 2008; Wickens, 1992). The total data set of responses of study 2 can be used to analyze ‘hits’ and ‘misses’ of the participants, defined as:
hit (true positive): the participant perceives an error message that contradicts his mental model and it is demised; and
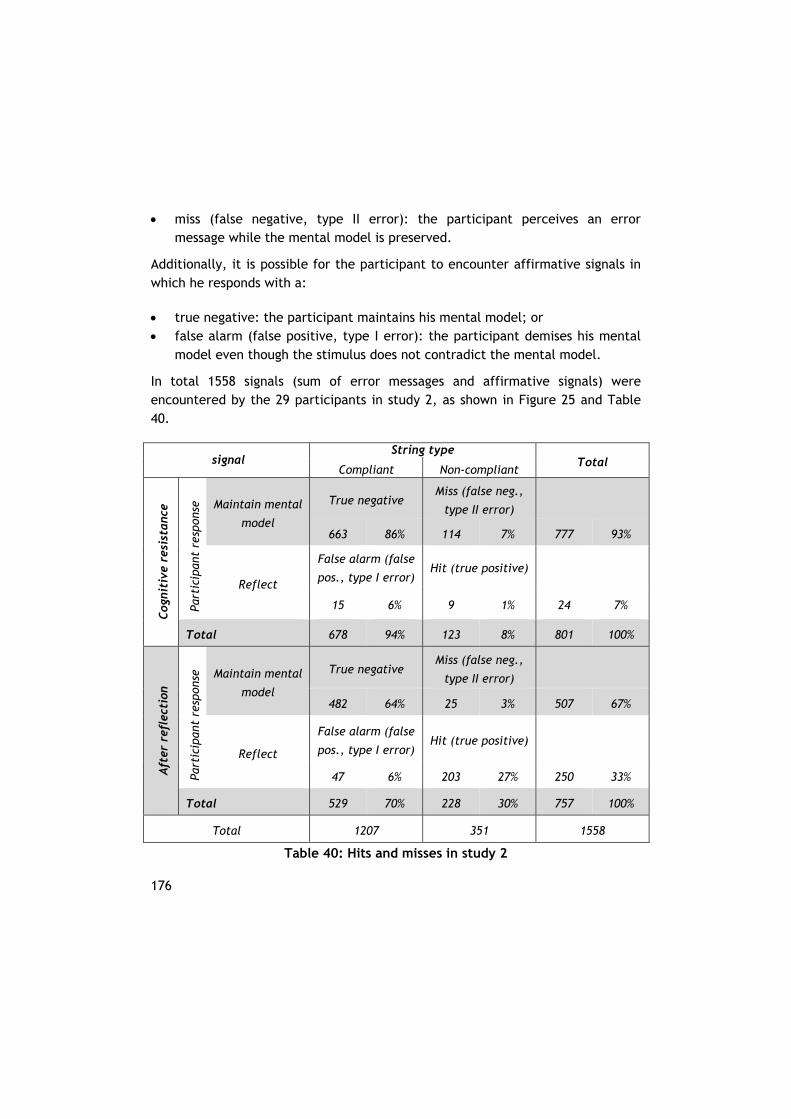
176
miss (false negative, type II error): the participant perceives an error message while the mental model is preserved.
Additionally, it is possible for the participant to encounter affirmative signals in which he responds with a:
true negative: the participant maintains his mental model; or false alarm (false positive, type I error): the participant demises his mental
model even though the stimulus does not contradict the mental model.
In total 1558 signals (sum of error messages and affirmative signals) were encountered by the 29 participants in study 2, as shown in Figure 25 and Table 40.
signal String type
Total Compliant Non-compliant
Cog
niti
ve r
esis
tanc
e
Part
icip
ant
resp
onse
Maintain mental
model
True negative Miss (false neg.,
type II error)
663 86% 114 7% 777 93%
Reflect
False alarm (false
pos., type I error) Hit (true positive)
15 6% 9 1% 24 7%
Total 678 94% 123 8% 801 100%
Aft
er r
efle
ctio
n
Part
icip
ant
resp
onse
Maintain mental
model
True negative Miss (false neg.,
type II error)
482 64% 25 3% 507 67%
Reflect
False alarm (false
pos., type I error) Hit (true positive)
47 6% 203 27% 250 33%
Total 529 70% 228 30% 757 100%
Total 1207 351 1558
Table 40: Hits and misses in study 2
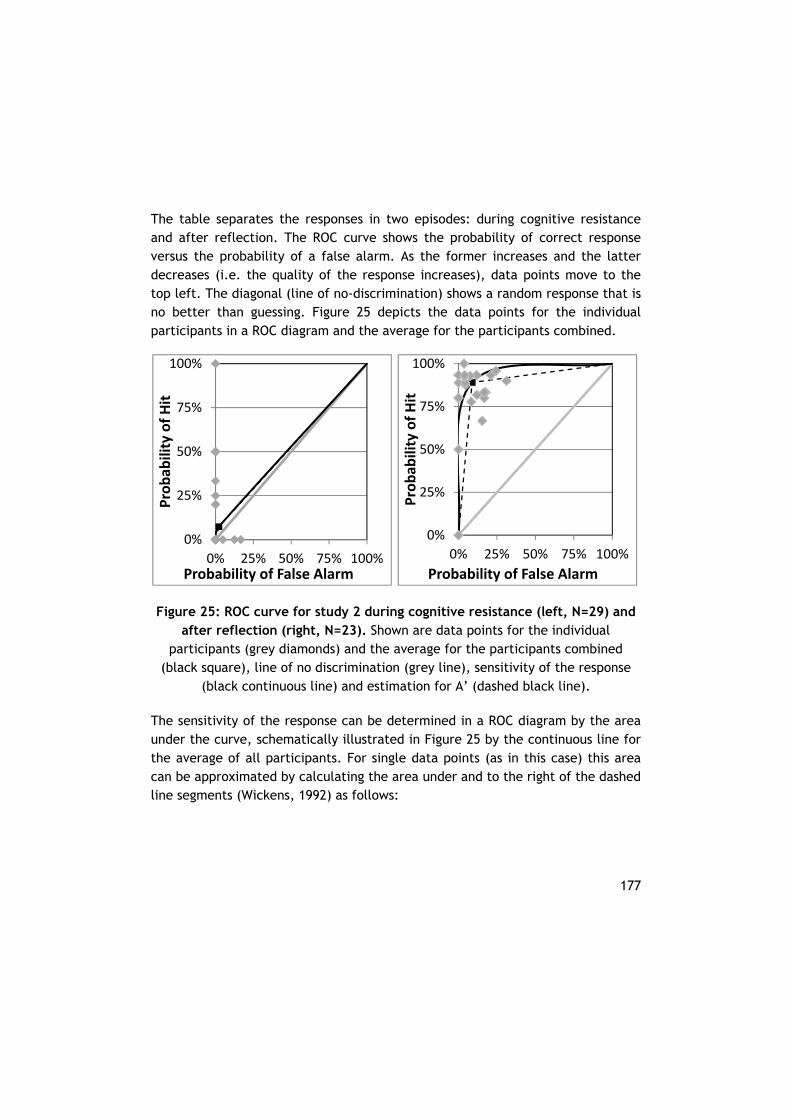
177
The table separates the responses in two episodes: during cognitive resistance and after reflection. The ROC curve shows the probability of correct response versus the probability of a false alarm. As the former increases and the latter decreases (i.e. the quality of the response increases), data points move to the top left. The diagonal (line of no-discrimination) shows a random response that is no better than guessing. Figure 25 depicts the data points for the individual participants in a ROC diagram and the average for the participants combined.
Figure 25: ROC curve for study 2 during cognitive resistance (left, N=29) and after reflection (right, N=23). Shown are data points for the individual
participants (grey diamonds) and the average for the participants combined (black square), line of no discrimination (grey line), sensitivity of the response
(black continuous line) and estimation for A’ (dashed black line).
The sensitivity of the response can be determined in a ROC diagram by the area under the curve, schematically illustrated in Figure 25 by the continuous line for the average of all participants. For single data points (as in this case) this area can be approximated by calculating the area under and to the right of the dashed line segments (Wickens, 1992) as follows:
0%
25%
50%
75%
100%
0% 25% 50% 75% 100%
Probab
ility of Hit
Probability of False Alarm
0%
25%
50%
75%
100%
0% 25% 50% 75% 100%
Probab
ility of Hit
Probability of False Alarm
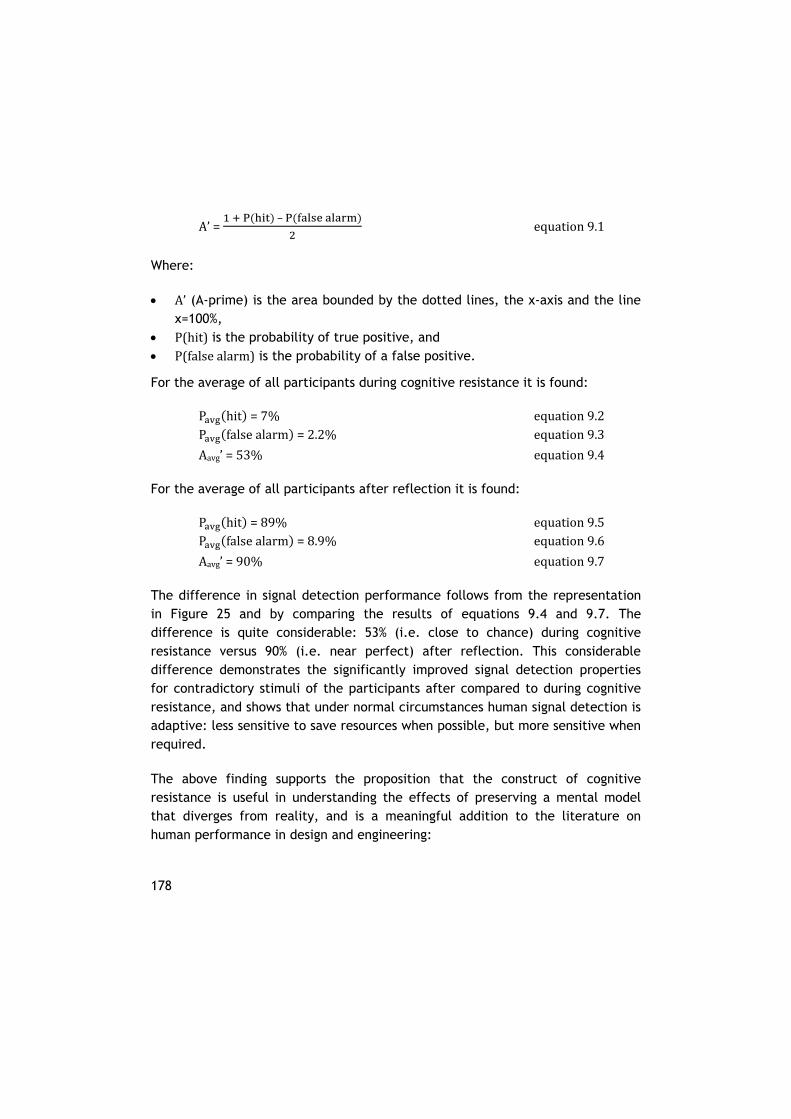
178
A’= –
equation9.1
Where:
A’ (A-prime) is the area bounded by the dotted lines, the x-axis and the line x=100%,
P(hit) is the probability of true positive, and P(falsealarm) is the probability of a false positive.
For the average of all participants during cognitive resistance it is found:
P hit =7% equation9.2P falsealarm =2.2% equation9.3
Aavg’=53% equation9.4
For the average of all participants after reflection it is found:
P hit =89% equation9.5P falsealarm =8.9% equation9.6
Aavg’=90% equation9.7
The difference in signal detection performance follows from the representation in Figure 25 and by comparing the results of equations 9.4 and 9.7. The difference is quite considerable: 53% (i.e. close to chance) during cognitive resistance versus 90% (i.e. near perfect) after reflection. This considerable difference demonstrates the significantly improved signal detection properties for contradictory stimuli of the participants after compared to during cognitive resistance, and shows that under normal circumstances human signal detection is adaptive: less sensitive to save resources when possible, but more sensitive when required.
The above finding supports the proposition that the construct of cognitive resistance is useful in understanding the effects of preserving a mental model that diverges from reality, and is a meaningful addition to the literature on human performance in design and engineering:
179
it refers to a phenomenon that has been described abundantly in the literature using other terms (cf. Table 3 on page 25) but it does not suffer from the negative connotation often attributed to the phenomenon in hindsight (cf. Woods et al., 2010);
the definition of cognitive resistance (page 31) allows the identification of its existence and contrast it against non-existence, as well as its beginning and when it ends (cf. Sander & Scherer, 2005);
the articulated model of cognitive resistance (Figure 7 on page 67) includes “constituent psychological mechanisms”, can be deductively validated, and does not (as yet) suffer from overgeneralization (cf. Dekker & Hollnagel, 2004); and
the model allowed predictions to be made that have been tested empirically (Dul & Hak, 2008).
Whereas the construct of cognitive resistance has merit, it does not in itself explain all instances of perseverance of ideas. This will be addressed in section 10.3. First we will elaborate on the affective model in the next section.
10.2. Affective model
One of the aims of the current research is to explore cognitive resistance as it unfolds. In this section the episodic nature of cognitive resilience is discussed in terms of the results of the experimental study, and compared to the reinforcement learning framework proposed in chapter 4.
The responses during cognitive resistance in study 2 are shown in Figure 26, based on the actual responses during the course of the study. The figure shows error messages (i.e. the contradictory stimuli) along the horizontal axis. The emotion type is indicated by the colors according to the legend; no emotion is indicated in black. The relative frequency of an occurrence is indicated on the vertical axis. Those that have reflected are no longer shown in the graph; therefore cognitive resilience diminishes as the contradictory stimuli persist.
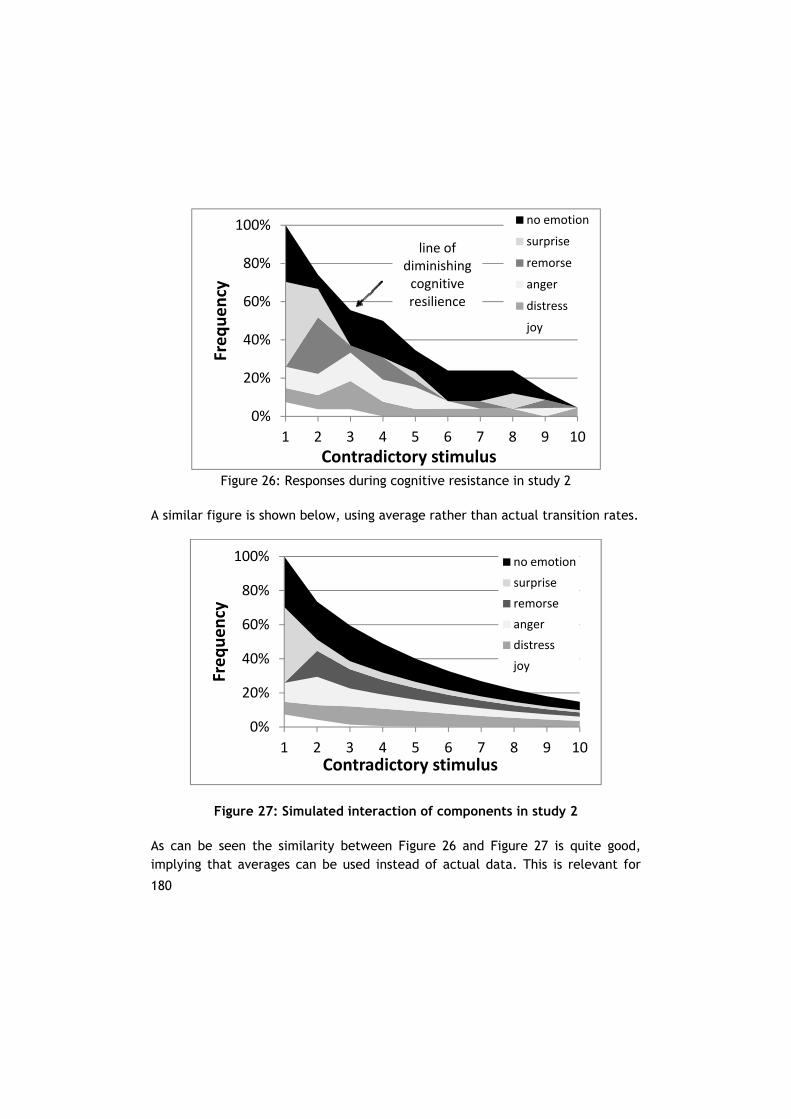
180
Figure 26: Responses during cognitive resistance in study 2
A similar figure is shown below, using average rather than actual transition rates.
Figure 27: Simulated interaction of components in study 2
As can be seen the similarity between Figure 26 and Figure 27 is quite good, implying that averages can be used instead of actual data. This is relevant for
0%
20%
40%
60%
80%
100%
1 2 3 4 5 6 7 8 9 10
Frequency
Contradictory stimulus
no emotion
surprise
remorse
anger
distress
joy
0%
20%
40%
60%
80%
100%
1 2 3 4 5 6 7 8 9 10
Frequency
Contradictory stimulus
no emotion
surprise
remorse
anger
distress
joy
line of diminishing cognitive resilience
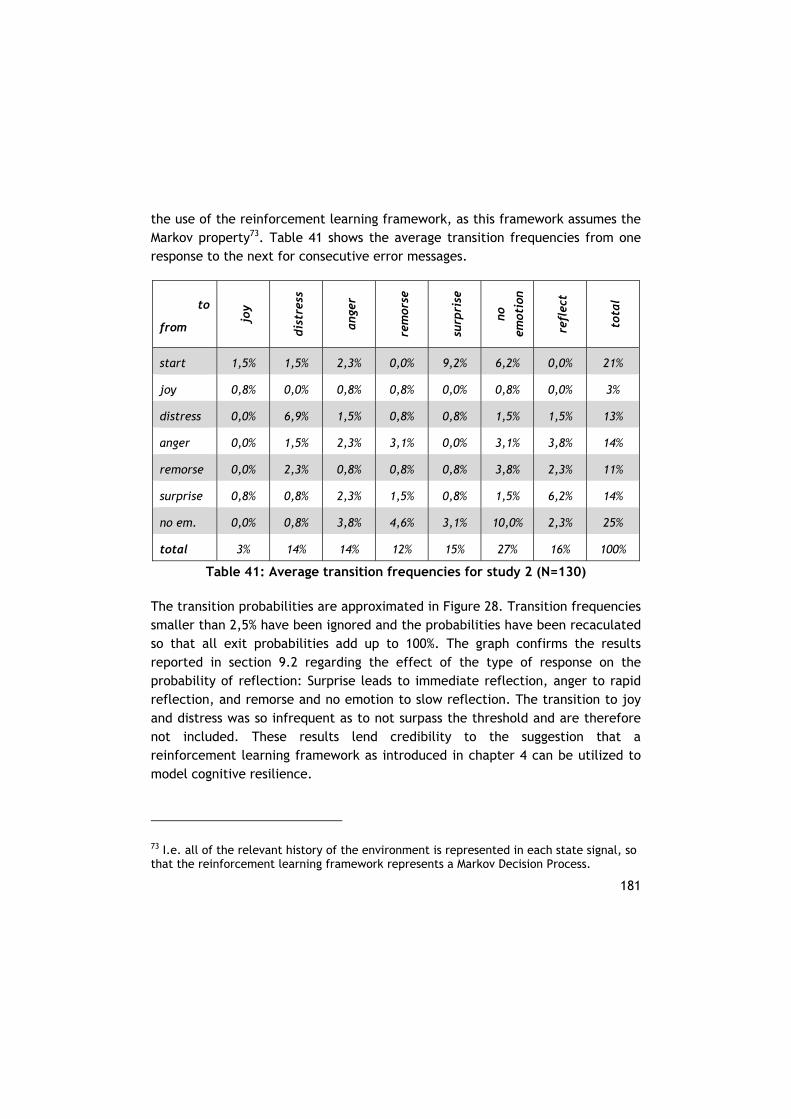
181
the use of the reinforcement learning framework, as this framework assumes the Markov property73. Table 41 shows the average transition frequencies from one response to the next for consecutive error messages.
to
from
joy
dis
tres
s
ang
er
rem
orse
surp
rise
no
emot
ion
refl
ect
tota
l
start 1,5% 1,5% 2,3% 0,0% 9,2% 6,2% 0,0% 21%
joy 0,8% 0,0% 0,8% 0,8% 0,0% 0,8% 0,0% 3%
distress 0,0% 6,9% 1,5% 0,8% 0,8% 1,5% 1,5% 13%
anger 0,0% 1,5% 2,3% 3,1% 0,0% 3,1% 3,8% 14%
remorse 0,0% 2,3% 0,8% 0,8% 0,8% 3,8% 2,3% 11%
surprise 0,8% 0,8% 2,3% 1,5% 0,8% 1,5% 6,2% 14%
no em. 0,0% 0,8% 3,8% 4,6% 3,1% 10,0% 2,3% 25%
total 3% 14% 14% 12% 15% 27% 16% 100%
Table 41: Average transition frequencies for study 2 (N=130)
The transition probabilities are approximated in Figure 28. Transition frequencies smaller than 2,5% have been ignored and the probabilities have been recaculated so that all exit probabilities add up to 100%. The graph confirms the results reported in section 9.2 regarding the effect of the type of response on the probability of reflection: Surprise leads to immediate reflection, anger to rapid reflection, and remorse and no emotion to slow reflection. The transition to joy and distress was so infrequent as to not surpass the threshold and are therefore not included. These results lend credibility to the suggestion that a reinforcement learning framework as introduced in chapter 4 can be utilized to model cognitive resilience.
73 I.e. all of the relevant history of the environment is represented in each state signal, so that the reinforcement learning framework represents a Markov Decision Process.
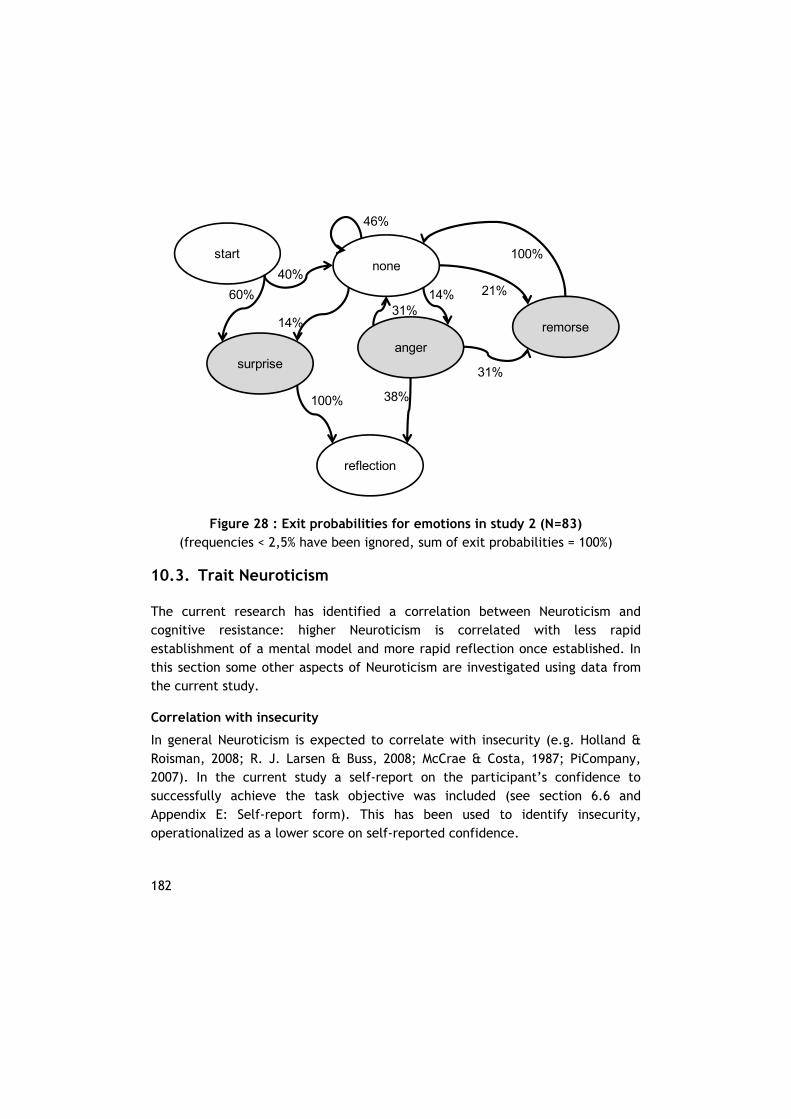
182
Figure 28 : Exit probabilities for emotions in study 2 (N=83) (frequencies < 2,5% have been ignored, sum of exit probabilities = 100%)
10.3. Trait Neuroticism
The current research has identified a correlation between Neuroticism and cognitive resistance: higher Neuroticism is correlated with less rapid establishment of a mental model and more rapid reflection once established. In this section some other aspects of Neuroticism are investigated using data from the current study.
Correlation with insecurity
In general Neuroticism is expected to correlate with insecurity (e.g. Holland & Roisman, 2008; R. J. Larsen & Buss, 2008; McCrae & Costa, 1987; PiCompany, 2007). In the current study a self-report on the participant’s confidence to successfully achieve the task objective was included (see section 6.6 and Appendix E: Self-report form). This has been used to identify insecurity, operationalized as a lower score on self-reported confidence.
reflection
remorse
surprise
nonestart
40%
60%
100%
14%
100%
anger
31%
31%
38%
21%
46%
14%
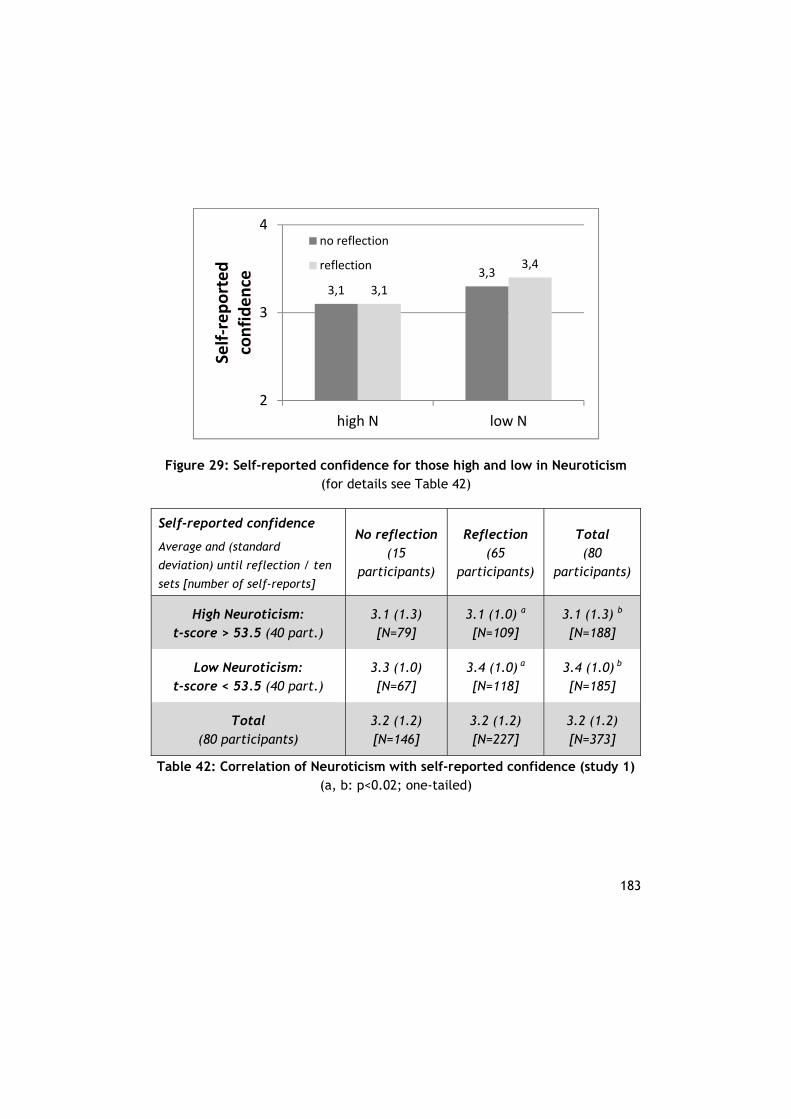
183
Figure 29: Self-reported confidence for those high and low in Neuroticism (for details see Table 42)
Self-reported confidence
Average and (standard
deviation) until reflection / ten
sets [number of self-reports]
No reflection (15
participants)
Reflection (65
participants)
Total (80
participants)
High Neuroticism: t-score > 53.5 (40 part.)
3.1 (1.3)
[N=79] 3.1 (1.0) a [N=109]
3.1 (1.3) b
[N=188]
Low Neuroticism: t-score < 53.5 (40 part.)
3.3 (1.0)
[N=67]
3.4 (1.0) a [N=118]
3.4 (1.0) b
[N=185]
Total (80 participants)
3.2 (1.2) [N=146]
3.2 (1.2) [N=227]
3.2 (1.2) [N=373]
Table 42: Correlation of Neuroticism with self-reported confidence (study 1) (a, b: p<0.02; one-tailed)
3,1
3,3
3,1
3,4
2
3
4
high N low N
Self‐reported
confidence
no reflection
reflection
184
As shown in Figure 29 and Table 42, the results of the first study74 replicate the expected correlation between Neuroticism and insecurity. The table shows that the correlation between Neuroticism and insecurity is independent of whether reflection is achieved or not. Only data is included in the table that stems from self-reports preceding reflection, i.e. in the course of cognitive resistance. The participants of study 1 were divided along the median of Neuroticism (t-score = 53.5).
Possible advantages of Neuroticism for design engineers
As indicated in section 7.1, the participants in the current study have elevated average scores for Neuroticism and reduced average scores for Extraversion and Agreeableness (Figure 13), which matches reports for engineers in other studies.
The negative effects of Neuroticism have been well-described in the psychological literature. Besides insecurity, high Neuroticism is also presumed to be correlated with high stress levels, increased probability of psychiatric disorders (particularly depression and anxiety), and a predictor of relationship failure and social isolation (R. J. Larsen & Buss, 2008; Daniel Nettle, 2006). Soldz and Vaillant (1999) studied the correlation of Neuroticism75 with “life course variables” that describe career and societal success:
employment, maximum income, career advancement and work enjoyment (negative);
highest attained level of psychosocial development according to Erikson (negative);
maturity of defenses (negative); depression – self and in family – and need for psychiatric treatment; and mood-altering drug use, alcohol abuse and smoking.
Cuijpers (2010) reports that the economic cost of Neuroticism is “enormous” and is approximately 2.5 times as high as the total costs of common mental disorders. Even in the wording of personality tests Neuroticism is often described in
74 Self-reports are not available for the second study due to the compressed time scale in study 2. 75 The study included all Big Five traits but we limit the discussion to Neuroticism here.
185
disparaging terms (e.g. Costa et al., 1992; R. J. Larsen & Buss, 2008 p.532; PiCompany, 2006)76.
In contrast, Nettle (2006) suggests that “the Big Five dimensions of human personality can be seen as the result of a trade-off between different fitness costs and benefits”. There must be advantages to high Neuroticism “given the normal distribution observed in the human population, and the persistence of lineages demonstrably high in the trait”. The alleged advantages of Neuroticism include vigilance, wariness and anxiety to enhance the detection of ambiguous or threatening stimuli and avoid danger (Bar-Haim, Lamy, Pergamin, Bakermans-Kranenburg, & van Ijzendoorn, 2007; Mathews, Mackintosh, & Fulcher, 1997). Increasing neuroticism is also associated with striving and achievements (D. Nettle, 2004).The results from the current study show that those high in Neuroticism are less susceptible to cognitive resistance than others, thereby giving support to the alleged advantages of Neuroticism and a more balanced view of its costs and benefits.
The attraction of engineering for those high in Neuroticism has generally been defined in terms of the need for structured tasks and a lack of tolerance for ambiguity (e.g. Chan, 2004). Vice versa, the results of the current study suggest that the benefit of those high in Neuroticism for engineering tasks is rapid reflection and a lower reliance on mental models. Neuroticism is also related with the avoidance of risks for self and for others. Therefore, it is postulated that rapid reflection is possibly an advantage in the dynamic and uncertain circumstances under which design activities are performed, so that engineering risks are avoided.
76The facets for Neuroticism in the most common psychometric test (NEO-PI-R) are named: anxiety, angry hostility, depression, self-consciousness, impulsiveness, vulnerability (Costa, McCrae et al. 1992); those high in Neuroticism are described as: “Generally reacts emotionally to adversity and can continue to be worried. Will then maintain focus on problems rather than solutions. Can be personally affronted by criticisms of others and then be annoyed. Can easily become insecure when challenged and requires time to readjust.” (Translated from a Dutch test report, PiCompany 2006).
186
Stubborn engineers?
Although the findings of the current research support the elevated average scores for Neuroticism in the engineering population, this is related to a reduction (rather than an increase) in cognitive resistance. How can this be matched with the stubbornness of the stereotype engineer that was alluded to in the preface to this thesis? This finding seems to suggest that engineering stubbornness is an artifact of conscious and rational system 2 thinking – a thought that may be comforting for many in the profession. The relative low frequency of feedback (compared to the context of manual or supervisory control) as well as other aspects of job design such as organizational support, loci of control and clarity of information may also contribute to delays in reflection (Lauche, 2005).
Social behavior is considered to be largely automatic (Iacoboni, 2009; Rameson, Morelli, & Lieberman, 2011), and can thus be impeded by conscious thought. The alleged lack of socially adept behavior of engineers may constitute the reciprocal effect of essential engineering competences, i.e. less inclination for automatic behavior, and contrasts vividly with the frequent call to develop more communicative engineers (e.g. Ravesteijn, Graaff, & Kroesen, 2006; Saunders-Smits, 2008). This certainly rings true from practical experience: I have been surprised by engineers that wait for weeks with feelings of cropped up anger before complaining about something that really bothers them (i.e. system 2), rather than reacting more intuitively and bringing it up immediately.
10.4. Evaluation of the research approach
In this section the research approach as proposed in section 2.3 is evaluated and limitations of the current research are identified.
Literature review
The literature review for the current work was initiated from two seminal works: The Reflective Practitioner (Schön, 1983) and Mental Models (Johnson-Laird, 1983). The literature review has covered more than 800 works, of which more than 380 are referenced in this dissertation. The references are summarized in Table 43 according to the year of publication and the domain.
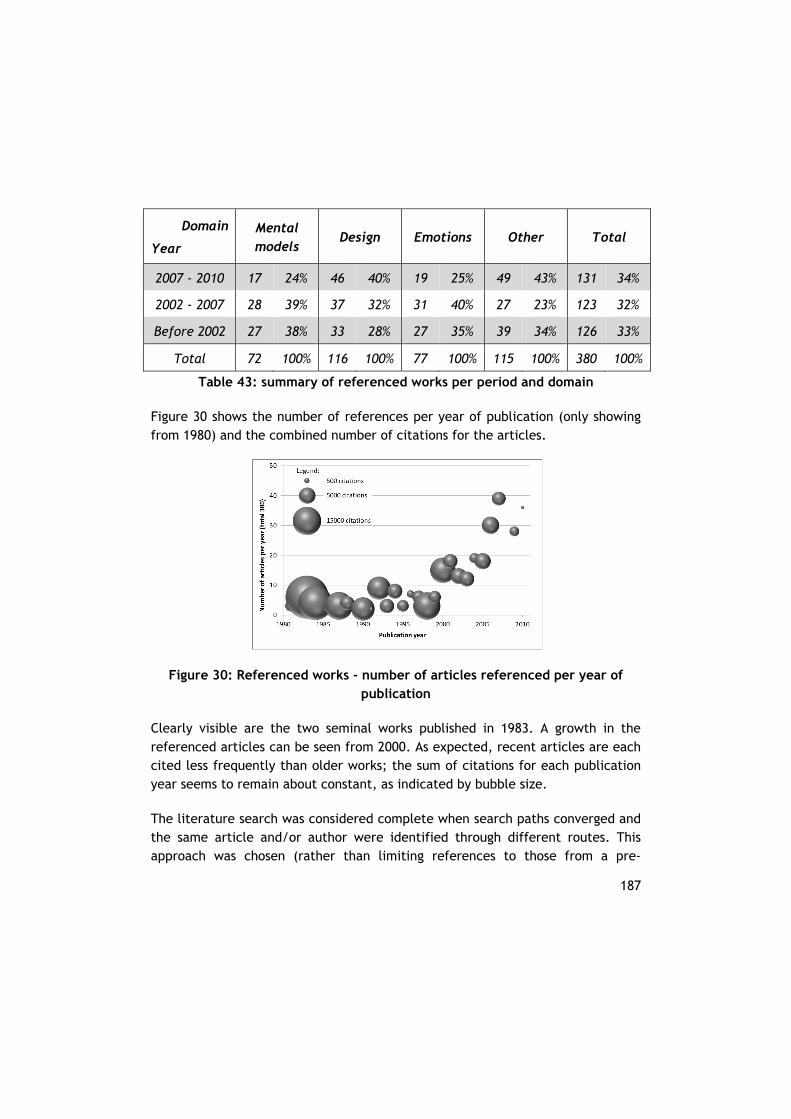
187
Domain
Year
Mental models
Design Emotions Other Total
2007 - 2010 17 24% 46 40% 19 25% 49 43% 131 34%
2002 - 2007 28 39% 37 32% 31 40% 27 23% 123 32%
Before 2002 27 38% 33 28% 27 35% 39 34% 126 33%
Total 72 100% 116 100% 77 100% 115 100% 380 100%
Table 43: summary of referenced works per period and domain
Figure 30 shows the number of references per year of publication (only showing from 1980) and the combined number of citations for the articles.
Figure 30: Referenced works - number of articles referenced per year of publication
Clearly visible are the two seminal works published in 1983. A growth in the referenced articles can be seen from 2000. As expected, recent articles are each cited less frequently than older works; the sum of citations for each publication year seems to remain about constant, as indicated by bubble size.
The literature search was considered complete when search paths converged and the same article and/or author were identified through different routes. This approach was chosen (rather than limiting references to those from a pre-
188
selection of journals) because of the multi-disciplinary nature of this investigation. Despite the large number of references and the convergence of articles and authors it is not certain that all relevant documents have been found because a rather broad scientific field ranging from engineering and design, human factors, team interaction, to personality psychology and neurobiology has been accessed. In fact, this broad range of sources may have limited a deeper understanding in certain areas.
Experimental study
The experimental design has been described and justified in chapter 6. The explorative experimental study was successful in generating cognitive resistance in a time scale suitable for research, validating the defining characteristics of this phenomenon, and understanding the interaction of the components. Participants were unaware of the real objective of the task and were not sensitized to the contradictory stimuli. However, the study included several significant limitations:
a severe limitation to the validity of the results of study 2 and therefore the general conclusions of the current research is the number of participants (N=29), due to the limited number of participants that were able to identify the pattern in the strings and establish a mental model (see Figure 18);
the design of study 1 was inappropriate as the manipulation resulted in a delay between feedback and reflection, and the results were confounded by the initial instructions given by the system and the researcher;
a-priori selection of participants from the engineering population has not been successful in reducing the bandwidth of trait scores; and
the measures for emotional response had insufficient inter-measure reliability to be useful;
the heart rate monitors did not always work satisfactorily.
The experimental design was generally successful in realizing the intended manipulation, identifying reflection, and achieving an acceptable inter-rater reliability for emotional response and emotion type. The results of the experimental study were considered sufficient to validate the predictions that followed from the literature review, although further work is required to substantiate the results. The choice for an individual setting was appropriate,
189
because the present research shows that emotions are elicited even without social interactions. In a team setting it is probable that emotions are elicited as a result of cognitive resistance (i.e. involuntarily), but also tactically to emphasize an important point.
10.5. Scientific Contribution and further work
In general the results of the experimental study are considered sufficient to validate the predictions that followed from the literature review, although more work is required to further substantiate the results and replicate them in a more practical context. The chosen approach of this research, incorporating an extensive review of the literature and an exploratory experimental study, may be criticized for a lack of independent and dependent variables and a restriction in context richness. However, the value of the current research lies in its exploration of a phenomenon that:
lacked a clear definition; suffered from a bias towards its detrimental rather than beneficial
consequences; and of which the episodic nature had not previously been investigated.
The difficulty to detect the difference between cognitive resistance (system 1) and conscious stubbornness (system 2) in practice (as mentioned in section 10.3) supports the choice for this approach.
The contributions to science are specified in more detail below.
Design methodology
The findings of the current work contribute to the science of design methodology by providing a theoretical and empirical foundation for mental models. The definition of a mental model has been refined, and compared to similar constructs in the literature. The interaction between emotions and reflection that have been suggested by Schön (1983, 1987) has been validated. This study also contributes to previous attempts to relate emotions to design performance, by suggesting that the relationship may not be a direct one. Rather, the findings of this study suggest that emotions are influential in achieving reflection, and reflection may or may not improve performance.
190
Further experimental work is required to identify the sensitivity of cognitive resistance for variations in type and intensity of the contradictory stimuli. Further work is also required to expand the validity of the findings of the current study to the actual practice of design, using design games or actual design tasks and in individual and group settings. It is envisaged that the operationalization of mental model establishment, contradictory stimuli and reflection will be challenging in situations that are more real-life than the current study. The implications of the current findings for design practice also require further work. In particular, examples of cognitive resistance in design practice can help designers and managers to recognize the subconscious and cognitive processes that are involved in designing complex systems, and where possible mitigate the negative effects of “cognitive biases that lead to optimistic forecasts resulting in cost overruns” (Cantarelli, Flyvbjerg, van Wee, & Molin, 2010).
Teamwork
The refinement of the mental model construct contributes to the field of teamwork by supporting the theoretical foundation for team mental models. The team mental model (TMM) construct (e.g. Klimoski & Mohammed, 1994) has been applied in empirical studies that have “consistently demonstrated the positive effect of TMM sharedness on team performance“ across a wide range of domains over the past decade and a half (Mohammed, Ferzandi, & Hamilton, 2010). Despite the growth in popularity, the exact definition of the team mental model construct is unclear:
Does the TMM also include shared knowledge that is not relevant to the team task - in contradiction to what many authors have suggested (Janis A. Cannon-Bowers & Salas, 2001; J. A. Cannon-Bowers et al., 1993; Mohammed et al., 2010) but seemingly less contentious in drawing the line?
Is all shared knowledge in a team part of the team mental model, or just the knowledge of which the team members are aware that it is shared?
Does the TMM include unique knowledge of a team member that aids in accomplishing the team task, even if the existence of this knowledge is not known to the other team members - supported by Kozlowski (2006) but refuted by Mohammed et al (2010)?
191
Is it necessary to differentiate between transactive memory and team mental models rather than considering the former a subset of the latter (e.g. Kozlowski & Ilgen, 2006; Mohammed et al., 2010)?
The consistent positive effect of team mental models and the imprecise definition make the construct susceptible to some of the characteristics of folk models that are sometimes encountered in the study of human performance: explanation by means of substitution instead of decomposition, immunity against falsification, and inclination for overgeneralization (Dekker & Hollnagel, 2004). The theoretical foundation that the current work offers may support further clarification of the team mental model construct.
Additionally, the current work contributes to the theoretical and practical body of knowledge on optimal team composition. In general, team performance has been shown to be correlated with proficient social behavior (e.g. Ravesteijn et al., 2006; Woolley, Chabris, Pentland, Hashmi, & Malone, 2010). However, the findings of the influence of personality characteristics on cognitive resistance warrant further research to investigate the effect of ambiguous stimuli on team performance for different team compositions.
Psychology and Human Factors
The current work is founded on the work by Johnson-Laird (1983, 2006a) on mental models but also aligns with recent literature on system 1 and system 2 thinking (e.g. Kahneman, 2011) and the prominent role of the subconscious in decision making (Dijksterhuis & Nordgren, 2006). Differences with the Human Factors literature have been highlighted. It is hoped that this research might therefore contribute in a small way to the convergence of these schools of thought.
The reinforcement learning framework that was developed in chapter 4 has contributed to the validated predictions for the effect of emotions on cognitive resistance. This successful but limited application of temporal learning suggests that other psychological phenomena could possibly be modeled in a similar way. The current model may be significantly enhanced by improving the estimate for the rewards and penalties, and further validating the model in experimental and field settings.
192
It is similarly hoped that the findings relating to Neuroticism contribute to a more balanced view of the costs and benefits of this trait. The correlation between cognitive resistance and Neuroticism that was established warrants further investigation, for instance in combination with the Cognitive Reflection Test (Frederick, 2005).
10.6. Practical relevance
Although my experience in industry inspired the current work, the direct practical relevance of this research is limited due to the exploratory nature of the investigation. The initial trigger for this research was collaboration between engineers that seems to be promoted or impeded by emotion – teams of engineers at Fokker that are heavily involved with each other and are discussing intensively make more headway than those that were retracted and less drawn in. The research has generated a plausible explanation, in that the cognitive resistance to the alignment of individual mental models triggers emotional responses.
A better understanding of cognitive resistance will support our understanding of many common mistakes in aviation and other socio-technical systems, such as:
Design changes to an auto throttle that are not implemented despite the occurrence of many incidents (OVV, 2010);
A technician that mounts an engine seal the wrong way, despite the fact that this is visible on the technical drawing (NN, 2011); or
A pilot taking off from a taxi way at night despite the difference in lighting compared to a runway (OVV, 2011).
The difficulty to detect the difference between conscious stubbornness (system 2) and cognitive resistance (system 1) is problematic from a practical point of view, because the strategies to resolve them will most probably differ. This requires further research. A similar difficulty is expected in making the distinction between errors as a result of cognitive resistance and errors made in conscious thought (cf. Rasmussen, 1983). A better understanding of the mechanisms that underlie both erroneous and non-erroneous behavior are expected to enable progress in this important field.
193
The effect of emotions and personality on cognition is generally underestimated in engineering environments. The current work extends the application of psychological theories and findings into the domain of design engineering (Flach et al., 2008; Hohn, 1999; Lauche, 2007), and indirectly facilitates improved individual and team performance.
Automation surprise
As mentioned in section 5.2, automation surprise is a special case of cognitive resistance, defined as “situations in which crews [i.e. in airplane cockpits] are surprised by control actions taken by automated systems [because] they misinterpret or misassess data on system states and functioning” (Mosier, 2010). Automation surprise can have dire consequences (Dekker, 2009; Mouloua, Hancock, Jones, & Vincenzi, 2010), and will become increasingly widespread as human tasks are transformed from manual into supervisory control (Cottrell & Barton, 2011).
Although the direct cause of an automation surprise is a mismatch between the individual’s understanding of a complex system and the system’s actual performance, little is as yet known about how automation surprise unfolds and how it may be terminated, let alone which factors encourage or impede it. It is envisaged that research will be conducted at the Amsterdam University of Applied Sciences where automation surprise will be investigated using a static flight simulator. This allows us to explore potential factors of influence (e.g. fatigue) and identify mitigating measures.

194
195
References
Akin, C. (2008). Frames of Reference in Architectural Design:Analyzing the Hyper-Acclamation (A-h-
a-!) (No. paper 25): Carnegie Mellon University.
Akin, Ö., & Akin, C. (1996). Frames of reference in architectural design: analysing the
hyperacclamation (A-h-a-!). Design Studies, 17(4), 341-361.
Allen, J. E., & Self, A. (2008). Analysis of the integration of knowledge and novelty in creative
engineering design. Proceedings of the Institution of Mechanical Engineers, Part G: Journal of
Aerospace Engineering, 222(1), 127-167.
Altfeld, H. (2010). Commercial Aircraft Projects: Managing the Development of Highly Complex
Products. Farnham, UK: Ashgate Pub Co.
Argyris, C., & Schon, D. A. (1974). Theory in practice: Increasing professional effectiveness: Jossey-
Bass.
Austin, E. J. (2005). Personality correlates of the broader autism phenotype as assessed by the Autism
Spectrum Quotient (AQ). Personality and Individual Differences, 38, 451-460.
Badke-Schaub, P. (2004). Strategies of experts in engineering design: between innovation and routine
behaviour. The Journal of Design Research, 4(2).
Badke-Schaub, P. (2005). Why designing is best to be described as complex problem solving - and why
designers are best to be described as human beings. In P. Badke-Schaub, C. Cardoso, K. Lauche &
N. F. M. Roozenburg (Eds.), Design Theory and Methodology (Vol. ID 4010). Delft: Delft University
of Technology.
Badke-Schaub, P., Goldschmidt, G., & Meijer, M. (2007). Cognitive Conflict in Design Teams:
Competing or Collaborating? Paper presented at the International Conference on Engineering
Design, Paris.
Badke-Schaub, P., Goldschmidt, G., & Meijer, M. (2010). How Does Cognitive Conflict in Design Teams
Support the Development of Creative Ideas? Creativity and Innovation Management, 19(2), 119-
133.
Badke-Schaub, P., Lauche, K., & Neumann, A. (2007). Team mental models in design (editorial).
CoDesign, 3(1), 1 - 3.
Badke-Schaub, P., Lauche, K., Neumann, A., & Ahmed, S. (2009). Task, Team, Process: The
development of Shared Representations in an Engineering Design Team. In J. McDonnell & P.
Lloyd (Eds.), About: Designing-Analysing Design Meetings. Leiden: CRC Press/Balkema.
Badke-Schaub, P., Neumann, A., Lauche, K., & Mohammed, S. (2007). Mental models in design teams:
a valid approach to performance in design collaboration? CoDesign, 3(1), 5-20.
Bailenson, J. N., Pontikakis, E. D., Mauss, I. B., Gross, J. J., Jabon, M. E., Hutcherson, C. A. C., et al.
(2008). Real-time classification of evoked emotions using facial feature tracking and physiological
responses. International Journal of Human-Computer Studies, 66(5), 303-317.
Bainbridge, L. (1992). Mental models in cognitive skill: The example of industrial process operation.
Models in the mind: theory, perspective and application, 119-143.

196
Bainbridge, L., & Dorneich, M. C. (2010). Processes underlying Human Performance. In J. A. Wise, V.
D. Hopkin & D. J. Garland (Eds.), Handbook of aviation human factors (2nd ed.). Boca Raton:
CRC.
Bar-Haim, Y., Lamy, D., Pergamin, L., Bakermans-Kranenburg, M. J., & van Ijzendoorn, M. H. (2007).
Threat-related attentional bias in anxious and nonanxious individuals: A meta-analytic study.
Psychological Bulletin, 133(1), 1.
Bargh, J. A., & Chartrand, T. L. (1999). The unbearable automaticity of being. American Psychologist,
54(7), 462-479.
Baron-Cohen, S. (2002). The extreme male brain theory of autism. Trends in Cognitive Sciences, 6(6),
248-254.
Baron-Cohen, S. (2008). Autism, hypersystemizing, and truth. The Quarterly Journal of Experimental
Psychology, 61(1), 64-75.
Baron-Cohen, S., Richler, J., Bisarya, D., Gurunathan, N., & Wheelwright, S. (2003). The systemizing
quotient: an investigation of adults with Asperger syndrome or high functioning autism, and
normal sex differences. Philosophical Transactions of the Royal Society of London. Series B:
Biological Sciences, 358(1430), 361-374.
Baron-Cohen, S., Wheelwright, S., Burtenshaw, A., & Hobson, E. (2007). Mathematical Talent is
Linked to Autism. Human Nature, 18, 125-131.
Barrett, L. F., Mesquita, B., Ochsner, K. N., & Gross, J. J. (2007). The experience of emotion. Annual
review of psychology, 58, 373.
Barrett, L. F., & Wager, T. D. (2006). The Structure of Emotion: Evidence From Neuroimaging Studies.
Current Directions in Psychological Science.
Basso, M. R., Schefft, B. K., Ris, M. D., & Dember, W. N. (1996). Mood and global-local visual
processing. Journal of the International Neuropsychological Society, 2(03), 249-255.
Baumeister, R. F., & Masicampo, E. J. (2010). Conscious Thought Is for Facilitating Social and Cultural
Interactions: How Mental Simulations Serve the Animal-Culture Interface. Psychol. Rev, 117(3),
945-971.
Baumeister, R. F., Vohs, K. D., & Nathan DeWall, C. (2007). How emotion shapes behavior: Feedback,
anticipation, and reflection, rather than direct causation. Personality and Social Psychology
Review, 11(2), 167.
Baxter, G., Besnard, D., & Riley, D. (2007). Cognitive mismatches in the cockpit: Will they ever be a
thing of the past? Applied Ergonomics, 38(4), 417-423.
Bechara, A., & Damasio, A. R. (2005). The somatic marker hypothesis: A neural theory of economic
decision. Games and Economic Behavior, 52(2), 336-372.
Bechara, A., Damasio, H., & Damasio, A. R. (2000). Emotion, decision making and the orbitofrontal
cortex. Cerebral cortex, 10(3), 295.
Bechara, A., Damasio, H., Tranel, D., & Damasio, A. R. (1997). Deciding advantageously before
knowing the advantageous strategy. Science, 275(5304), 1293.
Besnard, D., Greathead, D., & Baxter, G. (2004). When mental models go wrong: co-occurrences in
dynamic, critical systems. International Journal of Human-Computer Studies, 60(1), 117-128.
197
Bierhals, R., Schuster, I., Kohler, P., & Badke-Schaub, P. (2007). Shared mental models - linking team
cognition and performance. CoDesign, 3(1), 75 - 94.
Biyalogorsky, E., Boulding, W., & Staelin, R. (2006). Stuck in the past: Why managers persist with new
product failures. Journal of Marketing, 70(2), 108-121.
Blom, H. A. P., Daams, J., & Nijhuis, H. B. (2000). Human cognition modelling in ATM safety
assessment. Paper presented at the 3rd FAA/Eurocontrol R&D Seminar, Napoli.
de Boer, R. J. (1988). Human Whole-body Motion Sensitivity with Unrestrained Head. Delft University
of Technology, Delft.
de Boer, R. J. (2009a). Enjoy your ingenuity: Emotion elicitation of individuals and teams during
cognitive tasks and its impact on team performance, internal publication. Delft: Delft University
of Technology.
de Boer, R. J. (2011). Seneca's Error: the Intervening Effect of Emotions on Mental Model
Preservation. Paper presented at the Symposium on Human Factors for Future Aviation,
Amsterdam, the Netherlands. de Boer, R. J., & Badke-Schaub, P. (2008a). Emotional Alignment in teams: How
Emotions Support the Design Process, International Design Conference - DESIGN 2008.
Dubrovnik: Design Society. de Boer, R. J., & Badke-Schaub, P. (2008b). Simultaneous emotional arousal in teams
leads to better performance, XXIX International Congress of Psychology Berlin:
International Union of Psychological Science.
de Boer, R. J., Badke-Schaub, P., & Santema, S. C. (2010a). Emotion Elicitation in Individuals During
a Cognitive Task. In R. Curran (Ed.), Air Transport & Operations Symposium 2010. Delft, the
Netherlands. de Boer, R. J., Badke-Schaub, P., & Santema, S. C. (2010b). Emotion Elicitation during a
Cognitive TAsk, International Design Conference - DESIGN 2010. Dubrovnik: Design Society.
Bonanno, G., & Keltner, D. (2004). The coherence of emotion systems: Comparing “on line” measures
of appraisal and facial expressions, and self report. Cognition and Emotion, 18(3), 431-444.
Boos, M. (2007). Optimal sharedness of mental models for effective group performance. CoDesign,
3(1), 21-28.
Bosse, T., Jonker, C. M., Van Der Meiji, L., Sharpanskykh, A., & Treur, J. (2009). Specification and
verification of dynamics in agent models. International Journal of Cooperative Information
Systems, 18(1), 167-193.
Bradley, M. M., Codispoti, M., Cuthbert, B. N., & Lang, P. J. (2001). Emotion and motivation I:
Defensive and appetitive reactions in picture processing. Emotion, 1(3), 276-298.
Bradley, M. M., & Lang, P. J. (2007). The International Affective Picture System (IAPS) in the study of
emotion and attention. In J. A. Coan & J. J. B. Allen (Eds.), Handbook of emotion elicitation and
assessment (pp. 29–46): Oxford University Press.
Brody, L. R., & Hall, R. J. (2008). Gender and Emotion in Context. In M. Lewis, J. M. Haviland-Jones &
L. Feldman Barrett (Eds.), Handbook of Emotions (Third ed., pp. 395). New York: The Guilford
Press.
Bucciarelli, L. L. (1994). Designing Engineers. Cambridge, Massachusetts: The MIT press.
198
Camm, A. J., Malik, M., & et. al. (1996). Heart Rate Variability : Standards of Measurement,
Physiological Interpretation, and Clinical Use. European Heart Journal, 17, 354-381.
Canli, T., Sivers, H., Whitfield, S. L., Gotlib, I. H., & Gabrieli, J. D. E. (2002). Amygdala Response to
Happy Faces as a Function of Extraversion. Science, 296, 2191.
Canli, T., Zhao, Z., Desmond, J. E., Kang, E., Gross, J., & Gabrieli, J. D. E. (2001). An fMRI Study of
Personality Influences on Brain Reactivity to Emotional Stimuli. Behavioral Neuroscience, 115(1),
33-42.
Cannon-Bowers, J. A., & Salas, E. (2001). Reflections on shared cognition. Journal of Organizational
Behavior, 22, 8.
Cannon-Bowers, J. A., Salas, E., & Converse, S. A. (1993). Shared mental models in expert decision
making teams. Current issues in individual and group decision making, 221-246.
Cantarelli, C. C., Flyvbjerg, B., van Wee, B., & Molin, E. (2010). Cost overruns in large-scale
transportation infrastructure projects: Which explanations can be given? European Journal of
Transport and Infrastructure Research, 5-18.
Cardoso, C., Badke-Schaub, P., & Luz, A. (2009). Design fixation on non-verbal stimuli: the influence
of simple vs rich pictorial information on design problem solving, Proceedings of the ASME 2009
International Design Engineering Technical Conferences & Computers and Information in
Engineering Conference. San Diego, California, USA.
Carnino, A., Idee, E., Boulanger, J. L., & Morlat, G. (1988). Representational errors: why some may
be termed “diabolical”. In L. P. Goodstein (Ed.), Task, Errors and Mental Models (pp. 240-250):
Taylor & Francis, Inc.
Carver, C. S. (2006). Approach, avoidance, and the self-regulation of affect and action. Motivation
and Emotion, 30(2), 105-110.
Casner, S. M. (2010). General Aviation. In E. Salas & D. Maurino (Eds.), Human factors in aviation
(2nd ed., pp. 595-). Burlington, Mass: Academic Press.
Chabris, C., & Simons, D. (2010). The invisible gorilla: and other ways our intuitions deceive us:
Crown Archetype.
Chan, D. (2004). Individual Differences in Tolerance for Contradiction. Human Performance, 17(3),
297-324.
Chi, M. (2000). Self-explaining expository texts: The dual process of generating inferences and
repairing mental models. In Advances in Instructional Psychology, Volume 5: Educational Design
and Cognitive Science (pp. 161).
Chiou, G. L., & Anderson, O. R. (2010). A study of undergraduate physics students' understanding of
heat conduction based on mental model theory and an ontology–process analysis. Science
Education, 94(5), 825-854.
Chrysikou, E. G., & Weisberg, R. W. (2005). Following the wrong footsteps: Fixation effects of
pictorial examples in a design problem-solving task. Learning, Memory, 31(5), 1134-1148.
Codispoti, M., Surcinelli, P., & Baldaro, B. (2008). Watching emotional movies: Affective reactions
and gender differences. International Journal of Psychophysiology, 69(2), 90-95.
Columbia Accident Investigation Board. (2003). Report volume 1. Washington D.C.: National
Aeronautics and Space Administration.

199
Comer, R., & Gould, E. (2010). Psychology Around Us: John Wiley & Sons.
Compton, R. J., & Weissman, D. H. (2002). Hemispheric asymmetries in global-local perception:
Effects of individual differences in neuroticism. Laterality: Asymmetries of Body, Brain and
Cognition, 7(4), 333-350.
Costa, P. T., & McCrae, R. R. (1995). Primary Traits of Eysenck's P-E-N System: Three- and Five-Factor
Solutions. Journal of Personality and Social Psychology, 69(2), 308-317.
Costa, P. T., McCrae, R. R., & Psychological Assessment Resources, I. (1992). Revised neo personality
inventory (neo pi-r) and neo five-factor inventory (neo-ffi): Psychological Assessment Resources.
Cottrell, N. D., & Barton, B. K. (2011). The role of automation in reducing stress and negative affect
while driving. Theoretical Issues in Ergonomic Science.
Craig, T. Y., & Kelly, J. R. (1999). Group Cohesiveness and Creative Performance. Group Dynamics:
Theory, Research and Practice, 3(4), 243 - 256.
Crosby, M. E., Auernheimer, B., Aschwandan, C., and Ikehara, C. . (2001, November 15 - 16, 2001).
Physiological Data Feedback for Application in Distance Education. Paper presented at the
Proceedings of the 2001 Workshop on Perceptive User interfaces, Orlando, Florida.
Cross, N. (1989/2008). Engineering design methods: strategies for product design (4th ed.).
Chichester, UK: John Wiley & Sons.
Cross, N. (2001). Design cognition: Results from protocol and other empirical studies of design
activity. Design knowing and learning: Cognition in design education, 79-103.
Cuijpers, P., Smit, F., Penninx, B. W. J. H., de Graaf, R., ten Have, M., & Beekman, A. T. F. (2010).
Economic Costs of Neuroticism: A Population-Based Study. Archives of General Psychiatry, 67(10),
1086.
Curran, R., Verhagen, W. J. C., van Tooren, M. J. L., & van der Laan, T. H. (2010). A multidisciplinary
implementation methodology for knowledge based engineering: KNOMAD. Expert Systems with
Applications, 37(11), 7336-7350.
Curtis, M. T., Jentsch, F., & Wise, J. A. (2010). Aviation Displays. In E. Salas & D. Maurino (Eds.),
Human factors in aviation (2nd ed., pp. 439-478). Burlington, Mass: Academic Press.
Damasio, A. R. (1994). Descartes' Error: Emotion, Reason and the Human Brain, . New York:
Grosset/Putnam.
Damasio, A. R. (2003). Looking for Spinoza: Joy, Sorrow and the Feeling Brain. Orlando: Harcourt,
Inc.
Darlow, A. L., & Sloman, S. A. (2010). Two systems of reasoning: architecture and relation to
emotion. Wiley Interdisciplinary Reviews: Cognitive Science, 1(3), 382-392.
Darwin, C. (1872). The expression of emotion in man and animals.
Davies, M. F. (1985). Cognitive-style differences in belief persistence after evidential discrediting.
Personality and Individual Differences, 6(3), 341-346.
Davies, M. F. (1992). Field dependence and hindsight bias: Cognitive restructuring and the generation
of reasons. Journal of Research in Personality, 26(1), 58-74.
Dehais, F., Tessier, C., Christophe, L., & Reuzeau, F. (2010). The Perseveration Syndrome in the
Pilot’s Activity: Guidelines and Cognitive Countermeasures. In P. Palanque, J. Vanderdonckt & M.
200
Winckler (Eds.), Human Error, Safety and Systems Development (Vol. 5962, pp. 68-80): Springer
Berlin / Heidelberg.
Dekker, S. (2000). Human Factors in Aviation-A natural history.
Dekker, S. (2006). The field guide to understanding human error: Ashgate Pub Co.
Dekker, S. (2009). Report of the flight crew human factors invetsigation conducted for the Dutch
safety board into the accident of TK1951, Boeing 737-800 near Amsterdam Schiphol Airport,
February 25, 2009. Lund: Lund University, School of Aviation.
Dekker, S., & Hollnagel, E. (2004). Human factors and folk models. Cognition, Technology & Work,
6(2), 79-86.
Desmet, P. M. A. (2002). Designing Emotions. Delft University of Technology, Delft.
Détienne, F. (2006). Memory of past designs: distinctive roles in individual and collective design.
Arxiv preprint cs/0612016.
Dhillon, B. S. (2009). Human Reliability, Error, and Human Factors in Engineering Maintenance. Baco
Raton, FL, USA: Taylor & Francis.
Diefendorff, J. M., Hall, R. J., Lord, R. G., & Strean, M. L. (2000). Action–state orientation: Construct
validity of a revised measure and its relationship to work-related variables. Journal of Applied
Psychology, 85(2), 250.
Digman, J. M. (1990). Personality structure: Emergence of the five-factor model. Annual review of
psychology, 41(1), 417-440.
Dijksterhuis, A., & Nordgren, L. F. (2006). A theory of unconscious thought. Perspectives on
Psychological Science, 1(2), 95.
Ditto, P. H., Munro, G. D., Apanovitch, A. M., Scepansky, J. A., & Lockhart, L. K. (2003). Spontaneous
skepticism: The interplay of motivation and expectation in responses to favorable and
unfavorable medical diagnoses. Personality and Social Psychology Bulletin, 29(9), 1120.
Dolan, R. J. (2002). Emotion, cognition, and behavior. Science, 298(5596), 1191.
Dong, A., Kleinsmann, M., & Valkenburg, R. (2009). Affect-in-cognition through the language of
appraisals. Design Studies, 30(2), 138-153.
Dörner, D. (1997). The Logic Of Failure: Recognizing And Avoiding Error In Complex Situations
Dörner, D. (1999). Bauplan für eine Seele. Hamburg: Rowohlt Verlag GmbH.
Dorst, C. H. (1997). Describing Design - a Comparison of Paradigms. Delft University of Technology.
Dougherty Jr, E. M., & Fragola, J. R. (1988). Foundations for a time reliability correlation system to
quantify human reliability.
Doyle, J. K., & Ford, D. N. (1998). Mental models concepts for system dynamics research. System
dynamics review, 14(1), 3-29.
Dul, J., & Hak, T. (2008). Case study methodology in business research. Oxford: Butterworth-
Heinemann.
Duncan, S., & Barrett, L. F. (2007). Affect is a form of cognition: A neurobiological analysis. Cognition
& Emotion, 21(6), 1184-1211.
Duncker, K. (1945 / 1972). On problem-solving. Santa Barbara, California: Greenwood Press.
Egberink, I. J. L. (2010). Applications of item response theory to non-cognitive data. Rijksuniversiteit
Groningen, Groningen.
201
Ekman, P. (2007). The directed facial action task: Emotional responses without appraisal. In J. A.
Coan & J. J. B. Allen (Eds.), Handbook of emotion elicitation and assessment (pp. 47-53): Oxford
University Press.
Endsley, M. R. (1995). Toward a theory of situation awareness in dynamic systems. Human Factors:
The Journal of the Human Factors and Ergonomics Society, 37(1), 32-64.
Endsley, M. R. (2000). Theoretical underpinnings of situation awareness: A critical review. In M. R.
Endsley & D. J. Garland (Eds.), Situation awareness analysis and measurement (pp. 3-32).
Mahwah, NJ.: Lawrence Erlbaum Associates.
Endsley, M. R., & Connors, E. S. (2008). Situation awareness: State of the art. Paper presented at the
Power and Energy Society General Meeting - Conversion and Delivery of Electrical Energy in the
21st Century, , Pittsburgh, Pennsylvania.
Evans, J. S. B. T. (2003). In two minds: dual-process accounts of reasoning. Trends in Cognitive
Sciences, 7(10), 454-459.
Evans, J. S. B. T. (2008). Dual-processing accounts of reasoning, judgment, and social cognition.
Annu. Rev. Psychol., 59, 255-278.
Fischer, A. H., & Manstead, A. S. R. (2008). Social Functions of Emotion. In M. Lewis, J. M. Haviland-
Jones & L. Feldman Barrett (Eds.), Handbook of Emotions (Third ed.). New York: The Guilford
Press.
Flach, J. M., Dekker, S., & Stappers, P. J. (2008). Playing twenty questions with nature: Reflections
on quantum mechanics and cognitive systems. Theoretical Issues in Ergonomic Science, 9(2), 125-
154.
Fogarty, J., Baker, R. S., & Hudson, S. E. (2005). Case studies in the use of ROC curve analysis for
sensor-based estimates in human computer interaction.
Fothergill, S., Loft, S., & Neal, A. (2009). ATC-lab Advanced: An air traffic control simulator with
realism and control. Behavior research methods, 41(1), 118-127.
Frankish, K., & Evans, J. S. B. T. (2009). The duality of mind: an historical perspective. In J. S. B. T.
Evans & K. Frankish (Eds.), Two Minds: Dual Processes and Beyond (pp. 1-29). Oxford: Oxford
University Press.
Frederick, S. (2005). Cognitive reflection and decision making. The Journal of Economic Perspectives,
19(4), 25-42.
Fredrickson, B. L., & Cohn, M. A. (2008). Positive Emotions. In M. Lewis, J. M. Haviland-Jones & L.
Feldman Barrett (Eds.), Handbook of Emotions (Third ed., pp. 777). New York: The Guilford
Press.
Frijda, N. H. (1986). The Emotions. Cambridge, UK: Cambridge University Press.
Frijda, N. H. (2007). The Laws of Emotion. Mahwah, NJ: Lawrence Erlbaum Associates, Inc.
Frijda, N. H. (2008). The Psychologists' Point of View. In M. Lewis, J. M. Haviland-Jones & L. Feldman
Barrett (Eds.), Handbook of Emotions (Third ed.). New York: The Guilford Press.
Frijda, N. H., & Zeelenberg, M. (2001). Appraisal: What is dependent? In K. R. Scherer, A. Schorr & T.
Johnstone (Eds.), Appraisal processes in emotion: Theory, methods, research (pp. 141-155):
Oxford University Press.

202
de Fruyt, F., & Mervielde, I. (1996). Personality and interests as predictors of educational streaming
and achievement. European Journal of Personality, 10, 405-425.
Fugelsang, J. A., & Dunbar, K. N. (2005). Brain-based mechanisms underlying complex causal
thinking. Neuropsychologia, 43(8), 1204-1213.
Gemser, G., & Leenders, M. A. A. M. (2001). How integrating industrial design in the product
development process impacts on company performance. Journal of Product Innovation
Management, 18(1), 28-38.
Gentner, D., & Stevens, A. L. (1983). Mental models: Lawrence Erlbaum.
Georgio, G. A. (2006). Probability of Detection (PoD) curves: Derivation, applications and limitations:
Health and Safety Executive, UK
Goel, V., & Dolan, R. J. (2003). Explaining modulation of reasoning by belief. Cognition, 87(1), B11-
B22.
Goldstein, E. B. (2009). Sensation and perception: Wadsworth Pub Co.
Grandjean, D., & Scherer, K. R. (2008). Unpacking the Cognitive Architecture of Emotion Processes.
Emotion, 8(3), 341–335.
Greifeneder, R., & Bless, H. (2008). Depression and reliance on ease-of-retrieval experiences.
European Journal of Social Psychology, 38(2), 213-230.
Griffiths, P. E. (2007). Precision, stability and scientific progress. Social Science Information, 46(3).
Grootjen, M., Neerincx, M. A., Weert, J. C. M. v., & Truong, K. P. (2007). Measuring Cognitive Task
Load on a Naval Ship: Implications of a Real World Environment. In D. D. Schmorrow & L. M.
Reeves (Eds.), Foundations of Augmented Cognition (Vol. LNAI 4565, pp. 147–156). Berlin:
Springer.
Gross, J. J. (2008). Emotion Regulation. In M. Lewis, J. M. Haviland-Jones & L. Feldman Barrett
(Eds.), Handbook of Emotions (Third ed.). New York: The Guilford Press.
Gross, J. J., & Thompson, R. A. (2007). Emotion Regulaton: Conceptual Foundations. In J. J. Gross
(Ed.), Handbook of Emotion Regulation. New York: The Guilford Press.
Hadjichristidis, C., Sloman, S., Stevenson, R., & Over, D. (2004). Feature centrality and property
induction. Cognitive science, 28(1), 45-74.
Hahn, W. K. (2008). Shame. In Corsini Encyclopedia of Psychology: Wiley.
Hales, C., & Gooch, S. (2004). Managing Engineering Design (second edition ed.). London: Springer-
Verlag.
Hamann, S., & Canli, T. (2004). Individual differences in emotion processing. Current Opinion in
Neurobiology, 14, 233-238.
Harris, D. (2011). Human Performance on the Flight Deck. Farnham, UK: Ashgate Publishing.
Harris, P. L. (2008). Children's understanding of emotion. In M. Lewis, J. M. Haviland-Jones & L. F.
Barrett (Eds.), Handbook of emotions (pp. 320-329). New York: The Guilford Press.
Hawk, S. T., Van der Schalk, J., & Fischer, A. H. (2008). Moving faces, looking places: The Amsterdam
Dynamic Facial Expressions Set (ADFES), 12th European Conference on Facial Expressions.
Geneva, Switzerland.
Heaton, R., Chelune, G., Talley, J., Kay, G., & Curtiss, G. (1993). Wisconsin card sorting test manual:
PAR. Odessa, Florida: Psychological Assessment Resources.
203
Higgins, E. T. (2000). Social cognition: learning about what matters in the social world. European
Journal of Social Psychology, 30(1), 3-39.
Hofinger, G. (2003). Fehler und Fallen beim Entscheiden in kritischen Situationen. In S.
Strohschneider (Ed.), Entscheiden in kritischen Situationen (pp. 115-136). Frankfurt am Main:
Verlag für Polizeiwissenschaft.
Hohn, H. D. (1999). Playing, Leadership and Team Development in Innovative Teams. Delft University
of Technology.
Holland, A. S., & Roisman, G. I. (2008). Big Five personality traits and relationship quality: Self-
reported, observational, and physiological evidence. Journal of Social and Personal Relationships,
25(5), 811-829.
Hollnagel, E. (2009). The ETTO principle: efficiency-thoroughness trade-off: why things that go right
sometimes go wrong: Ashgate Pub Co.
Holroyd, C. B., & Coles, M. G. H. (2002). The Neural Basis of Human Error Processing: Reinforcement
Learning, Dopamine, and the Error-Related Negativity. Psychological Review, 109(4), 679-709.
Hrdy, S. B. (2007). Evolutionary Context of Human Development: The Cooperative Breeding Model. In
C. Salmon & T. K. Shackelford (Eds.), Family Relationships: An Evolutionary Perspective: Oxford
University Press.
Iacoboni, M. (2009). Imitation, empathy, and mirror neurons. Annual review of psychology, 60, 653-
670.
Isen, A. M. (2008). Some Ways in Which Positive Affect Influences Decision Making and Problem
Solving. In M. Lewis, J. M. Haviland-Jones & L. Feldman Barrett (Eds.), Handbook of Emotions
(Third ed., pp. 548). New York: The Guilford Press.
Izard, C. E. (1977). Human Emotions. New York: Plenum Press.
Izard, C. E. (2007). Basic emotions, natural kinds, emotion schemas, and a new paradigm.
Perspectives on Psychological Science, 2(3), 260.
Izard, C. E., Trentacosta, C. J., & King, K. A. (2005). Brain, emotions, and emotion-cognition
relations. Behavioral and Brain Sciences, 28(02), 208-209.
Jansson, D. G., & Smith, S. M. (1991). Design fixation. Design Studies, 12(1), 3-11.
Johansson, P., Hall, L., Sikström, S., Tärning, B., & Lind, A. (2006). How something can be said about
telling more than we can know: On choice blindness and introspection. Consciousness and
Cognition, 15(4), 673-692.
Johnson-Laird, P. N. (1983). Mental models: Towards a cognitive science of language, inference and
consciousness: Harvard Univ Pr.
Johnson-Laird, P. N. (2006a). How we reason: Oxford University Press, USA.
Johnson-Laird, P. N. (2006b). Mental models, sentential reasoning, and illusory inferences. Advances
in Psychology, 27-51.
Johnson-Laird, P. N. (2010). Mental models and human reasoning. Proceedings of the National
Academy of Sciences, 107(43), 18243-18250.
Johnson-Laird, P. N., & Byrne, R. M. J. (1993). Models and deductive rationality. Rationality:
Psychological and philosophical perspectives. London: Routledge.

204
Johnson-Laird, P. N., & Oatley, K. (2008). Emotions, Music and Literature. In M. Lewis, J. M.
Haviland-Jones & L. Feldman Barrett (Eds.), Handbook of Emotions (Third ed.). New York: The
Guilford Press.
Johnson, S. A., Blaha, L. M., Houpt, J. W., & Townsend, J. T. (2010). Systems factorial technology
provides new insights on global-local information processing in autism spectrum disorders.
Journal of Mathematical Psychology, 54(1), 53-72.
Jordan, S. (2010). Learning to be surprised: How to foster reflective practice in a high-reliability
context. Management Learning, 41(4), 391-413.
Justen, P., van der Pal, J., van Doorn, R. R., & Zijlstra, F. R. H. (2010). Air Traffic Control Shared
Mental Models Effects on Team Behaviour, Communication and Performance in a Game
Environment, Performance, Safety and Well-being in Aviation.
Kahneman, D. (2011). Thinking, fast and slow (1st ed.). New York: Farrar Straus & Giroux.
Kahneman, D., & Frederick, S. (2002). Representativeness revisited: Attribute substitution in intuitive
judgment. Heuristics and biases: The psychology of intuitive judgment, 49–81.
Kaiser, S., & Wehrle, T. (2001). Facial expressions as indicators of appraisal processes. In K. R.
Scherer, A. Schorr & T. Johnstone (Eds.), Appraisal processes in emotion: Theory, methods,
research (pp. 285–300): Oxford University Press.
Kellermanns, F. W., Floyd, S. W., Pearson, A. W., & Spencer, B. (2008). The contingent effect of
constructive confrontation on the relationship between shared mental models and decision
quality. Journal of Organizational Behavior, 29(1), 119-137.
Kester, L., Hultink, E. J., & Lauche, K. (2009). Portfolio decision-making genres: A case study.
Journal of Engineering and Technology Management, 26(4), 327-341.
Key Dismukes, R. (2010). Understanding and Amalyzing Human Error in Real-World Operations. In E.
Salas & D. Maurino (Eds.), Human factors in aviation (2nd ed., pp. 335-374). Burlington, Mass:
Academic Press.
Kimchi, R. (1992). Primacy of wholistic processing and global/local paradigm: A critical review.
Psychological Bulletin, 112(1), 24.
Klein, G., & Hoffman, R. R. (2008a). Macrocognition, mental models, and cognitive task analysis
methodology. In J. M. Schraagen, L. G. Militello & T. Ormerod (Eds.), Naturalistic Decision-
making and Macrocognition (pp. 57-81). Aldershot, UK: Ashgate Publishing Limited.
Kleinginna, P. R., & Kleinginna, A. M. (1981). A categorized list of emotion definitions, with
suggestions for a consensual definition. Motivation and Emotion, 5(4), 345-379.
Kleinsmann, M. (2006). Understanding Collaborative Design. Unpublished PhD dissertation, Delft
University of Technology.
Kleinsmann, M., & Dong, A. (2007). Investigating the Affective Force on Creating Shared
Understanding, ASME 2007 International Design Engineering Technical Conferences & Computers
and Information in Engineering Conference IDETC/CIE 2007. Las Vegas.
Klimoski, R., & Mohammed, S. (1994). Team mental model: construct or metaphor? Journal of
Management, 20(2), 403.
Kokkonen, M., & Pulkkinen, L. (2001). Extraversion and neuroticism as antecedents of emotion
regulation and dysregulation in adulthood. European Journal of Personality, 15(6), 407-424.
205
Kolb, D. A. (1984). Experiential learning: Experience as the source of learning and development:
Prentice-Hall Englewood Cliffs, NJ.
Kopecka, J. A., Santema, S. C., & Buijs, J. A. (2011). Designerly ways of muddling through. Journal of
Business Research, In Press, Corrected Proof.
Kozlowski, S. W. J., & Ilgen, D. R. (2006). Enhancing the Effectiveness of Work Groups and Teams.
Psychological Science in the Public Interest, 7(3), 77-124.
van Kuilenburg, H., Den Uyl, M. J., Israel, M. L., & Ivan, P. (2008, August 26-29, 2008). Advances in
face and gesture analysis. Paper presented at the Proceedings of Measuring Behavior 2008,
Maastricht, The Netherlands.
Laird, J. D., & Strout, s. (2007). Emotional behaviors as emotional stimuli. In J. A. Coan & J. J. B.
Allen (Eds.), Handbook of emotion elicitation and assessment (pp. 54-64): Oxford University
Press.
Lambie, J. A., & Marcel, A. J. (2002). Consciousness and the varieties of emotion experience: A
theoretical framework. Psychological Review, 109(2), 219-259.
Lang, P. J., Bradley, M. M., & Cuthbert, B. N. (2008). International affective picture system (IAPS):
Affective ratings of pictures and instruction manual. Gainesville, FL: University of Florida.
de Lange, M. A., & van Knippenberg, A. (2009). To err is human: How regulatory focus and action
orientation predict performance following errors. Journal of Experimental Social Psychology,
45(6), 1192-1199.
Larsen, J. T., Berntson, G. G., Poehlmann, K. M., Ito, T. A., & Cacioppo, J. T. (2008). The
Psychophysiology of Emotion. In M. Lewis, J. M. Haviland-Jones & L. Feldman Barrett (Eds.),
Handbook of Emotions (Third ed.). New York: The Guilford Press.
Larsen, R. J., & Buss, D. M. (2008). Personality Psychology: Domains of Knowledge about Human
Nature (Third edition ed.). New York: McGraw-Hill.
Lauche, K. (2005). Job design for good design practice. Design Studies, 26(2), 191-213.
Lauche, K. (2007). Empirical research on information and knowledge management in designing: where
are we and where do we go from here? Journal of Design Research, 6(3), 295-310.
Lauche, K., Bohemia, E., Connor, C., & Badke-Schaub, P. (2008). Distributed collaboration in design
education: practising designer and client roles. Journal of Design Research, 7(3), 238-258.
Lawson, B. (2006). How Designers Think. The Design Process Demystified (4th ed.). Oxford:
Architectural Press / Elsevier.
Lazarus, R. S. (2001). Relational Meaning and Discrete Emotions. In K. R. Scherer, A. Schorr & T.
Johnstone (Eds.), Appraisal processes in emotion: Theory, methods, research (pp. 37-67): Oxford
University Press.
Lee, J., & Boling, E. (2008). Information conveying approaches and cognitive styles of mental
modeling in a hypermedia based learning environment. Journal of the American Society for
Information Science and Technology, 59(4), 644-661.
Lemerise, E. A., & Dodge, K. A. (2008). The Development of Anger and Hostile Interactions. In M.
Lewis, J. M. Haviland-Jones & L. F. Barrett (Eds.), Handbook of Emotions (Third Edition ed.). New
York: The Guilford Press.
206
Leveson, N. (2004). A New Accident Model for Engineering Safer Systems. Safety Science, 42(4), 237-
270.
Lewicki, P., Hill, T., & Czyzewska, M. (1992). Nonconscious acquisition of information. American
Psychologist, 47(6), 796-801.
Lewis, M. D. (2005). Bridging emotion theory and neurobiology through dynamic systems modeling.
Behavioral and Brain Sciences, 28, 169 - 245.
Lewis, M. D. (2008a). Self-conscious emotions: embarrassment, prode, shame and guilt. In M. Lewis,
J. M. Haviland-Jones & L. Feldman Barrett (Eds.), Handbook of Emotions (Third ed., pp. 742).
New York: The Guilford Press.
Lewis, M. D. (2008b). The Emergence of Human Emotions. In M. Lewis, J. M. Haviland-Jones & L.
Feldman Barrett (Eds.), Handbook of Emotions (Third ed., pp. 304). New York: The Guilford
Press.
Lewis, M. D., Alessandri, S. M., & Sullivan, M. W. (1992). Differences in Shame and Pride as a
Function of Children's Gender and Task Difficulty. Child Development, 63(3), 630-638.
Lewis, M. D., Haviland-Jones, J. M., & Barrett, L. F. (2008). Handbook of emotions: The Guilford
Press.
Loewenstein, G. (2007). Defining affect. Social Science Information, 46(3).
Ludden, G. D. S., Schifferstein, H. N. J., & Hekkert, P. (2009). Visual-tactual incongruities in products
as sources of surprise. Empirical Studies of the Arts, 27(1), 61-87.
Macmillan, N. A., & Creelman, C. D. (2005). Detection theory: a user's guide: Lawrence Erlbaum
Associates.
Mandler, G. (1984). Mind and body: Psychology of emotion and stress. New York: WW Norton
Manstead, A. S. R., & Fischer, A. H. (2001). Social Appraisal: The Social World as Object of and
Influence on Appraisal Processes. In K. R. Scherer, A. Schorr & T. Johnstone (Eds.), Appraisal
processes in emotion: Theory, methods, research (pp. 221-232): Oxford University Press.
Marshall, N. (2007). Team mental models in action: a practice-based perspective. CoDesign, 3(1), 29-
36.
Martens, M. H. (2007). The failure to act upon important information: where do things go wrong? ,
Vrije Universiteit, Amsterdam.
Masten, A. S. (2009). Ordinary Magic: Lessons from Research on Resilience in Human Development.
Education Canada, 49(3), 5.
Mathews, A., Mackintosh, B., & Fulcher, E. P. (1997). Cognitive biases in anxiety and attention to
threat. Trends in Cognitive Sciences, 1(9), 340-345.
Matsumoto, D., Keltner, D., Shiota, M. N., O’Sullivan, M., & Frank, M. (2008). Facial expressions of
emotion. In M. Lewis, J. M. Haviland-Jones & L. Feldman Barrett (Eds.), Handbook of emotions
(3rd ed., pp. 211–234). New York: The Guilford Press.
Matthews, G., Davies, D. R., Westerman, S. J., & Stammers, R. B. (2000). Human Performance -
Cognition, Stress and Individual Differences. Philadelphia: Taylor & Francis.
Mauss, I. B., & Robinson, M. D. (2009). Measures of emotion: A review. Cognition & Emotion, 23(2),
209 - 237.
207
McCrae, R. R., & Costa, P. T. (1987). Validation of the five-factor model of personality across
instruments and observers. Journal of Personality and Social Psychology, 52(1), 81-90.
McCrae, R. R., & John, O. P. (1992). An introduction to the five-factor model and its applications.
Journal of personality, 60(2), 175-215.
McDonnell, J., & Lloyd, P. (2009). About: Designing - Analysing Design Meetings. Leiden, the
Netherlands: CRC Press/Balkema.
Meij, G. (2004). Sticking to plans: capacity limitation or decision-making bias?
Miller, G. A. (1956). The magical number seven, plus or minus two: Some limits on our capacity for
processing information. Psychological Review, 63, 81-97.
Mitroff, S. R., Simons, D. J., & Levin, D. T. (2004). Nothing compares 2 views: Change blindness can
occur despite preserved access to the changed information. Perception & Psychophysics, 66(8),
1268.
Mohammed, S., Ferzandi, L., & Hamilton, K. (2010). Metaphor no more: A 15-year review of the team
mental model construct. Journal of Management, 36(4), 876.
Molen, H. T. v. d., Schmidt, H. G., & Kruisman, G. (2007). Personality characteristics of engineers.
European Journal of Engineering Education, 32(5), 495-501.
Moray, N. (1997). Models of models of... mental models. Perspectives on the Human Controller:
Essays in Honor of Henk G. Stassen, Erlbaum, Mahwah, NJ, 271-285.
Mosier, K. L. (2010). The Human in Flight: Form Kinesthetic Sense to Cognitive Sensibility. In E. Salas
& D. Maurino (Eds.), Human factors in aviation (2nd ed., pp. 147-173). Burlington, Mass:
Academic Press.
Mouloua, M., Hancock, P. A., Jones, L., & Vincenzi, D. (2010). Automation in Aviation Systems: Issues
and Considerations. In J. A. Wise, V. D. Hopkin & D. J. Garland (Eds.), Handbook of aviation
human factors (2nd ed.). Boca Raton: CRC.
Navon, D. (1977). Forest before trees: The precedence of global features in visual perception* 1.
Cognitive psychology, 9(3), 353-383.
Neisser, U. (1976). Cognition and reality: principles and implications of cognitive psychology: W. H.
Freeman.
Neisser, U. (1978). Perceiving, anticipating and imagining. Minnesota Studies in the Philosophy of
Science (9), 89-106.
Nelson, P. S. (2008). A STAMP ANALYSIS OF THE LEX COMAIR 5191 ACCIDENT. Lund University,
Sweden.
Nettle, D. (2004). Evolutionary origins of depression: a review and reformulation. Journal of affective
disorders, 81(2), 91-102.
Nettle, D. (2006). The Evolution of Personality Variation in Humans and Other Animals. American
Psychologist, 61(6), 622-631.
Neumann, A., Badke-Schaub, P., & Lauche, K. (2006). Measuring shared mental models in design
teams. Paper presented at the Design2006, Dubrovnik.
Neumann, A., Badke-Schaub, P., & Lauche, K. (2008). Team Cohesion and Process Aspects of
Teamwork in Design. Paper presented at the Design2008, Dubrovnik.
208
Newell, A., & Rosenbloom, P. S. (1981). Mechanisms of skill acquisition and the law of practice. In J.
R. Anderson (Ed.), Cognitive skills and their acquisition (pp. 1-55). Hillsdale, New Jersey:
Lawrence Erlbaum Associates.
Newell, A., & Simon, H. A. (1972). Human problem solving: Prentice-Hall Englewood Cliffs, NJ.
de Neys, W., & Franssens, S. (2009). Belief inhibition during thinking: Not always winning but at least
taking part. Cognition, 113(1), 45-61.
de Neys, W., Vartanian, O., & Goel, V. (2008). Smarter than we think: when our brains detect that
we are biased. Psychological Science.
Niedenthal, P. M. (2008). Emotion Concepts. In M. Lewis, J. M. Haviland-Jones & L. Feldman Barrett
(Eds.), Handbook of emotions (pp. 587-600). New York: The Guilford Press.
Niedenthal, P. M., Barsalou, L. W., Ric, F., & Krauth-Gruber, S. (2005). Embodiment in the
acquisition and use of emotion knowledge. Emotion and consciousness, 21–50.
NN. (2011). Loss of oil during departure. Amsterdam: Airline incident investigation team.
Nokes, T. J., Schunn, C. D., & Chi, M. T. H. (2010). Problem Solving and Human Expertise. In P.
Peterson, E. L. Baker & B. McGaw (Eds.), International encyclopedia of education. Oxford:
Elsevier.
Norman, D. A. (1983). Some Observations on MentaI ModeIs. In D. Gentner & A. L. Stevens (Eds.),
Mental models (pp. 7). New Jersey: Lawrence Erlbaum Associates.
Nowaczyk, R. H., Perlow, R., Palazzo, M.A. . (1996, Sept. 4-6, 1996). An examination of personality
traits and engineering/science student team performance. Paper presented at the 6th AIAA,
NASA, and ISSMO Symposium on Multidisciplinary Analysis and Optimization, Bellevue, WA.
O'Doherty, J. P., Dayan, P., Friston, K., Critchley, H., & Dolan, R. J. (2003). Temporal difference
models and reward-related learning in the human brain. Neuron, 38(2), 329-337.
Oatley, K. (2007). On the definition and function of emotions. Social Science Information, 46(3).
Oatley, K., & Johnson-Laird, P. N. (1996). The communicative theory of emotions: Empirical tests,
mental models, and implications for social interaction. In L. L. Martin & A. Tesser (Eds.), Striving
and feeling: interactions among goals, affect, and self-regulation: Routledge.
Oorschot, v., K. (2001). Analyzing Radical NPD Projects from an Operational Control Perspective.
Unpublished PhD dissertation, Technische Universiteit Eindhoven.
Ortony, A., Clore, G. L., & Collins, A. (1988). The cognitive structure of emotions: Cambridge
University Press, Cambridge, UK.
OVV. (2010). Neergestort tijdens nadering, Boeing 737-800, nabij Amsterdam Schiphol Airport, 25
februari 2009. Den Haag: Onderzoeksraad voor Veiligheid.
OVV. (2011). Start vanaf taxibaan, Amsterdam Airport Schiphol, 10 februari 2010. Den Haag:
Onderzoeksraad voor Veiligheid.
Panksepp, J. (2005). Emotional dynamics of the organism and its parts. Behavioral and Brain
Sciences, 28(02), 212-213.
Panksepp, J. (2008). The Affective Brain and Core Consciousness. In M. Lewis, J. M. Haviland-Jones &
L. Feldman Barrett (Eds.), Handbook of Emotions (Third ed.). New York: The Guilford Press.
209
Pecchinenda, A. (2001). The Psychophysiology of Appraisals. In K. R. Scherer, A. Schorr & T.
Johnstone (Eds.), Appraisal processes in emotion: Theory, methods, research (pp. 301-318):
Oxford University Press.
Penley, J. A., & Tomaka, J. (2002). Associations among the Big Five, emotional responses, and coping
with acute stress. Personality and Individual Differences, 32(7), 1215-1228.
Perlovsky, L. I. (2006). Toward physics of the mind: Concepts, emotions, consciousness, and symbols.
Physics of Life Reviews, 3(1), 23-55.
Pessoa, L., Japee, S., Sturman, D., & Ungerleider, L. G. (2006). Target Visibility and Visual Awareness
Modulate Amygdala Responses to Fearful Faces. Cerebral cortex, 16(3), 366-375.
PiCompany. (2006). Reflector Big Five Personality - Personal Example Report. Utrecht, the
Netherlands.
PiCompany. (2007). Reflector Big Five Personality - Background to the Instrument. Utrecht, the
Netherlands.
Plutchik, R. (2001). The nature of emotions. American Scientist, 89, 344.
Power, M. J., & Dalgleish, T. (2007). Cognition and emotion: From order to disorder: Psychology Pr.
Proctor, R. W., & Van Zandt, T. (2008). Human factors in simple and complex systems (2nd ed.). Boca
Raton, Fl.: CRC Press.
Ramalingam, V., LaBelle, D., & Wiedenbeck, S. (2004). Self-efficacy and mental models in learning
to program.
Rameson, L. T., Morelli, S. A., & Lieberman, M. D. (2011). The Neural Correlates of Empathy:
Experience, Automaticity, and Prosocial Behavior. Journal of Cognitive Neuroscience(Early
Access), 1-11.
Rasmussen, J. (1979). On the Structure of Knowledge - a Morphology of Mental Models in a Man-
Machine System Context (No. RIS0-M-2192). Roskilde, Denmark: Riso National Laboratory.
Rasmussen, J. (1983). Skills, rules, and knowledge; signals, signs, and symbols, and other distinctions
in human performance models. IEEE TRANS. SYS. MAN CYBER., 13(3), 257-266.
Rasmussen, J., & Vicente, K. J. (1989). Coping with human errors through system design: implications
for ecological interface design. International Journal of Man-Machine Studies, 31(5), 517-534.
Ravesteijn, W., Graaff, E. d., & Kroesen, O. (2006). Engineering the future: the social necessity of
communicative engineers. European Journal of Engineering Education, 31(1), 63-71.
Reason, J. (1990). Human error. Cambridge, UK: Cambridge University Press.
Rensink, R. A. (2002). Change detection. Annual review of psychology, 245-278.
Rick, S., & Loewenstein, G. (2008). The Role of Emotion in Economic Behavior. In M. Lewis, J. M.
Haviland-Jones & L. Feldman Barrett (Eds.), Handbook of Emotions (Third ed., pp. 138). New
York: The Guilford Press.
Roberts, N. A., Tsai, J. L., & Coan, J. A. (2007). Emotion Elicitation Using Dyadic Interaction Tasks. In
J. A. Coan & J. J. B. Allen (Eds.), Handbook of emotion elicitation and assessment (pp. 106-123):
Oxford University Press.
Rogers, W. P., Armstrong, N. A., Acheson, D. C., Covert, E. E., Feynman, R. P., Hotz, R. B., et al.
(1986). Report to the President on the Space Shuttle Challenger Accident.

210
Rolls, E. T. (2007). Emotion Elicited by Primary Reinforcers and Following Stimulus-Reinforcement
Association Learning. In J. A. Coan & J. J. B. Allen (Eds.), Handbook of emotion elicitation and
assessment (pp. 137-157): Oxford University Press.
Roozenburg, N. F. M., & Eekels, J. (2003). Productontwerpen, structuur en methoden (2nd ed.).
Utrecht: Uitgeverij LEMMA.
Roseman, I. J., & Smith, C. A. (2001). Appraisal Theory: Overview, Assumptions, Varieties,
Controversies. In K. R. Scherer, A. Schorr & T. Johnstone (Eds.), Appraisal processes in emotion:
Theory, methods, research (pp. 3-19): Oxford University Press.
Rothstein, M. G., & Goffin, R. D. (2006). The use of personality measures in personnel selection: what
does current research support? Human Resource Management Review, 16(2), 155-180.
Rouse, W. B., & Morris, N. M. (1986). On Looking Into the Black Box: Prospects and Limits in the
Search for Mental Models. Psychological Bulletin, 100(3), 349-363.
Rutherford, A., & Wilson, J. R. (1991). Models of mental models: an ergonomist-psychologist
dialogue. In M. J. Tauber & D. Ackerman (Eds.), Mental Models and Human-Computer Interaction
2 (pp. 39-58). Amsterdam: North-Holland Publishing Co.
Sabatinelli, D., Bradley, M. M., Fitzsimmons, J. R., & Lang, P. J. (2005). Parallel amygdala and
inferotemporal activation reflect emotional intensity and fear relevance. Neuroimage, 24(4),
1265-1270.
Sander, D., & Scherer, K. R. (2005). Amalgams and the power of analytical chemistry: Affective
science needs to decompose the appraisal-emotion interaction. Behavioral and Brain Sciences,
28(02), 216-217.
Saunders-Smits, G. (2008). Study of Delft Aerospace Alumni. Delft University of Technology, Delft.
Schaub, H. (2008). Wahrnemung, Aufmerksamkeit und "Situation Awareness" (SA). In P. Badke-Schaub,
G. Hofinger & K. Lauche (Eds.), Human Factors: Psychologie sicheren Handelns in Risikobranchen
(pp. 59-76). Heidelberg: Springer Medizin Verlag.
Scherer, K. R. (2001). Appraisal considered as a process of multilevel sequential checking. In K. R.
Scherer, A. Schorr & T. Johnstone (Eds.), Appraisal processes in emotion: Theory, methods,
research (pp. 92-120): Oxford University Press.
Scherer, K. R. (2005). What are emotions? And how can they be measured. Social Science
Information, 44(4), 695-729.
Scherer, K. R., & Ekman, P. (1984). Approaches to emotion: L. Erlbaum Associates.
Scherer, K. R., Wranik, T., Sangsue, J., Tran, V., & Scherer, U. (2004). Emotions in everyday life:
probability of occurrence, risk factors, appraisal and reaction patterns. Social Science
Information, 43(4), 499.
Schiano, D. J., Ehrlich, S. M., & Sheridan, K. (2004). Categorical imperative NOT: facial affect is
perceived continuously.
Schön, D. A. (1983). The reflective practitioner. New York: Basic Books.
Schön, D. A. (1987). Educating the Reflective Practitioner. San Francisco / Oxford: Jossey-Bass Inc.
Schön, D. A. (1992). Designing as reflective conversation with the materials of a design situation.
Knowledge-Based Systems, 5(1), 3-14.
211
Schönberg, T., Daw, N. D., Joel, D., & O'Doherty, J. P. (2007). Reinforcement learning signals in the
human striatum distinguish learners from nonlearners during reward-based decision making. The
Journal of Neuroscience, 27(47), 12860-12867.
Schraagen, J. M. (2009). Macht en onmacht der gewoonte (The power and weakness of habits).
Enschede: Universiteit Twente.
Shiota, M. N., Keltner, D., & John, O. P. (2006). Positive emotion dispositions differentially
associated with Big Five personality and attachment style. The Journal of Positive Psychology,
1(2), 61-71.
Simon, H. A. (1969). The science of the artificial. Cambridge, USA, MA: M.I.T. Press.
Simon, H. A. (1973). The structure of ill structured problems. Artificial intelligence, 4(3-4), 181-201.
Simons, D. J., & Chabris, C. F. (1999). Gorillas in our midst: Sustained inattentional blindness for
dynamic events. PERCEPTION-LONDON-, 28, 1059-1074.
Simons, D. J., Hannula, D. E., Warren, D. E., & Day, S. W. (2007). Behavioral, neuroimaging, and
neuropsychological approaches to implicit perception. The Cambridge handbook of consciousness.
Smid, N. (2010). Personality. In M. Born, C. D. Foxcroft & R. Butter (Eds.), Online Readings in Testing
and Assessment: International Test Commission.
Smith, C. A., & Kirby, L. D. (2001). Toward Delivering on the Promise of Appraisal Theory. In K. R.
Scherer, A. Schorr & T. Johnstone (Eds.), Appraisal processes in emotion: Theory, methods,
research (pp. 121-140): Oxford University Press.
Smulders, F. E. (2007). Team mental models in innovation: means and ends. CoDesign, 3(1), 51-58.
Smulders, F. E. H. M. (2006). Get Synchronized! Bridging the Gap between Design and Volume
Production. Delft University of Technology.
Soldz, S., & Vaillant, G. E. (1999). The Big Five Personality Traits and the Life Course: A 45-Year
Longitudinal Study. Journal of Research in Personality, 33, 208-232.
Sonnemans, J., & Frijda, N. H. (1994). The structure of subjective emotional intensity. Cognition &
Emotion, 8(4), 329-350.
Stanovich, K. E., & West, R. F. (2000). Individual differences in reasoning: Implications for the
rationality debate? Behavioral and Brain Sciences, 23(05), 645-665.
van Staveren, A. (2007). Zonder wrijving geen glans: leren samenwerken bij veranderen en
innoveren: Van Gorcum.
Stempfle, J., & Badke-Schaub, P. (2002). Thinking in design teams - an analysis of team
communication. Design Studies, 23(5), 473-496.
Steunebrink, B. R. (2010). The Logical Structure of Emotions. Universiteit Utrecht, Utrecht.
Straatemeier, M., van der Maas, H. L. J., & Jansen, B. R. J. (2008). Children's knowledge of the
earth: A new methodological and statistical approach. Journal of experimental child psychology,
100(4), 276-296.
Stroeve, S., Everdij, M., Blom, H., & Days, S. I. (2011). Studying hazards for resilience modelling in
ATM. In D. Schaefer (Ed.), Proceedings of the SESAR Innovation Days. Toulouse, France:
Eurocontrol.
Sutton, R. S., & Barto, A. G. (1998). Reinforcement learning: MIT Press.

212
Suwa, M., Gero, J., & Purcell, T. (2000). Unexpected discoveries and S-invention of design
requirements: important vehicles for a design process. Design Studies, 21(6), 539-567.
Tanaka, K., & Yamaoka, T. (2010). UNDERSTANDING CHARACTERISTICS OF THE TRANSFER OF MENTAL
MODELS IN THE USE OF ELECTRICAL DEVICES. Psychologia, 53(4), 256-266.
Taylor, M. M., & Creelman, C. D. (1967). PEST: Efficient estimates on probability functions. The
Journal of the Acoustical Society of America, 41, 782.
Thurstone, L. L., & Thurstone, T. G. (1941). Factorial studies of intelligence. Psychometr. Monogr.,
2(94).
Tooby, J., & Cosmides, L. (2008). The Evolutionary Psychology of the Emotions and their Relationship
to Internal Regulatory Variables. In M. Lewis, J. M. Haviland-Jones & L. Feldman Barrett (Eds.),
Handbook of Emotions (Third ed.). New York: The Guilford Press.
Tuckman, B. W., & Jensen, M. A. C. (1977). Stages of Small-Group Development Revisited. Group
Organization Management, 2(4), 419-427.
Turner, J. H. (2000). On the Origins of Human Emotions: A Sociological Inquiry into the Evolution of
Human Affect. Stanford, Caifornia: Stanford University Press.
Valkenburg, A. C. (2000). The Reflective Practice in product design teams. Delft University of
Technology.
Vandierendonck, A., Dierckx, V., & Van der Beken, H. (2006). Interaction of knowledge and working
memory in reasoning about relations. Advances in Psychology, 53-84.
Vidulich, M. A., Wickens, C. D., Tsang, P. S., & Flach, J. M. (2010). Infromation Porcessing in
Aviation. In E. Salas & D. Maurino (Eds.), Human factors in aviation (2nd ed., pp. 175).
Burlington, Mass: Academic Press.
Visser, W. (2006). The cognitive artifacts of designing. Mahwah, NJ: Lawrence Erlbaum Associates.
Visser, W. (2009). Design: One, but in different forms. Design Studies, 30(3), 187-223.
Wagner, U., Gais, S., Haider, H., Verleger, R., & Born, J. (2004). Sleep inspires insight. Nature,
427(6972), 352-355.
Walkowiak, A. L. T., Lang, J. W. B., & Zijlstra, F. R. H. (2010). Cognitive flexibility in Air Traffic
Control systems: A theoretical overview., 29th conference of the European Association for
Aviation Psychology. Budapest, Hungary.
Weippert, M., Kumar, M., Kreuzfeld, S., Arndt, D., Rieger, A., & Stoll, R. (2010). Comparison of three
mobile devices for measuring R–R intervals and heart rate variability: Polar S810i, Suunto t6 and
an ambulatory ECG system. European journal of applied physiology, 109(4), 779-786.
Westerink, J., Ouwerkerk, M., de Vries, G. J., de Waele, S., van den Eerenbeemd, J., & van Boven,
M. (2009). Emotion measurement platform for daily life situations.
Wheelwright, S., Baron-Cohen, S., Goldenfeld, N., Delaney, J., Fine, D., Smith, R., et al. (2006).
Predicting autism spectrum quotient (AQ) from the systemizing quotient-revised (SQ-R) and
empathy quotient (EQ). Brain research, 1079(1), 47-56.
Wickelgren, M. (2005). Engineering Emotion. Göteborg University.
Wickens, A. (2009). Introduction to Biopsychology: Prentice Hall.
Wickens, C. D. (1992). Engineering psychology and human performance (2nd ed.). New York:
HarperCollins Publishers Inc.
213
Wickens, C. D. (2008). Situation Awareness: Review of Mica Endsley's 1995 articles on Situation
Awareness theory and measurement. Human Factors: The Journal of the Human Factors and
Ergonomics Society, 50(3), 397.
Wickens, C. D. (2009). ISAP Keynote THE PSYCHOLOGY OF AVIATION SURPRISE: AN 8 YEAR UPDATE
REGARDING THE NOTICING OF BLACK SWANS.
Wickens, C. D., & Hollands, J. G. (2000). Engineering psychology and human performance (3rd ed.).
New York: Prentice Hall.
Wiens, S., & Öhman, A. (2007). Probing Unconscious Emotional Processes: On Becoming a Successful
Masketeer. In J. A. Coan & J. J. B. Allen (Eds.), Handbook of emotion elicitation and assessment
(pp. 65-90): Oxford University Press.
Wilson, J. R., & Rutherford, A. (1989). Mental models: Theory and application in human factors.
Human Factors: The Journal of the Human Factors and Ergonomics Society, 31(6), 617-634.
Witkin, H. A., & Goodenough, D. R. (1977). Field dependence and interpersonal behavior.
Psychological Bulletin, 84(4), 661-689.
Witkin, H. A., & Goodenough, D. R. (1981). cognitive styles: essence and origins: field dependence
and field independence (Vol. XII). New York: International Universities Press.
Wong, K. F. E., Yik, M., & Kwong, J. Y. Y. (2006). Understanding the emotional aspects of escalation
of commitment: The role of negative affect. Journal of Applied Psychology, 91(2), 282.
Woods, D. D., Dekker, S., Johannesen, L. J., Cook, R. I., & Sarter, N. (2010). Behind human error
(2nd ed.): Ashgate.
Woolley, A. W., Chabris, C. F., Pentland, A., Hashmi, N., & Malone, T. W. (2010). Evidence for a
collective intelligence factor in the performance of human groups. Science, 330(6004), 686.
Zhang, L. (2004). Field-dependence/independence: cognitive style or perceptual ability?--validating
against thinking styles and academic achievement. Personality and Individual Differences, 37(6),
1295-1311.
Zhang, Y. (2008). Undergraduate students' mental models of the Web as an information retrieval
system. Journal of the American Society for Information Science and Technology, 59(13), 2087-
2098.

214
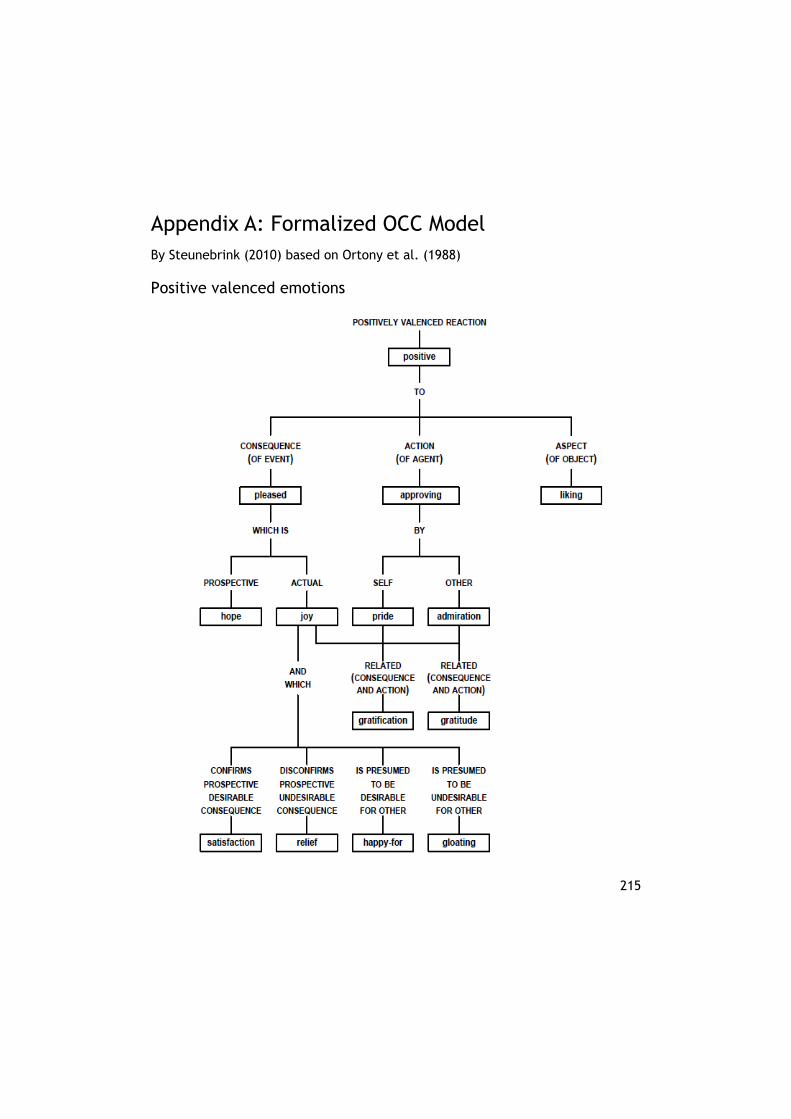
215
Appendix A: Formalized OCC Model By Steunebrink (2010) based on Ortony et al. (1988)
Positive valenced emotions
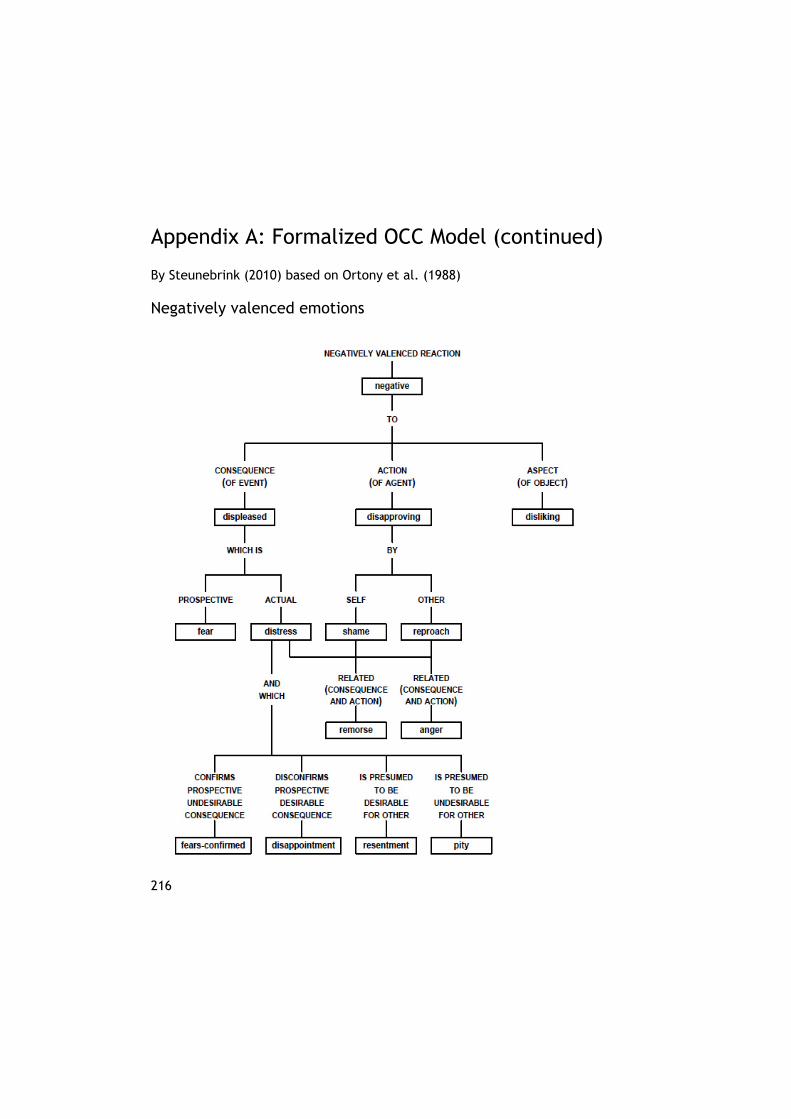
216
Appendix A: Formalized OCC Model (continued)
By Steunebrink (2010) based on Ortony et al. (1988)
Negatively valenced emotions
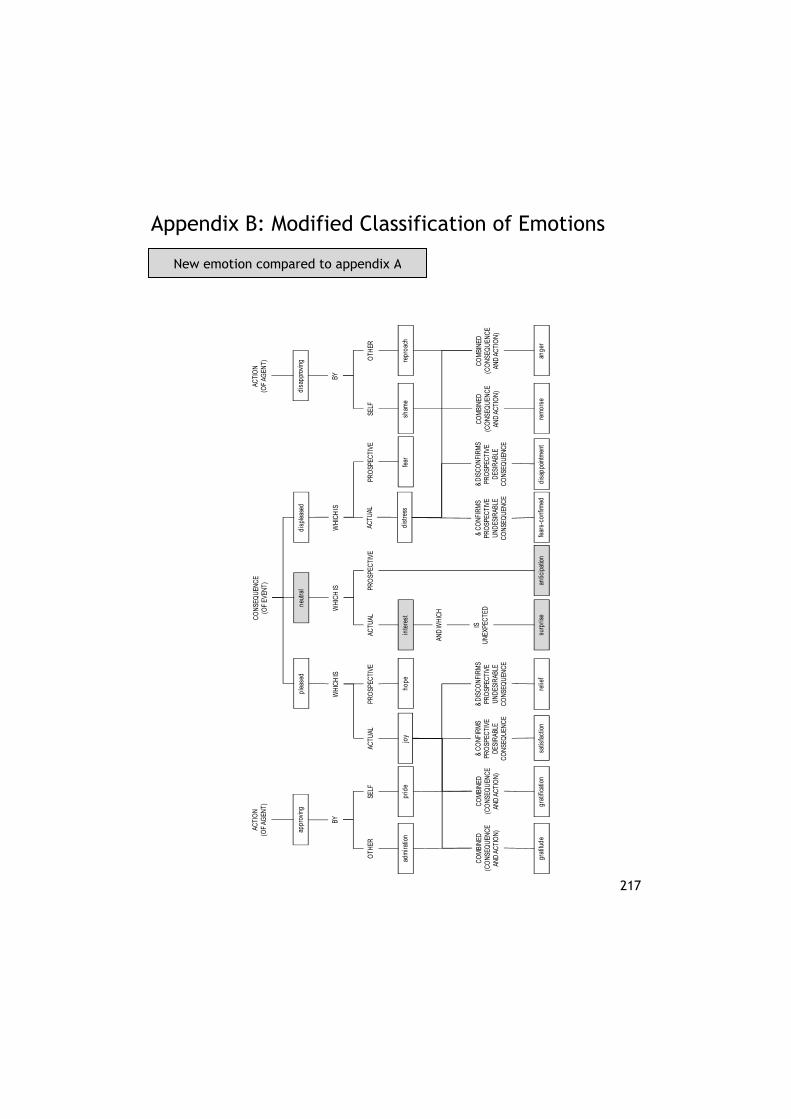
217
Appendix B: Modified Classification of Emotions
New emotion compared to appendix A
CO
MBI
NED
(CO
NSE
QU
ENC
E AN
D A
CTI
ON
)
plea
sed
ACTU
ALPR
OSP
ECTI
VE
hope
joy
WH
ICH
IS
ACTI
ON
(O
F AG
ENT)
appr
ovin
g
SELF
prid
e
BY
CO
MBI
NED
(CO
NSE
QU
ENC
E AN
D A
CTI
ON
)
grat
ifica
tion
CO
NSE
QU
ENC
E (O
F EV
ENT)
disp
leas
ed
PRO
SPEC
TIVE
ACTU
AL
dist
ress
fear
WH
ICH
IS
ACTI
ON
(O
F AG
ENT)
disa
ppro
ving
SELF
sham
e
BY
rem
orse
neut
ral
surp
rise
AND
WH
ICH
IS
UN
EXPE
CTE
D
PRO
SPEC
TIVE
ACTU
AL
inte
rest
antic
ipat
ion
WH
ICH
IS
OTH
ER
adm
iratio
n
CO
MBI
NED
(CO
NSE
QU
ENC
E AN
D A
CTI
ON
)
grat
itude
CO
MBI
NED
(CO
NSE
QU
ENC
E AN
D A
CTI
ON
)
OTH
ER
repr
oach
ange
r
& C
ON
FIR
MS
PRO
SPEC
TIVE
D
ESIR
ABLE
C
ON
SEQ
UEN
CE
& D
ISC
ON
FIR
MS
PRO
SPEC
TIVE
U
ND
ESIR
ABLE
C
ON
SEQ
UEN
CE
satis
fact
ion
relie
f
& C
ON
FIR
MS
PRO
SPEC
TIVE
U
ND
ESIR
ABLE
C
ON
SEQ
UEN
CE
& D
ISC
ON
FIR
MS
PRO
SPEC
TIVE
D
ESIR
ABLE
C
ON
SEQ
UEN
CE
fear
s-co
nfirm
eddi
sapp
oint
men
t

218
Appendix C: Amsterdam Dynamic Facial Expression Set
Still photographs from the Amsterdam Dynamic Facial Expression Set. The photographs were produced by freezing the film at the apex (point of most intense muscular contraction) of the model’s expression. Emotions shown are: anger (top left), embarrassment (top right), sadness (bottom left), and surprise (bottom right). Reproduced from Hawk et al. (2008) with kind permission.
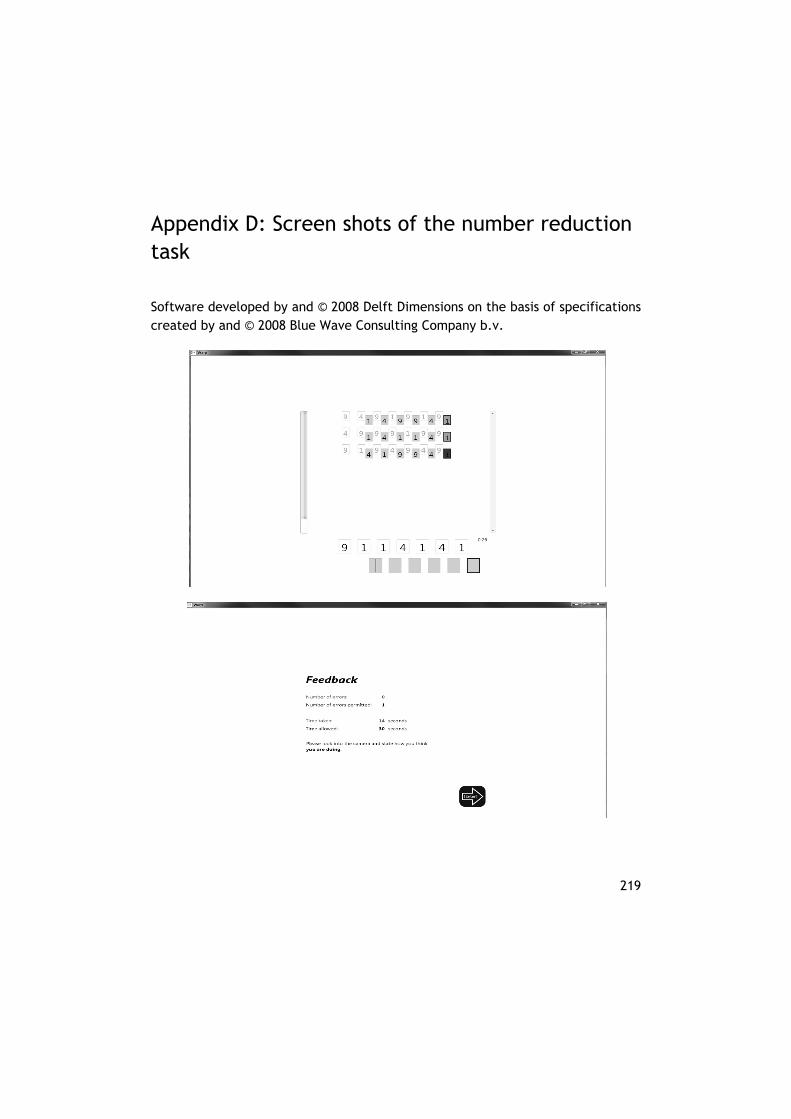
219
Appendix D: Screen shots of the number reduction task
Software developed by and © 2008 Delft Dimensions on the basis of specifications created by and © 2008 Blue Wave Consulting Company b.v.
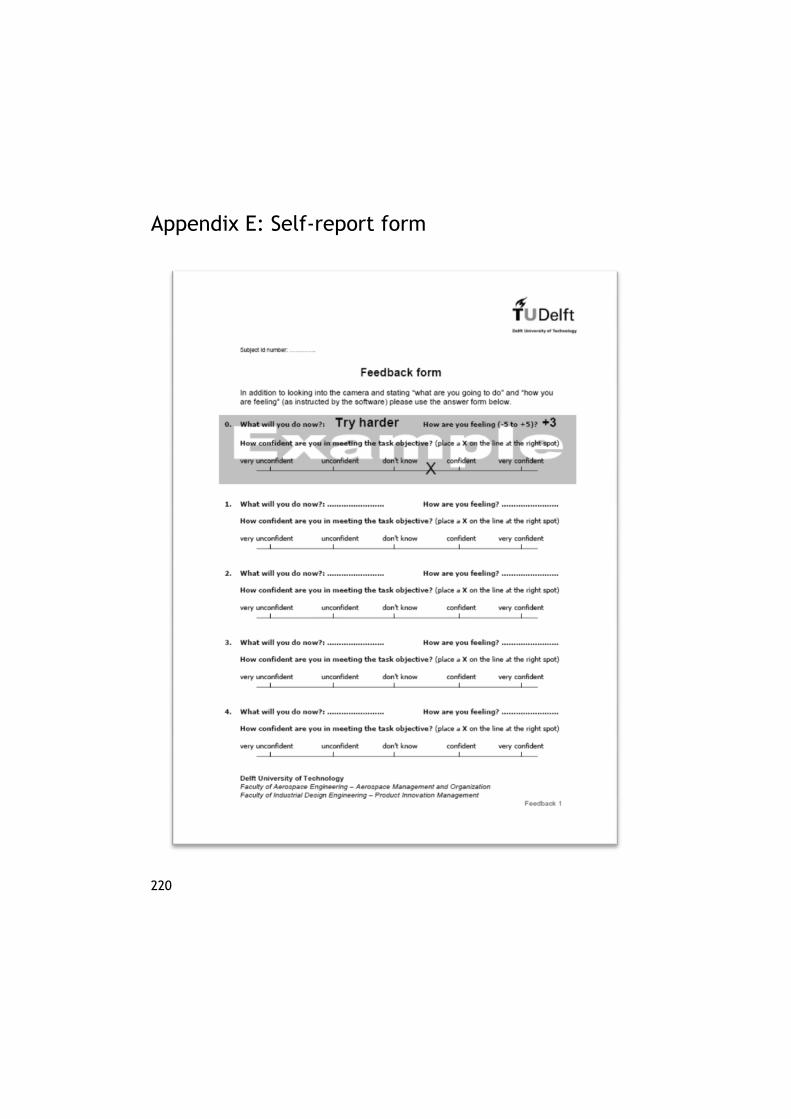
220
Appendix E: Self-report form
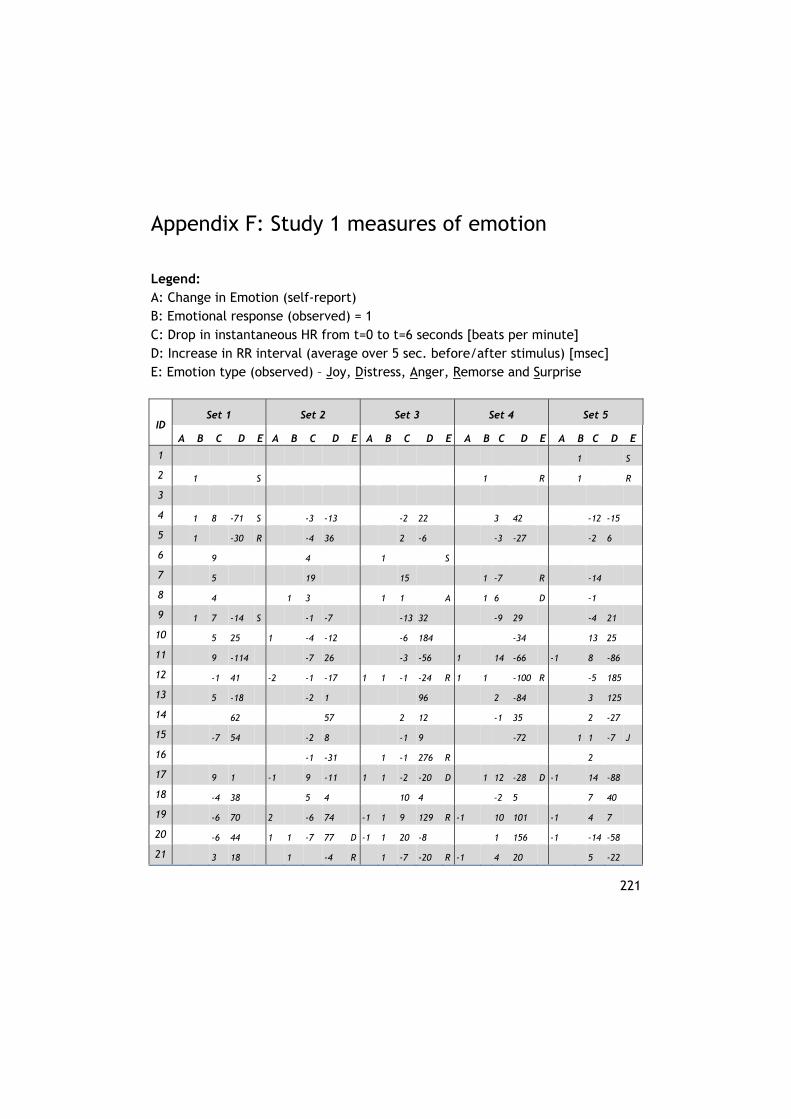
221
Appendix F: Study 1 measures of emotion
Legend: A: Change in Emotion (self-report) B: Emotional response (observed) = 1 C: Drop in instantaneous HR from t=0 to t=6 seconds [beats per minute] D: Increase in RR interval (average over 5 sec. before/after stimulus) [msec] E: Emotion type (observed) – Joy, Distress, Anger, Remorse and Surprise
ID Set 1 Set 2 Set 3 Set 4 Set 5
A B C D E A B C D E A B C D E A B C D E A B C D E
1 1 S
2 1 S 1 R 1 R
3
4 1 8 -71 S -3 -13 -2 22 3 42 -12 -15
5 1 -30 R -4 36 2 -6 -3 -27 -2 6
6 9 4 1 S
7 5 19 15 1 -7 R -14
8 4 1 3 1 1 A 1 6 D -1
9 1 7 -14 S -1 -7 -13 32 -9 29 -4 21
10 5 25 1 -4 -12 -6 184 -34 13 25
11 9 -114 -7 26 -3 -56 1 14 -66 -1 8 -86
12 -1 41 -2 -1 -17 1 1 -1 -24 R 1 1 -100 R -5 185
13 5 -18 -2 1 96 2 -84 3 125
14 62 57 2 12 -1 35 2 -27
15 -7 54 -2 8 -1 9 -72 1 1 -7 J
16 -1 -31 1 -1 276 R 2
17 9 1 -1 9 -11 1 1 -2 -20 D 1 12 -28 D -1 14 -88
18 -4 38 5 4 10 4 -2 5 7 40
19 -6 70 2 -6 74 -1 1 9 129 R -1 10 101 -1 4 7
20 -6 44 1 1 -7 77 D -1 1 20 -8 1 156 -1 -14 -58
21 3 18 1 -4 R 1 -7 -20 R -1 4 20 5 -22
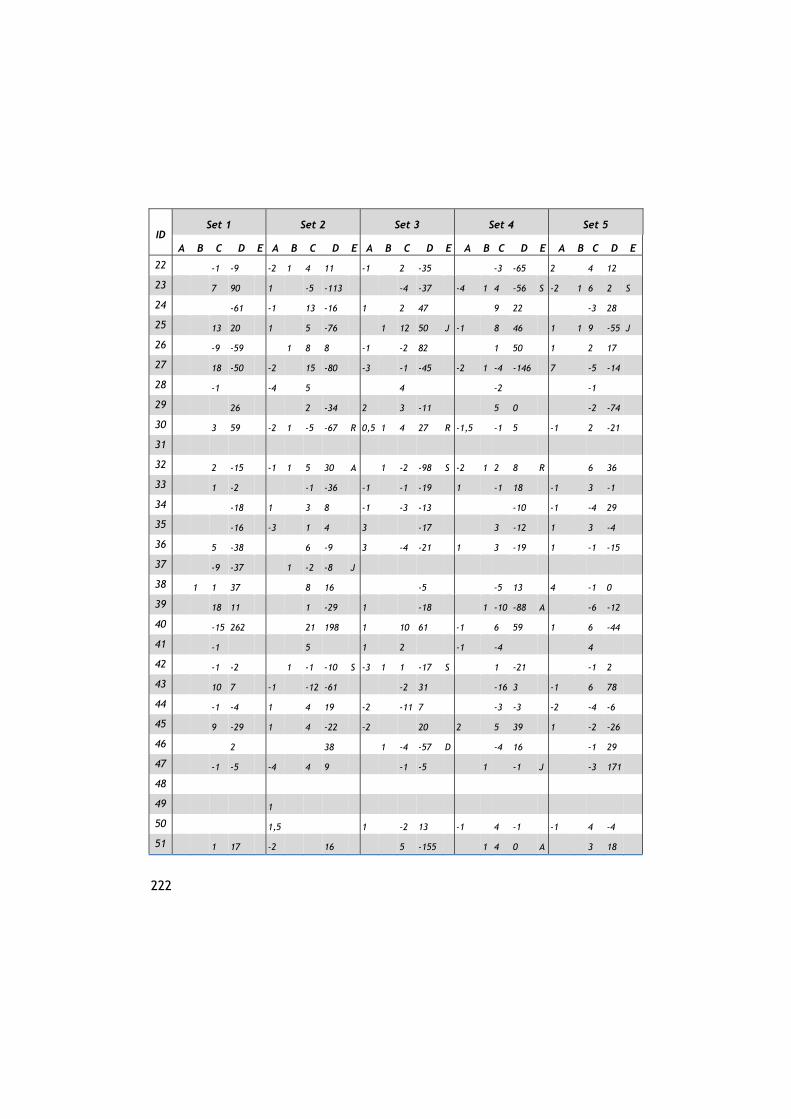
222
ID Set 1 Set 2 Set 3 Set 4 Set 5
A B C D E A B C D E A B C D E A B C D E A B C D E
22 -1 -9 -2 1 4 11 -1 2 -35 -3 -65 2 4 12
23 7 90 1 -5 -113 -4 -37 -4 1 4 -56 S -2 1 6 2 S
24 -61 -1 13 -16 1 2 47 9 22 -3 28
25 13 20 1 5 -76 1 12 50 J -1 8 46 1 1 9 -55 J
26 -9 -59 1 8 8 -1 -2 82 1 50 1 2 17
27 18 -50 -2 15 -80 -3 -1 -45 -2 1 -4 -146 7 -5 -14
28 -1 -4 5 4 -2 -1
29 26 2 -34 2 3 -11 5 0 -2 -74
30 3 59 -2 1 -5 -67 R 0,5 1 4 27 R -1,5 -1 5 -1 2 -21
31
32 2 -15 -1 1 5 30 A 1 -2 -98 S -2 1 2 8 R 6 36
33 1 -2 -1 -36 -1 -1 -19 1 -1 18 -1 3 -1
34 -18 1 3 8 -1 -3 -13 -10 -1 -4 29
35 -16 -3 1 4 3 -17 3 -12 1 3 -4
36 5 -38 6 -9 3 -4 -21 1 3 -19 1 -1 -15
37 -9 -37 1 -2 -8 J
38 1 1 37 8 16 -5 -5 13 4 -1 0
39 18 11 1 -29 1 -18 1 -10 -88 A -6 -12
40 -15 262 21 198 1 10 61 -1 6 59 1 6 -44
41 -1 5 1 2 -1 -4 4
42 -1 -2 1 -1 -10 S -3 1 1 -17 S 1 -21 -1 2
43 10 7 -1 -12 -61 -2 31 -16 3 -1 6 78
44 -1 -4 1 4 19 -2 -11 7 -3 -3 -2 -4 -6
45 9 -29 1 4 -22 -2 20 2 5 39 1 -2 -26
46 2 38 1 -4 -57 D -4 16 -1 29
47 -1 -5 -4 4 9 -1 -5 1 -1 J -3 171
48
49 1
50 1,5 1 -2 13 -1 4 -1 -1 4 -4
51 1 17 -2 16 5 -155 1 4 0 A 3 18

223
ID Set 1 Set 2 Set 3 Set 4 Set 5
A B C D E A B C D E A B C D E A B C D E A B C D E
52 -19 2 0 -1 2 25 1 2 18 2 48
53 1 -12 -1 -9 -19 -3 1 -1 7 1 -1 -32 -1 -11
54 1 -2 1
55 1
56 -4
57 -1
58 10 -50 1 1 6 -18 A 1 -1 -4 A -4 -10 -52 2 14 -2
59 -3 1
60 -2 1 S
61 -1 -30 1 1 -2 63 R 3 1 -9 57 R -1 -7 111 -4 4 174 R
62 11 5 -10 -7 1 -10 8 49 -1 2 42
63 1 1 D 4 -155 -13 -12 6 56
64 9 99 -4 -7 -163 1 1 11 -70 R -2 -137 1 19
65 -32 -2 4 5 1 -1 12 S 1 -11 21 S -11 -31
66 1 -2 1 S 2 -0,5
67 -2 -1 1 -1 -79 S 1 1 7 140 S 1 20 152
68 -1 1 1
69 -2 11 4 -1 7 -4 -1 -2 -7 2 14
70 -1 1 R -1 3
71 9 -8 -112 1 -9 -34 12 3 -1 25
72 -4 38 5 4 10 4 -1 -2 5 -3 7 40
73 -2 23 2 14 1 -2 5 6 -1 -2 3
74 -2 10 -7 14 1 11 88 -3 10 -7 24
75 -4 94 3 1 1 1 D 3 -1
76 -1 -3
77 1 -1 2 -15 1 -1 -1 1 -5
78 1 12 -4 -2 18 1 1 -6 S 1 -1 -12 D 1 -11 -50 D
79 2 -11 5 14 3 -14 8 8 -4 33
80 1 53 0,5 3 -7 0,5 5 -94 -0,5 1 181 -4 -4 93
81 2 -1 -3 1 9 -1 1 22 -1 -16
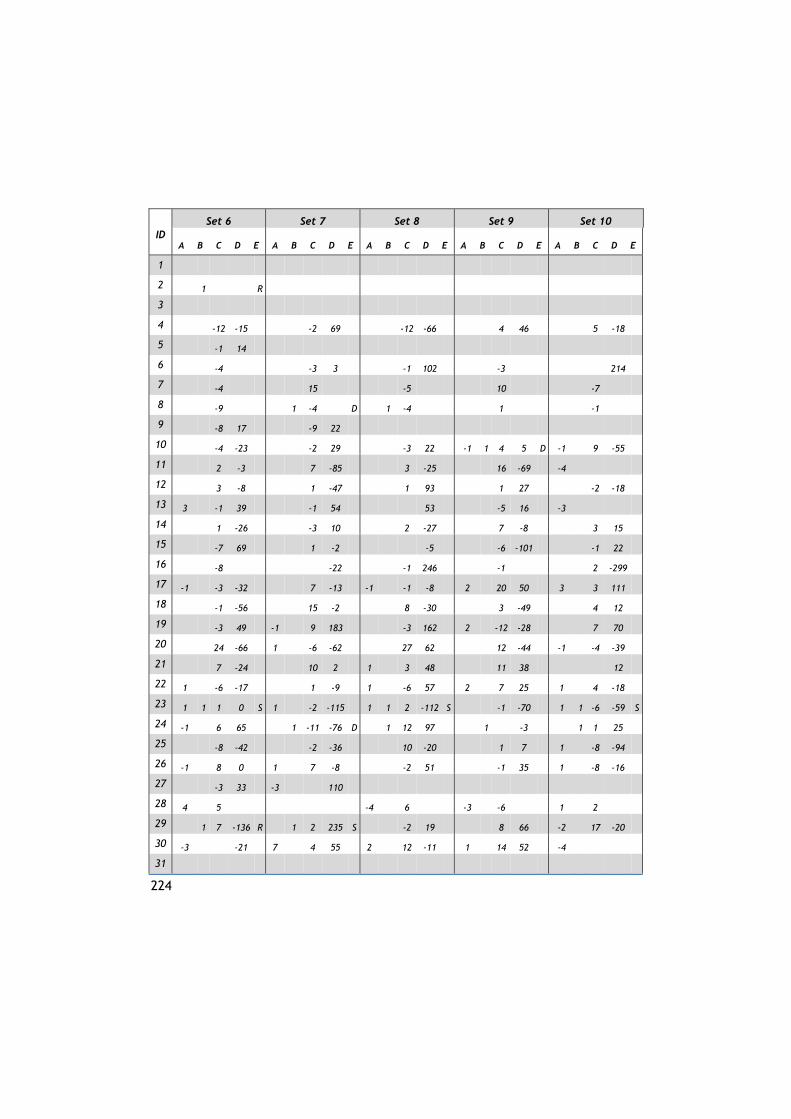
224
ID Set 6 Set 7 Set 8 Set 9 Set 10
A B C D E A B C D E A B C D E A B C D E A B C D E
1
2 1 R
3
4 -12 -15 -2 69 -12 -66 4 46 5 -18
5 -1 14
6 -4 -3 3 -1 102 -3 214
7 -4 15 -5 10 -7
8 -9 1 -4 D 1 -4 1 -1
9 -8 17 -9 22
10 -4 -23 -2 29 -3 22 -1 1 4 5 D -1 9 -55
11 2 -3 7 -85 3 -25 16 -69 -4
12 3 -8 1 -47 1 93 1 27 -2 -18
13 3 -1 39 -1 54 53 -5 16 -3
14 1 -26 -3 10 2 -27 7 -8 3 15
15 -7 69 1 -2 -5 -6 -101 -1 22
16 -8 -22 -1 246 -1 2 -299
17 -1 -3 -32 7 -13 -1 -1 -8 2 20 50 3 3 111
18 -1 -56 15 -2 8 -30 3 -49 4 12
19 -3 49 -1 9 183 -3 162 2 -12 -28 7 70
20 24 -66 1 -6 -62 27 62 12 -44 -1 -4 -39
21 7 -24 10 2 1 3 48 11 38 12
22 1 -6 -17 1 -9 1 -6 57 2 7 25 1 4 -18
23 1 1 1 0 S 1 -2 -115 1 1 2 -112 S -1 -70 1 1 -6 -59 S
24 -1 6 65 1 -11 -76 D 1 12 97 1 -3 1 1 25
25 -8 -42 -2 -36 10 -20 1 7 1 -8 -94
26 -1 8 0 1 7 -8 -2 51 -1 35 1 -8 -16
27 -3 33 -3 110
28 4 5 -4 6 -3 -6 1 2
29 1 7 -136 R 1 2 235 S -2 19 8 66 -2 17 -20
30 -3 -21 7 4 55 2 12 -11 1 14 52 -4
31

225
ID Set 6 Set 7 Set 8 Set 9 Set 10
A B C D E A B C D E A B C D E A B C D E A B C D E
32 2 -9 -80 222 -10 -218 -8 -92 -4 24
33 2 18 -1 3 4 2 3 -4 -1 2 17 1 -2 -26
34 1 -22 1 -6 -1 16 1 -1 3 -1 2
35 -2 -24 -1 -1 -28 1 -1 23 -1 7 21
36 -1 -1 -7 1 -6 -1 1 3 4 -7 -45 1 2 25
37
38 1 2 -9 -1 -3 -3 -1 2 -13 1 -19 -1 11
39 3 -15 6 86 -1 7 13 D -1 -4 22 -1 2 10
40 -1 1 259 -9 -171 -1 -6 -16 73 -1 -3 -154
41 1 1 -1 1 1 1 1 J 6 15 1 -1 4 D
42 3 1 -2 -1 26 1 -1 4 S 1 8 1 8 J
43 1 11 62 -1 -28 -7 -36 17 -61 -2 -2 57
44 1 1 -2 -14 -29 -2 -9 -33 -8 -16 -1 -2 -48
45 1 -14 -1 -2 3 -2 1 -1 39 1 -2 20
46 3 -50 2 18 -4 38 -2 42 2 17
47 -2 -2 89 7 -2 11 7
48
49
50 -5 -54 -3
51 1 13 2 30 13 83 -1 -2 -17 1 -2 8
52 -1 5 7 2 -4 23 6 -61 1 73 1 -1
53 -1 3 18 -2 -7 1 -4 -19 -2 26 -1 -4 4
54 -1 -3
55 -1 -1 -2 2 -2
56
57 2 -5 -1 3
58 -3 -128 3 2 -117 R 0,5 5 -25 1 -9 -64 D -2,5 6 32 J
59 1 J
60 1 J 1 S
61 1 78 2 -1 63 1 13 113 9 183 -1 -9 173
62 1 -12 -8 42 1 430 -3 130 7 341

226
ID Set 6 Set 7 Set 8 Set 9 Set 10
A B C D E A B C D E A B C D E A B C D E A B C D E
63 1 -4 -165 -271 1 -16 J -7 174 1 -50
64 40 6 -29 -3 10 7 14
65 -2 80 -6 90 -2 362 1 7 33 J 2 91
66 -2 1,5 -3
67 -2 2 -1 1 -1 D 1 -1 1 1 9 -235 S -1 1 18 155 S
68 -4 2 1 -1
69 -1 1 5 -346 J 1 9 103 1 1 -1 1 1 1
70 -1 1 1
71 -1 10 106 1 -11 -49 7 47 -1 -20 -5 1 -5 17
72 3 -1 -56 15 -2 2 8 -30 3 -49 4 12
73 73 1 6 109 -1 10 10 -1 3 7 1 14 -158 J
74 -3 -49 1 24 5 19 -8 1 12 A
75 -6 -5 -1 -6 2 2 3
76 1 J
77 -2 -14 -1 -2 27 1 3 113 -1 -7 270 1 -7 103
78 -0,5 -12 -21 0,5 -8 5 -3 -7 -0,5 -6 27 0,5 -5 106
79 1 -8 -55 S -2 58 11 -27 4 -74 65
80 -4 18 -4 -21 -4 -11 -1 -1
81 -1 1 3 31 J 6 -1 2 15 1 1 13 -3
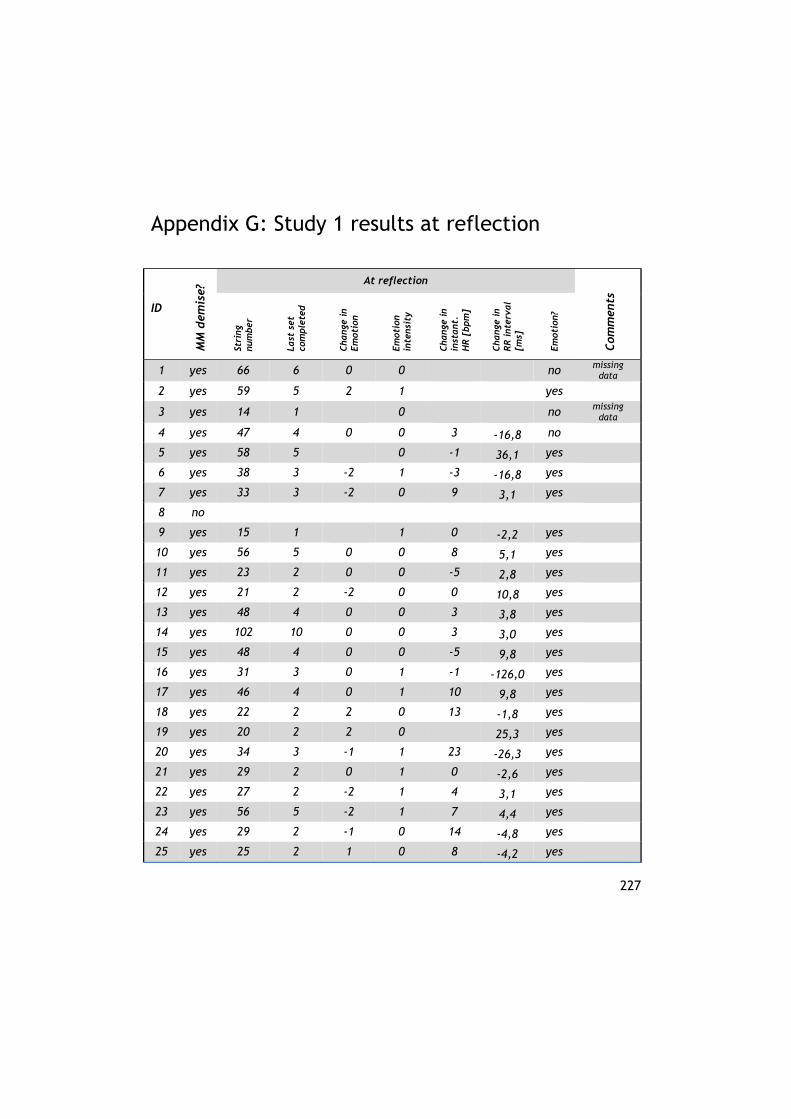
227
Appendix G: Study 1 results at reflection
ID
MM
dem
ise?
At reflection
Com
men
ts
Stri
ng
num
ber
Last
set
co
mple
ted
Cha
nge
in
Em
otio
n
Em
otio
n in
tens
ity
Cha
nge
in
inst
ant
. H
R [
bpm
]
Cha
nge
in
RR
int
erva
l [m
s]
Em
otio
n?
1 yes 66 6 0 0
no missing data
2 yes 59 5 2 1
yes
3 yes 14 1
0
no missing data
4 yes 47 4 0 0 3 -16,8 no
5 yes 58 5 0 -1 36,1 yes
6 yes 38 3 -2 1 -3 -16,8 yes
7 yes 33 3 -2 0 9 3,1 yes
8 no
9 yes 15 1 1 0 -2,2 yes
10 yes 56 5 0 0 8 5,1 yes
11 yes 23 2 0 0 -5 2,8 yes
12 yes 21 2 -2 0 0 10,8 yes
13 yes 48 4 0 0 3 3,8 yes
14 yes 102 10 0 0 3 3,0 yes
15 yes 48 4 0 0 -5 9,8 yes
16 yes 31 3 0 1 -1 -126,0 yes
17 yes 46 4 0 1 10 9,8 yes
18 yes 22 2 2 0 13 -1,8 yes
19 yes 20 2 2 0 25,3 yes
20 yes 34 3 -1 1 23 -26,3 yes
21 yes 29 2 0 1 0 -2,6 yes
22 yes 27 2 -2 1 4 3,1 yes
23 yes 56 5 -2 1 7 4,4 yes
24 yes 29 2 -1 0 14 -4,8 yes
25 yes 25 2 1 0 8 -4,2 yes
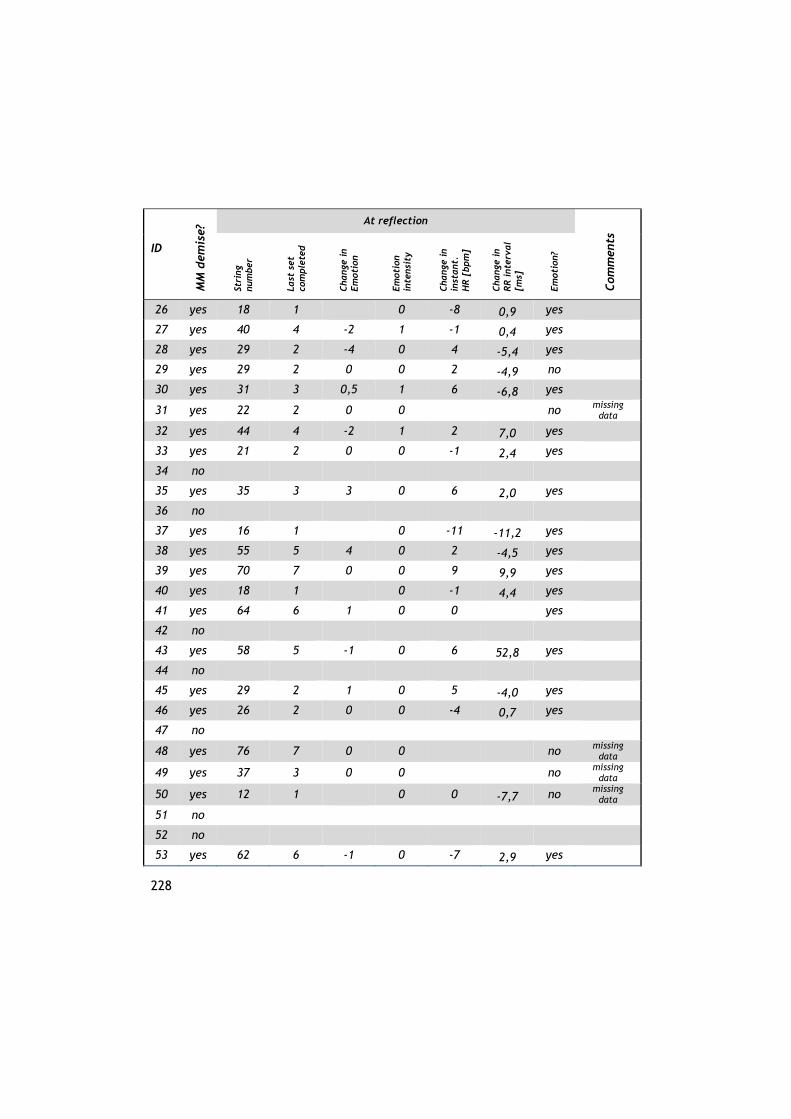
228
ID
MM
dem
ise?
At reflection
Com
men
ts
Stri
ng
num
ber
Last
set
co
mple
ted
Cha
nge
in
Em
otio
n
Em
otio
n in
tens
ity
Cha
nge
in
inst
ant
. H
R [
bpm
]
Cha
nge
in
RR
int
erva
l [m
s]
Em
otio
n?
26 yes 18 1
0 -8 0,9 yes
27 yes 40 4 -2 1 -1 0,4 yes
28 yes 29 2 -4 0 4 -5,4 yes
29 yes 29 2 0 0 2 -4,9 no
30 yes 31 3 0,5 1 6 -6,8 yes
31 yes 22 2 0 0
no missing data
32 yes 44 4 -2 1 2 7,0 yes
33 yes 21 2 0 0 -1 2,4 yes
34 no
35 yes 35 3 3 0 6 2,0 yes
36 no
37 yes 16 1 0 -11 -11,2 yes
38 yes 55 5 4 0 2 -4,5 yes
39 yes 70 7 0 0 9 9,9 yes
40 yes 18 1 0 -1 4,4 yes
41 yes 64 6 1 0 0
yes
42 no
43 yes 58 5 -1 0 6 52,8 yes
44 no
45 yes 29 2 1 0 5 -4,0 yes
46 yes 26 2 0 0 -4 0,7 yes
47 no
48 yes 76 7 0 0
no missing data
49 yes 37 3 0 0 no missing
data
50 yes 12 1 0 0 -7,7 no missing data
51 no
52 no
53 yes 62 6 -1 0 -7 2,9 yes
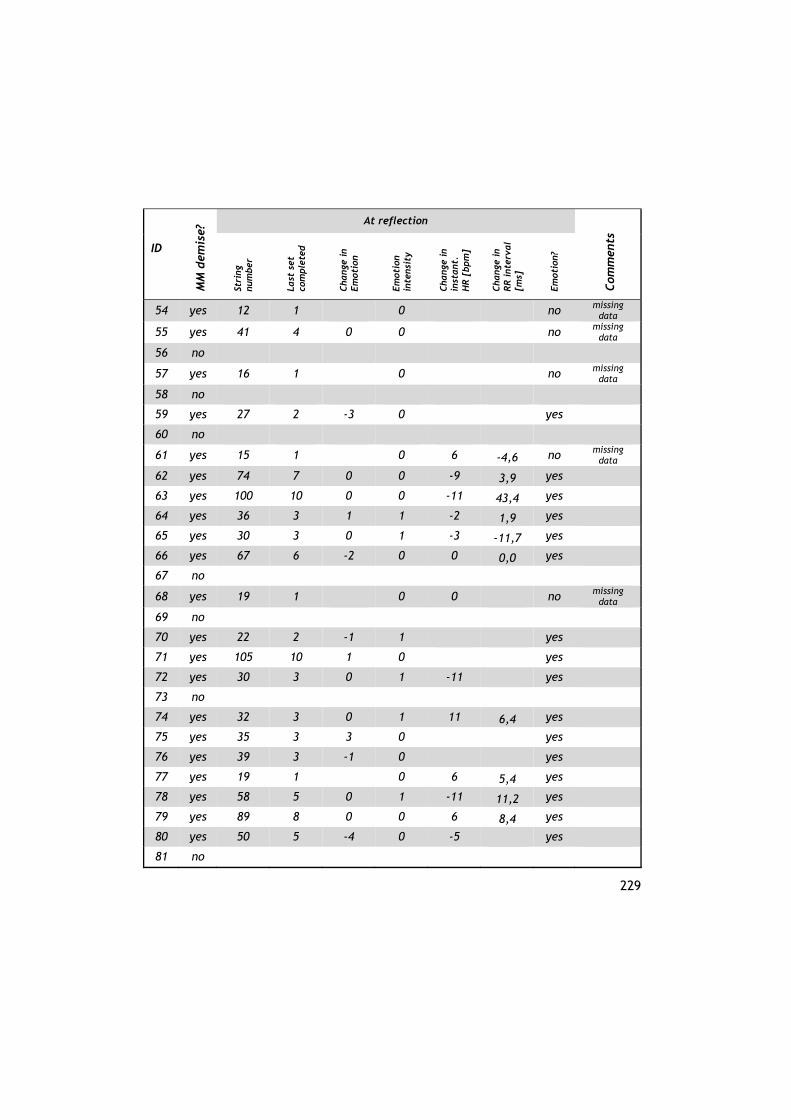
229
ID
MM
dem
ise?
At reflection
Com
men
ts
Stri
ng
num
ber
Last
set
co
mple
ted
Cha
nge
in
Em
otio
n
Em
otio
n in
tens
ity
Cha
nge
in
inst
ant
. H
R [
bpm
]
Cha
nge
in
RR
int
erva
l [m
s]
Em
otio
n?
54 yes 12 1
0
no missing data
55 yes 41 4 0 0
no missing data
56 no
57 yes 16 1 0 no missing
data
58 no
59 yes 27 2 -3 0
yes
60 no
61 yes 15 1 0 6 -4,6 no missing data
62 yes 74 7 0 0 -9 3,9 yes
63 yes 100 10 0 0 -11 43,4 yes
64 yes 36 3 1 1 -2 1,9 yes
65 yes 30 3 0 1 -3 -11,7 yes
66 yes 67 6 -2 0 0 0,0 yes
67 no
68 yes 19 1 0 0
no missing data
69 no
70 yes 22 2 -1 1 yes
71 yes 105 10 1 0 yes
72 yes 30 3 0 1 -11
yes
73 no
74 yes 32 3 0 1 11 6,4 yes
75 yes 35 3 3 0
yes
76 yes 39 3 -1 0
yes
77 yes 19 1
0 6 5,4 yes
78 yes 58 5 0 1 -11 11,2 yes
79 yes 89 8 0 0 6 8,4 yes
80 yes 50 5 -4 0 -5 yes
81 no
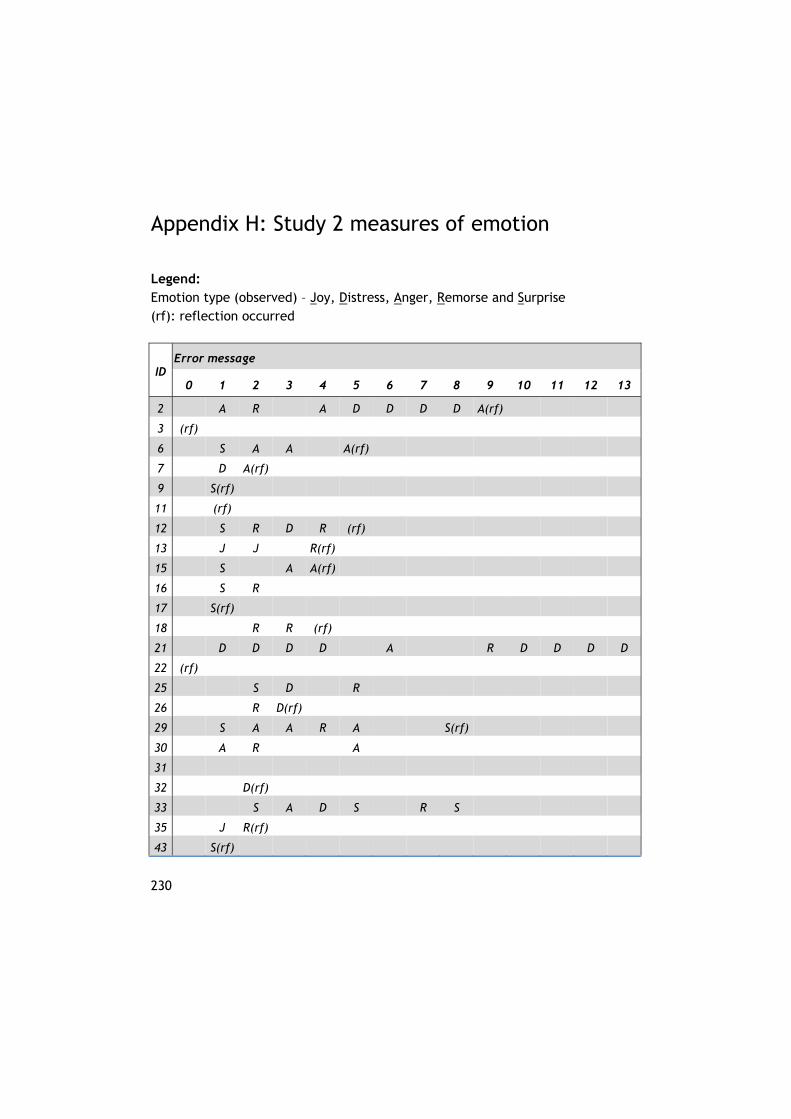
230
Appendix H: Study 2 measures of emotion
Legend: Emotion type (observed) – Joy, Distress, Anger, Remorse and Surprise (rf): reflection occurred
ID Error message
0 1 2 3 4 5 6 7 8 9 10 11 12 13
2 A R A D D D D A(rf)
3 (rf)
6 S A A A(rf)
7 D A(rf)
9 S(rf)
11 (rf)
12 S R D R (rf)
13 J J R(rf)
15 S A A(rf)
16 S R
17 S(rf)
18 R R (rf)
21 D D D D A R D D D D
22 (rf)
25 S D R
26 R D(rf)
29 S A A R A S(rf)
30 A R A
31
32 D(rf)
33 S A D S R S
35 J R(rf)
43 S(rf)

231
ID Error message
0 1 2 3 4 5 6 7 8 9 10 11 12 13
50 A R(rf)
61 S(rf)
68 S(rf)
70 S(rf)
75 S S J A(rf)
78 S(rf)

232
233
Summary
Research motivation
Design engineers perform design activities under dynamic and uncertain circumstances. They are able to solve design problems and forward the design because they construct mental models of the world around them. Mental models reduce cognitive workload, and they are inherently stable in the face of contrary evidence and so the assumptions underlying the mental model may diverge from reality. In the field of design, this discrepancy between the mental model and reality may continue for prolonged periods and could actually be justified in hindsight, for instance if the discrepancy is temporary. Similarly, the alignment of the individuals in group work is susceptible to the stability of the team members’ mental models.
The aim of this research is to contribute to the body of knowledge on mental models in the fields of design methodology, engineering psychology and human factors by studying the resistance of mental models to change. In this work, cognitive resistance has been defined as the capacity to endure stimuli from the environment that contradict the mental model: new perceptions are ignored, or interpreted in such a way that they fit the existing mental model. The end of cognitive resistance is marked by reflection on the assumptions underlying the mental model. The main research question that is answered in this research is:
RQ How do the components of cognitive resistance interact?
To fulfill the research objective, three main points have been addressed: the identification of the components of cognitive resistance, an investigation into their interaction, and the identification of environmental and intra-subject factors that influence cognitive resistance.
Authors like Donald Schön suggest that emotions may contribute to the resolution of cognitive resistance. In Reflective Practice the designer reflects on his own work to enable progress after “pleasing […] or unwanted” surprises. Case study reports of design practice support this proposition. The author of the current work is not aware of existing research into the effect of emotion on cognitive
234
resistance, nor are we aware of existing research into components of cognitive resistance and their interaction. The current research is aimed at filling this void, and is aligned with the research agenda of the section for Design Methodology of the School of Industrial Design Engineering at the Delft University of Technology.
Research results from the study of literature
In this work a definition of mental models has been proposed based on defining characteristics from the psychological literature (e.g. Johnson-Laird). This mental model construct differs from the construct by the same name that is commonly applied in the human factors community on important points, but shares its defining characteristics with schema and situation awareness, two other commonly used constructs. From the definition of a mental model a new construct termed cognitive resistance has been derived. This term has been chosen to avoid the confusion of the mental model construct, and to align with definitions of resistance in different disciplines. It is predicted that cognitive resistance can be modeled mathematically by a unimodal log-logistic distributed probability of reflection as a function of contradictory stimuli.
The components of cognitive resistance that have been identified from the literature are primary perception, stimulus matching, and emotions. Primary perception is defined as the physiological process that starts with an environmental stimulus that surpasses the perception threshold and leads to neural activation. Stimulus matching is the subconscious neurological process in which it is attempted to recognize the neural activation as relevant. The study of literature has further identified that the term emotion can be used in two ways: (1) to denote a specific instance of an emotional response, or (2) to categorize a set of emotional responses which are based on similar precedents and share comparable expressive behavior (termed “emotion type” in this work). These two interpretations have been segregated for the purpose of this research. A definition for an emotional response has been based on its defining characteristics. A taxonomy of emotion types has been proposed that is mutually exclusive and collectively exhaustive, allows identification and classification of emotion types by an external observer, and categorizes emotion types according to their effect on cognitive resistance.
235
A schematic description of cognitive resistance is presented, based on the sequential nature of the components of cognitive resistance. The attempt to match the neural activation of the stimulus following primary perception can be either successful (leading to reflection) or unsuccessful (therefore preserving the mental model). An emotional response is triggered by the neural activation if appraised as sufficiently destabilizing. The emotional response has two further effects: the sensitivity of primary perception for contradictory stimuli is increased (for instance by involuntarily turning the ears towards the source of noise or focusing the eyes), and the affective component of emotion (i.e. the emotion type) biases cognition by offering an intrinsic reward or penalty. This interaction of the components of cognitive resistance has been dynamically modeled using a reinforcement learning framework. In this framework, the agent is proposed to be the subconscious controller of the process step “stimulus matching”. This controller maintains a balance between ignoring irrelevant stimuli (thereby saving resources) and acting (i.e. reflecting) upon significant stimuli in the interest of survival. The agent is expected to adapt its behavior over time, depending on the perseverance of contradictory stimuli. The speed of temporal-learning in the context of the reinforcement learning framework is largely defined by the learning rate and the rewards or penalties of maintaining the mental model relative to the penalty of reflection. The learning rate is predicted to be dependent upon the personality characteristics of the individual, with high traits scores for Neuroticism leading to rapid reflection. It is proposed that the rewards or penalties of maintaining the mental model depend on the emotion type that is elicited during cognitive resistance: joy is predicted to inhibit reflection, surprise leads to immediate reflection, distress leads to slow reflection, anger leads to rapid reflection, remorse leads to a moderate rate of reflection, and if no emotion is elicited reflection is not likely to occur.
The study of literature has enabled the identification of environmental and intra-subject factors that influence cognitive resistance. This serves two purposes: (1) the improvement of the understanding of cognitive resistance; and (2) the reduction of their confounding effect in the experimental study. Some of the “factors” that were found in the literature are considered to be symptoms of cognitive resistance, because they describe ongoing behavior that is guided by the existing mental model, and are existent only after onset of the contradictory
236
stimuli. The remaining factors of cognitive resistance have been sorted into five groups based on the means by which they can be manipulated: task design, number of people involved, task instructions, participant preparation, and personal inclination.
Research findings from the experimental study
The predictions that were derived from the study of the literature have been validated in an experimental study utilizing a number reduction task. This task was used by Wagner and colleagues to identify reflection through an abrupt change in behavior, and was originally developed by Thurstone and Thurstone. This task has been selected because it enables the validation of the proposed interaction between the components of cognitive resistance, resembles problem-solving in design, permits the mitigation of confounding factors, and complies with other requirements that follow from the study of the literature. Two studies using the number reduction task have been conducted within the scope of the experimental study.
The results from the first study justify the conception of the construct of cognitive resistance. Reflection is delayed and the probability of reflection as a function of contradictory stimuli matches a unimodal log-logistics probability distribution. Emotions have been elicited in the course of cognitive resistance, and these have been described in terms of emotional responses as well as emotion types. The study has validated that the components of cognitive resistance are primary perception, stimulus matching and emotions (in the sense of an emotional response and emotion type). However, the first study was marked by two major limitations: (1) the manipulation resulted in a lack of synchronization between measures of emotion and moment of reflection, and (2) the results seem somewhat confounded by a bias to follow instructions given by the system and the researcher.
The results of the second study confirm the results of the first study regarding the instigation of cognitive resistance, the match with a unimodal log-logistics probability distribution, and the components of cognitive resistance. The predictions for the interaction of components of cognitive resistance have been validated:
237
joy was not observable directly before reflection, as predicted by the model; surprise largely led to immediate reflection; distress was shown to loop back to itself, therefore leading to a low rate of
reflection; anger leads to reflection in a third of the cases; remorse leads to a moderate rate of reflection; and reflection is inhibited if no emotion is elicited despite the contradictory
stimuli.
Furthermore, it was shown that high trait Neuroticism correlates with a high rate of reflection as predicted. In the design of the second study the limitations of the first study were addressed; however validity of the second study is restricted by the limited number of participants.
Research contribution
The construct of cognitive resistance is a contribution to the literature on human performance in design and engineering because it increases the knowledge of the effects of preserving a mental model that diverges from reality, and contributes to the understanding of automaticity and the application of heuristics in design. The construct represents a “real” physiological and neurological process from the discernment of contradictory stimuli to the conscious awareness of the discrepancy between expectations and reality. The change in sensitivity for contradictory stimuli during cognitive resistance and after reflection can be illustrated using a so-called Receiver Operating Characteristic curve.
The results from the current study show that those high in Neuroticism are less susceptible to cognitive resistance than others, thereby giving support to a more balanced view of the advantages and disadvantages of Neuroticism. Rapid reflection is expected to be an advantage in the dynamic and uncertain circumstances under which design activities are performed, so that engineering risks for others are avoided.
The findings of the current work contribute to the science of design methodology by providing a theoretical and empirical foundation for the study of the resistance of mental models and emotions. The definition of a mental model has been refined, and compared to similar constructs in the literature. The
238
interaction between emotions and reflection that have been suggested by Schön has been validated. This study also contributes to previous attempts to relate emotions to design performance, by suggesting that the relationship may not be a direct one. Rather, the findings of this study suggest that emotions are influential in achieving reflection, and reflection may or may not improve performance. The current research contributes to a better understanding of the cognitive biases that lead to optimistic forecasts resulting in cost overruns. Practical examples of cognitive resistance in design can help designers and managers to recognize the subconscious and cognitive processes that are involved in designing complex systems and avoid the pitfalls.
Automation surprise is a special case of cognitive resistance, caused by a mismatch between the individual’s understanding of a complex system and the system’s actual performance. Automation surprise can have dire consequences, and will become increasingly widespread as humans operators are transformed into machine supervisors. Little is as yet known about how automation surprise unfolds and how it may be terminated, let alone which factors encourage or impede it. It is envisaged that research will continue in this area at the Amsterdam University of Applied Sciences.
239
Nederlandse Samenvatting
Seneca’s fout: een affectief model van cognitieve weerstand
Dit proefschrift beschrijft hoe mensen van mening veranderen. Zoals iedere ontwerper weet uit eigen ervaring gaat dit niet altijd gemakkelijk. Daarom beogen we met dit proefschrift Seneca’s stelling77 te verbeteren: niet alleen vergissen is menselijk, maar ook het erin volharden ondanks waarschuwingstekens is menselijk. Ik geef aan hoe het van mening veranderen door gevoel wordt gereguleerd, voortbouwend op het werk van Damasio dat emoties essentieel zijn voor rationeel, dagelijks gedrag. Zijn boek “Descarte’s Error“ (1994) was de inspiratiebron voor de titel van dit proefschrift. Ik werd geïnspireerd voor dit onderzoek door mijn ervaringen in industrie, waar ik het geluk had om gedurende meer dan 20 jaar met veel slimme, aardige en nogal eigenwijze techneuten78 samen te werken. Bij ontelbare gelegenheden zag ik hoe gevoelens een rol speelde bij de manier waarop ontwerpers hun ideeën afstemden en gezamenlijk resultaten boekten.
Motivering van het onderzoek
Ontwerpers voeren hun werkzaamheden uit onder dynamische en onzekere condities. Door gebruik te maken van mentale modellen die de wereld om hun heen vereenvoudigt kunnen ze ontwerpproblemen oplossen. Deze modellen verminderen de cognitieve werklast en zijn enigszins stabiel, waardoor ze strijdig met de werkelijkheid kunnen zijn. Bij ontwerpers kan deze tegenstrijdigheid lang aanhouden en achteraf gerechtvaardigd zijn, bijvoorbeeld als de verandering in van tijdelijke aard is. Ook bij het afstemmen tussen individuen in een groep speelt de stabiliteit van de mentale modellen een rol.
Het doel van dit onderzoek is om kennis in het domein van de ontwerpleer, de psychologie en de ergonomie over mentale modellen te vergroten door de weerstand tegen verandering te bestuderen. In dit proefschrift wordt de term
77 Errare humanum est, sed perseverare diabolicum – zich vergissen is menselijk, maar erin volharden is duivels. 78 Het spreekt voor zich dat ik ook een techneut ben.
240
cognitieve weerstand gedefinieerd als het vermogen om prikkels uit de omgeving te weerstaan die het bestaande mentale model tegenspreken: nieuwe waarnemingen worden genegeerd of zo geïnterpreteerd dat ze in het mentale model passen. Het einde van cognitieve weerstand wordt gekenmerkt door een bespiegeling op de uitgangspunten van het mentale model. De primaire vraag die door dit onderzoek wordt beantwoord is:
RQ Hoe verloopt de wisselwerking tussen de bestanddelen van cognitieve weerstand?
Dit proefschrift kent drie hoofdpunten: de identificatie van de bestanddelen van cognitieve weerstand, een onderzoek naar hun wisselwerking, en het vaststellen van de persoonlijkheids- en omgevingsfactoren die cognitieve weerstand beïnvloeden.
Schrijvers zoals Donald Schön hebben gesuggereerd dat emoties wellicht bijdragen aan het oplossen van cognitieve weerstand. Hij beschrijft hoe ontwerpers op hun werk reflecteren na te zijn verrast door een uitkomst. Dit fenomeen wordt door verschillende andere onderzoeken bevestigd. Eerder onderzoek naar de invloed van emoties op cognitieve weerstand, noch naar de bestanddelen ervan, zijn ons bekend. Het huidig onderzoek wil aan het oplossen van deze lacune een bijdrage leveren, en sluit aan op eerder onderzoek aan de Technische Universiteit Delft.
Resultaten van het literatuuronderzoek
In dit proefschrift wordt een definitie van mentale modellen gehanteerd die is gebaseerd op de psychologische literatuur (bijvoorbeeld Johnson-Laird). Cognitieve weerstand is van deze definitie afgeleid. We voorspellen aan de hand van literatuur dat cognitieve weerstand mathematisch kan worden gemodelleerd als functie van het aantal tegenstrijdige prikkels door een log-logistieke kansverdeling met één modus.
De bestanddelen van cognitieve weerstand die uit de literatuur volgen zijn: primaire perceptie, stimulusherkenning en emoties. Primaire perceptie is gedefinieerd als het fysiologische proces dat begint met een prikkel en die leidt tot activering van de hersenen. Stimulusherkenning is het onbewuste proces
241
waarin wordt getracht de activering als relevant te herkennen. Uit de literatuurstudie volgt verder dat de term emotie op twee manieren kan worden gebruikt: (1) om een specifieke emotionele reactie te duiden, of (2) om een aantal verwante emotionele reacties te categoriseren, waarbij ieder categorie een ander effect heeft op cognitieve weerstand.
De bestanddelen van cognitieve weerstand vormen een sequentieel proces. Stimulusherkenning volgt op primaire perceptie, en kan mislukken (waardoor het mental model behouden blijft) of kan succesvol zijn (zodat reflectie volgt). In sommige gevallen wordt daarnaast een emotionele reactie door de primaire perceptie ontketend. De emotionele reactie verhoogt de gevoeligheid van de primaire waarneming voor tegenstrijdige prikkels (bijvoorbeeld door het onbewust draaien van het hoofd naar de bron van lawaai), en de gevoelswaarde van emotie beïnvloedt de cognitie. Met een zogenaamd reinforcement learning framework is deze wisselwerking gemodelleerd. De agent in het framework is de regelaar voor stimulusherkenning in ons onderbewustzijn. Deze regelaar bewaakt de balans tussen het negeren van irrelevant geachte prikkels (waardoor de cognitieve werklast wordt verlaagd) en het reageren op relevante prikkels door deze door te laten naar het bewustzijn en erop te reflecteren (om de overlevingskansen van het organisme te verhogen). We verwachten dat de regelaar na verloop van tijd zijn gedrag aanpast, al naar gelang de prikkels aanhouden die het mentale model tegenspreken79. De snelheid waarmee het gedrag aangepast wordt is afhankelijk van het leertempo, en de beloning of straf voor het behouden van het mentale model ten opzichte van de straf voor reflectie. In de literatuur wordt aangegeven dat het leertempo afhankelijk is van de persoonlijkheidskenmerken van het individu. Een hoge mate van onzekerheid leidt tot snelle reflectie. De beloning of straf voor het behouden van het mentale model is afhankelijk van het type emotie dat wordt ontketend door de cognitieve weerstand: vreugde leidt tot trage reflectie, verrassing leidt tot onmiddellijke reflectie, verdriet leidt tot langzame reflectie, boosheid leidt tot snelle reflectie, wroeging leidt tot een gematigd tempo van reflectie, en als er geen emotie wordt ontketend dan is reflectie niet waarschijnlijk.
79 Op prikkels die aansluiten bij het mentale model wordt niet actief gereflecteerd.
242
Uit de literatuurstudie volgen persoonlijkheids- en omgevingsfactoren die van invloed zijn op cognitieve weerstand. Door de identificatie daarvan zijn we in staat om: (1) inzicht in cognitieve weerstand te verbeteren; en (2) hun storende invloed op de experimentele studie te verminderen. Enkele van de "factoren" zijn symptomen van cognitieve weerstand, omdat ze gedrag beschrijven dat volgt uit het bestaande mentale model. De overige factoren zijn verdeeld in vijf groepen naar de manier dat ze kunnen worden beïnvloed: taakontwerp, aantal betrokkenen, instructies, voorbereiding en persoonlijkheid.
Resultaten van de experimentele studie
De voorspellingen uit de literatuurstudie zijn gevalideerd in twee experimenten, waarbij gebruik is gemaakt van een Number Reduction Task, een numerieke taak op de computer. Deze taak werd gebruikt door Wagner en collega’s om reflectie te identificeren via een abrupte wijziging in gedrag. Deze taak is geselecteerd omdat het de validatie mogelijk maakt van de voorgestelde wisselwerking tussen de bestanddelen van cognitieve weerstand, op een abstract niveau gelijkenissen vertoont met het oplossen van ontwerpproblemen, het effect van verstorende factoren minimaliseert en voldoet aan andere vereisten die uit de literatuurstudie voortvloeien.
De resultaten van de eerste studie rechtvaardigen de introductie van het nieuwe concept van cognitieve weerstand. Reflectie wordt door de experimentele manipulatie vertraagd en de kans op reflectie als een functie van de stimuli kan worden gemodelleerd door een log-logistieke kansverdeling met een enkele modus. Emoties worden zoals verwacht af en toe door cognitieve weerstand ontketend. De studies bevestigen dat de bestanddelen van cognitieve weerstand primaire perceptie, stimulusherkenning en emoties zijn. Echter, de eerste studie kende twee belangrijke beperkingen: (1) de uiting van emotie en het moment van reflectie liepen door de wijze van manipulatie niet synchroon, en (2) de resultaten lijken beïnvloed door de instructies van de onderzoeker.
De resultaten van de tweede studie bevestigen de resultaten van de eerste studie. Daarnaast zijn de voorspellingen voor de wisselwerking van de bestanddelen van cognitieve weerstand gevalideerd:
vreugde was niet zichtbaar bij reflectie, zoals voorspeld door het model;
243
verrassing leidde grotendeels tot onmiddellijke reflectie; verdriet leidt tot langzame reflectie; boosheid leidt tot snelle reflectie; wroeging leidt tot een gematigd tempo van reflectie; en als er geen emotie wordt ontketend dan is reflectie niet waarschijnlijk.
Bovendien werd aangetoond dat een onzekere persoonlijkheid correleert met een hoge mate van reflectie zoals voorspeld. In het ontwerp van de tweede studie werd tegemoet gekomen aan de beperkingen van de eerste studie; echter de validiteit van de tweede studie is beperkt door het aantal deelnemers.
Belang van het onderzoek
Het concept van cognitieve weerstand levert een bijdrage aan de ontwerpleer en engineering, omdat het kennis oplevert over afwijkingen tussen mentale modellen en de werkelijkheid en bijdraagt aan ons begrip over onbewuste handelingen in het maken van ontwerpen. Het concept vertegenwoordigt een "echt" fysiologische en neurologisch proces, dat loopt van de waarneming van tegenstrijdige prikkels tot het feitelijk bewust zijn hiervan. De verbetering in gevoeligheid tijdens en na cognitieve weerstand is duidelijk zichtbaar in een zogenaamde Receiver Operating Characteristic curve.
Uit de resultaten van de studies blijkt dat een onzekere persoonlijkheid correleert met een lagere gevoeligheid voor cognitieve weerstand, waarmee een evenwichtiger beeld van de voordelen en nadelen van een onzekere persoonlijkheid ontstaat. Snelle reflectie wordt gezien als een voordeel in de dynamische en onzekere omstandigheden waaronder ontwerpers hun werk doen, zodat technische risico's voor anderen worden vermeden.
De bevindingen van deze studie dragen bij aan de ontwerpleer door een theoretische en empirische basis te leggen voor de studie naar de weerstand van mentale modellen en emoties. De definitie van een mentaal model is verfijnd, en is vergeleken met soortgelijke concepten in de literatuur. De wisselwerking tussen emoties en reflectie die is voorgesteld door Schön is gevalideerd. Deze studie draagt ook bij aan een beter begrip van eerdere uitkomsten van de vergelijking tussen emoties and ontwerpprestaties, door te suggereren dat de relatie hoogstens indirect is. De resultaten van het huidige onderzoek kunnen ook

244
gebruikt worden voor een beter begrip van de cognitieve processen die leiden tot te optimistische kostenprognoses. Ontwerpers en managers kunnen cognitieve weerstand bij zichzelf en anderen herkennen om daarmee het ontwerpproces te faciliteren en valkuilen te vermijden.
Automation surprise is een speciaal geval van cognitieve weerstand, waarbij een individu het gedrag van een complex systeem niet begrijpt en volhardt in onjuiste bediening. Dit fenomeen kan noodlottige consequenties hebben, en zal in de toekomst vaker voorkomen omdat de mate van automatisering in veel sociaaltechnische systemen toeneemt en de rol van de mens verschuift van bediener naar toezichthouder. Vooralsnog is er weinig bekend over het proces van Automation surprise en hoe het kan worden beëindigd, laat staan welke factoren het bevorderen of belemmeren. Met praktijkgericht onderzoek aan de Hogeschool van Amsterdam willen we in de toekomst hier verandering in brengen.
245
Acknowledgements
This undertaking would not have been accomplished without the support of many people. My guides throughout the last five years were Petra and Sicco. Petra, thank you for introducing me into the world of psychology, its conferences and papers, and supporting me in my endeavor to understand more of the way engineers work. Sicco, it was very inspiring to be coached by you in scientific research. And thank you for keeping me on track despite my keenness to stray into new territories. Thanks also to Agneta for the fruitful discussions that we had along the way.
Halfway through the project I was appointed at the Amsterdam University of Applied Sciences, an ideal environment in which to execute practical research. I would like to thank Gerard, Philip, Arjan, Monique and my fellow lectoren for their sincere support over the last few years in getting this job done. I look forward to advancing this line of research into more practical domains with you in the future.
Erwin, Roel, Hans, Marc and Bart: Thank you for your long lasting friendship and also for allowing the trial experiments to dominate much of our weekend in France. Gillian and Maartje helped with the preliminary experiments in Delft. The personality inventory was made possible through the kind co-operation of Annette Maij de Meij and Lolle Schakel of PiCompany. Michiel helped me out with much of the data analysis which really helped to speed things up. I would like to thank the host companies that made the experimental studies possible: ADSE and Fokker; and also the participants: Joanne, Zeng, Chen, Marta, Morten, Sonia, Jin, Basil, Amit, NC, Miguel, Koen, Blessing, JC, Imke, Laura, Tony, Siti, Evelien, Liuxin, Gunjan, Sanya, Isabelle, Julian, Qian, Wang, Minwen, Esteban, Porntawan, Karina, Wei, Geert, Winnie, Adi, Deian, ML, Diana, PH, Pieter, Bekir, Marcel, Ritzo, Sicco, Olga, Ann, Gaston, A, MW, Paul, Robbin, Gerhard, AM, Michiel, Herry, Jaap, Evert, Michel, Marco, Niek, Hildo, MFM, B, Lloyd, Cecile, Dedmer, Noël, Ioannis, Jeroen, Ton, Leonid, Pjotr, Khanh, Arjan, Gencay, Tom, Sjoerd, Steven, Chris, Ingmar, Linda, Xiaofeng, Hella and Brent.

246
There were some hard times, of course. Luckily Michiel, Gaston, Marijn, Johan, Maarten, Justus and Frank were always able to put things into perspective over a glass of beer. After all, it’s only a thesis. There are many more important things in the world - like football.
Mijn moeder heeft al in 1980 de basis gelegd voor deze mijlpaal, door in Australië mij en mijn broers (toen zeer tegen onze wil) te verplichten om Nederlands te leren. Daardoor is het ons alle drie gelukt om onze opleidingen op een uitstekende manier af te ronden. Mijn vader is bij het huidige onderzoek vanaf het begin tot het einde nauw betrokken geweest, als proefpersoon, proeflezer en paranimf. Epke en Ellen hebben steeds interesse getoond in mijn voortgang, en geaccepteerd dat ik vaak verstek liet gaan. Dank.
Floor, dank voor je enthousiasme om me met hand-en-spandiensten te helpen. Ik hoop dat ik je heb kunnen inspireren om straks een leuke studie te kiezen, misschien wel in Delft! Sander, Martijn en Philip, dank dat jullie (soms tandenknarsend) toegestaan hebben dat ik vaak aan het werk was, of te moe om me met jullie bezig te houden. Ik hoop het goed te maken! Katinka, woorden schieten te kort. Dank je wel dat ik de afgelopen jaren zo egoïstisch aan dit ‘verhaaltje’ mocht schrijven. Zonder jouw aanhoudende steun was het niet gelukt. Ik zie er naar uit om weer voor je te sprankelen en samen leuke dingen te gaan doen.
Finally, I feel a great gratitude for all those talented, friendly and rather stubborn engineers that inspired this research. Thank you all.
Needless to say, all errors are mine - or Seneca’s.
247
About the author
Robert J. de Boer (Vlaardingen, 1965) attended St. Leonard’s High School in Melbourne Australia (1977–1980), and graduated with a VWO diploma in nine subjects from Meander College in Zwolle (1980-1983). Robert was trained as an aerospace engineer at Delft University of Technology (1983-1988). He majored in man-machine systems and graduated cum laude on the thresholds of the vestibular organ.
Robert joined Unilever to focus on operational improvements in manufacturing as an (Assistant) Production Manager at several manufacturing sites. His initial experience with the effectiveness of teams was at Calvé Delft, where he initiated line performance teams. In 1995 he turned to consulting at A.T. Kearney. Four years later he transferred to Fokker Aerostructures (now Fokker Technologies). Here he was asked to develop the Program Management methodology in compliance with aerospace requirements as a prerequisite for Fokker to participate on the A380 program. The successful launch of the Fokker Program Management Guide led to the request to become Director of Engineering in 2002. In this role he supported and guided an increasing number of engineers (up to 300) occupied in a large number of new design projects across the globe.
Robert experimented with several team facilitations and interventions during the course of his work at Fokker, with varying (but increasing) success. These experiences have lead to his scientific interest in the effectiveness of teams and the relationship with emotions. Since early 2007 he has returned to consulting and training under the name of Blue Wave Consulting Company, combining this with research at the Delft University of Technology. In September 2009 he was also appointed as part-time lector80 Aviation Engineering at the Amsterdam University of Applied Sciences. His research interests there are in the field of human factors and safety, as well as lean implementations at maintenance companies and optimal use of sensor data. Robert is married, has four children and lives in Zeist (the Netherlands).
80 Formally translated as “professor” (Stichting Kennisontwikkeling HBO 2008)

248


