Embed Size (px)
Citation preview
Contents lists available at ScienceDirect
Mechanical Systems and Signal Processing
Mechanical Systems and Signal Processing 25 (2011) 630–643
0888-32
doi:10.1
n Corr
Aerospa
E-m
journal homepage: www.elsevier.com/locate/jnlabr/ymssp
Sensitivity of fundamental mode shape and static deflection fordamage identification in cantilever beams
Maosen Cao a,c, Lin Ye a,b,n, Limin Zhou a, Zhongqing Su a, Runbo Bai c
a Department of Mechanical Engineering, The Hong Kong Polytechnic University, Hung Hom, Kowloon, Hong Kong, People’s Republic of Chinab Laboratory of Smart Materials and Structures (LSMS), Centre for Advanced Materials Technology (CAMT), School of Aerospace, Mechanical and Mechatronic
Engineering, The University of Sydney, NSW2006, Australiac Department of Engineering Mechanics, College of Mechanics and Materials, Hohai University, Nanjing 210098, People’s Republic of China
a r t i c l e i n f o
Article history:
Received 12 November 2009
Received in revised form
17 June 2010
Accepted 28 June 2010Available online 3 July 2010
Keywords:
Fundamental mode shape
Static deflection
Crack modeling
Damage identification
Cantilever beams
70/$ - see front matter & 2010 Elsevier Ltd. A
016/j.ymssp.2010.06.011
esponding author at: Laboratory of Smart
ce, Mechanical and Mechatronic Engineering
ail address: [email protected] (L. Ye).
a b s t r a c t
Fundamental mode shape and static deflection are typical features frequently used for
identification of damage in beams. Regarding these features, an interesting question,
still pending, is which one is most sensitive for use in damage identification. The present
study addresses the key sensitivity of these features for damage identification in
cantilever beams, wherein these features are extremely similar in configurations. The
intrinsic relation between the fundamental mode shape and static deflection is
discussed, and in particular, an explicit generic sensitivity rule describing the sensitivity
of these features to damage in cantilever beams is proposed. The efficiency of this rule
in identifying damage is investigated using Euler–Bernoulli cantilever beams with a
crack. The validity of the approach is supported by three-dimensional elastic finite
element simulation, incorporating the potential scatter in actual measurements. The
results show that the generic sensitivity rule essentially provides a theoretical basis for
optimal use of these features for damage identification in cantilever beams.
& 2010 Elsevier Ltd. All rights reserved.
1. Introduction
Damage identification in beam-like structures has been a basic research topic in structural health monitoring for thelate decades [1]. Various algorithms have been derived for damage diagnosis in a cantilever beam [2,3]. In studies ofdamage identification in cantilever beams, fundamental mode shape is the most typical dynamic property [3,4–9]employed for damage localization and quantification. The extensive use of fundamental mode shape in damageidentification is, to a large extent, attributed to its good sensitivity, reliability and relative convenience in experimentalacquisition using a standard modal testing method. Although the higher mode shapes may theoretically be more sensitiveto small damage, difficulties in acquisition considerably decrease their practicability in damage diagnosis. Parallel tofundamental mode shape, static deflections including deflection under tip-concentrated loading and deflection underuniformly distributed loading are alternative simple properties [10–14] for damage identification in cantilever beams.Hereafter, for conciseness in statement, fundamental mode shape, deflection under tip-concentrated loading and deflectionunder uniformly distributed loading are symbolized as FMS, dtcl and dudl, respectively.
ll rights reserved.
Materials and Structures (LSMS), Centre for Advanced Materials Technology (CAMT), School of
, The University of Sydney, NSW2006, Australia. Tel.: +61 02 93514798; fax: +61 02 93517060.
M. Cao et al. / Mechanical Systems and Signal Processing 25 (2011) 630–643 631
For damage identification in cantilever beams based on FMS, dtcl or dudl, a key question behind the popular algorithms iswhich of these characteristic properties is most sensitive for use in damage identification in a cantilever beam. This issuepresents a challenge for the optimal uses of these properties for damage identification.
In this study, sensitivity analyses of FMS, dtcl and dudl for crack identification in cantilever beams are investigated, usinganalytical models in conjunction with a three-dimensional finite element method. A generic sensitivity rule characterizingthese features in cantilever beams is developed. The outcomes are beneficial for optimal selection of these features forcrack identification in cantilever beams.
2. Formulation
The free vibration of a cantilever beam with given initial displacement and velocity can be found by superposingcontributions from each mode as follows [15]:
yðx,tÞ ¼X1n ¼ 1
YnðxÞðAn cosontþBn sinontÞ ð1Þ
where on and Yn (in Appendix A) are the nth order natural frequency and mode shape, respectively, and coefficients An andBn are in the following form:
An ¼
R L0 y0ðxÞYnðxÞdxR L
0 Y2n ðxÞdx
, Bn ¼
R L0 v0ðxÞYnðxÞdxR L
0 Y2n ðxÞdx
ð2Þ
with y0 and v0 being initial displacement and velocity, respectively. As the discussion should be independent of the initialvelocity in this study, v0=0 with Bn=0 for all n [15] are adopted in the discussion.
Essentially, 9An9 or 9Bn9 quantitatively signifies the contribution of the nth mode shape Yn to displacement y. An index,RAn, can be established as follows:
RAn¼
9An9P1m ¼ 1
9Am9ð3Þ
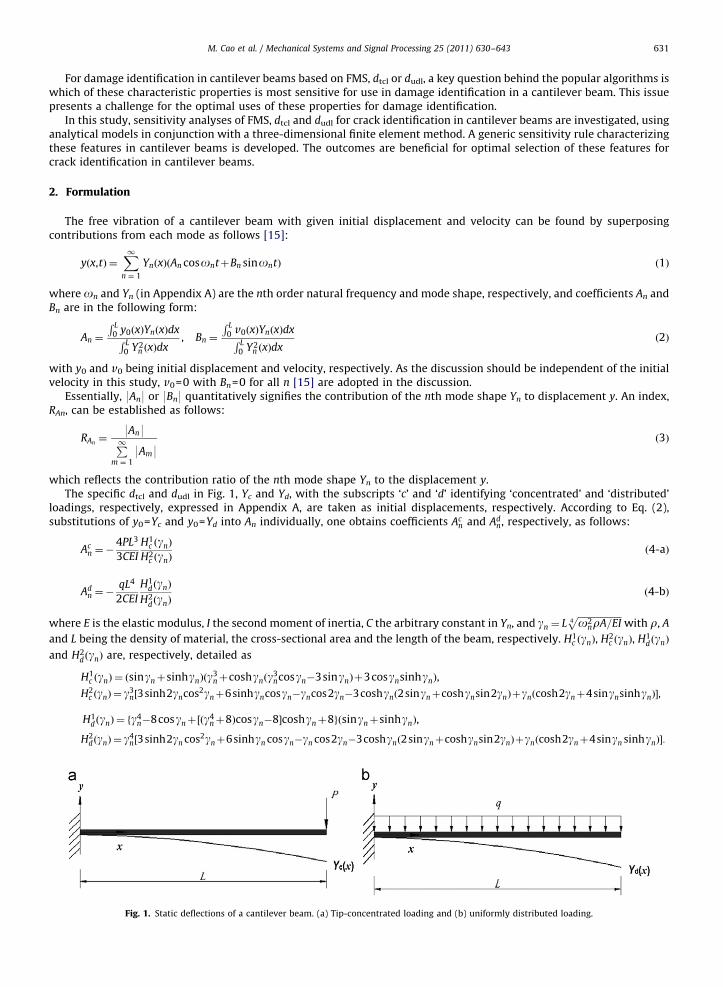
which reflects the contribution ratio of the nth mode shape Yn to the displacement y.The specific dtcl and dudl in Fig. 1, Yc and Yd, with the subscripts ‘c’ and ‘d’ identifying ‘concentrated’ and ‘distributed’
loadings, respectively, expressed in Appendix A, are taken as initial displacements, respectively. According to Eq. (2),substitutions of y0=Yc and y0=Yd into An individually, one obtains coefficients Ac
n and Adn, respectively, as follows:
Acn ¼�
4PL3
3CEI
H1c ðgnÞ
H2c ðgnÞ
ð4-aÞ
Adn ¼�
qL4
2CEI
H1dðgnÞ
H2dðgnÞ
ð4-bÞ
where E is the elastic modulus, I the second moment of inertia, C the arbitrary constant in Yn, and gn ¼ Lffiffiffiffiffiffiffiffiffiffiffiffiffiffiffiffiffiffiffio2
nrA=EI4p
with r, A
and L being the density of material, the cross-sectional area and the length of the beam, respectively. H1c ðgnÞ, H2
c ðgnÞ, H1dðgnÞ
and H2dðgnÞ are, respectively, detailed as
H1c ðgnÞ ¼ ðsingnþsinhgnÞðg3
nþcoshgnðg3ncosgn�3singnÞþ3cosgnsinhgnÞ,
H2c ðgnÞ ¼ g3
n½3sinh2gncos2gnþ6sinhgncosgn�gncos2gn�3coshgnð2singnþcoshgnsin2gnÞþgnðcosh2gnþ4singnsinhgnÞ�,
H1dðgnÞ ¼ fg4
n�8cosgnþ½ðg4nþ8Þcosgn�8�coshgnþ8gðsingnþsinhgnÞ,
H2d ðgnÞ ¼ g4
n½3sinh2gn cos2gnþ6sinhgn cosgn�gn cos2gn�3coshgnð2singnþcoshgnsin2gnÞþgnðcosh2gnþ4singn sinhgnÞ�:
Fig. 1. Static deflections of a cantilever beam. (a) Tip-concentrated loading and (b) uniformly distributed loading.
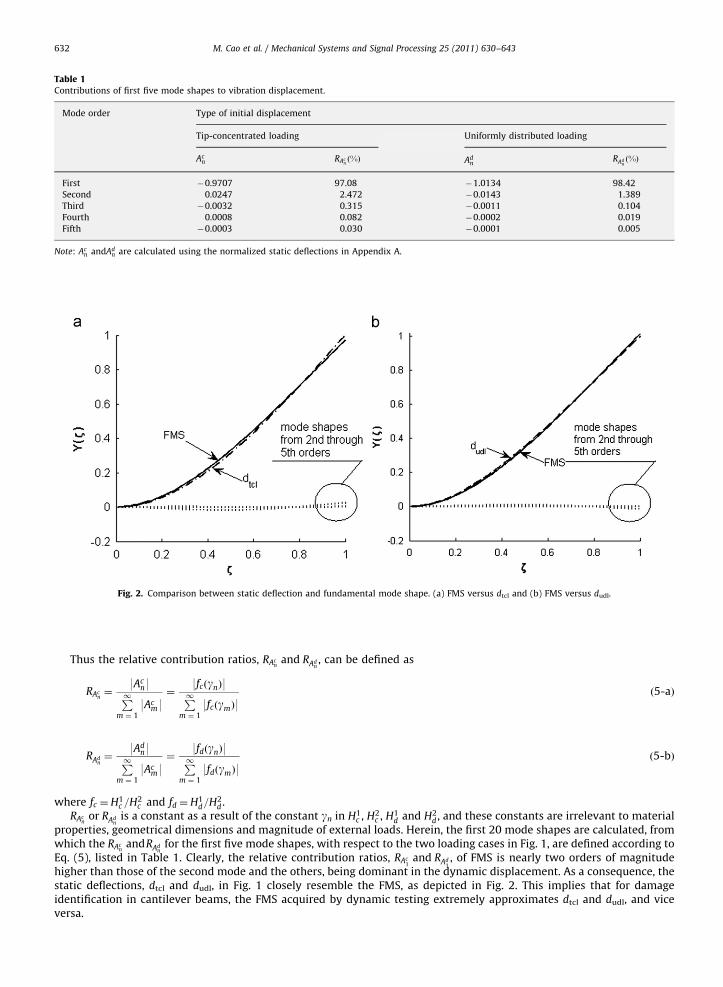
Table 1Contributions of first five mode shapes to vibration displacement.
Mode order Type of initial displacement
Tip-concentrated loading Uniformly distributed loading
Acn RAc
nð%Þ Ad
nRAd
nð%Þ
First �0.9707 97.08 �1.0134 98.42
Second 0.0247 2.472 �0.0143 1.389
Third �0.0032 0.315 �0.0011 0.104
Fourth 0.0008 0.082 �0.0002 0.019
Fifth �0.0003 0.030 �0.0001 0.005
Note: Acn andAd
n are calculated using the normalized static deflections in Appendix A.
Fig. 2. Comparison between static deflection and fundamental mode shape. (a) FMS versus dtcl and (b) FMS versus dudl.
M. Cao et al. / Mechanical Systems and Signal Processing 25 (2011) 630–643632
Thus the relative contribution ratios, RAcn
and RAdn, can be defined as
RAcn¼
9Acn9P1
m ¼ 1
9Acm9¼
9fcðgnÞ9P1m ¼ 1
9fcðgmÞ9ð5-aÞ
RAdn¼
9Adn9P1
m ¼ 1
9Acm9¼
9fdðgnÞ9P1m ¼ 1
9fdðgmÞ9ð5-bÞ
where fc ¼H1c =H2
c and fd ¼H1d=H2
d .RAc
nor RAd
nis a constant as a result of the constant gn in H1
c , H2c , H1
d and H2d , and these constants are irrelevant to material
properties, geometrical dimensions and magnitude of external loads. Herein, the first 20 mode shapes are calculated, fromwhich the RAc
nandRAd
nfor the first five mode shapes, with respect to the two loading cases in Fig. 1, are defined according to
Eq. (5), listed in Table 1. Clearly, the relative contribution ratios, RAc1
and RAd1, of FMS is nearly two orders of magnitude
higher than those of the second mode and the others, being dominant in the dynamic displacement. As a consequence, thestatic deflections, dtcl and dudl, in Fig. 1 closely resemble the FMS, as depicted in Fig. 2. This implies that for damageidentification in cantilever beams, the FMS acquired by dynamic testing extremely approximates dtcl and dudl, and viceversa.

M. Cao et al. / Mechanical Systems and Signal Processing 25 (2011) 630–643 633
3. Generic sensitivity
Curvature has often been used as a feature for effectively quantifying damage in beam-type structures [16]. Thecurvatures derived from dtcl, Yc, dudl, Yd and FMS, Y1 (in Appendix A), are
jYc¼
d2Yc
dx2¼
P
EIðx�LÞ ð6-aÞ
jYd¼
d2Yd
dx2¼�
q
2EIðL�xÞ2 ð6-bÞ
jY1¼
d2Y1
dx2¼ Cl2
1 �ðcosl1xþcoshl1xÞþ0:7341ðsinl1xþsinhl1xÞ� �
ð6-cÞ
In Eq. (6), P, q and C are the parameters that are responsible for a global magnitude of individual curvatures.Normalization of curvature magnitude is necessary for reflecting the sensitivity of the three deformation features todamage in a quantitatively comparable manner. The following normalized forms, YN
c , YNd and YN
1 , with beam tipdeformation being unity, Fig. 3(a), are used in the subsequent discussion:
YNc ¼
x2ð3L�xÞ
2L3ð7-aÞ
YNd ¼
x2ð6L2�4Lxþx2Þ
3L4ð7-bÞ
YN1 ¼
1
2ðcosl1x�coshl1xÞ�0:7341ðsinl1x�sinhl1xÞ� �
ð7-cÞ
The curvatures resulting from Eq. (7) for dtcl, dudl and FMS are expressed as follows and as shown in Fig. 3(b)
j�c ¼3ðL�xÞ
L3ð8-aÞ
j�d ¼4ðL�xÞ2
L4ð8-bÞ
j�1 ¼1
2l2
1 �ðcosl1xþcoshl1xÞþ0:7341ðsinl1xþsinhl1xÞ� �
ð8-cÞ
where the asterisk marks the derivation based on the normalized deformation.The points of intersection marked by K1, K2 and K3 in the curvature curves in Fig. 3(b) are obtained through solving
different combination of two simultaneous equations in Eq. (8):
xK1¼ 0:2058L, xK2
¼ 0:2500L, xK3¼ 0:2866L ð9Þ
Fig. 3. Normalized FMS, dtcl, and dudl (a) and their curvatures (b).
M. Cao et al. / Mechanical Systems and Signal Processing 25 (2011) 630–643634
Thus, the curvature of the beam is divided into four segments: 0oxoxK1, xK1
oxoxK2, xK2
oxoxK3and xK3
oxoL. Thesensitivity of the three deformation features with respect to damage is dependent on the segment. For example, for anarbitrary value of x within xK3
oxoL, we have
j�dðxÞoj�1ðxÞoj�c ðxÞ ð10Þ
Owning to the constitutive equation of the Euler–Bernoulli beam, M=EIj, the following relation is obtained viamultiplying each term in Eq. (10) by EI
M�dðxÞoM�1ðxÞoM�c ðxÞ ð11Þ
Assuming that a damage event occurs at location x=xt and it alters the local flexural stiffness from EI(xt) to EIðxtÞ ¼
ð1�KÞEIðxtÞwith 0oKo1, variations in curvature at the site of damage from the initial intact state are formulated as
Dj�dðxtÞ ¼M�dðxtÞ1
EIðxtÞ�
1
EIðxtÞ
� �¼M�dðxtÞ
K
ð1�KÞEIðxtÞð12-aÞ
Dj�1ðxtÞ ¼M�1ðxtÞ1
EIðxtÞ�
1
EIðxtÞ
� �¼M�1ðxtÞ
K
ð1�KÞEIðxtÞð12-bÞ
Dj�c ðxtÞ ¼M�c ðxtÞ1
EIðxtÞ�
1
EIðxtÞ
� �¼M�c ðxtÞ
K
ð1�KÞEIðxtÞð12-cÞ
where L/(1�L)EI(xt) is a constant.Based on Eqs. (11) and (12), variations in curvature at the site of damage from the initial intact state are obtained as the
following first inequality:
Dj�dðxtÞoDj�1ðxtÞoDj�c ðxtÞ, xK3oxtoL
Dj�c ðxtÞoDj�1ðxtÞoDj�dðxtÞ, 0oxtoxK1
Dj�c ðxtÞoDj�dðxtÞoDj�1ðxtÞ, xK1oxtoxK2
Dj�dðxtÞoDj�c ðxtÞoDj�1ðxtÞ, xK2oxtoxK3
ð13Þ
Then, the relations of the damage-induced variation in curvature to the other three segments can be elaborated usingthe rest of Eq. (13).
In Eq. (13), the magnitude of Dj quantitatively characterizes the sensitivity of the curvature to damage in a cantileverbeam with respect to each deformation feature. Thus, a generic sensitivity rule can be established as follows: for damagelocation xt 2 ð0 xK1
Þ, the degree of sensitivity to the crack for three deformation features is ranked with dudl first, FMSsecond and dtcl third; for xt 2 ðxK1
xK2Þ, FMS first, dudl second and dtcl third; for xt 2 ðxK2
xK3Þ, the ranking is in the order FMS,
dtcl and dudl; and for xt 2 ðxK3LÞ, dtcl has the greatest sensitivity, followed by FMS and dudl. Moreover, in the narrow interval
ðxK1¼ 0:2058L, xK3
¼ 0:2866LÞ, the sensitivity of the different features becomes less distinguishable.
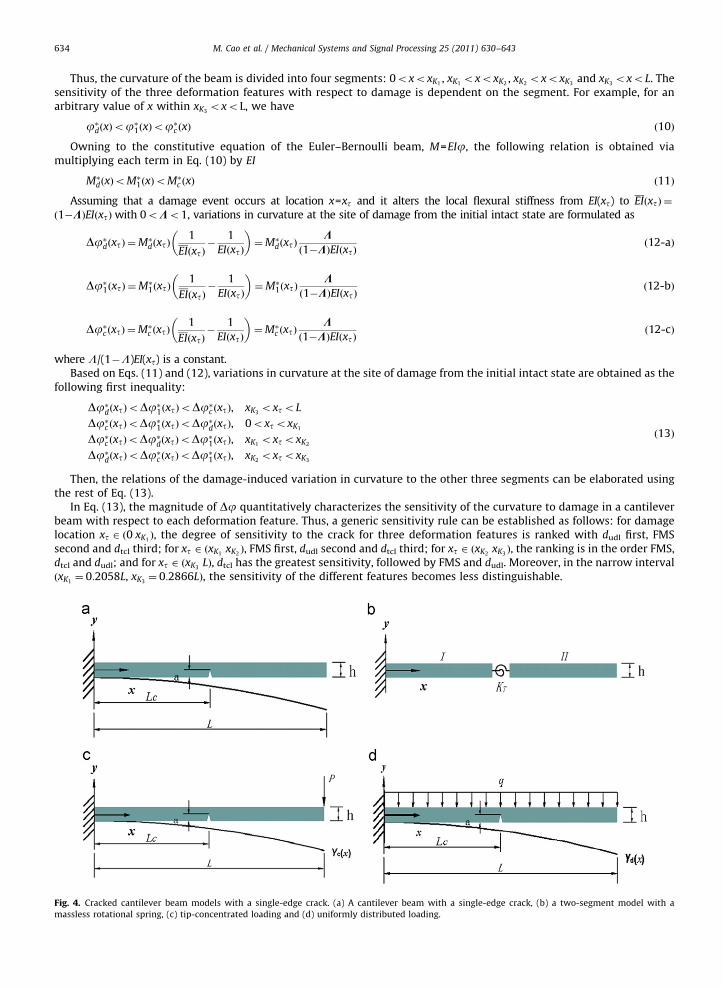
Fig. 4. Cracked cantilever beam models with a single-edge crack. (a) A cantilever beam with a single-edge crack, (b) a two-segment model with a
massless rotational spring, (c) tip-concentrated loading and (d) uniformly distributed loading.

M. Cao et al. / Mechanical Systems and Signal Processing 25 (2011) 630–643 635
4. A cracked beam model
A single-edge Mode I crack in a cantilever beam, as depicted in Fig. 4, is commonly evaluated as a massless rotationalspring [17–19] in analytical analysis of the beam. The equivalent stiffness of the rotational spring, KT, obtained from the crackstrain energy function and Castigliano’s theorem, can be expressed in the following form, as deduced in Appendix B:
KT ¼EIh
6pR a
0 af 2ða=hÞdað14Þ
where b and h are the width and height of the beam, a is the depth of the crack, and f(a/h) is the geometric function [20] givenas follows:
fa
h
� �¼
ffiffiffiffiffiffiffiffiffiffiffiffiffiffiffiffiffiffiffiffiffi2h
patan
pa
2h
r0:923þ0:199ð1�sin ðpa=2hÞÞ4
cosðpa=2hÞ
The presence of the crack is represented by an additional rotation, yn(Lc)=M(Lc)/KT with M(Lc)=EId2YI/(Lc)/dx2 at thecrack location (x=Lc), resulting in a discontinuity in the slope of the beam. The transition of slope is consequently expressedas [21]
dYIðLcÞ
dxþ
EI
KT
d2YIðLcÞ
dx2¼
dYIIðLcÞ
dxð15Þ
where YI and YII are the amplitudes of the flexural deformation of the beam segments I and II, respectively.
4.1. Dynamic response
Based on the Euler–Bernoulli beam theory, the governing equations of flexural vibration of beam segments I and II,Fig. 4(b), are expressed as
d4YI
dx4�l4
nYI ¼ 0; 0rxrLc ð16-aÞ
d4YII
dx4�l4
nYII ¼ 0; Lc rxrL ð16-bÞ
where ln ¼ffiffiffiffiffiffiffiffiffiffiffiffiffiffiffiffiffiffiffiffiffiffion
2rA=EI4p
The general solutions to Eq. (16) can be written as
Yni ðxÞ ¼ Bi,1 coslnxþBi,2 sinlnxþBi,3 coshlnxþBi,4 sinhlnx ði¼ I,IIÞ ð17Þ
where BI,j and BII,j with j=1,2,3,4 are constants to be determined from the boundary and continuity conditions.The boundary conditions at the clamped and free ends are specified as
YIð0Þ ¼ 0,dYIð0Þ
dx¼ 0,
d2YIIðLÞ
dx2¼ 0,
d3YIIðLÞ
dx3¼ 0 ð18Þ
Eq. (15) gives the compatibility in slope at the crack location; moreover, the continuity conditions of the displacement,bending moment and shear force are stated as
YIðLcÞ ¼ YIIðLcÞ,d2YIðLcÞ
dx2¼
d2YIIðLcÞ
dx2,
d3YIðLcÞ
dx3¼
d3YIIðLcÞ
dx3ð19Þ
An 8�8 matrix of coefficients for the eight constants (Bi,j, i=I, II and j=1,2,3,4) can be constructed from the generalsolution in conjunction with the boundary and continuity conditions (Eqs. (15), (18) and (19)). The associated set ofsimultaneous equations with respect to the eight constants will have nontrivial solutions only if the determinant of thecoefficients becomes zero. Expansion of the determinant leads to the frequency equation, from which the naturalfrequencies can be numerically determined. The natural frequencies prompt the solution of the constants in Eq. (17).
4.2. Static models
dtcl in Fig. 4(c) for the cracked cantilever beam is obtained from a particular bending equation EId4Yc/dx4=0 consideringthe boundary conditions
Yc;Ið0Þ ¼ 0, Yc;Iu ð0Þ ¼ 0, Yc;II00 ðLÞ ¼ 0, EIYc;IIu
00 ðLÞ ¼ P ð20Þ
with the prime denoting differentiation, and compatibility conditions including Eq. (15) with the shear effect neglected,and
Yc;IðLcÞ ¼ Yc;IIðLcÞ ð21Þ
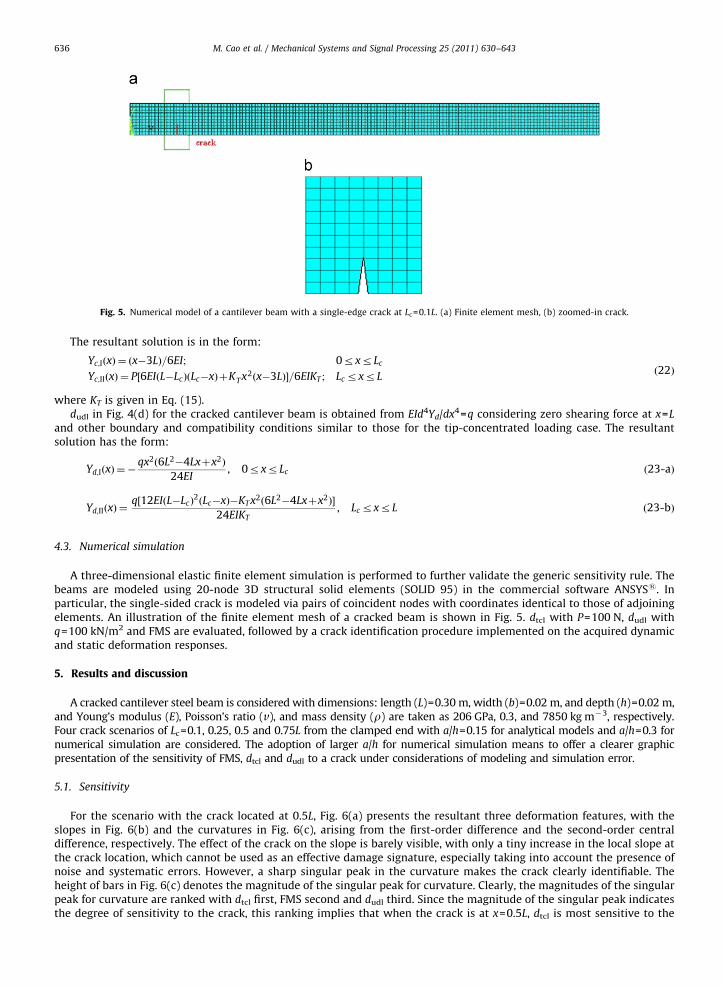
Fig. 5. Numerical model of a cantilever beam with a single-edge crack at Lc=0.1L. (a) Finite element mesh, (b) zoomed-in crack.
M. Cao et al. / Mechanical Systems and Signal Processing 25 (2011) 630–643636
The resultant solution is in the form:
Yc;IðxÞ ¼ ðx�3LÞ=6EI; 0rxrLc
Yc;IIðxÞ ¼ P½6EIðL�LcÞðLc�xÞþKT x2ðx�3LÞ�=6EIKT ; Lc rxrLð22Þ
where KT is given in Eq. (15).dudl in Fig. 4(d) for the cracked cantilever beam is obtained from EId4Yd/dx4=q considering zero shearing force at x=L
and other boundary and compatibility conditions similar to those for the tip-concentrated loading case. The resultantsolution has the form:
Yd;IðxÞ ¼ �qx2ð6L2�4Lxþx2Þ
24EI, 0rxrLc ð23-aÞ
Yd;IIðxÞ ¼q½12EIðL�LcÞ
2ðLc�xÞ�KT x2ð6L2�4Lxþx2Þ�
24EIKT, Lc rxrL ð23-bÞ
4.3. Numerical simulation
A three-dimensional elastic finite element simulation is performed to further validate the generic sensitivity rule. Thebeams are modeled using 20-node 3D structural solid elements (SOLID 95) in the commercial software ANSYSs. Inparticular, the single-sided crack is modeled via pairs of coincident nodes with coordinates identical to those of adjoiningelements. An illustration of the finite element mesh of a cracked beam is shown in Fig. 5. dtcl with P=100 N, dudl withq=100 kN/m2 and FMS are evaluated, followed by a crack identification procedure implemented on the acquired dynamicand static deformation responses.
5. Results and discussion
A cracked cantilever steel beam is considered with dimensions: length (L)=0.30 m, width (b)=0.02 m, and depth (h)=0.02 m,and Young’s modulus (E), Poisson’s ratio (v), and mass density (r) are taken as 206 GPa, 0.3, and 7850 kg m�3, respectively.Four crack scenarios of Lc=0.1, 0.25, 0.5 and 0.75L from the clamped end with a/h=0.15 for analytical models and a/h=0.3 fornumerical simulation are considered. The adoption of larger a/h for numerical simulation means to offer a clearer graphicpresentation of the sensitivity of FMS, dtcl and dudl to a crack under considerations of modeling and simulation error.
5.1. Sensitivity
For the scenario with the crack located at 0.5L, Fig. 6(a) presents the resultant three deformation features, with theslopes in Fig. 6(b) and the curvatures in Fig. 6(c), arising from the first-order difference and the second-order centraldifference, respectively. The effect of the crack on the slope is barely visible, with only a tiny increase in the local slope atthe crack location, which cannot be used as an effective damage signature, especially taking into account the presence ofnoise and systematic errors. However, a sharp singular peak in the curvature makes the crack clearly identifiable. Theheight of bars in Fig. 6(c) denotes the magnitude of the singular peak for curvature. Clearly, the magnitudes of the singularpeak for curvature are ranked with dtcl first, FMS second and dudl third. Since the magnitude of the singular peak indicatesthe degree of sensitivity to the crack, this ranking implies that when the crack is at x=0.5L, dtcl is most sensitive to the
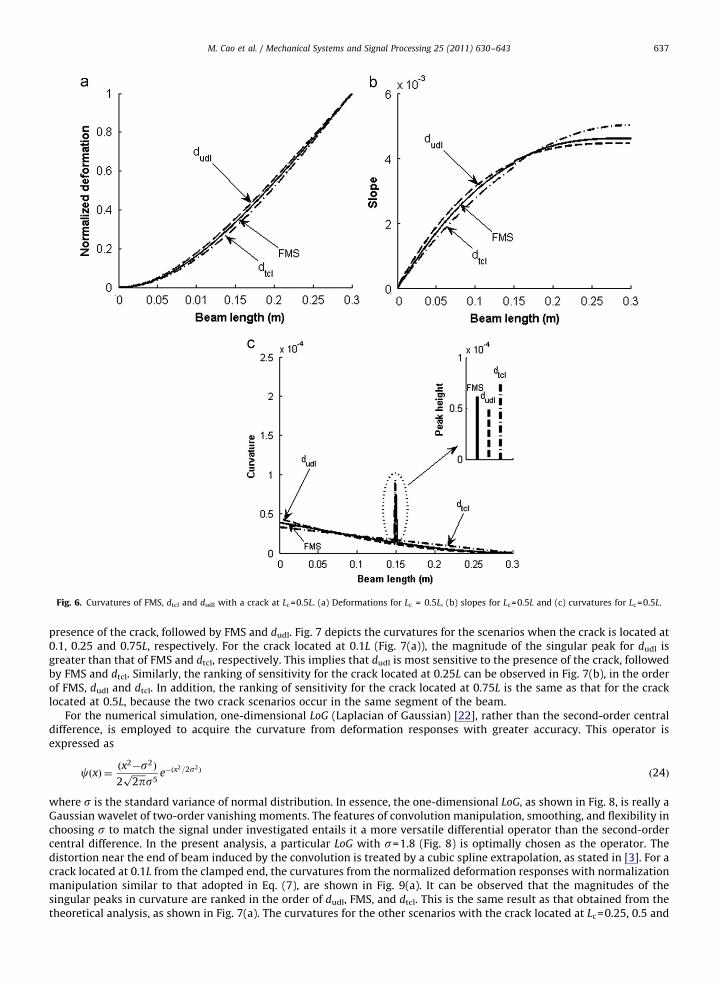
Fig. 6. Curvatures of FMS, dtcl and dudl with a crack at Lc=0.5L. (a) Deformations for Lc = 0.5L, (b) slopes for Lc=0.5L and (c) curvatures for Lc=0.5L.
M. Cao et al. / Mechanical Systems and Signal Processing 25 (2011) 630–643 637
presence of the crack, followed by FMS and dudl. Fig. 7 depicts the curvatures for the scenarios when the crack is located at0.1, 0.25 and 0.75L, respectively. For the crack located at 0.1L (Fig. 7(a)), the magnitude of the singular peak for dudl isgreater than that of FMS and dtcl, respectively. This implies that dudl is most sensitive to the presence of the crack, followedby FMS and dtcl. Similarly, the ranking of sensitivity for the crack located at 0.25L can be observed in Fig. 7(b), in the orderof FMS, dudl and dtcl. In addition, the ranking of sensitivity for the crack located at 0.75L is the same as that for the cracklocated at 0.5L, because the two crack scenarios occur in the same segment of the beam.
For the numerical simulation, one-dimensional LoG (Laplacian of Gaussian) [22], rather than the second-order centraldifference, is employed to acquire the curvature from deformation responses with greater accuracy. This operator isexpressed as
cðxÞ ¼ðx2�s2Þ
2ffiffiffiffiffiffi2pp
s5e�ðx
2=2s2Þ ð24Þ
where s is the standard variance of normal distribution. In essence, the one-dimensional LoG, as shown in Fig. 8, is really aGaussian wavelet of two-order vanishing moments. The features of convolution manipulation, smoothing, and flexibility inchoosing s to match the signal under investigated entails it a more versatile differential operator than the second-ordercentral difference. In the present analysis, a particular LoG with s=1.8 (Fig. 8) is optimally chosen as the operator. Thedistortion near the end of beam induced by the convolution is treated by a cubic spline extrapolation, as stated in [3]. For acrack located at 0.1L from the clamped end, the curvatures from the normalized deformation responses with normalizationmanipulation similar to that adopted in Eq. (7), are shown in Fig. 9(a). It can be observed that the magnitudes of thesingular peaks in curvature are ranked in the order of dudl, FMS, and dtcl. This is the same result as that obtained from thetheoretical analysis, as shown in Fig. 7(a). The curvatures for the other scenarios with the crack located at Lc=0.25, 0.5 and
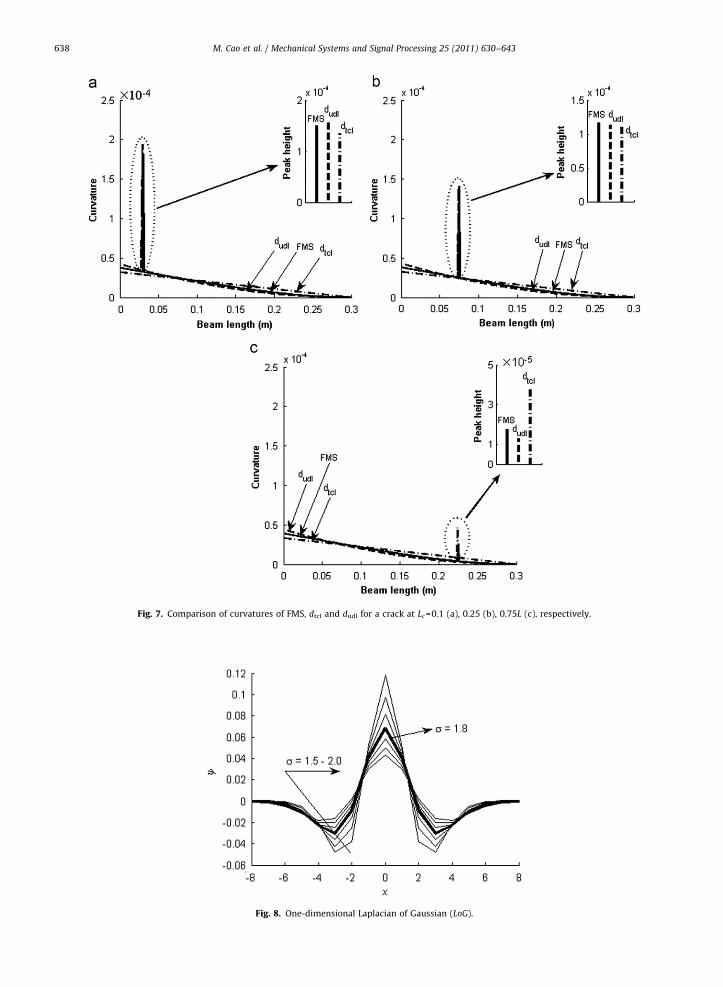
Fig. 7. Comparison of curvatures of FMS, dtcl and dudl for a crack at Lc=0.1 (a), 0.25 (b), 0.75L (c), respectively.
Fig. 8. One-dimensional Laplacian of Gaussian (LoG).
M. Cao et al. / Mechanical Systems and Signal Processing 25 (2011) 630–643638
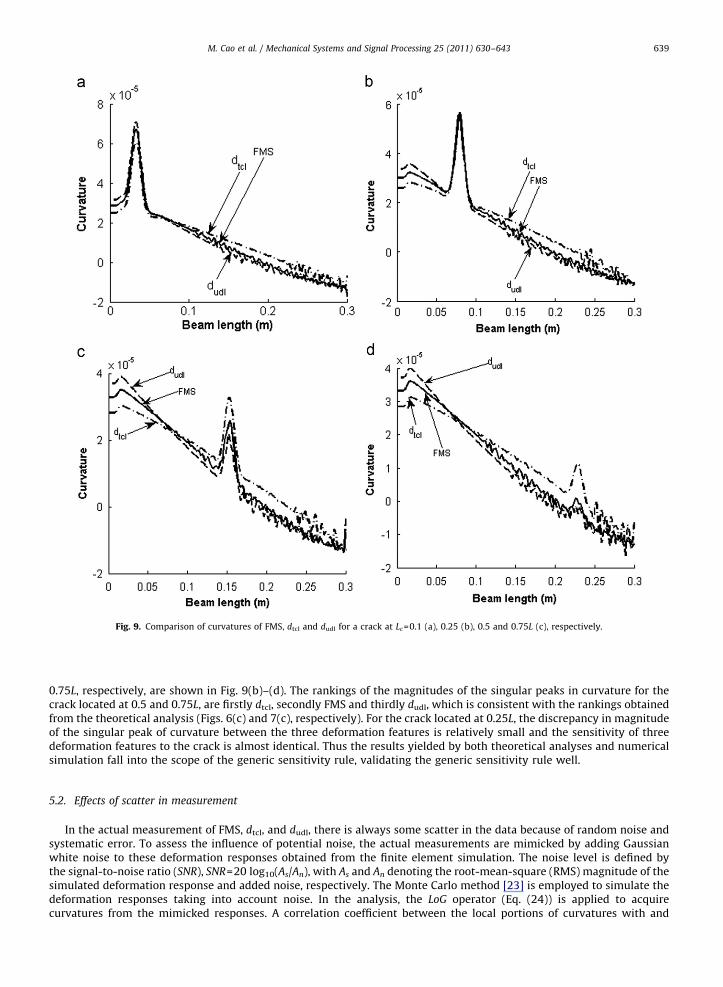
Fig. 9. Comparison of curvatures of FMS, dtcl and dudl for a crack at Lc=0.1 (a), 0.25 (b), 0.5 and 0.75L (c), respectively.
M. Cao et al. / Mechanical Systems and Signal Processing 25 (2011) 630–643 639
0.75L, respectively, are shown in Fig. 9(b)–(d). The rankings of the magnitudes of the singular peaks in curvature for thecrack located at 0.5 and 0.75L, are firstly dtcl, secondly FMS and thirdly dudl, which is consistent with the rankings obtainedfrom the theoretical analysis (Figs. 6(c) and 7(c), respectively). For the crack located at 0.25L, the discrepancy in magnitudeof the singular peak of curvature between the three deformation features is relatively small and the sensitivity of threedeformation features to the crack is almost identical. Thus the results yielded by both theoretical analyses and numericalsimulation fall into the scope of the generic sensitivity rule, validating the generic sensitivity rule well.
5.2. Effects of scatter in measurement
In the actual measurement of FMS, dtcl, and dudl, there is always some scatter in the data because of random noise andsystematic error. To assess the influence of potential noise, the actual measurements are mimicked by adding Gaussianwhite noise to these deformation responses obtained from the finite element simulation. The noise level is defined bythe signal-to-noise ratio (SNR), SNR=20 log10(As/An), with As and An denoting the root-mean-square (RMS) magnitude of thesimulated deformation response and added noise, respectively. The Monte Carlo method [23] is employed to simulate thedeformation responses taking into account noise. In the analysis, the LoG operator (Eq. (24)) is applied to acquirecurvatures from the mimicked responses. A correlation coefficient between the local portions of curvatures with and
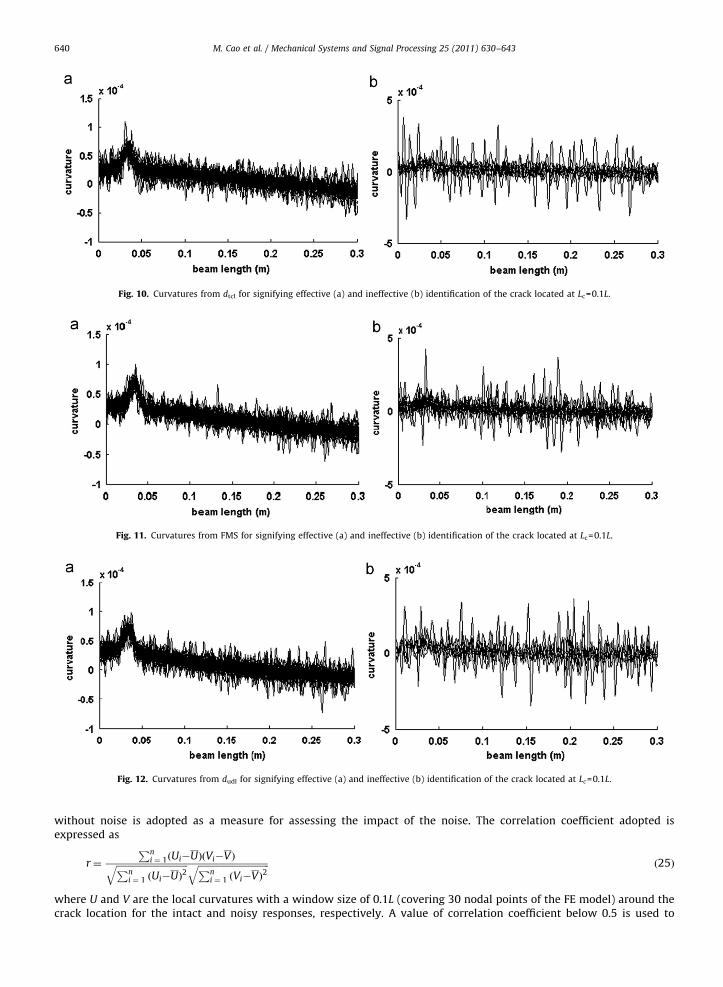
Fig. 10. Curvatures from dtcl for signifying effective (a) and ineffective (b) identification of the crack located at Lc=0.1L.
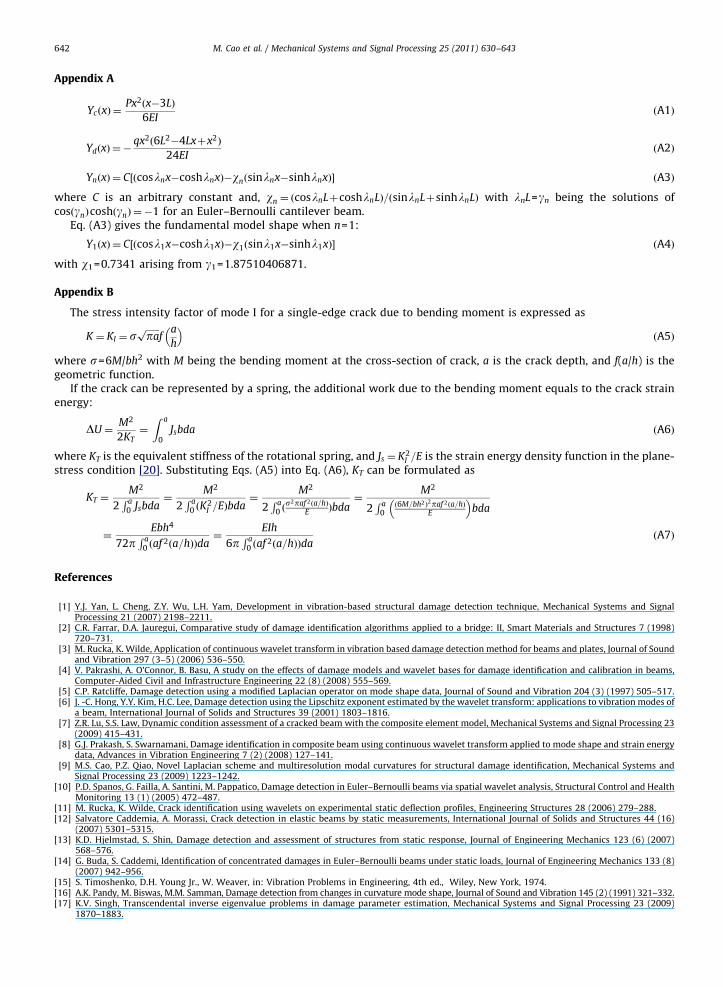
Fig. 12. Curvatures from dudl for signifying effective (a) and ineffective (b) identification of the crack located at Lc=0.1L.
Fig. 11. Curvatures from FMS for signifying effective (a) and ineffective (b) identification of the crack located at Lc=0.1L.
M. Cao et al. / Mechanical Systems and Signal Processing 25 (2011) 630–643640
without noise is adopted as a measure for assessing the impact of the noise. The correlation coefficient adopted isexpressed as
r¼
Pni ¼ 1ðUi�UÞðVi�VÞffiffiffiffiffiffiffiffiffiffiffiffiffiffiffiffiffiffiffiffiffiffiffiffiffiffiffiffiffiffiffiPn
i ¼ 1 ðUi�UÞ2q ffiffiffiffiffiffiffiffiffiffiffiffiffiffiffiffiffiffiffiffiffiffiffiffiffiffiffiffiffiffiffiPn
i ¼ 1 ðVi�VÞ2q ð25Þ
where U and V are the local curvatures with a window size of 0.1L (covering 30 nodal points of the FE model) around thecrack location for the intact and noisy responses, respectively. A value of correlation coefficient below 0.5 is used to
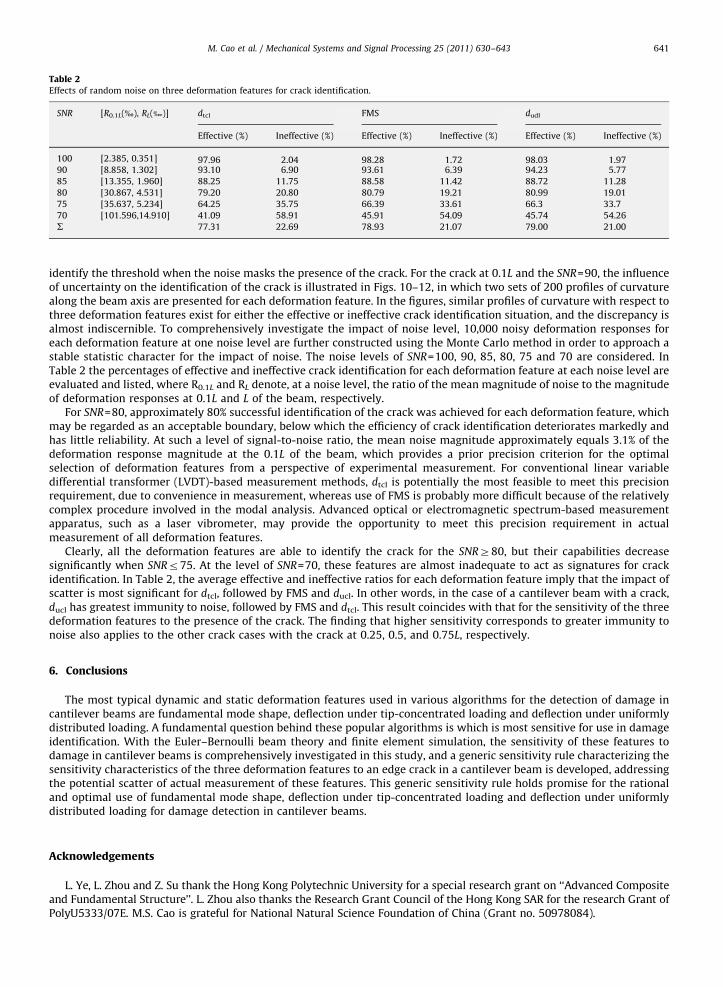
Table 2Effects of random noise on three deformation features for crack identification.
SNR [R0.1L(%), RL(n)] dtcl FMS dudl
Effective (%) Ineffective (%) Effective (%) Ineffective (%) Effective (%) Ineffective (%)
100 [2.385, 0.351] 97.96 2.04 98.28 1.72 98.03 1.9790 [8.858, 1.302] 93.10 6.90 93.61 6.39 94.23 5.77
85 [13.355, 1.960] 88.25 11.75 88.58 11.42 88.72 11.28
80 [30.867, 4.531] 79.20 20.80 80.79 19.21 80.99 19.01
75 [35.637, 5.234] 64.25 35.75 66.39 33.61 66.3 33.7
70 [101.596,14.910] 41.09 58.91 45.91 54.09 45.74 54.26
S 77.31 22.69 78.93 21.07 79.00 21.00
M. Cao et al. / Mechanical Systems and Signal Processing 25 (2011) 630–643 641
identify the threshold when the noise masks the presence of the crack. For the crack at 0.1L and the SNR=90, the influenceof uncertainty on the identification of the crack is illustrated in Figs. 10–12, in which two sets of 200 profiles of curvaturealong the beam axis are presented for each deformation feature. In the figures, similar profiles of curvature with respect tothree deformation features exist for either the effective or ineffective crack identification situation, and the discrepancy isalmost indiscernible. To comprehensively investigate the impact of noise level, 10,000 noisy deformation responses foreach deformation feature at one noise level are further constructed using the Monte Carlo method in order to approach astable statistic character for the impact of noise. The noise levels of SNR=100, 90, 85, 80, 75 and 70 are considered. InTable 2 the percentages of effective and ineffective crack identification for each deformation feature at each noise level areevaluated and listed, where R0.1L and RL denote, at a noise level, the ratio of the mean magnitude of noise to the magnitudeof deformation responses at 0.1L and L of the beam, respectively.
For SNR=80, approximately 80% successful identification of the crack was achieved for each deformation feature, whichmay be regarded as an acceptable boundary, below which the efficiency of crack identification deteriorates markedly andhas little reliability. At such a level of signal-to-noise ratio, the mean noise magnitude approximately equals 3.1% of thedeformation response magnitude at the 0.1L of the beam, which provides a prior precision criterion for the optimalselection of deformation features from a perspective of experimental measurement. For conventional linear variabledifferential transformer (LVDT)-based measurement methods, dtcl is potentially the most feasible to meet this precisionrequirement, due to convenience in measurement, whereas use of FMS is probably more difficult because of the relativelycomplex procedure involved in the modal analysis. Advanced optical or electromagnetic spectrum-based measurementapparatus, such as a laser vibrometer, may provide the opportunity to meet this precision requirement in actualmeasurement of all deformation features.
Clearly, all the deformation features are able to identify the crack for the SNRZ80, but their capabilities decreasesignificantly when SNRr75. At the level of SNR=70, these features are almost inadequate to act as signatures for crackidentification. In Table 2, the average effective and ineffective ratios for each deformation feature imply that the impact ofscatter is most significant for dtcl, followed by FMS and ducl. In other words, in the case of a cantilever beam with a crack,ducl has greatest immunity to noise, followed by FMS and dtcl. This result coincides with that for the sensitivity of the threedeformation features to the presence of the crack. The finding that higher sensitivity corresponds to greater immunity tonoise also applies to the other crack cases with the crack at 0.25, 0.5, and 0.75L, respectively.
6. Conclusions
The most typical dynamic and static deformation features used in various algorithms for the detection of damage incantilever beams are fundamental mode shape, deflection under tip-concentrated loading and deflection under uniformlydistributed loading. A fundamental question behind these popular algorithms is which is most sensitive for use in damageidentification. With the Euler–Bernoulli beam theory and finite element simulation, the sensitivity of these features todamage in cantilever beams is comprehensively investigated in this study, and a generic sensitivity rule characterizing thesensitivity characteristics of the three deformation features to an edge crack in a cantilever beam is developed, addressingthe potential scatter of actual measurement of these features. This generic sensitivity rule holds promise for the rationaland optimal use of fundamental mode shape, deflection under tip-concentrated loading and deflection under uniformlydistributed loading for damage detection in cantilever beams.
Acknowledgements
L. Ye, L. Zhou and Z. Su thank the Hong Kong Polytechnic University for a special research grant on ‘‘Advanced Compositeand Fundamental Structure’’. L. Zhou also thanks the Research Grant Council of the Hong Kong SAR for the research Grant ofPolyU5333/07E. M.S. Cao is grateful for National Natural Science Foundation of China (Grant no. 50978084).
M. Cao et al. / Mechanical Systems and Signal Processing 25 (2011) 630–643642
Appendix A
Yc xð Þ ¼Px2ðx�3LÞ
6EIðA1Þ
YdðxÞ ¼�qx2ð6L2�4Lxþx2Þ
24EIðA2Þ
YnðxÞ ¼ C½ðcoslnx�coshlnxÞ�wnðsinlnx�sinhlnxÞ� ðA3Þ
where C is an arbitrary constant and, wn ¼ ðcoslnLþcoshlnLÞ=ðsinlnLþsinhlnLÞ with lnL=gn being the solutions ofcosðgnÞcoshðgnÞ ¼ �1 for an Euler–Bernoulli cantilever beam.
Eq. (A3) gives the fundamental model shape when n=1:
Y1ðxÞ ¼ C½ðcosl1x�coshl1xÞ�w1ðsinl1x�sinhl1xÞ� ðA4Þ
with w1=0.7341 arising from g1=1.87510406871.
Appendix B
The stress intensity factor of mode I for a single-edge crack due to bending moment is expressed as
K ¼ KI ¼ sffiffiffiffiffiffipap
fa
h
� �ðA5Þ
where s=6M/bh2 with M being the bending moment at the cross-section of crack, a is the crack depth, and f(a/h) is thegeometric function.
If the crack can be represented by a spring, the additional work due to the bending moment equals to the crack strainenergy:
DU ¼M2
2KT¼
Z a
0Jsbda ðA6Þ
where KT is the equivalent stiffness of the rotational spring, and Js ¼ K2I =E is the strain energy density function in the plane-
stress condition [20]. Substituting Eqs. (A5) into Eq. (A6), KT can be formulated as
KT ¼M2
2R a
0 Jsbda¼
M2
2R a
0 ðK2I =EÞbda
¼M2
2R a
0 ðs2paf 2ða=hÞ
E Þbda¼
M2
2R a
0ð6M=bh2Þ
2paf 2ða=hÞE
� �bda
¼Ebh4
72pR a
0 ðaf 2ða=hÞÞda¼
EIh
6pR a
0 ðaf 2ða=hÞÞdaðA7Þ
References
[1] Y.J. Yan, L. Cheng, Z.Y. Wu, L.H. Yam, Development in vibration-based structural damage detection technique, Mechanical Systems and SignalProcessing 21 (2007) 2198–2211.
[2] C.R. Farrar, D.A. Jauregui, Comparative study of damage identification algorithms applied to a bridge: II, Smart Materials and Structures 7 (1998)720–731.
[3] M. Rucka, K. Wilde, Application of continuous wavelet transform in vibration based damage detection method for beams and plates, Journal of Soundand Vibration 297 (3–5) (2006) 536–550.
[4] V. Pakrashi, A. O’Connor, B. Basu, A study on the effects of damage models and wavelet bases for damage identification and calibration in beams,Computer-Aided Civil and Infrastructure Engineering 22 (8) (2008) 555–569.
[5] C.P. Ratcliffe, Damage detection using a modified Laplacian operator on mode shape data, Journal of Sound and Vibration 204 (3) (1997) 505–517.[6] J. -C. Hong, Y.Y. Kim, H.C. Lee, Damage detection using the Lipschitz exponent estimated by the wavelet transform: applications to vibration modes of
a beam, International Journal of Solids and Structures 39 (2001) 1803–1816.[7] Z.R. Lu, S.S. Law, Dynamic condition assessment of a cracked beam with the composite element model, Mechanical Systems and Signal Processing 23
(2009) 415–431.[8] G.J. Prakash, S. Swarnamani, Damage identification in composite beam using continuous wavelet transform applied to mode shape and strain energy
data, Advances in Vibration Engineering 7 (2) (2008) 127–141.[9] M.S. Cao, P.Z. Qiao, Novel Laplacian scheme and multiresolution modal curvatures for structural damage identification, Mechanical Systems and
Signal Processing 23 (2009) 1223–1242.[10] P.D. Spanos, G. Failla, A. Santini, M. Pappatico, Damage detection in Euler–Bernoulli beams via spatial wavelet analysis, Structural Control and Health
Monitoring 13 (1) (2005) 472–487.[11] M. Rucka, K. Wilde, Crack identification using wavelets on experimental static deflection profiles, Engineering Structures 28 (2006) 279–288.[12] Salvatore Caddemia, A. Morassi, Crack detection in elastic beams by static measurements, International Journal of Solids and Structures 44 (16)
(2007) 5301–5315.[13] K.D. Hjelmstad, S. Shin, Damage detection and assessment of structures from static response, Journal of Engineering Mechanics 123 (6) (2007)
568–576.[14] G. Buda, S. Caddemi, Identification of concentrated damages in Euler–Bernoulli beams under static loads, Journal of Engineering Mechanics 133 (8)
(2007) 942–956.[15] S. Timoshenko, D.H. Young Jr., W. Weaver, in: Vibration Problems in Engineering, 4th ed., Wiley, New York, 1974.[16] A.K. Pandy, M. Biswas, M.M. Samman, Damage detection from changes in curvature mode shape, Journal of Sound and Vibration 145 (2) (1991) 321–332.[17] K.V. Singh, Transcendental inverse eigenvalue problems in damage parameter estimation, Mechanical Systems and Signal Processing 23 (2009)
1870–1883.

M. Cao et al. / Mechanical Systems and Signal Processing 25 (2011) 630–643 643
[18] G. Gounaris, A. Dimarogonas, A finite element of a cracked prismatic beam for structural analysis, Computers & Structures 28 (3) (1988) 309–313.[19] Lee. Jinhee, Identification of multiple cracks in a beam using vibration amplitudes, Journal of Sound and Vibration 326 (2009) 205–212.[20] H. Tada, P. Paris, G. Irwin., in: The Stress Analysis of Cracks Handbook, 2nd Ed., Paris Production Inc., St. Louis, MI, USA, 1985.[21] W.M. Ostachowicz, M. Krawczuk, Analysis of the effect of cracks on the natural frequencies of a cantilever beam, Journal of Sound and Vibration 150
(2) (1991) 191–201.[22] S. Mallat, in: A Wavelet Tour of Signal Processing, Academic Press, USA, 1998.[23] Y. Xia, H. Hao, Statistical damage identification of structures with frequency changes, Journal of Sound and Vibration 263 (4) (2003) 853–870.


![SKSVR249 [Erect and Dismantle Basic Cantilever Scaffolds]](https://img.pdfslide.net/doc/110x75/6321487b537c10e838029552/sksvr249-erect-and-dismantle-basic-cantilever-scaffolds.jpg)


