Embed Size (px)
Citation preview

UITNODIGING
Voor het bijwonen van de openbare verdediging van het proefschrift van
Jeroen Hermanides
Measure for Measure
Consequences, Detection and Treatment
of Hyperglycaemia
Op vrijdag 4 juni 2010 om 14:00 in de Agnietenkapel,
Oudezijds Voorburgwal 231, Amsterdam
Receptie ter plaatse na afloop van de verdediging
Paranimfen
Bas van [email protected]
Wietse [email protected]
Jeroen HermanidesTugelaweg 139F
1091VX [email protected]
Measure for MeasureConsequences, Detection and Treatment
ofHyperglycaemia
Jeroen Hermanides“Pissing Evil”
That is how sir Thomas Willis in the 17th century described the high concentrations of glucose found in the urine of patients. The sweet urine described by dr. Willis was the result of pathologically elevated concentrations of glucose in the blood called hyperglycaemia. In those days, hyperglycaemia would eventually mean certain death. Since then we have come a long way, but are still left with questions on the consequences ofhyperglycaemia and how we best measure it in order to take the appropriate measures. In this thesis, several studies are presented that investigated the consequences, detection and treatment of hyperglycaemia.
Measure for M
easure
Jeroen Herm
anides

Measure for Measure
Consequences, Detection and Treatment of
Hyperglycaemia
Jeroen Hermanides

Author: Jeroen Hermanides
Cover: Design of a perpetuum mobile by Johann Joachim Becher, adapted
from Technica Curiosa (Casper Scott, 1664)
Printed by: Gildeprint Drukkerijen B.V.
ISBN/EAN 978-90-9025313-8
The printing of this thesis was financially supported by:
Abbott Diabetes Care, B. Braun Medical B.V., Bayer B.V., Boehringer Ingelheim
B.V., Eli Lilly Nederland B.V., GlaxoSmithKline, J.E. Jurriaanse Stichting,
Menarini Diagnostics Benelux, Merck Sharp & Dohme B.V., NovoNordisk B.V.,
sanofi-aventis Netherlands B.V., Stichting Amstol, Stichting Asklepios, and the
Universiteit van Amsterdam.
Copyright© 2010, J. Hermanides, Amsterdam, The Netherlands No part of this thesis may be reproduced, stored in a retrieval system or transmitted in any form or by any means, without prior written permission of the author

Measure for Measure
Consequences, Detection and Treatment of
Hyperglycaemia
Academisch proefschrift
ter verkrijging van de graad van doctor aan de Universiteit van Amsterdam op gezag van de Rector Magnificus
prof.dr. D.C. van den Boom ten overstaan van een door het college voor promoties
ingestelde commissie, in het openbaar te verdedigen in de Agnietenkapel op
vrijdag 4 juni 2010, te 14.00 uur
door
Jeroen Hermanides
Geboren te Amsterdam

PROMOTIECOMMISSIE
Promotor Prof.dr. J.B.L. Hoekstra
Co-promotor Dr. J.H. de Vries
Overige leden Prof.dr. H.R. Büller
Prof.dr. J.C. Pickup
Prof.dr. F.R. Rosendaal
Prof.dr. W.S. Schlack
Prof.dr. D.F. Zandstra
Faculteit der Geneeskunde
Financial support by the Netherlands Heart Foundation and the Dutch Diabetes
Research Foundation for the publication of this thesis is gratefully acknowledged.

TABLE OF CONTENTS
Chapter 1 Introduction 7
PART I Consequences of Hyperglycaemia
Chapter 2 Glucose: a prothrombotic factor? 15
Chapter 3 Venous thrombosis is associated with 31
hyperglycaemia at diagnosis: a case–control study
Chapter 4 Hip surgery sequentially induces stress 43
hyperglycaemia and activates coagulation
Chapter 5 Stress-induced hyperglycaemia and venous 53
thromboembolism following total hip or total knee
arthroplasty
Chapter 6 Early postoperative hyperglycaemia is associated with 67
postoperative complications after pancreatoduodenectomy
PART II Detection and Treatment of Hyperglycaemia
Chapter 7 Sense and nonsense in sensors 87
Chapter 8 Sensor augmented pump therapy 97
lowers HbA1c in suboptimally controlled
type 1 diabetes; a randomised controlled trial
Chapter 9 Sensor augmented insulin pump 117
therapy to treat hyperglycaemia at the
coronary care unit; a randomised clinical pilot trial
Chapter 10 No apparent local effect of insulin on microdialysis 133
continuous glucose-monitoring measurements.

Chapter 11 Algorithm to treat postprandial glycaemic 141
excursions using a closed-loop format: a pilot study
Chapter 12 Glucose variability is associated with ICU mortality 151
Chapter 13 Hypoglycaemia is associated with ICU mortality 165
Chapter 14 Mean glucose during ICU admission is 179
related to mortality by a U-shaped curve;
implications for clinical care
Chapter 15 Summary and future considerations 197
Samenvatting en toekomstperspectief 205
List of publications 213
Biografie 217
Co-authors 221
Dankwoord 225

Introduction
J Hermanides


1
2
3
4
5
6
7
8
9
10
11
12
13
14
15
„Pissing Evil‰
That is how sir Thomas Willis, the famous London physician, described the high
concentrations of glucose found in the urine of his patients.1 For this, the
underlying illness became known as „diabetes mellitus‰, translated as „flowing
sweetness‰. The sweet urine described by dr. Willis was the result of pathologically
elevated concentrations of glucose in the blood called hyperglycaemia. With no
treatment available at that time, patients with hyperglycaemia would eventually
face certain death. Nowadays in the Western world insulin and other glucose
lowering agents have become available to treat hyperglycaemia and life expectancy
of patients with diabetes continues to increase.2 However, patients with diabetes
mellitus type 1 still face intensive, bothersome and lifelong treatment, trying to
prevent complications.3;4 Recently the growing epidemic of diabetes mellitus type 2
has put this form of diabetes in the spotlight.5 Even more since morbidity and
mortality are worrying.6
In 2001 another form of hyperglycaemia drew everyoneÊs attention (at least in the
medical world) when Greet van den Berghe in Leuven showed that strict glycaemic
control in the Intensive Care Unit (ICU) reduced mortality by a relative 43%.7
Especially patients without known diabetes, but with transient hyperglycaemia
because of severe illness, benefitted from this intervention.8 This so-called „diabetes
of injury‰ or „stress-hyperglycaemia‰ turned out to be a risk factor for poor outcome
in a variety of acute- and severe illnesses.9;10
But what exactly is the harm of hyperglycaemia? It is known to cause micro-,
macrovascular and neural damage in longstanding diabetes.3;4;6 Another major
cause of morbidity and mortality is the influence of hyperglycaemia on the
coagulation system11, thereby causing arterial and venous thrombosis, leading to
stroke, myocardial infarction and pulmonary embolism. The consequences of stress
hyperglycaemia in different patient groups remain unclear. In general it is thought
to have its impact on the immune system, the endothelium and the coagulation
system.9 The exact effects seem to vary between patient groups and many research
questions remain unanswered. In PPART I of this thesis the effects of
hyperglycaemia on the coagulation system are investigated in venous thrombosis
and after orthopaedic surgery. CChapter 2 gives a review of the current evidence on
hyperglycaemia and thrombosis. The association between venous thrombosis and
hyperglycaemia is investigated in CChapter 3, whereas CChapter 4 and 5 study the
influence of orthopaedic surgery on glucose metabolism, coagulation activation and
����������
9

postoperative venous thrombosis. Furthermore, the consequences of
hyperglycaemia after pancreatoduodenectomy are studied in CChapter 6.
With developing technologies, new possibilities have become available to target
hyperglycaemia. After advancing from bulky insulin needles to the delicate pens
today, the development of the insulin pump made it possible to continuously
administer and adjust insulin administration.12 This flexible insulin dosing proved
beneficial in treating diabetes mellitus.13 Hereafter, new ways of measuring glucose
became available with the continuous glucose sensors. Instead of the snapshot
glucose values gained with fingerstick measurements, there was now a continuous
stream of data available.14 Only recently, these two devices have been combined in
one integrated sensor augmented insulin pump15, a major step towards the
development of a closed-loop system or artificial pancreas. Clearly, the detection
and treatment of hyperglycaemia is being modernised and provides a source for
interesting research questions in PPART II.
Chapter 7 comments on the development of the glucose sensors so far. In CChapter 8
the results of a randomised controlled trial investigating the efficacy of sensor
augmented pump therapy are presented. In CChapter 9 the application of sensor
augmented pump therapy in patients with acute myocardial infarction and
hyperglycaemia is studied. Also further steps towards the closed-loop system have
been studied and described by infusing insulin in the close proximity of
subcutaneous glucose sensors in CChapter 10 and the development of a closed-loop
algorithm in CChapter 11.
After the first Leuven study by Greet van den Berghe, following trials could not
reproduce her impressive results. Even more, the evidence from the recent NICE-
SUGAR study implies that strict glycaemic control in the ICU does more harm than
good.16 Whether or not strict glycaemic control in the ICU should be common
practice and what guidelines to follow is being heavily debated. Factors not yet
studied could be involved and explain the differences between the trials. We
therefore used a different approach in measuring hyperglycaemia, by taking
glucose variability into account, which is done in CChapter 12. A major side effect of
treating hyperglycaemia and important factor in interpreting study results is
hypoglycaemia. The consequence of hypoglycaemia in the ICU has been
investigated in CChapter 13. Finally, the implications for clinical care resulting from
our data and the Leuven and NICE-SUGAR trials are discussed in CChapter 14.
The title of this thesis refers to the Shakespeare play „Measure for Measure‰, which
means that every action is followed by a reaction or every upside has its downside.
As with ShakespeareÊs play, this thesis is about searching for „truths‰ and
�� ������
10

1
2
3
4
5
6
7
8
9
10
11
12
13
14
15
questioning methods of measuring as these will directly influence the measures
that are taken. The bad guy in this thesis is however not a harsh judge from
ancient Vienna named Angelo, but a pathological phenomenon called
hyperglycaemia.
����������
11
REFERENCES (1) Willis T. Pharmaceutice rationalis. 1679.
(2) Gale EA. How to survive diabetes. Diabetologia 2009; 52(4):559-567.
(3) The effect of intensive treatment of diabetes on the development and progression of long-term complications in insulin-dependent diabetes mellitus. The Diabetes Control and Complications Trial Research Group. N Engl J Med 1993; 329(14):977-986.
(4) Writing Team for the Diabetes Control and Complications Trial/Epidemiology of Diabetes Interventions and Complications Research Group. Sustained Effect of Intensive Treatment of Type 1 Diabetes Mellitus on Development and Progression of Diabetic Nephropathy: The Epidemiology of Diabetes Interventions and Complications (EDIC) Study. JAMA 2003; 290(16):2159-2167.
(5) Mokdad AH, Bowman BA, Ford ES, Vinicor F, Marks JS, Koplan JP. The Continuing Epidemics of Obesity and Diabetes in the United States. JAMA 2001; 286(10):1195-1200.
(6) Intensive blood-glucose control with sulphonylureas or insulin compared with conventional treatment and risk of complications in patients with type 2 diabetes (UKPDS 33). UK Prospective Diabetes Study (UKPDS) Group. Lancet 1998; 352(9131):837-853.
(7) Van den Berghe G, Wouters P, Weekers F, Verwaest C, Bruyninckx F, Schetz M et al. Intensive insulin therapy in the critically ill patients. N Engl J Med 2001; 345(19):1359-1367.
(8) Van den Berghe G, Wilmer A, Milants I, Wouters PJ, Bouckaert B, Bruyninckx F et al. Intensive insulin therapy in mixed medical/surgical intensive care units: benefit versus harm. Diabetes 2006; 55(11):3151-3159.
(9) Dungan KM, Braithwaite SS, Preiser JC. Stress hyperglycaemia. Lancet 2009; 373(9677):1798-1807.
(10) Vriesendorp TM, de Vries JH, Hoekstra JB. [Hyperglycaemia during hospitalisation]. Ned Tijdschr Geneeskd 2007; 151(23):1278-1282.
(11) Carr ME. Diabetes mellitus: a hypercoagulable state. J Diabetes Complications 2001; 15(1):44-54.
(12) Pickup JC, Keen H, Parsons JA, Alberti KG. Continuous subcutaneous insulin infusion: an approach to achieving normoglycaemia. Br Med J 1978; 1(6107):204-207.
(13) Retnakaran R, Hochman J, DeVries JH, Hanaire-Broutin H, Heine RJ, Melki V et al. Continuous Subcutaneous Insulin Infusion Versus Multiple Daily Injections: The impact of baseline A1c. Diabetes Care 2004; 27(11):2590-2596.
(14) Wentholt IM, Hoekstra JB, DeVries JH. Continuous glucose monitors: the long-awaited watch dogs? Diabetes Technol Ther 2007; 9(5):399-409.
(15) Mastrototaro JJ, Cooper KW, Soundararajan G, Sanders JB, Shah RV. Clinical experience with an integrated continuous glucose sensor/insulin pump platform: a feasibility study. Adv Ther 2006; 23(5):725-732.
(16) Finfer S, Chittock DR, Su SY, Blair D, Foster D, Dhingra V et al. Intensive versus conventional glucose control in critically ill patients. N Engl J Med 2009; 360(13):1283-1297.
�� ������
12

CONSEQUENCES OF HYPERGLYCAEMIA


Glucose: a prothrombotic factor?
J Hermanides, BA Lemkes, JH DeVries, F Holleman,
JCM Meijers and JBL Hoekstra
Submitted for publication

ABSTRACT
Evidence is mounting that both diabetes and stress induced hyperglycaemia
contribute to coagulation activation and hypofibrinolysis, resulting in a
procoagulant state that predisposes patients to thrombotic events. Hyperglycaemia
is often accompanied by hyperinsulinaemia and their combined effects may be even
stronger. In this review we discuss the current evidence regarding the role of
glucose as prothrombotic factor, not only in relation to diabetes, but also with
regard to acute hyperglycaemia. Furthermore, the effects of glucose lowering
therapies to prevent hypercoagulability are considered.
�������
16

1
2
3
4
5
6
7
8
9
10
11
12
13
14
15
INTRODUCTION
Patients with diabetes are notorious for their risk of vascular events. Apart from
the effects of diabetes and its prerequisite hyperglycaemia on the development of
atherosclerosis, this high risk may also be caused by the procoagulant state found
in diabetes.1;2
In recent years hyperglycaemia per se, even without overt diabetes, has gained
interest as a potential target to improve clinical outcomes in hospitalised patients
with acute illness.3 In this setting the effects of hyperglycaemia on the coagulation
system may be of greater importance than previously considered. Here we discuss
the current evidence regarding potentially harmful changes in the coagulation
system and subsequent risk of thrombotic disease, not only caused by diabetes but
also by acute hyperglycaemia.
CHRONIC HYPERGLYCAEMIA
Type 2 diabetes
Type 2 diabetes (DM2) is defined by hyperglycaemia, but often accompanied by
hyperinsulinaemia, dyslipidaemia, hypertension and obesity. Its effects on the
coagulation system can therefore not easily be attributed to either one of these
entities4, but the impact of glucose on coagulation in diabetes has been studied
extensively.
Markers of fibrinolysis and coagulation Both parameters of increased coagulability as well as a fibrinolytic impairment
have been found in DM2, although there are many different markers in the
circulation to measure these abnormalities. Platelet-dependent thrombin
generation, for instance, was measured in patients with poor glycaemic control,
good glycaemic control and healthy controls. In vitro induced thrombin generation
was found to be increased in platelet-rich plasma from diabetes patients compared
to healthy controls and a significant elevation of thrombin levels was also
demonstrated in plasma from poorly controlled DM2 when compared to well
controlled patients.5 In a placebo controlled trial using troglitazone combined with
diet modification a significant association was shown between improved glycaemic
control and blood thrombogenicity as reflected by a reduction in ex-vivo thrombus
formation in a Badimon perfusion chamber. Improved glycaemic control was the
only significant predictor of a decrease in blood thrombogenicity irrespective of
�� ��������������������������
17
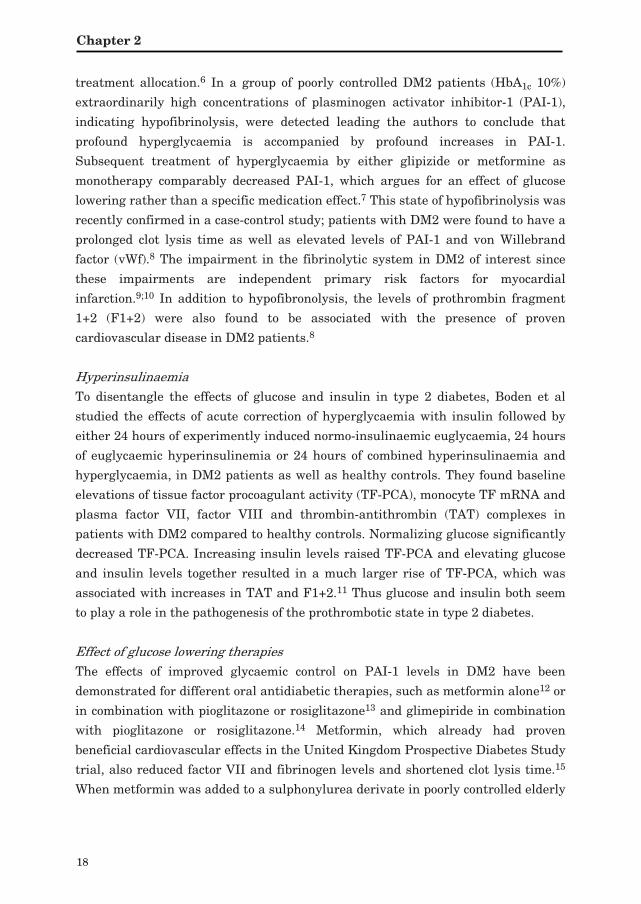
treatment allocation.6 In a group of poorly controlled DM2 patients (HbA1c 10%)
extraordinarily high concentrations of plasminogen activator inhibitor-1 (PAI-1),
indicating hypofibrinolysis, were detected leading the authors to conclude that
profound hyperglycaemia is accompanied by profound increases in PAI-1.
Subsequent treatment of hyperglycaemia by either glipizide or metformine as
monotherapy comparably decreased PAI-1, which argues for an effect of glucose
lowering rather than a specific medication effect.7 This state of hypofibrinolysis was
recently confirmed in a case-control study; patients with DM2 were found to have a
prolonged clot lysis time as well as elevated levels of PAI-1 and von Willebrand
factor (vWf).8 The impairment in the fibrinolytic system in DM2 of interest since
these impairments are independent primary risk factors for myocardial
infarction.9;10 In addition to hypofibronolysis, the levels of prothrombin fragment
1+2 (F1+2) were also found to be associated with the presence of proven
cardiovascular disease in DM2 patients.8
Hyperinsulinaemia To disentangle the effects of glucose and insulin in type 2 diabetes, Boden et al
studied the effects of acute correction of hyperglycaemia with insulin followed by
either 24 hours of experimently induced normo-insulinaemic euglycaemia, 24 hours
of euglycaemic hyperinsulinemia or 24 hours of combined hyperinsulinaemia and
hyperglycaemia, in DM2 patients as well as healthy controls. They found baseline
elevations of tissue factor procoagulant activity (TF-PCA), monocyte TF mRNA and
plasma factor VII, factor VIII and thrombin-antithrombin (TAT) complexes in
patients with DM2 compared to healthy controls. Normalizing glucose significantly
decreased TF-PCA. Increasing insulin levels raised TF-PCA and elevating glucose
and insulin levels together resulted in a much larger rise of TF-PCA, which was
associated with increases in TAT and F1+2.11 Thus glucose and insulin both seem
to play a role in the pathogenesis of the prothrombotic state in type 2 diabetes.
Effect of glucose lowering therapies The effects of improved glycaemic control on PAI-1 levels in DM2 have been
demonstrated for different oral antidiabetic therapies, such as metformin alone12 or
in combination with pioglitazone or rosiglitazone13 and glimepiride in combination
with pioglitazone or rosiglitazone.14 Metformin, which already had proven
beneficial cardiovascular effects in the United Kingdom Prospective Diabetes Study
trial, also reduced factor VII and fibrinogen levels and shortened clot lysis time.15
When metformin was added to a sulphonylurea derivate in poorly controlled elderly
�������
18

1
2
3
4
5
6
7
8
9
10
11
12
13
14
15
DM2 patients, the resulting substantial improvement in glycaemic control was
accompanied by beneficial changes in markers of platelet function (platelet factor 4
and beta-thromboglobulin), thrombin generation (fibrinopeptide A, F1+2, and D-
dimer) and fibrinolysis (PAI-1 activity and antigen).16
In the Diabetes Prevention Program, which studied the stages preceding diabetes,
i.e. impaired glucose tolerance, lifestyle interventions even more than metformin
treatment showed a modest, but significant, amelioration in fibrinogen levels.17
Data on the effects of insulin therapy on coagulation and fibrinolysis markers in
DM2 are scarce, and more conflicting than for the oral antidiabetic treatments.
Although some authors report beneficial effects of insulin18, others were unable to
find improvements with insulin therapy.19;20
Type 1 Diabetes
Markers of fibrinolysis and coagulation In type 1 diabetes (DM1) patients the specific contribution of hyperglycaemia to the
prothrombotic state is clearer as they lack the other risk factors which confound the
relationship in DM2 patients. In a long term follow up study, a highly significant
correlation was found between mean HbA1c in DM1 patients over the course of 18
years and impaired fibrinolysis as represented by elevated PAI-1 and decreased
tissue plasminogen activator (t-PA).21 In a smaller setting, eight DM1 patients on
continuous subcutaneous insulin infusion therapy were withheld treatment for the
duration of four hours which caused a rise of PAI-1 and plasma TF. Although the
authors conclude that early ketogenesis causes a prothrombotic change in DM1
patients, the effects of acute hyperglycaemia in this setting cannot be excluded.22
Platelet function tests, including aggregation and platelet adhesion tests, did not
improve with intensive glycaemic control in DM1. However, platelet function tests
are notoriously variable and the authors may not have included a sufficient number
of patients to overcome this disadvantage.23 Finally, despite the abundant evidence
of fibrinolytic impairment in diabetes, not all markers of fibrinolysis are abnormal.
Thrombin-activatable fibrinolysis inhibitor (TAFI) for instance, showed no
difference between patients with DM1 and healthy controls24 a finding which was
recently confirmed in DM2 patients.8
Diabetes and thrombosis
DM2 and, maybe to a lesser extent, DM1 are known for a high risk of developing
atherothrombotic events. This is at least partly explained by hyperglycaemia, given
�� ��������������������������
19

the continuous relationship between the development of cardiovascular disease and
glycaemic control, also in DM2.25 Moreover, intensive blood glucose control in the
early stages of the disease proved effective in lowering the long term incidence of
cardiovascular disease in both disease entities.26;27
Recently it has become clear that not only atherothrombotic events are seen more
often in patients with diabetes but that venous thromboembolism (VTE) is also
more frequent in this patient group. Movahed found an odds ratio (OR) of 1.27 (95%
CI 1.19 to 1.35) for the occurrence of pulmonary embolism in DM patients.28
Earlier, Tsai et al also found diabetes to be a risk factor for VTE with a hazard
ratio (HR) of 1.46 (95% CI 1.03 to 2.05), even after adjusting for BMI, a known
predictor of VTE.29 A recent meta-analysis on cardiovascular risk factors for VTE
showed DM to be an independent risk factor with an OR of 1.41 (95%CI 1.12 to
1.77).30 Although the effect of glucose lowering on VTE risk remains to be
established, the overrepresentation of both venous as well as atherothrombosis in
diabetes is highly suggestive of a prothrombotic effect of its main component,
hyperglycaemia, in addition to its more established effects on atherosclerosis.
ACUTE HYPERGLYCAEMIA
Apart from chronic hyperglycaemia, it is important to consider the role of acute
hyperglycaemia. Frequently, this is transient hyperglycaemia resulting from
metabolic deterioration during (severe) illness.31 Although this may result from
pre-existing and undiagnosed diabetes, 30-40% of patients with „stress-
hyperglycaemia‰ will revert to normoglycaemia with follow-up.32;33 Transient
hyperglycaemia will usually be accompanied by transient hyperinsulinaemia.
Markers of fibrinolysis and coagulation The effect of hyperglycaemia and hyperinsulinaemia on the coagulation system in
subjects without diabetes has been studied rather extensively. Already in 1988,
Ceriello showed that experimentally increased glucose levels activated the
coagulation system in non-diabetic subjects by increasing factor VII.34 Stegenga
and co-workers demonstrated in healthy volunteers that hyperglycaemia (12
mmol/l), irrespective of insulin levels, activates coagulation, marked by an increase
in TAT complexes and soluble tissue factor (sTF).35 In contrast, hyperinsulinaemia
inhibited fibrinolysis by increasing PAI-1 levels. This was even more profound
when systemic inflammation was induced.36 In vitro, studies with endothelial cells
from pig aortas exposed to increasing glucose concentrations indicated that PAI-1
�������
20
1
2
3
4
5
6
7
8
9
10
11
12
13
14
15
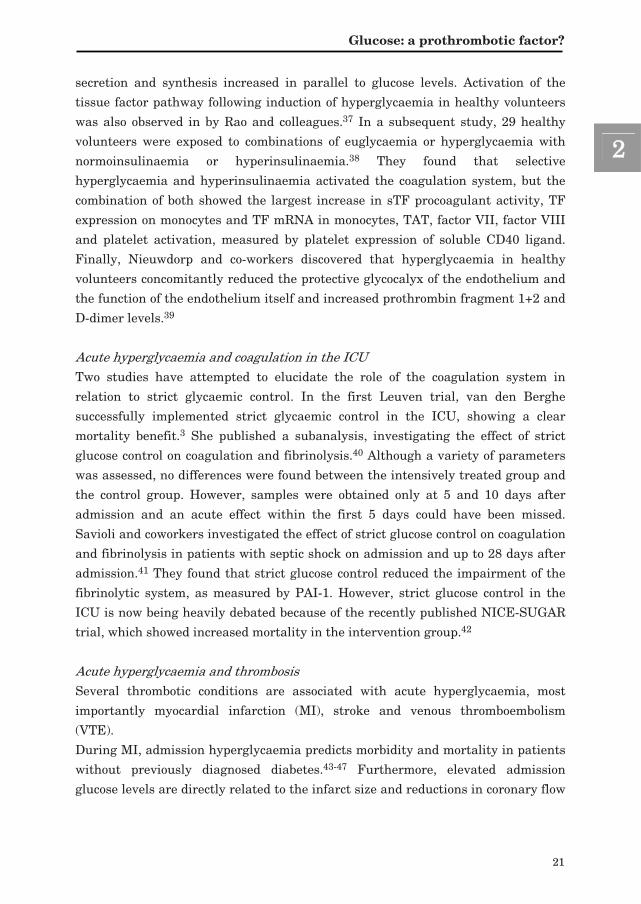
secretion and synthesis increased in parallel to glucose levels. Activation of the
tissue factor pathway following induction of hyperglycaemia in healthy volunteers
was also observed in by Rao and colleagues.37 In a subsequent study, 29 healthy
volunteers were exposed to combinations of euglycaemia or hyperglycaemia with
normoinsulinaemia or hyperinsulinaemia.38 They found that selective
hyperglycaemia and hyperinsulinaemia activated the coagulation system, but the
combination of both showed the largest increase in sTF procoagulant activity, TF
expression on monocytes and TF mRNA in monocytes, TAT, factor VII, factor VIII
and platelet activation, measured by platelet expression of soluble CD40 ligand.
Finally, Nieuwdorp and co-workers discovered that hyperglycaemia in healthy
volunteers concomitantly reduced the protective glycocalyx of the endothelium and
the function of the endothelium itself and increased prothrombin fragment 1+2 and
D-dimer levels.39
Acute hyperglycaemia and coagulation in the ICU Two studies have attempted to elucidate the role of the coagulation system in
relation to strict glycaemic control. In the first Leuven trial, van den Berghe
successfully implemented strict glycaemic control in the ICU, showing a clear
mortality benefit.3 She published a subanalysis, investigating the effect of strict
glucose control on coagulation and fibrinolysis.40 Although a variety of parameters
was assessed, no differences were found between the intensively treated group and
the control group. However, samples were obtained only at 5 and 10 days after
admission and an acute effect within the first 5 days could have been missed.
Savioli and coworkers investigated the effect of strict glucose control on coagulation
and fibrinolysis in patients with septic shock on admission and up to 28 days after
admission.41 They found that strict glucose control reduced the impairment of the
fibrinolytic system, as measured by PAI-1. However, strict glucose control in the
ICU is now being heavily debated because of the recently published NICE-SUGAR
trial, which showed increased mortality in the intervention group.42
Acute hyperglycaemia and thrombosis Several thrombotic conditions are associated with acute hyperglycaemia, most
importantly myocardial infarction (MI), stroke and venous thromboembolism
(VTE).
During MI, admission hyperglycaemia predicts morbidity and mortality in patients
without previously diagnosed diabetes.43-47 Furthermore, elevated admission
glucose levels are directly related to the infarct size and reductions in coronary flow
�� ��������������������������
21

after stent implantation in non-diabetic patients.48;49 This might be related to
intravascular thrombotic events. Patients with acute coronary syndrome and
admission glucose >7.0 mmol/l had elevated values of thrombin-antithrombin
complexes and platelets activation, measured by soluble CD40 ligand levels, as
compared to patients admitted with glucose <7.0 mmol/l.50 Also the fibrin clot lysis
time was impaired in hyperglycaemic subjects. In another study activation of
platelets, as measured by beta-thromboglobulin, was associated with
hyperglycaemia after MI, independent of pre-existing diabetes.51 In a rabbit model,
reducing hyperglycaemia using acarbose resulted in decreased infarct size.52
In stroke patients, admission hyperglycaemia was related to the infarct size53-55
and a strong predictor of post-stroke morbidity and mortality.56;57 Ribo and
colleagues showed that acute but not chronic hyperglycaemia during stroke was
associated with lower tissue-type plasminogen activator recanalization rates,
suggesting an impairment of the fibrinolytic system by hyperglycaemia.58
A few studies investigated the relation between venous thromboembolism (VTE)
and hyperglycaemia. Pre-surgery hyperglycaemia (>11.1 mmol/l) is associated with
an OR of 3.2 for pulmonary embolism after orthopaedic surgery.59 However, this
might reflect undiagnosed and uncontrolled diabetes. Recently, we published data
on glucose levels at presentation for suspected VTE and showed that higher glucose
levels at presentation are associated with actually having VTE, in a clear dose-
response fashion.60 During hip surgery, glucose levels rise in patients without
diabetes and this precedes a rise in factor VIII, vWF and F1+261, but whether this
is a causal relation needs further investigation.
Unfortunately, clinical trials in patients with MI and stroke have not been able to
reach their targets and trials aiming to prevent VTE are awaited. After proven
beneficial in patients with DM in the DIGAMI study, the value of glucose-insulin-
potassium (GIK) infusion on outcome after MI in patients without diabetes was
investigated, but no significant contrast in glucose control between the intervention
and control groups was achieved,62-65 The GIST-UK trial randomised stroke
patients to GIK infusion or saline infusion to investigate the effect of glucose
modulation with GIK. In this trial no clinical benefit was observed, however the
trial was underpowered and the glucose lowering effect of GIK was small and
patients were treated for only 24 hours.66
�������
22

1
2
3
4
5
6
7
8
9
10
11
12
13
14
15
POSSIBLE MECHANISMS
Many theories on how hyperglycaemia leads to hypercoagulability have already
been proposed and studied.67 First, on a cellular level, hyperglycaemia and also
hyperinsulinaemia increases the expression of PAI-1 on vascular smooth muscle
cells in vitro, thereby increasing its concentration and activity. As a result, the
activity of t-PA is reduced thereby decreasing the fibrinolytic potential.68 The
authors suggested that a direct effect of glucose and insulin on gene transcription
could be responsible. Indeed, hyperglycaemia in the presence of insulin increases
the activity of transcription factor nuclear factor kappa-B (NF-kB) in human
hepatocyte cells and the gene transcription of PAI-1 in vitro, which suggests that
PAI-1 transcription is increased via NF-kB.69 Because this effect disappeared when
an antioxidant was added to the medium, hyperglycaemia-induced oxidative stress
was hypothesised to be the major activator of NF-kB. Khechai and coworkers
studied the effect of advanced glycation end products (AGE) on TF expression in
human monocytes and concluded this AGE-induced TF expression at the mRNA
level, which could be diminished by adding antioxidants. The effect of AGEs on
coagulation activation was also seen when human umbilical vein endothelial cells
were exposed to AGEs70 and AGEs dose-dependently increased procoagulant
activity and TF levels. Withholding insulin in patients with DM1 increased TF and
PAI-1 levels, which was accompanied by a rise in malondialdehyde (MDA) and
protein carbonyl groups (PCG), both markers of oxidative stress.22
Next, hyperglycaemia directly influences the vulnerability of the vascular
endothelium by affecting the glycocalyx, a protective layer of proteoglycans
covering the vessel wall. This results in enhanced platelet-endothelial cell adhesion
and release of coagulation factors harboured within the endothelial glycocalyx.71
Finally, hyperglycaemia exerts its effects also extracellular by direct glycation of
proteins involved in coagulation. Verkleij et al. showed that glycated TAFI looses
its fibrinolytic properties in vitro, although this could not be reproduced in vivo.8
Fibrin clots from patients with diabetes type 2 are more dense as compared to
controls and displayed an altered structure, resulting in longer clot lysis time.72 In vivo glycaemic control was directly correlated to the clot density from the patients.
A likely explanation for this is the possible non-enzymatic glycation of fibrin.73 It is
conceivable that other coagulation proteins are also glycated, altering their activity.
Thus, multiple complex pathways are likely to be involved in the induction of
hypercoagulability by hyperglycaemia, and its effect is more profound in
combination with hyperinsulinaemia.
�� ��������������������������
23

SUMMARY
In summary, the evidence is compelling that both chronic and acute
hyperglycaemia contribute to coagulation activation and hypofibrinolysis, resulting
in a procoagulant state that predisposes patients to thrombotic events (Figure 1).
What is more, hyperglycaemia is often accompanied by hyperinsulinaemia and
their combined effects may result in an even stronger hypercoagulable state.
Although we separately discussed the effects of chronic and acute hyperglycaemia
on coagulation, the current evidence gives no reason to assume that the underlying
mechanisms differ.
Intensive glycaemic control in patients with diabetes reduces the incidence of
thrombotic diseases such as myocardial infarction and stroke in the long run.
Whether intensive glucose control during acute hyperglycaemia during acute MI,
stroke and VTE could prevent hypercoagulability and thereby improve outcome
awaits further investigation in randomised controlled trials.
�������
24

1
2
3
4
5
6
7
8
9
10
11
12
13
14
15
Figure 1- A simplified impression of the relations between hyperglycaemia, hyperinsulinaemia and coagulation, leading to clinical outcome.
�� ��������������������������
25

REFERENCES
(1) Carr ME. Diabetes mellitus: a hypercoagulable state. J Diabetes Complications 2001; 15(1):44-54.
(2) Grant PJ. Diabetes mellitus as a prothrombotic condition. J Intern Med 2007; 262(2):157-172.
(3) Van den Berghe G, Wouters P, Weekers F, Verwaest C, Bruyninckx F, Schetz M et al. Intensive insulin therapy in the critically ill patients. N Engl J Med 2001; 345(19):1359-1367.
(4) Nieuwdorp M, Stroes ES, Meijers JC, Buller H. Hypercoagulability in the metabolic syndrome. Curr Opin Pharmacol 2005; 5(2):155-159.
(5) Aoki I, Shimoyama K, Aoki N, Homori M, Yanagisawa A, Nakahara K et al. Platelet-dependent thrombin generation in patients with diabetes mellitus: effects of glycemic control on coagulability in diabetes. J Am Coll Cardiol 1996; 27(3):560-566.
(6) Osende JI, Badimon JJ, Fuster V, Herson P, Rabito P, Vidhun R et al. Blood thrombogenicity in type 2 diabetes mellitus patients is associated with glycemic control. J Am Coll Cardiol 2001; 38(5):1307-1312.
(7) Cefalu WT, Schneider DJ, Carlson HE, Migdal P, Gan LL, Izon MP et al. Effect of combination glipizide GITS/metformin on fibrinolytic and metabolic parameters in poorly controlled type 2 diabetic subjects. Diabetes Care 2002; 25(12):2123-2128.
(8) Verkleij CJN, Gerdes VEA, de Bruijn R, Meijers JCM, Marx PF. The hemostatic system in patients with type 2 diabetes with and without cardiovascular disease. J Thromb Haemostas 2009; 7 (Suppl 2):PP-WE-336.
(9) Meltzer ME, Doggen CJ, de Groot PG, Rosendaal FR, Lisman T. Reduced plasma fibrinolytic capacity as a potential risk factor for a first myocardial infarction in young men. Br J Haematol 2009; 145(1):121-127.
(10) Thogersen AM, Jansson JH, Boman K, Nilsson TK, Weinehall L, Huhtasaari F et al. High plasminogen activator inhibitor and tissue plasminogen activator levels in plasma precede a first acute myocardial infarction in both men and women: evidence for the fibrinolytic system as an independent primary risk factor. Circulation 1998; 98(21):2241-2247.
(11) Boden G, Vaidyula VR, Homko C, Cheung P, Rao AK. Circulating tissue factor procoagulant activity and thrombin generation in patients with type 2 diabetes: effects of insulin and glucose. J Clin Endocrinol Metab 2007; 92(11):4352-4358.
(12) Fontbonne A, Charles MA, Juhan-Vague I, Bard JM, Andre P, Isnard F et al. The effect of metformin on the metabolic abnormalities associated with upper-body fat distribution. BIGPRO Study Group. Diabetes Care 1996; 19(9):920-926.
(13) Derosa G, Dangelo A, Ragonesi PD, Ciccarelli L, Piccinni MN, Pricolo F et al. Effects of rosiglitazone and pioglitazone combined with metformin on the prothrombotic state of patients with type 2 diabetes mellitus and metabolic syndrome. J Int Med Res 2006; 34(5):545-555.
(14) Derosa G, Cicero AF, Gaddi A, Ragonesi PD, Piccinni MN, Fogari E et al. A comparison of the effects of pioglitazone and rosiglitazone combined with glimepiride on prothrombotic state in type 2 diabetic patients with the metabolic syndrome. Diabetes Res Clin Pract 2005; 69(1):5-13.
(15) Grant PJ. Beneficial effects of metformin on haemostasis and vascular function in man. Diabetes Metab 2003; 29(4 Pt 2):6S44-6S52.
(16) Gregorio F, Ambrosi F, Manfrini S, Velussi M, Carle F, Testa R et al. Poorly controlled elderly Type 2 diabetic patients: the effects of increasing sulphonylurea dosages or adding metformin. Diabet Med 1999; 16(12):1016-1024.
�������
26
1
2
3
4
5
6
7
8
9
10
11
12
13
14
15
(17) Haffner S, Temprosa M, Crandall J, Fowler S, Goldberg R, Horton E et al. Intensive lifestyle intervention or metformin on inflammation and coagulation in participants with impaired glucose tolerance. Diabetes 2005; 54(5):1566-1572.
(18) Aso Y, Okumura KI, Yoshida N, Tayama K, Takemura Y, Inukai T. Enhancement of fibrinolysis in poorly controlled, hospitalized type 2 diabetic patients by short-term metabolic control: association with a decrease in plasminogen activator inhibitor 1. Exp Clin Endocrinol Diabetes 2004; 112(4):175-180.
(19) Fonseca VA, Reynolds T, Hemphill D, Randolph C, Wall J, Valiquet TR et al. Effect of troglitazone on fibrinolysis and activated coagulation in patients with non-insulin-dependent diabetes mellitus. J Diabetes Complications 1998; 12(4):181-186.
(20) Knobl P, Schernthaner G, Schnack C, Pietschmann P, Proidl S, Prager R et al. Haemostatic abnormalities persist despite glycaemic improvement by insulin therapy in lean type 2 diabetic patients. Thromb Haemost 1994; 71(6):692-697.
(21) Seljeflot I, Larsen JR, hl-Jorgensen K, Hanssen KF, Arnesen H. Fibrinolytic activity is highly influenced by long-term glycemic control in Type 1 diabetic patients. J Thromb Haemost 2006; 4(3):686-688.
(22) Iorio A, Federici MO, Mourvaki E, Ferolla P, Piroddi M, Stabile A et al. Impaired endothelial antithrombotic activity following short-term interruption of continuous subcutaneous insulin infusion in type 1 diabetic patients. Thromb Haemost 2007; 98(3):635-641.
(23) Roshan B, Tofler GH, Weinrauch LA, Gleason RE, Keough JA, Lipinska I et al. Improved glycemic control and platelet function abnormalities in diabetic patients with microvascular disease. Metabolism 2000; 49(1):88-91.
(24) Harmanci A, Kandemir N, Dagdelen S, Gonc N, Buyukasik Y, Alikasifoglu A et al. Thrombin-activatable fibrinolysis inhibitor activity and global fibrinolytic capacity in Type 1 diabetes: evidence for normal fibrinolytic state. J Diabetes Complications 2006; 20(1):40-44.
(25) Khaw KT, Wareham N, Bingham S, Luben R, Welch A, Day N. Association of hemoglobin A1c with cardiovascular disease and mortality in adults: the European prospective investigation into cancer in Norfolk. Ann Intern Med 2004; 141(6):413-420.
(26) Holman RR, Paul SK, Bethel MA, Matthews DR, Neil HA. 10-year follow-up of intensive glucose control in type 2 diabetes. N Engl J Med 2008; 359(15):1577-1589.
(27) Nathan DM, Cleary PA, Backlund JY, Genuth SM, Lachin JM, Orchard TJ et al. Intensive diabetes treatment and cardiovascular disease in patients with type 1 diabetes. N Engl J Med 2005; 353(25):2643-2653.
(28) Movahed MR, Hashemzadeh M, Jamal MM. The prevalence of pulmonary embolism and pulmonary hypertension in patients with type II diabetes mellitus. Chest 2005; 128(5):3568-3571.
(29) Tsai AW, Cushman M, Rosamond WD, Heckbert SR, Polak JF, Folsom AR. Cardiovascular Risk Factors and Venous Thromboembolism Incidence: The Longitudinal Investigation of Thromboembolism Etiology. Arch Intern Med 2002; 162(10):1182-1189.
(30) Ageno W, Becattini C, Brighton T, Selby R, Kamphuisen PW. Cardiovascular Risk Factors and Venous Thromboembolism: A Meta-Analysis. Circulation 2008; 117(1):93-102.
(31) Dungan KM, Braithwaite SS, Preiser JC. Stress hyperglycaemia. The Lancet 373(9677):1798-1807.
(32) Greci LS, Kailasam M, Malkani S, Katz DL, Hulinsky I, Ahmadi R et al. Utility of HbA(1c) levels for diabetes case finding in hospitalized patients with hyperglycemia. Diabetes Care 2003; 26(4):1064-1068.
(33) Ishihara M, Inoue I, Kawagoe T, Shimatani Y, Kurisu S, Hata T et al. Is admission hyperglycaemia in non-diabetic patients with acute myocardial infarction a surrogate for previously undiagnosed abnormal glucose tolerance? Eur Heart J 2006; 27(20):2413-2419.
�� ��������������������������
27

(34) Ceriello A, Giugliano D, Quatraro A, Dello RP, Torella R. Blood glucose may condition factor VII levels in diabetic and normal subjects. Diabetologia 1988; 31(12):889-891.
(35) Stegenga ME, van der Crabben SN, Blumer RM, Levi M, Meijers JC, Serlie MJ et al. Hyperglycemia enhances coagulation and reduces neutrophil degranulation, whereas hyperinsulinemia inhibits fibrinolysis during human endotoxemia. Blood 2008; 112(1):82-89.
(36) Stegenga ME, van der Crabben SN, Dessing MC, Pater JM, van den Pangaart PS, de Vos AF et al. Effect of acute hyperglycaemia and/or hyperinsulinaemia on proinflammatory gene expression, cytokine production and neutrophil function in humans. Diabet Med 2008; 25(2):157-164.
(37) Rao AK, Chouhan V, Chen X, Sun L, Boden G. Activation of the tissue factor pathway of blood coagulation during prolonged hyperglycemia in young healthy men. Diabetes 1999; 48(5):1156-1161.
(38) Vaidyula VR, Rao AK, Mozzoli M, Homko C, Cheung P, Boden G. Effects of hyperglycemia and hyperinsulinemia on circulating tissue factor procoagulant activity and platelet CD40 ligand. Diabetes 2006; 55(1):202-208.
(39) Nieuwdorp M, van Haeften TW, Gouverneur MC, Mooij HL, van Lieshout MH, Levi M et al. Loss of endothelial glycocalyx during acute hyperglycemia coincides with endothelial dysfunction and coagulation activation in vivo. Diabetes 2006; 55(2):480-486.
(40) Langouche L, Meersseman W, Vander PS, Milants I, Wouters PJ, Hermans G et al. Effect of insulin therapy on coagulation and fibrinolysis in medical intensive care patients. Crit Care Med 2008; 36(5):1475-1480.
(41) Savioli M, Cugno M, Polli F, Taccone P, Bellani G, Spanu P et al. Tight glycemic control may favor fibrinolysis in patients with sepsis. Crit Care Med 2009; 37(2):424-431.
(42) Finfer S, Chittock DR, Su SY, Blair D, Foster D, Dhingra V et al. Intensive versus conventional glucose control in critically ill patients. N Engl J Med 2009; 360(13):1283-1297.
(43) Capes SE, Hunt D, Malmberg K, Gerstein HC. Stress hyperglycaemia and increased risk of death after myocardial infarction in patients with and without diabetes: a systematic overview. Lancet 2000; 355(9206):773-778.
(44) Ishihara M, Kojima S, Sakamoto T, Asada Y, Tei C, Kimura K et al. Acute hyperglycemia is associated with adverse outcome after acute myocardial infarction in the coronary intervention era. Am Heart J 2005; 150(4):814-820.
(45) Norhammar A, Tenerz A, Nilsson G, Hamsten A, Efendic S, Ryden L et al. Glucose metabolism in patients with acute myocardial infarction and no previous diagnosis of diabetes mellitus: a prospective study. The Lancet 2002; 359(9324):2140-2144.
(46) Kosiborod M, Rathore SS, Inzucchi SE, Masoudi FA, Wang Y, Havranek EP et al. Admission Glucose and Mortality in Elderly Patients Hospitalized With Acute Myocardial Infarction: Implications for Patients With and Without Recognized Diabetes. Circulation 2005; 111(23):3078-3086.
(47) Kosiborod M, Inzucchi SE, Krumholz HM, Masoudi FA, Goyal A, Xiao L et al. Glucose Normalization and Outcomes in Patients With Acute Myocardial Infarction. Arch Intern Med 2009; 169(5):438-446.
(48) Nakamura T, Ako J, Kadowaki T, Funayama H, Sugawara Y, Kubo N et al. Impact of acute hyperglycemia during primary stent implantation in patients with ST-elevation myocardial infarction. J Cardiol 2009; 53(2):272-277.
(49) Timmer JR, van der Horst ICC, Ottervanger JP, Henriques JPS, Hoorntje JCA, de Boer MJ et al. Prognostic value of admission glucose in non-diabetic patients with myocardial infarction. American Heart Journal 2004; 148(3):399-404.
(50) Undas A, Wiek I, Stepien E, Zmudka K, Tracz W. Hyperglycemia Is Associated With Enhanced Thrombin Formation, Platelet Activation, and Fibrin Clot Resistance to Lysis in Patients With Acute Coronary Syndrome. Diabetes Care 2008; 31(8):1590-1595.
�������
28

1
2
3
4
5
6
7
8
9
10
11
12
13
14
15
(51) Oswald GA, Smith CC, Delamothe AP, Betteridge DJ, Yudkin JS. Raised concentrations of glucose and adrenaline and increased in vivo platelet activation after myocardial infarction. Br Heart J 1988; 59(6):663-671.
(52) Minatoguchi SM, Zhang ZM, Bao NM, Kobayashi HM, Yasuda SM, Iwasa MM et al. Acarbose Reduces Myocardial Infarct Size by Preventing Postprandial Hyperglycemia and Hydroxyl Radical Production and Opening Mitochondrial KATP Channels in Rabbits. Journal of Cardiovascular Pharmacology 2009; 54(1):25-30.
(53) Els T, Klisch J, Orszagh M, Hetzel A, Schulte-Monting J, Schumacher M et al. Hyperglycemia in patients with focal cerebral ischemia after intravenous thrombolysis: influence on clinical outcome and infarct size. Cerebrovasc Dis 2002; 13(2):89-94.
(54) Fuentes B, Castillo J, San JB, Leira R, Serena J, Vivancos J et al. The prognostic value of capillary glucose levels in acute stroke: the GLycemia in Acute Stroke (GLIAS) study. Stroke 2009; 40(2):562-568.
(55) Parsons MW, Barber PA, Desmond PM, Baird TA, Darby DG, Byrnes G et al. Acute hyperglycemia adversely affects stroke outcome: a magnetic resonance imaging and spectroscopy study. Ann Neurol 2002; 52(1):20-28.
(56) Bruno A, Levine SR, Frankel MR, Brott TG, Lin Y, Tilley BC et al. Admission glucose level and clinical outcomes in the NINDS rt-PA Stroke Trial. Neurology 2002; 59(5):669-674.
(57) Poppe AY, Majumdar SR, Jeerakathil T, Ghali W, Buchan AM, Hill MD. Admission hyperglycemia predicts a worse outcome in stroke patients treated with intravenous thrombolysis. Diabetes Care 2009; 32(4):617-622.
(58) Ribo M, Molina C, Montaner J, Rubiera M, gado-Mederos R, Arenillas JF et al. Acute hyperglycemia state is associated with lower tPA-induced recanalization rates in stroke patients. Stroke 2005; 36(8):1705-1709.
(59) Mraovic B, Hipszer BR, Epstein RH, Pequignot EC, Parvizi J, Joseph JI. Preadmission Hyperglycemia is an Independent Risk Factor for In-Hospital Symptomatic Pulmonary Embolism After Major Orthopedic Surgery. J Arthroplasty 2008.
(60) Hermanides J, Cohn DM, DeVries JH, Kamphuisen PW, Huijgen R, Meijers JC et al. Venous thrombosis is associated with hyperglycemia at diagnosis: a case-control study. J Thromb Haemost 2009; 7(6):945-949.
(61) Hermanides J, Huijgen R, Henny CP, Mohammad NH, Hoekstra JB, Levi MM et al. Hip surgery sequentially induces stress hyperglycaemia and activates coagulation. Neth J Med 2009; 67(6):226-229.
(62) Ceremuzynski L, Budaj A, Czepiel A, Burzykowski T, Achremczyk P, Smielak-Korombel W et al. Low-dose glucose-insulin-potassium is ineffective in acute myocardial infarction: results of a randomized multicenter Pol-GIK trial. Cardiovasc Drugs Ther 1999; 13(3):191-200.
(63) Mehta SR, Yusuf S, Diaz R, Zhu J, Pais P, Xavier D et al. Effect of glucose-insulin-potassium infusion on mortality in patients with acute ST-segment elevation myocardial infarction: the CREATE-ECLA randomized controlled trial. JAMA 2005; 293(4):437-446.
(64) van der Horst I, Zijlstra F, van 't Hof AW, Doggen CJ, de Boer MJ, Suryapranata H et al. Glucose-insulin-potassium infusion inpatients treated with primary angioplasty for acute myocardial infarction: the glucose-insulin-potassium study: a randomized trial. J Am Coll Cardiol 2003; 42(5):784-791.
(65) Malmberg K, Ryden L, Efendic S, Herlitz J, Nicol P, Waldenstrom A et al. Randomized trial of insulin-glucose infusion followed by subcutaneous insulin treatment in diabetic patients with acute myocardial infarction (DIGAMI study): effects on mortality at 1 year. J Am Coll Cardiol 1995; 26(1):57-65.
(66) Gray CS, Hildreth AJ, Sandercock PA, O'Connell JE, Johnston DE, Cartlidge NE et al. Glucose-potassium-insulin infusions in the management of post-stroke hyperglycaemia: the UK Glucose Insulin in Stroke Trial (GIST-UK). Lancet Neurol 2007; 6(5):397-406.
�� ��������������������������
29

(67) Ceriello A. Coagulation activation in diabetes mellitus: the role of hyperglycaemia and therapeutic prospects. Diabetologia 1993; 36(11):1119-1125.
(68) Pandolfi A, Iacoviello L, Capani F, Vitacolonna E, Donati MB, Consoli A. Glucose and insulin independently reduce the fibrinolytic potential of human vascular smooth muscle cells in culture. Diabetologia 1996; 39(12):1425-1431.
(69) Iwasaki Y, Kambayashi M, Asai M, Yoshida M, Nigawara T, Hashimoto K. High glucose alone, as well as in combination with proinflammatory cytokines, stimulates nuclear factor kappa-B-mediated transcription in hepatocytes in vitro. J Diabetes Complications 2007; 21(1):56-62.
(70) Min C, Kang E, Yu SH, Shinn SH, Kim YS. Advanced glycation end products induce apoptosis and procoagulant activity in cultured human umbilical vein endothelial cells. Diabetes Res Clin Pract 1999; 46(3):197-202.
(71) Vink H, Constantinescu AA, Spaan JA. Oxidized lipoproteins degrade the endothelial surface layer : implications for platelet-endothelial cell adhesion. Circulation 2000; 101(13):1500-1502.
(72) Dunn EJ, Philippou H, Ariens RA, Grant PJ. Molecular mechanisms involved in the resistance of fibrin to clot lysis by plasmin in subjects with type 2 diabetes mellitus. Diabetologia 2006; 49(5):1071-1080.
(73) Brownlee M, Vlassara H, Cerami A. Nonenzymatic glycosylation reduces the susceptibility of fibrin to degradation by plasmin. Diabetes 1983; 32(7):680-684.
�������
30

Venous thrombosis is associated with
hyperglycaemia at diagnosis: a case-control study
J Hermanides, DM Cohn, JH DeVries,
TPW Kamphuisen, R Huijgen, JCM Meijers,
JBL Hoekstra and HR Büller
Journal of Thrombosis and Haemostasis 2009 June;7(6):945-9

ABSTRACT
Background Patients with (undiagnosed) diabetes mellitus, impaired glucose
tolerance or stress-induced hyperglycaemia may be at greater risk for venous
thrombosis and present with relative hyperglycaemia during the thrombotic event.
Objectives To assess whether venous thrombosis is associated with hyperglycaemia
at diagnosis.
Patients/methods We performed a case-control study, derived from a cohort of
consecutive patients referred for suspected deep vein thrombosis. Cases were
patients with confirmed symptomatic venous thrombosis of the lower extremity.
Controls were randomly selected in a 1:2 ratio from individuals in whom this
diagnosis was excluded. We measured plasma glucose levels upon presentation to
the hospital.
Results In total, 188 patients with thrombosis and 370 controls were studied. The
glucose cut-off level for the first to fourth quartiles were as follows: first quartile
<5.3 mmol/l; second quartile 5.3 to 5.7 mmol/l; third quartile 5.7 to 6.6 mmol/l; and
the fourth quartile >=6.6 mmol/l. When adjusted for body mass index, a known
history of diabetes mellitus, age, sex, ethnicity and whether known risk factors for
deep vein thrombosis were present, the odds ratios for deep vein thrombosis in the
second, third and fourth quartiles of glucose levels compared with the first quartile
were 1.59 (95% confidence interval [CI] 0.89 to 2.85), 2.04 (95 % CI 1.15 to 3.62) and
2.21 (95% CI 1.20 to 4.05), respectively, p for trend =0.001.
Conclusions Increased glucose levels measured at presentation were associated
with venous thrombosis. Experimental evidence supports a potential causal role for
hyperglycaemia in this process. As this is the first report on the association
between (stress) hyperglycaemia and venous thrombosis, confirmation in other
studies is required.
�������
32

1
2
3
4
5
6
7
8
9
10
11
12
13
14
15
INTRODUCTION
Venous thromboembolism (VTE) is a common disease with an annual incidence of
2-3 per 1000 inhabitants.1 Both acquired and inherited risk factors are known to
play a role in the development of thrombosis.2 Nevertheless, in approximately 25%
of patients with VTE neither an acquired nor an inherited risk factor can be
demonstrated.3;4 Evidence is growing that classic risk factors for arterial disease
are also involved in the development of VTE.5;6 Hyperglycaemia is associated with
arterial thrombosis7-9 and, indeed, patients with diabetes mellitus or the metabolic
syndrome also have an increased risk of VTE.10-12 This increased risk of VTE can in
part be explained by the platelet activation and hypercoagulability present in
diabetes mellitus.13 Activation of the coagulation system has also been observed in
acute experimentally induced hyperglycaemia in healthy male volunteers.14 During
acute illness such as myocardial infarction, a phenomenon called stress
hyperglycaemia may occur independently of the presence of known diabetes.
As hyperglycaemia stimulates coagulation, we hypothesised that higher glucose
levels -independent of known diabetes mellitus- would be more common in patients
presenting with acute VTE.
METHODS
A case-control study was performed. Cases and controls were selected from the
Amsterdam Case-Control Study on Thrombosis, which was initiated in 1999 to
identify new risk factors for deep vein thrombosis (DVT). All consecutive
outpatients older than 18 years referred to the Academic Medical Centre in
Amsterdam between September 1999 and August 2006 with clinically suspected
DVT of the lower extremity were eligible for this study. The study protocol was
approved by the Medical Ethics Review Committee and all participants provided
written informed consent. At presentation, the patientÊs medical history was
obtained through a standardised questionnaire including specific questions about
symptom duration, presence of known risk factors (concomitant malignancy,
pregnancy, use of hormonal replacement therapy, oral contraceptives or selective
oestrogen receptor modulators, recent trauma (within last 60 days), being
bedridden for >3 days, uncommon travel (>6hrs) within the last 3 months, paralysis
of the symptomatic leg, or surgery within the last 4 weeks), concomitant diseases
and medication use. In addition, body mass index (BMI) was calculated. Cases were
patients with thrombosis of the lower extremity confirmed by compression
��� ����� �� �������� ������������������������������� ���
33

ultrasonography, including proximal DVT (i.e. proximal thrombosis of the iliac or
superficial femoral vein, calf vein thrombosis, involving at least the upper third
part of the deep calf veins), symptomatic calf vein thrombosis, and superficial
thrombophlebitis. The diagnosis was confirmed following a diagnostic management
strategy, based on the WellsÊ criteria15 and a Tinaquant D-dimer assay (Roche
Diagnostics, Basel, Switzerland), followed by compression ultrasound if indicated
as validated and described previously.16 Controls were selected in a 1:2 ratio from
those individuals in whom thrombosis was ruled out using the above mentioned
strategy. Selection was performed randomly, only taking into account the
male/female ratio of the cases.
Sample storage and laboratory analysis
On admission and prior to diagnostic testing, blood samples were drawn and
collected in tubes containing 0.109 mmol/l trisodium citrate. Within one hour after
collection, platelet poor plasma was obtained by centrifugation twice for 20 min at
1600 x g and 4°C. The plasma was stored in 2 ml cryovials containing 0.5 ml of
plasma at -80° C.
Glucose was measured using the HK/G-6PD method (Roche/Hitachi, Basel,
Switzerland) and corrected for the 10% dilution with sodium citrate. To assess
whether elevated glucose levels were related to an acute phase response induced by
the thrombotic event itself, we analysed C-reactive protein (CRP) levels from 20
cases and 20 controls, randomly selected from each quartile, giving a total of 160
patients.
Statistical analysis
Results are presented as mean � standard deviation or median with interquartile
range (IQR), depending on the observed distribution. The primary objective of this
study was to assess the relationship between glucose levels at presentation and
VTE, which was expressed as odds ratios (ORs), with 95% confidence intervals.
Glucose levels of the controls were divided into quartiles, as glucose levels are
typically non-normally distributed. Subsequently, the cases were assigned to these
quartiles according to their admission glucose values. Binary logistic regression
was used. The regression model was created on the basis of clinically relevant
potential confounders (BMI, concomitant known diabetes mellitus, sex, ethnicity,
age at diagnosis, and whether known risk factors for VTE were present).
Furthermore, ORs were calculated for cases in which the diagnosis of thrombosis
was restricted to DVT only, excluding calf vein thrombosis and superficial
�������
34

1
2
3
4
5
6
7
8
9
10
11
12
13
14
15
thrombophlebitis. To assess the correlation between glucose levels and CRP levels a
scatter plot was performed and the correlation (expressed in r) coefficient was
calculated. All statistical analyses were performed in SPSS version 15.0 (SPSS Inc.,
Chigaco, IL, USA).
RESULTS
In total 188 patients with confirmed thrombosis and 370 controls were included in
this study, as blood samples were not available for two cases and 10 controls. The
baseline characteristics of the two study groups are shown in Table 1. Mean age
and gender distribution were comparable. The control group consisted of a smaller
proportion of white patients and a greater proportion of black patients as compared
with the cases. The mean BMI was higher in the control group, as tended to be the
number of patients with known diabetes mellitus. Median glucose levels were 5.9
mmol/l (IQR 5.3 to 6.6) in patients with thrombosis, and 5.6 mmol/l (IQR 5.2 to 6.6)
in the controls. In thrombosis patients, 38% had one or more acquired risk factors
and the distribution of thrombosis was as follows: 82% had DVT, 6% had calf vein
thrombosis, and the remaining 12% had superficial thrombophlebitis. The cut-off
glucose levels were as follows: first quartile <5.3 mmol/l (n=141); second quartile
5.3 to 5.7 mmol/l (n=134); third quartile 5.7 to 6.6 mmol/l (n=139); and fourth
quartile >=6.6 mmol/l (n=144) (Table 2).
After adjustment for BMI, concomitant known diabetes mellitus, sex, ethnicity, age
at diagnosis, and whether known risk factors for VTE were present, the ORs for
thrombosis in the second, third and fourth quartiles of glucose levels as compared
with the first quartile were 1.40 (95% CI 0.82 to 2.85), 1.69 (95 % CI 1.00 to 2.87)
and 1.94 (95% CI 1.12 to 3.39), respectively; p for trend =0.01. The same trend of an
increasing OR could be observed when adjusting only for BMI, age, sex and known
diabetes mellitus. As most risk factors predominantly relate to DVT a separate
analysis was planned for DVT only, thus excluding patients with superficial
thrombophlebitis or calf vein thrombosis, leaving 154 cases and 370 controls. Here
also, the OR increases with glucose levels: 1.59 (95% CI 0.89 to 2.85), 2.04 (95% CI
1.15 to 3.62) and 2.21 (95% CI 1.20 to 4.05) for the second, third and fourth quartile
of glucose levels, respectively (see Table 2, p for trend =0.001). Finally, the
Spearman rank correlation coefficient for CRP and plasma glucose was 0.09, with a
p-value of 0.27.
��� ����� �� �������� ������������������������������� ���
35

Tabl
e 1-
bas
elin
e ch
arac
teris
tics
of th
e tw
o st
udy
grou
ps
C
ases
(n=1
88)
Con
trol
s (n
=370
) A
ge, y
ears
(mea
n ±S
D)
57±1
7 56
±16
Fem
ale
(%)
Ethn
icity
(%)
- W
hite
-
Bla
ck
- A
sian
/Pac
ific
isla
nder
-
Oth
er
57.4
78
.7
10.1
2.
7 8.
5
58.1
69
.2
18.1
4.
2 8.
5 B
MI k
g/m
² (m
edia
n, IQ
R)
26.6
(23.
9 to
29.
1)
27.2
(24.
2 to
31.
3)
Dia
bete
s ty
pe 1
or 2
(%)
3.7
10.0
G
luco
se m
mol
/l (m
edia
n, IQ
R)
5.9
(5.3
to 6
.6)
5.6
(5.2
to 6
.6)
Kno
wn
risk
fact
ors:
con
com
itant
mal
igna
ncy,
pre
gnan
cy, u
se o
f hor
mon
al re
plac
emen
t the
rapy
, or
al c
ontra
cept
ives
or s
elec
tive
estro
gen
rece
ptor
mod
ulat
ors,
rece
nt tr
aum
a (w
ithin
last
60
days
),
bedr
idde
n >
3 da
ys, u
ncom
mon
trav
el (>
6hr
s) w
ithin
the
last
3 m
onth
s, p
aral
ysis
of t
he s
ympt
omat
ic le
g,
or s
urge
ry w
ithin
the
last
4 w
eeks
Ta
ble
2- o
dds
ratio
s (O
Rs)
for v
enou
s th
rom
boem
bolis
m.
Qua
rtile
(g
luco
se m
mol
/l)
Cas
es
Con
trol
s C
rude
OR
(9
5% C
I) A
djus
ted
OR
* (9
5% C
I) C
ases
† C
ontr
ols†
C
rude
OR
† (9
5% C
I) A
djus
ted
OR
††
(95%
CI)
1st : <
5.3
39
10
2 re
fere
nce
refe
renc
e 28
10
2 re
fere
nce
refe
renc
e 2nd
: 5.3
to 5
.7
46
88
1.37
(0.8
2 to
2.2
8)
1.40
(0.8
2 to
2.3
8)
37
88
1.53
(0.8
7 to
2.7
0)
1.59
(0.8
9 to
2.8
5)
3rd :
5.7
to 6
.6
52
87
1.56
(0.9
4 to
2.5
9)
1.69
(1.0
0 to
2.8
7)
46
87
1.93
(1.1
1 to
3.3
4)
2.04
(1.1
5 to
3.6
2)
4th :
� 6.
6 51
93
1.
43 (0
.87
to 2
.37)
1.
94 (1
.12
to 3
.39)
43
93
1.
68 (0
.97
to 2
.93)
2.
21 (1
.20
to 4
.05)
p fo
r tre
nd =
0.1
4 p
for t
rend
= 0
.01
p fo
r tre
nd =
0.0
5 p
for t
rend
= 0
.001
* a
djus
ted
for B
MI,
know
n di
abet
es m
ellit
us, s
ex, a
ge, e
thni
city
and
kno
wn
risk
fact
ors
†ana
lyse
s fo
r dee
p ve
nous
thro
mbo
sis
only
††
anal
yses
for d
eep
veno
us th
rom
bosi
s on
ly, a
djus
ted
for B
MI,
diab
etes
mel
litus
, sex
, age
, eth
nici
ty a
nd k
now
n ris
k fa
ctor
s C
I=co
nfid
ence
inte
rval
�������
36

1
2
3
4
5
6
7
8
9
10
11
12
13
14
15
DISCUSSION
In this case-control study, increased glucose levels measured at the time of
presentation were associated with venous thrombosis. This could be a relevant
clinical concept as the general population is becoming increasingly glucose
intolerant. The relationship between glucose and DVT was not readily explained by
an acute phase reaction due to the thrombotic event itself.
Whereas our results indicate that increased glucose levels and VTE coincide, it is
impossible with the current design to demonstrate a causal relationship. However,
a causal relationship seems plausible. To assess this one can apply the diagnostic
criteria for causation.17 A causal relationship is supported by the available
biological evidence from experiments in humans. Stegenga et al. showed that
experimentally induced acute hyperglycaemia activates the coagulation system in
healthy volunteers.14 From a pathophysiologic point of view, hyperglycaemia is
known to induce coagulation activation through glycocalyx damage18, up regulation
of tissue factor19;20, non-enzymatic glycation and the development of increased
oxidative stress.21 Long term exposure to hyperglycaemia such as occurs in
diabetes mellitus, is a known risk factor for VTE.22 In addition, the effect of
hyperglycaemia on coagulation seems to be modifiable in diabetes patients, as
treating hyperglycaemia among these patients led to down regulation of
coagulation activation in several randomised controlled trials.23;24 Furthermore,
our results are in line with the findings by Mraovic et al. who demonstrated that
hyperglycaemia increases the risk of pulmonary embolism after major orthopaedic
surgery.25 Thus, direct and indirect evidence supports a possible association for
acute and chronic hyperglycaemia in the development of VTE. Furthermore, the
association is consistent from this study to other studies, which is in line with the
criterion for repetitive demonstration of causality.
In this study, an adjusted OR of 2.21 (95 % CI 1.20 to 4.05) for DVT was observed
in the highest quartile which suggests a strong relationship. In comparison, the OR
for the well established risk factor for VTE, the prothrombin 20210A mutation is
2.8 (95% CI 1.4 to 5.6).26 The OR for venous thrombosis increases with increasing
glucose levels, from 1.40 (95% CI 0.82 to 2.38) in the second quartile to 1.69 (95%
1.00 to 2.87) in the third quartile and 1.94 (95 % CI 1.12 to 3.39) in the fourth
quartile. We tested for differences in ORs among the quartiles of glucose levels and
found a significant linear trend (p=0.01). This is in concordance with a dose-
response gradient, another criterion for causality.
��� ����� �� �������� ������������������������������� ���
37

The question arises of whether elevated glucose levels during a VTE result from the
inflammatory and counter regulatory hormone action initiated by the VTE event
itself, or whether hyperglycaemia preceded the VTE event. Although a significant
proportion of the patients with hyperglycaemia during an episode of VTE will have
an undisturbed glucose tolerance at follow-up27, undiagnosed impaired glucose
tolerance is likely to have been present in a proportion of patients before the VTE
event itself, and may therefore have contributed to the development of thrombosis.
We therefore suspect a temporal relationship. In addition, no correlation was found
between the acute phase reaction, measured by CRP, and glucose levels. The
presence of stress hyperglycaemia during a thrombotic event, independent of its
cause, could be relevant: it has been shown to have evident clinical consequences in
patients with myocardial infarction and patients admitted to the intensive care
unit (especially without known diabetes mellitus)28;29, although results from recent
intervention trials have been disappointing.30;31
Interestingly, we found a greater proportion of patients with diabetes in the control
group than in the case group. In fact, this higher rate can be caused by referral
bias. Patients with diabetes are usually under chronic medical care and are prone
to leg- and foot problems that can resemble DVT, such as erysipelas. Thus, they are
more easily referred for suspicion of DVT. We had no information on the use of
anti-diabetic drugs. Differences in the distribution of diabetes treatment in both
cases and controls could be a source of bias. However, we believe this effect to be
limited. The model was adjusted for diabetes mellitus as a potential confounder.
Our study has several limitations. First, the control group consisted of patients
with complaints of their legs instead of healthy controls. Consequently, it may be
possible that glucose levels were increased in the controls because of an underlying
disease such as infection. However, this would have led to an underestimation of
the association between glucose and DVT. Second, the glucose levels were
measured on admission, and it was unknown whether these were fasting or non-
fasting samples. However, owing to the study design there were no differences
between cases and controls with respect to the time of presentation and larger
dispersion of glucose levels would therefore have affected cases as much as controls.
Third, citrated plasma is not the plasma of choice for determining glucose and CRP
levels, because of the dilution with sodium citrate. Also, sodium citrate does not
inhibit ex vivo glycolysis. However, we corrected glucose levels for the dilution and
the obtained blood samples were centrifuged and stored within one hour thereby
minimizing glycolysis. Again, as blood samples of both cases and controls were
obtained and processed in the same manner, the results for glucose levels were
�������
38

1
2
3
4
5
6
7
8
9
10
11
12
13
14
15
affected equally. Because this is the first report on the association between stress
hyperglycaemia and VTE, confirmation in other studies is required.
In conclusion, our findings suggest that higher glucose levels are a risk factor for
the development of venous thrombosis. It will therefore be of importance to analyse
whether disturbed glucose homeostasis persists after the acute phase of venous
thrombosis.
ACKNOWLEDGEMENTS
We would like to acknowledge M.M. Levi for assessing the manuscript and for his
significant intellectual contribution. In addition we would like to acknowledge the
„vasculists‰, a group of medical students responsible for execution of this study,
ranging from design of the study to recruitment and data collection.
��� ����� �� �������� ������������������������������� ���
39

REFERENCES
(1) Cushman M, Kuller LH, Prentice R, Rodabough RJ, Psaty BM, Stafford RS et al. Estrogen plus progestin and risk of venous thrombosis. JAMA 2004; 292(13):1573-1580.
(2) Rosendaal FR. Venous thrombosis: a multicausal disease. Lancet 1999; 353(9159):1167-1173.
(3) Lensing AW, Prandoni P, Prins MH, Büller HR. Deep-vein thrombosis. Lancet 1999; 353(9151):479-485.
(4) Spencer FA, Emery C, Lessard D, Anderson F, Emani S, Aragam J et al. The Worcester Venous Thromboembolism study: a population-based study of the clinical epidemiology of venous thromboembolism. J Gen Intern Med 2006; 21(7):722-727.
(5) Eliasson A, Bergqvist D, Bjorck M, Acosta S, Sternby NH, Ogren M. Incidence and risk of venous thromboembolism in patients with verified arterial thrombosis: a population study based on 23,796 consecutive autopsies. J Thromb Haemost 2006; 4(9):1897-1902.
(6) Sorensen HT, Horvath-Puho E, Pedersen L, Baron JA, Prandoni P. Venous thromboembolism and subsequent hospitalisation due to acute arterial cardiovascular events: a 20-year cohort study. Lancet 2007; 370(9601):1773-1779.
(7) Bruno A, Levine SR, Frankel MR, Brott TG, Lin Y, Tilley BC et al. Admission glucose level and clinical outcomes in the NINDS rt-PA Stroke Trial. Neurology 2002; 59(5):669-674.
(8) Laakso M. Hyperglycemia and cardiovascular disease in type 2 diabetes. Diabetes 1999; 48(5):937-942.
(9) Malmberg K, Ryden L, Hamsten A, Herlitz J, Waldenstrom A, Wedel H. Effects of insulin treatment on cause-specific one-year mortality and morbidity in diabetic patients with acute myocardial infarction. DIGAMI Study Group. Diabetes Insulin-Glucose in Acute Myocardial Infarction. Eur Heart J 1996; 17(9):1337-1344.
(10) Ay C, Tengler T, Vormittag R, Simanek R, Dorda W, Vukovich T et al. Venous thromboembolism a manifestation of the metabolic syndrome. Haematologica 2007; 92(3):374-380.
(11) Grundy SM, Cleeman JI, Daniels SR, Donato KA, Eckel RH, Franklin BA et al. Diagnosis and management of the metabolic syndrome: an American Heart Association/National Heart, Lung, and Blood Institute Scientific Statement. Circulation 2005; 112(17):2735-2752.
(12) Petrauskiene V, Falk M, Waernbaum I, Norberg M, Eriksson JW. The risk of venous thromboembolism is markedly elevated in patients with diabetes. Diabetologia 2005; 48(5):1017-1021.
(13) Grant PJ. Diabetes mellitus as a prothrombotic condition. J Intern Med 2007; 262(2):157-172.
(14) Stegenga ME, van der Crabben SN, Levi M, de Vos AF, Tanck MW, Sauerwein HP et al. Hyperglycemia stimulates coagulation, whereas hyperinsulinemia impairs fibrinolysis in healthy humans. Diabetes 2006; 55(6):1807-1812.
(15) Wells PS, Anderson DR, Bormanis J, Guy F, Mitchell M, Gray L et al. Value of assessment of pretest probability of deep-vein thrombosis in clinical management. The Lancet 350(9094):1795-1798.
(16) Kraaijenhagen RA, Piovella F, Bernardi E, Verlato F, Beckers EA, Koopman MM et al. Simplification of the diagnostic management of suspected deep vein thrombosis. Arch Intern Med 2002; 162(8):907-911.
(17) How to read clinical journals: IV. To determine etiology or causation. Can Med Assoc J 1981; 124(8):985-990.
�������
40

1
2
3
4
5
6
7
8
9
10
11
12
13
14
15
(18) Nieuwdorp M, van Haeften TW, Gouverneur MC, Mooij HL, van Lieshout MH, Levi M et al. Loss of endothelial glycocalyx during acute hyperglycemia coincides with endothelial dysfunction and coagulation activation in vivo. Diabetes 2006; 55(2):480-486.
(19) Khechai F, Ollivier V, Bridey F, Amar M, Hakim J, de PD. Effect of advanced glycation end product-modified albumin on tissue factor expression by monocytes. Role of oxidant stress and protein tyrosine kinase activation. Arterioscler Thromb Vasc Biol 1997; 17(11):2885-2890.
(20) Min C, Kang E, Yu SH, Shinn SH, Kim YS. Advanced glycation end products induce apoptosis and procoagulant activity in cultured human umbilical vein endothelial cells. Diabetes Res Clin Pract 1999; 46(3):197-202.
(21) Ceriello A. Coagulation activation in diabetes mellitus: the role of hyperglycaemia and therapeutic prospects. Diabetologia 1993; 36(11):1119-1125.
(22) Ageno W, Becattini C, Brighton T, Selby R, Kamphuisen PW. Cardiovascular risk factors and venous thromboembolism: a meta-analysis. Circulation 2008; 117(1):93-102.
(23) Caballero AE, Delgado A, guilar-Salinas CA, Herrera AN, Castillo JL, Cabrera T et al. The Differential Effects of Metformin on Markers of Endothelial Activation and Inflammation in Subjects with Impaired Glucose Tolerance: A Placebo-Controlled, Randomized Clinical Trial. J Clin Endocrinol Metab 2004; 89(8):3943-3948.
(24) De Jager J, Kooy A, Lehert P, Bets D, Wulffele MG, Teerlink T et al. Effects of short-term treatment with metformin on markers of endothelial function and inflammatory activity in type 2 diabetes mellitus: a randomized, placebo-controlled trial. J Intern Med 2005; 257(1):100-109.
(25) Mraovic B, Hipszer BR, Epstein RH, Pequignot EC, Parvizi J, Joseph JI. Preadmission Hyperglycemia is an Independent Risk Factor for In-Hospital Symptomatic Pulmonary Embolism After Major Orthopedic Surgery. J Arthroplasty 2008.
(26) Poort SR, Rosendaal FR, Reitsma PH, Bertina RM. A common genetic variation in the 3'-untranslated region of the prothrombin gene is associated with elevated plasma prothrombin levels and an increase in venous thrombosis. Blood 1996; 88(10):3698-3703.
(27) Ishihara M, Inoue I, Kawagoe T, Shimatani Y, Kurisu S, Hata T et al. Is admission hyperglycaemia in non-diabetic patients with acute myocardial infarction a surrogate for previously undiagnosed abnormal glucose tolerance? Eur Heart J 2006; 27(20):2413-2419.
(28) Ishihara M, Kojima S, Sakamoto T, Asada Y, Tei C, Kimura K et al. Acute hyperglycemia is associated with adverse outcome after acute myocardial infarction in the coronary intervention era. Am Heart J 2005; 150(4):814-820.
(29) Whitcomb BW, Pradhan EK, Pittas AG, Roghmann MC, Perencevich EN. Impact of admission hyperglycemia on hospital mortality in various intensive care unit populations. Crit Care Med 2005; 33(12):2772-2777.
(30) Finfer S, Chittock DR, Su SY, Blair D, Foster D, Dhingra V et al. Intensive versus conventional glucose control in critically ill patients. N Engl J Med 2009; 360(13):1283-1297.
(31) Mehta SR, Yusuf S, Diaz R, Zhu J, Pais P, Xavier D et al. Effect of glucose-insulin-potassium infusion on mortality in patients with acute ST-segment elevation myocardial infarction: the CREATE-ECLA randomized controlled trial. JAMA 2005; 293(4):437-446.
��� ����� �� �������� ������������������������������� ���
41


Hip surgery sequentially induces stress
hyperglycaemia and activates coagulation
J Hermanides, R Huijgen, CP Henny, N Haj
Mohammad, JBL Hoekstra, MM Levi and JH DeVries
The Netherlands Journal of Medicine, 2009 June;67(6):226-9

ABSTRACT
Background A frequent complication of orthopaedic procedures is venous
thromboembolism (VTE). Hyperglycaemia has been shown to activate the
coagulation system and is associated with postoperative morbidity and mortality.
Therefore we hypothesised that glucose levels increase during orthopaedic surgery
and are associated with an activation of the coagulation system.
Methods Nine adult patients undergoing elective hip replacement were included.
Venous blood samples were taken before, during and after surgery. Plasma glucose
levels, factor VIII clotting activity (fVIII:c), von Willebrand ristocetin cofactor
activity, von Willebrand factor antigen and prothrombin fragment 1+2 were
measured.
Results Immediately after induction of anaesthesia, plasma glucose levels started
to increase until the second day postoperatively (peak 8.0 mmol/l). After seven
weeks glucose values had returned to baseline (6.1 mmol/l), p<0.001 with ANOVA.
All coagulation parameters increased during surgery, subsequent to the rise in
glucose. The change in mean FVIII:c and von Willebrand ristocetin cofactor activity
significantly correlated with mean glucose values.
Conclusions These observations indicate that total hip replacement surgery causes
an increase in glucose levels that precedes the proportional rise of the measured
coagulation parameters. This suggests a possible role of glucose in the activation of
the coagulation system during hip surgery.
�������
44

1
2
3
4
5
6
7
8
9
10
11
12
13
14
15
INTRODUCTION
A frequent complication of surgical procedures is venous thromboembolism (VTE),
manifesting as deep venous thrombosis or pulmonary embolism.1 Especially after
orthopaedic surgery the incidence of postoperative symptomatic VTE is high,
occurring in 1.5 to 10% of the patients despite adequate anticoagulant
prophylaxis.2 Risk factors for the development of VTE after surgery include
underlying malignancy and advanced age.2 In an experimental setting
hyperglycaemia has been shown to activate the coagulation system in healthy
volunteers, in particular by stimulating the tissue factor pathway.3;4 This is of
interest since hyperglycaemia in response to surgery is a common finding.5-7
Counter regulatory hormone action initiated by the surgical trauma can induce
„stress hyperglycaemia‰, even without known diabetes mellitus.8 Recently, pre-
operative hyperglycaemia has been identified as a risk factor for pulmonary
embolism, independent of diabetes mellitus.9
Thus, we hypothesised that glucose levels increase during orthopaedic surgery and
may contribute and therefore be related to an activation of the coagulation system.
MATERIALS AND METHODS
Study design and population
We performed an observational study, assessing the correlation between
perioperative changes in plasma glucose levels and a number of coagulation
parameters. Adult patients undergoing elective hip replacement surgery were
recruited from the Department of Orthopaedic Surgery at the Academic Medical
Centre, University of Amsterdam, the Netherlands. Exclusion criteria were:
previous VTE, revision hip replacement, use of �-blockers, known diabetes
mellitus, inability or unwillingness to give written informed consent, and inability
to be followed up. The study was approved by the Medical Ethics Commission of the
Academic Medical Centre, University of Amsterdam and written informed consent
was obtained from each patient.
Data collection
Clinical data including date of birth, sex, height, weight, blood and indication for
hip replacement were recorded. Venous blood samples were taken at 14 set points
in time (Figure 1). The samples on the day of surgery were taken in the fasting
��� ������ ����������������� ������������������������� �����������
45

state. The samples on the other days (non-fasting) were taken between 8 and 10 am
to exclude the influence of circadian fluctuations on the haemostatic parameters.
Laboratory determinations
Blood was collected in ice-cooled tubes of 2.7 ml containing 0.109 M trisodium
citrate, which were centrifuged within one hour. The citrate samples were
centrifuged at 3000 rpm at 4 °C for 20 minutes and the separated plasma again at
4000 rpm and 4 °C for five minutes and stored immediately at -80ÀC. Plasma
glucose was measured using the HK/G-6PD method (Roche/Hitachi, Basel,
Switzerland) and corrected for the 10% dilution with sodium citrate. Factor VIII
clotting activity (FVIII:c) and von Willebrand ristocetin cofactor activity
(vWF:RiCof) assays were performed on an automated coagulation analyser
(Behring Coagulation System) with reagents and protocols from the manufacturer
(Dade Behring, Marburg, Germany), and are expressed as a percentage of reference
activity. Measurements of prothrombin fragment 1+2 (F1+2) (Dade Behring,
Marburg, Germany) and von Willebrand factor antigen (vWF:Ag) (antibodies from
Dako, Glostrup, Denmark) were performed by ELISA.
Statistical analyses
Mean glucose levels perioperatively and during surgery were plotted against time.
Sequential glucose values were analysed with the repeated measurements ANOVA.
For the ANOVA analyses, missing values per patient were linearly interpolated.
Post-hoc testing was performed using the paired t-test with HolmÊs sequential
Bonferroni correction, comparing the non-fasting samples with the baseline mean
glucose values and the fasting samples with the pre-induction sample. To assess
the correlation between mean glucose levels and mean FVIII:c, vWF:Ag,
vWB:RiCof., F1+2 values we calculated the correlation coefficient . Correlation was
considered relevant in case of r >0.5. The level of significance was p<0.05. RESULTS
During the study period 17 patients scheduled for elective hip replacement surgery
were evaluated. Nine patients met the inclusion criteria and provided written
informed consent. The investigated cohort included five males and four females
with a mean age of 63 years (SD 22 years) and mean BMI of 27.7 kg/m² (SD 2.8).
Indication for hip surgery was coxarthrosis in seven patients, one case of idiopathic
femur head necrosis and prednisone induced femur head necrosis in one patient.
�������
46

1
2
3
4
5
6
7
8
9
10
11
12
13
14
15
This last subject had stopped taking prednisone two years before inclusion in this
study. Low-molecular weight heparin (LMWH), starting the day before surgery,
was used as thromboprofylaxis in five patients. One patient started LMWH the day
after surgery and three patients used oral anticoagulants.
Glucose values
Mean plasma glucose levels and the number of successful samples per time point
are depicted in Figure 1 and Table 1. The repeated measurements ANOVA for all
sequential glucose samples was p<0.001. Missing values are due to occlusion of the
intravenous sampling catheter during surgery. Mean plasma glucose levels
changed significantly during surgery as compared with pre-induction. Directly after
induction of anaesthesia glucose levels increased from 5.6 to 6.0 mmol/l (p=0.002).
Two hours after surgery, glucose levels were still significantly increased as
compared with pre-induction (7.3 mmol/l, p=0.01). Postoperatively non-fasting
glucose levels peaked at the second postoperative day and remained increased up to
the 4th day after surgery as compared to baseline non-fasting mean glucose values.
After seven weeks non-fasting glucose levels returned to baseline values.
Coagulation factors
The mean levels of FVIII:c, vWF:Ag, vWF:RiCof. and F1+2 are presented in Table
1. All values increased significantly during surgery. FVIII:c and F1+2 returned to
baseline values seven weeks after surgery. However, vWF:Ag and vWF:RiCof
remained elevated. In Figure 1 the increase in mean levels of coagulation factors
per time point are shown. In contrast with the steep increase in glucose levels after
placement of the prosthesis cup (S4), vWF:Ag, vWF:RiCof and FVIII:c levels
somewhat lagged behind the glucose pattern. Both FVIII:c (r=0.69, p=0.03) and
vWF:RiCof (r=0.69, p=0.006) were significantly correlated with the mean glucose
levels. Correlation coefficients of F1+2 (r=0.58, p=0.07) and vWF:Ag (r=0.59,
p=0.06) had borderline significance.
��� ������ ����������������� ������������������������� �����������
47

Tim
e
Glu
cose
(mm
ol/l)
F1
+2 (n
mol
/L)
vWF:
Ag
(IU/d
L)
vWB
:RiC
of (I
U/d
L)
FVIII
:c (I
U/d
L)
Surg
ery
-1 d
ay
Bas
elin
e 6.
2 (±
1.0)
1.
0 (±
0.3)
11
6.8
(±37
.2)
101.
8 (±
34.3
) 11
3.1
(±25
.3)
Bef
ore
indu
ctio
n
S1
5.6
(±0.
4)
1.1
(±0.
5)
115.
4 (±
27.5
) 10
5.4
(±36
.7)
100.
9 (±
23.7
) A
fter i
nduc
tion
S2
6.0(
±0.4
) 1.
0 (±
0.5)
11
4.0
(±29
.0)
101.
0 (±
35.2
) 10
1.0
(±24
.8)
Afte
r ski
n in
cisi
on
S3
6.0
(±0.
7)
1.0
(±0.
4)
103.
6 (±
28.2
) 91
.1 (±
39.6
) 89
.3 (±
19.0
) A
fter p
laci
ng c
up
S4
6.9
(±0.
6)
1.3
(±0.
4)
102.
1 (±
46.2
) 10
4.5
(±59
.8)
92.5
(±38
.4)
Afte
r pl
acin
g pr
osth
esis
S
5 7.
2 (±
0.6)
2.
0 (±
0.8)
12
2.0
(±34
.8)
140.
4 (±
47.4
) 11
6.3
(±28
.8)
2 ho
urs
afte
r sur
gery
S
6 7.
3 (±
1.4)
2.
6 (±
1.5)
12
3.6
(±50
.0)
138.
6 (±
58.6
) 11
0.4
(±36
.6)
Surg
ery
+1 d
ay
D1
7.8
(±1.
7)
1.3
(±0.
4)
151.
4 (±
48.4
) 17
5.9
(±54
.6)
124.
3 (±
28.7
) Su
rger
y +2
day
s D
2 8.
0 (±
1.7)
1.
4 (±
0.4)
19
5.4
(±42
.8)
240.
6 (±
52.1
) 16
3.3
(±24
.5)
Surg
ery
+3 d
ays
D3
7.9
(±1.
2)
1.6
(±0.
4)
228.
0 (±
69.3
) 26
4.0
(±87
.8)
167.
7 (±
37.0
) Su
rger
y +4
day
s D
4 6.
9 (±
1.4)
1.
7 (±
0.5)
23
1.4
(±54
.7)
250.
6 (±
71.2
) 17
1.3
(±37
.0)
Surg
ery
+49
days
Fi
nal
6.1
(±0.
8)
1.1
(±0.
7)
164.
6 (±
57.9
) 14
9.2
(±62
.7)
128.
4 (±
35.2
)
Tabl
e 1-
Mea
n le
vels
of g
luco
se a
nd c
oagu
latio
n pa
ram
eter
s pe
r tim
e po
int,
disp
laye
d w
ith m
ean
± S
D
Fact
or V
III c
lotti
ng a
ctiv
ity=F
VIII
:c, v
on W
illeb
rand
rist
ocet
in c
ofac
tor a
ctiv
ity =
vWF:
RiC
of
prot
hrom
bin
fragm
ent 1
+2=F
1+2,
von
Will
ebra
nd fa
ctor
ant
igen
= vW
F:A
g
�������
48

1
2
3
4
5
6
7
8
9
10
11
12
13
14
15
F1+2
Baseline S1 S2 S3 S4 S5 S6 D1 D2 D3 D4 Final
F1
+ F2
(nm
ol/l)
0,5
1,0
1,5
2,0
2,5
3,0
3,5
FVIII:c
Baseline S1 S2 S3 S4 S5 S6 D1 D2 D3 D4 Final
FVIII
(IU
/dl)
60
80
100
120
140
160
180
200
vWF:ag
Time
Baseline S1 S2 S3 S4 S5 S6 D1 D2 D3 D4 Final
vWFa
g (IU
/dl)
60
80
100
120
140
160
180
200
220
240
260
280
vWF:RiCof
Time
Baseline S1 S2 S3 S4 S5 S6 D1 D2 D3 D4 Final
vWFa
c (IU
/dl)
50
100
150
200
250
300
350
++
+
++ +
+
+ +
++
++
+
Glucose
Baseline S1 S2 S3 S4 S5 S6 D1 D2 D3 D4 Final
Glu
cose
(mm
ol/l)
5
6
7
8
9
10
+
*
**
**
Glucose
Baseline S1 S2 S3 S4 S5 S6 D1 D2 D3 D4 Final
Glu
cose
(mm
ol/l)
5
6
7
8
9
10
+
*
**
**
Figure 1- Mean per- and postoperative glucose levels (2 upper graphs are identical) and coagulation parameters with 95% CI.+p< 0.05 as compared to baseline, *p< 0.05 as compared to S1 (glucose fasting samples only) Repeated measurements ANOVA: p<0.001 for glucose, vWF:ag, vWF:RiCof, F1+2 and FVIII:c
Sampling time points Baseline (n=9) Baseline: surgery -1 day S6 (n=8) 2 hours after surgery S1 (n=7) Before induction D1 (n=9) Surgery +1 day S2 (n=8) After induction D2 (n=7) Surgery +2 days S3 (n=8) After skin incision D3 (n=9) Surgery +3 days S4 (n=8) After placing cup D4 (n=7) Surgery +4 days S5 (n=8) After placing prosthesis Final (n=9) Surgery +49 days
��� ������ ����������������� ������������������������� �����������
49

DISCUSSION
In this observational study we have demonstrated how plasma glucose levels
increase in response to hip replacement surgery. Following this rise in glucose,
FVIII:c, vWF:Ag, vWF:RiCof and F1+2 levels also increased. These changes in
mean glucose levels and mean levels of coagulation parameters during hip
replacement surgery were closely correlated. All measured parameters remained
elevated for several days up to seven weeks postoperatively.
The link between glucose increase and activation of the coagulation system has
been established before. Stegenga and co-workers showed in clamp studies that
hyperglycaemia leads to up regulation of coagulation parameters in healthy
volunteers, measured by soluble tissue factor and thrombin-antithrombin
complexes.3 Furthermore, exposure to prolonged hyperglycaemia (diabetes
mellitus) is an established risk factor for VTE.10 Coagulation activation by
hyperglycaemia may be explained by mechanisms such as glycocalyx damage, non-
enzymatic glycation, or the development of increased oxidative stress.10;11 From the
present study we cannot conclude whether increasing glucose levels directly
activates the coagulation system. Activation of coagulation could be due to other
causes, such as vascular damage and bleeding induced by the surgery. However, it
is of interest to note that the rise in glucose levels precedes the increase in the
measured coagulation parameters and is closely correlated with these parameters.
Our study was limited by the small sample size (n=9). This was therefore a pilot
study, to determine whether hip surgery does indeed cause hyperglycaemia and
whether this is associated with activation of the coagulation system. To investigate
the direct influence of perioperative glucose levels on coagulation parameters, a
randomised controlled trial is needed, comparing an intervention group in which
normoglycaemia is maintained with untreated controls, as in our study population.
A consideration in interpreting the results is the possible lowering of coagulation
parameters in response to the use of thromboprophylaxis and anticoagulants,
especially the use of oral anticoagulants in three patients and the influence on
F1+2. However, one would have expected an even larger increase in the coagulation
parameters when no anticoagulants or thromboprophylaxis were used, and this is
therefore not likely to have biased the results.
Glucose values were measured both fasting (preoperatively) and non-fasting
(perioperatively). In the analyses we have attempted to overcome this limitation by
comparing the non-fasting samples to the baseline mean glucose values and the
fasting samples with the pre-induction sample. It should also be noted that the
�������
50

1
2
3
4
5
6
7
8
9
10
11
12
13
14
15
medium in which the blood was collected, trisodium citrate, is not the medium of
choice for glucose measurements. We have however corrected for the dilution factor.
In addition, samples were stored in ice-cooled tubes which were centrifuged
immediately. This limits possible glycolysis.
In conclusion, our observations indicate that total hip replacement surgery causes
glucose levels to increase, prior to a rise in the concentration of the measured
coagulation parameters. This suggests a possible role of glucose in the activation of
the coagulation system during hip surgery. Confirmation of this observation in
interventional studies is needed.
��� ������ ����������������� ������������������������� �����������
51

REFERENCES
(1) Spencer FA, Emery C, Lessard D, Anderson F, Emani S, Aragam J et al. The Worcester Venous Thromboembolism study: a population-based study of the clinical epidemiology of venous thromboembolism. J Gen Intern Med 2006; 21(7):722-727.
(2) Geerts WH, Bergqvist D, Pineo GF, Heit JA, Samama CM, Lassen MR et al. Prevention of venous thromboembolism: American College of Chest Physicians Evidence-Based Clinical Practice Guidelines (8th Edition). Chest 2008; 133(6 Suppl):381S-453S.
(3) Stegenga ME, van der Crabben SN, Levi M, de Vos AF, Tanck MW, Sauerwein HP et al. Hyperglycemia Stimulates Coagulation, Whereas Hyperinsulinemia Impairs Fibrinolysis in Healthy Humans. Diabetes 2006; 55(6):1807-1812.
(4) Rao AK, Chouhan V, Chen X, Sun L, Boden G. Activation of the tissue factor pathway of blood coagulation during prolonged hyperglycemia in young healthy men. Diabetes 1999; 48(5):1156-1161.
(5) Gandhi GY, Nuttali GA, Abel MD, Mullany CJ, Schaff HV, Williams BA et al. Intraoperative Hyperglycemia and Perioperative Outcomes in Cardiac Surgery Patients. Mayo Clinic Proceedings 2005; 80(7):862-866.
(6) Thorell A, Efendic S, Gutniak M, Haggmark T, Ljungqvist O. Insulin resistance after abdominal surgery. Br J Surg 1994; 81(1):59-63.
(7) Engin A, Bozkurt BS, Ersoy E, Oguz M, Gokcora N. Stress hyperglycemia in minimally invasive surgery. Surg Laparosc Endosc 1998; 8(6):435-437.
(8) Wolfe RR, Martini WZ. Changes in Intermediary Metabolism in Severe Surgical Illness. World Journal of Surgery 2000; 24(6):639-647.
(9) Mraovic B, Hipszer BR, Epstein RH, Pequignot EC, Parvizi J, Joseph JI. Preadmission Hyperglycemia is an Independent Risk Factor for In-Hospital Symptomatic Pulmonary Embolism After Major Orthopedic Surgery. The Journal of Arthroplasty In Press, Corrected Proof.
(10) Ceriello A. Coagulation activation in diabetes mellitus: the role of hyperglycaemia and therapeutic prospects. Diabetologia 1993; 36(11):1119-1125.
(11) Nieuwdorp M, van Haeften TW, Gouverneur MC, Mooij HL, van Lieshout MH, Levi M et al. Loss of endothelial glycocalyx during acute hyperglycemia coincides with endothelial dysfunction and coagulation activation in vivo. Diabetes 2006; 55(2):480-486.
�������
52

Stress-induced hyperglycaemia and venous
thromboembolism following total hip or total
knee arthroplasty
J Hermanides, DM Cohn, JH DeVries, PW Kamphuisen,
S Kuhls, M Homering, JBL Hoekstra, AW Lensing and
HR Büller
Submitted for publication

ABSTRACT
Background Stress-induced hyperglycaemia is common during orthopaedic surgery.
In addition, hyperglycaemia activates coagulation. Whether stress-induced
hyperglycaemia is associated with symptomatic or asymptomatic venous
thromboembolism (VTE) following orthopaedic surgery is unknown.
Methods We performed post-hoc analyses in the four RECORD studies (REgulation
of Coagulation in major Orthopedic surgery reducing the Risk of Deep venous
thrombosis and pulmonary embolism). Separate analyses were performed for
patients undergoing total hip or knee replacement. Outcome measures were
symptomatic VTE and „total VTE‰ (defined as the composite of symptomatic VTE,
asymptomatic DVT assessed by per protocol venography and all cause mortality).
Glucose levels were measured at day 0 (pre-surgery visit) and post-surgery on day
1, categorised into quartiles, based on the distribution in the respective cohorts.
The influence of glucose, adjusted for BMI, age, gender and diabetes mellitus on
VTE was assessed by logistic regression analyses.
Results A total of 12383 patients were eligible for assessment of symptomatic VTE
and 8512 patients were eligible for assessment of total VTE. Increased glucose
levels after total hip replacement were associated with total VTE; adjusted OR
highest versus lowest quartile 1.9 (95%CI 1.3 to 3.0). Furthermore, increase in
glucose levels during hip surgery was associated with total VTE (OR highest versus
lowest quartile 1.8 (95%CI 1.2 to 2.8). This was not observed in patients undergoing
total knee replacement.
Conclusion Stress-induced hyperglycaemia following total hip replacement was
associated with total VTE. This was not demonstrated in patients undergoing total
knee replacement, which is likely due to the surgical procedure.
�������
54

1
2
3
4
5
6
7
8
9
10
11
12
13
14
15
INTRODUCTION
Venous thromboembolism (VTE) may manifest as either deep venous thrombosis
(DVT) or pulmonary embolism (PE), or a combination of both. VTE affects 2-3
persons per 1000 inhabitants annually in Western Societies.1 Acquired risk factors,
inherited risk factors or both can be found in approximately 75% of patients with
VTE.2;3 This implies, that in approximately 25% of patients with VTE no risk
factors can be identified.
In several reports, acute hyperglycaemia was shown to cause coagulation activation
in an experimental setting as demonstrated by increased levels of thrombin-
antithrombin complexes and soluble tissue factor.4;5 During acute illness or
surgery, a phenomenon called stress hyperglycaemia may occur independently of
the presence of known diabetes.6 Indeed, hip surgery has been shown to induce
hyperglycaemia peaking the days after the procedure, followed by post-operative
procoagulant activity peaking on the third and fourth postoperative days.7
Hyperglycaemia at presentation has recently been shown to be associated with
VTE in an outpatient population.8 Whether stress-hyperglycaemia is associated
with VTE in hospitalised patients, such as orthopaedic patients, has not been
previously addressed. The associated risk of hyperglycaemia could be of particular
interest in surgical patients, since the coagulation system is already activated due
to the surgical procedure.9 Furthermore, VTE is a frequently occurring
complication following orthopaedic surgery. Despite anticoagulant prophylaxis,
symptomatic VTE occurs in approximately 2% of all patients undergoing hip or
knee replacements.10 In this study we aimed to assess whether pre- and
postoperative hyperglycaemia is associated with (a)symptomatic VTE.
METHODS
Patients
For the present analysis we made use of the large phase III trial programme:
„REgulation of Coagulation in major Orthopaedic surgery reducing the Risk of
Deep venous thrombosis and pulmonary embolism studies‰ (RECORD 1-4).11-14
These trials compared the efficacy and safety of Rivaroxaban (a direct factor Xa
inhibitor) 10 mg qd relative to standard treatment with Enoxaparin 40 mg qd 11-13
or 30 mg b.i.d.14 Because efficacy and safety outcomes, as well as independent,
blinded adjudication committees were the same in all RECORD studies, the studies
allowed pooling of the data. Patients were eligible if they were aged 18 years or
������ ������������������������������������������������������������
55

older and were scheduled for elective total hip or total knee arthroplasty. Major
exclusion criteria included active bleeding or high risk of bleeding, significant liver
disease, anticoagulant therapy that could not be interrupted, use of HIV-protease-
inhibitors and a contraindication for prophylaxis with enoxaparin or a condition
that would require a dose adjustment for enoxaparin. Detailed in- and exclusion
criteria were reported in the original publications of the RECORD studies.11-14
Procedures
Deep-vein thrombosis was assessed per protocol, by ascending, bilateral
venography with a standardised technique.15 This was performed at day 36 (range
32 to 40) in patients with total hip replacements (RECORD 1 and 2)11;12 and at day
13 (range 11 to 15) in patients with total knee replacement (RECORD 3 and 4).13;14
Symptomatic VTE was objectively confirmed by standard imaging techniques.
Treatment duration was 5 weeks for RECORD study 1 and 2 (including the 3 weeks
of placebo treatment in the comparator group). Treatment duration in RECORD 3
and 4 was 2 weeks. Patients were followed up for 30 to 35 days after the last dose.
Glucose levels were sampled upon admission (day 0) and 6 hours after surgery (day
1). All samples were analysed in the central laboratory.
Outcomes
The aim of this study was to assess whether hyperglycaemia (measured pre- and
post-surgery) was associated with an increased risk of VTE. We assessed the effect
of hyperglycaemia on symptomatic VTE (until Day 42 in hip replacement and Day
17 in knee replacement) in the participants included in the safety population of the
four RECORD studies. The safety population was defined as patients who received
at least one dose of study medication. Furthermore, we investigated the association
between hyperglycaemia and total VTE, which was defined as the composite
outcome of symptomatic VTE and asymptomatic DVT as detected by venography
and all cause mortality. The analyses for total VTE were performed in the modified
intention to treat (mITT) population, comprising all patients from the safety
analyses with surgery and adequate assessment of both proximal and distal veins
on venography. Only events occurring in the planned treatment phase of the
studies were considered.
Statistical Analyses
Descriptive results are presented as mean � standard deviation (SD) or median
with interquartile range (IQR). To investigate the association of hyperglycaemia
�������
56

1
2
3
4
5
6
7
8
9
10
11
12
13
14
15
and VTE multiple logistic regression analyses were performed separately for
patients undergoing total hip and total knee arthroplasty. Separate analyses were
carried out to assess the influence of glucose on Day 0 (pre-surgery) and Day 1
(post-surgery), and of the difference in glucose levels (Day 1-Day 0) on symptomatic
VTE and total VTE. In all analyses glucose levels were categorised into quartiles,
based on the distribution in the respective cohorts. Adjusted odds ratios (OR) for
categorised glucose levels were derived from a logistic regression model with
variables for glucose, treatment group, study and other relevant covariates (BMI
(<25, 25 to 35, >=35), age (<65, 65 to 75, >75 years), gender, concomitant known
diabetes mellitus). The reported p-value (from likelihood ratio test on 3 d.f.) for
glucose refers to a global test of differences in outcome rates with categorised
glucose levels. All statistical analyses were performed in SAS version 9.1 (SAS
institute, Cary, NC).
������ ������������������������������������������������������������
57

RESULTS
Baseline characteristics
The safety population of the four RECORD studies consisted of 12383 patients, of
whom 6890 underwent total hip arthroplasty and 5493 total knee arthroplasty,
respectively. The baseline characteristics of both cohorts are shown in Table 1.
High BMI and female gender were more common in the knee arthroplasty cohort
(mean BMI 30 kg/m2 vs. 28 kg/m2, and 66% vs. 55%, respectively). Mean age was
slightly higher in the knee surgery cohort: 66 years vs. 63 years. The mITT
population comprised 8512 patients (hip replacement 4886 patients, knee
replacement 3626 patients).
Table 1-baseline characteristics of both cohorts (safety population) VTE=venous thromboembolism, SD=standard deviation
Total hip arthroplasty (RECORD 1&2) (n=6890)
Total knee arthroplasty (RECORD 3&4) (n=5493)
Age – years (mean ± SD) 63 (12) 66 (10) Sex, female n (%) 3780 (55%) 3652 (66%) Body-mass index – kg/m² (mean ± SD) 28 (5) 30 (6) History of VTE, n (%) 132 (2%) 156 (3%) Previous orthopaedic surgery, n (%) 1447 (21%) 1690 (31%) Type of surgery, n (%) -Primary -Revision -Missing/no surgery
6562 (95%) 254 (4%) 74 (1%)
5329 (97%) 119 (2%) 45 (1%)
Type of anesthesia -General only -General and regional -Regional only -Missing -None
1983 (29%) 619 (9%) 4215 (61%) 73 (1%) 0 (0%)
1034 (19%) 1126 (21%) 3292 (60%) 0 (0%) 41 (1%)
Duration of surgery – minutes (mean ± SD) 98 (48) 99 (40) Time to mobilisation – days (mean ± SD) 2.2 (4) 1.6 (2) Ethnic origin, n (%) -White -Asian -Hispanic -Black -Other/missing
5687 (83%) 498 (7%) 329 (5%) 103 (1%) 273 (4%)
4037 (73%) 736 (13%) 353 (6%) 181 (3%) 186 (3%)
Randomisation allocation, n (%) -Rivaroxaban -Comparator (enoxaparin)
3437 (50%) 3453 (50%)
2746 (50%) 2747 (50%)
On glucose lowering therapy, n (%) 407 (6%) 654 (12%) Diabetes Mellitus n (%) 532 (8%) 890 (16%) Glucose measured on Day 0, n (%) 6844 (99%) 5433 (99%) Glucose measured on Day 1, n (%) 6680 (97%) 5323 (97%) Glucose measured on Day 0 & Day 1, n (%) 6648 (96%) 5272 (96%)
�������
58

1
2
3
4
5
6
7
8
9
10
11
12
13
14
15
Total hip arthroplasty
The median pre-operative glucose level at day 0 was 5.4 mmol/l (IQR 4.9 to 6.3,
Table 2a). Glucose levels on Day 0 were not associated with either symptomatic
VTE or total VTE (p=0.22 and p=0.31 respectively, see Table 2a).
At day 1 (post surgery), the median glucose level was 6.5 mmol/l (IQR 5.5 to 7.9,
Table 2b). Glucose levels in the highest quartile (>7.9 mmol/l) were associated with
both symptomatic VTE and total VTE, when compared to the lowest glucose
quartile (<5.5 mmol/l): adjusted OR were 2.3 (95% CI 0.9 to 6.0) and OR 1.9 (95%CI
1.3 to 3.0), respectively. The p-value of the Likelihood Ratio test for glucose on Day
1 was significant for both outcomes (p=0.04 for symptomatic VTE and p<0.0001 for
total VTE). In addition, the amount of increase of the glucose level between day 1
and day 0 was associated with total VTE (p=0.01, see Table 2c). Median difference
of glucose levels between these two time points was 0.9 mmol/l (IQR -0.3 to 2.2).
The highest quartile of this difference was associated with a nearly twofold
increased risk for total VTE compared to the lowest quartile (adjusted OR 1.8,
95%CI 1.2 to 2.8). For symptomatic VTE no association with the difference of
glucose on day 1 and day 0 could be observed (p=0.24, Table 2c).
Total knee arthroplasty
The distribution in glucose levels at day 0 and day 1 in patients undergoing knee
arthroplasty was comparable to that in the hip surgery cohort. Median glucose was
5.5 mmol/l (IQR 4.9 to 6.4) at day 0 and 6.8 mmol/l (IQR 5.7 to 8.3) at day 1 (Table
3a and 3b).
For glucose levels measured at day 0, there was no association between glucose
levels and symptomatic VTE (p=0.46, Table 3a). A non-significant trend was
observed for total VTE at day 0 (Likelihood Ratio test: p=0.14). The adjusted OR for
highest versus lowest quartile was 1.4 (95%CI 1.03 to 2.0, Table 3a). Glucose levels
measured at day 1 were not significantly associated with symptomatic VTE:
adjusted OR 1.8 (95%CI 0.8 to 4.1, Table 3b). For total VTE, the adjusted OR for
highest versus lowest glucose quartile was 1.3 (95%CI 0.96 to 1.8, Table 3b).
No association was found between the increase in glucose levels (median difference
1.1 mmol/l, IQR -0.2 to 2.6) and VTE; adjusted OR for symptomatic VTE: 0.8
(95%CI 0.3 to 1.8) and for total VTE: 1.1 (95%CI 0.8 to 1.4, Table 3c).
������ ������������������������������������������������������������
59

Table 2- odds ratio for glucose levels measured at day 0, day 1 and difference in glucose levels between day 1 and day 0 in relation to symptomatic VTE and total VTE in hip surgery patients (RECORD 1&2)
a) quartiles glucose levels measured at day 0* <4.9 �4.9 to 5.4 >5.4 to 6.3 >6.3 all patients (N) 1487 1713 2014 1630 symptomatic VTE (n) 5 13 11 6
crude OR (95%CI) 1 (ref) 2.3 (0.8 to 6.4) 1.6 (0.6 to 4.7) 1.1 (0.3 to 3.6) adjusted OR (95%CI) 1 (ref) 2.3 (0.8 to 6.5) 1.7 (0.6 to 4.9) 0.9 (0.3 to 3.2) LR test p=0.22
patients valid for the modified intention to treat analyses (N) 1051 1220 1449 1141 total VTE (n) 37 41 60 35
crude OR (95%CI) 1 (ref) 1.0 (0.6 to 1.5) 1.2 (0.8 to 1.8) 0.9 (0.5 to 1.4) adjusted OR (95%CI) 1 (ref) 0.9 (0.6 to 1.4) 1.1 (0.7 to 1.7) 0.8 (0.5 to 1.2) LR test p=0.31
b) quartiles glucose levels measured at day 1* <5.5 �5.5 to 6.5 >6.5 to 7.8 >7.8 all patients (N) 1590 1722 1671 1697 symptomatic VTE (n) 6 4 6 17
crude OR (95%CI) 1 (ref) 0.6 (0.2 to 2.2) 1.0 (0.3 to 3.0) 2.7 (1.1 to 6.8) adjusted OR (95%CI) 1 (ref) 0.6 (0.2 to 2.2) 0.9 (0.3 to 2.8) 2.3 (0.9 to 6.0) LR test p=0.04
patients valid for the modified intention to treat analyses (N) 1148 1241 1219 1210 total VTE (n) 32 31 33 75
crude OR (95%CI) 1 (ref) 0.9 (0.5 to 1.5) 1.0 (0.6 to 1.6) 2.3 (1.5 to 3.5) adjusted OR (95%CI) 1 (ref) 0.8 (0.5 to 1.4) 0.9 (0.5 to 1.4) 1.9 (1.3 to 3.0) LR test p<0.0001
c) quartiles difference in glucose levels day 1 - day 0* �-0.3 >-0.3 to 0.9 >0.9 to 2.2 >2.2 all patients (N) 1633 1655 1699 1661 symptomatic VTE (n) 5 6 8 14
crude OR (95%CI) 1 (ref) 1.2 (0.4 to 3.9) 1.5 (0.5 to 4.7) 2.8 (1.0 to 7.7) adjusted OR (95%CI) 1 (ref) 1.3 (0.4 to 4.3) 1.6 (0.5 to 4.8) 2.6 (0.9 to 7.3) LR test p=0.24
patients valid for the modified intention to treat analyses (N) 1169 1192 1241 1197 total VTE (n) 33 30 43 64
crude OR (95%CI) 1 (ref) 0.9 (0.5 to 1.5) 1.2 (0.8 to 2.0) 1.9 (1.3 to 3.0) adjusted OR (95%CI) 1 (ref) 0.9 (0.6 to 1.6) 1.2 (0.7 to 1.9) 1.8 (1.2 to 2.8) LR test p=0.01
VTE=venous thromboembolism; OR=Odds Ratio, LR test=Likelihood Ratio test for testing whether increase in glucose levels (in quartiles) has a significant influence on the occurrence of VTE. Total VTE is the composite of symptomatic VTE, asymptomatic DVT and all cause mortality. *mmol/l
�������
60

1
2
3
4
5
6
7
8
9
10
11
12
13
14
15
Table 3- odds ratio for glucose levels measured at day 0, day 1 and difference in glucose levels between day 1 and day 0 in relation to symptomatic VTE and total VTE in knee surgery patients (RECORD 3&4)
a) quartiles glucose levels measured at day 0* <4.9 �4.9 to 5.5 >5.5 to 6.4 >6.4 all patients (N) 1216 1480 1320 1417 symptomatic VTE (n) 12 18 11 19
crude OR (95%CI) 1 (ref) 1.2 (0.6 to 2.6) 0.8 (0.4 to 1.9) 1.4 (0.7 to 2.8) adjusted OR (95%CI) 1 (ref) 1.2 (0.6 to 2.5) 0.8 (0.4 to 1.9) 1.5 (0.7 to 3.1) LR test p=0.46
patients valid for the modified intention to treat analyses (N) 813 996 878 903 total VTE (n) 72 115 93 124
crude OR (95%CI) 1 (ref) 1.3 (1.0 to 1.8) 1.2 (0.9 to 1.7) 1.6 (1.2 to 2.2) adjusted OR (95%CI) 1 (ref) 1.2 (0.9 to 1.7) 1.1 (0.8 to 1.5) 1.4 (1.0 to 2.0) LR test p=0.14
b) quartiles glucose levels measured at day 1* <5.7 �5.7 to 6.8 >6.8 to 8.3 >8.3 all patients (N) 1476 1300 1266 1281 symptomatic VTE (n) 10 22 12 14
crude OR (95%CI) 1 (ref) 2.5 (1.2 to 5.3) 1.4 (0.6 to 3.3) 1.6 (0.7 to 3.7) adjusted OR (95%CI) 1 (ref) 2.6 (1.2 to 5.6) 1.5 (0.6 to 3.4) 1.8 (0.8 to 4.1) LR test p=0.07
patients valid for the modified intention to treat analyses (N) 1005 876 846 831 total VTE (n) 103 93 99 107
crude OR (95%CI) 1 (ref) 1.0 (0.8 to 1.4) 1.2 (0.9 to 1.6) 1.3 (1.0 to 1.7) adjusted OR (95%CI) 1 (ref) 1.1 (0.8 to 1.4) 1.2 (0.9 to 1.6) 1.3 (1.0 to 1.8) LR test p=0.37
c) quartiles difference in glucose levels day 1 - day 0* �-0.2 >-0.2 to 1.1 >1.1 to 2.6 >2.6 all patients (N) 1331 1304 1347 1290 symptomatic VTE (n) 13 21 13 10
crude OR (95%CI) 1 (ref) 1.7 (0.8 to 3.3) 1.0 (0.5 to 2.1) 0.8 (0.3 to 1.8) adjusted OR (95%CI) 1 (ref) 1.6 (0.8 to 3.3) 1.0 (0.5 to 2.2) 0.8 (0.3 to 1.8) LR test p=0.26
patients valid for the modified intention to treat analyses (N) 887 899 902 840 total VTE (n) 100 100 102 95
crude OR (95%CI) 1 (ref) 1.0 (0.7 to 1.3) 1.0 (0.7 to 1.3) 1.0 (0.7 to 1.4) adjusted OR (95%CI) 1 (ref) 1.0 (0.8 to 1.4) 1.1 (0.8 to 1.4) 1.1 (0.8 to 1.4) LR test p=0.98
VTE=venous thromboembolism; OR=Odds Ratio, LR test=Likelihood Ratio test for testing whether increase in glucose levels (in quartiles) has a significant influence on the occurrence of VTE. Total VTE is the composite of symptomatic VTE, asymptomatic DVT and all cause mortality. *mmol/l
������ ������������������������������������������������������������
61

DISCUSSION
This study shows an association between stress-induced hyperglycaemia and total
VTE in patients undergoing total hip arthroplasty. This was not observed in knee
surgical patients, in whom only glucose levels prior to surgery were associated with
total VTE.
An association between preoperatively elevated glucose levels and VTE in patients
undergoing orthopaedic surgery has previously been reported.16 Mraovic and
colleagues found that preadmission glucose levels exceeding 11.1 mmol/l
independently increased the risk of pulmonary embolism (OR 3.19, 95%CI 1.25 to
8.10) when compared to glucose levels of less than 6.1 mmol/l in patients who
underwent hip or knee arthroplasty. We did not find a relation between
preoperative hyperglycaemia and VTE in patients undergoing hip surgery.
However, 11.1 mmol/l is well above the cut-off value of the highest quartile in the
hip surgery cohort, 8.0 mmol/l, and is likely to reflect patients with undiagnosed
diabetes mellitus before surgery, a known risk factor for postsurgical
complications.17 We also assessed the influence of post-surgical stress-induced
glucose increase in relation to the development of VTE to investigate whether
stress-hyperglycaemia is an independent risk factor for VTE following orthopaedic
surgery.
Available pathophysiological evidence supports the relation between (acute)
hyperglycaemia and hypercoagulability. In patients with diabetes mellitus, the
concentration of several procoagulant factors are increased (fibrinogen, von
Willebrand antigen, factor VII antigen, factor VIII) and antifibrinolytic factors are
decreased, such as plasminogen activator inhibitor-1 (PAI-1).18 Furthermore, hip
surgery has been shown to induce hyperglycaemia, which preceded a rise of factor
VIII clotting activity, von Willebrand ristocetin cofactor activity, von Willebrand
factor antigen and prothrombin fragment 1+2.7 In healthy volunteers, acute
hyperglycaemia activates the coagulation system in an experimental setting.4
In this study, only those patients in the highest quartile of post-surgical stress-
induced hyperglycaemia were at increased risk for VTE, instead of a linear increase
in risk. This implies that glucose levels apparently need to exceed a certain
threshold to reach a significant association with VTE. Interestingly, the cut-off
between the third and fourth quartiles in hip surgery patients, 7.9 mmol/l, is close
to the classic cut-off for impaired glucose tolerance following the glucose tolerance
test, 7.8 mmol/l.19
�������
62

1
2
3
4
5
6
7
8
9
10
11
12
13
14
15
Hyperglycaemia was not clearly associated with VTE in patients undergoing total
knee replacement as in patients undergoing total hip replacement. This
discrepancy cannot be explained by major differences in patients characteristics, as
these were included as covariates in the regression model. The most important
factor may concern the surgical procedure. Total knee replacement is performed
with application of a tourniquet, occluding arterial and venous flow.20 Tourniquet
use is related to the formation of thrombi.21-24 It is thus possible that the effect of
hyperglycaemia is in part outweighed by other risk factors for VTE in patients
undergoing total knee arthroplasty.
Although preoperative glucose samples were drawn at predefined time points,
patients were not mandatory in the fasting state. We have, however, no reason to
assume that there was a difference in distribution in fasting/non-fasting samples in
patients with- or without VTE. Furthermore, this substudy involved a non-
prespecified analysis. Nevertheless, we have investigated a prospective database,
with a very large sample size. In addition, the most important assessments, VTE
and glucose, were collected prospectively and comprehensively. The outcome „total
VTE‰ not only included symptomatic VTE and asymptomatic DVT, but also „all
cause mortality‰. As the number of subjects who died during the treatment phase is
very low in the four RECORD studies (n=23/8512, 0.3%), it is not likely that the
inclusion of the latter outcome measure affected the results.
CONCLUSION
Stress-induced post-surgical hyperglycaemia is associated total VTE following total
hip replacement. Likely due to the surgical procedure, this was not found in
patients undergoing total knee arthroplasty. Future studies should assess whether
the risk of VTE can be decreased by glucose lowering therapy in patients with
stress-induced hyperglycaemia.
������ ������������������������������������������������������������
63

REFERENCES
(1) Naess IA, Christiansen SC, Romundstad P, Cannegieter SC, Rosendaal FR, Hammerstrom J. Incidence and mortality of venous thrombosis: a population-based study. J Thromb Haemost 2007; 5(4):692-699.
(2) Lensing AW, Prandoni P, Prins MH, Büller HR. Deep-vein thrombosis. Lancet 1999; 353(9151):479-485.
(3) Spencer FA, Emery C, Lessard D, Anderson F, Emani S, Aragam J et al. The Worcester Venous Thromboembolism study: a population-based study of the clinical epidemiology of venous thromboembolism. J Gen Intern Med 2006; 21(7):722-727.
(4) Stegenga ME, van der Crabben SN, Levi M, de Vos AF, Tanck MW, Sauerwein HP et al. Hyperglycemia stimulates coagulation, whereas hyperinsulinemia impairs fibrinolysis in healthy humans. Diabetes 2006; 55(6):1807-1812.
(5) Stegenga ME, van der Crabben SN, Blumer RM, Levi M, Meijers JC, Serlie MJ et al. Hyperglycemia enhances coagulation and reduces neutrophil degranulation, whereas hyperinsulinemia inhibits fibrinolysis during human endotoxemia. Blood 2008; 112(1):82-89.
(6) Dungan KM, Braithwaite SS, Preiser JC. Stress hyperglycaemia. Lancet 2009; 373(9677):1798-1807.
(7) Hermanides J, Huijgen R, Henny CP, Mohammad NH, Hoekstra JB, Levi M et al. Hip surgery sequentially induces stress hyperglycaemia and activates coagulation. Neth J Med 2009; 67(6):226-229.
(8) Hermanides J, Cohn DM, Devries JH, Kamphuisen PW, Huijgen R, Meijers JC et al. Venous thrombosis is associated with hyperglycemia at diagnosis: a case-control study. J Thromb Haemost 2009; 7(6):945-949.
(9) Galster H, Kolb G, Kohsytorz A, Seidlmayer C, Paal V. The pre-, peri-, and postsurgical activation of coagulation and the thromboembolic risk for different risk groups. Thromb Res 2000; 100(5):381-388.
(10) Warwick D, Friedman RJ, Agnelli G, Gil-Garay E, Johnson K, FitzGerald G et al. Insufficient duration of venous thromboembolism prophylaxis after total hip or knee replacement when compared with the time course of thromboembolic events: findings from the Global Orthopaedic Registry. J Bone Joint Surg Br 2007; 89(6):799-807.
(11) Eriksson BI, Borris LC, Friedman RJ, Haas S, Huisman MV, Kakkar AK et al. Rivaroxaban versus enoxaparin for thromboprophylaxis after hip arthroplasty. N Engl J Med 2008; 358(26):2765-2775.
(12) Kakkar AK, Brenner B, Dahl OE, Eriksson BI, Mouret P, Muntz J et al. Extended duration rivaroxaban versus short-term enoxaparin for the prevention of venous thromboembolism after total hip arthroplasty: a double-blind, randomised controlled trial. Lancet 2008; 372(9632):31-39.
(13) Lassen MR, Ageno W, Borris LC, Lieberman JR, Rosencher N, Bandel TJ et al. Rivaroxaban versus enoxaparin for thromboprophylaxis after total knee arthroplasty. N Engl J Med 2008; 358(26):2776-2786.
(14) Turpie AG, Lassen MR, Davidson BL, Bauer KA, Gent M, Kwong LM et al. Rivaroxaban versus enoxaparin for thromboprophylaxis after total knee arthroplasty (RECORD4): a randomised trial. Lancet 2009; 373(9676):1673-1680.
(15) Rabinov K, Paulin S. Roentgen diagnosis of venous thrombosis in the leg. Arch Surg 1972; 104(2):134-144.
(16) Mraovic B, Hipszer BR, Epstein RH, Pequignot EC, Parvizi J, Joseph JI. Preadmission Hyperglycemia is an Independent Risk Factor for In-Hospital Symptomatic Pulmonary Embolism After Major Orthopedic Surgery. J Arthroplasty 2008.
�������
64

1
2
3
4
5
6
7
8
9
10
11
12
13
14
15
(17) Marchant MH, Jr., Viens NA, Cook C, Vail TP, Bolognesi MP. The impact of glycemic control and diabetes mellitus on perioperative outcomes after total joint arthroplasty. J Bone Joint Surg Am 2009; 91(7):1621-1629.
(18) Carr ME. Diabetes mellitus: a hypercoagulable state. J Diabetes Complications 2001; 15(1):44-54.
(19) Diagnosis and classification of diabetes mellitus. Diabetes Care 2008; 31 Suppl 1:S55-S60.
(20) Sharrock NE, Go G, Sculco TP, Ranawat CS, Maynard MJ, Harpel PC. Changes in circulatory indices of thrombosis and fibrinolysis during total knee arthroplasty performed under tourniquet. J Arthroplasty 1995; 10(4):523-528.
(21) Parmet JL, Horrow JC, Pharo G, Collins L, Berman AT, Rosenberg H. The incidence of venous emboli during extramedullary guided total knee arthroplasty. Anesth Analg 1995; 81(4):757-762.
(22) Parmet JL, Horrow JC, Berman AT, Miller F, Pharo G, Collins L. The incidence of large venous emboli during total knee arthroplasty without pneumatic tourniquet use. Anesth Analg 1998; 87(2):439-444.
(23) Westman B, Weidenhielm L, Rooyackers O, Fredriksson K, Wernerman J, Hammarqvist F. Knee replacement surgery as a human clinical model of the effects of ischaemia/reperfusion upon skeletal muscle. Clin Sci (Lond) 2007; 113(7):313-318.
(24) Carles M, Dellamonica J, Roux J, Lena D, Levraut J, Pittet JF et al. Sevoflurane but not propofol increases interstitial glycolysis metabolites availability during tourniquet-induced ischaemia-reperfusion. Br J Anaesth 2008; 100(1):29-35.
������ ������������������������������������������������������������
65


Early postoperative hyperglycaemia is associated
with postoperative complications after
pancreatoduodenectomy
WJ Eshuis, J Hermanides, JW van Dalen, G van
Samkar, ORC Busch, TM van Gulik, JH DeVries,
JBL Hoekstra and DJ Gouma
Submitted for publication

ABSTRACT
Background Perioperative hyperglycaemia is associated with complications after
various types of surgery. This relation was never investigated for
pancreatoduodenectomy. Aim of this study was to investigate the relation between
perioperative hyperglycaemia and complications after pancreatoduodenectomy.
Methods In a consecutive series of 330 patients undergoing
pancreatodoudenectomy, glucose values were collected from the hospital
information system during three periods: pre-, intra- and early postoperative. The
average glucose value per period was calculated for each patient and divided in
duals according to the median group value. Odds ratios for complications were
calculated for the upper versus lower dual, adjusted for age, gender, ASA-
classification, BMI, diabetes mellitus, intraoperative blood transfusion, duration of
surgery, intraoperative insulin administration and octreotide use. The same
procedures were carried out to assess the consequences of increased glucose
variability, expressed by the standard deviation.
Results Average glucose values were 7.5 (preoperative), 7.4 (intraoperative) and 7.9
mmol/l (early postoperative). Pre- and intraoperative glucose values were not
associated with postoperative complications. Early postoperative hyperglycaemia
(>7.8 mmol/l) was significantly associated with complications (OR 2.9, 95%CI 1.7 to
4.9). Overall, high glucose variability was not significantly associated with
postoperative complications, but early postoperative patients who had both high
glucose values and high variability had an OR for complications of 3.6 (95%CI 1.9
to 6.8) compared to the lower glucose dual.
Conclusions Early postoperative hyperglycaemia is associated with postoperative
complications after pancreatoduodenectomy. High glucose variability may enhance
this risk. Future research must demonstrate whether strict glucose control in the
early postoperative period prevents complications after pancreatoduodenectomy.
�������
68
1
2
3
4
5
6
7
8
9
10
11
12
13
14
15
INTRODUCTION
Although mortality of pancreatoduodenectomy (PD) is well below 5% in high
volume centres, complications occur in up to 50% of patients. Most prevalent
surgical complications include delayed gastric emptying, leakage of
pancreaticojejunostomy or hepaticojejunostomy and infectious complications.
Complications that are not directly related to surgery are mostly of cardiac,
pulmonary or urogenital origin.1-4
Numerous studies have been carried out to identify risk factors for the development
of complications after PD. Factors reported to be associated with morbidity after
PD include high body mass index, diabetes mellitus, high preoperative blood urea
nitrogen and low preoperative serum albumin, longer duration of surgery,
intraoperative blood transfusion and a small, non-dilated main pancreatic duct.5-11
Higher perioperative glucose levels have been shown to be associated with
complications after various types of cardiac, general, vascular and orthopaedic
surgery.12-18 This effect is generally attributed to an impaired immune response, in
combination with an excessive release of stress hormones and inflammatory
cytokines resulting in diminished insulin action.12;15;17 However, perioperative
hyperglycaemia does not increase postoperative morbidity in all types of surgery: in
oesophageal resection no relation was found between early postoperative
hyperglycaemia and postoperative complications.19
The relation between perioperative glucose levels and postoperative complications
after PD has never been investigated. Apart from surgical stress hyperglycaemia,
patients undergoing PD might be extra susceptible to disarrangement of glucose
levels: pancreatic cancer - the main indication for PD - is associated with
progressive hyperglycemia and (new onset) diabetes mellitus in 20% to 30% of
patients before diagnosis.20-22 The operation itself involves manipulation and
resection of pancreatic tissue, and resection of the duodenum, one of the enteric
regions where the incretin hormone GIP (glucose-dependent insulinotropic
polypeptide) is released, which assists in maintaining glucose homeostasis.
Together, this may render patients hyperglycaemic.23;24
Aiming for near-normal glucose levels (4.4 to 6.1 mmol/l) in a surgical intensive
care unit (ICU) significantly reduced mortality.25 Although subsequent studies on
such strict glucose control has yielded conflicting results in various populations, it
seems to reduce mortality and morbidity in surgical ICU patients.26
Because patients undergoing PD are at risk for hyperglycaemia, it seems important
to establish whether increased perioperative glucose levels are associated with poor
���� �������������� ����� ������������������������������������������
69

outcome, especially since strict glucose control may be beneficial in this
population.26 The aim of the present study was therefore to investigate the
association of perioperative glucose levels with postoperative complications after
PD.
�������
70

1
2
3
4
5
6
7
8
9
10
11
12
13
14
15
METHODS
Patients and study outline
In a consecutive series of 330 patients undergoing elective PD between July 2000
and December 2006 for suspected pancreatic or periampullary malignancy,
clinicopathologic data, demographics and postoperative outcomes were
prospectively registered. Glucose values were analysed retrospectively. Since the
present study involved a retrospective analysis of anonymised data, the Dutch
Ethical Review Board regulations do not require informed consent.
Surgical Procedure
The standard surgical procedure was the pylorus-preserving PD with removal of
lymph nodes at the right side of the portal vein, as earlier described.27 In case of
tumor ingrowth in pylorus or duodenum, a classic WhippleÊs resection was
performed. If minimal tumor ingrowth in the portal or superior mesenteric vein
was found, a segmental or wedge resection was carried out.28 Reconstruction was
performed by retrocolic hepaticojejunostomy and pancreaticojejunostomy and
retrocolic or antecolic duodenojejunostomy, without Roux-Y reconstruction. One
silicone drain was left in the foramen of Winslow near the hepaticojejunostomy and
pancreaticojejunostomy.27 Feeding jejunostomy was not standard.29 Octreotide was
routinely administered for 7 days until 2002, and afterwards on indication of soft
pancreatic tissue or small pancreatic duct. Postoperatively, patients stayed at the
recovery room until the morning of the first postoperative day, before returning to
the surgical ward.
Measures of glucose
The most recent venous plasma glucose level within 4 months before surgery was
collected from the clinical information system or patient chart. Details about
fasting or non-fasting state were mostly unknown. All available intraoperative and
early postoperative glucose values (from operation until the end of the first
postoperative day) were collected. During surgery and in the early postoperative
period (defined as the period at the recovery room, or in case of extended stay at the
recovery room, until postoperative day 1), all blood glucose values were fasting.
They were measured by a blood gas/pH analyzer (Ciba Corning 865, Chiron
Diagnostics, Medford, MA, USA) in blood samples obtained from an arterial
catheter, and automatically stored in the hospital information system. We
calculated the mean intraoperative and early postoperative glucose value per
���� �������������� ����� ������������������������������������������
71

patient. Furthermore, as a measure of glucose variability, the standard deviations
(SD) of intraoperative and early postoperative glucose values in each patient were
calculated.
Outcome measures
Primary outcome measure was whether the patient experienced any postoperative
complication. All surgical complications and non-surgical complications were taken
into account.
Secondary outcome measures were the occurrence of a surgical complication, the
occurrence of an infectious complication, a score of IIIa or higher in the Dindo-
Clavien classification of complications, delayed gastric emptying and
pancreaticojejunostomy leakage (grade B or C according to the International Study
Group of Pancreatic Surgery criteria), relaparotomy, admission to intensive or
medium care unit or readmission to the recovery room, length of hospital stay, and
hospital readmission within 30 days.30-32
Statistical analyses
Results are presented as mean � SD or median with interquartile range (IQR),
depending on the distribution of the data.
All glucose variables (the preoperative value, mean and SD of intraoperative and
early postoperative values) were divided into duals of equal group size. Using
multivariate binary logistic regression, we calculated Odds Ratios (OR) for all
dichotomous outcome measures for patients in the upper versus the lower dual.
Correlation with length of hospital stay (Natural log (Ln)-transformed) was
calculated using linear regression. Calculations were carried out separately for
each period (preoperative, intraoperative and early postoperative). Analyses were
adjusted for age, gender, ASA-classification, body mass index (BMI), diabetes
mellitus, intraoperative blood transfusion, duration of surgery, intraoperative
insulin administration and octreotide use. Analyses of SD were also adjusted for
the mean glucose value in the respective period.
Finally, secondary outcomes analyses were corrected for multiple testing according
to Benjamini and Hochberg.33 p-values below 0.05 were considered statistically
significant. All analyses were performed in SPSS version 16.0 (SPSS Inc.,Chicago,
IL, USA).
�������
72

1
2
3
4
5
6
7
8
9
10
11
12
13
14
15
RESULTS
Patient population
Patient and operative characteristics are summarised in Table 1. Mean age of the
cohort was 62 (SD 12); 56% was male and 16% had diabetes mellitus. A
preoperative glucose value was available in 79% of patients. At least one
intraoperative glucose value was available in 97% of patients and at least one early
postoperative glucose value was available in 99% of patients (Table 2).
Table 1-baseline and operative characteristics of 330 patients undergoing pancreatoduodenectomy in the period July 2000 – December 2006
Baseline characteristics Age, years (mean, SD) 62.3 12 Male sex, n (%) 185 (56) ASA I, n (%) 58 (18) ASA II, n (%) 209 (63) ASA III, n (%) 63 (19) Body Mass Index, n (%) -Underweight (<18.5) 19 (6) -Normal weight (18.5 – 24.9) 173 (52) -Overweight (25 – 29.9) 120 (36) -Obese (30 or higher) 18 (6) Diabetes Mellitus, n (%) 53 (16) Underlying disease, n (%) -Pancreatic adenocarcinoma 103 (31) -Ampullary adenocarcinoma 77 (23) -Distal CBD adenocarcinoma 43 (13) -Other (pre)malignant 58 (18) -Chronic pancreatitis 32 (10) -Other benign 17 (5)
Operative characteristics
Operative time, minutes (median, IQR) 280 (242-338) Blood transfusions, n (%) -None 259 (78) -1-3 59 (18) -4 or more 12 (4) Pylorus preserved, n (%) 299 (91)
SD, standard deviation; ASA, American Society of Anesthesiologists; CBD, common bile duct; IQR, interquartile range
���� �������������� ����� ������������������������������������������
73

Preoperative Intraoperative Early Postoperative
Glu
cose
(mm
ol/l)
with
95%
CI
P<0.0018.2
8.0
7.8
7.6
7.4
7.2
7.0
6.8
Mean preoperative glucose was 7.5 (SD 4.2) mmol/l and mean intraoperative
glucose 7.4 (SD 1.9) mmol/l. Intraoperative insulin was administered in 14% of
patients. During stay at recovery, mean glucose was significantly higher as
compared to the intraoperative period: 7.9 (SD 1.5) mmol/l (p<0.001, paired t-test,
Figure 1).
Table 2-perioperative glucose values of 330 patients undergoing pancreatoduodenectomy
Moment of sampling Preoperative -Preoperative value available, n (%) 259 (79) -Preoperative value, mmol/l* (mean, SD) 7.5 (4.2) Intraoperative -At least 1 value available, n (%) 320 (97) ->1 value available, n (%) 263 (80) -No. of samples per patient (mean, SD) 2.9 (1.6) -Intraoperative value, mmol/l (mean, SD) 7.4 (1.9) -Standard deviation mmol/l (mean, SD) 1.0 (1.2) Early postoperative -At least 1 value available, n (%) 329 (100) ->1 value available, n (%) 328 (99) -No. of samples per patient (mean,SD) 4.3 (1.9) -Postoperative value, mmol/l (mean, SD) 7.9 (1.5) -Standard deviation, mmol/l (mean, SD) 1.1 (0.9)
SD, standard deviation
Figure 1- mean glucose values pre-, intra-, and early postoperative
�������
74

1
2
3
4
5
6
7
8
9
10
11
12
13
14
15
Postoperative morbidity was 58%. Surgical complications occurred in 48% of
patients; most prevalent complications were delayed gastric emptying and
pancreaticojejunostomy leakage (Table 3); 83 patients (25%) had a complication of
grade IIIa or higher in the Dindo-Clavien classification (Table 4). There were no
significant differences in complications in patients with or without diabetes (Table
5).
Table 3-postoperative complications and other outcomes in 330 patients undergoing pancreatoduodenectomy
Complication
Any complication, n (%) 191 (58) Surgical complications, n (%) 158 (48) -Delayed gastric emptying (ISGPS grade B or C) 99 (30) -Pancreaticojejunostomy leakage (ISGPS grade B or C) 52 (16) -Postpancreatectomy hemorrhage (ISGPS grade B or C) 17 (5) -Hepaticojejunostomy leakage 11 (3) -Intra-abdominal abscess (without PJ- or HJ-leakage) 10 (3) -Wound infection 43 (13) -Other 45 (14) Non-surgical complications, n (%) 97 (29) -Pneumonia 17 (5) -Other pulmonary 21 (6) -Cardiac 25 (8) -Urinary tract infection 45 (14) -Other 31 (9) Infectious complications, n (%) 140 (42)
Other outcomes
In-hospital mortality, n (%) 7 (2) Reoperation, n (%) 22 (7) Admission to ICU/MC or readmission to recovery room, n (%) 42 (13) Length of hospital stay - days, (median, IQR) 12 (9-21) Hospital readmission within 30 days, n (%) 29 (9)
ISGPS, International Study Group of Pancreatic Surgery; PJ, pancreaticojejunostomy; HJ, hepaticojejunostomy; ICU, intensive care unit; MC, medium care; IQR, interquartile range
Table 4-classification of 330 patients undergoing pancreatoduodenectomy according to the Clavien-Dindo classification of complications
Clavien-Dindo grade, n (%) 0 – No complication 121 (37) I – No pharmacologic treatment or intervention needed* 21 (6) II – Requiring pharmacological treatment† 105 (32) IIIa – Requiring intervention – not under general anesthesia 35 (11) IIIb – Requiring intervention – under general anesthesia 3 (1) IVa – Life-threatening complication requiring MC/IC management, single organ dysfunction 34 (10) IVb – As IVa, but with multiple organ dysfunction 3 (1) V – Death 8 (2)
MC, medium care; IC, intensive care * Allowed: antiemetics, antipyretics, analgetics, diuretics, electrolytes, physiotherapy, wound infections opened at bedside † Includes blood transfusions and total parenteral nutrition
���� �������������� ����� ������������������������������������������
75

Table 5-distribution of glucose levels and complications after 330 pancreatoduodenectomies in patients without diabetes and patients with diabetes
Glucose values in mmol/l, results presented as mean (SD). * Chi-squared test for between group difference in any complication p = 0.16
Perioperative glucose values and postoperative complications
Preoperative and mean intraoperative glucose values were not associated with the
occurrence of a postoperative complication (Figure 2). In the early postoperative
period, a higher mean glucose (>7.8 mmol/l) was significantly associated with
postoperative complication (OR 2.9, 95%CI 1.7 to 4.9) (Figure 2). A Receiver-
Operator-Characteristic curve (ROC-curve) showed that a cut-off point of 7.8
mmol/l was the best discriminative value for the occurrence of a postoperative
complication, with a sensitivity of 0.58 and a specificity of 0.63 (curve not shown).
High glucose variability during operation or in the early postoperative period was
not associated with the occurrence of a postoperative complication. Patients in the
upper dual for both mean glucose value and glucose variability in the early
postoperative period had an OR for the development of a postoperative complication
of 3.6 (95%CI 1.9 to 6.8) compared to the lower glucose dual.
Secondary outcome measures
Preoperative and mean intraoperative glucose values were not associated with any
of the secondary outcome measures (Figure 2). A higher mean early postoperative
glucose value was significantly associated with surgical and infectious
complications (ORs 2.0, 95% CI 1.2 to 3.2, and 2.3, 95% CI 1.4 to 3.8, respectively),
delayed gastric emptying (OR 2.1, 95% CI 1.2 to 3.7), Dindo-Clavien complication
score >=III (OR 2.3, 95% CI 1.3 to 4.3), and relaparotomy (OR 6.1, 95% CI 1.6 to
24.1). Length of stay was 1.2 days (95% CI 1.1 to 1.4, p=0.01) longer in the upper
dual. High glucose variability intraoperatively or in the early postoperative period
was not associated with any of the secondary outcome measures.
Preoperative Intraoperative Early postoperative
Any complication* N (%)
No diabetes (n=277) 6.5 (2.1) 7.1 (1.4) 7.9 (1.4) 165 (59.6) Diabetes (n=53) 11.5 (7.2) 8.7 (3.3) 8.2 (2.1) 26 (49.1)
�������
76

1
2
3
4
5
6
7
8
9
10
11
12
13
14
15
Odds ratio w
ith 95% C
I
0,11
10
Clavien => III
Readm
ission
ICU
admittance
Relaparotom
y
DG
E
PJ leakage
Infectious complications
Surgical com
plications
Any com
plication
Mean P
reoperative Glucose
0.9 (0.5-1.5)
1.1 (0.7-1.9)1.7 (0.8-3.9)
1.5 (0.8-2.7)
1.0 (0.6-1.8)
1.3 (0.6-2.4)
1.1 (0.3-3.8)2.7 (0.9-7.7)
1.6 (0.7-3.8)
Odds ratio w
ith 95% C
I
0,11
10
Clavien => III
Readm
ission
ICU
admittance
Relaparotom
y
DG
E
PJ leakage
Infectious complications
Surgical com
plications
Any com
plication
Mean Intraoperative G
lucose
0.8 (0.5-1.4)
0.8 (0.5-1.4)
0.8 (0.5-1.3)
0.5 (0.2-1.2)
1.2 (0.7-2.2)
0.9 (0.3-2.9)
0.4 (0.2-1.0)
0.6 (0.2-1.5)
0.9 (0.5-1.7)
Odds ratio w
ith 95% C
I
0,11
10
Clavien => III
Readm
ission
ICU
admittance
Relaparotom
y
DG
E
PJ leakage
Infectious complications
Surgical com
plications
Any com
plication
Mean E
arly Postoperative G
lucose
2.9 (1.7-4.9), P<0.001
2.0 (1.2-3.2), P=0.01
2.3 (1.4-3.8), P=0.02
1.6 (0.8-3.2), P=0.24
2.2 (1.2-3.7), P=0.02
1.5(0.7-3.5),P=0.28
6.2 (1.6-24.3), P=0.01
2.0 (0.8-5.0), P=0.17
2.4 (1.3-4.3), P=0.02
Figure 2A
-odds ratios
(OR
s) for
all outcom
es com
paring patients
with
preoperative glucose of >=6.30 mm
ol/l to patients <6.30 m
mol/l. A
fter correction for m
ultiple testing, none of the OR
s were
significant. ICU
= Adm
ission to intensive care
unit, m
edium
care unit
or readm
ission to the recovery room.
PJ,
pancreaticojejunostomy
leakage; D
GE
, delayed gastric emptying
Figure 2B
-odds ratios
(OR
s) for
all outcom
es com
paring patients
with
intraoperative glucose of >=7.06 mm
ol/l to patients <7.06 m
mol/l. A
fter correction for m
ultiple testing, none of the OR
s were
significant. ICU
= Adm
ission to intensive care unit, m
edium care unit or readm
ission to the recovery room
. P
J, pancreaticojejunostom
y leakage;
DG
E, delayed gastric em
ptying
Figure 2C
-odds ratios
(OR
s) for
all outcom
es comparing patients w
ith early postoperative glucose of >=7.78 m
mol/l to
patients <7.78
mm
ol/l. p
values are
adjusted for
multiple
testing. IC
U=
Adm
ission to intensive care unit, medium
care unit or readm
ission to the recovery room
. P
J, pancreaticojejunostom
y leakage;
DG
E, delayed gastric em
ptying
�
���� �������������� ����� ������������������������������������������
77

DISCUSSION
In this study we showed that early postoperative hyperglycaemia (>7.8 mmol/l)
after pancreatoduodenectomy was significantly associated with the development of
a postoperative complication, possible confounders taken into account. This was
reflected by a higher risk of surgical and infectious complications, delayed gastric
emptying, Dindo-Clavien complication score >=III and relaparotomy. Also length of
stay was significantly longer in these patients. When elevated postoperative
glucose was accompanied by high glucose variability, the risk of a postoperative
complication seemed to increase. These novel findings were all adjusted for age,
gender, ASA-classification, BMI, diabetes mellitus, intraoperative blood
transfusion, duration of surgery, intraoperative insulin administration and use of
octreotide. Mean glucose levels before and during PD were comparable and
significantly lower as compared to early postoperative levels. Elevated preoperative
and intraoperative glucose and higher glucose variability were not associated with
the development of complications.
Our findings that early postoperative higher glucose levels are associated with
complications after PD are in line with previous studies investigating this relation
in other types of surgery. Ramos and coworkers identified postoperative
hyperglycaemia as a significant risk factor for postoperative infections in general
and vascular surgery.13 Vriesendorp et al observed an OR of 5.1 (95% CI 1.6 to
17.1) for postoperative infections when early postoperative glucose values were 8.4
mmol/l or above in peripheral vascular surgery.12 Also the seemingly additional
detrimental effect of high glucose variability was described before in populations of
critically ill and surgical intensive care unit patients.34;35 Although it is difficult to
elucidate whether hyperglycaemia results from postoperative complications or
indeed contributes to their development, we believe the latter mechanism is might
be most plausible, but should be proven in the future by early regulation and
control. As the increase in glucose levels preceded the development of complications
and possible confounders were accounted for in the analyses, a causal relation
between elevated glucose levels postoperatively and the development of
complications is suspected.
Early postoperative hyperglycaemia was associated with the most prevalent
complication in our cohort, delayed gastric emptying. Besides being a common
complication after pancreatoduodenectomy, gastroparesis is a well-known
complication of longstanding diabetes mellitus. It has also been associated with
acute hyperglycaemia.36
�������
78

1
2
3
4
5
6
7
8
9
10
11
12
13
14
15
Several explanations for the harmful effects of both stress hyperglycaemia and
glucose variability have been proposed, such as glucose toxicity and oxidative
stress, stimulating intracellular pathways that lead to detrimental tissue effects
such as mitochondrial dysfunction and immune dysregulation.22;37 Although the
application of strict glucose control has led to conflicting results in a variety of
populations, a recent meta-analysis suggests that surgical ICU patients benefit
from strict glucose control.26 Okabayashi and coworkers recently showed that strict
control of perioperative blood glucose following pancreatic resection is possible, and
may reduce postoperative infection rates.38;39
We found that in PD, intraoperative glucose levels were comparable to preoperative
levels, and that pre- and intraoperative glucose values and variability were not a
risk factor for postoperative complications after PD. Intraoperative glucose values
have earlier been described as risk factor for adverse outcomes in cardiac surgery
and liver transplantation.14;15;40;41 Contrary to PD, these operations involve
substantial ischemia and reperfusion injury, which may explain these seemingly
contradictory different findings.
Interestingly, the mean glucose in patients with diabetes decreased after surgery as
compared to the intraoperative values, indicating a different glucose response to
surgery. Diabetes patients did not have more complications than non-diabeties
patients in our series, whereas diabetes mellitus has been described as a risk factor
for intra-abdominal complications after PD.8 Our cohort was however too small to
draw firm conclusions about the diabetes subpopulation.
Using an ROC-curve analysis we found that the cut-off value of 7.8 mmol/l early
postoperatively was the most discriminatory value when predicting complications.
This was comparable to our population mean and median value. Perhaps not
coincidentally, normal healthy subjects will not peak above 7.8 mmol/l when
challenged with oral glucose, supporting the strength of this cut-off value.42
Our study was limited by the retrospective collection of glucose values.
Preoperative values were not available in 21% of patients. However, postoperative
morbidity in these patients was not different from patients who did have a
preoperative value available (59% versus 58%, data not shown). Glucose sampling
was not standardised, leading to differences in timing, amount and indication of
glucose samples. To minimise these sources of error, the average glucose value per
period was taken. Also, intraoperative and postoperative glucose values were
available in nearly all patients, showing that frequent perioperative sampling was
common, irrespective of the condition of the patient.
���� �������������� ����� ������������������������������������������
79

Our study is the first to investigate the effect of perioperative glucose levels in this
specific patient group with pancreatic disease. It was performed in a large
consecutive series of elective patients. Patient characteristics and hospital course
were prospectively scored.
In conclusion, early postoperative glucose levels above 7.8 mmol/l are significantly
associated with postoperative complications after PD. Future research must clarify
the underlying mechanisms and pathways of this relation. Treatment of
hyperglycaemia is possible and strict glucose control may be favourable in surgical
patients.26 A randomised clinical trial should be conducted to investigate whether a
strategy of strict glucose control (versus glucose correction on indication) in the
early postoperative period is beneficial in this patient group.
�������
80

1
2
3
4
5
6
7
8
9
10
11
12
13
14
15
REFERENCES
(1) Bassi C, Falconi M, Salvia R, Mascetta G, Molinari E, Pederzoli P. Management of complications after pancreaticoduodenectomy in a high volume centre: results on 150 consecutive patients. Dig Surg 2001; 18(6):453-457.
(2) de Castro SM, Busch OR, van Gulik TM, Obertop H, Gouma DJ. Incidence and management of pancreatic leakage after pancreatoduodenectomy. Br J Surg 2005; 92(9):1117-1123.
(3) van Heek NT, Kuhlmann KF, Scholten RJ, de Castro SM, Busch OR, van Gulik TM et al. Hospital volume and mortality after pancreatic resection: a systematic review and an evaluation of intervention in the Netherlands. Ann Surg 2005; 242(6):781-8, discussion.
(4) Yeo CJ, Cameron JL, Sohn TA, Lillemoe KD, Pitt HA, Talamini MA et al. Six hundred fifty consecutive pancreaticoduodenectomies in the 1990s: pathology, complications, and outcomes. Ann Surg 1997; 226(3):248-257.
(5) House MG, Fong Y, Arnaoutakis DJ, Sharma R, Winston CB, Protic M et al. Preoperative predictors for complications after pancreaticoduodenectomy: impact of BMI and body fat distribution. J Gastrointest Surg 2008; 12(2):270-278.
(6) Su Z, Koga R, Saiura A, Natori T, Yamaguchi T, Yamamoto J. Factors influencing infectious complications after pancreatoduodenectomy. J Hepatobiliary Pancreat Surg 2009.
(7) Williams TK, Rosato EL, Kennedy EP, Chojnacki KA, Andrel J, Hyslop T et al. Impact of obesity on perioperative morbidity and mortality after pancreaticoduodenectomy. J Am Coll Surg 2009; 208(2):210-217.
(8) Cheng Q, Zhang B, Zhang Y, Jiang X, Zhang B, Yi B et al. Predictive factors for complications after pancreaticoduodenectomy. J Surg Res 2007; 139(1):22-29.
(9) Fathy O, Wahab MA, Elghwalby N, Sultan A, EL-Ebidy G, Hak NG et al. 216 cases of pancreaticoduodenectomy: risk factors for postoperative complications. Hepatogastroenterology 2008; 55(84):1093-1098.
(10) Muscari F, Suc B, Kirzin S, Hay JM, Fourtanier G, Fingerhut A et al. Risk factors for mortality and intra-abdominal complications after pancreatoduodenectomy: multivariate analysis in 300 patients. Surgery 2006; 139(5):591-598.
(11) Winter JM, Cameron JL, Yeo CJ, Alao B, Lillemoe KD, Campbell KA et al. Biochemical markers predict morbidity and mortality after pancreaticoduodenectomy. J Am Coll Surg 2007; 204(5):1029-1036.
(12) Vriesendorp TM, Morelis QJ, Devries JH, Legemate DA, Hoekstra JB. Early post-operative glucose levels are an independent risk factor for infection after peripheral vascular surgery. A retrospective study. Eur J Vasc Endovasc Surg 2004; 28(5):520-525.
(13) Ramos M, Khalpey Z, Lipsitz S, Steinberg J, Panizales MT, Zinner M et al. Relationship of perioperative hyperglycemia and postoperative infections in patients who undergo general and vascular surgery. Ann Surg 2008; 248(4):585-591.
(14) Gandhi GY, Nuttall GA, Abel MD, Mullany CJ, Schaff HV, Williams BA et al. Intraoperative hyperglycemia and perioperative outcomes in cardiac surgery patients. Mayo Clin Proc 2005; 80(7):862-866.
(15) Park C, Hsu C, Neelakanta G, Nourmand H, Braunfeld M, Wray C et al. Severe intraoperative hyperglycemia is independently associated with surgical site infection after liver transplantation. Transplantation 2009; 87(7):1031-1036.
(16) Olsen MA, Nepple JJ, Riew KD, Lenke LG, Bridwell KH, Mayfield J et al. Risk factors for surgical site infection following orthopaedic spinal operations. J Bone Joint Surg Am 2008; 90(1):62-69.
���� �������������� ����� ������������������������������������������
81

(17) Vilar-Compte D, Alvarez dI, I, Martin-Onraet A, Perez-Amador M, Sanchez-Hernandez C, Volkow P. Hyperglycemia as a risk factor for surgical site infections in patients undergoing mastectomy. Am J Infect Control 2008; 36(3):192-198.
(18) Ambiru S, Kato A, Kimura F, Shimizu H, Yoshidome H, Otsuka M et al. Poor postoperative blood glucose control increases surgical site infections after surgery for hepato-biliary-pancreatic cancer: a prospective study in a high-volume institute in Japan. J Hosp Infect 2008; 68(3):230-233.
(19) Vriesendorp TM, Devries JH, Hulscher JB, Holleman F, van Lanschot JJ, Hoekstra JB. Early postoperative hyperglycaemia is not a risk factor for infectious complications and prolonged in-hospital stay in patients undergoing oesophagectomy: a retrospective analysis of a prospective trial. Crit Care 2004; 8(6):R437-R442.
(20) Pannala R, Leibson CL, Rabe KG, Timmons LJ, Ransom J, de AM et al. Temporal association of changes in fasting blood glucose and body mass index with diagnosis of pancreatic cancer. Am J Gastroenterol 2009; 104(9):2318-2325.
(21) Chari ST, Leibson CL, Rabe KG, Timmons LJ, Ransom J, de AM et al. Pancreatic cancer-associated diabetes mellitus: prevalence and temporal association with diagnosis of cancer. Gastroenterology 2008; 134(1):95-101.
(22) Dungan KM, Braithwaite SS, Preiser JC. Stress hyperglycaemia. Lancet 2009; 373(9677):1798-1807.
(23) Freeman JS. Role of the incretin pathway in the pathogenesis of type 2 diabetes mellitus. Cleve Clin J Med 2009; 76 Suppl 5:S12-S19.
(24) Slezak LA, Andersen DK. Pancreatic resection: effects on glucose metabolism. World J Surg 2001; 25(4):452-460.
(25) Van den Berghe G, Wouters P, Weekers F, Verwaest C, Bruyninckx F, Schetz M et al. Intensive insulin therapy in the critically ill patients. N Engl J Med 2001; 345(19):1359-1367.
(26) Griesdale DE, de Souza RJ, van Dam RM, Heyland DK, Cook DJ, Malhotra A et al. Intensive insulin therapy and mortality among critically ill patients: a meta-analysis including NICE-SUGAR study data. CMAJ 2009; 180(8):821-827.
(27) Gouma DJ, Nieveen van Dijkum EJ, Obertop H. The standard diagnostic work-up and surgical treatment of pancreatic head tumours. Eur J Surg Oncol 1999; 25(2):113-123.
(28) van Geenen RC, ten Kate FJ, de Wit LT, van Gulik TM, Obertop H, Gouma DJ. Segmental resection and wedge excision of the portal or superior mesenteric vein during pancreatoduodenectomy. Surgery 2001; 129(2):158-163.
(29) Heslin MJ, Latkany L, Leung D, Brooks AD, Hochwald SN, Pisters PW et al. A prospective, randomized trial of early enteral feeding after resection of upper gastrointestinal malignancy. Ann Surg 1997; 226(4):567-577.
(30) Bassi C, Dervenis C, Butturini G, Fingerhut A, Yeo C, Izbicki J et al. Postoperative pancreatic fistula: an international study group (ISGPF) definition. Surgery 2005; 138(1):8-13.
(31) Dindo D, Demartines N, Clavien PA. Classification of surgical complications: a new proposal with evaluation in a cohort of 6336 patients and results of a survey. Ann Surg 2004; 240(2):205-213.
(32) Wente MN, Bassi C, Dervenis C, Fingerhut A, Gouma DJ, Izbicki JR et al. Delayed gastric emptying (DGE) after pancreatic surgery: a suggested definition by the International Study Group of Pancreatic Surgery (ISGPS). Surgery 2007; 142(5):761-768.
(33) Benjamini Y, Hochberg Y. Controlling the False Discovery Rate: a Practical and Powerful Approach to Multiple Testing. Journal of the Royal Statistical Society 1995; 57(1):289-300.
(34) Dossett LA, Cao H, Mowery NT, Dortch MJ, Morris JM, Jr., May AK. Blood glucose variability is associated with mortality in the surgical intensive care unit. Am Surg 2008; 74(8):679-685.
�������
82

1
2
3
4
5
6
7
8
9
10
11
12
13
14
15
(35) Hermanides J, Vriesendorp TM, Bosman RJ, Zandstra DF, Hoekstra JB, Devries JH. Glucose variability is associated with intensive care unit mortality. Crit Care Med 2010; 38(3):838-42
(36) De Block CE, De L, I, Pelckmans PA, Van Gaal LF. Current concepts in gastric motility in diabetes mellitus. Curr Diabetes Rev 2006; 2(1):113-130.
(37) Brownlee M. The pathobiology of diabetic complications: a unifying mechanism. Diabetes 2005; 54(6):1615-1625.
(38) Hanazaki K, Okabayashi T, Maeda H. Hepatectomized PatientsTight Glycemic Control Using an Artificial Pancreas to Control Perioperative Hyperglycemia Decreases Surgical Site Infection in Pancreatectomized or Hepatectomized Patients. Ann Surg 2009; 250(2):351.
(39) Okabayashi T, Nishimori I, Yamashita K, Sugimoto T, Maeda H, Yatabe T et al. Continuous postoperative blood glucose monitoring and control by artificial pancreas in patients having pancreatic resection: a prospective randomized clinical trial. Arch Surg 2009; 144(10):933-937.
(40) Ammori JB, Sigakis M, Englesbe MJ, O'Reilly M, Pelletier SJ. Effect of intraoperative hyperglycemia during liver transplantation. J Surg Res 2007; 140(2):227-233.
(41) Doenst T, Wijeysundera D, Karkouti K, Zechner C, Maganti M, Rao V et al. Hyperglycemia during cardiopulmonary bypass is an independent risk factor for mortality in patients undergoing cardiac surgery. J Thorac Cardiovasc Surg 2005; 130(4):1144.
(42) American Diabetes Association. Diagnosis and classification of diabetes mellitus. Diabetes care 2008; 31(Suppl. 1):S55-S60.
���� �������������� ����� ������������������������������������������
83


DETECTION AND TREATMENT OF HYPERGLYCAEMIA

Sense and nonsense in sensors
J Hermanides and JH DeVries
Diabetologia, 2010 April;53:593-596
ABSTRACT
Continuous subcutaneous glucose monitoring (CGM) is a developing technology in
the treatment of diabetes mellitus. The first randomised controlled trials on its
efficacy have been performed. In several studies, CGM lowered HbA1c in adult
patients with suboptimally type 1 diabetes mellitus, when selecting compliant
patients who tolerate the device. However, as a preventive tool for hypoglycaemia,
CGM has not fulfilled the great expectations. Increasing reimbursement of CGM is
expected in the near future, awaiting studies on cost-effectiveness.
�������
88
1
2
3
4
5
6
7
8
9
10
11
12
13
14
15
INTRODUCTION
Pioneering work of artificially replacing the glucose-monitoring function of the
pancreas started in the 1970s.1 With the introduction of the microdialysis
technique in the early 1990s, the future of continuous subcutaneous glucose
monitoring (CGM) seemed bright and shiny.2;3 The great expectation was that, by
providing the patient with a continuous stream of data and alarms for otherwise
unrecognised (nocturnal) hypo- and hyperglycaemia, the HbA1c target of <7% was
in reach and the main barrier to effective diabetes treatment·the occurrence of
severe hypoglycaemia·could be overcome.4-6 Even more, integrating CGM and
continuous subcutaneous insulin infusion (CSII) would mean it would be a matter
of time before the closed-loop system would be available.7 Several years later, the
first needle-type sensor became clinically available, though it could only be read out
retrospectively.8 Currently, there are three real-time CGM systems on the market
that are approved by the US Food and Drug Administration (FDA) and have the
Conformité Européenne (CE) mark: the Freestyle Navigator (Abbott Diabetes Care,
Alameda, CA, USA); the Guardian Real-Time (Medtronic MiniMed, Northridge,
CA, USA); and the DexCom SEVEN (DexCom, San Diego, CA, USA; only available
in the USA). All these systems measure glucose in the subcutaneous tissue and
provide real-time glucose measurements every 1 to 5 min. The first randomised
controlled trials (RCTs) have now been performed with real-time CGM, prompting
the next questions: did the sensor fulfil expectations and is this reflected in the
current reimbursement status of the device?
EFFECT ON HbA1C
The first RCT, performed by Deiss and colleagues, investigated a needle-type
continuous subcutaneous glucose monitor in patients with poorly controlled type 1
diabetes (HbA1c >=8.1% on intensive treatment).9 There was a difference in HbA1c
reduction of 0.6% after 3 months in favour of patients who were instructed to use
the device continuously, as compared with patients using conventional treatment.
In a third arm, patients used CGM biweekly, and this did not result in a significant
HbA1c improvement. A subsequent 26 week randomised treat-to-target study
performed by Hirsch and coworkers (the STAR 1 trial) yielded disappointing
results.10 There was no significant difference in change in HbA1c between type 1
diabetes patients using CSII randomised to either augmenting their current
therapy with CGM or continuing with their standard self-monitoring of blood
��� ������� �� ��� �� ��
89

glucose (SMBG). In both groups, there was a decrease in HbA1c of 0.6 to 0.7%. That
the decreases in HbA1c were comparable in both groups was attributed to
intensification of the treatment in both the control and intervention groups. It
seems that in an attempt to assure equal attention times in both groups, the
control group was treated more intensively than would be feasible in daily practice.
In the Juvenile Diabetes Research Foundation (JDRF) study, three different age
groups (º25, 15 to 24 and 8 to 14 years) were randomised to either CGM or SMBG
continuation.11 All patients had type 1 diabetes and the vast majority were already
using CSII. The mean difference in HbA1c change was 0.5% after 26 weeks in
favour of patients using CGM, but this was only in those aged 25 years and older.
No significant difference in HbA1c change was detected in the other age groups. In
both the STAR 1 and the JDRF trials, the frequency of sensor usage was strongly
correlated to the decrease in HbA1c. This is in line with the study from Deiss et al.9
and the recently published RealTrend study12. In this latter study, patients
administering multiple daily injections and with an HbA1c >=8% at inclusion
started with either CSII therapy or sensor-augmented pump therapy for 26 weeks.
From a predefined analysis, HbA1c improved compared with the CSII group only in
patients using the sensor >70% of the time. Unfortunately, patients in the sensor-
augmented pump group had already used CGM for 9 days before the baseline
HbA1c measurement was performed and therefore the observed HbA1c difference,
0.41%, may have been underestimated. The combination of CGM and CSII has also
been investigated in the recently presented Eurythmics trial, where a difference in
HbA1c improvement of 1.21% in favour of the sensor-augmented pump group was
found when type 1 diabetes patients (HbA1c at entry >=8.2%), who were using
multiple daily injection therapy and SMBG, were randomised to continuing their
current therapy or starting CGM-augmented insulin-pump therapy.13 It is
interesting that the JDRF trial and the Eurythmics trial, both showing a
significant HbA1c improvement in the intervention group, confronted patients with
a short period of blinded CGM usage at baseline before randomisation. Patients
who did not tolerate the device, and therefore would be likely to drop out or be non-
compliant during the study course, were at least partly filtered out before
randomisation.
EFFECT ON SEVERE HYPOGLYCAEMIA
The improvement in HbA1c in the different RCTs was not accompanied by a
significant increase in severe hypoglycaemia.9;11-13 This seems reassuring, but
�������
90

1
2
3
4
5
6
7
8
9
10
11
12
13
14
15
CGM did not fulfil the expectation that its use would reduce the frequency of severe
hypoglycaemic events.14 Even more, in the STAR 1 trial, the use of CGM was
associated with a significant increase in severe hypoglycaemia. This is most likely
related to the reduced awareness of auditory and vibratory alarms during
hypoglycaemia and non-use of the device during high-risk activities, such as
intensive sports. No study so far has shown a decrease in the frequency of severe
hypoglycaemia in a CGM arm as compared with the control arm in type 1 diabetes.
Indeed, sensors have an inaccuracy of up to 21% when comparing plasma glucose
values with subcutaneous glucose values.15 This inaccuracy is even more
pronounced in the hypoglycaemic range. In addition, the usefulness of the CGM
devices for detecting forthcoming hypoglycaemia is limited by a putative
physiological delay between the blood glucose and glucose concentration in the
subcutaneous tissue, which is accompanied by an instrumental delay of the
sensor.16 In other words, patients need more time to prevent hypoglycaemia,
especially when they have hypoglycaemia unawareness. Perhaps the developing
technology will result in an alarm function for predicting hypoglycaemia by using
the rate of change in glucose in the lower euglycaemic range. For now, CGM is
insufficient for the prevention of severe hypoglycaemia.
COSTS AND REIMBURSEMENT
Interestingly, it is the argument of possibly preventing severe hypoglycaemia that
has persuaded healthcare organisations in Israel to reimburse CGM use. Children
with type 1 diabetes who have experienced more than two severe hypoglycaemic
episodes within 1 year are entitled to CGM compensation. In addition, real-time
CGM is now covered by the majority of health plans in the USA, including the
federal Medicare program. Reimbursement is generally available for type 1
patients with severe hypoglycaemia or those who are not meeting American
Diabetes Association HbA1c targets. In the Netherlands and part of Italy,
retrospective CGM is currently reimbursed. The Czech Republic covers up to four
sensors per year for retrospective CGM and in Sweden, real-time CGM is
reimbursed for patients using CSII and having two or more severe hypoglycaemic
episodes per year, children who require at least ten plasma glucose tests per 24 h
and patients with HbA1c >10% while receiving optimised insulin therapy. The
reimbursement indication of hypoglycaemia illustrates that so far, coverage was
based on feeling rather than the (scarce) evidence. This is not to say that CGM is
not able to reduce severe hypoglycaemia, but we need randomised trials in patients
��� ������� �� ��� �� ��
91
at high risk for severe hypoglycaemia (i.e. those suffering from hypoglycaemia
unawareness). From the results of the clinical trials to date, we can now argue that
CGM offers a clear health benefit, expressed as HbA1c lowering, for type 1 diabetes
patients with HbA1c values above 8%. The additional costs for sensors are US$4380
per person year compared with US$550-2740 when using SMBG.17 Consequently,
we need to calculate whether the long-term health benefits of CGM following from
ascertained lowering of HbA1c outweigh the costs when compared with standard
care with multiple daily injections and/or insulin pumps. A similar comparison was
performed by Roze and colleagues indicating that the cost-effectiveness of CSII is
acceptable.18 A technical appraisal from the National Institute for Health and
Clinical Excellence (England and Wales) seems timely.
OTHER PATIENT GROUPS
The application of CGM in patient groups other than those with type 1 diabetes is
limited. No trials with adequate duration assessing HbA1c change have been
performed for patients with type 2 diabetes.19 One particular patient group that
warrants special attention is pregnant women with diabetes. CGM has proven
effective in improving glucose control at the end of pregnancy.20 It resulted in fewer
cases of macrosomia in the offspring, with an odds ratio of 0.36 (95% CI 0.13 to
0.98).21 As it concerns a limited time span, reimbursement of CGM in this group
should impose no significant financial burden on the healthcare system. Finally,
the use of CGM for treating in-hospital hyperglycaemia could be valuable, and the
first randomised studies are awaited. However, the advantage of CGM in this
setting may be less evident, as frequent blood sampling is standard practice in the
intensive care unit and CGM accuracy may suffer if the circulation is
compromised.22
CONCLUSION
CGM with or without CSII has been proven to lower HbA1c in adult patients with
type 1 diabetes mellitus and HbA1c values above 8%, when compliant patients who
tolerate the device are selected. However, CGM is not the final answer to severe
hypoglycaemia. Awaiting a cost-effectiveness analysis, increasing reimbursement of
CGM is expected.
�������
92

1
2
3
4
5
6
7
8
9
10
11
12
13
14
15
ACKNOWLEDGDEMENTS
No funding was received for this commentary. We acknowledge N. Papo (Senior
Reimbursement Manager, Medtronic International Trading Sárl, Tolochenaz
Switzerland) for providing information on the current global reimbursement status
of CGM.
��� ������� �� ��� �� ��
93

REFERENCES
(1) Albisser AM, Leibel BS. 9 The artificial pancreas. Clinics in Endocrinology and
Metabolism 1977; 6(2):457-479.
(2) Bolinder J, Ungerstedt U, Arner P. Long-term continuous glucose monitoring with microdialysis in ambulatory insulin-dependent diabetic patients. Lancet 1993; 342(8879):1080-1085.
(3) Bolinder J, Ungerstedt U, Arner P. Microdialysis measurement of the absolute glucose concentration in subcutaneous adipose tissue allowing glucose monitoring in diabetic patients. Diabetologia 1992; 35(12):1177-1180.
(4) American Diabetes Association. Standards of Medical Care in Diabetes--2008. Diabetes Care 2008; 31(Supplement_1):S12-S54.
(5) Cryer PE. The barrier of hypoglycemia in diabetes. Diabetes 2008; 57(12):3169-3176.
(6) Wentholt IM, Maran A, Masurel N, Heine RJ, Hoekstra JB, DeVries JH. Nocturnal hypoglycaemia in Type 1 diabetic patients, assessed with continuous glucose monitoring: frequency, duration and associations. Diabet Med 2007; 24(5):527-532.
(7) Hanaire H. Continuous glucose monitoring and external insulin pump: towards a subcutaneous closed loop. Diabetes Metab 2006; 32(5 Pt 2):534-538.
(8) Gross TM, Bode BW, Einhorn D, Kayne DM, Reed JH, White NH et al. Performance evaluation of the MiniMed continuous glucose monitoring system during patient home use. Diabetes Technol Ther 2000; 2(1):49-56.
(9) Deiss D, Bolinder J, Riveline JP, Battelino T, Bosi E, Tubiana-Rufi N et al. Improved Glycemic Control in Poorly Controlled Patients with Type 1 Diabetes Using Real-Time Continuous Glucose Monitoring. Diabetes Care 2006; 29(12):2730-2732.
(10) Hirsch IB, Abelseth J, Bode BW, Fischer JS, Kaufman FR, Mastrototaro J et al. Sensor-Augmented Insulin Pump Therapy: Results of the First Randomized Treat-to-Target Study. Diabetes Technology & Therapeutics 2008; 10(5):377-383.
(11) The Juvenile Diabetes Research Foundation Continuous Glucose Monitoring Study Group. Continuous Glucose Monitoring and Intensive Treatment of Type 1 Diabetes. N Engl J Med 2008; 359(14):1464-1476.
(12) Raccah D, Sulmont V, Reznik Y, Guerci B, Renard E, Hanaire H et al. Incremental value of continuous glucose monitoring when starting pump therapy in patients with poorly controlled type 1 diabetes: The RealTrend study. Diabetes Care 2009.
(13) Hermanides J., NŒrgaard K., Bruttomesso D., Mathieu C., Frid A., Dayan C.M. et al. Sensor augmented pump therapy substantially lowers HbA1c. Diabetologia 52[Supplement I], S43. 2009. Abstract
(14) Cryer PE. Diverse causes of hypoglycemia-associated autonomic failure in diabetes. N Engl J Med 2004; 350(22):2272-2279.
(15) Wentholt IM, Hoekstra JB, DeVries JH. Continuous glucose monitors: the long-awaited watch dogs? Diabetes Technol Ther 2007; 9(5):399-409.
(16) Wentholt IM, Hart AA, Hoekstra JB, DeVries JH. Relationship between interstitial and blood glucose in type 1 diabetes patients: delay and the push-pull phenomenon revisited. Diabetes Technol Ther 2007; 9(2):169-175.
(17) Pham M. Medtronic Diabetes: Sizing the market for realtime, continuous blood glucose monitors from MDT, DXCM, and ABT. Available from www.research.hsbc.com/midas/Res/ RDV? p=pdf&key=ate2b8rygn&name=127057.PDF, accessed 28 September 2009
(18) Roze S, Valentine WJ, Zakrzewska KE, Palmer AJ. Health-economic comparison of continuous subcutaneous insulin infusion with multiple daily injection for the treatment of Type 1 diabetes in the UK. Diabet Med 2005; 22(9):1239-1245.
�������
94

1
2
3
4
5
6
7
8
9
10
11
12
13
14
15
(19) Yoo HJ, An HG, Park SY, Ryu OH, Kim HY, Seo JA et al. Use of a real time continuous glucose monitoring system as a motivational device for poorly controlled type 2 diabetes. Diabetes Res Clin Pract 2008; 82(1):73-79.
(20) Landon MB, Gabbe SG, Piana R, Mennuti MT, Main EK. Neonatal morbidity in pregnancy complicated by diabetes mellitus: predictive value of maternal glycemic profiles. Am J Obstet Gynecol 1987; 156(5):1089-1095.
(21) Murphy HR, Rayman G, Lewis K, Kelly S, Johal B, Duffield K et al. Effectiveness of continuous glucose monitoring in pregnant women with diabetes: randomised clinical trial. BMJ 2008; 337:a1680.
(22) Sair MPMF, Etherington PJB, Peter Winlove CD, Evans TWM. Tissue oxygenation and perfusion in patients with systemic sepsis. Critical Care Medicine 2001; 29(7):1343-1349.
��� ������� �� ��� �� ��
95


Sensor augmented pump therapy lowers HbA1c
in suboptimally controlled type 1 diabetes; a
randomised controlled trial
J Hermanides, K NŒrgaard, D Bruttomesso, C Mathieu,
A Frid, CM Dayan, P Diem, C Fermon, IME Wentholt,
JBL Hoekstra, JH DeVries
Submitted for publication

ABSTRACT
Aims To investigate the efficacy of sensor augmented pump therapy vs. multiple
daily injection therapy in patients with suboptimally controlled type 1 diabetes.
Methods In this investigator initiated multicentre trial (Eurythmics Trial) in 8
outpatient centres in Europe we randomised 83 Diabetes type 1 patients (40
woman) currently treated with multiple daily injections, age 18-65 years and
haemoglobin A1c (HbA1c)>=8.2% to 26 weeks of treatment with either a sensor
augmented insulin pump (SAP, n=44) (Paradigm® REAL-Time) or multiple daily
injections (MDI, n=39). Change in HbA1c between baseline and 26 weeks, sensor
derived endpoints and patient reported outcomes were assessed.
Results In the SAP group 43/44 (98%) patients completed the trial and in the MDI
group 35/39 (90%). Mean HbA1c at baseline and 26 weeks changed from 8.46% (SD
0.95) to 7.23% (SD 0.65) in the SAP group and from 8.59% (SD 0.82) to 8.46% (SD
1.04) in the MDI group. Mean difference in change in HbA1c after 26 weeks was -
1.21% (95% confidence interval -1.52 to -0.90, p<0.001) in favour of the SAP group.
This was achieved without an increase in percentage of time spent in
hypoglycaemia: between-group difference 0.0% (95% confidence interval -1.6 to 1.7,
p=0.96). Problem Areas In Diabetes and Diabetes Treatment Satisfaction
Questionnaire scores improved in the SAP group.
Conclusions Sensor augmented pump therapy effectively lowers HbA1c in type 1
diabetes patients suboptimally controlled on MDI
Clinical Trial Registration controlled-trials.com ISRCTN22472013
�������
98

1
2
3
4
5
6
7
8
9
10
11
12
13
14
15
INTRODUCTION
Intensive treatment of type 1 diabetes mellitus has become the standard of care
since it reduces diabetes-related complications marked by haemoglobin A1c (HbA1c)
reduction1. However, many patients do not reach the HbA1c target of <7%.2
Achieving euglycaemia is limited by symptomatic hypoglycaemia and undetected
hypo- and hyperglycaemia.3-5 With technical developments, continuous
subcutaneous insulin infusion (CSII) and continuous subcutaneous glucose
monitoring (CGM) have become available, providing more flexible insulin dosing
schemes and a continuous stream of glucose data.6;7 Indeed, recent meta-analyses
indicate that CSII is effective in lowering HbA1c in patients with high HbA1c at
start and in reducing severe hypoglycaemia in patients at risk.8-10 The Juvenile
Diabetes Research Foundation trial found a difference in change in HbA1c of -0.5%
in favour of CGM treated type 1 diabetes patients, as compared to a control group
performing self measurement of blood glucose (SMBG).11 Recently, an integrated
real-time CGM and insulin pump system has entered the market, with alarm
function for hypo- and hyperglycaemia and a mealtime bolus advisor (Paradigm
REAL-Time System; Medtronic MiniMed, Inc., Northridge, CA).12 Today, this
integrated platform is the most extensive technical support one can provide to
diabetes patients, without taking over some parts of patient self-control, the next
step towards the closed-loop or artificial pancreas.13 It could have potential for
patients failing on intensive optimised treatment with multiple daily injections
(MDI) and SMBG. As with any new device, it needs to be compared to standard
care to evaluate efficacy.
Therefore we compared sensor augmented pump therapy to intensive multiple daily
injection therapy in suboptimally controlled type 1 diabetes mellitus patients in a
randomised controlled multicentre trial.
METHODS
Study Design and Patient Population
This was a 26-week open-label, multinational, multi-centre randomised controlled
clinical trial, performed between April 2007 and January 2009 in 8 centres
experienced in clinical research and pump therapy. Centres qualified for the trial
after being able to verify sensor augmented insulin-pump experience with at least
three type 1 diabetes patients for a treatment period of two weeks.
��� ������������������������ ����������������������������
99
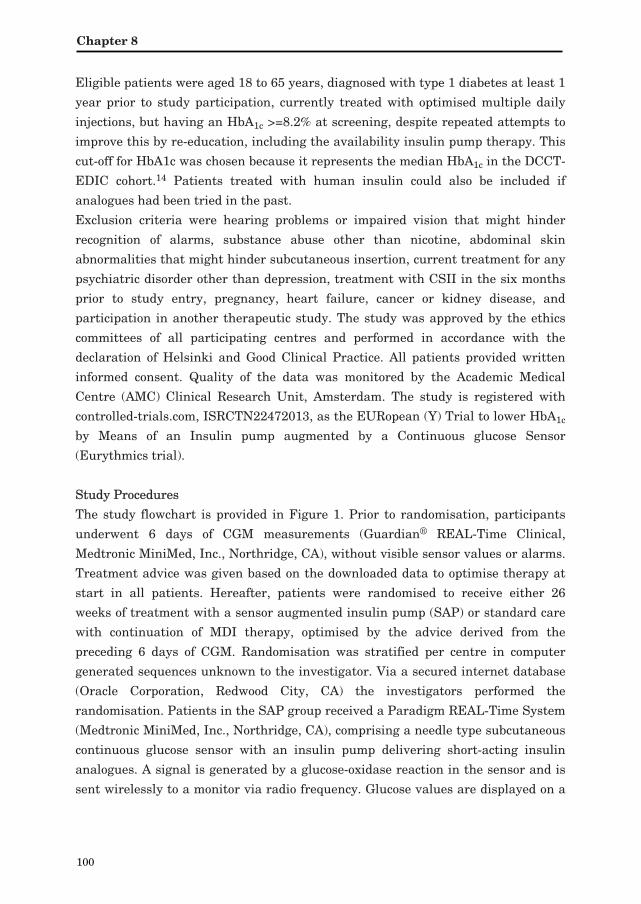
Eligible patients were aged 18 to 65 years, diagnosed with type 1 diabetes at least 1
year prior to study participation, currently treated with optimised multiple daily
injections, but having an HbA1c >=8.2% at screening, despite repeated attempts to
improve this by re-education, including the availability insulin pump therapy. This
cut-off for HbA1c was chosen because it represents the median HbA1c in the DCCT-
EDIC cohort.14 Patients treated with human insulin could also be included if
analogues had been tried in the past.
Exclusion criteria were hearing problems or impaired vision that might hinder
recognition of alarms, substance abuse other than nicotine, abdominal skin
abnormalities that might hinder subcutaneous insertion, current treatment for any
psychiatric disorder other than depression, treatment with CSII in the six months
prior to study entry, pregnancy, heart failure, cancer or kidney disease, and
participation in another therapeutic study. The study was approved by the ethics
committees of all participating centres and performed in accordance with the
declaration of Helsinki and Good Clinical Practice. All patients provided written
informed consent. Quality of the data was monitored by the Academic Medical
Centre (AMC) Clinical Research Unit, Amsterdam. The study is registered with
controlled-trials.com, ISRCTN22472013, as the EURopean (Y) Trial to lower HbA1c
by Means of an Insulin pump augmented by a Continuous glucose Sensor
(Eurythmics trial).
Study Procedures
The study flowchart is provided in Figure 1. Prior to randomisation, participants
underwent 6 days of CGM measurements (Guardian® REAL-Time Clinical,
Medtronic MiniMed, Inc., Northridge, CA), without visible sensor values or alarms.
Treatment advice was given based on the downloaded data to optimise therapy at
start in all patients. Hereafter, patients were randomised to receive either 26
weeks of treatment with a sensor augmented insulin pump (SAP) or standard care
with continuation of MDI therapy, optimised by the advice derived from the
preceding 6 days of CGM. Randomisation was stratified per centre in computer
generated sequences unknown to the investigator. Via a secured internet database
(Oracle Corporation, Redwood City, CA) the investigators performed the
randomisation. Patients in the SAP group received a Paradigm REAL-Time System
(Medtronic MiniMed, Inc., Northridge, CA), comprising a needle type subcutaneous
continuous glucose sensor with an insulin pump delivering short-acting insulin
analogues. A signal is generated by a glucose-oxidase reaction in the sensor and is
sent wirelessly to a monitor via radio frequency. Glucose values are displayed on a
�������
100
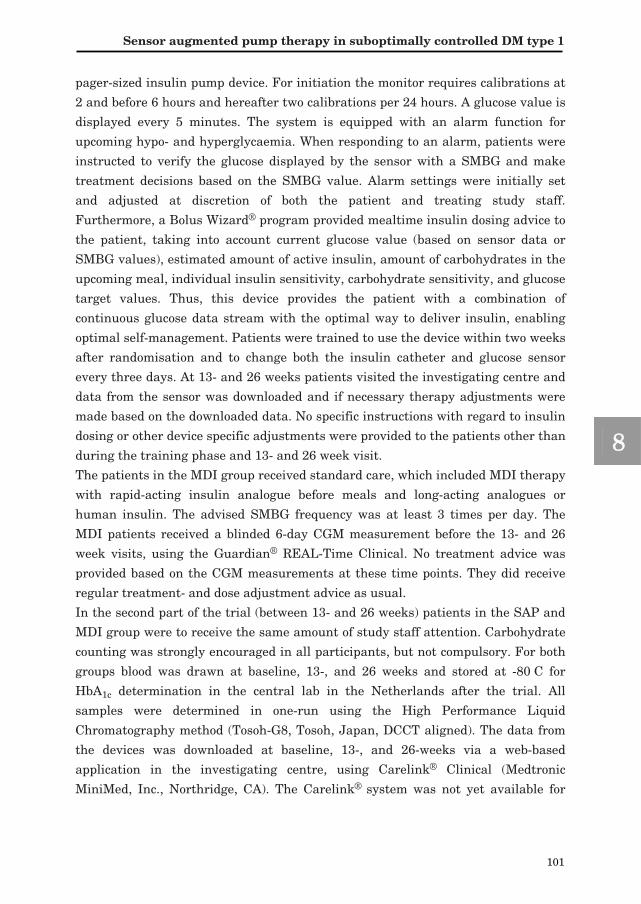
1
2
3
4
5
6
7
8
9
10
11
12
13
14
15
pager-sized insulin pump device. For initiation the monitor requires calibrations at
2 and before 6 hours and hereafter two calibrations per 24 hours. A glucose value is
displayed every 5 minutes. The system is equipped with an alarm function for
upcoming hypo- and hyperglycaemia. When responding to an alarm, patients were
instructed to verify the glucose displayed by the sensor with a SMBG and make
treatment decisions based on the SMBG value. Alarm settings were initially set
and adjusted at discretion of both the patient and treating study staff.
Furthermore, a Bolus Wizard® program provided mealtime insulin dosing advice to
the patient, taking into account current glucose value (based on sensor data or
SMBG values), estimated amount of active insulin, amount of carbohydrates in the
upcoming meal, individual insulin sensitivity, carbohydrate sensitivity, and glucose
target values. Thus, this device provides the patient with a combination of
continuous glucose data stream with the optimal way to deliver insulin, enabling
optimal self-management. Patients were trained to use the device within two weeks
after randomisation and to change both the insulin catheter and glucose sensor
every three days. At 13- and 26 weeks patients visited the investigating centre and
data from the sensor was downloaded and if necessary therapy adjustments were
made based on the downloaded data. No specific instructions with regard to insulin
dosing or other device specific adjustments were provided to the patients other than
during the training phase and 13- and 26 week visit.
The patients in the MDI group received standard care, which included MDI therapy
with rapid-acting insulin analogue before meals and long-acting analogues or
human insulin. The advised SMBG frequency was at least 3 times per day. The
MDI patients received a blinded 6-day CGM measurement before the 13- and 26
week visits, using the Guardian® REAL-Time Clinical. No treatment advice was
provided based on the CGM measurements at these time points. They did receive
regular treatment- and dose adjustment advice as usual.
In the second part of the trial (between 13- and 26 weeks) patients in the SAP and
MDI group were to receive the same amount of study staff attention. Carbohydrate
counting was strongly encouraged in all participants, but not compulsory. For both
groups blood was drawn at baseline, 13-, and 26 weeks and stored at -80°C for
HbA1c determination in the central lab in the Netherlands after the trial. All
samples were determined in one-run using the High Performance Liquid
Chromatography method (Tosoh-G8, Tosoh, Japan, DCCT aligned). The data from
the devices was downloaded at baseline, 13-, and 26-weeks via a web-based
application in the investigating centre, using Carelink® Clinical (Medtronic
MiniMed, Inc., Northridge, CA). The Carelink® system was not yet available for
��� ������������������������ ����������������������������
101

outpatient use at start of our trial. The contact time with the study personnel was
registered. The occurrence of severe hypoglycaemia (clinical episode of
hypoglycaemia <=2.8 mmol/l, resulting in seizure or coma, intravenous glucose or
glucagon, or any 3rd party assistance) and ketoacidosis were considered adverse
events. Finally, serious adverse events (SAE) and their possible relation to the
study and/or device were listed.
Outcome Measures
The primary outcome was difference in HbA1c between baseline and 26 weeks. Also
we calculated the change between 13 and 26 weeks. The sensor data were analyzed
for minutes in hyperglycaemia >11.1 mmol/l and hypoglycaemia <4.0 mmol/l
expressed as the percentage of the total monitoring time. Also the number of hyper-
and hypoglycaemia events per day were calculated. For both groups a time-window
of up to six-days prior to downloading of the available data was used to determine
Figure 1- study flowchart
Abbreviations: SAP=Sensor Augmented Pump group, MDI= Multiple Daily Injections, CGM= Continuous Glucose Monitoring, T=Time in weeks, HbA1c=Haemoglobin A1c
�������
102

1
2
3
4
5
6
7
8
9
10
11
12
13
14
15
the sensor derived endpoints. Sensor use was calculated for the SAP group as the
average hours/week sensor use and percentage of sensor use during the whole trial.
Furthermore, the proportion of patients reaching HbA1c <7%, the contact time with
the study personnel, the number of SMBG measurements per three weeks and total
daily insulin dose per patient were calculated.
Patient Reported Outcomes (PRO)
Questionnaires were administered at baseline and end of trial. Health-related
quality of life was assessed using the SF-36 version 2 (SF-36v2)15, which comprises
eight subscales: Physical Functioning (PF), Role-Physical (RP), Bodily Pain (BP),
General Health (GH), Vitality (VT), Social Functioning (SF), Role-Emotional (RE),
and Mental Health (MH). Scores were transformed to a 0 to 100 (highest health
score) scale. The Problem Areas in Diabetes Scale (PAID) is a 20 item questionnaire
that scores diabetes related physiological distress.16 Scores were transformed to a
0-100 scale, with higher scores indicating more problems. The Diabetes Treatment
Satisfaction Questionnaire (DTSQ) comprises six items and is scored on a 0-36
scale, with higher scores indicating higher satisfaction. Two additional items
concern perceived frequency of hypo- and hyperglycaemia, scored on a 0 (lowest
frequency) to 6 (highest frequency) scale.17 Finally, the 13-item worry-subscale of
the Hypoglycaemia Fear Survey (HFS) was administered.18 The HFS scores were
transformed to a 0-100 scale, higher scores indicating more hypoglycaemia related
fear. The HFS and PAID could not be administered in all centres, due to lack of
validated translations.
Statistical Methods
Assuming a standard deviation of 1.3% in HbA1c, a two-sided t-test with an alpha
level of 0.05, sample size calculations indicated that 36 patients per group would be
needed to detect a between-group difference of 1.0% in HbA1c with 90% power. A
drop-out rate of 30% was anticipated, and the original goal was to randomise 52
patients per group. As the drop-out rate was much lower than expected, we stopped
inclusion after having randomised 83 patients.
All analyses were predefined but the percentage of participants reaching the <7%
target and analysis on sensor use. Analyses were based on the intention to treat
principle. The primary outcome measure, change in HbA1c between baseline and 26
weeks, was analyzed using an ANCOVA model with treatment and centre as fixed
effects and the baseline HbA1c value as covariate. If a patient dropped out after 13
weeks, the last observation was carried forward (LOCF) to 26 weeks. HbA1c after 13
��� ������������������������ ����������������������������
103

weeks, the sensor-derived endpoints and questionnaire scores were analysed using
the ANCOVA model as defined above and are reported as mean with standard
deviation (SD). The difference in change in HbA1c between 13 and 26 weeks was
analysed using repeated measurements ANOVA with centre and treatment as fixed
effects and baseline HbA1c, time and the interaction between treatment as covariates
and subject as random factor. Hours of sensor use/week in the SAP group during the
trial were related to change in HbA1c after 26 weeks and corrected for baseline
HbA1c. Differences in contact time were reported as median with IQR and compared
using the Mann-Whitney U test. The differences in proportions of patients reaching
HbA1c <7% and experiencing a severe hypoglycaemic episode were calculated using
the chi-square test.
RESULTS
Patients
The participant flow is displayed in Figure 2. After screening ninety-three patients,
eighty-seven started the trial. Before randomisation, 4 patients dropped-out after
the baseline sensor measurement, all indicating that they did not tolerate the
sensor. Eighty-three patients were randomised. Baseline characteristics of the two
groups were comparable as displayed in Table 1. In the SAP group 43/44 (98%)
patients completed the trial and 35/39 (90%) in the MDI group. The patient
dropping out in the SAP group did not tolerate the intensity of the SAP treatment.
In the MDI group one patient stopped for unknown reasons, one patient due to
surgery for aorta bifurcation prosthesis, one patient because of dissatisfaction
about the randomisation outcome, and one patient was lost to follow up. Three
baseline HbA1c blood samples got lost. HbA1c analyses could be performed on 41/44
patients from the SAP group (1 drop-out, 2 missing baseline samples) and 36/39
patients from the MDI group (4 drop out, with 2 LOCF, one missing baseline
sample). After 26 weeks, the total daily insulin dose in the SAP group decreased to
46.7 (SD 16.5) units and somewhat increased in the MDI group to 57.8 (SD 18.1)
units per day, with a baseline and centre adjusted difference in change between the
groups of -11.0 units per day (95% confidence interval -16.1 to -5.9, p<0.001). Prior
to the study patients in the SAP group used 76 (SD 40) SMBG per three weeks,
which increased to 87 (SD 43) at the end of the trial. For patients in the MDI group,
the number of SMBGs per three weeks increased from 70 (SD 38) to 82 (SD 48).
This was a non-significant difference in change, p=0.38.
�������
104

1
2
3
4
5
6
7
8
9
10
11
12
13
14
15
Table 1- baseline characteristics
SAP (n=44) MDI (n=39) Age, years (mean, (SD)) 39.3 (11.9) 37.3 (10.7) Female sex (n, (%)) 22 (50.0) 18 (46.2) Diabetes duration, years (mean (SD)) 16.9 (10.7) 21.0 (9.4) HbA1c baseline, % (mean (SD)) 8.47 (0.94) 8.64 (0.86) Total daily insulin dose, units (mean (SD)) 54.5 (21.0) 53.9 (14.0) Patients experiencing severe hypoglycaemia the last 12 months before randomisation (n, (%))
6 (13.6)
3 (7.7)
Country (n, (%)) -Denmark -Switzerland -The Netherlands -Sweden -France -United Kingdom -Belgium -Italy
13 (29.5) 2 (4.5) 6 (13.6) 6 (13.6) 1 (2.3) 6 (13.6) 6 (13.6) 6 (13.6)
11 (28.2) 2 (5.1) 5 (12.8) 5 (12.8) 0 (0.0) 4 (10.3) 6 (15.4) 6 (15.4)
Figure 2- participant flow, horizontal arrows indicating reasons for dropping out
Abbreviations: SAP=Sensor Augmented Pump group, MDI=Multiple Daily Injections group, CGM= Continuous Glucose Monitoring, HbA1c=Haemoglobin A1c
Abbreviations: SAP=Sensor Augmented Pump group, MDI=Multiple Daily Injections group, HbA1c= haemoglobin A1c
��� ������������������������ ����������������������������
105

Glycaemic Control
The least square mean (LS mean) from the ANCOVA model for treatment effect,
adjusted for baseline HbA1c and centre was -1.21% (95% confidence interval -1.52 to
-0.90, p<0.001). The crude mean difference in change in HbA1c after 26 weeks was -
1.10% (95% confidence interval -1.47 to -0.73, p<0.001) in favour of the SAP group
(Figure 3 and Table 2). The LS mean difference in change in HbA1c after 13 weeks
was -1.22% (95% confidence interval -1.59 to -0.86, p<0.001). No significant
difference in change was observed between 13 and 26 weeks, p=0.85. The
proportion of patients reaching EASD/ADA HbA1c target of <7% was 34% in the
SAP group and 0% in the MDI group, p<0.001. The LS mean difference in change in
percentage of sensor-time spent in hyperglycaemia after 26 weeks was -17.3% (95%
confidence interval -25.1 to -9.5, p<0.001). No significant difference in change in
percentage of time spent in hypoglycaemia after 26 weeks was found between
groups: 0.0% (95% confidence interval -1.6 to 1.7, p=0.96). The change in number of
hyper- or hypoglycaemic events did not differ between the groups. Sensor derived
endpoints are summarised in Table 3.
Figure 3- haemoglobin A1c (HbA1c) results
*The baseline and treating centre adjusted HbA1c change (ANCOVA-model) was: -1.21% (95% CI -1.52 to -0.90, p<0.001)
�������
106

1
2
3
4
5
6
7
8
9
10
11
12
13
14
15
Table 2: haemoglobin A
1c results
SAP (n=41)
HbA
1c % (m
ean (SD))
MD
I (n=36) H
bA1c %
(mean (SD
)) D
ifference (95 % C
I) p value*
Baseline
8.46 (0.95) 8.59 (0.82)
0.13 (N/A
)
13 weeks
7.29 (0.71) 8.55 (1.21)
1.25 (0.79 to 1.72) <0.001
� B
aseline-13 weeks
-1.17 (0.93) -0.05 (0.73)
-1.13 (-1.51 to -0.74) <0.001
LSM �
Baseline-13 w
eeks†
-1.22 (-1.59 to -0.86)
<0.001 26 w
eeks 7.23 (0.65)
8.46 (1.04) 1.23 (0.83 to 1.63)
<0.001 �
Baseline-26 w
eeks -1.23 (1.01)
-0.13 (0.56) -1.10 (-1.47 to -0.73)
<0.001 LSM
� B
aseline-26 weeks†
-1.21 (-1.52 to -0.90) <0.001
� 13-26 w
eeks -0.06 (0.57)
-0.09 (0.51) -0.03 (-0.27 to 0.21)
0.83 LSM
� 13-26 w
eeks‡
-0.02 (-0.27 to 0.21)
0.85
Abbreviations: H
bA1c = haem
oglobin A1c, S
AP
=Sensor A
ugmented P
ump group, M
DI=M
ultiple Daily Injections group, N
/A= not applicable, LSM
= least square mean,
CI=confidence interval
*p value for comparison betw
een the SA
P and M
DI group
†Difference in H
bA1c change in H
bA1c betw
een the SA
P and M
DI group after 13 and 26 w
eeks. LSM
from the A
NC
OV
A m
odel, adjusted for investigating centre and baseline H
bA1c
‡Difference in change in H
bA1c betw
een the SAP
and MD
I Group betw
een 13 weeks and 26 w
eeks from repeated m
easurements A
NO
VA
, adjusted for centre, baseline H
bA1c , the factor tim
e and the interaction between treatm
ent and time. P
atient identification number w
as included as random factor
����������� ������� ������������� ��������� ���������� �����
107

Tabl
e 3:
sen
sor d
ata
SA
P (n
=40)
m
ean
(SD
) M
DI (
n=31
) m
ean
(SD
) D
iffer
ence
(95
% C
I) p
valu
e*
% o
f tim
e in
hyp
ergl
ycae
mia
B
asel
ine
38.0
(17.
4)
40.1
(18.
4)
2.1
(N/A
)
26 w
eeks
21
.6 (1
2.2)
38
.2 (2
1.5)
16
.5 (7
.8 to
25.
2)
<0.0
01
LSM
� B
asel
ine-
26 w
eeks
†
-1
7.3
(-25
.1 to
-9.5
) <0
.001
%
of t
ime
in h
ypog
lyca
emia
B
asel
ine
3.9
(4.7
) 2.
5 (2
.8)
1.4
(N/A
)
26 w
eeks
2.
7 (3
.4)
2.5
(3.6
) 0.
2 (-
1.4
to 1
.9)
0.79
LS
M �
Bas
elin
e-26
wee
ks†
0.0
(-1.
6 to
1.7
) 0.
96
Num
ber o
f hyp
ergl
ycae
mic
eve
nts‡
B
asel
ine
2.4
(0.6
) 2.
5 (0
.6)
0.2
(N/A
)
26 w
eeks
2.
1 (0
.8)
2.2
(0.7
) 0.
2 (-
0.2
to 0
.5)
0.30
LS
M �
Bas
elin
e-26
wee
ks†
-0.2
(-0.
6 to
0.1
) 0.
21
Num
ber o
f hyp
ogly
caem
ic e
vent
s‡
Bas
elin
e 0.
7 (0
.1)
0.5
(0.5
) 0.
2 (N
/A)
26
wee
ks
0.7
(0.7
) 0.
6 (0
.7)
0.1
(-0.
2 to
0.5
) 0.
40
LSM
� B
asel
ine-
26 w
eeks
†
-0
.1 (-
0.5
to 0
.2)
0.50
Abb
revi
atio
ns: H
bA1c
= ha
emog
lobi
n A
1c, S
AP
=Sen
sor A
ugm
ente
d P
ump
grou
p, M
DI=
Mul
tiple
Dai
ly In
ject
ions
gro
up, N
/A=
not a
pplic
able
, LSM
= le
ast s
quar
e m
ean,
CI=
conf
iden
ce in
terv
al
Hyp
ergl
ycae
mia
>11
.1 m
mol
/l, H
ypog
lyca
emia
<4.
0 m
mol
/l *p
val
ue fo
r com
paris
on b
etw
een
the
SA
P a
nd M
DI g
roup
†D
iffer
ence
in c
hang
e be
twee
n th
e S
AP
and
MD
I gro
up a
fter 2
6 w
eeks
; LS
M fr
om th
e A
NC
OV
A m
odel
, adj
uste
d fo
r inv
estig
atin
g ce
ntre
and
ba
selin
e va
lues
‡N
umbe
r of e
vent
s, s
tand
ardi
sed
per d
ay. A
n ev
ent w
as c
ount
ed w
hen
the
sens
or g
luco
se v
alue
cro
ssed
the
hype
r- o
r hyp
ogly
caem
ia
thre
shol
d, fo
llow
ed b
y a
30 m
inut
e pe
riod
betw
een
4.0
mm
ol/l
and
11.1
mm
ol/l
��� ����
108

1
2
3
4
5
6
7
8
9
10
11
12
13
14
15
Patient Reported Outcomes
The patient reported outcomes are shown in Table 4. The difference in change in
the PAID score was significant -7.9 (95% confidence interval -15.1 to -0.61, p=0.03)
in favour of the SAP group. Also the DTSQs and DTSQ „perceived frequency of
hyperglycaemia‰ scores improved significantly more in SAP group as compared to
the MDI group. For the SF-36v2 questionnaire, only the change in the General
Health and Social Functioning subscales differed significantly, both in favour of the
SAP group.
Contact Time and Sensor Usage
The median total contact time during the trial was 240 minutes (IQR 195 to 353) in
the MDI group and 690 minutes (526 to 1028) in the SAP group (p<0.001). The
median contact time in the SAP and MDI group before week 13 was 553 minutes
(423-825) and 135 minutes (108 to 218) respectively (p=0.001). Between week 13
and the end of the trial this was 75 minutes (60 to 120) in the SAP group and 60
minutes (40 to 75) in the MDI group (p=0.001).
The mean sensor use in the SAP group was 4.5 (SD 1.0) days/per week over the
whole trial period and 79% of the patients using the sensor more than 60% of the
time. The Bolus Wizard® was used by 86% of the SAP group patients at the end of
the trial. There was no evident relation between sensor use and HbA1c decrease
within the SAP group, when adjusted for baseline HbA1c, with a regression
coefficient of 0.006, p=0.20. Furthermore, when examining contact time, sensor use,
age, sex and baseline HbA1c as predictors for HbA1c decrease after 26 weeks in a
multivariate linear regression model, only baseline HbA1c was a significant
predictor (�= -0.80, 95% CI -1.06 to -0.53, p<0.001).
��� ������������������������ ����������������������������
109

Table 4- patient reported outcomes
SAP mean (SD)
MDI mean (SD)
Difference (95 % CI) p value*
Problem Areas In Diabetes scale N=30 N=24 Baseline 32.4 (18.8) 26.5 (18.4) 5.8 (N/A) 26 weeks 21.0 (19.3) 23.7 (19.4) 2.7 (-7.9 to 13.4) 0.61 LSM � Baseline-26 weeks† -7.9 (-15.1 to -0.61) 0.03 Hypoglycaemia Fear Survey N=35 N=28 Baseline 29.8 (19.2) 21.0 (17.7) 8.8 (N/A) 26 weeks 24.1 (20.2) 20.3 (16.9) 3.9 (-5.7 to 13.4) 0.42 LSM � Baseline-26 weeks† -3.2 (-10.0 to 3.7) 0.36
Diabetes Treatment Satisfaction Questionnaire
N=41 N=35
Baseline 21.6 (5.5) 22.5 (6.3) 1.0 (N/A) 26 weeks 32.4 (3.5) 23.8 (6.2) 8.6 (6.2 to 11.0) <0.001 LSM � Baseline-26 weeks† 9.3 (7.3 to 11.3) <0.001 Perceived frequency of hyperglycaemia Baseline 4.4 (1.2) 4.3 (1.3) 0.1 (N/A) 26 weeks 2.4 (1.2) 3.9 (1.2) 1.5 (1.0 to 2.1) <0.001 LSM � Baseline-26 weeks† -1.6 (-2.1 to -1.1) <0.001 Perceived frequency of hypoglycaemia Baseline 2.3 (1.3) 2.3 (1.4) 0.1 26 weeks 2.4 (1.2) 2.2 (1.3) 0.2 (-0.4 to 0.8) 0.51 LSM � Baseline-26 weeks† -0.3 (-0.8 to 0.3) 0.34
SF-36 N=42 N=33 Baseline Physical Functioning Role-Physical Bodily Pain General Health Vitality Social Functioning Role-Emotional Mental Health
89.4 (14.5) 76.8 (23.8) 78.9 (25.4) 55.5 (20.3) 53.9 (20.0) 81.5 (20.3) 84.9 (20.4) 72.6 (14.8)
90.5 (14.3) 84.4 (19.3) 78.7 (23.0) 59.8 (22.3) 61.0 (23.7) 86.4 (21.0) 89.6 (16.7) 77.9 (20.2)
1.0 (N/A) 7.6 (N/A) 0.2 (N/A) 4.3 (N/A) 7.1 (N/A) 4.8 (N/A) 4.4 (N/A) 5.3 (N/A)
26 weeks Physical Functioning Role-Physical Bodily Pain General Health Vitality Social Functioning Role-Emotional Mental Health
92.7 (11.2) 85.7 (20.7) 79.9 (24.4) 67.7 (21.6) 66.7 (20.2) 89.3 (16.0) 87.1 (19.6) 79.2 (12.5)
91.4 (12.7) 87.3 (20.4) 78.7 (22.6) 63.1 (19.1) 65.2 (19.3) 82.2 (25.2) 88.0 (16.0) 76.8 (16.5)
1.4 (-4.1 to 6.9) 1.6 (-11.2 to 8.0) 1.3 (-9.7 to 12.2) 4.5 (-5.0 to 14.1) 1.5 (-7.7 to 10.7) 7.1 (-3.0 to 17.2) 0.9 (-7.6 to 9.4) 2.3 (-4.3 to 9.0)
0.62 0.74 0.82 0.35 0.74 0.17 0.83 0.49
LSM � Baseline-26 weeks† Physical Functioning Role-Physical Bodily Pain General Health Vitality Social Functioning Role-Emotional Mental Health
2.2 (-0.7 to 5.1) 2.1 (-6.1 to 10.3) 1.7 (-7.6 to 11.0) 7.9 (0.5 to 15.3) 6.4 (-1.2 to 14.1) 9.8 (1.3 to 18.3) 0.9 (-6.6 to 8.4) 4.8 (-1.6 to 11.1)
0.13 0.62 0.71 0.04 0.10 0.02 0.81 0.14
�������
110

1
2
3
4
5
6
7
8
9
10
11
12
13
14
15
Hypoglycaemia and Adverse Events
There was a non-significant difference in the occurrence of severe hypoglycaemia,
with 4 episodes in the SAP group (9%) and 1 episode in the MDI group (3%),
p=0.21. This is 19 episodes /100 person years in the SAP group and 6/100 person
years in the MDI group. All patients in the SAP group were wearing the device
during the severe hypoglycaemia. In total, 7 SAEÊs were reported, of which 2
occurred in the SAP group and 5 in the MDI group. Only one SAE was reported as
being related to the device in the SAP group, where the patient was admitted to the
hospital for ketoacidosis because of pump-failure. Other SAEs were: surgery for
aorta bifurcation prosthesis, hemianopsia, respiratory tract infection, and
ketoacidosis (x2) in the MDI group and acute gastritis in the SAP group. Twenty
patients reported 26 probable or possible device related adverse events. Of these, 17
patients reported skin related problems (itch/exanthema/infection/redness/plaster
allergy/bruising/hematoma) at the sensor or insulin infusion site.
DISCUSSION
Sensor augmented pump therapy (SAP) significantly lowered HbA1c after 26 weeks
by -1.21% as compared to multiple daily injection therapy (MDI) without a
significant increase in hypoglycaemia. SAP therapy was associated with an
improvement in treatment satisfaction and diabetes related distress. These results
were observed in patients failing on optimal MDI and SMBG therapy in specialized
CSII centres.
This is the first trial with adequate duration and sample size comparing SAP to
MDI therapy in type 1 diabetes patients with suboptimal control. We thought it to
be appropriate to compare SAP therapy to MDI, as the number of patients using
insulin pump therapy in stead of MDI is relatively small6 Therefore, MDI reflects
the current standard of care. Furthermore, previous trials have already
investigated the addition of CGM to MDI or pump therapy and the initiation of
Table 4 (Left page)- patient reported outcomes Abbreviations: SAP=Sensor Augmented Pump group, MDI=Multiple Daily Injections group, N/A= not applicable, LSM= least square mean, CI=confidence interval *p value for comparison between the SAP and MDI group †Difference in change between the SAP and MDI group after 26 weeks; LSM from the ANCOVA model, adjusted for investigating centre and baseline values
��� ������������������������ ����������������������������
111

SAP therapy vs. the initiation of insulin pump therapy.11;19;20 The efficacy of CSII
therapy with short-acting analogues alone is about -0.3% as compared to MDI
therapy.10 This is however highly dependent on baseline HbA1c10, The JDRF trial
demonstrated the efficacy of sensor use as compared to MDI therapy in adult type 1
diabetes patients, lowering HbA1c by -0.5% from 7.6% at baseline.11 Other trials
investigating the efficacy of sensor use in poorly regulated type 1 diabetes patients
have found effects on HbA1c decrease ranging from 0 to -0.6%.21 Thus, the
magnitude of change of -1.21% in the Eurythmics trial seems at least a summation
of the effects of CSII and CGM therapy. This supports the notion that integration of
CSII and CGM provides a new treatment platform. This is further substantiated by
the use of the mealtime insulin dose advisor by 86% of the SAP group, establishing
active communication between the insulin pump, CGM and the patient.
A limitation of the study was the by necessity unblinded character. Moreover, the
patients in the SAP group received more attention from the study staff especially in
the first part of the trial, because of the device specific training phase. This
difference in attention, to the best of our knowledge now quantified for the first
time in a diabetes device trial, may contribute to HbA1c lowering.20;22 We believe
however that a temporary increase in time spent with the patient reflects the real-
life situation and can not be set apart when starting SAP therapy in patients using
MDI. Furthermore, in multivariate analysis, the duration of contact time was not a
significant predictor of HbA1c decrease and the HbA1c lowering reached in the first
part of the trial in the SAP group was sustained between 13 and 26 weeks, when
the difference in attention given to both study groups was only 15 minutes.
Notably, in the MDI group there was a minimal HbA1c decrease and no study effect
was observed. Perhaps this is not so surprising when considering that all other
attempts to optimise their MDI/SMBG treatment failed, and the limited additional
attention given to these patients.
Prior to randomisation, 4 patients dropped out because they did not tolerate the
CGM device, but hereafter only 1 patient randomised to SAP did not complete the
trial. In the JDRF trial, patients had to complete a run-in phase before they could
be randomised.11 Thus in both trials the efficacy of sensor or SAP therapy was
investigated in patients with type 1 diabetes, who proved to be tolerating the
device.
The rate of severe hypoglycaemia at 26 weeks was low in both groups, with a non-
significantly higher rate in the SAP group (9% vs. 3%, p=0.21), that seemed to be
more susceptible to severe hypoglycaemia at baseline as compared to the MDI
group. Thus, with a more pronounced HbA1c lowering, the severe hypoglycaemia
�������
112

1
2
3
4
5
6
7
8
9
10
11
12
13
14
15
frequencies are similar to those found in the JDRF CGM trial and much lower than
observed in the DCCT.1;11 The apparent lack of decrease in hypoglycaemia in the
SAP group can have several explanations. First, due to the decline of cognitive
functions during hypoglycaemia patients are less adequate in responding to
acoustic or vibration alarms.23 Also the CGM device is more likely to be put aside
during high risk activities such as intensive sports. Finally, the sensor inaccuracy
can contribute to missing episodes of hypoglycaemia. We did not specifically assess
sensor performance in this trial. The accuracy of glucose sensors has however been
investigated extensively and is known to be deteriorating in the hypoglycaemic
range.7
The analyses of the sensor derived data also show that a significant decrease in
hyperglycaemia AUC in the SAP group as compared to the MDI group is not
accompanied by an increase in time spent in hypoglycaemia. Also the number of
hypoglycaemic events did not differ between both groups. What did change was the
percentage of time spent in hyperglycaemia, which was significantly lower in the
SAP group after 26 weeks. The number of hyperglycaemic events did not differ
significantly between the SAP and MDI group, suggesting that the beneficial effect
of the SAP treatment results from reducing the duration (and not the number) of
hyperglycaemic events as they occur.
We found an improvement in change in PRO scores concerning diabetes related
distress, perceived frequency of hyperglycaemia, general health, social functioning,
and treatment satisfaction. Furthermore, the use of SAP therapy was not
accompanied by an increase the fear- or perceived frequency of hypoglycaemia.
These PRO outcomes do not confirm historical fears of data overload due to CGM.
Sensor use in the trial was on average 4.5 days/week and most patients used the
sensor >60% of the time. In contrast with previous CGM trials, we could not find a
relation between CGM use and change in HbA1c.11;19;20 This trial was however not
designed to investigate this relationship. It is noteworthy that the substantial
improvement in glycaemic control with frequent sensor use was seen in a patient
group not easy to reach, under treatment in experienced pump centres and failing
on optimised MDI/SMBG therapy.
In conclusion, these study results show that, as compared to MDI treatment, SAP
treatment in motivated but suboptimally controlled type 1 diabetes patients results
in a considerable HbA1c reduction and improvement in quality of life, without
increasing hypoglycaemia. The magnitude of the difference in change in HbA1c of -
1.21% may be due to the combined effect of pump, sensor, Bolus Wizard® and the
process of starting SAP therapy in this hard to reach population.
��� ������������������������ ����������������������������
113

Acknowledgements
This trial was financially supported by Medtronic International Trading Sàrl. This
was an investigator-initiated trial. The funding source had an advising role in trial
design details and drafting of the report and was only involved in the collection of
the sensor data. The funding source had no role in the conduct of the analyses,
interpretation of the data or in the decision to approve publication. Chantal
Mathieu is a clinical researcher of the FWO (Fund for Research Flanders). We
further acknowledge the following people involved in the execution of the trial:
Hilde Morobé, Peggy Callewaert, Marijke Carpentier, Conny Peeters, Kate Green,
Dr. Danijela Tatovic, Dr. Silvana Costa, Dr. Andrea Egger, Dr. Andrea Lanker,
Peggy Wentzel, Dorien Dragt, Dr. C.B. Brouwer, Merete Meldgaard, Ingrid
Wetterholtz, and Hanna Söderling.
�������
114

1
2
3
4
5
6
7
8
9
10
11
12
13
14
15
REFERENCES
(1) The effect of intensive treatment of diabetes on the development and progression of long-term complications in insulin-dependent diabetes mellitus. The Diabetes Control and Complications Trial Research Group. N Engl J Med 1993; 329(14):977-986.
(2) American Diabetes Association. Standards of Medical Care in Diabetes--2008. Diabetes Care 2008; 31(Supplement_1):S12-S54.
(3) Bode BW, Schwartz S, Stubbs HA, Block JE. Glycemic Characteristics in Continuously Monitored Patients With Type 1 and Type 2 Diabetes: Normative values. Diabetes Care 2005; 28(10):2361-2366.
(4) Cryer PE. The Barrier of Hypoglycemia in Diabetes. Diabetes 2008; 57(12):3169-3176.
(5) Wentholt IM, Maran A, Masurel N, Heine RJ, Hoekstra JB, DeVries JH. Nocturnal hypoglycaemia in Type 1 diabetic patients, assessed with continuous glucose monitoring: frequency, duration and associations. Diabet Med 2007; 24(5):527-532.
(6) Pickup J, Keen H. Continuous subcutaneous insulin infusion at 25 years: evidence base for the expanding use of insulin pump therapy in type 1 diabetes. Diabetes Care 2002; 25(3):593-598.
(7) Wentholt IM, Hoekstra JB, DeVries JH. Continuous glucose monitors: the long-awaited watch dogs? Diabetes Technol Ther 2007; 9(5):399-409.
(8) Pickup JC, Sutton AJ. Severe hypoglycaemia and glycaemic control in Type 1 diabetes: meta-analysis of multiple daily insulin injections compared with continuous subcutaneous insulin infusion. Diabet Med 2008; 25(7):765-774.
(9) Jeitler K, Horvath K, Berghold A, Gratzer TW, Neeser K, Pieber TR et al. Continuous subcutaneous insulin infusion versus multiple daily insulin injections in patients with diabetes mellitus: systematic review and meta-analysis. Diabetologia 2008; 51(6):941-951.
(10) Retnakaran R, Hochman J, DeVries JH, Hanaire-Broutin H, Heine RJ, Melki V et al. Continuous Subcutaneous Insulin Infusion Versus Multiple Daily Injections: The impact of baseline A1c. Diabetes Care 2004; 27(11):2590-2596.
(11) The Juvenile Diabetes Research Foundation Continuous Glucose Monitoring Study Group. Continuous Glucose Monitoring and Intensive Treatment of Type 1 Diabetes. N Engl J Med 2008; 359(14):1464-1476.
(12) Mastrototaro JJ, Cooper KW, Soundararajan G, Sanders JB, Shah RV. Clinical experience with an integrated continuous glucose sensor/insulin pump platform: a feasibility study. Adv Ther 2006; 23(5):725-732.
(13) Hanaire H. Continuous glucose monitoring and external insulin pump: towards a subcutaneous closed loop. Diabetes Metab 2006; 32(5 Pt 2):534-538.
(14) Writing Team for the Diabetes Control and Complications Trial/Epidemiology of Diabetes Interventions and Complications Research Group. Sustained Effect of Intensive Treatment of Type 1 Diabetes Mellitus on Development and Progression of Diabetic Nephropathy: The Epidemiology of Diabetes Interventions and Complications (EDIC) Study. JAMA 2003; 290(16):2159-2167.
(15) Ware JEJP. SF-36 Health Survey Update. Spine 2000; 25(24):3130-3139.
(16) Polonsky WH, Anderson BJ, Lohrer PA, Welch G, Jacobson AM, Aponte JE et al. Assessment of diabetes-related distress. Diabetes Care 1995; 18(6):754-760.
(17) Bradley C. The Diabetes Treatment Satisfaction Questionnaire:DTSQ. Handbook of Psychology and Diabetes: A Guide to Psychological Measurement in Diabetes Research and Practice. Chur, Switzerland: Harwood Academic Publishers; 1994. 111-132.
(18) Cox DJ, Irvine A, Gonder-Frederick L, Nowacek G, Butterfield J. Fear of hypoglycemia: quantification, validation, and utilization. Diabetes Care 1987; 10(5):617-621.
��� ������������������������ ����������������������������
115

(19) Hirsch IB, Abelseth J, Bode BW, Fischer JS, Kaufman FR, Mastrototaro J et al. Sensor-Augmented Insulin Pump Therapy: Results of the First Randomized Treat-to-Target Study. Diabetes Technology & Therapeutics 2008; 10(5):377-383.
(20) Raccah D, Sulmont V, Reznik Y, Guerci B, Renard E, Hanaire H et al. Incremental value of continuous glucose monitoring when starting pump therapy in patients with poorly controlled type 1 diabetes: The RealTrend study. Diabetes Care 2009.
(21) Hermanides J, DeVries JH. Sense and nonsense in sensors. Diabetologia 2010; Apr;53:593-596..
(22) O'Connell M, Donath S, O'Neal D, Colman P, Ambler G, Jones T et al. Glycaemic impact of patient-led use of sensor-guided pump therapy in type 1 diabetes: a randomised controlled trial. Diabetologia 2009; 52(7):1250-1257.
(23) Cryer PE, Davis SN, Shamoon H. Hypoglycemia in Diabetes. Diabetes Care 2003; 26(6):1902-1912.
�������
116

Sensor augmented insulin pump therapy to treat
hyperglycaemia at the coronary care unit; a
randomised controlled pilot trial
J Hermanides, AE Engström, IME Wentholt, KD Sjauw,
JBL Hoekstra, JPS Henriques, JH DeVries
Diabetes Technology & Therapeutics, In Press

ABSTRACT
Background The relationship between admission hyperglycaemia and adverse
outcome in myocardial infarction has been shown consistently. However, achieving
and maintaining normoglycaemia in STEMI-patients has proven difficult. This
study aimed to investigate the efficacy of sensor augmented insulin pump therapy
(SAP) to treat hyperglycaemia.
Methods In a randomised controlled pilot trial, we assigned 20 patients, aged 30-80
years, admitted with STEMI and hyperglycaemia (>=7.8 mmol/l) to receive either
48 hours of strict glycaemic control with an subcutaneous insulin pump augmented
with a continuous glucose monitor (SAP group) or to treatment according to
standard practice (Control group) with glucose measured by blinded CGM. The
main outcome measure proportion of time spent in hyperglycaemia.
Results The median treatment time was 47.0 hours (IQR 46.2 to 48.0) in the SAP
group and 44.6 (IQR 22.0 to 48.6) in the Control group. The median proportion of
time >=7.8 mmol/l was 14.6% (IQR 10.5 to 18.5) in the SAP group and 36.3% in the
control group (IQR 26.0 to 80.4), p=0.006. The proportion of time <=3.9 mmol/l was
8.9% (IQR 8.3 to 12.5) in the SAP group vs. 0% (IQR 0 to 2) in the Control group,
p<0.001. Plasma glucose decreased significantly in SAP group as compared to the
Control group, p=0.025.
Conclusions SAP therapy is effective in reducing hyperglycaemia in STEMI
patients on the coronary care unit. This is accompanied by a small but significant
increase in hypoglycaemia. Although a promising tool for in-hospital
hyperglycaemia therapy, SAP needs improvement before continuing to large scale
randomised controlled trials.
�������
118

1
2
3
4
5
6
7
8
9
10
11
12
13
14
15
INTRODUCTION
In patients admitted for acute myocardial infarction (AMI), elevated admission
glucose levels are strongly predictive of heart failure, shock and mortality. 1-4 In the
first randomised controlled study to treat Diabetic Patients with Acute Myocardial
Infarction (DIGAMI), intensive glucose lowering therapy significantly reduced both
short- and long term mortality. 5;6 Two following trials aiming to treat
hyperglycaemia in patients with- and without diabetes mellitus and AMI (DIGAMI
2 and HI-5) could not reproduce earlier results.7;8 The authors attributed this to
disappointing recruitment rates, but also to the lack of significant difference in
glucose control achieved between the intervention and control groups. Indeed, post-
hoc analyses showed that hyperglycaemia remained an important predictor of
mortality.7;8 Recently, Kosiborod and colleagues showed that glucose normalisation
after AMI is associated with improved survival. 9 It thus seems important but
difficult to lower glucose in the coronary care setting. An important barrier to
implementation of intensive glucose control in the coronary care unit may be the
fear for hypoglycaemia that invariably accompanies glucose lowering therapy.10;11
Furthermore, it has proven hard to handle postprandial glucose excursions in
hospitalised patients who resume normal eating.12 The use of insulin pumps
augmented with a continuous subcutaneous glucose monitor (CGM) could improve
glucose lowering therapy in the coronary care unit (CCU). Using the continuous
stream of glucose data with preset alarms for hypo- and hyperglycaemia, the
subcutaneous insulin infusion rates can be adjusted to maintain euglycaemia.
Furthermore, a mealbolus advisor can be used to limit postprandial
hyperglycaemia.13 The system has already proven beneficial in treating patients
with type 1 diabetes in outpatient settings.14-16 In this study, we investigated the
efficacy of sensor augmented pump therapy to treat hyperglycaemia in patients
admitted to the CCU for AMI.
METHODS
Design and patients
We performed a randomised controlled pilot trial, including patients admitted to
the CCU of the Academic Medical Centre (Amsterdam, The Netherlands), a
university hospital. Patients with an admission glucose of >=7.8 mmol/l (measured
from a venous blood sample using the Accu-Check Inform®, Roche Diagnostics,
Basel Switserland), aged 30-80 years, and ST-elevation myocardial infarction
��� ���������������������������������������������������
119

(STEMI), treated by primary percutaneous coronary intervention (PCI), were
included. Exclusion criteria were known diabetes mellitus type 1, abdominal
abnormalities that might hinder either glucose measurement by the sensor or the
continuous subcutaneous insulin infusion and simultaneous participation in other
studies. The study was approved by the ethic committee of the Academic Medical
Centre and performed in accordance with the declaration of Helsinki. All patients
provided written informed consent. The study is registered with controlled-
trials.com, ISRCTN55085730.
Procedures
After inclusion, patients were randomised to either 48 hours of glucose control with
sensor augmented pump therapy (SAP group) or blinded continuous monitoring
only with treatment according to standard practice (Control group). A flow chart is
provided in Figure 1.
In the SAP group, preceding PCI, an intravenous starting insulin bolus was
injected based on the admission glucose, using an adapted standardised algorithm
(Appendix 1) from Bode et al and adjusted by Nobels et al. 17;18 The Paradigm®
Real-Time system (Medtronic MiniMed, Inc., Northridge, CA), combines a
continuous glucose sensor and insulin pump. Both need insertion subcutaneously in
the abdominal periumbilical area at different sites. Two hours after insertion and
Figure 1- study flow-chart, SAP=Sensor Augmented Pump, CGM= Continuous subcutaneous Glucose Monitor
�������
120

1
2
3
4
5
6
7
8
9
10
11
12
13
14
15
initiation (inherent to the system), the system could be calibrated and the CGM
and insulin pump were started. The CGM provides a glucose value every 5 minutes.
The alarm thresholds were set at 4.7 mmol/l for hypo- and 6.1 mmol/l for
hyperglycaemia. Because the frequency of the alarms requesting a blood glucose
check and recalibration was too time consuming for the nursing personnel we
changed the upper alarm threshold to 7.1 mmol/l after the first 5 patients in the
SAP group. On request of the nursing staff, the lower alarm threshold was set at
4.4 mmol/l and the upper at 7.5 mmol/l for the last two patients.
The nursing staff was instructed to adjust the basal insulin rates responding to
alarms according to the algorithm (Appendix 1). Using the BolusWizard® the study
staff calculated the mealtime insulin bolus. The BolusWizard® program provides a
mealtime insulin bolus advice taking into account the current glucose value, insulin
administration rate, patient specific insulin/carbohydrate sensitivity and the
amount of carbohydrates to be ingested. The insulin/carbohydrate sensitivity was
based on the total daily insulin need of the patient, which was calculated from the
amount of insulin needed to achieve normoglycaemia in each particular patient.
In the control group the CGM of the Paradigm® Real-Time system was inserted
before or shortly after PCI. The CGM readings were not made available to the
treating physician and the patient. If patients had glucose levels above 15 mmol/l
during 3 consecutive routine glucose measurements, standard practice at our
institution indicated that therapy should be started. To minimize bias,
responsibility for the initiation or adjustment of insulin remained with the treating
physician or consulting internal medicine physician. All patients were instructed
not to consume snacks in between the regular meals provided by the hospital.
In both groups the CGM was calibrated according to manufacturersÊ instructions
using venous blood samples every 6 hours. The glucose values for calibration were
determined using the Accu-Check Inform® (Roche Diagnostics, Basel Switserland).
In the SAP group, additional calibrations were performed if there was a false alarm
(Appendix 1). Routine venous blood samples for glucose determination were taken
before PCI and at 24 and 48 hours after admission. Blood was collected in heparine
gel tubes and centrifuged for 10 min at 1600 x g and 18À C for immediate glucose
determination.
Outcome measures and statistical analyses
The main outcome measure was the proportion of time spent hyperglycaemia
(>=7.8 mmol/l) as measured by continuous subcutaneous glucose monitor (CGM)
during 48 hours. Also we calculated the proportion of time spent in hypoglycaemia
��� ���������������������������������������������������
121

(<=3.9 mmol/l), spent within the initial alarm target range (4.7-6.1 mmol/l) and the
Area Under the Curve (AUC) for hypo- and hyperglycaemia.
Differences in plasma glucose values during admittance were assessed.
Furthermore we calculated CGM accuracy with the mean absolute difference
(MAD). The standardised venous recalibration samples taken every 6 hours were
compared with the last sensor value before recalibration (MAD = |CGM value -
blood glucose| / blood glucose). Thus, we did not use the additional calibration
values performed in the SAP group in case of a false alarm. Finally, the number of
alarms to which the nursing staff had to respond in the SAP group was assessed as
well as the number of hypoglycaemic episodes (plasma glucose <=3.9 mmol/l) that
were followed by oral or intravenous glucose administration.
A formal power analysis was not possible, because this is the first study applying
SAP in the CCU. Therefore, we aimed to include 20 patients to be randomised in a
1:1 ratio. Results were presented as mean � SD or median with IQR were
appropriate. For the between group differences from the sensor derived endpoints,
we used the Mann-Whitney-U test or the student T test. The between group
difference for the plasma glucose values were tested using an ANOVA model for
repeated measurements. All analyses were performed in SPSS 16.0 (SPSS Inc.,
Chicago, IL, USA).
RESULTS
After screening 45 patients we randomised 20 patients to either 48 hours of SAP
therapy or standard care. In both the SAP group and Control group one patient
dropped-out because of transferral to another hospital. In the Control group, one
patient withdrew informed consent. Thus 9 and 8 patients were eligible for
analyses in the SAP- and Control group, respectively. All patients resumed eating
regular meals after admission. The baseline characteristics are provided in Table 1.
The median amount of IV insulin given as a bolus before PCI in the SAP group was
3.6 IU (IQR 3.3-4.8). Hereafter, 102.9 IU (IQR 67.6 to 147.3) were given
subcutaneously with the insulin pump, of which 82% (IQR 69-92) was basal insulin
In the Control group no insulin therapy was initiated by the treating physician.
The median treatment time the SAP group was 47.0 hours (IQR 46.2 to 48.0) and in
the Control group 44.6 (IQR 22.0 to 48.6), p=0.67. Figure 2 shows the median
glucose values for both groups as measured every 5 minutes by the CGM system (2
hours after initiation).
�������
122

1
2
3
4
5
6
7
8
9
10
11
12
13
14
15
0 10 20 30 40 50 60
Glu
cose
(mm
ol/l)
3
4
5
6
7
8
9
10
11
Time (hours after randomisation)
SAP groupControl groupUpper Line 7.7 mmolLower line 3.9 mmol/l
48 hours
SAP group (n=9)
Control group (n=8)
Age, years (mean ± SD) 58 ± 8 62 ± 7 Male gender, n (%) 8 (89) 5 (63) Diabetes mellitus, n (%) Insulin treatment on admission, n (%)
4 (44) 1 (11)
2 (25) 0 (0)
Smoking, n (%) 5 (56) 5 (63) Hypertension, n (%) 3 (33) 2 (25) Hypercholesterolemia, n (%) 3 (33) 1 (13) Previous MI, n (%) 3 (33) 1 (13) Family history of CAD, n (%) 5 (56) 1 (13) Culprit vessel -LAD, n (%) 3 (33) 3 (38) -RCA, n (%) 5 (56) 4 (50) -LCX, n (%) 1 (11) 1 (13) HbA1c (median, IQR) 6.5% (6.0-7.5) 5.7% (5.5-6.5)
Table 1- Cohort characteristics, SAP=Sensor Augmented Pump, MI= Myocardial Infarction, CAD= Coronary Artery Disease, LAD= Left Anterior Descending, RCA= Right Coronary Artery, LCX= Left Circumflex
Figure 2- median sensor glucose values every 5 minutes after start measurements sensor for both groups. SAP= Sensor Augmented Pump
��� ���������������������������������������������������
123

The percentage of time spent in hyperglycaemia during the 48 hours after PCI was
significantly smaller in the SAP group: 14.6% (IQR 10.5 to 18.5) vs. 36.3% (IQR
26.0 to 80.4), p<0.01. The proportion of time spent in hypoglycaemia was
significantly greater in the SAP group (8.9%, IQR 8.3 to 12.5) as compared to the
Control group (0%, IQR 0 to 1.5), p<0.001 and the percentage of time spent in the
initial alarm target range of 4.7 to 6.1 mmol/l was 32.7% (IQR 28.4 to 36.0) in the
SAP group and 2.2% (IQR 0.2 to 27.7) in the control group, p=0.036. The AUC for
hyperglycaemia was significantly smaller in the SAP group (0.1 mmol/l/min, IQR
0.0 to 0.1) as compared to the Control group (0.2 mmol/l/min, IQR 0.1 to 0.4),
p=0.015. When comparing the AUC for hypoglycaemia this was 0.02 mmol/l/min
(IQR 0 to 0.02) in the SAP group and 0 mmol/l/min (IQR 0 to 0) in the Control
group, p<0.01.
The median plasma glucose in the SAP group decreased from 10.3 mmol/l (IQR 9.0
to 13.1) pre-PCI to 4.8 mmol/l (IQR 4.0 to 7.4) after 24 hours and 4.6 mmol/l (IQR
4.2 to 7.1) after 48 hours (Figure 3). In the Control group, the median glucose pre-
PCI was 9.1 mmol/l (IQR 8.6 to 11.4), which decreased to 7.7 mmol/l (IQR 6.3 to
10.5) after 24 hours and 6.9 mmol/l (IQR 6.1 to 11.5) after 48 hours. The plasma
glucose in the SAP group decreased significantly more as compared to the Control
group, p=0.025.
Figure 3- median plasma glucose values for both groups. The plasma glucose decreased significantly more in the SAP group, P=0.025. PCI= Primary percutaneous Coronary Intervention SAP= Sensor Augmented Pump
�������
124

1
2
3
4
5
6
7
8
9
10
11
12
13
14
15
In total we measured 7620 valid sensor values during the study. In 6% of the
monitoring time the sensor did not generate a signal. On four occasions a sensor
had to be replaced because of sensor failure. The mean number of calibrations per
24 hours was 9 (�4) in the SAP group and 4 (�1) in the Control group and the
median number of paired regular calibration values (every 6 hours) per patient was
5 (IQR 4-6.5). The accuracy of the CGM based on the regular calibration values did
not differ significantly between both groups with an MAD of 21.6% (�9.6) in the
SAP group and 18.5% (�8.8) in the control group (p=0.50).
In the SAP group, the nursing staff responded 11 times (�6) per 24 hours to an
alarm, with an equal distribution between the hypo- and hyperglycaemic alarms. In
the majority of the cases, the patient needed to indicate that the alarm was going
off because the acoustic signal was too weak to be heard by the nurse on the
coronary care unit. The basal rate was adjusted 9 times (�5, mean � SD) per 24
hours. The BolusWizard® advice was followed 75% of the time. In 25% of the time
the advised amount of insulin was lowered by the study staff. In the SAP group,
hypoglycaemia (plasma glucose <=3.9 mmol/l) followed by glucose administration
occurred 11 times in 6 patients. Of these, 3 patients had known diabetes. All events
were without clinical sequelae and occurred at least 23 hours after admission with
a median temporary distribution of 31.4 hours (IQR 26.7-36.6) after admission. In
the Control group, no hypoglycaemia was observed. No other device related adverse
events occurred.
DISCUSSION
In this randomised controlled trial we showed that sensor augmented insulin pump
therapy in patients with STEMI and admission hyperglycaemia lowered the
proportion of time spent in hyperglycaemia. This was accompanied by a significant
increase in the percentage of time in normoglycaemia, but also an increase in
hypoglycaemia and workload.
The (CREATE)-ECLA, Pol-GIK and GIK trials all aimed to deliver high
concentrations of insulin in glucose-insulin-potassium solution to patients with
AMI, without lowering the mean glucose levels.19-21 All of these trials yielded
negative results. In patients with diabetes mellitus, the first DIGAMI trial
successfully lowered the glucose during admittance and thereafter, thereby
improving survival.6 Targeting the mean glucose in the CCU seems more important
than the administration of insulin, as also indicated by Kosiborod and colleagues.9
In contrast with the DIGAMI 2 and HI-5 trial, we were able to lower median
��� ���������������������������������������������������
125

glucose values during CCU admittance after STEMI.7;8 The reduction of the
proportion of time spent in hyperglycaemia that we found was also shown in the
trials investigating SAP therapy in diabetes mellitus type 1 patients.14-16;22 An
increase in hypoglycaemia is not a consistent finding in these trials; however they
all concern intensively insulin treated type 1 patients, with hypoglycaemia
occurring in both arms of the studies. In our study, only the SAP group received
strict glucose control with ensuing hypoglycaemia.
The use of a continuous glucose sensor in a CCU setting was investigated before in
an exploratory study by Rowen and colleagues.23 They concluded that the use of
CGM was helpful to the nursing personnel, without an increase in workload. This is
in contrast with our findings, as most of the personnel indicated that the workload
substantially increased due to SAP treatment. Besides paying attention to CGM
alarms and checking the plasma glucose, the nursing staff had to follow the
treatment algorithm and perform calibrations at set times. The number of alarms
to which the nursing staff had to respond was experienced as high (11 times (�6)
per 24 hours).To decrease the workload, we changed the alarm thresholds for the
hyperglycaemic alarm during the trial. One important explanation for the false
positive or negative alarms is the inaccuracy of the interstitial glucose
measurements as compared to the plasma glucose. In our trial we found the MAD
to be 18.5 to 21.5%. It should be noted that we used venous plasma samples to
determine the glucose calibration values, whereas the usual outpatient practice is
to calibrate against capillary blood. However, our results are in line with previous
studies investigating the CGM in the ICU.24;25 The somewhat higher calibration
rate in the SAP group did not lead to a different accuracy of CGM measurements in
both groups, which may be due to the fact that sensor accuracy is more influenced
by the timing rather than the frequency of the calibration.26 We only calibrated the
sensor when glucose values were stable and the patient was not eating.
On many occasions, the patient had to alert the nurse that an alarm was signalling.
It is therefore likely that not all alarms were addressed immediately and this could
have contributed to the hypoglycaemia developed in 6 patients. The observation
that the acoustic signal of the SAP is not loud enough in the hospital setting has
also been made by Logtenberg et al.24 We have however used a device designed for
treatment in the outpatient setting and necessary adjustments for the in-hospital
setting were to be expected.
Due to logistic reasons we were not always able to complete the 48 hours of
treatment time. Figure 3 clearly shows that the median sensor value lines meet
before completion of the preset 48 hours of intervention. Although this is a
�������
126

1
2
3
4
5
6
7
8
9
10
11
12
13
14
15
limitation of the trial, plasma glucose in SAP was lower as compared to the Control
group up to 48 hours.
Because this was a pilot trial, it was limited by its relative small sample size.
Therefore, despite appropriate randomisation procedures, the percentage of
patients with diabetes mellitus was almost twice as high in the SAP group (44%) as
compared to the Control group (25%), which was also reflected in a higher
admission glucose and HbA1c in the SAP group. However, despite this baseline
difference putting the SAP group at the disadvantage, glucose in the SAP group
was significantly lower as compared to the Control group in the first 48 hours.
Notably, there was also a spontaneous glucose decrease in the Control group from
baseline to 48 hours.
This is the first randomised controlled pilot trial showing that in hyperglycaemic
STEMI patients, SAP clearly significantly reduces the duration of hyperglycaemia
as well as plasma glucose levels, when compared with hyperglycaemic control
patients. This is however accompanied by a small but significant increase of
hypoglycaemia and considerable workload for the nursing staff. Accuracy and
alarm functions need improvement in this setting. Although a promising tool for in-
hospital hyperglycaemia therapy SAP needs improvement, especially with regard
to sensor accuracy and the alarm function of the device, before continuing to large
scale randomised controlled trials.
ACKNOWLEDGEMENTS
We thank Medtronic International Trading Sàrl for providing the sensors for this
investigation free of charge.
��� ���������������������������������������������������
127

REFERENCES
(1) Capes SE, Hunt D, Malmberg K, Gerstein HC. Stress hyperglycaemia and increased risk of death after myocardial infarction in patients with and without diabetes: a systematic overview. Lancet 2000; 355(9206):773-778.
(2) Hsu CW, Chen HH, Sheu WHH, Chu SJ, Shen YS, Wu CP et al. Initial Serum Glucose Level as a Prognostic Factor in the First Acute Myocardial Infarction. Annals of Emergency Medicine 2007; 49(5):618-626.
(3) Ishihara M, Kojima S, Sakamoto T, Asada Y, Tei C, Kimura K et al. Acute hyperglycemia is associated with adverse outcome after acute myocardial infarction in the coronary intervention era. Am Heart J 2005; 150(4):814-820.
(4) Kosiborod M, Rathore SS, Inzucchi SE, Masoudi FA, Wang Y, Havranek EP et al. Admission Glucose and Mortality in Elderly Patients Hospitalized With Acute Myocardial Infarction: Implications for Patients With and Without Recognized Diabetes. Circulation 2005; 111(23):3078-3086.
(5) Malmberg K, Ryden L, Efendic S, Herlitz J, Nicol P, Waldenstrom A et al. Randomized trial of insulin-glucose infusion followed by subcutaneous insulin treatment in diabetic patients with acute myocardial infarction (DIGAMI study): effects on mortality at 1 year. J Am Coll Cardiol 1995; 26(1):57-65.
(6) Malmberg K. Prospective randomised study of intensive insulin treatment on long term survival after acute myocardial infarction in patients with diabetes mellitus. DIGAMI (Diabetes Mellitus, Insulin Glucose Infusion in Acute Myocardial Infarction) Study Group. BMJ 1997; 314(7093):1512-1515.
(7) Cheung NW, Wong VW, McLean M. The Hyperglycemia: Intensive Insulin Infusion In Infarction (HI-5) Study: A randomized controlled trial of insulin infusion therapy for myocardial infarction. Diabetes Care 2006; 29(4):765-770.
(8) Malmberg K, Ryden L, Wedel H, Birkeland K, Bootsma A, Dickstein K et al. Intense metabolic control by means of insulin in patients with diabetes mellitus and acute myocardial infarction (DIGAMI 2): effects on mortality and morbidity. Eur Heart J 2005; 26(7):650-661.
(9) Kosiborod M, Inzucchi SE, Krumholz HM, Masoudi FA, Goyal A, Xiao L et al. Glucose Normalization and Outcomes in Patients With Acute Myocardial Infarction. Arch Intern Med 2009; 169(5):438-446.
(10) Kosiborod M, Inzucchi SE, Goyal A, Krumholz HM, Masoudi FA, Xiao L et al. Relationship Between Spontaneous and Iatrogenic Hypoglycemia and Mortality in Patients Hospitalized With Acute Myocardial Infarction. JAMA 2009; 301(15):1556-1564.
(11) Mellbin LG, Malmberg K, Waldenstrom A, Wedel H, Ryden L, for the DIGAMI. Prognostic implications of hypoglycaemic episodes during hospitalisation for myocardial infarction in patients with type 2 diabetes: a report from the DIGAMI 2 trial. Heart 2009; 95(9):721-727.
(12) Vriesendorp TM, Roos YB, Kruyt ND, Biessels GJ, Kappelle LJ, Vermeulen M et al. Efficacy and safety of two 5 day insulin dosing regimens to achieve strict glycaemic control in patients with acute ischaemic stroke. J Neurol Neurosurg Psychiatry 2009; 80(9):1040-1043.
(13) Mastrototaro JJ, Cooper KW, Soundararajan G, Sanders JB, Shah RV. Clinical experience with an integrated continuous glucose sensor/insulin pump platform: a feasibility study. Adv Ther 2006; 23(5):725-732.
(14) Hermanides J., NŒrgaard K., Bruttomesso D., Mathieu C., Frid A., Dayan C.M. et al. Sensor augmented pump therapy substantially lowers HbA1c. Diabetologia 52[Supplement I], S43. 2009.
�������
128

1
2
3
4
5
6
7
8
9
10
11
12
13
14
15
(15) The Juvenile Diabetes Research Foundation Continuous Glucose Monitoring Study Group. Continuous Glucose Monitoring and Intensive Treatment of Type 1 Diabetes. N Engl J Med 2008; 359(14):1464-1476.
(16) Raccah D, Sulmont V, Reznik Y, Guerci B, Renard E, Hanaire H et al. Incremental value of continuous glucose monitoring when starting pump therapy in patients with poorly controlled type 1 diabetes: The RealTrend study. Diabetes Care 2009.
(17) Bode BW, Braithwaite SS, Steed RD, Davidson PC. Intravenous insulin infusion therapy: indications, methods, and transition to subcutaneous insulin therapy. Endocr Pract 2004; 10 Suppl 2:71-80.
(18) Nobels F, Van Pottelbergh I, Van Crombrugge P. Bloedglucosecontrole tijdens opname in het ziekenhuis. Essentials of insulin therapy in diabetes mellitus 2006; 6:4-18.
(19) Ceremuzynski L, Budaj A, Czepiel A, Burzykowski T, Achremczyk P, Smielak-Korombel W et al. Low-dose glucose-insulin-potassium is ineffective in acute myocardial infarction: results of a randomized multicenter Pol-GIK trial. Cardiovasc Drugs Ther 1999; 13(3):191-200.
(20) Mehta SR, Yusuf S, Diaz R, Zhu J, Pais P, Xavier D et al. Effect of glucose-insulin-potassium infusion on mortality in patients with acute ST-segment elevation myocardial infarction: the CREATE-ECLA randomized controlled trial. JAMA 2005; 293(4):437-446.
(21) van der Horst I, Zijlstra F, van 't Hof AW, Doggen CJ, de Boer MJ, Suryapranata H et al. Glucose-insulin-potassium infusion inpatients treated with primary angioplasty for acute myocardial infarction: the glucose-insulin-potassium study: a randomized trial. J Am Coll Cardiol 2003; 42(5):784-791.
(22) Hirsch A, Windhausen F, Tijssen JG, Verheugt FW, Cornel JH, de Winter RJ. Long-term outcome after an early invasive versus selective invasive treatment strategy in patients with non-ST-elevation acute coronary syndrome and elevated cardiac troponin T (the ICTUS trial): a follow-up study. The Lancet 369(9564):827-835.
(23) Rowen M, Schneider DJ, Pratley RE, Sobel BE. On rendering continuous glucose monitoring ready for prime time in the cardiac care unit. Coron Artery Dis 2007; 18(5):405-409.
(24) Logtenberg SJ, Kleefstra N, Snellen FT, Groenier KH, Slingerland RJ, Nierich AP et al. Pre- and postoperative accuracy and safety of a real-time continuous glucose monitoring system in cardiac surgical patients: a randomized pilot study. Diabetes Technol Ther 2009; 11(1):31-37.
(25) Piper HG, Alexander JL, Shukla A, Pigula F, Costello JM, Laussen PC et al. Real-Time Continuous Glucose Monitoring in Pediatric Patients During and After Cardiac Surgery. Pediatrics 2006; 118(3):1176-1184.
(26) King C, Anderson SM, Breton M, Clarke WL, Kovatchev BP. Modeling of Calibration Effectiveness and Blood-to-Interstitial Glucose Dynamics as Potential Confounders of the Accuracy of Continuous Glucose Sensors during Hyperinsulinemic Clamp. J Diabetes Sci Technol 2007; 1(3):317-322.
��� ���������������������������������������������������
129

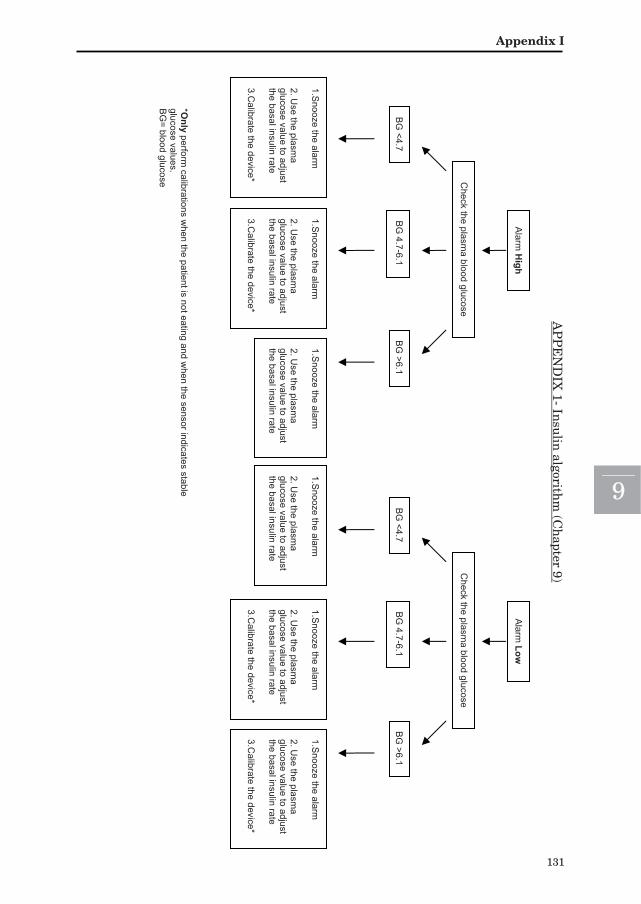
1
2
3
4
5
6
7
8
9
10
11
12
13
14
15
Check the plasm
a blood glucose
1.Snooze the alarm
2. U
se the plasma
glucose value to adjust the basal insulin rate 3.C
alibrate the device*
*Only perform
calibrations when the patient is not eating and w
hen the sensor indicates stable glucose values. B
G= blood glucose
BG
<4.7 B
G 4.7-6.1
Alarm
High
BG
>6.1
1.Snooze the alarm
2. U
se the plasma
glucose value to adjust the basal insulin rate
1.Snooze the alarm
2. U
se the plasma
glucose value to adjust the basal insulin rate 3.C
alibrate the device*
Check the plasm
a blood glucose
1.Snooze the alarm
2. U
se the plasma
glucose value to adjust the basal insulin rate 3.C
alibrate the device*
BG
<4.7B
G 4.7-6.1
Alarm
Low
BG
>6.1
1.Snooze the alarm
2. U
se the plasma
glucose value to adjust the basal insulin rate
1.Snooze the alarm
2. U
se the plasma
glucose value to adjust the basal insulin rate 3.C
alibrate the device*
AP
PE
ND
IX 1- In
sulin
algorithm
(Ch
apter 9)
���������
131

E/u=number of insulin units per hour
Intravenous starting insulin bolus pre-PCI:
Only for patients randomised to the sensor augmented pump group - Determine the starting rate in K2, -Multiply by 1.5, - Give I.V.
Glycaemia
(mmol/l)
K1 (E/u)
K2 (E/u)
START
K3 (E/u)
K4 (E/u)
K5 (E/u)
K6 (E/u)
K7 (E/u)
K8 (E/u)
K9 (E/u)
K10 (E/u)
> 25 4.4 8.8 13.2 17.6 22.0 26.4 30.8 35.2 39.6 44.0 21.4 - 25 3.6 7.2 10.8 14.4 18.0 21.6 25.2 28.8 32.4 36.0 18.5 - 21.3 3.0 6.0 9.0 12.0 15.0 18.0 21.0 24.0 27.0 30.0 16.1 - 18.4 2.5 5.0 7.5 10.0 12.5 15.0 17.5 20.0 22.5 25.0 13.9 - 16.0 2.1 4.2 6.3 8.4 10.5 12.6 14.7 16.8 18.9 21.0 12.1 - 13.8 1.7 3.4 5.1 7.2 8.5 10.2 11.9 13.6 15.3 17.0 10.4 - 12.0 1.4 2.8 4.2 5.6 7.0 8.4 9.8 11.2 12.6 14.0 9.1 - 10.3 1.2 2.4 3.6 4.8 6.0 7.2 8.4 9.6 10.8 12.0 8.4 - 9.0 1.0 2.0 3.0 4.0 5.0 6.0 7.0 8.0 9.0 10.0 7.8 - 8.3 0.9 1.8 2.7 3.6 4.5 5.4 6.3 7.2 8.1 9.0 7.3 - 7.7 0.8 1.6 2.4 3.2 4.0 4.8 5.6 6.4 7.2 8.0 6.7 - 7.2 0.7 1.4 2.1 2.8 3.5 4.2 4.9 5.6 6.3 7.0 6.2 - 6.6 0.6 1.2 1.8 2.4 3.0 3.6 4.2 4.8 5.4 6.0 5.9 - 6.1 0.5 1.0 1.5 2.0 2.5 3.0 3.5 4.0 4.5 5.0 5.6 - 5.8 0.4 0.9 1.3 1.8 2.2 2.7 3.0 3.6 4.0 4.5 5.3 - 5.5 0.4 0.8 1.2 1.6 2.0 2.4 2.8 3.2 3.6 4.0 5.0 - 5.2 0.3 0.7 1.0 1.4 1.7 2.1 2.4 2.8 3.2 3.5 4.7 - 5.0 0.3 0.6 0.9 1.2 1.5 1.8 2.1 2.4 2.7 3.0 4.4 – 4.6 0.2 0.5 0.7 1.0 1.2 1.5 1.7 2.0 2.3 2.5 4.2 - 4.3 0.2 0.4 0.6 0.8 1.0 1.2 1..4 1.6 1.8 2.0 3.9 - 4.1 0.1 0.3 0.4 0.6 0.7 0.9 1.0 1.2 1.3 1.5 3.3 - 3.8 0.1 0.2 0.3 0.4 0.5 0.6 0.7 0.8 0.9 1.0 < 3.3 0 0 0 0 0 0 0 0 0 0
Advice Glucose range (mmol/L)
Specific General
16.1 - > 25
Check ketones at glucose > 16.7 mmol/L
Consult doctor if E/u=> 24.0
6.2 – 16.0 -
If glycaemic range has been lowered: remain in same column If glycaemic range unaltered: move 1 column to the right
4.7 – 6.1 - If glycaemia remains within this zone:
stay in same column < 3.3. – 4.6
-
Consult doctor if E/u =<0.2 and glucose=<4.1
If glycaemia < 4.7 mmol/L: move 1 column to the left
Glycaemia (mmol/l) Glucose 30% Action 3.3 - 3.8 20 ml 2.8 - 3.3 30 ml < 2.8 40 ml
o Move 1 column to the left o Re-check BG after 15 min o BG 2x < 3.3 mmol/L: consult doctor
�������
132

No apparent local effect of insulin on
microdialysis continuous glucose monitoring
measurements
J Hermanides, IME Wentholt, AA Hart, JBL Hoekstra,
JH DeVries
Diabetes Care, 2008 Jun;31(6):1120-2

ABSTRACT
Background Data investigating the possible disturbing influence of insulin in the
vicinity of continuous glucose monitoring (CGM) is lacking. We investigated the
hypothesis that high local insulin concentrations would interfere with sensor
readings.
Methods Two microdialysis sensors were inserted in the periumbilical region of 10
continuous subcutaneous insulin infusion (CSII) treated type 1 diabetes patients. A
test sensor was inserted as close as possible to the insulin catheter and compared
with a control sensor. Glucose peak and nadir were induced. Horizontal and
vertical shifts were assessed using curve fitting and mean absolute difference
(MAD) between paired blood and sensor values were calculated.
Results Curve fitting showed no significant differences between the two sensors.
MAD � SD was 8.50 � 3.47% for the test sensor and 9.21 � 3.17% for the control
sensor, p=0.72.
Conclusions Microdialysis CGM can be accurately performed in the proximity of
CSII systems.
��������
134

1
2
3
4
5
6
7
8
9
10
11
12
13
14
15
INTRODUCTION
With ongoing technology development, continuous glucose monitoring (CGM) is
expected to work together with continuous subcutaneous insulin infusion systems
(CSII), evolving towards closed-loop insulin delivery.1 According to manufacturersÊ
instructions, the distance between the insertion points of the pump catheter and
the CGM catheter should be more than 2-3 inches.2 However, no clear evidence
supports this. We therefore investigated the hypothesis that high local insulin
concentrations would interfere with sensor readings.
RESEARCH AND DESIGN METHODS
Patients with at least 6 months of CSII experience were included. Exclusion
criteria were BMI >30 kg/m²; heparin, oral anticoagulant, or corticosteroid use;
pregnancy or breastfeeding; and skin problems prohibiting needle insertion. After
local ethics committee approval, participants gave written informed consent. A
GlucoDay® S (A. Menarini Diagnostics, Firenze, Italy) microdialysis CGM sensor3
was inserted in the periumbilical region, and a control sensor was inserted at least
10 cm away from the test sensor. The insulin catheter was inserted parallel and as
close as possible to the test sensor. The patient returned after overnight fasting.
Blood was sampled in sodium fluoride tubes through an intravenous catheter in the
forearm for immediate glucose determination at the laboratory (HK/G-6PD method,
Roche/Hitachi). Blood glucose levels were increased by withholding the usual rapid-
acting insulin injection, and patients then consumed a standard breakfast, as
described previously.4 Forty minutes after breakfast, an augmented bolus of insulin
(mean � SD 10.7 � 4.5 IU/kg) was administered. During the whole experiment,
basal CSII rates were maintained. Calibration was performed retrospectively, using
two venous glucose values from periods with minimal glucose rate of change, before
breakfast and at the end of the experiment.
Statistical analyses were performed using SPSS version 14.0.0 and package S+ 6.2
was used for curve fitting as previously described.4 It results in a horizontal and
vertical shift for both sensors, indicating sensor delay and drift respectively. For
each subject, blood glucose values were paired with concomitant interpolated
sensor values from the test and the control sensor. The mean absolute difference
(MAD) for each sensor was calculated per subject [|sensor value -blood
� ��������� ��������� �������� ����� �����������������������
135

glucose|/blood glucose], averaging the paired data per experiment per sensor.
Comparisons of the MADs were made using the WilcoxonÊs signed-rank test.
RESULTS
Out of fifteen performed experiments, five were unsuccessful because of pressure or
leakage problems. Results of three female and seven male diabetes type 1 subjects
were analysed. Mean age was 50.1 � 7.9 years (mean � SD), BMI 24.2 � 2.6 kg/m²,
diabetes duration 26.8 � 9.9 year and HbA1c 8.4 � 1.4%. The mean insertion
distance between the insulin catheter and the closest insertion point of the
microfiber was 0.9 � 0.2 cm. There was no significant correlation between the
insertion distance and the MAD of the test sensor (r =-0.12). The curves from the
ten successful experiments are shown in Figure 1. Bland-Altman plots are provided
in Figure 2.
After curve fitting, there is evidence that the test sensor values trail those of the
blood glucose by an average -10.8 � 4.0 min (range of –18.2 to -6.0 min, one-sample t test: p<0.001). A minus sign indicates a delay with respect to the blood glucose
curve. For the control series, the average delay was: -5.7 � 8.1 min (–11.8 to 14.8
min, one-sample t test: p=0.053). However, the difference in horizontal shift
between both sensors did not reach statistical significance (p=0.13). No significant
vertical shifts were detected.
��������
136

1
2
3
4
5
6
7
8
9
10
11
12
13
14
15
Figure 1- The results of all ten patients are displayed. The continuous line represents the blood glucose values, the dotted line represents the control sensor and the long dashed line represents the test sensor. The tim
e of breakfast is indicated by the arrow.
� ��������� ��������� �������� ����� �����������������������
137

In total, 374 blood glucose values were paired with the concomitant values from
both sensors, with 37 � 2 paired values per patient. The average MAD calculated
from the ten MADs was 9.21 � 3.17% for the control sensor and 8.50 � 3.47% for the
test sensor (WilcoxonÊs signed-rank test p=0.72).
Figure 2- Bland-Altman plots for the control sensor (A) and the test sensor (B). The x-axis represents the average of blood and sensor glucose measurements, and the y-axis represents the difference between sensor and paired blood glucose (BG) measurements as proportion of the average BG measurement. The difference between BG and sensor readings is 0 at the horizontal solid line. The long dashed line represents the mean difference (–0.0014 for the control and –0.024 for the test sensor); dotted lines are drawn at the mean difference ± 1.96 times the SD of the differences.
��������
138

1
2
3
4
5
6
7
8
9
10
11
12
13
14
15
CONCLUSIONS
We investigated the hypothesis that high local insulin concentrations would
interfere with sensor readings by infusion of insulin in the proximity of a
microdialysis type glucose sensor. No difference in MAD was detected when
comparing the test and control sensors. When applying curve fitting, there was a
significant delay (mean � SD 10.8 � 4.0 min) of the test sensor compared to the
blood glucose values. A non-significant delay was found for the control sensor (5.7 �
8.1 min). This cannot be fully explained by instrumental delay.4;5 One could
hypothesise that insulin induced saturation of the low number of GLUT4s present
at the adipocyte cell surface could explain how glucose can reliably be measured in
the vicinity of relatively high insulin concentrations and possibly delay glucose-
transporting capacity.6 This speculation merits further investigation. However, to
minimize variation, we have used the same devices for the test and control sensors
and bias created due to constant intersensor variability can therefore not be
excluded.7 A preliminary human pilot study also suggested no local influence of
insulin on sensor readings in humans.8
Furthermore, the relatively low number of 23 hypoglycaemic paired readings is a
limitation of this study and the efficacy of the test sensor in the hypoglycaemic
range needs further investigation.
We aimed to position the tip of the injection catheter as close to the microdialysis
catheter as possible. Using ultrasound, we were not able to visualize the microfiber
subcutaneously. Therefore we can not tell the exact distance between the injection
and microdialysis sites, but is seems likely that the actual distance was smaller
than the surface distance of the two insertions.
We conclude that microdialysis CGM can be accurately performed at a mean
distance of 0.9 cm from a CSII system in the normo- and hyperglycaemic ranges
and probably the hypoglycaemic range during rapid rise and fall of blood glucose.
This has important consequences for the use of CGM in type 1 diabetes and the
development of a closed-loop system. Further studies should focus on a possible
additional sensor delay caused by insulin and evaluate sensor accuracy in the
proximity of insulin during hypoglycaemia.
ACKNOWLEDGEMENTS
We acknowledge Nico J. Smits for his expert ultrasound help.
� ��������� ��������� �������� ����� �����������������������
139

REFERENCES
(1) Hanaire H. Continuous glucose monitoring and external insulin pump: towards a subcutaneous closed loop. Diabetes Metab 2006; 32(5 Pt 2):534-538.
(2) Medtronic MiniMed. Important safety information. http://www minimed com/about/safety [accessed 2008 Feb. 12]; Available at: http://www.minimed.com/about/safety.html
(3) Kubiak T, Worle B, Kuhr B, Nied I, Glasner G, Hermanns N et al. Microdialysis-Based 48-Hour Continuous Glucose Monitoring with GlucoDay: Clinical Performance and Patients' Acceptance. Diabetes Technology & Therapeutics 2006; 8(5):570-575.
(4) Wentholt IM, Vollebregt MA, Hart AA, Hoekstra JB, Devries JH. Comparison of a needle-type and a microdialysis continuous glucose monitor in type 1 diabetic patients. Diabetes Care 2005; 28(12):2871-2876.
(5) Wentholt IM, Hart AA, Hoekstra JB, Devries JH. Relationship between interstitial and blood glucose in type 1 diabetes patients: delay and the push-pull phenomenon revisited. Diabetes Technol Ther 2007; 9(2):169-175.
(6) Kozka IJ, Clark AE, Reckless JPD, Cushman SW, Gould GW, Holman GD. The effects of insulin on the level and activity of the GLUT4 present in human adipose cells. Diabetologia 1995; 38(6):661-666.
(7) Boyne MS, Silver DM, Kaplan J, Saudek CD. Timing of changes in interstitial and venous blood glucose measured with a continuous subcutaneous glucose sensor. Diabetes 2003; 52(11):2790-2794.
(8) Regittnig W, Koehler G, Bodenlenz M, Schaller HC, Koehler H, Ellmerer M et al. Coupling of Subcutaneous Insulin Delivery and Subcutaneous Glucose Sensing by Means of a Microperfusion or Microdialysis Probe. 5th Annual Diabetes Technology Meeting , A118. 2005
.
��������
140

�
Postprandial glycaemic excursions with the use
of a closed-loop platform in diabetes type 1, a
pilot study
AC van Bon, J Hermanides, R Koops, JBL Hoekstra, JH
DeVries
Submitted for publication

�
ABSTRACT
Background To evaluate the efficacy of a proportional derivative algorithm closed-
loop system to control postprandial glucose concentrations in diabetes type 1.
Methods Six patients treated with CSII received a standardised meal on three
days. The first day served as control, the second day as learning experiment for the
algorithm and the third day to compare the closed-loop to the control day. Venous
glucose was measured as reference until 300 minutes postprandially. The artificial
pancreas platform consisted of a subcutaneous continuous glucose monitor (CGM),
the GlucoDay® S (Menarini Diagnostics), two D-Tron+ pumps (Disetronic Medical
Systems) for subcutaneous insulin and glucagon administration connected to a
personal computer.
Results One patient was excluded due to technical failure of the CGM. Two of five
patients were male; mean age was 50.8 years (range 38 to 60) and mean HbA1c
8.7% (range 7.0 to 12.2). The median postprandial venous glucose concentration of
day 1 was 11.4 mmol/l (range 5.2 to 14.7 mmol/l) compared to 8.7 mmol/l (7.1 to 8.8
mmol/l) on day 3 (p=0.14). Percentage of time spent in postprandial euglycaemia on
day 1 was 31% versus 60% on day 3 (p=0.08). Time spent below 3.9 mmol/l was 19%
on day 1 compared to 11% on day 3 (p=1.0). Time above 10 mmol/l on day 1 was
60% versus 29% on day 3 (p=0.22).
Conclusion The artificial pancreas provided comparable postprandial glycaemic
control as usual care.
�������
142

1
2
3
4
5
6
7
8
9
10
11
12
13
14
15
�
INTRODUCTION
Continuous subcutaneous insulin infusion (CSII) combined with continuous
glucose monitoring (CGM) and a glucose control algorithm would result in an
artificial pancreas. Artificial pancreas or closed-loop systems are capable to
achieve automated glucose control in ICU or CCU settings.1;2
Steil3 and Weinzimer4 tested a subcutaneous artificial pancreas based on a
proportional integrated derivative (PID) model in a clinical research unit. Mean
glucose concentrations were not different from usual care; however postprandial
glucose excursions were higher than with usual care. A manually administered
premeal priming bolus could partially overcome this problem. Schaller et al.5
evaluated an algorithm based on model predictive control (MPC) in six patients
with diabetes type 1 during eight hours in the fasting condition. The model
normalised glucose concentrations if the glucose level was above 6 mmol/l and
then maintained normoglycaemia. Hovorka et al.6 evaluated glucose control with
an algorithm based on a MPC model in patients with diabetes type 1 compared to
usual care with an insulin pump in three different settings: overnight glucose
control starting two hours after dinner following a pre-meal with self-determined
manual insulin bolus until the next morning, postprandial glucose control 30
minutes after dinner comparing rapidly absorbed carbohydrates to slowly
absorbed carbohydrates until the next morning and glucose control starting two
hours after 45 minutes of exercise until the next morning. In all these studies
closed-loop glucose control resulted in more time in target range as compared to
conventional care. Recent data showed similar results for an MPC closed loop
artificial pancreas compared to usual care in fourteen patients.7;8
The aim of this study was to test the feasibility of a control algorithm to control
postprandial glucose concentrations after a single meal in patients with diabetes
type 1.
METHODS
Subjects
Six patients with type 1 diabetes treated with CSII for more than six months, aged
18-70 years were recruited for the study. All patients gave written informed
consent. The ethics committee of the Academic Medical Centre at the University of
Amsterdam approved the study.
�� ������������������������� ��������������������������������������
143

�
Study Procedures
In the afternoon before the study visit, a microdialysis glucose sensor (GlucoDay® S
Menarini Diagnostics, Firenze, Italy) was inserted. Patients were admitted to the
clinical research unit of the Academic Medical Centre the following morning in
fasting condition. An intravenous catheter was inserted into an antecubital vein for
blood sampling. During the first test day, the patients administered a self-
determined insulin bolus before a standardised meal of 40 gram carbohydrates.
During the second and third test day, patients wore two D-Tron+ pumps
(Disetronic Medical Systems, St. Paul, MN) for subcutaneous insulin and glucagon
administration, respectively. The CGM sensor, insulin pump and the glucagon
pump were connected to a personal computer containing the algorithm. The test
started after calibration of the CGM. No premeal insulin bolus was administered
when the standardised meal was served. The sensor glucose values were read out
every ten seconds. Every five minutes an average glucose level was calculated. The
second day was a so-called learning day of the algorithm to determine an individual
insulin sensitivity factor. This factor was initially calculated on the basis of total
daily insulin need and adjusted as needed during the day 2 experiment. During all
three test days, venous glucose was measured at baseline and every 30 minutes
until five hours postprandially.
Calibration procedure
The calibration procedure was performed before starting the artificial pancreas and
repeated in case of a difference between sensor glucose and self-monitored glucose
level above 1.5 mmol/l. The calibration procedure consisted of three measurements
of the sensor glucose and the corresponding concomitant self-monitored glucose
values with an interval of ten minutes. The average difference of the three
measurements between the sensor glucose level and the self-monitored glucose was
calculated. This average was the correction factor for the sensor glucose.
Algorithm
The control algorithm, employed in this study was designed by Inreda BV (Goor,
the Netherlands) and is patented (NL C 1032756; WO 2007/049961 A3). The
algorithm can be characterised as a self learning individualised proportional
derivative controller. Insulin delivery is determined by the difference between
current and target glucose and the rate of change of glucose levels. Furthermore,
insulin delivery is adjusted for individual insulin sensitivity. Target blood glucose
values can be programmed for a lower and an upper limit. The upper limit was set
�������
144

1
2
3
4
5
6
7
8
9
10
11
12
13
14
15
�
at 7 mmol/l and the lower limit at 5 mmol/l. Every five minutes, the glucose levels
are compared to the target range. There are three operating ranges. First, if glucose
values are below the lower limit, a sound signal is generated. The patient can
correct the low glucose value by eating. In case of a glucose fall below a next limit,
glucagon is injected according to a formula taking into account the rate of glucose
fall. During the experiment, this was set at 3.2 mmol/l. If glucose levels are
between the lower and upper limit, no insulin is administered by the algorithm. If
glucose levels are above the upper limit, insulin is injected according to a formula
taking into account the rate of glucose rise. Every seven minutes, insulin is
administered if the glucose levels are above the limit and not falling. If glucose
concentration is above 20 mmol/l, the maximum insulin administration rate is
reached i.e. 10 units per seven minutes.
Statistics
All postprandial venous glucose concentrations on the first day and on the third day
were averaged per patient and were compared as paired measurements with the
Wilcoxon Signed Ranks test. Median venous glucose concentrations are given with
minimum and maximum value. Sensor glucose concentrations were calculated
every three minutes. The median sensor glucose concentration is expressed as area
under the curve (AUC). Demographic features are given as mean with range of
minimum and maximum. Time spent in euglycaemia was defined as the percentage
of time the glucose concentrations were between 3.9 mmol/l and 10.0 mmol/l.
RESULTS
Due to failure of the microdialysis filament on day 3, one male patient was
excluded. Two of five patients were male; mean age was 50.8 years (range 38 to 60)
and mean HbA1c 8.7% (range 7.0 to 12.2). The mean diabetes duration was 30.3
years (range 14 to 45) and the mean CSII duration was 6.7 years (range 2 to 14,
Table 1).
Table 1 Baseline characteristics (n=5)
Male / Female 2 / 3 Age, years (mean, range) 50.8 (38 – 60) HbA1c, % (mean, range) 8.7 (7 – 12.2) Diabetes duration, years (mean, range) 30.3 (14 – 45) CSII duration, years (mean, range) 6.7 (2 – 14)
�� ������������������������� ��������������������������������������
145

�
The median venous glucose concentration on day 1 was 11.4 mmol/l (range 5.2 to
14.7 mmol/l) compared to a median venous glucose concentration in day 3 of 8.7
mmol/l (range 7.1 to 8.8 mmol/l), p=0.14 (see Figure 1 and Table 2). For those with
HbA1c >7%, n=4, the median glucose concentration on day 1 was 12.6 mmol/l
(range 9.2 to 14.7 mmol/l) compared to 8.7 mmol/l (range 8.5 to 8.8 mmol/l) on day
3, p=0.07. The AUC of the sensor glucose concentration of day 1 (2993 mmol/l x
minutes, range 1900 to 4581) did not differ from day 3 (2746 mmol/l x minutes
range 2426 to 3330), p=0.5. The venous peak and nadir glucose concentration on
day 1 and day 3 were not different (Table 2). Figure 1-median venous glucose concentrations day 1 compared to day 3
Table 2-postprandial glucose values day 1 compared to day 3, n=5 Plasma glucose, mmol/l (median, range) Day 1 Day 3 p-value
Overall 11.4 (5.2 to 14.7) 8.7 (7.1 to 8.8) 0.14 t=120 min 12.3 (4.2 to 17.4) 8.1 (6.8 to 9.6) 0.23 t=180 min 13.4 (3.3 to 15.6) 4.5 (3.3 to 9.0) 0.08 Peak 14.1 (7.9 to 17.7) 14.5 (10.8 to 17.7) 0.5 Nadir 10.4 (3.0 to 10.1) 3.8 (3.2 to 4.4) 0.08
�������
146

1
2
3
4
5
6
7
8
9
10
11
12
13
14
15
�
On day three, the patients tended to have a higher percentage of time spent in
euglycaemia measured by venous glucose measurements compared to day 1 (31% vs
60%, p=0.08). No significant differences were seen in time spent in hypoglycaemia
or hyperglycaemia between day 1 and day 3.
On day 3, three hypoglycaemic episodes occurred in two patients lasting 6, 9 and 30
minutes. During the period of 30 minutes, the corresponding venous blood glucose
level was 3.2 mmol/l. No venous measurements were taken during the other two
periods. In addition, venous glucose measurements detected five other episodes of
glucose levels below 3.9 mmol/l, in three patients, with values of 3.2, 3.6 (twice) and
3.8 mmol/l (twice). All hypoglycaemic periods occurred late postprandially, after
150 minutes or more.
On day 3, the algorithm was enabled to give alarms. The number of sound alarms
and number of the glucagon responses are shown in table 3. In total the sound
alarm went off 14 times, range 1-4 per patient. Glucagon boluses were given in two
patients. No nausea was noted.
The cumulative mealtime related insulin requirements on day 1 and day 3 are
shown in table 3. No significant differences were seen, p=0.14.
Table 3a-insulin need during the study, given as international units Day 1 Day 3 Patient Bolus Basal Total Total 1 14 6.1 20.1 41 2 4 3 7 26.5 3 4 5 9 9 4 4.5 5.8 10.3 40.5 6 5 6.1 11.1 9
Table 3b- number of sound alarms (glucose<5 mmol/l) and the number of glucagon responses (glucose<3.2 mmol/l) Day 3 Hypoglycaemic alarm Glucagon need (IU)
Patient 1 3 0 Patient 2 4 10 Patient 3 1 0 Patient 4 4 0 Patient 6 2 1
�� ������������������������� ��������������������������������������
147

�
DISCUSSION
In this small pilot study, the feasibility of a closed-loop artificial pancreas based on
a PID algorithm was tested. Postprandial venous glucose control was comparable to
usual care, with a tendency to a higher percentage of time spent in euglycaemia.
We donÊt want to overemphasise this, as in some of our patients with relatively
high HbA1cÊs control could have been optimised using conventional methods, but for
a first pilot trial we chose to take these real-life patients as a starting point.
Preliminary results of closed-loop artificial pancreas experiments based on Model
Predictive Control (MPC)7;8 also showed comparable control during 22 hours closed-
loop versus usual care. Postprandial hyperglycaemia did not significantly differ
between closed-loop and usual care, but the maximum glucose levels were above
the postprandial targets advised by the American Diabetes Association (ADA).
Weinzimer et al.9 also reported high postprandial levels that could partially
overcome by a manual premeal insulin bolus. In our pilot study the postprandial
glucose values achieved by the AP were almost within the postprandial range of the
ADA (<10 mmol/l). The median venous glucose on day 1 time point 120 minutes
postprandial was 12.3 mmol/l (range 4.2 to 17.4 mmol/l) versus median glucose 8.1
mmol/l on day 3 (range 6.8 to 9.6 mmol/l), p=0.23. At time point 180 minutes
postprandial, the median venous glucose concentrations was 13.4 mmol/l on day 1
(range 3.3 to 15.6 mmol/l) and 4.5 mmol/l on day 3 (range 3.3 to 9 mmol/l), p=0.08
(Table 2).
After the learning day, the individual sensitivity was adjusted for the following test
day. Probably, the individually adjusted insulin sensitivity factor is an explanation
for the tendency towards lower glucoses on day three compared to day one. The
research groups of Padova, Montpellier and Virginia7;8 also used an individual
factor. This factor named ÂaggressivenessÊ or ÂqÊ was dependent of clinical
parameters of the patient. The research groups did not have a learning day, so q
was not adjusted during the experiment.
To prevent hypoglycaemias, the hypoglycaemic alarm was set at 5 mmol/l. If the
glucose level was below 5 mmol/l a hypoglycaemic alarm went off and patients had
to eat 25 gram carbohydrates. All patients had to eat carbohydrates, but the alarm
was not followed by oral carbohydrates if the alarm went off within 5 until 10
minutes after eating.
A hypoglycaemia was defined as a glucose concentration below 3.9 mmol/l. On day
3, five episodes of hypoglycaemia were measured by venous glucose concentrations
�������
148
1
2
3
4
5
6
7
8
9
10
11
12
13
14
15
�
in three patients, one patient encountering a single value of 3.8 mmol/l only, of
arguable significance. All events occurred late postprandial, between 150 and 300
minutes. The lowest measured venous blood glucose concentration was 3.2 mmol/l.
This occurred in two patients and glucagon injections were administered. In one of
these two patients the amount of insulin administered on day 3 was substantially
larger than on day 1. So, in these two patients the individual sensitivity factor was
set too aggressive. One other patient received four times more insulin than usual.
Taking her HbA1c of 10% into account, her daily insulin doses was probably too
low.
Glucagon boluses were given in two patients in order to prevent severe
hypoglycaemia. The efficacy of low dose glucagon as a rescue to prevent severe
hypoglycaemia remains to be shown in subsequent experiments. Damiano et al 10
also used subcutaneous glucagon injections in their closed-loop glucose control, but
glucagon was used to control the glucose concentration within the normal range
with frequent injection of small doses, while it was used as rescue compound in our
system.
In the near future, the algorithm will undergo revisions, mainly at the glucose level
of the sound alarm. The slope of the glucose drop has to be taken in account if the
carbohydrate alarm will go off, and the level will be set lower, probably at 4 or 4.5
mmol/l. Also a needle type sensor will replace the microdialysis sensor because of
the technical problem of the microdialysis filament. Furthermore, the examination
time and number of patients will be extended. Hereafter, a wireless connection
between the components would enable outpatient testing.
In conclusion, postprandial glucose control by this algorithm was feasible, and
comparable to non-optimised usual care.
�� ������������������������� ��������������������������������������
149

�
REFERENCES
(1) Hovorka R, Kremen J, Blaha J, Matias M, Anderlova K, Bosanska L et al. Blood Glucose Control by a Model Predictive Control Algorithm with Variable Sampling Rate Versus a Routine Glucose Management Protocol in Cardiac Surgery Patients: A Randomized Controlled Trial. J Clin Endocrinol Metab 2007; 92(8):2960-2964.
(2) Plank J, Blaha J, Cordingley J, Wilinska ME, Chassin LJ, Morgan C et al. Multicentric, randomized, controlled trial to evaluate blood glucose control by the model predictive control algorithm versus routine glucose management protocols in intensive care unit patients. diabetes Care 2006; 29:272-276.
(3) Steil GM, Rebrin K, Darwin C, Hariri F, Saad MF. Feasibility of Automating Insulin Delivery for the Treatment of Type 1 Diabetes. Diabetes 2006; 55(12):3344-3350.
(4) Weinzimer SA, Steil GM, Swan KL, Dziura J, Kurtz N, Tamborlane WV. Fully Automated Closed-Loop Insulin Delivery Versus Semiautomated Hybrid Control in Pediatric Patients With Type 1 Diabetes Using an Artificial Pancreas. diabetes Care 2008; 31(5):934-939.
(5) Schaller HC, Schaupp L, Bodenlenz M, Wilinksa ME, Chassin LJ, Wach P et al. On-line adaptive algorithm with glucose prediction capacity for subcutaneous closed loop control of glucose: evaluation under fasting conditions in patients with diabetes type 1. Diabetic medicine 2006; 23:-90.
(6) Hovorka R, Acerini CL, Allen JM, Chassin LJ, Kollman C, Elleri D et al. Overnight closed-loop insulin delivery in children and adolescents with type 1 diabetes: towards home testing. Diabetes 2009; 58(Supl):A54-206-OR.
(7) Bruttomesso D, Farret A, Costa S, Marescotti MC, Vettore M, Avogaro A et al. Closed –loop artificial pancreas using subcutaneous glucose sensing and insulin delivery and a model predictive control algorithm: preliminary studies in Padova and Montpellier. Journal of Diabetes Science and Technology 2009; 3:1014-1021.
(8) Clarke WL, Anderson S, Breton M, Patek S, Kashmar L, Kovatchev B. Closed-loop artificial pancreas using subcutaneous glucose sensing and insulin delivery and a model predictive control algorithm: the Virginia experience. Journal of Diabetes Science and Technology 2009; 3:1031-1038.
(9) Weinzimer SA, Steil GM, Swan KL, Dziura J, Kurtz N, Tamborlane WV. Fully Automated Closed-Loop Insulin Delivery Versus Semiautomated Hybrid Control in Pediatric Patients With Type 1 Diabetes Using an Artificial Pancreas. diabetes Care 2008; 31(5):934-939.
(10) Model predictive closed loop control with insulin and glucagon. EASD / JDRF symposium EASD 2009 S13; 2009.
�������
150

Glucose variability is associated with ICU
mortality
J Hermanides, TM Vriesendorp, RJ Bosman,
DF Zandstra, JBL Hoekstra, JH DeVries
Critical Care Medicine, 2010 Mar;38(3):838-42

ABSTRACT
Objective Mounting evidence suggests a role for glucose variability in predicting
intensive care unit (ICU) mortality. We investigated the association between
glucose variability and intensive care unit and in-hospital deaths across several
ranges of mean glucose.
Design Retrospective cohort study.
Setting An 18-bed medical/surgical ICU in a teaching hospital.
Patients All patients admitted to the ICU from January 2004 through December
2007.
Measurements and Main Results Two measures of variability, mean absolute
glucose change per hour and SD, were calculated as measures of glucose variability
from 5728 patients and were related to ICU and in-hospital death using logistic
regression analysis. Mortality rates and adjusted odds ratios for ICU death per
mean absolute glucose change per hour quartile across quartiles of mean glucose
were calculated. Patients were treated with a computerized insulin algorithm
(target glucose 4.0 to 7.0 mmol/l). Mean age was 65 � 13 years, 34% were female,
and 6.3% of patients died in the ICU. The odds ratios for ICU death were higher for
quartiles of mean absolute glucose change per hour compared with quartiles of
mean glucose or SD. The highest odds ratio for ICU death was found in patients
with the highest mean absolute glucose change per hour in the upper glucose
quartile: odds ratio 12.4 (95% confidence interval, 3.2 to 47.9; p<0.001). Mortality
rates were lowest in the lowest mean absolute glucose change per hour quartiles.
Conclusions High glucose variability is firmly associated with ICU and in-hospital
death. High glucose variability combined with high mean glucose values is
associated with highest ICU mortality. In patients treated with strict glycaemic
control, low glucose variability seemed protective, even when mean glucose levels
remained elevated.
��������
152

1
2
3
4
5
6
7
8
9
10
11
12
13
14
15
Time (hours)
1 2 3 4 5 6 7 8 9 10 11 12 13 14 15 16 17 18 19 20
Glu
cose
(mm
ol/l)
4
5
6
7
8
9
10
11
Patient 1, mean glucose 7.5 mmol/l, SD = 2.5, MAG = 0.25 mmol/l/hr
INTRODUCTION
The results of the Leuven studies have led to a worldwide increase in the
implementation of strict glycaemic control in the intensive care unit (ICU).1;2 The
mortality reduction in these landmark trials was attributed to the strict lowering of
mean glucose (target 4.4-6.1 mmol/l) during admission in the intervention group.3
Interestingly, the positive results of the Leuven studies have not been reproduced
in later studies4-8 It is therefore of importance to examine whether factors other
than mean glucose are of influence. As mean glucose is lowered and glycaemic
excursions are targeted, glucose variability (GV) is likely to be reduced as well.
Several studies have shown that GV is strongly associated with short-term ICU
mortality.9;10 This can be understood from a pathophysiological viewpoint, because
hyperglycaemia, as well as GV, can contribute to ICU mortality by increasing
oxidative stress, neuronal damage, mitochondrial damage and coagulation
activation.11-15 In a study by Krinsley in an ICU population, the SD as marker of
GV was a predictor of mortality within different ranges of mean glucose and a
stronger predictor than mean glucose itself.16 However, the SD is not the most
appropriate method for defining GV of repeated glucose measurements.17 Two
patients with the same mean glucose and SD can express completely different
patterns of variability (Figure 1). Furthermore, the majority of the results gathered
so far on the predictive value of GV come from populations that are not treated or
are partly treated with strict glycaemic control.9;10;16
The aims of this study were to measure GV over time in a large strict glucose
control-treated ICU population across several ranges of mean glucose, and to
investigate the association of GV and mean glucose values with ICU- and in-
hospital mortality.
Figure 1- two fictive patients with identical mean glucose and SD, but different patterns of variability, expressed by the mean absolute glucose change (MAG)
� ������������ ��������������������������� ���
153

MATERIALS AND METHODS
Setting
We performed a retrospective cohort study in an 18-bed medical/surgical ICU in a
teaching hospital (Onze Lieve Vrouwe Gasthuis Hospital, Amsterdam, The
Netherlands). On average, a nurse takes care of two patients, depending on the
severity of disease. All beds were equipped with a clinical information system (iMD-
Soft; MetaVision, Tel Aviv, Israel) and all clinical and laboratory data was stored
here. The glucose regulation protocol was implemented in April 2001 and set at a
target glucose range of 4.0 to 7.0 mmol/l. Using a sliding scale computerised
algorithm, the nursing staff was instructed to adjust the insulin infusion rate
depending on the current glucose value and the rate of glucose change (based on
the previous five measurements). The software also provided the time the next
glucose measurement was due, which could vary from 15 minutes up to 4 hours.
Routinely, enteral feeding was started within 24 hours after admission, aiming at
2000 ml within 48 hour or 1500 ml within 24 hours. A duodenal feeding tube was
inserted in case of persistent gastric retention. When patients resumed normal
eating, the tight glucose algorithm was deactivated. The successful implementation
of the algorithm has been reported previously.18 An integrated decision support
module controlled the algorithm and was connected to the clinical information
system. Because a retrospective analysis of anonimysed data was performed,
informed consent was not required according to Dutch Ethical Review Board
regulations.
Cohort and Data collection
We extracted data from the clinical information system concerning patients
admitted between January 2004 and December 2007. Readmissions, patients with
a withholding care policy and patients with <3 glucose values measured during
admission were excluded. We assessed demographic variables, medical history and
mortality in the ICU and in-hospital mortality. Furthermore we collected
information on severity of disease, the occurrence of severe hypoglycaemia (glucose
<=ª2.5 mmol/l) and diabetes mellitus, because these variables are associated with
GV.16;19 As measures for severity of disease we evaluated both the maximal
Sequential Organ Failure Assessment (SOFA) score during admission and the
Acute Physiology and Chronic Health Evaluation II (APACHE II) score on
admission.20;21
��������
154

1
2
3
4
5
6
7
8
9
10
11
12
13
14
15
Measures of glucose
Glucose was measured from blood samples obtained from an arterial catheter using
the Accu-check (Roche/Hitachi®, Basel, Switzerland), a handheld glucose
measurement device. Results were automatically stored in the clinical information
system. We collected all glucose values measured for every patient and calculated
the mean glucose during admission and the SD. To obtain a measure of GV that
was less dependent on the mean glucose and took into account all variability over
time, we calculated the mean absolute glucose (MAG) change per patient per hour
(formula 1). This is done by taking the sum of all absolute glucose changes during
admission and dividing this by the total time spent in the ICU in hours.
MAG = |�BG|/�time
Statistical analyses
Results are presented as mean � SD or median with interquartile range (IQR),
depending on the distribution of the data. Mean glucose, the glucose SD and MAG
change were divided into quartiles. The area under the receiver operating
characteristic curve of the MAG change and the SD were calculated and any
difference in predictive value was examined using parametrical bootstrapping with
1000 replicates. To select the best measure for disease severity we compared the
relations of the APACHE II and maximal SOFA score with ICU mortality in
univariate regression analysis. Using multivariate logistic regression, we
calculated odds ratios (ORs) for ICU- and in-hospital death for each MAG quartile
and corrected for clinical relevant confounders: sex, age, diabetes mellitus, severity
of disease, severe hypoglycaemia and mean glucose. In addition, length of stay in
the ICU was included as a possible confounder because of its relation to mortality
and likely relation to variability, because variability may change over time and the
precision of variability assessment depends on the observation time. Also
cardiothoracic surgery was included, because mortality in this group is generally
lower compared with other surgical patients. Furthermore, several demographic
and physiological characteristics of this group differed from the general ICU
population, which could be reflected in differences in mean glucose levels and
glucose variability.22 Furthermore, we explored differences in predictive value of
the MAG in surgical and medical patients, using an interaction term in the
multivariate model. Hereafter, we calculated ORÊs for ICU death and in-hospital
death for different ranges of GV, subdivided into quartiles of mean glucose. All
Formula 1- mean Absolute Glucose (MAG) change is the absolute glucose change (�BG) per hour spent in the ICU (�time)
� ������������ ��������������������������� ���
155

statistical analyses were performed in SPSS 16.0 (SPSS Inc.,Chicago, IL) and SAS
9.1 (SAS Institute, Cary, NC).
RESULTS
Between January 2004 and December 2007, there were 6725 ICU admissions. We
excluded 656 readmissions, 86 patients with a withholding care policy and 255
patients with <3 glucose value measured during admission, leaving 5728 patients
for our analyses. The characteristics of the studied cohort are displayed in Tables
1A and 1B. In total 154189 glucose values were collected, a median of 12 values per
patient (IQR 6 to 23) and 11 values per day (IQR 7 to 14).
Cardiothoracic surgery (n=3560)
Medical and Other (n=2168)
Total cohort (n=5728)
Age, years (mean ± SD) 67 ± 11 63 ± 17 65 ± 13 Gender, female n (%) 1106 (31.1%) 865 (39.9%) 1971 (34%) APACHE II score on admission (median, IQR) 15 (12 to 17) 20 (15 to 27) 16 (13 to 20) Max SOFA score during admission (median, IQR) 5 (4 to 6) 7 (5 to 10) 6 (5 to 7) ICU stay, days (median (IQR) 0.9 (0.8 to 1.1) 1.9 (0.8 to 4.4) 1.0 (0.8 to 2.0) Diabetes mellitus, n (%) 681 (19.1%) 18 (0.8%) 699 (12.2%) Died ICU, n (%) 27 (0.8%) 334 (15.4%) 361 (6.3%) Died hospital, n (%) 93 (2.6%) 516 (23.8%) 609 (10.6%) Severe hypoglycaemia (� 1 event), n (%) 66 (1.9%) 223 (10.3%) 299 (5.2%)
Surgical (n=4409) Medical (n=1319)
Cardiovascular Sepsis After cardiac arrest
3895 52 10
235 220 287
Gastrointestinal 235 57 Haematological 7 7 Renal 12 26 Metabolic 7 48 Neurological 40 150 Respiratory 151 289
Table 1A- characteristics of the studied cohort; APACHE Acute Physiology and Chronic Health Evaluation, SOFA Sequential Organ Failure Assessment
Table 1B- number of patients per APACHE II admission category (surgical/medical)
��������
156

1
2
3
4
5
6
7
8
9
10
11
12
13
14
15
0
5
10
15
20
25
30
35
ICU
mor
talit
y (%
)
Mean glucose quartiles
MAG chan
ge q
uarti
les
43
21
1
2
3
4
0
5
10
15
20
25
30
35In
-hos
pita
l mor
talit
y (%
)
Mean glucose quartilesMAG ch
ange
qua
rtiles
43
21
1
2
3
4
Measures of glucose and ICU mortality
For the entire cohort, the median glucose SD was 1.8 mmol/l (IQR 1.4 to 2.4 mmol/l)
and the median MAG was 0.6 mmol/l/hr (IQR 0.4 to 0.9 mmol/l). The MAG was
significantly stronger associated with ICU death compared with the SD in
univariate analysis, a difference in area under the receiver operating curve of 5.4%
(95% confidence interval [CI], 3.0 to 7.7, p<0.001). The ranges of mean glucose
quartiles and MAG quartiles with the number of patients per stratum and ICU
mortality are shown in Table 2. The highest ICU- and in-hospital mortality was
seen in the upper MAG and upper mean glucose quartile with mortality rates of
24.5% and 28.7% respectively (Figure 2). ICU mortality rates in the lowest MAG
quartile ranged from 0.7% to 5.2%.
Severity of disease and glucose variability The OR for death in the highest quartile of the APACHE II score was 33.8 (95% CI
17.9 to 63.8) and 64.8 (95% CI 28.8 to 145.9) for the maximal SOFA score. Thus we
corrected for quartiles of maximal SOFA score instead of APACHE II score as a
measure of disease severity in our multiple regression model.20 The median MAG
change increased from 0.6 mmol/l/hr (0.3 to 0.9 mmol/l/hr) in the lowest quartiles
SOFA quartile to 0.7 mmol/l/hr (IQR 0.4 to 1.0 mmol/l/hr) in the highest SOFA
quartile (p<0.001). The association of the MAG and ICU mortality did not
significantly differ between surgical and medical patients, p=0.74.
Figure 2A- intensive care unit (ICU) mortality (%) Figure 2B- in-hospital mortality (%) All mortality rates were calculated per quartiles of mean absolute glucose change (MAG), divided by quartiles of mean glucose. Quartile Range mean glucose (mmol/l) Range MAG (mmol/l/hour) 1 <6.92 <0.39 2 6.92 to 7.60 0.39 to 0.60 3 7.60 to 8.89 0.60 to 0.88 4 >8.89 >0.88
� ������������ ��������������������������� ���
157

M
AG
qua
rtile
s (m
mol
/l/hr
)
<0
.39
(n=1
432)
0.
39 to
0.6
0 (n
=143
2)
0.60
to 0
.88
(n=1
432)
>0
.88
(n
=143
2)
18/3
46 (5
.2%
) 41
/485
(8.5
%)
41/3
85 (1
0.6%
) 44
/216
(20.
4%)
4/20
4 (2
.0%
) 14
/402
(3.5
%)
24/4
65 (5
.2%
) 24
/365
(6.6
%)
2/34
4 (0
.6%
) 4/
236
(1.7
%)
13/3
53 (3
.7%
) 32
/496
(6.5
%)
Mea
n gl
ucos
e qu
artil
es (m
mol
/l)
<6.
92 (n
=143
2)
6.
92 to
7.6
0 (n
=143
6)
7.60
to 8
.89
(n=1
429)
>8
.89
(n=1
431)
4/
538
(0.7
%)
1/30
9 (0
.3%
) 8/
229
(3.5
%)
87/3
55 (2
4.5%
)
Qua
rtile
s of
MA
G c
hang
e O
R IC
U d
eath
(95%
CI)
OR
in-h
ospi
tal d
eath
(95
% C
I)
1st : <
0.3
9 m
mol
/l/hr
re
fere
nce
refe
renc
e
2nd : 0
.39
to 0
.60
mm
ol/l/
hr
1.5
(0.9
to 2
.5)
1.5
(1.0
to 2
.1)
3rd :
0.60
to 0
.88
mm
ol/l/
hr
1.8
(1.1
to 2
.9)
1.6
(1.2
to 2
.3)
4th :
> 0.
88 m
mol
/l/hr
3.
3 (2
.1 to
5.4
) 2.
8 (2
.0 to
3.9
)
p
for t
rend
<0.
001
p fo
r tre
nd <
0.00
1
Tabl
e 2-
the
num
ber o
f pat
ient
s pe
r stra
tum
are
dep
icte
d w
ith th
e IC
U m
orta
lity
per s
tratu
m (n
and
%).
Ran
ges
of q
uarti
les
of m
ean
abso
lute
gl
ucos
e ch
ange
(MA
G) a
nd m
ean
gluc
ose
are
give
n.
Tabl
e 3-
odd
s ra
tio (O
R) f
or IC
U a
nd in
-hos
pita
l dea
th p
er M
AG
cha
nge
quar
tile,
adj
uste
d fo
r age
, sex
, dia
bete
s m
ellit
us, m
axim
al S
OFA
sco
re, m
ean
gluc
ose,
sev
ere
hypo
glyc
aem
ia a
nd c
ardi
otho
raci
c su
rger
y
��������
158

1
2
3
4
5
6
7
8
9
10
11
12
13
14
15
Multivariate analyses
The ORs for ICU death and in-hospital death, adjusted for mean glucose and other
confounders are displayed in Table 3: in the highest MAG quartile, the OR for ICU
death was 3.3 (95% CI 2.1 to 5.4) and for in-hospital death 2.8 (95% CI 2.0 to 3.9).
The risk of death increased per MAG quartile (p for trend <0.001). We performed
logistic regression, with ICU death as dependent variable and MAG quartiles as
the covariate. Per quartile of mean glucose, we calculated ORs for ICU death. We
corrected for age, sex, diabetes mellitus, cardiothoracic surgery, severe
hypoglycaemia, length of ICU stay and maximal SOFA score during admission. The
highest OR for ICU death was found in patients with the highest MAG in the upper
glucose quartile: OR 12.4 (95% CI 3.2 to 47.9, p<0.001). Also in the first quartile of
mean glucose, high MAG change in the fourth quartile was associated with ICU
death, with an OR of 4.1 (95 % CI 1.9 to 9.1, p<0.001). Finally, we performed
analyses for in-hospital death. In each quartile of mean glucose, the upper MAG
quartile seemed predictive of in-hospital death compared to the first quartile, with
ORs for in-hospital death of 2.7 (95% CI 1.6 to 5.2), 1.9 (95% CI 0.9 to 4.2), 2.5 (95%
CI 0.9 to 6.8) and 6.4 (95% CI 2.7 to 15.0) across the first, to the fourth mean
glucose quartile, respectively.
DISCUSSION
In this retrospective cohort study we have shown that GV, expressed as MAG, is
highly associated with ICU death in both high and low ranges of mean glucose. In
combination with a high mean glucose, GV seems most detrimental. It can be
debated whether GV reflected by MAG change is a causative harmful phenomenon,
or whether it is an epiphenomenon, resulting from metabolic deterioration during
severe illness and dying.23 We have attempted to elucidate this by excluding
patients who were on a withholding care policy and correcting for the maximal
SOFA score during admission. From a pathophysiological viewpoint a causal
relationship can be substantiated: in vitro, varying glucose levels have been shown
to enhance cell apoptosis.24 In rats, glycaemic reperfusion after hypoglycaemia
caused neuronal death25 and altering glucose levels were impairing endothelial
function in healthy volunteers.26 Even more, tubulointerstitial cells exposed to
intermittent high glucose concentrations showed enhanced cell growth and collagen
syntheses compared with stable high glucose concentrations.27 Possibly, the
adaptive cell mechanisms that are initiated in case of constant hyperglycaemia are
� ������������ ��������������������������� ���
159

ineffective when the hyperglycaemia is not constant but varying, explaining the
toxicity of GV.28
Our findings are in accordance with previous studies that have investigated the
relationship between GV and mortality. In the studies of Krinsley and Egi the
glucose SD in the ICU was a predictor of mortality, independent of mean
glucose10;16 In the study form Bagshaw et al, GV, defined as the occurrence of both
hypoglycaemia and hyperglycaemia within 24 hours of ICU admission, was related
to ICU mortality. Although these studies reported data from large multicentre
cohorts, a strict glycaemic control algorithm was not fully implemented, limiting
external validity for the ICU populations treated with strict glycaemic control.
Furthermore, Krinsley and Egi used the SD as a measure of variability. Because
the blood glucose scale is not normally distributed and asymmetric, he assumptions
of parametric statistics do not apply and the SD was therefore not the optimal
measure of GV.17 In addition, the SD does not take the change per time into
account. Indeed, in our cohort, the MAG change was a stronger predictor of ICU
death than SD. Similar results were reported by Dosset et al, who investigated a
surgical ICU population and found that the largest absolute change in successive
blood glucose measurements during an ICU admission was a strong predictor of
ICU death, whereas the SD was not.29
The APACHE II model is the most widely used parameter when correcting for
disease severity in GV studies in the ICU.9;10;16 However, the APACHE II model
was originally designed to predict mortality in the first 24 hours of ICU
admission.21 Indeed we found disease severity to be a confounder with a relation to
both glycaemic variability and mortality. Correction for disease severity using
maximum SOFA score during admission seemed superior to using APACHE scores
at admission.
Our findings suggest that high mean glucose is less harmful when GV is low and
patients with identical mean glucose can have different mortality rates, depending
on their MAG change. GV was not reported as an outcome measure in the Leuven
studies, the GluControl study, the VISEP study and the NICE-SUGAR study.1;2;4;7;8
Differences in these study outcomes may be attributed to several factors.30 It can be
hypothesised that more stable glucose profiles, with less GV, can be reached when
insulin therapy is combined with a constant administration of glucose-containing
fluids, analogous to the insulin clamp technique.31 Because we have found that GV
is such a strong predictor of ICU death, there is the possibility that differences in
GV can be part of the explanation of differences in mortality reduction in these
��������
160

1
2
3
4
5
6
7
8
9
10
11
12
13
14
15
trials. It would be interesting to examine the results of these previous trials in the
context of glycaemic variability.
Of note, ICU mortality in the mean glucose quartiles in our study decreased from
10.1% (<6.92 mmol/l) to 3.6% (7.60 to 8.89 mmol/l) and rose hereafter to 7.0% (>8.89
mmol/l). Such a J-shaped mortality curve has been seen before in patients with
myocardial infarction32-34 and in a large cohort of 66184 ICU patients in whom
glucose values during the first 24 hours of admission were taken into account.35 We
cannot explain the increased mortality in the lower glucose quartile solely by the
occurrence of severe hypoglycaemia (as defined by glucose <=2.5 mmol/l). Previous
results regarding the relation between severe hypoglycaemia and ICU mortality are
conflicting.4;36-38 In our study, the association between ICU mortality in the lowest
mean glucose quartile and highest MAG quartile holds after correcting for severe
hypoglycaemia in the multivariate analysis. This is in concordance with the study
from Bagshaw et al, who found that glucose variability was a stronger predictor of
ICU death than hypoglycaemia alone.9
An important limitation of this study is that was performed in one centre only and
is retrospective in nature. Most patients were admitted for cardiothoracic surgery;
we have however corrected for this potential confounder. A strong point is that we
studied a large and representative group of 5728 mixed ICU patients who were
treated with strict glycaemic control using a computerised algorithm, which
brought a high number of patients in target.18 Furthermore, we used a novel
indicator for GV.
CONCLUSIONS
We have confirmed findings of previous studies that GV is related to ICU and in-
hospital death. Additionally, we have shown that, also for those with persistently
high mean glucose values during admission, low GV seems protective. There
appears to be a synergistic negative effect of high mean glucose in combination with
high GV. To elucidate whether GV is a treatable risk factor in the ICU or a risk
marker only, the effect of lowering GV on ICU survival is to be investigated, for
example by designing an algorithm which aims at lowering variability rather than
the mean glucose and comparing this with an algorithm that lowers the mean
glucose.
� ������������ ��������������������������� ���
161

REFERENCES
(1) Van den Berghe G, Wouters P, Weekers F, Verwaest C, Bruyninckx F, Schetz M et al. Intensive insulin therapy in the critically ill patients. N Engl J Med 2001; 345(19):1359-1367.
(2) Van den Berghe G, Wilmer A, Hermans G, Meersseman W, Wouters PJ, Milants I et al. Intensive insulin therapy in the medical ICU. N Engl J Med 2006; 354(5):449-461.
(3) Van den Berghe GMP, Wouters PJM, Bouillon RM, Weekers FM, Verwaest CM, Schetz MM et al. Outcome benefit of intensive insulin therapy in the critically ill: Insulin dose versus glycemic control. Critical Care Medicine 2003; 31(2):359-366.
(4) Brunkhorst FM, Engel C, Bloos F, Meier-Hellmann A, Ragaller M, Weiler N et al. Intensive insulin therapy and pentastarch resuscitation in severe sepsis. N Engl J Med 2008; 358(2):125-139.
(5) Wiener RS, Wiener DC, Larson RJ. Benefits and risks of tight glucose control in critically ill adults: a meta-analysis. JAMA 2008; 300(8):933-944.
(6) Arabi YMM, Dabbagh OCM, Tamim HMM, Al-Shimemeri AAM, Memish ZAM, Haddad SHM et al. Intensive versus conventional insulin therapy: A randomized controlled trial in medical and surgical critically ill patients. Critical Care Medicine 2008; 36(12):3190-3197.
(7) Finfer S, Chittock DR, Su SY, Blair D, Foster D, Dhingra V et al. Intensive versus conventional glucose control in critically ill patients. N Engl J Med 2009; 360(13):1283-1297.
(8) Preiser JC, Devos P, Ruiz-Santana S, M+®lot C, Annane D, Groeneveld J et al. A prospective randomised multi-centre controlled trial on tight glucose control by intensive insulin therapy in adult intensive care units: the Glucontrol study. Intensive Care Medicine.
(9) Bagshaw SM, Bellomo R, Jacka MJ, Egi M, Hart GK, George C et al. The impact of early hypoglycemia and blood glucose variability on outcome in critical illness. Crit Care 2009; 13(3):R91.
(10) Egi M, Bellomo R, Stachowski E, French CJ, Hart G. Variability of blood glucose concentration and short-term mortality in critically ill patients. Anesthesiology 2006; 105(2):244-252.
(11) Brownlee M. The Pathobiology of Diabetic Complications: A Unifying Mechanism. Diabetes 2005; 54(6):1615-1625.
(12) Nieuwdorp M, van Haeften TW, Gouverneur MC, Mooij HL, van Lieshout MH, Levi M et al. Loss of endothelial glycocalyx during acute hyperglycemia coincides with endothelial dysfunction and coagulation activation in vivo. Diabetes 2006; 55(2):480-486.
(13) Stegenga ME, van der Crabben SN, Levi M, de Vos AF, Tanck MW, Sauerwein HP et al. Hyperglycemia Stimulates Coagulation, Whereas Hyperinsulinemia Impairs Fibrinolysis in Healthy Humans. Diabetes 2006; 55(6):1807-1812.
(14) Van den Berghe G, Schoonheydt K, Becx P, Bruyninckx F, Wouters PJ. Insulin therapy protects the central and peripheral nervous system of intensive care patients. Neurology 2005; 64(8):1348-1353.
(15) Weekers F, Giulietti AP, Michalaki M, Coopmans W, Van Herck E, Mathieu C et al. Metabolic, Endocrine, and Immune Effects of Stress Hyperglycemia in a Rabbit Model of Prolonged Critical Illness. Endocrinology 2003; 144(12):5329-5338.
(16) Krinsley JS. Glycemic variability: a strong independent predictor of mortality in critically ill patients. Crit Care Med 2008; 36(11):3008-3013.
(17) Kovatchev BP, Cox DJ, Gonder-Frederick LA, Clarke W. Symmetrization of the blood glucose measurement scale and its applications. Diabetes Care 1997; 20(11):1655-1658.
��������
162

1
2
3
4
5
6
7
8
9
10
11
12
13
14
15
(18) Rood E, Bosman RJ, van der Spoel JI, Taylor P, Zandstra DF. Use of a computerized guideline for glucose regulation in the intensive care unit improved both guideline adherence and glucose regulation. J Am Med Inform Assoc 2005; 12(2):172-180.
(19) Waeschle RM, Moerer O, Hilgers R, Herrmann P, Neumann P, Quintel M. The impact of the severity of sepsis on the risk of hypoglycaemia and glycaemic variability. Crit Care 2008; 12(5):R129.
(20) Ferreira FL, Bota DP, Bross A, Melot C, Vincent JL. Serial Evaluation of the SOFA Score to Predict Outcome in Critically Ill Patients. JAMA 2001; 286(14):1754-1758.
(21) Knaus WA, Draper EA, Wagner DP, Zimmerman JE. APACHE II: a severity of disease classification system. Crit Care Med 1985; 13(10):818-829.
(22) Kramer AA, Zimmerman JE. Predicting outcomes for cardiac surgery patients after intensive care unit admission. Semin Cardiothorac Vasc Anesth 2008; 12(3):175-183.
(23) Mizock BA. Alterations in fuel metabolism in critical illness: hyperglycaemia. Best Pract Res Clin Endocrinol Metab 2001; 15(4):533-551.
(24) Quagliaro L, Piconi L, Assaloni R, Martinelli L, Motz E, Ceriello A. Intermittent high glucose enhances apoptosis related to oxidative stress in human umbilical vein endothelial cells: the role of protein kinase C and NAD(P)H-oxidase activation. Diabetes 2003; 52(11):2795-2804.
(25) Suh SW, Gum ET, Hamby AM, Chan PH, Swanson RA. Hypoglycemic neuronal death is triggered by glucose reperfusion and activation of neuronal NADPH oxidase. J Clin Invest 2007; 117(4):910-918.
(26) Ceriello A, Esposito K, Piconi L, Ihnat MA, Thorpe JE, Testa R et al. Oscillating glucose is more deleterious to endothelial function and oxidative stress than mean glucose in normal and type 2 diabetic patients. Diabetes 2008; 57(5):1349-1354.
(27) Jones SC, Saunders HJ, Qi W, Pollock CA. Intermittent high glucose enhances cell growth and collagen synthesis in cultured human tubulointerstitial cells. Diabetologia 1999; 42(9):1113-1119.
(28) Hirsch IB, Brownlee M. Should minimal blood glucose variability become the gold standard of glycemic control? Journal of Diabetes and its Complications 2005; 19(3):178-181.
(29) Dossett LA, Cao H, Mowery NT, Dortch MJ, Morris JM, Jr., May AK. Blood glucose variability is associated with mortality in the surgical intensive care unit. Am Surg 2008; 74(8):679-685.
(30) Vanhorebeek IP, Langouche LP, Van den Berghe GMP. Tight blood glucose control: What is the evidence? Critical Care Medicine, Metabolic Support in Sepsis and Multiple Organ Failure: Proceedings of a Roundtable Conference in Brussels, Belgium, 2007; 35(9):S496-S502.
(31) DeFronzo RA, Tobin JD, Andres R. Glucose clamp technique: a method for quantifying insulin secretion and resistance. Am J Physiol 1979; 237(3):E214-E223.
(32) Pinto DS, Skolnick AH, Kirtane AJ, Murphy SA, Barron HV, Giugliano RP et al. U-shaped relationship of blood glucose with adverse outcomes among patients with ST-segment elevation myocardial infarction. J Am Coll Cardiol 2005; 46(1):178-180.
(33) Pinto DS, Kirtane AJ, Pride YB, Murphy SA, Sabatine MS, Cannon CP et al. Association of blood glucose with angiographic and clinical outcomes among patients with ST-segment elevation myocardial infarction (from the CLARITY-TIMI-28 study). Am J Cardiol 2008; 101(3):303-307.
(34) Kosiborod M, Inzucchi SE, Krumholz HM, Xiao L, Jones PG, Fiske S et al. Glucometrics in patients hospitalized with acute myocardial infarction: defining the optimal outcomes-based measure of risk. Circulation 2008; 117(8):1018-1027.
(35) Bagshaw SMM, Egi MM, George CM, Bellomo RM, for the ANZICS Database Management Committee. Early blood glucose control and mortality in critically ill patients in Australia. Critical Care Medicine 2009; 37(2):463-470.
� ������������ ��������������������������� ���
163

(36) Krinsley JS, Grover A. Severe hypoglycemia in critically ill patients: risk factors and outcomes. Crit Care Med 2007; 35(10):2262-2267.
(37) Van den Berghe G, Wilmer A, Milants I, Wouters PJ, Bouckaert B, Bruyninckx F et al. Intensive Insulin Therapy in Mixed Medical/Surgical Intensive Care Units: Benefit Versus Harm. Diabetes 2006; 55(11):3151-3159.
(38) Vriesendorp TM, DeVries JH, van SS, Moeniralam HS, de JE, Roos YB et al. Evaluation of short-term consequences of hypoglycemia in an intensive care unit. Crit Care Med 2006; 34(11):2714-2718.
��������
164

Hypoglycaemia is associated with ICU mortality
J Hermanides, RJ Bosman, TM Vriesendorp, R Dotsch,
FR Rosendaal, DF Zandstra, JBL Hoekstra, JH DeVries
Critical Care Medicine, In Press

ABSTRACT
Objective The implementation of intensive insulin therapy in the intensive care
unit (ICU) is accompanied by an increase in hypoglycaemia. We studied the
relation between hypoglycaemia on ICU mortality, since the evidence on this
subject is conflicting.
Design Retrospective database cohort study.
Setting An 18-bed medical/surgical ICU in a teaching hospital (Onze Lieve Vrouwe
Gasthuis Hospital, Amsterdam, the Netherlands).
Patients 5961 patients admitted to from 2004 to 2007 were analysed. Readmissions
and patients with a withholding care policy or with hypoglycaemia on the first
glucose measurement were excluded. Patients were treated with a computerised
insulin algorithm (target glucose range 4.0 to 7.0 mmol/l).
Measurements All first episodes of hypoglycaemia (glucose <=2.5 mmol/l) were
derived from 154015 glucose values. Using Poisson regression, the incidence rates
(IR) for ICU death and incidence rate ratio (IRR) comparing exposure and non-
exposure to hypoglycaemia were calculated. Patients were considered to be exposed
to hypoglycaemia from the event until the end of ICU admittance. We corrected for
severity of disease using the daily Sequential Organ Failure Assessment score. Age,
sex, cardiothoracic surgery, sepsis and diabetes mellitus were also included as
possible confounders.
Main results 288 (4.8%) patients experienced at least one episode of hypoglycaemia.
Median age was 68 (58 to 75) years, 66% was male and 6.4% died in the ICU. The
IR of death in patients exposed to hypoglycaemia was 40/1000 ICU days, as
compared to 17/1000 ICU days in patients without exposure. The adjusted IRR for
ICU death was 2.1 (95% CI 1.6-2.8, p<0.001).
Conclusions Hypoglycaemia is related to ICU mortality, also when adjusted for a
daily adjudicated measure of disease severity, indicating the possibility of a causal
relationship.
��������
166

1
2
3
4
5
6
7
8
9
10
11
12
13
14
15
INTRODUCTION
Hyperglycaemia in the ICU is common, also in patients without known diabetes,
and is related to poor outcome.1 The implementation of strict glucose control with
intensive insulin therapy (IIT) in the Intensive Care Unit (ICU), targeting for a
fasting morning glucose of 4.4-6.1 mmol/l was proven to be beneficial with regard to
mortality in the two „Leuven‰ trials, if ICU treatment exceeded five and three days,
respectively. 2;3 Two large multicentre randomised controlled trials were carried
out to confirm these results but were terminated prematurely, because of high rates
of sever hypoglycaemia or because the target glucose range was not reached.4;5 The
recently published NICE-SUGAR trial showed that mortality was increased, when
the investigators aimed for a blood glucose 4.5 to 6.0 mmol/l in the IIT group as
compared to <=10.0 mmol/l in the control group (27.5% vs. 24.9%, p=0.02).6 Several
explanations have already been proposed to explain the conflicting results
regarding strict glucose control, including the increased risk of (severe)
hypoglycaemia that accompanies IIT.7-9 A meta-analysis including the NICE-
SUGAR data indicated that IIT was associated with a six-fold increased risk for
hypoglycaemic events (95% CI 4.5 to 8.0). However, the causal relation with
mortality in the ICU remains unclear. Several studies have specifically
investigated outcomes after hypoglycaemia in the ICU and yielded conflicting
results.4;10-13 Because it is possible that hypoglycaemia is a risk marker for severe
illness or dying, rather than a risk factor for mortality, it is important to correct for
severity of disease. All previous studies used the APACHE II score to this purpose,
a validated score designed to predict mortality in the first 24 hours of ICU
admittance. To discriminate between hypoglycaemia as a risk marker and a risk
factor, we reasoned the optimal correction is for severity of disease on the day of the
hypoglycaemic event. Therefore in this study we investigated the relation between
hypoglycaemia in the ICU and mortality, corrected for a measure of severity of
disease taken on the day of the hypoglycaemic event.
MATERIALS AND METHODS
Design and setting
We performed a cohort study in an 18-bed mixed surgical/medical ICU in a
teaching hospital (Onze Lieve Vrouwe Gasthuis Hospital, Amsterdam, the
Netherlands). The nurse-to-patient ratio was on average 1:2 and all beds were
equipped with a clinical information system (iMD-Soft; MetaVision, Tel Aviv,
� ���� ���������������������������������
167

Israel). Informed consent was not required according to Dutch Ethical Review
Board regulations, as it concerned analysis of anonimysed data.
Glucose regulation protocol
The glucose regulation algorithm (target range 4.0 to 7.0 mmol/l) was fully
computerised and connected to the clinical information system. The software
suggested an insulin infusion rate based on the current glucose value, the rate of
glucose change over the previous 5 measurements, previous insulin drip rates and
given insulin boluses. The software also provided the timing of the next glucose
measurement which could vary between 15 minutes and 4 hours. In case of a
glucose measurement below <3.5 mmol/l the insulin pump was stopped and 20 ml
of 30% glucose administered. Glucose was measured 15 minutes hereafter and if
euglycaemia was reached, the insulin pump was restarted at 50% of the previous
infusion rate. If still below 3.5 mmol/l, glucose was administered again and the
insulin pump was not restarted for at least two hours. In case of a glucose
measurement between 3.5 and 4.5 mmol/l, the insulin pump infusion rate was
decreased with the percentage of decrease between the current and the last glucose
value. Within 24 hours after admission, enteral feeding was started, targeting for
2000 kcal/24h within 48 hour or 1500 kcal/24h within 24 hours. In case of gastric
retention, a feeding tube was inserted in the duodenum. When normal eating was
resumed, the glucose regulation algorithm was stopped. The protocol was
implemented in 2001.14
Hypoglycaemia
Glucose was measured from blood samples obtained from an arterial catheter using
the AccuCheck (Roche/Hitachi®, Basel, Switzerland). We obtained all
measurements from the clinical information system. Hypoglycaemia was defined as
one or more glucose measurements <=2.5 mmol/l. This is using the same cut-off
value as we used earlier and similar to the cut-off values used by van den Berghe
and the NICE-SUGAR investigators (<=2.2 mmol/l).6;13;15
Because the cut-off value for (severe) hypoglycaemia in the ICU in different studies
ranges from 2.2 to 4.5 mmol/l, we also assessed the risk for ICU death associated
with different cut-off values for hypoglycaemia; <=1.4, 1.9, 3.1, 3.6, 4.2, 4.7, 5.3 and
5.8 mmol/l respectively.
��������
168

1
2
3
4
5
6
7
8
9
10
11
12
13
14
15
Data collection
All data was extracted from the clinical information system. Patients admitted
between January 2004 and January 1st 2008 were included. No changes in the
glucose regulation protocol were applied in this period. Readmissions, patients with
a withholding care policy and patients who had hypoglycaemia at admission were
excluded. We collected information on the medical history, demographic variables
and admission diagnosis. For each day of ICU admittance, we calculated the
Sequential Organ Failure Assessment (SOFA) Score, as a measure of severity of
disease on that particular day.16 If the SOFA score was not available on the day of
ICU discharge, we imputed the SOFA score of the preceding day.
Statistical analyses
Results are presented as median with interquartile range (IQR). We calculated the
incidence rate of ICU death per 1000 ICU days for patients with- and without
hypoglycaemia and calculated the crude incidence rate ratio (IRR), thereby
assuming a more or less constant hazard for ICU death. Every calendar day of ICU
admittance was counted as 1 day of ICU admittance. When a patient experienced
hypoglycaemia, we considered the patient to be exposed all subsequent days of the
ICU admittance. To correct for severity of disease per day, we divided the daily
SOFA scores into tertiles and compared mortality in the exposed to the non-
exposed within each SOFA tertile. We created tertiles to maintain sufficient power
for multivariate analyses. Using Poisson regression, we adjusted the IRR for the
altering SOFA-tertile. We also included the interaction between SOFA-tertile and
ICU admission days in the model (SOFA tertile*ICU admission days), as the
predictive value of the SOFA score differs when patients are admitted longer.
Furthermore, we adjusted for admission diagnosis of sepsis, according to the
APACHE II diagnostic criteria, as this can cause hypoglycaemia and is also related
to ICU mortality.17 Diabetes mellitus is known to predispose patients to
hypoglycaemia in the ICU17 however might affect outcome positively18 and was
therefore included in the analyses. Cardiothoracic surgery was also included as a
potential confounder, because mortality among cardiothoracic patients is generally
lower and they differ with respect to several demographic and physiological
characteristics.19
Finally, the analyses were adjusted for age and sex. The same analysis was
performed for different cut-off values for hypoglycaemia. All statistical analyses
were performed in SPSS 16.0 (SPSS Inc.,Chicago, IL, USA).
� ���� ���������������������������������
169

RESULTS
From 6725 admissions, 5961 patients were eligible for analyses after excluding 656
readmissions and patients with a withholding care policy (n=86) or glucose <=2.5
mmol/l according to their first glucose measurement (n=22). The patient
characteristics are displayed in Table 1 and Table 2. In total 154015 glucose values
were collected, a median of 11 values per day per patient (IQR 6 to 14). Median age
was 68 years (IQR 58 to 75), 66% of the population was male and 6.4% of the
patients died in the ICU. Patients were in target range a median of 42% of the time
(IQR 17 to 56) and 288 (4.8 %) of patients encountered one or more episodes of
hypoglycaemia (<=2.5 mmol/l) and of these 113 patients experienced more than 1
episode.In total we collected 20737 SOFA scores (1152 missing scores (5.6%),
mainly SOFA scores of discharge day), of which the tertiles ranged from 0-4, 5-6,
>6.
��������
170

1
2
3
4
5
6
7
8
9
10
11
12
13
14
15
Surgical (n=4582)
Medical (n=1379)
Total cohort (n=5961)
Age, years (median, IQR) 68 (59 to 78) 64 (52 to 76) 68 (58 to 75) Gender, male n (%) 3058 (67) 863 (62) 3907 (66) APACHE II score on admission (median, IQR) 15 (12 to 17) 24 (18 to 31) 16 (13 to 20) Max SOFA score during admission* (median, IQR) 5 (4 to 6) 8 (5 to 11) 6 (4 to 7) ICU stay, days (median (IQR) 0.9 (0.8 to 1.1) 2.6 (1.1 to 5.3) 1.0 (0.8 to 2.0) Diabetes mellitus, n (%) 691 (15.1) 8 (0.6) 699 (11.7%) Died ICU, n (%) 81 (1.8) 305 (21.8) 380 (6.4%) Died hospital, n (%) 211 (4.6) 445 (31.9) 648 (10.9%) Severe hypoglycaemia (>= 1 event), n (%) 111 (2.4) 177 (12.8) 288 (4.8%) Admission Category n (%) -Cardiovascular 4012 (87.6) 253 (18.3) 4265 (71.5) -After cardiac arrest 10 (0.2) 298 (21.6) 308 (5.2) -Sepsis 53 (1.2) 221 (16.0) 274 (4.6) -Gastrointestinal 255 (5.6) 57 (4.1) 312 (5.2) -Haematological 8 (0.2) 9 (0.7) 17 (0.3) -Renal 12 (0.3) 26 (1.9) 38 (0.6) -Metabolic 7 (0.2) 45 (3.3) 52 (0.9) -Neurological 47 (1.0) 168 (12.2) 215 (3.6) -Respiratory 178 (3.9) 302 (21.9) 476 (8.0)
No severe hypoglycaemic episode (n=5673)
>=1 severe hypoglycaemic episode (n=288)
Age, years (median, IQR) 68 (58 to 75) 68 (57 to 77) Gender, male n (%) 3740 (65.9) 167 (58.0) APACHE II score on admission (median, IQR) 15 (12 to 19) 23 (17 to 30) SOFA score* (median, IQR) 5 (4-7) 9 (6-13) ICU stay, days (median (IQR) 1.0 (0.8 to 1.9) 5.8 (2.0 to 12.9) Diabetes mellitus, n (%) 666 (11.7) 33 (11.5) Died ICU, n (%) 312 (5.5) 68 (23.6) Died hospital, n (%) 549 (9.7) 99 (34.4) Medical admission, n (%) 1202 (21.2) 177 (61.5) Surgical admission, n (%) 4471 (78.8) 111 (38.5)
Table 1- population characteristics; APACHE Acute Physiology and Chronic Health Evaluation, SOFA Sequential Organ Failure Assessment ICU Intensive Care Unit *Maximum score of the total scores calculated each ICU day
Table 2- population characteristics for patients with- and without severe hypoglycaemia; APACHE Acute Physiology and Chronic Health Evaluation, SOFA Sequential Organ Failure Assessment ICU Intensive Care Unit *Maximum score during admission, calculated from the total scores calculated each ICU day
� ���� ���������������������������������
171

SOFA score
0 to 4 5 to 6 >6Inci
denc
e of
ICU
dea
th p
er 1
000
patie
nt IC
U-d
ays
0
10
20
30
40
50
60
70
80
Hypo +Hypo -
ICU mortality and hypoglycaemia
The IR of ICU death was 19/1000 ICU days. The overall IR for ICU death after
experiencing a hypoglycaemic event was 40/1000 ICU days, as compared to 17/1000
ICU days without a hypoglycaemic episode, crude IRR 2.3 (95% CI 1.8 to 3.1,
p<0.001). The IRs after experiencing hypoglycaemia were higher across all SOFA
score ranges (Figure 1). After adjusting for age, sex, admission for cardiothoracic
surgery, sepsis, SOFA score, ICU days and the interaction between SOFA score and
ICU days, the adjusted IRR was to 2.1 (95% CI 1.6 to 2.8, p<0.001). The crude IR
for patients experiencing only one episode of hypoglycaemia was 36/1000 ICU days
as compared to 42/1000 ICU days for patients with more than one episode, IRR 1.2
(95% CI 0.7 to 2.0, p=0.58). When the APACHE II score was used to correct for
severity of disease, instead of the daily SOFA score, the IRR for ICU death was 1.6
(95% CI 1.2 to 2.1).
Figure 1- the incidence of intensive care unit (ICU) death per 1000 ICU days with and without hypoglycaemia (<=2.5 mmol/l) for daily sequential organ failure scores (SOFA) 0 to 4, 5 to 6 and >6.
��������
172

1
2
3
4
5
6
7
8
9
10
11
12
13
14
15
Hypo cut-off (mmol/l)
IRR
for I
CU
dea
th w
ith 9
5% C
I
1.4 1.9 2.5 3.1 3.6 4.2 4.7 5.3 5.80.1
1
10
Figure 2 shows the adjusted IRRs for the different cut-off values for hypoglycaemia
in the ICU. There was an increased risk for ICU death up to the cut-off value of 4.7
mmol/l, IRR 1.4 (95% CI 1.1 to 1.8, p=0.006). With cut-off values above 4.7 mmol/l,
no effect on IRR for ICU death was found, IRR 1.1 (0.9 to 1.4, p=0.44).
DISCUSSION
In this cohort study we showed that hypoglycaemia (<=2.5 mmol/l) in the ICU is
accompanied by an increase in ICU death 2.1 (95% CI 1.6 to 2.8, p<0.001) after
adjusting for the daily SOFA score over time.
In a previous nested case-control study we did not find an association between
hypoglycaemia and in-hospital death (hazard ratio 1.03, 95% CI 0.68 to 1.56) in a
relative small sample of 156 hypoglycaemic events.13 Arabi and coworkers also
found no significant relation between hypoglycaemia and ICU mortality.12 In
contrast with these findings, Krinsley et al. found in a small retrospective case-
control designed study that hypoglycaemia (<2.2 mmol/l) was associated with an
increased mortality risk (OR 2.28, 95% CI 1.41 to 3.70) in a population that was
only partly treated with IIT.11 Also, Bagshaw et al showed in a large multicentre
ICU cohort (n=66,184), that the OR for ICU mortality after exposure to a glucose
Figure 2- Adjusted incidence rate ratios (IRR) for intensive care unit (ICU) death when different cut-off values for hypoglycaemia are used.
� ���� ���������������������������������
173

value <4.5 mmol/l was 1.41 (95% CI 1.31 to 1.54).10 However, this study was limited
to the first 24 hours of ICU admission and a relative small number of glucose
values per patient (~2) were collected.
All previous studies used the APACHE II score to correct for disease severity.20
We excluded patients with a severe hypoglycaemia as the first glucose
measurement. This was because these patients were not under strict glucose
control before the event and spontaneous hypoglycaemia can be a marker of severe
disease.21-23
A strength of the current study is that we attempted to adjust for severity of
disease as a changing variable over time in stead of using the APACHE II score.
Although APACHE II is validated to predict mortality, it is determined at ICU
admission and does not take any changes thereafter into account. The SOFA score
is a measure of disease severity that it is updated daily during admittance and
therefore seems to provide a better distinction between hypoglycaemia as a risk
factor or risk marker. The use of the SOFA score is limited by the interaction with
time spent in the ICU and different predictive power of identical SOFA scores
depending on the failing organ systems that contribute to the score.24 However, in
the current study it was the best available predictive score that could be assessed
on a daily basis and it is validated to discriminate between ICU survivors and non-
survivors.16;24 Furthermore, we have attempted to correct for the interaction with
time spent in ICU by including this in the model. After experiencing a
hypoglycaemic event, we considered patients to be exposed the remaining days of
the ICU admittance, because from a pathofysiological viewpoint hypoglycaemia
may cause damage that is, at least during ICU stay, likely to be sustained.
Hypoglycaemia may contribute to ICU mortality by inducing neuroglycopenia with
neuronal cell loss and hypoglycaemic coma, especially after hyperglycaemic
reperfusion.13;25;26 Furthermore, hypoglycaemia might provoke ischemia in pre-
existing vascular disease in diabetic patients27 and it has also been shown to induce
platelet activation and inflammation in experimental setting.28-30 Hypoglycaemia
could thus contribute to ICU mortality by aggravating overall illness.
Another strength of this study is that adequate glycaemic control was achieved
while the hypoglycaemia rate was low compared to other studies.31 Our study is
limited by its single-centre origin. However, there was a high quality of data
collection, because all clinical information and laboratory values were directly or
even automatically stored in the computerised clinical information system.
The additional analyses we performed investigating different cut-off values for
hypoglycaemia showed that up to 4.7 mmol/l, hypoglycaemia was associated with a
��������
174

1
2
3
4
5
6
7
8
9
10
11
12
13
14
15
significant increased risk for ICU death. This is in concordance with the study of
Bagshaw and colleagues, who found an increased mortality risk when defining
hypoglycaemia as <4.5 mmol/l. The recently published NICE-SUGAR study was the
start of a debate about the optimal blood glucose range in the ICU6 and a higher,
perhaps safer range than the tight range of the Leuven studies is proposed.2 The
present and previous studies thus suggest that hypoglycaemia might be harmful
when aiming for strict glycaemic control, targeting for a range between 4.0 to 7.0
mmol/l.5
Future investigations looking at strict glycaemic control in the ICU should consider
the possibility that even glucose values below 4.7 mmol/l are harmful. Higher
target ranges for glucose control will diminish the incidence hypoglycaemia and
seem justified.
CONCLUSIONS
Hypoglycaemia is related to ICU mortality, also when adjusted for a daily
adjudicated measure of disease severity. Although residual confounding can never
be ruled out, a causal relationship between hypoglycaemia and ICU mortality is a
likely possibility.
� ���� ���������������������������������
175

REFERENCES
(1) Dungan KM, Braithwaite SS, Preiser JC. Stress hyperglycaemia. Lancet 2009; 373(9677):1798-1807.
(2) Van den Berghe G, Wouters P, Weekers F, Verwaest C, Bruyninckx F, Schetz M et al. Intensive insulin therapy in the critically ill patients. N Engl J Med 2001; 345(19):1359-1367.
(3) Van den Berghe G, Wilmer A, Hermans G, Meersseman W, Wouters PJ, Milants I et al. Intensive insulin therapy in the medical ICU. N Engl J Med 2006; 354(5):449-461.
(4) Brunkhorst FM, Engel C, Bloos F, Meier-Hellmann A, Ragaller M, Weiler N et al. Intensive Insulin Therapy and Pentastarch Resuscitation in Severe Sepsis. N Engl J Med 2008; 358(2):125-139.
(5) Preiser JC, Devos P, Ruiz-Santana S, M��lot C, Annane D, Groeneveld J et al. A prospective randomised multi-centre controlled trial on tight glucose control by intensive insulin therapy in adult intensive care units: the Glucontrol study. Intensive Care Medicine.
(6) Finfer S, Chittock DR, Su SY, Blair D, Foster D, Dhingra V et al. Intensive versus conventional glucose control in critically ill patients. N Engl J Med 2009; 360(13):1283-1297.
(7) Preiser JC. NICE-SUGAR: the end of a sweet dream? Critical Care 2009; 13(3):143.
(8) Bellomo R, Egi M. What Is a NICE-SUGAR for Patients in the Intensive Care Unit? Mayo Clinic Proceedings 2009; 84(5):400-402.
(9) Van den Berghe G, Schetz M, Vlasselaers D, Hermans G, Wilmer A, Bouillon R et al. Intensive Insulin Therapy in Critically Ill Patients: NICE-SUGAR or Leuven Blood Glucose Target? J Clin Endocrinol Metab 2009; 94(9):3163-3170.
(10) Bagshaw SM, Bellomo R, Jacka MJ, Egi M, Hart GK, George C et al. The impact of early hypoglycemia and blood glucose variability on outcome in critical illness. Crit Care 2009; 13(3):R91.
(11) Krinsley JS, Grover A. Severe hypoglycemia in critically ill patients: risk factors and outcomes. Crit Care Med 2007; 35(10):2262-2267.
(12) Arabi YMM, Tamim HMM, Rishu AHM. Hypoglycemia with intensive insulin therapy in critically ill patients: Predisposing factors and association with mortality. Critical Care Medicine 2009; 37(9):2536-2544.
(13) Vriesendorp TM, DeVries JH, van SS, Moeniralam HS, de JE, Roos YB et al. Evaluation of short-term consequences of hypoglycemia in an intensive care unit. Crit Care Med 2006; 34(11):2714-2718.
(14) Rood E, Bosman RJ, van der Spoel JI, Taylor P, Zandstra DF. Use of a Computerized Guideline for Glucose Regulation in the Intensive Care Unit Improved Both Guideline Adherence and Glucose Regulation. J Am Med Inform Assoc 2005; 12(2):172-180.
(15) Van den Berghe G, Wilmer A, Milants I, Wouters PJ, Bouckaert B, Bruyninckx F et al. Intensive insulin therapy in mixed medical/surgical intensive care units: benefit versus harm. Diabetes 2006; 55(11):3151-3159.
(16) Ferreira FL, Bota DP, Bross A, Melot C, Vincent JL. Serial Evaluation of the SOFA Score to Predict Outcome in Critically Ill Patients. JAMA 2001; 286(14):1754-1758.
(17) Vriesendorp TM, van SS, DeVries JH, de JE, Rosendaal FR, Schultz MJ et al. Predisposing factors for hypoglycemia in the intensive care unit. Crit Care Med 2006; 34(1):96-101.
(18) Graham BB, Keniston A, Gajic O, Trillo Alvarez CA, Medvedev S, Douglas IS. Diabetes mellitus does not adversely affect outcomes from a critical illness. Crit Care Med 2010; 38(1):16-24.
��������
���

1
2
3
4
5
6
7
8
9
10
11
12
13
14
15
(19) Kramer AA, Zimmerman JE. Predicting outcomes for cardiac surgery patients after intensive care unit admission. Semin Cardiothorac Vasc Anesth 2008; 12(3):175-183.
(20) Knaus WA, Draper EA, Wagner DP, Zimmerman JE. APACHE II: a severity of disease classification system. Crit Care Med 1985; 13(10):818-829.
(21) Goyal A, Mehta SR, Diaz R, Gerstein HC, Afzal R, Xavier D et al. Differential clinical outcomes associated with hypoglycemia and hyperglycemia in acute myocardial infarction. Circulation 2009; 120(24):2429-2437.
(22) Kosiborod M, Inzucchi SE, Goyal A, Krumholz HM, Masoudi FA, Xiao L et al. Relationship between spontaneous and iatrogenic hypoglycemia and mortality in patients hospitalized with acute myocardial infarction. JAMA 2009; 301(15):1556-1564.
(23) Mendoza A, Kim YN, Chernoff A. Hypoglycemia in hospitalized adult patients without diabetes. Endocr Pract 2005; 11(2):91-96.
(24) Vincent JL, de MA, Cantraine F, Moreno R, Takala J, Suter PM et al. Use of the SOFA score to assess the incidence of organ dysfunction/failure in intensive care units: results of a multicenter, prospective study. Working group on "sepsis-related problems" of the European Society of Intensive Care Medicine. Crit Care Med 1998; 26(11):1793-1800.
(25) Fujioka M, Okuchi K, Hiramatsu KI, Sakaki T, Sakaguchi S, Ishii Y. Specific Changes in Human Brain After Hypoglycemic Injury. Stroke 1997; 28(3):584-587.
(26) Suh SW, Gum ET, Hamby AM, Chan PH, Swanson RA. Hypoglycemic neuronal death is triggered by glucose reperfusion and activation of neuronal NADPH oxidase. J Clin Invest 2007; 117(4):910-918.
(27) Wright RJ, Frier BM. Vascular disease and diabetes: is hypoglycaemia an aggravating factor? Diabetes Metab Res Rev 2008; 24(5):353-363.
(28) Hutton RA, Mikhailidis D, Dormandy KM, Ginsburg J. Platelet aggregation studies during transient hypoglycaemia: a potential method for evaluating platelet function. J Clin Pathol 1979; 32(5):434-438.
(29) Razavi Nematollahi L, Kitabchi AE, Stentz FB, Wan JY, Larijani BA, Tehrani MM et al. Proinflammatory cytokines in response to insulin-induced hypoglycemic stress in healthy subjects. Metabolism 2009; 58(4):443-448.
(30) Trovati M, Anfossi G, Cavalot F, Vitali S, Massucco P, Mularoni E et al. Studies on mechanisms involved in hypoglycemia-induced platelet activation. Diabetes 1986; 35(7):818-825.
(31) Vriesendorp TM, DeVries JH, Hoekstra JB. Hypoglycemia and strict glycemic control in critically ill patients. Current Opinion in Critical Care 2008; 14(4):397-402.
� ���� ���������������������������������
177


Mean glucose during ICU admission is related to
mortality by a U-shaped curve; implications for
clinical care
SE Siegelaar, J Hermanides, HM Oudemans- van
Straaten, PHJ van der Voort, RJ Bosman, DF Zandstra,
JH DeVries
Submitted for publication

ABSTRACT
Purpose To determine in which way glucose regulation is associated with ICU
mortality thereby trying to reconcile the conflicting data from the Leuven and
NICE-SUGAR trials, since recently the optimal glucose target range has become
unclear.
Methods Retrospective database cohort study including patients admitted between
January 2004 and December 2007 in a 20-bed medical/surgical ICU in a teaching
hospital. Hyperglycaemia was treated using a fully computerised algorithm
targeting for glucose levels of 4.0 to 7.0 mmol/l. 5983 patients were eligible for
analyses. We randomly selected 2435 patients with a surgical/medical ICU
admission ratio of 55/45%, to enable comparison with the Leuven and NICE-
SUGAR populations.
Results The cohort was subdivided in deciles of increasing mean glucose. We
examined the relation between mean glucose strata and mortality. We observed the
highest mortality in the lower and higher strata. Logistic regression analysis
adjusted for age, sex, APACHE II score and admission duration showed that mean
glucose levels <7.0 mmol/l and >9.0 mmol/l were associated with significantly
increased ICU mortality (OR >=2.06 and >=2.33 respectively). Limitations of the
study were its retrospective design and possible incomplete correction for severity
of disease. Conclusions Mean glucose during ICU admission is related to mortality by a U-
shaped curve. A Âsafe rangeÊ of mean glucose regulation might be defined between
7.0 and 9.0 mmol/l. The U-shaped curve may help to explain the increased
mortality in the intensively treated group of the NICE-SUGAR study but is at odds
with the low mortality in the intensively treated groups of the Leuven studies.
��������
180

1
2
3
4
5
6
7
8
9
10
11
12
13
14
15
INTRODUCTION
Due to inflammatory and neuro-endocrine derangements in critically ill patients,
stress hyperglycaemia associated with high hepatic glucose output and insulin
resistance is common in the intensive care unit (ICU).1 This stress hyperglycaemia
is associated with poor outcome.2 Moreover, several studies report a deleterious
effect of glycaemic variability over and above mean glucose, after correction for
severity of disease.3-5
In 2001 van den Berghe and colleagues published the first randomised controlled
trial (RCT) comparing normalization of glycaemia by intensive insulin treatment
(IIT) with conventional glycaemic control at a surgical ICU (glucose target: 4.4 to
6.1 mmol/l versus 10.0 to 11.1 mmol/l).6 They reported an impressive reduction in
mortality with IIT. This same group failed to reproduce these findings in the entire
population of patients in their medical ICU,7 however mortality was lower in the
predefined subgroup of patients receiving IIT for more than three days. After
pooling of the data of both RCTÊs IIT seemed associated with a reduction in
mortality.8 Based on these ÂLeuven trialsÊ, many hospitals decided to implement
protocols and target normalisation of glucose levels to improve patient care.
Recently, after the publication of two inconclusive multicentre studies (the Volume
Substitution and Insulin Therapy in Severe Sepsis [VISEP]9 and the
GluControl10;11 studies) followed by the very recently reported Normoglycaemia in
Intensive Care Evaluation- Survival Using Glucose Algorithm Regulation (NICE-
SUGAR) trial12, confusion has been raised about the optimal tightness of control:
the NICE-SUGAR trial investigators reported an absolute increase in deaths at 90
days with IIT (glucose target: 4.5 to 6.0 mmol/l versus 8.0 to 10.0 mmol/l).
Additionally, a recently published meta-analysis including this latter trial showed
that intensive insulin therapy significantly increased the risk of hypoglycaemia and
conferred no overall mortality benefit among critically ill patients.13
The goal of this study is to report glucose and mortality data from a general ICU of
a teaching hospital in the Netherlands and to compare these data with the results
of the Leuven studies and NICE-SUGAR trial, with the goal to come to terms
regarding the cause of their conflicting results and to define the optimal tightness
of glycaemic control.
��� �������� ������������������������������������������
181

MATERIALS AND METHODS
Cohorts, setting and data collection
We collected information about patients admitted between January 2004 and
December 2007 in a 20-bed medical/surgical ICU in a teaching hospital (Onze Lieve
Vrouwe Gasthuis Hospital, Amsterdam, the Netherlands; the OLVG cohort). The
average patient-to-nurse ratio was 1:2. All beds were equipped with a clinical
information system (iMD-Soft; MetaVision, Tel Aviv, Israel) from which all clinical
and laboratory data was extracted. The glucose regulation algorithm was
implemented successfully in 200114, targeting for glucose values between 4.0 and
7.0 mmol/l. Using a sliding scale computerised algorithm, the nursing staff was
instructed to adjust the insulin infusion rate depending on the current glucose
value and the rate of glucose change (based on the previous five measurements).
The software also provided the time the next glucose measurement was due, which
could vary from 15 minutes up to 4 hours. Routinely, enteral feeding was started
within 24 hours after admission, aiming at 1500 ml within 24 hours, and
subsequently adjusted to the patientÊs requirements. A duodenal feeding tube was
inserted in case of persistent gastric retention. The tight glucose algorithm was
deactivated when patients resumed normal eating.
We excluded readmissions, patients with a withholding care policy and patients
with only one glucose value measured during admission. From these patients we
randomly allocated a definitive population in which 45% of the patients had a
medical ICU admission diagnosis and 55% of the patients a surgical ICU admission
diagnosis. This ratio lies in between the populations of the Leuven and NICE-
SUGAR studies. From the clinical information system we collected demographic
variables, mortality rates in the ICU and glucose values. As severity of disease
measures we used the maximal Sequential Organ Failure Assessment (SOFA) score,
which was determined daily during ICU admission15 and the Acute Physiology and
Chronic Health Evaluation II (APACHE II) score16. Informed consent is not
required according to Dutch Ethical Review Board regulations, because a
retrospective analysis of anonymous data was performed.
Glucose measurers
For each patient we calculated the mean overall glucose during admission from all
glucose values measured during admission and the mean morning glucose from the
first value available between 5.00h and 7.00h am per patient per day. Glucose was
obtained from arterial blood samples, with a handheld glucose measurement device
��������
182
1
2
3
4
5
6
7
8
9
10
11
12
13
14
15
(AccuCheck, Roche/Hitachi®, Basel, Switzerland). Results were automatically
stored in the clinical information system.
For comparison with the combined Leuven and NICE-SUGAR studies, we used the
mean glucose during admission and ICU mortality rates as published for both the
IIT and conventional group.
Data interpretation
The cohort characteristics are presented as mean � standard deviation (SD) or
median with interquartile range (IQR), depending on the distribution of the data.
The mean glucose values and standard deviations were divided into 10 strata with
equal numbers of patients per group. For each stratum, the ICU mortality was
calculated. Subsequently we performed a logistic regression analysis to calculate
the odds ratio (OR) for ICU mortality per glucose stratum. The stratum with the
lowest mortality incidence was used as reference. In this model we adjusted for age,
sex, severity of disease (APACHE II score) and admission duration (i.e. <= or
>24hr). The latter because glucose values are higher and have a wider range in the
first 24 hours of admission, biasing the patients with longer admission times and
corresponding lower mean glucose values. For the combined Leuven studies and the
NICE-SUGAR study, we assessed the 95% population range around the mean
glucose by taking the mean minus- and plus 1.96 times the standard deviation. We
plotted the mortality rate in the Leuven and NICE-SUGAR trials against the
mortality in the corresponding stratum of mean glucose in our cohort.
RESULTS
In total 5983 patients were eligible for analyses of the mean glucose for the OLVG
population after excluding 656 readmissions, 86 patients with a withholding care
policy and 155 patients with only one glucose value measured. From this
population we randomly selected the final cohort of 2435 patients with a
surgical/medical ICU admission ratio of 55/45%, to enable comparison with the
Leuven and NICE-SUGAR populations. In the final cohort a median (IQR) of 12 (8
to 14) glucose values per admission day per patient was collected. The total
population and the random sample are comparable regarding all baseline
characteristics (data not shown). The characteristics of our population and those in
the Leuven and NICE-SUGAR trials are displayed in Table 1.
��� �������� ������������������������������������������
183
Mean glucose
The overall mean (SD) glucose of the OLVG population was 8.0 (2.3) mmol/l (Table
1). The mean glucose values of the first 24 hours of admission were larger and had
a wider range than mean glucose values after 24 hours (mean [SD] 8.3 [2.8] mmol/l,
range 0.6 to 40.2 mmol/l and 7.2 [1.6] mmol/l, range 3.2 to 31.1 mmol/l respectively).
The mean morning glucose was 7.5 [2.5] mmol/l.
After dividing the mean glucose into ten equally sized strata, the lowest mean
glucose stratum ranged 6.3 mmol/l and below. The highest stratum went up from
10.3 mmol/l. Mean glucose ranges per stratum and corresponding mortality rates
are displayed in Figure 1. This results in a U-shaped curve relation between
glucose and mortality, with high mortality in the lowest and highest glucose-
stratum, 21.3% and 27.6% respectively. The strata of the total population showed a
comparable U-curve with the random sample (data not shown). Logistic regression
analysis showed that glucose values below 7.0 mmol/l and above 9.1 mmol/l were
associated with a significant higher OR for ICU mortality compared to the stratum
with the lowest mortality (stratum 6). This results in a Âsafe rangeÊ of 7.0 up to 9.0
mmol/l (Figure 2). The mean glucose, SD and 95% population range of the combined
Leuven and NICE-SUGAR studies are depicted in Table 1.
In the NICE-SUGAR study, the mean glucose of the IIT group (6.4 mmol/l) falls
into the stratum with increased mortality compared to the conventional group (8.0
mmol/), which lies in the safe range of the OLVG population (Figure 1). The mean
of the IIT group of the combined Leuven studies (5.8 mmol/l) falls into the stratum
of 6.3 mmol/l and below, where mortality in the OLVG cohort is highest. The mean
of the conventional group in the combined Leuven studies (8.4 mmol/l) lies in the
safe range of the OLVG population (Figure 1).
��������
184

1
2
3
4
5
6
7
8
9
10
11
12
13
14
15
Table 1- characteristics of the studied cohorts; Hypoglycaem
ia was defined as at least one glucose value <=2.2 m
mol/l
¶ time-w
eighted blood glucose12
IIT, Intensive Insulin Therapy; AP
AC
HE
, Acute P
hysiology and Chronic H
ealth Evaluation; S
OFA
, Sequential O
rgan Failure Assessm
ent; ICU
, Intensive Care U
nit, n.a.; not available
O
LVG
Com
bined Leuven N
ICE-SU
GA
R
IIT (n=2435)
IIT (n=1388) C
onventional (n=1360) IIT (n=3016)
Conventional (n=3014)
Age, years (m
ean ± SD)
63.9 ± 15.1 63 ± 15
63 ± 15 60 ± 17
60 ± 17 G
ender, female n (%
) 857 (35.2)
460(34) 449 (32)
1128 (37) 1079 (36)
Diagnostic group, n (%
) -S
urgical -M
edical
1096 (45) 1339 (55)
765 (55) 595 (45)
783 (58) 605 (42)
1112 (37) 1903 (63)
1121 (37) 1893 (63)
APA
CH
E II score on admission (m
ean ± SD)
20.3 ± 8.6 15 ± 10
16 ± 9 21 ± 8
21 ± 8 D
iabetes Mellitus, n (%
) 180 (7.4)
207 (15) 200 (14)
615 (20) 596 (20)
BM
I (mean ± SD
) 27.2 ± 20.7
25.7 ± 4.9 25.4 ± 4.9
27.9 ± 7.7 28.0 ± 7.2
Died IC
U, n (%
) 302 (12.4)
179 (13.2) 225 (16.2)
546 (18.1) 498 (16.5)
Morning glucose, m
mol/l (m
ean ± SD)
7.5 (2.5) n.a.
n.a. 6.5 (1.4)
8.0 (1.4) O
verall glucose, mm
ol/l (mean ± SD
) 8.0 (2.3)
5.8 (1.3) 8.4 (1.8)
6.4 (1.0) ¶ 8.0 (1.3) ¶
95% population range (m
mol/l)
3.5 to 12.5 3.2 to 8.4
4.9 to 11.9 3.9 to 9.3
5.2 to 10.8 H
ypoglycaemia incidence (%
) 6.6
11.3 1.8
6.8 0.5
��� �������� ������������������������������������������
185

ICU
mor
talit
y (%
)
0
5
10
15
20
25
30
Mean glucose (mmol/l)
<= 6
,3
6,4-
6,7
6,8-
6,9
7,0-
7,2
7,3-
7,4
7,5-
7,7
7,8-
8,2
8,3-
9,0
9,1-
10,2
>= 1
0,3
Leuven IITLeuven CNICE SUGAR IITNICE SUGAR COLVG
**
* **
**
Mean glucose (mmol/l)
<= 6
,3
6,4-
6,7
6,8-
6,9
7,0-
7,2
7,3-
7,4
7,5-
7,7
7,8-
8,2
8,3-
9,0
9,1-
10,2
>=10
,3
OR
ICU
mor
talit
y
0,1
1
10
**
* *
**
*
Figure 1- ICU mortality per mean glucose stratum with the highest mortality in the lowest and highest strata. The mean glucose values and ICU mortality data of the Leuven and NICE-SUGAR IIT and C groups are plotted in the graph. ICU, Intensive Care Unit; SD, standard deviation; IIT, intensive insulin treatment; C, conventional treatment
Figure 2- odds ratio (OR) for mortality per glucose stratum with the highest OR in the lowest and highest strata. Logistic regression model adjusted for age, sex, APACHE II score and admission duration (� and > 24hr). *p<0.05, **p<0.001. ICU, Intensive Care Unit
��������
186

1
2
3
4
5
6
7
8
9
10
11
12
13
14
15
Mean glucose stratum (mmol/l)
<= 6
,3
6,4-
6,7
6,8-
6,9
7,0-
7,2
7,3-
7,4
7,5-
7,7
7,8-
8,2
8,3-
9,0
9,1-
10,2
>=10
,3
Hyp
ogly
cem
ia in
cide
nce
(%)
0
5
10
15
20
Hypoglycaemia
In total 161 (6.6%) patients of this cohort suffered from at least 1 hypoglycaemic
episode during ICU admission, defined as a glucose value <=2.2 mmol/l. 17.9% of all
deaths during ICU admission concerned patients who had experienced
hypoglycaemia. Regarding the lowest mean glucose stratum (mean glucose <=6.3
mmol/l), 34.6% of the patients that died at the ICU had experienced a
hypoglycaemic episode and 65.4% did not. The incidence of hypoglycaemia in the
different the mean glucose and variability cohorts is reported in Figure 3.
Figure 3-Hypoglycaemia incidence per mean glucose stratum
DISCUSSION
Mean glucose values between 7.0 and 9.0 mmol/l during ICU stay are associated
with the lowest OR for mortality at the ICU, while mean values below 7.0 and
higher than 9.0 mmol/l confer significantly higher ORÊs. These results were
attained while using a glucose algorithm that targeted for glucose values between
4.0 and 7.0 mmol/l. The finding that hyperglycaemia is associated with increased
mortality is in accordance with published literature.2 Also, the U-shaped curve we
found, with increased mortality in the lower and upper quadrants, is described
earlier in patients with myocardial infarction during admission17-19, in the ICU
setting for the first 24 hours of admission20 and more generally in patients with
type 2 diabetes mellitus21, corroborating this finding.
��� �������� ������������������������������������������
187
Hypoglycaemia seems to be associated with increased mortality at the ICU.22-25 In
our population the incidence of hypoglycaemia was highest in the lowest mean
glucose cohorts in which mortality was higher as well. In addition, a significant
part of the patients who died had experienced a hypoglycaemic episode. However,
hypoglycaemia can only partially account for the considerable mortality rate in the
lowest mean glucose stratum since 65.4% of the non-survivors did not experience
hypoglycaemia. However, it might be possible that some hypoglycaemic episodes
were not recorded due to intermittent sampling or were underestimated due to the
AccuChek point-of-care meter used for glucose measurements, results of which tend
to be higher than those obtained from the laboratory.26;27 Also, low blood sugars are
perhaps already harmful above the current cut-off value of 2.2 mmol/l. Therefore
the contribution of hypoglycaemia to ICU death could be underestimated and needs
further research using continuous glucose measurement.
We plotted the reported NICE-SUGAR and combined Leuven mean glucose data in
Figure 1. This shows that the findings of the NICE-SUGAR trial are in accordance
with the mortality data from our cohort; the mean glucose of their IIT group is
according to our data also associated with a higher ICU mortality rate than the
conventionally treated group. This is in contrast with data of the combined Leuven
studies (Figure 1). According to our U-curve the mean glucose value achieved in the
combined Leuven conventionally treated group would correspond with a lower
mortality rate than the mean glucose achieved in their intensively treated group,
which is opposed to their findings. Since the mean mortality and mean glucose
values of the conventionally treated groups of both the combined Leuven and
NICE-SUGAR studies are roughly comparable, it seems that the mortality rate of
the combined Leuven IIT group is lower than expected. A possible explanation for
the low mortality of the Leuven IIT group might be lower glucose variability. In
addition to hypoglycaemia, glycaemic swings are a known risk factor of ICU
death.4;5 Also after an attempt for correction using severity of disease measures
glucose variability remains an independent predictor of mortality in the OLVG
population.28 In addition, other explanations have been proposed to explain the
diverging outcomes of Leuven and NICE-SUGAR.29
Baseline characteristics from our sample and the combined Leuven and NICE-
SUGAR studies were reasonably comparable, only the proportion of patients with
diabetes mellitus in our sample is smaller, 7.4% versus 14.5 and 20.0% in the
combined Leuven and NICE-SUGAR studies respectively). This may be due to a
difference in definition since in our population diabetes mellitus was only scored
when the patient used anti-hyperglycaemic drugs, probably leading to an
��������
188

1
2
3
4
5
6
7
8
9
10
11
12
13
14
15
underestimation of the proportion of patients with diabetes mellitus in our
population. The APACHE II score at admission was lower in the Leuven studies,
which might be due to a larger proportion of (cardiothoracic) surgery patients, of
whom on average APACHE II score and mortality rate were lower than in medical
patients.6;7
The mean glucose of the OLVG population (8.0 mmol/l) was higher than the target
range, between 4.0 and 7.0 mmol/l. Other studies of intensive insulin therapy also
did not reach their target range, illustrating the difficult implementation of this
therapy.9;11;12 Also short ICU admission duration in the OLVG population makes it
more difficult to reach the glucose target because glucose values are higher and
have a wider range in the first 24 hours of admission (median duration of stay 1.5
days in our cohort compared to 3 days in the Leuven cohort and 4.2 days 'on
algorithm' in the NICE-SUGAR study). Furthermore, our patients were treated in a
normal-care setting without the extra stimuli of a trial setting to achieve the target.
Mean glucose does not equal time in target range, as the protocol requires more
frequent sampling when not in target, thus falsely inflating the mean.
The rate of hypoglycaemia in our population was comparable with the NICE-
SUGAR study intensively treated group despite a higher mean glucose in our
population. Lack of a study effect and perhaps a different sampling frequency
might also have contributed to this observation30. Moreover, patients with a
medical admission diagnosis experience more hypoglycaemic events.25 Taking that
into account, other studies implementing intensive insulin therapy observed
comparable rates of severe hypoglycaemia in their intensively treated groups
compared to our population.9;11
In our logistic regression model we adjusted for severity of disease and admission
duration less or more than 24 hours, since both high and low glucose levels could be
a manifestation of severe disease rather than a cause. Glucose values are higher
and have a wider range in the first 24 hours of admission, biasing the patients with
longer admission times and corresponding lower mean glucose values. A limitation
of our correction for severity of disease is the use of the APACHE II score, because
the use of APACHE II to predict mortality is not validated for cardiothoracic
surgery patients. However, this adjustment is the best available method.31
CONCLUSIONS
According to our data the mean glucose during ICU stay is related to mortality by a
U-shaped curve; a Âsafe rangeÊ for mean glucose can be defined between 7.0 and 9.0
mmol/l, while both higher and lower mean values are associated with higher
��� �������� ������������������������������������������
189

mortality. Secondly, comparison of the combined Leuven, NICE SUGAR and our
cohorts learns that the increased mortality in the IIT group of NICE-SUGAR is in
line with our U-shaped curve. Low glucose variability may have contributed to their
corresponding low mortality. According to these findings and awaiting further
studies we recommend treating hyperglycaemia at the ICU in a moderately
intensive way, targeting for mean glucose values between 7.0 and 9.0 mmol/l and
avoiding hypoglycaemia. This Âsafe rangeÊ should be studied prospectively in
randomised clinical trials.
��������
190

1
2
3
4
5
6
7
8
9
10
11
12
13
14
15
REFERENCES
(1) Dungan KM, Braithwaite SS, Preiser JC. Stress hyperglycaemia. The Lancet 2009;
373(9677):1798-1807.
(2) Umpierrez GE, Isaacs SD, Bazargan N, You X, Thaler LM, Kitabchi AE. Hyperglycemia:
An Independent Marker of In-Hospital Mortality in Patients with Undiagnosed Diabetes.
J Clin Endocrinol Metab 2002; 87(3):978-982.
(3) Dossett LA, Cao H, Mowery NT, Dortch MJ, Morris J, May AK. Blood Glucose Variability
Is Associated with Mortality in the Surgical Intensive Care Unit. American Surgeon 2008;
74(8):679-685.
(4) Egi M, Bellomo R, Stachowski E, French C, Hart G. Variability of blood glucose
concentration and short-term mortality in critically ill patients. Anesthesiology 2006;
105(2):244-252.
(5) Krinsley J. Glycemic variability: A strong independent predictor of mortality in critical ill
patients. Crit Care Med 2008; 36(11):3008-3013.
(6) Van den Berghe G, Wouters P, Weekers F, Verwaest C, Bruyninckx F, Schetz M et al.
Intensive Insulin Therapy in Critically Ill Patients. N Engl J Med 2001; 345(19):1359-
1367.
(7) Van den Berghe G, Wilmer A, Hermans G, Meersseman W, Wouters PJ, Milants I et al.
Intensive Insulin Therapy in the Medical ICU. N Engl J Med 2006; 354(5):449-461.
(8) Van den Berghe G, Wilmer A, Milants I, Wouters PJ, Bouckaert B, Bruyninckx F et al.
Intensive Insulin Therapy in Mixed Medical/Surgical Intensive Care Units. Diabetes
2006; 55(11):3151-3159.
(9) Brunkhorst FM, Engel C, Bloos F, Meier-Hellmann A, Ragaller M, Weiler N et al.
Intensive Insulin Therapy and Pentastarch Resuscitation in Severe Sepsis. N Engl J Med
2008; 358(2):125-139.
(10) Devos P, Preiser JC, Melot C. Impact of tight glucose control by intensive insulin therapy
on ICU mortality and the rate of hypoglycemia: final results of the Glucontrol study.
Intensive Care Medicine 2007; 33: Suppl 2:S189.
(11) Preiser JC, Devos P, Ruiz-Santana S, Melot C, Annane D, Groeneveld J et al. A
prospective randomised multi-centre controlled trial on tight glucose control by intensive
insulin therapy in adult intensive care units: the Glucontrol study . Intensive Care
Medicine 2009; E-pub 28 july.
(12) The NICE-SUGAR Study Investigators. Intensive versus Conventional Glucose Control
in Critically Ill Patients. N Engl J Med 2009; 360(13):1283-1297.
(13) Griesdale DEG, de Souza RJ, van Dam RM, Heyland DK, Cook DJ, Malhotra A et al.
Intensive insulin therapy and mortality among critically ill patients: a meta-analysis
including NICE-SUGAR study data. CMAJ: Canadian Medical Association Journal 2009;
180(8):821-827.
��� �������� ������������������������������������������
191

(14) Rood E, Bosman R, van der Spoel J, Taylor P, Zandstra D. Use of a computerized
guideline for glucose regulation in the Intensive Care Unit improved both guideline
adherence and glucose regulation. Journal of the American Medical Informatics
Association 2005; 12(2):172-180.
(15) Ferreira FL, Bota DP, Bross A, Melot C, Vincent JL. Serial Evaluation of the SOFA Score
to Predict Outcome in Critically Ill Patients. JAMA 2001; 286(14):1754-1758.
(16) Knaus W, Draper E, Wagner D, Zimmerman J. APACHE II: A severity of disease
classification system. Critical Care Medicine 1985; 13(10):818-829.
(17) Kosiborod M, Inzucchi SE, Krumholz HM, Xiao L, Jones PG, Fiske S et al. Glucometrics
in Patients Hospitalized With Acute Myocardial Infarction: Defining the Optimal
Outcomes-Based Measure of Risk. Circulation 2008; 117(8):1018-1027.
(18) Pinto DS, Skolnick AH, Kirtane AJ, Murphy SA, Barron HV, Giugliano RP et al. U-
Shaped Relationship of Blood Glucose With Adverse Outcomes Among Patients With ST-
Segment Elevation Myocardial Infarction. Journal of the American College of Cardiology
2005; 46(1):178-180.
(19) Pinto DS, Kirtane AJ, Pride YB, Murphy SA, Sabatine MS, Cannon CP et al. Association
of Blood Glucose With Angiographic and Clinical Outcomes Among Patients With ST-
Segment Elevation Myocardial Infarction (from the CLARITY-TIMI-28 Study). The
American Journal of Cardiology 2008; 101(3):303-307.
(20) Bagshaw S, Egi M, George C, Bellomo R. Early blood glucose control and mortality in
critically ill patients in Australia. Crit Care Med 2009; 37(2):463-470.
(21) Currie C, Peters J, Tynan A, Evans M, Heine R, Bracco O et al. Survival as a function of
HbA1c in people with type 2 diabetes: a retrospective cohort study. The Lancet 2010;
375:481-489.
(22) Bagshaw S, Bellomo R, Jacka M, Egi M, Hart G, George C et al. The impact of early
hypoglycemia and blood glucose variability on outcome in critical illness. Critical Care
2009; 13(3):R91.
(23) Krinsley JS, Grover A. Severe hypoglycemia in critically ill patients: Risk factors and
outcomes. Critical Care Medicine 2007; 35(10):2262-2267.
(24) Vriesendorp TM, Devries JH, van SS, Moeniralam HS, de JE, Roos YB et al. Evaluation
of short-term consequences of hypoglycemia in an intensive care unit. Crit Care Med
2006; 34(11):2714-2718.
(25) Hoekstra J, Hermanides J, Bosman R, Vriesendorp T, Dotsch R, Rosendaal FR et al.
Hypoglycaemia is related to mortality in the ICU. Diabetologia 2009; 52: Suppl1:S237
(40-PS), Abstract.
(26) Hoedemaekers CWE, Klein Gunnewiek JMT, Prinsen MA, Willems JL, Van der Hoeven
JG. Accuracy of bedside glucose measurement from three glucometers in critically ill
patients. Critical Care Medicine 2008; 36(11).
(27) Karon BS, Gandhi GY, Nuttall GA, Bryant SC, Schaff HV, McMahon MM et al. Accuracy
of Roche Accu-Chek Inform Whole Blood Capillary, Arterial, and Venous Glucose Values
��������
192

1
2
3
4
5
6
7
8
9
10
11
12
13
14
15
in Patients Receiving Intensive Intravenous Insulin Therapy After Cardiac Surgery.
American Journal of Clinical Pathology 2007; 127(6):919-926.
(28) Hermanides J, Vriesendorp T, Bosman R, Zandstra D, Hoekstra J, DeVries J. Glucose
variability predicts mortality in the ICU. Crit Care Med 2010 Mar;38(3):838-42.
(29) Van den Berghe G, Schetz M, Vlasselaers D, Hermans G, Wilmer A, Bouillon R et al.
Intensive insulin therapy in critically ill patients: NICE-SUGAR or Leuven blood glucose
target? J Clin Endocrinol Metab 2009; 94(9):3163-3170.
(30) Van den Berghe G. How to compare adequacy of algorithms to control blood glucose in the
intensive care unit? Critical Care 2004; 8(3):151-152.
(31) Kramer AA, Zimmerman JE. Predicting Outcomes for Cardiac Surgery Patients After
Intensive Care Unit Admission. Seminars in Cardiothoracic and Vascular Anesthesia
2008; 12(3):175-183.
��� �������� ������������������������������������������
193


Summary and future considerations
Samenvatting en toekomstperspectief
List of Publications
Biografie
Co-authors
Dankwoord
J Hermanides


Summary and future considerations
197


1
2
3
4
5
6
7
8
9
10
11
12
13
14
15
What are the consequences of hyperglycaemia, how do we measure it and what
measures do we need to take? These questions were the base of this thesis. In
PART I, the consequences of hyperglycaemia are investigated in relation to the
coagulation system and thromboembolism. We especially focused on the effects of
acute hyperglycaemia resulting from surgery in patients with and without diabetes
mellitus. PART II of the thesis is about the detection and treatment of
hyperglycaemia. The sensor augmented pump therapy as a new detection and
treatment tool is the subject of several chapters. The final chapters concern the
treatment of hyperglycaemia in the Intensive Care Unit (ICU).
PART I
Chapter 2 gives an overview of the current evidence of the role of hyperglycaemia
in activating the coagulation system. Evidence is mounting that both chronic and
acute hyperglycaemia contribute to coagulation activation and hypofibrinolysis,
resulting in a procoagulant state that predisposes patients to thrombotic events.
Intensive glycaemic control in patients with diabetes mellitus reduces the incidence
of thrombotic diseases such as myocardial infarction and stroke. Whether intensive
glucose control during acute hyperglycaemia will be beneficial needs further
investigation in randomised controlled trials.
Chapter 3 confirms the association between hyperglycaemia and coagulation: a
cohort of consecutive patients referred for suspected deep vein thrombosis was
investigated. 188 cases with confirmed venous thromboembolism (VTE) were
compared to 370 controls. Increased glucose levels at presentation in the outpatient
clinic were associated with increased odds ratios for actually having VTE. This is
the first report on this association and now confirmation in other studies is
required.
In CChapter 4 the effect of hip surgery on glucose metabolism and coagulation
activation was studied in 9 patients without diabetes mellitus undergoing elective
hip surgery. Hip surgery clearly induced a rise in glucose levels, which preceded a
proportional rise of factor VIII clotting activity, von Willebrand ristocetin cofactor
activity, von Willebrand factor antigen and prothrombin fragment 1+2. These
results suggests a possible role of hyperglycaemia in activating the coagulation
system.
��������������� ����� ������
199

Chapter 5 supports the suggestion we made in chapter 4: increased glucose levels
after elective hip surgery were predictive of later development of venous
thromboembolism. We performed post-hoc analyses of four previously performed
studies investigating patients undergoing total hip or knee replacement. Our
outcome measures were symptomatic VTE and „total VTE‰ (defined as the
composite of symptomatic VTE, asymptomatic DVT and all cause mortality). We
analysed 12383 patients who underwent elective hip- and knee-surgery.
Postoperative glucose levels measured at day 1 were associated with total VTE in
patients undergoing hip surgery. Also, the increase of glucose levels during hip
surgery was associated with the development of symptomatic and total VTE. This
was not demonstrated in patients undergoing total knee replacement, which is
likely due to the surgical procedure. This indicates that hyperglycaemia develops as
a consequence of hip surgery and contributes to the development of post-surgical
VTE.
In CChapter 6 a different patient group was studied: 330 consecutive patients
undergoing pancreatoduodenectomy. Glucose was measured before-, during-, and
after surgery. In concordance with previous studies, early postoperative
hyperglycaemia was induced by the procedure and appears to be a strong predictor
of postoperative complications.
All of the previous studies show that acute hyperglycaemia occurs even without
known diabetes preticipated by a pathophysiological stressor, such as surgery or
illness. Postoperative hyperglycaemia is associated with VTE after hip surgery and
with complications after pancreatodoudenectomy. Future studies should focus on
preventing the development of perioperative hyperglycaemia and study the effect in
randomised controlled setting. As intensive insulin therapy can be time consuming
and carries the risk of hypoglycaemia, the use other glucose lowering agents should
be considered, such as oral antidiabetics or GLP-1 analogs.
PART II
Chapter 7 provides a view on the current evidence of the clinical application of
subcutaneous glucose sensors (CGM), alone or combined with subcutaneous insulin
pumps. In several studies, CGM lowered HbA1c in adult patients with poorly
controlled type 1 diabetes mellitus, when selecting compliant patients who tolerate
the device. However, as a preventive tool for hypoglycaemia, CGM is not yet
����� ����
200

1
2
3
4
5
6
7
8
9
10
11
12
13
14
15
effective. Increasing reimbursement of CGM is expected in the near future and
studies on cost-effectiveness are awaited.
Chapter 8 describes the EURYTHMICS trial (EURopean trial (Y) To lower HbA1c
by Means of an Insulin pump augmented by a Continuous glucose Sensor). In a
randomised controlled trial in 8 European countries, the efficacy of sensor
augmented pump therapy was investigated in 83 patients with type 1 diabetes
mellitus and HbA1c >= 8.2%. Patients were randomised to either sensor augmented
pump with mealtime bolus advisor for 26 weeks or to the control group using
multiple daily injection therapy. We showed that sensor augmented pump therapy
effectively lowered HbA1c by 1.21% in suboptimally controlled type 1 diabetes
patients. The magnitude of the improvement in glycaemic control suggests an
additive effect of the insulin pump, mealtime insulin dose advisor and CGM.
The use of sensor augmented pump therapy was also studied in CChapter 9.
However, in this randomised controlled pilot trial, we investigated the efficacy of
the therapy in patients with hyperglycaemia (>7.7 mmol/l) admitted to the coronary
care unit (CCU) for acute myocardial infarction. Hyperglycaemia is a known risk
factor for mortality after myocardial infarction, but previous trials were not able to
lower the glucose in this patient group. Therefore we tested the sensor augmented
pump therapy. 20 Patients were randomised to either sensor augmented pump
therapy for 48 hours or standard care. Although effective in normalising glucose
levels, sensor augmented pump therapy was associated with increased
hypoglycaemia and workload for the nursing staff due to false positive alarms.
Improvement of the device is awaited before continuing with large scale trials.
In CChapter 10 a part of the development of sensor augmented pump therapy
towards the artificial pancreas was studied. As two functions, insulin delivery and
glucose sensing, are combined, one would like to physically integrate insulin
delivery and glucose sensing as this would minimise the discomfort for the patient
and increase the usability. Therefore we investigated the hypothesis that high local
insulin concentrations would interfere with sensor readings in 10 type 1 diabetes
patients using microdialyses CGM. We concluded that microdialysis CGM could be
accurately performed at a mean distance of 0.9 cm from an insulin pump system in
the normo- and hyperglycaemic ranges, and probably the hypoglycaemic range,
during rapid rise and fall of blood glucose. This has important consequences for the
development of a closed-loop system or artificial pancreas.
��������������� ����� ������
201

The development of the closed-loop system was further investigated in CChapter 11.
To optimally integrate insulin delivery and glucose sensing, communication via an
algorithm is essential. However, an effective algorithm has proven difficult to
develop. In this pilot study we have investigated the effectiveness of an algorithm
to treat postprandial glucose excursions in a closed-loop format. Indeed, the
algorithm is as effective as standard care, and may even become superior, which we
hope to demonstrate in a subsequent study.
In CChapter 12 hyperglycaemia is approached from a different perspective. Of
course, hyperglycaemia is not a constant phenomenon, but it will vary over time.
This will be even more pronounced when treatment of hyperglycaemia is initiated.
Earlier studies already suggested that this glucose variation may be harmful by
itself. Because variation of glucose is always associated with the mean glucose, it is
difficult to distinguish between these two. In this study, we investigated the
association of glucose variability, using a newly developed measure of glycaemic
variability, and mortality among 5728 patients admitted to the ICU. We found that
high glucose variability was strongly associated with ICU and in-hospital death.
High glucose variability combined with high mean glucose values was associated
with highest ICU mortality. Low glucose variability seemed protective, even when
mean glucose levels were elevated.
Every upside has its downside, as we show in CChapter 13. The downside of treating
patients for hyperglycaemia in the ICU is that you will increase the risk of
hypoglycaemia. Whether or not this is harmful is being debated and therefore we
investigated the association between hypoglycaemia and mortality in the ICU. All
first episodes of hypoglycaemia (glucose <=2.5 mmol/l) were derived from 154015
glucose values in 5961 patients admitted to the ICU. Patients were considered to be
exposed to hypoglycaemia from the event until the end of ICU admittance.
Hypoglycaemia was indeed related to ICU mortality, also when adjusted for a daily
adjudicated measure of disease severity, indicating a causal relationship.
Finally in CChapter 14 we try to put the most important recent evidence of the
NICE-SUGAR and Leuven studies in perspective, thereby including our data from
an ICU population treated according to the most recent guidelines. Mean glucose
during ICU admission turned out to be related to mortality by a U-shaped curve. A
Âsafe rangeÊ of glucose regulation in our population could be defined between 7.0
����� ����
202

1
2
3
4
5
6
7
8
9
10
11
12
13
14
15
and 9.0 mmol/l. The U-shaped curve may help to explain the increased mortality in
the intensively treated group of the NICE-SUGAR study but also the higher
mortality in the conventionally treated groups of the Leuven studies.
So, what should be done in the future? The application of sensor augmented pump
therapy for poorly regulated patients with diabetes mellitus type 1 has been proven
to be effective in lowering HbA1c, but not in preventing hypoglycaemia. However,
no trial so far has been designed for sensor augmented pump therapy with (severe)
hypoglycaemia as the primary outcome measure. Such a trial is expected and
warranted in the near future. The development of the closed-loop or artificial
pancreas is ongoing and future projects will hopefully bring this holy grail a little
bit closer by improving and designing algorithms for the communication between
glucose sensor and insulin pump. The use of sensor augmented pump therapy in a
(acute) clinical setting needs improvement, as shown in chapter 9. It could be a
most useful tool, as continuous glucose measurements, when accurate, should be
able to prevent hypoglycaemia, decrease nursing workload and capture glucose
variability. It should be realised that at a completely different patient group as
compared to patients with type 1 diabetes mellitus. Patients in an ICU or CCU
have other major problems next to their hyperglycaemia, which could influence the
accuracy of the glucose sensors. When writing this thesis, the TOPDOGS study is
being finalised. In this study factors influencing the effectiveness and accuracy of
glucose sensors in the ICU is being investigated in a large cohort and the results
are awaited eagerly. Finally, a pooled analysis of the NICE-SUGAR and Leuven
data is expected to provide treatment guidelines for treating hyperglycaemia,
glucose variability and avoiding hypoglycaemia in the ICU. For now, the avoidance
of hypoglycaemia by targeting for a safe-range seems advisable, considering the U-
shaped mortality curve.
��������������� ����� ������
203


Samenvatting en toekomstperspectief
205

1
2
3
4
5
6
7
8
9
10
11
12
13
14
15
Het onderwerp van dit proefschrift is hyperglykemie: een verhoging van het
glucosegehalte in het bloed. De meest voorkomende oorzaak van hyperglykemie is
de ziekte diabetes mellitus. Sinds de ontdekking van insuline is de
levensverwachting van patiënten met diabetes mellitus enorm gestegen. Het blijft
echter een aandoening waarbij patiënten rekening moeten houden met ernstige
complicaties van de ziekte en een levenslange en hinderlijke behandeling.
Een minder bekende oorzaak van hyperglykemie is fysieke stress. Door
bijvoorbeeld een operatie of een hartinfarct kan een dusdanige acute metabole
ontregeling ontstaan dat het glucose stijgt. Waar men vroeger dacht dat deze
tijdelijke hyperglykemie gunstig zou kunnen zijn voor het herstel, wordt het steeds
duidelijker dat het eigenlijk zeer nadelig is voor de patiënt.
In DEEL I van dit proefschrift worden de gevolgen van hyperglykemie onderzocht,
vooral in relatie tot het stollingssyteem en het optreden van trombose. Daarbij
hebben we ons in het bijzonder gericht op de gevolgen van acute hyperglykemie,
uitgelokt door een operatie. DEEL II van dit proefschrift gaat over het detecteren
en behandelen van hyperglykemie. Tot op heden is het gebruikelijk dat de patiënt
met diabetes een aantal maal per dag met een vingerprik in het bloed de hoogte
van het glucose meet en daarop insuline spuit. Door de technische vooruitgang is
het inmiddels mogelijk om met behulp van sensoren in de buikhuid continu het
suikergehalte te meten en ook continu kleine hoeveelheden insuline middels een
pomp af te geven. De effectiviteit van deze nieuwe behandelingstechniek hebben we
onderzocht bij patiënten met diabetes mellitus en patiënten met hyperglykemie
tijdens een hartinfarct. Tevens wordt geanalyseerd hoe deze nieuwe
behandelingstechniek verder is te verbeteren. In de laatste hoofdstukken komt het
detecteren van hyperglykemie op de Intensive Care (IC) aan bod en de nadelen van
behandeling met insuline in deze situatie.
DEEL I
In HHoofdstuk 2 geeft een overzicht van de huidige literatuur met betrekking tot de
rol van hyperglykemie in het stollingssysteem. Er is overtuigend bewijs dat zowel
chronische als acute hyperglykemie het stollingssyteem activeren en de afbraak
van een stolsel vertragen. Dit leidt tot een verhoogd risico op trombose. Het
behandelen van hyperglykemie bij patiënten met diabetes mellitus blijkt het risico
op trombotische aandoeningen, zoals een hersen- of hartinfarct, te verlagen. Echter,
het effect van de behandeling van acute hyperglykemie is nog niet voldoende
onderzocht in interventie trials.
����������������� ��������������
207

Hoofdstuk 3 bevestigt het verband tussen hyperglykemie en stolling in een groep
patiënten die werd onderzocht op de polikliniek op verdenking van een diep
veneuze trombose in het been. Van deze personen hadden er 188 daadwerkelijk een
trombose in het been. De controlegroep bestond uit 370 mensen die geen trombose
bleken te hebben. Hoe hoger het glucose was bij presentatie op de polikliniek, hoe
groter de kans was dat de patiënt inderdaad een trombosebeen had. Dit is de eerste
keer dat de relatie tussen een trombosebeen en oplopend glucose is aangetoond en
vervolgstudies zijn nodig ter bevestiging.
Het gevolgen van een heupoperatie voor het glucose metabolisme en de
stollingsactivatie werden bestudeerd in HHoofdstuk 4. In een groep van 9 patiënten
zonder diabetes mellitus werd het glucose bepaald voor, tijdens en na de operatie.
Bovendien werden op dezelfde tijdstippen de stollingsfactoren factor VIII, von
Willibrand ristocetine cofactor activiteit, von Willibrand factor antigeen en
prothrombine fragment 1+2 bepaald. Door de heupoperatie steeg het
plasmaglucose, wat werd gevolgd door een vergelijkbare stijging van de
stollingsfactoren. Deze resultaten suggereren een mogelijke rol voor glucose bij het
activeren van het stollingssysteem.
Hoofdstuk 5 bevestigt de suggestie die we hebben gedaan in hoofdstuk 4: verhoogde
glucosewaarden na een heupoperatie voorspellen de latere ontwikkeling van
veneuze trombose. Dit bleek uit een post-hoc analyse van 4 grote studies die waren
uitgevoerd bij 12383 patiënten die electieve heup- of knieoperaties ondergingen. De
belangrijkste uitkomstmaat was symptomatische veneuze trombose en „totale
veneuze trombose‰ (gecombineerde uitkomstmaat van symptomatische en
asymptomatische trombose met overlijden door welke oorzaak dan ook). Op dag één
na de operatie bleken de gemiddelde glucosewaarden in de patiëntengroepen
gestegen in vergelijking met preoperatieve waarden. Bij patiënten die een
heupoperatie ondergingen was deze verhoging geassocieerd met een verhoogd risico
op het ontwikkelen van symptomatische en „totale veneuze trombose‰. Dit werd
niet aangetoond bij patiënten die een knieoperatie ondergingen, wat mogelijk
verklaard wordt door het verschil in de chirurgische procedure. Deze resultaten
geven aan dat hyperglykemie kan ontstaan als gevolg van orthopedische chirurgie
en bij heupoperaties ook bijdraagt aan de ontwikkeling van postoperatieve veneuze
trombose.
����������
208

1
2
3
4
5
6
7
8
9
10
11
12
13
14
15
In HHoofdstuk 6 werd een andere patiëntengroep bestudeerd: bij 330 patiënten die
een pancreatoduodenectomie ondergingen werd het glucose gemeten voor, tijdens
en na de operatie. Ten gevolge van de operatie ontstond hyperglykemie en deze
bleek een sterke voorspeller voor postoperatieve complicaties.
Uit al deze studies komt naar voren dat acute hyperglykemie kan worden
veroorzaakt door pathofysiologische stress, zoals een operatie, ook zonder dat de
patiënt diabetes mellitus heeft. Postoperatieve hyperglykemie blijkt geassocieerd
met veneuze trombose na heupoperaties en met complicaties na een
pancreatoduodenectomie. De logische volgende stap lijkt de preventie te zijn van
perioperatieve hyperglykemie en het effect daarvan bestuderen in gerandomiseerde
studies. Omdat de toepassing van intensieve insuline therapie peroperatief
tijdrovend is en gepaard gaat met een verhoogd risico op hypoglykemie, kan ook
gebruik van andere glucoseverlagende medicatie dan insuline worden overwogen.
Te denken valt aan bepaalde orale medicatie en GLP-1 analoga.
DEEL II
Hoofdstuk 7 wordt de huidige stand van zaken met betrekking tot de continue
subcutane glucose sensoren, al dan niet in combinatie met de insulinepomp
besproken. Uit meerdere studies blijkt inmiddels dat met behulp van continue
glucose sensoren het HbA1c verlaagd kan worden bij volwassen, slecht gereguleerde
maar gemotiveerde patiënten met type 1 diabetes, mits zij het apparaat verdragen.
Het nut van het gebruik van sensoren ter preventie van hypoglykemie is nog niet
bewezen. Hoewel een analyse van de kosteneffectiviteit nog moet worden
uitgevoerd, is de verwachting dat sensoren in toenemende mate zullen worden
vergoed door verzekeraars.
In Hoofdstuk 8 worden de resultaten van de EURYTHMICS trial (EURopean (Y)
trial To lower HbA1c by Means of an Insulin pump augmented by a Continuous
glucose Sensor) gepresenteerd. De effectiviteit van behandeling van type 1 diabetes
met een combinatie van glucose sensor en insulinepomp werd onderzocht in een
gerandomiseerde studie in 8 Europese landen bij 83 patiënten met een HbA1c van
8.2% of hoger. De patiënten werden gerandomiseerd naar 26 weken behandeling
met sensor gecombineerd met pomp voorzien van een maaltijd bolus-calculator of
naar continueren van de behandeling met meerdaagse insuline injecties. We
toonden aan dat therapie met sensor en pomp het HbA1c verlaagt met 1.21%. Deze
����������������� ��������������
209

mate van HbA1c verlaging suggereert een gecombineerd effect van de glucose
sensor, de insulinepomp en de bolus-calculator.
Ook in HHoofdstuk 9 werd pomp therapie in combinatie met glucose sensor
onderzocht in een gerandomiseerde studie. Echter, nu werden 20 patiënten die
werden opgenomen op de hartbewaking met een acuut hartinfarct en een verhoogd
glucose (>7.7 mmol/l) gerandomiseerd naar behandeling met sensor gecombineerde
pomptherapie of conventionele behandeling gedurende 48 uur. Eerdere
onderzoeken slaagden er niet in om glucose effectief te verlagen in deze
patiëntengroep, terwijl hyperglykemie een bekende risicofactor voor overlijden is.
Met therapie met sensor en pomp bleek het inderdaad wel mogelijk om het glucose
te verlagen, echter dit ging gepaard met een toename van hypoglykemie en
werkdruk voor het verpleegkundig personeel. Voordat grotere gerandomiseerde
studies worden opgezet, lijken verbeteringen aan de apparatuur gewenst.
Het verder integreren van de glucose sensor en de insulinepomp is onderzocht in
Hoofdstuk 10. Dit moet uiteindelijk leiden tot de ontwikkeling van een kunstmatige
pancreas. In dit hoofdstuk is onderzocht of het mogelijk is insuline afgifte en
glucosemetingen op dezelfde plaats in het buikvet te verrichten. Dit zou de weg
vrijmaken naar de ontwikkeling van één naald waardmee beide functies kunnen
worden uitgevoerd, wat het ongemak voor de patiënt belangrijk zou verminderen.
Bij 10 patiënten met type 1 diabetes onderzochten we de invloed van hoge
concentraties insuline zo dicht mogelijk bij een continue microdialyse glucose
sensor. Het bleek dat de sensor nauwkeurig blijft meten op een gemiddelde afstand
van 0.9 cm vanaf de injectieplaats ven de insulinepomp. Zowel bij hoge als normale
glucosewaarden bleven de metingen nauwkeurig en dit leek ook het geval in het
hypoglykeme gebied. Ook tijdens het snel stijgen en dalen van glucose waren de
metingen van de sensor niet minder nauwkeurig. Deze resultaten hebben
belangrijke consequenties voor het verder ontwikkelen van de kunstmatige
pancreas.
Ook Hoofdstuk 11 heeft betrekking op de ontwikkeling van een kunstmatige
pancreas. Om insuline afgifte te laten plaatsvinden op basis van gemeten continue
sensor waarden is communicatie tussen deze twee functies via een algoritme
essentieel. De ontwikkeling van een dergelijk algoritme is een uitdaging gebleken.
In dit onderzoek is de effectiviteit van een algoritme om postprandiale glucose
excursies te behandelen onderzocht in een gesloten systeem, dus zonder interventie
����������
210

1
2
3
4
5
6
7
8
9
10
11
12
13
14
15
van de arts of patiënt. Het algoritme bleek even effectief als de standaard
behandeling, wellicht zelfs iets beter, en een vervolgstudie is inmiddels gaande.
In HHoofdstuk 12 bekijken we hyperglykemie vanuit een andere invalshoek.
Hyperglykemie is geen constant fenomeen, maar de glucosewaarden zullen
variëren over de tijd. Ook behandeling van hyperglykemie heeft invloed op de
variabiliteit van glucose. Uit eerder onderzoek is gebleken dat deze glucose variatie
op zichzelf ook schadelijk kan zijn. Omdat de mate van variatie samenhangt met
het gemiddelde bloedglucose is het lastig om de gevolgen van beide fenomenen
apart te onderzoeken. In dit hoofdstuk hebben we daarom een nieuwe maat voor
glucose variabiliteit ontwikkeld. Bij 5728 patiënten is onderzocht wat de associatie
is tussen glucose variabiliteit en mortaliteit op de IC. Een verhoogde glucose
variabiliteit bleek duidelijk geassocieerd met een toename van het aantal patiënten
dat overleed. De combinatie van een hoog gemiddeld glucose tijdens opname en
hoge variabiliteit bracht het hoogste sterftecijfer met zich mee. Een lage glucose
variabiliteit leek echter te beschermen tegen overlijden.
Elke behandeling is geassocieerd met bijwerkingen, zoals is te lezen in HHoofdstuk
13. De standaard behandeling van hyperglykemie op de IC is insulinetherapie,
waarmee het risico op hypoglykemie toeneemt. In de huidige literatuur bestaat
verschil van mening over de vraag of deze hypoglykemie schadelijk is. Daarom
onderzochten wij de relatie tussen hypoglykemie op de IC en overlijden. Alle eerste
episodes van een glucose <= 2.5 mmol/l werden onderzocht in een groep van 5961
IC patiënten. Patiënten werden beschouwd als zijnde blootgesteld aan
hypoglykemie vanaf het moment van de episode tot aan het einde van de IC
opname. Er bleek inderdaad een duidelijke relatie te bestaan tussen hypoglykemie
en sterfte op de IC, ook na correctie voor ernst van ziekte van de patiënt. Dit
suggereert een causaal verband.
Tot slot hebben we in HHoofdstuk 14 geprobeerd de twee belangrijkste IC trials
(NICE-SUGAR en Leuven) naar de effectiviteit van insuline therapie op de IC in
perspectief te plaatsen met behulp van de data uit een IC populatie. Het
gemiddelde glucose tijdens IC opnames blijkt zich te verhouden tot sterfte op de IC
via een U-curve. De laagste sterfte, ofwel het veilige gebied, bevindt zich in de
bestudeerde populatie tussen de 7.0 en de 9.0 mmol/l. Deze U-curve kan wellicht de
interpretatie van zowel het hoge sterftecijfer in de intensief behandelde groep van
����������������� ��������������
211

de NICE-SUGAR studie, alsook de hogere sterfte in de conventioneel behandelde
groepen van de Leuven studies vergemakkelijken.
Wat kunnen we nu in de nabije toekomst verwachten aan verdere ontwikkelingen
en studies? De toepassing van pomptherapie gecombineerde met sensor bij slecht
gereguleerd patiënten met type 1 diabetes is bewezen effectief ter verlaging van het
HbA1c, maar niet bij het voorkomen van hypoglykemie. Er zijn echter nog geen
gerandomiseerde studies gepubliceerd waarin het voorkomen van hypoglykemie bij
het gebruik van glucose sensoren specifiek is onderzocht. Het is belangrijk dat een
dergelijke studie gaat worden uitgevoerd.
De ontwikkeling van de kunstmatige pancreas is nu volop gaande en vooral de
verbeterde algoritmes om de glucose sensor en insulinepomp met elkaar te laten
communiceren zijn veelbelovend. Bij het gebruik van de glucose sensor
gecombineerd met insulinepomp in de acute klinische setting is, zoals wij hebben
laten zien, nog veel ruimte voor verbetering. Het is in potentie een nuttig apparaat
aangezien de continue glucose metingen, indien voldoende nauwkeurig
geregistreerd, hypoglykemie en glucose variabiliteit kunnen helpen voorkomen met
daarbij een vermindering van de werkdruk van het verpleegkundig personeel. Men
moet zich echter wel realiseren dat het hier gaat om een totaal andere
patiëntengroep dan de patiëntengroep met type 1 diabetes. Patiënten op de
hartbewaking en de IC hebben naast hun hyperglykemie andere pathologie, die
direct de werking van de glucosesensoren kan beïnvloeden. Terwijl dit proefschrift
wordt geschreven, wordt ook de laatste hand gelegd aan een studie waarin een
aantal bijkomende factoren op de IC worden onderzocht, die de nauwkeurigheid en
effectiviteit van glucose sensoren zouden kunnen beïnvloeden, zoals verminderde
weefselpersfusie en temperatuurschommelingen (de TOPDOGS studie). Tenslotte
wordt een gezamenlijke analyse verwacht van de NICE-SUGAR en Leuven data,
Deze analyse kan vermoedelijk leiden tot het vaststellen van definitieve richtlijnen
voor de behandeling van hyperglykemie en de preventie van hypoglykemie en
glucose variabiliteit. Op dit moment lijkt het, gezien de U-vormige sterfte curve,
verstandig om hypoglykemie in ieder geval te vermijden en dus een veilige glucose
range aan te houden bij patiënten op de IC.
����������
212

List of Publications
213


1
2
3
4
5
6
7
8
9
10
11
12
13
14
15
Hermanides J, Bosman RJ, Vriesendorp TM, Dotsch R, Rosendaal FR, Zandstra DF; Hoekstra JBL, DeVries JH. Hypoglycemia is associated with ICU mortality. Critical Care Medicine 2010 In Press Hermanides J¹, Engström AE², Wentholt IME¹, Sjauw KD², Hoekstra JBL¹, Henriques JPS², DeVries JH. Sensor augmented insulin pump therapy to treat hyperglycemia at the coronary care unit; a randomized clinical pilot trial. Diabetes Technoly & Therapeutics. 2010 In Press Hermanides J, Devries JH. Sense and nonsense in sensors. Diabetologia. 2010 Apr;53:593-596. Hermanides J, Vriesendorp TM, Bosman RJ, Zandstra DF, Hoekstra JBL, Devries JH. Glucose variability is associated with intensive care unit mortality. Critical Care Medicine. 2010 Mar;38(3):838-42. Hermanides J, Huijgen R, Henny CP, Mohammad NH, Hoekstra JBL, Levi MM, DeVries JH. Hip surgery sequentially induces stress hyperglycaemia and activates coagulation. The Netherlands Journal of Medicine. 2009 Jun;67(6):226-9. Hermanides J, Hoekstra JBL. Oral glucose tolerance test. Not useful in screening of type 2 diabetes. Nederlands Tijdschrift voor Geneeskunde. 2009 Apr 18;153(16):743. Hermanides J, Cohn DM, Devries JH, Kamphuisen PW, Huijgen R, Meijers JC, Hoekstra JBL, Büller HR. Venous thrombosis is associated with hyperglycemia at diagnosis: a case-control study. Journal of Thrombosis and Haemostasis. 2009 Jun;7(6):945-9. Verhagen DW, Hermanides J, Korevaar JC, Bossuyt PM, van den Brink RB, Speelman P, van der Meer JT. Health-related quality of life and posttraumatic stress disorder among survivors of left-sided native valve endocarditis. Clinical Infectiuos Diseases. 2009 Jun 1;48(11):1559-65. Hermanides J, Belqhazi L, Michels RP, Hoekstra JBL. Lower incidence of type 2 diabetes mellitus with changes in lifestyle: clues from World War II. Nederlands Tijdschrift voor Geneeskunde. 2008 Nov 1;152(44):2415-7. Hermanides J, Wentholt IME, Hart AA, Hoekstra JBL, DeVries JH. No apparent local effect of insulin on microdialysis continuous glucose- monitoring measurements. Diabetes Care. 2008 Jun;31(6):1120-2. Verhagen DW, Hermanides J, Korevaar JC, Bossuyt PM, van den Brink RB, Speelman P, van der Meer JT. Prognostic value of serial C-reactive protein measurements in left-sided native valve endocarditis. Archives of Internal Medicine. 2008 Feb 11;168(3):302-7. Verhagen DW, Hermanides J, Korevaar JC, Bossuyt PM, van den Brink RB, Speelman P, van der Meer JT. Extension of antimicrobial treatment in patients with left-sided native valve endocarditis based on elevated C-reactive protein values. European Journal of Clinical Microbioly & Infectious Diseases. 2007 Aug;26(8):587-90.
����������� ������
215


Biografie
217


1
2
3
4
5
6
7
8
9
10
11
12
13
14
15
Op 11 januari 1981 kwam Jeroen ter aarde. Aan het feit dat dit in het VUmc moest
gebeuren, kon hij niet zo veel doen. Als oudste van drie broers doorliep hij vlijtig de
Wilhelmina School, waar hij zijn basisonderwijs genoot. Tijdens zijn middelbare
schooltijd op het Hermann Wesselink College ontwikkelde hij zijn kunstzinnige
talenten in de muziek en op het toneel. Met halflang haar stal hij regelmatig de
show met vingervlugge gitaarsolo's en in de rol van Lysander in Shakespeare's 'Een
Midzomernachtsdroom' bewees hij zijn dramaturgisch talent. In 1999 behaalde hij
zijn gymnasiumdiploma, om direct door te stomen naar de Universiteit van
Amsterdam voor zijn opleiding geneeskunde. Het duurde niet lang voordat Jeroen
zijn ouderlijk huis verruilde voor een studentenkamer in de Amsterdamse Pijp.
Alhier verwierf hij faam met zijn koffie met een vleugje kaneel. Dit brouwsel hielp
hem zijn studie geneeskunde vlot te doorlopen, in combinatie met een muzikale
carrière in de bands Dunk en Ruis en een sportcarrière bij hockeyclub AMVJ. Na
een wetenschappelijke stage in Ethiopië ging Jeroen wetenschappelijk onderzoek
doen bij prof. dr. P. Speelman. Van het één kwam het ander, en uiteindelijk wist hij
na zijn co-schappen een promotieplaats te verkrijgen bij prof. dr. J.B.L. Hoekstra.
Tijdens zijn promotietijd werd hij gegrepen door de kunst van de pijnbestrijding, en
in april 2010 is hij begonnen met de opleiding tot anesthesioloog in het AMC onder
leiding van dr. C. Keijzer.
De Paranimfen
Bas van Geldere en Wietse Eshuis
��������
219


Co-authors
221


1
2
3
4
5
6
7
8
9
10
11
12
13
14
15
� Anders Frid (MD, PhD), Division of Diabetes and Endocrinology, Malmö University
Hospital, Malmö, Sweden � Annemarie E Engström (MD), Department of Cardiology, Academic Medical Centre,
Amsterdam
� Anthonie W Lensing (MD, PhD), Bayer HealthCare AG, Wuppertal, Germany
� Arianne C van Bon (MD), Department of Internal Medicine, Academic Medical Centre,
Amsterdam
� Augustinus AM Hart (PhD)
� Bregtje A Lemkes (MD), Department of Internal Medicine, Academic Medical Centre,
Amsterdam
� C Pieter Henny (MD, PhD), Department of Anaesthesiology, Academic Medical Centre,
Amsterdam
� Catherine Fermon (MD, PhD), Centre dÊéducation pour le traitement de diabète et des
maladies de la nutrition, Centre Hospitalier de Roubaix, Roubaix, France
� Chantal Mathieu (MD, PhD), Department of Endocrinology, Catholic University Leuven,
Leuven, Belgium,
� Colin M Dayan (MD, PhD), Department of Medicine, University of Bristol, Bristol, United
Kingdom
� Daniela Bruttomesso (MD, PhD), Department of Clinical and Experimental Medicine,
Division of Metabolic Diseases, University of Padova, Padova, Italy
� Danny M Cohn (MD, PhD), Department of Vascular Medicine, Academic Medical Centre,
Amsterdam
� Dirk J Gouma (MD, PhD), Department of Surgery, Academic Medical Centre,
Amsterdam
� Durk F Zandstra (MD, PhD), Department of Intensive Care Medicine, Onze Lieve
Vrouwe Gasthuis, Amsterdam
� Frits Holleman (MD, PhD), Department of Internal Medicine, Academic Medical Centre,
Amsterdam
� Frits R Rosendaal (MD, PhD), Department of Clinical Epidemiology, the Netherlands,
Leiden University Medical Center, Leiden
� Gan van Samkar (MD), Department of Anaesthesiology, Academic Medical Centre,
Amsterdam
� Harry R Büller (MD, PhD), Department of Vascular Medicine, Academic Medical Centre,
Amsterdam
� Heleen M Oudemans- van Straaten (MD, PhD), Department of Intensive Care Medicine,
Onze Lieve Vrouwe Gasthuis, Amsterdam
� Iris ME Wentholt (MD, PhD), Department of Internal Medicine, Academic Medical
Centre, Amsterdam
� J Hans DeVries (MD, PhD), Department of Internal Medicine, Academic Medical Centre,
Amsterdam
� Jan W van Dalen, Department of Internal Medicine, Academic Medical Centre,
Amsterdam
� Joost BL Hoekstra (MD, PhD), Department of Internal Medicine, Academic Medical
Centre, Amsterdam
��������
223

� Joost CM Meijers (PhD), Department of Vascular Medicine, Academic Medical Centre,
Amsterdam
� Jose PS Henriques (MD, PhD), Department of Cardiology, Academic Medical Centre,
Amsterdam
� Kirsten NŒrgaard (MD, PhD), Department of Endocrinology, Hvidovre University
Hospital, Hvidovre, Denmark
� Krishan D Sjauw (MD), Department of Cardiology, Academic Medical Centre,
Amsterdam
� Marcel M Levi (MD, PhD), Department of Vascular Medicine, Academic Medical Centre,
Amsterdam
� Martin Homering (PhD), Bayer HealthCare AG, Wuppertal, Germany
� Nadja Haj Mohammad (MD, PhD), Department of Internal Medicine, Academic Medical
Centre, Amsterdam
� Olivier RC Busch (MD, PhD), Department of Surgery, Academic Medical Centre,
Amsterdam
� Peter Diem (MD, PhD), Division of Endocrinology, Diabetes and Clinical Nutrition,
University Hospital and University of Bern, Bern, Switzerland
� Peter HJ van der Voort (MD, PhD), Department of Intensive Care Medicine, Onze Lieve
Vrouwe Gasthuis, Amsterdam
� Pieter W Kamphuisen (MD, PhD), Department of Vascular Medicine, Academic Medical
Centre, Amsterdam
� Robert J Bosman (MD, PhD), Department of Intensive Care Medicine, Onze Lieve
Vrouwe Gasthuis, Amsterdam
� Robin Koops, Inreda Diabetic BV, Goor
� Roeland Huijgen (MD), Department of Vascular Medicine, Academic Medical Centre,
Amsterdam
� Ron Dotsch (MSc), Behavioural Science Institute, Department of Social and Cultural
Psychology, Radboud University Nijmegen
� Sarah E Siegelaar (MD), Department of Internal Medicine, Academic Medical Centre,
Amsterdam
� Silvia Kuhls (PhD), Bayer HealthCare AG, Wuppertal, Germany
� Thomas M van Gulik (MD, PhD), Department of Surgery, Academic Medical Centre,
Amsterdam
� Titia M Vriesendorp (MD, PhD), Department of Internal Medicine, Academic Medical
Centre, Amsterdam
� Wietse J Eshuis (MD), Department of Surgery, Academic Medical Centre, Amsterdam
������ ��
224

Dankwoord
225


1
2
3
4
5
6
7
8
9
10
11
12
13
14
15
Allereerst een woord van dank voor alle deelnemers aan de verschillende studies. Mijn promotor, prof.dr. J.B.L. Hoekstra. Beste Joost, enorm veel dank voor je enthousiaste, motiverende en sportieve begeleiding. In de loop van mijn promotietraject ben ik er steeds meer achter gekomen dat het helemaal niet zo vanzelfsprekend is dat een promotor zo betrokken is bij zijn (explosief groeiend aantal) promovendi als jij. Je stimuleert nieuwe initiatieven en ideeën, waardoor onderzoek doen veel interessanter wordt dan domweg „tellen‰. Bovendien heeft onder jouw supervisie (en soms lichte dwang) ook mijn hardloopcarrière een enorme vlucht genomen. Ondanks mijn afscheid van de interne verschijn ik nog graag aan de start van de volgende triatlon. Mijn co-promotor, dr. J.H. De Vries. Beste Hans, je hebt me de afgelopen jaren verlicht; figuurlijk met je enorme hoeveelheid parate kennis, maar ook letterlijk, want het enige daglicht waaraan ik op een reguliere werkdag werd blootgesteld, kwam via jouw raam binnen in mijn „aquariumÊ als je deur open stond. Gelukkig was dat zeer regelmatig, want je was bijna altijd bereikbaar voor een vraag, overleg of discussie. Ik heb ontzettend veel van je geleerd en dank je hartelijk voor je uitstekende en prettige begeleiding. Ik hoop dat deze samenwerking nog niet ten einde is. Prof.dr. Büller, prof.dr. Rosendaal, prof.dr. Schlack en prof.dr. Zandstra wil ik hartelijk danken voor het kritisch beoordelen van mijn proefschrift en hun bereidheid om zitting te nemen in de commissie. Dear Professor Pickup, I am very honoured that you are willing to come to Amsterdam and serve on my doctorate committee. Prof.dr. Peter Speelman en „baas‰ dr. Dominique Verhagen, dank voor de mogelijkheid om de eerste wetenschappelijke stappen te zetten. Mijn collegae van de diabetes groep: Bregtje, Sanne, Sarah, Anne, Arianne, Aline, Max, Iris, Titia en Frits, het was een mooie tijd, bedankt voor de gezelligheid en samenwerking! Het jonge aanstormende talent: Airin, Josefine, Wanda, Yoeri, Lonneke en Temo. De groep groeit en dat is goed. Ook dank aan de gang- en koffiegenoten van F4-Noord: Els, Anouk, Miriam en Maaike. En natuurlijk de diabetesverpleegkundigen: Peggy en Dorien, jullie hulp bij de Eurythmics trial was zeer welkom! Ook dank aan Hester, Ineke en Monique. Wendelien, Jan-Willem en Juliette, bedankt voor jullie inzet als student. Er was ook interdisciplinaire samenwerking, zoals de „Glucothrombotic Society‰: Danny, PW, Roeland en professor Joost Meijers. Maar ook dank aan de afdelingen cardiologie (Krischan en Annemarie), chirurgie en anesthesiologie van het AMC. De intensive care van het Onze Lieve Vrouwe Gasthuis (dr. Rob Bosman en professor Durk Zandstra). En natuurlijk de psychologische ondersteuning vanuit Nijmegen: Ron, wat mooi dat onze namen in hetzelfde rijtje boven een artikel staan, de meest „holistische‰ benadering van hypoglykemie op de IC ooit. Maarten, dank voor alle glucose gedachtewisselingen en obese mails, daar moet toch ooit een studie uit voortkomen!
��������
227

Mijn paranimfen en vrienden, Bas en Wietse. Het is goed te weten dat jullie er zijn, mocht het fysiek of verbaal uit de hand lopen tijdens de verdediging. Bas, wederom brothers in arms! Wietse, „De pancreas zorgt ervoor dat je met de mensen in je omgeving kunt omgaan�.‰ (www.kruidenvrouwtje.nl), dat geldt zeker voor ons! Vrienden: muziek, sport of gewoon naar de kroeg hebben helemaal niets met werk te maken en daarom zijn jullie zo belangrijk. Lieve opaÊs en omaÊs, wat fantastisch dat jullie er bij zijn en ik weet zeker dat oma Jannie dit heel mooi had gevonden. Jullie zijn de meest hippe grootouders ooit. Mijn BroÊs: Stephan en Michel, wat goed dat we met zÊn 3en zijn. Laten we vooral de „mannen‰-avonden in stand houden, ook al zijn er soms wat kilometers te overbruggen. Lieve Pa en Ma, zonder een berucht bord havermoutpap was ik er niet geweest, laat staan dat deze promotie dan had plaatsgevonden. Altijd kan ik onvoorwaardelijk op jullie rekenen. Ik ben trots op zulke lieve ouders. Tot slot, waar onderzoek al niet toe kan leiden: lief Caatje, je bent de mooiste, belangrijkste en vrolijkste ontdekking van mijn promotie! En nu een feest.
��� �����
228


