Embed Size (px)
Citation preview

Title: Sensor Network Configuration Effect on Detection Sensitivity of an Acousto-Ultrasound-based Active SHM System Authors: Vishnuvardhan Janapati
Fotis Kopsaftopoulos Surajit Roy Ingolf Mueller
Sang Jun Lee Purim Ladpli
Fu-Kuo Chang
ABSTRACT
An investigation was performed to assess the sensitivity of an acousto-ultrasound SHM system to changes in the configuration of the sensor network for the detection of fatigue cracks. Two different sensor networks were selected for the study on a riveted aluminum plate subjected to cyclic loads. The detection sensitivity of the system was quantified by the probability of detection (POD) approach that is used in traditional NDE but in this case modified for active SHM systems. The objective of the present work is to propose a POD analysis framework for reliable quantification of SHM systems. The proposed framework takes into account environmental and operating uncertainties, including varying temperature and loading conditions. The main concept is outlined and its operational applicability is addressed for hotspot damage detection monitoring. The issues of proper data collection, both experimental and model-based using numerical models, are discussed, while a model-based temperature compensation method is employed to treat the environmental uncertainties. In addition, the active sensing diagnostics based on ultrasonic guided waves and signal processing techniques are presented. Finally, the overview of the statistical POD analysis methodology is outlined and discussed.
The effectiveness of the proposed framework is experimentally assessed via its application to an aluminum coupon, with two distinct sensor network configurations attached, under varying temperatures and loading conditions. The POD results with respect to increasing crack length are extracted and the SHM system’s reliability for damage quantification for both configurations are compared and discussed.
_____________
Vishnuvardhan Janapati1) / Fotis Kopsaftopoulos2) / Surajit Roy2) / Ingolf Mueller2)/ Sang Jun Lee1) / Purim Ladpli 2) / Fu-Kuo Chang2) | 1) Acellent Technologies Inc., 835 Stewart Drive, Sunnyvale, CA 94085, USA; 2) Structures and Composites Laboratory, Department of Aeronautics and Astronautics, Stanford University, Durand Building, 496 Lomita Mall, Stanford, CA 94305, USA.
INTRODUCTION
SHM systems utilize distributed, permanently installed sensing networks at certain structural regions and apply diagnostic algorithms to gain meaningful health information from the sensing data. This data is subject to various sources of uncertainty associated with all aspects of the inspection environment and operating conditions. In contrast to traditional NDE procedures, where the factors due to operator pose the dominant uncertainty, SHM-based technology is mainly challenged by in-situ effects, such as changing environments (temperature, loads, humidity, and wind), operating conditions (ambient loading conditions, operational speed and mass loading), variation in coupling, aging, measurement noise etc., as well as the sensing network layout itself. Usually, the uncertainties due to environmental effects have the largest impact on the system performance [1-2]. An SHM system needs to be robust (insensitive) to uncertainties but sensitive enough to detect the required minimum damage even when the sensor data is affected by these uncertainties. More specifically, the sensor layout in an SHM system significantly affects the sensitivity to damage detection. Although, this is an extremely important issue, only a limited number of studies exist to demonstrate such an effect in the literature.
Typically, the capability of an SHM system can be characterized into four levels: a) Level I: Detection of an occurrence of an event exceeding a threshold, b) Level II: Identification of the location of the event if not known prior to
inspection, c) Level III: Determination of the magnitude or extent of the event such as
impact force or crack size, and d) Level IV: Estimation of the influence of the event on the structure such as
residual stiffness and strength. At a minimum, an SHM system must be able to detect the occurrence of an event
exceeding a prescribed threshold. The outputs depend upon the sensor types, the number of sensors and their positions on the structure, as well as the software/algorithms used in the SHM system. Therefore, the SHM system outputs must be evaluated at these levels in terms of the sensitivity, accuracy, and reliability required for various intended functions. The validation activities should include the evaluation of sufficient quantitative measures to cover these attributes. Further details can be found in [1].
Performance quantification of an SHM system [1-4] at its Level I is of utmost importance for the evaluation of its sensitivity regarding event detection. In order to quantify such an event, the POD analysis is a potential approach and has been adopted for an investigation in this study. Therefore, this work will solely focus on the performance quantification of an SHM system at Level I for two different sensor network configurations. In general, POD=POD(a) curves relate the size a of a damage (such as cracks, delamination) to its probability of detection under the specified conditions and procedures [5-6].
For SHM systems, a similar interpretation of POD analysis is not readily apparent since there is no human factor involved as in traditional NDE. Therefore, the transfer of the traditional POD concept to SHM systems implies a different interpretation. A meaningful SHM POD analysis must incorporate uncertainties from all relevant sources of in-situ conditions as mentioned above.
The main goal of this work is to systematically study the effect of the sensor network layout to the sensitivity of an active sensing SHM system to detect damage (Level I). For this purpose, a “global” network POD framework applicable to SHM systems for both hotspot (damage location is known a priori) and large area (damage location is unknown) monitoring is introduced and evaluated using an experimental application whose main elements remain valid for both above cases. However, the experimental application presented herein focuses primarily on the case of hotspot monitoring.
In order to capture the typical SHM-inherent effects, in-situ uncertainties in terms of varying temperature and loads are applied to the experimental setup. Therefore, the system’s performance is investigated for two different configurations of sensing networks using experimental data under varying environmental (temperature) and operating (loads) conditions with respect to increasing damage (crack length). For this purpose, along with the experimental data, model-based temperature data are also generated, while the diagnostic algorithms are extended to include appropriate compensation strategies in order to mitigate the corrupting effects of the ambient conditions. PROBLEM STATEMENT
An acousto-ultrasonic SHM system for hotspot monitoring is considered with
two different sensor network configurations. The system sensitivity is defined and assessed for two configurations with respect to the SHM system’s capability to detect cracks (Level I) of increasing size a and under a broad variety of load and temperature conditions. THE POD FRAMEWORK FOR ACTIVE SHM SYSTEMS
POD analyses for traditional NDE and SHM systems have several fundamental differences [1-4], with one of the major differences being the source of uncertainty. Human dependent operator conditions constitute the most significant source of uncertainty for traditional NDE inspection systems, whereas varying environmental and operating conditions constitute the major sources of uncertainty in SHM systems. In order to estimate the POD for a traditional NDE inspection system, several calibration samples (identical to actual sample under test) with different damage sizes are manufactured and tested by several operators. On the other hand, the POD for SHM systems is estimated based on one structure with its attached or embedded sensor network configuration, as it is impractical or in some cases even impossible to have many identical structures just for testing purposes. More specifically, the POD in SHM systems is often referred to as a network POD, since it explicitly depends on the employed sensor network, the data acquisition hardware, and the diagnostic algorithm used for damage detection. A modification to any of these subsystems necessitates the conduction of an updated network POD analysis. A major challenge in network POD estimation is the number of coupons (only one) available for testing. In addition, the larger the number of data available for each damage size the higher will be the accuracy of the POD analysis. The final question that is raised is “how to quantify the damage detection reliability of a SHM system with the existing POD formulation?”
In this work, Acellent Technologies Inc. in collaboration with the Structures and Composites Laboratory (SACL) at Stanford University systematically investigate the effect of sensor layout on the sensitivity of an active sensing SHM system with respect to damage detection. For this reason, a network POD framework is introduced. A preliminary evaluation and assessment of the framework for an SHM system with two different sensor network configurations is investigated and discussed.
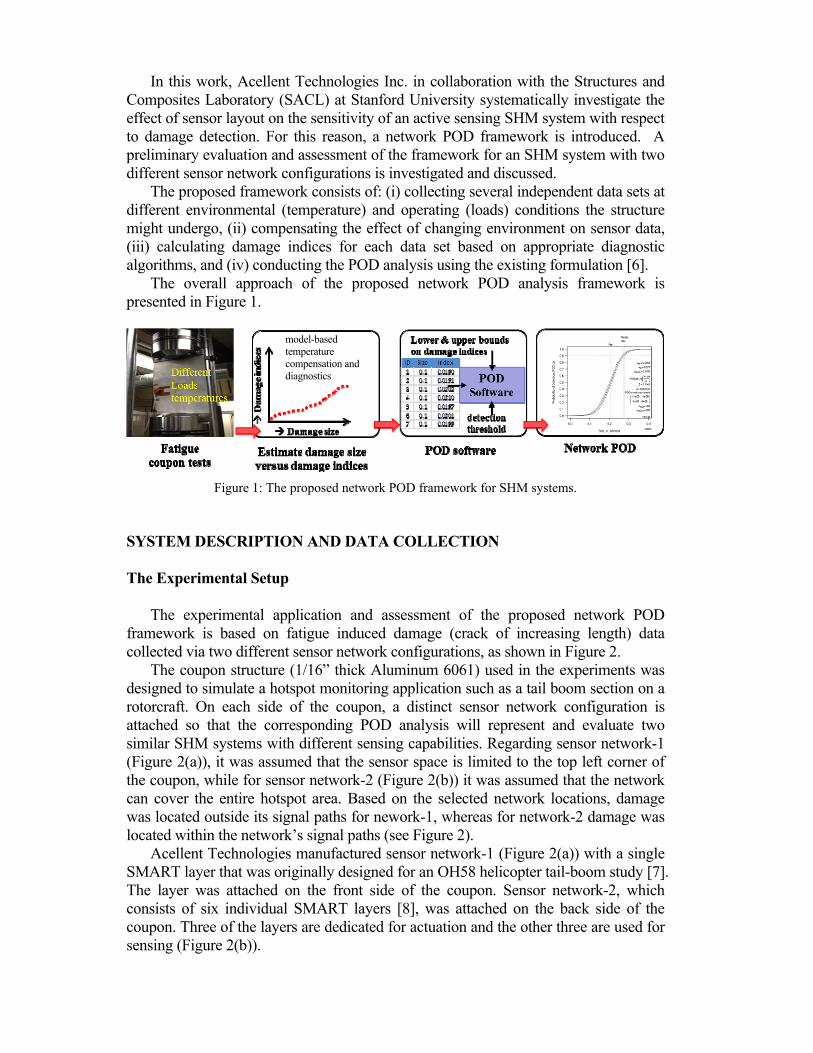
The proposed framework consists of: (i) collecting several independent data sets at different environmental (temperature) and operating (loads) conditions the structure might undergo, (ii) compensating the effect of changing environment on sensor data, (iii) calculating damage indices for each data set based on appropriate diagnostic algorithms, and (iv) conducting the POD analysis using the existing formulation [6].
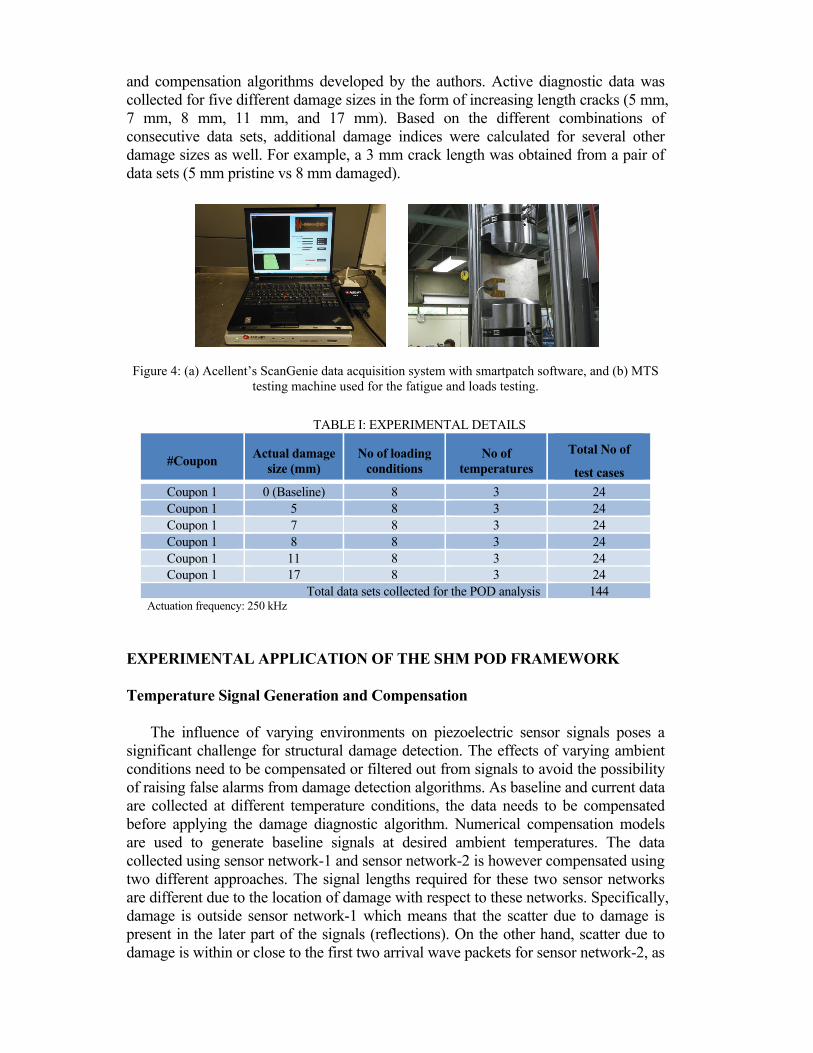
The overall approach of the proposed network POD analysis framework is presented in Figure 1.
Figure 1: The proposed network POD framework for SHM systems.
SYSTEM DESCRIPTION AND DATA COLLECTION The Experimental Setup
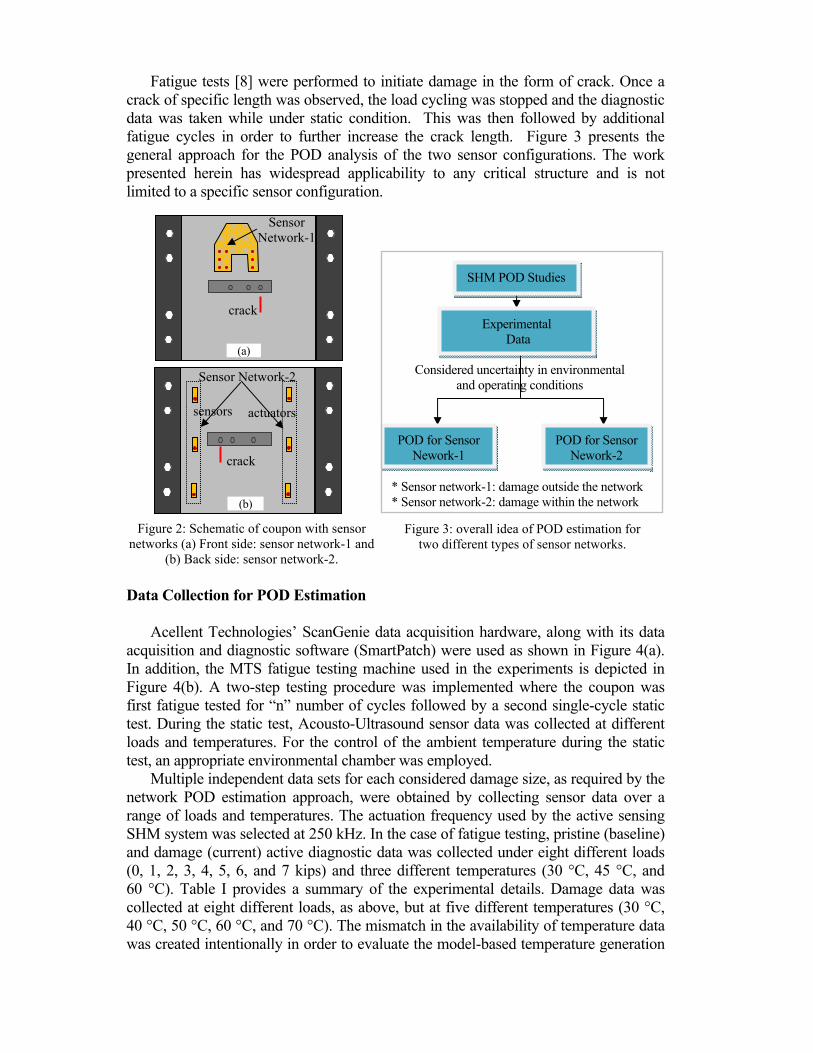
The experimental application and assessment of the proposed network POD framework is based on fatigue induced damage (crack of increasing length) data collected via two different sensor network configurations, as shown in Figure 2.
The coupon structure (1/16” thick Aluminum 6061) used in the experiments was designed to simulate a hotspot monitoring application such as a tail boom section on a rotorcraft. On each side of the coupon, a distinct sensor network configuration is attached so that the corresponding POD analysis will represent and evaluate two similar SHM systems with different sensing capabilities. Regarding sensor network-1 (Figure 2(a)), it was assumed that the sensor space is limited to the top left corner of the coupon, while for sensor network-2 (Figure 2(b)) it was assumed that the network can cover the entire hotspot area. Based on the selected network locations, damage was located outside its signal paths for nework-1, whereas for network-2 damage was located within the network’s signal paths (see Figure 2).
Acellent Technologies manufactured sensor network-1 (Figure 2(a)) with a single SMART layer that was originally designed for an OH58 helicopter tail-boom study [7]. The layer was attached on the front side of the coupon. Sensor network-2, which consists of six individual SMART layers [8], was attached on the back side of the coupon. Three of the layers are dedicated for actuation and the other three are used for sensing (Figure 2(b)).
model-based temperature compensation and diagnostics
Fatigue tests [8] were performed to initiate damage in the form of crack. Once a crack of specific length was observed, the load cycling was stopped and the diagnostic data was taken while under static condition. This was then followed by additional fatigue cycles in order to further increase the crack length. Figure 3 presents the general approach for the POD analysis of the two sensor configurations. The work presented herein has widespread applicability to any critical structure and is not limited to a specific sensor configuration.
Data Collection for POD Estimation
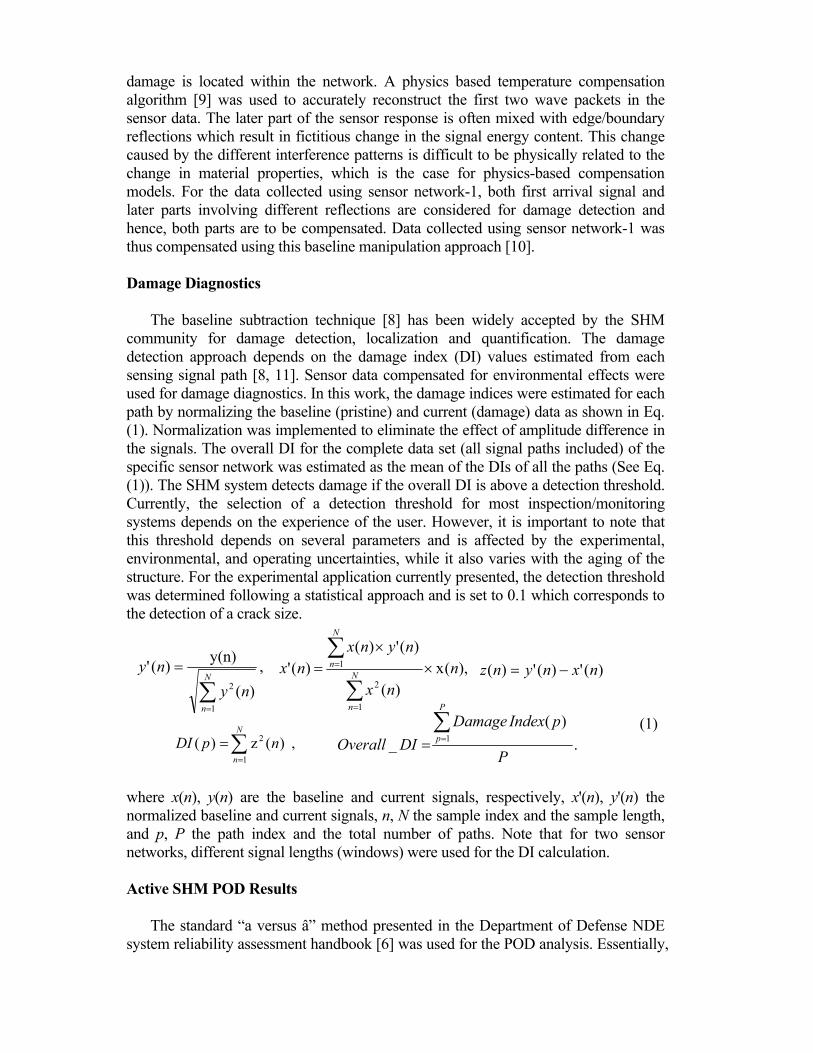
Acellent Technologies’ ScanGenie data acquisition hardware, along with its data acquisition and diagnostic software (SmartPatch) were used as shown in Figure 4(a). In addition, the MTS fatigue testing machine used in the experiments is depicted in Figure 4(b). A two-step testing procedure was implemented where the coupon was first fatigue tested for “n” number of cycles followed by a second single-cycle static test. During the static test, Acousto-Ultrasound sensor data was collected at different loads and temperatures. For the control of the ambient temperature during the static test, an appropriate environmental chamber was employed.
Multiple independent data sets for each considered damage size, as required by the network POD estimation approach, were obtained by collecting sensor data over a range of loads and temperatures. The actuation frequency used by the active sensing SHM system was selected at 250 kHz. In the case of fatigue testing, pristine (baseline) and damage (current) active diagnostic data was collected under eight different loads (0, 1, 2, 3, 4, 5, 6, and 7 kips) and three different temperatures (30 °C, 45 °C, and 60 °C). Table I provides a summary of the experimental details. Damage data was collected at eight different loads, as above, but at five different temperatures (30 °C, 40 °C, 50 °C, 60 °C, and 70 °C). The mismatch in the availability of temperature data was created intentionally in order to evaluate the model-based temperature generation
Figure 3: overall idea of POD estimation for two different types of sensor networks.
Figure 2: Schematic of coupon with sensor networks (a) Front side: sensor network-1 and
(b) Back side: sensor network-2.
Considered uncertainty in environmental and operating conditions
SHM POD Studies
Experimental Data
POD for Sensor Nework-1
POD for Sensor Nework-2
* Sensor network-1: damage outside the network * Sensor network-2: damage within the network
(a)
Sensor Network-1
crack
(b)
Sensor Network-2
crack
sensors actuators
and compensation algorithms developed by the authors. Active diagnostic data was collected for five different damage sizes in the form of increasing length cracks (5 mm, 7 mm, 8 mm, 11 mm, and 17 mm). Based on the different combinations of consecutive data sets, additional damage indices were calculated for several other damage sizes as well. For example, a 3 mm crack length was obtained from a pair of data sets (5 mm pristine vs 8 mm damaged).
Figure 4: (a) Acellent’s ScanGenie data acquisition system with smartpatch software, and (b) MTS testing machine used for the fatigue and loads testing.
TABLE I: EXPERIMENTAL DETAILS
#Coupon Actual damage
size (mm) No of loading
conditions No of
temperatures
Total No of
test cases
Coupon 1 0 (Baseline) 8 3 24 Coupon 1 5 8 3 24 Coupon 1 7 8 3 24 Coupon 1 8 8 3 24 Coupon 1 11 8 3 24 Coupon 1 17 8 3 24
Total data sets collected for the POD analysis 144 Actuation frequency: 250 kHz
EXPERIMENTAL APPLICATION OF THE SHM POD FRAMEWORK Temperature Signal Generation and Compensation
The influence of varying environments on piezoelectric sensor signals poses a significant challenge for structural damage detection. The effects of varying ambient conditions need to be compensated or filtered out from signals to avoid the possibility of raising false alarms from damage detection algorithms. As baseline and current data are collected at different temperature conditions, the data needs to be compensated before applying the damage diagnostic algorithm. Numerical compensation models are used to generate baseline signals at desired ambient temperatures. The data collected using sensor network-1 and sensor network-2 is however compensated using two different approaches. The signal lengths required for these two sensor networks are different due to the location of damage with respect to these networks. Specifically, damage is outside sensor network-1 which means that the scatter due to damage is present in the later part of the signals (reflections). On the other hand, scatter due to damage is within or close to the first two arrival wave packets for sensor network-2, as
damage is located within the network. A physics based temperature compensation algorithm [9] was used to accurately reconstruct the first two wave packets in the sensor data. The later part of the sensor response is often mixed with edge/boundary reflections which result in fictitious change in the signal energy content. This change caused by the different interference patterns is difficult to be physically related to the change in material properties, which is the case for physics-based compensation models. For the data collected using sensor network-1, both first arrival signal and later parts involving different reflections are considered for damage detection and hence, both parts are to be compensated. Data collected using sensor network-1 was thus compensated using this baseline manipulation approach [10]. Damage Diagnostics
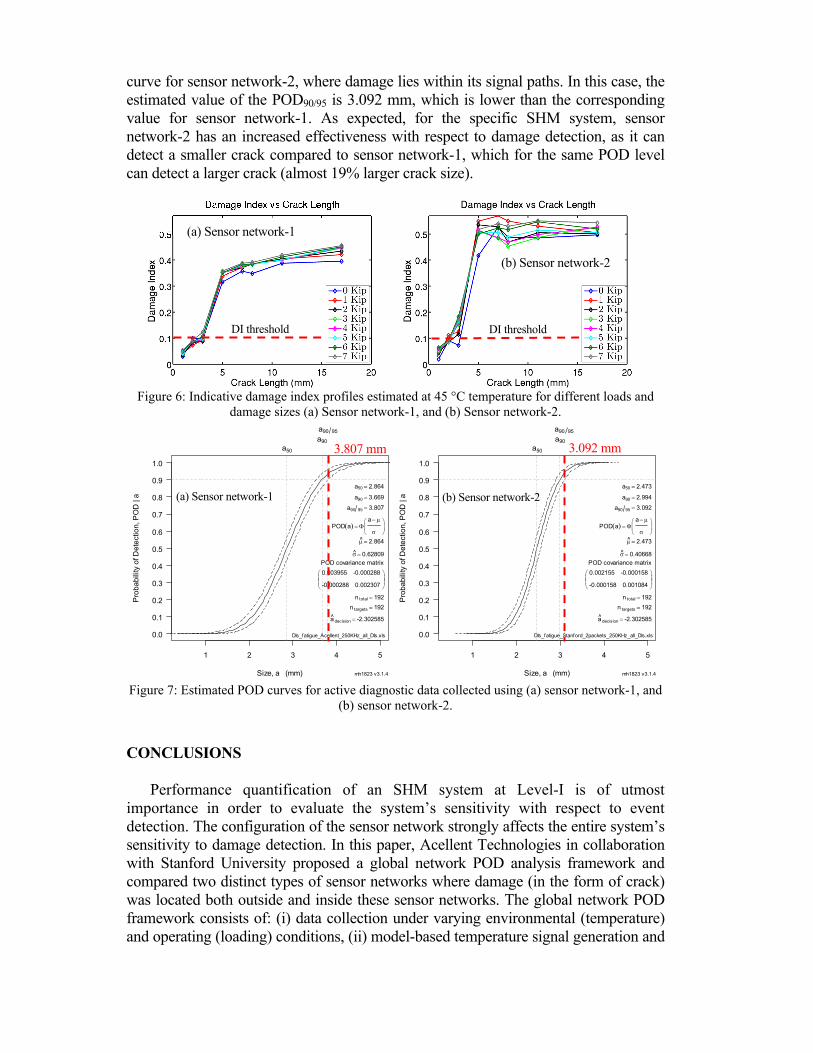
The baseline subtraction technique [8] has been widely accepted by the SHM community for damage detection, localization and quantification. The damage detection approach depends on the damage index (DI) values estimated from each sensing signal path [8, 11]. Sensor data compensated for environmental effects were used for damage diagnostics. In this work, the damage indices were estimated for each path by normalizing the baseline (pristine) and current (damage) data as shown in Eq. (1). Normalization was implemented to eliminate the effect of amplitude difference in the signals. The overall DI for the complete data set (all signal paths included) of the specific sensor network was estimated as the mean of the DIs of all the paths (See Eq. (1)). The SHM system detects damage if the overall DI is above a detection threshold. Currently, the selection of a detection threshold for most inspection/monitoring systems depends on the experience of the user. However, it is important to note that this threshold depends on several parameters and is affected by the experimental, environmental, and operating uncertainties, while it also varies with the aging of the structure. For the experimental application currently presented, the detection threshold was determined following a statistical approach and is set to 0.1 which corresponds to the detection of a crack size.
(1)
where x(n), y(n) are the baseline and current signals, respectively, x'(n), y'(n) the normalized baseline and current signals, n, N the sample index and the sample length, and p, P the path index and the total number of paths. Note that for two sensor networks, different signal lengths (windows) were used for the DI calculation. Active SHM POD Results
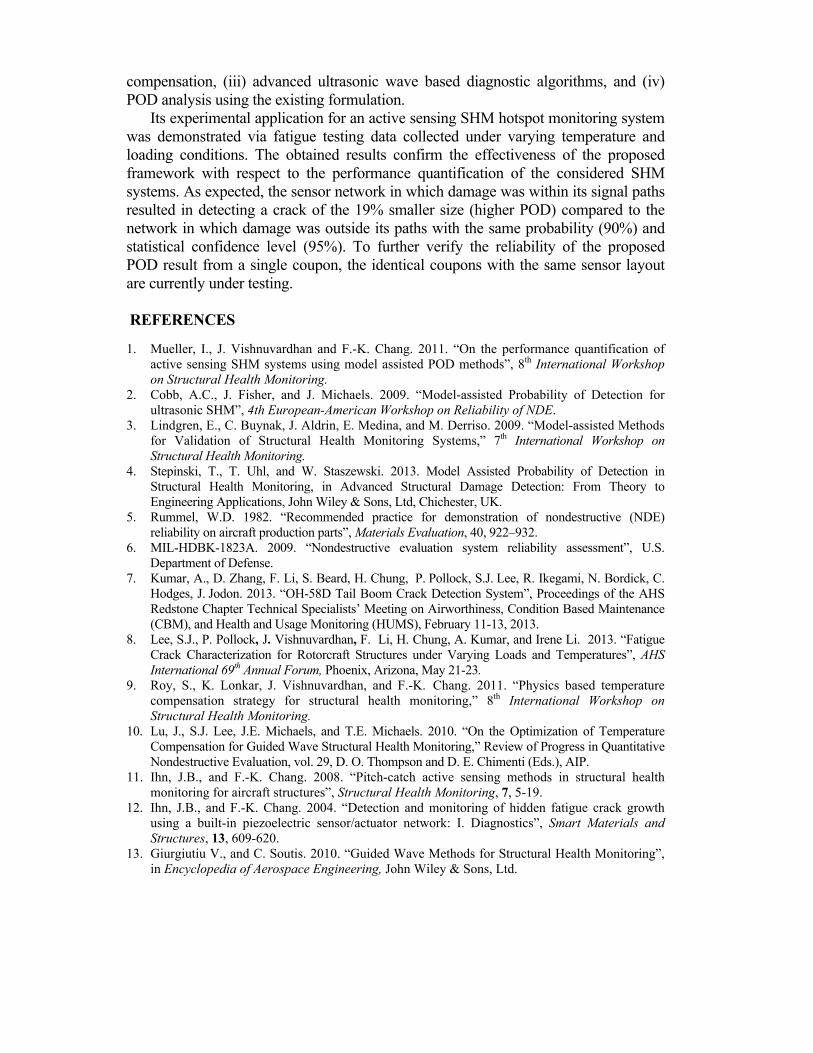
The standard “a versus â” method presented in the Department of Defense NDE system reliability assessment handbook [6] was used for the POD analysis. Essentially,
,
)(
y(n))('
1
2
N
n
ny
ny ),(x)(
)(')()('
1
2
1 nnx
nynxnx
N
n
N
n
)(')(')( nxnynz
.
)(
_ 1
P
pIndexDamage
DIOverall
P
p,)(z)(
1
2
N
n
npDI
this method requires data including the real size of damage and the corresponding damage indices as estimated by the diagnostic algorithm. Moreover, it requires the values of the upper and lower bounds of the calculated damage indices, along with an appropriate damage detection threshold as determined by the diagnostic algorithm. Then, these parameters are used to perform a linear regression during the POD analysis [6]. For each damage size, the data obtained under the different loads and temperatures were used to generate a matrix including damage size versus damage index. Finally, these values (actual damage size, damage indices, lower and upper bounds of damage indices, and detection threshold) were passed as inputs into the POD software [6] which enables the POD analysis and estimates the corresponding damage detection confidence levels.
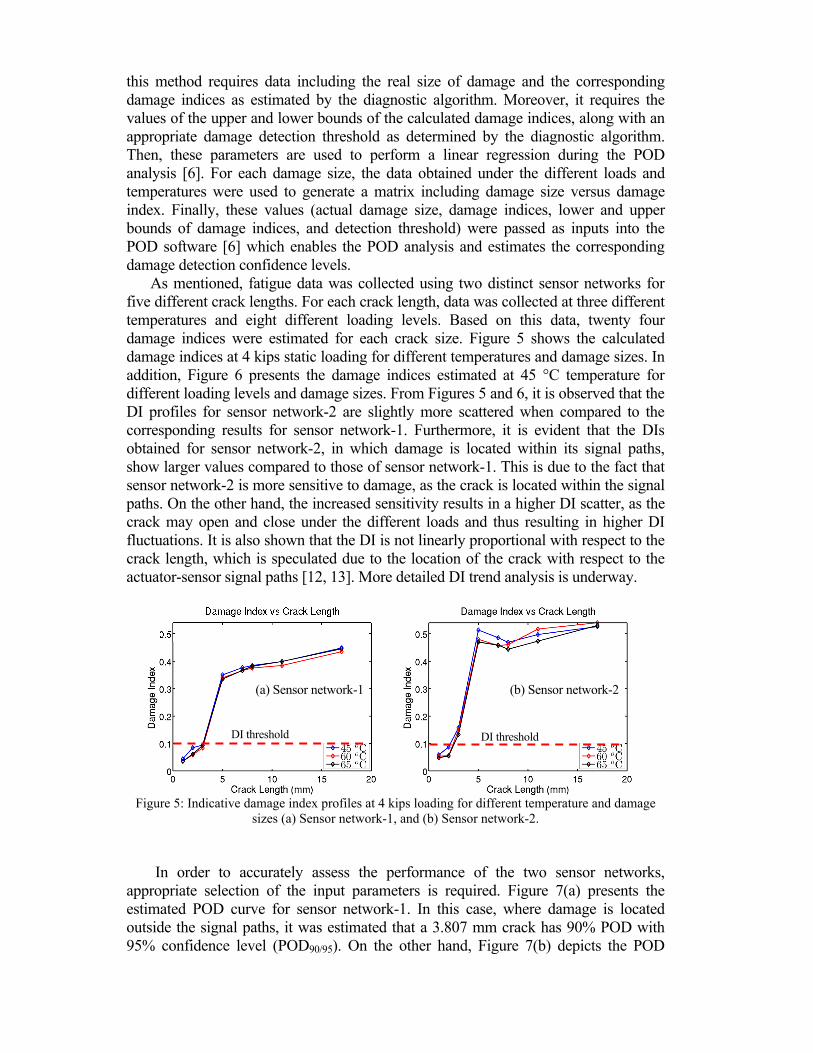
As mentioned, fatigue data was collected using two distinct sensor networks for five different crack lengths. For each crack length, data was collected at three different temperatures and eight different loading levels. Based on this data, twenty four damage indices were estimated for each crack size. Figure 5 shows the calculated damage indices at 4 kips static loading for different temperatures and damage sizes. In addition, Figure 6 presents the damage indices estimated at 45 °C temperature for different loading levels and damage sizes. From Figures 5 and 6, it is observed that the DI profiles for sensor network-2 are slightly more scattered when compared to the corresponding results for sensor network-1. Furthermore, it is evident that the DIs obtained for sensor network-2, in which damage is located within its signal paths, show larger values compared to those of sensor network-1. This is due to the fact that sensor network-2 is more sensitive to damage, as the crack is located within the signal paths. On the other hand, the increased sensitivity results in a higher DI scatter, as the crack may open and close under the different loads and thus resulting in higher DI fluctuations. It is also shown that the DI is not linearly proportional with respect to the crack length, which is speculated due to the location of the crack with respect to the actuator-sensor signal paths [12, 13]. More detailed DI trend analysis is underway.
Figure 5: Indicative damage index profiles at 4 kips loading for different temperature and damage
sizes (a) Sensor network-1, and (b) Sensor network-2. In order to accurately assess the performance of the two sensor networks,
appropriate selection of the input parameters is required. Figure 7(a) presents the estimated POD curve for sensor network-1. In this case, where damage is located outside the signal paths, it was estimated that a 3.807 mm crack has 90% POD with 95% confidence level (POD90/95). On the other hand, Figure 7(b) depicts the POD
(a) Sensor network-1 (b) Sensor network-2
DI threshold DI threshold
curve for sensor network-2, where damage lies within its signal paths. In this case, the estimated value of the POD90/95 is 3.092 mm, which is lower than the corresponding value for sensor network-1. As expected, for the specific SHM system, sensor network-2 has an increased effectiveness with respect to damage detection, as it can detect a smaller crack compared to sensor network-1, which for the same POD level can detect a larger crack (almost 19% larger crack size).
Figure 6: Indicative damage index profiles estimated at 45 °C temperature for different loads and
damage sizes (a) Sensor network-1, and (b) Sensor network-2.
Size, a (mm)
1 2 3 4 5
0.0
0.1
0.2
0.3
0.4
0.5
0.6
0.7
0.8
0.9
1.0
Pro
ba
bili
ty o
f De
tect
ion
, PO
D |
a
mh1823 v3.1.4
a50
a90
a90 95
a50 2.864
a90 3.669
a90 95 3.807
PODa
a
2.864
0.62809POD covariance matrix
0.003955 -0.000288
-0.000288 0.002307
n total 192
n targets 192
a decision -2.302585
DIs_fatigue_Acellent_250KHz_all_DIs.xls
Size, a (mm)
1 2 3 4 5
0.0
0.1
0.2
0.3
0.4
0.5
0.6
0.7
0.8
0.9
1.0
Pro
ba
bili
ty o
f De
tect
ion
, PO
D |
a
mh1823 v3.1.4
a50
a90
a90 95
a50 2.473
a90 2.994
a90 95 3.092
PODa
a
2.473
0.40668POD covariance matrix
0.002155 -0.000158
-0.000158 0.001084
n total 192
n targets 192
a decision -2.302585
DIs_fatigue_Stanford_2packets_250KHz_all_DIs.xls
Figure 7: Estimated POD curves for active diagnostic data collected using (a) sensor network-1, and
(b) sensor network-2. CONCLUSIONS
Performance quantification of an SHM system at Level-I is of utmost importance in order to evaluate the system’s sensitivity with respect to event detection. The configuration of the sensor network strongly affects the entire system’s sensitivity to damage detection. In this paper, Acellent Technologies in collaboration with Stanford University proposed a global network POD analysis framework and compared two distinct types of sensor networks where damage (in the form of crack) was located both outside and inside these sensor networks. The global network POD framework consists of: (i) data collection under varying environmental (temperature) and operating (loading) conditions, (ii) model-based temperature signal generation and
(a) Sensor network-1
(b) Sensor network-2
(a) Sensor network-1 (b) Sensor network-2
3.807 mm 3.092 mm
DI threshold DI threshold
compensation, (iii) advanced ultrasonic wave based diagnostic algorithms, and (iv) POD analysis using the existing formulation.
Its experimental application for an active sensing SHM hotspot monitoring system was demonstrated via fatigue testing data collected under varying temperature and loading conditions. The obtained results confirm the effectiveness of the proposed framework with respect to the performance quantification of the considered SHM systems. As expected, the sensor network in which damage was within its signal paths resulted in detecting a crack of the 19% smaller size (higher POD) compared to the network in which damage was outside its paths with the same probability (90%) and statistical confidence level (95%). To further verify the reliability of the proposed POD result from a single coupon, the identical coupons with the same sensor layout are currently under testing. REFERENCES 1. Mueller, I., J. Vishnuvardhan and F.-K. Chang. 2011. “On the performance quantification of
active sensing SHM systems using model assisted POD methods”, 8th International Workshop on Structural Health Monitoring.
2. Cobb, A.C., J. Fisher, and J. Michaels. 2009. “Model-assisted Probability of Detection for ultrasonic SHM”, 4th European-American Workshop on Reliability of NDE.
3. Lindgren, E., C. Buynak, J. Aldrin, E. Medina, and M. Derriso. 2009. “Model-assisted Methods for Validation of Structural Health Monitoring Systems,” 7th International Workshop on Structural Health Monitoring.
4. Stepinski, T., T. Uhl, and W. Staszewski. 2013. Model Assisted Probability of Detection in Structural Health Monitoring, in Advanced Structural Damage Detection: From Theory to Engineering Applications, John Wiley & Sons, Ltd, Chichester, UK.
5. Rummel, W.D. 1982. “Recommended practice for demonstration of nondestructive (NDE) reliability on aircraft production parts”, Materials Evaluation, 40, 922–932.
6. MIL-HDBK-1823A. 2009. “Nondestructive evaluation system reliability assessment”, U.S. Department of Defense.
7. Kumar, A., D. Zhang, F. Li, S. Beard, H. Chung, P. Pollock, S.J. Lee, R. Ikegami, N. Bordick, C. Hodges, J. Jodon. 2013. “OH-58D Tail Boom Crack Detection System”, Proceedings of the AHS Redstone Chapter Technical Specialists’ Meeting on Airworthiness, Condition Based Maintenance (CBM), and Health and Usage Monitoring (HUMS), February 11-13, 2013.
8. Lee, S.J., P. Pollock, J. Vishnuvardhan, F. Li, H. Chung, A. Kumar, and Irene Li. 2013. “Fatigue Crack Characterization for Rotorcraft Structures under Varying Loads and Temperatures”, AHS International 69th Annual Forum, Phoenix, Arizona, May 21-23.
9. Roy, S., K. Lonkar, J. Vishnuvardhan, and F.-K. Chang. 2011. “Physics based temperature compensation strategy for structural health monitoring,” 8th International Workshop on Structural Health Monitoring.
10. Lu, J., S.J. Lee, J.E. Michaels, and T.E. Michaels. 2010. “On the Optimization of Temperature Compensation for Guided Wave Structural Health Monitoring,” Review of Progress in Quantitative Nondestructive Evaluation, vol. 29, D. O. Thompson and D. E. Chimenti (Eds.), AIP.
11. Ihn, J.B., and F.-K. Chang. 2008. “Pitch-catch active sensing methods in structural health monitoring for aircraft structures”, Structural Health Monitoring, 7, 5-19.
12. Ihn, J.B., and F.-K. Chang. 2004. “Detection and monitoring of hidden fatigue crack growth using a built-in piezoelectric sensor/actuator network: I. Diagnostics”, Smart Materials and Structures, 13, 609-620.
13. Giurgiutiu V., and C. Soutis. 2010. “Guided Wave Methods for Structural Health Monitoring”, in Encyclopedia of Aerospace Engineering, John Wiley & Sons, Ltd.