Embed Size (px)
Citation preview

JOURNAL OF SEDIMENTARY RESEARCH, VOL. 68, NO. 4, JULY, 1998, P. 684–699Copyright q 1998, SEPM (Society for Sedimentary Geology) 1073-130X/98/068-684/$03.00
SEQUENCE STRATIGRAPHY AND RELATIVE SEA-LEVEL HISTORY OF THE MIDDLE AND UPPERORDOVICIAN OF THE NASHVILLE DOME, TENNESSEE
S.M HOLLAND1 AND M.E. PATZKOWSKY2
1 Department of Geology, University of Georgia, Athens, Georgia 30602-2501, U.S.A.2 Department of Geosciences, Pennsylvania State University, University Park, Pennsylvania 16802-2714, U.S.A.
ABSTRACT: Eleven depositional sequences are present in the Middleand Upper Ordovician of the Nashville Dome. All but one lack low-stand systems tracts, and many display evidence of subaerial exposuresuch as paleokarst or regional erosional truncation at their sequenceboundaries, which are combined with transgressive surfaces. Featuresformed during the transgression, such as hardgrounds, are more prom-inent at most sequence boundaries than are those features related tosubaerial exposure. All sequences have maximum flooding zones withaggradational stacking rather than discrete maximum flooding sur-faces. Condensation features are much more common at transgressivesurfaces than within the maximum flooding zone. The expression ofthese parasequences and sequences changes with the onset of the Ta-conic orogeny. Although parasequences from equivalent depositionalenvironments can be recognized before and after the onset of the orog-eny, their facies composition changes completely. Sequences followingthe orogeny display fewer paleokarst features, more pyritized and iron-stained hardgrounds at flooding surfaces and transgressive surfaces,and more phosphatic lags and mineralization at transgressive surfacesthan those preceding the orogeny. A relative sea-level curve for theNashville Dome has a long-term (. 5 m.y.) component presumablydominated by subsidence and a short-term (1–3 m.y.) component con-sisting of 10–50 m fluctuations that is primarily the result of eustasy.
INTRODUCTION
The emplacement of thrust loads is well known to control the strati-graphic architecture of the proximal parts of foreland basins (e.g., Read1980; Van Wagoner 1995). Many studies have also pointed to the role ofthrust loading in shaping the stratigraphy of distal parts of foreland basins,including the peripheral bulge (Dorobek and Read 1986; Flemings andJordan 1990). We have previously documented several effects of the Mid-dle Ordovician Taconic orogeny on the stratigraphy of mixed carbonate–clastic deposits of the Nashville Dome in central Tennessee (Holland andPatzkowsky 1997). The onset of this orogeny is accompanied there by ashift from tropical-type to temperate-type carbonates, the initiation of wide-spread phosphate deposition, the introduction of large amounts of terrige-nous silt and clay, the occurrence of widespread seismically induced soft-sediment deformation, and a change from a carbonate shelf to a ramp (Fig.1).
The onset of the orogeny had no immediate effects on accommodationrates on the Nashville Dome, but 4 million years following the onset, ac-commodation rates underwent a fourfold drop. Changes in accommodationrates and changes in sediment supply should be expected to leave a distinctchange in sequence stratigraphic architecture, and this study documents anumber of these changes. This study also uses depositional sequences toestablish a relative sea-level history for the Middle and Upper Ordovicianof the Nashville Dome. This paper is a companion to Holland and Patz-kowsky (1997), and readers are referred to that paper for additional mea-sured sections as well as details on the lithologic changes and the tectonicoceanographic evolution of the Nashville Dome.
Regional Tectonic and Climatic Background
The Nashville Dome and the Cincinnati Arch (Fig. 2) are widely con-sidered to be peripheral bulges, or flexural uplifts driven primarily by thrust
loads to the east of the Appalachian Foreland Basin (Beaumont et al. 1988).Although the Nashville Dome and Cincinnati Arch experienced thrust-in-duced flexural uplift throughout much of the Paleozoic, they were firstuplifted during the Middle Ordovician during two orogenic events, theBlountian and Taconic orogenies (Stearns and Reesman 1986). The Bloun-tian orogeny occurred during the early Middle Ordovician (ca. 463 Ma)and was centered in easternmost Tennessee, whereas the Taconic orogenyoccurred during the late Middle Ordovician (ca. 454 Ma) and was centeredon northeastern Virginia, and easternmost Pennsylvania and New York.
The Taconic orogeny was driven by the attempted and aborted subduc-tion of the eastern edge of North America under either a small microplateor terrane (Delano et al. 1990), a series of island arcs (Rowley and Kidd1981), or possibly even western Argentina (Dalla Salda et al. 1992). Asthe North American continent approached the subduction zone, loading ofthe eastern edge of North America formed a peripheral foreland basin anduplifted the Nashville Dome and Cincinnati Arch (Beaumont et al. 1988).Flexural uplift along the margins of the Michigan, Illinois, and Black War-rior Basins transformed the Nashville Dome and Cincinnati Arch into aseries of domes and arches rather than a single linear peripheral bulge(Beaumont et al. 1988).
During the Middle and Late Ordovician, the Nashville Dome lay in sub-tropical latitudes at approximately 258S (Scotese and McKerrow 1991). Thetrade winds that would have formed at this latitude would have blowntowards the west–northwest. Evaporites are absent from the NashvilleDome region, suggesting less than arid conditions. Yet, prominent paleo-karst is absent as well, suggesting no significant rainfall. On the basis oftidal-flat deposits, the adjacent central Kentucky region has been interpretedas semi-humid (Pope and Read 1993). The Middle to Late Ordovician wasa time of greenhouse climate, and oxygen isotopic evidence suggests thatend-Ordovician glaciation was limited to a half-million-year interval nearlyat the end of the Ordovician (Brenchley et al. 1994). There are no rocksof this age on the Nashville Dome, indicating that all of the Ordovicianrocks of the Nashville Dome were deposited in a greenhouse climate priorto any significant continental glaciation.
FACIES
Five major depositional environments are identified in the Ordovician ofthe Nashville Dome on the basis of grain types, physical and biogenicsedimentary structures, and vertical facies relationships. These include peri-tidal, shallow subtidal, sand shoal, deep subtidal, and offshore environ-ments. These five are represented by 18 lithofacies (Tables 1–5). Despitedifferences in tropical-type versus temperate-type carbonates as well aspercent shale, facies from corresponding environments share many simi-larities before and after the onset of the Taconic orogeny.
In the study area, peritidal facies are characterized by typically low levelsof bioturbation (ichnofabric index or ii 1–2, Droser and Bottjer 1989), thepresence of desiccation cracks, laminar to tubular fenestral fabrics, and verythin to thin bedding. Somewhat deeper and less restricted peritidal faciesdisplay more bioturbation (ii 2–3), fewer desiccation features, commontubular to bubble fenestrae, and evidence of more frequent reworking inthe form of erosionally based skeletal lags.
In this study, shallow subtidal facies are highly variable, but containabundant peloids or skeletal material, are nearly everywhere highly biotur-bated (ii 4–5), and are very thickly to massively bedded. Shallow subtidal

685SEQUENCE STRATIGRAPHY OF THE ORDOVICIAN OF THE NASHVILLE DOME
FIG. 1.—Depositional sequences and major lithologic changes of the Middle and Upper Ordovician of the Nashville Dome, summarized from Holland and Patzkowsky(1997). The Taconic orogeny is closely timed with most of these changes and is initiated late in the M4 sequence. CSS refers to Sweet’s conodont-based graphic correlationdiscussed in the text under Relative Sea-Level History. D and M in the sequences column indicate the positions of the Deicke and Millbrig K-bentonites. The durationsof the unconformities are poorly constrained, and the missing lowstand systems tracts are each assumed to represent one-third of their respective sequences. The positionof the C6 sequence, known from the Cincinnati Arch (Holland 1993), is shown here although no rocks from the C6 sequence are exposed on the Nashville Dome.
facies may contain an open marine fauna dominated by brachiopods, bry-ozoans, and echinoderms or may contain a more restricted marine faunacharacterized by molluscs, ostracods, and stromatoporoids.
Sand-shoal facies are characterized by coarse-grained to very coarse-grained skeletal grainstones with pervasive large-scale cross-bedding (i.e.,sets . 5 cm thick, sensu Ashley 1990) and upper-plane-bed lamination.Skeletal grains in sand shoal facies are dominantly echinodermal and phos-phatic grains are locally abundant. Burrowing is usually absent, but isolatedshort vertical shafts have been found.
Deep subtidal facies contain abundant storm beds with lesser amountsof siliciclastic to dolomitic mudstones that represent quiet-water deposition.These storm beds are typically 5–20 cm thick, have an erosional base, andmay have a basal poorly sorted skeletal lag and an upper layer of calcisiltiteto well-sorted very fine peloidal packstone. The storm beds commonlyexhibit small-scale hummocky cross-stratification, wave-ripple lamination,small-scale (i.e., sets , 5 cm thick) ripple cross-bedding, or upper-plane-bed lamination. Mudstones and the tops of the storm beds are commonlyburrowed (ii 2–3).
Offshore facies are similar to the deep subtidal but are dominated byburrowed (ii 2–3) siliciclastic to dolomitic mudstones. Offshore facies alsocontain fewer and thinner storm beds, which are commonly only 1–5 cmthick.
These five depositional environments are similar to those found in many
modern carbonate depositional settings (Jones and Desrochers 1992; Read1985). Of these, the Persian Gulf is perhaps the best modern analog forinferring ancient water depths because it shares many similarities with theNashville Dome and Appalachian Foreland Basin during the Ordovician.Both settings are peripheral foreland basins, have similar basin geometries,have comparably shallow depositional slopes, lie in subtropical latitudes,and have limited connections to the open ocean. Therefore, likely waterdepths are 2–20 m for the shallow subtidal, 0–5 m for sand shoals, 20–50m for deep subtidal environments, and 501 m for offshore environments(Purser and Evans 1973; Wagner and van der Togt 1973).
FIELD EXPRESSION OF PARASEQUENCES
The 18 lithofacies combine to form a wide variety of parasequences.Certain parasequences are either common enough or demonstrate particularfacies changes well enough that they are discussed in more detail below.The change from a tropical-type, low-energy shelf with little siliciclasticinput to a temperate-type, higher-energy ramp with significant siliciclasticinput substantially altered the facies composition and anatomy of parase-quences.
Parasequences Prior to the Taconic Orogeny
Deep Subtidal.—Deep subtidal parasequences are common within thePierce and Lebanon Limestones. These consist of the Packstone-Siltstone-

686 S.M HOLLAND AND M.E. PATZKOWSKY
FIG. 2.—Major structural features andOrdovician outcrop area (shaded) in the easternUnited States.
TABLE 1.—Peritidal lithofacies.
LaminiteLithology: Fining-upward beds grading from ostracod-bearing lime mudstone and wackestone into pure
lime mudstone.Bedding & structures: Laminated to very thin-bedded. Laminoid fenestrae, planar lamination, small-scale
cross-lamination.
Dolomitic LaminiteLithology: Fine-grained dolomite and greenish dolomitic shale.Bedding & structures: Very thin-bedded to laminated. Wave (vortex) ripples, abundant desiccation cracks.
Green Mudstone-CalcisiltiteLithology: Ranges from entirely dolomitic mudstone to even proportions of dolomitic mudstone and calcis-
iltite. Mudstones are light green to greenish-gray; calcisiltites are light to medium gray. Mudstones aresilty, glauconitic, and usually unfossiliferous. Calcisiltites are locally coarse enough to be very fine-grained skeletal grainstones.
Bedding & structures: Thin- to medium-bedded mudstones with very thin to thin beds of calcisiltite. Mud-stones are structureless, nonfissile, blocky; presumably thoroughly bioturbated. Beds of calcisiltite arecommon discontinuous and may display erosional bases, fining-upward grain size, planar lamination,wave-ripple lamination, short vertical burrows, and nonlaminar bubble fenestrae.
Light-Colored Fine GrainstoneLithology: Light to medium gray silty skeletal to peloidal packstones and poorly washed grainstones; so
fine grained as to almost be calcisiltites. Packstone and grainstone beds commonly fine upwards. Gener-ally unfossiliferous, but may contain ostracod valves and echinoderm ossicles. Dolomitic mudstones aregreen, argillaceous, and silty.
Bedding & structures: Thin- to medium-bedded packstones and grainstones separated by very thin beds topartings of dolomitic mudstone. Moderately to heavily bioturbated (ii2–ii4). Nonlaminar bubble fenestrapresent.
Fenestral MudstoneLithology: Lime mudstone, rarely dolomitized; typically unfossiliferous, but locally contains rare ostracods.Bedding & structures: Thin- to medium-bedded. Common to abundant nonlaminar fenestral vugs. Less
common vertical branching tubular pseudo-fenestrae.
Burrowed Lime MudstoneLithology: Lime mudstones. Contains sparse fossil fragments, usually of ostracods and brachiopods, rarely
rich enough to form a wackestone. Interbeds of very thin beds of dolomitic shale.Bedding & structures: Thin- to very thin-bedded. Abundant dolomite-filled burrows in lime mudstones,
most commonly of Chondrites.
Shale Facies, which may grade upwards into the Bioturbated Wackestoneto Packstone Facies (Fig. 3A). The Packstone-Siltstone-Shale Facies dis-plays an upsection decrease in the percentage and bed thickness of bur-rowed dolomitic mudstones, and an increase in the frequency, thickness,and amalgamation of skeletal packstones and peloidal packstones. Manystorm beds display erosional bases with lime mud intraclasts, tool marks,and gutter casts. Small-scale hummocky cross-stratification and small-scaleripple cross-stratification are both common within the peloidal packstones.Where a parasequence shoals up into a shallow subtidal facies, beddingthickness and bioturbation increase markedly (Fig. 4, 5A). These thick bio-turbated peloidal to skeletal packstones may be punctuated by thin beds ofpeloidal grainstones displaying upper-plane-bed lamination. Many deepsubtidal parasequences do not pass upwards into the shallow subtidal en-vironment as illustrated in Figure 3, and these display only the facieschanges present in the lower half of the figure. Many deep subtidal par-asequences are not entirely shallowing-upward and have deepening-upwardbases that comprise up to one-third of the parasequence (cf. Elrick 1995).
Shallow Subtidal.—Poorly to subtly expressed shallow subtidal para-sequences make up the bulk of the Ridley Limestone and the Lower Mem-ber of the Carters Limestone. Most of each parasequence consists of theBioturbated Wackestone to Packstone Facies and displays few or no ver-tical trends in grain type or size, bedding, or bioturbation. In most cases(Fig. 3B), the parasequence has a basal skeletal to intraclastic lag and maybe capped by a thin dolomitic shale. Some of these parasequences arecapped by a thin to medium bed of the Fenestral Lime Mudstone Facies,indicating shallowing to sea level (Fig. 3C). In rare cases, the parasequence

687SEQUENCE STRATIGRAPHY OF THE ORDOVICIAN OF THE NASHVILLE DOME
TABLE 2.—Shallow-subtidal lithofacies.
Dark-Colored Fine GrainstoneLithology: Skeletal grainstones, dark gray to dark bluish-black, fine-grained, phosphatic. Locally contains
whole brachiopod valves. Mudstones are fissile, dark gray to black.Bedding & structures: Grainstones are medium-bedded and separated by partings or very thin beds of
shale. Slightly bioturbated (ii2). Lacks obvious sedimentary structures such as cross-bedding commonlyseen in other grainstone facies.
Peloidal GrainstoneLithology: Peloidal grainstone, locally skeletal in part, locally packstone to poorly washed grainstone. Pe-
loids large, up to 1 mm long. Common Girvanella and uncommon Solenopora. Some dolomitic mottling.Oolitic in some places.
Bedding & structures: Medium- to thick-bedded. Burrow mottling (ii3–4) increases upwards within parase-quence. Uncommon planar laminae.
Bioturbated Wackestone to PackstoneLithology: Skeletal to peloidal packstone and wackestone. Most fossils finely fragmented, but some layers
with abundant coarsely broken to whole brachiopods, bryozoans, gastropods, and trilobites. Grainstonesare intraclastic and skeletal.
Bedding & structures: Thick-bedded. Grainstones are thin but laterally continuous. Heavily bioturbated(ii4–ii5), with abundant dolomitic burrow mottling.
Silty Bioturbated PackstoneLithology: Skeletal packstones with abundant quartz silt and clay. Many whole or coarsely broken fossils
of brachiopods, bryozoans, gastropods, nautiloids. Grades into Nodular Packstone-Shale facies.Bedding & structures: Thick- to very thick-bedded; individual depositional units obscured by intense bio-
turbation (ii5 to ii6). Sedimentary structures and discrete trace fossils rare to absent.
Nodular Packstone-ShaleLithology: Skeletal packstones with coarsely broken and whole fossils of brachiopods, bryozoans, gastro-
pods, and nautiloids. Shales and packstones may contain abundant quartz silt. Grades into Silty Biotur-bated Packstone facies.
Bedding & structures: Packstones are nodular-bedded to very thin-bedded and discontinuous; shales arevery thin-bedded. Some beds of skeletal grainstone and packstone are very thin- to thin-bedded and lat-erally continuous.
Packstone-ShaleLithology: Skeletal packstones to poorly washed grainstones. Skeletal; fossils usually coarsely broken or
whole. Girvanella locally common.Bedding & structures: Thin- to medium-bedded packstones separated by laminae or very thin beds of silty
shale. Tabular bedding; sedimentary structures uncommon.
Undulatory Wackestone to PackstoneLithology: Wackestones and packstones are skeletal. Commonly finely dolomitized. Color ranges from me-
dium gray to dark black; tan where dolomitized. Fossil fragments finely broken. Stromatoporoids com-mon.
Bedding & structures: Thin- to medium-bedded wackestones separated by very thin shale beds to partings.Upper and lower surfaces of wackestones are commonly undulatory, but may be planar. Intense bioturba-tion within wackestones (ii3–ii5). Vugs (2–10 cm) filled with sparry calcite locally common.
TABLE 3.—Sand-shoal lithofacies.
Cross-bedded GrainstoneLithology: Crinoid grainstone. Variably phosphatic; some laminae may be composed entirely of phosphatic
peloids and phosphatic internal molds of mollusks, bryozoan zooecia, and echinoderm stereom. Locallywith lags of ramose to massive bryozoans, or with discontinuous horizons of large colonial rugosans,colonial tabulates, or stromatoporoids. At some localities, grainstone composed of numerous unbrokenhigh-spired gastropods and echinoderm debris. Solenopora locally present. Uncommon to locally abun-dant shale intraclasts. Grain size varies widely within facies from fine to very coarse, but individual bedsare well to very well sorted. Numerous microfacies types at any given outcrop; microfacies distinguishedchiefly on cross-bedding, phosphate, grain size, and fossils.
Bedding & structures: Medium- to thick-bedded. Abundant large-scale trough cross-bedding; large-scaletroughs locally have clay drapes. Abundant thin pyritic hardgrounds. Rare small-scale ripple lamination.
FIG. 3.—Representative parasequences from the M1–M4 sequences, prior to the Taconic orogeny, with localities indicated in caption. A) Deep subtidal parasequence;Alexandria. B) Shallow subtidal parasequence; Hollis Creek. C) Shallow subtidal parasequence with peritidal cap; Gladeville. D) Peritidal parasequence; Hollis Creek.
may pass upwards into the Peloidal Grainstone Facies. Shallow subtidalparasequences contain skeletal packstones deposited as storm lags; thesemay be relatively thin and rare (Fig. 3A) or they may be thicker and con-stitute more of the parasequence (Fig. 3B). Heads of stromatoporoids and
colonial corals are common and tend to be present in the lower part of aparasequence.
Peritidal.—Peritidal parasequences are uncommon on the NashvilleDome and never form thick monotonous sections. Peritidal parasequencescan be found in the Murfreesboro, Ridley, and Upper Carters Limestones.These parasequences commonly start with a relatively thin interval of theBioturbated Wackestone to Packstone Facies (Fig. 3D). This passes up-wards into the Burrowed Lime Mudstone Facies with an accompanyingdecrease in bedding thickness and an increased segregation into grain-poorbeds (lime mudstones) and grain-rich beds (thin skeletal packstones). Theskeletal packstones are interpreted as storm events on the basis of normalgrading and erosional bases with gutter casts. Peritidal parasequences arefrequently capped with the Laminite or Dolomitic Laminite Facies, whichcan have prominent laminar fenestrae or desiccation cracks.
Parasequences Following the Taconic Orogeny
Deep Subtidal.—Deep subtidal parasequences are present in the Her-mitage, Arnheim, Fernvale, and Sequatchie Formations and show a widerange of expressions. In the Hermitage, deep subtidal parasequences consistof the Hummocky Siltstone Facies (Fig. 6A). Individual storm beds in thisfacies may show an overall thickening-upward trend, which may be ac-companied by a decrease in percentage of mudstone. In a few cases, theparasequence may be capped by several beds of the Packstone-Shale Faciescontaining a coquina of dalmanellid brachiopods.
In the Arnheim, deep subtidal parasequences consist of the Packstone-Siltstone-Shale Facies similar to those described for the Lebanon Lime-

688 S.M HOLLAND AND M.E. PATZKOWSKY
TABLE 4.—Deep subtidal lithofacies.
Hummocky SiltstoneLithology: Calcisiltites with varying concentrations of very fine quartz sand to silt. Mudstones also contain
varying concentrations of quartz silt. Generally unfossiliferous, although some calcisiltites may rarelyhave lags of brachiopods and bivalves at their bases.
Bedding & structures: Thin- to medium-bedded calcisiltites are interbedded with thin-bedded silty mud-stones in varying but roughly equal proportions. Calcisiltites have erosional lower surfaces with toolmarks; tops are burrowed; beds display abundant planar laminae, small-scale hummocky cross-stratifica-tion, and megaripples. Tool marks common, gutter casts also present. Ball and pillow locally common,but discontinuous across an outcrop. Diplocraterion locally present; strong bioturbation at some localities(ii4). Calcisiltites fine upwards into overlying silty mudstones.
Packstone-Siltstone-ShaleLithology: Packstones are skeletal, with abundant whole to fragmented brachiopods, bryozoans, gastropods,
trilobites and echinoderms. Skeletal grainstones composed of both whole and broken fossils locally com-mon. Calcisiltites generally quartz-poor. Shales dolomitic.
Bedding & structures: Packstones, calcisiltites, and shales are all interbedded and very thin- to thin-bedded.All three lithologies are laterally discontinuous, but where packstones dominate, beds may be relativelycontinuous. Calcisiltites with common planar laminae, small-scale ripple lamination, small-scale hum-mocky cross-lamination, and common to abundant burrows (Chondrites) filled with dolomitic shale. Bio-turbation variable (ii2 to ii4), but increases up-cycle and obscures bedding. Abundant hardgrounds. Gir-vanella locally.
TABLE 5.—Offshore lithofacies.
Gray ShaleLithology: Mudstone, dolomitic and commonly silt-poor. Calcisiltites are rare and contain quartz silt.Bedding & structures: Mudstones are medium-bedded; calcisiltites to skeletal packstones are thin to very
thin-bedded. Calcisiltites may display small-scale hummocky cross-stratification.
Dolomitic MudstoneLithology: Greenish to gray dolomitic mudstone.Bedding & structures: Medium- to thick-bedded; often interbedded with cross-bedded crinoidal grainstone
facies containing intraclasts of green to gray dolomitic mudstone.
FIG. 4.—Parasequence within M2 sequence exposed at Double Springs with Pack-stone-Siltstone-Shale facies grading upwards into Bioturbated Wackestone Pack-stone facies. Dolomitic mudstones delineate individual storm beds low in the pho-tograph. Increasingly intense bioturbation higher in the section has mixed this dol-omitic mudstone material into storm beds, welding successive beds together andcausing bed thickness to increase upsection.
stone, but differ in that the Arnheim parasequences contain only skeletalgrains and lack peloids. In the Fernvale and Sequatchie Formations, deepsubtidal parasequences consist of the Dolomitic Mudstone Facies thatgrades upwards into the Cross-Bedded Grainstone Facies.
Shallow Subtidal.—Shallow subtidal parasequences are common andmake up most of the Cannon, Catheys, and Leipers Formations and partsof the Hermitage and Arnheim Formations. Like their pre-orogenic coun-terparts, most of these shallow subtidal parasequences are cryptically ex-pressed. In their most subtle expression, they consist of either the SiltyBioturbated Packstone Facies or the Nodular Packstone-Shale Facies, whichmay display an upsection loss of argillaceous material and may be cappedwith a thicker, laterally continuous skeletal packstone or grainstone (Fig.6B).
Another common type of parasequence may begin with any of a varietyof facies but is capped by the Cross-Bedded Grainstone Facies. The un-derlying facies may include the Undulatory Wackestone and PackstoneFacies (as shown in Figure 6C), the Packstone-Shale Facies, the NodularPackstone-Shale Facies, or the Silty Bioturbated Packstone Facies. Theseunderlying facies may show no vertical trends in bedding, grain type orsize, bioturbation, or sedimentary structures. The cross-bedded grainstonehas an erosional base with up to 20 cm of relief and is commonly cappedwith a strongly iron-stained hardground. Colonial corals and stromatopor-oids are frequently associated with these grainstone-capped shallow subti-dal parasequences and may be present in either the grainstones or the un-derlying facies.
Sand Shoal.—Sand shoal parasequences are common in the northernand western parts of the Nashville Dome, where a belt of grainstone shoalspersisted throughout the late Middle and Late Ordovician (Holland andPatzkowsky 1997). Sand-shoal parasequences constitute the bulk of theBigby and Fernvale Formations and can locally dominate the Catheys andLeipers Formations. These parasequences commonly have erosional bases,consist entirely of the Cross-Bedded Grainstone Facies, and may be cappedby iron-stained hardgrounds. Some parasequences may end with a few thinbeds of fenestral mudstones (Fig. 6D). Grain size and sedimentary struc-tures vary widely in these parasequences, and clear vertical trends are rare.Where iron-stained hardgrounds or peritidal caps are absent, it can be im-possible to identify individual parasequences within a series of grainstones.
Peritidal.—Peritidal parasequences are uncommon following the onsetof the Taconic orogeny. Peritidal caps to shallow subtidal parasequencesare locally common within the Cannon Formation and consist of the Fe-nestral Mudstone Facies capping the Undulatory Wackestone to PackstoneFacies. In the extreme southern part of the Nashville Dome, peritidal par-asequences are also common, and there they make up parts of the CatheysFormation and all of the Inman Formation. These parasequences consist ofthe Light-Colored Fine Grainstone Facies that grades upward into the Green
Mudstone–Calcisiltite Facies (Fig. 6E). This transition is characterized byan upsection increase in green dolomitic mudstone and a decrease in thenumber and thickness of fine skeletal grainstones to calcisiltites. The greenmudstones are massive, which is attributed to bioturbation although distinctburrows were not recognized. No evidence of subaerial exposure in theform of desiccation cracks was recognized, although nonlaminar fenestraeare present, which may indicate increasingly restricted conditions upsec-tion, but perhaps without subaerial exposure. A restricted setting is sug-gested by a lack of abundant open-marine forms such as articulate bra-

689SEQUENCE STRATIGRAPHY OF THE ORDOVICIAN OF THE NASHVILLE DOME
FIG. 5.—A) Flooding surface within M2 sequence exposed at Double Springs. Note abrupt decrease in bedding thickness where the Packstone-Siltstone-Shale Faciesoverlies the Bioturbated Wackestone-Packstone Facies. B) Scalloped and pinnacled microkarstic surface (arrows) at M4 sequence boundary exposed at Hollis Creek. C)Overhanging microkarstic and hardground surface at C5 sequence boundary exposed at Vietnam Vets Highway. D) Burrowed firmground at C5 sequence boundary exposedat Briley Parkway. E) Pyritized hardground at C3 sequence boundary exposed at Peyton’s Warehouse. F) Phosphatized cobbles at C4 sequence boundary exposed atVietnam Vets Highway. Jacob staff in A, E, and F is marked in 10 cm increments.
chiopods and by the abundance of ostracods. Where slightly deeper waterdepths were achieved at the base of these parasequences, the Dark-ColoredFine Grainstone Facies is present and contains an open-marine assemblagewith brachiopods, crinoids, and bryozoans.
FIELD EXPRESSION OF SEQUENCES
Eleven third-order depositional sequences are recognized in the Ordo-vician exposed on the Nashville Dome (Fig. 7–11) and range in duration
from 0.5 to 2.5 m.y. The salient features of each of these sequences aresummarized in Table 6.
These sequences were recognized and correlated on the basis of para-sequence stacking patterns and by distinctive features of sequence bound-aries and transgressive surfaces. Parasequence stacking patterns were iden-tified on the basis of vertical trends in facies composition among successiveparasequences. Many carbonate studies have used Fischer plots to identifystacking patterns in thick successions of peritidal cycles, but they were not

690 S.M HOLLAND AND M.E. PATZKOWSKY
FIG. 6.—Representative parasequences from the M5–C5 sequences, following the onset of the Taconic orogeny. See Figure 3 for key to symbols and lithologies. A)Deep subtidal parasequence; Columbia North. B) Shallow subtidal parasequence; Vietnam Vets Highway. C) Shallow subtidal to sand-shoal parasequence; Gladdice. D)Sand-shoal parasequence with peritidal cap; Columbia North. E) Peritidal parasequence; Bradshaw Creek.
used here for two reasons. First, Fischer plots are most easily interpretedwhen each parasequence shallows to roughly the same water depth, whereasthe parasequences in this study differ markedly in their facies composition(Sadler et al. 1993). Second, Fischer plots are most useful where numerousparasequences are recognized within each sequence, whereas most of thesequences in this study consist of less than twenty parasequences (Sadleret al. 1993).
As a result, this study focused on depth trends to identify stacking pat-terns, much as is commonly done in siliciclastic sequence stratigraphicstudies (Van Wagoner et al. 1990). Progradational stacking was indicatedby a net shallowing-upward trend through a series of parasequences. Re-trogradational stacking was indicated by an overall deepening-upward pat-tern through a series of parasequences, despite upward shallowing withineach of the component parasequences. Aggradational stacking was indi-cated by a lack of net shallowing or deepening through a set of parase-quences.
Sequence Boundaries and Transgressive Surfaces
Lack of Lowstand Systems Tracts.—Most sequence boundaries rec-ognized in this study were initially identified in the field by an abrupt shiftfrom progradational stacking to retrogradational stacking. Such a shiftclearly marks the transgressive surface and the beginning of the transgres-sive systems tract. On the Nashville Dome, these transgressive surfacesgenerally display features attributable to subaerial exposure, suggesting thatthey are also sequence boundaries and that the lowstand systems tract ismissing. In any slowly subsiding updip region, sequence boundaries arefrequently combined with transgressive surfaces. During the Middle andUpper Ordovician, long-term accommodation rates on the Nashville Domewere on the order of 10 m/m.y. (Holland and Patzkowsky 1997), so a lackof lowstand systems tracts is expected.
A few of these surfaces lack clear evidence of subaerial exposure, butmight still be sequence boundaries, particularly if a lack of vegetation orlow rainfall did not favor meteoric alteration. Alternatively, these surfacesmay simply be transgressive surfaces and not sequence boundaries at all.In such a case, a type II sequence boundary would lie hidden within theunderlying progradational parasequence set (Van Wagoner et al. 1990). In
this scenario, the rate of eustatic fall would have been slower than the rateof subsidence, such that the carbonate platform was never subaerially ex-posed.
Paleokarst.—Four of the sequence boundaries identified (M4, M5, M6,C5) have direct evidence of subaerial exposure in the form of paleokarst.In most cases, the paleokarst is of small scale, and nowhere have metersof relief, thick breccias, or other such prominent paleokarst features beenfound.
Paleokarst at the M4 sequence boundary consists of 10–40 cm high tee-pee-like deformations of underlying strata. The cores of these structuresare filled with angular and rotated clasts of peloidal grainstones floatingwithin a yellowish dolomite matrix. The karst surface itself displays at least40 cm of relief on an individual outcrop. This relief is locally overhanging,and the surface is apparently encrusted in places by stromatoporoids andcolonial corals. The karst surface is overlain by a skeletal grainstone con-taining 101 cm angular intraclasts of underlying lithologies (Fig. 12A). Insome outcrops, M4 paleokarst is manifested as scalloped and pinnacledsurfaces (Fig. 5B; cf. Read and Grover 1977), although similar surfaceshave elsewhere been interpreted as submarine hardgrounds.
At the M5 sequence boundary, paleokarst is indicated by a highly in-vaginated surface with up to 10 cm of relief. Underlying burrow-mottledskeletal wackestones are diagenetically mottled and blackened. Ferroan do-lomite is common beneath the sequence boundary (Dıaz 1996). In the sub-sequent transgression, the karst surface itself was subsequently bored, min-eralized with pyrite, and overlain by coarse sandy phosphatic grainstones.In places, the sequence boundary is overlain by blackened and phosphatizedpebbles of lime mudstones derived from the underlying sequence (Fig.12B). Thus, many prominent features of this surface formed during trans-gression rather than from subaerial exposure.
The M6 sequence boundary contains paleokarst features in the form ofmultiple fissures 1 cm wide and 101 cm deep cut through fenestral limemudstones. These fissures have irregularly shaped walls, are locally over-hanging, and are filled with dark phosphatic fine-grained skeletal grain-stones.
Paleokarst at the C5 sequence boundary consists of a bored and black-ened surface with up to 3 cm of overhanging relief (Fig. 5C). Strata un-

691SEQUENCE STRATIGRAPHY OF THE ORDOVICIAN OF THE NASHVILLE DOME
FIG. 7.—Key to facies and symbols in Figures 8–11. Additional sections can befound in Holland and Patzkowsky (1997).
derlying this surface underwent soft-sediment deformation that appears inplaces to be ball-and-pillow and in other places to be teepee structures.The tops of these deformed beds are truncated at the sequence boundary.During the subsequent transgression, this surface was subsequently modi-fied by at least three generations of phosphatization, mineralization, boring,and intraclast formation. At some exposures, the C5 sequence boundary ismarked only by a burrowed firmground and lacks obvious evidence ofsubaerial exposure (Fig. 5D). Like the M5 sequence boundary, the most
prominent aspects of these surface are a result of transgression rather thansubaerial exposure.
The remaining sequence boundaries display little or no evidence of pa-leokarst, although many have other features suggesting subaerial exposure.The relative scarcity of paleokarst features in the entire section may indicatea relatively arid environment, a lack of vegetation and soil development,or relatively brief periods of exposure.
Erosional Truncation.—Erosional truncation was generally difficult todetect in this study because of the scarcity of outcrops and the lack ofstratigraphic marker beds underlying most of the sequence boundaries.Nonetheless, clear erosional truncation could be identified in a few in-stances. The M5 sequence boundary displays clear truncation and erosionalbeveling of up to 7 m, made visible by the progressive removal of theDeicke K-bentonite, the Upper Member of the Carters, and the Millbrig K-bentonite (Fig. 9). The C5 sequence boundary cuts out the C4, the C3, andmuch of the C2 sequences across much of the southern outcrop area (Fig.11). The Arnheim Formation, the sole unit of the C4 sequence, is missingthroughout most of the southern Nashville Dome (Wilson 1949). What issignificant about this erosional truncation is that in individual outcrops theC5 sequence boundary displays no striking evidence of subaerial exposure.Without multiple outcrops, it would be difficult to prove that the C5 se-quence was preceded by subaerial exposure.
Two incised valleys have been reported from the C4 and C5 sequenceboundaries at the southern end of the Nashville Dome (Wilson 1948). Mostof Wilson’s incised-valley outcrops are now covered, and new outcrops arescarce (e.g., Smithson Branch in the Appendix). Wilson mapped these in-cised valleys and demonstrated up to 30 m of relief extending down intoM5 strata. The valley fills are multistage, and contain two conglomeratichorizons, plus fine-grained quartz-rich sandstones and mudstones. Thesandstones contain both small-scale and large-scale cross-bedding, currentripples, and flaser to wavy bedding. Wilson interpreted these as southeast-ward-flowing channels on the basis of cross-bedding foresets, but the lackof a northwestern source of the quartz-rich sands suggests to us that theserepresent paleovalleys of rivers draining off Appalachian highlands to thesoutheast. The southeastward-directed paleocurrents presumably reflect tid-al processes, which are also suggested by the presence of flaser and wavybedding. The two-stage fill may represent the C4 and C5 sequence bound-aries, or possibly two stages of development on the C5 sequence boundary.
Chertification and Diagenetic Mottling.—Many of the sequenceboundaries overlie zones of black chert nodules. The nodules are 2–5 cmthick and tend to be elongated parallel to bedding. The nodules are notdistributed evenly, but show a preference for particular horizons, althoughit could not be determined why these horizons were favored. The cherti-fication is interpreted as representing the combined dissolution of calciumcarbonate and precipitation of silica within the mixing zone during sub-aerial exposure (Knauth 1979). Although most of these nodules lie belowthe sequence boundary, some are found up to 1 m above it. The first fewparasequences above such sequence boundaries have peritidal caps and mayhave had subaerial exposure sufficient to generate additional chert horizonsabove the main sequence boundary.
Where lime mudstones or wackestones underlie sequence boundaries,they are commonly diagenetically mottled and patterned with black stain-ing. This type of staining has been interpreted elsewhere as forming throughsubaerial exposure and oxidation of pyrite within carbonate tidal-flat sed-iments (Dixon 1976). Most peritidal lime mudstones and wackestones inthis study do not display diagenetic mottling, and it appears to occur onlyat surfaces that were interpreted on other criteria to be sequence boundaries.
Features Related to Transgression.—Although some indicators of sub-aerial exposure are found at most of the sequence boundaries, many of theprominent features of these surfaces formed during the subsequent trans-gression. In some cases, such as where the sequence boundary is overlainby a cross-bedded grainstone with a clearly erosional base, some features

692 S.M HOLLAND AND M.E. PATZKOWSKY
FIG. 8.—Measured sections from the M1 through M3 sequences. Ordovician outcrop area on Nashville Dome with locations of measured sections is shown in lower left.Appendix contains locality descriptions. FC: Fall Creek. CV: Central Valley. W: Whip-poor-will Road. PM: Pierce’s Mill. L: Lascassas. DS: Double Springs. CC: CrippleCreek. CF: Carson Fork. SRH: Sam Ridley Highway. E: Exit 32.
recording subaerial exposure may have been destroyed by transgressiveravinement (Swift 1968).
Many of the sequence boundary that coincide with transgressive surfaceshave hardgrounds developed on them, which in some cases (e.g., M5, C5)were developed on what were originally microkarst surfaces. Many of thesesurfaces are mineralized, usually with pyrite and phosphate, and may bevisible from a distance as a prominently iron-stained surface. Several ofthese surfaces that are combined sequence boundaries and transgressivesurfaces display a horizon of intense burrowing. The edges of the burrowsare well defined and sharp, suggesting a firm substrate.
Finally, many of the sequence boundaries that are combined with trans-gressive surfaces are marked by the abrupt disappearance of multiple spe-cies of brachiopods, bryozoans, corals, trilobites, and molluscs, as well asthe abrupt appearance of several new species of these groups. This abruptfaunal change reflects not only a period of nondeposition but also the abruptfacies changes during transgression (Holland 1995a, 1995b). Similar clus-tering of first and last occurrences have been noted elsewhere where se-quence boundaries and transgressive surfaces are combined into single sur-faces (e.g., Brett and Baird 1995; Harris and Sheehan 1997).
Maximum Flooding Zones
The turnaround from retrogradational to progradational stacking thatmarks the maximum flooding surface is never abrupt in this study area.Instead, it is characterized by an interval of aggradational stacking. Con-sequently, no maximum flooding surfaces are recognized here; maximumflooding zones are recognized instead. Because the stacking patterns arerecognized by trends in water depth in successive parasequences, the max-imum flooding zone lies within the zone displaying no net water-depthtrend, overlies a zone of net deepening, and is overlain by a zone of netshallowing.
Similar patterns have been recognized in many other carbonate studies(e.g., Elrick 1996; Goldhammer et al. 1993; Osleger and Read 1991). Max-imum flooding zones indicate a slow drop in rates of accommodation fromthe rapid rates during the transgressive systems tract to the slow rates dur-ing the early highstand systems tract. Maximum flooding surfaces, in con-trast, represent a much more rapid drop in rates of accommodation.
The maximum flooding zones in this study do not display any of thefeatures typically associated with condensed sections developed at maxi-

693SEQUENCE STRATIGRAPHY OF THE ORDOVICIAN OF THE NASHVILLE DOME
FIG. 9.—Measured sections from the M3 through M5 sequences. BC: Bluff Creek. A: Alexandria. HC: Hollis Creek. G: Gladeville. NA: Nashville Airport. CN: ColumbiaNorth. L: Lewisburg.
mum flooding surfaces, such as enrichment in diagenetic minerals, bur-rowed surfaces, or fossil concentrations. The lack of these features suggeststhat rates of relative sea-level change near the maximum flooding surfacewere insufficient to slow rates of sediment accumulation significantly. Con-densation features are much better developed in this study at the trans-gressive surfaces and underscore that stratigraphic condensation commonlyoccurs in other contexts than the maximum flooding surface (Brett 1995;Kidwell 1991).
Changes in Sequence Architecture
Several aspects of the sequence architecture change across the M5 se-quence boundary at the onset of the Taconic orogeny. These include thevisibility of subaerial exposure features, hardground mineralization, and thecomposition of lags.
Paleokarst features and other diagenetic features related to subaerial ex-posure are clearly developed at the M2, M4, M5, M6, and C5 sequenceboundaries and most prominently prior to the M5 boundary. The lack ofclearly defined paleokarst and diagenetic features at several of the Cincin-natian sequences plus the presence of the two incised valleys in these samerocks suggest that their argillaceous content may have been high enoughto cause them to erode like siliciclastic rocks rather than dissolve likecarbonates. In addition, the relatively high calcite:aragonite ratio of theM5–C5 temperate-type carbonates may have slowed rates of meteoric al-teration and allowed relatively loose sediments to be eroded like siliciclasticsediments (cf. Boreen and James 1995). Alternatively, the lack of paleo-karst and diagenetic features may indicate that Late Ordovician climate wasmore arid than Middle Ordovician climate, such that dissolution rates andthe extent of meteoric diagenesis were higher prior to the Taconic orogeny.The Taconic Highlands upwind to the southeast may have formed a rainshadow that reduced rainfall across the region.
A second conspicuous difference in sequence expression is the abun-dance of iron-stained and pyritized hardgrounds after the onset of the Ta-
conic orogeny and their near-absence prior to the orogeny (Fig. 5E). Asdiscussed above, many of these hardgrounds are developed at transgressivesurfaces, where they are associated with accumulations of phosphatic peb-bles and phosphatic internal molds of microfossils. In addition, many par-asequences ending with cross-bedded grainstones are capped by pyritizedand iron-stained hardgrounds. Similar iron staining has been reported fromTertiary cool-water carbonates of Australia (James and Bone 1992) andfrom modern cool-water continental shelves (Collins 1988). The abundanceof iron staining on hardgrounds in the M5–C5 and its absence on M1–M4hardgrounds may be attributable to increased nutrient flux following theonset of the Taconic Orogeny (Holland and Patzkowsky 1997). An in-creased supply of nutrients would have increased the flux of organic matterto the seafloor and led to the formation of strong redox gradients in surficialsediments. When sedimentation was slowed, such as at major flooding sur-faces, bacterially mediated sulfate reduction would have formed thick py-ritic horizons. Such sulfate reduction may also have favored submarinedissolution of the underlying limestone.
The third conspicuous difference is the abundance of phosphatic lagsfollowing the onset of the orogeny and their prior scarcity. Phosphate isfrequently found in the M5 through C4 sequences as red to brown stein-kerns of molluscan protoconchs, bryozoan zooecia, and crinoid stereom.The increased phosphate deposition following the M4 sequence reflectsincreased productivity driven by upwelling in the newly deepened forelandbasin (Holland and Patzkowsky 1997). Much of this phosphate is dissem-inated throughout shallow subtidal and sand shoal facies, but it is alsofrequently concentrated as basal parasequence lags, transgressive lags, andwithin transgressive crinoidal grainstones. Black phosphate is also foundat the C4 and C5 transgressive surfaces as coatings on pebbles and im-pregnations on hardgrounds (Fig. 5F). The sole known Nashville exampleof a phosphatic lag prior to the Taconic orogeny is at the M4 sequenceboundary at Lewisburg (see Appendix). The presence of these phosphaticlags reflects the increased availability of these abrasion- and dissolution-resistant grains following the orogeny.
694 S.M HOLLAND AND M.E. PATZKOWSKY
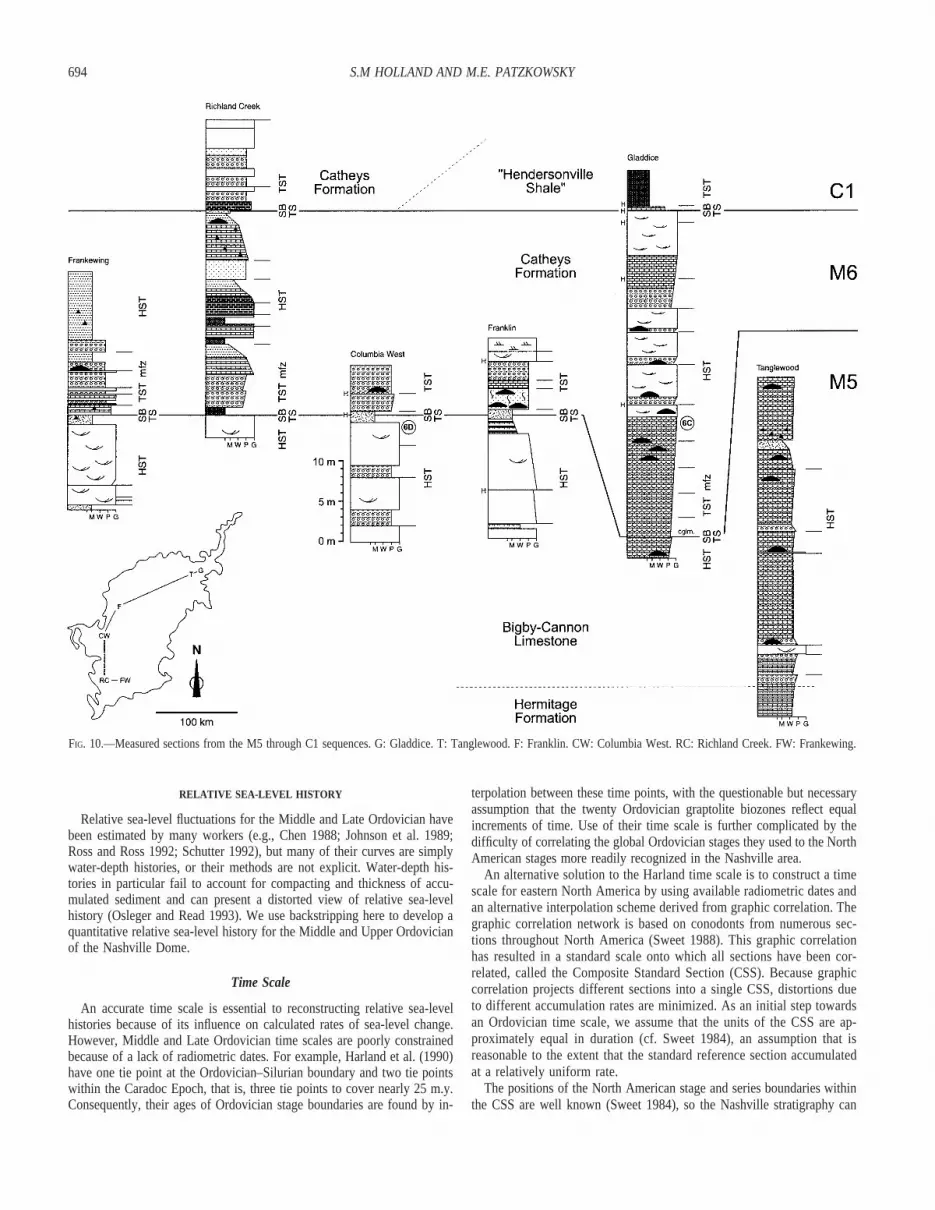
FIG. 10.—Measured sections from the M5 through C1 sequences. G: Gladdice. T: Tanglewood. F: Franklin. CW: Columbia West. RC: Richland Creek. FW: Frankewing.
RELATIVE SEA-LEVEL HISTORY
Relative sea-level fluctuations for the Middle and Late Ordovician havebeen estimated by many workers (e.g., Chen 1988; Johnson et al. 1989;Ross and Ross 1992; Schutter 1992), but many of their curves are simplywater-depth histories, or their methods are not explicit. Water-depth his-tories in particular fail to account for compacting and thickness of accu-mulated sediment and can present a distorted view of relative sea-levelhistory (Osleger and Read 1993). We use backstripping here to develop aquantitative relative sea-level history for the Middle and Upper Ordovicianof the Nashville Dome.
Time Scale
An accurate time scale is essential to reconstructing relative sea-levelhistories because of its influence on calculated rates of sea-level change.However, Middle and Late Ordovician time scales are poorly constrainedbecause of a lack of radiometric dates. For example, Harland et al. (1990)have one tie point at the Ordovician–Silurian boundary and two tie pointswithin the Caradoc Epoch, that is, three tie points to cover nearly 25 m.y.Consequently, their ages of Ordovician stage boundaries are found by in-
terpolation between these time points, with the questionable but necessaryassumption that the twenty Ordovician graptolite biozones reflect equalincrements of time. Use of their time scale is further complicated by thedifficulty of correlating the global Ordovician stages they used to the NorthAmerican stages more readily recognized in the Nashville area.
An alternative solution to the Harland time scale is to construct a timescale for eastern North America by using available radiometric dates andan alternative interpolation scheme derived from graphic correlation. Thegraphic correlation network is based on conodonts from numerous sec-tions throughout North America (Sweet 1988). This graphic correlationhas resulted in a standard scale onto which all sections have been cor-related, called the Composite Standard Section (CSS). Because graphiccorrelation projects different sections into a single CSS, distortions dueto different accumulation rates are minimized. As an initial step towardsan Ordovician time scale, we assume that the units of the CSS are ap-proximately equal in duration (cf. Sweet 1984), an assumption that isreasonable to the extent that the standard reference section accumulatedat a relatively uniform rate.
The positions of the North American stage and series boundaries withinthe CSS are well known (Sweet 1984), so the Nashville stratigraphy can

695SEQUENCE STRATIGRAPHY OF THE ORDOVICIAN OF THE NASHVILLE DOME
FIG. 11.—Measured sections from the M6 through C5 sequences. B: Briley Parkway. PW: Peyton’s Warehouse. VV: Vietnam Vets Highway. GC: Garrison Creek. P:Pulaski. BC: Bradshaw Creek. Note that correlation of Peyton’s Warehouse section corrects a drafting error in figure 8 of Holland and Patzkowsky (1997).
be tied to the CSS in two mutually supporting ways. Sweet (1984) hasused the data collected by Votaw (1971) to tie the Nashville lithostratig-raphy into the CSS. In addition, North American stages are readily rec-ognizable in Nashville on the basis of macrofossils.
The final step is to convert the CSS scale to a time scale expressed inunits of true age. Two absolute ages are available to make this conversion.The Ordovician–Silurian boundary has an interpolated U–Pb age of 443.5Ma (Fordham 1992; Tucker et al. 1990) and the Rocklandian Deicke K-bentonite has an 40Ar/39Ar age of 454.2 Ma (Kunk and Sutter 1984). TheCSS can then be used to linearly interpolate ages for Upper Rocklandianthrough Richmondian strata and extrapolate ages for Lower Rocklandianthrough Ashbyan strata (Fig. 1) using the following formula:
Age (in Ma) 5 20.0359 * CSS (in m) 1 489.3
Because only two dates are used, a change in either date would affectall rates calculated from this time scale equally, that is, any rate calculatedfrom the Ashbyan would be changed by the same amount as one from theMaysvillian. Consequently, changes in these dates would not affect theshape of our relative sea-level curve, only the scale of the entire curve.
Because the numerical age of not every horizon is known, some as-sumption must be made about the distribution of geologic time within asequence. As a start, we assume that each systems tract (lowstand, trans-gressive, highstand) represents one-third of the duration of a sequence.Although this assumption is likely to be incorrect in detail, adopting it willresult in only relatively minor distortions of the relative sea-level history.
Water-Depth History and Rock Thickness
For each systems tract, water depth is recorded as the depth at the topof that systems tract, resulting in three successive and equally spaced water
depths for each sequence. To avoid averaging changes in accommodationhistory across the Nashville Dome, all water depths are estimated fromoutcrops close to the city of Nashville. Because the water depth at the endof the highstand systems tract is estimated from the facies immediatelybeneath the sequence boundary, any erosion at the sequence boundarywould tend to make this depth an overestimate, given the overall shallowingwithin the highstand systems tract. Because lowstand systems tracts areabsent in the study area for ten of the eleven sequences, the true magnitudeof relative sea-level fall for each sequence is unknown. By assuming thatsea level fell at least enough to subaerially expose the platform (that is, awater depth of zero is assigned for each missing lowstand systems tract),we are able to provide a minimum estimate of the magnitude of relativesea-level fall.
The third component needed for backstripping is rock thickness, whichis simply taken as the thickness of each systems tract within a sequence.The lowstand systems tract is assigned a thickness of zero, which under-estimates the amount of relative sea-level change by ignoring any erosionthat may have taken place, but which is difficult to quantify.
Backstripping Algorithm
The backstripping algorithm we use follows the method of Angevine etal. (1990), which integrates the effects of compaction over the entire unit.Most systems tracts in this study consist of a range of carbonate lithologies,although some consist mostly of shale. Because of the wide range in car-bonate lithologies present in most systems tracts, we use the compactioncoefficients of Sahagian and Holland (1991) rather than more facies-spe-cific coefficients, such as those of Goldhammer (1997).

696 S.M HOLLAND AND M.E. PATZKOWSKY
TABLE 6.—Depositional sequences of the Middle and Upper Ordovician on the Nashville Dome.
Sequence LithostratigraphySequence Boundary (SB),
Lowstand Systems Tract (LST)Transgressive Surface (TS),
Transgressive Systems Tract (TST)Maximum Flooding Surface (MFS),
Highstand Systems Tract (HST)
C5 Fernvale, Sequatchie LST absent, SB merged with TS SB/TS: highly burrowed surface, overlain by a hardgroundcharacterized by numerous episodes of phosphatization,boring, and erosion. Hardground locally overhanging,may have been a paleokarst surface. Hardground devel-oped on ball-and-pillow structure of underlying ArnheimFm. In the south, sequence boundary marked by a secondstage of fill in two incised valleys.
TST: retrogradational set of parasequences composed ofpackstone-siltstone-shale facies.
MFS: indistinct
HST: progradational stacking of parasequences; each parase-quence consists of a basal dolomitic mudstone facies andan upper cross-bedded crinoidal grainstone facies. Crinoi-dal grainstones locally hematitic.
C4 Arnheim LST absent, SB merged with TS SB/TS: pyritized and bored hardground with numerousphosphatic pebbles; abrupt appearance of numerous fossilgenera (see Holland, 1995). In the south, sequence bound-ary marked by two conglomerate and sandstone-filled in-cised valleys (Wilson, 1948).
TST: retrogradational set of nodular packstone-shale parase-quences; bases of parasequences progressively less biotur-bated and more argillaceous through set
MFS: indistinct
HST: no progradational stacking recognized; regional loss ofentire Arnheim Formation suggests HST (and locallyTST) removed by pre-C5 erosion.
C3 part of Leipers LST absent, SB merged with TS SB/TS: Regionally persistent tongue of cross-bedded phos-phatic skeletal grainstone marks basal lag (see Wilson,1962, his figure 27)
TST: difficult to evaluate; entire sequence consists of highlybioturbated silty nodular limestone facies
MFS: indistinct
HST: difficult to evaluate; entire sequence consists of highlybioturbated silty nodular limestone facies
C2 part of Leipers abrupt basinward shift of facies, withcross-bedded grainstones containingabundant phosphatic and crinoidal ma-terial and numerous internal erosionsurfaces sharply overlying underlyingoffshore shales.
TS: sharp change to thicker parasequences
TST: parasequences composed of basal nodular packstone-shale facies grading up to grainstone caps; upward pro-gressive loss of grainstone caps within parasequence set;upward progressive increase in argillaceous content
MFS: indistinct
HST: nodular packstone-shale parasequences with progres-sively less argillaceous material in successive parase-quences
C1 part of Catheys LST absent, SB merged with TS SB/TS: abrupt appearance of intraclastic skeletal grainstonesand several pyritic hardgrounds
TST: Packstone-shale parasequences passing upwards intogray shale parasequences and packstone-siltstone-shaleparasequences
MFS: indistinct
HST: not recognized
M6 part of Catheys LST absent, SB merged with TS SB/TS: minor karstic surface with blackening of underlyinglime mudstones; solution voids filled with dark phosphaticskeletal grainstones; locally marked by thin conglomerateof blackened limestone cobbles
TST: packstone-shale and nodular packstone-shale parase-quences
MFS: indistinct
HST: progradational set of parasequences with basal pack-stone-shale facies and upper cross-bedded grainstone fa-cies. Set becomes progressively more grainstone-rich. Lo-cal stromatoporoid-tabulate-rugosan patch reefs.Grainstone shoals present to the west.
M5 Hermitage, Bigby-Cannon LST absent, SB merged with TS SB/TS: nearly planar karstic surface, with up to 7 m of re-gional relief. Solution voids filled with dark phosphaticskeletal grainstones. Strongly pyritized hardground. Localthin bed of coarse to very coarse quartz sand.
TST: retrogradational set of hummocky siltstone facies inwhich storm beds become progressively thinner and moredistal
MFS: indistinct
HST: hummocky siltstone parasequences add progressivelythicker cross-bedded grainstone and nodular limestonecaps
M4 Carters LST absent, SB merged with TS SB/TS: microkarstic surface with scalloped, pinnacled andoverhanging relief up to 10–20 cm (cf. Read and Grover,1977). Underlying beds deformed as ball-and-pillow orpossibly tepee structures. Black chert in 10 m thick zonestraddling sequence boundary. Local cross-bedded crinoi-dal, quartzose, phosphatic sand overlying SB.
TST: Retrogradational stacking from peritidal parasequencesinto highly bioturbated shallow subtidal facies
MFS: indistinct
HST: thick zone of aggradationally stacked bioturbated shal-low subtidal parasequences, eventually passes upwardsinto parasequences with peritidal caps.
M3 Lebanon LST absent, SB merged with TS SB/TS: Crinoidal and intraclastic basal lag, with dolomitizedclasts of underlying burrowed lime mudstone facies
TST: Retrogradationally stacked packstone-siltstone-shaleparasequences in which successive parasequences becomeshalier and less bioturbated.
MFS: indistinct
HST: Progradationally stacked packstone-siltstone-shale para-sequences in which successive parasequences become lessshaly and more bioturbated.
M2 Pierce, Ridley LST absent, SB merged with TS SB/TS: Basal bioclastic and intraclastic grainstone with deci-meters of erosional relief. Zone of black chert straddlingboundary.
TST: Retrogradational set of parasequences composed of ba-sal packstone-siltstone-shale facies and an upper biotur-bated wackestone to packstone facies
MFS: indistinct
HST: Thick aggradational to progradational set of bioturbat-ed wackestone to packstone facies
M1 Murfreesboro not exposed not exposed MFS: not exposed
HST: poorly exposed; a few shallow subtidal to peritidalparasequences
697SEQUENCE STRATIGRAPHY OF THE ORDOVICIAN OF THE NASHVILLE DOME
FIG. 12.—A) Overhanging karstic surface infilled with brecciated intraclastic and skel-etal lag. M4 sequence boundary exposed at Alexandria. B) Bedding-plane view of M5sequence boundary exposed at Gladeville. Note fractured, bored, and phosphatized peb-bles (arrows) and dark rusty stain resulting from oxidation of iron sulfides.
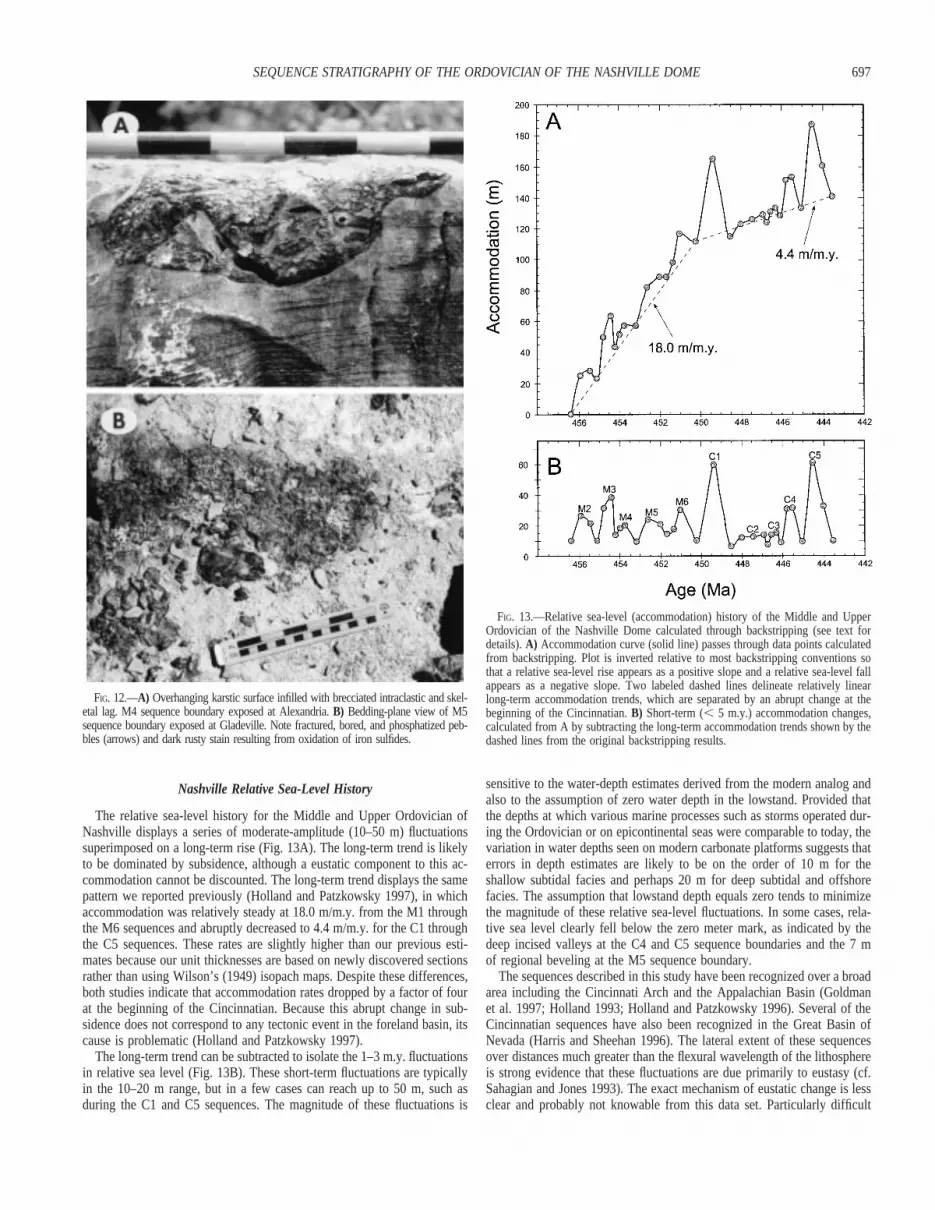
FIG. 13.—Relative sea-level (accommodation) history of the Middle and UpperOrdovician of the Nashville Dome calculated through backstripping (see text fordetails). A) Accommodation curve (solid line) passes through data points calculatedfrom backstripping. Plot is inverted relative to most backstripping conventions sothat a relative sea-level rise appears as a positive slope and a relative sea-level fallappears as a negative slope. Two labeled dashed lines delineate relatively linearlong-term accommodation trends, which are separated by an abrupt change at thebeginning of the Cincinnatian. B) Short-term (, 5 m.y.) accommodation changes,calculated from A by subtracting the long-term accommodation trends shown by thedashed lines from the original backstripping results.
Nashville Relative Sea-Level History
The relative sea-level history for the Middle and Upper Ordovician ofNashville displays a series of moderate-amplitude (10–50 m) fluctuationssuperimposed on a long-term rise (Fig. 13A). The long-term trend is likelyto be dominated by subsidence, although a eustatic component to this ac-commodation cannot be discounted. The long-term trend displays the samepattern we reported previously (Holland and Patzkowsky 1997), in whichaccommodation was relatively steady at 18.0 m/m.y. from the M1 throughthe M6 sequences and abruptly decreased to 4.4 m/m.y. for the C1 throughthe C5 sequences. These rates are slightly higher than our previous esti-mates because our unit thicknesses are based on newly discovered sectionsrather than using Wilson’s (1949) isopach maps. Despite these differences,both studies indicate that accommodation rates dropped by a factor of fourat the beginning of the Cincinnatian. Because this abrupt change in sub-sidence does not correspond to any tectonic event in the foreland basin, itscause is problematic (Holland and Patzkowsky 1997).
The long-term trend can be subtracted to isolate the 1–3 m.y. fluctuationsin relative sea level (Fig. 13B). These short-term fluctuations are typicallyin the 10–20 m range, but in a few cases can reach up to 50 m, such asduring the C1 and C5 sequences. The magnitude of these fluctuations is
sensitive to the water-depth estimates derived from the modern analog andalso to the assumption of zero water depth in the lowstand. Provided thatthe depths at which various marine processes such as storms operated dur-ing the Ordovician or on epicontinental seas were comparable to today, thevariation in water depths seen on modern carbonate platforms suggests thaterrors in depth estimates are likely to be on the order of 10 m for theshallow subtidal facies and perhaps 20 m for deep subtidal and offshorefacies. The assumption that lowstand depth equals zero tends to minimizethe magnitude of these relative sea-level fluctuations. In some cases, rela-tive sea level clearly fell below the zero meter mark, as indicated by thedeep incised valleys at the C4 and C5 sequence boundaries and the 7 mof regional beveling at the M5 sequence boundary.
The sequences described in this study have been recognized over a broadarea including the Cincinnati Arch and the Appalachian Basin (Goldmanet al. 1997; Holland 1993; Holland and Patzkowsky 1996). Several of theCincinnatian sequences have also been recognized in the Great Basin ofNevada (Harris and Sheehan 1996). The lateral extent of these sequencesover distances much greater than the flexural wavelength of the lithosphereis strong evidence that these fluctuations are due primarily to eustasy (cf.Sahagian and Jones 1993). The exact mechanism of eustatic change is lessclear and probably not knowable from this data set. Particularly difficult

698 S.M HOLLAND AND M.E. PATZKOWSKY
to explain are the larger-amplitude fluctuations, such as the M3, C1, andC5. Glacioeustasy is capable of driving large fluctuations on these timescales, but isotopic evidence strongly suggests a lack of significant conti-nental glaciation until the very end of the Ordovician (Brenchley et al.1994). Other mechanisms for producing tens of meters of sea-level changeover these time scales are unknown (Revelle 1990). The smaller fluctua-tions of a few meters to ten meters may be produced by a wider range ofmechanisms, including changes in groundwater and lake levels and changesin ocean temperature (Revelle 1990).
CONCLUSIONS
(1) Eleven depositional sequences are present in the Middle and UpperOrdovician of the Nashville Dome. With one exception, all lack lowstandsystems tracts and have combined sequence boundaries and transgressivesurfaces. Many of the sequence boundaries display some evidence of sub-aerial exposure in the form of regional truncation, minor paleokarst, andchertification, but a few show no clear evidence of subaerial exposure. Theselatter sequences may be type II sequences rather than type I sequences.
(2) Parasequences are present throughout the study interval, thoughsome deviate from the original definition in that they have relatively thickdeepening-upward intervals. At the onset of the Taconic orogeny, parase-quences undergo a major change in facies composition that reflects theswitch from a tropical-type to a temperate-type platform, the introductionof siliciclastics and phosphate, and the switch from a low-energy shelf toa high-energy ramp. In most cases, similar parasequences can be recognizedbefore and after the orogeny.
(3) Sequences undergo a change in architecture at the onset of the Ta-conic orogeny. Paleokarst features are much more common before the orog-eny than after, which may reflect an increasingly arid climate or the un-susceptibility of argillaceous temperate-type carbonates to dissolution. Pyr-itized and iron-stained hardgrounds are common at transgressive surfacesand atop grainstone-capped parasequences only following the onset of theorogeny. Their presence may indicate a change in ocean chemistry as aresult of oceanographic changes brought on by the orogeny. Finally, phos-phatic lags are much more common following the onset of the orogeny,because of the increased abundance of phosphate derived from upwellingin the newly deepened foreland basin and the resistance of phosphaticgrains to abrasion and dissolution.
(4) The relative sea-level history of the Middle and Upper Ordoviciancan be divided into two components. A long-term component of relativelylinear subsidence through the Middle Ordovician followed by linear butslower subsidence through the Upper Ordovician is likely to be controlledby the tectonic subsidence history of the Nashville Dome, but could containa long-term eustatic component. Short-term (1–3 m.y.) fluctuations of 10–50 m are likely due to eustasy, because the sequences they generate canbe correlated over a much broader area than any available tectonic mech-anism would predict.
ACKNOWLEDGMENTS
Acknowledgment is made to the Donors of the Petroleum Research Fund, admin-istered by the American Chemical Society, for support of this research. Maya Elrickand Mark Sonnenfeld made many helpful comments on an early draft of parts ofthis manuscript. We thank JSR reviewers Bruce Fouke and Mark Harris and Asso-ciate Editor David Osleger for their many helpful comments and suggestions. Thebackstripping program is available from SMH.
REFERENCES
ANGEVINE, C.L., HELLER, P.L., AND PAOLA, C., 1990, Quantitative sedimentary basin modelling:American Association of Petroleum Geologists, Continuing Education Course Notes, 133 p.
ASHLEY, G.M., 1990, Classification of large-scale subaqueous bedforms: a new look at an oldproblem: Journal of Sedimentary Petrology, v. 60, p. 160–172.
BEAUMONT, C., QUINLAN, G., AND HAMILTON, J., 1988, Orogeny and stratigraphy: numerical
models of the Paleozoic in the eastern interior of North America: Tectonics, v. 7, p. 389–416.
BOREEN, T.D., AND JAMES, N.P., 1995, Stratigraphic sedimentology of Tertiary cool-water lime-stones, SE Australia: Journal of Sedimentary Research, v. B65, p. 142–159.
BRENCHLEY, P.J., MARSHALL, J.D., CARDEN, G.A.F., ROBERTSON, D.B.R., LONG, D.G.F., MEIDLA,T., HINTS, L., AND ANDERSON, T.F., 1994, Bathymetric and isotopic evidence for a short-livedLate Ordovician glaciation in a greenhouse period: Geology, v. 22, p. 295–298.
BRETT, C.E., 1995, Sequence stratigraphy, biostratigraphy, and taphonomy in shallow marineenvironments: PALAIOS, v. 10, p. 597–616.
BRETT, C.E., AND BAIRD, G.C., 1995, Coordinated stasis and evolutionary ecology of Silurianto Middle Devonian faunas in the Appalachian Basin, in Erwin, D.H., and Anstey, R.L.,ed., New Approaches to Speciation in the Fossil Record: New York, Columbia UniversityPress, p. 285–315.
CHEN, J.-Y., 1988, Ordovician changes of sea level: New Mexico Bureau of Mines and MineralResearch, Memoir 44, p. 387–404.
COLLINS, L.B., 1988, Sediments and history of the Rottnest Shelf, southwest Australia: a swell-dominated, non-tropical carbonate margin: Sedimentary Geology, v. 60, p. 15–50.
DALLA SALDA, L.H., DALZIEL, I.W.D., CINGOLANI, C.A., AND VARELA, R., 1992, Did the TaconicAppalachians continue into southern South America?: Geology, v. 20, p. 1059–1062.
DELANO, J.W., SHIRNICK, C., BOCK, B., KIDD, S.F., HEIZLER, T., PUTNAM, G.W., DELONG, S.E.,AND OHR, M., 1990, Petrology and geochemistry of Ordovician K-bentonites in New YorkState: constraints on the nature of a volcanic arc: Journal of Geology, v. 98, p. 157–170.
DıAZ, J.R., 1996, Meteoric diagenesis of Ordovician limestones from Cannon County, Ten-nessee [unpublished M.S. thesis]: University of Georgia, Athens, Georgia, 70 p.
DIXON, J., 1976, Patterned carbonate—a diagenetic feature: Bulletin of Canadian PetroleumGeology, v. 24, p. 450–456.
DOROBEK, S.L., AND READ, J.F., 1986, Sedimentology and basin evolution of the Siluro-Devo-nian Helderberg Group, central Appalachians: Journal of Sedimentary Petrology, v. 56, p.601–613.
DROSER, M.L., AND BOTTJER, D.J., 1989, Ordovician increase in extent and depth of bioturbation:implications for understanding early Paleozoic eco-space utilization: Geology, v. 17, p. 850–852.
ELRICK, M., 1995, Cyclostratigraphy of Middle Devonian carbonates of the eastern Great Basin:Journal of Sedimentary Research, v. B65, p. 61–79.
ELRICK, M., 1996, Sequence stratigraphy and platform evolution of Lower–Middle Devoniancarbonates, eastern Great Basin: Geological Society of America, Bulletin, v. 108, p. 392–416.
FLEMINGS, P.B., AND JORDAN, T.E., 1990, Stratigraphic modeling of foreland basins: interpretingthrust deformation and lithosphere rheology: Geology, v. 18, p. 430–434.
FORDHAM, B.G., 1992, Chronometric calibration of mid-Ordovician to Tournaisian conodontzones: a compilation from recent graphic-correlation and isotope studies: Geological Mag-azine, v. 129, p. 709–721.
GOLDHAMMER, R.K., 1997, Compaction and decompaction algorithms for sedimentary carbon-ates: Journal of Sedimentary Research, v. 67, p. 26–35.
GOLDHAMMER, R.K., LEHMANN, P.J., AND DUNN, P.A., 1993, The origin of high-frequency plat-form carbonate cycles and third-order sequences (Lower Ordovician El Paso Gp, westTexas): constraints from outcrop data and stratigraphic modeling: Journal of SedimentaryPetrology, v. 63, p. 318–359.
GOLDMAN, D., MITCHELL, C.E., JOY, M.P., BAIRD, G.C., BRETT, C.E., AND DELANO, J.W., 1997,A sequence stratigraphic model for the Middle and Upper Ordovician strata in the Taconicforedeep of New York: eustasy and tectonics (abstract): Geological Society of America,Abstracts with Programs, v. 29, p. 49.
HARLAND, W.B., ARMSTRONG, R.L., COX, A.V., CRAIG, L.E., SMITH, A.G., AND SMITH, D.G., ED.,1990, A Geologic Time Scale 1989: Cambridge, U.K., Cambridge University Press, 263 p.
HARRIS, M.T., AND SHEEHAN, P.M., 1996, Upper Ordovician–Lower Silurian depositional se-quences determined from middle shelf sections, Barn Hills and Lakeside Mountains, easternGreat Basin, in Witzke, B.J., Ludvigson, G.A., and Day, J., ed., Paleozoic Sequence Stra-tigraphy: Views from the North American Craton: Geological Society of America, SpecialPaper 306, p. 161–176.
HARRIS, M.T., AND SHEEHAN, P.M., 1997, Carbonate sequences and fossil communities from theUpper Ordovician–Lower Silurian of the Eastern Great Basin: Brigham Young UniversityGeology Studies, v. 42, p. 105–128.
HOLLAND, S.M., 1993, Sequence stratigraphy of a carbonate–clastic ramp: the CincinnatianSeries (Upper Ordovician) in its type area: Geological Society of America, Bulletin, v. 105,p. 306–322.
HOLLAND, S.M., 1995a, Sequence stratigraphy, facies control, and their effects on the strati-graphic distribution of fossils, in Haq, B.U., ed., Sequence Stratigraphy and DepositionalResponse to Eustatic, Tectonic and Climatic Forcing: Dordrecht, The Netherlands, KluwerAcademic Publishing, p. 1–23.
HOLLAND, S.M., 1995b, The stratigraphic distribution of fossils: Paleobiology, v. 21, p. 92–109.
HOLLAND, S.M., AND PATZKOWSKY, M.E., 1996, Sequence stratigraphy and long-term lithologicchange in the Middle and Upper Ordovician of the eastern United States, in Witzke, B.J.,Ludvigsen, G.A., and Day, J.E., ed., Paleozoic Sequence Stratigraphy: Views from the NorthAmerican Craton: Geological Society of America, Special Paper 306, p. 117–130.
HOLLAND, S.M., AND PATZKOWSKY, M.E., 1997, Distal orogenic effects on peripheral bulge sed-imentation: Middle and Upper Ordovician of the Nashville Dome: Journal of SedimentaryResearch, v. 67, p. 250–263.
JAMES, N.P., AND BONE, Y., 1992, Synsedimentary cemented calcarenite layers in Oligo-Mio-cene cool-water shelf limestones, Eucla Platform, Southern Australia: Journal of Sedimen-tary Petrology, v. 62, p. 860–872.
JOHNSON, M.E., RONG, J.Y., AND FOX, W.T., 1989, Comparison of Late Ordovician epiconti-

699SEQUENCE STRATIGRAPHY OF THE ORDOVICIAN OF THE NASHVILLE DOME
nental seas and their relative bathymetry in North American and China: PALAIOS, v. 4, p.43–50.
JONES, B., AND DESROCHERS, A., 1992, Shallow platform carbonates, in Walker, R.G., and James,N.P., ed., Facies Models: Response to Sea Level Change: St. John s, Newfoundland, Geo-logical Association of Canada, p. 277–302.
KIDWELL, S.M., 1991, Condensed deposits in siliciclastic sequences: expected and observedfeatures, in Einsele, G., Ricken, W., and Seilacher, A., ed., Cycles and Events in Stratig-raphy: Berlin, Springer-Verlag, p. 682–695.
KNAUTH, L.P., 1979, A model for the origin of chert in limestone: Geology, v. 7, p. 274–277.KUNK, M.J., AND SUTTER, J.F., 1984, 40Ar/39Ar age spectrum dating of biotite from middle
Ordovician bentonites, eastern North America, in Bruton, D.L., ed., Aspects of the Ordo-vician System (Palaeontological Contributions from the University of Oslo 295): Oslo, Univ-ersitetsforlaget, p. 11–22.
OSLEGER, D., AND READ, J.F., 1991, Relation of eustasy to stacking patterns of meter-scalecarbonate cycles, Late Cambrian, U.S.A.: Journal of Sedimentary Petrology, v. 61, p. 1225–1252.
OSLEGER, D., AND READ, J.F., 1993, Comparative analysis of methods used to define eustaticvariations in outcrop: Late Cambrian interbasinal sequence development: American Journalof Science, v. 293, p. 157–216.
POPE, M.C., AND READ, J.F., 1993, Evidence for large high-frequency glacio-eustatic sea levelfluctuations in late Middle Ordovician cool water carbonates, Kentucky (abstract): Geolog-ical Society of America, Abstracts with Programs, v. 25, p. 338.
PURSER, B.H., AND EVANS, G., 1973, Regional sedimentation along the Trucial Coast, SE PersianGulf, in Purser, B.H., ed., The Persian Gulf—Holocene Carbonate Sedimentation and Dia-genesis in a Shallow Epicontinental Sea: Berlin, Springer-Verlag, p. 211–232.
READ, J.F., 1980, Carbonate ramp-to-basin transitions and foreland basin evolution, MiddleOrdovician, Virginia Appalachians: American Association of Petroleum Geologists, Bulletin,v. 64, p. 1575–1612.
READ, J.F., 1985, Carbonate platform facies models: American Association of Petroleum Ge-ologists, Bulletin, v. 69, p. 1–21.
READ, J.F., AND GROVER, G., JR., 1977, Scalloped and planar erosion surfaces, Middle Ordo-vician limestones, Virginia: analogues of Holocene exposed karst or tidal rock platforms:Journal of Sedimentary Petrology, v. 47, p. 956–972.
REVELLE, R., ED., 1990, Sea Level Change: National Research Council, Studies in Geophysics:Washington, D.C., National Academy Press, 234 p.
ROSS, J.R.P., AND ROSS, C.A., 1992, Ordovician sea-level fluctuations, in Webby, B.D., andLaurie, J.R., ed., Global Perspectives on Ordovician Geology: Rotterdam, A.A. Balkema, p.327–336.
ROWLEY, D.B., AND KIDD, W.S.F., 1981, Stratigraphic relationships and detrital composition ofthe medial Ordovician flysch of western New England: Implications for the tectonic evo-lution of the Taconic Orogeny: Journal of Geology, v. 89, p. 199–218.
SADLER, P.M., OSLEGER, D.A., AND MONTANEZ, I.P., 1993, On the labeling, length, and objectivebasis of Fischer plots: Journal of Sedimentary Petrology, v. 63, p. 360–368.
SAHAGIAN, D.L., AND HOLLAND, S.M., 1991, Eustatic sea-level curve based on a stable frame ofreference: preliminary results: Geology, v. 19, p. 1209–1212.
SAHAGIAN, D., AND JONES, M., 1993, Quantified Middle Jurassic to Paleocene eustatic variationsbased on Russian Platform stratigraphy: stage level resolution: Geological Society of Amer-ica, Bulletin, v. 105, p. 1109–1118.
SCHUTTER, S.R., 1992, Ordovician hydrocarbon distribution in North America and its relation-ship to eustatic cycles, in Webby, B.D., and Laurie, J.R., ed., Global perspectives on Or-dovician Geology: Rotterdam, A.A. Balkema, p. 421–432.
SCOTESE, C.R., AND MCKERROW, W.S., 1991, Ordovician plate tectonic reconstructions: Geo-logical Survey of Canada, Paper 90-9, p. 271-282.
STEARNS, R.G., AND REESMAN, A.L., 1986, Cambrian to Holocene structural and burial historyof Nashville Dome: American Association of Petroleum Geologists, Bulletin, v. 70, p. 143–154.
SWEET, W.C., 1984, Graphic correlation of upper Middle and Upper Ordovician rocks, NorthAmerican Midcontinent Province, U.S.A., in Bruton, D.L., ed., Aspects of the OrdovicianSystem: Oslo, Norway, University of Oslo, p. 23-35.
SWEET, W.C., 1988, Mohawkian and Cincinnatian chronostratigraphy: New York State Mu-seum, Bulletin 462, p. 84–90.
SWIFT, D.J.P., 1968, Coastal erosion and transgressive stratigraphy: Journal of Geology, v. 76,p. 444–456.
TUCKER, R.D., KROGH, T.E., ROSS, R.J., JR., AND WILLIAMS, S.H., 1990, Time-scale calibrationby high-precision U–Pb zircon dating of interstratified volcanic ashes in the Ordovician and
Lower Silurian stratotypes of Britain: Earth and Planetary Science Letters, v. 100, p. 51–58.
VAN WAGONER, J.C., 1995, Sequence stratigraphy and marine to nonmarine facies architectureof foreland basin strata, Book Cliffs, Utah, U.S.A., in Van Wagoner, J.C., and Bertram,G.T., ed., Sequence Stratigraphy of Foreland Basin Deposits: American Association of Pe-troleum Geologists, Memoir 64, p. 137–224.
VAN WAGONER, J.C., MITCHUM, R.M., CAMPION, K.M., AND RAHMANIAN, V.D., 1990, Siliciclasticsequence stratigraphy in well logs, cores, and outcrops: American Association of PetroleumGeologists, Methods in Exploration Series, No. 7, 55 p.
VOTAW, R.B., 1971, Conodont biostratigraphy of the Black River Group (Middle Ordovician)and equivalent rocks of the eastern Midcontinent, North America [unpublished Ph.D. thesis]:Ohio State University, Columbus, Ohio, 170 p.
WAGNER, C.W., AND VAN DER TOGT, C., 1973, Holocene sediment types and their distributionin the southern Persian Gulf, in Purser, B.H., ed., The Persian Gulf—Holocene CarbonateSedimentation and Diagenesis in a Shallow Epicontinental Sea: Berlin, Springer-Verlag, p.123–156.
WILSON, C.W., JR., 1948, Channels and channel-filling sediments of Richmond age in south–central Tennessee: Geological Society of America, Bulletin, v. 59, p. 733–765.
WILSON, C.W., JR., 1949, Pre-Chattanooga stratigraphy in central Tennessee: Tennessee Divi-sion of Geology, Bulletin 56, p. 1–407.
Received 4 November 1997; accepted 27 February 1998
APPENDIX: LOCALITY DESCRIPTIONS
Alexandria: Roadcuts along both sides of TN 53 at Smith / Dekalb county line,just north of Alexandria, TN. Alexandria, TN quad. 368 059 030 N, 868 019 490 W.
Bradshaw Creek: Composite of 2 outcrops. (1) Roadcut on south side of US 64,1.1 miles east of intersection with I-65. Frankewing, TN quad. 358 119 240 N, 868509 590 W. (2) Roadcuts on both sides of US 64 at Lincoln County / Giles Countyline. Frankewing, TN quad. 358 119 170 N, 868 499 490 W.
Fall Creek: Composite of 2 outcrops. (1) Roadcuts on both sides of TN 840, 3.2miles south of Wilson / Rutherford county line. Gladeville, TN quad. 368 009 310N, 868 259 290 W. (2) Roadcuts on both sides of TN 840, 1.8 miles south of Wilson /Rutherford county line. Gladeville, TN quad. 368 019 430 N, 868 259 470 W.
Frankewing: Composite of 2 outcrops. (1) Roadcuts along southbound onrampfrom US 64 / TN 15 to I-65 at exit #14. Frankewing, TN quad. 358 119 370 N, 868529 200 W. (2) Roadcuts along northbound onramp from US 64 / TN 15 to I-65 atexit #14. Frankewing, TN quad. 358 119 350 N, 868 529 120 W.
Garrison Creek: Roadcut on southeast side of Natchez Trace Parkway betweenmile markers 427 and 428, and 0.1 miles southwest of Garrison Creek picnic area.Theta, TN quad. 358 529 190 N, 878 029 040 W.
Gladeville: Composite of 2 outcrops. (1) Roadcuts on both sides of TN 840, 1.0mile north of TN 265 / Central Pike overpass. Martha, TN quad. 368 089 200 N,868 239 010 W. (2) Roadcuts on both sides of southbound exit ramp from TN 840to TN 265 / Central Pike. Martha, TN quad. 368 079 550 N, 868 239 470 W.
Pulaski: Composite of 3 outcrops. (1) Roadcut on south side of US 64 bypass,1.7 miles east of intersection with US 31 on south side of Pulaski. Tarpley, TNquad. 358 109 330 N, 868 599 170 W. (2) Roadcut on small service road immediatelysouth of and parallel to US 64 bypass, 1.5 miles east of intersection with US 31 onsouth side of Pulaski. Tarpley, TN quad. 358 109 260 N, 868 599 260 W. (3) Roadcuton south side of US 64 bypass, 0.1 miles east of intersection with TN 166 on southside of Pulaski. Pulaski, TN quad. 358 109 090 N, 878 029 580 W.
Richland Creek: Roadcut on north side of US 64 bypass, 0.7 miles east of inter-section with TN 166 and 1.5 miles west of intersection with US 31 on south sideof Pulaski. Pulaski, TN quad. 358 109 020 N, 878 029 260 W.
Locality descriptions of the following outcrops can be found in the appendix toHolland and Patzkowsky (1996): Bluff Creek, Briley Parkway, Carson Fork, CentralValley, Columbia North, Columbia West, Cripple Creek, Double Springs, Exit 32,Franklin, Gladdice, Hollis Creek, Lascassas, Lewisburg, Nashville Airport, Peyton’sWarehouse, Pierce’s Mill, Sam Ridley Highway, Tanglewood, Vietnam Vets High-way, Whip-poor-will Road.