Embed Size (px)
Citation preview

Sequential Logic Model Deciphers DynamicTranscriptional Control of Gene ExpressionsZhen Xuan Yeo1, Sum Thai Wong2, Satya Nanda Vel Arjunan4, Vincent Piras4, Masaru Tomita4, Kumar Selvarajoo4, Alessandro Giuliani3, MasaTsuchiya4*
1 Genome Institute of Singapore, Singapore, Singapore, 2 Bioinformatics Institute, Singapore, Singapore, 3 Department of Environment and Health,Instituto Superiore di Sanita’, Roma, Italy, 4 Institute for Advanced Biosciences, Keio University, Tsuruoka, Yamagata, Japan
Background. Cellular signaling involves a sequence of events from ligand binding to membrane receptors throughtranscription factors activation and the induction of mRNA expression. The transcriptional-regulatory system plays a pivotalrole in the control of gene expression. A novel computational approach to the study of gene regulation circuits is presentedhere. Methodology. Based on the concept of finite state machine, which provides a discrete view of gene regulation, a novelsequential logic model (SLM) is developed to decipher control mechanisms of dynamic transcriptional regulation of geneexpressions. The SLM technique is also used to systematically analyze the dynamic function of transcriptional inputs, thedependency and cooperativity, such as synergy effect, among the binding sites with respect to when, how much and how fastthe gene of interest is expressed. Principal Findings. SLM is verified by a set of well studied expression data on endo16 ofStrongylocentrotus purpuratus (sea urchin) during the embryonic midgut development. A dynamic regulatory mechanism forendo16 expression controlled by three binding sites, UI, R and Otx is identified and demonstrated to be consistent withexperimental findings. Furthermore, we show that during transition from specification to differentiation in wild type endo16expression profile, SLM reveals three binary activities are not sufficient to explain the transcriptional regulation of endo16expression and additional activities of binding sites are required. Further analyses suggest detailed mechanism of R switchactivity where indirect dependency occurs in between UI activity and R switch during specification to differentiation stage.Conclusions/Significance. The sequential logic formalism allows for a simplification of regulation network dynamics goingfrom a continuous to a discrete representation of gene activation in time. In effect our SLM is non-parametric and model-independent, yet providing rich biological insight. The demonstration of the efficacy of this approach in endo16 is a promisingstep for further application of the proposed method.
Citation: Yeo ZX, Wong ST, Arjunan SNV, Piras V, Tomita M, et al (2007) Sequential Logic Model Deciphers Dynamic Transcriptional Control of GeneExpressions. PLoS ONE 2(8): e776. doi:10.1371/journal.pone.0000776
INTRODUCTIONUnderstanding of dynamic control of gene regulatory networks is
a prime challenge in molecular biology. As gene regulatory
network is underpinned by dynamical interaction of transcrip-
tional-regulatory systems through transcriptional activation, tran-
scriptional-regulatory system can be considered as an elementary
component of gene regulatory networks [1,2,3,4,5]. Moreover,
substantial evidence supports that evolution and regulation of
transcriptional-regulatory systems are major contributing factor on
the variation and selection of biological phenotypes [6]. A
transcriptional-regulatory system is based on the presence of
transcription factor binding sites of genes which are responsible for
receiving temporal regulatory input signals, integrating these
signals and producing output in terms of gene expression [7]. The
relationship between regulatory input signals and gene expression
profile is a complex mapping [8,9,10,11,12] and combinatorial
regulatory inputs add further complexity to the entire framework
[8,10,13].
To decipher the dynamic regulation mechanism of a transcrip-
tional-regulatory system, a sequential logic model (SLM) is used to
demonstrate the existence of dynamical logical mapping between
trans-activation and temporal mRNA expression profiles. Our
efforts are driven by the following goals: 1. Generalization of
dynamical transcription for control and prediction of gene
expression at mRNA level using SLM. 2. Identify a formalism
that allows the extraction of the functional information that is
associated with transcriptional-regulatory components that control
mRNA expression (e.g. dynamic-function of cis-acting sites and
dynamic-dependency among the sites including cooperative
effects).
On the basis of this SLM, both characteristic equation analysis and
time-simulation analysis (Methods) have been developed to investigate
the dynamics of transcriptional-regulation circuits. Characteristic
equation is employed for systematically extracting the dynamic
function of cis-acting sites and their relationship in regulating gene
expression. Time-simulation analysis is performed to simulate gene
expression profile in mutagenesis analysis (in silico mutagenesis), to
predict novel gene expression profiles under different activity of cis-
acting sites (forward mapping) and to identify specific binding
activity when a particular expression profile is given (reverse
mapping). SLM is part of the logical model family and has a long
and established tradition in engineering and systems analysis; it is
distinctive from classical Boolean model by its capability for
Academic Editor: Andrea Califano, Columbia University, United States of America
Received March 12, 2007; Accepted August 2, 2007; Published August 22, 2007
Copyright: � 2007 Yeo et al. This is an open-access article distributed under theterms of the Creative Commons Attribution License, which permits unrestricteduse, distribution, and reproduction in any medium, provided the original authorand source are credited.
Funding: This work was supported by the Agency for Science, Technology andResearch of Singapore (A*STAR), Japan Science and Technology Agency/CoreResearch for Evolutional Science and Technology (JST CREST), Ministry ofEducation, Culture, Sports, Science and Technology of Japan (MEXT), andResearch fund by Yamagata Prefecture and Tsuruoka City, Japan.
Competing Interests: The authors have declared that no competing interestsexist.
* To whom correspondence should be addressed. E-mail: [email protected]
PLoS ONE | www.plosone.org 1 August 2007 | Issue 8 | e776

modeling of non-binary expression levels as well as for consideration
of dynamic behaviour. The state transition from present to next state
at a given time interval is expressed as an AND logic for activation of
cis-acting sites and present state conditions. Therefore, expression of
AND logic terms at a given time interval (characteristic equation)
manifests when the effect of activation of cis-acting sites, such as
enhancer and silencer, has occurred as well as logical dependence
among cis-acting sites. Construction and analysis of the SLM only
requires two input information: temporal gene expression profiles
and activity of cis-acting sites. Therefore, SLM is non-parametric and
model-independent, yet providing rich biological insight. Moreover
it can in principle incorporate other elements of gene regulation
different from TF like post-transcriptional regulation by means of
differential mRNA stability [14,15].
Our model is verified using a set of well studied expression data
on endo16, a marker for sea urchin gut development, provided by
Davidson’s group [9,10]. The choice of an embryonic develop-
ment gene regulation circuit allows us to circumvent all the
problems linked to the vagaries of gene expression noise and
modulating signals: in fact, it is well known that developing
embryo filters out the inherent genetic noise in order to follow
a specific temporal development scheme [16,17], which makes it
possible to treat the gene regulation as a deterministic logic
machine. In our verification model, three regulatory sites: Otx, R
and UI are selected due to their significant functions in controlling
the onset as well as transition of specification and differentiation
for the gut development of the species. Our model allows to
account for the entire endo16 gene expression dynamics as
controlled by Otx, R and UI cis-acting sites during transition
from specification of endomesoderm to differentiation of midgut in
sea urchin. For instance, our endo16 SLM clearly reveals when
repressive effect of R on the Otx cis-acting site occurs in order to
prepare for the transition from specification to differentiation of
the mid gut development. In addition, our model has the utility to
demonstrate that the activation of binding site of R and Otx is
distinct from the resultant functional activation of endo16
expression (e.g. Figure 1).
In this report, the construction and analysis of endo16 SLM are
first introduced to provide validation over our approach. Sub-
sequently, a mechanism of transcriptional-regulatory control on
endo16 expression is proposed on the basis of the analyses. This is
followed by Conclusion and Methods sections. In Methods section,
apart of the mathematical framework for our approach, three
synthetic models are included to further illustrate the features of
SLM analysis. Moreover, we also demonstrate the construction of
gene expression control at network level by combining multiple
SLMs that are representing different gene components of a gene
network (Methods).
RESULTS
Generation and first test of the modelTemporal activation of transcription factor binding sites is defined
as the occupation of transcription factors on these sites over time in
which causing the regulation mRNA expression of a particular
gene. For verification purposes, our approach is applied to
decipher cis-regulation of sea urchin endo16 temporal gene
expression data [9,10] to construct a sequential logical model;
although our approach can handle general transactivity, in this
section we only focus on cis-regulation due to the fact that we are
using mutation data on cis-acting sites of endo16. The strict
deterministic control exerted on gene expression during embryo
development makes this model system almost ideal for testing the
SLM approach. Recent work by Yuh et al [10] demonstrated that
the so called A and B modules are the main cis-regulatory regions
that control the expression of endo16 for specification and
differentiation of sea urchin gut development. In our analysis,
UI (Unique Factor I, characterized as Brn1/2/4 Yuh et al [18])
Figure 1. Identify time period required for preparation from specification to differentiation during midgut development. Left: the characteristicanalysis at 29–40 pfh and 40–50 pfh. The characteristic equation (Table 1) shows when repressive effect of R and Otx together occurs; Right: 29–40 pfh(red bar) and 40–50 pfh (blue bar) are corresponding time periods in the control profile. Given that UI, R and Otx are activated at 29–40 pfh,only UI drives the state transition from 012 state: R and Otx are independent of the state transition. However, at 40–50 pfh (UI, R and Otx remainactivated), the characteristic equation consists of the AND logic (ROtx)’ which indicates that (ROtx)’ is repressive: activation of R and Otx cooperativelyprevent the state rises from 102 to 112 since (ROtx)’ generates q0,t+1 = 0 when R = 1 and Otx = 1. Further analysis of Otx mutation (Table 3) shows R hasno effect on any state transition suggesting that R is a silencer to Otx at 40–50 pfh (main text).doi:10.1371/journal.pone.0000776.g001
Control of Gene Expression
PLoS ONE | www.plosone.org 2 August 2007 | Issue 8 | e776

and Otx (Orthodenticle-like) [19] are selected because they are the
key-drivers of module B and A respectively [10]. R is chosen as
another input since it is suggested to be critically involved in the
switching from specification of sea urchin endomesoderm to its
differentiation into embryonic gut. It has been shown that UI, R
and Otx are sufficient to resemble the regulation caused by
module A and B during the same developmental period [10]. A set
of temporal gene expression profiles related to UI, Otx and R sites
are elected for modeling. All temporal gene expression levels are
normalized with respect to the control BA-BpNCAT expression
profile in term of concentration of CAT (chloramphenicol acetyl
transferase) acting as reporter (i)Figure S1(A,B,D–F)).
Our modelling approach involves the discretization and
digitization of temporal mRNA expression profiles into a finite
number of levels (states), which are defined by discretization of
continuous/analogue gene expression levels (Step 1 & 2, Figure 2
and Methods). During the mapping process (Step 3&4), we
consider the variation in mRNA expression level (state) to exhibit
a behaviour in which the transition from present to the next state
only depends on the present state and the corresponding input
conditions. The input condition is defined as the activation state of
cis-acting sites (Step 2, Methods).From the BA-BpNCAT construct
(Figure S1(A)) the Otx input is considered as ‘on’ (represented by
1) if the sampling time falls between 18–48 post fertilization hours
(pfh), and ‘off’ (represented by 0) otherwise [10]. If the sampling
time falls between 24–72 pfh, we assign 1 to UI input only in this
period. R is always considered to be ‘on’ at all intervals within
0–72 pfh (refer Figure S1(A)). Hence, the temporal input condition
of UI, R and Otx is given as (0102, 0102, 0102, 0102, 0102, 0112,
0112, 1112, 1112, 1112, 1112, 1112, 1112, 1112, 1102, 1102, 1102,
1102, 1102, 1102), where a unit time interval is about 3.6 hours.
The optimum unit interval is chosen such that maximum number
of state transitions is obtained and minimum consecutively
identical states transitions are generated. Consecutively identical
states transitions occur at multiple unit time intervals due to over
sampling. Since such state transitions can be viewed as a single
state transition over a longer time interval, they are lumped locally
together to represent one state transition. The truth table for
endo16 only consists of state transitions extracted from results of
CAT reporter provided from the publications (Step 3). State
transitions that are not available are regarded as don’t care
conditions (Methods).
We present a single valued function of sequential logic mapping
(Eq. (1)) which suggests the involvement of extra number of cis-
acting sites in the transactivation control of gene expression BA-
BpNCAT during 50–61 pfh. The sequential logic mapping is
a single valued function since only a unique next state is given by
a particular pair of present state and input condition. However, we
found out that there are one-to-many correspondences occurring in
some of the temporal expression profiles. In a temporal expression
profile, B(UIm)A(Otxm)-BpNCAT (UIm: UI mutation; Otxm: Otx
mutation)(refers to Figure S1(B)) two different state transition occurs
from a unique pair of present state and input condition at 25–40 and
50–61 pfh respectively. Given 102 as present state and 0102 as input
condition of UI, R and Otx, two different next states, 102 at 25–
40 pfh and 012 at 50–61 pfh are mapped. State transition at 25–
40 pfh is selected base on two selection criteria: 1) The selected
transition is due to the combined activities of three cis-acting sites:
UI, R and Otx; 2) one-to-many correspondence for the chosen state
transition is not found in other expression profiles.
Beyond 25 pfh, in order to check the involvement of UI (first
criterion), we compare the next state of B(UIm)A(Otxm)-BpNCAT
(UI mutant) (refer to Figure S1(B)) and BA(Otxm)-BpNCAT (non-
UI mutant) (refer to Figure S2(B)) at time interval 25–40 pfh.
Under the same present state (102), no transition (102) is induced in
the UI mutant, whereas in the non-UI mutant, state transition to
112 level occurs. Therefore, UI is required for the state transition
of non-UI mutant. However, we are unable to conclude the UI
involvement at 50–61 pfh since the present state of BA(Otxm)-
BpNCAT is different from B(UIm)A(Otxm)-BpNCAT: two state
transitions are comparable if their present states are identical.
Criterion 2 is applied which reveals another one-to-many
correspondence occurring in a different profile when state
transition at 50–61 pfh is selected. In B(Rm)A-BpNCAT (Rm: R
mutation)(refer to Figure S1(B)) during 50–61 pfh and 74–80 pfh,
for the same present state (112) and the same input condition of
UI, R and Otx, 1002, two different next states are observed: 102 at
50–61 pfh and 112 at 74–80 pfh. This conflict (one-to-many
correspondence for the chosen state transition) suggests that the
binary activities of the three cis-acting sites, UI, R and Otx are not
enough to understand state transition activity at 50–61 pfh in the
wild type expression profile and additional cis-acting sites are
required in sequential logic modeling. The findings not only
specified the requirement of extra regulatory site, it also identified
when such regulation is occurring.
A simple analysis of sequential logic mapping reveals coopera-
tivity and conditional effect of three transcription factors, UI, R
and Otx. Pertaining to the case of endo16, present states are divided
into four levels: 002; 012; 102; 112, corresponding to basal
(46105 mol per embryo), threshold (86105 mol per embryo),
specification (126105 mol per embryo) and differentiation (16
6105 mol per embryo) respectively from analysis in Yuh et al. [9,10].
These states are used in both characteristic equation and simulation
analysis (Step4, Methods). The simplified logical equation (sequential
logic equation, SLE) of endo16 SLM is derived and shown in Eq. (1)
(Table S1 shows the corresponding truth table).
q1,tz1
q0,tz1
� �~
q01q0UIzq1q00UIzq0UIR0zq0UIOtx0
q01UI 0Otxzq01q0UI 0zq1UIR0zq1UIOtx0
� �ð1Þ
where q1,t q0,t and q1,t+1 q0,t+1 are binary variables representing
present and next state respectively; UI, R and Otx (italic for variable)
are the binary variables for the input condition of the three cis-acting
sites.
The characteristic equation analysis is achieved by substituting
input conditions into variables UI, R and Otx in Eq. (1). (Methods).
The equations given in Table 1 allow for the derivation of some
important insights about the role played by the different actors in
time:
1. When present state equals to basal (002) level, Otx functions
as an activating site since state increase only if Otx = 1,
provided that UI = 0. Otx activation occurs between 0–
25 pfh of the control expression profile whereas UI is not
activated during this time period. The result suggests Otx
activation function as a ‘kick off’ switch for endo16 expression.
2. At the threshold (012) level, the characteristic equation
suggests that state transition is only dependent on UI
(Table 1). This is clearly shown during 25–40 pfh of the
control expression profile that equally shows that, at this
level, the state transition is independent of R and Otx. Thus,
UI alone plays a role as gene driver to increase endo16
expression level beyond threshold level at 25–40 pfh.
3. If present state has reached the specification (102) level,
activation of R and Otx (R = 1 and Otx = 1) will initiate
a repressive effect on gene expression (refer to Figure S1(B)).
This situation can be found during 40–50 pfh of control
Control of Gene Expression
PLoS ONE | www.plosone.org 3 August 2007 | Issue 8 | e776

Figure 2. Overviews of SLM and analyses. Step 1. Obtain temporal transcriptional activation and corresponding time-series expression data; Step 2.SLM Mapping: Dicretization and digitization into time-series bar chart; Step 3. Truth table construction: tabulate the digitized data into present states,input conditions and next states; Step 4. Mathematical mapping: Characteristic equation analysis and time simulation analysis; Step 5. Networkmotifs construction: integration of multiple SLMs to form gene network model.doi:10.1371/journal.pone.0000776.g002
Control of Gene Expression
PLoS ONE | www.plosone.org 4 August 2007 | Issue 8 | e776

expression profile (Figure 1). As long as both R and Otx are
activated, the state will not increase from specification to
differentiation (112) level. The characteristic equation con-
tains the repressive term: (ROtx)’ ((ROtx)’ = 0 for R = 1 and
Otx = 1) at specification level (Table 2). This implies that Otx
and R sites operate together to introduce a repressive effect
on gene expression such that the state cannot achieve
differentiation level. One interesting point to note is that
although cis-acting sites, R and Otx are activated during 29–
50 pfh, repressive activation occurs only during 40–50 pfh.
This result clearly demonstrates that activation of binding
site of R and Otx is distinct from the resultant functional
activation of endo16 expression (Figure 1).
4. Previous experimental analyses from Yuh et al [10] suggested
activation of R switch depends on UI activation. Character-
istic equation analysis further explores and specifies that
whether the dependency is a direct or indirect. A direct
dependency is due to physiochemical interaction of two TFs
(formation of functional complex) whereas indirect de-
pendency occurs when two TFs are interacting via a third
party (no complex formation) (see Methods: Prediction of
interactions between transcriptional binding sites from the transition
map). When R switch repression occurs (at 30–48 pfh, state
transition from 102 to 102), UI = 1, R = 1 and Otx = 1
(Table 2), suggests the function of R switch depends on the
activation of UI. Since, the UI(ROtx)’ term consists UI
outside the parentheses of (ROtx)’, therefore, UI is not
considered as part of the repressive complex, hence
indicating R switch is indirectly dependent on UI
activation.
From the above considerations, it is cleared that how we can
easily derive from the characteristic equation a detailed tale of the
roles played by the different regulators at subsequent times and
their mutual interactions in a way formally similar to sensitivity
analysis in differential equation style but allowing for a much
greater flexibility (Table 2).
In-silico mutagenesis of endo16 cis-regulatory
regionHaving obtained a reliable SLM describing cis-regulation by
means of detailed analysis of the correspondence between
activation states of the transcription factors and the reporter gene
temporal profile, we tested the model by means of a sort of in-silico
mutagenesis (Methods). Since the state transitions in the truth table
only carry information within the time periods 0–50 pfh and
61–s80 pfh, the model derived from the truth table is not supposed
to perform simulation with time period of 0–80 pfh. Hence,
a truncated-time-simulation for 0–50 pfh and 61–80 pfh are
executed separately with different initial state conditions. The
initial condition for present state in all expression profiles within
0–50 pfh is equal to 002 basal level by default whereas the initial
state for expression profiles within 61–80 pfh is varying. The initial
state of BA?Bp-CAT for 61–80 pfh, for instance, is found to be
threshold level in the discretized profiles of the raw data (refer to
Table 2. Functional effect of combinatorial input condition instate transition for endo16 SLM.
. . . . . . . . . . . . . . . . . . . . . . . . . . . . . . . . . . . . . . . . . . . . . . . . . . . . . . . . . . . . . . . . . . . . . .
Input condition State transition Function
Otx 00R01 Activation
R 00R00 No effect/Repression
01R01 No effect/Repression
UI 00R00 No effect/Repression
01R10 Activation
10R11 Activation
11R11 Activation
UI R 00R00 No effect/Repression
01R10 Activation
10R11 Activation
11R11 Activation
R Otx 00R01 Activation
01R00 No effect/Repression
UI Otx 01R10 Activation
10R11 Activation
11R11 Activation
UI R Otx 01R10 Activation
10R10 No effect/Repression
doi:10.1371/journal.pone.0000776.t002....
....
....
....
....
....
....
....
....
....
....
....
....
....
....
....
....
....
....
....
....
..
Table 1. Summary of characteristic equation analysis for endo16 SLM with Otx, R and UI as variable of input conditions.. . . . . . . . . . . . . . . . . . . . . . . . . . . . . . . . . . . . . . . . . . . . . . . . . . . . . . . . . . . . . . . . . . . . . . . . . . . . . . . . . . . . . . . . . . . . . . . . . . . . . . . . . . . . . . . . . . . . . . . . . . . . . . . . . . . . . . . . . . . . . . . . . .
Present state(expression)
Characteristic equation(from Eq. (1)) Activity of cis-acting sites Function of cis-acting sites
00 q1,tz1
q0,tz1
� �~
0UI 0Otx
� �N Otx = 1 increases state iff UI = 0 N Otx is an activating site
N R is independent N UI is an repressive site
N R has no effect
01 q1,tz1
q0,tz1
� �~
UI
UI 0
� �N UI = 1 increases state N UI is an activating site
N R and Otx are independent N R and Otx have no effect
10 q1,tz1
q0,tz1
� �~
UI
UI(ROtx)0
� �N UI = 1 increases state if either or both R and Otx equal to 0 N UI is an activating site
N UI = 1 remains at present state if both R and Otx equal 1 N R and Otx has repressive effect
11 q1,tz1
q0,tz1
� �~
UI(ROtx)0
UI(ROtx)0
� �N UI = 1 increases state if either or both R and Otx equal to 0 N UI is an activating site
N Reduced state if both R and Otx equal 1 N R and Otx has repressive effect
doi:10.1371/journal.pone.0000776.t001....
....
....
....
....
....
....
....
....
....
....
....
....
....
....
...
Control of Gene Expression
PLoS ONE | www.plosone.org 5 August 2007 | Issue 8 | e776

Figure S1(A)). Same procedure is applied for forward and reverse
mapping mentioned in the next section.
The above procedure allows for the derivation of the functional
consequences of different mutations of the system:
1. Unlike wild type, the R mutant (R = 0, Table 3) reaches
a premature differentiation level early at about 40–50 pfh.
This differentiation can be achieved even if Otx is activated
since (ROtx)’ = 1 (Table 1).
2. UI mutant is investigated by setting UI = 0. Threshold level is
the maximum state that can be achieved and there is no
differentiation level in UI mutant. UI mutant can establish
a threshold level only when Otx is activated. Subsequently,
the mutation of Otx (Otx = 0) introduces a profile similar to R
mutant where an early differentiation expression level at 40–
50 pfh is identified when Otx is mutated.
The operational consequences of simultaneous mutations of
different sites can be investigated as well: three different mutant
couples (ROtx)m , (UIOtx)m and (UIR)m are generated by setting
(R = 0, Otx = 0), (UI = 0, Otx = 0) and (UI = 0, R = 0) respectively.
Some consequences of these double mutations can be derived:
1. If initial state is equal to basal level, (ROtx)m will always
remain in the same state.
2. In the case of (UIOtx)m, from any state different from
threshold level, R activation has no effect and the expression
profile always remains at basal level.
3. Expression profile generated by (UIR)m is restricted to
threshold level and the only non-mutated input, Otx, is
functional at low state (002, 012).
These results highlight other dependencies among the cis-acting
sites not evident from the simple characteristic equation analysis.
The identical logic equations of (OtxR)m and Otxm indicate that
R has no effect. Table 1 shows that the AND logic (OtxR)’
(repression) is found in the characteristic equations that are derived
from setting 012 and 102 as present state. Hence, R functions as
silencer in which the repressive effect is dependent on the activation
of Otx (Figure 1 and Figure S1(C)).
Forward and Reverse Mapping: predict novel
expression and profile specific binding activities of
UI, R and OtxForward mapping is applied on endo16 sequential logic equation to
infer a novel temporal gene expression profile with a given
temporal activity of cis-acting sites (input condition), whereas
reverse mapping can be used to deduce possible input conditions
from a given temporal gene expression profile (details in Methods).
Forward mapping is performed to replicate the expression
profile of BA-BpNCAT for verification of endo16 SLM. The state
transitions during 50–61 pfh are excluded in endo16 sequential
logic modelling. Truncated-time-simulation is performed where
forward mappings for 0–50 pfh and 61–80 pfh are carried out
separately with different initial present state (Figure 3). To simulate
the profile beyond 61 pfh the present state is reset at 47–50 pfh.
Next, forward mapping with a novel input series is used to prove
the statement Otx is the driver of Module A, to do so the following
series: input condition (UIt Rt Otxt) (0002, 0002, 0002, 0002, 0002,
0012, 0012, 0012, 0012, 0012, 0012, 0012, 0012, 0012, 0002, 0002,
0002, 0002, 0002, 0002) is substituted into Eq. (1). This simulation
indicates that the state level is 012 during 18–50 pfh and is 002
otherwise. The results generate good approximation to experi-
mentally observed Otx-BpNCAT (refers to Figure S2(B)). This
confirms Otx as the main driver for module A.
Reverse mapping is applied on a specific expression profile in
which the differentiation level (112) is achieved before 21 pfh, for
the estimation of a series of input condition that establish such an
expression profile. The particular state level for reverse mapping
Table 3. Combinatorial mutant logic equations for in silico mutagenesis of endo16 SLM.. . . . . . . . . . . . . . . . . . . . . . . . . . . . . . . . . . . . . . . . . . . . . . . . . . . . . . . . . . . . . . . . . . . . . . . . . . . . . . . . . . . . . . . . . . . . . . . . . . . . . . . . . . . . . . . . . . . . . . . . . . . . . . . . . . . . . . . . . . . . . . . . . .
Mutation x site (x = 0) Characteristic equation (from Eq. (1)) Remarks
R = 0 q1,tz1
q0,tz1
� �~
UI(q1zq0)
q01(q0zOtx)UI 0zq1UI
� �N Exceed 102 state during specification stage (control profile)
N Establish differentiation expression level earlier
UI = 0 q1,tz1
q0,tz1
� �~
0q01Otxzq01q0
� �N Cannot exceed 012 (Threshold level)
N No differentiation expression
N Only driven by Otx
Otx = 0 q1,tz1
q0,tz1
� �~
UI(q1zq0)q01q0UI 0zq1UI
� �N Exceed 102 state during specification stage (control profile)
N Establish differentiation expression level earlier
N R has no effect
R = 0 q1,tz1
q0,tz1
� �~
UI(q1zq0)q01q0UI 0zq1UI
� �N Always remain at basal level unless present state is brought to 012
Otx = 0
UI = 0 q1,tz1
q0,tz1
� �~
0
q01q0
� �N R has no effect
Otx = 0 N Always remain at basal level except present state is 012
UI = 0 q1,tz1
q0,tz1
� �~
0q01Otxzq01q0
� �N Cannot exceeds 012 (Threshold level)
R = 0 N Otx only functions at low state (002, 012)
doi:10.1371/journal.pone.0000776.t003....
....
....
....
....
....
....
....
....
....
....
....
....
....
....
....
....
....
....
....
....
.
Control of Gene Expression
PLoS ONE | www.plosone.org 6 August 2007 | Issue 8 | e776

during 0–21 pfh is given as 002 012 102 102 112 112 112. The results
of reverse mapping provide 216 possible combinations of temporal
input conditions in total. However, it is known that R activation is
time-invariant in endo16 mRNA expression. As a result, only 2 out of
the 216 possible combinations are selected under the condition
where R is always being activated (Table 4). Reverse mapping
analysis suggests that activation of UI and Otx in advance and then
followed by earlier deactivation of Otx can result in the expression
reaching differentiation level before 21 pfh.
Regulatory mechanism for endo16 expression
during gut specification to differentiationThe sequential logic analyses (characteristic equation analysis and
simulation analysis) are able to model the regulatory mechanism
Figure 3. Forward mapping and in silico mutagenesis of endo16 SLM. (A) Discretized profile of BA-Bp?CAT at 0–50 and 61–72 pfh are reproducedby forward mapping. (B) In silico mutagenesis of R is achieved by providing input series with R is always set to 0. State transition to differentiationexpression level occurred early at 40–50 pfh. The rest of the state transition beside 40–50 pfh is same as Figure 3(A). (C) In silico mutagenesis with Otxas the only input condition; the state transitions are generated to show similar expression profile to that of A-Bp?CAT ((Figure S1 (A))doi:10.1371/journal.pone.0000776.g003
Table 4. Reverse mapping of given endo16 expression profilewhen R is considered to be always activated.
. . . . . . . . . . . . . . . . . . . . . . . . . . . . . . . . . . . . . . . . . . . . . . . . . . . . . . . . . . . . . . . . . . . . . .
Unit time (pfh) State transition Possible Input (UI R Otx) combination
0–3.6 00R01 011
3.6–7.2 01R10 110/111
7.2–10.8 10R10 111
10.8–14.4 10R11 110
14.4–18 11R11 110
18–21.6 11R11 110
doi:10.1371/journal.pone.0000776.t004....
....
....
....
....
....
....
....
....
....
..
Control of Gene Expression
PLoS ONE | www.plosone.org 7 August 2007 | Issue 8 | e776

for endo16 expression during gut specification to differentiation as
follows.
During 0–25 pfh, Otx functions as an activation site that drives
the endo16 expression level from basal to threshold level. The
threshold level holds a role of temporal checkpoint for specification
level to occur since UI is unable to drive the expression further (to
reach specification level) if threshold level is not reached. Beyond
25 pfh (transition from threshold to specification level), Otx has no
activating effect on endo16 expression even though the site is still in
activation. Just above threshold level, UI is activated and has
begun to drive the expression profile to the specification level.
Although activation of UI is able to drive the endo16 expression
beyond differentiation level during 70–80 pfh [10], it is found that
the expression does not exceed specification level between 25–
70 pfh even UI is activated. Hence, a repressive effect must be
present to prevent UI from driving the expression beyond
specification level. In fact, apart from earlier (0–25 pfh) activation,
Otx exhibits a repressive effect at the period of 40–50 pfh when R
is activated. When present state is 102 (specification level), the
characteristic equation derived from Eq. (1) consists of (ROtx)’
(Table 1) term, which indicates that presence of both R and Otx
prevents a state jump from 102 to 112 state within 40–50 pfh. The
repressive effect plays an important role for specifying collabora-
tive effect of ROtx as an essential switching control from
specification to differentiation. The maintenance of specification
level at 40–50 pfh is required such that gene expression does not
reach differentiation level (state greater than 102) at the earlier
developmental stage. During 50–61 pfh, additional cis-acting sites
other than UI, R and Otx are responsible to turn off the
specification expression (from 102 to 012) as the only committed
cells are preparing for differentiation expression. Upon removal of
Otx activation at later stage, R repression is deactivated, i.e.
differentiation expression is allowed to begin only when Otx
control is absent.
DISCUSSIONThe analysis based on the sequential logic modeling consists of
characteristic equation and simulation analyses. Analysis of SLM
systematically extracts functional information on transcriptional
activities hidden in mutation on cis-acting sites and corresponding
gene expression data. Nevertheless, to attain input condition, SLM
construction is not restricted on the usage of mutation data. For
instance a model can be derived by the observations coming from
a pharmacological intervention on specific trans-activating
inducers.
The discrete nature of SLM operates noise suppression on the
experimental data by collapsing the continuous value of expression
into modal classes. Characteristic equation analysis allows for
systematic identification of the key function of cis-acting sites and
the logical relationship between the sites. Our model reveals that
the function of a cis-acting site can vary under different present
state instead of solely determined by input condition. The
variation of the function of cis-acting site due to different present
state is defined as conditional effect of state transition. This
conditional effect can be due to several factors, including the
consequence of DNA structure remodeling, co-factor activity or
other mechanical and chemical process such as covalent
modification during transcription. These results can provide the
mean for hypothesis formulation and experimental design in
understanding the mechanism of transcription.
Three time-simulation analyses, in silico mutagenesis, forward
and reverse mapping can be achieved based on sequential logic. In
silico mutagenesis, performed by deactivating cis-acting sites,
provides prediction of mutant expression profiles and identifies
global functional activity of cis-acting sites in the gene expression.
In contrast, characteristic equation analysis reveals local functional
activities with given present state and input condition. Forward
mapping is employed for prediction of novel or uncharacterized
temporal expression profile under different input conditions. The
forward mapping simulation establishes a platform to investigate
the variation in dynamics of the activation of cis-acting sites. Lastly,
reverse mapping is a useful feature to suggest possible input
condition in a dynamical manner, which leads to a particular
expression profile. The resulting time series of input conditions
provide indication for the dynamics of transcription factors that
are involved in transcriptional regulation. As a potential approach
for constructing gene regulatory network, reverse mapping could
be used to extract active signaling pathways. These signaling
pathways are associated with the activity of these transcription
factors from the given temporal RNA expressions.
In summary, sequential logic modelling has provided a non-
parametric, model independent, dynamic and quantitative ap-
proach to facilitate systematic analysis of cis-regulatory system. At
current stage, only the expression level is non-Boolean whereas the
activation of cis-acting site is still considered as binary. Recent
study on embryonic development also shows that the possibility of
representing gene relative activation by means of few states is
totally consistent with recent computational and experimental
findings [18,20,21,22,23,24].
The concentration effect of transcription factor during tran-
scription can be incorporated in our approach as non-binary
activation of cis-acting sites [23,25]. In our subsequent work, we
are focusing on dealing with the binding effect (defined as
occupancy by Bolouri et al [23] and Istrail et al [24]) of
transcription factors on the activation of cis-acting sites to
generalise the simple on/off model of activation. This can be
simply carried out by assigning two (or more) binary number for
activation of each cis-acting site (e.g., UIRUI1UI0) which is same
as dealing with the expression state, q1q0.
A fully differentiated biological system may display a more
analogical behaviour of gene regulation. We handle this situation
in i) cis-acting sites activation as well as ii) gene mRNA induction.
In i), activation level of cis-acting sites is discretized (beyond on/off)
based on transcription factor concentration (see above). In ii), gene
regulatory networks have often been considered to be naturally
‘discretized processes’ [26,27]. Bistable and multistable (and hence
discrete) hysteretic switches, enabling cells to adopt multiple
internal expression states in response to an external input have
a pivotal impact on biological systems, ranging from cell-fate
decisions to cell-cycle control [26]. This has to do with the
modular and hierarchical characteristics of biological systems. For
example, the existence of ‘modules’ implies some form of
discretization occurs while any form of hierarchy implies the
possibility to define ‘discrete layers’. The choice of the ‘optimal
discretization’ when in presence of a sufficient amount of data can
be based on the maximization of explained variance by a cluster
analysis procedure [28,29], a well studied statistical problem. A
specific observation is assigned to its ‘discrete class’ on the basis the
minimum distance to the k centroid values (average values for the
studied variables, in this case the clustering variable is only one
and corresponds to the expression level of the correspondent gene)
relative to the best k-means cluster solution. The optimal number
of clusters k (discrete classes) is maximizing the model explained
variance (R-square), namely, the ratio between the variance of the
distribution of the single statistical units coded by the relative
cluster centroid value and the original distribution total variance.
Our discretization procedure is based on the analysis of Yuh et
al. [9,10], which utilizes experimental replicates for noise
Control of Gene Expression
PLoS ONE | www.plosone.org 8 August 2007 | Issue 8 | e776
averaging effect. However, we can extend our discussion on the
effect of noise to the construction of SLM, after the optimal
discretization is obtained, by the following 2 points: a) discretiza-
tion is a well known technique to reduce noise in engineering field.
With sufficient data, using basic statistical analysis such as looking
at standard deviation and mean values, we can appropriately
discretize the state levels in both transcription factor binding
activation and mRNA expression. In the case of a sufficiently high
number of observations, a data driven discretization process can
be performed by means of k-means cluster analysis [28,29] by
assigning each observation to the nearest cluster. The noise is not
a major issue for this approach given that substituting actual value
with the cluster centroid value (cluster = discrete classes) facilitates
the noise filtration. b) If a wrong transition state occurs due to the
noise, this will be seen in simulation analysis, e.g. i) result in
conflicting binding activation (in comparison to experimental data
for modelling) by Reverse mapping, Step 4b, ii) multiple state
transitions occurs for same input and present state by Forward
mapping, Step 4b; however, this type of errors are not expected to
be frequent if clusters are well formed (e.g. k-means cluster analysis
is bounded to generate clusters with the most separate as possible).
Endo 16 data is particularly a favourable example i) as it based on
a very good previous experimentation and ii) clearly because
developmental system is under strict control and consequently the
classes of concentrations (discretization) are easy to detect.
ConclusionWe have developed the model on a particularly well known
regulation system, acting in a quasi-deterministic matter so to
provide a reliable development scheme. This promises to be
potentially fruitful avenue for the systematic analysis of gene
regulation networks in general. The main strength of the model
resides in its flexibility: it allows for different roles played by the
same factors in different instants of times and different initial
conditions such as in understanding of time-delay in cis-regulation
of gene expression. One interesting feature of SLM can be traced
back to the possibility of dramatically reducing the complexity of
parameterization in regulatory circuits that until now have
hampered the classical differential equation approach in time-
course modeling of regulatory networks. Moreover, the proposed
method ends up with a description of the modeled regulation
circuits into easily understandable way to the mainframe biologists
without the need of mathematical formalisms which are relatively
difficult to grasp.
METHODS
The sequential logic models (SLM)The SLM constitutes of the following 5 operations (Figure 2):
1. Obtaining data for temporal transcriptional activation and
corresponding temporal gene expression data from experi-
ments/literatures. Additionally, the information of active
transcriptional regulatory sites can also be estimated
computationally [30,31,32]
2. Discretization of gene expression level and expression time:
The full range (maximum level–minimum level among data)
of continuous gene expression levels is subdivided into
multiple discrete and equally separated states. Concurrently,
the time axis of the profile has also been discretized by
sampling the gene expression data at fixed time intervals. b)
Digitization of gene expression level and transcriptional
activity associated with unit time interval: Each discretized
expression state is encoded with binary value. There are
maximally 2n states can be coded by n number of binary bit.
For transcriptional activity, a binary input value representing
the activation of single transcriptional-regulatory site that
associates to the current state transition is assigned to each
interval. The set of binary input values (multiple activations)
is called input condition. Input condition is defined as the
activity of transactivation on cis-acting sites. A value of 1 (of
binary variable) denotes activation, whereas a value of
0 denotes deactivation. Binary variable, x’ is defined as
complementary representation of the binary variable, x.
3. Truth table construction: A truth table is a tabulated
representation that illustrates the mapping of possible state
(expression level) transitions under various input conditions,
which obtained from digitized temporal gene expression
profiles. The table includes the information of the states at
time t (present states), input conditions at time t and states at
time t+1 (next states) (three main columns). Present state and
next state are represented by (q1,t q0,t)and (q1,t+1 q0,t+1)
respectively, where qn,t and qn,t+1 refer to the nth bit (n = 0,1)
at present state (time interval t) and next state (time interval
t+1) respectively (Table 5). When binary transcriptional
activation is considered, there are 2m of possible input
conditions, where m is number of inputs (e.g. number of
transcription factor binding sites). If there are k = 2n states
and m cis-acting sites, the total number of row for a complete
table is equal to 2k+m.
4. Mathematical Mapping by SL (Text S1): The mapping can
be represented as a finite state machine (finite state
automata) [33,34] which consists of a finite number of states
(expression states), transitions between those states, and
inputs (transcriptional activity). The output of the ‘machines’
is equal to the next state. In general, the next state is
a function (F) of present input and present state (refers to
Mealy model [35]). F can be represented as sum of AND
logics in binary system [35], this function is called sequential
logic equation (SLE). On the basis of SLE, both character-
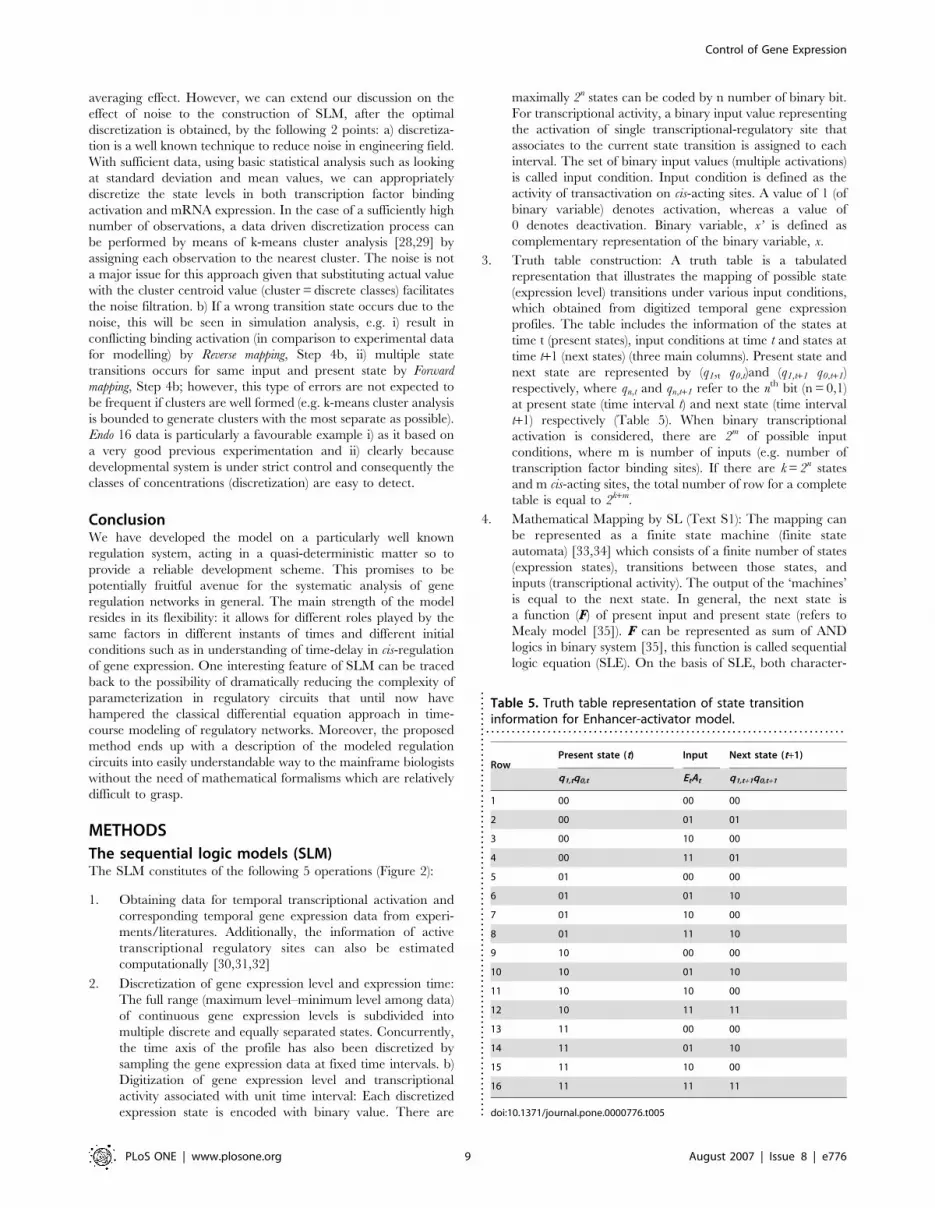
Table 5. Truth table representation of state transitioninformation for Enhancer-activator model.
. . . . . . . . . . . . . . . . . . . . . . . . . . . . . . . . . . . . . . . . . . . . . . . . . . . . . . . . . . . . . . . . . . . . . .
RowPresent state (t) Input Next state (t+1)
q1,tq0,t EtAt q1,t+1q0,t+1
1 00 00 00
2 00 01 01
3 00 10 00
4 00 11 01
5 01 00 00
6 01 01 10
7 01 10 00
8 01 11 10
9 10 00 00
10 10 01 10
11 10 10 00
12 10 11 11
13 11 00 00
14 11 01 10
15 11 10 00
16 11 11 11
doi:10.1371/journal.pone.0000776.t005....
....
....
....
....
....
....
....
....
....
....
....
....
....
....
....
....
....
....
....
...
Control of Gene Expression
PLoS ONE | www.plosone.org 9 August 2007 | Issue 8 | e776

istic equation analysis and time-simulation analysis have
been developed to investigate the dynamics of transcription-
al-regulation. a) Characteristic equation analysis involves the
substitution of present state into its state variables in SLE and
forming a simplified equation that characterised the
transcriptional regulation by input variables at the particular
present state. The simplified characteristic equations de-
termine the dynamic functions and interactions among
transcriptional binding sites. b) Time-simulation analysis is
performed to simulate gene expression profile in mutagenesis
analysis (in silico mutagenesis), to predict novel gene expression
profiles under different activity of cis-acting sites (forward
mapping) and to identify specific binding activity when
a particular expression profile is given (reverse mapping).
5. Gene regulatory network motif construction: When more
than two genes are regulated by identical inputs, we
construct each corresponding SLE and combine then and
consider as co-regulated gene network of SLMs to describe
gene regulatory network motifs.
To further illustrate our approach conceptually, three synthetic
models are introduced at the following sections. In order to
develop binary cis-regulatory system through synthetic models, we
consider 2 cis-acting sites with binary activation and 2 bits
expression state discretization (n = 2 and m = 2 in Eq. (2)).
Synthetic Model: Enhancer-activator (EA) sequential
logic modelTo illustrate the utility of our SLM, we developed a synthetic
model for EA binding (Figure 4) consisting of four temporal gene
expression output profiles (Figure 2, Step 1). The gene expression
level is discretized into four states by two binary bits (Step 2). Input
conditions, E and A are binary variables that represent the
activation (on/off) of the two cis-acting sites E and A. E and A are
specifically designed as non-synergistic enhancer and activating
site respectively. The complete truth table (Table 5) is constructed
from 16 possible state transition that represents the mapping
between activation of cis-acting sites and temporal mRNA
expression profiles described in Figure 2 (Step 3). Present state
and next state are represented by two binary variables, q1,t q0,t and
q1,t+1 q0,t+1 respectively. The current state, q1,t q0,t is simplified as q1
q0. Construction of SL equation is a standard procedure in digital
design [35]. For instance, from 8th row at Table 5, the next state
level, q1,t+1 q0,t+1 is 102, where q1,t+1 = 1 and q0,t+1 = 0. The first bit
(Least Significant Bit) of the next state, q0,t+1 produces 1 only when
q1 = 0, q0 = 1, E = 1 and A = 1. This condition is AND logic.
Therefore, the corresponding logical term (minterm) of q0 t+1 is given
as q1’q0EA (Figure 5). Subsequently, the sequential logic equation
corresponding to Table 5 is constructed (Step 4):
q1,tz1
q0,tz1
" #~
q01q0E0Azq01q0EAzq1q00E0Azq1q00EAzq1q0E0Azq1q0EA
q01q00E0Azq01q00EAzq1q00EAzq1q0EA
" #ð2Þ
Eq. (2) can be further simplified (factorized) into Eq. (3)
computationally by Quine-McCluskey algorithm or identified
graphically by Karnaugh Map [35].
q1,tz1
q0,tz1
� �~
q1Azq0A
q01q00Azq1EA
� �ð3Þ
Determination of dynamic function of transcriptional
binding sites using Eq. 3: cooperativity and physiochemical
variation (Step 4a) The construction of characteristic equation
for Eq. (3) requires setting present state, q1,t q 0,t equal to either of
002, 012, 102 or 112. As a result, four simpler mapping equations,
which are now functions of E and A, represent four characteristic
Figure 4. Synthetic model for activation of E and A inputs. (A) Only exhibits basal expression without binding of transcription factors. (B) Binding oftranscriptional activator on activation site increase the expression level. (C) Binding of another activator on enhancer does not alter expression level.(D) Expression level is highly elevated in comparing to (B) when both activator site and enhancer are bound.doi:10.1371/journal.pone.0000776.g004
Control of Gene Expression
PLoS ONE | www.plosone.org 10 August 2007 | Issue 8 | e776

equations corresponding to the four present states respectively
(Table 6). By setting E and A to either 1 or 0, the next state is
obtained under these input conditions. For example, if present
state, q1q0 = 002, then the characteristic equation derived from Eq.
(3) becomes q1,t+1 = 0 and q0,t+1 = A (Table 6). Firstly, this shows
that the state transition from present state, 002 to next state only
depend on A and it is independent from E. Secondly, if A is set to 1
(A is activated), the state will rise from 002 (present state) to 012
(next state). Otherwise, if A = 0 then there is no effect. Hence, A is
concluded to be an activating site at 002 state and E has no effect
under the same condition. Characteristic equation at 102 present
state, q1,t+1 = A and q0,t+1 = EA, shows that activation of E site act as
an enhancer to A as followed: 1) E has no effect if A = 0; 2) State
transition remains at 102 state if E = 0; 3) State is transited to 112
state (1 level increment) if both A and E are activated. Moreover,
comparison of different characteristic equation with identical
present states can reveals when the enhancer function of E cis-
acting site occurs (Figure 6).
Prediction of interactions between transcriptional
binding sites from the transition map (Step 4a) Using the
Table 6. Summary of characteristic equation analysis for Enhancer-activator model.. . . . . . . . . . . . . . . . . . . . . . . . . . . . . . . . . . . . . . . . . . . . . . . . . . . . . . . . . . . . . . . . . . . . . . . . . . . . . . . . . . . . . . . . . . . . . . . . . . . . . . . . . . . . . . . . . . . . . . . . . . . . . . . . . . . . . . . . . . . . . . . . . .
Present state (expression) Characteristic equation (from Eq. (3)) Activity of transcriptional inputs Function of transcriptional inputs
00 q1,tz1
q0,tz1
� �~
0
A
� �N A = 1increases state N A is an activating site
N E is independent N E has no effect
01 q1,tz1
q0,tz1
� �~
A
0
� �N A = 1 increases state N A is an activating site
N A = 0 reduces state N E has no effect
N E is independent
10 q1,tz1
q0,tz1
� �~
A
EA
� �N A = 1 increases state iff E = 1 N A is an activating site
N A = 0 reduces state N E is an enhancer to A
N E is independent if A = 0 N E and A has activating effect
N E = 0 holds state at ‘10’ if A = 1
11 q1,tz1
q0,tz1
� �~
A
EA
� �N A = 1 increases state iff E = 1 N A is an activating site
N A = 0 reduces state N E is an enhancer
N E is independent if A = 0 N E and A has activating effect
N E = 0 reduces state
doi:10.1371/journal.pone.0000776.t006....
....
....
....
....
....
....
....
....
....
....
....
....
....
....
....
....
....
....
Figure 5. Construction of sequential logic mapping between dynamic transactivity and a state transition. State (expression level) is representedby the two binary numbers, q1,t+1q0,t+1. (A) Activation of E and A inputs (E = 1, A = 1) generates the state transition from 012 to 102. The mappingbetween the activation of EA sites (Transcriptional activity) and the state transition (Gene expression)) is established by q1,t+1 = q1’q0EA and q1,t+1 = 0,where minterm (AND logic), q1’q0EA is 1 only if q1 = 0, q0 = 1, E = 1 and A = 1. (B) The mapping between input (E = 0, A = 1) and the state transition from112 to 102 is established by q1,t+1 = q1q0E’A and q0,t+1 = 0, where minterm q1q0E’A is 1 only if q1 = 1, q0 = 1, E = 0 and A = 1.doi:10.1371/journal.pone.0000776.g005
Control of Gene Expression
PLoS ONE | www.plosone.org 11 August 2007 | Issue 8 | e776

Boolean conditions of each state transition generated from a given
characteristic equation defining one state level (Eq. S4), we can
determine possible functions and interactions between binding
sites for this state level. All possible Boolean combinations between
two Boolean variables (minterms) X and Y describing the
activation state of two binding sites X and Y can have a different
interpretation to determine dependency between two binding sites,
cooperativity and anti-cooperativity, and also binding sites functions
(repression, enhancement). For example, dependency of two binding
sites, X and Y can be determined in minterms motifs such as XY,
(XY)’, XY’ or (XY’)’, whereas non-dependency of X and Y are
determined for motifs X+Y and (X+Y)’ (manuscript in preparation).
In endo16 model, the (ROtx)’ motif was found in the characteristic
equations, determining dependency of R and Otx binding sites, and
describing R-Otx complex activity as one repressor. Moreover,
conditional effect can be determined by observing the different
interpretation we can find for some given binding sites for the other
characteristic equations at different state levels.
SLE for Synergistic EA (SEA) and Conditional EA (CEA)
model (Step 4a) A non-linear binding activity event is modeled
via slight modification of minterm on Eq. (3). Eq. (4) demonstrate
SLE for synergy effect on EA binding sites and Eq. (5) for
conditional EA (when the same transcription activation causes
different state transitions, there is the presence of a so-called
conditional effect).
q1,tz1
q0,tz1
� �~
q1Azq0A
q01q00AzEA
� �ð4Þ
q1,tz1
q0,tz1
� �~
q0Azq1E0A
q00Azq1E0Azq01EA
� �ð5Þ
Synergistic effect, from characteristic equation (Table 7), is
observed in (012R112) state transition. The activation of A
alone increases the state by one step (102): A is an activating site.
On the other hand, the deactivation of A alone decreases the state
by one step (002): the activation of E alone has no effect. This
suggests that E and A act in synergy at 012 state.
In conditional Enhancer-activator model (Eq. (5)), the activation
of E and A show synergistic as well as repressive effect. Eq. (5)
illustrates that E and A are synergistic at 012 state (same
characteristic equation derived from Eq. (4), Table 7 and
Table 8). At present state, 112, characteristic equation (q1,t+1 = A
and q0,t+1 = E’A) shows repressive effect: activation of both E and A
generates (112R102) transition. The repressive effect is clearly
shown by the AND logic, E’A, since E’A is 1 only if E = 0 (off) and
A = 1 (on). This suggests that some physiochemical change occur in
the activation of E site as compared to activation of the synergistic
transition. Therefore, our SLM can point changes arising from
conditional effects such as physicochemical regulation of gene
expression.
Control of temporal gene expression by varying E and A
dynamically (Step 4b) In silico mutagenesis of EA (Eq. (3)), SEA
(Eq. (4)) and CEA model (Eq. (5)) are performed to demonstrate
the effect of E and A site mutants on temporal gene expression
profile (Figure 7). For in-silico mutagenesis of EA model, we
consider the deactivation of binding sites by setting E, A or both to
zero in Eq. (3). Setting A = 0 implies that all states remain at 002.
However, setting E = 0 means that 112 state cannot occur in the
mutant expression profile (Figure 7(A)). This result shows that the
temporal functional activity of the site E have an enhancer effect
only at 102 state and above. Similarly, for in-silico mutagenesis of
SEA model and CEA model, Figure 7(B) & Figure 7(C) show the
differential role of E (not always an enhancer) at different time
points. This suggests when conditional effect occurs on E acting site
through the 6. activity of transcription factor. Furthermore, in-silico
mutagenesis of the three models clearly indicates when the mutant
state transitions are occurred, which implies changes in rate of
gene expression between the wild-type and mutant conditions.
Forward and Reverse Mapping (Step 4b) Dynamic
simulation for forward mapping can be performed with novel
input conditions to infer a temporal gene expression (Step 4). For
Figure 6. Identification of dynamic functional activities of transcriptional inputs for EA model (Eq. (3)). Function of identical transcription factorbinding activity is not unique over time due to the dynamic nature. Left: characteristic equation analyses; Right: Colours (red and blue) indicate statetransitions corresponding to the analyses. From Left, characteristic equation of the model at 012 present state indicates that while E and A sites areactivated, E has no effect in the state transition from t3 to t4. The next state is generated by the characteristic equation q1,t+1 = A and q0,t+1 = 0, inwhich there is no E variable, i.e., E is independent of the state transition. The characteristic equation at 102 present state, q1,t+1 = E and q0,t+1 = EAshows that E is only functioning as enhancer at time t = t8 (see Right) when present state equals to 102 provided that A = 1. This example showscharacteristic equation analysis can reveal when the enhancer function of E site occurs. (see conditional effect in Methods).doi:10.1371/journal.pone.0000776.g006
Control of Gene Expression
PLoS ONE | www.plosone.org 12 August 2007 | Issue 8 | e776

example, given the starting state is 002, and if an arbitrary
temporal input series (EtAt) (t = 0, 1,..11) is given: (002 012 012 012
112 112 112 112 002 102 102 102), substituting these conditions into
Eq. (4), a new series of next state (q1,t+1 q0,t+1) (t = 0,1,..11) is
produced: (002 012 102 102 112 112 112 112 002 002 002 002).
Forward mapping based on a complete SLM (a complete truth
table) could provide a complete picture of how dynamic activation
of cis-acting sites via temporal activity of transcription factors is
able to control temporal gene expression. In order to illustrate the
process of extraction of input condition by reverse mapping (Step
4), a state transition map representation for Table 5 is constructed
in Figure 8(A). The state transition map describes the transition
from a state at one time point to another state at the following time
point under a particular input condition. It is possible that forward
mapping points to more than one time series of input conditions
being generated by reverse mapping. In fact, in our case, there are
64 possible combinations of input series are suggested (Figure 8(B)),
each one able to generate expression profiles given by forward
mapping. The multiple input series could account for system
robustness, given that it allows for more than one time series of
Table 8. Conditional Enhancer-activator model.. . . . . . . . . . . . . . . . . . . . . . . . . . . . . . . . . . . . . . . . . . . . . . . . . . . . . . . . . . . . . . . . . . . . . . . . . . . . . . . . . . . . . . . . . . . . . . . . . . . . . . . . . . . . . . . . . . . . . . . . . . . . . . . . . . . . . . . . . . . . . . . . . .
Present state (expression) Characteristic equation (from Eq. (5)) Activity of transcriptional inputs Function of transcriptional inputs
00 q1,tz1
q0,tz1
� �~
0
A
� �N A = 1increases state N A is an activating site
N E is independent N E has no effect
01 q1,tz1
q0,tz1
� �~
A
EA
� �N A = 1 increases state N A is an activating site
N A = 0 reduces state N E is an enhancer
N E is dependent if A = 0 N E and A has synergistic effect
N Synergistic activation occurs if A = 1 and E = 1
10 q1,tz1
q0,tz1
� �~
E0AA
� �N A = 1 increases state iff E = 0 N A is an activating site
N A = 0 reduces state N E is a repressive site
N E is dependent if A = 0 N E and A has repressive effect
N E = 1 reduces state
11 q1,tz1
q0,tz1
� �~
A
E0A
� �N A = 1 increases state iff E = 0 N A is an activating site
N A = 0 reduces state N E is a repressive site
N E is dependent if A = 0 N E and A has repressive effect
N E = 1 reduces state
doi:10.1371/journal.pone.0000776.t008....
....
....
....
....
....
....
....
....
....
....
....
....
....
....
....
....
....
....
....
Table 7. Synergistic Enhancer-activator model.. . . . . . . . . . . . . . . . . . . . . . . . . . . . . . . . . . . . . . . . . . . . . . . . . . . . . . . . . . . . . . . . . . . . . . . . . . . . . . . . . . . . . . . . . . . . . . . . . . . . . . . . . . . . . . . . . . . . . . . . . . . . . . . . . . . . . . . . . . . . . . . . . .
Present state (expression) Characteristic equation (from Eq. (4)) Activity of transcriptional inputs Function of transcriptional inputs
00 q1,tz1
q0,tz1
� �~
0
A
� �N A = 1increase state N A is an activating site
N E is independent N E has no effect
01 q1,tz1
q0,tz1
� �~
A
EA
� �N A = 1 increase state N A is an activating site
N A = 0 reduces state N E is an enhancer
N E is independent if A = 0 N E and A has synergistic effect
N Synergistic activation occurs if A = 1 and E = 1
10 q1,tz1
q0,tz1
� �~
A
EA
� �N A = 1 increases state iff E = 1 N A is an activating site
N A = 0 reduces state N E is an enhancer
N E is independent if A = 0 N E and A has activating effect
N E = 0 holds state at 102 if A = 1
11 q1,tz1
q0,tz1
� �~
A
EA
� �N A = 1 increases state iff E = 1 N A is an activating site
N A = 0 reduces state N E is an enhancer
N E is independent if A = 0 N E and A has activating effect
N E = 0 reduces state
doi:10.1371/journal.pone.0000776.t007....
....
....
....
....
....
....
....
....
....
....
....
....
....
....
....
....
....
....
....
Control of Gene Expression
PLoS ONE | www.plosone.org 13 August 2007 | Issue 8 | e776

input conditions to achieve the same temporal state transition.
Reverse mapping can be used to infer transactivity on cis-acting
sites from temporal gene expression at a time interval of interest.
Incomplete sequential logic model: don’t care
conditionThus far four binary variables: q1, q0, E and A are considered in
truth table construction and sixteen different state transitions are
required for the construction of complete truth table. In practical,
there will be cases where some of the state transitions are yet to be
obtained from experimental mRNA expression profiles and are
regarded as don’t care conditions [35]. For don’t care condition,
the next state of the state transitions is conventionally set to 002.
Existing state transitions from incomplete truth table, however, are
not affected by additional state transition in don’t care condition:
additional information in don’t care condition only gives rise to
state transition with a new set of present state and input condition,
which does not overlapped with present state and input condition
of existing state transitions. Therefore, characteristic equations
corresponding to existing state transitions are invariant under
additional information in don’t care condition. However, for
forward mapping and in silico mutagenesis, if present state and
input condition for don’t care condition become current mapping
condition, then the remaining time series is unreliable. In reverse
mapping, if next state is 002, it is also not possible to distinguish
present input conditions derived from don’t care condition and
existing state transition.
Figure 7. In silico mutagenesis: comparison of wild type and mutant expression profiles with 3 models. (A) EA model shows E is an enhancer; (B)SEA model shows E is a synergistic enhancer and (C) CEA model reveals E is a synergistic enhancer as well as silencer. Figure 7 also shows when thoseeffects of the E site occur. Wild type profiles: (A)–(C) are generated by Eq. (3), (4) and (5) with given input condition: EtAt = (102 002 012 112 102 002 012
112 112 012 002 002), where t = t0–t11. The corresponding mutant profiles are obtained by setting Et = 0 in input condition.doi:10.1371/journal.pone.0000776.g007
Control of Gene Expression
PLoS ONE | www.plosone.org 14 August 2007 | Issue 8 | e776

Synthetic network motifs (Step 5)We have discussed the systematic construction and analyses of
single SLM. In this section, we demonstrate that combination of
two connected SLMs which termed as network motif shows the
control of gene regulation at network level (Figure 9 and Table 9).
A network motif is defined as pattern or architecture of
connectivity in gene network that consists of specific regulatory
function and recur significantly more often than randomized
network [36,37,38]. Furthermore, we consider the possibility
where the input condition (e.g. E and A) of SLM is a function of its
output state (e.g. q1,t+1,q0,t+1), i.e. modeling of auto-regulative
motif. For example, if we consider a positive feed-forward motif
where one of the inputs of the second EA model is the output of
the first EA model, we have two model equations systems for each
EA model defined as the following:
M1 :q1,tz1
q0,tz1
� �~
q1Azq0A
q01q0Azq1E1A
� �ð6Þ
and
M2 :q1,tz1
q0,tz1
� �~
q1Azq0A
q01q0Azq1E2A
� �ð7Þ
In the case where E2 is a function of the output of the first EA
model, E2 is written as fq1,tz1
q0,tz1
� �M1
� �. For the 1-bit input E2 has
2 values: 0 and 1; and for 2-bits input of the first EA model can
have 4 values: 00, 01, 10, and 11. The function f determines the
output state of the first EA model which corresponds to the input
state of E2. M1 and M2 can be considered as one single block
(M1–M2) via f mapping. And we can determine the equation
model for the composite of the two EA models:
M2�M1~M20M1q1,tz1
q0,tz1
� �~
q1Azq0A
q01q0Azq1fq1,tz1
q0,tz1
� �M1
� �A
264
375 ð8Þ
In general, the same principle can be applied to construct various
complexities of gene network motifs. (Figure 9 and Table 9).
Biological dataThe temporal endo16 expression profiles were quantitated via CAT
(chloramphenicol acetyltransferase) reporter assays [9,10,39,40].
The method for the generation of endo16 expression profile had been
well described [10,39,40]. In these experiments, a 2.3 kb region in
the promoter of endo16 is cloned along with a CAT reporter gene.
This promoter region is chosen as it is able to represent the full
expression pattern of endo16 gene in sea urchin development
[10,39,40]. The function and organisation of endo16 regulatory
sequences in the region were well characterized [9,10,18,39,40].
SUPPORTING INFORMATION
Text S1
Found at: doi:10.1371/journal.pone.0000776.s001 (0.03 MB
DOC)
Table S1
Found at: doi:10.1371/journal.pone.0000776.s002 (0.04 MB
DOC)
Figure 8. Construction of state map representation and reverse mapping of EA model. (A) The state transition map (finite state machine),constructed using truth table (Table 5), consists of four states (purple circles), 10 state transitions (in arrow) and 16 input conditions (binary valuesassociated to each arrow). (B) Using the state transition map in (a) the temporal binding activity corresponding digitized gene expression profile (002
012 102 102 112 112 112 112 002 002 002 002) is inferred (reverse mapping). There are 11 state transitions in 12 time steps. Following the 12 arrows instate transition map, there are 2 possible inputs (01, 11) for each of the first two transitions (002R012R102), 1 possible input for the next fivetransitions and 2 possible inputs for the final four transitions. In total, 64 possible combinations of input series are suggested where these input seriesare able to generate expression profile given by forward mapping.doi:10.1371/journal.pone.0000776.g008
Control of Gene Expression
PLoS ONE | www.plosone.org 15 August 2007 | Issue 8 | e776

Figure 9. Construction of gene network via SLMs: Synthetic network motifs. (A)–(D) Four sets of SLMs that resemble four fundamental units areconsidered for construction of multiple gene network motifs (Table 9): EA/SEA models (positive regulation, set 1); Silencer-activator (SA)/SynergisticSA models (repressive regulation, set 2); By considering input condition of E site for set 1 as a function of its output state, an auto-regulative positivefeedback is constructed; we denote this set as Simple positive feedback (set 3). Similarly, a silencer version of unit network motif for auto-regulativefeedback, Simple negative feedback, is formed by considering input condition of S site for set 2 as a function of its output state (set 4). (E)–(I) Toextend the single SLM approach to genes network, several combinations of two SLMs representing two genes, each regulated by two cis-acting sitesare constructed based on the four set of fundamental units albeit with auto-regulative feedback replaced by inter-genetic feedback control (Table 9).In addition, all of these combinations are co-regulated networks with common activator site (A/A1). A co-regulated network is defined as set of genesthat contained at least one common active cis-acting site. The simplest form of co-regulated network occurred when no direct connectivity foundbetween two SLMs where Both Gene1 and Gene2 are linked by their common regulatory sites: E and A ((E)). Non-auto-regulative feedforward andfeedback control can occur if Gene1 and Gene2 are connected by at least one of the gene product. Thus, in addition to intra-genetic-feedback controlthat happened in single SLM ((C)–(D)), network motifs constructed by multiple SLMs can exhibit inter-genetic-feedforward and feedback control. Ininter-genetic-feedback control, the input condition of a SLM is now a function of output state from another SLM. Given that output signal from Gene2is function as feedback signal onto Gene1, the input condition of Gene1, X1, is defined as a function of output state of Gene2: X1 = X1(q1,t+1,Gene2, q0,t+1,
Gene2) where X1 can be either an enhancer or an silencer Gene1 ((H)–(I)). Inter-genetic-feedforward control is defined similarly to inter-feedback controlwhere X2 = X2(q1,t+1,Gene1, q0,t+1, Gene1) since we consider output signal from Gene1 to be the feedforward signal onto Gene2 ((F)–(G)).doi:10.1371/journal.pone.0000776.g009
Control of Gene Expression
PLoS ONE | www.plosone.org 16 August 2007 | Issue 8 | e776

Figure S1 Figures obtained from [10]. (A) Effect of mutation of
the R site in BA-Bp?CAT. The timecourse of expression of this
construct (B(Rm)A-Bp?CAT, orange curve) is compared with that
of the BA-Bp?CAT control (red), and to that of B-Bp?CAT (green)
and A-Bp?CAT (blue). (B) Same input condition and present state
generates different state transitions by B(UIm)A(Otxm)-Bp?CAT.
The timecourse of expression of the double mutation B(UI-
m)A(Otxm)-Bp?CAT (black) is compared with BA-Bp?CAT (red)
and the triple mutation B(UIm,CB2m)A(Otxm)-Bp?CAT (magen-
ta). From the profile of B(UIm)A(Otxm)-Bp?CAT, given that 102
as present state and 0102 as input condition of UI, R and Otx, two
different next states, 102 at 25–40 pfh and 012 at 50–61 pfh are
mapped. (C) Successive pathways of spatial and temporal control
within the endo16 cis-regulatory system. The diagram summarizes
results from several previous studies (Yuh et al., 1996; Yuh et al.,
1998; Yuh and Davidson, 1996). Module (Mod) A functions are
shown in red; Module B functions in blue. Early in development
the endo16 gene responds to a ubiquitous activator (SpOtx1)
binding in Module A, but in order to achieve accurate spatial
expression, activity must be extinguished outside the veg2
endomesodermal domain by repressors binding in the upstream
modules (F, E and DC). Later in development, the activity of
a transcriptional regulator (UI) binding in Module B rises and the
internal BA intermodule input switch shuts off Otx input so that
the system is now driven only by Module B input. This input is
amplified in Module A, which provides the sole communication
with the basal transcription apparatus. (D) Direct demonstration of
repression function mediated by the R target site. The timecourse
generated by a construct consisting of three copies of an
oligonucleotide that represents the R target site (Figure 3) ligated
to A-Bp?CAT ([R3]A-Bp?CAT, orange curve) is compared with
the timecourse of A-Bp?CAT, blue. (E) Additional mutation of UI
in a BA construct carrying the R mutation also negates the effect
of the R mutation. An average of two experiments is shown in
which the output of B(UIm,Rm)A-Bp?CAT (green) is seen to be
very similar to that of B(UIm)A-Bp?CAT (purple). That is, though
the R sites is intact in B(UIm)A-Bp?CAT, it fails to repress the
activity of Module A in this context. As controls, BA-Bp?CAT (red)
and A-Bp?CAT (blue) are shown in normal embryos of the same
batch of eggs. (F) The UI site alone produces the late rise in
expression. Output kinetics are shown from an experiment in
which only the UI site has been left intact (construct [UI]-
Bp+?CAT of Table 1) so that it alone provides regulatory input
into the enhanced basal promoter (black). This construct produces
exactly the same output as does [UI-R-CB2]-Bp+?CAT (orange),
again generating the late rise in expression. However, the output is
Table 9. Synthetic network motifs constructed by SLMs.. . . . . . . . . . . . . . . . . . . . . . . . . . . . . . . . . . . . . . . . . . . . . . . . . . . . . . . . . . . . . . . . . . . . . . . . . . . . . . . . . . . . . . . . . . . . . . . . . . . . . . . . . . . . . . . . . . . . . . . . . . . . . . . . . . . . . . . . . . . . . . . . . .
Network motifs Sequential Logic Equations (SLEs) Comments
A. Simple EAM1
q1,tz1
q0,tz1
� �~
q1Azq0A
q01q00Azq1EA
� �or M2
q1,tz1
q0,tz1
� �~
q1Azq0A
q01q00AzEA
� �EA model (M1)/Synergistic EA model (M2)
B. Simple SAM3
q1,tz1
q0,tz1
� �~
(q1zq0)S0
(q1Szq00S0)A
� �or M4
q1,tz1
q0,tz1
� �~
(q1zq0)S0
q00S0A
� �SA model (M3)/Synergistic SA model (M4)
C. Simple positive feedbackM1
q1,tz1
q0,tz1
� �~
q1Azq0A
q01q00Azq1EA
� �or M2
q1,tz1
q0,tz1
� �~
q1Azq0A
q01q00AzEA
� �EA model (M1)/Synergistic EA model (M2)
E = E(q1,t+1, q0,t+1)
D. Simple negative feedbackM3
q1,tz1
q0,tz1
� �~
(q1zq0)S0
(q1Szq00S0)A
� �or M4
q1,tz1
q0,tz1
� �~
(q1zq0)S0
q00S0A
� �SA model (M3)/Synergistic SA model (M4)
S = S(q1,t+1, q0,t+1)
E. Simple co-regulated genenetwork
M1q1,tz1
q0,tz1
� �~
q1Azq0A
q01q00Azq1EA
� �or M2
q1,tz1
q0,tz1
� �~
q1Azq0A
q01q00AzEA
� �Two EA model (M1)/Synergistic EA model (M2)
F. Positive feedforward networkM1
q1,tz1
q0,tz1
� �~
q1A1zq0A1
q01q00A1zq1E1A1
� �or M2
q1,tz1
q0,tz1
� �~
q1A1zq0A1
q01q00A1zE1A1
� �Two EA model (M1)/Synergistic EA model (M2)
and E2 = E2(q1,t+1,Gene1, q0,t+1, Gene1)
M1q1,tz1
q0,tz1
� �~
q1A1zq0A1q01q00A1zq1E2A1
� �or M2
q1,tz1
q0,tz1
� �~
q1A1zq0A1q01q00A1zE2A1
� �
G. Negative feedforward networkM1
q1,tz1
q0,tz1
� �~
q1A1zq0A1
q01q00A1zq1E1A1
� �or M2
q1,tz1
q0,tz1
� �~
q1A1zq0A1
q01q00A1zE1A1
� �An EA model (M1)/Synergistic EA model (M2) &an SA model (M3)/Synergistic SA model (M4)
and S2 = S2(q1,t+1,Gene1, q0,t+1, Gene1)
M3q1,tz1
q0,tz1
� �~
(q1zq0)S10
(q1S1zq00S10)A1
� �M4
q1,tz1
q0,tz1
� �~
(q1zq0)S10
q00S10A1
� �
H. Positive feedback & negativefeedforward network
M1q1,tz1
q0,tz1
� �~
q1A1zq0A1q01q00A1zq1E1A1
� �or M2
q1,tz1
q0,tz1
� �~
q1A1zq0A1q01q00A1zE1A1
� �An EA model (M1)/Synergistic EA model (M2) &an SA model (M3)/Synergistic SA model (M4)
and E1 = E1(q1,t+1,Gene2, q0,t+1,Gene2)
M3q1,tz1
q0,tz1
� �~
(q1zq0)S10
(q1S1zq00S10)A1
� �M4
q1,tz1
q0,tz1
� �~
(q1zq0)S10
q00S10A1
� �S2 = S2(q1,t+1,Gene1, q0,t+1,Gene1)
I. Negative feedback & positivefeedforward network
M3q1,tz1
q0,tz1
� �~
(q1zq0)S10
(q1S1zq00S10)A1
� �or M4
q1,tz1
q0,tz1
� �~
(q1zq0)S10
q00S10A1
� �An SA model (M3)/Synergistic SA model (M4) &an EA model (M1)/Synergistic EA model (M2)
and S1 = S1(q1,t+1,Gene2, q0,t+1,Gene2)
M1q1,tz1
q0,tz1
� �~
q1A1zq0A1
q01q00A1zq1E2A1
� �or M2
q1,tz1
q0,tz1
� �~
q1A1zq0A1
q01q00A1zE2A1
� �E2 = E2(q1,t+1,Gene1, q0,t+1,Gene1)
doi:10.1371/journal.pone.0000776.t009....
....
....
....
....
....
....
....
....
....
....
....
....
....
....
....
....
....
....
....
....
....
....
....
....
....
....
....
....
....
....
Control of Gene Expression
PLoS ONE | www.plosone.org 17 August 2007 | Issue 8 | e776

of low magnitude relative to that of BA-Bp?CAT: the inset shows
these data (i.e. for [UI]-Bp+?CAT) at reduced scale, to also
indicate BA-Bp?CAT output in the same experiment.
Found at: doi:10.1371/journal.pone.0000776.s003 (2.59 MB
DOC)
Figure S2 Figures obtained from [9]. (A) Effect of BA modules
during the absent of Otx. BA(Otx)-Bp?CAT (black) (note that
(Otx) is equivalent to (Otxm) in [10]) is compared with BA-
Bp?CAT (red). (B) Effect of Otx on temporal expression. A(Otx)-
Bp?CAT (red) is compared with A-Bp?CAT (dark blue) and OtxZ-
Bp?CAT (marine blue).
Found at: doi:10.1371/journal.pone.0000776.s004 (1.15 MB
DOC)
ACKNOWLEDGMENTSWe are grateful to Prof. Eric Davidson for discussion in the endo16 cis-
regulatory system. We thank Prof Kanaga Sabapathy and Dr. Kenneth
Lee for their critical review of our work in both computational and
biological aspects. We also thank Mr. Li Bin for sharing his time for
discussion.
Author Contributions
Conceived and designed the experiments: SW MT ZY. Performed the
experiments: SA MT ZY. Analyzed the data: SA AG SW MT ZY VP KS
MT. Contributed reagents/materials/analysis tools: SA MT ZY VP MT.
Wrote the paper: AG SW MT ZY VP KS.
REFERENCES1. Bintu L, Buchler NE, Garcia HG, Gerland U, Hwa T, et al. (2005)
Transcriptional regulation by the numbers: applications. Curr Opin Genet
Dev 15: 125–135.
2. Bintu L, Buchler NE, Garcia HG, Gerland U, Hwa T, et al. (2005)Transcriptional regulation by the numbers: models. Curr Opin Genet Dev 15:
116–124.3. Wolf DM, Eeckman FH (1998) On the relationship between genomic regulatory
element organization and gene regulatory dynamics. J Theor Biol 195: 167–186.4. Elowitz MB, Leibler S (2000) A synthetic oscillatory network of transcriptional
regulators. Nature 403: 335–338.
5. Hasty J, McMillen D, Isaacs F, Collins JJ (2001) Computational studies of generegulatory networks: in numero molecular biology. Nat Rev Genet 2: 268–279.
6. Wray GA, Hahn MW, Abouheif E, Balhoff JP, Pizer M, et al. (2003) Theevolution of transcriptional regulation in eukaryotes. Mol Biol Evol 20:
1377–1419.
7. Harbison CT, Gordon DB, Lee TI, Rinaldi NJ, Macisaac KD, et al. (2004)Transcriptional regulatory code of a eukaryotic genome. Nature 431: 99–104.
8. Setty Y, Mayo AE, Surette MG, Alon U (2003) Detailed map of a cis-regulatoryinput function. Proc Natl Acad Sci U S A 100: 7702–7707.
9. Yuh CH, Bolouri H, Davidson EH (1998) Genomic cis-regulatory logic:experimental and computational analysis of a sea urchin gene. Science 279:
1896–1902.
10. Yuh CH, Bolouri H, Davidson EH (2001) Cis-regulatory logic in the endo16gene: switching from a specification to a differentiation mode of control.
Development 128: 617–629.11. Davidson EH, Rast JP, Oliveri P, Ransick A, Calestani C, et al. (2002) A
genomic regulatory network for development. Science 295: 1669–1678.
12. Bolouri H, Davidson EH (2002) Modelling DNA sequence-based cis-regulatorygene networks. Dev Biol 246: 2–13.
13. Buchler NE, Gerland U, Hwa T (2003) On schemes of combinatorialtranscription logic. Proc Natl Acad Sci U S A 100: 5136–5141.
14. Cheadle C, Fan J, Cho-Chung YS, Werner T, Ray J, et al. (2005) Control of
gene expression during T cell activation: alternate regulation of mRNAtranscription and mRNA stability. BMC Genomics 6(1): 75.
15. Gerber AP, Herschlag D, Brown PO (2004) Extensive Association ofFunctionally and Cytotopically Related mRNAs with Puf Family RNA-Binding
Proteins in Yeast. PLoS Biol 2(3): E79.16. Stathopoulos A, Levine M (2005) Genomic regulatory networks and animal
development. Dev Cell 9(4): 449–462.
17. Arias AM, Hayward P (2006) Filtering transcriptional noise during development:concepts and mechanisms. Nature Rev Genet 7(1): 34–44.
18. Yuh CH, Dorman ER, Davidson EH (2005) Brn1/2/4, the predicted midgutregulator of the endo16 gene of the sea urchin embryo. Dev Biol 281: 286–298.
19. Yuh CH, Dorman ER, Howard ML, Davidson EH (2004) An otx cis-regulatory
module: a key node in the sea urchin endomesoderm gene regulatory network.Dev Biol 269: 536–551.
20. Blasi MF, Casorellia I, Colosimob A, Blasic FS, Bignamia M (2005) Recursivenetwork approach can identify constitutive regulatory circuits in gene expression
data. Physica A 348: 349–370.21. Di Camillo B, Sanchez-Cabo F, Toffolo G, Nair SK, Trajanoski Z, et al. (2005)
A quantization method based on threshold optimization for microarray short
time series. BMC Bioinformatics 1;6 Suppl 4: S11.
22. Barrett CL, Herring CD, Reed JL, Palsson BO (2005) The global transcriptional
regulatory network for metabolism in Escherichia coli exhibits few dominant
functional states. Proc Natl Acad Sci U S A 102: 19103–19108.
23. Bolouri H, Davidson EH (2003) Transcriptional regulatory cascades in
development: initial rates, not steady state, determine network kinetics. Proc
Natl Acad Sci U S A 100: 9371–9376.
24. Istrail S, Davidson EH (2005) Logic functions of the genomic cis-regulatory
code. Proc Natl Acad Sci U S A 102: 4954–4959.
25. Bulyk ML, Johnson PLF, Church GM (2002) Nucleotides of transcription factor
binding sites exert interdependent effects on the binding affinities of transcription
factors. Nucleic Acids Res 30: 1255–1261.
26. Kramer BP, Fussenegger M (2005) Hysteresis in a synthetic mammalian gene
network. Proc Natl Acad Sci U S A 102: 9517–9522.
27. Angeli D, Ferrell JE, Sontag ED (2004) Detection of multistability, bifurcations,
and hysteresis in a large class of biological positive-feedback systems. Proc Natl
Acad Sci U S A 101: 1822–1827.
28. Giuliani A, Lo Giudice P, Mancini AM, Quatrini G, Pacifici L, Webber CL,
Zak M, Zbilut JP (1996) A Markovian formalization of heart rate dynamics
evinces a quantum-like hypothesis. Biol Cybern 74: 181–187.
29. Martin S, Zhang Z, Martino A, Faulon JL (2007) Boolean dynamics of genetic
regulatory networks inferred from microarray time series data. Bioinformatics
23: 866–74.
30. Djordjevic M, Sengupta AM, Shraiman BI (2003) A biophysical approach to
transcription factor binding site discovery. Genome Res 13: 2381–2390.
31. Hughes JD, Estep PW, Tavazoie S, Church GM (2000) Computational
identification of cis-regulatory elements associated with groups of functionally
related genes in Saccharomyces cerevisiae. J Mol Biol 296: 1205–14.
32. Tamada Y, Kim S, Bannai H, Imoto S, Tashiro K, et al. (2003) Estimating gene
networks from gene expression data by combining Bayesian network model with
promoter element detection. Bioinformatics 19: Suppl 2: II227–II236.
33. Ruklisa D, Brazma A, Viksna J (2005) Reconstruction of Gene Regulatory
Networks under the Finite State Linear Model. Genome Informatics 16(2):
225–236.
34. Brazma A, Schlitt T (2003) Genome Biology Reverse engineering of gene
regulatory networks: a finite state linear model. 4:P5 doi:10.1186/gb-2003-4-6-
p5.
35. Mano MM (2001) Digital Design Prentice Hall PTR. pp 516.
36. Milo R, Shen-Orr S, Itzkovitz S, Kashtan N, Chklovskii D, et al. (2002) Network
motifs: simple building blocks of complex networks. Science 298: 824–827.
37. Prill RJ, Iglesias PA, Levchenko A (2005) Dynamic properties of network motifs
contribute to biological network organization. PLoS Biol 3: 1881–1892.
38. Yeger-Lotem E, Sattath S, Kashtan N, Itzkovitz S, Milo R (2004) Network
motifs in integrated cellular networks of transcription–regulation and protein–
protein interaction. Proc Natl Acad Sci U S A 101: 5934–5939.
39. Yuh CH, Davidson EH (1996) Modular cis-regulatory organization of Endo16,
a gut-specific gene of the sea urchin embryo. Development 122: 1069–1082.
40. Yuh CH, Moore JG, Davidson EH (1996) Quantitative functional interrelations
within the cis-regulatory system of the S. purpuratus Endo16 gene. Development
122: 4045–4056.
Control of Gene Expression
PLoS ONE | www.plosone.org 18 August 2007 | Issue 8 | e776


