Embed Size (px)
Citation preview
Sequential Dependencies in Driving
Anup Doshi,a Cuong Tran,a Matthew H. Wilder,b Michael C. Mozer,b
Mohan M. Trivedia
aUniversity of California, San DiegobUniversity of Colorado, Boulder
Received 17 December 2010; received in revised form 21 November 2011; accepted 5 December 2011
Abstract
The effect of recent experience on current behavior has been studied extensively in simple labora-
tory tasks. We explore the nature of sequential effects in the more naturalistic setting of automobile
driving. Driving is a safety-critical task in which delayed response times may have severe conse-
quences. Using a realistic driving simulator, we find significant sequential effects in pedal-press
response times that depend on the history of recent stimuli and responses. Response times are slowed
up to 100 ms in particular cases, a delay that has dangerous practical consequences. Further, we
observe a significant number of history-related pedal misapplications, which have recently been
noted as a cause for concern in the automotive safety community. By anticipating these consequences
of sequential context, driver assistance systems could mitigate the effects of performance degrada-
tions and thus critically improve driver safety.
Keywords: Sequential effects; Recency; Human–computer interaction; Perceptual motor coordina-
tion; Reaction time; Driver safety
1. Introduction
In many naturalistic tasks, it is critically important for an individual to respond quickly to
a sequence of cues in a rapidly changing environment. For example, drivers on highways
worldwide are increasingly getting stuck in stop-and-go traffic (Chang, 2010), and they are
forced to engage in a sequence of braking and accelerating actions as dictated by cues from
other vehicles. These situations sometimes take a turn for the worse: Over 3,500 vehicles
were involved in fatal rear-end collisions on highways in the United States in 2008
(NHTSA, 2010).
Correspondence should be sent to Anup Doshi, Electrical and Computer Engineering Department, University
of California, San Diego, La Jolla, CA 92093-0434. E-mail: [email protected]
Cognitive Science 36 (2012) 948–963Copyright � 2012 Cognitive Science Society, Inc. All rights reserved.ISSN: 0364-0213 print / 1551-6709 onlineDOI: 10.1111/j.1551-6709.2012.01261.x
In this research, we suggest that the recent sequence of stimuli and responses in driv-
ing—specifically, cues to brake and accelerate—have a profound effect on driver response
times (RTs).
Such sequential dependencies have been studied in the psychological literature for over half
a century (Anderson, 1960; Estes, 1950; Remington, 1969). A sequential dependency is an
influence of one incidental experience on subsequent experience. Sequential dependencies arise
when individuals perform a task repeatedly or perform a series of tasks, and one trial influences
behavior on subsequent trials. Diverse behavioral measures are affected, including RT, accu-
racy, type of errors produced, and interpretation of ambiguous stimuli. Recency effects occur
across all components of the cognitive architecture, including perception (Maloney, Dal
Martello, Sahm, & Spillmann, 2005), selective attention (Kristjansson, 2006), language (Bock
& Griffin, 2000), decision making and judgment (Jesteadt, Luce, & Green, 1977), and motor
control (Dixon & Glover, 2004, 2009; Wilder, Ahmed, Mozer, & Jones, 2010a).
The canonical laboratory task used to study sequential dependencies has been two-alterna-tive forced choice (2AFC), where individuals are shown a series of trials in which one of two
stimuli is presented, and the task is to make a unique response associated with the stimulus.
For example, the stimuli might be the letters X and Y and the response a left button press for
the X and a right button press for the Y. Theoretical accounts have been developed for this
task that obtain exquisite fits to data, accounting for over 98% of the variance in mean RT
conditioned on the recent trial context (Cho et al., 2002; Wilder, Jones, & Mozer, 2010b).
These theories assume two distinct, additive mechanisms: priming based on what we will
refer to as first- and second-degree statistics. Priming based on first-degree statistics depends
on the recent history of stimulus ⁄ response identities. (Stimuli and responses are confounded
in this task, so one cannot distinguish on behavioral grounds alone whether the stimulus or
the response is producing the priming.) Priming based on second-degree statistics depends
on the history of repetitions and alternations of the stimulus ⁄ response. Although the first- and
second-degree sequences are in one-to-one correspondence, they can be dissociated in terms
of the priming that they predict. For example, the sequence X then Y then X then Y, denoted
XYXY, produces first-degree priming for Y because two recent trials have been Y, but strong
second-degree priming for X because the stimulus has alternated on the three-most recent tri-
als. In fitting data from 2AFC tasks, priming based on first- and second-degree statistics both
contribute roughly equally to explaining RT variability (Wilder et al., 2010b).1
Sequential dependencies suggest that what might appear to be intrinsic uncertainty in
human behavior can instead be understood in terms of a systematic response to a changing
world. Recent theoretical perspectives characterize sequential dependencies in terms of an
individual’s adaptation to the statistical structure of a nonstationary environment (Jones &
Sieck, 2003; Mozer, Kinoshita, & Shettel, 2007; Wilder et al., 2010b; Yu & Cohen, 2009).
Nonstationarity implies that recent events provide a stronger predictor of the future than
events further back in time, and therefore that sequential dependencies will continue to
be—and are—observed even for overlearned and expert behavior.
Although reliable patterns of sequential dependencies have been demonstrated in
controlled experimental tasks, it is not known how robust these effects are outside the
laboratory. Typical laboratory 2AFC experiments involve trials that are neatly parceled into
A. Doshi et al. ⁄ Cognitive Science 36 (2012) 949
discrete events. In contrast, driving requires continuous, ongoing behavior, and graded
responses that include pedal depression and steering adjustments. In 2AFC, the response-to-
stimulus interval is very brief, typically on the order of 500–1,000 ms. Recency effects may
be short-lived and not persist in more naturalistic environments where the events occur
irregularly and less frequently. Finally, in 2AFC, participants are focused on a single task,
quite different than a situation such as driving, where multiple goals and extraneous stimuli
compete to control an individual’s attention, and where multiple responses (steering, pedal
depression) are required simultaneously.
Here, we examine sequential dependencies in a more complex, naturalistic, time-critical
task. In our experiment, participants navigate a vehicle in a driving simulator and are occa-
sionally required to brake or accelerate, indicated by a traffic-light-style red or green cue on
the windshield. We demonstrate the existence of sequential dependencies in both
pedal-press latencies and errors.
2. Method
2.1. Participants
Eighteen volunteers participated in the experiment, 6 female and 12 male. The partici-
pants were in their 20s and 30s and varied in driving experience levels from beginner to
decades of driving experience.
2.2. Apparatus
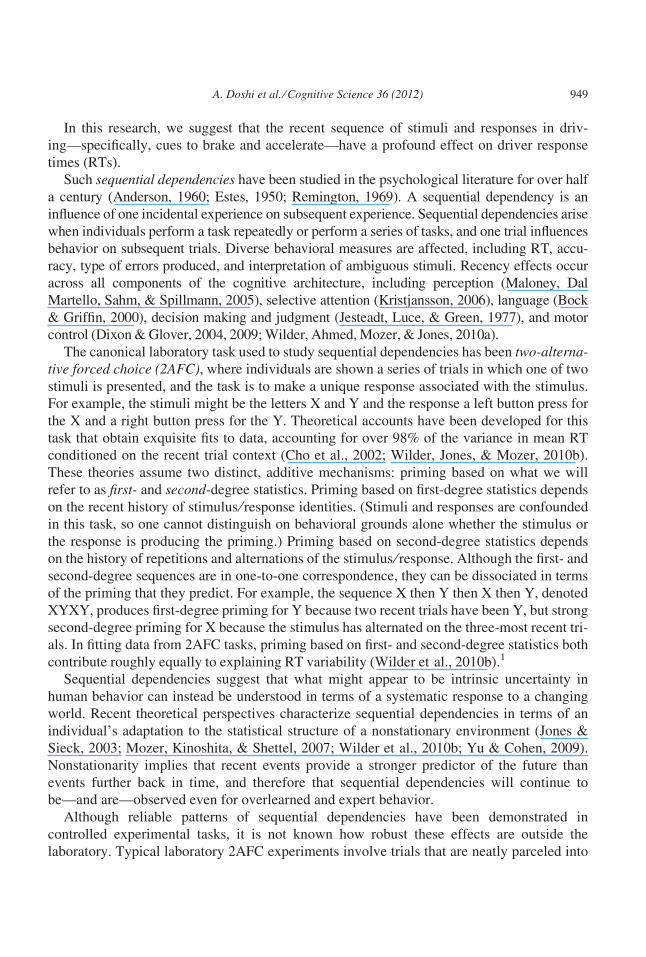
The experiment was controlled by a PC running an interactive open source simulator,
TORCS (TORCS, The Open Racing Car Simulator, 2010), depicted in Fig. 1. The ego-vehicle
and road parameters such as friction and vehicle weight were fixed to approach real-world
conditions. However, they were also constrained in order to facilitate an easy learning process,
as some subjects had never used driving simulators before. In particular, the maximum speed
of the vehicle was limited, and the dynamics of the vehicle were set such that the car tended
to travel at a slow, constant velocity when the pedal was not pressed. This was performed in a
similar fashion to ‘‘idle speeds’’ on real vehicles, by adjusting the engine RPMs (revolutions
per minute). The maximum RPMs were adjusted so that the maximum speed was approxi-
mately 65 mph, and the ‘‘idle’’ (no-pedal) RPMs were set to correspond to about 5 mph.
A 52¢¢ screen was placed 3 feet in front of the subject, with a Logitech (Logitech Corp.,
Newark, CA, USA) steering wheel mounted at a comfortable position near the driver, and
accelerator and brake pedals placed accordingly. Mounted onto the toy steering wheel was a
full-size steering wheel (15¢¢) typical of those found in compact cars. The brake and acceler-
ator pedals, positioned and sized similarly to realistic automobile configurations, registered
continuous deflection.
All the driving parameters such as pedal position, lateral position of the vehicle in the
road, and steering wheel data were automatically timestamped and logged to disk every
950 A. Doshi et al. ⁄ Cognitive Science 36 (2012)
10 ms. Additionally, a camera synchronously captured views of the driver’s foot movements
at 30 frames ⁄ s using an NTSC color camera (Sony Electronics, New York, NY, USA).
2.3. Design
Each participant was run in two conditions: simple and complex. In the simple condition,
the simulator was configured with a wide, straight track that required little steering effort to
keep the car on the track. No other vehicles were present, and lane markings, background
scenery, and sky features were eliminated. In the complex condition, the track was designed
to be a constant S-curve, that is, a series of switchbacks; the environment was populated
with buildings, trees, and other scenery such as mountains in the distance; and the track
consisted of three lanes, although no other vehicles were present.
Each condition was run as two continuous driving episodes, with a short break between
episodes. The two episodes of the simple condition always preceded the two episodes of the
complex condition, to allow the participants to get used to the simulator before increasing
the challenge of the task. Trials were embedded within a driving episode and consisted of a
cue (red or green disk) and the corresponding driver response (braking or accelerating,
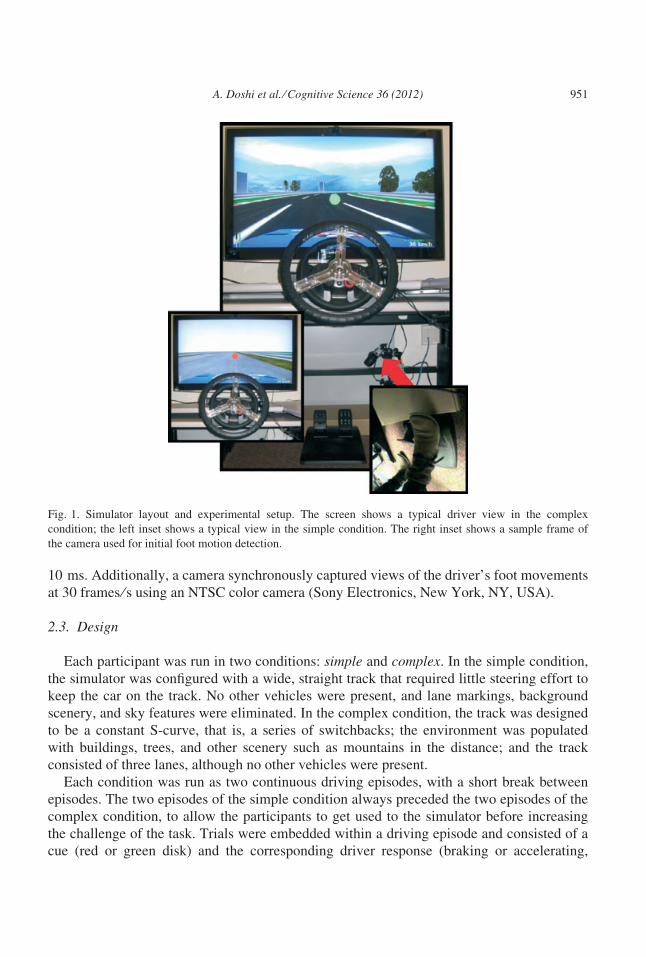
Fig. 1. Simulator layout and experimental setup. The screen shows a typical driver view in the complex
condition; the left inset shows a typical view in the simple condition. The right inset shows a sample frame of
the camera used for initial foot motion detection.
A. Doshi et al. ⁄ Cognitive Science 36 (2012) 951
respectively). In the simple condition, the interval from response to the next stimulus cue
(Response to Stimulus Interval, or RSI) was 2 s. In the complex condition, the RSI varied
from 1 to 4 s, drawn from a uniform distribution.
Each driving episode consisted of seven practice trials followed by 128 experimental tri-
als, for a total of 135 trials per episode. Experimental trials were counterbalanced such that
all stimulus sequences of length 5 (e.g., red, green, red, red, green) occurred exactly once
per 25 = 32 trials, resulting in four presentations of each five-stimulus sequence per episode
(eight per condition). In the analyses we present, we consider only the influence of the pre-
ceding three trials, n ) 3, n ) 2, and n ) 1, on the current trial, n. However, counterbalanc-
ing one additional trial back only helps address the possibility that influences of past trials
extend further back. The entire experiment took approximately 25 min per participant.
2.4. Procedure
Participants were told that the experiment examines driver behavior in stop-and-go traf-
fic. They were instructed to respond to a series of red and green cues that appear as circular
traffic-light style disks in the central field of view; red and green cues required participants
to ‘‘pump’’ the brake and accelerator, respectively, with their right foot. Participants were
told not to hold their foot on the brake or accelerator position and that the default foot posi-
tion should be a neutral one in which neither pedal was depressed. Participants were allowed
to hover their driving foot over either pedal. Most hovered over the accelerator, as is typical
in naturalistic driving, but some hovered over the last pedal that was depressed. Although
this hovering requirement is not entirely naturalistic, it is reminiscent of stop-and-go driving
and participants had no difficulty in following the instruction.
The cues remained visible until a response pedal was pressed. If neither response pedal
was pressed within 1 s of stimulus onset, the trial was terminated by removing the cue and
the next stimulus appeared following the RSI.
2.5. Data analysis
A pedal press was defined to occur at the time when either of the pedals was depressed
20% or more of its maximum. Several participants tended to braise one pedal briefly along a
trajectory to pressing the other pedal, and we determined criteria—consistent with video
observations—that considered the second pedal press as the response.
The video data coming from the foot camera was also analyzed to detect the time of the
initial foot movement and to allow us to decompose the pedal press latency into a foot
movement initiation time and a time to move the foot to the pedal. The video-processing
algorithm used a moving pixel-wise median background to distinguish novel changes in the
current frame. Due to the camera perspective, these changes were caused mostly by foot
motion; thus, any major foot motion could be detected by placing a threshold on the amount
of motion in the frame. Once a foot movement event was detected in this manner, the foot
movement signal was traced back to the initial inflection point of the motion, to determine
the time of the beginning of the foot motion.
952 A. Doshi et al. ⁄ Cognitive Science 36 (2012)
3. Results
Each trial is characterized by three independent variables: (a) the driving environ-
ment—simple versus complex, (b) the target response—accelerate versus brake, and (c) the
context arising from the three-most recent trials. The context is specified in terms of the
sequence leading up to the current trial. If we adopt the shorthand notation of X for the {red,
brake} stimulus–response pair, and Y for the {green, accelerate} pair, we can represent a
sequence like green–green–red–red as YYXX, where the order of trials, left to right, is
n ) 3, n ) 2, n ) 1, and n. Because the labels X and Y represent both stimulus and response
and the mapping, we are neutral as to whether the effects of context that we describe are
due to priming of stimuli, responses, or both.
The context can also be described in terms of the pattern of alternation (A) and repetitions
(R) by considering pairs of trials. For example, the trial sequence green–green–red–red,
which corresponds to the X–Y sequence YYXX, also corresponds to the repetition ⁄ alterna-
tion sequence RAR, where the first R denotes that stimuli on trials n ) 3 and n ) 2 are the
same, the A denotes that stimuli on trials n ) 2 and n ) 1 are different, and the final R
denotes that stimuli on trials n ) 1 and n are the same. We refer to these two representations
of context as first and second degree because the X ⁄ Y representation describes individual
trials, whereas the A ⁄ R representation describes pairs of trials. In laboratory studies of
sequential dependencies in 2AFC, the second-degree representation of context is standard.
We will present results using both representations, and it should shortly become clear why
we include the first-degree representation.
Participants made relatively few response errors. We discuss errors later, but first we present
an analysis of RTs. For the RT analysis, trial n is discarded if an error has occurred on any of
trials from n ) 3 to n, or if the RT is not within 3 SDs of the individual participant’s mean RT.
A repeated-measures anova with subjects as a random factor yields a main effect of driv-
ing environment: RTs are slower in the complex environment than in the simple, 654 versus
612 ms, F(1, 17) = 27.8; p < .001, expected given the additional distractors and variability
present in the complex environment. Participants are slower to brake than to accelerate, 659
versus 607 ms, F(1, 17) = 6.97; p < .02, not a big surprise because in normal driving the
foot tends to hover over the accelerator pedal. Finally, there is a main effect of context,
F(7, 119) = 26.99; p < .001. However, there are no higher order interactions involving any
of the independent variables (all p > .275). Consequently, we are justified in collapsing
across driving environment and response pedal in the RT analyses to follow. Further,
because we observe only a main effect of RT on the particular stimulus–response pair iden-
tity (i.e., braking vs. accelerating), we collapse across complementary sequences, for exam-
ple, YYXX and XXYY, and as shorthand, we refer to both sequences using the label that
ends in X, here YYXX.
3.1. Sequential dependencies on RT
The top row of Fig. 2 shows the mean RTs across participants for each three-back context.
The left and right graphs encode the context in the first- and second-degree representations,
A. Doshi et al. ⁄ Cognitive Science 36 (2012) 953
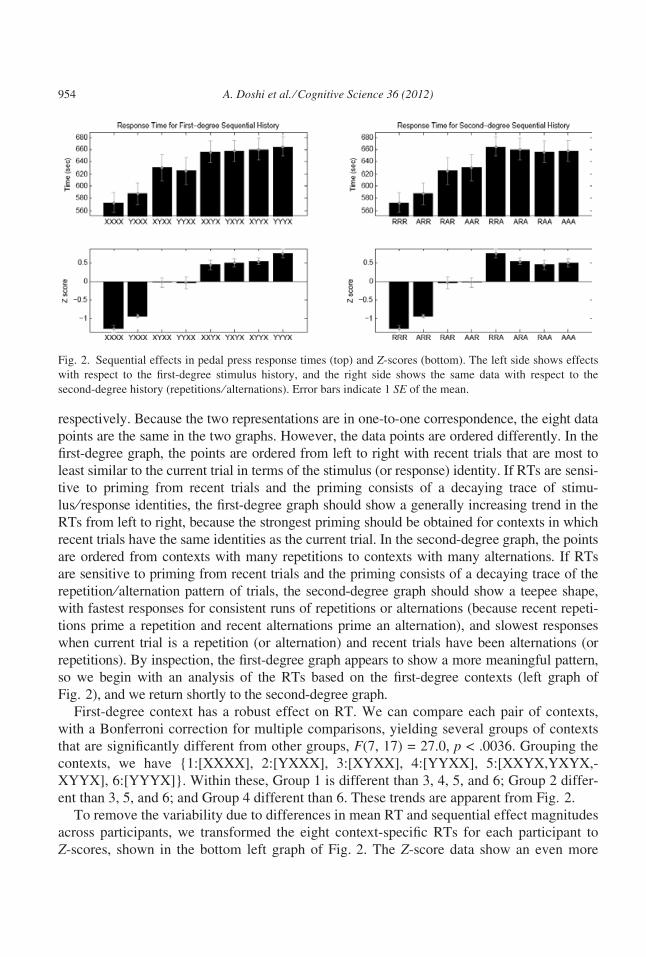
respectively. Because the two representations are in one-to-one correspondence, the eight data
points are the same in the two graphs. However, the data points are ordered differently. In the
first-degree graph, the points are ordered from left to right with recent trials that are most to
least similar to the current trial in terms of the stimulus (or response) identity. If RTs are sensi-
tive to priming from recent trials and the priming consists of a decaying trace of stimu-
lus ⁄ response identities, the first-degree graph should show a generally increasing trend in the
RTs from left to right, because the strongest priming should be obtained for contexts in which
recent trials have the same identities as the current trial. In the second-degree graph, the points
are ordered from contexts with many repetitions to contexts with many alternations. If RTs
are sensitive to priming from recent trials and the priming consists of a decaying trace of the
repetition ⁄alternation pattern of trials, the second-degree graph should show a teepee shape,
with fastest responses for consistent runs of repetitions or alternations (because recent repeti-
tions prime a repetition and recent alternations prime an alternation), and slowest responses
when current trial is a repetition (or alternation) and recent trials have been alternations (or
repetitions). By inspection, the first-degree graph appears to show a more meaningful pattern,
so we begin with an analysis of the RTs based on the first-degree contexts (left graph of
Fig. 2), and we return shortly to the second-degree graph.
First-degree context has a robust effect on RT. We can compare each pair of contexts,
with a Bonferroni correction for multiple comparisons, yielding several groups of contexts
that are significantly different from other groups, F(7, 17) = 27.0, p < .0036. Grouping the
contexts, we have {1:[XXXX], 2:[YXXX], 3:[XYXX], 4:[YYXX], 5:[XXYX,YXYX,-
XYYX], 6:[YYYX]}. Within these, Group 1 is different than 3, 4, 5, and 6; Group 2 differ-
ent than 3, 5, and 6; and Group 4 different than 6. These trends are apparent from Fig. 2.
To remove the variability due to differences in mean RT and sequential effect magnitudes
across participants, we transformed the eight context-specific RTs for each participant to
Z-scores, shown in the bottom left graph of Fig. 2. The Z-score data show an even more
Fig. 2. Sequential effects in pedal press response times (top) and Z-scores (bottom). The left side shows effects
with respect to the first-degree stimulus history, and the right side shows the same data with respect to the
second-degree history (repetitions ⁄ alternations). Error bars indicate 1 SE of the mean.
954 A. Doshi et al. ⁄ Cognitive Science 36 (2012)
reliable dependency on the first-degree context than do the raw data, F(7, 17) = 32.3,
p < .0001. Grouping the contexts, we have {1:[XXXX], 2:[YXXX], 3:[XYXX], 4:[YYXX],
5:[XXYX], 6:[YXYX,XYYX,YYYX]}. Within these, Groups 1 and 2 are different than 3,
4, 5, and 6; Group 3 different than 6; and Group 4 different than 5 and 6.
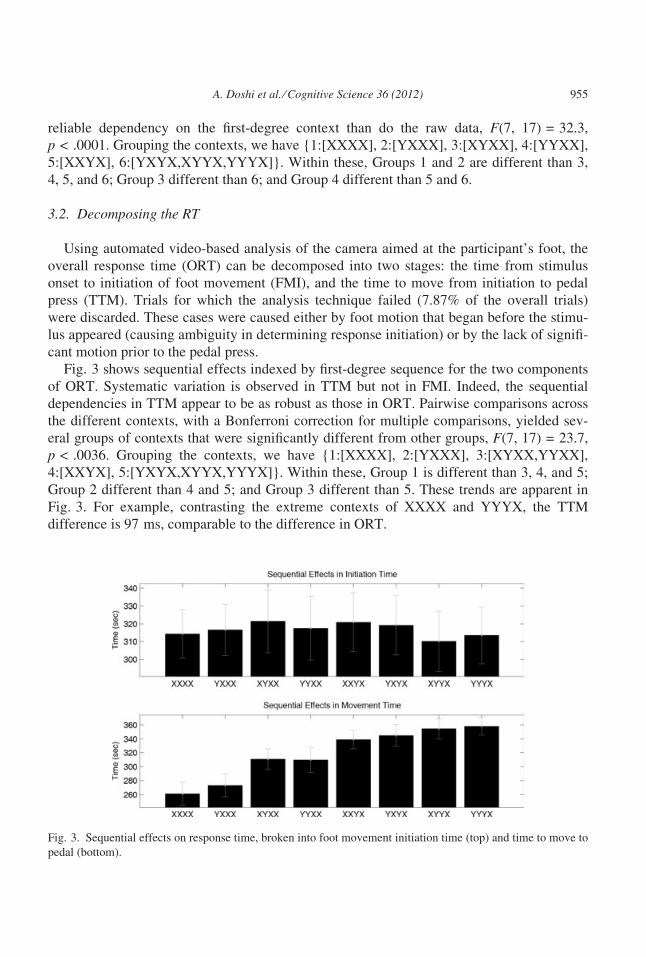
3.2. Decomposing the RT
Using automated video-based analysis of the camera aimed at the participant’s foot, the
overall response time (ORT) can be decomposed into two stages: the time from stimulus
onset to initiation of foot movement (FMI), and the time to move from initiation to pedal
press (TTM). Trials for which the analysis technique failed (7.87% of the overall trials)
were discarded. These cases were caused either by foot motion that began before the stimu-
lus appeared (causing ambiguity in determining response initiation) or by the lack of signifi-
cant motion prior to the pedal press.
Fig. 3 shows sequential effects indexed by first-degree sequence for the two components
of ORT. Systematic variation is observed in TTM but not in FMI. Indeed, the sequential
dependencies in TTM appear to be as robust as those in ORT. Pairwise comparisons across
the different contexts, with a Bonferroni correction for multiple comparisons, yielded sev-
eral groups of contexts that were significantly different from other groups, F(7, 17) = 23.7,
p < .0036. Grouping the contexts, we have {1:[XXXX], 2:[YXXX], 3:[XYXX,YYXX],
4:[XXYX], 5:[YXYX,XYYX,YYYX]}. Within these, Group 1 is different than 3, 4, and 5;
Group 2 different than 4 and 5; and Group 3 different than 5. These trends are apparent in
Fig. 3. For example, contrasting the extreme contexts of XXXX and YYYX, the TTM
difference is 97 ms, comparable to the difference in ORT.
Fig. 3. Sequential effects on response time, broken into foot movement initiation time (top) and time to move to
pedal (bottom).
A. Doshi et al. ⁄ Cognitive Science 36 (2012) 955
These strong patterns are all the more impressive considering that the quantization of the
video stream is relatively coarse; our timing accuracy is limited by the video frame rate,
33 ms. One potential explanation for why sequential dependencies are observed in TTM is
that our experiment did not control for foot position at the start of a trial, and if participants
rested their foot over the pedal that was last depressed, then one would expect TTM to be
faster for an XX sequence than a YX sequence. Although foot position might explain why
sequential effects are observed in TTM at lag 1, this account would not explain effects
beyond lag 1, which are found in the data.
Whereas FMI is not susceptible to sequential effects, it is affected by the interval from
the preceding response to the current stimulus (RSI). In the complex condition, we divided
trials into shorter and longer RSIs, with the dividing line being the median RSI of 2.52 s. In
other words, we labeled those trials whose RSI was between 1 and 2.52 s as ‘‘short,’’ and
those between 2.52 and 4 s as ‘‘long.’’ FMI was reliably faster following short RSIs (FMI
of 343.8 and 365.7 ms for short and long RSI, respectively), F(1, 17) = 14.55; p < .01.
However, RSI had no systematic effect on TTM (298.6 and 301.1 ms for short and long
RSI), F(1, 17) = 0.28; p > .25. Thus, a stimulus readiness effect is observed in the early
stages of processing that determine FMI, whereas sequential dependencies are observed in
later stages reflected in the TTM.
3.3. Sequential dependencies based on first- and second-degree statistics
To investigate the relative contribution of first- and second-degree statistics to priming,
the data were fit to models that assume that priming from recent trials decays exponentially
and is based on first-degree statistics, second-degree statistics, or both.
We model the probability of the stimulus on trial n + 1, Xn+1, based on first-degree statis-
tics as
P1ðXnþ1 ¼ xÞ ¼ c1X3
k¼0kk1 � I½Xn�k ¼ x�;
with k1 representing the first-degree decay parameter and c1 = (1 ) k1) ⁄ (1 ) k14) serving to
scale the weights k1k such that their sum is 1. I[•] represents the indicator function and takes
on the value 1 if the statement in the brackets is true. The probability of the stimulus on trial
n + 1 based on second-degree statistics is given by
P2ðXnþ1 ¼ xÞ ¼ I½Xn ¼ x�PR þ ð1� I½Xn ¼ x�Þð1� PRÞ;
with
PR ¼ PðXnþ1 ¼ XnÞ ¼ c2X2
k¼0kk2 � I½Xn�k ¼ Xn�k�1�:
Here k2 is the second-degree decay parameter and c2 = (1 ) k2) ⁄ (1 ) k23) is again a nor-
malizing term. The probability for the combined model is obtained by taking a weighted
combination of the first- and second-degree probabilities,
956 A. Doshi et al. ⁄ Cognitive Science 36 (2012)
PcðXnþ1 ¼ xÞ ¼ wP1ðXnþ1 ¼ xÞ þ ð1� wÞP2ðXnþ1 ¼ xÞ:
The pure models have one free parameter—the memory decay rate (k); the combined
model has three—two decay parameters (k1 and k2) and one additional parameter w for a
mixture weight (see Wilder et al., 2010b, for details of these models). Parameters for each
model are obtained by minimizing the squared prediction error.
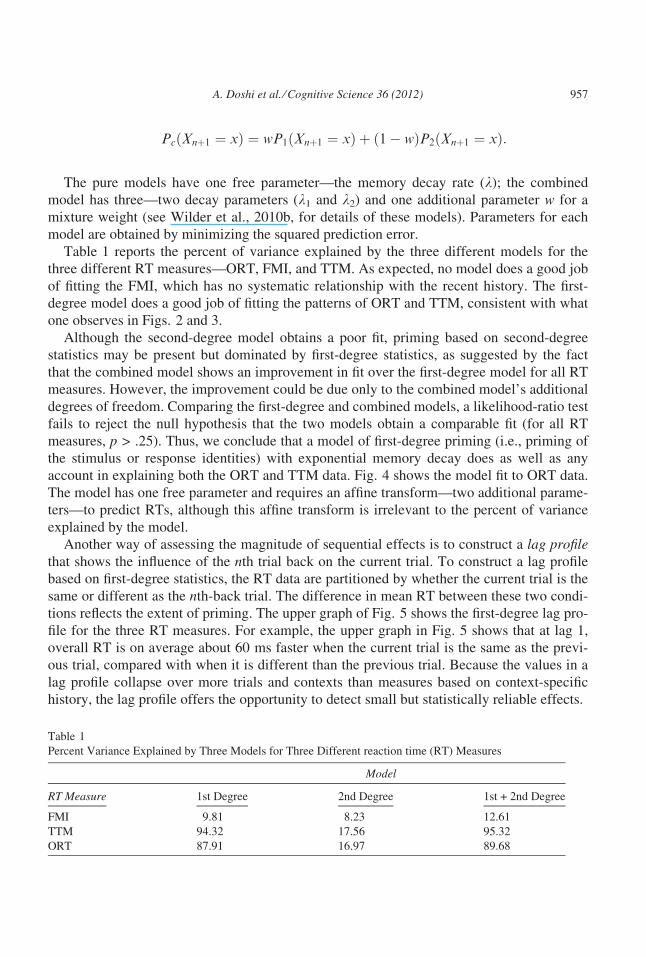
Table 1 reports the percent of variance explained by the three different models for the
three different RT measures—ORT, FMI, and TTM. As expected, no model does a good job
of fitting the FMI, which has no systematic relationship with the recent history. The first-
degree model does a good job of fitting the patterns of ORT and TTM, consistent with what
one observes in Figs. 2 and 3.
Although the second-degree model obtains a poor fit, priming based on second-degree
statistics may be present but dominated by first-degree statistics, as suggested by the fact
that the combined model shows an improvement in fit over the first-degree model for all RT
measures. However, the improvement could be due only to the combined model’s additional
degrees of freedom. Comparing the first-degree and combined models, a likelihood-ratio test
fails to reject the null hypothesis that the two models obtain a comparable fit (for all RT
measures, p > .25). Thus, we conclude that a model of first-degree priming (i.e., priming of
the stimulus or response identities) with exponential memory decay does as well as any
account in explaining both the ORT and TTM data. Fig. 4 shows the model fit to ORT data.
The model has one free parameter and requires an affine transform—two additional parame-
ters—to predict RTs, although this affine transform is irrelevant to the percent of variance
explained by the model.
Another way of assessing the magnitude of sequential effects is to construct a lag profilethat shows the influence of the nth trial back on the current trial. To construct a lag profile
based on first-degree statistics, the RT data are partitioned by whether the current trial is the
same or different as the nth-back trial. The difference in mean RT between these two condi-
tions reflects the extent of priming. The upper graph of Fig. 5 shows the first-degree lag pro-
file for the three RT measures. For example, the upper graph in Fig. 5 shows that at lag 1,
overall RT is on average about 60 ms faster when the current trial is the same as the previ-
ous trial, compared with when it is different than the previous trial. Because the values in a
lag profile collapse over more trials and contexts than measures based on context-specific
history, the lag profile offers the opportunity to detect small but statistically reliable effects.
Table 1
Percent Variance Explained by Three Models for Three Different reaction time (RT) Measures
Model
RT Measure 1st Degree 2nd Degree 1st + 2nd Degree
FMI 9.81 8.23 12.61
TTM 94.32 17.56 95.32
ORT 87.91 16.97 89.68
A. Doshi et al. ⁄ Cognitive Science 36 (2012) 957
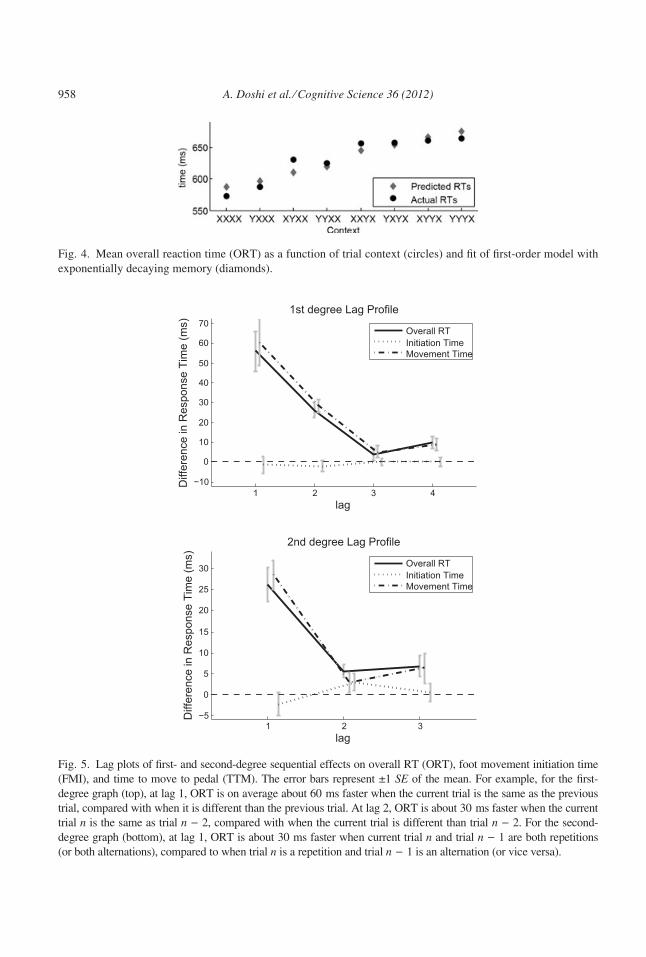
Fig. 4. Mean overall reaction time (ORT) as a function of trial context (circles) and fit of first-order model with
exponentially decaying memory (diamonds).
Fig. 5. Lag plots of first- and second-degree sequential effects on overall RT (ORT), foot movement initiation time
(FMI), and time to move to pedal (TTM). The error bars represent ±1 SE of the mean. For example, for the first-
degree graph (top), at lag 1, ORT is on average about 60 ms faster when the current trial is the same as the previous
trial, compared with when it is different than the previous trial. At lag 2, ORT is about 30 ms faster when the current
trial n is the same as trial n ) 2, compared with when the current trial is different than trial n ) 2. For the second-
degree graph (bottom), at lag 1, ORT is about 30 ms faster when current trial n and trial n ) 1 are both repetitions
(or both alternations), compared to when trial n is a repetition and trial n ) 1 is an alternation (or vice versa).
958 A. Doshi et al. ⁄ Cognitive Science 36 (2012)
The lag profile confirms that for ORT and TTM, priming based on first-degree statistics
are statistically reliable at lags 1, 2, and 4 (p < .01 by one-tailed t test), although not at lag
3—ORT lag 3 t(17) = 1.20; p = .248; TTM lag 3 t(17) = 1.79; p = .092. There is no signifi-
cant first-degree priming of FMI (p > .10 for all lags).
In the lag profile based on second-degree statistics (lower graph of Fig. 5), each trial is
characterized as a repetition or alternation of the previous, and the lag n priming is the
speed-up that occurs when the current trial matches the nth trial back. For example, the
lower graph in Fig. 5 shows that at lag 2, ORT is about 5 ms faster when the current trial nand trial n ) 2 are both repetitions or both alternations, compared with when trial n is an R
and n ) 2 an A or vice versa. Second-degree priming at lag 1 is identical to first-degree
priming at lag 2. Consequently, evidence for effects based on second-degree statistics comes
from reliable priming at lags 2 or 3. Second-degree priming at lags 2 and 3 is statistically
reliable for ORT—lag 2: t(17) = 3.73; p < .01; lag 3: t(17) = 2.70; p = .015—albeit small
in magnitude. For TTM, second-degree priming is not statistically reliable—lag 2:
t(17) = 1.27; p = .221; lag 3: t(17) = 1.83; p = .086. Thus, there is evidence for second-
degree priming in the lag profile, but it has a small absolute effect on RTs.
3.4. Pedal misapplications
Sequential effects typically arise in error rates as well as in latencies (Cho et al., 2002),
with the slower responses being more error-prone, indicating that sequential effects are not
merely a speed–accuracy tradeoff.
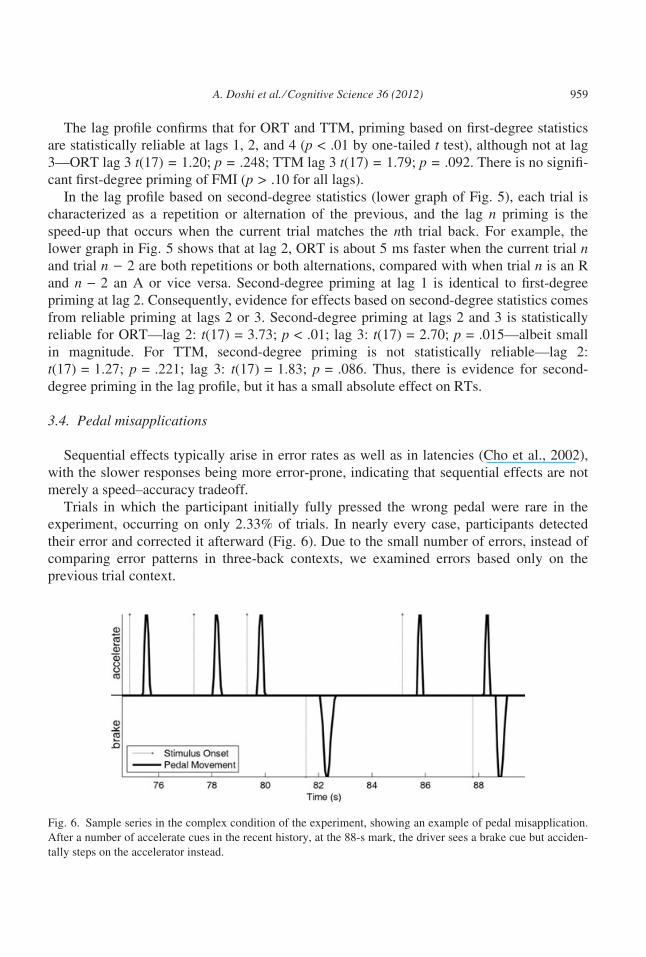
Trials in which the participant initially fully pressed the wrong pedal were rare in the
experiment, occurring on only 2.33% of trials. In nearly every case, participants detected
their error and corrected it afterward (Fig. 6). Due to the small number of errors, instead of
comparing error patterns in three-back contexts, we examined errors based only on the
previous trial context.
Fig. 6. Sample series in the complex condition of the experiment, showing an example of pedal misapplication.
After a number of accelerate cues in the recent history, at the 88-s mark, the driver sees a brake cue but acciden-
tally steps on the accelerator instead.
A. Doshi et al. ⁄ Cognitive Science 36 (2012) 959
Pedal misapplications occurred on 3.30% of trials when the previous stimulus differed
from the current, but only on 1.46% when the previous stimulus was the same as the current
(reporting a subjectwise median). The difference is significant by a Wilcoxon signed-rank
test (Z = 2.46; p < .05). On 0.39% of trials, participants made no response. When these
no-response trials are considered to be misapplications, the effect of the previous trial is still
evident (Z = 2.16; p < .05).
4. Discussion
In a simulated driving task, we observe a robust effect of the recent sequence of pedal
presses on both response latencies and error rates. The task is perhaps the most realistic, nat-
uralistic scenario in which recency effects have been explored. We obtained evidence for
effects well beyond the immediately preceding trial, extending up to four trials back. The
effects are primarily what we characterize as first degree, corresponding to the traditional
conception of priming of the response (or stimulus, as the two are confounded). In contrast
to laboratory 2AFC tasks, second-degree effects—effects of the repetition and alternation
sequence—are minimal in magnitude.
Our experiment extends the canonical laboratory 2AFC task toward a more naturalistic
scenario in three respects. First, the visual environment is cluttered, heterogeneous, con-
stantly changing, and contains elements that distract from the pedal pressing task, such as
buildings, trees, mountains, and grass. Second, driving requires multitasking: In addition to
braking and accelerating as demanded by the pedal pressing task, the driver needs to con-
stantly monitor and adjust steering to remain in the center lane of a regularly curved road.
Third, the response-to-stimulus intervals are variable, ranging from 1 to 4 s, and are larger
than the typical interstimulus intervals of less than a second.
Even the simple condition in our experiment—which offered little in the way of distractor
stimuli and required minimal multitasking—moves in the direction of ecological validity
over the canonical 2AFC task. However, the finding that sequential effects are robust and
comparable in the complex condition supports the notion that environmental and task com-
plexity—via additional variability of the stimulus onset, additional visual distractors, and
additional difficulty of the secondary (driving) task—do not modulate the nature of sequen-
tial effects.
Although it is not altogether unexpected to find priming in a complex, multitasking envi-
ronment, a further analysis of behavior offers an intriguing suggestion concerning the stage
of processing at which priming occurs. We decomposed the ORT into the time from stimu-
lus onset to foot movement initiation (FMI) and the time from movement initiation to pedal
press (TTM). We find that only TTM is affected by the trial sequence, and only FMI is
affected by the response-to-stimulus interval, implying that sequential dependencies occur
at a distinct stage of processing from stimulus readiness.
Our motivation for the RT decomposition is a related decomposition that has been per-
formed via event-related potentials to analyze sequential dependencies. In a 2AFC task with
the two responses mapped to the two hands, the start of response selection can be inferred as
960 A. Doshi et al. ⁄ Cognitive Science 36 (2012)
the onset of the lateralized readiness potential (LRP). Jentzsch and Sommer (2002) and
Jones et al. (2009) have analyzed sequential effects on RT, decomposing the overall RT into
stimulus-processing (pre-LRP) and response-processing (post-LRP) stages. Wilder et al.
(2010b) have shown that the stimulus-processing component of RT is well fit by a second-
degree model of sequential dependencies, and the response-processing component is well fit
by a first-degree model. That is, sequential dependencies are based on the frequency of repe-
titions and alternations of the stimuli, and on the frequency of the two alternative responseidentities.
The presence of priming based on first-degree statistics in the TTM in the driving task is
predicted by the dual priming theory (Wilder et al., 2010b), because TTM reflects a late
stage of processing. However, on its face, the theory predicts second-degree dependencies
at an early stage of processing, which are not observed in the FMI. It remains to be deter-
mined whether the absence of second-degree priming is a failure of the theory or is attribut-
able to noise in the data or another factor that differentiates the driving task from canonical
2AFC tasks, for example, the complexity of the visual environment, multitasking, or the
asymmetry of pedal presses.
What are the practical implications of recency effects in driving? Consistent with previ-
ous studies using simple 2AFC tasks, we find that recent events can result in response delays
of nearly 100 ms (e.g., for the most extreme contrast—XXXX vs. YYYX—the difference in
ORT is 91 ms, and the difference in TTM is 97 ms). Because sequential dependencies are
found in complex laboratory conditions that approximate real-world driving, it seems alto-
gether plausible that they will be observed in situations such as stop-and-go traffic, or a
series of traffic lights in an urban environment.
At 20 mph, a delay of up to 100 ms corresponds to an increased stopping distance of
nearly 1 m, which could be the difference between running into a leading vehicle and stop-
ping safely. At 65 mph, this 100-ms difference corresponds to an extra 3 m in stopping dis-
tance. Even smaller differences in RTs have been shown to have severe consequences in
both the probability and severity of vehicle crashes (Evans, 1991).
Beyond delays in responding, we have shown that recent events can affect the likelihood
of a pedal misapplication. In our study, the probability of a pedal misapplication more than
doubled if the target pedal differs from the previous pedal versus when the two are the
same.
Many recent unintended acceleration-related accidents in the United States may have
been a result of pedal misapplications (Healey & Carty, 2010). The context-dependent pat-
tern of driver response delays and errors could potentially be exploited in a holistic
Advanced Driver Assistance System (ADAS; Doshi, Cheng, & Trivedi, 2009; Trivedi,
Gandhi, & McCall, 2007). Given a particular observed history of pedal presses and familiar-
ity with a particular driver, the ADAS could predict real-time performance. These predic-
tions could be used to provide additional or earlier alerts to drivers in situations where
delays ⁄ errors were likely. In more critical circumstances, the vehicle could take action to
reduce impending accident severity by priming the brake system. In less critical situations,
if the upcoming context is ripe for higher RTs (e.g., more than 600 ms), an urgent
alert could help to refocus the driver to the potentially appropriate response. An adaptive
A. Doshi et al. ⁄ Cognitive Science 36 (2012) 961
intelligent ADAS design could thus utilize sequential context to help the driver and mitigate
dangerous or uncomfortable circumstances.
Note
1. Traditional analyses of sequential effects have been based on a dichotomy between
effects of trial n ) 1 (‘‘first-order effects’’) and effects of trial n ) 2 and beyond
(‘‘higher-order effects’’). Even though these effects are referred to by ‘‘order,’’ the
better terminology would have been ‘‘lag’’: The effect of trial n ) k is a lag k effect.
From the perspective of recent theoretical work (e.g., Jones, Curran, Mozer, & Wilder,
2009; Wilder et al., 2010b; Yu & Cohen, 2009), analyses using the traditional dichot-
omy have less value than an analysis based on first- and second-order statistics of the
sequence. A single decay-based priming mechanism can explain the lag k effect for
any k. However, as we will discuss in this article, priming based on first- and second-
order statistics yields distinct predictions. Because the field has used ‘‘order’’ in the
past to refer to lags, we instead use the term ‘‘degree’’—as in first- and second-degree
statistics—to avoid confusing readers who are steeped in the literature.
Acknowledgments
This research was supported by the University of California Transportation Center Ph.D.
Dissertation Fellowship, UC-Discovery, and NSF grants BCS-0339103, BCS-720375, and
SBE-0518699.
References
Anderson, N. (1960). Effect of first-order conditional probability in a two-choice learning situation. Journal ofExperimental Psychology, 59(2), 73–93.
Bock, K., & Griffin, Z. M. (2000). The persistence of structural priming: Transient activation or implicit learn-
ing? Journal of Experimental Psychology: General, 129, 177–192.
Chang, A. (2010, August 24). China’s massive traffic jam could last for weeks. Associated Press. Available at:
http://www.usatoday.com/news/world/2010-08-24-china-traffic-jam_N.htm. [accessed on January 1, 2012].
Cho, R. Y., Nystrom, L. E., Brown, E. T., Jones, A. D., Braver, T. S., Holmes, P. J., and Cohen, J. D. (2002).
Mechanisms underlying dependencies of performance on stimulus history in a two-alternative forced-choice
task. Cognitive Affective Behavior Neuroscience, 2 (4), 283–299.
Dixon, P., & Glover, S. (2004). Action and memory. In B. Ross (Ed.), The psychology of learning and motiva-tion (pp. 143–174). San Diego, CA: Elsevier.
Dixon, P., & Glover, S. (2009, May). Perseveration and contrast effects in grasping. Neuropsychologia, 47(6),
1578–1584.
Doshi, A., Cheng, S. Y., & Trivedi, M. M. (2009). A novel, active heads-up display for driver assistance. IEEETransactions on Systems, Man, and Cybernetics Part B, 39 (1), 85–93.
Estes, W. (1950). Toward a statistical theory of learning. Psychological Review, 57, 94–107.
962 A. Doshi et al. ⁄ Cognitive Science 36 (2012)
Evans, L. (1991). Traffic safety and the driver. New York: Van Nostrand Reinhold.
Healey, J. R., & Carty, S. S. (2010, July 14). Driver error found in some Toyota acceleration cases. USA Today.
Available at: http://www.usatoday.com/money/autos/2010-07-14-toyota14_ST_N.htm. [accessed on January
1, 2012].
Jentzsch, I., & Sommer, W. (2002). Functional localization and mechanisms of sequential effects in serial
reaction time tasks. Perception and Psychophysics, 64(7), 1169–1188.
Jesteadt, W., Luce, R. D., & Green, D. M. (1977). Sequential effects in judgments of loudness. Journal of Exper-imental Psychology Human Perception and Performance, 3(1), 92–104.
Jones, M., Curran, T., Mozer, M., & Wilder, M. H. (2009, November). Sequential effects reflect learning of
temporal structure. Presented at the 50th Annual Meeting of the Psychonomic Society, Boston, MA.
Jones, M., & Sieck, W. R. (2003). Learning myopia: An adaptive recency effect in category learning. Journal ofExperimental Psychology: Learning, Memory, & Cognition, 29, 626–640.
Kristjansson, A. (2006). Rapid learning in attention shifts: A review. Visual Cognition, 13(3), 324–362.
Maloney, L. T., Dal Martello, M. F., Sahm, C., & Spillmann, L. (2005). Past trials influence perception of
ambiguous motion quartets through pattern completion. Proceedings of the National Academy of Sciences,
102, 3164–3169.
Mozer, M. C., Kinoshita, S., & Shettel, M. (2007). Sequential dependencies offer insight into cognitive control.
In W. Gray (Ed.), Integrated models of cognitive systems (pp. 180–193). Oxford, England: Oxford University
Press.
NHTSA (2010). National highway traffic safety administration—Fatal Analysis Reporting System (FARS).
Available at: http://www-fars.nhtsa.dot.gov. [accessed on January 1, 2012].
Remington, R. (1969). Analysis of sequential effects in choice reaction times. Journal of Experimental Psychol-ogy, 82(2), 250–257.
TORCS, The Open Racing Car Simulator (2010). Available at: http://torcs.sourceforge.net. [accessed on January
1, 2012].
Trivedi, M. M., Gandhi, T., & McCall, J. C. (2007). Looking in and looking out of a vehicle: Computer vision-
based enhanced vehicle safety. IEEE Transactions on Intelligent Transportation Systems, 8, 108–120.
Wilder, M., Ahmed, A., Mozer, M., & Jones, M. (2010a, November 15). Sequential effects in motor adaptation:
The importance of far back trials. Poster presentation at Society for Neuroscience, San Diego, CA.
Wilder, M., Jones, M., & Mozer, M. C. (2010b). Sequential effects reflect parallel learning of multiple environ-
mental regularities. In Y. Bengio, D. Schuurmans, J. Lafferty, C. Williams, & A. Culotta (Eds.), Advances inNeural Information Processing Systems (Vol. 22, pp. 2053–2061). La Jolla, CA: NIPS Foundation.
Yu, A. J., & Cohen, J. D. (2009). Sequential effects: Superstition or rational behavior? Advances in NeuralInformation Processing Systems, 21, 1873–1880.
A. Doshi et al. ⁄ Cognitive Science 36 (2012) 963