Embed Size (px)
Citation preview

Received: 02.12.2009 Accepted: 29.01.2010J Gastrointestin Liver DisJune 2010 Vol.19 No 2, 169-174Address for correspondence: Hadi Parsian Department of Biochemistry and Biophysics University of Medical Sciences Babol, Iran E-mail: [email protected]
Serum Hyaluronic Acid and Laminin as Biomarkers in Liver FibrosisHadi Parsian1, Ali Rahimipour2, Mohammad Nouri3, Mohammad Hossein Somi3, Durdi Qujeq1, Mehrdad Kashi Fard4, Karim Agcheli5
1) Department of Biochemistry and Biophysics, Babol University of Medical Sciences, Babol; 2) Department of Clinical Biochemistry, Shahid Beheshti University of Medical Sciences, Tehran; 3) Liver and Gastrointestinal Diseases Research Centre, Tabriz University of Medical Sciences, Tabriz; 4) Yahya Nezhad Hospital, Babol University of Medical Sciences, Babol; 5) Liver and Gastrointestinal Diseases Research Centre, Gorgan University of Medical Sciences, Gorgan, Iran
AbstractBackground and Aim: Non-invasive methods have
been proposed as surrogate markers for liver biopsy. It was shown that serum hyaluronic acid (HA) and laminin (LN) levels increase with the development of liver fibrosis. The aim of this study was to determine serum HA and LN levels cut-off points for predicting liver fibrosis, highlighting their diagnostic value and their changes during treatment. Methods: Serum HA and LN levels in chronic hepatitis patients (n=62) and controls (n=20) were assessed by ELISA and liver histopathological parameters were evaluated by the modified Knodell score. Results: Mean serum HA (113.4±59.2 ng/ml) and LN (91.9±20.9 ng/ml) concentrations in patients were greater than in controls (46.6±10.5 and 46.1±10.1 ng/ml, p<0.001). A strong correlation between serum HA and LN concentrations with hepatic necroinflammatory lesions was found (p<0.001). A cut-off point of 59.5 ng/ml HA and 52.0 ng/ml LN for the discrimination of patients with liver fibrosis from healthy controls and 102.0 ng/ml HA and 92.5 ng/ml LN for the discrimination of patients with mild from severe fibrosis showed acceptable AUC, sensitivity and specificity. After six months of treatment, a gradual decrease in serum HA and LN levels was observed, however the levels were still higher than those of the controls (p<0.05). Conclusions: Serum hyaluronic acid and laminin concentrations increase in liver fibrosis and could be used as a noninvasive biomarker to discriminate between patients with liver fibrosis and healthy individuals.
Key wordsChronic hepatitis – hepatic fibrosis – hyaluronic acid
– serum laminin – Knodell score.
IntroductionLiver fibrosis is a process involving production and
deposition of various components that constitute the extracellular matrix (ECM). Some of these components are noncollagenous glycoproteins such as laminin (LN), hyaluronic acid (HA), and proteoglycans. Staging of liver fibrosis and evaluation of the inflammation grade is beneficial for estimating the progression rate of liver fibrosis, treatment selection and monitoring the disease. Liver biopsy is still the reference test for staging and grading hepatic fibrosis and inflammation. However, due to some limitations of the liver biopsy, noninvasive methods are now preferred [1]. In recent years, some studies proposed HA and LN as indices of the extent of liver fibrosis in chronic liver diseases [2].
Hyaluronic acid is a glycosaminoglycan distributed in the extracellular spaces. In the liver, HA is mostly synthesized by the hepatic stellate cells and degraded by the sinusoidal endothelial cells. An increase in serum HA levels was observed in chronic hepatitis C and in cirrhotic patients [2, 3].
One of the main glycoproteins of the basement membrane is LN, which is synthesized by hepatocytes and sinusoidal cells [4]. Stellate cells or lipocytes produce the largest amount of serum LN. Increased serum LN levels in advanced stages of fibrosis (in patients with hepatic disease) were observed [5]. Korner et al reported that LN serum concentration could be a sensitive screening test for hepatic fibrotic disease and portal hypertension if the test was assessed together with the serum level of HA [6].
In the Iranian population, there are few published studies concerning the relationship between HA and LN serum levels and liver fibrosis stage or inflammation grade in chronic hepatitis and the studies have been performed in chronic

170 Parsian et al
hepatitis B patients [7, 8]. The value of such markers in patients with chronic hepatitis C and autoimmune hepatitis (AIH) especially in the north of Iran remain ambiguous. In addition, the published studies applied the Ishak scoring system for assessing liver fibrosis in liver biopsies [9] and there has been no report concerning the relationship between HA and LN serum levels and liver necroinflammatory injuries according to the modified Knodell score system [10].
Therefore we aimed to determine the differences in the serum concentrations of HA and LN between patients (chronic hepatitis B, C and AIH patients) with liver fibrosis according to the modified Knodell score system and healthy individuals without any sign of liver disease, as well as the optimal cut-off values for discriminating patients with liver fibrosis from those without liver fibrosis and patients with mild fibrosis from those with severe fibrosis. We tried also to assess if therapy modulates the levels of HA and LN in chronic hepatitis patients.
Methods
Study populationSixty-two patients, 35 men and 27 women (mean
age ± SD: 35.4±11.3 years) were signed up in this study. Among these 35 patients had hepatitis B, 14 had hepatitis C and 13 AIH. Patients were included in the study if they had persistently elevated serum aminotransferases greater than 1.5 fold upper limit of the reference range (for at least 6 months) and were positive for serum hepatitis B surface antigen or HCV antibodies. The AIH patients were diagnosed according to the International Autoimmune Hepatitis Group Report protocol [11]. Patients with a history of gastrointestinal bleeding, liver transplantation and other chronic liver diseases were excluded.
Treatment was initiated if they met the inclusion criteria and they were followed up for at least six months. Treatment of each patient was according to a standard protocol. Hepatitis C patients were treated with pegylated interferon (180 µg/week) + ribavirin (800-1200 mg/day) or interferon (3 million u, tid/week) + ribavirin (800-1200 mg/day). Hepatitis B patients were treated with interferon (3 million U, t.i.d./week) or adefovir (10 mg/day) or lamivudin (100 mg/day) and the AIH patients with prednisolone (0.5-1 mg/kg BW) and imuran (50-100 mg/kg BW) [12].
Control sera for the determination of HA and LN were obtained from 20 healthy volunteers; 10 women and 10 men (42.0±14.7 years). These healthy subjects had normal serum concentrations of aminotransferases and alkaline phosphatase (ALP) and therefore did not have to undergo liver biopsy and had no history of gastrointestinal or chronic liver disease, smoking and alcohol intake. The subjects who smoked (≥1cigarette/day) and drunk alcohol (>5g/day) were classified as smokers and alcohol drinkers.
All patients gave written informed consent to use these data for scientific purposes and Tabriz Medical University Ethical Committee approved the study.
Blood sample collection and analysisFasting venous blood (7ml) was collected on the day
before the beginning of the treatment and three times in a two month interval after the beginning of the treatment. Standard liver function tests, including aspartate aminotransferase (AST), alanine aminotransferase (ALT), ALP, bilirubin and albumin were measured by commercially available kits (Ziestchem, Tehran, Iran) and the APRI score [13] was calculated according to the following formula (upper limit of normal (ULN) for AST considered as 28.0 IU/L):
APRI = AST level (/ULN)/ Platelet counts (109/L) ×100
The hepatitis serology markers were analyzed on an ELISA reader (Norahan Fajr, Iran). Anti-LKM-1 (Euroimmun ELISA, Germany) and antinuclear antibody (Biazyme ELISA, Birmingham, UK) for AIH patients, hepatitis B surface antibody (Diakey, Shinjin Medics Inc. ELISA, Korea), hepatitis B core antibody (DiaPro ELISA, Italy) and hepatitis B surface antigen (Diakey, Shinjin Medics Inc. ELISA, Korea) were assayed for hepatitis B patients. An HCV antibody kit (Diakey, Shinjin Medics Inc. ELISA, Korea) and HCV PCR kit (Roche Diagnostics, Mannheim, Germany) were used for detecting hepatitis C.
Serum HA was assayed using an ELISA reader (Immunoscan, Lab System, Switzerland) and HA an ELISA Kit (HA-test, product number: K-1200, Echelon Bioscience Inc, USA). The concentration of HA in samples was determined from a standard curve. Serum HA concentrations were determined in one analytical batch in one working day. The intra assay variability (coefficient of variation: CV) of the procedure according to the manufacturer was 5.0%.
Serum LN concentrations were assayed using a LN EIA Kit (Takara Bio, product number: MK107) on an ELISA reader (BDSL, Immunoscan, Lab System, Switzerland) and the amount of LN was determined by a standard curve. The intra assay and inter-assay variability (CV) of the procedure according to the manufacturer, were 4.0 -5.7% and 0.3-5.0%, respectively.
Histological assessment of liver damageSixty-two patients underwent a liver biopsy for assessing
the presence and severity of liver disease. The biopsy fragments were fixed in a 10% formalin solution for 12 hours and embedded in paraffin. Sections were stained with hematoxylin-eosin, Masson’s trichrome and reticulin stain. Specimens were graded and staged according to the modified Knodell scoring system [10] by a pathologist who was blinded to the results of serum indices in the study subjects.
Statistical analysis The SPSS software (Version 12.0) was used for statistical
analysis. Data were expressed as mean ± SD and a p-value less than 0.05 was considered statistically significant. The mean serum HA and LN levels between patient subgroups (six stages of liver fibrosis) and healthy controls were compared with the analysis of variance (ANOVA). For

Hyaluronic acid, laminin and chronic hepatitis 171
multiple comparisons, we used the post-hoc, least square differences (LSD) method to compare HA and LN levels of different fibrosis stages with those in control subjects. The correlation between serum HA and LN levels with liver fibrosis stage and inflammation grade before and during treatment was calculated by Spearman’s correlation coefficient (rS). To assess the diagnostic accuracy of HA and LN for differentiating chronic hepatitis patients with severe liver fibrosis from healthy individuals and severe fibrosis from mild fibrosis, we plotted the receiver operating characteristic curve (ROC) and calculated the area under the curves (AUC) , sensitivity, specificity, positive predictive value (PPV), and negative predictive value (NPV) [14, 15].
Results
Characteristics of chronic hepatitis patients and controls are shown in Table I. The results of laboratory tests showed that the serum ALT, AST and ALP and APRI score in patients groups were significantly higher than in the control group (p<0.001) but the differences in platelet count, prothrombin time, total bilirubin, and albumin levels were not significant. The results also showed increased serum HA and LN levels in patients, as compared with the healthy controls (p<0.001). The serum HA and LN concentrations did not differ significantly among chronic hepatitis etiologies (for HA: HBV vs. HCV: p=0.149; HBV vs. AIH: p=0.971; and HCV vs. AIH: p=0.215, for LN: HBV vs. HCV: p=0.433; HBV vs. AIH: p=0.817; and HCV vs. AIH: p=0.401).
Table II. Serum hyaluronic acid concentrations (mean ± SD; ng/ml) in patient subgroups (stages of liver fibrosis) and controls (46.6 ± 10.5 ng/ml) before and during the treatment by ANOVA; post hoc, LSD method.
Stage HA1 HA2 HA3 HA4
0 (n=10) 53.6 ± 6.4‡ 60.5± 2.7‡ 61.3 ± 2.1‡ 59.0 ± 3.2‡
1 (n=19) 81.7± 21.4* 72.4 ± 19.4** 71.3 ± 18.9* 67.8 ± 17.8*
2 (n=11) 106.7 ± 22.4** 98.2 ± 17.6** 91.7 ± 21.3** 85.8 ± 20.1**
3 (n=9) 128.5 ± 24.9** 120.3 ± 17.5** 111.2 ± 17.2** 103.2 ±16.3**
4 (n=8) 172.0± 51.2** 156.0 ± 45.7** 148.3 ± 46.1** 138.6 ± 40.1**
5 (n=4) 238.0 ± 15.8** 221.5 ± 30.0** 201.7 ± 41.2** 200.2 ± 16.4**
HA1: Serum HA at entry; HA2, HA3 and HA4: Serum HA two, four and six months after the beginning of the treatment. ‡ Not significant; * P-value<0.05; ** P-value <0.001
Table I. Characteristics of the patient and control groups included in the study
Variables Patients (n=62)
Controls (n=20)
P value
Male/Female (n) 35 / 27 10 / 10 -
Age in years (range) 35.4 ± 11.3 (15-65)
42.0 ± 14.7 (20-69 )
-
Platelet count (109/L) 225.7± 122.4 179.7± 25.5 0.051
Total bilirubin (mg/dl) 2.13± 3.60 0.95± 0.40 0.363
Prothrombin time (s) 13.56± 1.65 13.15± 1.47 0.345
Albumin (g/dl) 3.7± 0.7 3.6± 0.8 0.559
ALT (IU/L) 143.0 ± 145.6 27.3 ± 6.4 <0.001
AST (IU/L) 101.1 ± 143.1 28.3 ± 6.5 <0.001
ALP (IU/L) 395.7 ± 426.7 130.6 ± 38.0 <0.001
APRI score 1.55 ± 1.66 0.57 ± 0.15 <0.001
Hyaluronic acid (ng/ml) 113.4 ± 59.2 46.6 ± 10.5 <0.001
Laminin (ng/ml) 91.9 ± 20.9 46.1 ± 10.1 <0.001
Comparison between the quantitative variables were performed by using Mann-Whitney U or Student’s t-test, as appropriate. The data are expressed as mean ± SD
The patients serum HA levels in different stages of liver fibrosis - at entry and during the treatment - are presented in Table II. Almost in all stages of hepatic fibrosis, the serum levels of HA were higher than those of the healthy group (p<0.05). In stage 0 of liver fibrosis at entry and during the treatment, the HA serum concentrations did not differ compared with the healthy controls. In fibrosis stage 6, which was represented by only one patient, the serum levels of HA at entry and during the treatment in this patient were 285.0,
Table III. Serum laminin concentrations (mean ± SD; ng/ml) in patient subgroups (six stages of liver fibrosis) and control group (46.1 ± 10.1 ng/ml) before and during the treatment by ANOVA; post hoc, LSD method.
Stage LN1 LN2 LN3 LN4
0 (n=10) 63.0 ±12.1** 44.0 ± 4.1‡ 41.0 ± 2.6‡ 39.0 ± 3.7‡
1 (n=19) 85.7 ± 6.3** 79.5 ± 6.6** 75.3 ± 7.0** 75.2 ± 6.0**
2 (n=11) 94.0 ± 10.2** 90.9 ± 12.0** 85.7 ± 2.4** 83.8 ± 11.1**
3 (n=9) 100.6 ± 8.6** 96.0 ± 7.0** 90.0 ± 5.0** 87.6 ± 5.9**
4 (n=8) 104.2 ± 20.2** 100.3 ± 18.4** 93.0 ±15.2** 88.8 ± 13.0**
5 (n=4) 130.2 ± 13.7** 118.2 ± 19.0** 111.7 ±12.6** 110.2 ± 9.5**
LN1: Serum LN at entry; LN2, LN3 and LN4: Serum LN two, four and six months after the beginning of the treatment; ‡ Not significant; ** P-value <0.001
172 Parsian et al
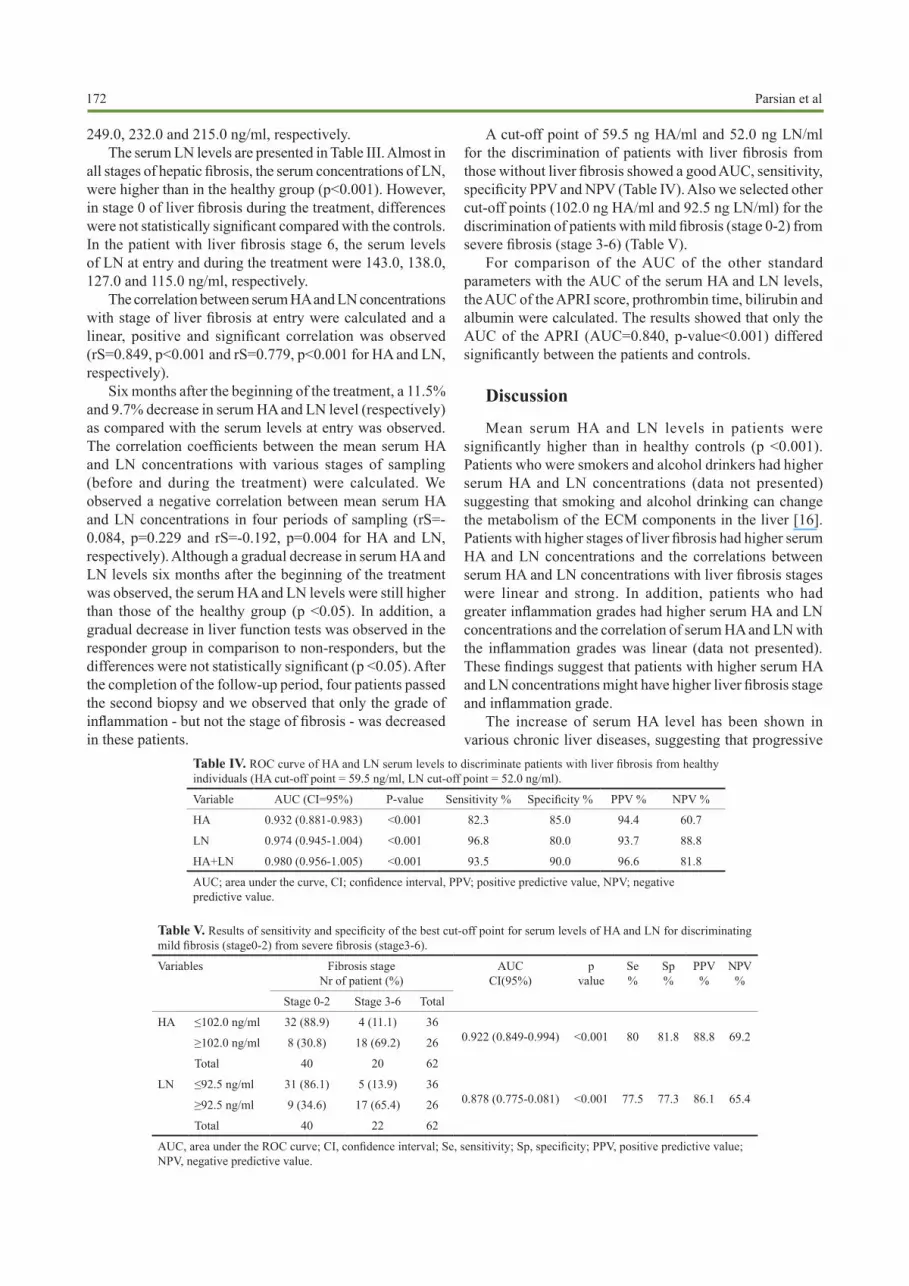
249.0, 232.0 and 215.0 ng/ml, respectively.The serum LN levels are presented in Table III. Almost in
all stages of hepatic fibrosis, the serum concentrations of LN, were higher than in the healthy group (p<0.001). However, in stage 0 of liver fibrosis during the treatment, differences were not statistically significant compared with the controls. In the patient with liver fibrosis stage 6, the serum levels of LN at entry and during the treatment were 143.0, 138.0, 127.0 and 115.0 ng/ml, respectively.
The correlation between serum HA and LN concentrations with stage of liver fibrosis at entry were calculated and a linear, positive and significant correlation was observed (rS=0.849, p<0.001 and rS=0.779, p<0.001 for HA and LN, respectively).
Six months after the beginning of the treatment, a 11.5% and 9.7% decrease in serum HA and LN level (respectively) as compared with the serum levels at entry was observed. The correlation coefficients between the mean serum HA and LN concentrations with various stages of sampling (before and during the treatment) were calculated. We observed a negative correlation between mean serum HA and LN concentrations in four periods of sampling (rS=-0.084, p=0.229 and rS=-0.192, p=0.004 for HA and LN, respectively). Although a gradual decrease in serum HA and LN levels six months after the beginning of the treatment was observed, the serum HA and LN levels were still higher than those of the healthy group (p <0.05). In addition, a gradual decrease in liver function tests was observed in the responder group in comparison to non-responders, but the differences were not statistically significant (p <0.05). After the completion of the follow-up period, four patients passed the second biopsy and we observed that only the grade of inflammation - but not the stage of fibrosis - was decreased in these patients.
Table IV. ROC curve of HA and LN serum levels to discriminate patients with liver fibrosis from healthy individuals (HA cut-off point = 59.5 ng/ml, LN cut-off point = 52.0 ng/ml).
Variable AUC (CI=95%) P-value Sensitivity % Specificity % PPV % NPV %
HA 0.932 (0.881-0.983) <0.001 82.3 85.0 94.4 60.7
LN 0.974 (0.945-1.004) <0.001 96.8 80.0 93.7 88.8
HA+LN 0.980 (0.956-1.005) <0.001 93.5 90.0 96.6 81.8
AUC; area under the curve, CI; confidence interval, PPV; positive predictive value, NPV; negative predictive value.
A cut-off point of 59.5 ng HA/ml and 52.0 ng LN/ml for the discrimination of patients with liver fibrosis from those without liver fibrosis showed a good AUC, sensitivity, specificity PPV and NPV (Table IV). Also we selected other cut-off points (102.0 ng HA/ml and 92.5 ng LN/ml) for the discrimination of patients with mild fibrosis (stage 0-2) from severe fibrosis (stage 3-6) (Table V).
For comparison of the AUC of the other standard parameters with the AUC of the serum HA and LN levels, the AUC of the APRI score, prothrombin time, bilirubin and albumin were calculated. The results showed that only the AUC of the APRI (AUC=0.840, p-value<0.001) differed significantly between the patients and controls.
Discussion
Mean serum HA and LN levels in patients were significantly higher than in healthy controls (p <0.001). Patients who were smokers and alcohol drinkers had higher serum HA and LN concentrations (data not presented) suggesting that smoking and alcohol drinking can change the metabolism of the ECM components in the liver [16]. Patients with higher stages of liver fibrosis had higher serum HA and LN concentrations and the correlations between serum HA and LN concentrations with liver fibrosis stages were linear and strong. In addition, patients who had greater inflammation grades had higher serum HA and LN concentrations and the correlation of serum HA and LN with the inflammation grades was linear (data not presented). These findings suggest that patients with higher serum HA and LN concentrations might have higher liver fibrosis stage and inflammation grade.
The increase of serum HA level has been shown in various chronic liver diseases, suggesting that progressive
Table V. Results of sensitivity and specificity of the best cut-off point for serum levels of HA and LN for discriminating mild fibrosis (stage0-2) from severe fibrosis (stage3-6).
Variables Fibrosis stage Nr of patient (%)
AUCCI(95%)
p value
Se %
Sp %
PPV %
NPV %
Stage 0-2 Stage 3-6 Total
HA ≤102.0 ng/ml 32 (88.9) 4 (11.1) 360.922 (0.849-0.994) <0.001 80 81.8 88.8 69.2≥102.0 ng/ml 8 (30.8) 18 (69.2) 26
Total 40 20 62
LN ≤92.5 ng/ml 31 (86.1) 5 (13.9) 360.878 (0.775-0.081) <0.001 77.5 77.3 86.1 65.4≥92.5 ng/ml 9 (34.6) 17 (65.4) 26
Total 40 22 62
AUC, area under the ROC curve; CI, confidence interval; Se, sensitivity; Sp, specificity; PPV, positive predictive value; NPV, negative predictive value.

Hyaluronic acid, laminin and chronic hepatitis 173
liver damage can be identified and monitored by serum HA evaluation [17-20]. Castera et al reported that LN concentration increases in early stages of chronic liver disease and the highest concentrations were in active cirrhosis and chronic active hepatitis [21]. But Korner et al reported that among various serum parameters (such as HA, LN, A1-apolipoprotein, and prothrombin time), HA was most strongly correlated with the stage of liver fibrosis [6].
The mean serum HA concentrations in the six stages of the liver fibrosis showed statistically significant differences as compared with the healthy group. Patients with higher stages of liver fibrosis had higher serum HA concentrations. This suggested that when liver damage develops, the liver more poorly metabolized the HA. Patients in early stage of liver fibrosis possibly better metabolized HA in the liver than those with advanced liver fibrosis stages. We observed such a pattern also for LN concentrations in the patient group.
Murawaki et al reported that differences in serum HA levels in patients with chronic hepatitis C between various stages of liver fibrosis were statistically significant [19]. Tao et al reported that serum HA and LN levels were higher in cirrhotic patients than in controls and the highest levels were detected in patients with higher stages of liver fibrosis. In addition, patients had serum HA and LN levels consistent with stages of their liver fibrosis [22]. In another study, the mean serum level of LN in severe liver fibrosis were greater than in mild liver fibrosis and the highest concentrations of serum LN were in active cirrhosis and chronic active hepatitis [23].
We measured the serum HA and LN levels before and during the treatment in patients. Serum HA and LN levels decreased during six months treatment, but the levels remained abnormally high as compared with the controls. In stage 0 of liver fibrosis - six months after the beginning of the treatment - HA and LN serum levels in patients and controls did not differ. It means that serum HA and LN concentrations were constant in this group of patients and showed the efficacy of the treatment. The decrease in serum concentrations of HA after six months treatment was not significant, but LN showed a statistically significant decrease. We concluded that six months treatment are more effective on decreasing the serum LN concentrations than HA concentrations. Possibly, the treatment of liver fibrosis stimulates the liver endothelial cells to regenerate and new endothelial cells better metabolized HA and LN. Further studies are needed to gain a complete understanding of the ECM components metabolism.
Lebensztejn et al detected a significant decrease of serum HA level - but not of LN - after a two-year treatment of chronic hepatitis B patients [24]. Grzeszczuk et al assessed serum HA levels in chronic hepatitis B patients at baseline, then at the beginning of treatment and at weeks 4, 12, 24, 48. The mean serum HA pre-treatment level was higher than the mean levels detected in healthy controls and decreased gradually during treatment and the mean level detected at the end of the therapy was even lower than in controls. They concluded that serum HA level may be a valuable complementary marker
of liver fibrosis and necroinflammatory activity in chronic hepatitis B patients [18]. In another study, Guechot et al reported that the serum HA level correlated with the extent of liver fibrosis both before and after IFN-α therapy, but not with the histopathological indices of liver inflammation or necrosis [25]. Ishibashi et al serially measured the levels of serum HA before and 24 weeks after the end of IFN-α therapy in patients with chronic hepatitis C and observed that serum HA levels significantly decreased and reached normal levels after treatment [26].
A cut-off point of 59.5 ng HA/ml and 52.0 ng LN/ml for the discrimination of patients with liver fibrosis from those without liver fibrosis showed a good AUC (0.932 and 0.974, respectively) sensitivity, specificity, PPV and NPV. In addition, a cut-off point of 102.0 ng HA/ml and 92.5 ng LN/ml for the discrimination of patients with mild fibrosis from those with severe fibrosis showed the AUC of 0.922 and 0.878, respectively. It means that HA and LN can discriminate between persons with liver fibrosis and healthy individuals and patients with mild fibrosis from those with severe fibrosis. Similar results were obtained for the diagnosis of liver fibrosis at the same cut off value in other studies [19, 23, 27]. The combination of HA and LN results for predicting liver fibrosis improved the sensitivity, specificity, PPV and NPV of these biomarkers.
In several studies on cirrhotic patients, HA and LN turned out to be the relative biomarker of fibrosis [27, 28]. Zheng et al reported that in ROC analysis, the HA levels had greater diagnostic performances than LN according to fibrosis staging [20] and another study reported that serum HA had a reasonable diagnostic performance for discriminating patients with advanced liver fibrosis from those with no or mild fibrosis [25].
There are some reports which have proposed the transient elastography (Fibroscan) and the APRI score as non-invasive methods. Fibroscan yields high values in patients with acute liver damage. But there are some reports that this method gives a high variation of the AUC for the diagnosis of significant fibrosis [29-32]. We evaluated the AUC of the APRI and of serum HA and LN levels and found that the AUC of serum HA and LN levels agreed with the APRI values. We concluded that when serum HA and LN levels are used with the APRI score, they have an accuracy comparable to liver biopsy and can be used as an alternative method particularly in those patients in whom a liver biopsy cannot be carried out [13, 33, 34].
Conclusions
Our findings suggest that measurment of serum HA and LN concentrations can discriminate between patients with liver fibrosis and healthy individuals and between patients with mild fibrosis and those with severe fibrosis. An increase in serum HA and LN concentrations above the predictive value is associated with liver fibrosis. In addition the values of the APRI score and serum HA and LN levels are in the same order. Therefore, serum HA and LN levels together

174 Parsian et al
with the APRI score could be an additional non-invasive tool for evaluation of liver fibrosis, when liver biopsy is contraindicated. These indices may also be used for the assessment of therapeutic efficacy in chronic hepatitis patients, if liver biopsy can not be performed.
Conflicts of interestNone to declare.
AcknowledgmentsThe authors gratefully acknowledge the financial support
from the Liver and Gastroenterology Research Centre, Tabriz University of Medical Sciences, Tabriz, Iran.
References 1. Stauber RE, Lackner C. Noninvasive diagnosis of hepatic fibrosis in
chronic hepatitis C. World J Gastroenterol 2007; 13: 4287-4294. 2. Leroy V. Other non-invasive markers of liver fibrosis. Gastroenterol
Clin Biol 2008; 32(6 Suppl 1): 52-57. 3. Halfon P, Bourliere M, Penaranda G et al. Accuracy of hyaluronic
acid level for predicting liver fibrosis stages in patients with hepatitis C virus. Comp Hepatol 2005; 4: 6.
4. Timpl R, Rohde H, Robey PG, Rennard SI, Foidart JM, Martin GR. Laminin-a glycoprotein from basement membranes. J Biol Chem 1979; 254: 9933-9937.
5. Niemela O, Risteli J, Blake JE, Risteli L, Compton KV, Orrego H. Markers of fibrogenesis and basement membrane formation in alcoholic liver disease. Relation to severity, presence of hepatitis, and alcohol intake. Gastroenterology 1990; 98: 1612-1619.
6. Korner T, Kropf J, Gressner AM. Serum laminin and hyaluronan in liver cirrhosis: markers of progression with high prognostic value. J Hepatol 1996; 25: 684-688.
7. Geramizadeh B, Janfeshan K, Saberfiroozi M. Serum hyaluronic acid as a non-invasive marker of hepatic fibrosis in chronic hepatitis B. Saudi J Gastroenterol 2008; 14: 174-177.
8. Montazeri G, Estakhri A, Mohamadnejad M, et al. Serum hyaluronate as a non-invasive marker of hepatic fibrosis and inflammation in HBeAg-negative chronic hepatitis B. BMC Gastroenterol 2005; 5: 32 .
9. Ishak K, Baptista A, Bianchi L, et al. Histological grading and staging of chronic hepatitis. J Hepatol 1995; 22: 696-699.
10. Knodell RG, Ishak KG, Black WC, et al. Formulation and application of a numerical scoring system for assessing histological activity in symptomatic chronic active hepatitis. Hepatology 1981; 1: 431 – 435.
11. Alvarez F, Berg PA, Bianchi FB, et al. International Autoimmune Hepatitis Group Report: review of criteria for diagnosis of autoimmune hepatitis. J Hepatol 1999; 31: 929-938.
12. Thomas HC, Lemon S, Zuckerman AJ. Viral Hepatitis. 3rd ed. Wiley-Blackwell. 2005.
13. Wai CT, Greenson JK, Fontana RJ, et al. A simple noninvasive index can predict both significant fibrosis and cirrhosis in patients with chronic hepatitis C. Hepatology 2003; 38: 518-526.
14. Zweig MH, Campbell G. Receiver-operating characteristic (ROC) plots: a fundamental evaluation tool in clinical medicine. Clin Chem 1993; 39: 561–577.
15. Huguet J, Castineiras MJ, Fuentes-Arderiu X. Diagnostic accuracy evaluation using ROC curve analysis. Scand J Clin Lab Invest 1993; 53: 693–699.
16. Wong CS, Gibson PR. Effects of eating on plasma hyaluronan in
patients with cirrhosis: its mechanism and influence on clinical interpretation. J Gastroenterol Hepatol 1998; 13: 1218-1224.
17. Dienstag JL. The role of liver biopsy in chronic hepatitis C. Hepatology 2002; 36(5 Suppl 1): S152-S160.
18. Grzeszczuk A, Prokopowicz D. Serum hyaluronic acid during lamivudine treatment in chronic hepatitis B. Rocz Akad Med Bialymst 2004; 49: 275-279.
19. Murawaki Y, Ikuta Y, Okamoto K, Koda M, Kawasaki H. Diagnostic value of serum markers of connective tissue turnover for predicting histological staging and grading in patients with chronic hepatitis C. J Gastroenterol 2001; 36: 399–406.
20. Zheng M, Cai WM, Weng HL, Liu RH. ROC curves in evaluation of serum fibrosis indices for hepatic fibrosis. World J Gastroenterol 2002; 8: 1073-1076.
21. Castera L, Hartmann DJ, Chapel F, et al. Serum laminin and type IV collagen are accurate markers of histologically severe alcoholic hepatitis in patients with cirrhosis. J Hepatol 2000; 32: 412–418.
22. Tao J, Peng HQ, Cai WM, Dong FQ, Weng HL, Liu RH. Influence factors of serum fibrosis markers in liver fibrosis. World J Gastroenterol 2003; 9: 2497-2500.
23. Attallah AM, Toson EA, Shiha GE, Omran MM, Abdel-Aziz MM, El-Dosoky I. Evaluation of serum procollagen aminoterminal propeptide III, laminin, and hydroxyproline as predictors of severe fibrosis in patients with chronic hepatitis C. J Immunoassay Immunochem 2007; 28: 199-211.
24. Lebensztejn DM, Skiba E, Sobaniec-Lotowska ME, Kaczmarski M. Serum hyaluronan and laminin level in children with chronic hepatitis B during long-term lamivudine treatment. Hepatogastroenterology 2007; 54: 834-838.
25. Guechot J, Loria A, Serfaty L, Giral P, Giboudeau J, Poupon R. Serum hyaluronan as a marker of liver fibrosis in chronic viral hepatitis C: effect of alpha-interferon therapy. J Hepatol 1995; 22: 22-26.
26. Ishibashi K, Kashiwagi T, Ito A, et al. Changes in serum fibrogenesis markers during interferon therapy for chronic hepatitis type C. Hepatology 1996; 24: 27-31.
27. Santos VN, Leite-Mor MM, Kondo M, et al. Serum laminin, type IV collagen and hyaluronan as fibrosis markers in non-alcoholic fatty liver disease. Braz J Med Biol Res 2005; 38: 747-753.
28. Lydatakis H, Hager IP, Kostadelou E, Mpousmpoulas S, Pappas S, Diamantis I. Non-invasive markers to predict the liver fibrosis in non-alcoholic fatty liver disease. Liver Int 2006; 26: 864–871.
29. Castera L, Vergniol J, Foucher J, et al. Prospective comparison of transient elastography, Fibrotest, APRI, and liver biopsy for the assessment of fibrosis in chronic hepatitis C. Gastroenterology 2005; 128: 343-350.
30. Sagir A, Erhardt A, Schmitt M, Haussinger D. Transient elastography is unreliable for detection of cirrhosis in patients with acute liver damage. Hepatology 2008; 47: 592-595.
31. Castera L, Le Bail B, Roudot-Thoraval F, et al. Early detection in routine clinical practice of cirrhosis and oesophageal varices in chronic hepatitis C: comparison of transient elastography (FibroScan) with standard laboratory tests and non-invasive scores. J Hepatol 2009; 50: 59-68.
32. Friedrich-Rust M, Ong MF, Martens S, et al. Performance of transient elastography for the staging of liver fibrosis: a meta-analysis. Gastroenterology 2008; 134: 960-974.
33. Borsoi Viana MS, Takei K, Collarile Yamaguti DC, Guz B, Strauss E. Use of AST platelet ratio index (APRI Score) as an alternative to liver biopsy for treatment indication in chronic hepatitis C. Ann Hepatol 2009; 8: 26-31.
34. Khan DA, Fatima-Tuz-Zuhra, Khan FA, Mubarak A. Evaluation of diagnostic accuracy of APRI for prediction of fibrosis in hepatitis C


