Embed Size (px)
Citation preview
Biological Conservation 188 (2015) 41–49
Contents lists available at ScienceDirect
Biological Conservation
journal homepage: www.elsevier .com/ locate /biocon
Special Issue Article: Tropical Insectivores
Severe declines of understory birds follow illegal logging in UpperGuinea forests of Ghana, West Africa
http://dx.doi.org/10.1016/j.biocon.2015.02.0100006-3207/� 2015 Elsevier Ltd. All rights reserved.
⇑ Corresponding author at: Department of Biodiversity, Earth and EnvironmentalScience, Drexel University, Philadelphia, PA 19104, USA. Tel.: +1 215 571 4198.
E-mail address: [email protected] (N. Arcilla).
Nicola Arcilla a,b,⇑, Lars H. Holbech c, Sean O’Donnell b
a Wildlife Wood Project – Ghana, Conservation Programmes, Zoological Society of London, Regent’s Park, London NW1 4RY, UKb Department of Biodiversity, Earth and Environmental Science, Drexel University, Philadelphia, PA 19104, USAc Department of Animal Biology and Conservation Science, University of Ghana, Legon, Accra, Ghana
a r t i c l e i n f o
Article history:Received 2 April 2014Received in revised form 2 February 2015Accepted 7 February 2015Available online 12 March 2015
Keywords:Tropical forestIllegal loggingUnderstory bird communityForest generalistsSallying insectivoresAbundanceSpecies richness
a b s t r a c t
We investigated how legal logging history and recent illegal logging affected forest bird communitystructure in Ghana. Ghanaian forests belong to West Africa’s highly fragmented Upper Guinea rainforests, part of a global priority ‘‘biodiversity hotspot’’ under intense pressure from anthropogenicdegradation. Between 1995 and 2010, officially-reported legal logging intensities increased up to�600%, while illegal logging, which now accounts for 80% of timber extraction in Ghana, has drivenlogging intensities to �6 times greater than the maximum sustainable rate. We collected data in2008–2010 and used a comparable dataset collected in 1993–1995 to assess impacts of recent loggingon understory bird communities in large forest fragments (100–524 km2) in southwest Ghana. Forestunderstory bird species abundance declined by >50% during this period. Species richness also showeddeclining trends. Whereas analysis based on data collected in 1993–1995 estimated a partial post-loggingrecovery of the understory bird community at that time, data from 2008–2010 showed no indication ofpost-logging recovery, likely due to ongoing illegal logging following intensive legal logging operations.Forest generalist species and sallying insectivores declined significantly in logged compared to unloggedforests. These severe declines of Upper Guinea forest understory birds indicate the rapidly deterioratingconservation status of a biodiversity hotspot and could signal collapsing ecosystem processes. Immediateconservation actions are urgently required to protect surviving forest fragments from further degradationand avian declines.
� 2015 Elsevier Ltd. All rights reserved.
1. Introduction study has quantified the impacts of illegal logging on tropical
We present empirical data on the impacts of logging on under-story bird communities in West African Upper Guinea rain forest,taking advantage of a unique opportunity to compare findingsfrom two studies conducted 15 years apart in the same study areain Ghana. Logging and other types of anthropogenic forest conver-sion trigger changes in avian community dynamics, populationabundance, and species composition, and may increase extinctionrates (Stratford and Robinson, 2005; Sodhi et al., 2011; Thinhet al., 2012; Edwards and Laurance, 2013; Michalski and Peres,2013; Edwards et al., 2014). Illegal logging is an increasing threatto tropical forests (Laurance, 1999; Curran et al., 2004;Nellemann and INTERPOL, 2012; Finer et al., 2014). However, fewdatasets allow assessments of the effects of logging history andillegal logging on bird community structure, and no empirical
wildlife.West Africa’s Upper Guinea rain forests form part of a priority
global ‘‘biodiversity hotspot’’ where exceptional plant and animalendemism is severely threatened by human activities (Myerset al., 2000; Kouame et al., 2012). Over 80% of Ghana’s UpperGuinea forests have been cleared, mainly for agriculture and settle-ment, and remaining forest is highly fragmented (Hawthorne andAbu-Juam, 1995; Beier et al., 2002). Extant forest fragments haveimmense conservation value as refuges for endemic birds andother wildlife (Brashares et al., 2001; Cordeiro et al., currentissue). A number of priority global Endemic and Important BirdAreas have been designated in these forests (BirdLife, 2013).Ghana’s forest avifauna is comprised of �80% Guinean–Congolianregional endemics and �14% species restricted to Upper Guineaforests (Dowsett-Lemaire and Dowsett, 2014), making this regionimportant for studies of disturbance effects on bird communities.
Illegal logging is a major driver contributing to tropical forestdestruction worldwide, and accounts for 50–90% of timberharvested in many tropical countries (Nellemann and INTERPOL,
42 N. Arcilla et al. / Biological Conservation 188 (2015) 41–49
2012; Zimmerman and Kormos, 2012). Illegal logging nowcomprises 80% of Ghana’s annual timber production and in recentyears has driven logging intensities up to �6 times greater than themaximum allowable cut for sustainable forestry (Hansen et al.,2009, 2012). The fact that illegal logging is particularly well studiedand documented in Ghana (Hansen and Treue, 2008; Marfo, 2010;Hansen et al., 2009; Hansen et al., 2012; Teye, 2013; Amoah andBoateng, 2014; Franck and Hansen, 2014; Oduro et al., 2014) hasset the stage to allow us to examine its impacts on Ghana’sUpper Guinea forest understory birds.
Understory birds, especially insectivores, are sensitive to log-ging damage due to their foraging and habitat specializations,post-logging impoverishment of arthropod fauna, and high sitefidelity (Peters et al., 2008; Sodhi et al., 2011; Hamer et al.,current issue; Powell et al., current issue-a; Powell et al., currentissue-b). Understory birds thus serve as excellent indicators or‘‘sentinels’’ of forest ecosystem integrity (Corlett and Primack,2011; Sodhi et al., 2011). Few studies have evaluated avianresponses to logging in Guinean–Congolian forests of westernand central Africa, and we are aware of only one previous peer-reviewed study that has examined the impacts of logging onUpper Guinea forest birds, based on 1993–1995 data from Ghana(Holbech, 2005). While most empirical studies of tropical loggingand birds have been limited to examining short-term impacts(Thinh et al., 2012), we investigated both long-term trends andrecent patterns in understory bird dynamics in response to increas-es of logging intensity in Ghana’s remaining Upper Guinea forests.We conducted fieldwork in 2008–2010, and compared our datawith findings from fieldwork in 1993–1995 (Holbech 1996,2005). All data were collected in the same region of southwestGhana, including several of the same forest fragments. In thispaper, we address three main goals: (1) quantifying long-termchanges in Ghana’s understory birds by comparing sampling datafrom 1993–1995 (Holbech 2005, 2009) and 2008–2010; (2)quantifying recent trends in forest understory bird communitiesin response to recent increases in logging intensities, with a par-ticular focus on vulnerable insectivorous guilds and conservationpriority species; and (3) examining implications for UpperGuinea forest and understory bird ecology and conservation.
2. Materials and methods
2.1. Study area and study design
Remaining Upper Guinea forest in Ghana covers �16000 km2 ofreserves, representing 20% of extant forest prior to colonization,which were originally designated by the British colonial
Table 1Upper Guinea forest fragments sampled in Ghana in 2008–2010.
Foresta Area (km2) Forest typee Sampling e
Ankasa RRi 524b WE 2520Bia NP and Bia RR 306 MS 8550Bia Tributaries North FR 356 MS 5310Boin River FRi 278 W/ME 18970Kakum NP 366c MS 2430Nkrabia FR 100 MS 2760Suhuma FR 360 MS 15680Tano Nimiri FRi 335d W/ME 5520Yoyo River FRi 236 ME 11352
a FR = Forest Reserve (active logging concession); NP = National Park, RR = Resource Rb Area includes contiguous Nini-Suhien NP.c Area includes contiguous Assin-Atandanso RR.d Area includes contiguous Boi-Tano FR.e Forest habitat type classification (Hall and Swaine, 1976): MS = Moist Semi-deciduof NMH = Net-Meter-Hours.g GWD = Ghana Wildlife Division; GFSD = Ghana Forest Services Division.h UL = unlogged forest; L3 = forest 3 years post-logging; L10 = forest 10 years post-logi Forest fragments also sampled by Holbech 1993–1995 (Holbech 2005, 2009); see Fi
government for environmental protection and timber production(Hawthorne and Abu-Juam, 1995; Hansen et al., 2012). In the1970s, �8% of remaining forest (1261 km2) was designated aswildlife protected areas (national parks and resource reserves)managed by the Ghana Wildlife Division. The other �92% is inforest reserves managed as logging concessions by the GhanaForest Services Division, which leases them to private timbercompanies. Industrial logging operations are often accompaniedand followed by illegal logging, wherein both organized groupsand opportunistic individuals use logging roads to penetrate forestinterior and further exploit timber (Laurance, 1999; Marfo, 2010;Hansen et al., 2012). Approximately 25% of the total area of forestreserves has been seriously degraded or entirely cleared by humanimpacts, while 75% (�12000 km2) still constitutes dense forest(Norris et al., 2010). Virtually all forest outside of these reserveshas been cleared, leaving forest fragments surrounded by a matrixof plantation monocultures interspersed with human settlements(Deikumah et al., 2014).
We selected 27 study sites for bird sampling in 2008–2010 andcompared our results with sampling data from 1993 to 1995(Holbech, 1996, 2005) in the same region of southwest Ghana(Table 1 and Fig. 1). Our 2008–2010 sampling took place in 10protected forests (Fig. 1: 1–7 and A–C) and Holbech’s 1993–1995sampling took place in 9 protected forests (Fig. 1: 8–13; A–C),including 3 of the same reserves, for a total of 16 protected forests(12 forest reserves; 2 resource reserves; 2 national parks) includedin this study. We sampled only within large forest fragments(100–524 km2) in order to focus on logging impacts rather thanspecies-area relationships (Beier et al., 2002; Bregman et al.,2014; Stratford and Robinson, 2005). We sampled evergreen andsemi-deciduous forests with approximately equal effort to avoidbias due to habitat type. Sites were assigned as replicates of 1 of4 treatments: unlogged forest and forest �2, �10, and �20 or moreyears post-logging. We defined a replicate as a single mist netsampling session of 20–24 h accumulated over 2–3 days (hereafterwe refer to a mist net day as a ‘‘sampling occasion’’). We used atleast 3 replicates in each forest type, for a total of 6–9 replicatesper treatment. We recorded dates, times, geographic location,and logging history for each forest sampled. We included multiplelogging treatments within a single forest fragment whereverpossible, but this was sometimes precluded by fragments’ specificlogging histories.
To investigate the impacts of logging on understory bird com-munities in 2008–2010, we accumulated a total of 80 samplingoccasions. In 1993–1995, Holbech (1996, 2005) used a total effortof 201 sampling occasions, representing a greater range of
ffort (NMH)f Treatment(s) [replication(s)]g Governing authorityh
L20+(1) GWDUL(2), L10(1) GWDL3(1), L20+(1) GFSDUL (3), L3(2), L20+(2) GFSDL20+(1) GWDL20+(1) GFSDUL(1), L3(2), L10(2), L20+(1) GFSDL20+(2) GFSDL3(1), L10(3) GFSD
eserve (including former logging concessions).
us; W/ME = West/Moist Evergreen.
ging; L20+ = forest 20 or more years post-loggng.g. 1 for map and data comparisons.
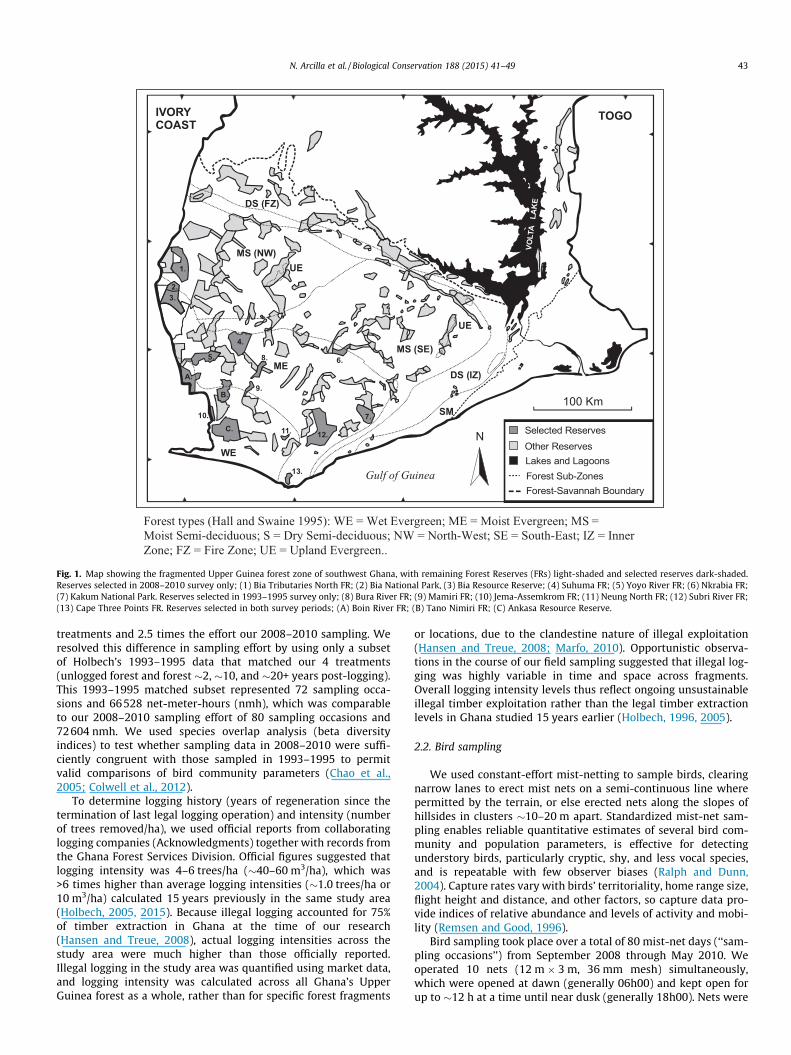
Fig. 1. Map showing the fragmented Upper Guinea forest zone of southwest Ghana, with remaining Forest Reserves (FRs) light-shaded and selected reserves dark-shaded.Reserves selected in 2008–2010 survey only; (1) Bia Tributaries North FR; (2) Bia National Park, (3) Bia Resource Reserve; (4) Suhuma FR; (5) Yoyo River FR; (6) Nkrabia FR;(7) Kakum National Park. Reserves selected in 1993–1995 survey only; (8) Bura River FR; (9) Mamiri FR; (10) Jema-Assemkrom FR; (11) Neung North FR; (12) Subri River FR;(13) Cape Three Points FR. Reserves selected in both survey periods; (A) Boin River FR; (B) Tano Nimiri FR; (C) Ankasa Resource Reserve.
N. Arcilla et al. / Biological Conservation 188 (2015) 41–49 43
treatments and 2.5 times the effort our 2008–2010 sampling. Weresolved this difference in sampling effort by using only a subsetof Holbech’s 1993–1995 data that matched our 4 treatments(unlogged forest and forest �2, �10, and �20+ years post-logging).This 1993–1995 matched subset represented 72 sampling occa-sions and 66528 net-meter-hours (nmh), which was comparableto our 2008–2010 sampling effort of 80 sampling occasions and72604 nmh. We used species overlap analysis (beta diversityindices) to test whether sampling data in 2008–2010 were suffi-ciently congruent with those sampled in 1993–1995 to permitvalid comparisons of bird community parameters (Chao et al.,2005; Colwell et al., 2012).
To determine logging history (years of regeneration since thetermination of last legal logging operation) and intensity (numberof trees removed/ha), we used official reports from collaboratinglogging companies (Acknowledgments) together with records fromthe Ghana Forest Services Division. Official figures suggested thatlogging intensity was 4–6 trees/ha (�40–60 m3/ha), which was>6 times higher than average logging intensities (�1.0 trees/ha or10 m3/ha) calculated 15 years previously in the same study area(Holbech, 2005, 2015). Because illegal logging accounted for 75%of timber extraction in Ghana at the time of our research(Hansen and Treue, 2008), actual logging intensities across thestudy area were much higher than those officially reported.Illegal logging in the study area was quantified using market data,and logging intensity was calculated across all Ghana’s UpperGuinea forest as a whole, rather than for specific forest fragments
or locations, due to the clandestine nature of illegal exploitation(Hansen and Treue, 2008; Marfo, 2010). Opportunistic observa-tions in the course of our field sampling suggested that illegal log-ging was highly variable in time and space across fragments.Overall logging intensity levels thus reflect ongoing unsustainableillegal timber exploitation rather than the legal timber extractionlevels in Ghana studied 15 years earlier (Holbech, 1996, 2005).
2.2. Bird sampling
We used constant-effort mist-netting to sample birds, clearingnarrow lanes to erect mist nets on a semi-continuous line wherepermitted by the terrain, or else erected nets along the slopes ofhillsides in clusters �10–20 m apart. Standardized mist-net sam-pling enables reliable quantitative estimates of several bird com-munity and population parameters, is effective for detectingunderstory birds, particularly cryptic, shy, and less vocal species,and is repeatable with few observer biases (Ralph and Dunn,2004). Capture rates vary with birds’ territoriality, home range size,flight height and distance, and other factors, so capture data pro-vide indices of relative abundance and levels of activity and mobi-lity (Remsen and Good, 1996).
Bird sampling took place over a total of 80 mist-net days (‘‘sam-pling occasions’’) from September 2008 through May 2010. Weoperated 10 nets (12 m � 3 m, 36 mm mesh) simultaneously,which were opened at dawn (generally 06h00) and kept open forup to �12 h at a time until near dusk (generally 18h00). Nets were
44 N. Arcilla et al. / Biological Conservation 188 (2015) 41–49
closed during periods of rain. We accumulated 20–24 mist-net hper site, usually within 2–3 days. We identified, measured,weighed, photographed, and released birds at the capture site afterprocessing. Birds were not banded because all sampling at a givensite occurred within 2–3 consecutive days. Instead, captured birdswere marked on the belly feathers with a permanent marker toavoid double-counting (Holbech, 2005, 2009). Recaptured birdswere released immediately at capture sites.
2.3. Avian conservation priority status and ecological guilds
To test for impacts on avian habitat and foraging guilds, weassigned species encountered to guilds as follows: forest specialists(forest-dependent species typically restricted to forest interior andwhich prefer primary forest), forest generalists (forest-dependentspecies ranging throughout forests and which prefer secondarygrowth and edge), and forest visitors (species not dependent onforest that occur both outside and inside forests but which prefernon-forest areas), as well as to 3 potentially vulnerable understoryinsectivore guilds: sallying insectivores, terrestrial insectivores,and ant followers (Bennun et al., 1996; Holbech, 2005, 2009). Weused data from this and previous studies to assign conservationpriority status to species considered especially vulnerable toextinction due to their rarity, range restrictions, and habitat and/or foraging specializations (Grimes, 1987; Beier et al., 2002;Holbech, 2005, 2009; Dowsett-Lemaire and Dowsett, 2014); thisis analogous to ‘‘conservation important’’ species as defined byHolbech (2005, 2009). Nomenclature follows Borrow and Demey(2010).
2.4. Statistical analyses
We standardized relative abundances for all replicatecaptures per 1000 net-meter-hours (nmh; this is equivalent to1000/12 = 83 net-hours), and calculated means and standarddeviations based on the number of replicates in each treatment(Table 2). As �88% of bird species are shared between semi-deciduous and evergreen forest in Ghana (Ntiamoa-Baidu et al.,2000), and our sampling effort was equivalent for both forest types,we pooled data from forest types to increase the statistical powerof our analyses. We used the mist-net capture rate (birds/10000 nmh) at each site as our unit of comparison. We calculatedmean capture rates among sites within each forest category to testfor effects of time since logging on bird abundance.
We used EstimateS software v. 9.1 (Colwell, 2013) to generatespecies accumulation curves (species observed versus individualsfor comparable sampling efforts). We compared species richnessin the 1993–1995 subsample with that in the 2008–2010 datasetusing 95% confidence intervals around mean richness as a conser-vative statistical test for differences in species richness (Colwellet al., 2012). We extrapolated the 2010 species accumulationcurves to match the total bird captures in the 1993–1995subsample, and also compared asymptotic estimates of total birdspecies richness between 1995 and 2010 (Abundance CoverageEstimator, ACE: Colwell and Coddington, 1994; Colwell et al.,2012). We used the abundance-based Chao-Jaccard species simi-larity index to assess whether bird communities were sufficientlycongruent across sampling periods to enable accurate comparison;this index represents the probability that a bird randomly chosenfrom one sample would belong to a species found in the othersample (Chao et al., 2005).
To test for changes in abundance in response to logging, weconducted ANOVAs using general linear models (function lm) inR (R Core Development Team, 2013), testing each of 4 explanatory
variables (forest size, forest type, post-logging regeneration time,logged vs. unlogged forest) in turn as a predictor of abundance ofeach of 6 guilds: forest specialists; forest generalists; conservationpriority species; sallying insectivores; terrestrial insectivores;ant-following insectivores. We also compared mean values ofoverall and conservation priority species abundance between1995 and 2010 through one-way ANOVAs, using Practistat(Ashcroft and Pereira, 2003; Holbech, 2005).
3. Results
We captured 962 individuals of 46 bird species, of which 32(70%) were forest specialists, 13 (�28%) were forest generalists,and 35 species (76%) were understory insectivores (Appendix A).We compared this 2008–2010 capture data with the subset ofHolbech’s 1993–1995 data (1996, 2005) described previously,which resulted in captures of 2293 individuals of 71 bird species.The Chao-Jaccard index for the 1993–1995 (Holbech, 1996, 2005)and 2008–2010 datasets indicated a very high (96.6%) similarity,allowing us to compare bird community parameters between1995 and 2010 with confidence (Chao et al., 2005).
3.1. Long-term changes in Upper Guinea forest understory birdcommunities
Following >600% increases in logging intensities in Ghana’sUpper Guinea forests between 1995 and 2010, overall empiricalabundance (birds/10000 nmh) was 52% lower in 2010 (13.46) thanin 1995 (28.07) (F1,28 = 90.52, p < 0.001) and differed in the rela-tionship of abundance with logging treatment (Fig. 2; F3,28 = 6.56,p = 0.002). The greatest differences were in logged forests, whichhad much higher capture rates in 1995 than in 2010 (Fig. 2). Wefound no indication of a post-logging bird community recoveryby 2010 (Fig. 2). Abundance in all logged treatments in 2008–2010 was significantly lower than in unlogged forest, in contrastto Holbech’s (1996, 2005) previous findings of an increase in birdabundance over time following logging in 1993–1995. A separateanalysis of the 2008–2010 data also suggested capture rates weresignificantly higher in unlogged forest but time since logging hadno additional effect (Tukey HSD post-hoc test, critical alpha 0.05).
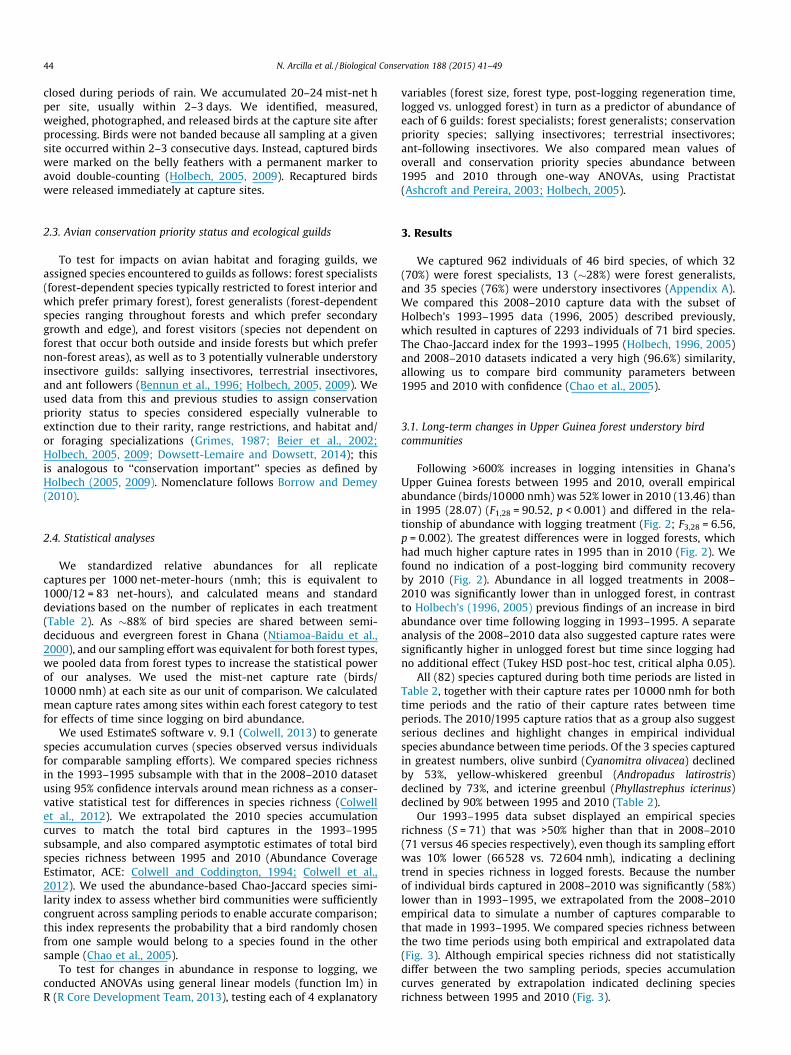
All (82) species captured during both time periods are listed inTable 2, together with their capture rates per 10000 nmh for bothtime periods and the ratio of their capture rates between timeperiods. The 2010/1995 capture ratios that as a group also suggestserious declines and highlight changes in empirical individualspecies abundance between time periods. Of the 3 species capturedin greatest numbers, olive sunbird (Cyanomitra olivacea) declinedby 53%, yellow-whiskered greenbul (Andropadus latirostris)declined by 73%, and icterine greenbul (Phyllastrephus icterinus)declined by 90% between 1995 and 2010 (Table 2).
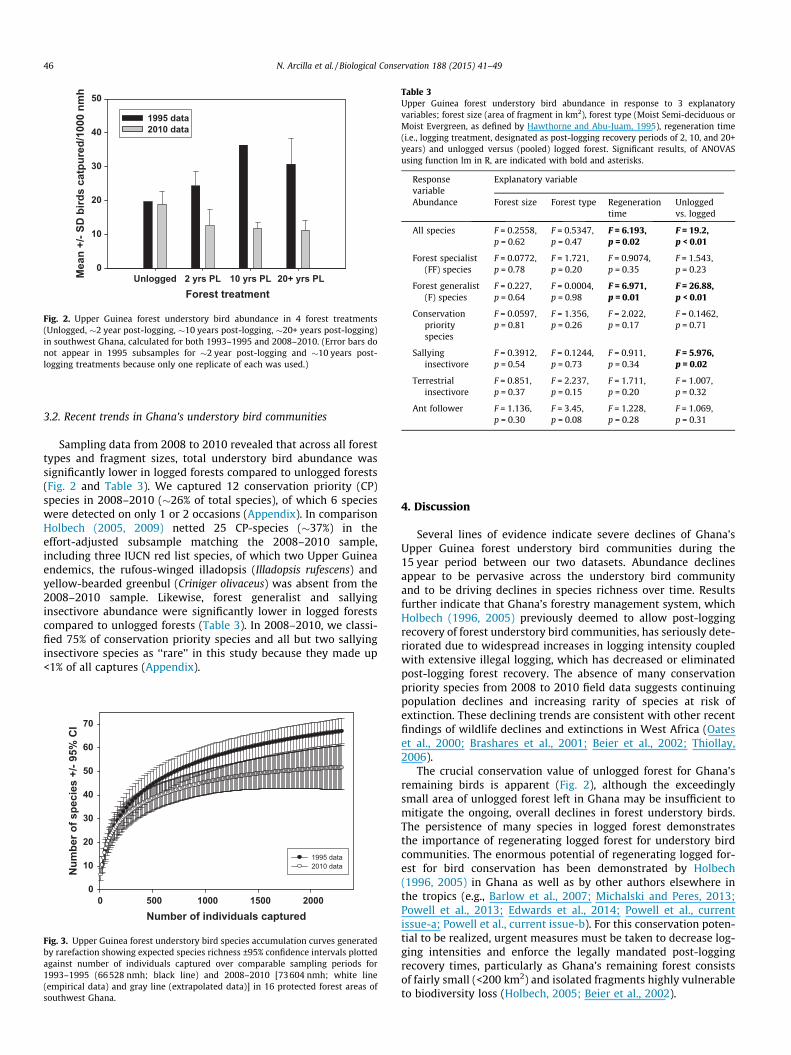
Our 1993–1995 data subset displayed an empirical speciesrichness (S = 71) that was >50% higher than that in 2008–2010(71 versus 46 species respectively), even though its sampling effortwas 10% lower (66528 vs. 72604 nmh), indicating a decliningtrend in species richness in logged forests. Because the numberof individual birds captured in 2008–2010 was significantly (58%)lower than in 1993–1995, we extrapolated from the 2008–2010empirical data to simulate a number of captures comparable tothat made in 1993–1995. We compared species richness betweenthe two time periods using both empirical and extrapolated data(Fig. 3). Although empirical species richness did not statisticallydiffer between the two sampling periods, species accumulationcurves generated by extrapolation indicated declining speciesrichness between 1995 and 2010 (Fig. 3).
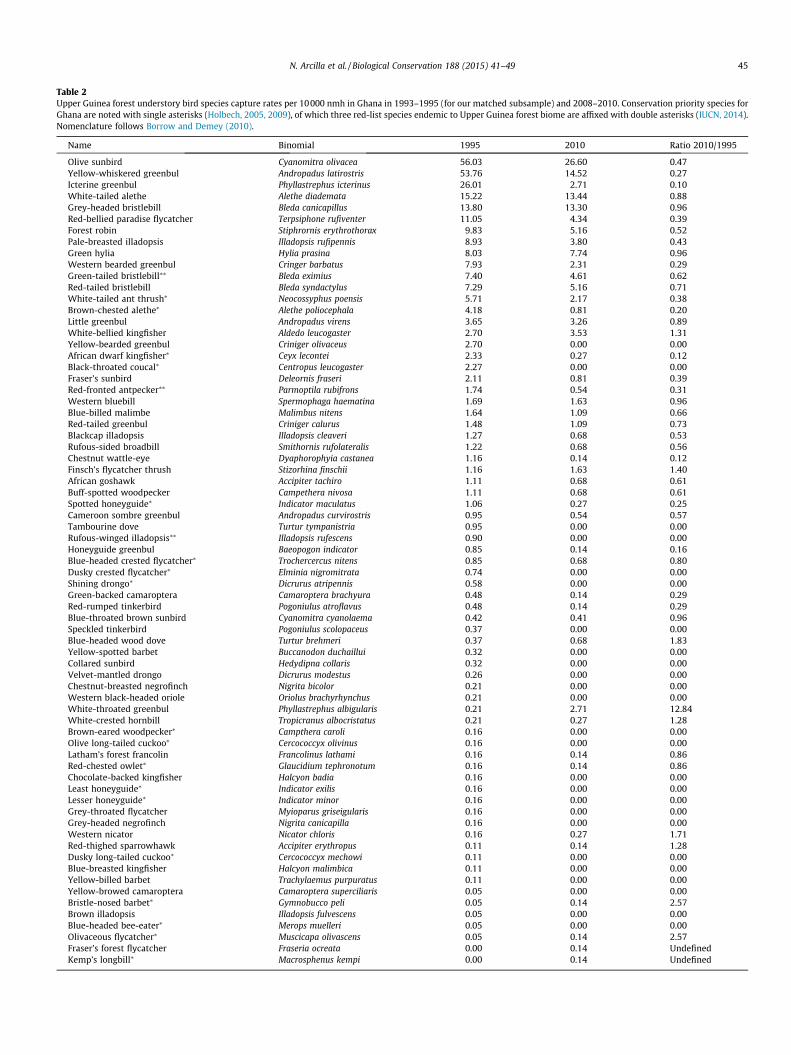
Table 2Upper Guinea forest understory bird species capture rates per 10 000 nmh in Ghana in 1993–1995 (for our matched subsample) and 2008–2010. Conservation priority species forGhana are noted with single asterisks (Holbech, 2005, 2009), of which three red-list species endemic to Upper Guinea forest biome are affixed with double asterisks (IUCN, 2014).Nomenclature follows Borrow and Demey (2010).
Name Binomial 1995 2010 Ratio 2010/1995
Olive sunbird Cyanomitra olivacea 56.03 26.60 0.47Yellow-whiskered greenbul Andropadus latirostris 53.76 14.52 0.27Icterine greenbul Phyllastrephus icterinus 26.01 2.71 0.10White-tailed alethe Alethe diademata 15.22 13.44 0.88Grey-headed bristlebill Bleda canicapillus 13.80 13.30 0.96Red-bellied paradise flycatcher Terpsiphone rufiventer 11.05 4.34 0.39Forest robin Stiphrornis erythrothorax 9.83 5.16 0.52Pale-breasted illadopsis Illadopsis rufipennis 8.93 3.80 0.43Green hylia Hylia prasina 8.03 7.74 0.96Western bearded greenbul Cringer barbatus 7.93 2.31 0.29Green-tailed bristlebill⁄⁄ Bleda eximius 7.40 4.61 0.62Red-tailed bristlebill Bleda syndactylus 7.29 5.16 0.71White-tailed ant thrush⁄ Neocossyphus poensis 5.71 2.17 0.38Brown-chested alethe⁄ Alethe poliocephala 4.18 0.81 0.20Little greenbul Andropadus virens 3.65 3.26 0.89White-bellied kingfisher Aldedo leucogaster 2.70 3.53 1.31Yellow-bearded greenbul Criniger olivaceus 2.70 0.00 0.00African dwarf kingfisher⁄ Ceyx lecontei 2.33 0.27 0.12Black-throated coucal⁄ Centropus leucogaster 2.27 0.00 0.00Fraser’s sunbird Deleornis fraseri 2.11 0.81 0.39Red-fronted antpecker⁄⁄ Parmoptila rubifrons 1.74 0.54 0.31Western bluebill Spermophaga haematina 1.69 1.63 0.96Blue-billed malimbe Malimbus nitens 1.64 1.09 0.66Red-tailed greenbul Criniger calurus 1.48 1.09 0.73Blackcap illadopsis Illadopsis cleaveri 1.27 0.68 0.53Rufous-sided broadbill Smithornis rufolateralis 1.22 0.68 0.56Chestnut wattle-eye Dyaphorophyia castanea 1.16 0.14 0.12Finsch’s flycatcher thrush Stizorhina finschii 1.16 1.63 1.40African goshawk Accipiter tachiro 1.11 0.68 0.61Buff-spotted woodpecker Campethera nivosa 1.11 0.68 0.61Spotted honeyguide⁄ Indicator maculatus 1.06 0.27 0.25Cameroon sombre greenbul Andropadus curvirostris 0.95 0.54 0.57Tambourine dove Turtur tympanistria 0.95 0.00 0.00Rufous-winged illadopsis⁄⁄ Illadopsis rufescens 0.90 0.00 0.00Honeyguide greenbul Baeopogon indicator 0.85 0.14 0.16Blue-headed crested flycatcher⁄ Trochercercus nitens 0.85 0.68 0.80Dusky crested flycatcher⁄ Elminia nigromitrata 0.74 0.00 0.00Shining drongo⁄ Dicrurus atripennis 0.58 0.00 0.00Green-backed camaroptera Camaroptera brachyura 0.48 0.14 0.29Red-rumped tinkerbird Pogoniulus atroflavus 0.48 0.14 0.29Blue-throated brown sunbird Cyanomitra cyanolaema 0.42 0.41 0.96Speckled tinkerbird Pogoniulus scolopaceus 0.37 0.00 0.00Blue-headed wood dove Turtur brehmeri 0.37 0.68 1.83Yellow-spotted barbet Buccanodon duchaillui 0.32 0.00 0.00Collared sunbird Hedydipna collaris 0.32 0.00 0.00Velvet-mantled drongo Dicrurus modestus 0.26 0.00 0.00Chestnut-breasted negrofinch Nigrita bicolor 0.21 0.00 0.00Western black-headed oriole Oriolus brachyrhynchus 0.21 0.00 0.00White-throated greenbul Phyllastrephus albigularis 0.21 2.71 12.84White-crested hornbill Tropicranus albocristatus 0.21 0.27 1.28Brown-eared woodpecker⁄ Campthera caroli 0.16 0.00 0.00Olive long-tailed cuckoo⁄ Cercococcyx olivinus 0.16 0.00 0.00Latham’s forest francolin Francolinus lathami 0.16 0.14 0.86Red-chested owlet⁄ Glaucidium tephronotum 0.16 0.14 0.86Chocolate-backed kingfisher Halcyon badia 0.16 0.00 0.00Least honeyguide⁄ Indicator exilis 0.16 0.00 0.00Lesser honeyguide⁄ Indicator minor 0.16 0.00 0.00Grey-throated flycatcher Myioparus griseigularis 0.16 0.00 0.00Grey-headed negrofinch Nigrita canicapilla 0.16 0.00 0.00Western nicator Nicator chloris 0.16 0.27 1.71Red-thighed sparrowhawk Accipiter erythropus 0.11 0.14 1.28Dusky long-tailed cuckoo⁄ Cercococcyx mechowi 0.11 0.00 0.00Blue-breasted kingfisher Halcyon malimbica 0.11 0.00 0.00Yellow-billed barbet Trachylaemus purpuratus 0.11 0.00 0.00Yellow-browed camaroptera Camaroptera superciliaris 0.05 0.00 0.00Bristle-nosed barbet⁄ Gymnobucco peli 0.05 0.14 2.57Brown illadopsis Illadopsis fulvescens 0.05 0.00 0.00Blue-headed bee-eater⁄ Merops muelleri 0.05 0.00 0.00Olivaceous flycatcher⁄ Muscicapa olivascens 0.05 0.14 2.57Fraser’s forest flycatcher Fraseria ocreata 0.00 0.14 UndefinedKemp’s longbill⁄ Macrosphenus kempi 0.00 0.14 Undefined
N. Arcilla et al. / Biological Conservation 188 (2015) 41–49 45
Forest treatmentUnlogged 2 yrs PL 10 yrs PL 20+ yrs PLM
ean
+/- S
D b
irds
catp
ured
/100
0 nm
h
0
10
20
30
40
50
1995 data2010 data
Fig. 2. Upper Guinea forest understory bird abundance in 4 forest treatments(Unlogged, �2 year post-logging, �10 years post-logging, �20+ years post-logging)in southwest Ghana, calculated for both 1993–1995 and 2008–2010. (Error bars donot appear in 1995 subsamples for �2 year post-logging and �10 years post-logging treatments because only one replicate of each was used.)
Table 3Upper Guinea forest understory bird abundance in response to 3 explanatoryvariables; forest size (area of fragment in km2), forest type (Moist Semi-deciduous orMoist Evergreen, as defined by Hawthorne and Abu-Juam, 1995), regeneration time(i.e., logging treatment, designated as post-logging recovery periods of 2, 10, and 20+years) and unlogged versus (pooled) logged forest. Significant results, of ANOVASusing function lm in R, are indicated with bold and asterisks.
Responsevariable
Explanatory variable
Abundance Forest size Forest type Regenerationtime
Unloggedvs. logged
All species F = 0.2558,p = 0.62
F = 0.5347,p = 0.47
F = 6.193,p = 0.02
F = 19.2,p < 0.01
Forest specialist(FF) species
F = 0.0772,p = 0.78
F = 1.721,p = 0.20
F = 0.9074,p = 0.35
F = 1.543,p = 0.23
Forest generalist(F) species
F = 0.227,p = 0.64
F = 0.0004,p = 0.98
F = 6.971,p = 0.01
F = 26.88,p < 0.01
Conservationpriorityspecies
F = 0.0597,p = 0.81
F = 1.356,p = 0.26
F = 2.022,p = 0.17
F = 0.1462,p = 0.71
Sallyinginsectivore
F = 0.3912,p = 0.54
F = 0.1244,p = 0.73
F = 0.911,p = 0.34
F = 5.976,p = 0.02
Terrestrialinsectivore
F = 0.851,p = 0.37
F = 2.237,p = 0.15
F = 1.711,p = 0.20
F = 1.007,p = 0.32
Ant follower F = 1.136,p = 0.30
F = 3.45,p = 0.08
F = 1.228,p = 0.28
F = 1.069,p = 0.31
46 N. Arcilla et al. / Biological Conservation 188 (2015) 41–49
3.2. Recent trends in Ghana’s understory bird communities
Sampling data from 2008 to 2010 revealed that across all foresttypes and fragment sizes, total understory bird abundance wassignificantly lower in logged forests compared to unlogged forests(Fig. 2 and Table 3). We captured 12 conservation priority (CP)species in 2008–2010 (�26% of total species), of which 6 specieswere detected on only 1 or 2 occasions (Appendix). In comparisonHolbech (2005, 2009) netted 25 CP-species (�37%) in theeffort-adjusted subsample matching the 2008–2010 sample,including three IUCN red list species, of which two Upper Guineaendemics, the rufous-winged illadopsis (Illadopsis rufescens) andyellow-bearded greenbul (Criniger olivaceus) was absent from the2008–2010 sample. Likewise, forest generalist and sallyinginsectivore abundance were significantly lower in logged forestscompared to unlogged forests (Table 3). In 2008–2010, we classi-fied 75% of conservation priority species and all but two sallyinginsectivore species as ‘‘rare’’ in this study because they made up<1% of all captures (Appendix).
Number of individuals captured0 500 1000 1500 2000
Num
ber o
f spe
cies
+/-
95%
CI
0
10
20
30
40
50
60
70
1995 data2010 data
Fig. 3. Upper Guinea forest understory bird species accumulation curves generatedby rarefaction showing expected species richness ±95% confidence intervals plottedagainst number of individuals captured over comparable sampling periods for1993–1995 (66528 nmh; black line) and 2008–2010 [73604 nmh; white line(empirical data) and gray line (extrapolated data)] in 16 protected forest areas ofsouthwest Ghana.
4. Discussion
Several lines of evidence indicate severe declines of Ghana’sUpper Guinea forest understory bird communities during the15 year period between our two datasets. Abundance declinesappear to be pervasive across the understory bird communityand to be driving declines in species richness over time. Resultsfurther indicate that Ghana’s forestry management system, whichHolbech (1996, 2005) previously deemed to allow post-loggingrecovery of forest understory bird communities, has seriously dete-riorated due to widespread increases in logging intensity coupledwith extensive illegal logging, which has decreased or eliminatedpost-logging forest recovery. The absence of many conservationpriority species from 2008 to 2010 field data suggests continuingpopulation declines and increasing rarity of species at risk ofextinction. These declining trends are consistent with other recentfindings of wildlife declines and extinctions in West Africa (Oateset al., 2000; Brashares et al., 2001; Beier et al., 2002; Thiollay,2006).
The crucial conservation value of unlogged forest for Ghana’sremaining birds is apparent (Fig. 2), although the exceedinglysmall area of unlogged forest left in Ghana may be insufficient tomitigate the ongoing, overall declines in forest understory birds.The persistence of many species in logged forest demonstratesthe importance of regenerating logged forest for understory birdcommunities. The enormous potential of regenerating logged for-est for bird conservation has been demonstrated by Holbech(1996, 2005) in Ghana as well as by other authors elsewhere inthe tropics (e.g., Barlow et al., 2007; Michalski and Peres, 2013;Powell et al., 2013; Edwards et al., 2014; Powell et al., currentissue-a; Powell et al., current issue-b). For this conservation poten-tial to be realized, urgent measures must be taken to decrease log-ging intensities and enforce the legally mandated post-loggingrecovery times, particularly as Ghana’s remaining forest consistsof fairly small (<200 km2) and isolated fragments highly vulnerableto biodiversity loss (Holbech, 2005; Beier et al., 2002).
N. Arcilla et al. / Biological Conservation 188 (2015) 41–49 47
4.1. Long-term changes in Ghana’s forest understory bird communities
The greatest difference between the 1993–1995 and 2008–2010datasets appeared in older regenerating forest treatments (�10and �20 years post-logging). In 1993–1995, the understory birdcommunity exhibited increases in abundance following logging(Holbech 1996, 2005; Fig. 2); this led to the conclusion that the for-est bird community appeared to be resilient and that post-loggingrecovery of forest understory bird communities could occur withinthe legal minimum recovery period in Ghana of 40 years. However,reported logging intensities in Ghana have increased over 600%since 1995, well beyond the threshold of sustainability for timberproduction (Hansen et al., 2009, 2012). Over the same period,repeated incursions by illegal logging operations have inhibitedforest recovery. In response, our findings indicate that by 2008–2010, understory bird communities declined >50% in abundanceand did not show any indication of recovery. Empirical speciesrichness declined by 35% (from 71 to 46 species), and extrapolationindicated this decline is significant (Fig. 3). The fact that the 1993–1995 dataset represents a smaller sampling effort underlines thatthese results are conservative and reflects grave implications forconservation.
Substantial increases in logging intensities together withdecreased post-logging recovery times appear to be drivingsevere declines that are manifest throughout the entire birdcommunity, rather than restricted to any single group or species.Of the 3 species captured in greatest numbers, yellow-whiskeredgreenbul (A. latirostris) declined by 73% and icterine greenbul(P. icterinus) declined by 90% between 1995 and 2010 (Table 2).These provide examples of 2 species with distinctly different lifehistories, despite belonging to the same family. Yellow-whiskeredgreenbul is a forest generalist that occupies both interior and edgeof all types of primary and secondary forest, feeding on fruit andarthropods; it is generally solitary and has variable reproductivestrategies; in some areas it uses leks for breeding and is polyga-mous and nomadic, whereas in others it may be resident andmonogamous (Fishpool and Tobias, 2005b). Icterine greenbul is aforest specialist that prefers interior to edge habitats, often foragesin mixed-species flocks, sometimes as the leader, and is monoga-mous and territorial (Fishpool and Tobias, 2005a). One feature theyboth share is foraging by gleaning and sallying as well as atten-dance of Dorylus ant swarms in order to capture insects fleeingthe ants (Fishpool and Tobias, 2005a; Fishpool and Tobias,2005b). Logging and fragmentation is known to negatively affectDorylus ants, which in turn could affect their avian associates(Peters et al., 2008).
The 15 year period between our 2 datasets should represent atleast 1–2 generation lengths for many small-bodied birds, and thuspotentially sufficient time to reflect differences in reproductivesuccess influenced by logging and related disturbance patterns.Green-tailed bristlebill (Bleda eximius; vulnerable) is an exampleof a red list species endemic to Upper Guinea that has declined(by 38%) but remains sufficiently abundant to be a feasible candi-date for follow up demographic study. Many other species (e.g., 25species detected in 1993–1995 but not in 2008–2010; Table 2)should be monitored in future study, but were captured in suchsmall numbers that population-level responses to logging wouldbe difficult to quantify. As is typical in tropical forests with highspecies richness, most species are relatively rare, and Ghana is noexception; in 2008–2010, more than 90% of species were capturedat a rate of less than 10 per 10000 nmh (Table 2), highlighting theirvulnerability to local extinction. In contrast to some other tropicaland temperate contexts, no edge, pioneer, or invasive species havemoved into replace the understory birds disappearing from thissystem, resulting in many fewer birds and species in Ghana’sincreasingly disturbed and degraded forests.
4.2. Recent trends in Ghana’s forest understory bird communities
Overall understory bird abundance and conservation priorityspecies declined significantly in logged compared to unlogged for-est (Table 3). Forest generalist and sallying insectivores were theguilds hardest hit by logging (Table 3). Typically we would expectforest specialists rather than generalists to be more greatly affectedby forest disturbance (Fimbel et al., 2001; Sodhi et al., 2011). Thefact that the opposite appears to apply in this case is provides anexample of the difficulty predicting specific impacts of logging inany particular system or region a priori, without collecting empiri-cal data (Weber et al., 2001; Edwards et al., 2014). Forest generalistdeclines may be related to declines in forest quality that interfacewith life history traits of individual species in this group.
Salliers may respond negatively to logging due to the post-log-ging emergence of denser understory vegetation and changes inlight conditions and lower strata aerial arthropod abundance(Sodhi et al., 2011). Both or either group may be particularlyadversely affected by the interaction of logging with foraging, nest-ing, predation, competition, and/or other factors (Sigel et al., 2006).However, further studies, particularly demographic and populationstudies, will be necessary to reveal the precise mechanisms andprocesses that may have led to significant declines of this and othergroups or species, particularly as baseline ecological data for manyWest African bird species are lacking (Thiollay, 2006; BirdLife,2013). High variation in guilds’ responses to forest treatmentswas evident, likely due to high variation in forest destruction,degradation and disturbance associated with illegal exploitation.Our data reflect this unevenness in avian distributions, with largecapture values as well as zeros (Appendix).
4.3. Conservation and management implications for Ghana’s UpperGuinea forests and avifauna
Previous studies have demonstrated that illegal logging is themain driver of forest destruction and degradation in Ghana’sprotected forests (Hansen and Treue, 2008; Marfo, 2010; Hansenet al., 2012). Here, we show that excessive logging intensities,driven both by increases in legal and illegal logging in Ghana’sprotected forests since 1995, have resulted in precipitous declinesof Ghana’s forest understory bird communities. Recent and currentlevels of timber extraction Ghana not only appear to be unsustain-able in terms of timber production but also with respect to birds,and likely other forest wildlife. Other wildlife conservation failuresthat have already been documented in Ghana provide an ominouspicture of the fates that await forest wildlife without substantialintervention to change their current trajectory (Oates, 1999;Oates et al., 2000; Brashares et al., 2001).
Previous reports and publications (e.g., Oates, 1999; Oates et al.,2000; Holbech, 2005; Oates, 2006; Jachmann, 2008; Holbech, 2009;Marfo, 2010; Hansen et al., 2012; Franck and Hansen, 2014) havemade extensive forest conservation and management recommenda-tions for Ghana. Measures should include installing road blocks inlogging concessions (to prevent entry by illegal operators) andestablishing and maintaining a patrol presence in areas wherevulnerable species persist. Conservation priority species as well asavian guilds and species that have exhibited exceptional declinessince 1995 (e.g., forest generalists, sallying insectivores; Tables 2and 3, Appendix), should be targeted for special protection andmonitoring. Such actions should be accompanied by follow upstudies, including demographic and/or other population researchinvestigating potential mechanisms of species declines and/or resi-lience (Sigel et al., 2006; Hamer et al., current issue; Powell et al.,current issue-a; Powell et al., current issue-b) and the values ofregenerating forest (Barlow et al., 2007; Michalski and Peres,2013; Edwards et al., 2014) for understory birds.
48 N. Arcilla et al. / Biological Conservation 188 (2015) 41–49
Acknowledgements
For research permissions and collaboration, we thank theGhana Forestry Commission Wildlife and Forest ServicesDivisions, Samartex Timber & Plywood Co. Ltd., John Bitar & Co.Ltd. (JCM), Logs & Lumber Ltd., the University of Ghana, and theKwame Nkrumah University of Science and Technology. We grate-fully acknowledge support and assistance from Z. Kolani, N.N.D.Annorbah, K. Ditz, R. Nsenkyire, J. Eshun, D. Liyanage, L. Abosi,G. Bitar, S. Houweling, S. Ansong, B. Djante, E. Wiafe, J. Oppong,Y. Boakye, N.K. Adu-Nsiah, G.B. Adum, W. Oduro, S. Gatti,K. Silenga, M. Seidu, G. Walczak, A. Asamoah, J.F. Oates, L.B.Timer, J. Atkins Franch, E.A. Abeney, C. Hazel, J. Boakye, C. Sah,M. Sam, F. Appiah, J. Baillie, C. Ransom, N. Kümpel, J.M. Rowcliffe,P. Buzzard, and many others. We thank L.L. Powell, N.J. Cordeiro,and J.A. Stratford for organizing and editing this special issue,and C.H. Sekercioglu, E. Buechley, D. Duffy, and three anonymousreviewers for valuable input and comments on earlier versions ofthis manuscript. Major funding was provided by a grant from theDarwin Initiative to the Zoological Society of London, with supple-mentary contributions from Timbmet Ltd. and substantial in-kindcontributions from Samartex and JCM. Funders and contributorshad no role in study design, data collection, analysis, manuscriptpreparation or publication. Opinions expressed in this paper arethe authors’ and do not necessarily reflect those of their institu-tions. N.A. is funded by the Dean’s Office, College of Arts andSciences, Drexel University; S.O’D. is funded by NSF IOS grant1207029.
Appendix A. Supplementary material
Supplementary data associated with this article can be found, inthe online version, at http://dx.doi.org/10.1016/j.biocon.2015.02.010.
References
Amoah, M., Boateng, R.K., 2014. Addressing illegal logging in Ghana: do value, socialidentity, and corporate social responsibility theories matter? Int. For. Rev. 16,524–536.
Ashcroft, S., Pereira, C. Practistat Programme, 2003. Practical Statistics for theBiological Sciences. Palgrave Macmillan, Basingstoke.
Barlow, J., Gardner, T.A., Araujo, I.S., Ávila-Pires, T.C., Bonaldo, A.B., Costa, J.E.,Esposito, M.C., Ferreira, L.V., Hawes, J.M., Hernandez, I.M., Hoogmoed, M.S.,Leite, R.N., Lo- Man-Hung, N.F., Malcolm, J.R., Martins, M.B., Mestre, L.A.M.,Miranda-Santos, R., Nunes-Gutjahr, A.L., Overal, W.L., Parry, L., Peters, S.L.,Ribeiro-Junior, M.A., da Silva, M.N.F., da Silva Motta, C., Peres, C.A., 2007.Quantifying the biodiversity value of tropical primary, secondary, andplantation forests. PNAS USA 104, 18555–18560.
Beier, P., Van Drielen, M., Kankam, B.O., 2002. Avifaunal collapse in West Africanforest fragments. Conserv. Biol. 16, 1097–1111.
Bennun, L., Dranzoa, C., Pomeroy, D., 1996. The forest birds of Kenya and Uganda. J.East Afr. Nat. Hist. 85, 23–48.
BirdLife International, 2013. Endemic Bird Area Factsheet: Upper Guinea Forests<http://www.birdlife.org>.
Borrow, N., Demey, R., 2010. Birds of Ghana. Helm Field Guides, London.Brashares, J.S., Arcese, P., Sam, M.K., 2001. Human demography and reserve size
predict wildlife extinction in West Africa. Proc. Roy. Soc. B 268, 2473–2478.Bregman, T.P., Sekercioglu, C.H., Tobias, J.A., 2014. Global patterns and predictors of
bird species responses to forest fragmentation: implications for ecosystemfunction and conservation. Biol. Conserv. 169, 372–383.
Chao, A., Chazdon, R.L., Colwell, R.K., Shen, T.-J., 2005. A new statistical approach forassessing compositional similarity based on incidence and abundance data.Ecol. Lett. 8, 148–159.
Colwell, R.K., 2013. EstimateS Version 9.1.0 and User’s Guide <http://purl.oclc.org/estimates>.
Colwell, R.K., Coddington, J.A., 1994. Estimating terrestrial biodiversity throughextrapolation. Philos. Trans. Roy. Soc. B. 345, 101–118.
Colwell, R.K., Chao, A., Gotelli, N.J., Lin, S.-Y., Mao, C.X., Chazdon, R.L., Longino, J.T.,2012. Models and estimators linking individual-based and sample-basedrarefaction, extrapolation, and comparison of assemblages. J. Plant Ecol. 5, 3–21.
Cordeiro, N.J., Borghesio, L., Joho, M.P., Monoski, T.J., Mkongewa, V.J., Dampf, C.J.,current issue. Forest fragmentation in an African biodiversity hotpot impactsmixed species foraging bird flocks.
Corlett, R., Primack, R., 2011. Tropical Rain Forests: An Ecological andBiogeographical Comparison, second ed. Wiley-Blackwell, West Sussex.
Curran, L.M., Trigg, S.N., McDonald, A.K., Astiani, D., Hardiono, Y.M., Siregar, P.,Caniago, I., Kasischke, E., 2004. Lowland forest loss in protected areas ofIndonesian Borneo. Science 303, 1000–1003.
Deikumah, J.P., McAlpine, C.A., Maron, M., 2014. Mining matrix effects on WestAfrican rainforest birds. Biol. Conserv. 169, 334–343.
Dowsett-Lemaire, F., Dowsett, R.J., 2014. The Birds of Ghana: An Atlas andHandbook. Tauraco Press, Liège.
Edwards, D.P., Laurance, W.F., 2013. Diversity despite selective logging. Science 339,646–647.
Edwards, D.P., Tobias, J.A., Sheil, D., Meijaard, E., Laurance, W.F., 2014. Maintainingecosystem function in logged tropical forests. Trends Ecol. Evol. 29, 511–520.
Fimbel, R.A., Grajal, A., Robinson, J.G. (Eds.), 2001. The Cutting Edge: ConservingWildlife in Logged Tropical Forests. Columbia U. Press, New York.
Finer, M., Jenkins, C.N., Blue Sky, M.A., Pine, J., 2014. Logging concessions enableillegal logging crisis in the Peruvian Amazon. Sci. Rep. 4, 4719. http://dx.doi.org/10.1038/srep04719.
Fishpool, L., Tobias, J., 2005a. Icterine Greenbul (Phyllastrephus icterinus). In: delHoyo, J., Elliott, A., Sargatal, J., Christie, D.A., de Juana, E. (Eds.), Handbook of theBirds of the World Alive. Lynx Edicions, Barcelona, <www.hbw.com>.
Fishpool, L., Tobias, J., 2005b. Yellow-whiskered Greenbul (Andropadus latirostris).In: del Hoyo, J., Elliott, A., Sargatal, J., Christie, D.A., de Juana, E. (Eds.), Handbookof the Birds of the World Alive. Lynx Edicions, Barcelona, <www.hbw.com>.
Franck, M., Hansen, C.P., 2014. How effective are task forces in tackling illegallogging? Empirical evidence from Ghana. Int. For. Rev. 16, 354–362.
Grimes, L.G., 1987. The Birds of Ghana. British Ornithologists’ Union, London.Hall, J.B., Swaine, M.D., 1976. Classification and ecology of closed canopy forest in
Ghana. J. Ecol. 64, 913–951.Hamer, K.C., Newton, R.J., Edwards, F.A., Benedick, S., Bottrell, S.H., Edwards, D.P.,
Current Issue. Impacts of selective logging on insectivorous birds in Borneo: theimportance of trophic position, body size, and foraging height.
Hansen, C.P., Treue, T., 2008. Assessing illegal logging in Ghana. Int. For. Rev. 10,573–590.
Hansen, C.P., Lund, J.F., Treue, T., 2009. Neither fast nor easy: the prospect ofreduced emissions from deforestation and degradation (REDD) in Ghana. Int.For. Rev. 11, 439–455.
Hansen, C.P., Damnyag, L., Obiri, B.D., Carlsen, K., 2012. Revisiting illegal logging andthe size of the domestic timber market: the case of Ghana. Int. For. Rev. 14, 39–49.
Hawthorne, W.D., Abu-Juam, M., 1995. Forest Protection in Ghana – With ParticularReference to Vegetation and Plant Species. IUCN, Gland.
Holbech, L.H., 1996. Faunistic Diversity and Game Production Contra HumanActivities in the Ghana High Forest Zone: With Reference to the WesternRegion. Ph.D. dissertation, University of Copenhagen, Copenhagen.
Holbech, L.H., 2005. The implications of selective logging and forest fragmentationfor the conservation of avian diversity in evergreen forests of south-west Ghana.Bird Conserv. Int. 15, 27–52.
Holbech, L.H., 2009. The conservation importance of luxuriant tree plantations forlower storey forest birds in south-west Ghana. Bird Conserv. Int. 19, 287–308.
Holbech, L.H., 2015. Low-extraction selective logging and avifaunal recovery in theBia moist forest of southwest Ghana: a 1990–1991 census. In: Gupta, A.K.,Verma, A.K. (Eds.), Animal Diversity, Natural History, and Conservation, vol. 4.Astral International, Delhi, pp 183–205.
IUCN, The IUCN Red List of Threatened Species 2014.3, <www.iucnredlist.org>.Jachmann, H., 2008. Illegal wildlife use and protected area management in Ghana.
Biol. Conserv. 141, 1906–1918.Kouame, O.M.L., Jengre, N., Kobele, M., Knox, D., Ahon, D.B., Gbondo, J., Gamys, J.,
Egnankou, W., Siaffa, D., Okoni-Williams, A., Saliou, M., 2012. Key BiodiversityAreas identification in the Upper Guinea forest biodiversity hotspot. J. Threat.Taxa 4, 2745–2752.
Laurance, W.F., 1999. Reflections on the tropical deforestation crisis. Biol. Cons. 91,109–117.
Marfo, E., 2010. Chainsaw Milling in Ghana: Context, Drivers and Impacts.Tropenbos International, Wageningen.
Michalski, F., Peres, C.A., 2013. Biodiversity depends on logging recovery time.Science 339, 1521–1522.
Myers, N., Mittermeier, R.A., Mittermeier, C.G., da Fonseca, G.A.B., Kent, J., 2000.Biodiversity hotspots for conservation priorities. Nature 403, 853–858.
Nellemann, C., INTERPOL Environmental Crime Programme (Eds.), 2012. GreenCarbon, Black Trade: Illegal Logging, Tax Fraud and Laundering in the World’sTropical Forests. UNEP, Birkeland.
Norris, K., Asase, A., Collen, B., Gockowksi, J., Mason, J., Phalan, B., Wade, A., 2010.Biodiversity in a forest-agriculture mosaic: the changing face of West Africanrainforests. Biol. Conserv. 143, 2341–2350.
Ntiamoa-Baidu, Y., Owusu, E.H., Asamoah, S., Owusu-Boateng, K., 2000. Distributionand abundance of forest birds in Ghana. Ostrich 71, 262–268.
Oates, J.F., 1999. Myth and Reality in the Rain Forest: How Conservation Strategiesare Failing in West Africa. U. California Press, Berkeley.
Oates, J.F., 2006. Primate Conservation in the Forests of Western Ghana: FieldSurvey Results 2005–2006. Report to the Wildlife Division, ForestryCommission, Ghana.
Oates, J.F., Abedi-Lartey, M., McGraw, W.S., Struhsaker, T.T., Whitesides, G.H., 2000.Extinction of a West African red colobus monkey. Conserv. Biol. 14, 1526–1532.
Oduro, K.A., Mohren, G.M.J., Affum-Baffoe, K., Kyereh, B., 2014. Trends in timberproduction systems in the high forest zone of Ghana. Int. For. Rev. 16, 289–300.
N. Arcilla et al. / Biological Conservation 188 (2015) 41–49 49
Peters, M.K., Likare, S., Kraemer, M., 2008. Effects of habitat fragmentation anddegradation on flocks of African ant-following birds. Ecol. Appl. 18, 847–858.
Powell, L.L., Stouffer, P.C., Johnson, E.I., 2013. Recovery of understory birdmovement across the interface of primary and secondary Amazon rainforest.Auk 130, 459–468.
Powell, L.L., Cordeiro, N.J., Stratford, J.A., current issue. Ecology and conservation ofavian insectivores of the rainforest understory: a pan-tropical perspective.
Powell, L.L., Wolfe, J.D., Johnson, E.I., Hines, J.E., Nichols, J.D., Stouffer, P.C., currentissue. Heterogeneous movement of insectivorous Amazonian birds throughprimary and secondary forest: a case study using multistate models withradiotelemetry data.
R Development Core Team, 2013. R: A Language and Environment for StatisticalComputing. R Foundation for Statistical Computing, Vienna, Austria.
Ralph, C.J., Dunn, E.H. (Eds.), 2004. Monitoring Bird Populations Using Mist Nets.Cooper Ornithological Society, Camarillo.
Remsen Jr., J.V., Good, D.A., 1996. Misuse of data from mist-net captures to assessrelative abundance in bird populations. Auk 113, 381–398.
Sigel, B.J., Sherry, T.W., Young, B.E., 2006. Avian community responses to lowlandtropical forest isolation: 40 years of change at La Selva Biological Station, CostaRica. Conserv. Biol. 20, 111–121.
Sodhi, N.S., Sekercioglu, C.H., Barlow, J., Robinson, S.K., 2011. Conservation ofTropical Forest Birds. Wiley-Blackwell, West Sussex, UK.
Stratford, J.A., Robinson, W.D., 2005. Gulliver travels to the fragmented tropics:geographical variation in mechanisms of avian extinction. Front. Ecol. Environ.3, 91–98.
Teye, J.K., 2013. Corruption and illegal logging in Ghana. Int. Dev. Plan. Rev. 35, 1–19.
Thinh, V.T., Doherty Jr., P.F., Huyvaert, K.P., 2012. Effects of different loggingschemes on bird communities in tropical forests: a simulation study. Ecol.Model. 243, 95–100.
Thiollay, J.M., 2006. The decline of raptors in West Africa: long-term assessmentand the role of protected areas. Ibis 148, 240–254.
Weber, W., White, L.J.T., Vedder, A., Naughton-Treves, L. (Eds.), 2001. African RainForest Ecology and Conservation: An Interdisciplinary Perspective. Yale U. Press,New Haven.
Zimmerman, B.L., Kormos, C.F., 2012. Prospects for sustainable logging in tropicalforests. Bioscience 62, 479–487.