Embed Size (px)
Citation preview
water
Article
Understory Limits Surface Runoff and Soil Loss inTeak Tree Plantations of Northern Lao PDR
Layheang Song 12 Laurie Boithias 1 Oloth Sengtaheuanghoung 3 Chantha Oeurng 2Christian Valentin 4 Bounthan Souksavath 5 Phabvilay Sounyafong 6 Anneke de Rouw 4Bounsamay Soulileuth 6 Norbert Silvera 4 Bounchanh Lattanavongkot 5 Alain Pierret 6 andOlivier Ribolzi 1
1 GET Universiteacute de Toulouse CNRS IRD UPS 31400 Toulouse France layheangsongitcedukh (LS)olivierribolziirdfr (OR)
2 Research and Innovation Center (RIC) Faculty of Hydrology and Water Resources Engineering Institute ofTechnology of Cambodia Phnom Penh 12156 Cambodia chanthaitcedukh
3 Department of Agricultural Land Management (DALaM) Ministry of Agriculture and ForestryVientiane 01000 Laos oloth_shotmailcom
4 Institute of Ecology and Environmental Sciences of Paris (iEES-Paris) Sorbonne Universiteacute Univ Paris EstCreteil IRD CNRS INRA 75005 Paris France christianvalentinirdfr (CV)annekede_rouwirdfr (AdR) norbertsilverairdfr (NS)
5 Luang Prabang Teak Program (LPTP-TFT) Luang Prabang Provincial Forestry SectionLuang Prabang 06000 Laos bsouksavathearthwormorg (BS) chanhlptpgmailcom (BL)
6 IRD IEES-Paris UMR 242 co National Agriculture and Forestry Research Institute Vientiane 01000 Laosphabvilay_laopdryahoocom (PS) sbounsamaygmailcom (BS) alainpierretirdfr (AP)
Correspondence laurieboithiasgetompeu Tel +33-561-332-712
Received 14 July 2020 Accepted 15 August 2020 Published 19 August 2020
Abstract Many mountainous regions of the humid tropics experience serious soil erosion followingrapid changes in land use In northern Lao Peoplersquos Democratic Republic (PDR) the replacementof traditional crops by tree plantations such as teak trees has led to a dramatic increase in floodsand soil loss and to the degradation of basic soil ecosystem services such as water filtration by soilfertility maintenance etc In this study we hypothesized that conserving understory under teak treeswould protect soil limit surface runoff and help reduce soil erosion Using 1 m2 microplots installedin four teak tree plantations in northern Lao PDR over the rainy season of 2017 this study aimedto (1) assess the effects on surface runoff and soil loss of four understory management practicesnamely teak with no understory (TNU control treatment) teak with low density of understory(TLU) teak with high density of understory (THU) and teak with broom grass Thysanolaena latifolia(TBG) (2) suggest soil erosion mitigation management practices and (3) identify a field visualindicator allowing a rapid appraisal of soil erosion intensity We monitored surface runoff and soilloss and measured teak tree and understory characteristics (height and percentage of cover) andsoil surface features We estimated the relationships among these variables through statistics andregression analyses THU and TBG had the smallest runoff coefficient (23 for both) and soil loss (465and 381 gmiddotmminus2 respectively) The runoff coefficient and soil loss in TLU were 35 and 1115 gmiddotmminus2respectively TNU had the highest runoff coefficient and soil loss (60 5455 gmiddotmminus2) associated to thehighest crusting rate (82) Hence the soil loss in TBG was 14-times less than in TNU and teak treeplantation owners could divide soil loss by 14 by keeping understory such as broom grass withinteak tree plantations Indeed a high runoff coefficient and soil loss in TNU was explained by thekinetic energy of rain drops falling from the broad leaves of the tall teak trees down to bare soildevoid of plant residues thus leading to severe soil surface crusting and soil detachment The arealpercentage of pedestal features was a reliable indicator of soil erosion intensity Overall promotingunderstory such as broom grass in teak tree plantations would (1) limit surface runoff and improve
Water 2020 12 2327 doi103390w12092327 wwwmdpicomjournalwater
Water 2020 12 2327 2 of 23
soil infiltrability thus increase soil water stock available for both root absorption and groundwaterrecharge and (2) mitigate soil loss while favoring soil fertility conservation
Keywords overland flow inter-rill erosion teak tree plantation understory broom grass SouthndashEastAsia land management soil erosion
1 Introduction
Mountain areas of the humid tropics are characterized by steep slopes and heavy rains [1] Hencethese regions are prone to high surface runoff and soil erosion [2] Conversion of natural forest toeg agricultural land exacerbates runoff production and soil erosion leading to physicochemical andbiological changes of the altered ecosystems [34]
On-site effects of increased soil erosion include the reduction of soil quality impacting thesustainability of agricultural production [5] and economics due to the loss of ecosystem services [6]The tremendously higher rate of soil loss compared to its formation rate threatens food production andenvironmental quality (water soil and air) [7ndash9]
Off-site effects comprise floods depletion of groundwater recharge degradation of streamenvironments and downstream sedimentation [510] In addition the adsorption of organic andinorganic matter on soil particles and suspended sediments plays a leading role in the transportof nutrients [11] radionuclides [12] metals [13] pesticides [14] and bacterial pathogens [1516]Higher contamination of rivers by fecal bacteria is often correlated to higher in-stream suspendedsediment concentration [1718] Sediment loads cause massive accumulation of fine sediments toriver beds and cause the siltation of irrigation canals and dam reservoirs [19ndash21] thus reducing theirlife spans All of these off-site effects lead to high economic and ecological costs (ie sedimentationflooding landslides water eutrophication biodiversity loss land abandonment destruction ofinfrastructures) [6]
Natural forests are known for their protective effect against erosion [22] Forests have favorablehydrodynamic properties for surface infiltration [23] subsurface drainage [24] due to the biologicalactivity and the development of macropores in the litter and underneath A fraction of rainfall known asthroughfall is intercepted by the canopy and the underlying vegetative strata [25] The amount ofwater and the kinetic energy of drops corresponding to throughfall is lower than that of rainfallthus reducing soil erosion Kinetic energy is the main factor initiating soil erosion raindrops hitthe soil surface and disaggregate the soil structure [26] resulting in redistribution of soil material bysplash effect [5] Kinetic energy is controlled by rainfall (amount drop size fall velocity) vegetationcharacteristics (height cover residues) [27] and slope [26]
In the mountainous region of northern Lao Peoplersquos Democratic Republic (PDR) widespreadagricultural practices are known to increase surface runoff soil erosion and in-stream suspendedsediment concentrations compared to natural forest [323] In particular commercial perennialmonocultures such as teak tree plantations lead to a drastic surface runoff increase [28] and exacerbatesoil loss along hillslopes [2930] In teak tree plantations such as the old teak trees (high timbers withbroad leaves) growing in the Houay Pano catchment surface runoff and soil erosion are likely relatedto recurrent understory and leaf litter suppression by burning at the end of the dry season leaving thesoil bare and exposed to the kinetic energy of the raindrops [31]
Land use understory cover and soil surface condition are the main drivers influencing theinfiltration of water into the soil [3233] Living plant roots modify both mechanical and hydrologicalcharacteristics of the soil matrix and negatively influence the soil erodibility [3435] Understory andplant residues on soil surface are known to efficiently attenuate the effect of splash and thus soildetachment [36ndash40] Soil surface features have a strong impact on surface runoff and soil erosionsoil aggregation limits surface runoff generation and soil loss [4142] while crusted soils can be
Water 2020 12 2327 3 of 23
self-protecting from erosion because of their high surface shear stress resistance but they also promotesurface runoff hence downstream erosion especially on non-crusted areas [2630] For examplein northern Lao PDR splash in teak tree plantations increases soil erosion and the absence ofunderstory enhances the effect of splash [29] By adapting the model developed by [43] Patin et al [31]showed that plant residues and weed cover at soil surface were the main attenuation factors of soilerosion In northern Thailand soil erosion in rubber tree plantations decreased when understory wasgrown [44] Indeed in northern Lao PDR headwater catchments the runoff coefficient is approximately55 under teak trees at the plot scale [30] whereas it nearly doubled from 16 to 31 within 13 yearsat the catchment scale [29] resulting from the absence of understory in the teak tree plantation areaIn particular mature teak trees with limited understory were shown to export respectively 55- and31-times more water and soil than broom grass (Thysanolaena latifolia) at the plot scale [30]
Hence in this paper we hypothesized that conserving understory such as broom grasswhich provides income to farmers through broom making and selling [45] protects soil limits surfacerunoff and helps to reduce soil erosion in teak tree plantations The overarching goal of this studyconducted in the teak tree plantations of Ban Kokngew northern Lao PDR was thus to find the beststrategy to contribute to sustainable agricultural production In this context the three objectives ofour 1 m2 microplot experiment performed during the June to October monsoon period of 2017 wereto (1) assess the effects on surface runoff and soil loss of four understory management practicesnamely teak with no understory (TNU control treatment) teak with low density of understory (TLU)teak with high density of understory (THU) and teak with broom grass (TBG) (2) suggest soil erosionmitigation management practices and (3) identify a field visual indicator allowing a rapid appraisal ofsoil erosion intensity
2 Materials and Methods
21 Study Area and Experimental Plots
We conducted the experiment in 2017 in teak tree plantations surrounding Ban Kokngew a villagelocated in Luang Prabang Province northern Lao PDR and predominantly situated over Acrisolsoil and Carboniferous and Permian limestones (Figure 1) The climate is sub-tropical humid and ischaracterized by a monsoon regime with a dry season from November to May and a rainy from June toOctober Mean annual rainfall recorded at Luang Prabang from 1960 to 2006 was 1268 mm about 76of which falls during the rainy season The mean annual temperature is 253 C Mean annual referenceevapotranspiration is 1116 mm The study area belongs to the mountainous region of northernLaos PDR More specifically the area is located within the ldquoLuang Prabang mountain rain forestrdquoecoregion [46] The area has been experiencing dramatic land use changes in the last decade with theintroduction of the teak tree plantations [2947]
We selected this area because it presents over short distances diversely managed teak treeplantations This area used to be shifting cultivation land This last decade teak has graduallyreplaced most of the fields and spontaneous forest regrowth because of land degradation lack oflabor and the expectation of profitability Teak timber is valued for its durability and water resistanceit is used for furniture and construction in the rapidly developing city of Luang Prabang Farmersspontaneously adopted different management practices within their plantations and we selected foursites corresponding to actual contrasted situations that we intended to test and compare
Aside from the most common situation which is teak with no understory (TNU) ie teak treeplantations where soil is kept bare often by burning the leaf litter and understory and whichrepresented our control situation we considered the three following alternative treatments teak treesgrown with high density understory (THU) teak trees grown with low density andor periodicallypruned understory (TLU) and teak trees grown with broom grass Thysanolaena latifolia (TBG) In eachtreatment we set up 1 m2 microplots (Figure 2) with six replicates per treatment
Water 2020 12 2327 4 of 23
Water 2020 12 x FOR PEER REVIEW 4 of 25
comparison of treatments in this study since the effect of slope is known to be imperceptible for these slope ranges [31] The size of the teak tree plantations was 187 ha 378 ha 121 ha and 132 ha in TNU TLU THU and TBG respectively We installed a rain gauge near the treatments TNU TLU and THU and approximately 500 m from TBG (Figure 1)
Figure 1 Study site in Ban Kokngew Luang Prabang Province Lao Peoplersquos Democratic Republic with location of experimental microplots treatments and soil types
Figure 1 Study site in Ban Kokngew Luang Prabang Province Lao Peoplersquos Democratic Republicwith location of experimental microplots treatments and soil types
The age of the teak trees in the four treatments varied between 12 years in TBG and 18 years inTLU (Table 1) Elevation above sea level ranged between 316 m in TLU and 358 m in TBG whereasTNU and THU were both at 325 m The slopes of the microplots ranged between 39 in TNU and46 in TBG The slope difference between TNU and TBG was not considered a limitation for thecomparison of treatments in this study since the effect of slope is known to be imperceptible for theseslope ranges [31] The size of the teak tree plantations was 187 ha 378 ha 121 ha and 132 ha in TNUTLU THU and TBG respectively We installed a rain gauge near the treatments TNU TLU and THUand approximately 500 m from TBG (Figure 1)
Table 1 Characteristics of the four experimental sites in 2017 measured on 14 December 2017 in BanKokngew Luang Prabang Province Lao Peoplersquos Democratic Republic TNU teak with no understoryTLU teak with low density of understory THU teak with high density of understory TBG teak withbroom grass
Treatment Teak Height(m)
Teak StemDiameter
(cm)
Teak Cover()
TreeDensity
(treemiddothaminus1)
Teak Age(Years)
Altitude(m)
Slope()
Latitude()
Longitude()
TNU 22 153 35 1200 15 325 392 198577 10221269TLU 22 170 30 1000 18 316 407 1985641 10221202THU 20 154 70 800 15 325 415 1985735 10221237TBG 20 164 60 1000 12 358 455 1985475 10221666
Water 2020 12 2327 5 of 23
Water 2020 12 x FOR PEER REVIEW 5 of 25
Figure 2 (a) Sketch of microplot of 1 times 1 m metal frame connected to a bucket through a pipe for surface runoff and sediment collection (source [31]) (b) Microplot of TNU teak with no understory (c) Microplot of TLU teak with low density of understory (d) Microplot of THU teak with high density of understory (e) Microplot of TBG teak with broom grass Microplots were installed on 9th and 10th of May 2017 in Ban Kokngew Luang Prabang Province Lao Peoplersquos Democratic Republic
Figure 2 (a) Sketch of microplot of 1 times 1 m metal frame connected to a bucket through a pipe forsurface runoff and sediment collection (source [31]) (b) Microplot of TNU teak with no understory(c) Microplot of TLU teak with low density of understory (d) Microplot of THU teak with high densityof understory (e) Microplot of TBG teak with broom grass Microplots were installed on 9th and 10thof May 2017 in Ban Kokngew Luang Prabang Province Lao Peoplersquos Democratic Republic
Water 2020 12 2327 6 of 23
22 Teak Trees and Understory Structure Assessment
We measured teak tree height canopy cover and stem diameter at 16 m height in 10 times 10 mplots enclosing the microplots At the time of measurement on 14 December 2017 ie during the dryseason some teak trees were already shedding their leaves (30 and 35 cover in TLU and TNUrespectively) but in other plantations many teak leaves were still attached (70 and 60 cover in THUand TBG respectively) Average teak heights ranged from 20 m to 22 m Average diameter at 16 mheight was 16 cm The original planting density had been 2000 treemiddothaminus1 in TNU and TBG from whichthe actual density was obtained by thinning 40 and 50 respectively The original planting densityhad been 1600 treemiddothaminus1 in THU and only 1200 treemiddothaminus1 in TLU here the actual densities were obtainedby thinning 50 and 16 respectively (Table 1)
We considered two categories of understory one consisting of weed and low vegetation hereafterreferred to as ldquounderstoryrdquo and another consisting of purposely planted broom grass (Thysanolaenalatifolia) monocrop hereafter referred to as ldquobroom grassrdquo Both kinds of understories are spontaneousvegetation but farmers enhance broom grass propagation by cutting The TBG treatment in this studywas made of replanted broom grass Farmers cut the inflorescences of broom grass to make broomsand regularly prune the grass We described the structure of the understory in each of the four selectedtreatments during the 2017 rainy season by combining the use of visual inspections (percentage ofcover assessment) and measuring tapes (girth height) We estimated the mean understory height andcover in a representative area of 18 m2 encompassing the three microplot replicates on 4 June and27 October 2017
23 Rainfall Measurements
We measured rainfall by using a rain gauge (Campbell BWS200 equipped with ARG100 02 mmcapacity tipping-bucket Figure 1)
24 Surface Runoff Soil Loss and Soil Surface Features Assessment
We collected surface runoff through a small channel at the lower side of each microplot connectedto a large plastic bucket by a plastic pipe (Figure 2a) The height of the buckets was 045 m while theirdiameter at the bottom was 032 m and the diameter at the top was 038 m We emptied the bucketsafter every major rainfall event or after a series of two to ten smaller rainfall events We calculatedthe runoff coefficient as the ratio between the total surface runoff depth and the total rainfall depthexpressed in percentage We also computed a cumulated runoff coefficient over the rainy season
Soil loss was the total weight of sediment collected each time the buckets were emptied It wasmeasured after flocculation filtration and oven dehydration We calculated suspended sedimentconcentration by dividing sediment mass by surface runoff depth and we cumulated soil loss over therainy season
Soil surface features were assessed at the beginning (4 June) and at the end (27 October) ofthe rainy season using the method proposed by [48] and extensively used by [232628ndash334449ndash54]We calculated the average of each soil surface feature for each treatment by first calculating theaverages of the two measurements dates per treatment and then by calculating the averages amongthe six replicates per treatment Surface features include understory residues (leaves branches seeds)constructions by soil macro-organisms like earthworms and termites moss and algae charcoalsfree aggregates free gravel and three types of crust structural erosion and gravel crusts In thesesoils structural crusts result from the packing of highly stable micro-aggregates [3250] Compacted byraindrops and smoothed by surface runoff this structural crust gradually transforms into an erosioncrust characterized by a thin and very compacted smooth plasmic layer [55] When they include gravelsstructural or erosion crusts become a gravel crust [51] Additionally we assessed the percentage areasof soil corresponding to pedestal features [5]
Water 2020 12 2327 7 of 23
25 Statistical Analysis and Modelling
We performed non-parametric Wilcoxon tests (R version 353 The R Foundation for StatisticalComputing) to compare the distribution between paired groups of the four treatments for threevariables (surface runoff depth suspended sediment concentration and runoff coefficient)
We conducted a correlation analysis between the measured variables namely Rc seasonalrunoff coefficient Sl seasonal soil loss and soil surface features expressed in areal percentage Fafree aggregates Fg free gravel Tc total crust Sc structural crust Ec erosion crust Gc gravelcrust Cha charcoals Res residues Wor worm casts Alg algae Mos mosses Ped pedestalsUnd understory To meet the distributional and variance assumptions required for linear statisticalmodels [56] we transformed the variables prior to the analysis variables expressed in percent werenormalized using the arcsine of the square root which is a classical transformation for percentageswhile Sl was scaled with logarithm transformation [31] The main objective of these transformationswas to make each distribution symmetrical After transformation we calculated Pearson correlationcoefficients and significance levels (XLSTAT Premium version 2011 Addinsoft Paris France) in orderto test the correlation between variables
We also calculated partial least squares regression (PLSR) analysis [57] on the measured variables(XLSTAT Premium version 2011) in order to model Rc and Sl depending on soil surface featuresFa free aggregates Fg free gravel Tc total crust Cha charcoals Res residues Wor worm castsAlg algae Mos mosses Ped pedestals Und understory PLSR has the advantage to be little sensitiveto multi-collinearity and can be used with datasets where the number of observations is close to thenumber of variables or even smaller The importance of each projected variable is estimated by thevariable importance in the projection number (VIP) In order to limit the uncertainty related to thevariables that bring little information to the model and consequently to limit the distortion of theresults we discarded the VIP values below 08 [5859]
3 Results
31 Rainfall
Accumulated rainy season rainfall was 1133 mm from 4 June to 15 October 2017 A total of22 major rainfall events occurred during the same period (Figure S1) Minimum rainfall depth was17 mm whereas maximum was 93 mm Average rainfall depth was 52 mm About 36 of the majorrainfall events occurred in July which represents 33 of the accumulated rainy season rainfall depth
32 Height and Cover of Teak Trees and of Understory
The average height of the teak trees ranged from 20 m in THU and TBG to 22 m in TNU andTLU Teak cover was 30 and 35 in TLU and TNU respectively and was 60 and 70 in TBG andTHU respectively The average height of understory varied between 06 m in TNU and 4 m in TLUUnderstory cover varied between 30 in TNU and 90 in THU (Figure 3)
33 Soil Surface Features and Pedestal Features
The average height of pedestal features ranged from 12 cm in TBG to 21 cm in TNU (Figure 4ab)The pedestal features cover was high in TNU (50) compared to the other treatments (3ndash6 Figure 4b)
Figure 4c illustrates the percentage area of total crust (erosion crust structural crust and gravelcrust) free aggregates free gravel charcoals and residues in each treatment Soil surface acrossthe treatments excluding TNU shared similar conditions such as total crust (85) free aggregates(325) and residues (585) On the contrary TNU exhibited high total crust (825) free gravel(93) and little residues (291) Structural crust accounts for more than 90 of total crust in eachtreatment and charcoals are negligible (less than 003) Nevertheless erosion crust was 054 in TNUand negligible in the other three treatments (less than 005)
Water 2020 12 2327 8 of 23
Figure 5 shows the relationship between the percentage of cover of pedestal features and bothsurface runoff (logarithm model R2 = 082) and soil loss (linear model R2 = 091) The percentage ofcover of pedestal features exhibits a consistent increase with increasing surface runoff and soil loss
Water 2020 12 x FOR PEER REVIEW 8 of 25
Figure 3 Percentage of cover () by teak trees and understory and mean height (m) of teak trees and understory in each treatment measured on 14 December 2017 in Ban Kokngew Luang Prabang Province Lao Peoplersquos Democratic Republic TNU teak with no understory TLU teak with low density of understory THU teak with high density of understory TBG teak with broom grass
33 Soil Surface Features and Pedestal Features
The average height of pedestal features ranged from 12 cm in TBG to 21 cm in TNU (Figure 4ab) The pedestal features cover was high in TNU (50) compared to the other treatments (3ndash6 Figure 4b)
Figure 4c illustrates the percentage area of total crust (erosion crust structural crust and gravel crust) free aggregates free gravel charcoals and residues in each treatment Soil surface across the treatments excluding TNU shared similar conditions such as total crust (85) free aggregates (325) and residues (585) On the contrary TNU exhibited high total crust (825) free gravel (93) and little residues (291) Structural crust accounts for more than 90 of total crust in each treatment and charcoals are negligible (less than 003) Nevertheless erosion crust was 054 in TNU and negligible in the other three treatments (less than 005)
Figure 5 shows the relationship between the percentage of cover of pedestal features and both surface runoff (logarithm model R2 = 082) and soil loss (linear model R2 = 091) The percentage of cover of pedestal features exhibits a consistent increase with increasing surface runoff and soil loss
Figure 3 Percentage of cover () by teak trees and understory and mean height (m) of teak treesand understory in each treatment measured on 14 December 2017 in Ban Kokngew Luang PrabangProvince Lao Peoplersquos Democratic Republic TNU teak with no understory TLU teak with lowdensity of understory THU teak with high density of understory TBG teak with broom grassWater 2020 12 x FOR PEER REVIEW 9 of 25
Figure 4 (a) Example of pedestal features circled by red lines (b) Percentage of cover of pedestal features () and pedestal featuresrsquo height (m logarithmic scale) (c) Cumulative percentage areas () of the soil surface features in 2017 in Ban Kokngew Luang Prabang Province Lao Peoplersquos Democratic Republic TNU teak with no understory TLU teak with low density of understory THU teak with high density of understory TBG teak with broom grass
Figure 4 Cont
Water 2020 12 2327 9 of 23
Water 2020 12 x FOR PEER REVIEW 9 of 25
Figure 4 (a) Example of pedestal features circled by red lines (b) Percentage of cover of pedestal features () and pedestal featuresrsquo height (m logarithmic scale) (c) Cumulative percentage areas () of the soil surface features in 2017 in Ban Kokngew Luang Prabang Province Lao Peoplersquos Democratic Republic TNU teak with no understory TLU teak with low density of understory THU teak with high density of understory TBG teak with broom grass
Figure 4 (a) Example of pedestal features circled by red lines (b) Percentage of cover of pedestalfeatures () and pedestal featuresrsquo height (m logarithmic scale) (c) Cumulative percentage areas ()of the soil surface features in 2017 in Ban Kokngew Luang Prabang Province Lao Peoplersquos DemocraticRepublic TNU teak with no understory TLU teak with low density of understory THU teak withhigh density of understory TBG teak with broom grass
Water 2020 12 x FOR PEER REVIEW 10 of 25
Figure 5 (a) Relationship between runoff coefficient () and percentage of cover of pedestal features () (b) Relationship between soil loss (gmiddotmminus2) and percentage of cover of pedestal features () measured in 2017 in Ban Kokngew Luang Prabang Province Lao Peoplersquos Democratic Republic TNU teak with no understory TLU teak with low density of understory THU teak with high density of understory TBG teak with broom grass
34 Relationship between Surface Runoff and Soil Loss across Four Treatments
Figure 6 depicts the linear correlation between accumulated surface runoff and accumulated soil loss on log scale during the rainy season in 2017 for all the replicates Total surface runoff averaged over the rainy season ranged from approximately 170 mm in THU and TBG to 480 mm in TLU while it reached up to 680 mm in TNU The average value in the four treatments was 370 mm TBG and THU provided the same amount of surface runoff Soil loss varied between 249 gmiddotmminus2 in TBG to 6012 gmiddotmminus2 in TNU with an average of 1848 gmminus2 in all treatments The highest sediment concentration was 960 gmiddotLminus1 in TNU while the other three treatments had an average of 234 gmiddotLminus1
Figure 5 (a) Relationship between runoff coefficient () and percentage of cover of pedestal features() (b) Relationship between soil loss (gmiddotmminus2) and percentage of cover of pedestal features ()measured in 2017 in Ban Kokngew Luang Prabang Province Lao Peoplersquos Democratic Republic TNUteak with no understory TLU teak with low density of understory THU teak with high density ofunderstory TBG teak with broom grass
34 Relationship between Surface Runoff and Soil Loss across Four Treatments
Figure 6 depicts the linear correlation between accumulated surface runoff and accumulated soilloss on log scale during the rainy season in 2017 for all the replicates Total surface runoff averagedover the rainy season ranged from approximately 170 mm in THU and TBG to 480 mm in TLU while itreached up to 680 mm in TNU The average value in the four treatments was 370 mm TBG and THU
Water 2020 12 2327 10 of 23
provided the same amount of surface runoff Soil loss varied between 249 gmiddotmminus2 in TBG to 6012 gmiddotmminus2
in TNU with an average of 1848 gmminus2 in all treatments The highest sediment concentration was960 gmiddotLminus1 in TNU while the other three treatments had an average of 234 gmiddotLminus1
Water 2020 12 x FOR PEER REVIEW 11 of 25
Figure 6 Surface runoff (mm) and soil loss (gmminus2 logarithmic scale) measured from 4 June to 15 October 2017 in the four treatments with six replicates in Ban Kokngew Luang Prabang Province Lao Peoplersquos Democratic Republic TNU teak with no understory TLU teak with low density of understory THU teak with high density of understory TBG teak with broom grass
35 Effect of Understory on Soil Loss and Surface Runoff Generation
The Wilcoxon test applied to the cumulative surface runoff the average suspended sediment concentration and the runoff coefficient for the four treatments highlighted three significantly (p-value gt 005) different categories of treatments from the little erosive treatments (THU and TBG) to highly erosive treatments (TNU Figure 7)
The surface runoff pattern matched the rainfall pattern while the soil detachment pattern did not perfectly match rainfall pattern (Figure S1) The highest median values of surface runoff and runoff coefficient (44 mm mostly in TNU and about 110 in TBG and TNU respectively) were observed from 15 July to 15 August and this pattern was less clear for soil loss We found the maximum median value of soil loss in TNU (551 gmiddotmminus2) For one replicate of TNU the soil loss reached 1054 gmiddotmminus2 (8 July)
Figure S2 shows the cumulative surface runoff and cumulative soil loss in relation to cumulative rainfall over the 2017 rainy season for the different treatments Surface runoff and soil loss in TBG were 242 mm and 381 gmiddotmminus2 respectively Surface runoff and soil loss in THU were 242 mm and 465 gmiddotmminus2 respectively Surface runoff and soil loss in TLU were 358 mm and 1115 gmiddotmminus2 respectively TNU produced more surface runoff (612 mm) and much more soil loss (5455 gmiddotmminus2) than the other treatments Hence the surface runoff in TNU was approximately 25-times higher than in THU and TBG and 17-time higher than in TLU The soil loss in TNU was 13- and 14-times higher than in THU and TBG respectively TNU had the sharpest rise of soil loss among all the treatments Median runoff coefficients for TBG THU TLU and TNU were 23 23 25 and 60 respectively
Figure 6 Surface runoff (mm) and soil loss (gmminus2 logarithmic scale) measured from 4 June to 15October 2017 in the four treatments with six replicates in Ban Kokngew Luang Prabang ProvinceLao Peoplersquos Democratic Republic TNU teak with no understory TLU teak with low density ofunderstory THU teak with high density of understory TBG teak with broom grass
35 Effect of Understory on Soil Loss and Surface Runoff Generation
The Wilcoxon test applied to the cumulative surface runoff the average suspended sedimentconcentration and the runoff coefficient for the four treatments highlighted three significantly (p-valuegt 005) different categories of treatments from the little erosive treatments (THU and TBG) to highlyerosive treatments (TNU Figure 7)
The surface runoff pattern matched the rainfall pattern while the soil detachment pattern did notperfectly match rainfall pattern (Figure S1) The highest median values of surface runoff and runoff
coefficient (44 mm mostly in TNU and about 110 in TBG and TNU respectively) were observed from15 July to 15 August and this pattern was less clear for soil loss We found the maximum median valueof soil loss in TNU (551 gmiddotmminus2) For one replicate of TNU the soil loss reached 1054 gmiddotmminus2 (8 July)
Figure S2 shows the cumulative surface runoff and cumulative soil loss in relation to cumulativerainfall over the 2017 rainy season for the different treatments Surface runoff and soil loss in TBGwere 242 mm and 381 gmiddotmminus2 respectively Surface runoff and soil loss in THU were 242 mm and465 gmiddotmminus2 respectively Surface runoff and soil loss in TLU were 358 mm and 1115 gmiddotmminus2 respectivelyTNU produced more surface runoff (612 mm) and much more soil loss (5455 gmiddotmminus2) than the othertreatments Hence the surface runoff in TNU was approximately 25-times higher than in THU andTBG and 17-time higher than in TLU The soil loss in TNU was 13- and 14-times higher than in THUand TBG respectively TNU had the sharpest rise of soil loss among all the treatments Median runoff
coefficients for TBG THU TLU and TNU were 23 23 25 and 60 respectively
36 Runoff Coefficient and Soil Loss in Relation to Soil Surface Features and Understory Cover
Table 2 shows the relationship between the surface runoff coefficient soil loss and soil surfacefeatures areal percentages Erosion crust charcoals worm casts algae and mosses show weakcorrelations with the surface runoff coefficient while the other soil surface features and understorycover provided Pearson correlation coefficient (r) above 07 The features with lower r had lowerpercentages which may cause poor relation with the surface runoff coefficient Free aggregatesresidues and understory had a strong and negative correlation with surface runoff with r betweenminus072 and minus091 Free gravel total crust structural crust gravel crust and pedestal features coverexhibited a strong correlation with surface runoff (r = 084 089 089 098 and 089 respectively)
Water 2020 12 2327 11 of 23
We also found a strong correlation between soil loss and surface runoff (r = 097) Soil surface featuresand understory cover exhibited significant inter-correlation except for charcoals worm casts algaeand mosses which were weakly related to other types of soil surface features or understory coverWater 2020 12 x FOR PEER REVIEW 12 of 25
Figure 7 Boxplots of (a) cumulative surface runoff (mm) (b) average suspended sediment concentration (gmiddotLminus1) and (c) runoff coefficient () in each treatment measured from 4 June to 15 October 2017 in Ban Kokngew Luang Prabang Province Lao Peoplersquos Democratic Republic Each rainfall bar represents the accumulated rainfall over the period prior to the sampling Each boxplot contains the extreme of the lower whisker (vertical line) the lower hinge (thin line) the median (bold line) the upper hinge (thin line) the extreme of the upper whisker (vertical line) and the outliers (black dots) with p-values from Wilcoxon tests between two groups of treatments The whiskers extend to the most extreme data point which is no more than 15-times the interquartile range from the box TNU teak with no understory TLU teak with low density of understory THU teak with high density of understory TBG teak with broom grass The runoff coefficient is the ratio in percentage between total surface runoff depth and total rainfall depth
Figure 7 Boxplots of (a) cumulative surface runoff (mm) (b) average suspended sediment concentration(gmiddotLminus1) and (c) runoff coefficient () in each treatment measured from 4 June to 15 October 2017 in BanKokngew Luang Prabang Province Lao Peoplersquos Democratic Republic Each rainfall bar represents theaccumulated rainfall over the period prior to the sampling Each boxplot contains the extreme of thelower whisker (vertical line) the lower hinge (thin line) the median (bold line) the upper hinge (thinline) the extreme of the upper whisker (vertical line) and the outliers (black dots) with p-values fromWilcoxon tests between two groups of treatments The whiskers extend to the most extreme data pointwhich is no more than 15-times the interquartile range from the box TNU teak with no understoryTLU teak with low density of understory THU teak with high density of understory TBG teak withbroom grass The runoff coefficient is the ratio in percentage between total surface runoff depth andtotal rainfall depth
Water 2020 12 2327 12 of 23
Table 2 Correlation (Pearson coefficient) between seasonal runoff coefficient (Rc) seasonal soil loss (Sl) and soil surface features Fa free aggregates Fg free gravelTc total crust Sc structural crust Ec erosion crust Gc gravel crust Cha charcoals Res residues Wor worm casts Alg algae Mos mosses Ped pedestals Undunderstory All variables were measured in 2017 in Ban Kokngew Luang Prabang Province Lao Peoplersquos Democratic Republic
Variables Rc Sl Fa Fg Tc Sc Ec Gc Cha Res Wor Alg Mos Ped
Sl 097 Fa minus072 minus077 Fg 084 086 minus072 Tc 089 090 minus087 084 Sc 089 090 minus087 083 099 Ec 062 064 minus058 044 067 066 Gc 087 090 minus078 090 091 090 070
Cha 048 044 minus039 032 052 052 049 043 Res minus087 minus089 077 minus088 minus097 minus097 minus066 minus094 minus053 Wor minus047 minus042 minus007 minus046 minus027 minus027 minus015 minus037 minus013 039Alg 055 053 minus031 049 045 045 016 044 028 minus047 minus023Mos minus026 minus034 027 minus025 minus039 minus038 minus032 minus037 minus010 042 026 minus013Ped 089 091 minus080 082 094 094 073 091 054 minus092 minus030 038 minus031Und minus091 minus093 089 minus086 minus098 minus098 minus063 minus091 minus049 095 026 minus047 036 minus092
Significance level p lt 00001 p lt 0001 p lt 001 p lt 005
Water 2020 12 2327 13 of 23
Figure 8a shows PLSR biplot of inter-correlation between runoff coefficient soil loss understoryand soil surface features The runoff coefficient and soil loss were positively correlated with totalcrust pedestal features cover free gravel charcoals and algae but were negatively correlated withunderstory residues and free gravel Worm casts and mosses had no significant relation with theother variables
Water 2020 12 x FOR PEER REVIEW 15 of 25
Figure 8 (a) Partial least squares regression (PLSR) biplot for seasonal surface runoff coefficient (Rc) and seasonal soil loss (Sl) in relation with soil surface features and understory (b) Variable importance for the projection (VIP) score plot of each variable contributing the most to the models of Rc and Sl Und understory Tc total crust Ped pedestals Res residues Fg free gravel Fa free aggregates Alg algae Cha charcoals Wor worm casts Mos mosses All variables were measured in 2017 in Ban Kokngew Luang Prabang Province Lao Peoplersquos Democratic Republic
Figure 8b displays the score plot of variable importance in projection (VIP) for each soil surface feature and understory treatment This plot allows the rapid identification of the variables that contribute the most to the models of runoff coefficient and soil loss (Figure S3) Understory total crust pedestal features cover and residues were considered the most important variables and
Figure 8 (a) Partial least squares regression (PLSR) biplot for seasonal surface runoff coefficient (Rc)and seasonal soil loss (Sl) in relation with soil surface features and understory (b) Variable importancefor the projection (VIP) score plot of each variable contributing the most to the models of Rc and SlUnd understory Tc total crust Ped pedestals Res residues Fg free gravel Fa free aggregatesAlg algae Cha charcoals Wor worm casts Mos mosses All variables were measured in 2017 in BanKokngew Luang Prabang Province Lao Peoplersquos Democratic Republic
Figure 8b displays the score plot of variable importance in projection (VIP) for each soil surfacefeature and understory treatment This plot allows the rapid identification of the variables that
Water 2020 12 2327 14 of 23
contribute the most to the models of runoff coefficient and soil loss (Figure S3) Understory total crustpedestal features cover and residues were considered the most important variables and therefore thebest predictors in the model The coefficients of each variable contributing to the modelsrsquo equation arelisted in Table S1
Figure 9 shows the observed and the modelled soil loss proposed by [31] The soil loss is a functionof the runoff coefficient with the equation ln(Sl) = minus130 + 236 ln(Rc) where Sl is the soil loss andRc is the runoff coefficient The model provided significant statistics (R2 = 091 p lt 00001) and is apromising framework for the prediction of soil loss based on the runoff coefficient
Water 2020 12 x FOR PEER REVIEW 16 of 25
therefore the best predictors in the model The coefficients of each variable contributing to the modelsrsquo equation are listed in Table S1
Figure 9 shows the observed and the modelled soil loss proposed by [31] The soil loss is a function of the runoff coefficient with the equation ln(Sl) = minus130 + 236 ln(Rc) where Sl is the soil loss and Rc is the runoff coefficient The model provided significant statistics (R2 = 091 p lt 00001) and is a promising framework for the prediction of soil loss based on the runoff coefficient
Figure 9 Observed and modelled seasonal soil loss Each point represents the seasonal soil loss of the 24 microplots Values (in gmiddotmminus2) were predicted using the simple formulation ln(Sl) = minus130 + 236 ln(Rc) where Rc is the seasonal runoff coefficient and Sl is the seasonal soil loss as proposed by [31] Observed Rc and Sl were measured from 4 June to 15 October 2017 in Ban Kokngew Luang Prabang Province Lao Peoplersquos Democratic Republic
4 Discussion
41 Understory Limits Surface Runoff and Soil Erosion
Soil loss is strongly related to surface runoff (Figures 6 and 8 and Table 2) Soil loss increased with increasing surface runoff especially in TNU which produced the most surface runoff over the rainy season (Figure S1) Patin et al [31] successfully applied the Terrace Erosion and Sediment Transport (TEST) model developed by [43] to estimate soil detachment observed for various land covers in the Houay Pano catchment northern Lao PDR They also proposed a simple soil loss model describing the soil loss as a function of the runoff coefficient We applied this simplified model and also found that seasonal surface runoff coefficient is a reliable predictor of the seasonal soil loss (Figure 9) This result shows that at the plot scale surface runoff is statistically the main process responsible for the transfer of solid particles Our results show that under the studied conditions sediment production which is high is not the limiting factor to soil loss We found that soil loss had a strong correlation with structural crust and a strong negative correlation with free aggregates and residues Overall these findings are in accordance with the findings reported by [30] namely that soil loss increases with an increasing surface runoff coefficient proportionally predicted by structural crust The percentage of erosion crust is one of the main drivers of soil erosion [30] At the plot scale soil detachment firstly depends on splash [5] The packing of the soil particles which is due to the compaction by large drops leads to crust forming [5] Soil detachment by splash eventually leads to
Figure 9 Observed and modelled seasonal soil loss Each point represents the seasonal soil loss of the24 microplots Values (in gmiddotmminus2) were predicted using the simple formulation ln(Sl) = minus130 + 236ln(Rc) where Rc is the seasonal runoff coefficient and Sl is the seasonal soil loss as proposed by [31]Observed Rc and Sl were measured from 4 June to 15 October 2017 in Ban Kokngew Luang PrabangProvince Lao Peoplersquos Democratic Republic
4 Discussion
41 Understory Limits Surface Runoff and Soil Erosion
Soil loss is strongly related to surface runoff (Figures 6 and 8 and Table 2) Soil loss increased withincreasing surface runoff especially in TNU which produced the most surface runoff over the rainyseason (Figure S1) Patin et al [31] successfully applied the Terrace Erosion and Sediment Transport(TEST) model developed by [43] to estimate soil detachment observed for various land covers in theHouay Pano catchment northern Lao PDR They also proposed a simple soil loss model describing thesoil loss as a function of the runoff coefficient We applied this simplified model and also found thatseasonal surface runoff coefficient is a reliable predictor of the seasonal soil loss (Figure 9) This resultshows that at the plot scale surface runoff is statistically the main process responsible for the transfer ofsolid particles Our results show that under the studied conditions sediment production which is highis not the limiting factor to soil loss We found that soil loss had a strong correlation with structuralcrust and a strong negative correlation with free aggregates and residues Overall these findings arein accordance with the findings reported by [30] namely that soil loss increases with an increasingsurface runoff coefficient proportionally predicted by structural crust The percentage of erosion crustis one of the main drivers of soil erosion [30] At the plot scale soil detachment firstly depends on
Water 2020 12 2327 15 of 23
splash [5] The packing of the soil particles which is due to the compaction by large drops leads tocrust forming [5] Soil detachment by splash eventually leads to pedestal features [5] We found thatthe structural crust represents in average 93ndash100 of the total crust similar to the 91 reported by [30]for mature teak trees Consistently the percentage of pedestal features cover (Figure 4a) and total crust(82 of the percentage area of soil surface feature Figure 4b) was relatively high in TNU The highestsurface runoff and soil loss were observed in TNU due to the highly crusted area together resultingfrom less residues cover and the absence of understory cover Hence runoff generation occurs on thecrusted soil area which restricts infiltration [6061] depending on the presence of plant residues atsoil surface and understory [6263] Residues do not only prevent crust formation [62] but also favorthe biological activity of organisms which decompose organic matter from the residues especiallymacro-faunal communities (also referred to as soil engineers) [64] This biological process contributesto increase the infiltration rate through the development of soil biological porosity and breakdownof soil crusts resulting from previous inappropriate land use [6365] The surface runoff coefficientis a function of structural crust [30] and our results confirmed this finding (Table 2) A similar resultwas obtained by [616667] who found that a soil crusted area enhances surface runoff and soil erosionCrusted soil has less influence on soil detachment due to its physical protection [33] This implies thatstructural crust is not the main cause of soil erosion but the main driver of surface runoff generation [30]Once generated surface runoff carries towards downstream the soil particles detached by splash [5]
Our models based on PLSR analysis confirmed the importance of each soil surface featureincluding understory cover in predicting seasonal surface runoff coefficient and seasonal soil loss atthe plot scale (Figure S3 and Table S1) High soil detachment and surface runoff could be alleviatedby the physical protection of both understory covers including broom grass and plant residues(originating from teak leaves and understory) Soil splash depends on understory cover and on thepercentage of cover by residues [5] while surface runoff decreases when understory cover increases [68]The understory and a thick residue layer reduces the rain splash effect and allows a high rate ofinfiltration which then reduces surface runoff and soil erosion [69] The soil is protected by understorywhich dissipates the high raindropsrsquo kinetic energy under teak trees [5] In the absence of understorythe height of trees plays a decisive role with respect to soil detachment (Figure 3) Tall tree canopy indense tree plantations intercepts the raindrops Since teak tree leaves are broad leaves dramaticallyincrease the diameter of raindrops with throughflow hence their kinetic energy and erosivity [273070]Plant residue attenuates the effect of rain splash and reduces the percentage area of total crust [30]A number of authors have shown that the removal of understory by slashing and burning inducesincreased surface runoff and soil erosion [52657172]
Runoff coefficients in the four treatments varied in time and increased in the middle of the rainyseason (July 2017 Figure S1) which is explained by antecedent rainfall ie the rain falling beforeany rainfall event of interest [73] Rainfall events happen more frequently in the middle of the rainyseason Since there is less time between two subsequent rainfall events to dry the soil soil moistureincreases and soils get saturated or nearly saturated by water Consequently surface runoff generationis enhanced and the runoff coefficients increase in the middle of the rainy season Surface runoff inTNU plots were much higher than in all other treatments over the rainy season (Figure S1) The runoff
coefficient in TNU was higher than in the other treatments since the very beginning of the seasondespite the low soil moisture and the low hydraulic conductivity of soil Overall the runoff coefficientin TNU was the highest with 597 (Figure S2) which is comparable to the values found by [30]in mature teak tree plantations with similar conditions of understory On the contrary the runoff
coefficients of THU and TBG were around 23 (Figure S2) which is comparable to the overall runoff
coefficient calculated for the treatments associating young teak trees with a variety of understoryin [30]
The least erosive treatment in this study ie TBG (381 gmiddotmminus2) produced soil loss about 75-timeshigher than the broom grass treatment in Houay Dou catchment in northern Lao PDR [30] The differencebetween our finding and broom grass treatment in [30] can be explained by the lower residue cover
Water 2020 12 2327 16 of 23
and the greater height of teak trees in our study and by the fact that broom grass canopy was less densebecause it was grown under the shadow of the teak trees and frequently harvested Our values inTBG treatment were also greater than the values reported by [6674] in northern Vietnam with similarunderstory topography and climate but with different vegetation types namely mixed tree plantationand fallow respectively Similarly the most erosive treatment in this study ie TNU (5455 gmiddotmminus2)produced soil loss about 35-times higher than the mature teak tree treatment in [30] The values inTNU were also higher than the values reported by [303366] in the same region with similar understoryconditions Such discrepancies may be related to soil surface conditions or plant and understorycharacteristics (height plant density percentage of cover) which were usually discussed in this studyHowever values 54-times higher were measured by [75] in Costa Rica where antecedent land use asrangeland most likely greatly and durably reduced soil hydraulic conductivity [72] Overall the soilloss in TBG was 14-times less than in TNU Hence teak tree plantation owners could divide soil lossby 14 by keeping understory such as broom grass within teak tree plantations
Considering the finding of our study at the plot scale the farmers would also have saved about40ndash50 tonmiddothaminus1 of soil over the 2017 rainy season if they had grown understory under teak treesHowever this result must be qualified since the value cannot be extrapolated at scales larger thanthe plot scale such as the catchment scale because erosion processes at catchment scale are different(suspended sediments deposition or resuspension gully formation on steep slope) At the catchmentscale a supplementary mitigation measure to trap water and eroded soil particles before entering theriver network would be riparian buffers and vegetation filter strips [5476]
42 Broom Grass Grown in Teak Tree Plantations Agronomic Aspects and Ecosystem Services
Tree spacing is a determinant factor of teak tree productivity [65] In our study densities of800ndash1200 treemiddothaminus1 [47] (Table 1) were relatively high compared to densities reported for other plantationareas (lt800 treemiddothaminus1) [657778] Planting trees at lower densities in our study site should be seriouslyconsidered as not only would it warrant higher productivity [65] possibly higher than in natural forest(40 treemiddothaminus1) [77] but it would also allow growing intercropped understory adding economic value tothe overall plantation yield
The introduction of agroforestry into agricultural practices ensures an increased food security by arestored soil fertility for food crops [79] and a sustainable production of wood [64] Broom grass is neithera food nor a feed crop but similar to agroforestry systems it is grown under trees Thus the managementpractice may possibly increase the overall productivity (biomass economic yield [4547]) of the plot bymaking an optimal use of the resources (water and nutrients) that would otherwise not be utilized bya single crop consumed by plant species at different soil layers depending on their root length [80]Although it seems to be more productive when grown in full light [30] broom grass can be grownunder teak trees similar to other shade-tolerant crops such as patchouli [78]
Growing broom grass in teak tree plantations may supply a range of ecosystem services that isnot limited to the supply of raw material for brooms and to the prevention of high surface runoff andsoil loss in teak tree plantations At the plot scale the litter from broom grass leaves may increasetop soil organic matter content [64] thus improving soil structure soil nutrient availability [65]soil carbon sequestration [81] and increasing water infiltration and soil moisture retention [4463]Diversifying vegetation strata may diversify the habitats for bird species and other forest-dependentspecies [778283] thus increasing predator biodiversity [8485] and reducing the need for chemicalinputs (insecticides herbicides etc) in eg surrounding annual crop plots At the catchment scalefavoring water infiltration and reducing surface runoff may mitigate natural disasters (floods anddroughts) [6581] and increase the transfer time of contaminants deposited at the soil surface [86]Decreasing the sediment supply to the stream network would increase the life span of dam reservoirs [87]and avoid dredging costs [88ndash90] an issue of particular concern along the Mekong River where thenumber of dams is dramatically increasing [9192]
Water 2020 12 2327 17 of 23
43 Percentage of Cover of Pedestal Features An Indicator of Soil Erosion
Both the PLSR model and the simplified model proposed by [31] that we presented in this studyprovided promising results to predict soil loss Nevertheless such models require input data fromexperimental microplots which are rather difficult and time consuming to be implemented particularlywithin the framework of a large-scale approach It would be more practical to use simple indicatorsthat are known to be proxies of soil loss such as soil surface features andor understory characteristics(Table 2) On one hand understory cover varies throughout the year which causes difficulties invisual observation and inconsistent estimation On the other hand observing soil surface features(such as total crust free aggregates free gravel residues etc) requires some expertise Howeveramong soils surface features pedestal feature cover is a reliable proxy of soil erosion intensity in thefield (Figure 4a) that is easy to assess visually Hence lay people could use the proxy of the percentageof cover of pedestal features to identify the impact of the agricultural management of their land on soildegradation through surface runoff and soil loss
5 Conclusions
We investigated the impact of different types of understory on surface runoff and soil loss in a teaktree plantation of the mountainous region of northern Lao PDR We analyzed the relationship betweenunderstory management soil surface features (including pedestal features) and surface runoff and soilloss at the plot scale This paper clearly demonstrates that teak tree plantations especially in steepsloping lands can be prone to considerable soil loss if not properly managed Our main findingswhich are graphically synthesized in Figure 10 are that
bull Understory cover acts as an umbrella that protects soil surface from rain splash despite the heightof teak trees and the large size of their leaves which contribute to produce raindrops of highkinetic energy Teak tree plantation owners could divide soil loss by 14 by keeping understorysuch as broom grass within teak tree plantations Hence growing understory under teak treesis a mitigation management practice that can be reliably promoted to limit surface runoff andsoil erosion
bull Residues from both teak tree leaves and understory not only protect the soil but also enhance theinfiltrability of water into the soil In contrast the main driver of surface runoff and soil erosion isthe percentage of crusted area
bull Understory such as broom grass provides several benefits to the relevant stakeholders in the areain terms of incomes and ecosystem services For example the farmers can sell the brooms madefrom broom grass
bull The percentage of cover of pedestal features appears as a good indicator of soil erosion thatfarmers and teak tree plantations owners could easily use to assess the degradation of their land
In such a context to minimize surface runoff and soil erosion in steep slope areas such as themontane regions of southndasheast Asia decision makers should if not legally enforce the maintenanceof understory strata in teak tree plantation at least recommend the plantations owners to maintainunderstory and avoid understory and plant residue layers burning
At the plot scale our findings are relevant to farmers concerned about soil loss and soil fertilityin their teak tree plots At catchment scale they are relevant to decision makers concerned withthe management of costs (such as the cost of water treatment andor infrastructure rehabilitationsuch as dam reservoir dredging) resulting from soil loss induced by upslope activities such as treeplantations and improper agricultural land management In addition to maintaining the understorystrata encouraging the use of eg riparian zone buffers along the streams [9394] could also berecommended to trap soil particles from the cultivated hillslopes and favor runoff infiltration and thusensure the sustainability of the system
Water 2020 12 2327 18 of 23
Water 2020 12 x FOR PEER REVIEW 19 of 25
experimental microplots which are rather difficult and time consuming to be implemented particularly within the framework of a large-scale approach It would be more practical to use simple indicators that are known to be proxies of soil loss such as soil surface features andor understory characteristics (Table 2) On one hand understory cover varies throughout the year which causes difficulties in visual observation and inconsistent estimation On the other hand observing soil surface features (such as total crust free aggregates free gravel residues etc) requires some expertise However among soils surface features pedestal feature cover is a reliable proxy of soil erosion intensity in the field (Figure 4a) that is easy to assess visually Hence lay people could use the proxy of the percentage of cover of pedestal features to identify the impact of the agricultural management of their land on soil degradation through surface runoff and soil loss
5 Conclusions
We investigated the impact of different types of understory on surface runoff and soil loss in a teak tree plantation of the mountainous region of northern Lao PDR We analyzed the relationship between understory management soil surface features (including pedestal features) and surface runoff and soil loss at the plot scale This paper clearly demonstrates that teak tree plantations especially in steep sloping lands can be prone to considerable soil loss if not properly managed Our main findings which are graphically synthesized in Figure 10 are that
bull Understory cover acts as an umbrella that protects soil surface from rain splash despite the height of teak trees and the large size of their leaves which contribute to produce raindrops of high kinetic energy Teak tree plantation owners could divide soil loss by 14 by keeping understory such as broom grass within teak tree plantations Hence growing understory under teak trees is a mitigation management practice that can be reliably promoted to limit surface runoff and soil erosion
bull Residues from both teak tree leaves and understory not only protect the soil but also enhance the infiltrability of water into the soil In contrast the main driver of surface runoff and soil erosion is the percentage of crusted area
bull Understory such as broom grass provides several benefits to the relevant stakeholders in the area in terms of incomes and ecosystem services For example the farmers can sell the brooms made from broom grass
bull The percentage of cover of pedestal features appears as a good indicator of soil erosion that farmers and teak tree plantations owners could easily use to assess the degradation of their land
Figure 10 Graphical abstract TNU teak with no understory TLU teak with low density of understoryTHU teak with high density of understory TBG teak with broom grass
Supplementary Materials The following are available online at httpwwwmdpicom2073-44411292327s1Figure S1 (a) Cumulated rainfall (mm) (b) boxplots of runoff coefficient () (c) boxplot of surface runoff (mm)(d) boxplot of soil loss (gmiddotmminus2) in each treatment measured from 4 June to 15 October 2017 in Ban KokngewLuang Prabang Province Lao Peoplersquos Democratic Republic TNU teak with no understory TLU teak with lowdensity of understory THU teak with high density of understory TBG teak with broom grass Each rainfall barrepresents the accumulated rainfall over the period previous to the sampling Each boxplot contains the extremeof the lower whisker (dashed line) the lower hinge (thin line) the median (bold line) the upper hinge (thin line)and the extreme of the upper whisker (dashed line) The whiskers extend to the most extreme data point which isno more than 15-times the interquartile range from the box Figure S2 (a) Cumulative surface runoff (mm) versuscumulative rainfall and runoff coefficient ( total surface runoff divided by total rainfall) and (b) cumulativesoil loss (gmiddotmminus2) versus cumulative rainfall (mm) measured from 4 June to 15 October 2017 in Ban KokngewLuang Prabang Province Lao Peoplersquos Democratic Republic TNU teak with no understory TLU teak withlow density of understory THU teak with high density of understory TBG teak with broom grass Figure S3Observed and modelled seasonal runoff coefficient (Rc in ) and seasonal soil loss (Sl in gmiddotmminus2) from partialleast squares (PLS) regression method Observed Rc and Sl were measured from 4 June to 15 October 2017 in BanKokngew Luang Prabang Province Lao Peoplersquos Democratic Republic Table S1 Coefficients of each variables inthe runoff coefficient () and soil loss (gmiddotmminus2) partial least squares (PLS) models SD standard deviation Fafree aggregates Fg free gravel Tc total crust Cha charcoals Res residues Wor worm casts Alg algae Mosmosses Ped pedestals Und understory
Author Contributions Conceptualization OS BS (Bounthan Souksavath) BL and OR methodology AdRCV and OR formal analysis LS OR and LB data curation LS CV PS AdR BS (BounsamaySoulileuth) NS and OR writingmdashoriginal draft preparation LS writingmdashreview and editing LB OR APCV and AdR visualization LS and OR supervision LB OR and CO funding acquisition OR and APAll authors have read and agreed to the published version of the manuscript
Funding This research was funded by the French National Research Agency TecItEasy project grant numberANR-13-AGRO-0007 and by a scholarship of French government and Ministry of Education Youth and Sports ofCambodia (LS)
Acknowledgments This study was supported by the Luang Prabang Teak Programme (LPTP) the FrenchInstitute for Sustainable Development (IRD) through the international joint laboratory LUSES (Dynamic of LandUse Changes and Soil Ecosystem Services) and the Faculty of Agriculture of Lao PDR and Lao students namelyVACHOIMA Sythong and TONGSENG Chong Moua The authors sincerely thank the M-TROPICS CriticalZone Observatory (httpsmtropicsobs-mipfr) which belongs to the French Research Infrastructure OZCAR(httpwwwozcar-riorg) and the Lao Department of Agricultural Land Management (DALaM) for their supportincluding granting the permission for field access
Conflicts of Interest The authors declare no conflict of interest
Water 2020 12 2327 19 of 23
References
1 Gerstengarbe FW Werner PC Precipitation Pattern In Encyclopedia of Ecology Joslashrgensen SE Fath BDEds Elsevier Science Amsterdam The Netherlands 2008 pp 2916ndash2923 [CrossRef]
2 Descroix L Gonzaacutelez Barrios JL Viramontes D Poulenard J Anaya E Esteves M Estrada J Gullyand sheet erosion on subtropical mountain slopes Their respective roles and the scale effect Catena 2008 72325ndash339 [CrossRef]
3 Valentin C Agus F Alamban R Boosaner A Bricquet J-P Chaplot V De Guzman T De Rouw AJaneau J-L Orange D Runoff and sediment losses from 27 upland catchments in Southeast Asia Impact ofrapid land use changes and conservation practices Agric Ecosyst Environ 2008 128 225ndash238 [CrossRef]
4 Nandi A Luffman I Erosion related changes to physicochemical properties of Ultisols distributed oncalcareous sedimentary rocks J Sustain Dev 2012 5 52 [CrossRef]
5 Valentin C Rajot JL Erosion and Principles of Soil Conservation In Soils as a Key Component of the CriticalZone 5 Degradation and Rehabilitation Johns Hopkins University Press Baltimore MD USA 2018 Volume 5pp 39ndash82
6 Sartori M Philippidis G Ferrari E Borrelli P Lugato E Montanarella L Panagos P A linkage betweenthe biophysical and the economic Assessing the global market impacts of soil erosion Land Use Policy 201986 299ndash312 [CrossRef]
7 Panagos P Borrelli P Poesen J Ballabio C Lugato E Meusburger K Montanarella L Alewell CThe new assessment of soil loss by water erosion in Europe Environ Sci Policy 2015 54 438ndash447 [CrossRef]
8 Pimentel D Burgess M Soil erosion threatens food production Agriculture 2013 3 443ndash463 [CrossRef]9 Pimentel D Soil erosion A food and environmental threat Environ Dev Sustain 2006 8 119ndash137
[CrossRef]10 Owens P Batalla R Collins A Gomez B Hicks D Horowitz A Kondolf G Marden M Page M
Peacock D Fine-grained sediment in river systems Environmental significance and management issuesRiver Res Appl 2005 21 693ndash717 [CrossRef]
11 Yuan S Tang H Xiao Y Xia Y Melching C Li Z Phosphorus Contamination of the Surface Sediment ata River Confluence J Hydrol 2019 573 568ndash580 [CrossRef]
12 Chartin C Evrard O Onda Y Patin J Lefegravevre I Ottleacute C Ayrault S Lepage H Bonteacute P Trackingthe early dispersion of contaminated sediment along rivers draining the Fukushima radioactive pollutionplume Anthropocene 2013 1 23ndash34 [CrossRef]
13 Turner JN Brewer PA Macklin MG Fluvial-controlled metal and As mobilisation dispersal and storagein the Rio Guadiamar SW Spain and its implications for long-term contaminant fluxes to the Donanawetlands Sci Total Environ 2008 394 144ndash161 [CrossRef] [PubMed]
14 Domagalski JL Kuivila KM Distributions of pesticides and organic contaminants between water andsuspended sediment San Francisco Bay California Estuaries 1993 16 416ndash426 [CrossRef]
15 Gateuille D Evrard O Lefevre I Moreau-Guigon E Alliot F Chevreuil M Mouchel JM Mass balanceand decontamination times of Polycyclic Aromatic Hydrocarbons in rural nested catchments of an earlyindustrialized region (Seine River basin France) Sci Total Environ 2014 470 608ndash617 [CrossRef] [PubMed]
16 Ribolzi O Cuny J Sengsoulichanh P Mousques C Soulileuth B Pierret A Huon SSengtaheuanghoung O Land use and water quality along a Mekong tributary in northern Lao PDREnviron Manag 2011 47 291ndash302 [CrossRef] [PubMed]
17 Boithias L Choisy M Souliyaseng N Jourdren M Quet F Buisson Y Thammahacksa C Silvera NLatsachack K Sengtaheuanghoung O et al Hydrological Regime and Water Shortage as Drivers of theSeasonal Incidence of Diarrheal Diseases in a Tropical Montane Environment PLoS Negl Trop Dis 2016 10e0005195 [CrossRef] [PubMed]
18 Kim M Boithias L Cho KH Sengtaheuanghoung O Ribolzi O Modeling the Impact of Land UseChange on Basin-scale Transfer of Fecal Indicator Bacteria SWAT Model Performance J Environ Qual 201847 1115ndash1122 [CrossRef]
19 Thothong W Huon S Janeau J-L Boonsaner A de Rouw A Planchon O Bardoux G Parkpian PImpact of land use change and rainfall on sediment and carbon accumulation in a water reservoir of NorthThailand Agric Ecosyst Environ 2011 140 521ndash533 [CrossRef]
Water 2020 12 2327 20 of 23
20 Zarris D Vlastara M Panagoulia D Sediment Delivery Assessment for a Transboundary MediterraneanCatchment The Example of Nestos River Catchment Water Resour Manag 2011 25 3785 [CrossRef]
21 Efthimiou N Lykoudi E Panagoulia D Karavitis C Assessment of soil susceptibility to erosion usingthe EPM and RUSLE Models The case of Venetikos River Catchment Global NEST J 2016 18 164ndash179
22 Sidle RC Ziegler AD Negishi JN Nik AR Siew R Turkelboom F Erosion processes in steepterrainmdashTruths myths and uncertainties related to forest management in Southeast Asia For Ecol Manag2006 224 199ndash225 [CrossRef]
23 Patin J Mouche E Ribolzi O Chaplot V Sengtahevanghoung O Latsachak KO Soulileuth BValentin C Analysis of runoff production at the plot scale during a long-term survey of a small agriculturalcatchment in Lao PDR J Hydrol 2012 426 79ndash92 [CrossRef]
24 Ziegler AD Giambelluca TW Tran LT Vana TT Nullet MA Fox J Vien TD Pinthong JMaxwell JF Evett S Hydrological consequences of landscape fragmentation in mountainous northernVietnam Evidence of accelerated overland flow generation J Hydrol 2004 287 124ndash146 [CrossRef]
25 Ziegler AD Giambelluca TW Nullet MA Sutherland RA Tantasarin C Vogler JB Negishi JNThroughfall in an evergreen-dominated forest stand in northern Thailand Comparison of mobile andstationary methods Agric For Meteorol 2009 149 373ndash384 [CrossRef]
26 Valentin C (Ed) Soil Surface Crusting of Soil and Water Harvesting In Soils as a Key Component of the CriticalZone 5 Degradation and Rehabilitation John Wiley amp Sons New York NY USA 2018 Volume 5 pp 21ndash38
27 Goebes P Seitz S Kuumlhn P Li Y Niklaus PA Oheimb Gv Scholten T Throughfall kinetic energy inyoung subtropical forests Investigation on tree species richness effects and spatial variability Agric ForMeteorol 2015 213 148ndash159 [CrossRef]
28 Lacombe G Ribolzi O de Rouw A Pierret A Latsachak K Silvera N Pham Dinh R Orange DJaneau JL Soulileuth B et al Contradictory hydrological impacts of afforestation in the humid tropicsevidenced by long-term field monitoring and simulation modelling Hydrol Earth Syst Sci 2016 202691ndash2704 [CrossRef]
29 Ribolzi O Evrard O Huon S de Rouw A Silvera N Latsachack KO Soulileuth B Lefevre IPierret A Lacombe G et al From shifting cultivation to teak plantation Effect on overland flow andsediment yield in a montane tropical catchment Sci Rep 2017 7 3987 [CrossRef]
30 Lacombe G Valentin C Sounyafong P de Rouw A Soulileuth B Silvera N Pierret ASengtaheuanghoung O Ribolzi O Linking crop structure throughfall soil surface conditions runoff
and soil detachment 10 land uses analyzed in Northern Laos Sci Total Environ 2018 616 1330ndash1338[CrossRef]
31 Patin J Mouche E Ribolzi O Sengtahevanghoung O Latsachak KO Soulileuth B Chaplot VValentin C Effect of land use on interrill erosion in a montane catchment of Northern Laos An analysisbased on a pluri-annual runoff and soil loss database J Hydrol 2018 563 480ndash494 [CrossRef]
32 Ribolzi O Patin J Bresson LM Latsachack KO Mouche E Sengtaheuanghoung O Silvera NThieacutebaux JP Valentin C Impact of slope gradient on soil surface features and infiltration on steep slopes innorthern Laos Geomorphology 2011 127 53ndash63 [CrossRef]
33 Chaplot V Khampaseuth X Valentin C Bissonnais YL Interrill erosion in the sloping lands of northernLaos subjected to shifting cultivation Earth Surf Process Landf 2007 32 415ndash428 [CrossRef]
34 Vannoppen W Vanmaercke M De Baets S Poesen J A review of the mechanical effects of plant roots onconcentrated flow erosion rates Earth Sci Rev 2015 150 666ndash678 [CrossRef]
35 Shinohara Y Otani S Kubota T Otsuki K Nanko K Effects of plant roots on the soil erosion rate undersimulated rainfall with high kinetic energy Hydrol Sci J 2016 61 2435ndash2442 [CrossRef]
36 Roose E Land Husbandry Components and Strategy FAO Rome Italy 199637 Ehigiator OA Anyata BU Effects of land clearing techniques and tillage systems on runoff and soil erosion
in a tropical rain forest in Nigeria J Environ Manag 2011 92 2875ndash2880 [CrossRef] [PubMed]38 Cerdagrave A Rodrigo-Comino J Gimeacutenez-Morera A Novara A Pulido M Kapovic-Solomun M
Keesstra SD Policies can help to apply successful strategies to control soil and water losses The case ofchipped pruned branches (CPB) in Mediterranean citrus plantations Land Use Policy 2018 75 734ndash745[CrossRef]
39 Li X Niu J Xie B The effect of leaf litter cover on surface runoff and soil erosion in Northern ChinaPLoS ONE 2014 9 e107789 [CrossRef]
Water 2020 12 2327 21 of 23
40 Duraacuten Zuazo VH Martiacutenez JRF Pleguezuelo CRR Martiacutenez Raya A Rodriacuteguez BC Soil-erosion andrunoff prevention by plant covers in a mountainous area (se spain) Implications for sustainable agricultureEnvironmentalist 2006 26 309ndash319 [CrossRef]
41 Poesen J Conditions for gully formation in the Belgian loam belt and some ways to control themIn Proceedings of the of Soil Erosion Protection Measures in Europe Proc EC Workshop FreisingGermany 24ndash26 May 1988 pp 39ndash52
42 Valentin C Ruiz Figueroa J Effects of kinetic energy and water application rate on the development ofcrusts in a fine sandy loam soil using sprinkling irrigation and rainfall simulation Micromorphol Sols 1987401ndash408
43 Van Dijk A Bruijnzeel L Eisma E A methodology to study rain splash and wash processes under naturalrainfall Hydrol Process 2003 17 153ndash167 [CrossRef]
44 Neyret M Robain H de Rouw A Janeau J-L Durand T Kaewthip J Trisophon K Valentin C Higherrunoff and soil detachment in rubber tree plantations compared to annual cultivation is mitigated by groundcover in steep mountainous Thailand Catena 2020 189 104472 [CrossRef]
45 Pachas ANA Newby JC Siphommachan P Sakanphet S Dieters MJ Broom grass in Lao PDRA market chain analysis in Luang Prabang Province For Trees Livelihoods 2020 1ndash18 [CrossRef]
46 Olson DM Dinerstein E Wikramanayake ED Burgess ND Powell GVN Underwood ECDrsquoamico JA Itoua I Strand HE Morrison JC et al Terrestrial Ecoregions of the World A New Mapof Life on Earth A new global map of terrestrial ecoregions provides an innovative tool for conservingbiodiversity Bioscience 2001 51 933ndash938 [CrossRef]
47 Pachas A Sakanphet S Midgley S Dieters M Teak (Tectona grandis) silviculture and researchApplications for smallholders in Lao PDR Aust For 2019 82 94ndash105 [CrossRef]
48 Casenave A Valentin C A runoff capability classification system based on surface features criteria insemi-arid areas of West Africa J Hydrol 1992 130 231ndash249 [CrossRef]
49 Ribolzi O Lacombe G Pierret A Robain H Sounyafong P de Rouw A Soulileuth B Mouche EHuon S Silvera N Interacting land use and soil surface dynamics control groundwater outflow in amontane catchment of the lower Mekong basin Agric Ecosyst Environ 2018 268 90ndash102 [CrossRef]
50 Janeau JL Bricquet JP Planchon O Valentin C Soil crusting and infiltration on steep slopes in northernThailand Eur J Soil Sci 2003 54 543ndash554 [CrossRef]
51 Valentin C Casenave A Infiltration into sealed soils as influenced by gravel cover Soil Sci Soc Am J1992 56 1667ndash1673 [CrossRef]
52 Lacombe G Ribolzi O de Rouw A Pierret A Latsachak K Silvera N Pham Dinh R Orange DJaneau JL Soulileuth B et al Afforestation by natural regeneration or by tree planting Examples ofopposite hydrological impacts evidenced by long-term field monitoring in the humid tropics Hydrol EarthSyst Sci 2015 12 12615ndash12648 [CrossRef]
53 Janeau J-L Gillard L-C Grellier S Jouquet P Le TPQ Luu TNM Ngo QA Orange D Pham DRTran DT et al Soil erosion dissolved organic carbon and nutrient losses under different land use systemsin a small catchment in northern Vietnam Agric Water Manag 2014 146 314ndash323 [CrossRef]
54 Vigiak O Ribolzi O Pierret A Sengtaheuanghoung O Valentin C Trapping efficiencies of cultivatedand natural riparian vegetation of northern Laos J Environ Qual 2008 37 889ndash897 [CrossRef]
55 Valentin C Bresson L-M Morphology genesis and classification of surface crusts in loamy and sandy soilsGeoderma 1992 55 225ndash245 [CrossRef]
56 Quinn G Keough M Experimental Design and Data Analysis for Biologists Cambridge University PressCambridge UK 2002
57 Abdi H Partial least squares regression and projection on latent structure regression (PLS Regression)Wiley Interdiscip Rev Comput Stat 2010 2 97ndash106 [CrossRef]
58 Zaldiacutevar Santamariacutea E Molina Dagaacute D Palacios Garciacutea AT Statistical Modelization of the DescriptorldquoMineralityrdquo Based on the Sensory Properties and Chemical Composition of Wine Beverages 2019 5 66
59 Wold S PLS for multivariate linear modeling Chemom Methods Mol Des 1995 195ndash21860 Bu C-F Wu S-F Yang K-B Effects of physical soil crusts on infiltration and splash erosion in three typical
Chinese soils Int J Sediment Res 2014 29 491ndash501 [CrossRef]61 Fox D Bryan R Fox C Changes in pore characteristics with depth for structural crusts Geoderma 2004
120 109ndash120 [CrossRef]
Water 2020 12 2327 22 of 23
62 Neave M Rayburg S A field investigation into the effects of progressive rainfall-induced soil seal andcrust development on runoff and erosion rates The impact of surface cover Geomorphology 2007 87 378ndash390[CrossRef]
63 Rey F Ballais J-L Marre A Roveacutera G Rocircle de la veacutegeacutetation dans la protection contre lrsquoeacuterosion hydriquede surface C R Geosci 2004 336 991ndash998 [CrossRef]
64 Angelsen A Kaimowitz D Is agroforestry likely to reduce deforestation In Agroforestry and BiodiversityConservation in Tropical Landscapes Schroth G Fonseca GAd Harvey CA Gascon C Vasconcelos HLIzac A-MN Eds Island Press Washington DC USA 2004 pp 87ndash106
65 Blanco JA Lo Y-H Forest Ecosystems More Than Just Trees BoDndashBooks on Demand NorderstedtGermany 2012
66 Podwojewski P Orange D Jouquet P Valentin C Janeau J Tran DT Land-use impacts on surfacerunoff and soil detachment within agricultural sloping lands in Northern Vietnam Catena 2008 74 109ndash118[CrossRef]
67 Kosmas C Danalatos N Cammeraat LH Chabart M Diamantopoulos J Farand R Gutierrez LJacob A Marques H Martinez-Fernandez J The effect of land use on runoff and soil erosion rates underMediterranean conditions Catena 1997 29 45ndash59 [CrossRef]
68 Nouwakpo SK Weltz MA Green CHM Arslan A Combining 3D data and traditional soil erosionassessment techniques to study the effect of a vegetation cover gradient on hillslope runoff and soil erosionin a semi-arid catchment Catena 2018 170 129ndash140 [CrossRef]
69 Calder IR Hall RL Prasanna K Hydrological impact of Eucalyptus plantation in India J Hydrol 1993150 635ndash648 [CrossRef]
70 Geiszligler C Kuumlhn P Boumlhnke M Bruelheide H Shi X Scholten T Splash erosion potential under treecanopies in subtropical SE China Catena 2012 91 85ndash93 [CrossRef]
71 Le HT Rochelle-Newall E Ribolzi O Janeau JL Huon S Latsachack K Pommier T Land use stronglyinfluences soil organic carbon and bacterial community export in runoff in tropical uplands- Land DegradDev 2020 31 118ndash132 [CrossRef]
72 Fernaacutendez-Moya J Alvarado A Forsythe W Ramiacuterez L Algeet-Abarquero N Marchamalo-Sacristaacuten MSoil erosion under teak (Tectona grandis Lf) plantations General patterns assumptions and controversiesCatena 2014 123 236ndash242 [CrossRef]
73 Jadidoleslam N Mantilla R Krajewski WF Goska R Investigating the role of antecedent SMAP satellitesoil moisture radar rainfall and MODIS vegetation on runoff production in an agricultural region J Hydrol2019 579 124210 [CrossRef]
74 Phan Ha HA Huon S Henry des Tureaux T Orange D Jouquet P Valentin C De Rouw A Tran Duc TImpact of fodder cover on runoff and soil erosion at plot scale in a cultivated catchment of North VietnamGeoderma 2012 177 8ndash17 [CrossRef]
75 Santamariacutea Leandro F Evaluacioacuten de la Peacuterdida de Suelo en Plantaciones de Teca Bajo la Aplicacioacutende Sistemas de Conservacioacuten de Suelos en Nicoya Guanacaste 1992 Available online httpwwwsidalcnetcgi-binwxisexeIsisScript=redniaxisampmethod=postampformato=2ampcantidad=1ampexpresion=mfn=
005930 (accessed on 2 February 2019)76 Cao X Song C Xiao J Zhou Y The optimal width and mechanism of riparian buffers for storm water
nutrient removal in the Chinese eutrophic Lake Chaohu watershed Water 2018 10 1489 [CrossRef]77 Koonkhunthod N Sakurai K Tanaka S Composition and diversity of woody regeneration in a 37-year-old
teak (Tectona grandis L) plantation in Northern Thailand For Ecol Manag 2007 247 246ndash254 [CrossRef]78 Kumar D Bijalwan A Kalra A Dobriyal MJ Effect of shade and organic manure on growth and yield
of patchouli [Pogostemon cablin (blanco) benth] under teak (Tectona grandis lf) based agroforestry systemIndian For 2016 142 1121ndash1129
79 Schroeder P Agroforestry systems Integrated land use to store and conserve carbon Clim Res 1993 353ndash60 [CrossRef]
80 Chitra-Tarak R Ruiz L Dattaraja HS Kumar MM Riotte J Suresh HS McMahon SM Sukumar RThe roots of the drought Hydrology and water uptake strategies mediate forest-wide demographic responseto precipitation J Ecol 2018 106 1495ndash1507 [CrossRef]
81 Balmford A Whitten T Who should pay for tropical conservation and how could the costs be met Oryx2003 37 238ndash250 [CrossRef]
Water 2020 12 2327 23 of 23
82 Harvey CA Villalobos JAG Agroforestry systems conserve species-rich but modified assemblages oftropical birds and bats Biodivers Conserv 2007 16 2257ndash2292 [CrossRef]
83 Wunderle JM Jr The role of animal seed dispersal in accelerating native forest regeneration on degradedtropical lands For Ecol Manag 1997 99 223ndash235 [CrossRef]
84 Imron M Tantaryzard M Satria R Maulana I Pudyatmoko S Understory Avian Community In A TeakForest Of Cepu Central Java J Trop For Sci 2018 30 509ndash518 [CrossRef]
85 Perrin R Pest management in multiple cropping systems Agro-Ecosystems 1976 3 93ndash118 [CrossRef]86 Monaghan R Smith L Muirhead R Pathways of contaminant transfers to water from an artificially-drained
soil under intensive grazing by dairy cows Agric Ecosyst Environ 2016 220 76ndash88 [CrossRef]87 Annandale GW Reservoir sedimentation In Encyclopedia of Hydrological Sciences Wiley New York NY
USA 2006 [CrossRef]88 Boithias L Terrado M Corominas L Ziv G Kumar V Marques M Schuhmacher M Acuna V
Analysis of the uncertainty in the monetary valuation of ecosystem servicesmdashA case study at the river basinscale Sci Total Environ 2016 543 683ndash690 [CrossRef]
89 Crowder BM Economic costs of reservoir sedimentation A regional approach to estimating croplanderosion damage J Soil Water Conserv 1987 42 194ndash197
90 McHenry JR RESERVOIR SEDIMENTATION 1 J Am Water Resour Assoc 1974 10 329ndash337 [CrossRef]91 Dang TD Cochrane TA Arias ME Quantifying suspended sediment dynamics in mega deltas using
remote sensing data A case study of the Mekong floodplains Int J Appl Earth Obs Geoinf 2018 68105ndash115 [CrossRef]
92 Arias ME Cochrane TA Kummu M Lauri H Holtgrieve GW Koponen J Piman T Impacts ofhydropower and climate change on drivers of ecological productivity of Southeast Asiarsquos most importantwetland Ecol Model 2014 272 252ndash263 [CrossRef]
93 Bhat SA Dar MUD Meena RS Soil erosion and management strategies In Sustainable Management ofSoil and Environment Springer New York NY USA 2019 pp 73ndash122
94 Ahmad NSBN Mustafa FB Gideon D A systematic review of soil erosion control practices on theagricultural land in Asia Int Soil Water Conserv Res 2020 [CrossRef]
copy 2020 by the authors Licensee MDPI Basel Switzerland This article is an open accessarticle distributed under the terms and conditions of the Creative Commons Attribution(CC BY) license (httpcreativecommonsorglicensesby40)
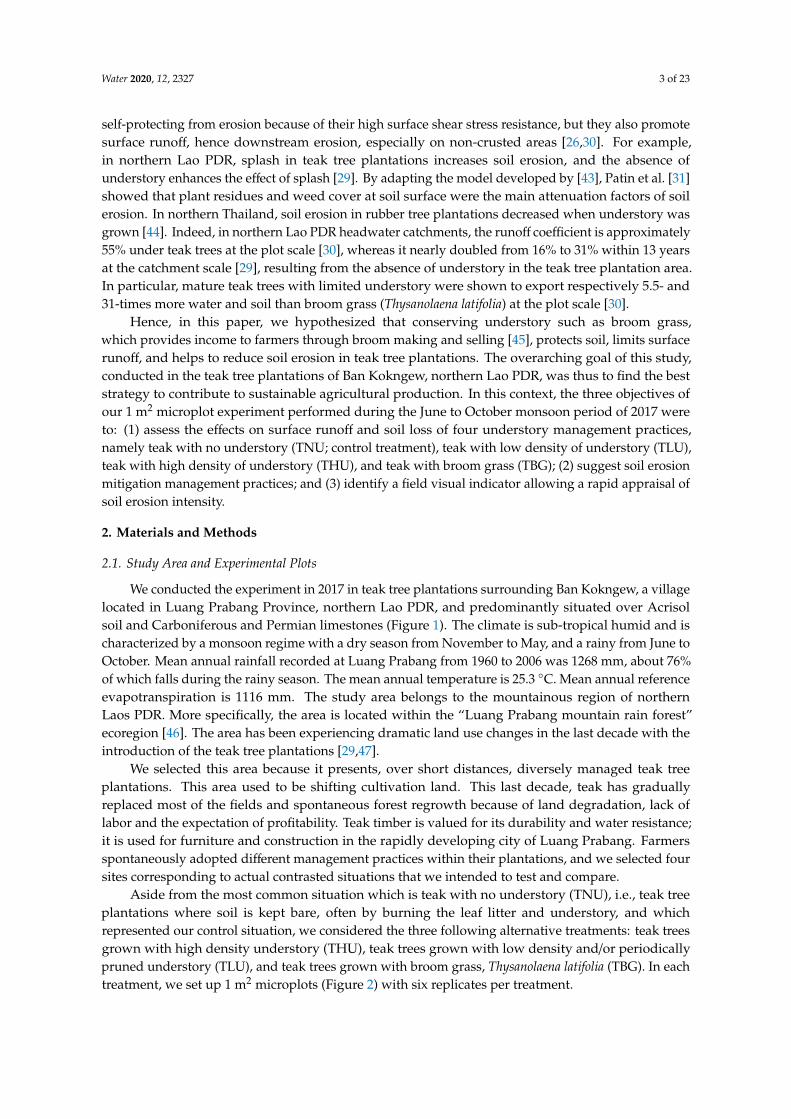
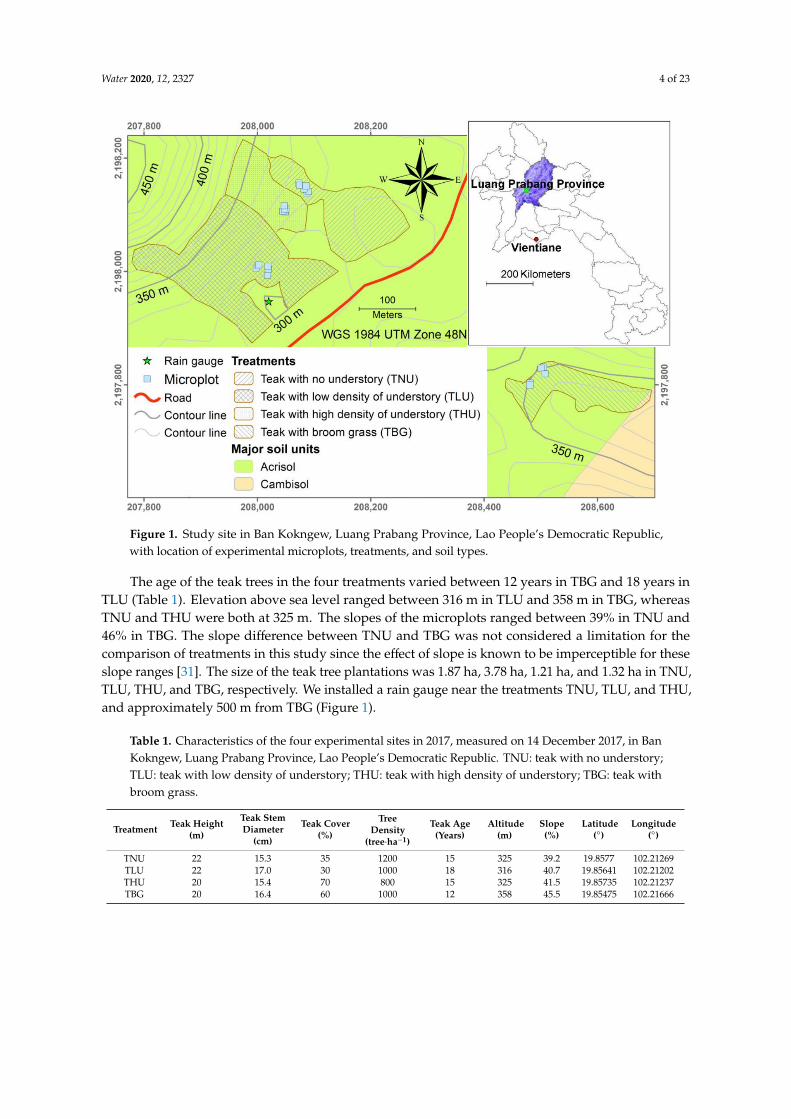
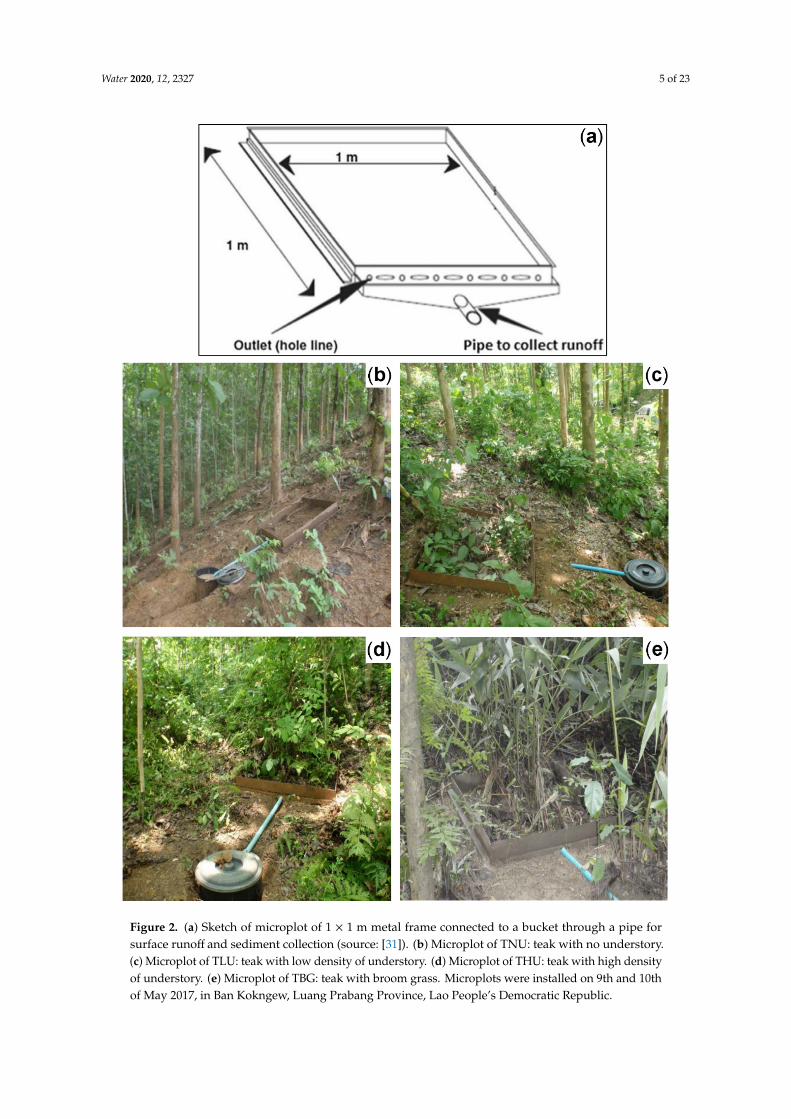
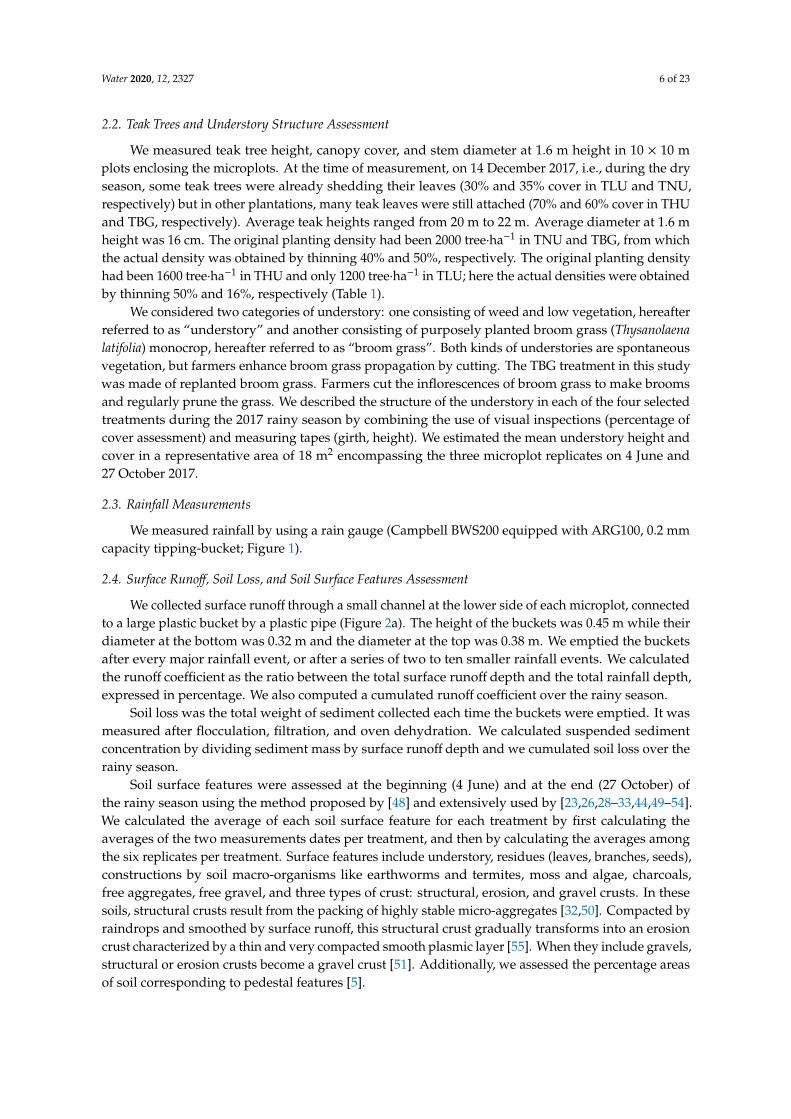
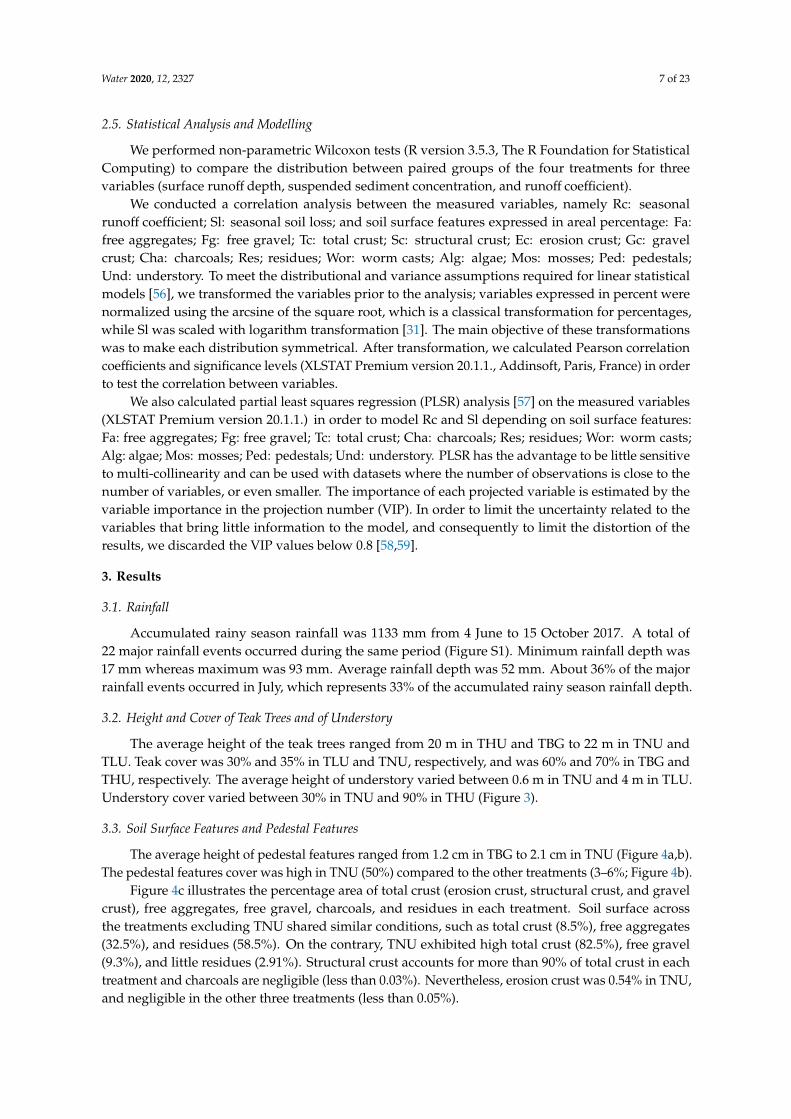
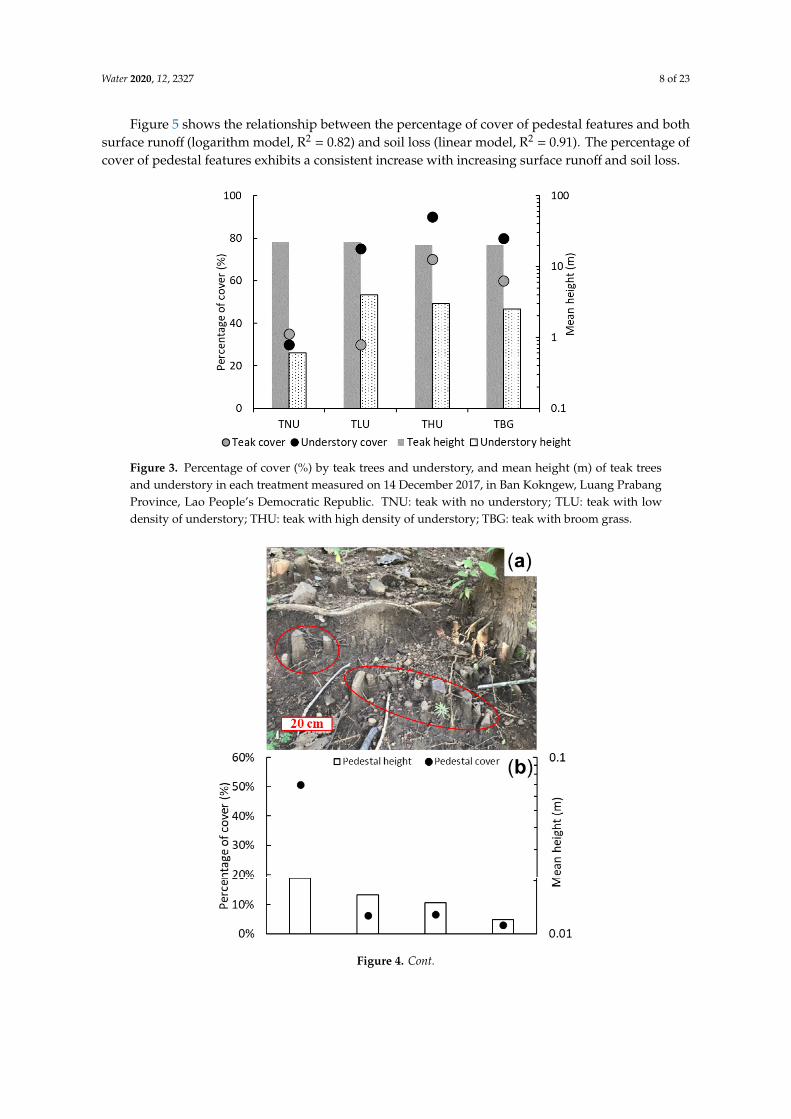
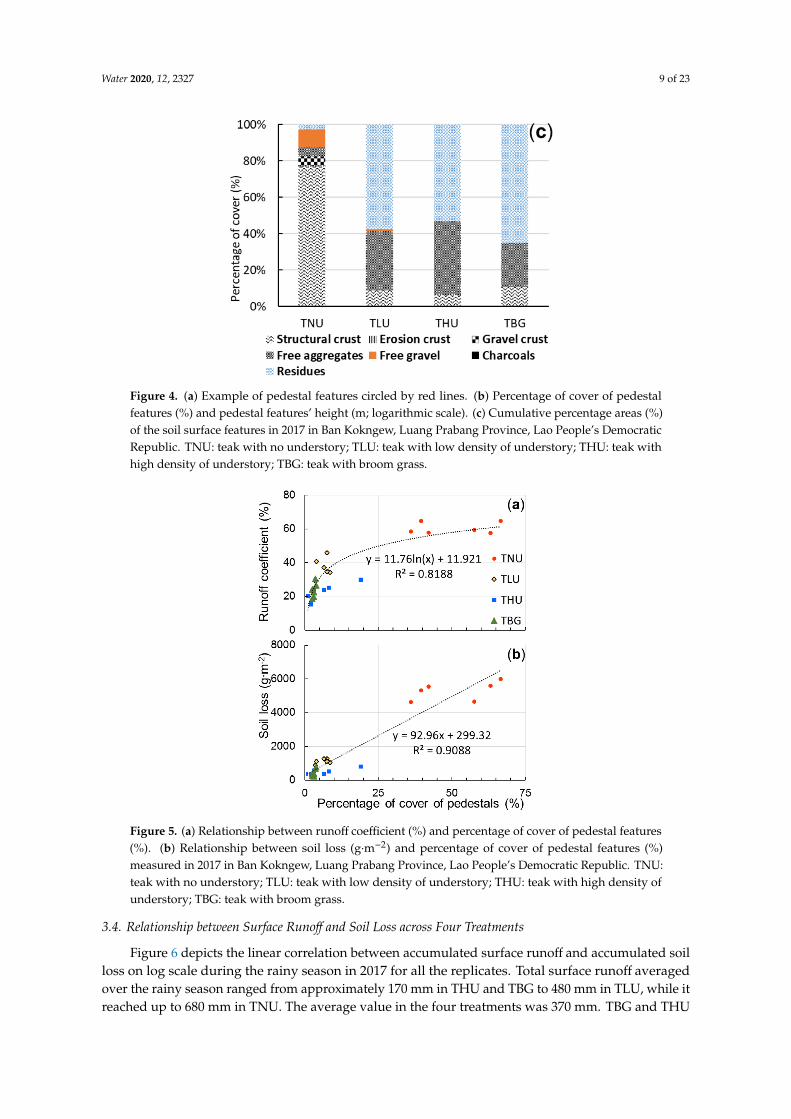
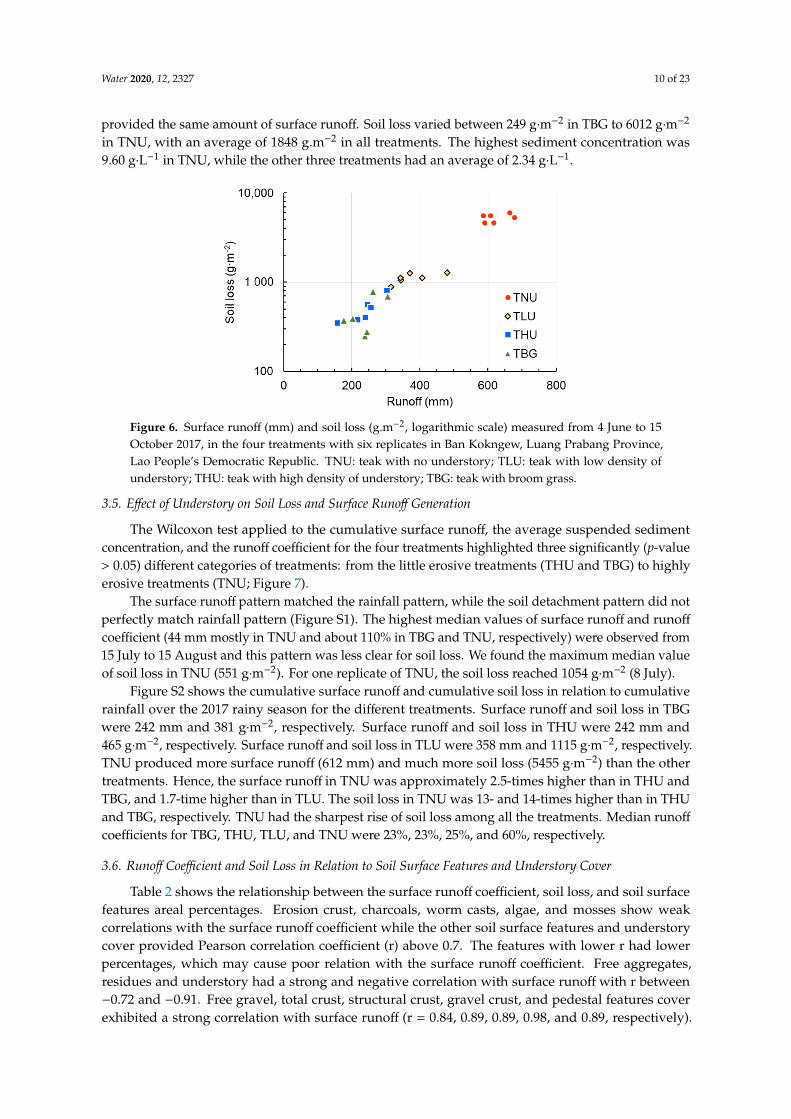
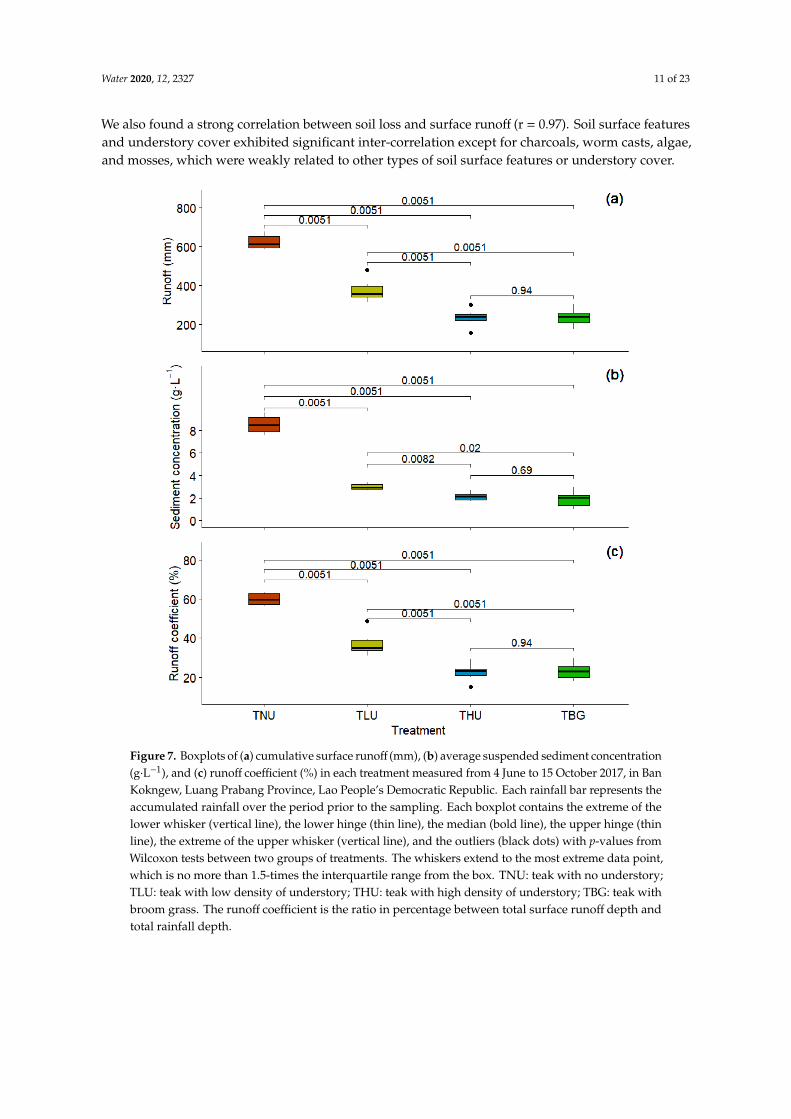
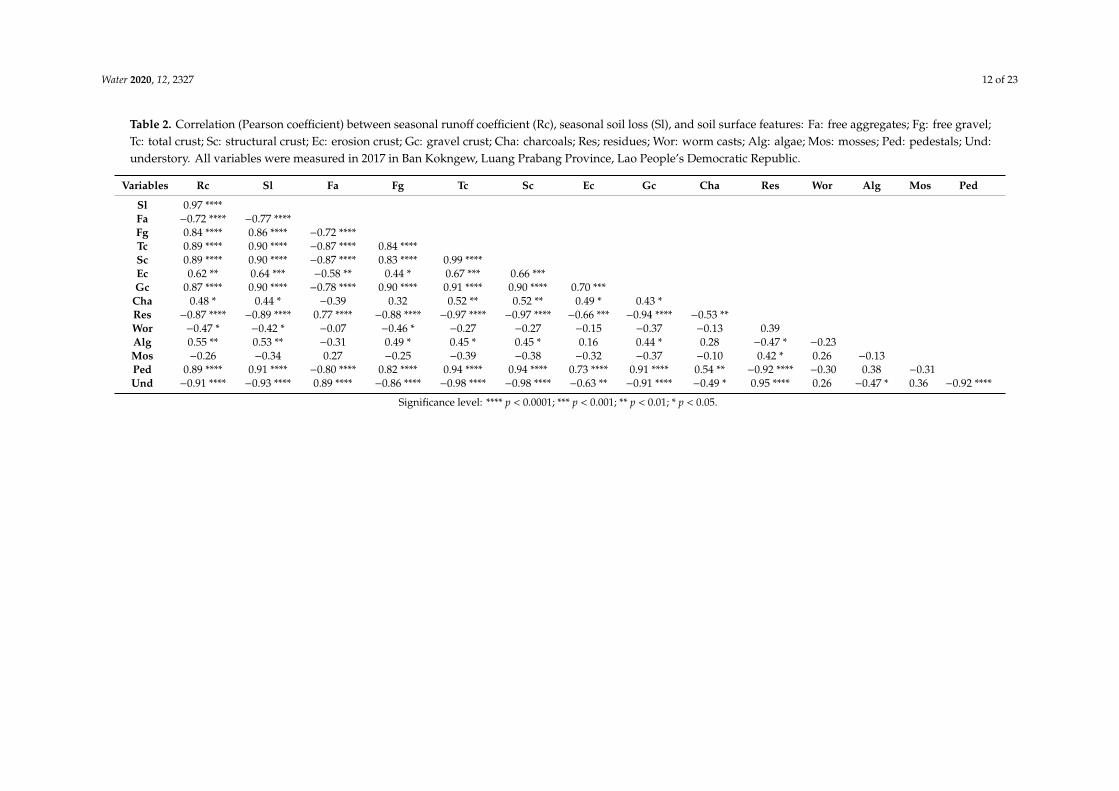
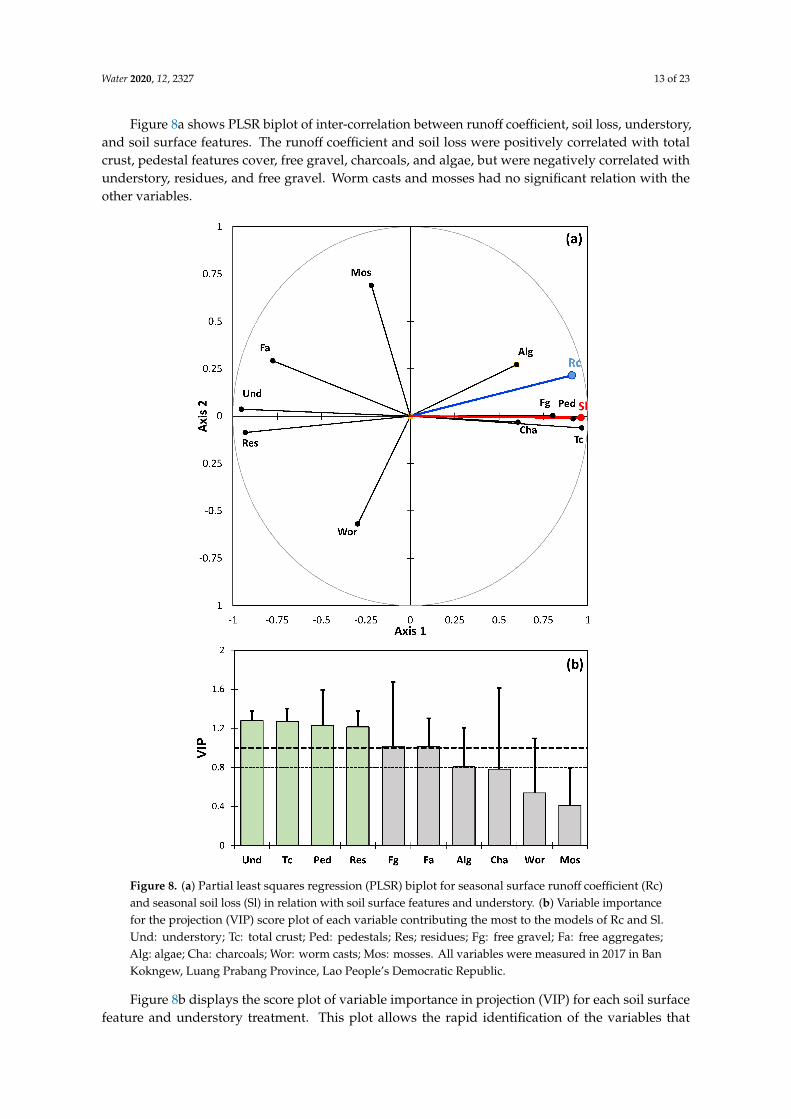
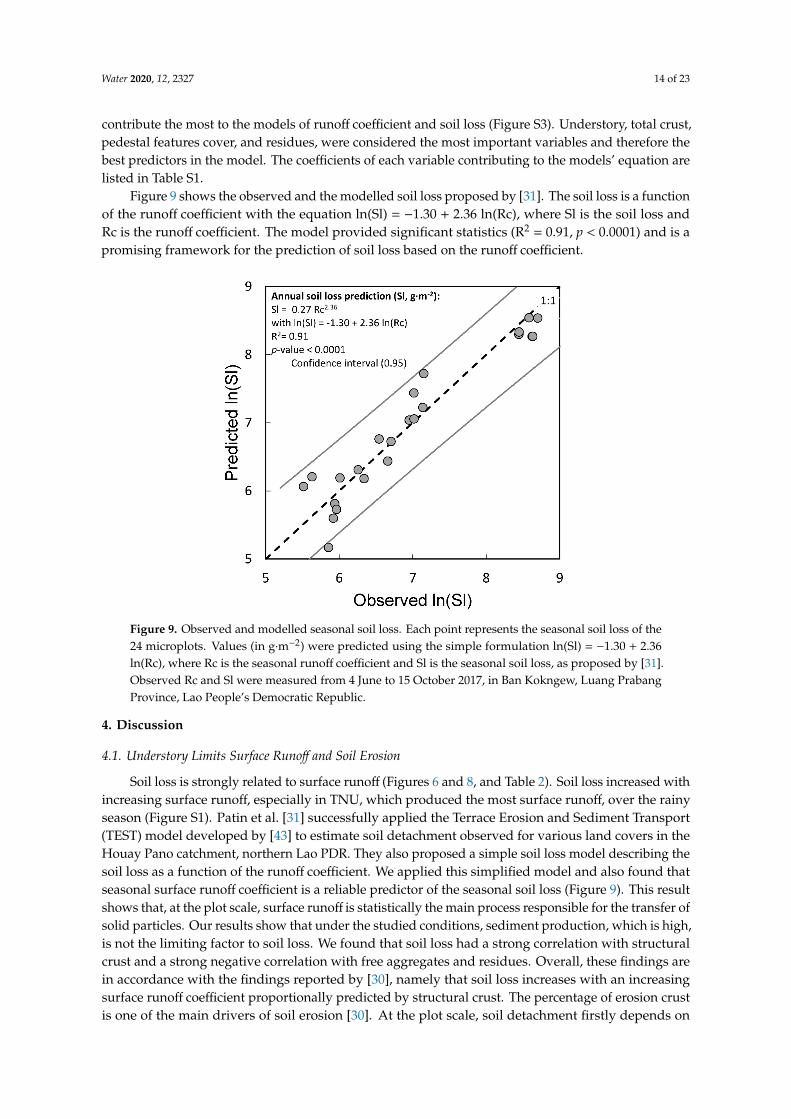
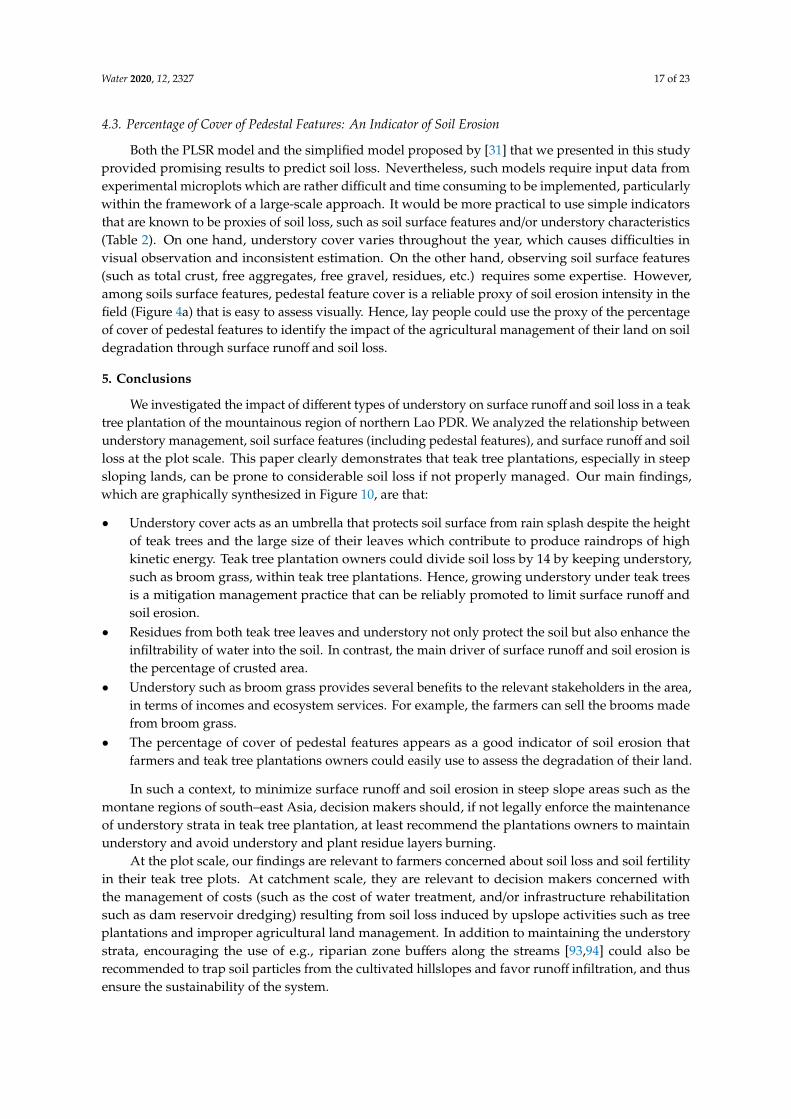
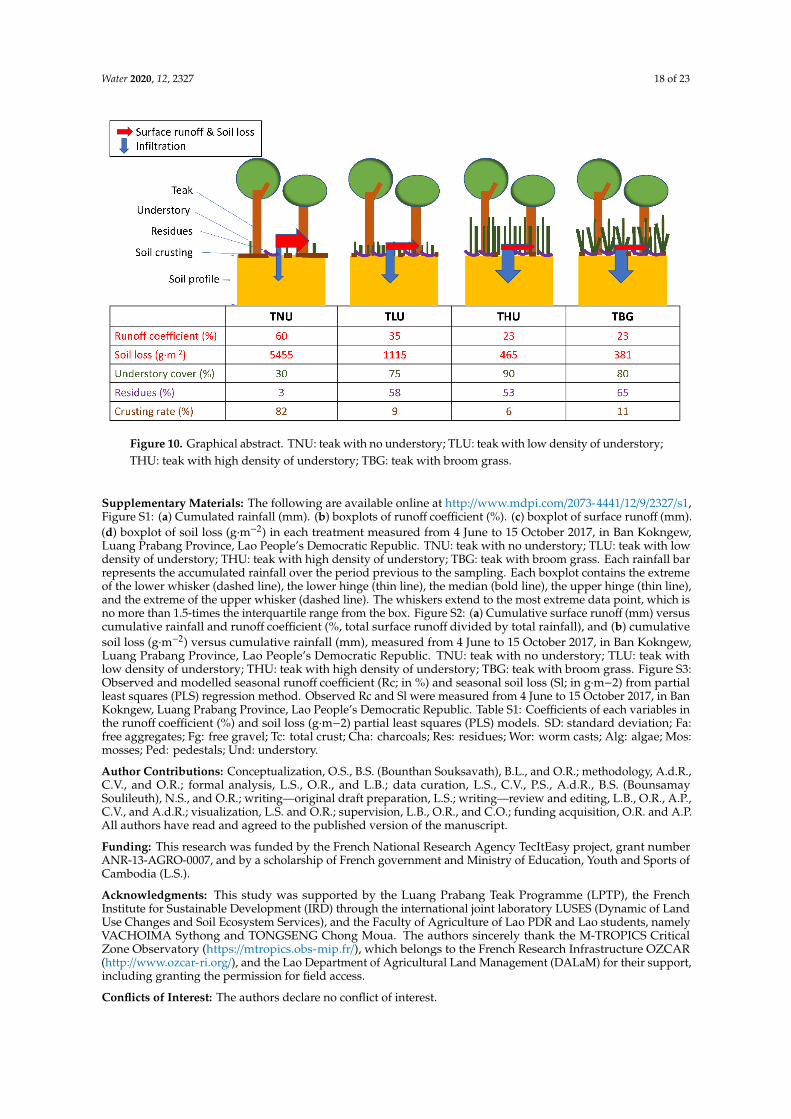


