Embed Size (px)
Citation preview

Antonio Rosas,Markus Bastir,CayetanaMartınez-Maza andJose Marıa Bermudezde CastroDepartment of Paleobiology,Museo Nacional de CienciasNaturales, Jose G. Abascal 2,28006 Madrid, Spain.E-mail: [email protected]
Received 18 August 2001Revision received 21 June2001Accepted 28 November2001 and publishedelectronically 8 February2002
Keywords: sexual dimorphism,mandible, H. heidelbergensis,Middle Pleistocene,Atapuerca.
Sexual dimorphism in the Atapuerca-SHhominids: the evidence from themandibles
The pattern of sexual dimorphism in 15 mandibles from theAtapuerca-SH Middle Pleistocene site, attributed to Homo heidelber-gensis, is explored. Two modern human samples of known sex areused as a baseline for establishing sexing criteria. The mandiblewas divided for analysis into seven study regions and differentialexpression of sexual dimorphism in these regions is analysed. A totalof 40 continuous and 32 discrete variables were scored on themandibles. The means method given in Regh & Leigh (Am. J. phys.Anthrop. 110, 95–104, 1999) was followed for evaluating the potentialof correct sex attribution for each variable.
On average, the mandibles from the Atapuerca-SH site present adegree of sexual dimorphism about eight points higher than inH. sapiens samples. However, mandibular anatomy of the EuropeanMiddle Pleistocene hominid records sexual dimorphism differen-tially. Different areas of the Atapuerca-SH mandibles exhibit quitedistinct degrees of sexual dimorphism. For instance, variables of thealveolar arcade present very low or practically no sexual dimorphism.Variables related to overall size of the mandible and symphysis regionpresent a medium degree of sex differences. Finally, ramus height,and gonion and coronoid process present a high degree of sexualdimorphism (indexes of sexual dimorphism are all above 130%).Whether this marked sexual dimorphism in specific anatomicalsystems affects sexual differences in body size is not completely clearand further studies are needed.
Sexual differences detected in the mandible of modern humanshave at least two components: differences related to musculo-skeletaldevelopment and differences related to a different growth trajectoryin males and females (relative development of some of the basalborder features). The Atapuerca-SH mandibles display little variationin the basal border, however. The limited variation of this mandibularregion may indicate that the pattern of sexual variation in H.heidelbergensis is different enough to that of H. sapiens to cautionagainst simple extrapolation of criteria from one pattern to the other.
� 2002 Elsevier Science Ltd.
Journal of Human Evolution (2002) 42, 451–474doi:10.1006/jhev.2001.0536Available online at http://www.idealibrary.com on
Introduction
There is a longstanding debate in paleo-anthropology regarding whether or not vari-ous species of Homo had a degree of sexualdimorphism higher than or similar tothat of modern humans (Wolpoff, 1980;Lieberman et al., 1988; Arsuaga et al.,
0047–2484/02/040451+24$35.00/0
1997). This matter is important becausedifferences in the degree of sexual dimor-phism could imply significant biological dif-ferences in social structure (see, however,Plavcan, 2000). Moreover, sex differences inmortality patterns can be reflected bythe composition of males and femalesin a skeletal sample. At the taxonomic
� 2002 Elsevier Science Ltd.

452 . ET AL.
level, identifying the patterns of sexualdimorphism in fossil hominids is essentialfor evaluating morphological variabilitywithin samples, taxonomic assessment, aswell as the potential ecological con-ditions under which these species wereliving (Clutton-Brock & Harvey, 1977;Leutenegger & Kelly, 1977; Borgognini &Repetto, 1986; Pickford, 1986; Plavcan &van Shaik, 1992; Molleson & Cox, 1993).
European Middle Pleistocene populationshave been believed to have been moredimorphic than modern humans (Lumley &Lumley, 1973; Wolpoff, 1980, 1999).These sexual differences might account, atleast in part, for the high level of variationdetected in these samples. The discovery ofthe extensive hominid sample in the Sima delos Huesos (SH) site at Atapuerca (Spain),which is considered to belong to a singlebiological population (Bermudez de Castro,1988; Arsuaga et al., 1997; Carreteroet al., 1997; Rosas, 1997), offers the oppor-tunity to evaluate different aspects of vari-ation in Middle Pleistocene populations.Specifically, the Atapuerca-SH sample isattributed to the species H. heidelbergensis(Arsuaga et al., 1991; Rosas & Bermudez deCastro, 1998).
Patterns of variation in the Atapuerca-SHhuman fossil remains have been explored inprevious studies (Bermudez de Castro et al.,1993; Rosas, 1995; Arsuaga et al., 1997;Lorenzo et al., 1998; Bermudez de Castroet al., 2001). In particular, Rosas (1997)studied the pattern of mandibular variationin the SH sample and a systematic relation-ship between size and shape was found.However, the specific pattern of sexualdimorphism has not been fully con-sidered. The sample of mandibles fromAtapuerca-SH site, as representative of aEuropean Middle Pleistocene population, ishere explored with the aim of determiningthe pattern and degree of sexual dimor-phism. The study is organized in two steps.First, we search for morphological criteria
for sexing human mandibles in order tobuild a reference sample for fossil studies.And second, we explore the degree ofsexual dimorphism in the Atapuerca-SHmandibular sample.
The mandible is a good anatomical sys-tem for exploring the manner in whichsex-related morphological processes areexpressed in the skeleton. The mandible isthe last skull bone to cease growth, andbecause of that it is sensitive to the adoles-cent growth spurt (Randly, 1988; Enlow &Hans, 1996). Furthermore, the mandible isa complex anatomical structure composedof several units whose determinants are ofdifferent nature (Moss & Rankow, 1968;Atchley & Hall, 1991). On the whole, themandible is considered a reasonably goodskeletal element for sexual diagnosis. Theaccuracy of sex determination ranges from75% to 99% of accuracy (Giles, 1964;Hanihara, 1996; Loth & Henneberg, 1996),though there is a current debate about thevalidity of some of the features—ramusflexion—producing very high percentages ofgood classification (Koski, 1996; Donnellyet al., 1998; Haun, 2000; Hill, 2000).
Materials and methods
Up to the 2000 field season, a total of 29mandibular specimens have been recoveredat the Atapuerca-SH site, as part of a largehominid fossil sample of more than 3000specimens. The fossil hominid samplerecovered at the Atapuerca-SH site may beolder than 320,000 (Bischoff et al.,1997), though recent studies suggest an agebetween 325 to 205 ka (Pares et al., 2000).At present, a conservative minimum numberof 27 individuals have been identified in theAtapuerca-SH sample (Bermudez de Castroet al., 2001). We have estimated the sex of15 SH individuals on the basis of theirmandibular remains. From them, 13 indi-viduals show fully erupted third molars,

453 -
whereas in two individuals these teeth wereat gingival emergence (Table 1). The mor-phological areas preserved for each individ-ual vary from one specimen to another,ranging from nearly complete specimens tofragments of mandibular body or ramus(Table 1).
Two modern human samples have beenused as a baseline for sex diagnosis. Themain sample comes from the identifiedskeletal collection housed at the MuseoAntropologico of the Universidade deCoimbra (Portugal) (n=243 specimens, 115females and 128 males for discrete variables;n=233, 110 females and 123 males forcontinuous variables). A sample of 72adult specimens of known sex from theSpitalfields sample (London) (Molleson &Cox, 1993) was also considered.
A total of 40 continuous variableswas measured following Rosas (1995).Measurements defined linear distancesbetween anthropometric points of the man-dible (see Table 2 for definition). The con-ventional height and thickness of themandibular body were taken at three differ-ent positions: symphysis, mental foramen
and third molar. Height of the mandibularbody was taken between the basal borderand the alveolar border keeping the callipersparallel to the external side of the mandibu-lar body. Thickness was measured betweenthe external side of the mandibular bodyand the most prominent point of theinternal side for each particular position.Distances from the mental foramen to thebasal border and alveolar border were alsotaken.
Descriptive statistics were computed forall variables (StatSoft, 1996). FollowingLeigh & Jungers, 1994, two-way unbalancedANOVAs and MANOVA were computed(StatSoft, 1996), in order to evaluatewhether or not the patterns of sexual dimor-phism vary significantly among the modernreference samples. PCA and stepwise dis-criminant analysis were also carried out withthe aim of selecting variables with a higherdiscriminatory potential.
Once the sex of the Atapuerca-SH speci-mens was attributed, the question ofwhether the patterns of sexual dimorphismwas similar or not in the mandible of H.sapiens and H. heidelbergensis was explored
Table 1 Atapuerca-SH mandibular sample including the specimens considered in the study
Specimen Individual* Preserved area
AT-1 I Mandibular copus without ramiAT-3 III Fragment left side of the mandibular bodyAT-75 VI Fragment right side of the mandibular bodyAT-172+AT-301+AT-508 X Fragments right and left of the mandibular bodyAT-250+AT-793 IV Left side mandibular bodyAT-300 XII Right side of the mandibular bodyAT-505+AT-604+AT-952 XIX Nearly complete mandibleAT-605 XXII Mandible. Right ramus missingAT-607+AT-771 XXIII Mandible. Left ramus missingAT-792 XXVII Mandibular copus without ramiAT-888 XXI Complete mandible less left ramusAT-950 XXXI Complete mandibleAT-1775 XXVI Left side of the mandibular bodyAT-1957 VII Right side of the mandibular bodyAT-2193+AT-2439 XV Symphisis and right side of the mandibular body
*After Bermudez de Castro et al. (2001).

454 . ET AL.
Table 2 Set of measurements employed in the study defined as linear distances between landmarks ofthe mandible*
Variable Abbreviation Definition
VAR1 C-C Bi-canine widthVAR2 M1-M1 Bi-molar widthVAR3 M3-M3 Bi-molar widthVAR4 COR-COR Bi-coronoid widthVAR5 CON-CON Bi-condyle widthVAR6 GON-GON Bi-gonion width. Bigonial widthDiagonals of the mandibleVAR7 IN-C Distance incision-canineVAR8 IN-M1 Distance incision-first molarVAR9 IN-M3 Distance incision-third molarVAR10 IN-COR Distance incision-vertex of the coronoid processVAR11 GNA-GON Distance gnation-gonionVAR12 GNA-CON Distance gnation-condyle. Maximum length of the mandibleDiagonals of the ramusVAR13 COR-GON Distance vertex of the coronoid process-gonionVAR14 CON-M3 Distance condyle-third molarDiagonals of the mandibular corpusVAR15 IN-GON Distance incision-gonionVAR16 GNA-M3 Distance gnation-third molarPerimeters of the ramusVAR17 COR-CON Distance vertex of the coronoid process-condyleVAR18 CON-GON Distance condyle-gonionVAR19 GON-M3 Distance gonion-third molarVAR20 M3-COR Distance third molar-vertex of the coronoid processVAR21 IN-GNA Distance incision-gnation. Height of the symphysisDistances from the mandibular foramen (ascending ramus)VAR22 LIN-COR Distance Lingula mandibulae-vertex of the coronoid processVAR23 LIN-CON Distance Lingula mandibulae-condyleVAR24 LIN-GON Distance Lingula mandibulae-gonionVAR25 LIN-M3 Distance Lingula mandibulae-third molarDistances from the mental foramen (mandibular body)VAR26 FOR-M3 Distance mental foramen-third molarVAR27 FOR-GON Distance mental foramen-gonionVAR28 FOR-IN Distance mental foramen-incisionVAR29 FOR-GNA Distance mental foramen-gnationOther variablesVAR32 Position of the mental foramen. Distance mental foramen-basal borderVAR33 Position of the mental foramen. Distance mental foramen-alveolar borderVAR34 Height of the corpus at the level of the mental foramen
VAR35Thickness of the corpus at the level of the third molar at the level of themental foramen
VAR36 Height of the corpus at the level of the third molarVAR37 Thickness of the corpus at the level of the third molarVAR38 Depth of the sigmoid notch
VAR39Length of the coronoid process (from vertex of the coronoid process to lowestpoint of the sigmoidal notch).
VAR40 Length of the condyleVAR41 Width of the condyleVAR42 Breadth of the ramus
*Anthropometric points defined as follows. IN: Incision, point between central incisor sockets at the external sideof the alveolar margin; GNA: Gnathion, the most basal point of the symphysis; C, M1, M3: located at thebucco-distal corner of the canine (C), first molar (M1) and third molar (M3) sockets respectively; FOR: mentalforamen, most posterior point of the foramen; COR: vertex of the coronoid process; CON: medial point of thecondyloid process taken at the point of contact of the articular surface with the neck condyle at its posterior side;GON: Gonion, point on the gonial perimetrum which crosses the bisectrix of the angle defined by the tangents tothe posterior margin of the ramus and the basal border, LIN, the most promient point at the lingula mandibulae orequivalent point in the posterior area of the mandibular foramen.

455 -
by means of MANOVAs. Given the frag-mentary nature of the fossils, the mandiblewas divided into seven study regions definedby a number of variables in order to explorepossible differences in the pattern of sexualdimorphism in different mandibular regions.The mandibular regions and the variablesincluded in each region are as follows:symphysis (VAR21, VAR28, and VAR29),region of the mental foramen (VAR32,VAR33, VAR34, and VAR35), region of thelateral prominence (protuberantia lateralis)(VAR36 and VAR37), the ramus (VAR13,VAR14, VAR17, and VAR18), gonion(VAR19, VAR24, and VAR27), coronoidprocess (VAR20, VAR22, and VAR39), andcondyloid process (VAR23, VAR41, andVAR42).
Thirty-two discrete variables wererecorded and explored in the Coimbrasample in order to determine which of themshowed statistical differences between sexes.Two or three categories were considered foreach character. In symmetric features, onlyright side score was used in this study (seeTable 3). Chi-square tests were employedfor testing sex-differences in the Coimbrasample. Those variables showing significantsex differences were then explored in the SHsample. Note that the reported probabilitiesare not ‘‘protected’’, that is, they are notcorrected for multiplicity. The large numberof significance tests in this study thusincreases the chance of making Type Ierrors.
The means method given in Regh & Leigh(1999) was followed for evaluating thepotential of correct sex attribution for eachvariable. According to Regh & Leigh(1999), ‘‘the means method involves deter-mining the mean of a pooled or unknowndistribution, then splitting the sample at thisvalue into a set greater than the mean and aset lesser than the mean. For primates, the‘greater-than’ set presumably representsmales, and the ‘lesser-than’ set representsfemales.’’
Results
Continuous variablesDescriptive statistics of H. sapiens compara-tive samples, the pooled sample, and theAtapuerca-SH sample are given in Table 4.As expected, male means are in most vari-ables significantly higher than those of thefemales. Results of the unbalanced two-wayANOVAs are given in Table 5 andMANOVA results for sex and sample aregiven in Table 6. Sample differences aredetected between Coimbra and Spitalfieldsin a number of variables (Table 4), and thisis confirmed at the multivariate level(MANOVA, Table 6). Sex differences aredetected in all of the variables within thesamples, except for the corpus thickness atthe level of the mental foramen (VAR35).However, no difference in the degree ofsexual dimorphism is appreciated betweenthe samples. The interaction term in theANOVAs is not significant for most of thevariables, except for the distance LIN-CON(VAR23) and the distance FOR-M3(VAR26). At the multivariate level theinteraction term is also not significant(MANOVA, Table 6). According to Legh &Jungers (1994), ‘‘failure to find a statisticallysignificant interaction term (sex by popu-lation) implies that differences in the degreeof sexual dimorphism between groups arenot significant’’.
Percentages of correct sex attribution fol-lowing the means method are given in Table7. Variables with the highest correct sexattribution yield values close to or slightlyabove 80%. The rank of the variablesvaries in each sample. Nevertheless, whenvariables with a percentage of correct sexattribution above 70% are considered ageneral pattern emerge. On the whole, fouraspects of the mandible seem to express agreater sexual dimorphism. First, length ofthe mandible (represented by maximumlength of the mandible (VAR12) and lengthof the basal border (VAR11). Second,

456 . ET AL.
Tab
le3
Dis
cret
eva
riab
les
inth
eC
oim
bra
sam
ple
Cha
ract
erst
ate
Pea
rson
Chi
-squ
are
dfP
12
3F
emal
e/M
ale
Pos
itio
nof
alve
olar
arca
dein
rela
tion
toth
eba
sal
arca
de(1
:in
side
;2:
inte
rmed
iate
;3:
para
llel)
29/3
964
/49
22/3
97·
622
0·02
Bas
alpr
ofile
ofth
esy
mph
ysis
(1:
poin
ted;
2:sm
ooth
;3:
stra
ight
)35
/13
64/3
816
/77
56·1
82
0·00
0L
ater
altu
berc
les
ofth
ech
in(1
:ab
sent
;2:
med
ium
;3:
larg
e)13
/190
·83
12/4
428
·24
20·
000
Ant
erio
rba
sal
bord
er(1
:tr
iang
le;
2:pa
rabo
la;
3:sq
uare
)23
·486
·70
6·54
52·8
62
0·00
0In
curv
atio
man
dibu
lae
(1:
stra
ight
;2:
med
ium
;3:
curv
ed)
31/4
944
/62
39/1
616
·07
20·
000
Sha
peof
the
basa
lbo
rder
(lat
eral
)(1
:co
ncav
e;2:
sinu
ous;
3:st
raig
ht/c
onve
x)44
/21
55/8
616
/20
14·8
32
0·00
0P
laty
sma
atta
chm
ent
(1:
abse
nt;
2:pr
esen
t)25
/81
90/4
742
·50
10·
000
Pre
angu
lar
notc
h(1
:ab
sent
;2:
smoo
th;
3:m
arke
d)37
/18
54/5
622
/52
18·1
02
0·00
0R
elat
ion
betw
een
alve
olar
and
basa
lbo
rder
s(1
:pa
ralle
l;2:
slig
htly
dive
rgen
t;3:
dive
rgen
t)46
/32
37/3
732
/59
9·85
20·
007
Siz
eof
the
ante
rior
mar
gina
ltu
berc
le(A
MT
)(1
:ab
sent
;2:
med
ium
;3:
larg
e)44
/29
59/6
912
/30
10·9
12
0·00
4R
elat
ions
hip
betw
een
AM
Tan
dla
tera
ltu
berc
les
ofth
ech
in(1
:ab
sent
;2:
fuse
d;3:
inde
pend
ent)
44/2
935
/57
36/4
28·
132
0·01
7O
rien
tati
onof
the
AM
T(1
:su
peri
or;
2:la
tera
l;3:
infe
rior
)12
/22
57/7
11/
41·
952
0·37
Pos
itio
nof
the
AM
T(1
:I2
/I2-
C;
2:C
;3:
C-P
1/P
1)33
/33
25/3
513
/311
4·54
20·
10N
umbe
rof
the
men
tal
fora
min
a(1
:si
ngle
;2:
mul
tipl
e)11
3/12
12/
72·
361
0·12
Ori
enta
tion
ofth
em
enta
lfo
ram
en(1
:an
teri
or;
2:ce
ntra
l;3:
post
erio
r)3/
419
/16
93/1
080·
822
0·66
Ver
tica
lpo
siti
onof
the
men
tal
fora
men
(1:
abov
em
id-l
ine;
2:m
id-l
ine;
3:be
low
mid
-lin
e)4/
694
/98
16/2
41·
272
0·52
Hor
izon
tal
posi
tion
ofth
em
enta
lfo
ram
en(1
:C
-P3/
P3;
2:P
3-P
4/P
4;3:
P4-
M1/
M1)
3/4
108/
113
2/10
4·78
20·
09P
osit
ion
ofth
ela
tera
lpr
omin
ence
(1:
M1/
M1-
M2;
2:M
2;3:
M2-
M3/
M3)
6/7
83/8
520
/27
0·70
20·
70R
elie
fof
the
late
ral
prom
inen
ce(1
:ro
unde
d;2:
elon
gate
d;3:
fuse
d)38
/34
31/4
746
/47
2·82
20·
24S
hape
ofth
eex
tram
olar
sulc
us(1
:na
rrow
;2:
med
ium
;3:
wid
e)9/
3462
/64
44/2
917
·09
20·
000
Ext
erna
lgo
nion
relie
f(1
:un
defin
ed;
2:ro
unde
d;3:
squa
red)
38/1
657
/53
19/5
828
·24
20·
000
Lat
eral
goni
onpr
ofile
(1:
even
;2:
wri
nkle
d;3:
tube
rcul
ated
)30
/975
/69
9/49
38·5
52
0·00
0P
oste
rior
goni
onpr
ofile
(1:
stra
ight
/inve
rted
;2:
ever
ted;
3:si
nuou
s)87
/76
18/4
510
/712
·18
20·
002
Pos
itio
nof
the
man
dibu
lar
ram
usfle
xure
(1:
unde
fined
;2:
alve
olar
bord
er(A
B);
3:ab
ove
AB
)46
/33
28/7
741
/18
33·3
72
0·00
0S
hape
ofth
em
yloh
yioi
dlin
e(1
:sh
ort;
2:ob
lique
;3:
unev
en)
16/3
084
/87
15/1
14·
242
0·11
Sha
peof
the
lingu
la(1
:ab
sent
;2:
roun
d;3:
poin
ted)
8/21
52/5
454
/53
5·08
20·
07A
nter
ior
bord
erof
the
ram
uspr
ofile
(1:
stra
ight
;2:
conc
ave;
3:si
nuou
s)33
/32
57/8
324
/12
8·16
20·
01S
ize
ofth
eco
rono
idpr
oces
s(1
:st
anda
rd;
2:lo
w;
3:ta
ll)74
/65
22·1
919
/44
10·0
52
0·00
6O
rien
tati
onof
the
coro
noid
proc
ess
(1:
stan
dard
;2:
vert
ical
;3:
post
erio
r)71
/58
29/4
312
/22
6·47
20·
03R
elat
ion
betw
een
cond
yle
and
coro
noid
proc
ess
(1:
stan
dard
;2:
dive
rgen
t;3:
sym
met
ric)
58/9
119
/20
38/1
615
·74
20·
000
Con
dyle
posi
tion
(1:
late
ral;
2:ec
cent
ric;
3:ce
ntra
l)81
/93
33/3
30·
221
0·63
Sha
peof
the
cond
yle
(1:
stan
dard
;2:
roof
;3:
othe
rs)
66/7
527
/37
21/1
33·
522
0·17
The
num
ber
ofca
ses
for
each
cate
gory
and
sex
isin
the
char
acte
rst
ate
colu
mn.

457 -
breadth of the mandible (mainly representedby bi-gonial breadth (VAR6) and bi-condilar breadth (VAR5). Third, the heightof the mandible. This can be appreciated
both at the level of the ramus (measuredfrom gonion to coronoid process—VAR13—and from gonion to condyle—VAR18), and at the level of the corpus
Table 4 Descriptive statistics of the continuous variables in the reference H. sapiens samples andAtapuerca-SH (H. heidelbergensis) sample
Coimbra Spitalfields Pooled sample Atapuerca
Mean S.D. Mean S.D. Mean S.D.
Mean nf m f m f m f m f m f m
VAR1 30·7 31·7 2·1 2·0 29·9 31·5 2·1 2·4 30·0 31·2 2·0 2·2 36·7 7VAR2 52·7 54·4 2·7 2·2 52·7 54·7 3·3 3·2 52·4 54·3 2·7 2·9 59·5 7VAR3 62·3 64·4 2·6 3·0 63·3 67·2 3·1 3·9 62·7 65·4 2·9 3·8 71 6VAR4 89·8 95·2 4·2 5·3 91·3 98·3 5·2 6 90·3 96·9 4·7 5·2 102·1 2VAR5 109·0 115·6 5·6 5·6 109·4 117·5 5·1 6·8 109·4 116·9 5·0 5·5 130·2 2VAR6 90·0 97·6 5·0 6·2 89·9 99·4 5·9 6·4 89·8 98·3 5·3 6·7 99·3 5VAR7 16·2 16·7 1·2 1·1 15·5 15·9 1·1 1·4 15·8 16·4 1·1 1·3 19·2 9VAR8 37·2 38·1 1·7 2·0 36·2 37 2·3 1·6 36·9 37·7 1·9 2·0 40·3 9VAR9 54·9 56·2 2·2 2·7 53·8 55·3 3·2 3·9 54·6 56·0 2·9 3·3 60·7 8VAR10 78·1 83·0 4·4 4·8 78·1 83·1 8·6 4·6 78·6 83·2 4·7 4·7 95·8 3VAR11 77·4 81·9 3·8 4·0 77·7 81·6 4 5 77·4 82·0 3·8 4·2 90·3 5VAR12 114·7 121·6 5·0 4·9 114·3 122·9 4·9 5·2 114·3 122·6 4·7 4·5 125·7 7VAR13 55·0 61·5 5·4 5·6 56·6 63·7 4·9 5·8 55·8 62·5 5·2 5·8 65·3 5VAR14 53·4 57·0 3·8 4·1 53·9 57·2 3·9 4·7 53·6 58·1 3·7 3·7 66·7 7VAR15 79·4 83·9 3·7 4·6 77·3 82·3 4·2 4·6 79·0 83·9 4·2 4·8 103·4 9VAR16 61·3 64·8 2·9 3·3 60·9 66 3·3 6·1 61·2 64·7 3·0 4·4 59 10VAR17 34·6 35·8 3·1 3·7 33·8 35·9 3·2 3·7 34·5 36·3 3·2 3·4 41·3 4VAR18 56·2 61·8 4·5 5·3 58·5 66·1 4·5 5·2 57·0 63·7 4·4 5·3 58 6VAR19 29·4 33·3 3·2 3·4 29·3 33·6 3·4 3·7 29·8 33·7 3·2 3·5 44·7 5VAR20 37·8 42·1 4·4 4·5 39·5 42·9 4·6 4·1 38·3 42·6 4·7 4·4 43·7 4VAR21 29·2 32·1 2·8 2·9 28·2 32 2·6 2·4 28·7 32·2 2·6 2·8 33·8 11VAR22 29·4 32·3 3·2 3·2 30·2 32 2·7 3·9 29·8 32·3 3·2 3·5 32·8 5VAR23 34·9 36·8 2·3 2·4 33·7 36·8 3·6 5·5 34·6 37·1 2·9 2·6 36·9 7VAR24 28·1 31·9 3·2 3·9 29·2 34·5 4·1 3·7 28·5 33·2 3·4 3·8 31·5 6VAR25 19·7 21·6 2·8 3·2 22·1 22·3 5·3 5·2 20·7 22·4 3·9 3·5 32·8 7VAR26 38·2 39·4 2·9 3·0 36·5 39·3 3·7 3 37·5 39·0 3·1 3·0 34·5 9VAR27 55·2 58·5 3·4 3·8 53·2 56·7 4·5 3·8 54·5 58·2 3·9 3·9 67·7 4VAR28 28·3 29·6 2·1 2·5 28 29·2 1·8 3·2 28·2 29·7 2·1 2·8 38·5 11VAR29 26·9 28·4 1·7 1·9 28 29·5 1·8 2·2 27·1 28·8 1·8 2·2 30·1 11VAR32 12·9 14·0 1·4 1·5 13·1 13·9 1·6 1·6 12·9 14·1 1·5 1·6 12·6 12VAR33 15·1 16·5 2·3 2·3 13·2 14·7 2·3 2·6 14·4 15·9 2·4 2·6 19·2 12VAR34 28·2 30·8 2·7 2·5 27·6 30·1 2·6 3·2 27·9 30·7 2·5 2·7 31·5 16VAR35 10·6 11·3 1·3 1·3 11 11·7 1·2 1·4 10·7 11·5 1·3 1·3 16·2 16VAR36 23·5 25·1 2·6 2·6 22 24·9 2·6 4·2 23·0 25·1 2·7 3·3 29·9 11VAR37 14·7 14·7 1·5 1·7 13·6 14·2 1·5 1·8 14·3 14·6 1·6 1·7 17·3 11VAR38 12·4 13·8 1·7 1·7 13·1 14·2 2 2 12·8 14·1 1·7 1·8 11·7 3VAR39 16·5 18·4 2·2 2·6 16·9 18 2·5 2·9 16·9 18·5 2·2 2·5 20·8 3VAR40 18·0 19·6 1·9 1·9 18·9 20·8 1·6 1·7 18·3 20·1 1·8 1·9 24·8 5VAR41 8·2 8·4 1·0 0·9 8·2 8·7 1 0·8 8·2 8·6 1·0 0·8 10·2 5VAR42 29·6 31·1 2·7 2·6 30·1 31·1 2·6 2·5 42·4 5
Coimbra (females, n=115; males, n=128).Spitalfields (females, n=38; males, n=34).Pooled sample (females, n=153; males, n=162).

458 . ET AL.
Table 5 Results of unbalanced two-way ANOVAs for H. sapiens comparative samples with Coimbra(Portugal) and Spitalfields (England)
Effects df Effect MS Effect df Error MS Error F P-level Significancea
VAR1 Sample 1 0·39 171 4·60 0·08 0·771 nsSex 1 62·94 171 4·60 13·69 0·000 ***
Sex�sample 1 2·82 171 4·60 0·61 0·434 nsVAR2 Sample 1 8·50 140 7·98 1·07 0·304 ns
Sex 1 107·42 140 7·98 13·47 0·000 ***Sex�sample 1 0·07 140 7·98 0·01 0·926 ns
VAR3 Sample 1 116·62 135 10·83 10·77 0·001 **Sex 1 291·03 135 10·83 26·88 0·000 ***
Sex�sample 1 27·19 135 10·83 2·51 0·115 nsVAR4 Sample 1 105·60 166 23·97 4·41 0·037 *
Sex 1 1651·20 166 23·97 68·88 0·000 ***Sex�sample 1 1·84 166 23·97 0·08 0·782 ns
VAR5 Sample 1 8·07 167 28·26 0·29 0·594 nsSex 1 2175·92 167 28·26 76·99 0·000 ***
Sex�sample 1 6·07 167 28·26 0·21 0·644 nsVAR6 Sample 1 27·67 172 37·48 0·74 0·391 ns
Sex 1 2931·76 172 37·48 78·21 0·000 ***Sex�sample 1 21·48 172 37·48 0·57 0·450 ns
VAR7 Sample 1 10·71 168 1·34 8·02 0·005 **Sex 1 10·10 168 1·34 7·56 0·007 **
Sex�sample 1 0·99 168 1·34 0·74 0·392 nsVAR8 Sample 1 28·97 144 3·77 7·68 0·006 **
Sex 1 17·76 144 3·77 4·71 0·032 *Sex�sample 1 0·34 144 3·77 0·09 0·765 ns
VAR9 Sample 1 46·47 138 9·58 4·85 0·029 *Sex 1 61·25 138 9·58 6·40 0·013 *
Sex�sample 1 1·00 138 9·58 0·10 0·747 nsVAR10 Sample 1 14·07 167 22·00 0·64 0·425 ns
Sex 1 675·94 167 22·00 30·73 0·000 ***Sex�sample 1 16·98 167 22·00 0·77 0·381 ns
VAR11 Sample 1 0·06 171 16·30 0·00 0·951 nsSex 1 716·29 171 16·30 43·95 0·000 ***
Sex�sample 1 7·07 171 16·30 0·43 0·511 nsVAR12 Sample 1 1·90 172 21·20 0·09 0·765 ns
Sex 1 2605·81 172 21·20 122·9 0·000 ***Sex�sample 1 2·49 172 21·20 0·12 0·732 ns
VAR13 Sample 1 70·23 170 30·39 2·31 0·130 nsSex 1 1728·44 170 30·39 56·87 0·000 ***
Sex�sample 1 2·09 170 30·39 0·07 0·794 nsVAR14 Sample 1 7·09 157 13·67 0·52 0·473 ns
Sex 1 611·64 157 13·67 44·73 0·000 ***Sex�sample 1 27·19 157 13·67 1·99 0·160 ns
VAR15 Sample 1 221·68 169 19·65 11·28 0·001 **Sex 1 879·20 169 19·65 44·75 0·000 ***
Sex�sample 1 0·52 169 19·65 0·03 0·871 nsVAR16 Sample 1 16·11 154 14·52 1·11 0·294 ns
Sex 1 534·57 154 14·52 36·81 0·000 ***Sex�sample 1 48·16 154 14·52 3·32 0·071 ns
VAR17 Sample 1 24·48 171 10·69 2·29 0·132 nsSex 1 133·77 171 10·69 12·51 0·001 **
Sex�sample 1 1·48 171 10·69 0·14 0·710 nsVAR18 Sample 1 303·01 173 22·46 13·49 0·000 ***
Sex 1 1877·88 173 22·46 83·61 0·000 ***Sex�sample 1 11·85 173 22·46 0·53 0·469 ns

459 -
Table 5 Continued
Effects df Effect MS Effect df Error MS Error F P-level Significancea
VAR19 Sample 1 7·71 162 11·33 0·68 0·411 nsSex 1 574·52 162 11·33 50·73 0·000 ***
Sex�sample 1 3·34 162 11·33 0·30 0·588 nsVAR20 Sample 1 45·81 169 20·56 2·23 0·137 ns
Sex 1 601·03 169 20·56 29·24 0·000 ***Sex�sample 1 16·79 169 20·56 0·82 0·367 ns
VAR21 Sample 1 10·23 171 7·39 1·38 0·241 nsSex 1 479·80 171 7·39 64·95 0·000 ***
Sex�sample 1 1·39 171 7·39 0·19 0·665 nsVAR22 Sample 1 0·45 171 11·45 0·04 0·843 ns
Sex 1 192·37 171 11·45 16·80 0·000 ***Sex�sample 1 10·69 171 11·45 0·93 0·335 ns
VAR23 Sample 1 3·26 172 7·27 0·45 0·504 nsSex 1 316·51 172 7·27 43·53 0·000 ***
Sex�sample 1 40·35 172 7·27 5·55 0·020*VAR24 Sample 1 76·99 172 12·74 6·04 0·015 *
Sex 1 908·92 172 12·74 71·33 0·000 ***Sex�sample 1 7·27 172 12·74 0·57 0·451 ns
VAR25 Sample 1 36·11 166 13·20 2·74 0·100 nsSex 1 67·58 166 13·20 5·12 0·025 *
Sex�sample 1 50·20 166 13·20 3·80 0·053 nsVAR26 Sample 1 9·92 164 9·19 1·08 0·300 ns
Sex 1 123·06 164 9·19 13·39 0·000 ***Sex�sample 1 37·12 164 9·19 4·04 0·046 *
VAR27 Sample 1 159·17 172 14·37 11·08 0·001 **Sex 1 493·69 172 14·37 34·35 0·000 ***
Sex�sample 1 0·17 172 14·37 0·01 0·915 nsVAR28 Sample 1 11·43 172 6·31 1·81 0·180 ns
Sex 1 71·62 172 6·31 11·34 0·001 **Sex�sample 1 0·88 172 6·31 0·14 0·709 ns
VAR29 Sample 1 49·00 171 3·79 12·94 0·000 ***Sex 1 103·96 171 3·79 27·46 0·000 ***
Sex�sample 1 0·85 171 3·79 0·23 0·636 nsVAR30 Sample 1 0·01 173 2·46 0·00 0·952 ns
Sex 1 44·55 173 2·46 18·11 0·000 ***Sex�sample 1 2·86 173 2·46 1·16 0·283 ns
VAR31 Sample 1 121·71 173 5·60 21·73 0·000 ***Sex 1 79·55 173 5·60 14·20 0·000 ***
Sex�sample 1 0·12 173 5·60 0·02 0·883 nsVAR32 Sample 1 19·76 171 6·86 2·88 0·091 ns
Sex 1 270·66 171 6·86 39·46 0·000 ***Sex�sample 1 1·74 171 6·86 0·25 0·615 ns
VAR33 Sample 1 6·78 173 1·61 4·22 0·042 *Sex 1 22·60 173 1·61 14·05 0·000 ***
Sex�sample 1 0·18 173 1·61 0·11 0·741 nsVAR34 Sample 1 27·62 169 8·96 3·08 0·081 ns
Sex 1 196·03 169 8·96 21·88 0·000 ***Sex�sample 1 16·97 169 8·96 1·89 0·171 ns
VAR35 Sample 1 24·56 171 2·66 9·22 0·003 *Sex 1 5·69 171 2·66 2·14 0·146 ns
Sex�sample 1 2·45 171 2·66 0·92 0·339 nsVAR36 Sample 1 2·85 168 3·08 0·93 0·337 ns
Sex 1 53·20 168 3·08 17·30 0·000 ***Sex�sample 1 0·44 168 3·08 0·14 0·705 ns

460 . ET AL.
(symphysis and mental foramen level).Finally, there are some highly dimorphicvariables in which the gonion is involved(VAR19 and VAR24). In fact, the gonionlandmark is included in many of the vari-ables with high percentages of good sexattribution, and seems to be the mostdimorphic region of the mandible.
Following the means method, mandiblesfrom the Atapuerca-SH site were classifiedas male or female, and percentages of sexclassification are given in Table 8. Thenumber of variables employed in this classi-fication differs according to the preservationof the specimen. Three categories can bedistinguished. The first category corre-sponds to those specimens for which mostvariables have values that clearly fall belowthe Atapuerca-SH sample mean values.These are attributed to female sex. Thebest example is the mandible from individ-ual XIX (specimen AT-505+AT-604+AT-952), which preserves 39 variables. Its
female attribution holds when either themaximum number of preserved variables isused, or when a selected set of variables thatbetter perform in comparative samples isused (Table 8). Thus, the mandible AT-505may be considered as a typical female(Figure 1). Specimens AT-3, AT-75 andAT-172 also appear to be females, but thelow number of preserved variables deservefurther discussion (see below). Also, themandible from individual XXIII (AT-607)behaves similarly and could be considered tobe female. However, this is an immatureindividual and further discussion is needed.The second group of mandibles that can bedistinguished are those which do not displaya satisfactory percentage of classification(>75%) in either of sexes. Mandibles fromindividual IV (AT-250), individual XXXI(AT-950), and individual XV (AT-2193)are the best examples. Discrete and individ-ual variables will be considered before sex isassigned. The third group corresponds to
Table 5 Continued
Effects df Effect MS Effect df Error MS Error F P-level Significancea
VAR37 Sample 1 3·86 167 5·52 0·70 0·404 nsSex 1 69·25 167 5·52 12·55 0·001 **
Sex�sample 1 4·86 167 5·52 0·88 0·349 nsVAR38 Sample 1 38·80 171 3·14 12·35 0·001 **
Sex 1 123·57 171 3·14 39·33 0·000 ***Sex�sample 1 0·44 171 3·14 0·14 0·709 ns
VAR39 Sample 1 0·36 173 0·84 0·43 0·514 nsSex 1 7·09 173 0·84 8·41 0·004 **
Sex�sample 1 0·22 173 0·84 0·26 0·611 ns
aP<0·05, **P<0·01, ***P<0·001; ns, not significant.
Table 6 Multivariate analysis of variance (MANOVA) for the H. sapiens comparative samples fromCoimbra (Portugal) and Spitalfields (England)
Effects Wilk’s lambda F df Effect df Error P
Sample 0·248 4·979 39 64 0·000Sex 0·401 2·448 39 64 0·001Sex�sample 0·608 1·060 39 64 0·411
The analysis includes 41 variables of the mandible.
461 -
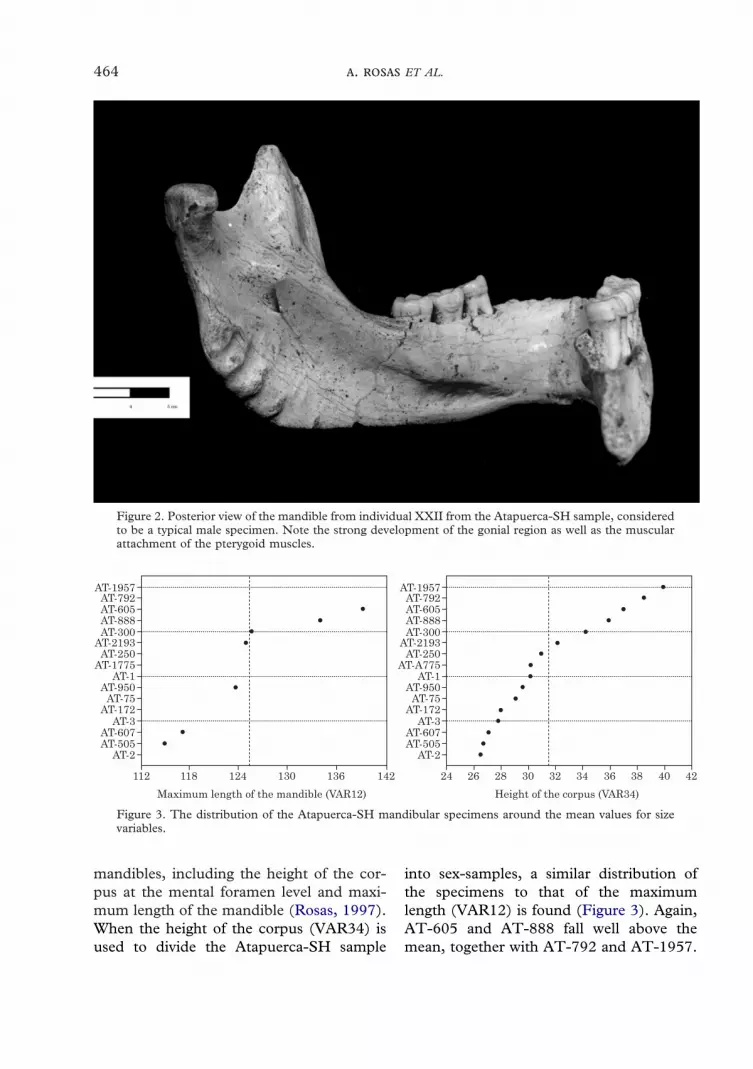
those specimens in which most variableshave values that fall well above the samplemean. Among these, mandibles from indi-vidual XXI (AT-888) and individual XXII(AT-605) are considered to be males(Figure 2). Note, however, that a number ofvariables (14–16%) would attribute a femalecondition to these specimens (Table 8).
Size of the mandibleBoth uni- and multivariate analysis (PCA)yielded size as the best discriminant factorfor sex. Results of a stepwise discriminantanalysis performed o the Coimbra sampleyielded 92·6% of total correct classification(91·1% for females and 93·8% for males).The analysis confirms the univariate results,
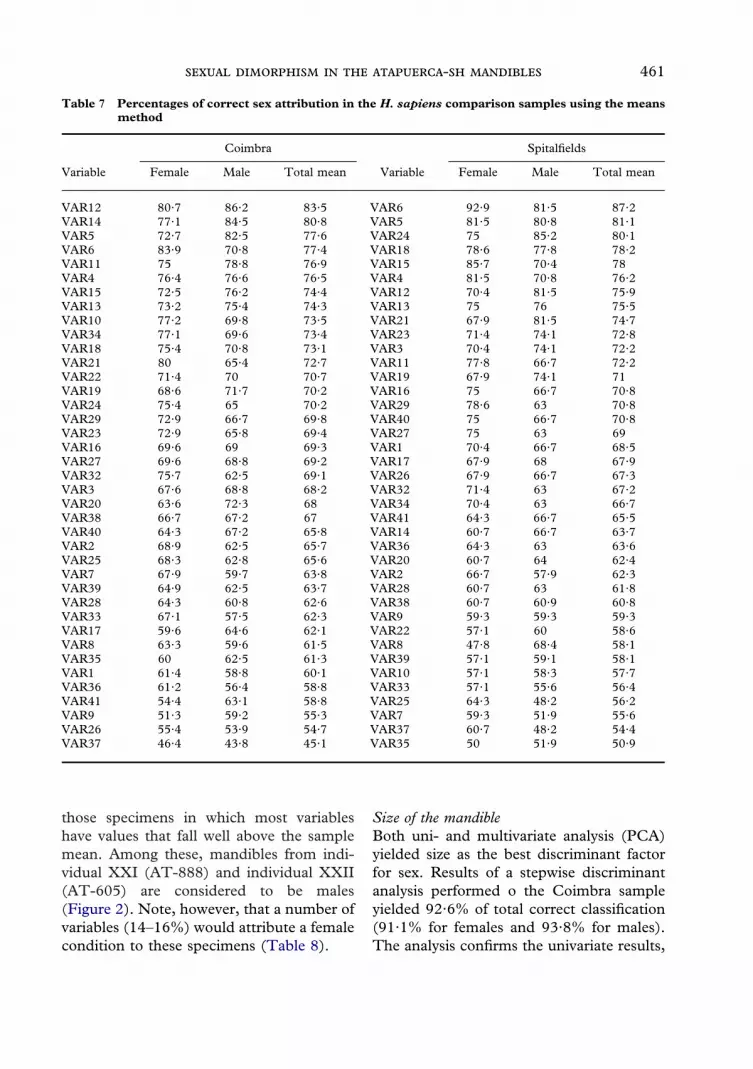
Table 7 Percentages of correct sex attribution in the H. sapiens comparison samples using the meansmethod
Variable
Coimbra
Variable
Spitalfields
Female Male Total mean Female Male Total mean
VAR12 80·7 86·2 83·5 VAR6 92·9 81·5 87·2VAR14 77·1 84·5 80·8 VAR5 81·5 80·8 81·1VAR5 72·7 82·5 77·6 VAR24 75 85·2 80·1VAR6 83·9 70·8 77·4 VAR18 78·6 77·8 78·2VAR11 75 78·8 76·9 VAR15 85·7 70·4 78VAR4 76·4 76·6 76·5 VAR4 81·5 70·8 76·2VAR15 72·5 76·2 74·4 VAR12 70·4 81·5 75·9VAR13 73·2 75·4 74·3 VAR13 75 76 75·5VAR10 77·2 69·8 73·5 VAR21 67·9 81·5 74·7VAR34 77·1 69·6 73·4 VAR23 71·4 74·1 72·8VAR18 75·4 70·8 73·1 VAR3 70·4 74·1 72·2VAR21 80 65·4 72·7 VAR11 77·8 66·7 72·2VAR22 71·4 70 70·7 VAR19 67·9 74·1 71VAR19 68·6 71·7 70·2 VAR16 75 66·7 70·8VAR24 75·4 65 70·2 VAR29 78·6 63 70·8VAR29 72·9 66·7 69·8 VAR40 75 66·7 70·8VAR23 72·9 65·8 69·4 VAR27 75 63 69VAR16 69·6 69 69·3 VAR1 70·4 66·7 68·5VAR27 69·6 68·8 69·2 VAR17 67·9 68 67·9VAR32 75·7 62·5 69·1 VAR26 67·9 66·7 67·3VAR3 67·6 68·8 68·2 VAR32 71·4 63 67·2VAR20 63·6 72·3 68 VAR34 70·4 63 66·7VAR38 66·7 67·2 67 VAR41 64·3 66·7 65·5VAR40 64·3 67·2 65·8 VAR14 60·7 66·7 63·7VAR2 68·9 62·5 65·7 VAR36 64·3 63 63·6VAR25 68·3 62·8 65·6 VAR20 60·7 64 62·4VAR7 67·9 59·7 63·8 VAR2 66·7 57·9 62·3VAR39 64·9 62·5 63·7 VAR28 60·7 63 61·8VAR28 64·3 60·8 62·6 VAR38 60·7 60·9 60·8VAR33 67·1 57·5 62·3 VAR9 59·3 59·3 59·3VAR17 59·6 64·6 62·1 VAR22 57·1 60 58·6VAR8 63·3 59·6 61·5 VAR8 47·8 68·4 58·1VAR35 60 62·5 61·3 VAR39 57·1 59·1 58·1VAR1 61·4 58·8 60·1 VAR10 57·1 58·3 57·7VAR36 61·2 56·4 58·8 VAR33 57·1 55·6 56·4VAR41 54·4 63·1 58·8 VAR25 64·3 48·2 56·2VAR9 51·3 59·2 55·3 VAR7 59·3 51·9 55·6VAR26 55·4 53·9 54·7 VAR37 60·7 48·2 54·4VAR37 46·4 43·8 45·1 VAR35 50 51·9 50·9

462 . ET AL.
and shows that maximum length of themandible (VAR12) explains 52·7% of thevariance in the sample. A combination offive variables was identified as contributingsignificantly to sex classification. The coeffi-cients for VARs 12, 6, 24, 36 and 39 suggesta morphological spectrum in which sexis involved. Thus, large maximum man-dibular length (VAR12) and bi-gonialbreadth (VAR6), combined with a largegonion (VAR24), a large coronoid process(VAR39), and a proportionally small corpusheight at the level of the M3 (VAR36)suggest a male mandible. A smaller maxi-mum mandibular length, as well as a smallergonion and coronoid process, but a propor-tionally higher corpus at the level of theM3 consequently, defines the female man-dibular pattern. A similar analysis in theSpitalfields sample yielded complementaryresults. In both samples, mandibular maxi-mum length is the most important factor forsex discrimination. Also, in the Coimbrasample, the transverse diameter of the con-dyle shows important differences between
sexes. Molleson & Cox (1993) have alsodetected this component in the Spitalfieldssample. When different discriminant analy-sis are performed varying the conditions inthe model, either with individual samples orcombining the Coimbra and Spitalfieldssamples, variables recording size of the man-dible, gonion and condyle are systematicallypresent in the discriminant function, withdifferent statistical significance. Althoughsexual dimorphism is differently expressedin modern human populations, a commonpattern may be recognized.
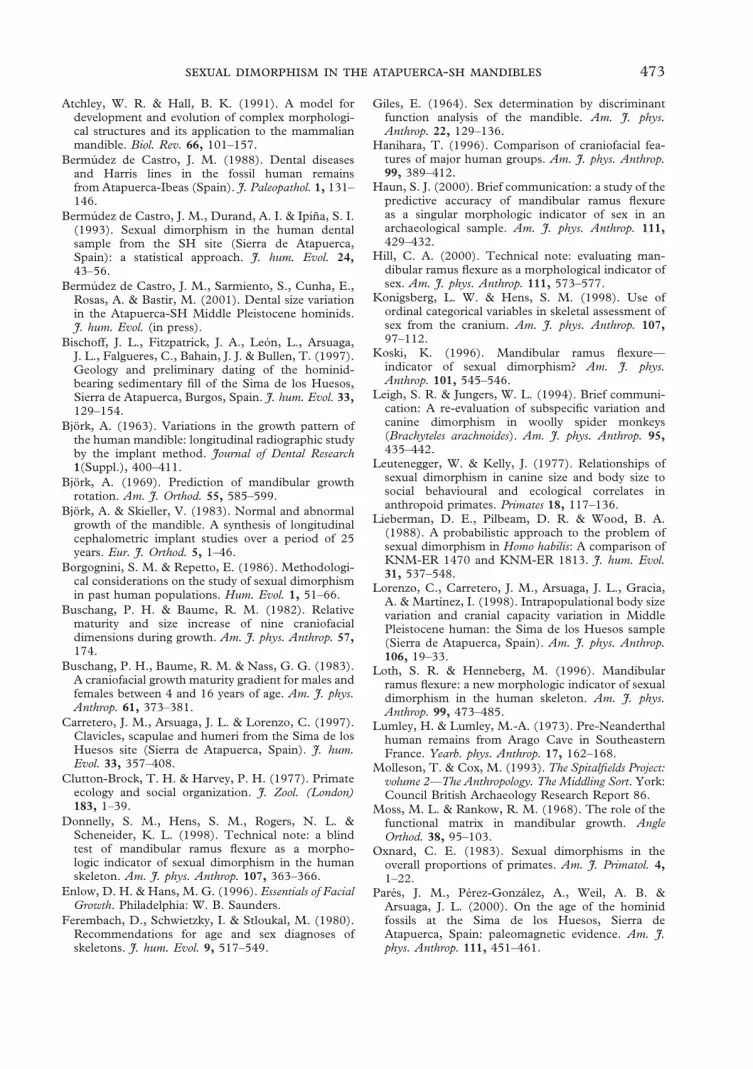
Seven mandibles from the SH site pre-serve the maximum length of the mandible(VAR12) (Figure 3). Distribution of thespecimens in relation to the sample meancoincides with that found using the meansmethod for the complete set of variables.Thus, specimens AT-605 and AT-888 fallwell above the mean of the sample, fitting amasculine attribution. On the other hand,the immature AT-607 and the adultAT-505 are found at the lower end, and areconsidered to be females. A number of
Table 8 Percentages of sex attribution for the Atapuerca-SH mandibles following the mean method
Specimen
All preserved variables Selected variables*
Total % Female % Male Total % Female % Male
AT-1 17 52·9 47·1 3 100 0·0AT-172 4 100 0·0 1 100 0·0AT-1775 2 100 0·0 1 100 0·0AT-1957 9 0·0 100 2 0·0 100AT-2193 14 57·1 42·9 5 60·0 40·0AT-250 14 57·1 42·9 3 66·7 33·3AT-3 2 100 0·0 1 100 0·0AT-300 24 54·2 45·8 8 37·5 62·5AT-505 39 89·7 10·3 14 100 0·0AT-605 40 17·5 82·5 14 7·1 92·9AT-607 24 95·8 4·2 9 100 0·0AT-75 4 100 0·0 1 100 0·0AT-792 17 17·6 82·4 3 0·0 100AT-888 29 13·8 86·2 8 0·0 100AT-950 36 88·9 11·1 11 72·7 27·3
*Pooled from mean method, i.e., the fifteen highest discriminating variables from Coimbra and Spitalfields:VARs 6, 12, 5, 14, 18, 15, 11, 4, 13, 21, 10, 34, 19, 16, 24.

463 -
specimens: AT-950, AT-2193 and AT-300fall in the middle of the distribution whereattribution of sex is uncertain.
The area of the mandibular foramen is thebest preserved area in Atapuerca-SH man-dibular sample, and, in several cases, the
only variable available for analysis. Theheight of the corpus (VAR34) yielded amoderate percentage of a correct classifica-tion in modern samples (73·3 and 66·7).However, a previous study showed high cor-relation among several variables in the SH
Figure 1. Lateral view of mandibles from (a) individual XIX (specimen AT505+AT604+AT95 (left) andindividual XXXI (specimen AT-950). Both of these mandibles are considered to belong to females. Notethe inclined symphysis and low ramus.
464 . ET AL.
mandibles, including the height of the cor-pus at the mental foramen level and maxi-mum length of the mandible (Rosas, 1997).When the height of the corpus (VAR34) isused to divide the Atapuerca-SH sample
into sex-samples, a similar distribution ofthe specimens to that of the maximumlength (VAR12) is found (Figure 3). Again,AT-605 and AT-888 fall well above themean, together with AT-792 and AT-1957.
Figure 2. Posterior view of the mandible from individual XXII from the Atapuerca-SH sample, consideredto be a typical male specimen. Note the strong development of the gonial region as well as the muscularattachment of the pterygoid muscles.
AT-607
AT-300
AT-605
AT-1957
112 142136130124118
Maximum length of the mandible (VAR12)
AT-3
AT-505AT-2
AT-792
AT-888
AT-2193AT-250
AT-1775AT-1
AT-950AT-75
AT-172
AT-607
AT-300
AT-605
AT-1957
AT-3
AT-505AT-2
AT-792
AT-888
AT-2193AT-250
AT-A775AT-1
AT-950AT-75
AT-172
24 4238 4032 34 363026 28
Height of the corpus (VAR34)
Figure 3. The distribution of the Atapuerca-SH mandibular specimens around the mean values for sizevariables.

465 -
The immature specimen AT-607, togetherwith AT-505, AT-3, AT-172 and AT-75 fallclearly below the mean, while specimensAT-250, AT-300 and AT-950 still maintainan undifferentiated position.
This is particularly evident in the Coimbrasample, in which a higher incidence ofstrong relieves for the platysma, pterygoid,and masseter muscle attachments is foundin males. Finally, ramus flexion also showedsex differences in the Coimbra sample,but the percentage of discrimination ismuch lower than that claimed by Loth &Henneberg (1996) and Koski (1996).None of these features allows a direct sexclassification in isolation.
Scores for discrete characters in theAtapuerca-SH specimens are given in Table9. As compared with modern human man-dibles, a number of features cannot behomologized in Middle Pleistocene speci-mens. In particular, three of the discretevariables showing sex differences in H.sapiens are features related to the develop-ment of the chin, and these cannot beapplied directly to the SH sample. Similarly,the antegonial notch and basal border shapeseems to follow a distinct pattern of vari-ation in the SH sample as compared tomodern samples. Relief of the platysma andgonion are related to muscle attachments,and can be identified in the Atapuerca-SHsample much like they are in modern popu-lations. Ramus flexure, as defined by Loth &Henneberg (1996), can also be scored inthe SH mandibles. However, because of thelarger and more superior extension of thegonion in Atapuerca-SH mandibles as com-pared with modern humans, the stretch ofthe posterior border where the flexure couldbe located is shorter in Middle Pleistocenespecimens.
Scores for Atapuerca-SH individuals ofsmaller size (AT-505, AT-607, and AT-75)fall into the female category relative tomodern human population standards.Specifically, smooth development of muscu-lar and structural reliefs, as well as a ramusflexion near the condyle, suggest femaleattribution. Likewise, discrete characterssuggest that larger individuals (AT-605,AT-888 and AT-792) are males, with strong
Discrete variables of the mandibleTwenty of the 32 discrete variables consid-ered in the modern sample showed signifi-cant sex differences (Table 3). Nonetheless,in spite of the elevated number of sexuallydimorphic discrete features, these might beinterpreted in sets of characters, directlyrelated to mandibular regions. Differencesin the female and male mandible are locatedspecifically at the symphysis, the basal bor-der, the gonion as well as in the ramus(coronoid process, and anterior and pos-terior borders of the ramus). Likewise, someaspects of the general architecture of themandible (e.g., the position of the alveolararcade in relation to the basal arcade, andassociated with this, the width of theextramolar sulcus) are also sexually dimor-phic. On the contrary, other regions of themandible, such as those of the mentalforamen and lateral prominence, as well asfeatures of the internal aspect of corpus andramus do not present sexual dimorphism inmodern samples.
All the features of the chin area are signifi-cantly different in males and females. Aspreviously pointed out by Acsadi &Nemeskeri (1970) and Ferembach et al.(1980), the lateral tubercles of the chin aresignificantly larger in males, giving rise towider basal symphysis and straight anteriorprofiles when observed in basal view. Shapeof the basal border and antegonial notchalso show sex differences, with a more pro-nounced relief in males. Female mandiblesshow a higher incidence of curved (concave)basal border, while the anterior basalborder is heavily built in the male mandi-bles, associated with a more pronouncedantegonial notch. Muscle attachments aregenerally stronger in males than in females.

466 . ET AL.
muscle attachments and ramus flexion nearthe occlusal surface. For specimens of inter-mediate size, discrete traits suggest thatAT-300 should be considered as a male.Conversely, mandibles from individuals IV(AT-250+AT-793) and XXXI (AT-950)are considered to be females because of thesmooth development of a majority of fea-tures, although for some specific featuresthey could potentially be arranged withmales. On the whole, based on the analysespresented here, most of the Atapuerca-SHmandibular specimens can be sexed withreasonable confidence (Table 10).
Following these sex attributions, the esti-mated degree of sexual dimorphism in theAtapuerca-SH sample and the actual degreeof sexual dimorphism in modern samplesare given in Table 11. Typically, theAtapuerca-SH sample displays a higherdegree of sexual dimorphism than modernsamples. Nevertheless, different areas of theAtapuerca-SH mandibles exhibit quite dis-tinct degrees of sexual dimorphism. Forinstance, variables of the alveolar arcadepresent very low or practically no sexualdimorphism. Variables related to overall sizeof the mandible and symphysis regionpresent a medium degree of sex differences.Variables that present a high degree of
sexual differences are related to ramusheight, and particularly the gonial region(VAR19: 138; VAR24: 131·3) and the coro-noid process (VAR13: 132·4; VAR20:155·3).
Results of the MANOVA analyses ofseven mandibular regions are given in Table12. The pattern of sexual dimorphism issimilar in both modern human samples in allthe regions; no significant differences aredetected in the interaction term exceptfor the condyle. This has been alreadynoted in the ANOVAs of single variables.Interestingly, differences in the pattern ofsexual dimorphism were detected betweenspecies in some specific regions of the man-dible. While symphysis, lateral prominenceregion and condyle display no significantdifference in the interaction term of theMANOVAs, the region of the mentalforamen as well as ramus, gonion and coro-noid process show a distinct pattern ofsexual dimorphism in H. heidelbergensis andH. sapiens.
Atapuerca-SH specimens
0%
100%(a)
80%
60%
40%
20%
AT-1957
AT-888
AT-792
AT-605
AT-300
AT-2193
AT-250
AT-950
AT-1
AT-505
AT-607
AT-172
AT-1775
AT-3
AT-75
0%
100%(b)
80%
60%
40%
20%
AT-1957
AT-888
AT-792
AT-605
AT-300
AT-2193
AT-250
AT-950
AT-1
AT-505
AT-607
AT-172
AT-1775
AT-3
AT-75
Figure 4. Percentages of sex assignment for the Atapuerca-SH mandibles following the mean method(values of Table 8). (a) Sex assignment using the complete set of preserved variables for each specimen.(b) Sex assignment using selected variables that best performed in modern human samples. Male ,Female .
Discussion and conclusions
Size and specific muscular reliefs emergeas the most diagnostic sex-related charac-ters. Distinctive female specimens include

467 -
Tab
le9
Sco
reof
mor
ph
olog
ical
feat
ure
sin
the
Ata
pu
erca
-SH
man
dib
les
Pla
tysm
aat
tach
men
t
Sha
peof
the
basa
lbo
rder
Pre
angu
lar
notc
h
Ext
erna
lgo
nion
relie
f
Man
dibu
lar
ram
usfle
xure
Ant
erio
ral
veol
arde
pres
sion
Dig
astr
icfo
ssa
relie
f
Att
achm
ent
med
ial
pter
ygoi
dG
onio
nor
ient
atio
nR
etro
mol
artu
berc
le
Ant
erio
rm
argi
nal
tube
rcle
Att
achm
ent
late
ral
pter
ygoi
d
AT
-1A
bsen
tS
trai
ght
Abs
ent
Abs
ent
Sm
ooth
Sm
ooth
Str
ong
AT
-3A
bsen
tS
moo
thA
T-7
5?
Str
aigh
tA
bsen
tS
moo
thA
T-1
72+
AT
-301
+A
T-5
08
Abs
ent
Str
aigh
tS
moo
thS
moo
th
AT
-250
+A
T-7
93P
rese
ntS
trai
ght
Sm
ooth
Pre
sent
Str
ong
Mar
ked
Sm
ooth
AT
-300
?S
trai
ght
Nea
rth
eoc
clus
alsu
rfac
eP
rese
ntS
moo
thS
moo
thS
tron
g
AT
-505
+A
T-6
04+
AT
-952
Abs
ent
Str
aigh
tA
bsen
tA
bsen
tN
ear
the
cond
yle?
Abs
ent
Sm
ooth
Sm
ooth
Inve
rted
Sm
ooth
AT
-605
Abs
ent
Str
aigh
tA
bsen
tT
uber
cula
ted
Nea
rth
eoc
clus
alsu
rfac
eP
rese
ntS
tron
gS
tron
gE
vert
edS
moo
thS
tron
gIn
term
edia
te
AT
-607
Abs
ent
Cur
ved
Abs
ent
Abs
ent
Nea
rth
eco
ndyl
eA
bsen
tS
tron
gS
moo
thIn
vert
edS
moo
thM
ediu
mS
moo
thA
T-7
92P
rese
ntS
trai
ght
Sm
ooth
Tub
ercu
late
dP
rese
ntS
tron
gM
arke
dS
tron
gA
T-8
88P
rese
ntC
urve
dA
bsen
tT
uber
cula
ted
Nea
rth
eoc
clus
alsu
rfac
eIn
term
edia
teS
tron
gS
tron
gS
trai
ght
Mar
ked
Med
ium
Str
ong
AT
-950
Abs
ent
Cur
ved
Sm
ooth
Rid
ged?
Nea
rth
eco
ndyl
eA
bsen
tIn
term
edia
teIn
term
edia
teE
vert
edM
arke
dM
ediu
mS
tron
gA
T-1
775
?A
bsen
tS
moo
thM
ediu
mA
T-1
957
?P
rese
ntS
tron
gS
tron
gA
T-2
193
Abs
ent
Str
aigh
tS
moo
thA
bsen
tN
ear
the
cond
yle
Abs
ent
Sm
ooth
Sm
ooth
Sm
ooth
Sm
ooth
Sm
ooth

A((HmlstbpAehca
((cA
468 . ET AL.
small size, and smooth muscle attachments.Conversely, larger specimens develop strongmuscle attachments, especially at the gonionand coronoid process. Assigning sex tomedium size specimens, such as AT-950,AT-250, and AT-300, is more difficult, andrelies on weighting the evidence of metricand discrete features. We think specimensAT-250 and AT-950 should be consideredas females because the higher proportion ofcontinuous variables that include them inthe female sub-sample, and because of theiroverall morphological pattern. In spite of thefact that pterygoid and platysma attach-ments are moderately well developed in bothcases, the shape of the symphysis and ramusaligns them with the more ‘‘secure’’ femalespecimens. In contrast, specimen AT-300 ismorphologically closer to the larger speci-mens, and it has been included in the malesub-sample.
Overall, the mandible of thetapuerca-SH hominids is more dimorphic
116%) than that of modern humans107%), about eight points higher than in. sapiens samples (Table 11). That is, theale values of the SH sample are twice as
arge as H. sapiens values, when females areet to 100. These data are congruent withhe values obtained for the low dentitiony Bermudez de Castro et al. (2001). Aossible interpretation is that thetapuerca-SH hominids had a greater gen-ral sexual dimorphism than to modernumans. However, this conclusion does notoncur with the results obtained from thenalysis of the post-cranial evidence.Arsuaga et al. (1997) and Lorenzo et al.
1998) have proposed that maximum ratiomaximum/minimum) of a number ofranial and post-cranial variables in thetapuerca-SH sample fit within the range of
Table 10 Final sex attribution of the Atapuerca-SH mandibles according to size of the mandible andmorphological features
Specimen Individual1 Size Means method Morphological features
AT-1 I Female Female All morphological features except for theanterior marginal tubercle indicate female
AT-3 III Female Female Few morphological features are preservedAT-75 VI Female Female Few morphological features are preservedAT-172 X Female Female Few morphological features are preservedAT-250 IV Female
(close to the mean)Female Some discrete features may indicate a male
attribution. Rosas et al. (1999) describe thespecimen as senile
AT-300 XI In the middle ofthe sample
Male Strong development of certain features
AT-505 XIX Female Female Representative femaleAT-605 XXII Male Male Representative maleAT-607 XXIII Female Female Immature. Previously published as male
(Rosas, 1997)AT-792 XXVII Male. Very large Male Representative maleAT-888 XXI Male Male Some features may indicate a female conditionAT-950 XXXI Female
(close to themean)
Female Some muscular relieves well developed
AT-1775 XXVI Female Female Few morphological features are preservedAT-1957 VII Male
(very large)Male Few morphological features are preserved
AT-2193 XV Female(close to themean)
Female Most of the features indicate a female condition

469 -
variation of modern humans. These authorsdid not explore sexual dimorphism directlybut the implication of their study is that, ifthe intrapopulational variation of MiddlePleistocene and modern samples is similar,the degree of sexual dimorphism might bealso similar. There are two possible ways to
reconcile the conclusions of these twostudies. The first may indicate that sexualdifferences are unequally distributed inmodern human and Middle Pleistocenehominids, even within the limits of a similarrange of variation. A second possibility isthat specific anatomical systems did, in fact,develop a greater degree of sexual differ-ences in mid-Pleistocene populations than ispresent in modern populations. Lorenzoet al. (1998) found, for instance, that vari-ation in humeral midshaft perimeter exceedsthe limits of modern populations, some-thing that they interpreted as a functionalacquisition by males.
The musculo-skeletal system is muchmore developed in H. heidelbergensis than inH. sapiens, even though body size couldmaintain a similar spectrum of variation inboth species. Some of the anatomicalregions affected by muscular and/or carti-lage developments show a greater de-velopment and size in H. heidelbergensis,particularly in those individuals consideredbeing male. The hypothesis that these par-ticular anatomical regions are the ones thatexpress a higher degree of sexual dimor-phism is plausible. The mandible may givesome examples.
Different regions of the European MiddlePleistocene hominid mandible exhibit vari-able degrees of sexual dimorphism. Forinstance, the alveolar arcade presents verylow, if any, sexual dimorphism. The sym-physis region and overall size of the man-dible present a medium degree of sexualdimorphism, as compared with the mean ofthe complete set of variables measured inthe Atapuerca-SH sample. The values ofthese variables are, however, higher thanequivalent variables in modern samples. Aninteresting case is found in the region of themental foramen. This mandibular area doesnot present sexual differences in H. sapienssamples but is, according to our data,sexually dimorphic in the Atapuerca-SHmandibles. Finally, ramus height, gonion
Table 11 Degree of sexual dimorphism in com-parison samples and estimated degree of sexualdimorphism in the Atapuerca-SH sample aftersexing the specimens
Coimbra Spitalfields Ata-SH
VAR1 103·40 105·26 113·45VAR2 103·54 103·69 101·42VAR3 103·32 106·15 101·31VAR4 107·34 107·72VAR5 106·69 107·43VAR6 108·98 110·65 112·70VAR7 104·32 102·32 104·63VAR8 101·78 102·43 100·98VAR9 102·15 102·84 103·18VAR10 106·45 106·50 114·17VAR11 106·24 105·08 119·22VAR12 107·08 107·53 110·65VAR13 111·94 112·54 132·44VAR14 109·32 106·03 113·56VAR15 105·92 106·42 118·27VAR16 104·41 108·26 106·08VAR17 104·90 106·23 93·02VAR18 111·53 113·00 116·13VAR19 112·16 114·54 138·01VAR20 112·54 108·54 155·34VAR21 111·66 113·32 119·55VAR22 109·55 105·78 123·06VAR23 105·34 109·25 112·32VAR24 115·86 118·34 131·35VAR25 112·57 100·84 118·82VAR26 102·17 107·75 102·29VAR27 106·68 106·68 118·56VAR28 105·40 104·38 114·46VAR29 106·79 105·40 108·67VAR32 110·61 106·20 121·53VAR33 109·28 111·44 129·82VAR34 110·36 108·98 128·92VAR35 107·99 106·39 113·08VAR36 106·87 113·48 114·96VAR37 100·91 104·74 105·12VAR38 110·52 108·50 114·80VAR39 110·54 106·11 118·88VAR40 109·45 110·14 121·64VAR41 104·34 106·18 116·76VAR42 103·47 117·68Mean 107·36 107·62 115·97

470 . ET AL.
Tab
le12
Res
ult
sof
MA
NO
VA
sfo
rse
xan
dsa
mp
le/s
pec
ies
effec
ts(H
.sa
pie
ns
and
H.
hei
del
ber
gen
sis)
Reg
ion
ofth
em
andi
ble
df
Sam
ple/
spec
ies
Sex
Sex
�S
ampl
e/sp
ecie
s
Wilk
’sla
mbd
aR
ao’s
RP
-val
ueW
ilk’s
lam
bda
Rao
’sR
P-v
alue
Wilk
’sla
mbd
aR
ao’s
RP
-val
ue
Mod
ern
hum
ansa
mpl
esS
ymph
ysis
3;28
00·
918·
820·
000
0·75
30·7
40·
000
0·99
0·52
0·52
Men
tal
fora
men
4;27
90·
6929
·95
0·00
00·
8412
·37
0·00
00·
990·
050·
99L
ater
alpr
omin
ence
2;27
80·
965·
560·
004
0·90
15·2
70·
000
0·98
1·46
0·23
Ram
us4;
257
0·91
5·59
0·00
00·
9023
·90
0·00
00·
980·
820·
51G
onio
n3;
268
0·90
9·45
0·00
00·
7332
·40
0·00
00·
990·
710·
54C
oron
oid
proc
ess
3;27
10·
971·
860·
130·
8811
·59
0·00
00·
990·
390·
75C
ondy
le3;
277
0·95
4·83
0·00
20·
7628
·36
0·00
00·
962·
950·
032
Spe
cies
sam
ples
(H.
heid
elbe
rgen
sis
and
H.
sapi
ens)
Sym
phys
is3;
264
0·59
59·1
50·
000
0·86
13·1
50·
000
0·97
1·95
0·12
Men
tal
fora
men
4;26
50·
5554
·13
0·00
00·
8412
·45
0·00
00·
962·
470·
044
Lat
eral
prom
inen
ce2;
264
0·73
26·3
80·
000
0·92
5·90
0·00
30·
981·
410·
24R
amus
4;23
80·
859·
820·
000
0·92
4·63
0·00
10·
7915
·05
0·00
0G
onio
n3;
248
0·88
10·2
80·
000
0·97
2·43
0·06
50·
7526
·93
0·00
0C
oron
oid
proc
ess
3;24
90·
954·
150·
006
0·92
7·05
0·00
00·
962·
880·
036
Con
dyle
3;19
90·
7719
·30
0·00
00·
906·
590·
000
0·96
2·46
0·06
3

471 -
and coronoid processes present a highdegree of sexual dimorphism. In these cases,the indexes of sexual dimorphism are allabove 130%, a figure clearly superior tovalues found in mandibular and postcranialvariables of H. sapiens that rarely are above120%.
Inasmuch as their attachment on the bonepermits evaluation, pterygoid and temporalmuscles seem to be much more developedin H. heidelbergensis than in H. sapiens.This differential development of muscles iscurrently interpreted in functional terms.However, even smaller specimens have arelatively large pterygoid area. Is there anyother possible explanation for the largedevelopment of certain muscles or anatomi-cal systems, apart from the use of a particu-lar organ? How are systems differentiallysensitive to hormones and growth factors,e.g., testosterone?
Sexual differences detected in the man-dible of modern humans have at leasttwo components. Differences related tomusculo-skeletal development and differ-ences related to a different growth trajectoryin males and females (Buschang & Baume,1982; Bjork & Skieller, 1983; Buschanget al., 1983; Enlow & Hans, 1996). Therelative development of some basal borderfeatures, such as the enlargement of theanterior part or the preangular notch, hasbeen related to specific mandibular growthtrajectories (Bjork, 1963, 1969). By con-trast, the Atapuerca-SH mandibles displaylittle variation in the basal border. Thelimited variation of this mandibular regionmay indicate a facial growth pattern quitedistinct in the Neandertal evolutionarylineage populations as compared with H.sapiens. The Atapuerca-SH mandibular vari-ation seems to depend more directly on sizeand relative development of the musculo-skeletal system (Rosas, 1997). The expres-sion of sexual dimorphism deduced for theMiddle Pleistocene hominid populationsseems to follow a different pattern than that
found in modern humans. A large variety ofsexual dimorphism patterns seems to be thenorm in primates (Oxnard, 1983), and per-haps this is also the case in closely relatedspecies such as those considered in thisstudy.
Possible causes of these aspects will be thesubject of future research. But, for themoment, it can be said that Atapuerca-SHhominids present a higher degree of sexualdimorphism than H. sapiens populations atleast in overall mandibular size and specificregions of the ramus. Whether this markedsexual dimorphism in specific anatomicalsystems is reflected in sexual differences inbody size is not completely clear and furtherstudies are needed.
Once individual sex attribution has beenperformed, an unbalanced sex proportionemerges in the Atapuerca-SH hominidsample (Table 10). According to the presentstudy, in a sample of 15 individuals withrepresentative mandibular remains, ten areclassified as females while only five seem tobe males. The question of whether the sexattribution is incorrect or there is a strongbias in sex representation in this samplemight be addressed.
At least three factors may affect the distri-bution of sexes in the Atapuerca-SH sample.First, the possible error in the sex attributionof some specimens. Thus, mandible AT-250(individual IV) is, perhaps, one of the mostdifficult to diagnose. The mean methodlocates it in the female side, but some dis-crete features such as the platysma attach-ment and the mandibular depression at thesymphysis could indicate a male condition.Mandible AT-1 (individual I) is also close tothe mean of the sample and some featuresare strongly developed (e.g., anterior mar-ginal tubercles). Even though the femalecondition of AT-1 seems to be well estab-lished, a possible misclassification is alwaysto be considered. The same can be arguedfor all the specimens that fall close to themean of the sample, already discussed in the

472 . ET AL.
text. Assuming that two or three specimensof the SH sample were misclassified, repre-senting 13–20% of the sample, that wouldbe in line with the margin of error in sexdiagnosis in modern samples (Konigsberg &Hens, 1998). In this case, the hypotheticalproportion 1:1 will be approached in theAtapuerca-SH sample.
A second source of error is the possiblerelationship between age and sex attribu-tion. A good example of this is found in thespecimen AT-607 (individual XXIII), animmature that was previously considered asmale (Rosas, 1997). That male attributionwas based on the appreciation of the poten-tial of growth and morphological changethat this individual could undergo untilit reaches its adult state (Rosas, 1992).However, the attempt to develop a methodfor sex attribution valid for the whole SHsample locates the specimen among thefemales. A similar situation can be found inother specimens. There is the possibility thatage is involved in the sex attribution. Thus,several of the females are young adults, withM3 just arrived to the occlusal level. Thequestion of when members of H. heidel-bergensis stabilize their morphology alongtheir ontogenetic trajectories is a matter offurther investigation. A number of authorshave proposed that sexually dimorphic fea-tures can be identified in the mandiblebefore reaching sexual maturity (Buschang& Baume, 1982; Loth & Henneberg, 1996).
A third possibility for explaining the sexdistribution inferred in the sample (fivemales/ten females) is the presence of ataphonomic bias in the representation ofsexes. It is difficult, at this stage of knowl-edge, to look for the reasons of such a bias.Under the hypothesis of an anthropic originfor the Atapuerca-SH human fossil bearing(Arsuaga et al., 1997) there could be a widerange of possibilities depending on culturalpractices. Nonetheless, a possible biologicalreason that could give an account of theunbalanced sex representation in favour of
females is the elevated mortality of femalesat the time of the first birth. That couldexplain the high incidence of young adultfemales in the Atapuerca-SH sample. Moreresearch on the pattern of sexual dimor-phism in different skeletal systems of H.heidelbergensis is needed before this uncer-tainty can be resolved. Also, further study ofthe taphonomical conditions and the poss-ible human influence on the SH site fossilbearing could reveal important informationfor the understanding of the biological pro-cesses and cultural practices idiosyncrasy ofH. heidelbergensis populations.
Acknowledgements
We should like to thank the wholeAtapuerca team, who made it possible forthe material studied to be recovered.This research is part of the ‘‘AccionesIntegradas’’ project with the Universidadede Coimbra. We are grateful to EugeniaCunha, Paolo Gama Mota, and all the staff
from the Museo Antropologico for their helpand assistance. We are also grateful to FredSpoor, the associate editor and three anony-mous referees for their useful comments.This research is also included in theframework of the Project BXX2000-1258-CO3-01 of the Spanish Government(MCYT). We also thank the financialsupport coming from the Consejerıa deCultura of the Junta de Castilla y Leon, andUnidades Asociadas CSIC Program.
References
Acsadi, G. & Nemeskeri, J. (1970). History of HumanLife Span and Mortality. Budapest: Akademiai Kiado.
Arsuaga, J. L., Carretero, J. M., Martınez, I. &Gracia, A. (1991). Cranial remains and long bonesfrom Atapuerca/Ibeas (Spain). J. hum. Evol. 20,191–230.
Arsuaga, J. L., Carretero, J. M., Lorenzo, C., Gracia,A., Martınez, I., Bermudez de Castro, J. M. &Carbonell, E. (1997). Size variation in MiddlePleistocene humans. Science 277, 1086–1088.
473 -
Atchley, W. R. & Hall, B. K. (1991). A model fordevelopment and evolution of complex morphologi-cal structures and its application to the mammalianmandible. Biol. Rev. 66, 101–157.
Bermudez de Castro, J. M. (1988). Dental diseasesand Harris lines in the fossil human remainsfrom Atapuerca-Ibeas (Spain). J. Paleopathol. 1, 131–146.
Bermudez de Castro, J. M., Durand, A. I. & Ipina, S. I.(1993). Sexual dimorphism in the human dentalsample from the SH site (Sierra de Atapuerca,Spain): a statistical approach. J. hum. Evol. 24,43–56.
Bermudez de Castro, J. M., Sarmiento, S., Cunha, E.,Rosas, A. & Bastir, M. (2001). Dental size variationin the Atapuerca-SH Middle Pleistocene hominids.J. hum. Evol. (in press).
Bischoff, J. L., Fitzpatrick, J. A., Leon, L., Arsuaga,J. L., Falgueres, C., Bahain, J. J. & Bullen, T. (1997).Geology and preliminary dating of the hominid-bearing sedimentary fill of the Sima de los Huesos,Sierra de Atapuerca, Burgos, Spain. J. hum. Evol. 33,129–154.
Bjork, A. (1963). Variations in the growth pattern ofthe human mandible: longitudinal radiographic studyby the implant method. Journal of Dental Research1(Suppl.), 400–411.
Bjork, A. (1969). Prediction of mandibular growthrotation. Am. J. Orthod. 55, 585–599.
Bjork, A. & Skieller, V. (1983). Normal and abnormalgrowth of the mandible. A synthesis of longitudinalcephalometric implant studies over a period of 25years. Eur. J. Orthod. 5, 1–46.
Borgognini, S. M. & Repetto, E. (1986). Methodologi-cal considerations on the study of sexual dimorphismin past human populations. Hum. Evol. 1, 51–66.
Buschang, P. H. & Baume, R. M. (1982). Relativematurity and size increase of nine craniofacialdimensions during growth. Am. J. phys. Anthrop. 57,174.
Buschang, P. H., Baume, R. M. & Nass, G. G. (1983).A craniofacial growth maturity gradient for males andfemales between 4 and 16 years of age. Am. J. phys.Anthrop. 61, 373–381.
Carretero, J. M., Arsuaga, J. L. & Lorenzo, C. (1997).Clavicles, scapulae and humeri from the Sima de losHuesos site (Sierra de Atapuerca, Spain). J. hum.Evol. 33, 357–408.
Clutton-Brock, T. H. & Harvey, P. H. (1977). Primateecology and social organization. J. Zool. (London)183, 1–39.
Donnelly, S. M., Hens, S. M., Rogers, N. L. &Scheneider, K. L. (1998). Technical note: a blindtest of mandibular ramus flexure as a morpho-logic indicator of sexual dimorphism in the humanskeleton. Am. J. phys. Anthrop. 107, 363–366.
Enlow, D. H. & Hans, M. G. (1996). Essentials of FacialGrowth. Philadelphia: W. B. Saunders.
Ferembach, D., Schwietzky, I. & Stloukal, M. (1980).Recommendations for age and sex diagnoses ofskeletons. J. hum. Evol. 9, 517–549.
Giles, E. (1964). Sex determination by discriminantfunction analysis of the mandible. Am. J. phys.Anthrop. 22, 129–136.
Hanihara, T. (1996). Comparison of craniofacial fea-tures of major human groups. Am. J. phys. Anthrop.99, 389–412.
Haun, S. J. (2000). Brief communication: a study of thepredictive accuracy of mandibular ramus flexureas a singular morphologic indicator of sex in anarchaeological sample. Am. J. phys. Anthrop. 111,429–432.
Hill, C. A. (2000). Technical note: evaluating man-dibular ramus flexure as a morphological indicator ofsex. Am. J. phys. Anthrop. 111, 573–577.
Konigsberg, L. W. & Hens, S. M. (1998). Use ofordinal categorical variables in skeletal assessment ofsex from the cranium. Am. J. phys. Anthrop. 107,97–112.
Koski, K. (1996). Mandibular ramus flexure—indicator of sexual dimorphism? Am. J. phys.Anthrop. 101, 545–546.
Leigh, S. R. & Jungers, W. L. (1994). Brief communi-cation: A re-evaluation of subspecific variation andcanine dimorphism in woolly spider monkeys(Brachyteles arachnoides). Am. J. phys. Anthrop. 95,435–442.
Leutenegger, W. & Kelly, J. (1977). Relationships ofsexual dimorphism in canine size and body size tosocial behavioural and ecological correlates inanthropoid primates. Primates 18, 117–136.
Lieberman, D. E., Pilbeam, D. R. & Wood, B. A.(1988). A probabilistic approach to the problem ofsexual dimorphism in Homo habilis: A comparison ofKNM-ER 1470 and KNM-ER 1813. J. hum. Evol.31, 537–548.
Lorenzo, C., Carretero, J. M., Arsuaga, J. L., Gracia,A. & Martınez, I. (1998). Intrapopulational body sizevariation and cranial capacity variation in MiddlePleistocene human: the Sima de los Huesos sample(Sierra de Atapuerca, Spain). Am. J. phys. Anthrop.106, 19–33.
Loth, S. R. & Henneberg, M. (1996). Mandibularramus flexure: a new morphologic indicator of sexualdimorphism in the human skeleton. Am. J. phys.Anthrop. 99, 473–485.
Lumley, H. & Lumley, M.-A. (1973). Pre-Neanderthalhuman remains from Arago Cave in SoutheasternFrance. Yearb. phys. Anthrop. 17, 162–168.
Molleson, T. & Cox, M. (1993). The Spitalfields Project:volume 2—The Anthropology. The Middling Sort. York:Council British Archaeology Research Report 86.
Moss, M. L. & Rankow, R. M. (1968). The role of thefunctional matrix in mandibular growth. AngleOrthod. 38, 95–103.
Oxnard, C. E. (1983). Sexual dimorphisms in theoverall proportions of primates. Am. J. Primatol. 4,1–22.
Pares, J. M., Perez-Gonzalez, A., Weil, A. B. &Arsuaga, J. L. (2000). On the age of the hominidfossils at the Sima de los Huesos, Sierra deAtapuerca, Spain: paleomagnetic evidence. Am. J.phys. Anthrop. 111, 451–461.

474 . ET AL.
Pickford, M. (1986). On the origins of body sizedimorphism in primates. Hum. Evol. 1, 77–90.
Plavcan, J. M. (2000). Inferring social behavior fromsexual dimorphism in the fossil record. J. hum. Evol.39, 327–344.
Plavcan, J. M. & van Shaik, C. P. (1992). Intrasexualcompetition and canine dimorphism in anthropoidprimates. Am. J. phys. Anthrop. 87, 461–477.
Randly, D. M. (1988). A Synopsis of CraniofacialGrowth. Norwalk: Appleton and Lange.
Regh, J. A. & Leigh, S. R. (1999). Estimatingsexual dimorphism and size differences in the fossilrecord: a test of methods. Am. J. phys. Anthrop. 110,95–104.
Rosas, A. (1992). Ontogenia y filogenia de la man-dıbula en la evolucion de los homınidos. Aplicacionde un modelo de morfogenesis a las mandıbulasfosiles humanas de Atapuerca. Ph.D. Dissertation,Universidad Complutense, Madrid.
Rosas, A. (1995). Seventeen new mandibular speci-mens from the Atapuerca/Ibeas Middle Pleistocenehominids sample (1985–1992). J. hum. Evol. 28,533–559.
Rosas, A. (1997). A gradient of size and shape for theAtapuerca sample and Middle Pleistocene hominidvariability. J. hum. Evol. 33, 319–331.
Rosas, A. & Bermudez de Castro, J. M. (1998). Onthe taxonomic affinities of the Dmanisi mandible(Georgia). Am. J. phys. Anthrop. 107, 145–162.
Rosas, A., Perez, P. J. & Bone, J. (1999). Senescencein European Middle Pleistocene hominids: TheAtapuerca Evidence. Hum. Evol. 14, 83–98.
StatSoft, I. (1996). STATISTICA for Windows(computer program manual). Tulsa, OK: StatSoft, Inc.
Wolpoff, M. H. (1980). Cranial remains of MiddlePleistocene european hominids. J. hum. Evol. 9,339–358.
Wolpoff, M. H. (1999). Paleoanthropology. Boston:McGraw-Hill.


