Embed Size (px)
Citation preview
ARTICLE
Shifts in pore connectivity from precipitation versusgroundwater rewetting increases soil carbon lossafter droughtA. Peyton Smith 1, Ben Bond-Lamberty 2, Brian W. Benscoter 3, Malak M. Tfaily 4, C. Ross Hinkle 5,
Chongxuan Liu 6,7 & Vanessa L. Bailey 1
Droughts and other extreme precipitation events are predicted to increase in intensity,
duration, and extent, with uncertain implications for terrestrial carbon (C) sequestration. Soil
wetting from above (precipitation) results in a characteristically different pattern of pore-
filling than wetting from below (groundwater), with larger, well-connected pores filling before
finer pore spaces, unlike groundwater rise in which capillary forces saturate the finest pores
first. Here we demonstrate that pore-scale wetting patterns interact with antecedent soil
moisture conditions to alter pore-scale, core-scale, and field-scale C dynamics. Drought
legacy and wetting direction are perhaps more important determinants of short-term
C mineralization than current soil moisture content in these soils. Our results highlight that
microbial access to C is not solely limited by physical protection, but also by drought or
wetting-induced shifts in hydrologic connectivity. We argue that models should treat soil
moisture within a three-dimensional framework emphasizing hydrologic conduits for C and
resource diffusion.
DOI: 10.1038/s41467-017-01320-x OPEN
1 Biological Sciences Division, Pacific Northwest National Laboratory, 902 Battelle Boulevard, Richland, WA 99352, USA. 2 Joint Global Change ResearchInstitute, Pacific Northwest National Laboratory, 5825 University Research Court, Suite 3500, College Park, MD 20740, USA. 3 Florida Atlantic University,Department of Biological Sciences, 3200 College Avenue, Davie, FL 33314, USA. 4 Environmental Molecular Sciences Laboratory, Pacific Northwest NationalLaboratory, 902 Battelle Boulevard, Richland, WA 99352, USA. 5 University of Central Florida, Ecosystem Processes and Services Laboratory, 4110 LibraDrive, Orlando, FL 3216, USA. 6 Physical Sciences Division, Pacific Northwest National Laboratory, 902 Battelle Boulevard, Richland, WA, 99354, USA.7 Southern University of Science and Technology, School of Environmental Science and Engineering, 518055 Shenzhen, China. Correspondence and requestsfor materials should be addressed to A.P.S. (email: [email protected]) or to V.L.B. (email: [email protected])
NATURE COMMUNICATIONS |8: 1335 |DOI: 10.1038/s41467-017-01320-x |www.nature.com/naturecommunications 1
1234
5678
90
C limate change is altering global precipitation patterns:droughts are predicted to increase in intensity, duration,and geographic coverage, with major implications for soil
carbon (C) storage at ecosystem and global scales1–3. Precipita-tion events are becoming less common but more intense in themajority of warm, humid environments in the contiguous UnitedStates4,5. How drought and wetting events will alter terrestrial Cuptake and loss remains highly uncertain, particularly for soils,which comprise the Earth’s largest terrestrial C reservoir6,7.Laboratory and field studies indicate drought-affected soils pro-duce a CO2 pulse when rewet8–10, but models do a poor job ofreproducing these moisture-related patterns of greenhouse gas(GHG) emissions in soils7, limiting our ability to predict howdrying and rewetting will influence soil C source or sink capacityunder scenarios of altered precipitation6.
A particular source of uncertainty concerns pore-scale soilbiogeochemical processes that underpin larger-scale C fluxresponses to soil wetting events11,12. Particular pore size domainshave distinct microenvironments that may favor different types ofmicroorganisms12,13 and mechanisms of soil C protection14. Soilstructure, particularly the size and connectivity of soil pores, hasbeen shown to affect microbial activities15,16, bulk soil decom-position rates during cycles of drying and wetting17, and organicmatter (OM) complexity18. Wetting direction (i.e., from above viaprecipitation or from below via groundwater rise) producesalternate saturation patterns among different pore-size domains:for example, when groundwater rises, capillary forces first satu-rate the finest pores, whereas in precipitation events, gravitationalforces first saturate coarse, well-connected large pores19,20.Because fine-sized pores are associated with more aromatic andcondensed forms of OM18, rewetting from groundwater rise maymake complex forms of C more susceptible to mineralizationthan precipitation-driven rewetting, producing rapid core-scale toecosystem-scale C loss.
The commonly observed pulse in CO2 that occurs when driedor drought-affected soils are rewet (i.e., the Birch Effect9) is rarelyinvestigated at multiple spatial or temporal scales, and itsmechanistic underpinnings can vary, making predictions difficult.Recent research suggests that the Birch Effect is a dual response,driven by rapid changes to microbial biomass growth21 andactivation of extracellular enzymes22. For short-term droughts(<2 weeks), the bacterial growth response to rewetting is linearand immediate, whereas for longer droughts bacterial growth isexponential, though this follows a lag period that may be up to18 h23. The drier the soil and longer the drought, the greater thepulse of CO2 upon rewetting23,24. These responses are often rapidand short-lived, occurring within 24–48 h24–28. However, short-term responses can result in significant C losses from rewetting,because such hot moments can comprise a substantial fraction ofthe landscape-scale or annual flux budget29.
The objective of this research was to develop a molecularunderstanding of the influence that wetting direction and ante-cedent soil moisture have on soil C vulnerability at both the soilpore and core-scale. Given the immediacy of the microbialresponses to rewetting, we focused our measurements on the 20 himmediately following rewetting. We hypothesized greater short-term CO2 emissions would be observed during bottom-wetting(simulated groundwater rise) relative to top-wetting (simulatedprecipitation), as C occluded in fine pores is more readilyaccessed through capillary diffusion-driven rewetting, and thatthis effect would be more pronounced in soil cores subjected tolaboratory-induced drought conditions prior to wetting. We alsohypothesized that the abundance of complex C compounds (suchas lignin, tannin, and condensed hydrocarbons) would increase inpore water collected from drought-conditioned soils due todrought-induced changes in sorption/desorption interactions
between soil minerals and OM30,31. Drought-induced accumu-lation of dead or dormant microbial biomass could also reducelipids in pore water. We tested this hypothesis on soil cores thatwere structurally intact, and for which physical protection mayhave been a dominant mechanism for C persistence, as well as onsoil cores that had been homogenized, so that any effect ofphysical protection was removed.
We used a laboratory experiment to uncover short-term pore-scale and core-scale mechanisms governing the C source or sinkcapacity of soils in response to drought and rewetting direction.Intact soil cores were collected from a sandy site located in theEverglades watershed (FL, USA) naturally subject to significanthydrologic variability, including capillary-led wetting32. Sixteenexperimental cores were randomly assigned to four factorialtreatments of antecedent soil moisture conditions (moisture attime of sampling, vs. antecedent drought) and rewetting direction(simulated precipitation vs. groundwater rise). To capture theimmediate response to rewetting, CO2 and CH4 flux rates weremonitored during and for 20 h after wetting. Pore water was thencollected from each core using different suctions to sample waterretained by pore throats of different effective size domains18
(−1.5, −15, and −50 kPa suctions representing pore throat dia-meters of ~200, 20, and 6 μm33) and characterized via ultrahighresolution mass spectrometry. To further clarify the importanceof physical protection in controlling soil C fluxes, the rewettingexperiment was then immediately repeated on the same, pre-viously intact soil cores after each core was homogenized (seeMethods section, Supplementary Fig. 1). Core-scale CO2 and CH4
flux and pore-scale OM composition measured from homo-genized cores represents the response from previously protectedC that was physically occluded in intact cores. To test the degreeto which these dynamics might be observed at larger scales, field-scale soil CO2 emissions were analyzed using precipitation andgroundwater data collected within the Disney Wilderness Pre-serve (DWP) (Supplementary Fig. 2).
Our results reveal that effective pore size domain is a strongpredictor of both the composition and concentration of soluble C,emphasizing the importance of pore-scale (i.e., physical) protec-tion of soil C. At the core-scale, we show that differences in short-term CO2 and CH4 production depends on antecedent moisturecontent and on the direction of soil rewetting. In situ CO2
emissions are also influenced by the direction of soil wettingsuggesting that precipitation and groundwater fluctuations mayinteract to destabilize soil C at the field scale. Our results highlightthat microbial access to soil C is governed by physical proximityand hydrologic connectivity, which are sensitive to changes in soilmoisture content and wetting direction.
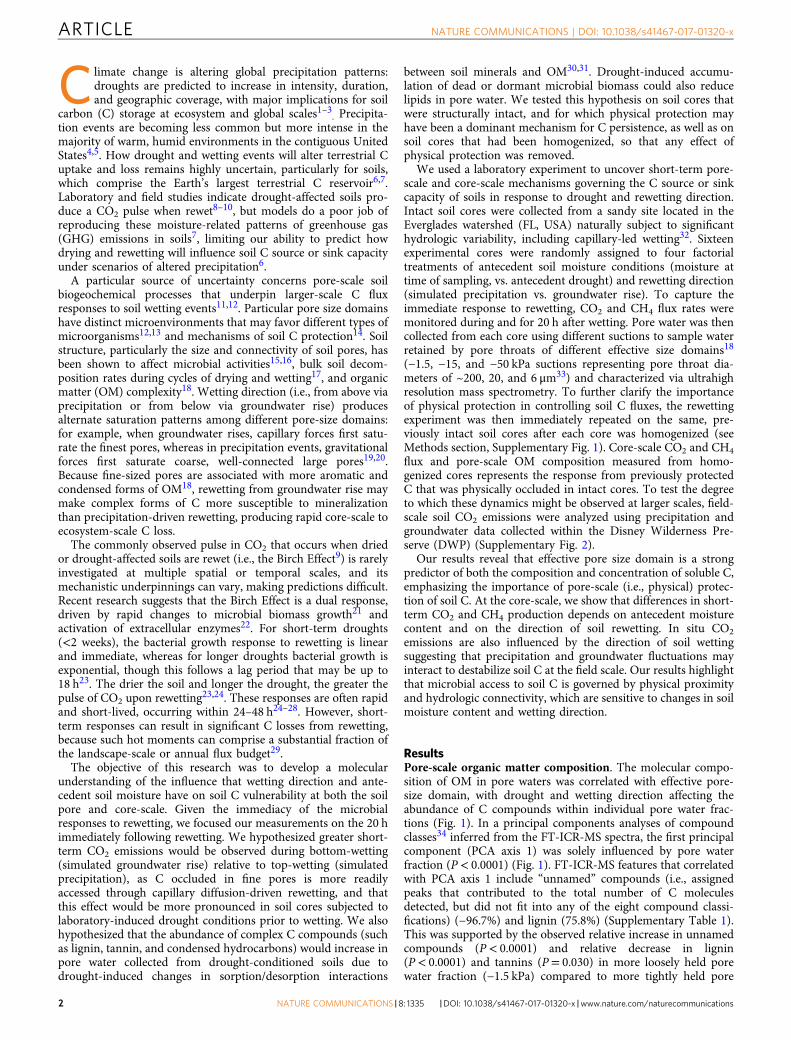
ResultsPore-scale organic matter composition. The molecular compo-sition of OM in pore waters was correlated with effective pore-size domain, with drought and wetting direction affecting theabundance of C compounds within individual pore water frac-tions (Fig. 1). In a principal components analyses of compoundclasses34 inferred from the FT-ICR-MS spectra, the first principalcomponent (PCA axis 1) was solely influenced by pore waterfraction (P< 0.0001) (Fig. 1). FT-ICR-MS features that correlatedwith PCA axis 1 include “unnamed” compounds (i.e., assignedpeaks that contributed to the total number of C moleculesdetected, but did not fit into any of the eight compound classi-fications) (−96.7%) and lignin (75.8%) (Supplementary Table 1).This was supported by the observed relative increase in unnamedcompounds (P< 0.0001) and relative decrease in lignin(P< 0.0001) and tannins (P= 0.030) in more loosely held porewater fraction (−1.5 kPa) compared to more tightly held pore
ARTICLE NATURE COMMUNICATIONS | DOI: 10.1038/s41467-017-01320-x
2 NATURE COMMUNICATIONS | 8: 1335 |DOI: 10.1038/s41467-017-01320-x |www.nature.com/naturecommunications
waters (−50 kPa) (Fig. 2, Supplementary Table 2). We alsoobserved a relative enrichment in unsaturated hydrocarbons inthe more loosely held pore water fraction compared to theintermediate-suction pore water fraction (−15 kPa, P= 0.039).
Soil homogenization influenced the second principal compo-nent (Fig. 1, PCA axis 2, P= 0.042), with significant interactiveeffects between wetting direction and effective pore size domain(P= 0.013), and drought and wetting direction (P= 0.039).Proteins and lipids were highly correlated (80.9, 80.9%,respectively) with PCA axis 2 (Supplementary Table 1). The soleeffect of soil homogenization on the relative abundance ofcompound classes was observed as a depletion of unnamedcompounds in loosely held pore waters (P= 0.033) (Fig. 2).
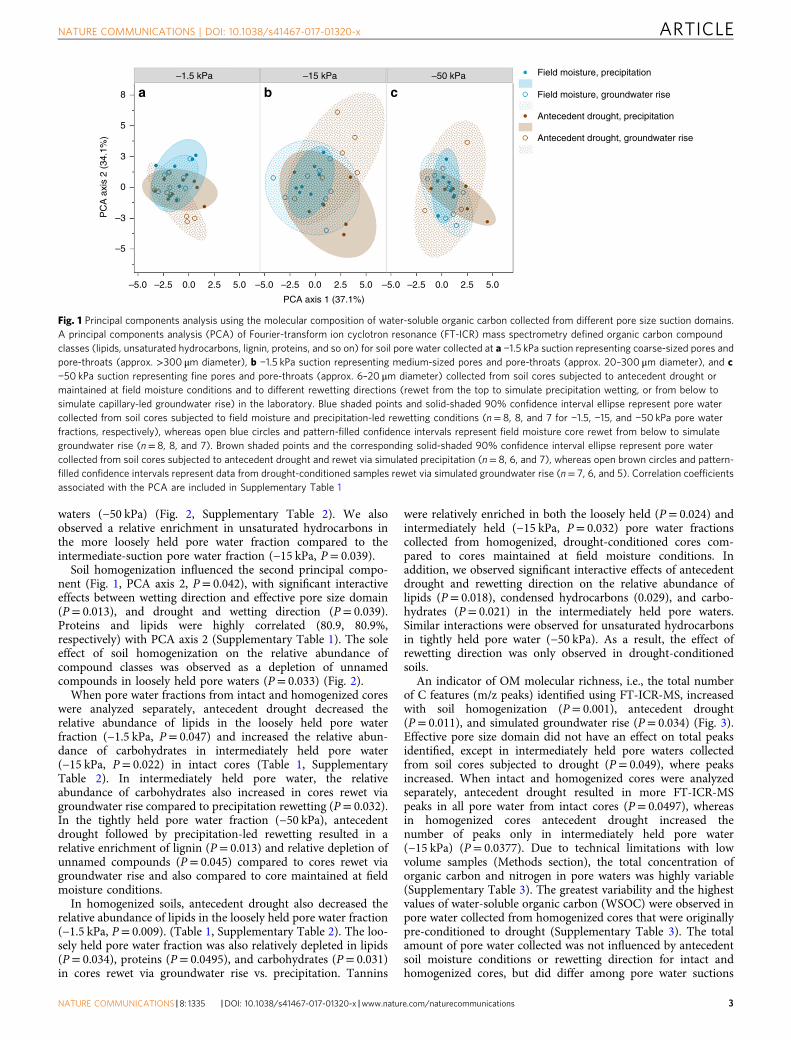
When pore water fractions from intact and homogenized coreswere analyzed separately, antecedent drought decreased therelative abundance of lipids in the loosely held pore waterfraction (−1.5 kPa, P= 0.047) and increased the relative abun-dance of carbohydrates in intermediately held pore water(−15 kPa, P= 0.022) in intact cores (Table 1, SupplementaryTable 2). In intermediately held pore water, the relativeabundance of carbohydrates also increased in cores rewet viagroundwater rise compared to precipitation rewetting (P= 0.032).In the tightly held pore water fraction (−50 kPa), antecedentdrought followed by precipitation-led rewetting resulted in arelative enrichment of lignin (P= 0.013) and relative depletion ofunnamed compounds (P= 0.045) compared to cores rewet viagroundwater rise and also compared to core maintained at fieldmoisture conditions.
In homogenized soils, antecedent drought also decreased therelative abundance of lipids in the loosely held pore water fraction(−1.5 kPa, P= 0.009). (Table 1, Supplementary Table 2). The loo-sely held pore water fraction was also relatively depleted in lipids(P= 0.034), proteins (P= 0.0495), and carbohydrates (P= 0.031)in cores rewet via groundwater rise vs. precipitation. Tannins
were relatively enriched in both the loosely held (P= 0.024) andintermediately held (−15 kPa, P= 0.032) pore water fractionscollected from homogenized, drought-conditioned cores com-pared to cores maintained at field moisture conditions. Inaddition, we observed significant interactive effects of antecedentdrought and rewetting direction on the relative abundance oflipids (P= 0.018), condensed hydrocarbons (0.029), and carbo-hydrates (P= 0.021) in the intermediately held pore waters.Similar interactions were observed for unsaturated hydrocarbonsin tightly held pore water (−50 kPa). As a result, the effect ofrewetting direction was only observed in drought-conditionedsoils.
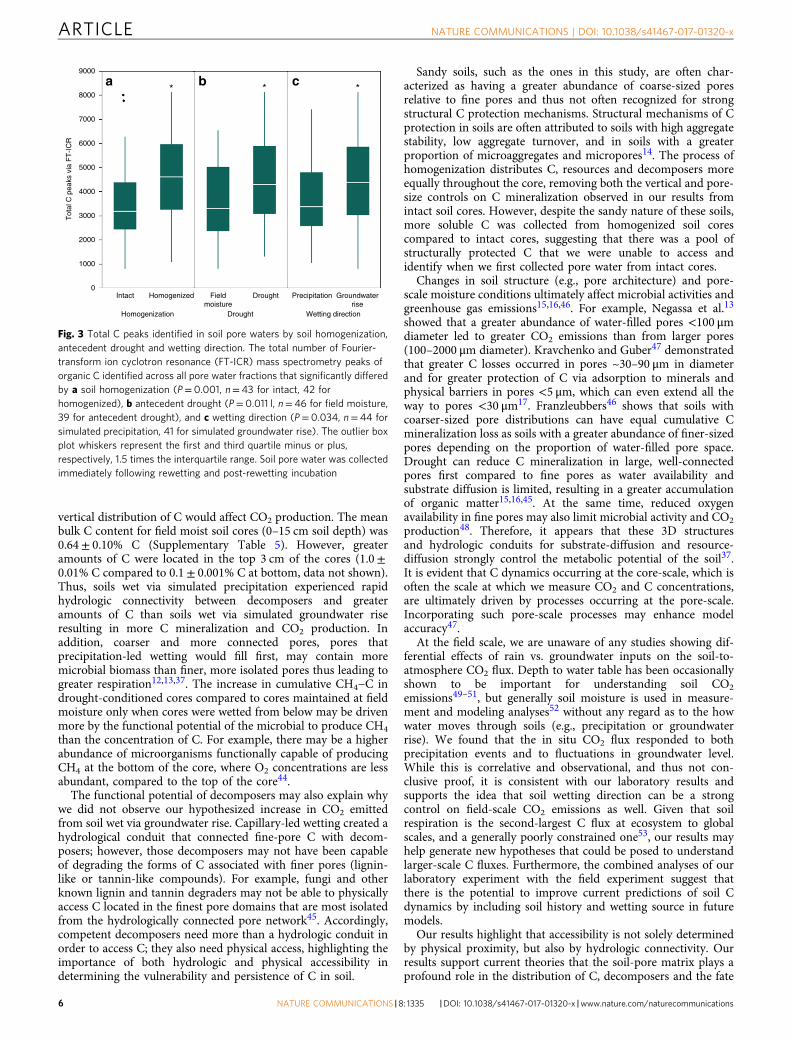
An indicator of OM molecular richness, i.e., the total numberof C features (m/z peaks) identified using FT-ICR-MS, increasedwith soil homogenization (P= 0.001), antecedent drought(P= 0.011), and simulated groundwater rise (P= 0.034) (Fig. 3).Effective pore size domain did not have an effect on total peaksidentified, except in intermediately held pore waters collectedfrom soil cores subjected to drought (P= 0.049), where peaksincreased. When intact and homogenized cores were analyzedseparately, antecedent drought resulted in more FT-ICR-MSpeaks in all pore water from intact cores (P= 0.0497), whereasin homogenized cores antecedent drought increased thenumber of peaks only in intermediately held pore water(−15 kPa) (P= 0.0377). Due to technical limitations with lowvolume samples (Methods section), the total concentration oforganic carbon and nitrogen in pore waters was highly variable(Supplementary Table 3). The greatest variability and the highestvalues of water-soluble organic carbon (WSOC) were observed inpore water collected from homogenized cores that were originallypre-conditioned to drought (Supplementary Table 3). The totalamount of pore water collected was not influenced by antecedentsoil moisture conditions or rewetting direction for intact andhomogenized cores, but did differ among pore water suctions
8 a b c–1.5 kPa –15 kPa –50 kPa Field moisture, precipitation
Field moisture, groundwater rise
Antecedent drought, precipitation
Antecedent drought, groundwater rise5
3
PC
A a
xis
2 (3
4.1%
)
0
–3
–5
–5.0 –2.5 0.0 2.5 5.0 –5.0 –2.5 0.0
PCA axis 1 (37.1%)
2.5 5.0 –5.0 –2.5 0.0 2.5 5.0
Fig. 1 Principal components analysis using the molecular composition of water-soluble organic carbon collected from different pore size suction domains.A principal components analysis (PCA) of Fourier-transform ion cyclotron resonance (FT-ICR) mass spectrometry defined organic carbon compoundclasses (lipids, unsaturated hydrocarbons, lignin, proteins, and so on) for soil pore water collected at a −1.5 kPa suction representing coarse-sized pores andpore-throats (approx. >300 μm diameter), b −1.5 kPa suction representing medium-sized pores and pore-throats (approx. 20–300 μm diameter), and c−50 kPa suction representing fine pores and pore-throats (approx. 6–20 μm diameter) collected from soil cores subjected to antecedent drought ormaintained at field moisture conditions and to different rewetting directions (rewet from the top to simulate precipitation wetting, or from below tosimulate capillary-led groundwater rise) in the laboratory. Blue shaded points and solid-shaded 90% confidence interval ellipse represent pore watercollected from soil cores subjected to field moisture and precipitation-led rewetting conditions (n= 8, 8, and 7 for −1.5, −15, and −50 kPa pore waterfractions, respectively), whereas open blue circles and pattern-filled confidence intervals represent field moisture core rewet from below to simulategroundwater rise (n= 8, 8, and 7). Brown shaded points and the corresponding solid-shaded 90% confidence interval ellipse represent pore watercollected from soil cores subjected to antecedent drought and rewet via simulated precipitation (n= 8, 6, and 7), whereas open brown circles and pattern-filled confidence intervals represent data from drought-conditioned samples rewet via simulated groundwater rise (n= 7, 6, and 5). Correlation coefficientsassociated with the PCA are included in Supplementary Table 1
NATURE COMMUNICATIONS | DOI: 10.1038/s41467-017-01320-x ARTICLE
NATURE COMMUNICATIONS |8: 1335 |DOI: 10.1038/s41467-017-01320-x |www.nature.com/naturecommunications 3
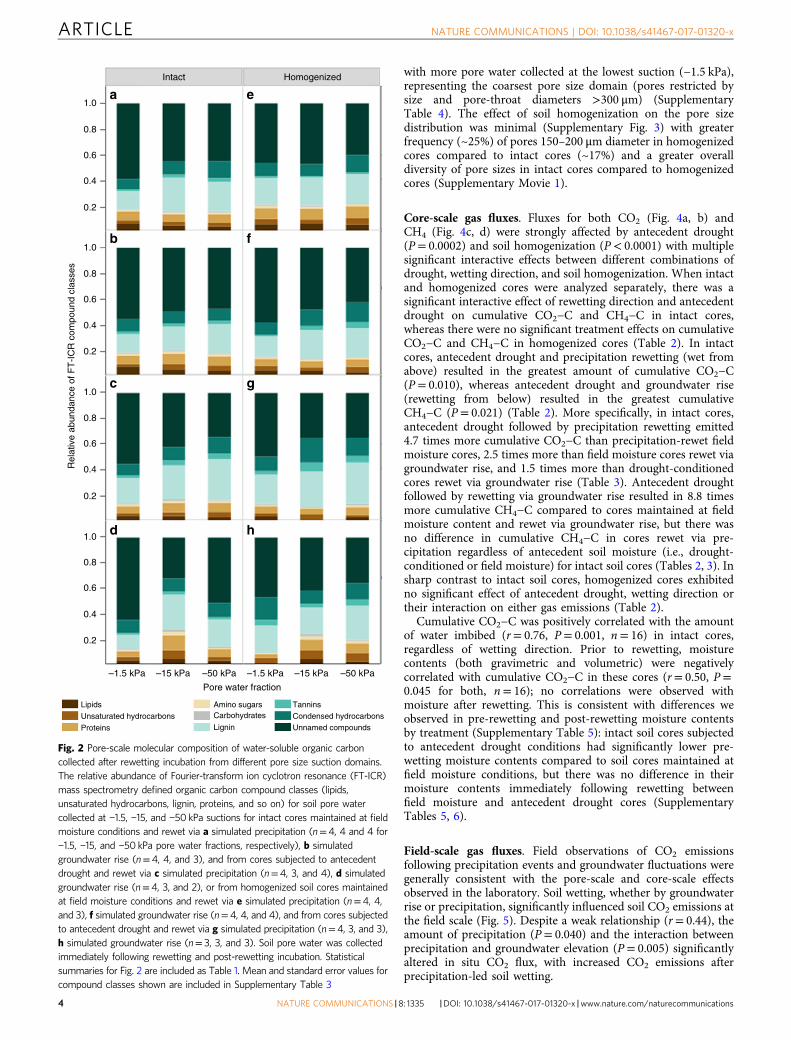
with more pore water collected at the lowest suction (−1.5 kPa),representing the coarsest pore size domain (pores restricted bysize and pore-throat diameters >300 μm) (SupplementaryTable 4). The effect of soil homogenization on the pore sizedistribution was minimal (Supplementary Fig. 3) with greaterfrequency (~25%) of pores 150–200 μm diameter in homogenizedcores compared to intact cores (~17%) and a greater overalldiversity of pore sizes in intact cores compared to homogenizedcores (Supplementary Movie 1).
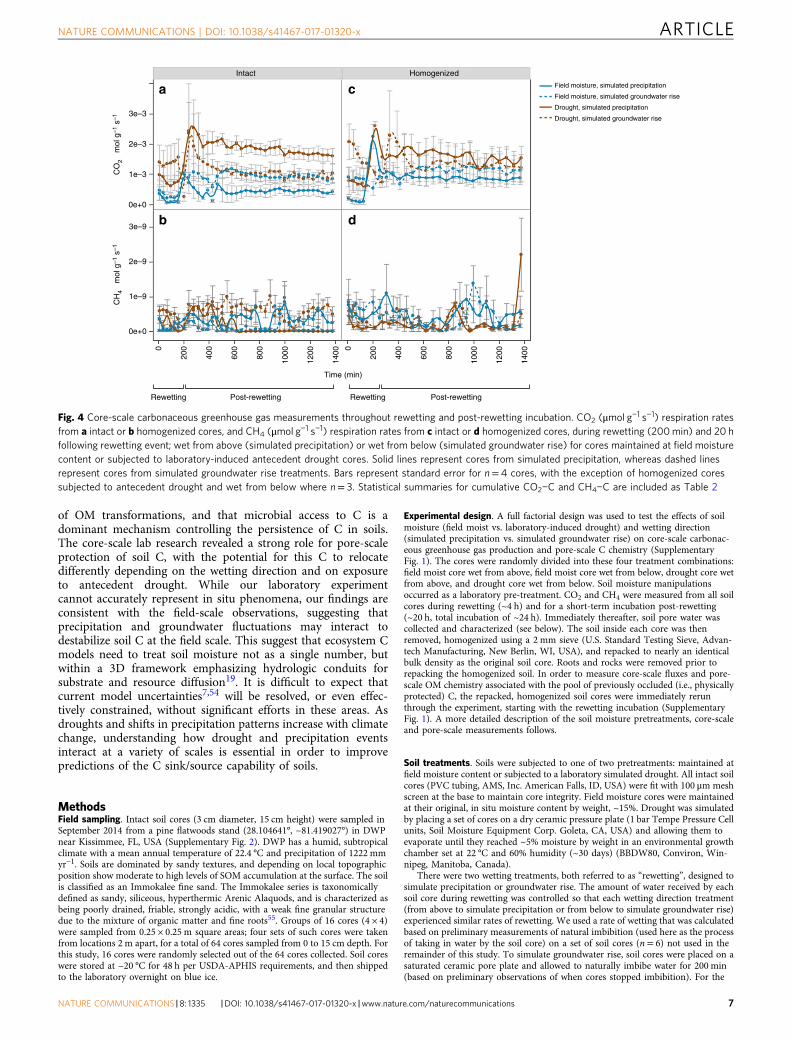
Core-scale gas fluxes. Fluxes for both CO2 (Fig. 4a, b) andCH4 (Fig. 4c, d) were strongly affected by antecedent drought(P= 0.0002) and soil homogenization (P< 0.0001) with multiplesignificant interactive effects between different combinations ofdrought, wetting direction, and soil homogenization. When intactand homogenized cores were analyzed separately, there was asignificant interactive effect of rewetting direction and antecedentdrought on cumulative CO2−C and CH4−C in intact cores,whereas there were no significant treatment effects on cumulativeCO2−C and CH4−C in homogenized cores (Table 2). In intactcores, antecedent drought and precipitation rewetting (wet fromabove) resulted in the greatest amount of cumulative CO2−C(P= 0.010), whereas antecedent drought and groundwater rise(rewetting from below) resulted in the greatest cumulativeCH4−C (P= 0.021) (Table 2). More specifically, in intact cores,antecedent drought followed by precipitation rewetting emitted4.7 times more cumulative CO2−C than precipitation-rewet fieldmoisture cores, 2.5 times more than field moisture cores rewet viagroundwater rise, and 1.5 times more than drought-conditionedcores rewet via groundwater rise (Table 3). Antecedent droughtfollowed by rewetting via groundwater rise resulted in 8.8 timesmore cumulative CH4−C compared to cores maintained at fieldmoisture content and rewet via groundwater rise, but there wasno difference in cumulative CH4−C in cores rewet via pre-cipitation regardless of antecedent soil moisture (i.e., drought-conditioned or field moisture) for intact soil cores (Tables 2, 3). Insharp contrast to intact soil cores, homogenized cores exhibitedno significant effect of antecedent drought, wetting direction ortheir interaction on either gas emissions (Table 2).
Cumulative CO2−C was positively correlated with the amountof water imbibed (r= 0.76, P= 0.001, n= 16) in intact cores,regardless of wetting direction. Prior to rewetting, moisturecontents (both gravimetric and volumetric) were negativelycorrelated with cumulative CO2−C in these cores (r= 0.50, P=0.045 for both, n= 16); no correlations were observed withmoisture after rewetting. This is consistent with differences weobserved in pre-rewetting and post-rewetting moisture contentsby treatment (Supplementary Table 5): intact soil cores subjectedto antecedent drought conditions had significantly lower pre-wetting moisture contents compared to soil cores maintained atfield moisture conditions, but there was no difference in theirmoisture contents immediately following rewetting betweenfield moisture and antecedent drought cores (SupplementaryTables 5, 6).
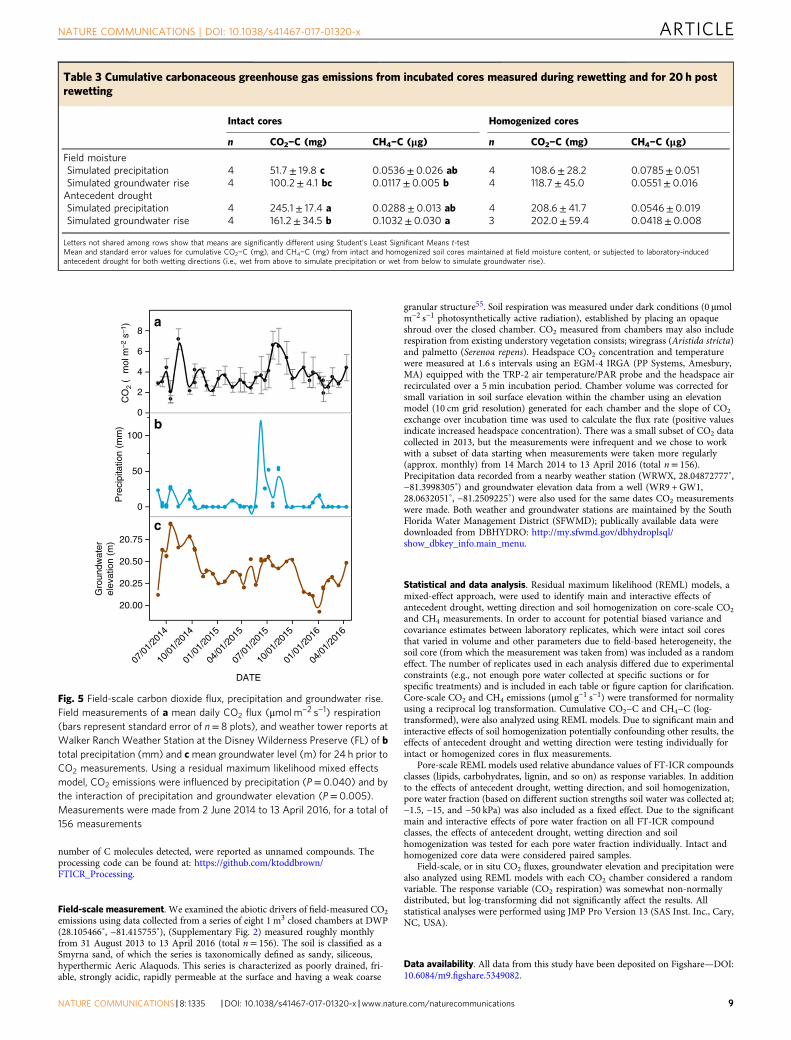
Field-scale gas fluxes. Field observations of CO2 emissionsfollowing precipitation events and groundwater fluctuations weregenerally consistent with the pore-scale and core-scale effectsobserved in the laboratory. Soil wetting, whether by groundwaterrise or precipitation, significantly influenced soil CO2 emissions atthe field scale (Fig. 5). Despite a weak relationship (r= 0.44), theamount of precipitation (P= 0.040) and the interaction betweenprecipitation and groundwater elevation (P= 0.005) significantlyaltered in situ CO2 flux, with increased CO2 emissions afterprecipitation-led soil wetting.
1.0
Intact Homogenized
0.8
0.6
0.4
0.2
1.0
0.8
0.6
Rel
ativ
e ab
unda
nce
of F
T-I
CR
com
poun
d cl
asse
s
0.4
0.2
1.0
0.8
0.6
0.4
0.2
1.0
0.8
0.6
0.4
0.2
–1.5 kPa –15 kPa –50 kPa
Pore water fraction
–1.5 kPa –15 kPa –50 kPa
a e
b f
c g
d h
Unnamed compoundsCondensed hydrocarbonsTannins
Lignin
CarbohydratesAmino sugars
Proteins
Unsaturated hydrocarbons
Lipids
Fig. 2 Pore-scale molecular composition of water-soluble organic carboncollected after rewetting incubation from different pore size suction domains.The relative abundance of Fourier-transform ion cyclotron resonance (FT-ICR)mass spectrometry defined organic carbon compound classes (lipids,unsaturated hydrocarbons, lignin, proteins, and so on) for soil pore watercollected at −1.5, −15, and −50 kPa suctions for intact cores maintained at fieldmoisture conditions and rewet via a simulated precipitation (n=4, 4 and 4 for−1.5, −15, and −50 kPa pore water fractions, respectively), b simulatedgroundwater rise (n=4, 4, and 3), and from cores subjected to antecedentdrought and rewet via c simulated precipitation (n=4, 3, and 4), d simulatedgroundwater rise (n=4, 3, and 2), or from homogenized soil cores maintainedat field moisture conditions and rewet via e simulated precipitation (n=4, 4,and 3), f simulated groundwater rise (n=4, 4, and 4), and from cores subjectedto antecedent drought and rewet via g simulated precipitation (n=4, 3, and 3),h simulated groundwater rise (n= 3, 3, and 3). Soil pore water was collectedimmediately following rewetting and post-rewetting incubation. Statisticalsummaries for Fig. 2 are included as Table 1. Mean and standard error values forcompound classes shown are included in Supplementary Table 3
ARTICLE NATURE COMMUNICATIONS | DOI: 10.1038/s41467-017-01320-x
4 NATURE COMMUNICATIONS | 8: 1335 |DOI: 10.1038/s41467-017-01320-x |www.nature.com/naturecommunications
DiscussionEffective pore size domain was a stronger predictor of both thecomposition and concentration of soluble C in pore water thanantecedent drought or rewetting direction. More tightly held porewaters (−50 kPa), sampled from isolated, fine (~6 μm diameter)pores and pore-throats, contained relatively more ‘complex’ Ccompounds (e.g., lignin and tannin-like compounds) comparedto the more loosely held pore waters (e.g., −1.5 kPa, coarse-sized,more connected pores, >200 μm). These results are consistentwith previous results measured from similarly located soils atDWP, Florida, where soluble-OM associated with more tightlyheld pore water was composed of relatively more lignin, tannins,and condensed hydrocarbons, whereas more loosely held porewater was more enriched in lipids18.
Antecedent soil moisture (i.e., drought), however, altered Cprocesses at multiple scales11,35. At the pore-scale, antecedentdrought showed a decrease in lipids in loosely held pore water,possibly indicating a loss of microbial biomass due to prolongeddry conditions36, as the cellular membrane of microorganisms isdominated by phospholipids37,38. Conversely, pore water tanninsand lignin increased following drought. This is consistent withour hypothesis that the abundance of complex C compounds(such as lignin, tannin, and condensed hydrocarbons) wouldincrease in pore water collected from soil subjected to antecedentdrought. The relative increase in complex C compounds may bedue to a negative enrichment from preferential degradation ofother compounds (such as lipids, from above), or due to thephysio-chemical relationship between ionic strength and thesorption of C to mineral surfaces. When soils are subjected todrying conditions, the ionic strength increases, resulting in therelease of C compounds that were previously sorbed to mineralsurfaces30,31. This results in a greater solubilization of previouslyprotected, complex (e.g., high molecular weight) C compounds31.
At the core-scale, the higher CO2 and CH4 fluxes fromdrought-conditioned soil relative to the field moist cores duringrewetting was consistent with the Birch Effect9 and may have
been due to a rapid release of microbial osmolytes from thesudden shift in soil water content35,39,40. It may have also beendue to increased hydrologic connectivity collocating decomposerswith previously inaccessible C and/or microbial necromass-C thataccumulated during drying36. As we hypothesized, we detectedfewer lipids in the loosely held pore water sampled from drought-conditioned soil compared to cores maintained at field moisture,suggesting accumulated microbial residues was rapidly miner-alized when drought-conditioned soils were rewet, leading tohigher CO2 and CH4 emissions. While the majority of studiesreport that the pulse in mineralization is often short-lived,returning to respective field moist emissions within hours ordays8, our study highlights that differences in the immediateresponse for CO2 and CH4 production may depend on thedirection of soil rewetting.
Even during our short-term rewetting experiment, we observeda legacy effect from antecedent drought on CO2 rates for intactsoil cores during the post-wetting incubation (Fig. 4a). In ourstudy, drought-conditioned soils imbibed and held more waterupon rewetting than cores maintained at field moist conditions(Supplementary Table 5). At the same time, the moisture contentof all intact soil cores (both those maintained at field moistureand antecedent drought conditions) did not differ after beingrewet. Thus, drought legacy and wetting direction (precipitationor groundwater rise) are perhaps more important determinants ofshort-term C mineralization than current soil moisture content inthese soils. Current models and representations of soil Cdynamics are based on a ‘snapshot’ of current soil conditions,with no consideration of history35,41. Taking historical patterns ofdrought and precipitation into account may improve suchrepresentations42,43.
While we hypothesized greater CO2 emissions from drought-stricken soils rewet from below (groundwater rise), simulatedprecipitation actually emitted more CO2 from intact soils. Thissuggests that while our assumptions about the spatial distributionof soluble C were correct, we did not take into account how the
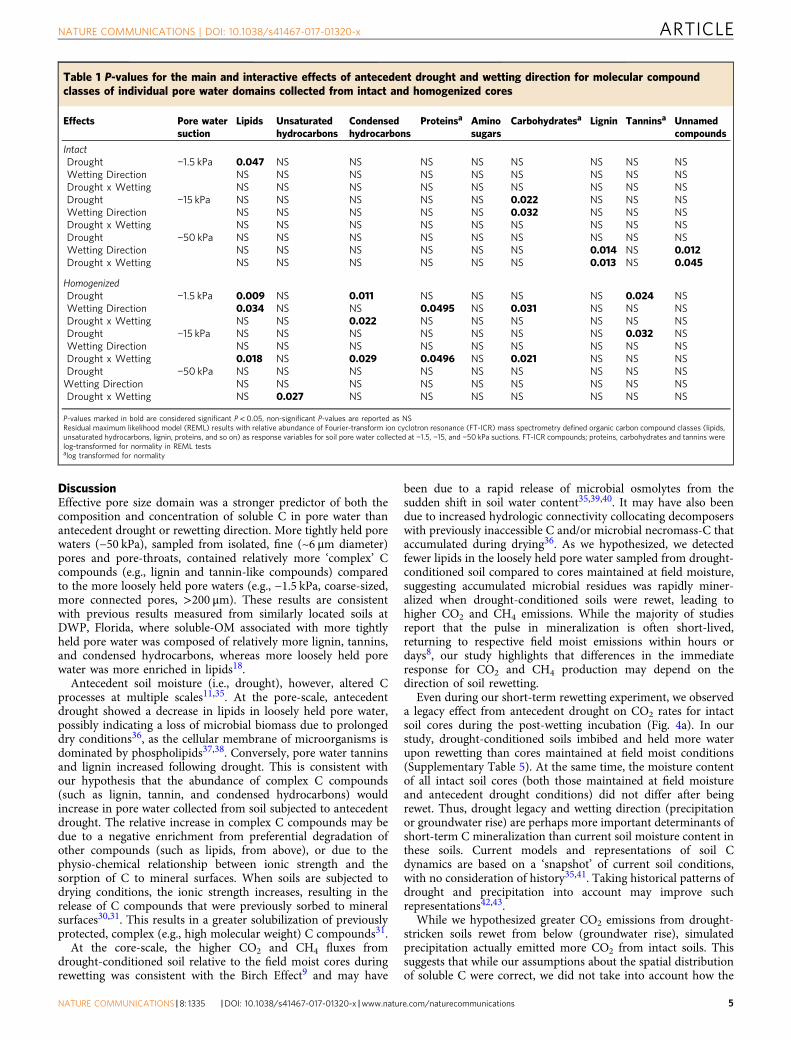
Table 1 P-values for the main and interactive effects of antecedent drought and wetting direction for molecular compoundclasses of individual pore water domains collected from intact and homogenized cores
Effects Pore watersuction
Lipids Unsaturatedhydrocarbons
Condensedhydrocarbons
Proteinsa Aminosugars
Carbohydratesa Lignin Tanninsa Unnamedcompounds
IntactDrought −1.5 kPa 0.047 NS NS NS NS NS NS NS NSWetting Direction NS NS NS NS NS NS NS NS NSDrought x Wetting NS NS NS NS NS NS NS NS NSDrought −15 kPa NS NS NS NS NS 0.022 NS NS NSWetting Direction NS NS NS NS NS 0.032 NS NS NSDrought x Wetting NS NS NS NS NS NS NS NS NSDrought −50 kPa NS NS NS NS NS NS NS NS NSWetting Direction NS NS NS NS NS NS 0.014 NS 0.012Drought x Wetting NS NS NS NS NS NS 0.013 NS 0.045
HomogenizedDrought −1.5 kPa 0.009 NS 0.011 NS NS NS NS 0.024 NSWetting Direction 0.034 NS NS 0.0495 NS 0.031 NS NS NSDrought x Wetting NS NS 0.022 NS NS NS NS NS NSDrought −15 kPa NS NS NS NS NS NS NS 0.032 NSWetting Direction NS NS NS NS NS NS NS NS NSDrought x Wetting 0.018 NS 0.029 0.0496 NS 0.021 NS NS NSDrought −50 kPa NS NS NS NS NS NS NS NS NSWetting Direction NS NS NS NS NS NS NS NS NSDrought x Wetting NS 0.027 NS NS NS NS NS NS NS
P-values marked in bold are considered significant P< 0.05, non-significant P-values are reported as NSResidual maximum likelihood model (REML) results with relative abundance of Fourier-transform ion cyclotron resonance (FT-ICR) mass spectrometry defined organic carbon compound classes (lipids,unsaturated hydrocarbons, lignin, proteins, and so on) as response variables for soil pore water collected at −1.5, −15, and −50 kPa suctions. FT-ICR compounds; proteins, carbohydrates and tannins werelog-transformed for normality in REML testsalog transformed for normality
NATURE COMMUNICATIONS | DOI: 10.1038/s41467-017-01320-x ARTICLE
NATURE COMMUNICATIONS |8: 1335 |DOI: 10.1038/s41467-017-01320-x |www.nature.com/naturecommunications 5
vertical distribution of C would affect CO2 production. The meanbulk C content for field moist soil cores (0–15 cm soil depth) was0.64± 0.10% C (Supplementary Table 5). However, greateramounts of C were located in the top 3 cm of the cores (1.0±0.01% C compared to 0.1± 0.001% C at bottom, data not shown).Thus, soils wet via simulated precipitation experienced rapidhydrologic connectivity between decomposers and greateramounts of C than soils wet via simulated groundwater riseresulting in more C mineralization and CO2 production. Inaddition, coarser and more connected pores, pores thatprecipitation-led wetting would fill first, may contain moremicrobial biomass than finer, more isolated pores thus leading togreater respiration12,13,37. The increase in cumulative CH4−C indrought-conditioned cores compared to cores maintained at fieldmoisture only when cores were wetted from below may be drivenmore by the functional potential of the microbial to produce CH4
than the concentration of C. For example, there may be a higherabundance of microorganisms functionally capable of producingCH4 at the bottom of the core, where O2 concentrations are lessabundant, compared to the top of the core44.
The functional potential of decomposers may also explain whywe did not observe our hypothesized increase in CO2 emittedfrom soil wet via groundwater rise. Capillary-led wetting created ahydrological conduit that connected fine-pore C with decom-posers; however, those decomposers may not have been capableof degrading the forms of C associated with finer pores (lignin-like or tannin-like compounds). For example, fungi and otherknown lignin and tannin degraders may not be able to physicallyaccess C located in the finest pore domains that are most isolatedfrom the hydrologically connected pore network45. Accordingly,competent decomposers need more than a hydrologic conduit inorder to access C; they also need physical access, highlighting theimportance of both hydrologic and physical accessibility indetermining the vulnerability and persistence of C in soil.
Sandy soils, such as the ones in this study, are often char-acterized as having a greater abundance of coarse-sized poresrelative to fine pores and thus not often recognized for strongstructural C protection mechanisms. Structural mechanisms of Cprotection in soils are often attributed to soils with high aggregatestability, low aggregate turnover, and in soils with a greaterproportion of microaggregates and micropores14. The process ofhomogenization distributes C, resources and decomposers moreequally throughout the core, removing both the vertical and pore-size controls on C mineralization observed in our results fromintact soil cores. However, despite the sandy nature of these soils,more soluble C was collected from homogenized soil corescompared to intact cores, suggesting that there was a pool ofstructurally protected C that we were unable to access andidentify when we first collected pore water from intact cores.
Changes in soil structure (e.g., pore architecture) and pore-scale moisture conditions ultimately affect microbial activities andgreenhouse gas emissions15,16,46. For example, Negassa et al.13
showed that a greater abundance of water-filled pores <100 μmdiameter led to greater CO2 emissions than from larger pores(100–2000 μm diameter). Kravchenko and Guber47 demonstratedthat greater C losses occurred in pores ~30–90 μm in diameterand for greater protection of C via adsorption to minerals andphysical barriers in pores <5 μm, which can even extend all theway to pores <30 μm17. Franzleubbers46 shows that soils withcoarser-sized pore distributions can have equal cumulative Cmineralization loss as soils with a greater abundance of finer-sizedpores depending on the proportion of water-filled pore space.Drought can reduce C mineralization in large, well-connectedpores first compared to fine pores as water availability andsubstrate diffusion is limited, resulting in a greater accumulationof organic matter15,16,45. At the same time, reduced oxygenavailability in fine pores may also limit microbial activity and CO2
production48. Therefore, it appears that these 3D structuresand hydrologic conduits for substrate-diffusion and resource-diffusion strongly control the metabolic potential of the soil37.It is evident that C dynamics occurring at the core-scale, which isoften the scale at which we measure CO2 and C concentrations,are ultimately driven by processes occurring at the pore-scale.Incorporating such pore-scale processes may enhance modelaccuracy47.
At the field scale, we are unaware of any studies showing dif-ferential effects of rain vs. groundwater inputs on the soil-to-atmosphere CO2 flux. Depth to water table has been occasionallyshown to be important for understanding soil CO2
emissions49–51, but generally soil moisture is used in measure-ment and modeling analyses52 without any regard as to the howwater moves through soils (e.g., precipitation or groundwaterrise). We found that the in situ CO2 flux responded to bothprecipitation events and to fluctuations in groundwater level.While this is correlative and observational, and thus not con-clusive proof, it is consistent with our laboratory results andsupports the idea that soil wetting direction can be a strongcontrol on field-scale CO2 emissions as well. Given that soilrespiration is the second-largest C flux at ecosystem to globalscales, and a generally poorly constrained one53, our results mayhelp generate new hypotheses that could be posed to understandlarger-scale C fluxes. Furthermore, the combined analyses of ourlaboratory experiment with the field experiment suggest thatthere is the potential to improve current predictions of soil Cdynamics by including soil history and wetting source in futuremodels.
Our results highlight that accessibility is not solely determinedby physical proximity, but also by hydrologic connectivity. Ourresults support current theories that the soil-pore matrix plays aprofound role in the distribution of C, decomposers and the fate
9000
* * *8000
7000
6000
Tot
al C
pea
ks v
ia F
T-I
CR
5000
4000
3000
2000
1000
0Intact Field
moistureDrought
Drought
Precipitation Groundwaterrise
Wetting direction
Homogenized
Homogenization
a b c
Fig. 3 Total C peaks identified in soil pore waters by soil homogenization,antecedent drought and wetting direction. The total number of Fourier-transform ion cyclotron resonance (FT-ICR) mass spectrometry peaks oforganic C identified across all pore water fractions that significantly differedby a soil homogenization (P= 0.001, n= 43 for intact, 42 forhomogenized), b antecedent drought (P= 0.011 l, n= 46 for field moisture,39 for antecedent drought), and c wetting direction (P= 0.034, n= 44 forsimulated precipitation, 41 for simulated groundwater rise). The outlier boxplot whiskers represent the first and third quartile minus or plus,respectively, 1.5 times the interquartile range. Soil pore water was collectedimmediately following rewetting and post-rewetting incubation
ARTICLE NATURE COMMUNICATIONS | DOI: 10.1038/s41467-017-01320-x
6 NATURE COMMUNICATIONS | 8: 1335 |DOI: 10.1038/s41467-017-01320-x |www.nature.com/naturecommunications
of OM transformations, and that microbial access to C is adominant mechanism controlling the persistence of C in soils.The core-scale lab research revealed a strong role for pore-scaleprotection of soil C, with the potential for this C to relocatedifferently depending on the wetting direction and on exposureto antecedent drought. While our laboratory experimentcannot accurately represent in situ phenomena, our findings areconsistent with the field-scale observations, suggesting thatprecipitation and groundwater fluctuations may interact todestabilize soil C at the field scale. This suggest that ecosystem Cmodels need to treat soil moisture not as a single number, butwithin a 3D framework emphasizing hydrologic conduits forsubstrate and resource diffusion19. It is difficult to expect thatcurrent model uncertainties7,54 will be resolved, or even effec-tively constrained, without significant efforts in these areas. Asdroughts and shifts in precipitation patterns increase with climatechange, understanding how drought and precipitation eventsinteract at a variety of scales is essential in order to improvepredictions of the C sink/source capability of soils.
MethodsField sampling. Intact soil cores (3 cm diameter, 15 cm height) were sampled inSeptember 2014 from a pine flatwoods stand (28.104641°, −81.419027°) in DWPnear Kissimmee, FL, USA (Supplementary Fig. 2). DWP has a humid, subtropicalclimate with a mean annual temperature of 22.4 °C and precipitation of 1222 mmyr−1. Soils are dominated by sandy textures, and depending on local topographicposition show moderate to high levels of SOM accumulation at the surface. The soilis classified as an Immokalee fine sand. The Immokalee series is taxonomicallydefined as sandy, siliceous, hyperthermic Arenic Alaquods, and is characterized asbeing poorly drained, friable, strongly acidic, with a weak fine granular structuredue to the mixture of organic matter and fine roots55. Groups of 16 cores (4 × 4)were sampled from 0.25 × 0.25 m square areas; four sets of such cores were takenfrom locations 2 m apart, for a total of 64 cores sampled from 0 to 15 cm depth. Forthis study, 16 cores were randomly selected out of the 64 cores collected. Soil coreswere stored at −20 °C for 48 h per USDA-APHIS requirements, and then shippedto the laboratory overnight on blue ice.
Experimental design. A full factorial design was used to test the effects of soilmoisture (field moist vs. laboratory-induced drought) and wetting direction(simulated precipitation vs. simulated groundwater rise) on core-scale carbonac-eous greenhouse gas production and pore-scale C chemistry (SupplementaryFig. 1). The cores were randomly divided into these four treatment combinations:field moist core wet from above, field moist core wet from below, drought core wetfrom above, and drought core wet from below. Soil moisture manipulationsoccurred as a laboratory pre-treatment. CO2 and CH4 were measured from all soilcores during rewetting (~4 h) and for a short-term incubation post-rewetting(~20 h, total incubation of ~24 h). Immediately thereafter, soil pore water wascollected and characterized (see below). The soil inside each core was thenremoved, homogenized using a 2 mm sieve (U.S. Standard Testing Sieve, Advan-tech Manufacturing, New Berlin, WI, USA), and repacked to nearly an identicalbulk density as the original soil core. Roots and rocks were removed prior torepacking the homogenized soil. In order to measure core-scale fluxes and pore-scale OM chemistry associated with the pool of previously occluded (i.e., physicallyprotected) C, the repacked, homogenized soil cores were immediately rerunthrough the experiment, starting with the rewetting incubation (SupplementaryFig. 1). A more detailed description of the soil moisture pretreatments, core-scaleand pore-scale measurements follows.
Soil treatments. Soils were subjected to one of two pretreatments: maintained atfield moisture content or subjected to a laboratory simulated drought. All intact soilcores (PVC tubing, AMS, Inc. American Falls, ID, USA) were fit with 100 μm meshscreen at the base to maintain core integrity. Field moisture cores were maintainedat their original, in situ moisture content by weight, ~15%. Drought was simulatedby placing a set of cores on a dry ceramic pressure plate (1 bar Tempe Pressure Cellunits, Soil Moisture Equipment Corp. Goleta, CA, USA) and allowing them toevaporate until they reached ~5% moisture by weight in an environmental growthchamber set at 22 °C and 60% humidity (~30 days) (BBDW80, Conviron, Win-nipeg, Manitoba, Canada).
There were two wetting treatments, both referred to as “rewetting”, designed tosimulate precipitation or groundwater rise. The amount of water received by eachsoil core during rewetting was controlled so that each wetting direction treatment(from above to simulate precipitation or from below to simulate groundwater rise)experienced similar rates of rewetting. We used a rate of wetting that was calculatedbased on preliminary measurements of natural imbibition (used here as the processof taking in water by the soil core) on a set of soil cores (n = 6) not used in theremainder of this study. To simulate groundwater rise, soil cores were placed on asaturated ceramic pore plate and allowed to naturally imbibe water for 200 min(based on preliminary observations of when cores stopped imbibition). For the
3e–3
Intact Homogenized
Field moisture, simulated precipitation
Field moisture, simulated groundwater rise
Drought, simulated precipitation
Drought, simulated groundwater rise
2e–3
CO
2 µm
ol g
–1 s
–1C
H4
µmol
g–1
s–1
1e–3
0e+0
3e–9
2e–9
1e–9
0e+0
0
200
400
600
800
1000
1200
1400
Time (min)
Post-rewettingRewetting Post-rewettingRewetting
0
200
400
600
800
1000
1200
1400
a c
b d
Fig. 4 Core-scale carbonaceous greenhouse gas measurements throughout rewetting and post-rewetting incubation. CO2 (μmol g−1 s−1) respiration ratesfrom a intact or b homogenized cores, and CH4 (μmol g−1 s−1) respiration rates from c intact or d homogenized cores, during rewetting (200min) and 20 hfollowing rewetting event; wet from above (simulated precipitation) or wet from below (simulated groundwater rise) for cores maintained at field moisturecontent or subjected to laboratory-induced antecedent drought cores. Solid lines represent cores from simulated precipitation, whereas dashed linesrepresent cores from simulated groundwater rise treatments. Bars represent standard error for n= 4 cores, with the exception of homogenized coressubjected to antecedent drought and wet from below where n= 3. Statistical summaries for cumulative CO2−C and CH4−C are included as Table 2
NATURE COMMUNICATIONS | DOI: 10.1038/s41467-017-01320-x ARTICLE
NATURE COMMUNICATIONS |8: 1335 |DOI: 10.1038/s41467-017-01320-x |www.nature.com/naturecommunications 7
simulated precipitation treatment, cores were rewet from above using a peristalticpump (Cole Palmer, Vernon Hills, IL, USA) for 30 min at 0.53 ml min−1, followedby 0.082 ml min−1 for 170 min (again, based on preliminary observations of naturalimbibition rates) in order to control for and reproduce similar rates of wetting tothat of soils wet from below. Despite our best attempts at controlling the rate andamount of water imbibed, there were differences in the amount of water imbibedamong cores and treatments. We also observed that the initial wetting front wasmore rapid, but less uniform, in cores rewet via simulated precipitation comparedto groundwater rise (i.e., water rapidly percolated to the bottom of the core withoutcomplete horizontal saturation). By the end of rewetting (200 min), all coresappeared to have equal distributions of water throughout the soil core regardless ofwetting direction or antecedent soil moisture conditions. See SupplementaryTable 5 for the amounts of water imbibed averaged across treatments. The amountof water imbibed was measured as the difference in weight for each soil core andwas measured immediately following the rewetting treatment (i.e., after 200 min).
Core-scale measurements. Carbonaceous greenhouse gas (CO2 and CH4) con-centrations in the cores’ headspace were measured using a G2301 Picarro GHGanalyzer (Picarro, Sunnyvale, CA, USA) during the wetting period (which lasted for200 min) and after it (up to 20 h) to capture the immediate response of the soil towetting. Fluxes were computed from the concentration changes according to thefollowing Eq. (1):
A ¼ dCdt
VM
PaRT
� �; ð1Þ
where A is the flux (µmol g soil−1 s−1), dC/dt the rate of change in gas con-centration (mole fraction s−1), V the total chamber volume (cm3), M dry soil mass(g), Pa atmospheric pressure (kPa), R the universal gas constant (8.3 × 103 cm3 kPamol−1 K−1), and T air temperature (K).The raw data and the R processing code canbe found at https://github.com/bpbond/dwp_peyton. When both core-scale andpore-scale (as described below) analyses were completed, soil cores were brokenapart and a variety of soil physical and chemical properties were measured,including soil mass, bulk density, and total C and nitrogen (N). Bulk density wascalculated for each core as the mass of air-dried soil divided by the volume of theintact soil core. Subsamples of homogenized, air-dried soil were ground to <250μm using a ceramic mortar and pestle and sent to the University of Wisconsin-Madison for total C and N, where triplicates were randomly arranged and run on aFlash 2000 NC analyzer (Thermo Scientific, Wilmington, DE, USA) combustionelemental analyzer. For porosity measurements and pore size distributions, anintact and homogenized soil core was scanned using X-ray Computed Tomography(XCT) on an X-Tek/Metris XTH 320/225 kV scanner (Nikon Metrology, Belmont,CA). Data were collected at 110 kV and 265 μA X-ray power. The core sampleswere rotated continuously during the scans with momentary stops to collecteach projection (shuttling mode) while minimizing ring artifacts. A total of 3142projections were collected over 360˚ with 0.5 s exposure time and 4 frames perprojection. Image voxel size was 28 microns. The images were reconstructed toobtain 3D data sets using CT Pro 3D (Metris XT 2.2, Nikon Metrology). Repre-sentative slice and 3D images were created using VG Studio MAX 2.1 (VolumeGraphics GmbH, Heidelberg Germany). Image processing and porosity analysis(including pore volume segmentation and pore analysis) was carried out usingImageJ 1.51k (National Institute of Health, USA).
Pore-scale measurements. Pore waters were sampled by transferring each coreonto individual 100 kPa Tempe Pressure Cell units to sequentially collect porewaters at −1.5, −15, and −50 kPa using a dual valve pressure controller (Alicat
Scientific, Tucson, AZ, USA), novel method modified from Lentz56. Suctionstrengths were chosen based on preliminary work showing these particularpore water fractions are discrete for these soils18. Using the Kelvin equation33 toestimate the largest water-filled pore diameter, −1.5, −15, and −50 kPa suctionscorrespond to pore and pore-neck size diameters of ~200, 20, and 6 μm33. It isimportant to note that water collected at each suction better represents watercontained within soil pore spaces restricted by channels, or pore throats, ratherthan held within pores of approximated diameters. For clarity, these three porewater fractions (200, 20, and 6 μm) will be referred to according to their suctionstrength or collectively referred to as “effective pore size domains”. Pore water waspulled for 24 h, starting with the lowest strength, and stored at −20 °C until furtheranalysis. Because little to no pore water was collected at higher suctions (−15 and50 kPa), replication was reduced from n= 4 to n= 3 or 2 (depending on thetreatment) for select pore water analyses. As such, the number of replicates used ineach analysis is included in each table or Figure caption. For low volume pore watersamples, we prioritized characterizing the molecular composition of C in porewater rather than measuring the concentration of water-soluble N (WSN) andorganic C (WSOC), due to technical limitations in measuring low volume samplesfor WSN and WSOC. Concentrations of total C (water-soluble organic carbon,WSOC) and N (WSN) in pore water were determined via combustion catalyticoxidation (TOC-5000A TOC analyzer, Shimadzu, Columbia, MD, USA). Themolecular composition of the C dissolved in the pore water was characterized byelectrospray ionization (ESI) coupled with Fourier-transform ion cyclotron reso-nance mass spectrometry (FT-ICR). The samples were desalted by solid phaseextraction (SPE) with PPL cartridges following Dittmar et al.57. Samples were firstacidified to a pH of 2 before extraction, and the water-soluble organic matter elutedin methanol; see Tfaily et al.58. The extracts were then injected directly on a 12Tesla Bruker SolariX FT-ICR spectrometer. A standard Bruker ESI source was usedto generate negatively charged molecular ions.
Samples were then introduced to the ESI source equipped with a fused silicatube (200 μm i.d) through a syringe pump at a flow rate of 3.0 μL min−1.Experimental conditions were as follows: needle voltage, +4.4 kV; Q1 set to150m/z; and the heated resistively coated glass capillary operated at 180 °C.Ninety-six individual scans were averaged for each sample and internally calibratedusing organic matter (OM) homologous series separated by 14 Da (–CH2 groups).The mass measurement accuracy was less than 1 p.p.m. for singly charged ionsacross a broad m/z range (i.e., 200, <m/z <1200). Chemical formulas were assignedusing in-house software based on the Compound Identification Algorithmdescribed by Kujawinski and Behn59 and modified by Minor et al.60 Chemicalformulas were assigned based on the following criteria: signal-to-noise (S/N)>7,and mass measurement error <1 p.p.m., taking into consideration the presence ofC, H, O, N, S, and P and excluding other elements.
FT-ICR spectra were classified into eight biomolecular groups, referred to asFT-ICR compound classes, based on O/C and H/C counts; lipids (0<O/C≤ 0.3,1.5 ≤H/C ≤ 2.5), unsaturated hydrocarbons (0≤O/C≤ 0.125, 0.8≤H/C< 2.5),proteins (0.3 <O/C≤ 0.55, 1.5≤H/C ≤ 2.3), amino sugars (0.55<O/C≤ 0.7,1.5 ≤H/C ≤ 2.2), carbohydrates (0.7 <O/C≤ 1.5, 1.5 ≤H/C ≤ 2.5), lignin (0.125 <O/C≤ 0.65, 0.8≤H/C< 1.5), tannins (0.65<O/C≤ 1.1, 0.8 ≤H/C < 1.5), andcondensed hydrocarbons (0≤O/C≤ 0.95, 0.2≤H/C< 0.8)34,61 (SupplementaryFig. 4). FT-ICR compound classes are tentative classifications as they are solelybased on the O/C and H/C ratios from the molecular formula, not the molecularstructural. As such, it would be more accurate to describe compounds as lipid-likeor carbohydrate-like. For simplicity, we will refer to each compound class, however,as lipids, tannins, proteins, and so on. Relative abundance values were calculatedfrom count values associated with each observed biomolecule group normalized bythe total number of C molecules identified. FT-ICR spectra that did not fit into anyof the eight biomolecule group classifications, but that contributed to the total
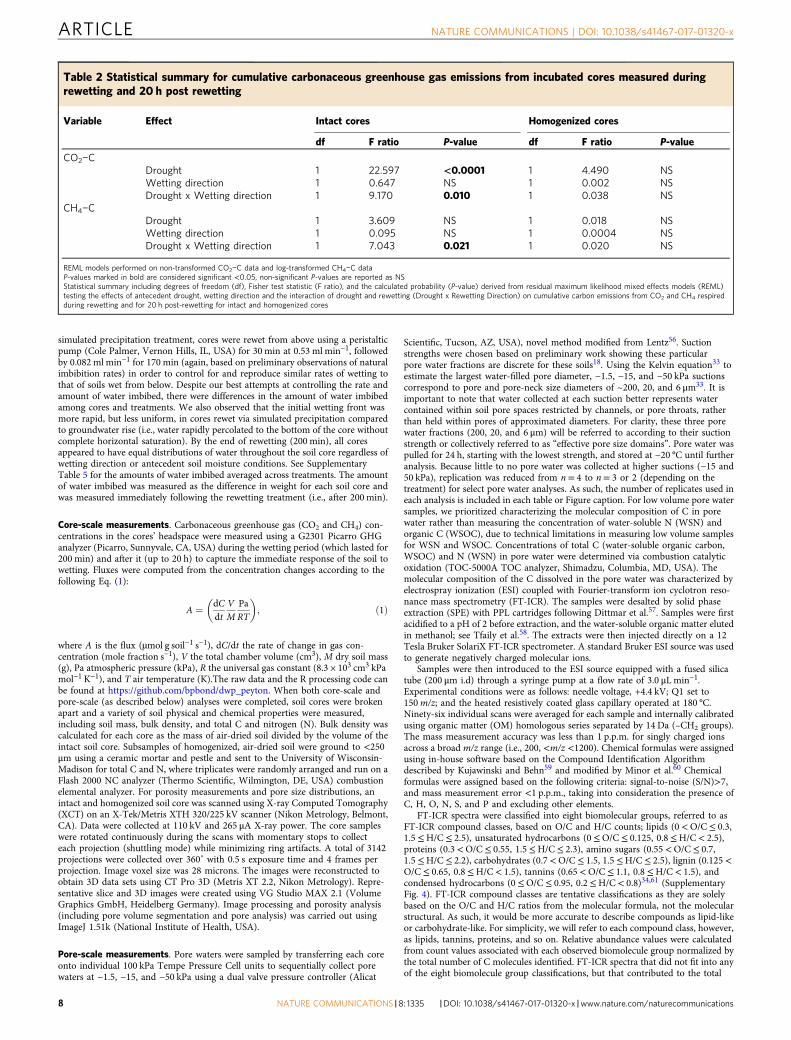
Table 2 Statistical summary for cumulative carbonaceous greenhouse gas emissions from incubated cores measured duringrewetting and 20 h post rewetting
Variable Effect Intact cores Homogenized cores
df F ratio P-value df F ratio P-value
CO2−CDrought 1 22.597 <0.0001 1 4.490 NSWetting direction 1 0.647 NS 1 0.002 NSDrought x Wetting direction 1 9.170 0.010 1 0.038 NS
CH4−CDrought 1 3.609 NS 1 0.018 NSWetting direction 1 0.095 NS 1 0.0004 NSDrought x Wetting direction 1 7.043 0.021 1 0.020 NS
REML models performed on non-transformed CO2−C data and log-transformed CH4−C dataP-values marked in bold are considered significant <0.05, non-significant P-values are reported as NSStatistical summary including degrees of freedom (df), Fisher test statistic (F ratio), and the calculated probability (P-value) derived from residual maximum likelihood mixed effects models (REML)testing the effects of antecedent drought, wetting direction and the interaction of drought and rewetting (Drought x Rewetting Direction) on cumulative carbon emissions from CO2 and CH4 respiredduring rewetting and for 20 h post-rewetting for intact and homogenized cores
ARTICLE NATURE COMMUNICATIONS | DOI: 10.1038/s41467-017-01320-x
8 NATURE COMMUNICATIONS | 8: 1335 |DOI: 10.1038/s41467-017-01320-x |www.nature.com/naturecommunications
number of C molecules detected, were reported as unnamed compounds. Theprocessing code can be found at: https://github.com/ktoddbrown/FTICR_Processing.
Field-scale measurement. We examined the abiotic drivers of field-measured CO2
emissions using data collected from a series of eight 1 m3 closed chambers at DWP(28.105466˚, −81.415755˚), (Supplementary Fig. 2) measured roughly monthlyfrom 31 August 2013 to 13 April 2016 (total n = 156). The soil is classified as aSmyrna sand, of which the series is taxonomically defined as sandy, siliceous,hyperthermic Aeric Alaquods. This series is characterized as poorly drained, fri-able, strongly acidic, rapidly permeable at the surface and having a weak coarse
granular structure55. Soil respiration was measured under dark conditions (0 µmolm−2 s−1 photosynthetically active radiation), established by placing an opaqueshroud over the closed chamber. CO2 measured from chambers may also includerespiration from existing understory vegetation consists; wiregrass (Aristida stricta)and palmetto (Serenoa repens). Headspace CO2 concentration and temperaturewere measured at 1.6 s intervals using an EGM-4 IRGA (PP Systems, Amesbury,MA) equipped with the TRP-2 air temperature/PAR probe and the headspace airrecirculated over a 5 min incubation period. Chamber volume was corrected forsmall variation in soil surface elevation within the chamber using an elevationmodel (10 cm grid resolution) generated for each chamber and the slope of CO2
exchange over incubation time was used to calculate the flux rate (positive valuesindicate increased headspace concentration). There was a small subset of CO2 datacollected in 2013, but the measurements were infrequent and we chose to workwith a subset of data starting when measurements were taken more regularly(approx. monthly) from 14 March 2014 to 13 April 2016 (total n= 156).Precipitation data recorded from a nearby weather station (WRWX, 28.04872777˚,−81.3998305˚) and groundwater elevation data from a well (WR9 + GW1,28.0632051˚, −81.2509225˚) were also used for the same dates CO2 measurementswere made. Both weather and groundwater stations are maintained by the SouthFlorida Water Management District (SFWMD); publically available data weredownloaded from DBHYDRO: http://my.sfwmd.gov/dbhydroplsql/show_dbkey_info.main_menu.
Statistical and data analysis. Residual maximum likelihood (REML) models, amixed-effect approach, were used to identify main and interactive effects ofantecedent drought, wetting direction and soil homogenization on core-scale CO2
and CH4 measurements. In order to account for potential biased variance andcovariance estimates between laboratory replicates, which were intact soil coresthat varied in volume and other parameters due to field-based heterogeneity, thesoil core (from which the measurement was taken from) was included as a randomeffect. The number of replicates used in each analysis differed due to experimentalconstraints (e.g., not enough pore water collected at specific suctions or forspecific treatments) and is included in each table or figure caption for clarification.Core-scale CO2 and CH4 emissions (μmol g−1 s−1) were transformed for normalityusing a reciprocal log transformation. Cumulative CO2−C and CH4−C (log-transformed), were also analyzed using REML models. Due to significant main andinteractive effects of soil homogenization potentially confounding other results, theeffects of antecedent drought and wetting direction were testing individually forintact or homogenized cores in flux measurements.
Pore-scale REML models used relative abundance values of FT-ICR compoundsclasses (lipids, carbohydrates, lignin, and so on) as response variables. In additionto the effects of antecedent drought, wetting direction, and soil homogenization,pore water fraction (based on different suction strengths soil water was collected at;−1.5, −15, and −50 kPa) was also included as a fixed effect. Due to the significantmain and interactive effects of pore water fraction on all FT-ICR compoundclasses, the effects of antecedent drought, wetting direction and soilhomogenization was tested for each pore water fraction individually. Intact andhomogenized core data were considered paired samples.
Field-scale, or in situ CO2 fluxes, groundwater elevation and precipitation werealso analyzed using REML models with each CO2 chamber considered a randomvariable. The response variable (CO2 respiration) was somewhat non-normallydistributed, but log-transforming did not significantly affect the results. Allstatistical analyses were performed using JMP Pro Version 13 (SAS Inst. Inc., Cary,NC, USA).
Data availability. All data from this study have been deposited on Figshare—DOI:10.6084/m9.figshare.5349082.
Table 3 Cumulative carbonaceous greenhouse gas emissions from incubated cores measured during rewetting and for 20 h postrewetting
Intact cores Homogenized cores
n CO2−C (mg) CH4−C (μg) n CO2−C (mg) CH4−C (μg)Field moistureSimulated precipitation 4 51.7± 19.8 c 0.0536± 0.026 ab 4 108.6± 28.2 0.0785± 0.051Simulated groundwater rise 4 100.2± 4.1 bc 0.0117± 0.005 b 4 118.7± 45.0 0.0551± 0.016Antecedent droughtSimulated precipitation 4 245.1± 17.4 a 0.0288± 0.013 ab 4 208.6± 41.7 0.0546± 0.019Simulated groundwater rise 4 161.2± 34.5 b 0.1032± 0.030 a 3 202.0± 59.4 0.0418± 0.008
Letters not shared among rows show that means are significantly different using Student’s Least Significant Means t-testMean and standard error values for cumulative CO2−C (mg), and CH4−C (mg) from intact and homogenized soil cores maintained at field moisture content, or subjected to laboratory-inducedantecedent drought for both wetting directions (i.e., wet from above to simulate precipitation or wet from below to simulate groundwater rise).
Pre
cipi
tatio
n (m
m)
Gro
undw
ater
elev
atio
n (m
)
a
b
c
CO
2 (µ
mol
m–2
s–1
)
8
6
4
2
0
100
50
0
20.75
20.50
20.25
20.00
07/0
1/20
14
10/0
1/20
14
01/0
1/20
15
04/0
1/20
15
07/0
1/20
15
10/0
1/20
15
01/0
1/20
16
04/0
1/20
16
DATE
Fig. 5 Field-scale carbon dioxide flux, precipitation and groundwater rise.Field measurements of a mean daily CO2 flux (μmol m−2 s−1) respiration(bars represent standard error of n= 8 plots), and weather tower reports atWalker Ranch Weather Station at the Disney Wilderness Preserve (FL) of btotal precipitation (mm) and cmean groundwater level (m) for 24 h prior toCO2 measurements. Using a residual maximum likelihood mixed effectsmodel, CO2 emissions were influenced by precipitation (P= 0.040) and bythe interaction of precipitation and groundwater elevation (P= 0.005).Measurements were made from 2 June 2014 to 13 April 2016, for a total of156 measurements
NATURE COMMUNICATIONS | DOI: 10.1038/s41467-017-01320-x ARTICLE
NATURE COMMUNICATIONS |8: 1335 |DOI: 10.1038/s41467-017-01320-x |www.nature.com/naturecommunications 9
Received: 16 June 2016 Accepted: 11 September 2017
References1. Dai, A. Drought under global warming: a review. Wiley Interdiscip. Rev.: Clim.
Change 2, 45–65 (2011).2. Choat, B. et al. Global convergence in the vulnerability of forests to drought.
Nature 491, 752–755 (2012).3. Borken, W. & Matzner, E. Reappraisal of drying and wetting effects on C and N
mineralization and fluxes in soils. Glob. Change Biol. 15, 808–824 (2009).4. Prein, A. F. et al. The future intensification of hourly precipitation extremes.
Nat. Clim. Change (2016).5. Trenberth, K. E. et al. Global warming and changes in drought. Nat. Clim.
Change 4, 17–22 (2014).6. Reichstein, M. et al. Climate extremes and the carbon cycle. Nature 500,
287–295 (2013).7. Falloon, P., Jones, C. D., Ades, M. & Paul, K. Direct soil moisture controls of
future global soil carbon changes: An important source of uncertainty. Glob.Biogeochem. Cycles. 25 GB3010 (2011).
8. Kim, D.-G., Vargas, R., Bond-Lamberty, B. & Turetsky, M. Effects of soilrewetting and thawing on soil gas fluxes: a review of current literature andsuggestions for future research. Biogeosciences 9, 2459–2483 (2012).
9. Birch, H. The effect of soil drying on humus decomposition and nitrogenavailability. Plant Soil 10, 9–31 (1958).
10. Wang, W., Dalal, R., Moody, P. & Smith, C. Relationships of soil respiration tomicrobial biomass, substrate availability and clay content. Soil Biol. Biochem.35, 273–284 (2003).
11. Manzoni, S. & Porporato, A. Soil carbon and nitrogen mineralization: theoryand models across scales. Soil Biol. Biochem. 41, 1355–1379 (2009).
12. Ruamps, L. S., Nunan, N. & Chenu, C. Microbial biogeography at the soil porescale. Soil Biol. Biochem. 43, 280–286 (2011).
13. Negassa, W. C. et al. Properties of soil pore space regulate pathways of plantresidue decomposition and community structure of associated bacteria. PLoSONE 10, e0123999 (2015).
14. Kravchenko, A. N., Negassa, W. C., Guber, A. K. & Rivers, M. L. Protection ofsoil carbon within macro-aggregates depends on intra-aggregate porecharacteristics. Sci. Rep. 5, 16261 (2015).
15. Torbert, H. A. & Wood, C. W. Effects of soil compaction and water‐filled porespace on soil microbial activity and N losses. Commun. Soil Sci. Plant Anal. 23,1321–1331 (1992).
16. Yoo, G., Spomer, L. A. & Wander, M. M. Regulation of carbon mineralizationrates by soil structure and water in an agricultural field and a prairie-like soil.Geoderma 135, 16–25 (2006).
17. Yao, S.-H., Zhang, B. & Hu, F. Soil biophysical controls over rice strawdecomposition and sequestration in soil: the effects of drying intensityand frequency of drying and wetting cycles. Soil Biol. Biochem. 43, 590–599(2011).
18. Bailey, V. L., Smith, A. P., Tfaily, M., Fansler, S. J. & Bond-Lamberty, B.Differences in soluble organic carbon chemistry in pore waters sampled fromdifferent pore size domains. Soil Biol. Biochem. 107, 133–143 (2017).
19. Yang, X., Liu, C., Shang, J., Fang, Y. & Bailey, V. L. A unified multiscalemodel for pore-scaleflow simulations in soils. Soil Sci. Soc. Am. J. 78, 108–118(2014).
20. Todoruk, T. R., Langford, C. H. & Kantzas, A. Pore-scale redistribution of waterduring wetting of air-dried soils as studied by low-field NMR relaxometry.Environ. Sci. Technol. 37, 2707–2713 (2003).
21. Waring, B. G. & Powers, J. S. Unraveling the mechanisms underlying pulsedynamics of soil respiration in tropical dry forests. Environ. Res. Lett. 11,105005 (2016).
22. Fraser, F. C. et al. On the origin of carbon dioxide released from rewetted soils.Soil Biol. Biochem. 101, 1–5 (2016).
23. Meisner, A., Rousk, J. & Bååth, E. Prolonged drought changes the bacterialgrowth response to rewetting. Soil Biol. Biochem. 88, 314–322 (2015).
24. Rey, A., Oyonarte, C., Morán-López, T., Raimundo, J. & Pegoraro, E. Changesin soil moisture predict soil carbon losses upon rewetting in a perennialsemiarid steppe in SE Spain. Geoderma 287, 135–146 (2017).
25. Munson, S. M., Benton, T. J., Lauenroth, W. K. & Burke, I. C. Soil carbon fluxfollowing pulse precipitation events in the shortgrass steppe. Ecol. Res. 25,205–211 (2010).
26. Wang, Q., He, N., Liu, Y. & Li, M. Strong pulse effects of precipitationevents on soil microbial respiration in temperate forests. Geoderma 275, 67–73(2016).
27. Sponseller, R. A. Precipitation pulses and soil CO2 flux in a Sonoran Desertecosystem. Glob. Change Biol. 13, 426–436 (2007).
28. Chen, S., Lin, G., Huang, J. & He, M. Responses of soil respiration to simulatedprecipitation pulses in semiarid steppe under different grazing regimes. J. PlantEcol. 1, 237–246 (2008).
29. Leon, E. et al. Hot spots, hot moments, and spatio-temporal controls onsoil CO 2 efflux in a water-limited ecosystem. Soil Biol. Biochem. 77, 12–21(2014).
30. Kaiser, M., Kleber, M. & Berhe, A. A. How air-drying and rewetting modify soilorganic matter characteristics: an assessment to improve data interpretationand inference. Soil Biol. Biochem. 80, 324–340 (2015).
31. Aubry, C., Gutierrez, L. & Croue, J. P. Coating of AFM probes with aquatichumic and non-humic NOM to study their adhesion properties. Water Res. 47,3109–3119 (2013).
32. Yang, X. et al. Simulations of ecosystem hydrological processes using a unifiedmulti-scale model. Ecol. Model. 296, 93–101 (2015).
33. Marshall, T. J. & Holmes, J. W. Soil Physics, 3rd edn (Cambridge UniversityPress, 1996).
34. Tfaily, M. M., Chu, R. K. & Tolic, N. Advanced solvent based methods formolecular characterization of soil organic matter by high-resolution massspectrometry. Anal. Chem. 87, 5206–5215 (2015).
35. Manzoni, S., Schaeffer, S., Katul, G., Porporato, A. & Schimel, J. A theoreticalanalysis of microbial eco-physiological and diffusion limitations to carboncycling in drying soils. Soil Biol. Biochem. 73, 69–83 (2014).
36. Bottner, P. Response of microbial biomass to alternate moist and dry conditionsin a soil incubated with 14C-and 15N-labelled plant material. Soil Biol.Biochem. 17, 329–337 (1985).
37. Ruamps, L. S. et al. Regulation of soil organic C mineralisation at the pore scale.FEMS Microbiol. Ecol. 86, 26–35 (2013).
38. Kravchenko, A. et al. Relationships between intra-aggregate pore structures anddistributions of Escherichia coli within soil macro-aggregates. Appl. Soil Ecol.63, 134–142 (2013).
39. Bouskill, N. et al. Belowground response to drought in a tropical forest soil. II.Change in microbial function impacts carbon composition. Fron. Microbiol. 7,323 (2016).
40. Warren, C. R. Response of osmolytes in soil to drying and rewetting. Soil Biol.Biochem. 70, 22–32 (2014).
41. Vicca, S. et al. Can current moisture responses predict soil CO2 efflux underaltered precipitation regimes? A synthesis of manipulation experiments.Biogeosci. 11, 2991–3013 (2014).
42. Averill, C., Waring, B. G. & Hawkes, C. V. Historical precipitation predictablyalters the shape and magnitude of microbial functional response to soilmoisture. Glob. Change Biol. 22, 1957–1964 (2016).
43. Hawkes, C. V. & Keitt, T. H. Resilience vs. historical contingency in microbialresponses to environmental change. Ecol. Lett. 18, 612–625 (2015).
44. Le Mer, J. & Roger, P. Production, oxidation, emission and consumption ofmethane by soils: a review. Eur. J. Soil Biol. 37, 25–50 (2001).
45. Strong, D., Wever, Hd, Merckx, R. & Recous, S. Spatial location ofcarbon decomposition in the soil pore system. Eur. J. Soil Sci. 55, 739–750(2004).
46. Franzluebbers, A. Microbial activity in response to water-filled pore space ofvariably eroded southern Piedmont soils. Appl. Soil Ecol. 11, 91–101 (1999).
47. Kravchenko, A. N. & Guber, A. K. Soil pores and their contributions to soilcarbon processes. Geoderma 287, 31–39 (2017).
48. Horn, R. & Smucker, A. Structure formation and its consequences for gas andwater transport in unsaturated arable and forest soils. Soil Tillage Res. 82, 5–14(2005).
49. Goodrick, I., Connor, S., Bird, M. & Nelson, P. Emission of CO2 from tropicalriparian forest soil is controlled by soil temperature, soil water content anddepth to water table. Soil Res. 54, 311–320 (2016).
50. Rezanezhad, F., Couture, R.-M., Kovac, R., O’Connell, D. & Van Cappellen, P.Water table fluctuations and soil biogeochemistry: an experimental approachusing an automated soil column system. J. Hydrol. 509, 245–256 (2014).
51. Oechel, W. C., Vourlitis, G. L., Hastings, S. J., Ault, R. P. & Bryant, P. Theeffects of water table manipulation and elevated temperature on the net CO2
flux of wet sedge tundra ecosystems. Glob. Change Biol. 4, 77–90 (1998).52. Davidson, E. A., Samanta, S., Caramori, S. S. & Savage, K. The Dual Arrhenius
and Michaelis–Menten kinetics model for decomposition of soil organic matterat hourly to seasonal time scales. Glob. Change Biol. 18, 371–384 (2012).
53. Hashimoto, S. et al. Global spatiotemporal distribution of soil respirationmodeled using a global database. Biogeosciences 12, 4121–4132 (2015).
54. Todd-Brown, K. et al. Causes of variation in soil carbon predictions fromCMIP5 Earth system models and comparison with observations. Biogeosci.Discuss. 9, 14437 (2012).
55. Soil Survey Staff. in Handbook, 2nd Edn, 436 (ed.) (Agriculture NRCSUSDo,1999).
56. Lentz, R. D. Automated system for collecting multiple, sequential samples fromsoil water percolation samplers under continuous vacuum. Commun. Soil Sci.Plant Anal. 37, 1195–1203 (2006).
ARTICLE NATURE COMMUNICATIONS | DOI: 10.1038/s41467-017-01320-x
10 NATURE COMMUNICATIONS | 8: 1335 |DOI: 10.1038/s41467-017-01320-x |www.nature.com/naturecommunications

57. Dittmar, T., Koch, B., Hertkorn, N. & Kattner, G. A simple and efficientmethod for the solid-phase extraction of dissolved organic matter (SPE-DOM)from seawater. Limnol. Oceanogr. Methods 6, 230–235 (2008).
58. Tfaily, M. M., Hodgkins, S. B., Podgorski, D. C., Chanton, J. & Cooper, W. T.Comparison of dialysis and solid-phase extraction for isolation andconcentration of dissolved organic matter prior to Fourier transform ioncyclotron resonance mass spectrometry. Anal. Bioanal. Chem. 404, 447–457(2012).
59. Kujawinski, E. B. & Behn, M. D. Automated analysis of electrospray ionizationFourier transform ion cyclotron resonance mass spectra of natural organicmatter. Anal. Chem. 78, 4363–4373 (2006).
60. Minor, E. C., Steinbring, C. J., Longnecker, K. & Kujawinski, E. B.Characterization of dissolved organic matter in Lake Superior and its watershedusing ultrahigh resolution mass spectrometry. Org. Geochem. 43, 1–11(2012).
61. Sleighter, R. L. & Hatcher, P. G. The application of electrospray ionizationcoupled to ultrahigh resolution mass spectrometry for the molecularcharacterization of natural organic matter. J. Mass Spectrometry 42, 559–574(2007).
AcknowledgementsThis research is based on grants to both the Pacific Northwest National Laboratory(PNNL) and to the University of Central Florida (UCF) from the U.S. Department ofEnergy, Office of Science, Biological and Environmental Research as part of the Ter-restrial Ecosystem Sciences Program. PNNL is operated for DOE by Battelle MemorialInstitute under contract DE-AC05-76RL01830. UCF funds were awarded via grant DE-SC00008301. A portion of this research was performed using EMSL, a DOE Office ofScience user facility sponsored by the DOE’s Office of Biological and EnvironmentalResearch and located at Pacific Northwest National Laboratory. We thank those whohelped in this research: Drs Tamas Varga, Erika Marín-Spiotta, Li-Jung Kuo, KentonRod, and Kathe Todd-Brown.
Author contributionsThis study was conceived by V.L.B., who also performed the field sampling. V.L.B. andA.P.S. designed the study. A.P.S. led the laboratory analyses with M.M.T. and C.L.assisting with specialized instrumentation. C.R.H. and B.W.B. led the field-scale fluxmeasurements. A.P.S. and B.B.-L. analyzed data, and A.P.S. wrote the manuscript withsignificant contributions from all authors.
Additional informationSupplementary Information accompanies this paper at doi:10.1038/s41467-017-01320-x.
Competing interests: The authors declare no competing financial interests.
Reprints and permission information is available online at http://npg.nature.com/reprintsandpermissions/
Publisher's note: Springer Nature remains neutral with regard to jurisdictional claims inpublished maps and institutional affiliations.
Open Access This article is licensed under a Creative CommonsAttribution 4.0 International License, which permits use, sharing,
adaptation, distribution and reproduction in any medium or format, as long as you giveappropriate credit to the original author(s) and the source, provide a link to the CreativeCommons license, and indicate if changes were made. The images or other third partymaterial in this article are included in the article’s Creative Commons license, unlessindicated otherwise in a credit line to the material. If material is not included in thearticle’s Creative Commons license and your intended use is not permitted by statutoryregulation or exceeds the permitted use, you will need to obtain permission directly fromthe copyright holder. To view a copy of this license, visit http://creativecommons.org/licenses/by/4.0/.
© The Author(s) 2017
NATURE COMMUNICATIONS | DOI: 10.1038/s41467-017-01320-x ARTICLE
NATURE COMMUNICATIONS |8: 1335 |DOI: 10.1038/s41467-017-01320-x |www.nature.com/naturecommunications 11


