Embed Size (px)
Citation preview

Citigroup Research is a division of Citigroup Global Markets Inc. (the "Firm"), which does and seeks to do business with companies covered in its research reports. As a result, investors should be aware that the Firm may have a conflict of interest that could affect the objectivity of this report. Investors should consider this report as only a single factor in making their investment decision. Non-US research analysts who have prepared this report are not registered/qualified as research analysts with the NYSE and/or NASD. 1Citigroup Global Market India Private Limited
Citigroup Global Markets | Equity Research
Asia Pacific | India Department Stores | Retailing - Department Stores
Company In-Depth
20 April 2007 | 16 pages
Shoppers Stop (SHOP.BO) Sell: Valuations Building Excessive Expectations from HyperCity
Valuations pricing in growth opportunities — We like the Shoppers Stop growth story, leveraged to rapidly growing high-end urban consumption. However, at 43x FY08E P/E valuations are steep and seem to be building unfeasible expectations from HyperCity. As such, the stock h`as underperformed the Sensex by 9% and we expect valuation roadblocks to continue. Maintain SELL
Excessive expectations from HyperCity — Based on our scenario analysis, we estimate that Shoppers Stop’s stock price is implying a steep valuation premium for HyperCity - ranging from 32%-290% over Pantaloon’s valuations (India’s leading hypermarket player), unsustainable in our view
Premium positioning, but exposed to competition — Shopper’s stores have high end positioning and are located in tier I cities. While stores are well positioned to capture high income urban growth opportunity, competitive intensity in these locations is also likely to be the highest, resulting in slowing same store sales growth, including cannibalization as Shopper’s own stores increase in each city
Expansion to specialty segment — Shoppers is increasing its retail space by 2.5x to 2.5m sq. ft over next 2-years. We expect 20% of this space to be dedicated to specialty formats offering a higher margin profile
Raising Price Target — Raising our target price to Rs421 from Rs275, reflecting 1) rolling forward of our 27x target P/E multiple from FY07E to FY08E and 2) incorporating value of 19% stake in HyperCity at Rs45 per share. Our price target of Rs421 is 40% below consensus target price of Rs723
Figure 1. Shoppers Stop – Statistical Abstract
Year to Net Profit FD EPS EPS Growth
P/E Adj.P/E* DPS Yield RoE
31-Mar (Rs Mils.) (Rs) (%) (x) (x) (Rs) (%) (%) 2005 189.9 6.9 57.6 91.0 84.5 1.0 0.2 21.9 2006 271.1 7.9 13.8 79.9 74.2 1.5 0.2 14.9 2007E 369.4 10.7 36.3 58.6 54.4 1.9 0.3 13.0 2008E 479.4 13.9 29.8 45.2 42.0 3.1 0.5 15.1 2009E 676.7 19.7 41.2 32.0 29.7 4.7 0.8 18.8
Source: Company Reports and Citigroup Investment Research estimates; *Adjusted for Hypercity stake
Sell/Medium Risk 3Mfrom Sell/Speculative
Price (19 Apr 07) Rs635.00Target price Rs421.00
from Rs270.00 Expected share price return -33.7%Expected dividend yield 0.3%Expected total return -33.4%Market Cap Rs21,833M US$522M
Price Performance (RIC: SHOP.BO, BB: SHOP IN)
See Appendix A-1 for Analyst Certification and important disclosures.
Princy Singh1 +91-22-6631-9871 [email protected]
Pragati Khadse1 [email protected]
Rating change Target price change
Estimate change

Shoppers Stop (SHOP.BO) 20 April 2007
Citigroup Global Markets | Equity Research 2
Fiscal year end 31-Mar 2005 2006 2007E 2008E 2009E
Valuation RatiosP/E adjusted (x) 91.7 80.6 59.1 45.5 32.3EV/EBITDA adjusted (x) 68.5 44.6 33.8 25.8 18.0P/BV (x) 18.4 8.1 7.3 6.5 5.7Dividend yield (%) 0.2 0.2 0.3 0.5 0.7Per Share Data (Rs)EPS adjusted 6.93 7.88 10.74 13.94 19.68EPS reported 6.93 7.88 10.74 13.94 19.68BVPS 34.55 78.51 87.07 97.50 111.84DPS 1.00 1.50 1.94 3.11 4.73
Profit & Loss (RsM)Net sales 4,160 5,882 7,060 9,609 14,382Operating expenses -3,922 -5,531 -6,578 -8,967 -13,414EBIT 238 350 481 642 968Net interest expense -39 -24 -42 -48 -89Non-operating/exceptionals 8 76 112 122 132Pre-tax profit 207 402 551 716 1,010Tax -17 -131 -182 -236 -333Extraord./Min.Int./Pref.div. 0 0 0 0 0Reported net income 190 271 369 479 677Adjusted earnings 190 271 369 479 677Adjusted EBITDA 328 490 623 829 1,240Growth Rates (%)Sales 25.4 41.4 20.0 36.1 49.7EBIT adjusted 55.8 47.2 37.4 33.4 50.6EBITDA adjusted 44.1 49.4 27.2 33.0 49.7EPS adjusted 57.6 13.8 36.3 29.8 41.2
Cash Flow (RsM)Operating cash flow 173 403 422 218 333Depreciation/amortization 90 139 142 186 273Net working capital -106 -7 -89 -447 -616Investing cash flow -431 -511 -509 -800 -1,360Capital expenditure -416 -269 -359 -800 -1,360Acquisitions/disposals 0 0 0 0 0Financing cash flow 258 1,192 -56 -121 837Borrowings 285 -289 19 0 1,020Dividends paid -31 -59 -75 -121 -183Change in cash 1 1,085 -143 -702 -190
Balance Sheet (RsM)Total assets 2,480 4,130 4,646 5,190 7,275Cash & cash equivalent 10 1,098 951 249 59Accounts receivable 26 53 45 61 91Net fixed assets 1,096 1,225 1,442 2,056 3,143Total liabilities 1,532 1,427 1,652 1,838 3,429Accounts payable 626 783 897 1,213 1,804Total Debt 874 586 605 605 1,625Shareholders' funds 947 2,699 2,994 3,352 3,846
Profitability/Solvency Ratios (%)EBITDA margin adjusted 7.9 8.3 8.8 8.6 8.6ROE adjusted 21.9 14.9 13.0 15.1 18.8ROIC adjusted 14.7 12.1 14.3 14.7 15.6Net debt to equity 91.2 -19.0 -11.6 10.6 40.7Total debt to capital 48.0 17.8 16.8 15.3 29.7
For further data queries on Citigroup's full coverage universe please contact CIR Data Services Asia Pacific at [email protected] +852-2501-2791

Shoppers Stop (SHOP.BO) 20 April 2007
Citigroup Global Markets | Equity Research 3
Great Story, But Price into Valuations We like the Shoppers Stop story – it is a leading department store in India with a premium position. Management has been conservative in expanding the business, managing growth carefully, focusing on strong operations and not unduly stressing the balance sheet. Shoppers Stop's positioning has also been at the premium end, with a strategy focusing on product assortment and quality, rather than discounts, driving sales. It is also expanding in the specialty format, focusing on food, cosmetics, books and apparel. We estimate retail space to increase from about 1m sq. ft. in FY06 to 2.5m by FY09E, driving a 36% CAGR in earnings over FY07E-FY09E. Shoppers Stop also has the option to acquire up to a 51% stake in HyperCity, the hypermarket format owned by its promoter. Of this, the company has already acquired 19%, and further increase in stake is imminent. However, current valuations seem to be pricing in growth profile of the business, and seem to be attributing an unsustainable premium to HyperCity’s valuations. While we see clear upsides from Shoppers Stop acquiring 51% stake in HyperCity, we believe that too much is being built into the stock price. We maintain our Sell rating, but revise our price target upwards to RsRs421 from Rs270 earlier, factoring in the value of its 19% stake in HyperCity acquired recently (Rs45 per share). We value Shopper’s Stop (standalone entity) as Rs376 per share based on 27xFY08E P/E.
Figure 3. Shoppers Stop – Stock Price Performance, Absolute and Relative to Sensex (%)
(%) 3M 6M 12M Absolute (6.7) 5.7 5.9 Rel. to .BSESN (3.0) (0.6) (8.5)
Source: DataStream
Revising Price Target, Factoring in HyperCity Stake We are increasing our price target for Shoppers Stop to Rs421 from Rs270, factoring in the value of 19% stake in HyperCity acquired recently (Rs45 per share). We value Shopper’s Stop (standalone entity) as Rs376 per share, which we increase from Rs270 earlier. Our increase in per share value is on account of our rolling forward our target P/E multiple from FY07E to FY08E, given that we are already in FY08 and the stock valuations should start discounting in FY08E earnings. We maintain our 27x target P/E multiple. We also revise down our FY07E and FY08E EPS estimates by 12.2%-13.9%, factoring in lower sales due to delays in space roll out as well as lower margins.
Figure 4. Shoppers Stop – Earnings Revision Table
Profits (Rs Million) EPS (Rs) DPS (Rs) Old New % Chg Old New % Chg Old New % Chg FY07E 420.6 369.4 -12.2 12.2 10.7 -12.2 2.2 1.9 -12.3 FY08E 646.0 479.4 -25.8 18.8 13.9 -25.8 3.8 3.1 -18.9
Source: Company Reports and Citigroup Investment Research estimates
Our target multiple is benchmarked against our regional retail universe and Indian market leader, Pantaloon. We believe Shoppers Stop could trade at a 10% premium to its regional peer group given its superior earnings growth
Figure 2. Shoppers Stop – Stock Price Relative to Sensex
400450500550600650700750
Apr May Jun Jul Aug
Sep Oc
tNo
vDe
c Jan Feb Mar758595105115125
Share Price (Left Axis)Rel. to BSESN (Right Axis)
Source: DataStream
Shoppers Stop (SHOP.BO) 20 April 2007
Citigroup Global Markets | Equity Research 4
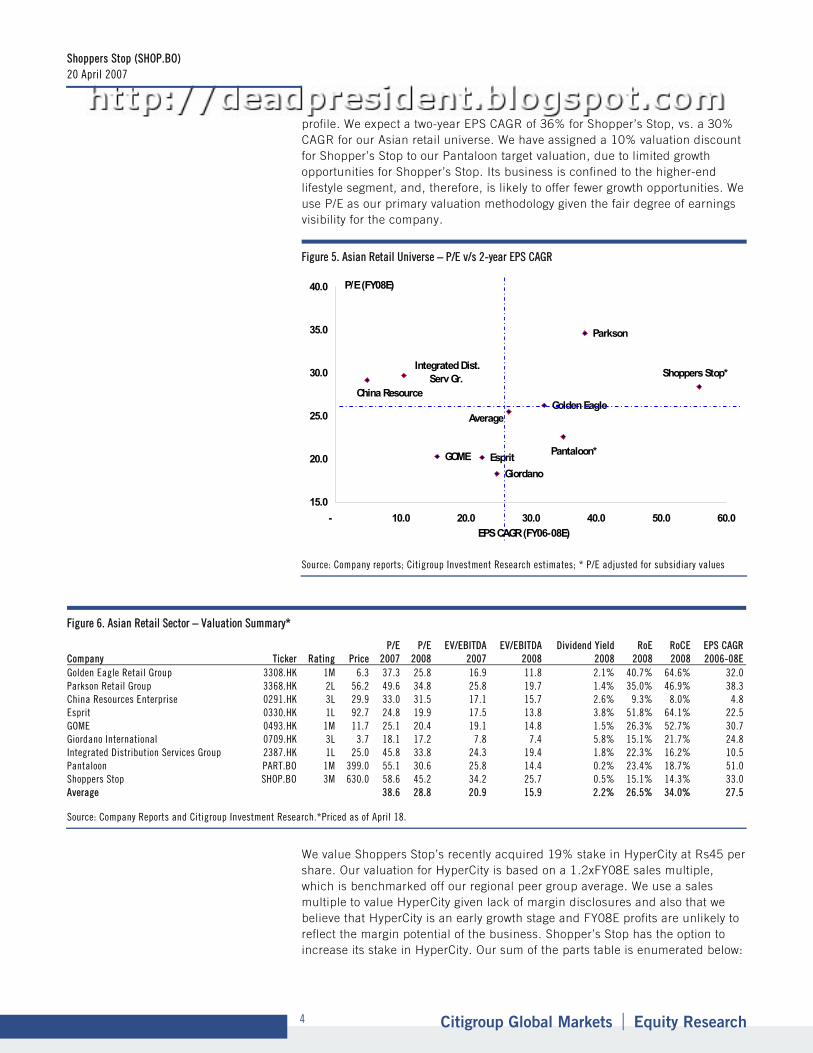
profile. We expect a two-year EPS CAGR of 36% for Shopper’s Stop, vs. a 30% CAGR for our Asian retail universe. We have assigned a 10% valuation discount for Shopper’s Stop to our Pantaloon target valuation, due to limited growth opportunities for Shopper’s Stop. Its business is confined to the higher-end lifestyle segment, and, therefore, is likely to offer fewer growth opportunities. We use P/E as our primary valuation methodology given the fair degree of earnings visibility for the company.
Figure 5. Asian Retail Universe – P/E v/s 2-year EPS CAGR
Parkson
Average
Shoppers Stop*
Golden Eagle China Resource
Pantaloon*
Giordano EspritGOME
Integrated Dist. Serv Gr.
15.0
20.0
25.0
30.0
35.0
40.0
- 10.0 20.0 30.0 40.0 50.0 60.0
P/E (FY08E)
EPS CAGR (FY06-08E)
Source: Company reports; Citigroup Investment Research estimates; * P/E adjusted for subsidiary values
Figure 6. Asian Retail Sector – Valuation Summary*
P/E P/E EV/EBITDA EV/EBITDA Dividend Yield RoE RoCE EPS CAGR Company Ticker Rating Price 2007 2008 2007 2008 2008 2008 2008 2006-08E Golden Eagle Retail Group 3308.HK 1M 6.3 37.3 25.8 16.9 11.8 2.1% 40.7% 64.6% 32.0 Parkson Retail Group 3368.HK 2L 56.2 49.6 34.8 25.8 19.7 1.4% 35.0% 46.9% 38.3 China Resources Enterprise 0291.HK 3L 29.9 33.0 31.5 17.1 15.7 2.6% 9.3% 8.0% 4.8 Esprit 0330.HK 1L 92.7 24.8 19.9 17.5 13.8 3.8% 51.8% 64.1% 22.5 GOME 0493.HK 1M 11.7 25.1 20.4 19.1 14.8 1.5% 26.3% 52.7% 30.7 Giordano International 0709.HK 3L 3.7 18.1 17.2 7.8 7.4 5.8% 15.1% 21.7% 24.8 Integrated Distribution Services Group 2387.HK 1L 25.0 45.8 33.8 24.3 19.4 1.8% 22.3% 16.2% 10.5 Pantaloon PART.BO 1M 399.0 55.1 30.6 25.8 14.4 0.2% 23.4% 18.7% 51.0 Shoppers Stop SHOP.BO 3M 630.0 58.6 45.2 34.2 25.7 0.5% 15.1% 14.3% 33.0 Average 38.6 28.8 20.9 15.9 2.2% 26.5% 34.0% 27.5
Source: Company Reports and Citigroup Investment Research.*Priced as of April 18.
We value Shoppers Stop’s recently acquired 19% stake in HyperCity at Rs45 per share. Our valuation for HyperCity is based on a 1.2xFY08E sales multiple, which is benchmarked off our regional peer group average. We use a sales multiple to value HyperCity given lack of margin disclosures and also that we believe that HyperCity is an early growth stage and FY08E profits are unlikely to reflect the margin potential of the business. Shopper’s Stop has the option to increase its stake in HyperCity. Our sum of the parts table is enumerated below:

Shoppers Stop (SHOP.BO) 20 April 2007
Citigroup Global Markets | Equity Research 5
Figure 7. Shoppers Stop – Sum of the Parts Valuation
Business Valuation Methodology Per Share Value (Rs)
Shoppers Stop
27xFY08E P/E benchmarked off regional retail peer group 376
HyperCity 1.2xFY08E Market Cap/Sales, benchmarked off regional retail peer group and attributing proportionate value to Shoppers Stop 19% stake
45
Source: Company Reports and Citigroup Investment Research estimates
Excessive Expectations from HyperCity Stake Shopper’s Stop has the option to acquire up to 51% stake in its promoter’s owned hypermarket store, HyperCity. This allows Shopper’s Stop to make the acquisition at cost + annual 10% return or market price, which ever is lower. It recently acquired a 19% stake in HyperCity, for an undisclosed amount. We believe that further acquisition of stake to 51% is imminent, but already factored into valuations. Based on our fair value of Rs376 for the parent company, current stock price seems to imply a per share value of Rs259 per share for a potential 51% stake in HyperCity. Our scenario analysis suggests that the implied per share price for the HyperCity stake not only assumes that acquisition of a 51% stake is imminent, but also implies a premium of 32%-290% over Pantaloon’s (leading hypermarket player in India) valuations. Our scenario analysis is enumerated below:
We have stripped off our target fair value (Rs376) of the parent company from the current stock price of Rs635, implying that residual Rs259 is the option value of Shopper’s Stop stake in HyperCity increasing to 51%.
We assume (based on recent 19% stake purchase and indications from management) this stake will be increased to 51% by 2008. Since we don’t have enough disclosures on the cost of HyperCity (while we can estimate store set up cost, we don’t have data on overheads), we have not assumed any cost to Shoppers Stop for the stake – so to that extent we are understating the valuation premium being attributed to HyperCity.
We base our growth assumptions for HyperCity on management guidance of 3-4 stores every year – assuming stores increasing to seven in the worst case and 13 in the best case by FY09E. We also base our net margin assumptions of 3% in worst case (close to Pantaloon’s current net margins) and 7% in best case (premium to Shoppers current margins)
We benchmark implied valuations based on Market Cap / Sales and P/E over Pantaloon’s valuations.

Shoppers Stop (SHOP.BO) 20 April 2007
Citigroup Global Markets | Equity Research 6
Figure 8. Asian Retail Universe – Scenario Analysis: Implied Valuations for HyperCity
Worst Case Median Case Best Case No of Stores in FY09E 7 9 13 FY09E Sales (Rs Million) 9,375 12,188 18,563 FY09E Net Margin (%) 3% 4% 5% Implied FY09E Market Cap / Sales (x)
2.7 2.1 1.4
Implied premium to Pantaloon's valuations (%)
261% 177% 82%
Implied FY09E P/E (x) 90 59 30 Implied premium to Pantaloon's valuations (%)
292% 158% 32%
Source: Citigroup Investment Research estimates
Despite our view on valuations, we do not deny the merit of increasing a stake in HyperCity, which will provide Shoppers Stop with exposure to the fast growing Hypermarket format. Now, only one store is located in Mumbai, and it expects to add four stores every year going forward, with a target to increase the total number of stores to 29 by end 2009. HyperCity’s product mix includes 30% sales from food items, a fast growing segment. Additionally, private label sales account for 25%, which management is targeting to increase to 30%. We enumerate below our key base case operating assumptions for HyperCity:
Figure 9. HyperCity – Key Operating Parameters (Rupees in Million, Percent)
Sales Breakup FY06 FY07E FY08E FY09E Sales (Rsm) 813 3,250 7,313 12,188 Growth (%) 300 125 66.7 Total Space (Sq Feet) 125,000 375,000 750,000 1,125,000 Growth (%) nm 200.0 100.0 50.0 Space Added (Sq. Ft.) 250,000 375,000 375,000 Average Space (Sq Ft) 62,500 250,000 562,500 937,500 No. of Stores 1 3 6 9 Sales / Sq Ft. (Rs) 13,000 13,000 13,000 13,000 Space/Store (Sq ft) 125,000 125,000 125,000 125,000
Source: Company reports; Citigroup Investment Research estimates
Premium Positioning, but Exposed to Competitive Risks Shopper’s Stop department stores are positioned at the premium end, catering to upper-mid and upper income segments. Shoppers Stop’s outlets are likely to be concentrated in tier-I cities, where majority of the organized retail expenditure is likely to be concentrated. Top 14 cities in India contribute to almost 45% of total urban income in India and that Shopper’s Stop is well positioned to capture this predominantly urban opportunity. However, its formats are also exposed to competitive risks, especially given that mall concentration is likely to be the highest in tier I cities. We expect slowing same store sales growth going forward, driven by rising competitive intensity, and to partly doe to cannibalization by Shopper’s own store expansions in these cities.

Shoppers Stop (SHOP.BO) 20 April 2007
Citigroup Global Markets | Equity Research 7
Figure 10. Urban India – Population and Income Pyramid
Population
Million Per cent
Per capita incomeINR ‘000, 2006
109.4
62.1
61.0
49.7
45.0
42.0
28.0
49.7
29
20
286
10
7
100
Delhi, Mumbai
Chennai, Kolkata
Next 10 cities
Next 20 cities
Next 33 cities
Remaining 4900 urban centers
Share of urban income
33 12
25 8
24 9
65 23
22
9
14
9
8
8
Per cent
Urban total 100
70
Next 113 cities
23 9
13
Source: Census of India 2001; NCAER “The Great Indian Middle Class”;
Market Skyline 2006; McKinsey & Company
Shopper’s Stop is expanding its presence in the specialty segment. The company’ specialty stores include Crossword (books), Home Stop (furniture and home furnishings), Brio (Café), MAC (Cosmetics) and Mother Care (apparel and accessories). We expect area under specialty formats to increase to 0.5m sq. ft., or almost 20% of total retail area by FY09E. We estimate that sales contribution from the specialty format will be higher than overall company average. We understand from management that these new formats have already turned profitable.
Shoppers Stop operating parameters remain strong and its stores are well managed. This is evident from continuous improvement in trends in footfalls, conversion ratios, ticket size and sales per sq. However, we believe that as competition in tier-I cities picks up, some of these parameters could start to taper.
Figure 11. Space contribution from Specialty Stores (%)
90% 85% 80%
10% 15% 20%
0%10%20%30%40%50%60%70%80%90%
100%
FY07E FY08E FY09E
Shoppers Stop Speciality Stores
Source: Company Reports and
Citigroup Investment Research estimates

Shoppers Stop (SHOP.BO) 20 April 2007
Citigroup Global Markets | Equity Research 8
Figure 12. Shoppers Stop – Customer Entry Trend (Million) Figure 13. Shoppers Stop – Conversion Ratios (Percent)
2.0
2.5
3.0
3.5
4.0
4.5
5.0
5.5
4Q05
1Q06
2Q06
3Q06
4Q06
1Q07
2Q07
3Q07
(Mn
25%
26%
27%
28%
29%
30%
4Q05
1Q06
2Q06
3Q06
4Q06
1Q07
2Q07
3Q07
9M07
Source: Company reports Source: Company reports
Figure 14. Shoppers Stop – Average Ticket Size Trend (Rupees) Figure 15. Shoppers Stop – Quarterly Same Store Sales Trend (Rupees/Sq. ft.)
1,000
1,100
1,200
1,300
1,400
1,500
1,600
1,700
1,800
4Q05
1Q06
2Q06
3Q06
4Q06
1Q07
2Q07
3Q07
Rs
1,000
1,200
1,400
1,600
1,800
2,000
2,200
2,400
2,600
4Q05
1Q06
3Q06
4Q06
1Q07
3Q07
(Rs
Source: Company reports Source: Company reports
EPS CAGR of 36% over FY07E-FY09E We forecast an EPS CAGR of 36% over FY07E-FY09E drive by sales growth CAGR of 43% during the same period. We expect rising rentals and wage inflation to pare margins, mitigated partly by improving product mix. We estimate retail space for Shoppers Stop to increase from about 1m sq. ft. in FY06 to 2.5m by FY09E. Our space addition estimates are slightly below management guidance, factoring in delays mall developments. Our key sales growth assumptions are enumerated below:
Figure 16. Shoppers Stop – Sales and Profit Growth Trend (% YoY)
-
10.0
20.0
30.0
40.0
50.0
60.0
70.0
FY05 FY06 FY07E FY08E FY09E
Net Profit Growth Sales Growth
(%)
Source: Company Reports and Citigroup Investment
Research estimates

Shoppers Stop (SHOP.BO) 20 April 2007
Citigroup Global Markets | Equity Research 9
Figure 17. Shoppers Stop – Sales Growth Assumptions (Rupees in Million, Percent)
FY05 FY06 FY07E FY08E FY09E Gross Retail Sales 5,000.7 6,660.3 8,198.9 11,148.7 16,686.4 Less: Cost of consignment merchandise
(798) (582) (1,599) (2,174) (3,254)
As a % of consignment merchandise
74% 70% 65% 65% 65%
Less: Value Added Tax (114) (311) (328.0) (445.9) (667.5) As a % of gross sales 2% 5% 4% 4% 4% Net Retail Sales 4,089.5 5,767.0 6,928.1 9,420.6 14,100.0 % growth 26.0 41.0 20.1 36.0 49.7 Other Retail Operating Income
70.6 114.8 131.6 188.4 282.0
Total Retail Sales 4,160.1 5,881.9 7,059.7 9,609.0 14,382.0 % Growth 25% 41% 20% 36% 50%
Sales Break Up (%) Apparels 65% 65% 60% 60% 60% Non-Apparels 35% 35% 40% 40% 40% Total Space (Sq. Feet) 752,848.0 950,701.0 1,150,701.0 1,650,701.0 2,500,701.0 % Change 7.4% 26.3% 21.0% 43.5% 51.5% Space Added (Sq. Feet) 52,152.0 197,853.0 200,000.0 500,000.0 850,000.0 Average Space (Sq. Feet) 726,772.0 851,774.5 1,050,701.0 1,400,701.0 2,075,701.0 % Change 7% 26% 21% 43% 51% No of Stores 16.0 22.0 22.0 40.0 58.0 Sales / Sq Ft. (Rs) 7,152.0 7,576.0 7,803.3 7,959.3 8,038.9 Merchandise Split Own Merchandise 3,916.2 5,828.1 5,739.2 7,804.1 11,680.5 As a % of Sales 78.3% 87.5% 70.0% 70.0% 70.0% Consignment Merchandise 1,084.5 832.2 2,459.7 3,344.6 5,005.9 As a % of Sales 36.8% 28.2% 30.0% 30.0% 30.0%
Source: Company Reports and Citigroup Investment Research estimates
We expect margins will decline going forward due to pressure on rentals and wage cost. However, operating leverage and improving product mix (higher share of non-apparel sales) is likely to mitigate margins pressure to some extent. Our key margin assumptions are enumerated below.
Shoppers Stop (SHOP.BO) 20 April 2007
Citigroup Global Markets | Equity Research 10
Figure 18. Shoppers Stop – Margin Assumptions (Rupees in Million, Percent)
FY05 FY06 FY07E FY08E FY09E Total Retail Sales 4,160.1 5,881.9 7,059.7 9,609.0 14,382.0 % Growth 25% 41% 20% 36% 50% Cost of Goods Sold (2,623.9) (3,739.8) (4,394.6) (5,998.0) (8,994.0) Gross Profit 1,536.1 2,142.0 2,665.1 3,611.1 5,388.0 Gross Margin (%) 30.7% 32.2% 32.5% 32.4% 32.3% Employee Costs -288.3 -402.9 -532.9 -724.7 -1,084.6 As % of Sales 5.8% 6.0% 6.5% 6.5% 6.5% Operating and Administrative Expenses
-920.0 -1,249.4 -1,509.1 -2,057.6 -3,063.0
As % of Sales 18.4% 18.8% 18.4% 18.5% 18.4% Total Operating Expenses -1,208.2 -1,652.3 -2,042.0 -2,782.3 -4,147.6 As % of Sales 24.2% 24.8% 24.9% 25.0% 24.9% EBITDA 327.9 489.8 623.1 828.8 1,240.5 EBITDA Margin (%) 6.6% 7.4% 7.6% 7.4% 7.4%
Source: Company Reports and Citigroup Investment Research estimates
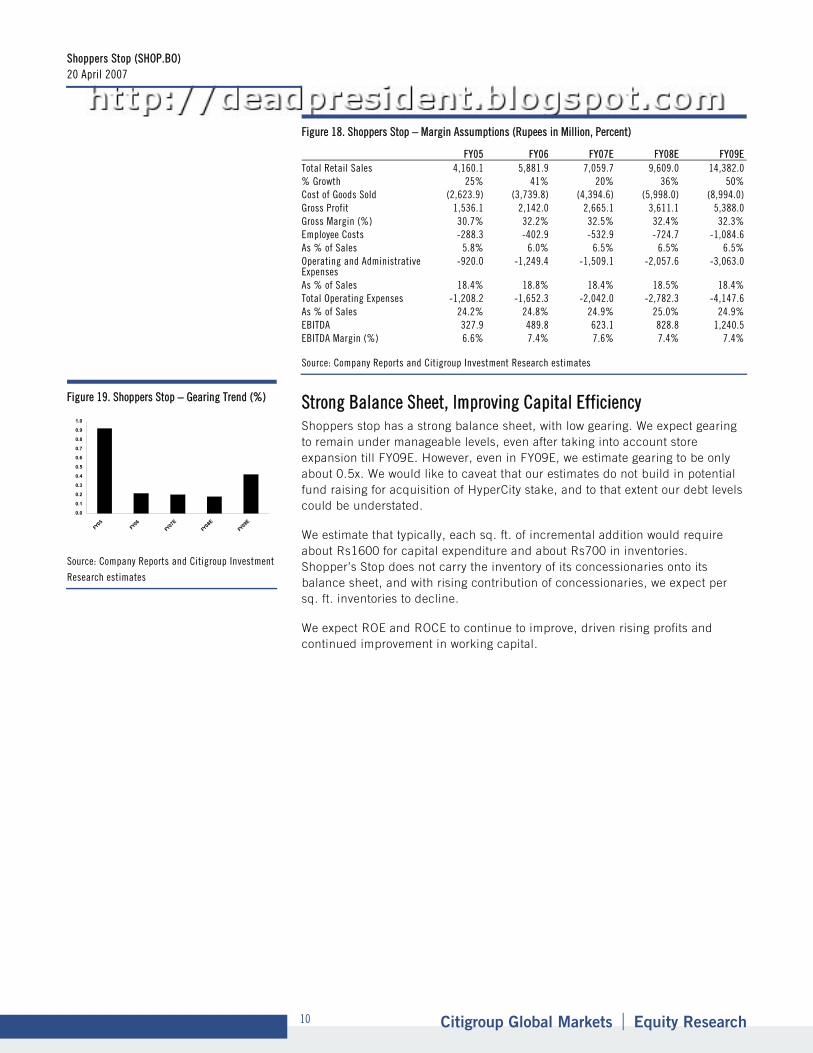
Strong Balance Sheet, Improving Capital Efficiency Shoppers stop has a strong balance sheet, with low gearing. We expect gearing to remain under manageable levels, even after taking into account store expansion till FY09E. However, even in FY09E, we estimate gearing to be only about 0.5x. We would like to caveat that our estimates do not build in potential fund raising for acquisition of HyperCity stake, and to that extent our debt levels could be understated.
We estimate that typically, each sq. ft. of incremental addition would require about Rs1600 for capital expenditure and about Rs700 in inventories. Shopper’s Stop does not carry the inventory of its concessionaries onto its balance sheet, and with rising contribution of concessionaries, we expect per sq. ft. inventories to decline.
We expect ROE and ROCE to continue to improve, driven rising profits and continued improvement in working capital.
Figure 19. Shoppers Stop – Gearing Trend (%)
0.0
0.1
0.2
0.3
0.4
0.5
0.6
0.7
0.8
0.9
1.0
FY05
FY06
FY07
EFY
08E
FY09
E
Source: Company Reports and Citigroup Investment
Research estimates

Shoppers Stop (SHOP.BO) 20 April 2007
Citigroup Global Markets | Equity Research 11
Figure 20. Shoppers Stop – ROE and ROCE (Percent)
-
5.0
10.0
15.0
20.0
25.0
FY05
FY06
FY07
EFY
08E
FY09
E
RoE RoCE
(%
Source: Citigroup Investment Research estimates

Shoppers Stop (SHOP.BO) 20 April 2007
Citigroup Global Markets | Equity Research 12
Shoppers Stop Company description Shopper's Stop is one of India's largest department-store chains. It opened its first store, retail menswear, in 1991. Since then, it has expanded to 22 stores in large Indian cities, retailing apparel and non-apparel products. The company plans to expand its reach from 0.1m sq feet now to almost 2.5m sq. ft. by FY08E by entering new cities and having 39 stores by FY08E. Its subsidiary, Crossword (which it acquired in FY00), has the largest bookstore chain in India with 26 stores. It is also expanding its presence in other specialty formats through brands such as Home Stop (furniture and home furnishings), Brio (Café), MAC (Cosmetics) and Mother Care (apparel and accessories)
Investment thesis We rate Shopper's Stop Sell/Medium Risk (3M). Current valuations not only seem to be factoring in growth but are also building in high expectations from a potential 51% stake acquisition in HyperCity. As such, the risk-reward balance seems unfavorable. In addition, Shopper’s Stop is likely to have difficulty expanding beyond tier-one cities as it caters to the ‘lifestyle’ higher-income segment. The department-store segment is the most crowded of India’s retail formats, and competes with specialty and single brand stores.
Valuation We value Shoppers Stop using sum of the parts valuation, factoring in the value its 19% stake in HyperCity. Our sum of the parts valuations returns a target price of Rs421 per share, valuing the parent company at Rs376 and the HyperCity stake at Rs45 per share. We value the parent Shoppers Stop based on 27x FY08E P/E, for a target price of Rs376. Our target multiple is benchmarked against our regional retail universe and Indian market leader Pantaloon. We believe Shoppers Stop could trade at 10% premium to its regional peers given its superior earnings growth profile. We expect two-year EPS CAGR of 36% vs. a 30% CAGR for our Asian retail universe. We assign a 10% valuation discount for Shopper’s Stop to our Pantaloon target valuation, due to limited growth opportunities for Shopper’s Stop. Its business is confined to the higher-end lifestyle segment, likely to offer fewer growth opportunities. We use P/E as our primary valuation methodology given the fair degree of earnings visibility. Our valuation for HyperCity is based on a 1.2xFY08E sales multiple, benchmarked off our regional peer group average.
Risks We assign a Medium Risk rating to Shopper’s Stop based on our quantitative risk-rating system. Key upside risks to our target price and estimates include: 1) Better-than-expected margins; 2) better-than-expected sales growth; 3) Any potential acquisitions, including increasing its stake in HyperCity. Key downside risks to our target price include: 1) intensifying competition; 2) execution risks; and 3) increasing competition from global retailers.

Shoppers Stop (SHOP.BO) 20 April 2007
Citigroup Global Markets | Equity Research 13
Appendix A-1 Analyst Certification I, Princy Singh, research analyst and the author of this report, hereby certify that all of the views expressed in this research report accurately reflect my personal views about any and all of the subject issuer(s) or securities. I also certify that no part of my compensation was, is, or will be directly or indirectly related to the specific recommendation(s) or view(s) in this report.
IMPORTANT DISCLOSURES
200
300
400
500
600
700
M J J A S O N D J2005
F M A M J J A S O N D J2006
F M A M J J A S O N D J2007
F M A
1
# Date RatingTargetPrice
ClosingPrice
1: 18 Aug 05 3S 270.00 370.35*Indicates change.
Shoppers Stop (SHOP.BO)Ratings and Target Price History - Fundamental ResearchAnalyst: Princy Singh (covered since August 18 2005) INR
CoveredNot covered
Chart current as of 14 A
pril 2007
Citigroup Global Markets Inc. or its affiliates beneficially owns 1% or more of any class of common equity securities of Golden Eagle Retail Group and Pantaloon. This position reflects information available as of the prior business day.
Within the past 12 months, Citigroup Global Markets Inc. or its affiliates has acted as manager or co-manager of an offering of securities of Esprit.
Citigroup Global Markets Inc. or its affiliates has received compensation for investment banking services provided within the past 12 months from China Resources Enterprise, Esprit, GOME and Parkson Retail Group.
Citigroup Global Markets Inc. or its affiliates expects to receive or intends to seek, within the next three months, compensation for investment banking services from China Resources Enterprise.
Citigroup Global Markets Inc. or an affiliate received compensation for products and services other than investment banking services from China Resources Enterprise, Esprit, Giordano International, Integrated Distribution Services Group and Pantaloon in the past 12 months.
Citigroup Global Markets Inc. currently has, or had within the past 12 months, the following company(ies) as investment banking client(s): China Resources Enterprise, Esprit, GOME, Integrated Distribution Services Group and Parkson Retail Group.
Citigroup Global Markets Inc. currently has, or had within the past 12 months, the following company(ies) as clients, and the services provided were non-investment-banking, securities-related: China Resources Enterprise, Esprit and Integrated Distribution Services Group.
Citigroup Global Markets Inc. currently has, or had within the past 12 months, the following company(ies) as clients, and the services provided were non-investment-banking, non-securities-related: China Resources Enterprise, Esprit, Giordano International, Integrated Distribution Services Group and Pantaloon.
Citigroup Global Markets Inc. or an affiliate received compensation in the past 12 months from Esprit and Integrated Distribution Services Group.
Analysts' compensation is determined based upon activities and services intended to benefit the investor clients of Citigroup Global Markets Inc. and its affiliates ("the Firm"). Like all Firm employees, analysts receive compensation that is impacted by overall firm profitability, which includes revenues from, among other business units, the Private Client Division, Institutional Sales and Trading, and Investment Banking.
For important disclosures (including copies of historical disclosures) regarding the companies that are the subject of this Citigroup Investment Research product ("the Product"), please contact Citigroup Investment Research, 388 Greenwich Street, 29th Floor, New York, NY, 10013, Attention: Legal/Compliance. In addition, the same important disclosures, with the exception of the Valuation and Risk assessments and historical disclosures, are contained on the Firm's disclosure website at www.citigroupgeo.com. Private Client Division clients should refer to www.smithbarney.com/research. Valuation and Risk assessments can be found in the text of the most recent research note/report regarding the subject company. Historical disclosures (for up to the past three years) will be provided upon request.
Citigroup Investment Research Ratings Distribution Data current as of 31 March 2007 Buy Hold SellCitigroup Investment Research Global Fundamental Coverage (3215) 45% 40% 15%
% of companies in each rating category that are investment banking clients 45% 42% 32%China -- Asia Pacific (88) 72% 15% 14%
% of companies in each rating category that are investment banking clients 44% 46% 42%Hong Kong -- Asia Pacific (99) 58% 13% 29%
% of companies in each rating category that are investment banking clients 42% 38% 38%India -- Asia Pacific (130) 58% 14% 28%

Shoppers Stop (SHOP.BO) 20 April 2007
Citigroup Global Markets | Equity Research 14
% of companies in each rating category that are investment banking clients 42% 50% 42%Guide to Fundamental Research Investment Ratings: Citigroup Investment Research's stock recommendations include a risk rating and an investment rating. Risk ratings, which take into account both price volatility and fundamental criteria, are: Low (L), Medium (M), High (H), and Speculative (S). Investment ratings are a function of Citigroup Investment Research's expectation of total return (forecast price appreciation and dividend yield within the next 12 months) and risk rating. For securities in developed markets (US, UK, Europe, Japan, and Australia/New Zealand), investment ratings are: Buy (1) (expected total return of 10% or more for Low-Risk stocks, 15% or more for Medium-Risk stocks, 20% or more for High-Risk stocks, and 35% or more for Speculative stocks); Hold (2) (0%-10% for Low-Risk stocks, 0%-15% for Medium-Risk stocks, 0%-20% for High-Risk stocks, and 0%-35% for Speculative stocks); and Sell (3) (negative total return). For securities in emerging markets (Asia Pacific, Emerging Europe/Middle East/Africa, and Latin America), investment ratings are: Buy (1) (expected total return of 15% or more for Low-Risk stocks, 20% or more for Medium-Risk stocks, 30% or more for High-Risk stocks, and 40% or more for Speculative stocks); Hold (2) (5%-15% for Low-Risk stocks, 10%-20% for Medium-Risk stocks, 15%-30% for High-Risk stocks, and 20%-40% for Speculative stocks); and Sell (3) (5% or less for Low-Risk stocks, 10% or less for Medium-Risk stocks, 15% or less for High-Risk stocks, and 20% or less for Speculative stocks). Investment ratings are determined by the ranges described above at the time of initiation of coverage, a change in investment and/or risk rating, or a change in target price (subject to limited management discretion). At other times, the expected total returns may fall outside of these ranges because of market price movements and/or other short-term volatility or trading patterns. Such interim deviations from specified ranges will be permitted but will become subject to review by Research Management. Your decision to buy or sell a security should be based upon your personal investment objectives and should be made only after evaluating the stock's expected performance and risk.
Guide to Corporate Bond Research Credit Opinions and Investment Ratings: Citigroup Investment Research's corporate bond research issuer publications include a fundamental credit opinion of Improving, Stable or Deteriorating and a complementary risk rating of Low (L), Medium (M), High (H) or Speculative (S) regarding the credit risk of the company featured in the report. The fundamental credit opinion reflects the CIR analyst's opinion of the direction of credit fundamentals of the issuer without respect to securities market vagaries. The fundamental credit opinion is not geared to, but should be viewed in the context of debt ratings issued by major public debt ratings companies such as Moody's Investors Service, Standard and Poor's, and Fitch Ratings. CBR risk ratings are approximately equivalent to the following matrix: Low Risk -- Triple A to Low Double A Low to Medium Risk -- High Single A through High Triple B Medium to High Risk -- Mid Triple B through High Double B High to Speculative Risk -- Mid Double B and Below The risk rating element illustrates the analyst's opinion of the relative likelihood of loss of principal when a fixed-income security issued by a company is held to maturity, based upon both fundamental and market risk factors. Certain reports published by Citigroup Investment Research will also include investment ratings on specific issues of companies under coverage which have been assigned fundamental credit opinions and risk ratings. Investment ratings are a function of Citigroup Investment Research's expectations for total return, relative return (to publicly available Citigroup bond indices performance), and risk rating. These investment ratings are: Buy/Overweight -- the bond is expected to outperform the relevant Citigroup bond market sector index (Broad Investment Grade, High Yield Market or Emerging Market), performances of which are updated monthly and can be viewed at http://www.sd.ny.ssmb.com/ using the "Indexes" tab; Hold/Neutral Weight -- the bond is expected to perform in line with the relevant Citigroup bond market sector index; or Sell/Underweight -- the bond is expected to underperform the relevant sector of the Citigroup indexes.
OTHER DISCLOSURES The subject company's share price set out on the front page of this Product is quoted as at 19 April 2007 03:44 PM on the issuer's primary market.
Within the past 5 years, Citigroup Global Markets Inc. or its affiliates has acted as manager or co manager of an offering of equity securities of Esprit and GOME.
Citigroup Global Markets Inc. or its affiliates beneficially owns 2% or more of any class of common equity securities of Golden Eagle Retail Group.
Citigroup Global Markets Inc. or its affiliates beneficially owns 5% or more of any class of common equity securities of Pantaloon.
Citigroup Global Markets Inc. or its affiliates holds a long position in any class of common equity securities of China Resources Enterprise, Esprit, Giordano International and GOME.
For securities recommended in the Product in which the Firm is not a market maker, the Firm is a liquidity provider in the issuers' financial instruments and may act as principal in connection with such transactions. The Firm is a regular issuer of traded financial instruments linked to securities that may have been recommended in the Product. The Firm regularly trades in the securities of the subject company(ies) discussed in the Product. The Firm may engage in securities transactions in a manner inconsistent with the Product and, with respect to securities covered by the Product, will buy or sell from customers on a principal basis.
This Product has been modified by the author following a discussion with one or more of the named companies.
Securities recommended, offered, or sold by the Firm: (i) are not insured by the Federal Deposit Insurance Corporation; (ii) are not deposits or other obligations of any insured depository institution (including Citibank); and (iii) are subject to investment risks, including the possible loss of the principal amount invested. Although information has been obtained from and is based upon sources that the Firm believes to be reliable, we do not guarantee its accuracy and it may be incomplete and condensed. Note, however, that the Firm has taken all reasonable steps to determine the accuracy and completeness of the disclosures made in the Important Disclosures section of the Product. The Firm's research department has received assistance from the subject company(ies) referred to in this Product including, but not limited to, discussions with management of the subject company(ies). Firm policy prohibits research analysts from sending draft research to subject companies. However, it should be presumed that the author of the Product has had discussions with the subject company to ensure factual accuracy prior to publication. All opinions, projections and estimates constitute the judgment of the author as of the date of the Product and these, plus any other information contained in the Product, are subject to change without notice. Prices and availability of financial instruments also are subject to change without notice. Notwithstanding other departments within the Firm advising the

Shoppers Stop (SHOP.BO) 20 April 2007
Citigroup Global Markets | Equity Research 15
companies discussed in this Product, information obtained in such role is not used in the preparation of the Product. Although Citigroup Investment Research does not set a predetermined frequency for publication, if the Product is a fundamental research report, it is the intention of Citigroup Investment Research to provide research coverage of the/those issuer(s) mentioned therein, including in response to news affecting this issuer, subject to applicable quiet periods and capacity constraints. The Product is for informational purposes only and is not intended as an offer or solicitation for the purchase or sale of a security. Any decision to purchase securities mentioned in the Product must take into account existing public information on such security or any registered prospectus.
Investing in non-U.S. securities, including ADRs, may entail certain risks. The securities of non-U.S. issuers may not be registered with, nor be subject to the reporting requirements of the U.S. Securities and Exchange Commission. There may be limited information available on foreign securities. Foreign companies are generally not subject to uniform audit and reporting standards, practices and requirements comparable to those in the U.S. Securities of some foreign companies may be less liquid and their prices more volatile than securities of comparable U.S. companies. In addition, exchange rate movements may have an adverse effect on the value of an investment in a foreign stock and its corresponding dividend payment for U.S. investors. Net dividends to ADR investors are estimated, using withholding tax rates conventions, deemed accurate, but investors are urged to consult their tax advisor for exact dividend computations. Investors who have received the Product from the Firm may be prohibited in certain states or other jurisdictions from purchasing securities mentioned in the Product from the Firm. Please ask your Financial Consultant for additional details. Citigroup Global Markets Inc. takes responsibility for the Product in the United States. Any orders by US investors resulting from the information contained in the Product may be placed only through Citigroup Global Markets Inc.
The Citigroup legal entity that takes responsibility for the production of the Product is the legal entity which the first named author is employed by. The Product is made available in Australia to wholesale clients through Citigroup Global Markets Australia Pty Ltd. (ABN 64 003 114 832 and AFSL No. 240992) and to retail clients through Citigroup Wealth Advisors Pty Ltd. (ABN 19 009 145 555 and AFSL No. 240813), Participants of the ASX Group and regulated by the Australian Securities & Investments Commission. Citigroup Centre, 2 Park Street, Sydney, NSW 2000. The Product is made available in Australia to Private Banking wholesale clients through Citigroup Pty Limited (ABN 88 004 325 080 and AFSL 238098). Citigroup Pty Limited provides all financial product advice to Australian Private Banking wholesale clients through bankers and relationship managers. If there is any doubt about the suitability of investments held in Citigroup Private Bank accounts, investors should contact the Citigroup Private Bank in Australia. Citigroup companies may compensate affiliates and their representatives for providing products and services to clients. If the Product is being made available in certain provinces of Canada by Citigroup Global Markets (Canada) Inc. (“CGM Canada”), CGM Canada has approved the Product. Citigroup Place, 123 Front Street West, Suite 1100, Toronto, Ontario M5J 2M3. The Product may not be distributed to private clients in Germany. The Product is distributed in Germany by Citigroup Global Markets Deutschland AG & Co. KGaA, which is regulated by Bundesanstalt fuer Finanzdienstleistungsaufsicht (BaFin). Frankfurt am Main, Reuterweg 16, 60323 Frankfurt am Main. If the Product is made available in Hong Kong by, or on behalf of, Citigroup Global Markets Asia Ltd., it is attributable to Citigroup Global Markets Asia Ltd., Citibank Tower, Citibank Plaza, 3 Garden Road, Hong Kong. Citigroup Global Markets Asia Ltd. is regulated by Hong Kong Securities and Futures Commission. If the Product is made available in Hong Kong by The Citigroup Private Bank to its clients, it is attributable to Citibank N.A., Citibank Tower, Citibank Plaza, 3 Garden Road, Hong Kong. The Citigroup Private Bank and Citibank N.A. is regulated by the Hong Kong Monetary Authority. The Product is made available in India by Citigroup Global Markets India Private Limited, which is regulated by Securities and Exchange Board of India. Bakhtawar, Nariman Point, Mumbai 400-021. If the Product was prepared by Citigroup Investment Research and distributed in Japan by Nikko Citigroup Ltd., it is being so distributed under license. Nikko Citigroup Limited is regulated by Financial Services Agency, Securities and Exchange Surveillance Commission, Japan Securities Dealers Association, Tokyo Stock Exchange and Osaka Securities Exchange. Akasaka Park Building, 2-20, Akasaka 5-chome, Minato-ku, Tokyo 107-6122. The Product is made available in Korea by Citigroup Global Markets Korea Securities Ltd., which is regulated by Financial Supervisory Commission and the Financial Supervisory Service. Hungkuk Life Insurance Building, 226 Shinmunno 1-GA, Jongno-Gu, Seoul, 110-061. The Product is made available in Malaysia by Citigroup Global Markets Malaysia Sdn Bhd, which is regulated by Malaysia Securities Commission. Menara Citibank, 165 Jalan Ampang, Kuala Lumpur, 50450. The Product is made available in Mexico by Acciones y Valores Banamex, S.A. De C. V., Casa de Bolsa, which is regulated by Comision Nacional Bancaria y de Valores. Reforma 398, Col. Juarez, 06600 Mexico, D.F. In New Zealand the Product is made available through Citigroup Global Markets New Zealand Ltd., a Participant of the New Zealand Exchange Limited and regulated by the New Zealand Securities Commission. Level 19, Mobile on the Park, 157 lambton Quay, Wellington. The Product is made available in Poland by Dom Maklerski Banku Handlowego SA an indirect subsidiary of Citigroup Inc., which is regulated by Komisja Papierów Wartosciowych i Gield. Bank Handlowy w Warszawie S.A. ul. Senatorska 16, 00-923 Warszawa. The Product is made available in the Russian Federation through ZAO Citibank, which is licensed to carry out banking activities in the Russian Federation in accordance with the general banking license issued by the Central Bank of the Russian Federation and brokerage activities in accordance with the license issued by the Federal Service for Financial Markets. Neither the Product nor any information contained in the Product shall be considered as advertising the securities mentioned in this report within the territory of the Russian Federation or outside the Russian Federation. The Product does not constitute an appraisal within the meaning of the Federal Law of the Russian Federation of 29 July 1998 No. 135-FZ (as amended) On Appraisal Activities in the Russian Federation. 8-10 Gasheka Street, 125047 Moscow. The Product is made available in Singapore through Citigroup Global Markets Singapore Pte. Ltd., a Capital Markets Services Licence holder, and regulated by Monetary Authority of Singapore. 1 Temasek Avenue, #39-02 Millenia Tower, Singapore 039192. The Product is made available by The Citigroup Private Bank in Singapore through Citibank, N.A., Singapore branch, a licensed bank in Singapore that is regulated by Monetary Authority of Singapore. Citigroup Global Markets (Pty) Ltd. is incorporated in the Republic of South Africa (company registration number 2000/025866/07) and its registered office is at 145 West Street, Sandton, 2196, Saxonwold. Citigroup Global Markets (Pty) Ltd. is regulated by JSE Securities Exchange South Africa, South African Reserve Bank and the Financial Services Board. The investments and services contained herein are not available to private customers in South Africa. The Product is made available in Taiwan through Citigroup Global Markets Inc. (Taipei Branch), which is regulated by Securities & Futures Bureau. No portion of the report may be reproduced or quoted in Taiwan by the press or any other person. No. 8 Manhattan Building, Hsin Yi Road, Section 5, Taipei 100, Taiwan. The Product is made available in Thailand through Citicorp Securities (Thailand) Ltd., which is regulated by the Securities and Exchange Commission of Thailand. 18/F, 22/F and 29/F, 82 North Sathorn Road, Silom, Bangrak, Bangkok 10500, Thailand. The Product is made available in United Kingdom by Citigroup Global Markets Limited, which is authorised and regulated by Financial Services Authority. This material may relate to investments or services of a person outside of the UK or to other matters which are not regulated by the FSA and further details as to where this may be the case are available upon request in respect of this material. Citigroup Centre, Canada Square, Canary Wharf, London, E14 5LB. The Product is made available in United States by Citigroup Global Markets Inc, which is regulated by NASD, NYSE and the US Securities and Exchange Commission. 388 Greenwich Street, New York, NY 10013. Unless specified to the contrary, within EU Member States, the Product is made available by Citigroup Global Markets Limited, which is regulated by Financial Services Authority. Many European regulators require that a firm must establish, implement and make available a policy for managing conflicts of interest arising as a result of publication or distribution of investment research. The policy applicable to Citigroup Investment Research's Products can be found at www.citigroupgeo.com. Compensation of equity research analysts is determined by equity research management and Citigroup's senior management and is not linked to specific transactions or recommendations. The Product may have been distributed simultaneously, in multiple formats, to the Firm's worldwide institutional and retail customers. The Product is not to be construed as providing investment services in any jurisdiction where the provision of such services would be illegal. Subject to the nature and contents of the Product, the investments described therein are subject to fluctuations in price and/or value and investors may get back less than originally invested. Certain high-volatility investments can be subject to sudden and large falls in value that could equal or exceed the amount invested. Certain investments contained in the Product may have tax implications for private customers whereby levels and basis of taxation may be subject to change. If in doubt, investors should seek advice from a tax adviser. Advice in the Product has been prepared without taking account of the objectives, financial situation

Shoppers Stop (SHOP.BO) 20 April 2007
Citigroup Global Markets | Equity Research 16
or needs of any particular investor. Accordingly, investors should, before acting on the advice, consider the appropriateness of the advice, having regard to their objectives, financial situation and needs.
© 2007 Citigroup Global Markets Inc. Citigroup Investment Research is a division and service mark of Citigroup Global Markets Inc. and its affiliates and is used and registered throughout the world. Citigroup and the Umbrella Device are trademarks and service marks of Citigroup or its affiliates and are used and registered throughout the world. Nikko is a registered trademark of Nikko Cordial Corporation. All rights reserved. Any unauthorized use, duplication, redistribution or disclosure is prohibited by law and will result in prosecution. The information contained in the Product is intended solely for the recipient and may not be further distributed by the recipient. The Firm accepts no liability whatsoever for the actions of third parties. The Product may provide the addresses of, or contain hyperlinks to, websites. Except to the extent to which the Product refers to website material of the Firm, the Firm has not reviewed the linked site. Equally, except to the extent to which the Product refers to website material of the Firm, the Firm takes no responsibility for, and makes no representations or warranties whatsoever as to, the data and information contained therein. Such address or hyperlink (including addresses or hyperlinks to website material of the Firm) is provided solely for your convenience and information and the content of the linked site does not in anyway form part of this document. Accessing such website or following such link through the Product or the website of the Firm shall be at your own risk and the Firm shall have no liability arising out of, or in connection with, any such referenced website.
ADDITIONAL INFORMATION IS AVAILABLE UPON REQUEST


