Embed Size (px)
Citation preview
www.elsevier.com/locate/ynimg
NeuroImage 23 (2004) 849–859
Short-term modulation of regional excitability and blood
flow in human motor cortex following rapid-rate
transcranial magnetic stimulation
Beatrice Takano,a,b Alexander Drzezga,c Martin Peller,c,d,e Iris Sax,a Markus Schwaiger,c
Lucy Lee,f and Hartwig Roman Siebnerd,e,*
aDepartment of Neurology, Munich University of Technology, Munich, GermanybDepartment of Neurology, Stadtisches Krankenhaus Munchen Bogenhausen, Munich, GermanycDepartment of Nuclear Medicine, Munich University of Technology, Munich, GermanydDepartment of Neurology, Christian-Albrechts-University, Kiel, GermanyeNeuroImageNord Kiel-Hamburg-Lubeck at Hamburg University Hospital, Hamburg, GermanyfWellcome Department of Imaging Neuroscience, Institute of Neurology, University College London, London, UK
Received 3 December 2003; revised 23 March 2004; accepted 22 June 2004
Available online 12 October 2004
Repetitive transcranial magnetic stimulation (rTMS) of the human
primarymotor cortex (M1) provides ameans of inducing lasting changes
in cortical excitability and synaptic activity. Here we combined rTMS
with positron emission tomography of regional cerebral blood flow
(rCBF) to examine how an rTMS-induced change in intracortical
excitability of inhibitory circuits affects regional synaptic activity. In a
first set of experiments, we gave 150 biphasic pulses of 5 Hz rTMS at
90% of active motor threshold to left M1 and used single- and paired-
pulse TMS to assess the conditioning effects of rTMS on motor cortical
excitability at rest. rTMS conditioning led to a selective decrease in
short-latency intracortical inhibition (SICI) without affecting short-
latency intracortical facilitation or corticospinal excitability. The
decrease in SICI lasted for approximately 8min. In a second experiment,
we used the same rTMS protocol and measured changes in regional
synaptic activity (as indexed by rCBF) during and for up to 14 min after
the end of rTMS. Subthreshold 5 Hz rTMS induced a region-specific
increase in resting rCBF in the stimulated M1 lasting approximately 8
min. These results suggest that in the stimulated M1, temporary
attenuation of SICI is paralleled by an increase in synaptic activity,
consistent with reduced efficacy of intracortical GABAA-ergic synapses.
The present findings demonstrate that short trains of low-intensity 5 Hz
rTMS can be used to induce a transient change in function within a
distinct cortical area. This opens up new possibilities for studying acute
reorganization at the systems level in the intact human brain.
D 2004 Elsevier Inc. All rights reserved.
Keywords: Functional imaging; Inhibition; Motor cortex; Regional cerebral
blood flow; Synaptic activity; Transcranial magnetic stimulation
1053-8119/$ - see front matter D 2004 Elsevier Inc. All rights reserved.
doi:10.1016/j.neuroimage.2004.06.032
* Corresponding author. Department of Neurology, Christian-
Albrechts-University, Schittenhelmstrasse 10, 24105 Kiel, Germany. Fax:
+49 431 5978502.
E-mail address: [email protected] (H.R. Siebner).
Available online on ScienceDirect (www.sciencedirect.com.)
Introduction
In recent years, repetitive transcranial magnetic stimulation
(rTMS) has become a well-established tool with which to induce
acute reorganization in the human cortex (Siebner and Rothwell,
2003). Several studies have demonstrated that rTMS to the primary
motor hand area (M1) can induce changes in the excitability of
corticospinal neurons (Chen et al., 1997; Pascual-Leone et al.,
1994). In these studies, corticospinal excitability was assessed at
rest by measuring the motor evoked potentials (MEPs) elicited by a
single pulse in relaxed contralateral hand muscles.
The frequency of rTMS plays an important role in determining
if the lasting modulatory effects on corticospinal excitability are
predominantly facilitatory or inhibitory (Chen et al., 1997; Maeda
et al., 2000; Pascual-Leone et al., 1994).
At intensities above motor threshold, short trains of high-
frequency rTMS (at frequencies of about 5 Hz or more) can
increase corticospinal excitability for several minutes after cessa-
tion of rTMS (Berardelli et al., 1998; Di Lazzaro et al., 2002;
Inghillieri et al., 2004; Pascual-Leone et al., 1994), whereas low-
frequency rTMS (at frequencies around 1 Hz) causes a decrease in
corticospinal excitability (Chen et al., 1997; Muellbacher et al.,
2000; Touge et al., 2001). Similar bidirectional effects have also
been observed after rTMS at intensities below resting motor
threshold (Gangitano et al., 2002; Maeda et al., 2000), but
subthreshold rTMS usually requires a greater number of stimuli
per rTMS session to induce consistent changes in corticospinal
excitability.
Lasting changes in motor cortex excitability can also be studied
using the conditioning test paradigm described by Kujirai et al.
(1993). This technique uses pairs of TMS pulses given through the
same coil. A conditioning (subthreshold) stimulus over M1
modulates the amplitude of a test MEP evoked by a suprathreshold
B. Takano et al. / NeuroImage 23 (2004) 849–859850
stimulus given a few milliseconds later. The test MEP is
consistently inhibited at conditioning test intervals of 1–5 ms, this
inhibitory interaction is called short-latency intracortical inhibition
(SICI). A facilitatory effect on the test MEP is seen with
conditioning test intervals of 8–15 ms (called short-latency
intracortical facilitation). There is converging evidence that these
effects are mediated by separate subpopulations of inhibitory
(presumably GABAA-ergic) and excitatory (presumably glutama-
tergic) cortical interneurons (Di Lazzaro et al., 1998; Kujirai et al.,
1993; Ziemann, 1999).
Using the paired-pulse paradigm of Kujirai et al. (1993), it has
been shown that subthreshold high-frequency rTMS can reduce the
strength of SICI (Di Lazzaro et al., 2002; Pascual-Leone et al.,
1998; Peinemann et al., 2000; Wu et al., 2000). Di Lazzaro et al.
(2002) reported that 50 stimuli of 5 Hz rTMS at active motor
threshold decreased the magnitude of SICI for several minutes.
There was no effect on motor threshold, MEP amplitude, short-
latency intracortical facilitation (SICF), or the duration of the
cortical silent period, suggesting a specific effect on SICI. Epidural
recordings of descending corticospinal volleys confirmed that this
effect of 5 Hz rTMS on SICI occurred at a cortical level.
In this study, we combined rTMS with positron emission
tomography (PET) of regional cerebral blood flow (rCBF) to
examine how a short train of subthreshold 5 Hz rTMS modulates
synaptic activity in the stimulated M1. We first established an
rTMS protocol that induced a transient reduction in SICI lasting
several minutes. We then applied this rTMS protocol to the left M1
in the PET scanner to investigate the immediate and enduring
effects of rTMS on regional synaptic activity (as indexed by
rCBF). In a previous study, we have shown that bon-lineQ PET
imaging during low-intensity rTMS at 90% of active motor
threshold can be used to map rate-dependent activation of the left
M1 (Siebner et al., 2001). Here we demonstrate that boff-lineQ PET
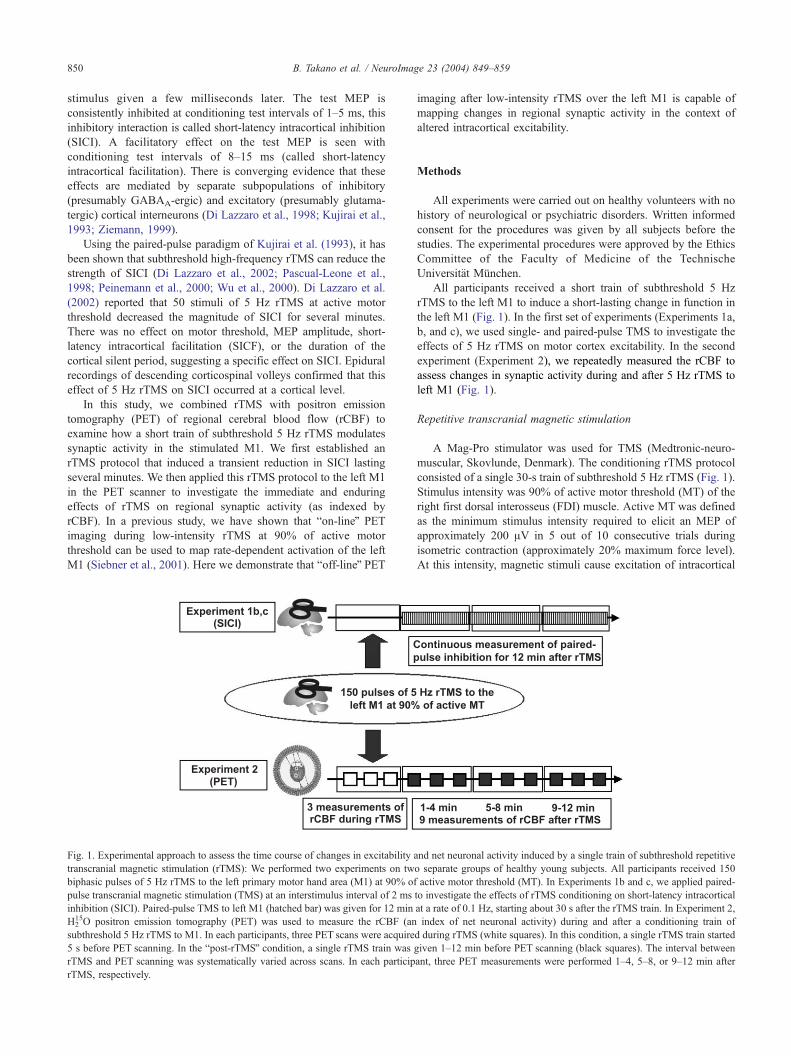
Fig. 1. Experimental approach to assess the time course of changes in excitability
transcranial magnetic stimulation (rTMS): We performed two experiments on tw
biphasic pulses of 5 Hz rTMS to the left primary motor hand area (M1) at 90% of
pulse transcranial magnetic stimulation (TMS) at an interstimulus interval of 2 ms
inhibition (SICI). Paired-pulse TMS to left M1 (hatched bar) was given for 12 min
H215O positron emission tomography (PET) was used to measure the rCBF (an
subthreshold 5 Hz rTMS to M1. In each participants, three PET scans were acquire
5 s before PET scanning. In the bpost-rTMSQ condition, a single rTMS train was
rTMS and PET scanning was systematically varied across scans. In each particip
rTMS, respectively.
imaging after low-intensity rTMS over the left M1 is capable of
mapping changes in regional synaptic activity in the context of
altered intracortical excitability.
Methods
All experiments were carried out on healthy volunteers with no
history of neurological or psychiatric disorders. Written informed
consent for the procedures was given by all subjects before the
studies. The experimental procedures were approved by the Ethics
Committee of the Faculty of Medicine of the Technische
Universit7t Mqnchen.All participants received a short train of subthreshold 5 Hz
rTMS to the left M1 to induce a short-lasting change in function in
the left M1 (Fig. 1). In the first set of experiments (Experiments 1a,
b, and c), we used single- and paired-pulse TMS to investigate the
effects of 5 Hz rTMS on motor cortex excitability. In the second
experiment (Experiment 2), we repeatedly measured the rCBF to
assess changes in synaptic activity during and after 5 Hz rTMS to
left M1 (Fig. 1).
Repetitive transcranial magnetic stimulation
A Mag-Pro stimulator was used for TMS (Medtronic-neuro-
muscular, Skovlunde, Denmark). The conditioning rTMS protocol
consisted of a single 30-s train of subthreshold 5 Hz rTMS (Fig. 1).
Stimulus intensity was 90% of active motor threshold (MT) of the
right first dorsal interosseus (FDI) muscle. Active MT was defined
as the minimum stimulus intensity required to elicit an MEP of
approximately 200 AV in 5 out of 10 consecutive trials during
isometric contraction (approximately 20% maximum force level).
At this intensity, magnetic stimuli cause excitation of intracortical
and net neuronal activity induced by a single train of subthreshold repetitive
o separate groups of healthy young subjects. All participants received 150
active motor threshold (MT). In Experiments 1b and c, we applied paired-
to investigate the effects of rTMS conditioning on short-latency intracortical
at a rate of 0.1 Hz, starting about 30 s after the rTMS train. In Experiment 2,
index of net neuronal activity) during and after a conditioning train of
d during rTMS (white squares). In this condition, a single rTMS train started
given 1–12 min before PET scanning (black squares). The interval between
ant, three PET measurements were performed 1–4, 5–8, or 9–12 min after
B. Takano et al. / NeuroImage 23 (2004) 849–859 851
inhibitory and facilitatory interneurons without evoking descend-
ing corticospinal volleys (Di Lazzaro et al., 1998).
The site for stimulating the left M1 was defined functionally as
the optimum position for eliciting a maximal MEP in the right FDI
muscle. This was determined by moving the coil in 0.5 cm steps
around the presumed M1. The site at which minimally supra-
threshold stimuli consistently produced the largest MEP in the
target muscle was marked with a red wax pen as the bmotor hot
spotQ by drawing a line following the anterior bifurcation of the
coil and a straight line indicating the orientation of the coil handle.
The handle of the coil was attached to an integrated fixation unit of
the head and the coil. Correct coil position was continuously
monitored throughout the experiment.
A specially designed figure-of-eight coil was used for rTMS of
the left M1 (Medtronic-neuromuscular). The coil had an 8-m cable
and an outer winding diameter of approximately 10 cm consisting
of two 10-turn copper windings. The handle of the coil was oriented
perpendicular to the plane of the coil. The coil was placed
tangentially to the scalp with the junction region pointing back-
wards and laterally at 458 to the sagittal plane, approximately
perpendicular to the line of the central sulcus. This orientation was
chosen because motor threshold is at a minimum when the electrical
current induced in the brain flows approximately perpendicular to
the line of the central sulcus (Brasil-Neto et al., 1992). The stimuli
had a biphasic waveform with a pulse width of 200 As and a rise
time of 50 As. The first phase of the biphasic stimulus induced an
anterior to posterior current in the stimulated M1.
Experiment 1: Effects on motor cortex excitability
In this experiment, we assessed the effects of a 30-s train of 5
Hz rTMS on corticospinal and corticocortical excitability by
measuring the amplitude of the MEP in the relaxed right FDI
muscle. The amplitude of the MEP elicited by a single pulse
depends on the excitability of M1 and the spinal cord. Therefore,
the MEP size provides a measure of overall corticospinal
excitability (Rothwell et al., 1999). By contrast, the MEP response
to pairs of magnetic stimuli provides specific information about the
excitability of intracortical inibitory or facilitatory circuits when a
conditioning test approach is used (Kujirai et al., 1993; Rothwell,
1999; Ziemann, 1999).
Participants were comfortably seated in an armchair. The back of
the head was supported by a headrest and the head was fixed to the
headrest by a headband. To ensure constant stimulation conditions
the headrest was connected to a metal frame upon which a flexible
coil holder was mounted. Correct coil position was continuously
monitored by the experimenter throughout the experiment.
Experiment 1a: specificity of cortical excitability changes
The first experiment was designed to test whether rTMS
conditioning caused selective attenuation of SICI in the stimulated
M1. Ten healthy volunteers (two females) aged between 24 and 38
years (mean age: 27 years) participated in the first experiment.
Nine volunteers were consistently right-handed according to the
Edinburgh Handedness Inventory (Oldfield, 1971). One participant
was a converted left-hander.
We gave 150 pulses of 5 Hz rTMS to left M1 at 90% active MT.
Using the method of Kujirai et al. (1993), the excitability of left
M1 was assessed with single and paired-pulse TMS before
(baseline) and up to 3 min after rTMS. Paired magnetic stimuli
at an interstimulus interval (ISI) of 2 ms were used to assess SICI.
SICF was tested with paired stimuli at an ISI of 10 ms. We selected
an ISI of 2 ms to test SICI because at this interval any change in
SICI is not confounded by concomitant effects on bfacilitatory I-
wave interactionQ (Rothwell, 1999). Moreover a recent study
reported that a short train of 5 Hz rTMS at active MT produced a
similar attenuation of SICI at ISIs of 2 and 3 ms (Di Lazzaro et al.,
2002), indicating that an ISI of 2 ms was suitable for probing
changes in SICI.
The intensity of the conditioning stimulus was 90% of active
MT. The intensity of the test stimulus was adjusted to elicit MEPs of
about 1 mV peak-to-peak amplitude when given alone. The intensity
of the test stimulus corresponded to approximately 110–120% of
resting MT. In addition to paired-pulse TMS, the test stimulus was
also given alone to assess changes in overall corticospinal
excitability. Stimulus intensities were determined at the beginning
of each experiment, and the individual stimulus intensities for
single- and paired-pulse TMS were kept constant throughout the
experiment. Magnetic stimuli were given every 6 s to avoid any
modulation of motor cortical excitability by the measurements.
For single- and paired-pulse TMS, the same figure-of-eight coil
which was used for rTMS of the left M1 was attached to a Maglite
stimulator with Twintop option for single- and paired-pulse TMS
(Medtronic-neuromuscular). This enabled us to assess motor
cortical excitability within 30 s of the end of the rTMS train while
maintaining constant stimulation conditions. This is in contrast to
previous studies (Di Lazzaro et al., 2002) where baseline and post-
rTMS measurements were not performed with the same stimulating
coil and pulse configuration as rTMS. With the coil configuration
used in the current study, we ensured that the neuronal circuits
conditioned with rTMS closely matched those assessed with single
and paired-pulse TMS.
Changes in corticospinal excitability (assessed with single-
pulse TMS), SICI (assessed with paired-pulse TMS at an ISI of 2
ms), and SICF (assessed with paired-pulse TMS at an ISI of 10 ms)
were measured in separate trials. A trial consisted of an rTMS train
plus TMS measurements of cortical excitability before and after the
rTMS train. To determine baseline corticospinal excitability, 10
stimuli were applied to the left M1 before rTMS. A conditioning
train of rTMS was then given to the left M1. Thirty seconds after
completion of rTMS, 30 further MEP measurements were
obtained. A single trial (i.e., baseline measurements, rTMS, and
post-rTMS measurements) lasted approximately 6 min. After
completion of each trial, the experiment was paused for 4 min.
A previous study by Di Lazzaro et al. (2002) suggested a transient
change in SICI for less than 10 min following a short train of 5 Hz
rTMS at active MT. Therefore, an intertrial interval of 10 min was
chosen to avoid carry-over effects between trials. In each
participant, five trials were performed for each measure of cortical
excitability. The order of trials was pseudo-randomized and
counterbalanced among subjects. The entire experiment lasted for
approximately 2 1/2 h.
MEPs were recorded from Ag-AgCl surface electrodes over the
right FDI muscle using a belly-tendon montage. EMG signals were
amplified (Toennies Myograph II, Wuerzburg, Germany), filtered
(20 Hz to 2 kHz), digitized at 5 kHz (CED 1401 Laboratory
Interface, Cambridge Electronic Design, Cambridge, UK), and
stored for further analysis (NuCursor, Sobell Department of Motor
Neuroscience and Movement Disorders, Institute of Neurology,
University College of London, London, UK).
Throughout the experiment, the target muscle was completely
relaxed. Absence of background EMG activity was monitored with
B. Takano et al. / NeuroImage 23 (2004) 849–859852
visual (oscilloscope) and auditory (speakers) feedback, and trials
with background EMG activity were rejected.
Peak-to-peak amplitude was measured for individual MEPs.
For each trial, the 30 MEPs recorded after rTMS were divided in
blocks of 10 consecutive MEPs elicited during the 1st, 2nd, and
3rd minute after rTMS. For each measure of cortical excitability,
the mean MEP amplitude for each block was calculated and
expressed as a percentage of the mean amplitude of the 10 baseline
MEPs.
The effects of rTMS on motor cortex excitability were
evaluated using repeated measures analyses of variance (ANOVA).
Using the normalized MEP amplitude as a dependent variable, we
computed a two-way repeated-measures ANOVA with btime binQ(three levels: 1st, 2nd, and 3rd minute after rTMS) and bmeasure of
excitabilityQ (three levels: single-pulse excitability, SICI, and SICF)as within-subject factors.
In a second ANOVA, we tested for time-dependent changes in
MEP amplitude at baseline during the course of the experiment.
Our concern was that there might be carry-over effects from trial to
trial resulting in a gradual shift in cortical excitability. The two-
factorial ANOVA model treated borderQ of trials (six levels: 1st,
2nd, 3rd, 4th, 5th, and 6th trial) and bmeasure of excitability Q(three levels: single-pulse excitability, SICI, and SICF) as within-
subject factors. The dependent variable was the mean MEP
amplitude at baseline before rTMS conditioning. The Green-
house–Geisser method was used to correct for nonsphericity. P
values of b0.05 were considered significant.
Experiments 1b and c: Time course of excitability changes
In Experiments 1b and c, we investigated the time course of
changes in SICI using the same rTMS protocol as Experiment 1a.
Since Experiment 1a suggested a selective effect of subthreshold 5
Hz rTMS on intracortical inhibition, Experiments 1b and c focused
exclusively on SICI. Paired-pulse TMS at an ISI of 2 ms was used
to determine the time course of rTMS-induced changes in SICI.
The procedures for measuring SICI at an ISI of 2 ms were identical
to those described in Experiment 1a. Data acquisition was identical
to Experiment 1a.
Experiment 1b
Twelve healthy volunteers (one female) aged between 23 and 41
years (mean age: 31 years) were studied. Eleven participants were
consistent right-handers and one person was a consistent left-hander
according to the Edinburgh Handedness Inventory (Oldfield, 1971).
In Experiment 1b, we measured SICI at baseline (i.e., immediately
before rTMS) and up to 12 min after a single conditioning train of 5
Hz rTMS.Measurements of SICI were carried out in separate blocks
immediately before 5 Hz rTMS (baseline), as well as three times
after 5 Hz rTMS. Each block consisted of 40 consecutive measure-
ments to reduce the variability of the MEP data. Using an ISI of 2
ms, paired-pulse TMS was given over left M1 every 6 s. Each bock
of measurements lasted 4 min, resulting in four time bins (baseline,
1–4, 5–8, and 9–12 min after rTMS). Peak-to-peak amplitude was
measured for individual MEPs recorded from the relaxed right FDI
muscle. In each participant, the meanMEP amplitude for each block
was calculated and entered as dependent variable into a one-way
ANOVA. The factor was btime binQ (four levels).
Experiment 1c
Six healthy male volunteers aged between 26 and 38 years
(mean age: 29 years) participated in Experiment 1c. All subjects
were consistent right-handers according to the Edinburgh Handed-
ness Inventory (Oldfield, 1971). Experiment 1c also explored the
time course of changes in SICI after a single rTMS train (Fig. 1). In
contrast to Experiment 1b, the rTMS trains were repeated at
approximately 13- to 15-min intervals and the time course of SICI
changes was measured after each train. This experiment was
necessary to demonstrate that the excitability changes observed
after a single conditioning train could be reliably provoked by 5 Hz
rTMS, even when rTMS was repeated several times during a single
session.
The experiment consisted of six consecutive trials. Each trial
consisted of a train of 5 Hz rTMS followed by paired-pulse TMS.
Paired-pulse TMS started about 30 s after the rTMS train and was
applied to left M1 for 12 min at a rate of 0.1 Hz. For each trial, a
total of 72 MEPs were elicited with paired-pulse TMS. MEPs were
grouped in blocks of 24 consecutive measurements to reduce the
variability of the MEP data. Each bock of measurements lasted 4
min, resulting in three time bins (1–4, 5–8, and 9–12 min after
rTMS). Peak-to-peak amplitude was measured for individual
MEPs recorded from the relaxed right FDI muscle. In each
participant, the mean MEP amplitude for each block was calculated
and normalized to the mean MEP amplitude over all blocks.
The time course of SICI was evaluated with repeated measures
analyses of variance (ANOVA). Using the mean MEP amplitude of
each block as a dependent variable, we computed a one-way
repeated measures ANOVAwith btime binQ as within-subject factors(three levels: 1–4, 5–8, and 9–12 min after rTMS). Conditional on a
significant F value, we performed post hoc t tests to directly
compare the magnitude of changes in SICI between epochs. The
Greenhouse–Geisser method was used when necessary to correct
for nonsphericity. P values of b0.05 were considered significant.
Experiment 2: Effects on regional blood flow in the motor cortex
Based on the results of Experiment 1, a PET study (Experiment
2) was performed to (i) compare changes in rCBF during
subthreshold 5 Hz rTMS with changes in rCBF seen after rTMS,
and (ii) to assess the time course of rCBF changes. We studied six
healthy volunteers (one female) aged between 26 and 40 years
(mean age: 31 years). All participants were consistently right-
handed according to the Edinburgh Handedness Inventory (Old-
field, 1971). Permission to administer radioactivity was obtained
from the German radiation protection authorities.
Experimental design
Each participant had 12 consecutive PET measurements of
normalized rCBF (Fig. 1). Three PET scans were acquired during 5
Hz rTMS to the left M1 (bon-lineQ PET imaging). In this condition,
the rTMS train started approximately 5 s before PET scanning.
Since the rTMS train lasted for 30 s, rTMS was only given during
the first half of the PET scan. Nine PET scans were performed up to
12 min after rTMS (boff lineQ PET imaging). To assess the time
course of lasting rTMS effects on rCBF, the interval between PET
scanning and rTMS was systematically varied across scans. In each
participant, three PET measurements were performed 1–4, 5–8, or
9–12 min after rTMS, respectively.
Participants lay supine in the scanner with their eyes closed and
were required to keep still during PET scanning. We recorded a
surface EMG from the right FDI muscle during PET and rTMS
(sample rate: 2000 Hz; band-pass filter: 10–1000 Hz).
B. Takano et al. / NeuroImage 23 (2004) 849–859 853
In this experiment, we did not measure motor cortex
excitability during PET acquisition because this would have
involved repeated administration of single and paired-pulse
TMS. Since suprathreshold TMS pulses induce a consistent
activation of the stimulated M1 (not least because of reafferent
activation caused by the TMS-induced muscle twitch) (Baudewig
et al., 2001), such measurements might confound the interpretation
of rCBF changes as reflecting changes in neuronal activity induced
by rTMS.
PET measurements were conducted using a Siemens ECAT
HR+ scanner (Siemens-CTI Inc., Knoxville, TN, USA) in three-
dimensional mode with interdetector collimating septa removed.
The axial field of view was 15.5 cm covering the whole brain with
no interplane dead space. A well-grounded cylindrical insert
consisting of four layers of 0.5-mm-thick mu-metal was placed
in the patient port of the PET scanner to protect the photo-
multipliers from the effects of the magnetic field generated by the
TMS coil (Paus et al., 1997; Siebner et al., 2001).
Normalized rCBF was measured using 15O-labelled water. For
each measurement of rCBF, 250 mBq of H215O was administered in
the left cubital vein using an infusion pump. Background activity
was calculated over 30 s before each image. Image acquisition
began with the appearance of the tracer bolus in the brain,
approximately 30 s after the start of the infusion and continued for
50 s. This procedure was repeated for each PET scan with
approximately 10 min between scans to allow for adequate decay
of radioactivity. A 10-min head-holder transmission scan with an
external 68Ga/68Ge ring source was acquired before the first rCBF
measurement to allow for a correction of radiation attenuation by
the subject’s head and the objects in the scanner: TMS coil, coil
mount, and metal sheets. A blank transmission scan was performed
with the magnetic shielding in place after the subject was scanned
to correct for the radiation attenuation due to the metal shielding
alone.
All calculations and image transformations were performed on
Sun SPARC 2 workstations (Sun Computers Europe, Inc., Surrey,
UK). PET data were analyzed using statistical parametric mapping
software (SPM99, Wellcome Department of Imaging Neuro-
science, Institute of Neurology, University College of London,
UK; http://www.fil.ion.ucl.ac.uk/spm) implemented in the PRO
Matlab environment (Mathworks Inc., Natic, MA, USA). For each
participant, images were realigned to the first image by rigid body
transformation using a least squares approach on a voxel-by-voxel
basis (Friston et al., 1995a). All images were then normalized using
linear and nonlinear three-dimensional transformations to match
each scan to a template image conforming to the standard
stereotaxic space of the Montreal Neurological Institute (MNI
template) (Friston et al., 1995a). The normalized images were
smoothed using an isotropic Gaussian kernel of 12 mm full-width
at half-maximum to accommodate intersubject differences in
anatomy and enable the application of Gaussian field corrections
during inference. Each voxel of normalized and smoothed images
had a size of 2 � 2 � 4 mm.
Statistical analysis used a general linear model and Gaussian
random field theory to correct for multiple comparisons (Friston et
al., 1990, 1995b). Based on the electrophysiological findings
(Experiment 1), the model included four conditions depending on
the temporal relationship between rTMS conditioning and PET
scanning: (1) rTMS during PET scanning, (2) rTMS given 1–4
min, (3) rTMS given 5–8 min, or (4) rTMS given 9–14 min before
PET scanning. The effect of global differences in cerebral blood
flow among scans was removed by treating global activity as a
confound and scaling to a nominal grand mean global activity of
50 ml/100 ml/min (Friston et al., 1995b). Using appropriately
weighted linear contrasts, this statistical model enabled the
characterization of time-dependent changes in neuronal activity
during and after rTMS. Contrasts were specified to address two
questions. The first set of contrasts tested for differences in rCBF
between scans acquired during rTMS and those acquired after
rTMS (rTMS during PET, rTMS given 1–4, 5–8, or 9–14 min
before PET: 3, �1, �1, �1, and �3, 1, 1, 1). The second set of
contrasts was motivated by the time course of changes in
intracortical inhibition seen after rTMS conditioning. These
contrasts were specified to test for changes in rCBF that mirrored
the changes in strength of SICI in the stimulated M1 after rTMS
conditioning (rTMS during PET, rTMS given 1–4 min before PET,
5–8 min before PET, rTMS given 9–14 min before PET: 0, 1, 1,
�2 and 0, �1, �1, 2).
Statistical inference was prospectively restricted to a region of
interest covering the stimulated left M1, defined by a 20-mm radius
sphere centered on the MNI coordinates: x =�32, y =�22, and z =
56. This site corresponds to the probabilistic location of the left
primary motor hand area as revealed by a meta-analysis of motor
activation studies (Paus et al., 1998). For voxels within the
predefined search volume, a small volume correction was used to
correct for multiple comparisons. For other areas, corrections for
multiple nonindependent comparisons where made over the whole
brain volume. In both cases, P values of b0.05 were considered
statistically significant.
Results
None of the subjects reported any adverse side effects during
the study. The intensities used for 5 Hz rTMS were 36 F 3%
(Experiment 1a), 34 F 3% (Experiment 1b), 35F 4% (Experiment
1c), and 35 F 3% (Experiment 2) of maximum stimulator output.
No EMG responses were evoked in the relaxed right FDI muscles
by the 30-s trains of 5 Hz rTMS.
Experiment 1: Lasting effects on motor cortex excitability
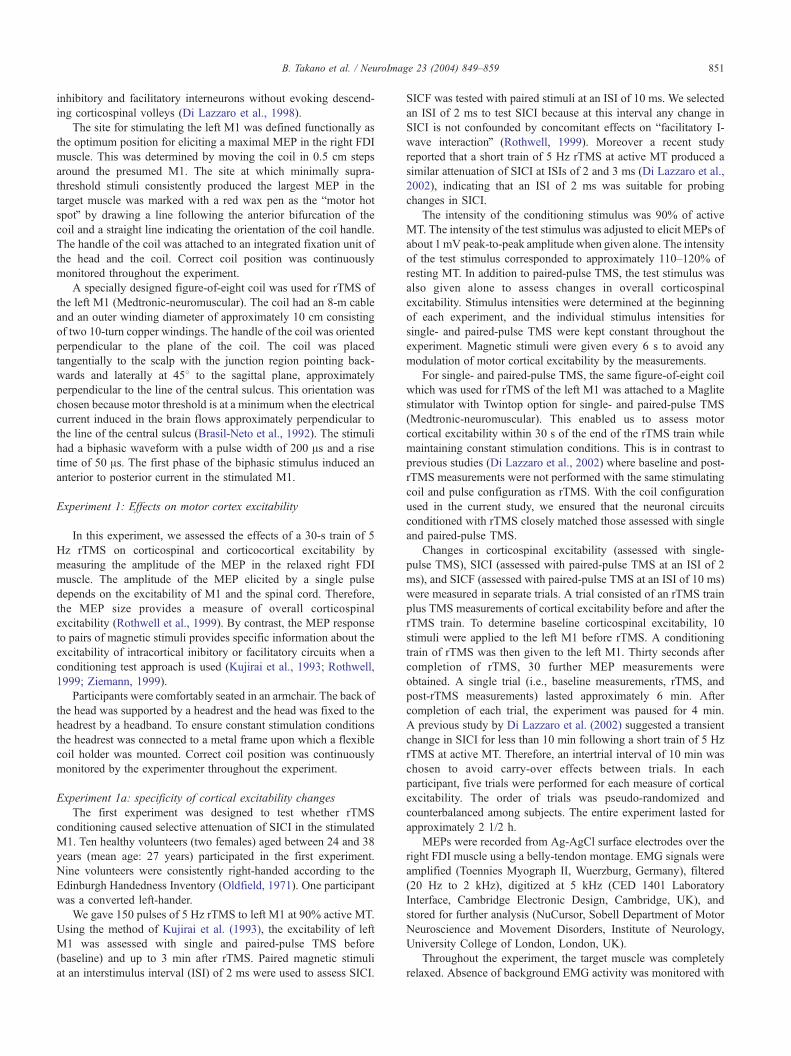
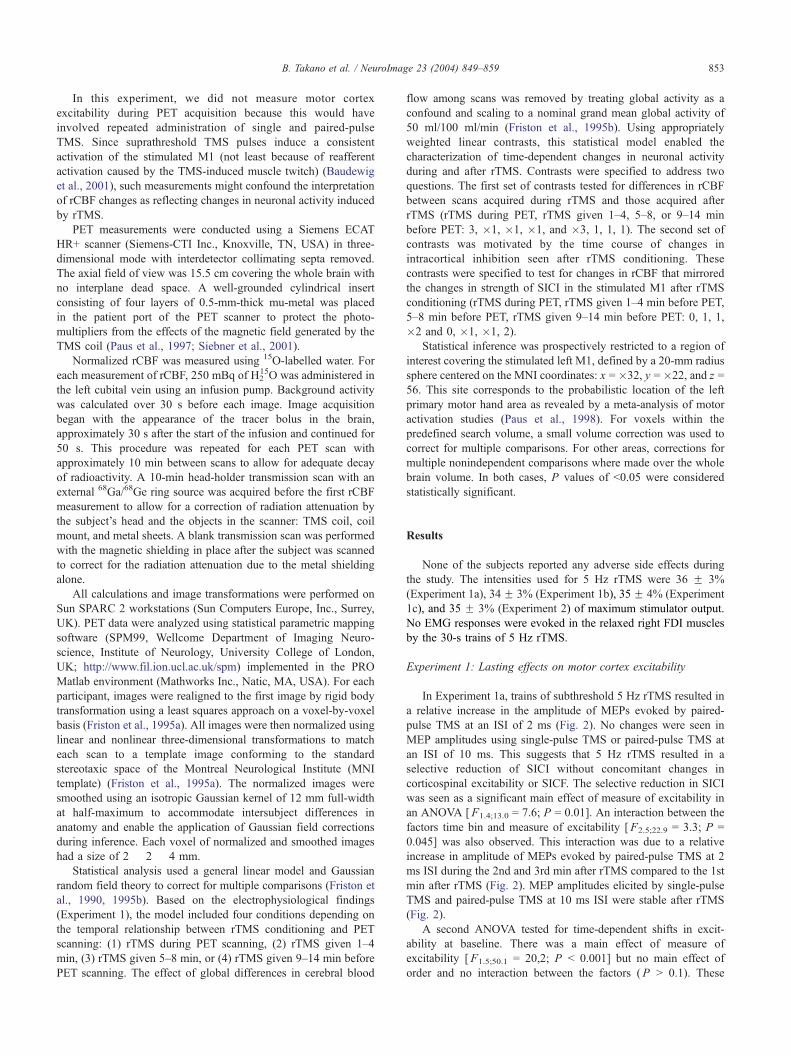
In Experiment 1a, trains of subthreshold 5 Hz rTMS resulted in
a relative increase in the amplitude of MEPs evoked by paired-
pulse TMS at an ISI of 2 ms (Fig. 2). No changes were seen in
MEP amplitudes using single-pulse TMS or paired-pulse TMS at
an ISI of 10 ms. This suggests that 5 Hz rTMS resulted in a
selective reduction of SICI without concomitant changes in
corticospinal excitability or SICF. The selective reduction in SICI
was seen as a significant main effect of measure of excitability in
an ANOVA [F1.4;13.0 = 7.6; P = 0.01]. An interaction between the
factors time bin and measure of excitability [F2.5;22.9 = 3.3; P =
0.045] was also observed. This interaction was due to a relative
increase in amplitude of MEPs evoked by paired-pulse TMS at 2
ms ISI during the 2nd and 3rd min after rTMS compared to the 1st
min after rTMS (Fig. 2). MEP amplitudes elicited by single-pulse
TMS and paired-pulse TMS at 10 ms ISI were stable after rTMS
(Fig. 2).
A second ANOVA tested for time-dependent shifts in excit-
ability at baseline. There was a main effect of measure of
excitability [F1.5;50.1 = 20,2; P b 0.001] but no main effect of
order and no interaction between the factors (P N 0.1). These
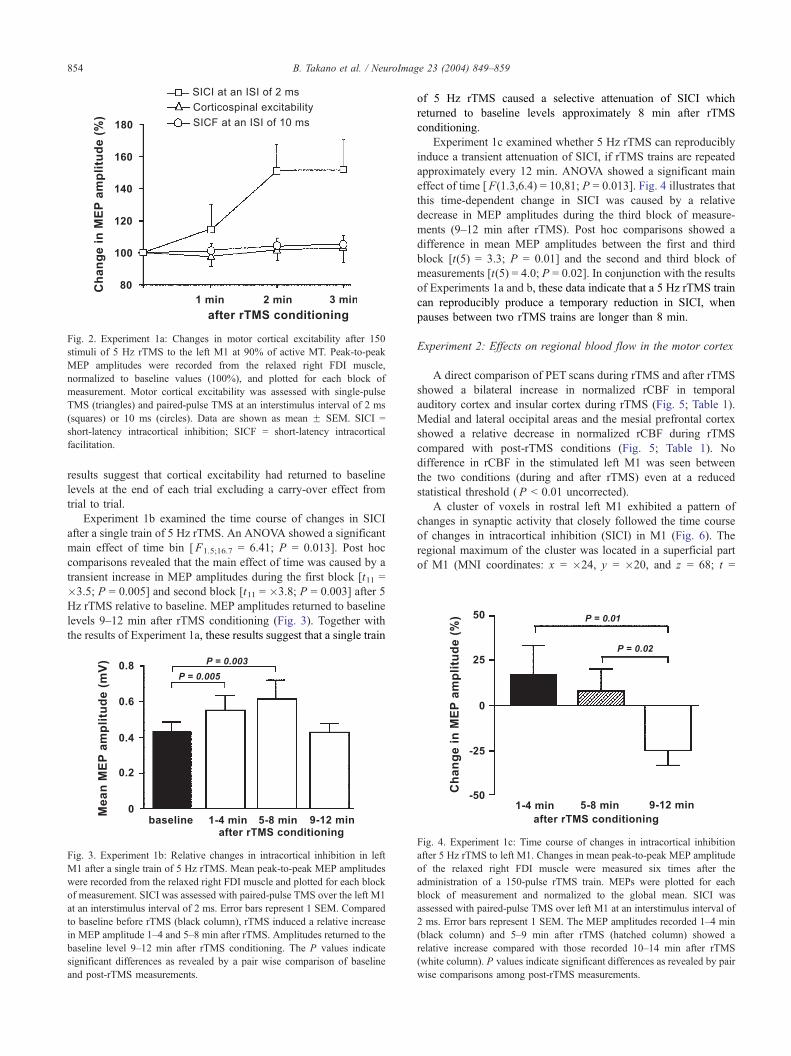
Fig. 2. Experiment 1a: Changes in motor cortical excitability after 150
stimuli of 5 Hz rTMS to the left M1 at 90% of active MT. Peak-to-peak
MEP amplitudes were recorded from the relaxed right FDI muscle,
normalized to baseline values (100%), and plotted for each block of
measurement. Motor cortical excitability was assessed with single-pulse
TMS (triangles) and paired-pulse TMS at an interstimulus interval of 2 ms
(squares) or 10 ms (circles). Data are shown as mean F SEM. SICI =
short-latency intracortical inhibition; SICF = short-latency intracortical
facilitation.
B. Takano et al. / NeuroImage 23 (2004) 849–859854
results suggest that cortical excitability had returned to baseline
levels at the end of each trial excluding a carry-over effect from
trial to trial.
Experiment 1b examined the time course of changes in SICI
after a single train of 5 Hz rTMS. An ANOVA showed a significant
main effect of time bin [F1.5;16.7 = 6.41; P = 0.013]. Post hoc
comparisons revealed that the main effect of time was caused by a
transient increase in MEP amplitudes during the first block [t11 =
�3.5; P = 0.005] and second block [t11 = �3.8; P = 0.003] after 5
Hz rTMS relative to baseline. MEP amplitudes returned to baseline
levels 9–12 min after rTMS conditioning (Fig. 3). Together with
the results of Experiment 1a, these results suggest that a single train
Fig. 3. Experiment 1b: Relative changes in intracortical inhibition in left
M1 after a single train of 5 Hz rTMS. Mean peak-to-peak MEP amplitudes
were recorded from the relaxed right FDI muscle and plotted for each block
of measurement. SICI was assessed with paired-pulse TMS over the left M1
at an interstimulus interval of 2 ms. Error bars represent 1 SEM. Compared
to baseline before rTMS (black column), rTMS induced a relative increase
in MEP amplitude 1–4 and 5–8 min after rTMS. Amplitudes returned to the
baseline level 9–12 min after rTMS conditioning. The P values indicate
significant differences as revealed by a pair wise comparison of baseline
and post-rTMS measurements.
of 5 Hz rTMS caused a selective attenuation of SICI which
returned to baseline levels approximately 8 min after rTMS
conditioning.
Experiment 1c examined whether 5 Hz rTMS can reproducibly
induce a transient attenuation of SICI, if rTMS trains are repeated
approximately every 12 min. ANOVA showed a significant main
effect of time [F(1.3,6.4) = 10,81; P = 0.013]. Fig. 4 illustrates that
this time-dependent change in SICI was caused by a relative
decrease in MEP amplitudes during the third block of measure-
ments (9–12 min after rTMS). Post hoc comparisons showed a
difference in mean MEP amplitudes between the first and third
block [t(5) = 3.3; P = 0.01] and the second and third block of
measurements [t(5) = 4.0; P = 0.02]. In conjunction with the results
of Experiments 1a and b, these data indicate that a 5 Hz rTMS train
can reproducibly produce a temporary reduction in SICI, when
pauses between two rTMS trains are longer than 8 min.
Experiment 2: Effects on regional blood flow in the motor cortex
A direct comparison of PET scans during rTMS and after rTMS
showed a bilateral increase in normalized rCBF in temporal
auditory cortex and insular cortex during rTMS (Fig. 5; Table 1).
Medial and lateral occipital areas and the mesial prefrontal cortex
showed a relative decrease in normalized rCBF during rTMS
compared with post-rTMS conditions (Fig. 5; Table 1). No
difference in rCBF in the stimulated left M1 was seen between
the two conditions (during and after rTMS) even at a reduced
statistical threshold (P b 0.01 uncorrected).
A cluster of voxels in rostral left M1 exhibited a pattern of
changes in synaptic activity that closely followed the time course
of changes in intracortical inhibition (SICI) in M1 (Fig. 6). The
regional maximum of the cluster was located in a superficial part
of M1 (MNI coordinates: x = �24, y = �20, and z = 68; t =
Fig. 4. Experiment 1c: Time course of changes in intracortical inhibition
after 5 Hz rTMS to left M1. Changes in mean peak-to-peak MEP amplitude
of the relaxed right FDI muscle were measured six times after the
administration of a 150-pulse rTMS train. MEPs were plotted for each
block of measurement and normalized to the global mean. SICI was
assessed with paired-pulse TMS over left M1 at an interstimulus interval of
2 ms. Error bars represent 1 SEM. The MEP amplitudes recorded 1–4 min
(black column) and 5–9 min after rTMS (hatched column) showed a
relative increase compared with those recorded 10–14 min after rTMS
(white column). P values indicate significant differences as revealed by pair
wise comparisons among post-rTMS measurements.
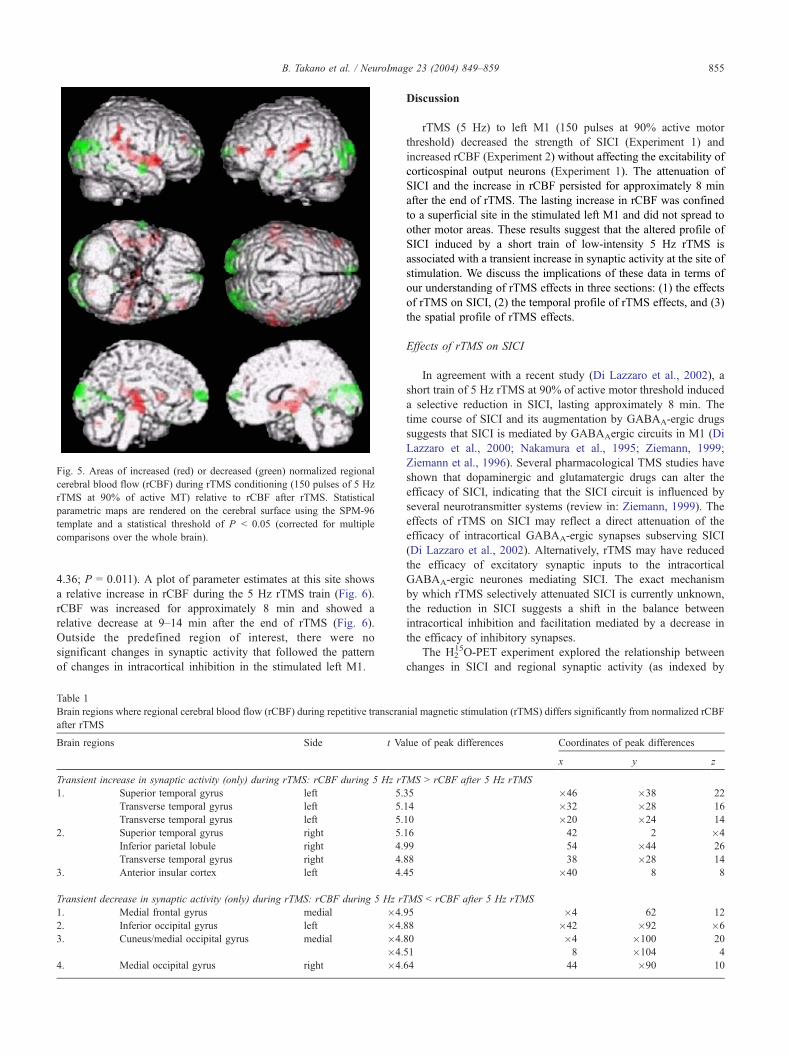
Fig. 5. Areas of increased (red) or decreased (green) normalized regional
cerebral blood flow (rCBF) during rTMS conditioning (150 pulses of 5 Hz
rTMS at 90% of active MT) relative to rCBF after rTMS. Statistical
parametric maps are rendered on the cerebral surface using the SPM-96
template and a statistical threshold of P b 0.05 (corrected for multiple
comparisons over the whole brain).
B. Takano et al. / NeuroImage 23 (2004) 849–859 855
4.36; P = 0.011). A plot of parameter estimates at this site shows
a relative increase in rCBF during the 5 Hz rTMS train (Fig. 6).
rCBF was increased for approximately 8 min and showed a
relative decrease at 9–14 min after the end of rTMS (Fig. 6).
Outside the predefined region of interest, there were no
significant changes in synaptic activity that followed the pattern
of changes in intracortical inhibition in the stimulated left M1.
Table 1
Brain regions where regional cerebral blood flow (rCBF) during repetitive transcran
after rTMS
Brain regions Side t Va
Transient increase in synaptic activity (only) during rTMS: rCBF during 5 Hz rT
1. Superior temporal gyrus left 5.
Transverse temporal gyrus left 5.
Transverse temporal gyrus left 5.
2. Superior temporal gyrus right 5.
Inferior parietal lobule right 4.
Transverse temporal gyrus right 4.
3. Anterior insular cortex left 4.
Transient decrease in synaptic activity (only) during rTMS: rCBF during 5 Hz rT
1. Medial frontal gyrus medial �4.
2. Inferior occipital gyrus left �4.
3. Cuneus/medial occipital gyrus medial �4.
�4.
4. Medial occipital gyrus right �4.
Discussion
rTMS (5 Hz) to left M1 (150 pulses at 90% active motor
threshold) decreased the strength of SICI (Experiment 1) and
increased rCBF (Experiment 2) without affecting the excitability of
corticospinal output neurons (Experiment 1). The attenuation of
SICI and the increase in rCBF persisted for approximately 8 min
after the end of rTMS. The lasting increase in rCBF was confined
to a superficial site in the stimulated left M1 and did not spread to
other motor areas. These results suggest that the altered profile of
SICI induced by a short train of low-intensity 5 Hz rTMS is
associated with a transient increase in synaptic activity at the site of
stimulation. We discuss the implications of these data in terms of
our understanding of rTMS effects in three sections: (1) the effects
of rTMS on SICI, (2) the temporal profile of rTMS effects, and (3)
the spatial profile of rTMS effects.
Effects of rTMS on SICI
In agreement with a recent study (Di Lazzaro et al., 2002), a
short train of 5 Hz rTMS at 90% of active motor threshold induced
a selective reduction in SICI, lasting approximately 8 min. The
time course of SICI and its augmentation by GABAA-ergic drugs
suggests that SICI is mediated by GABAAergic circuits in M1 (Di
Lazzaro et al., 2000; Nakamura et al., 1995; Ziemann, 1999;
Ziemann et al., 1996). Several pharmacological TMS studies have
shown that dopaminergic and glutamatergic drugs can alter the
efficacy of SICI, indicating that the SICI circuit is influenced by
several neurotransmitter systems (review in: Ziemann, 1999). The
effects of rTMS on SICI may reflect a direct attenuation of the
efficacy of intracortical GABAA-ergic synapses subserving SICI
(Di Lazzaro et al., 2002). Alternatively, rTMS may have reduced
the efficacy of excitatory synaptic inputs to the intracortical
GABAA-ergic neurones mediating SICI. The exact mechanism
by which rTMS selectively attenuated SICI is currently unknown,
the reduction in SICI suggests a shift in the balance between
intracortical inhibition and facilitation mediated by a decrease in
the efficacy of inhibitory synapses.
The H215O-PET experiment explored the relationship between
changes in SICI and regional synaptic activity (as indexed by
ial magnetic stimulation (rTMS) differs significantly from normalized rCBF
lue of peak differences Coordinates of peak differences
x y z
MS N rCBF after 5 Hz rTMS
35 �46 �38 22
14 �32 �28 16
10 �20 �24 14
16 42 2 �4
99 54 �44 26
88 38 �28 14
45 �40 8 8
MS b rCBF after 5 Hz rTMS
95 �4 62 12
88 �42 �92 �6
80 �4 �100 20
51 8 �104 4
64 44 �90 10
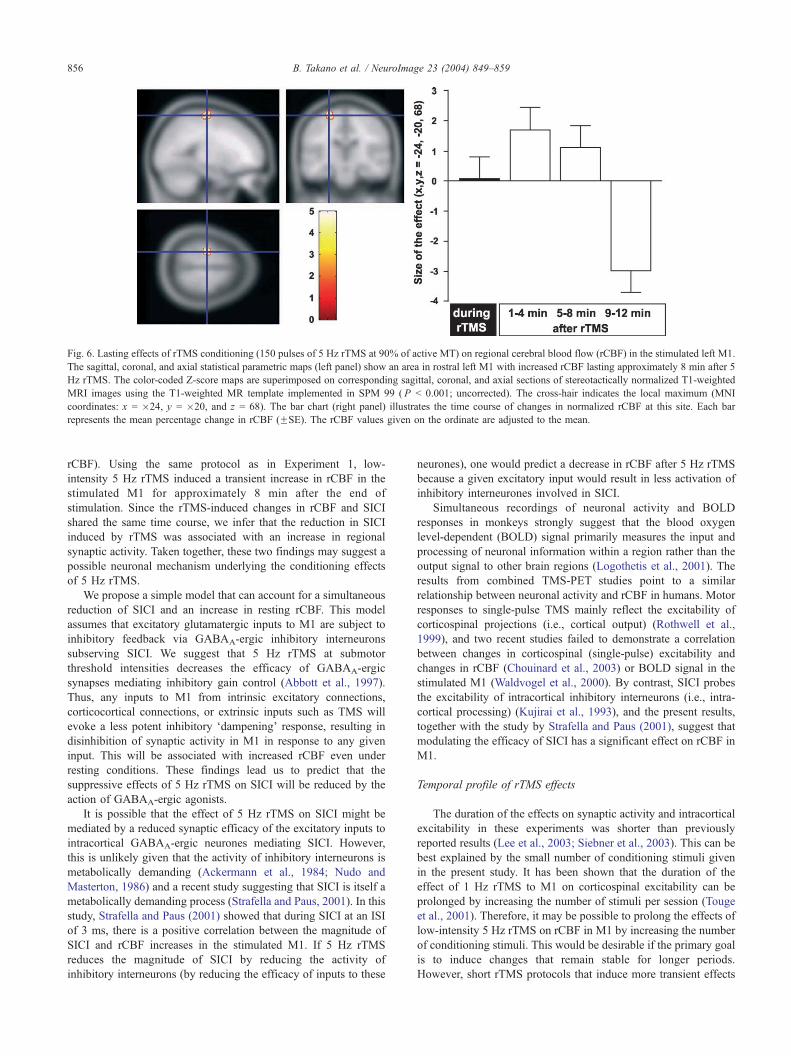
Fig. 6. Lasting effects of rTMS conditioning (150 pulses of 5 Hz rTMS at 90% of active MT) on regional cerebral blood flow (rCBF) in the stimulated left M1.
The sagittal, coronal, and axial statistical parametric maps (left panel) show an area in rostral left M1 with increased rCBF lasting approximately 8 min after 5
Hz rTMS. The color-coded Z-score maps are superimposed on corresponding sagittal, coronal, and axial sections of stereotactically normalized T1-weighted
MRI images using the T1-weighted MR template implemented in SPM 99 ( P b 0.001; uncorrected). The cross-hair indicates the local maximum (MNI
coordinates: x = �24, y = �20, and z = 68). The bar chart (right panel) illustrates the time course of changes in normalized rCBF at this site. Each bar
represents the mean percentage change in rCBF (FSE). The rCBF values given on the ordinate are adjusted to the mean.
B. Takano et al. / NeuroImage 23 (2004) 849–859856
rCBF). Using the same protocol as in Experiment 1, low-
intensity 5 Hz rTMS induced a transient increase in rCBF in the
stimulated M1 for approximately 8 min after the end of
stimulation. Since the rTMS-induced changes in rCBF and SICI
shared the same time course, we infer that the reduction in SICI
induced by rTMS was associated with an increase in regional
synaptic activity. Taken together, these two findings may suggest a
possible neuronal mechanism underlying the conditioning effects
of 5 Hz rTMS.
We propose a simple model that can account for a simultaneous
reduction of SICI and an increase in resting rCBF. This model
assumes that excitatory glutamatergic inputs to M1 are subject to
inhibitory feedback via GABAA-ergic inhibitory interneurons
subserving SICI. We suggest that 5 Hz rTMS at submotor
threshold intensities decreases the efficacy of GABAA-ergic
synapses mediating inhibitory gain control (Abbott et al., 1997).
Thus, any inputs to M1 from intrinsic excitatory connections,
corticocortical connections, or extrinsic inputs such as TMS will
evoke a less potent inhibitory ddampeningT response, resulting in
disinhibition of synaptic activity in M1 in response to any given
input. This will be associated with increased rCBF even under
resting conditions. These findings lead us to predict that the
suppressive effects of 5 Hz rTMS on SICI will be reduced by the
action of GABAA-ergic agonists.
It is possible that the effect of 5 Hz rTMS on SICI might be
mediated by a reduced synaptic efficacy of the excitatory inputs to
intracortical GABAA-ergic neurones mediating SICI. However,
this is unlikely given that the activity of inhibitory interneurons is
metabolically demanding (Ackermann et al., 1984; Nudo and
Masterton, 1986) and a recent study suggesting that SICI is itself a
metabolically demanding process (Strafella and Paus, 2001). In this
study, Strafella and Paus (2001) showed that during SICI at an ISI
of 3 ms, there is a positive correlation between the magnitude of
SICI and rCBF increases in the stimulated M1. If 5 Hz rTMS
reduces the magnitude of SICI by reducing the activity of
inhibitory interneurons (by reducing the efficacy of inputs to these
neurones), one would predict a decrease in rCBF after 5 Hz rTMS
because a given excitatory input would result in less activation of
inhibitory interneurones involved in SICI.
Simultaneous recordings of neuronal activity and BOLD
responses in monkeys strongly suggest that the blood oxygen
level-dependent (BOLD) signal primarily measures the input and
processing of neuronal information within a region rather than the
output signal to other brain regions (Logothetis et al., 2001). The
results from combined TMS-PET studies point to a similar
relationship between neuronal activity and rCBF in humans. Motor
responses to single-pulse TMS mainly reflect the excitability of
corticospinal projections (i.e., cortical output) (Rothwell et al.,
1999), and two recent studies failed to demonstrate a correlation
between changes in corticospinal (single-pulse) excitability and
changes in rCBF (Chouinard et al., 2003) or BOLD signal in the
stimulated M1 (Waldvogel et al., 2000). By contrast, SICI probes
the excitability of intracortical inhibitory interneurons (i.e., intra-
cortical processing) (Kujirai et al., 1993), and the present results,
together with the study by Strafella and Paus (2001), suggest that
modulating the efficacy of SICI has a significant effect on rCBF in
M1.
Temporal profile of rTMS effects
The duration of the effects on synaptic activity and intracortical
excitability in these experiments was shorter than previously
reported results (Lee et al., 2003; Siebner et al., 2003). This can be
best explained by the small number of conditioning stimuli given
in the present study. It has been shown that the duration of the
effect of 1 Hz rTMS to M1 on corticospinal excitability can be
prolonged by increasing the number of stimuli per session (Touge
et al., 2001). Therefore, it may be possible to prolong the effects of
low-intensity 5 Hz rTMS on rCBF in M1 by increasing the number
of conditioning stimuli. This would be desirable if the primary goal
is to induce changes that remain stable for longer periods.
However, short rTMS protocols that induce more transient effects
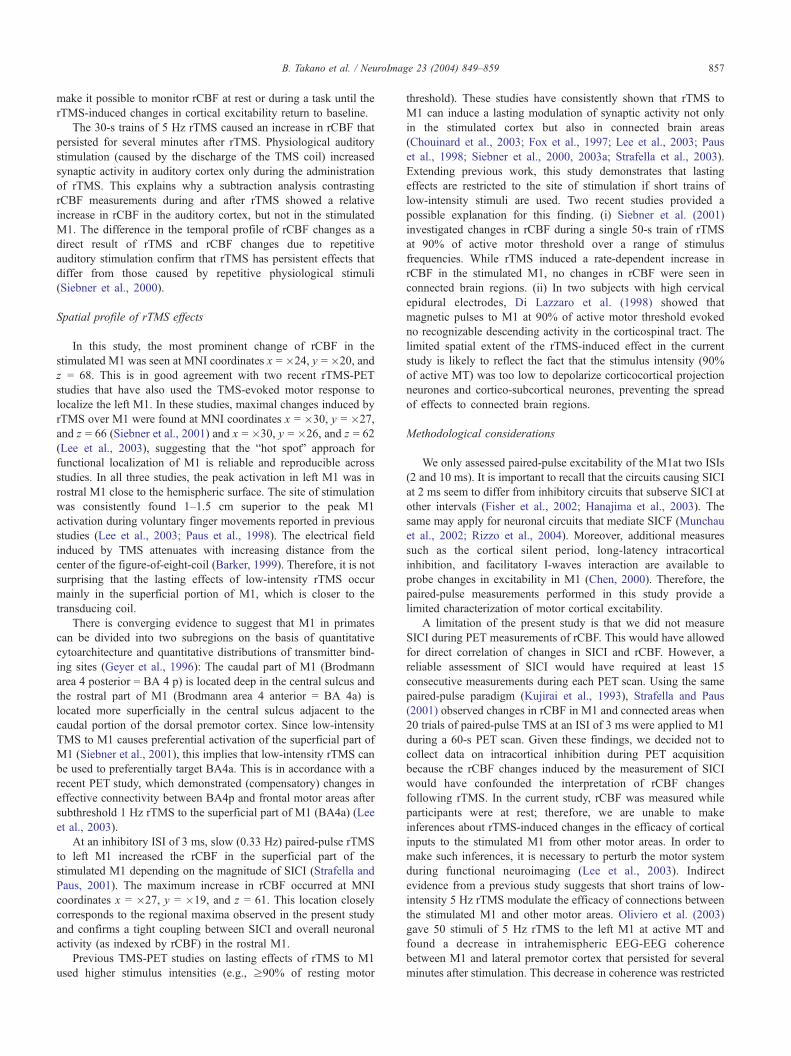
B. Takano et al. / NeuroImage 23 (2004) 849–859 857
make it possible to monitor rCBF at rest or during a task until the
rTMS-induced changes in cortical excitability return to baseline.
The 30-s trains of 5 Hz rTMS caused an increase in rCBF that
persisted for several minutes after rTMS. Physiological auditory
stimulation (caused by the discharge of the TMS coil) increased
synaptic activity in auditory cortex only during the administration
of rTMS. This explains why a subtraction analysis contrasting
rCBF measurements during and after rTMS showed a relative
increase in rCBF in the auditory cortex, but not in the stimulated
M1. The difference in the temporal profile of rCBF changes as a
direct result of rTMS and rCBF changes due to repetitive
auditory stimulation confirm that rTMS has persistent effects that
differ from those caused by repetitive physiological stimuli
(Siebner et al., 2000).
Spatial profile of rTMS effects
In this study, the most prominent change of rCBF in the
stimulated M1 was seen at MNI coordinates x = �24, y = �20, and
z = 68. This is in good agreement with two recent rTMS-PET
studies that have also used the TMS-evoked motor response to
localize the left M1. In these studies, maximal changes induced by
rTMS over M1 were found at MNI coordinates x = �30, y = �27,
and z = 66 (Siebner et al., 2001) and x = �30, y = �26, and z = 62
(Lee et al., 2003), suggesting that the bhot spotQ approach for
functional localization of M1 is reliable and reproducible across
studies. In all three studies, the peak activation in left M1 was in
rostral M1 close to the hemispheric surface. The site of stimulation
was consistently found 1–1.5 cm superior to the peak M1
activation during voluntary finger movements reported in previous
studies (Lee et al., 2003; Paus et al., 1998). The electrical field
induced by TMS attenuates with increasing distance from the
center of the figure-of-eight-coil (Barker, 1999). Therefore, it is not
surprising that the lasting effects of low-intensity rTMS occur
mainly in the superficial portion of M1, which is closer to the
transducing coil.
There is converging evidence to suggest that M1 in primates
can be divided into two subregions on the basis of quantitative
cytoarchitecture and quantitative distributions of transmitter bind-
ing sites (Geyer et al., 1996): The caudal part of M1 (Brodmann
area 4 posterior = BA 4 p) is located deep in the central sulcus and
the rostral part of M1 (Brodmann area 4 anterior = BA 4a) is
located more superficially in the central sulcus adjacent to the
caudal portion of the dorsal premotor cortex. Since low-intensity
TMS to M1 causes preferential activation of the superficial part of
M1 (Siebner et al., 2001), this implies that low-intensity rTMS can
be used to preferentially target BA4a. This is in accordance with a
recent PET study, which demonstrated (compensatory) changes in
effective connectivity between BA4p and frontal motor areas after
subthreshold 1 Hz rTMS to the superficial part of M1 (BA4a) (Lee
et al., 2003).
At an inhibitory ISI of 3 ms, slow (0.33 Hz) paired-pulse rTMS
to left M1 increased the rCBF in the superficial part of the
stimulated M1 depending on the magnitude of SICI (Strafella and
Paus, 2001). The maximum increase in rCBF occurred at MNI
coordinates x = �27, y = �19, and z = 61. This location closely
corresponds to the regional maxima observed in the present study
and confirms a tight coupling between SICI and overall neuronal
activity (as indexed by rCBF) in the rostral M1.
Previous TMS-PET studies on lasting effects of rTMS to M1
used higher stimulus intensities (e.g., z90% of resting motor
threshold). These studies have consistently shown that rTMS to
M1 can induce a lasting modulation of synaptic activity not only
in the stimulated cortex but also in connected brain areas
(Chouinard et al., 2003; Fox et al., 1997; Lee et al., 2003; Paus
et al., 1998; Siebner et al., 2000, 2003a; Strafella et al., 2003).
Extending previous work, this study demonstrates that lasting
effects are restricted to the site of stimulation if short trains of
low-intensity stimuli are used. Two recent studies provided a
possible explanation for this finding. (i) Siebner et al. (2001)
investigated changes in rCBF during a single 50-s train of rTMS
at 90% of active motor threshold over a range of stimulus
frequencies. While rTMS induced a rate-dependent increase in
rCBF in the stimulated M1, no changes in rCBF were seen in
connected brain regions. (ii) In two subjects with high cervical
epidural electrodes, Di Lazzaro et al. (1998) showed that
magnetic pulses to M1 at 90% of active motor threshold evoked
no recognizable descending activity in the corticospinal tract. The
limited spatial extent of the rTMS-induced effect in the current
study is likely to reflect the fact that the stimulus intensity (90%
of active MT) was too low to depolarize corticocortical projection
neurones and cortico-subcortical neurones, preventing the spread
of effects to connected brain regions.
Methodological considerations
We only assessed paired-pulse excitability of the M1at two ISIs
(2 and 10 ms). It is important to recall that the circuits causing SICI
at 2 ms seem to differ from inhibitory circuits that subserve SICI at
other intervals (Fisher et al., 2002; Hanajima et al., 2003). The
same may apply for neuronal circuits that mediate SICF (Munchau
et al., 2002; Rizzo et al., 2004). Moreover, additional measures
such as the cortical silent period, long-latency intracortical
inhibition, and facilitatory I-waves interaction are available to
probe changes in excitability in M1 (Chen, 2000). Therefore, the
paired-pulse measurements performed in this study provide a
limited characterization of motor cortical excitability.
A limitation of the present study is that we did not measure
SICI during PET measurements of rCBF. This would have allowed
for direct correlation of changes in SICI and rCBF. However, a
reliable assessment of SICI would have required at least 15
consecutive measurements during each PET scan. Using the same
paired-pulse paradigm (Kujirai et al., 1993), Strafella and Paus
(2001) observed changes in rCBF in M1 and connected areas when
20 trials of paired-pulse TMS at an ISI of 3 ms were applied to M1
during a 60-s PET scan. Given these findings, we decided not to
collect data on intracortical inhibition during PET acquisition
because the rCBF changes induced by the measurement of SICI
would have confounded the interpretation of rCBF changes
following rTMS. In the current study, rCBF was measured while
participants were at rest; therefore, we are unable to make
inferences about rTMS-induced changes in the efficacy of cortical
inputs to the stimulated M1 from other motor areas. In order to
make such inferences, it is necessary to perturb the motor system
during functional neuroimaging (Lee et al., 2003). Indirect
evidence from a previous study suggests that short trains of low-
intensity 5 Hz rTMS modulate the efficacy of connections between
the stimulated M1 and other motor areas. Oliviero et al. (2003)
gave 50 stimuli of 5 Hz rTMS to the left M1 at active MT and
found a decrease in intrahemispheric EEG-EEG coherence
between M1 and lateral premotor cortex that persisted for several
minutes after stimulation. This decrease in coherence was restricted
B. Takano et al. / NeuroImage 23 (2004) 849–859858
to the upper alpha band and occurred only during voluntary muscle
contraction (Oliviero et al., 2003).
Conclusion
The present data suggest that a short session of low-intensity
rTMS sufficient to induce a persistent change in motor cortical
excitability can cause an increase in synaptic activity (rCBF) that is
confined to the site of stimulation. This may reflect a direct
attenuation of the efficacy of intracortical GABAA-ergic synapses
subserving SICI. In contrast to previous work using prolonged
stimulation at intensities of z90% of resting motor threshold to
induce lasting alterations in synaptic activity in M1 and connected
brain areas (Chouinard et al., 2003; Lee et al., 2003; Siebner et al.,
2000, 2003), short trains of low-intensity stimulation provide a
means of selectively modulating cortical excitability at the site of
stimulation alone. The ability to induce a transient change in
function within a distinct area of a functional network opens up
new possibilities for studying acute reorganization at the systems
level in the human brain.
Acknowledgments
The authors would like to express their gratitude to Ms. S.
Ziegler and Mr. H. Riescher for their technical assistance, to Ms.
C. Kruschke and Ms. G. Dzewas for their assistance during PET
acquisition, and to Prof. J.C. Rothwell and Prof. K.J. Friston for
their helpful comments on the manuscript. H.R. Siebner was
supported by the Deutsche Forschungsgemeinschaft (DFG
Si738/1) and the BMBF (01GO 0206).
References
Abbott, L.F., Varela, J.A., Sen, K., Nelson, S.B., 1997. Synaptic depression
and cortical gain control. Science 275, 220–224.
Ackermann, R.F., Finch, D.M., Babb, T.L., Engel, J., 1984. Increased
glucose metabolism during long-duration recurrent inhibition of hippo-
campal pyramidal cells. J. Neurosci. 4, 251–264.
Barker, A.T., 1999. The history and basic principles of magnetic nerve
stimulation. Electroencephalogr. Clin. Neurophysiol., Suppl. 51, 3–21.
Baudewig, J., Siebner, H.R., Bestmann, S., Tergau, F., Tings, T., Paulus,
W., Frahm, J., 2001. Functional MRI of cortical activations induced by
transcranial magnetic stimulation (TMS). NeuroReport 12, 3543–3548.
Berardelli, A., Inghilleri, M., Rothwell, J.C., Romeo, S., Curra, A., Gilio,
F., Modugno, N., Manfredi, M., 1998. Facilitation of muscle evoked
responses after repetitive cortical stimulation in man. Exp. Brain Res.
122, 79–84.
Brasil-Neto, J.P., Cohen, L.G., Panizza, M., Nilsson, J., Roth, B.J., Hallett,
M., 1992. Optimal focal transcranial magnetic activation of the human
motor cortex: effects of coil orientation, shape of the induced current
pulse, and stimulus intensity. J. Clin. Neurophysiol. 9, 132–136.
Chen, R., 2000. Studies of human motor physiology with transcranial
magnetic stimulation. Muscle Nerve 999, S26–S32.
Chen, R., Classen, J., Gerloff, C., Celnik, P., Wassermann, E.M., Hallett,
M., Cohen, L.G., 1997. Depression of motor cortex excitability by
low-frequency transcranial magnetic stimulation. Neurology 48,
1398–1403.
Chouinard, P.A., Van Der Werf, Y.D., Leonard, G., Paus, T., 2003.
Modulating neural networks with transcranial magnetic stimulation
applied over the dorsal premotor and primary motor cortices. J.
Neurophysiol. 90, 1071–1083.
Di Lazzaro, V., Restuccia, D., Oliviero, A., Profice, P., Ferrara, L., Insola,
A., Mazzone, P., Tonali, P., Rothwell, J.C., 1998. Magnetic transcranial
stimulation at intensities below active motor threshold activates
intracortical inhibitory circuits. Exp. Brain Res. 119, 265–268.
Di Lazzaro, V., Oliviero, A., Meglio, M., Cioni, B., Tamburrini, G., Tonali,
P., Rothwell, J.C., 2000. Direct demonstration of the effect of lorazepam
on the excitability of the human motor cortex. Clin. Neurophysiol. 111,
794–799.
Di Lazzaro, V., Oliviero, A., Mazzone, P., Pilato, F., Saturno, E., Dileone,
M., Insola, A., Tonali, P.A., Rothwell, J.C., 2002. Short-term reduction
of intracortical inhibition in the human motor cortex induced by
repetitive transcranial magnetic stimulation. Exp. Brain Res. 147,
108–113.
Fisher, R.J., Nakamura, Y., Bestmann, S., Rothwell, J.C., Bostock, H.,
2002. Two phases of intracortical inhibition revealed by transcranial
magnetic threshold tracking. Exp. Brain Res. 143, 240–248.
Fox, P., Ingham, R., George, M.S., Mayberg, H., Ingham, J., Roby, J.,
Martin, C., Jerabek, P., 1997. Imaging human intra-cerebral connectiv-
ity by PET during TMS. NeuroReport 8, 2787–2791.
Friston, K.J., Frith, C.D., Liddle, P.F., Dolan, R.J., Lammertsma, A.A.,
1990. The relationship between global and local changes in PET scans.
J. Cereb. Blood Flow Metab. 10, 458–466.
Friston, K.J., Ashburner, J., Poline, J.-B., Frith, C.D., Frackowiak, R.S.J.,
1995a. Spatial registration and normalisation of images. Hum. Brain
Mapp. 2, 165–189.
Friston, K.J., Holmes, A., Worsley, K.J., Poline, J.B., Frith, C.D.,
Frackowiak, R.S.J., 1995b. Statistical parametric maps in functional
imaging: general linear approach. Hum. Brain Mapp. 2, 189–210.
Gangitano, M., Valero-Cabre, A., Tormos, J.M., Mottaghy, F.M., Romero,
J.R., Pascual-Leone, A., 2002. Modulation of input–output curves by
low and high frequency repetitive transcranial magnetic stimulation of
the motor cortex. Clin. Neurophysiol. 113, 1249–1257.
Geyer, S., Ledberg, A., Schleicher, A., Kinomura, S., Schormann, T.,
Burgel, U., Klingberg, T., Larsson, J., Zilles, K., Roland, P.E., 1996.
Two different areas within the primary motor cortex of man. Nature
382, 805–807.
Hanajima, R., Furubayashi, T., Iwata, N.K., Shiio, Y., Okabe, S.,
Kanazawa, I., Ugawa, Y., 2003. Further evidence to support different
mechanisms underlying intracortical inhibition of the motor cortex.
Exp. Brain Res. 151, 427–434.
Inghillieri, M., Conte, A., Frasca, V., Curra, A., Gilio, F., Manfredi, M.,
Berardelli, A., 2004. Antiepileptic drugs and cortical excitability: a study
with repetitive transcranial stimulation. Exp. Brain Res. 154, 488–493.
Kujirai, T., Caramia, M.D., Rothwell, J.C., Day, B.L., Thompson, P.D.,
Ferbert, A., Wroe, S., Asselman, P., Marsden, C.D., 1993. Cortico-
cortical inhibition in human motor cortex. J. Physiol. (London) 471,
501–519.
Lee, L., Siebner, H.R., Rowe, J.B., Rizzo, V., Rothwell, J.C., Frackowiak,
R.S., Friston, K.J., 2003. Acute remapping within the motor system
induced by low-frequency repetitive transcranial magnetic stimulation.
J. Neurosci. 23, 5308–5318.
Logothetis, N., Pauls, J., Augath, M., Trinath, T., Oeltermann, A., 2001.
Neurophysiological investigation of the basis of the fMRI signal.
Nature 412, 150–157.
Maeda, F., Keenan, J.P., Tormos, J.M., Topka, H., Pascual-Leone, A., 2000.
Interindividual variability of the modulatory effects of repetitive
transcranial magnetic stimulation on cortical excitability. Exp. Brain
Res. 133, 425–430.
Muellbacher, W., Ziemann, U., Boroojerdi, B., Hallett, M., 2000. Effects of
low-frequency transcranial magnetic stimulation on motor excitability
and basic motor behavior. Clin. Neurophysiol. 111, 1002–1007.
Munchau, A., Bloem, B.R., Irlbacher, K., Trimble, M.R., Rothwell, J.C.,
2002. Functional connectivity of human premotor and motor cortex
explored with repetitive transcranial magnetic stimulation. J. Neurosci.
22, 554–561.
Nakamura, H., Kitagawa, H., Kawaguchi, Y., Tsuji, H., Takano, H.,
Nakatoh, S., 1995. Intracortical facilitation and inhibition after paired
B. Takano et al. / NeuroImage 23 (2004) 849–859 859
magnetic stimulation in humans under anesthesia. Neurosci. Lett. 199,
155–157.
Nudo, R.J., Masterton, R.B., 1986. Stimulation-induced [14C]2-deoxyglu-
cose labeling of synaptic activity in the central auditory system. J.
Comp. Neurol. 245, 553–565.
Oldfield, R.C., 1971. The assessment and analysis of handedness: the
Edinburgh inventory. Neuropsychologia 9, 97–113.
Oliviero, A., Strens, L.H., Di Lazzaro, V., Tonali, P.A., Brown, P.,
2003. Persistent effects of high frequency repetitive TMS on the
coupling between motor areas in the human. Exp. Brain Res. 149,
107–113.
Pascual-Leone, A., Valls-Sole, J., Wassermann, E.M., Hallett, M., 1994.
Responses to rapid-rate transcranial magnetic stimulation of the human
motor cortex. Brain 117, 847–858.
Pascual-Leone, A., Tormos, J.M., Keenan, J., Tarazona, F., Canete, C.,
Catala, M.D., 1998. Study and modulation of human cortical
excitability with transcranial magnetic stimulation. J. Clin. Neuro-
physiol. 15, 333–343.
Paus, T., Jech, R., Thompson, C.J., Comeau, R., Peters, T., Evans, A.C.,
1997. Transcranial magnetic stimulation during positron emission
tomography: a new method for studying connectivity of the human
cerebral cortex. J. Neurosci. 17, 3178–3184.
Paus, T., Jech, R., Thompson, C.J., Comeau, R., Peters, T., Evans, A.C.,
1998. Dose-dependent reduction of cerebral blood f during rapid-rate
transcranial magnetic stimulation of the human sensorimotor cortex. J.
Neurophysiol. 79, 1102–1107.
Peinemann, A., Lehner, C., Mentschel, C., Munchau, A., Conrad, B.,
Siebner, H.R., 2000. Subthreshold 5-Hz repetitive transcranial magnetic
stimulation of the human primary motor cortex reduces intracortical
paired-pulse inhibition. Neurosci. Lett. 296, 21–24.
Rizzo, V., Siebner, H.R., Modugno, N., Pesenti, A., Munchau, A.,
Gerschlager, W., Webb, R.M., Rothwell, J.C., 2004. Shaping the
excitability of human motor cortex with premotor rTMS. J. Physiol.
(London) 554, 483–495.
Rothwell, J.C., 1999. Paired-pulse investigations of short-latency intra-
cortical facilitation using TMS in humans. Electroencephalogr. Clin.
Neurophysiol., Suppl. 51, 113–119.
Rothwell, J.C., Hallett, M., Berardelli, A., Eisen, A., Rossini, P., Paulus, W.,
1999. Magnetic stimulation: motor evoked potentials. The International
Federation of Clinical Neurophysiology. Electroencephalogr. Clin.
Neurophysiol., Suppl. 52, 97–103.
Siebner, H.R., Rothwell, J., 2003. Transcranial magnetic stimulation: new
insights into representational cortical plasticity. Exp. Brain Res. 148,
1–16.
Siebner, H.R., Peller, M., Willoch, F., Minoshima, S., Boecker, H., Auer,
C., Drzezga, A., Conrad, B., Bartenstein, P., 2000. Lasting cortical
activation after repetitive TMS of the motor cortex: a glucose metabolic
study. Neurology 54, 956–963.
Siebner, H.R., Takano, B., Peinemann, A., Schwaiger, M., Conrad, B.,
Drzezga, A., 2001. Continuous transcranial magnetic stimulation during
positron emission tomography: a suitable tool for imaging regional
excitability of the human cortex. NeuroImage 14, 883–890.
Siebner, H.R., Filipovic, S.R., Rowe, J.B., Cordivari, C., Gerschlager, W.,
Rothwell, J.C., Frackowiak, R.S., Bhatia, K.P., 2003. Patients with focal
arm dystonia have increased sensitivity to slow-frequency repetitive
TMS of the dorsal premotor cortex. Brain 126, 2710–2725.
Strafella, A.P., Paus, T., 2001. Cerebral blood-flow changes induced by
paired-pulse transcranial magnetic stimulation of the primary motor
cortex. J. Neurophysiol. 85, 2624–2629.
Strafella, A.P., Paus, T., Fraraccio, M., Dagher, A., 2003. Striatal dopamine
release induced by repetitive transcranial magnetic stimulation of the
human motor cortex. Brain 126, 2609–2615.
Touge, T., Gerschlager, W., Brown, P., Rothwell, J.C., 2001. Are the after-
effects of low-frequency rTMS on motor cortex excitability due to
changes in the efficacy of cortical synapses? Clin. Neurophysiol. 112,
2138–2145.
Waldvogel, D., van Gelderen, P., Muellbacher, W., Ziemann, U., Immisch,
I., Hallett, M., 2000. The relative metabolic demand of inhibition and
excitation. Nature 406, 995–998.
Wu, T., Sommer, M., Tergau, F., Paulus, W., 2000. Lasting influence of
repetitive transcranial magnetic stimulation on intracortical excitability
in human subjects. Neurosci. Lett. 287, 37–40.
Ziemann, U., 1999. Intracortical inhibition and facilitation in the conven-
tional paired TMS paradigm. Electroencephalogr. Clin. Neurophysiol.,
Suppl. 51, 127–136.
Ziemann, U., Lonnecker, S., Steinhoff, B.J., Paulus, W., 1996. The effect of
lorazepam on the motor cortical excitability in man. Exp. Brain Res.
109, 127–135.


