Embed Size (px)
Citation preview
REVIEW
Significance of Protein Binding in Pharmacokineticsand Pharmacodynamics
STEPHAN SCHMIDT,1,2 DANIEL GONZALEZ,1 HARTMUT DERENDORF1
1Department of Pharmaceutics, College of Pharmacy, University of Florida, Gainesville, Florida
2Leiden-Amsterdam Center for Drug Research, Division of Pharmacology, University of Leiden, Leiden, the Netherlands
Received 6 May 2009; revised 21 July 2009; accepted 22 July 2009
Published online in Wiley InterScience (www.interscience.wiley.com). DOI 10.1002/jps.21916
ABSTRACT: The significance of plasma protein binding on drug efficacy and, subse-quently, the clinical relevance of changes in protein binding has been controversiallydiscussed for decades. The uncertainty concerning the impact of plasma protein bindingon a drug’s pharmacological activity is, in part, related to the approach used wheninvestigating and interpreting protein binding effects in vitro and in vivo. Frequently, ageneralized one-size-fits-all approach, such as ‘‘protein binding does matter/does notmatter,’’ may not be applicable. An appropriate analysis requires careful considerationof both pharmacokinetic and pharmacodynamic processes, as they both contribute to thesafety and efficacy of drugs. Therefore, the aim of this article is to provide a concisereview of the theoretical concepts of protein binding, and to discuss relevantexamples where applicable. � 2009 Wiley-Liss, Inc. and the American Pharmacists Association
J Pharm Sci
Keywords: protein binding; pharmacokinetics; pharmacodynamics; clearance; drugeffects
INTRODUCTION
The effect of protein binding on the pharmacolo-gical activity of drugs seems to be a source of sheernever-ending debate.1–5 It is well known that thepharmacological effect of a drug is dependent onboth its pharmacokinetic and pharmacodynamicproperties, and thus the effects of protein bindingon both of these disciplines requires carefulconsideration. Several authors have highlightedscenarios where an alteration in a protein bindingmay result in clinically significant changes in the
pharmacokinetics (PK) of a drug.2,6–11 In compar-ison, fewer articles are available, which outlinethe effects of protein binding on drug action. It isoften much more difficult to make generallyapplicable statements about the effects of proteinbinding on the pharmacodynamics (PD) of a drug,since a plethora of factors need to be considered.These factors include the drug’s mechanism ofaction, the drug’s affinity for the drug target (andprotein), the number of drug binding sites on thetarget (and protein), location of the effect site,as well as the protein concentration directly atthe effect site.3 As a consequence, a case-by-caseevaluation is needed to appropriately address theprotein binding effects on the PK and PD of a drug.
Moreover, disagreements on its significanceare, in part, a result of how protein bindingeffects are investigated and interpreted. For
Correspondence to: Hartmut Derendorf(Telephone: þ1-352-273-7856; Fax: þ1-352-392-3249;E-mail: [email protected])
Journal of Pharmaceutical Sciences
� 2009 Wiley-Liss, Inc. and the American Pharmacists Association
JOURNAL OF PHARMACEUTICAL SCIENCES 1
example, often free, unbound concentrations areestimated rather than measured,12–14 the timecomponent of drug action is ignored,5 and/or theresults from in vitro systems are extrapolated toin vivo situations without paying close attentionto system-specific properties. Thus, a lack ofcaution in the conduct and interpretation ofexperiments can be misleading and result inconflicting statements about the impact of proteinbinding on the pharmacological activity of drugs.Therefore, the aim of this article is to provide aconcise review on the significance of proteinbinding on the PK and PD of drugs in vitro, aswell as, in vivo.
GENERAL CONCEPTS
The majority of drugs bind reversibly to plasmaproteins (e.g., serum albumin, alpha-1 acidglycoprotein (AAG), lipoproteins) or other biolo-gical materials, such as erythrocytes (Tab. 1).15–17
In addition, there are also plasma proteins whichhave a high affinity towards certain hormones(e.g., transcortin, thyroxine-binding globulin). Ofthese proteins, human serum albumin (HSA) andAAG are frequently the main binding partners fordrugs in plasma.18,19 While HSA is primarilyresponsible for the binding of acidic drugs, basicdrugs display greater affinity for AAG.20,21
Neutral drugs can be bound to both HSA andAAG.19,22,23 However, these are general state-ments and are not a steadfast rule, since somedrugs can bind to both HSA and AAG.24 Further-more, if a drug is available as a racemic mixture inblood/plasma, both HSA and AAG are able to bindpreferentially to one stereoisomer and formdiastereoisomeric drug–protein complexes.25 Inmost cases, HSA is thought to display greaterstereoselectivity than AAG for these isomericpairs.25
Several distinctions can be made between theplasma proteins listed in Table 1. First, albuminconcentrations in plasma are 3.5–5 g/dL, whichare significantly greater than those of AAG (0.04–
0.1 g/dL). Since AAG concentrations are muchlower, consequently there are fewer binding sitesfor a drug which binds to this individual plasmaprotein.26 Second, the concentrations of theseproteins can fluctuate significantly as a result ofvarious disease states. Hypoalbuminemia is acommon manifestation caused by a several dis-ease states (e.g., renal failure, burns, surgery,malnutrition).27–30 Hyperalbuminemia is far lesscommon. In contrast to albumin, an increase inAAG concentrations is far more common, and maybe triggered by conditions such as inflammatorydiseases, trauma, and an acute myocardialinfarction.23,24,31 Changes in drug binding causedby these disease states can have variable effectson both free and total concentrations and willbe discussed throughout the course of this reviewarticle.
The association and dissociation of these drug–protein complexes can be described using the lawof mass action. The association (k1) and dissocia-tion (k�1) of the drug–protein complex is usuallyrapid (within microseconds) and equilibriumbetween the free, unbound drug ([D]), the protein([P]) and the drug–protein complex ([DP]) isquickly established.32,33,32,33
½D� þ ½P� k1
k�1
½DP�
At equilibrium, the affinity of the drug moleculefor its binding site on the protein can be expressedas the association constant Ka(protein). In prac-tice, its inverse, the dissociation constant Kd(pro-tein), is more commonly employed (Eq. 1).
KaðproteinÞ ¼ k1k�1
¼ ½DP�½D� � ½P� ¼
1
KdðproteinÞ (1)
The degree to which a drug binds to plasmaproteins can then be expressed as the ratio of free(Cfree) or bound (Cbound) and total (Ctotal) drugconcentrations. This ratio is usually presented aseither the percentage of drug bound to plasmaprotein (%PPB, Eq. 2) or the fraction unbound in
Table 1. Characteristics of Common Drug-Binding Proteins (Information Taken from Refs. 23,24,26)
Albumin a1-Acid Glycoprotein Lipoproteins
Molecular weight (g/mol) 67,000 42,000 200,000–2,400,000Normal concentrations (g/dL) 3.5–5 0.04–0.1 VariableHalf-life (days) 19 5 Up to 6
JOURNAL OF PHARMACEUTICAL SCIENCES DOI 10.1002/jps
2 SCHMIDT, GONZALEZ, AND DERENDORF
plasma ( fuP, Eq. 3).
%PPB ¼ Cbound
Ctotal� 100 ¼ Ctotal � Cfree
Ctotal� 100 (2)
fuP ¼ Cfree
Ctotal(3)
Assuming that a drug binds to a single bindingsite, Eqs. (4) and (5) may be used to calculate Cfree
and Cbound.7
Cfree ¼ Cbound � KdðproteinÞBmax � Cbound
¼ Cbound � KdðproteinÞn� ½P� � Cbound
(4)
Cbound ¼ Bmax � Cfree
KdðproteinÞ þ Cfree
¼ n� ½P� � Cfree
KdðproteinÞ þ Cfree(5)
In these equations, Bmax represents the max-imum binding capacity of the protein for the drug.It should be noted that Bmax is a hybrid constantand reflects the product of the number of bindingsites per mole of protein (n) times the molarconcentration of protein ([P]).34 Considering thatplasma proteins can have multiple binding sitesfor a drug and/or that multiple plasma proteinscan be involved in the binding process, the affinityand the capacity of each binding site have tobe taken into account when computing Cfree andCbound.
Most drugs display concentration-independent(linear) binding to plasma proteins. This holdstrue as long as the molar unbound (drug)concentration is much lower than Kd(protein).
23
In this case, both %PPB and fuP are concentrationindependent and constant. Yet, the higher thetherapeutic doses given and the greater theaffinity for the protein, the more likely a drugwill display concentration-dependent (nonlinear)protein binding.23 It is more common to havesaturable protein binding when the bindingprotein is AAG.35,36 As discussed earlier, sincethe concentrations of AAG in serum are muchlower than those of albumin, the threshold for adrug to display saturable binding is much lower.In order to keep this review reasonably simple,only linear binding (applies for most clinicallyused drugs) is being discussed and examples ofnonlinear binding scenarios can be found else-where.37–40
Once at the site of action, a drug has to bind toits target (e.g., receptor, ion channel, etc.) in orderto exert a pharmacological effect. Association (k2)and dissociation (k�2) of the drug–target complex([DT]) and the respective affinity of drug for thedrug–target can be expressed according to Eq (6).
½D� þ ½T� k2
k�2
½DT�
KaðtargetÞ ¼ k2k�2
¼ ½DT�½D� � ½T� ¼
1
KdðtargetÞ (6)
where Ka(target) is the association constant of thedrug–target complex, and [T] is the unoccupieddrug target. Besides binding to their target,frequently drugs may also display affinity forproteins at the site of action. In this case, both thedrug target and the protein compete for free,unbound drug. As a consequence, the pharmaco-dynamic effect of a drug is reduced as proteinbinding is increased. However, this will only holdtrue if the drug does not get stripped off itsprotein binding site due to an extreme differencein binding affinities to a large number of targetbinding sites (k2� [T]� k1� [P]).41 It is furtherassumed that no drug has been used up (turn-over) during the binding process.
IMPACT OF PROTEIN BINDING ONIN VITRO PHARMACOKINETICS ANDPHARMACODYNAMICS
When evaluating the effect of protein bindingusing in vitro experiments several practicalconsiderations should be mentioned. First, oneshould always try to measure drug and/or targetconcentrations and their respective binding capa-cities rather than employing literature values,since these values may vary significantly betweendifferent experimental conditions. For example,some investigators use protein supplements, suchas HSA or animal serum albumin to produce ormodify protein binding in their experiments, butthen apply literature serum/plasma protein bind-ing values in the analysis.13,14,42,43 This approachmay be extremely misleading, since the bindingproperties of the protein supplements employed inthese in vitro assays can substantially differ frombinding in serum or plasma.12–14 In addition, itwas shown that the absence of fatty acids canlead to alterations of the drug binding sites onthe protein and, subsequently, to a significantalteration of fuP.
32,44
DOI 10.1002/jps JOURNAL OF PHARMACEUTICAL SCIENCES
SIGNIFICANCE OF PROTEIN BINDING 3
Second, it is also important to consider a drug’sunderlying mechanism of action when choosingthe concentration range for an in vitro experi-ment. For example, the effect of protein bindingon the antimicrobial activity of six differentpenicillins (ampicillin, methicillin, benzyl (G)penicillin, nafcillin, oxacillin, and cloxacillin)against S. aureus was evaluated by determiningminimum inhibitory concentrations (MIC) in bothbroth and in 100% human serum.45,46 The resultsof this study indicate that the MIC in serumincreases as protein binding increases. On theother hand, when MIC values were calculatedbased on free serum concentrations, no substan-tial differences in antimicrobial outcome wereobserved when compared to the MIC in broth. Thefindings of this first study clearly show that it isfree, unbound drug that is responsible for theantimicrobial efficacy.
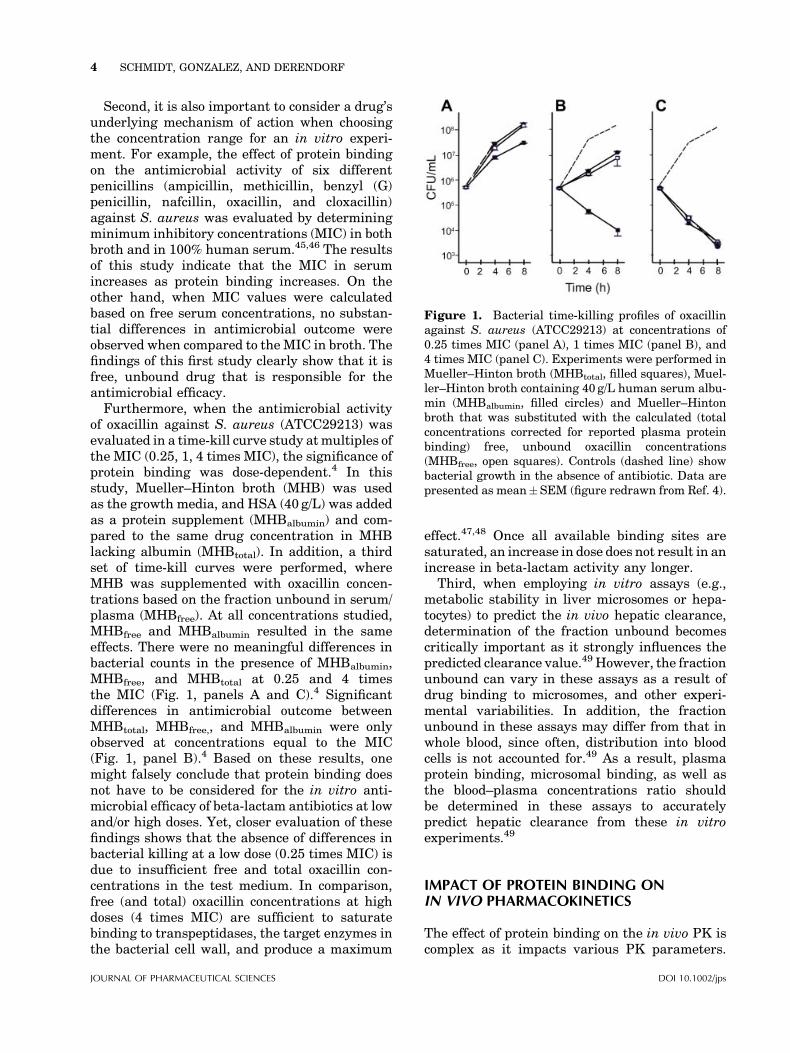
Furthermore, when the antimicrobial activityof oxacillin against S. aureus (ATCC29213) wasevaluated in a time-kill curve study atmultiples ofthe MIC (0.25, 1, 4 times MIC), the significance ofprotein binding was dose-dependent.4 In thisstudy, Mueller–Hinton broth (MHB) was usedas the growth media, and HSA (40 g/L) was addedas a protein supplement (MHBalbumin) and com-pared to the same drug concentration in MHBlacking albumin (MHBtotal). In addition, a thirdset of time-kill curves were performed, whereMHB was supplemented with oxacillin concen-trations based on the fraction unbound in serum/plasma (MHBfree). At all concentrations studied,MHBfree and MHBalbumin resulted in the sameeffects. There were no meaningful differences inbacterial counts in the presence of MHBalbumin,MHBfree, and MHBtotal at 0.25 and 4 timesthe MIC (Fig. 1, panels A and C).4 Significantdifferences in antimicrobial outcome betweenMHBtotal, MHBfree,, and MHBalbumin were onlyobserved at concentrations equal to the MIC(Fig. 1, panel B).4 Based on these results, onemight falsely conclude that protein binding doesnot have to be considered for the in vitro anti-microbial efficacy of beta-lactam antibiotics at lowand/or high doses. Yet, closer evaluation of thesefindings shows that the absence of differences inbacterial killing at a low dose (0.25 times MIC) isdue to insufficient free and total oxacillin con-centrations in the test medium. In comparison,free (and total) oxacillin concentrations at highdoses (4 times MIC) are sufficient to saturatebinding to transpeptidases, the target enzymes inthe bacterial cell wall, and produce a maximum
effect.47,48 Once all available binding sites aresaturated, an increase in dose does not result in anincrease in beta-lactam activity any longer.
Third, when employing in vitro assays (e.g.,metabolic stability in liver microsomes or hepa-tocytes) to predict the in vivo hepatic clearance,determination of the fraction unbound becomescritically important as it strongly influences thepredicted clearance value.49 However, the fractionunbound can vary in these assays as a result ofdrug binding to microsomes, and other experi-mental variabilities. In addition, the fractionunbound in these assays may differ from that inwhole blood, since often, distribution into bloodcells is not accounted for.49 As a result, plasmaprotein binding, microsomal binding, as well asthe blood–plasma concentrations ratio shouldbe determined in these assays to accuratelypredict hepatic clearance from these in vitroexperiments.49
IMPACT OF PROTEIN BINDING ONIN VIVO PHARMACOKINETICS
The effect of protein binding on the in vivo PK iscomplex as it impacts various PK parameters.
Figure 1. Bacterial time-killing profiles of oxacillinagainst S. aureus (ATCC29213) at concentrations of0.25 times MIC (panel A), 1 times MIC (panel B), and4 times MIC (panel C). Experiments were performed inMueller–Hinton broth (MHBtotal, filled squares), Muel-ler–Hinton broth containing 40 g/L human serum albu-min (MHBalbumin, filled circles) and Mueller–Hintonbroth that was substituted with the calculated (totalconcentrations corrected for reported plasma proteinbinding) free, unbound oxacillin concentrations(MHBfree, open squares). Controls (dashed line) showbacterial growth in the absence of antibiotic. Data arepresented as mean�SEM (figure redrawn from Ref. 4).
JOURNAL OF PHARMACEUTICAL SCIENCES DOI 10.1002/jps
4 SCHMIDT, GONZALEZ, AND DERENDORF
Therefore, this section of the review will focus onthe theoretical concepts of protein binding and itseffects on the individual PK parameters (Tab. 2).Respective examples from the literature will beused to help discuss the concepts.
Volume of Distribution
The volume of distribution (Vd) is a proportion-ality factor that relates the total amount of drugpresent in the body to the drug concentrations inthe body fluid from which it was sampled (e.g.,whole blood, plasma, etc.).50 If the drug wassampled from whole blood, the respective volumeof distribution (Vd,blood) may be computed accord-ing to Eq. (7)
Vd;blood ¼ VB þ fuBfuT
� VT (7)
whereVB represents the volume of blood (�0.07L/kg), fuB the fraction unbound in blood, fuT thefraction unbound in tissue, and VT the extra-vascular volume in which the drug is distribu-ted.50 For drugs (lipophilic, nonpolar) that
distribute in intra-, as well as extracellular water,VT is �0.6 L/kg (total body water� blood watervolume), whereas for drugs that cannot penetrateinto cells (hydrophilic, polar), VT is �0.13L/kg.23,24 However, more frequently, free and totaldrug concentrations are determined in plasmarather than in whole blood. The respective volumeof distribution in plasma (Vd,plasma) is computedaccording to Eq. (8)
Vd;plasma ¼ VP þ fuPfuT
� V 0T
¼ VP þ fuB � CB=CP
fuT� V 0
T (8)
where VP is the plasma volume, fuP the fractionunbound in plasma, CB the total concentration inblood, CP the total concentration in plasma andVT’ the tissue volume (extravascular spaceþ bloodcell volume).24,50 Many investigators use Eqs. (7)and (8) interchangeably. However, these equa-tions are only equivalent if CB equals CP.
24,50
Based on Eqs. (7) and (8) it can be concludedthat binding to both plasma and tissue proteins,as well as the ability to cross membranes are
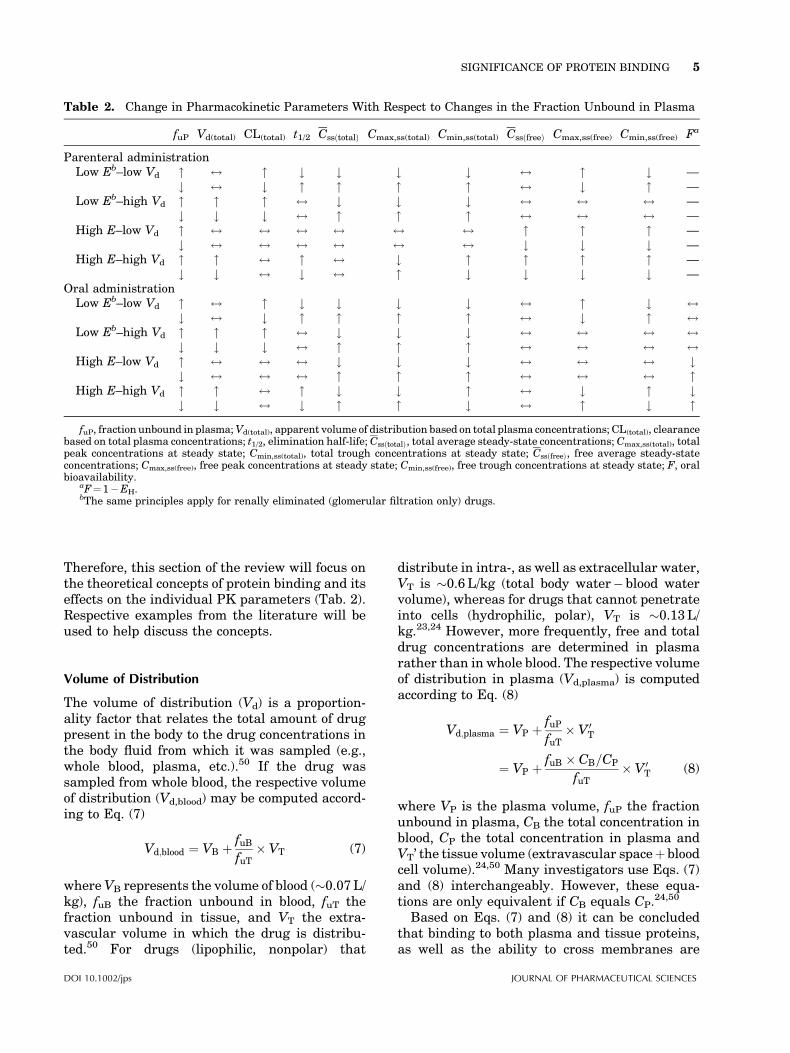
Table 2. Change in Pharmacokinetic Parameters With Respect to Changes in the Fraction Unbound in Plasma
fuP Vd(total) CL(total) t1/2 CssðtotalÞ Cmax,ss(total) Cmin,ss(total) CssðfreeÞ Cmax,ss(free) Cmin,ss(free) Fa
Parenteral administrationLow Eb–low Vd " $ " # # # # $ " # —
# $ # " " " " $ # " —Low Eb–high Vd " " " $ # # # $ $ $ —
# # # $ " " " $ $ $ —High E–low Vd " $ $ $ $ $ $ " " " —
# $ $ $ $ $ $ # # # —High E–high Vd " " $ " $ # " " " " —
# # $ # $ " # # # # —Oral administrationLow Eb–low Vd " $ " # # # # $ " # $
# $ # " " " " $ # " $Low Eb–high Vd " " " $ # # # $ $ $ $
# # # $ " " " $ $ $ $High E–low Vd " $ $ $ # # # $ $ $ #
# $ $ $ " " " $ $ $ "High E–high Vd " " $ " # # " $ # " #
# # $ # " " # $ " # "fuP, fraction unbound in plasma;Vd(total), apparent volume of distribution based on total plasma concentrations; CL(total), clearance
based on total plasma concentrations; t1/2, elimination half-life; CssðtotalÞ, total average steady-state concentrations; Cmax,ss(total), totalpeak concentrations at steady state; Cmin,ss(total), total trough concentrations at steady state; CssðfreeÞ, free average steady-stateconcentrations; Cmax,ss(free), free peak concentrations at steady state; Cmin,ss(free), free trough concentrations at steady state; F, oralbioavailability.
aF¼1�EH.bThe same principles apply for renally eliminated (glomerular filtration only) drugs.
DOI 10.1002/jps JOURNAL OF PHARMACEUTICAL SCIENCES
SIGNIFICANCE OF PROTEIN BINDING 5
important determinants of a drug’s apparent Vd.In theory, for a drug that can freely crossmembranes, an increase in fuP results in amore extensive tissue distribution and anincrease in the apparent Vd of total drug, whereasthe Vd of free drug remains unchanged(Vd,(free)¼Vd,(total)/fuP).
8 In comparison, an in-crease in fuT induces a redistribution of drug fromthe tissue into plasma/blood resulting in a
decrease in the apparent Vd of both free and totaldrug. Ultimately it is the ratio of fuP and fuT thatdetermines a drug’s Vd. For example, drugs withsimilar protein binding, such as eprosartan (98%PPB) and fluticasone proprionate (�90% PPB),can still have vastly different Vds (eprosartan�13L, fluticasone proprionate 250–600L).51–53
The magnitude of changes in Vd as a result ofchanges in fuP and/or fuT greatly depends onoriginal value of Vd. For compounds that poorlydistribute into tissues (e.g., erythropoietin, 0.033–0.075L/kg; heparin, 0.058L/kg; streptokinase,0.08L/kg), Vd will be almost equal to VP
(�3L).50,54 Changes in fuP and/or fuT will hardlyaffect the Vd of these drugs. In contrast, for drugswith a very large Vd (e.g., propranolol, 4.3 L/kg;amitriptyline, 15L/kg), changes in fuP and fuTresult in almost proportional changes in Vd.
24,54
However, most clinically relevant drugs have amoderate Vd (3–30L). For these drugs, changes infuP and/or fuT induce less than proportionalchanges in Vd.
2,9,24
Eqs. (7) and (8) represent a simplified view ofthe apparent Vd concept. In these equations, thevolumes of all tissues are combined and expressedas a single term. Also, there is no differentiation ofintra- and extracellular binding. Last, proteinconcentrations in plasma and at the site ofaction may vary, another factor not accountedfor in these equations. In order to overcome theselimitations, several authors have proposed alter-native equations, such as the Oie–Tozer equation,or algorithms to compute the apparent Vd bytaking additional factors that influence a drug’stissue distribution (e.g., protein content in extra-vascular spaces, lipophilicity, degree of ionization,etc.) into account.8,55–59
Clearance
Clearance is defined as the volume of blood (orplasma) from which a drug is completely andirreversibly removed per unit time.9 The vastmajority of drugs are cleared via the kidneys and/or the liver. For drugs which are eliminated solelyvia the kidneys, renal clearance may be describedby the following equation:26
where FR is the fraction reabsorbed from thetubule. For drugs that are eliminated solely viaglomerular filtration (no tubular secretion orreabsorption), Eq. (9) simplifies to Eq. (10), whereGFR represents the glomerular filtration rate(GFR).26
CLrenal ¼ fuP �GFR (10)
Aside from glomerular filtration, other pro-cesses, such as active secretion and active orpassive reabsorption may be involved in a drug’srenal clearance. If transporter-mediated secretionor reabsorption is involved in a drug’s renalclearance, the efficiency of this eliminationprocess depends on the activity, and possiblythe expression of the involved transporters.60–62
In comparison, the hepatic clearance of a drugfrom the blood (CLhepatic,blood) is usually describedby using the ‘‘well-stirred’’ model (Eq. 11),
CLhepatic;blood ¼ Qhepatic � fuB � CLuint
Qhepatic þ fuB � CLuint(11)
where Qhepatic is the liver blood flow, fuB thefraction unbound in blood, and CLuint representsthe intrinsic clearance based on unbound drugconcentrations.2,9,63,64 The ‘‘well-stirred’’ model isbased on the assumption that drug distributesinstantly and homogenously throughout the liverwater (perfusion-limited distribution, no activetransporters) and that unbound concentrations inthe liver and in the blood leaving the liver areidentical.65 Furthermore, the volume of bloodwhich is completely and irreversibly cleared ofdrug by the liver cannot exceed the volume ofblood that is provided to the liver per unit time.In healthy volunteers, the liver blood supply
CLrenal ¼ ð1� FRÞ � ðRate of Filtrationþ Rate of SecretionÞPlasma Concentration
(9)
JOURNAL OF PHARMACEUTICAL SCIENCES DOI 10.1002/jps
6 SCHMIDT, GONZALEZ, AND DERENDORF
accounts on average for 90L/h, but Qhepatic can besignificantly decreased due to some diseases (e.g.,cirrhosis, chronic heart failure). However, if thecomputation of the hepatic clearance is based onplasma (CP) rather than blood concentrations(CB), hepatic plasma clearance (CLhepatic,plasma)can exceed the liver plasma flow if fu�Cluint�Qhepatic and CB/CP> 1 (Eq. 12).65,66
CLhepatic;plasma
¼ Qhepatic � fuP � CLuint
Qhepatic þ fuP � CLuint=ðCB=CPÞ (12)
For the remainder of this discussion, it will beassumed that the hepatic clearance of a drug fromthe blood is equals to that from the plasma.
For hepatic clearance, the importance of proteinbinding is dependent on themetabolic efficiency ofthe enzymes (CLuint). In theory, hepaticallyeliminated drugs can be divided into three distinctgroups based on their extraction ratio (E): lowextraction drugs (E< 0.3), intermediate extrac-tion drugs (E¼ 0.3–0.7), and high extractiondrugs (E> 0.7).9 In practice, however, mostcompounds are either low or high extractiondrugs.26 For low extraction drugs, the productof CLuint and fuP is much smaller thanQhepatic andEq. (11) can be simplified to:
CLhepatic ¼ fuP � CLuint (13)
In contrast, for high extraction drugs theproduct of CLuint and fuP is much larger thanQhepatic and Eq. (11) can be simplified to:
CLhepatic ¼ Qhepatic (14)
Based on these simplifications one can concludethat the CLhepatic of low extraction drugs iscapacity limited and dependent on protein bind-ing, whereas it is flow-limited and independentof protein binding for high extraction drugs.2,9
However, it is important to remember that it is theproduct of CLuint and fuP which allows for thisdistinction, and that changes in CLuint are equallyimportant for the computation of CLhepatic.In some cases, coadministration of enzymeinhibitors may substantially decrease the extrac-tion ratio of the metabolizing organ.67 As aconsequence, CLhepatic of high extraction drugsmay not be solely dependent on Qhepatic anylonger. Instead, fuP, CLuint, and Qhepatic may haveto be considered to appropriately characterizeCLhepatic in this patient population.
Bioavailability and Route of Administration
Bioavailability ( F) is defined as ‘‘the rate andextent to which the active ingredient or activemoiety is absorbed from a drug product andbecomes available at the site of action.’’68 As aconsequence, the systemic bioavailability of adrug is largely dependent on its uptake fromthe administration site, as well as presystemicclearance. In the case of oral drug administration,first-pass metabolism in the liver or gut wall isfrequently the prevalent mechanism of presyste-mic clearance and, hence, the main determinantfor oral bioavailability ( Foral).
If the first-pass metabolism of an orallyadministered drug is negligible (low extractiondrug), Foral� 1 and is independent of proteinbinding.2 In contrast, for drugs that undergoextensive first-pass metabolism in the liver (highextraction drugs), Foral is inversely proportional toprotein binding and can be computed according tothe following equation:
Foral;high ¼ 1� E ¼ Qhepatic
fuP � CLuint(15)
On the other hand, first-pass metabolism in theliver does not impair the systemic bioavailabilityof orally administered drugs which are eliminat-ed exclusively through extrahepatic clearancemechanisms and of parenterally administereddrugs. For these drugs, their systemic bioavail-ability is independent of plasma protein binding.
Average Steady-State Concentrations
In clinical practice, the vast majority of drugs areadministered through a repeated dosing regimen.During the course of repeated dosing, concentra-tions will reach plateau levels, where the rate ofdrug input will equal the rate of elimination(steady state). At steady state, total average drugconcentrations ðCssðtotalÞÞ are calculated accordingto Eq. (16), whereas free average steady-statelevels ðCssðfreeÞÞ need to be corrected for proteinbinding (Eq. 17),
CssðtotalÞ ¼ F �D
CL� t¼ AUCtotal
t(16)
CssðfreeÞ ¼ fuP � F �D
CL� t¼ fuP � AUCtotal
t
¼ AUCfree
t(17)
DOI 10.1002/jps JOURNAL OF PHARMACEUTICAL SCIENCES
SIGNIFICANCE OF PROTEIN BINDING 7
where t represents the dosing interval, AUCtotal isthe area under the total concentration time curvefrom time zero to infinity, and AUCfree the areaunder the free concentration time curve from timezero to infinity. Based on Eqs. (16) and (17),systemic drug exposure will vary depending onthe route of administration and the processesinvolved in the drug’s elimination.
For drugs that are primarily eliminatedunchanged in the urine (glomerular filtrationonly), total ðCss;renalðtotalÞÞ and free ðCss;renalðfreeÞÞaverage steady-state concentrations can be com-puted according to Eqs. (18) and (19).
Css;renalðtotalÞ ¼ F �D
CL� t¼ F �D
fuP �GFR� t
¼ AUCrenalðtotalÞt
(18)
Css;renalðfreeÞ ¼ fuP � F �D
CL� t¼ F �D
GFR� t
¼ fuP � AUCrenalðtotalÞt
¼ AUCfree
t
(19)
From Eqs. (18) and (19) it can be shown that forrenally eliminated drugs (glomerular filtrationonly) both Css;renalðtotalÞ and total area under theconcentration curve (AUCrenal(total)) decrease as( fuP) increases, whereas Css;renalðfreeÞ and free areaunder the concentration curve (AUCrenal(free))remain unchanged. The decrease in Css;renalðtotalÞand AUCrenal(total) are a result of an increase in CLfor the total drug. In contrast, CL for the unbounddrug remains unchanged (CL(free)¼CL(total)/fuP),which explains why Css;renalðfreeÞ and AUCrenal(free)
are unaffected by a change in protein binding.Also, changes in apparent Vd will have noinfluence on steady-state concentrations for thetotal and free drug.
The same conclusions hold true for low extrac-tion drugs. Although changes in protein bindingmay result in changes in the total average steady-state concentration ðCss;lowðtotalÞÞ and the totalAUC (AUClow(total)) of low extraction drugs,changes in protein binding are irrelevant forthe corresponding free average steady-stateconcentration ðCss;lowðfreeÞÞ and the free AUC(AUClow(free)).
Css;lowðtotalÞ ¼ D
CL� t¼ D
fuP � CLuint � t
¼ AUClowðtotalÞt
(20)
Css;lowðfreeÞ ¼ fuP �D
CL� t¼ D
CLuint � t
¼ fuP � AUClowðtotalÞt
¼ AUClowðfreeÞt
(21)
In comparison, for high extraction drugs, therelevance of protein binding for the computationof average steady-state concentrations is depen-dent on the route of administration. Following i.v.bolus administration or other parenteral routes(e.g., inhalation), a change in protein binding mayalter free, unbound average steady-state concen-trations ðCss;high;i:v:ðfreeÞÞ as shown in Eq. (23). Incontrast, free average steady-state concentrationsof orally administered, high extraction drugsðCss;high;oralðfreeÞÞ are unaffected by changes in fuP(Eq. 25).
Css;high;i:v:ðtotalÞ ¼D
CL� t¼ D
Qhepatic � t
¼ AUChigh;i:v:ðtotalÞt
(22)
Css;high;i:v:ðfreeÞ ¼ fuP �D
CL� t¼ fuP �D
Qhepatic � t
¼ fuP � AUChigh;i:v:ðtotalÞt
¼ AUChigh;i:v:ðfreeÞt
(23)
Css;high;oralðtotalÞ ¼ Foral �D
CL� t¼ D
fuP � CLuint � t
¼ AUChigh;oralðtotalÞt
(24)
Css;high;oralðfreeÞ ¼ fuP � Foral �D
CL� t¼ D
CLuint � t
¼ fuP � AUChigh;oralðtotalÞt
¼ AUChigh;oralðfreeÞt
(25)
For example, saquinavir, a protease inhibitorused for the treatment of HIV infections, is a highextraction drug that is extensively bound (>95%)in plasma, primarily to AAG.69,70 Findings ofclinical studies indicated that there is consider-able between subject variability in the PK ofsaquinavir following oral administration.71,72 Itwas proposed that this variability may beexplained by changes in AAG levels, which are
JOURNAL OF PHARMACEUTICAL SCIENCES DOI 10.1002/jps
8 SCHMIDT, GONZALEZ, AND DERENDORF
elevated in severe cases of HIV infection.73,74 Inan attempt to explain the variability in patient PKfollowing oral dosing, both transgenic mice thatoverexpress plasma AAG and control mice weretreated with a single intravenous injection ofsaquinavir (10mg/kg).70 Results of this studyindicate that compared to the control mice bothfree and total clearance, as well as total Vd
in transgenic mice were significantly reducedresulting in an increased systemic saquinavirexposure.70 The most likely explanation for analteration in the CLtotal is that a substantialincrease in PPB results in a decrease in saquina-vir’s E. For high E drugs, a decrease in fuP mayresult in a decrease of Css;high;i:v:ðfreeÞ and anincrease in Css;high;oralðtotalÞ, it does not impactCss;high;oralðfreeÞ (Tab. 2).
Peak and Trough Concentrations
In order to appropriately characterize a drug’s PDeffect, it may be insufficient to only consideraverage steady-state concentrations. In fact, moreinformation can be obtained from free peak(Cmax,ss(free)) and/or trough (Cmin,ss(free)) concen-trations at steady state, as theymay correlate wellwith toxic side effects or therapeutic failure. Incontrast to the computation ofCssðtotalÞ (Eq. 16) andCssðfreeÞ (Eq. 17), the apparent Vd needs to be takeninto account when computing peak and troughconcentrations at steady state. For a one-compart-ment model, free peak (Cmax,ss(free)) and trough(Cmin,ss(free)) concentrations at steady state may becalculated according to Eqs. (26) and (27), respec-tively,
Cmax;ssðfreeÞ ¼ fuP � F �D
Vd � ð1� e�ððCL=VdÞ�tÞÞ� �
¼ fuP � Cmax;ssðtotalÞ ð26Þ
Cmin;ssðfreeÞ¼ fuP � F �D
Vd � ð1� e�ððCL=VdÞ�tÞÞ� �
� e�ððCL=VdÞ�tÞ
¼ fuP � Cmin;ssðtotalÞ
(27)
As shown in the previous sections of this paper,a distinction can be made based on the magnitudeof a drug’s Vd.
For both renally eliminated (glomerular filtra-tion only) and low extraction drugs with a verylow Vd (Vd�Vp) and a moderate Vd (3–30L),
changes in protein binding are likely to alter theCmax,ss(free) and Cmin,ss(free). For drugs with a veryhigh Vd (Vd� 30L), protein binding becomesirrelevant for the computation of Cmax,ss(free) andCmin,ss(free) (Tab. 2).
2,50
In comparison, a more complex scenario arisesfor high extraction drugs. While protein binding isirrelevant for the computation of Cmax,ss(free) andCmin,ss(free) of an orally administered high extrac-tion drug with a very low Vd (�VP), it may affectCmax,ss(free) and Cmin,ss(free) for all other scenarios,independent of the route of administration(Tab. 2).
Half-Life
A drug’s half-life is dependent on CL and Vd. As aconsequence, the effects of PPB on each of theseparameters must be considered (Eq. 28).
t1=2 ¼ ln 2� Vd
CL¼ ln 2� ðVP þ fuP=fuT � VTÞ
CL(28)
A distinction can be made between drugs with avery low Vd (�VP), a moderate Vd (<30L), and ahigh Vd (�30L) when evaluating the effect ofprotein binding on a drug’s half-life (t1/2).
For both renally eliminated (filtration only) andlow extraction drugs, t1/2 is dependent on proteinbinding at a very low or a moderate Vd, whereasprotein binding becomes irrelevant for the t1/2computation of those drugs with a high Vd
(Tab. 2). For example, thiopental, a low extractiondrug with a large Vd (0.4–3.5 L/kg) is used forthe induction of anesthesia and as an anti-convulsant.75 It is highly bound to plasmaproteins (75–90% PPB), primarily to albumin.76,77
In a study evaluating the PK of thiopental insurgical patients it was found that fuP ofthiopental increased from 15.7� 2.4% for patientswith normal renal function to 28.0� 6.5% forpatients with chronic renal failure.75 However,this increase in fuP did not result in a significantchange in thiopental’s t1/2 as both CL and Vd,based on total plasma concentrations, increased.75
When using free rather than total plasmaconcentrations, no substantial differences in CLand Vd were observed.75
In comparison, changes in protein binding willaffect the t1/2 of high extraction drugs with amoderate or a high Vd, but do not impact the t1/2 ofhigh extraction drugs with a very low Vd.
DOI 10.1002/jps JOURNAL OF PHARMACEUTICAL SCIENCES
SIGNIFICANCE OF PROTEIN BINDING 9
IMPACT OF PROTEIN BINDING ON IN VIVOPHARMACODYNAMICS
Based on the ‘‘free drug hypothesis,’’ it is expectedthat free drug concentrations correlate best withdrug response. As discussed throughout thispaper, there is a plethora of factors which mustbe considered when drawing conclusions concern-ing protein binding. Since drug response dependsheavily on free, unbound drug concentrations atthe site of action, the physicochemical propertiesof the drug and transporters are vital componentsin dictating the extent to which the drug reachesits target.
For drugs that have their site of action in thecentral compartment, such as beta-blockers, free,unbound drug in the plasma is responsible forbinding to the drug target and eliciting a response.For example, in a study evaluating the effect offour beta-blockers with varying degrees of proteinbinding (%PPB), S(�)-atenolol, 3%; S(�)-propra-nolol, 85%; S(�)-metoprolol, 19%; timolol, 37%) onisoprenaline-induced tachycardia, it was shownthat the in vivo efficacy correlated best with free,unbound concentrations and could be predictedfrom in vitro/in vivo correlations.3
On the other hand, once a drug has to crossmembranes in order to reach the target site, itsphysicochemical properties and the involvementof drug transporters become much more impor-tant. For example, in vitro, loperamide is a potentagonist for mu opioid receptors, which areprimarily located in the brain and the intes-tines.78,79 In vivo only antidiarrhetic effectsmediated by mu receptors in the intestines areclinically relevant. One might now speculate thatthis is the result of loperamide’s extensive proteinbinding (97%) resulting in insufficient tissuedistribution.80,81 Yet, it was shown in animalexperiments that the lack of central opiate activityis a result of a P-glycoprotein (P-gp)-mediatedefflux process rather than distribution restric-tions into the brain due to its high proteinbinding.82 When P-gp was inhibited in a secondstudy, central opiate effects were observed withloperamide use.83
Besides preventing a drug from reaching itstarget, transporters may also be responsible forthe rate and extent at which a drug reaches itstarget site. For example, morphine and oxycodoneare both potent analgesics, which mediate theireffects through binding primarily to the mu opioidreceptor. It was determined in in vitro experi-ments thatmorphine had a 26-fold greater affinity
for the mu receptor than oxycodone. This findingmay lead to the assumption that significantlylower morphine doses are required to achieve ananalgesic effect similar to that of oxycodone.However, findings from patient studies indicatedthat equal doses of morphine and oxycodone wereneeded for pain relief following i.v. administra-tion,84 whereas required morphine doses wereeven twofold higher following oral administra-tion.85 In order to evaluate this phenomenon, amicrodialysis study was performed in rats tomeasure free, unbound concentration at the site ofaction, the brain.86 In addition, blood sampleswere taken throughout the study. Results of thismicrodialysis study indicated that there was asixfold difference in transport across the blood–brain barrier resulting in free oxycodone brainconcentrations three times those in blood atsteady state.86 In contrast, free, unbound brainconcentrations ofmorphine are 0.56 times those inblood at steady state.86 As a consequence, free andtotal concentrations in the blood differ substan-tially from those at the site of action, and may bepoor predictors for PD outcome. In this case, amore rational approach would be to measure free,unbound concentrations directly at the site ofaction (by e.g., microdialysis) and correlate themwith the respective PD effect.
Once at the site of action, the formation of thedrug target complex is solely dependent on theavailability of free drug and unoccupied drugtarget, as well as their relative affinity for eachother, as discussed in the in vitro section. Theamount of free drug is reduced by protein that isavailable for drug binding at the target site. Insome cases, the protein content of interstitialspace fluids in tissues may substantially differfrom that in plasma. For example, proteinconcentrations in the cerebrospinal fluid are verylow (�1% of plasma).87 Consequently, competitivebinding to proteins in the interstitial space fluid ofthe brain is negligible. In this scenario, theamount of pharmacologically active drug at theeffect site will depend primarily on passage acrossthe blood–brain barrier and plasma on proteinbinding. This dependence of drugs with centralnervous system activity on protein binding wasdemonstrated for benzodiazepines. Upon uptakeinto the brain, benzodiazepines bind to GABAreceptors resulting in an altered chloride ionchannel function. Subsequent changes in theelectrophysiology of the brain have been evalu-ated in rats, where four different benzodiazepineswith varying degrees of protein binding (%PPB;
JOURNAL OF PHARMACEUTICAL SCIENCES DOI 10.1002/jps
10 SCHMIDT, GONZALEZ, AND DERENDORF
flunitrazepam, 85%; midazolam, 96%; oxazepam,91%; clobazam, 69%) were administered.88 Theresults of this study indicated that EC50 valuesand in vitro receptor binding Ki were reasonablycorrelated when total concentrations were used,but highly correlated after correcting total con-centration for protein binding (Tab. 3).88
Alternatively, a reduction in systemic drugexposure due to high protein bindingmay, in somecases, improve the safety profile of a drug due to areduction in free, active drug.89–92 This concepthas been applied in the development of newerinhaled corticosteroids. Ciclesonide, the mostrecently approved inhaled corticosteroid, is givenas a prodrug that is converted into its active
metabolite, desisobutyryl-ciclesonide (des-CIC),once it reaches the lungs.89 While the prolongeduse of older inhaled corticosteroids is frequentlylimited by the appearance of systemic adverseevents (e.g., hypothalamic–pituitary–adrenal axissuppression), des-CIC’s extensive protein binding(�99%) minimizes its systemic exposure and maycontribute to an improved risk-benefit profile.89,90
This optimized design allows ciclesonide to beadministered at high doses of up to the 1600mg/day without causing significant systemic sideeffects.93–98
As shown in the previous sections of this paper,multiple aspects have to be considered to fullycharacterize the effect of protein binding on the
Table 3. Comparison of EEG Activity and Receptor Affinity (Ki) of Four Benzodiazepines in Rats
EC50(total) (ng/mL) EC50(free) (ng/mL) Ki (ng/mL)
Flunitrazepam 26 4.2 7Midazolam 105 3.7 4.9Oxazepam 559 49 86Clobazam 859 277 350Correlation with Ki 0.916 0.998
Total (EC50(total)) and free (EC50(free)) pharmacodynamic parameters were derived from an EEG model and are reported asmean�SE (data taken from Ref. 88).
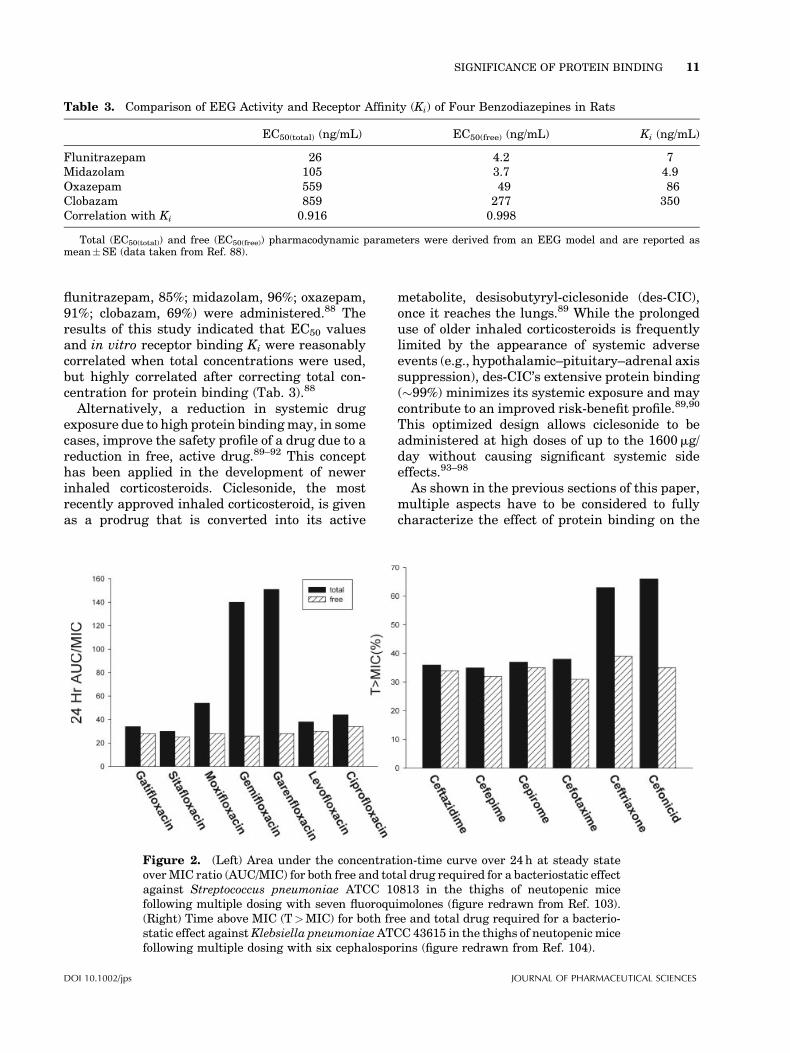
Figure 2. (Left) Area under the concentration-time curve over 24h at steady stateoverMIC ratio (AUC/MIC) for both free and total drug required for a bacteriostatic effectagainst Streptococcus pneumoniae ATCC 10813 in the thighs of neutopenic micefollowing multiple dosing with seven fluoroquimolones (figure redrawn from Ref. 103).(Right) Time above MIC (T>MIC) for both free and total drug required for a bacterio-static effect againstKlebsiella pneumoniaeATCC 43615 in the thighs of neutopenic micefollowing multiple dosing with six cephalosporins (figure redrawn from Ref. 104).
DOI 10.1002/jps JOURNAL OF PHARMACEUTICAL SCIENCES
SIGNIFICANCE OF PROTEIN BINDING 11
PK and, subsequently, the PD of a drug. Once thisrelationship has been identified and validated,drug exposure (PK) can be normalized to thecorresponding effect (PD) by establishing clini-cally relevant PK/PD indices.17,99 These indicescan then be used to optimize the dosing regimen.
For example, for beta-lactams, the cumulativepercentage of a 24-h period that free concentra-tions exceed the MIC (T>MIC) has been identi-fied as the best predictor for efficacy.100,101 Incomparison, the area under the concentration–time curve over 24h in steady state overMIC ratio(AUC/MIC) has been identified the best predictorfor fluoroquinolones.102 In both examples shownin Figure 2, PK/PD indices were highly variablewhen evaluated using total drug concentra-tions.103,104 However, there was no meaningfuldifference when protein binding was accountedfor.
CONCLUSION
In conclusion, plasma protein binding can havemultiple effects on the PK and PD of a drug. Asimple, generalized guideline for the evaluationof the clinical significance of protein bindingfrequently cannot be applied. Instead, a carefulanalysis of protein binding effects must be madeon a drug-by-drug basis. Whenever possible, freedrug concentrations at the receptor site shouldbe used for making inferences about a drug’spharmacological activity. Once at the receptorsite, free, unbound concentrations are the bestpredictor of a drug’s pharmacodynamic effect(s).In order to avoid further confusion about theclinical significance of protein binding, free,unbound concentrations should always be mea-sured rather than estimated, and used as theprimary input for PK/PD correlations, as well asfor statements on the safety and efficacy of drugs.
REFERENCES
1. Sansom LN, Evans AM. 1995. What is the trueclinical significance of plasma protein binding dis-placement interactions? Drug Saf 12:227–233.
2. Benet LZ, Hoener BA. 2002. Changes in plasmaprotein binding have little clinical relevance. ClinPharmacol Ther 71:115–121.
3. van Steeg TJ, Boralli VB, Krekels EH, SlijkermanP, Freijer J, Danhof M, de Lange EC. 2008. Influ-
ence of plasma protein binding on pharmacody-namics: Estimation of in vivo receptor affinitiesof beta blockers using a new mechanism-basedPK-PD modelling approach. J Pharm Sci 98:3816–3828.
4. Zeitlinger MA, Sauermann R, Traunmuller F,Georgopoulos A, Muller M, Joukhadar C. 2004.Impact of plasma protein binding on antimicrobialactivity using time-killing curves. J AntimicrobChemother 54:876–880.
5. Cha R, RybakMJ. 2004. Influence of protein bindingunder controlled conditions on the bactericidal activ-ity of daptomycin in an in vitro pharmacodynamicmodel. J Antimicrob Chemother 54:259–262.
6. Boffito M, Back DJ, Blaschke TF, Rowland M,Bertz RJ, Gerber JG, Miller V. 2003. Protein bind-ing in antiretroviral therapies. AIDS Res HumRetroviruses 19:825–835.
7. Toutain PL, Bousquet-Melou A. 2002. Free drugfraction vs free drug concentration: A matter offrequent confusion. J Vet Pharmacol Ther 25:460–463.
8. Tozer TN. 1981. Concepts basic to pharmacoki-netics. Pharmacol Ther 12:109–131.
9. Wilkinson GR, Shand DG. 1975. Commentary: Aphysiological approach to hepatic drug clearance.Clin Pharmacol Ther 18:377–390.
10. Wood M. 1986. Plasma drug binding: Implicationsfor anesthesiologists. Anesth Analg 65:786–804.
11. Calvo R, Lukas JC, Rodriguez M, Leal N, SuarezE. 2006. The role of unbound drug in pharmaco-kinetics/pharmacodynamics and in therapy. CurrPharm Des 12:977–987.
12. Nix DE, Matthias KR, Ferguson EC. 2004.Effect of ertapenem protein binding on killing ofbacteria. Antimicrob Agents Chemother 48: 3419–3424.
13. Schmidt S, Rock K, Sahre M, Burkhardt O, Brun-ner M, Lobmeyer MT, Derendorf H. 2008. Effect ofprotein binding on the pharmacological activityof highly bound antibiotics. Antimicrob AgentsChemother 52:3994–4000.
14. Beer J, Wagner CC, Zeitlinger M. 2009. Proteinbinding of antimicrobials: Methods for quantifica-tion and for investigation of its impact on bacterialkilling. AAPS J 11:1–12.
15. Kremer JM, Wilting J, Janssen LH. 1988. Drugbinding to human alpha-1-acid glycoprotein inhealth and disease. Pharmacol Rev 40:1–47.
16. Wright JD, Boudinot FD, Ujhelyi MR. 1996.Measurement and analysis of unbound drug con-centrations. Clin Pharmacokinet 30:445–462.
17. Schmidt S, Barbour A, Sahre M, Rand KH,Derendorf H. 2008. PK/PD: New insights for anti-bacterial and antiviral applications. Curr OpinPharmacol 8:549–556.
18. Bertucci C, Domenici E. 2002. Reversible and co-valent binding of drugs to human serum albumin:
JOURNAL OF PHARMACEUTICAL SCIENCES DOI 10.1002/jps
12 SCHMIDT, GONZALEZ, AND DERENDORF
Methodological approaches and physiological rele-vance. Curr Med Chem 9:1463–1481.
19. Israili ZH, Dayton PG. 2001. Human alpha-1-glycoprotein and its interactions with drugs. DrugMetab Rev 33:161–235.
20. Piafsky KM. 1980. Disease-induced changes in theplasma binding of basic drugs. Clin Pharmacoki-net 5:246–262.
21. Kopecky V, Jr., Ettrich R, Hofbauerova K,Baumruk V. 2003. Structure of human alpha1-acid glycoprotein and its high-affinity binding site.Biochem Biophys Res Commun 300:41–46.
22. Otagiri M. 2005. A molecular functional study onthe interactions of drugs with plasma proteins.Drug Metab Pharmacokinet 20:309–323.
23. MacKichan JJ. 2005. Influence of protein bindingand use of unbound (free) drug concentrations. In:Burton ME, Shaw LM, Schentag JL, Evans WE,editors. Applied pharmacokientics and pharmaco-dynamics: Principles of therapeutic drug monitor-ing, 4th edition. Philadelphia: Lippincott Williams& Wilkins. pp 82–120.
24. Mehvar R. 2005. Role of protein binding in phar-macokinetics. Am J Pharm Educ 69:1–8.
25. Rawis WR, Owen JS. 1994. Stereochemical con-siderations in bioavailability studies. In: JacksonAJ, editor. Generics and bioequivalence, 1stedition. Boca Raton, FL: CRC Press. pp 113–138.
26. Rowland M, Tozer TN. 1995. Clinical pharmaco-kinetics, concepts and applications, 3rd edition.Baltimore: Lippincott Williams & Williams.
27. Haller C. 2005. Hypoalbuminemia in renal failure:Pathogenesis and therapeutic considerations.Kidney Blood Press Res 28:307–310.
28. Furth SL, Cole SR, Fadrowski JJ, GersonA, PierceCB, Chandra M, Weiss R, Kaskel F. 2007. Theassociation of anemia and hypoalbuminemia withaccelerated decline in GFR among adolescentswith chronic kidney disease. Pediatr Nephrol 22:265–271.
29. Don BR, Kaysen G. 2004. Serum albumin: Rela-tionship to inflammation and nutrition. SeminDial 17:432–437.
30. Joynt GM, Lipman J, Gomersall CD, Young RJ,Wong EL, Gin T. 2001. The pharmacokinetics ofonce-daily dosing of ceftriaxone in critically illpatients. J Antimicrob Chemother 47:421–429.
31. Hochepied T, Berger FG, Baumann H, Libert C.2003. Alpha(1)-acid glycoprotein: An acute phaseprotein with inflammatory and immunomodulat-ing properties. Cytokine Growth Factor Rev14:25–34.
32. Craig WA, Welling PG. 1977. Protein bindingof antimicrobials: Clinical pharmacokinetic andtherapeutic implications. Clin Pharmacokinet2:252–268.
33. Laganiere S, McGilveray IJ. 2002. Protein bindingof drugs. In: Swarbrik J, Boylan JC, editors. Enzy-
clopedia of pharmaceutical technology, 3rdedition. New York: Dekker.
34. Lumpkin MH, Bruckner JV, Campbell JL, DallasCE,White CA, Fisher JW. 2003. Plasma binding oftrichloroacetic acid in mice, rats, and humansunder cancer bioassay and environmental expo-sure conditions. Drug Metab Dispos 31:1203–1207.
35. Lima JJ, Boudoulas H, Blanford M. 1981. Concen-tration-dependence of disopyramide binding toplasma protein and its influence on kineticsand dynamics. J Pharmacol Exp Ther 219:741–747.
36. Pritchard JF, McKown LA, Dvorchik BH, O’NeillPJ. 1985. Plasma protein binding of bepridil. J ClinPharmacol 25:347–353.
37. Wong BK, Bruhin PJ, Lin JH. 1999. Dose-dependent plasma clearance of MK-826, acarbapenem antibiotic, arising from concentra-tion-dependent plasma protein binding in ratsand monkeys. J Pharm Sci 88:277–280.
38. Cloyd JC, Dutta S, Cao G, Walch JK, Collins SD,Granneman GR. 2003. Valproate unbound frac-tion and distribution volume following rapid infu-sions in patients with epilepsy. Epilepsy Res53:19–27.
39. Vella-Brincat JW, Begg EJ, Kirkpatrick CM,Zhang M, Chambers ST, Gallagher K. 2007. Pro-tein binding of cefazolin is saturable in vivo bothbetween and within patients. Br J Clin Pharmacol63:753–757.
40. Parker RB, Williams CL, Laizure SC, Lima JJ.1995. Factors affecting serum protein binding ofcocaine in humans. J Pharmacol Exp Ther275:605–610.
41. Marathe A, Krzyzanski W, Mager DE. 2009.Numerical validation and properties of a rapidbinding approximation of a target-mediated drugdisposition pharmacokinetic model. J Pharmaco-kinet Pharmacodyn 36:199–219.
42. Cafini F, Aguilar L, Gonzalez N, Gimenez MJ,Torrico M, Alou L, Sevillano D, Vallejo P, PrietoJ. 2007. In vitro effect of the presence of humanalbumin or human serum on the bactericidalactivity of daptomycin against strains with themain resistance phenotypes in Gram-positives.J Antimicrob Chemother 59:1185–1189.
43. Laue H, Valensise T, Seguin A, Hawser S, LociuroS, Islam K. 2007. Effect of human plasma on theantimicrobial activity of iclaprim in vitro.J Antimicrob Chemother 60:1388–1390.
44. Ghuman J, Zunszain PA, Petitpas I, BhattacharyaAA, Otagiri M, Curry S. 2005. Structural basisof the drug-binding specificity of human serumalbumin. J Mol Biol 353:38–52.
45. KuninCM. 1966. Clinical pharmacology of the newpenicillins. 1. The importance of serum proteinbinding in determining antimicrobial activity
DOI 10.1002/jps JOURNAL OF PHARMACEUTICAL SCIENCES
SIGNIFICANCE OF PROTEIN BINDING 13
and concentration in serum. Clin Pharmacol Ther7:166–179.
46. Kunin CM, Craig WA, Kornguth M, Monson R.1973. Influence of binding on the pharmacologicactivity of antibiotics. Ann N Y Acad Sci 226:214–224.
47. Brown RP, Aplin RT, Schofield CJ. 1996. Inhibi-tion of TEM-2 beta-lactamase from Escherichiacoli by clavulanic acid: Observation of intermedi-ates by electrospray ionizationmass spectrometry.Biochemistry 35:12421–12432.
48. Therrien C, Kotra LP, Sanschagrin F, MobasheryS, Levesque RC. 2000. Evaluation of inhibition ofthe carbenicillin-hydrolyzing beta-lactamase PSE-4 by the clinically used mechanism-based inhibi-tors. FEBS Lett 470:285–292.
49. Berezhkovskiy LM, Khojasteh SC, Halladay JS,Hop CE. 2009. On the prediction of hepatic clear-ance using the diluted plasma in metabolic stabi-lity assay. J Pharm Sci 98:1922–1927.
50. Gibaldi M, Perrier D. 1982. Apparent volume ofdistribution. Pharmacokinetics, 2nd edition. NewYork: Marcel Dekker. pp 199–219.
51. Tenero DM, Martin DE, Miller AK, Ilson B, BoikeSC, Zariffa N, Jorkasky DK. 1998. Effect of ageand gender on the pharmacokinetics of eprosar-tan. Br J Clin Pharmacol 46:267–270.
52. TeneroD,Martin D, Ilson B, Jushchyshyn J, BoikeS, Lundberg D, Zariffa N, Boyle D, Jorkasky D.1998. Pharmacokinetics of intravenously andorally administered eprosartan in healthy males:Absolute bioavailability and effect of food. Bio-pharm Drug Dispos 19:351–356.
53. Thorsson L, Edsbacker S, Kallen A, Lofdahl CG.2001. Pharmacokinetics and systemic activity offluticasone via Diskus and pMDI, and of budeso-nide via Turbuhaler. Br J Clin Pharmacol 52:529–538.
54. Thummel KE, Shen DD, Isoherranen N, SmithHE. 2006. Design and optimization of dosage regi-mens: Pharmacokinetic data. In: Brunton L, LazoJ, Parker K, editors. Goodman & Gilman’s ThePharmacological Basis of Therapeutics, 11th edi-tion. New York: McGraw-Hill. pp 1787–1888.
55. Lombardo F, Obach RS, Shalaeva MY, Gao F.2004. Prediction of human volume of distributionvalues for neutral and basic drugs. 2. Extendeddata set and leave-class-out statistics. J MedChem 47:1242–1250.
56. Poulin P, Theil FP. 2009. Development of a novelmethod for predicting human volume of distribu-tion at steady-state of basic drugs and comparativeassessment with existing methods. J Pharm Sci(in press).
57. Berezhkovskiy LM. 2004. Volume of distributionat steady state for a linear pharmacokinetic sys-tem with peripheral elimination. J Pharm Sci93:1628–1640.
58. Rodgers T, Rowland M. 2007. Mechanisticapproaches to volume of distribution predictions:Understanding the processes. Pharm Res 24:918–933.
59. Oie S, Tozer TN. 1979. Effect of altered plasmaprotein binding on apparent volume of distribu-tion. J Pharm Sci 68:1203–1205.
60. Urban TJ, Brown C, Castro RA, ShahN,Mercer R,Huang Y, Brett CM, Burchard EG, Giacomini KM.2008. Effects of genetic variation in the novelorganic cation transporter, OCTN1, on the renalclearance of gabapentin. Clin Pharmacol Ther83:416–421.
61. Leabman MK, Giacomini KM. 2003. Estimatingthe contribution of genes and environment to var-iation in renal drug clearance. Pharmacogenetics13:581–584.
62. Shitara Y, Horie T, Sugiyama Y. 2006. Transpor-ters as a determinant of drug clearance and tissuedistribution. Eur J Pharm Sci 27:425–446.
63. Gillette JR. 1971. Factors affecting drug metabo-lism. Ann N Y Acad Sci 179:43–66.
64. Rowland M, Benet LZ, Graham GG. 1973. Clear-ance concepts in pharmacokinetics. J Pharmaco-kinet Biopharm 1:123–136.
65. Yang J, Jamei M, Yeo KR, Rostami-Hodjegan A,Tucker GT. 2007. Misuse of the well-stirred modelof hepatic drug clearance. Drug Metab Dispos35:501–502.
66. Hinderling PH. 1997. Red blood cells: A neglectedcompartment in pharmacokinetics and pharmaco-dynamics. Pharmacol Rev 49:279–295.
67. Kuroha M, Kayaba H, Kishimoto S, Khalil WF,Shimoda M, Kokue E. 2002. Effect of oral ketoco-nazole on first-pass effect of nifedipine after oraladministration in dogs. J Pharm Sci 91:868–873.
68. CDER. Guidance for industry bioavailability andbioequivalence studies for orally administereddrug products—General considerations. CDER.Accessed on August 28, 2009.
69. Shargel L, Wu-Pong S, Yu A. 2005. Physiologicdrug distribution and protein binding. In: ShargelL, Wu-Pong S, Yu A, editors. Applied biopharma-ceutics & pharmacokinetics, 5th edition. New York:Mc Graw-Hill. pp 251–302.
70. Holladay JW, Dewey MJ, Michniak BB, WiltshireH, Halberg DL, Weigl P, Liang Z, Halifax K,Lindup WE, Back DJ. 2001. Elevated alpha-1-acidglycoprotein reduces the volume of distributionand systemic clearance of saquinavir. Drug MetabDispos 29:299–303.
71. Regazzi MB, Villani P, Maserati R, Cocchi L,Giacchino R, Burroni D, Rettani M. 1999. Phar-macokinetic variability and strategy for therapeu-tic drug monitoring of saquinavir (SQV) in HIV-1infected individuals. Br J Clin Pharmacol 47:379–382.
JOURNAL OF PHARMACEUTICAL SCIENCES DOI 10.1002/jps
14 SCHMIDT, GONZALEZ, AND DERENDORF
72. Gieschke R, Fotteler B, Buss N, Steimer JL. 1999.Relationships between exposure to saquinavirmonotherapy and antiviral response in HIV-positive patients. Clin Pharmacokinet 37:75–86.
73. Oie S, Jacobson MA, Abrams DI. 1993. Alpha 1-acid glycoprotein levels in AIDS patients beforeand after short-term treatment with zidovudine(ZDV). J Acquir Immune Defic Syndr 6:531–533.
74. Flaherty JF, Jr., Gatti G, White J, Bubp J, BorinM, Gambertoglio JG. 1996. Protein binding ofclindamycin in sera of patients with AIDS. Anti-microb Agents Chemother 40:1134–1138.
75. Burch PG, Stanski DR. 1982. Decreased proteinbinding and thiopental kinetics. Clin PharmacolTher 32:212–217.
76. Becker KE, Jr. 1976. Gas chromatographic assayfor free and total plasma levels of thiopental.Anesthesiology 45:656–660.
77. Christensen JH, Andreasen F, Jensen EB. 1980.The binding of thiopental to serum proteins deter-mined by ultrafiltration and equilibrium dialysis.Acta Pharmacol Toxicol (Copenh) 47:24–32.
78. Terenius L. 1975. Comparison between narcotic‘‘receptors’’ in the guinea-pig ileum and the ratbrain. Acta Pharmacol Toxicol (Copenh) 37:211–221.
79. Kalvass JC, Olson ER, Cassidy MP, Selley DE,Pollack GM. 2007. Pharmacokinetics and pharma-codynamics of seven opioids in P-glycoprotein-competent mice: Assessment of unbound brainEC50,u and correlation of in vitro, preclinical,and clinical data. J Pharmacol Exp Ther 323:346–355.
80. Online DI. Loperamide-hydrochloride. Accessed via:www.drugs.com/mmx/loperamide-hydrochloride.html. Accessed on August 28, 2009.
81. Heel RC, Brogden RN, Speight TM, Avery GS.1978. Loperamide: A review of its pharmacologicalproperties and therapeutic efficacy in diarrhoea.Drugs 15:33–52.
82. Schinkel AH, Wagenaar E, Mol CA, van DeemterL. 1996. P-glycoprotein in the blood-brain barrierof mice influences the brain penetration and phar-macological activity of many drugs. J Clin Invest97:2517–2524.
83. Sadeque AJ, Wandel C, He H, Shah S, Wood AJ.2000. Increased drug delivery to the brain by P-glycoprotein inhibition. Clin Pharmacol Ther68:231–237.
84. Silvasti M, Rosenberg P, Seppala T, Svartling N,Pitkanen M. 1998. Comparison of analgesic effi-cacy of oxycodone and morphine in postoperativeintravenous patient-controlled analgesia. ActaAnaesthesiol Scand 42:576–580.
85. Curtis GB, Johnson GH, Clark P, Taylor R, BrownJ, O’Callaghan R, Shi M, Lacouture PG. 1999.Relative potency of controlled-release oxycodoneand controlled-release morphine in a postopera-
tive pain model. Eur J Clin Pharmacol 55:425–429.
86. Bostrom E, Hammarlund-Udenaes M, SimonssonUS. 2008. Blood-brain barrier transport helps toexplain discrepancies in in vivo potency betweenoxycodone and morphine. Anesthesiology 108:495–505.
87. Dingemanse J, Danhof M, Breimer DD. 1988.Pharmacokinetic-pharmacodynamic modeling ofCNS drug effects: An overview. Pharmacol Ther38:1–52.
88. Mandema JW, Sansom LN, Dios-Vieitez MC,Hollander-Jansen M, Danhof M. 1991. Pharmaco-kinetic-pharmacodynamic modeling of the elect-troencephalographic effects of benzodiazepines.Correlation with receptor binding and anticonvul-sant activity. J Pharmacol Exp Ther 257:472–478.
89. Derendorf H. 2007. Pharmacokinetic and pharma-codynamic properties of inhaled ciclesonide. J ClinPharmacol 47:782–789.
90. Rohatagi S, Luo Y, Shen L, Guo Z, Schemm C,Huang Y, Chen K, David M, Nave R, King SP.2005. Protein binding and its potential for elicitingminimal systemic side effects with a novel inhaledcorticosteroid, ciclesonide. Am J Ther 12:201–209.
91. Winkler J, Hochhaus G, Derendorf H. 2004. Howthe lung handles drugs: Pharmacokinetics andpharmacodynamics of inhaled corticosteroids.Proc Am Thorac Soc 1:356–363.
92. Rohatagi S, Appajosyula S, Derendorf H, Szefler S,Nave R, Zech K, Banerji D. 2004. Risk-benefitvalue of inhaled glucocorticoids: A pharmacoki-netic/pharmacodynamic perspective. J Clin Phar-macol 44:37–47.
93. Lipworth BJ, Kaliner MA, LaForce CF, Baker JW,Kaiser HB, Amin D, Kundu S, WilliamsJE, Engelstaetter R, Banerji DD. 2005. Effectof ciclesonide and fluticasone on hypothalamic-pituitary-adrenal axis function in adults withmild-to-moderate persistent asthma. Ann AllergyAsthma Immunol 94:465–472.
94. Szefler S, Rohatagi S, Williams J, Lloyd M, KunduS, Banerji D. 2005. Ciclesonide, a novel inhaledsteroid, does not affect hypothalamic-pituitary-adrenal axis function in patients with moderate-to-severe persistent asthma. Chest 128:1104–1114.
95. Kaliner MA. 2006. Pharmacologic character-istics and adrenal suppression with newerinhaled corticosteroids: A comparison of cicleso-nide and fluticasone propionate. Clin Ther 28:319–331.
96. Rohatagi S, Krishnaswami S, Pfister M, Sahasra-naman S. 2005. Model-based covariate pharmaco-kinetic analysis and lack of cortisol suppression bythe new inhaled corticosteroid ciclesonide using a
DOI 10.1002/jps JOURNAL OF PHARMACEUTICAL SCIENCES
SIGNIFICANCE OF PROTEIN BINDING 15
novel cortisol release model. Am J Ther 12:385–397.
97. Vermeulen JH, Gyurkovits K, Rauer H, Engelstat-ter R. 2007. Randomized comparison of theefficacy and safety of ciclesonide and budesonidein adolescents with severe asthma. Respir Med101:2182–2191.
98. Lee DK, Fardon TC, Bates CE, Haggart K,McFarlane LC, Lipworth BJ. 2005. Airwayand systemic effects of hydrofluoroalkane formu-lations of high-dose ciclesonide and fluticasonein moderate persistent asthma. Chest 127:851–860.
99. Mouton JW, Dudley MN, Cars O, Derendorf H,Drusano GL. 2005. Standardization of pharmaco-kinetic/pharmacodynamic (PK/PD) terminologyfor anti-infective drugs: An update. J AntimicrobChemother 55:601–607.
100. MacGowan AP. 2004. Elements of design: Theknowledge on which we build. Clin MicrobiolInfect 10:6–11.
101. Craig WA. 2001. Does the dose matter? Clin InfectDis 33:S233–S237.
102. Forrest A, Nix DE, Ballow CH, Goss TF,Birmingham MC, Schentag JJ. 1993. Pharmaco-dynamics of intravenous ciprofloxacin in seriouslyill patients. Antimicrob Agents Chemother37:1073–1081.
103. Craig WA. 2003. Pharmacodynamics of antimicro-bials in animal models. ISAP. Accessed via: www.isap.org/2003/Workshop-Glasgow/craig-2/craig-2.pdf. Accessed on August 28, 2008.
104. Craig WA. 2003. Basic pharmacodynamics of anti-bacterials with clinical applications to the use ofbeta-lactams, glycopeptides, and linezolid. InfectDis Clin North Am 17:479–501.
JOURNAL OF PHARMACEUTICAL SCIENCES DOI 10.1002/jps
16 SCHMIDT, GONZALEZ, AND DERENDORF


