Embed Size (px)
Citation preview

This article appeared in a journal published by Elsevier. The attachedcopy is furnished to the author for internal non-commercial researchand education use, including for instruction at the authors institution
and sharing with colleagues.
Other uses, including reproduction and distribution, or selling orlicensing copies, or posting to personal, institutional or third party
websites are prohibited.
In most cases authors are permitted to post their version of thearticle (e.g. in Word or Tex form) to their personal website orinstitutional repository. Authors requiring further information
regarding Elsevier’s archiving and manuscript policies areencouraged to visit:
http://www.elsevier.com/copyright

Author's personal copy
Separation and Purification Technology 72 (2010) 309–318
Contents lists available at ScienceDirect
Separation and Purification Technology
journa l homepage: www.e lsev ier .com/ locate /seppur
Silver-doped TiO2 prepared by microemulsion method: Surface properties,bio- and photoactivity
Anna Zielinskaa, Ewa Kowalskaa,e,f, Janusz W. Sobczakd, Izabela Łackab, Maria Gazdac,Bunsho Ohtanie, Jan Hupkaa, Adriana Zaleskaa,∗
a Department of Chemical Technology, Faculty of Chemistry, Gdansk University of Technology, ul. Narutowicza 11/12, 80-233 Gdansk, Polandb Department of Pharmaceutical Technology and Biochemistry, Faculty of Chemistry, Gdansk University of Technology, 80-233 Gdansk, Polandc Department of Solid State Physics, Faculty of Applied Physics and Mathematics, Gdansk University of Technology, 80-233 Gdansk, Polandd Laboratory of Electron Spectroscopies, Institute of Physical Chemistry, Polish Academy of Sciences, 01-224 Warsaw, Polande Catalysis Research Center, Hokkaido University, Sapporo 001-0021, Japanf Friedrich Alexander Universität Erlangen-Nürnberg, Institut für Anorganische Chemie, 91058 Erlangen, Germany
a r t i c l e i n f o
Article history:Received 23 May 2009Received in revised form 1 March 2010Accepted 2 March 2010
Keywords:Ag-doped TiO2
MicroemulsionHeterogeneous photocatalysisBioactivity
a b s t r a c t
A series of Ag-TiO2 photocatalysts were obtained in microemulsion system (water/AOT/cyclohexane),using several Ag precursor amounts ranging from 1.5 to 8.5 mol.%. The photocatalysts’ characteristics byX-ray diffraction, STEM microscopy, UV–vis spectroscopy, X-ray photoelectron spectroscopy, BET meth-ods showed that a sample with the highest photo- and bioactivity had anatase structure, about 90 m2/gspecific surface area, absorbed light over 400 nm and contained 1.64 at.% of silver (0.30 at.% of Ag0 and1.34 at.% of Ag2O) and about 13 at.% of carbon in the surface layer. The photocatalytic activity of the cata-lysts was estimated by measuring the decomposition rate of phenol in 0.21 mM aqueous solution undervisible and ultraviolet light irradiation. The bioactivity of silver-doped titanium dioxide nanocompositeswas estimated using bacteria Escherichia coli and Staphylococcus aureus, yeast Saccharomyces cerevisiaeand pathogenic fungi belonging to Candida family. All modified powders showed localized surface plas-mon resonance (LSPR) in visible region with almost the same position of LSPR peaks indicating that similarsizes of silver, regardless of used amount of Ag, is deposited on titania particles during microemulsionmethod. STEM microscopy revealed that almost 50% of observed silver nanoparticles deposited at theTiO2 surface are in the range from 5 to 10 nm.
© 2010 Elsevier B.V. All rights reserved.
1. Introduction
Silver-doped titanium dioxide nanoparticles became of currentinterests because of both their effects on the improvement of pho-tocatalytic activity of TiO2 and their effects on antibacterial activity.Noble metals deposited or doped with TiO2 have high Schottkybarriers among the metals and thus act as electron traps, facilitat-ing electron–hole separation and promote the interfacial electrontransfer process [1–2]. Silver can trap the excited electrons fromtitanium dioxide and leave the holes for the degradation reactionof organic species. It also results in the extension of their wave-length response towards the visible region [3]. In addition, silvernanoparticles possess the ability to absorb visible light, due to local-ized surface plasmon resonance (LSPR) [4]. These properties haveled to tremendous range of applications of Ag-TiO2 nanoparticles,for instance, antibacterial textiles, engineering materials, medi-
∗ Corresponding author. Tel.: +48 58 3472437; fax: +48 58 3472065.E-mail addresses: [email protected], [email protected] (A. Zaleska).
cal devices, food preparation surfaces, air conditioning filters andcoated sanitary wares.
The conventional method that has been applied to prepareAg-TiO2 nanoparticles is sol–gel process with chemical, thermalor photochemical reduction of silver ions. Several approaches toAg-TiO2 preparation have been proposed: one-step sol–gel route[5–9], photoreduction of Ag+ in TiO2 suspension [10] and by elec-trochemical deposition of Ag nanoparticles at the TiO2 surface[11]. Kawahara et al. [11] found that photochemically and elec-trochemically deposited silver exhibits multicolor photochromismin the nanoporous TiO2 film. The multicolor photochromism isnot generally observed for silver nanoparticles, because in thephoto-oxidation process the TiO2 matrix plays an important role.The photo-excited electrons on silver are transferred to oxygenmolecules via titanium dioxide and non-excited silver [11].
Tran et al. [12] stated that the presence of silver mainly enhancesthe photocatalytic oxidation of organic compounds that are pre-dominantly oxidized by holes, while it has not insignificant effecton those organic compounds that require hydroxyl radicals fortheir mineralization. They found that the enhancing effect of silver
1383-5866/$ – see front matter © 2010 Elsevier B.V. All rights reserved.doi:10.1016/j.seppur.2010.03.002

Author's personal copy
310 A. Zielinska et al. / Separation and Purification Technology 72 (2010) 309–318
deposits on TiO2 can initially by predicted by the molecular struc-ture of the substrate to be oxidized. The fewer C–H bonds and/ormore C O and C–O bonds a molecule possesses, the more probablethe enhancement of mineralization in the presence of silver.
Hamal and Klabunde [13] reported the synthesis and char-acterization of highly active (in visible light) new nanoparticlephotocatalysts based on silver, carbon and sulfur-doped TiO2 pre-pared by sol–gel route. They found that Ag/(C, S)-TiO2 nanoparticlephotocatalysts degrade the gaseous acetaldehyde 10 and 3 timesfaster than P25 TiO2 under visible and UV light, respectively [13].
Although the precipitation technique is easy, the morphologyand the size of the obtained Ag/TiO2 nanoparticles are diffi-cult to control, which results in unreliable properties in realapplications. Compared with these methods, the preparation ofsilver-doped titanium dioxide nanoparticles in w/o microemul-sion offers a unique microenvironment in which monodispersed,ultrafine Ag/TiO2 nanoparticles with a narrow size distributioncan be obtained. This method has obvious advantages of obtain-ing nanoparticles with specific diameter and morphology. Watermicrodroplets surrounded by a monolayer of surfactant in a con-tinuous hydrocarbon phase act as microreactors to synthesizenanoparticles whose growing is controlled inside the water dropletgiving rise to a narrow size distribution [14]. Inaba et al. [15]prepared titanium dioxide nanoparticles in a reverse micelle sys-tem composed of water, Triton X-100 and isooctane. The TiO2nanoparticles showed monodispersity, a large surface area and highdegrees of crystallinity and thermostability. The particle size ofTiO2 was controlled by changing the water content of the reversemicelle solution [15]. A reverse micelle system is also favorable forpreparation of nanosilver particles with narrow size distribution.Zhang et al. [14] reported that silver nanoparticles prepared in AOTmicroemulsion have a smaller average size and a narrower sizedistribution compared to the particles prepared by using cationicor nonionic surfactant in microemulsion system. In our previ-ous work we also studied the preparation of silver nanoparticlesin water/AOT/dodecane microemulsion [16]. We obtained stablemonodisperse silver nanoparticles with a narrow size distribu-tion. The diameter size of the silver nanoparticles was in the range5–10 nm [17]. Based on literature data, microemulsion appears asfavorable environment for nanoparticles preparation, but Ag-TiO2preparation in the microemulsion system has not been investi-gated.
The aim of this study was to investigate a reverse micelle sys-tem for Ag-TiO2 nanocomposites synthesis and to characterize theobtained nanoparticles. Here we report the preparation methodof silver-doped titanium dioxide nanoparticles in the water-in-oilmicroemulsion system of water/AOT/cyclohexane. Sodium bis-(2-ethylhexyl) sulfosuccinate (AOT), as the most common surfactantused to form reverse micelles, were chosen for our investigation.The effect of silver content used for preparation on the photocata-lyst structure, surface area, crystallinity, and efficiency of removalof model organic compound and model microorganisms from aque-ous phase were systematically investigated.
2. Experimental
2.1. Materials and instruments
Titanium isopropoxide (pure p.a.) was purchased from Aldrichand used as titanium source for the preparation of TiO2 nanoparti-cles. A commercial form of TiO2 (P25, ca. 80% anatase, 20% rutile)from Degussa was used for the comparison of the photocatalyticactivity. Silver nitrate (pure p.a.) was provided by POCh and used asthe starting material for the silver nanoparticles. Hydrazine anhy-drous and ascorbic acid (99%) were purchased from Aldrich and
used as reducing agents. Cyclohexane was used as the continuousoil phase, and sodium bis-(2-ethylhexyl) sulfosuccinate (AOT) pur-chased from Aldrich as the surfactant, and aqueous solution as thedispersed phase, without addition of any co-surfactant.
The crystal structures of the Ag-TiO2 nanoparticles were deter-mined from XRD pattern measured in the range of 2� = 20–80◦
using X-ray diffractometer (Xpert PRO-MPD, Philips) with Cu target(� = 1.542 Å). The XRD estimation of the crystallite size was basedon the Scherrer formula: d = 0.89�/(Be − Bt)cos �, where � is theX-ray wavelength, Be indicates the measured breadth of a peak pro-file, while Bt is the ideal, non-broadened breadth of a peak and �is the diffraction angle. The value of Bt was estimated on the basisof the measurements performed for a standard sample of polycrys-talline Si with large crystalline grains. The accuracy of the grain sizeanalysis has been estimated to be about 20%.
To characterize the light-absorption properties of modified pho-tocatalysts, diffuse reflectance (DR) spectra were recorded, and datawere converted to obtain absorption spectra. The measurementswere carried out on Jasco V-670 spectrophotometer equipped witha PIN-757 integrating sphere where the baseline was recordedusing a poly(tetrafluoroethylene) reference and bare titania pow-ders.
Nitrogen adsorption–desorption isotherms were recorded atliquid nitrogen temperature (77 K) on a Micromeritics Gemini V(model 2365) and the specific surface areas were determined bythe Brunauer–Emmett–Teller (BET) method.
The morphology of silver photodeposited onto titania wasobserved by Scanning Transmission Electron Microscopy (STEM,Hitachi, HD2000 ultrathin film evaluation system). Secondary elec-tron (SE), Z-contrast (ZC) and bright-field (BF) STEM were recorded.Ag/TiO2 powders were dispersed in ethanol in an ultrasound bathfor a few minutes. Some drops of suspension were deposited on car-bon covered microgrid. The images were acquired at wide rangeof magnification (200,000–180,000,000) in normal, high resolu-tion and ultra high resolution modes using 3 and 2 mm workingdistance, 200 kV accelerating voltage and 30 �A emission current.
All XPS spectra were recorded on a Physical Electronics PHI5000 Versa Probe scanning spectrometer using monochromatic AlKa X-rays working with power 25 W. X-ray beam was focused todiameter 100 �m, measured area was defined as 250 �m × 250 �m.The hemispherical electron energy analyzer was operated at a passenergy 23.50 eV for all high resolution measurements. All measure-ments were conducted with the use of a neutralizer working bothwith low energy electrons and low energy Ar+ ions. A PHI Multipaksoftware was used to evaluate the XPS data (Shirley type back-ground subtraction). For final calibration of spectra the peak Ti2p3/2of TiO2 support was used with BE values = 458.60 eV.
2.2. Preparation of Ag-doped TiO2 photocatalysts
Silver-doped titanium dioxide nanoparticles were preparedby adding titanium tetraisopropoxide (TIP) dropwise into themicroemulsion containing silver precursor in water cores [16].Water content was controlled by fixing the molar ratio of waterto surfactant (wo) at 2. Mixing was carried out for 2 h and then thesilver ions adsorbed on titanium dioxide were reduced to elementalsilver by dropwise addition microemulsion containing a reducingagent (hydrazine or ascorbic acid). During the precipitation nitro-gen was bubbled continuously through the suspension. The Ag/TiO2particles precipitated were separated in a centrifuge at 2000 rpmfor 2 min and were then washed with ethanol and deionized waterseveral times to remove the organic contaminants and surfactant.The particles were dried at 80 ◦C for 48 h and then calcinated at450 ◦C for 2 h. The schematic illustration of the preparation methodof silver-doped titanium dioxide nanoparticles in reverse micellesis presented in Fig. 1.

Author's personal copy
A. Zielinska et al. / Separation and Purification Technology 72 (2010) 309–318 311
Fig. 1. Schematic illustration of the Ag-TiO2 nanoparticles preparation method inAOT reverse micelles.
As reference samples, pure TiO2 and Degussa P25 loaded with6.5 mol.% of Ag were prepared. To evaluate the effect of microemul-sion method on titanium dioxide structure, pure TiO2 was obtainedby TIP hydrolysis in the microemulsion system followed by sepa-ration, washing, drying and calcination at 450 ◦C. Silver depositedat the surface of P25 TiO2 nanoparticles was obtained by mixingmicroemulsion containing P25 TiO2 and Ag ions with microemul-sion containing ascorbic acid in the N2 atmosphere. The obtainedphotocatalyst was separated, washed and dried at 80 ◦C for 48 hand then calcinated at 450 ◦C for 2 h.
2.3. Measurements of photocatalytic activity
The photocatalytic activity of Ag-TiO2 powders under UV andvisible light was estimated by measuring the decomposition rateof phenol (0.21 mmol/dm3) in an aqueous solution. Photocatalyticdegradation runs were preceded by blind tests in the absence ofa photocatalyst or illumination. Phenol was selected as a modelpollutant because it is a non-volatile and common contaminantpresent in industrial wastewaters. The mechanism of phenoldecomposition is also well established. 25 ml of phenol solutionat concentration of 2.1 × 10⁻⁴ M containing suspended photocat-alyst (125 mg) was stirred using a magnetic stirrer and aerated(5 dm3/h) prior and during the photocatalytic process. Aliquotsof 1.0 cm3 of the aqueous suspension were collected at regu-lar time periods during irradiation and filtered through syringefilters (Ø = 0.2 �m) to remove photocatalyst particles. Phenol con-centration was estimated by colorimetric method using UV–visspectrophotometer (DU-7, Beckman). The suspension was irradi-ated using 1000 W Xenon lamp (6271H, Oriel), which emits bothUV and vis light. The optical path included water filter and glassfilters (GG400 or UG1, Schott AG) to cut off IR and VIS or UV irradi-ation, respectively. GG glass filter transmitted light of wavelengthgreater than 400 nm, whereas UG in the range of 250–400 nm (max.
330 nm). The temperature during the experiments was maintainedat 10 ◦C.
2.4. Measurements of bioactivity (antibacterial and antifungal)
2.4.1. MIC (minimal inhibitory concentration)Antibacterial and antifungal activity was determined by the
serial twofold dilution microtiter plate method, in Tryptic Soy Brothmedium (TSB, GibcoBRL), for antibacterial activity determination orin YNBG medium (Yeast Nitrogen Base-glucose minimal medium,containing 0.67% YNB without amino acids and ammonium sul-phate with addition of 2% glucose and 5 g/l of ammonium sulphate,supplemented with uracil at 30 �g/l) for antifungal activity deter-mination. Wells containing serially diluted examined compounds(suspended Ag-TiO2) and compound-free controls were inoculatedwith overnight cultures of tested strains to the final concentra-tion of 104 cfu/ml (colony forming units per ml). The plates werethen incubated for 24 h at 37 ◦C (antibacterial activity determina-tion) or at 30 ◦C (antifungal activity determination). The microbialgrowth was quantified in each well by the measurement of an opti-cal density at � = 531 nm using the microplate reader (Victor3V,PerkinElmer, Centre of Excellence ChemBioFarm, Faculty of Chem-istry, Gdansk University of Technology). MIC (minimal inhibitoryconcentration) was defined as drug concentration at which atleast 80% decrease in turbidity, relative to that of the compound-free growth control well was found. The antimicrobial activityof silver-doped titanium dioxide nanocomposites was estimatedusing Escherichia coli ATCC 10536, Staphylococcus aureus ATCC 6538,Candida albicans ATCC 10231, Candida glabrata DSM 11226, Candidatropicalis KKP 334, Saccharomyces cerevisiae ATCC 9763, S. cerevisiaeJG and JG CDR1.
2.4.2. Zones of inhibitionThe solid YEPG (2% glucose, 1% yeast extract, 1% bacto-peptone,
2% agar, for fungi) or Tryptic Soy Agar (BTL, for bacteria) wereliquefied by warming at 100 ◦C and then chilled to 40 ◦C. The semi-liquid medium was inoculated with 3 × 10⁵ cells/ml of an overnightculture of microbial cells, poured into Petri plates and left for solid-ification. The Ag-TiO2 nanoparticles were suspended in dimethylsulfoxide (DMSO) to create a concentration of 4 mg/ml. 20 �l of thissuspension were spotted onto the agar medium surface (diameterof each spot ∼9 mm, three spots on each plate). The plates wereincubated for 24 h at 37◦ C (antibacterial activity determination)or at 30 ◦C (antifungal activity determination). Growth inhibitionzones appearing around the spots were measured.
3. Results and discussion
3.1. Photocatalytic activity of pure TiO2 and Ag-doped TiO2 underUV and visible light
The photocatalytic activity of the as-prepared nanocompositeswas studied by examining the reaction of phenol degradation. Nophenol was degraded in the absence of illumination indicatingthat there was no dark reaction at the surface of Ag-TiO2. Alsothe reference test in the absence of photocatalysts under visiblelight showed the lack of phenol degradation. Sample labeling, sil-ver amount and reducing agent used in the preparation procedure,as well as photocatalysts characteristics are given in Table 1. PureTiO2, prepared by the same microemulsion method without addingof Ag+ and reducing agent solutions, was used as a reference sam-ple. The efficiency of phenol degradation after 80 min illuminationby UV or visible light in the presence of pure TiO2 and Ag-dopedTiO2 are presented in Table 1 and Fig. 2.
Compared to pure TiO2, the TiO2 loaded with 4.5, 6.5 and8.5 mol.% of Ag exhibited a significant increase in the UV-driven

Author's personal copy
312 A. Zielinska et al. / Separation and Purification Technology 72 (2010) 309–318
Table 1Characteristics of pure TiO2 and TiO2 doped with 1.5–8.5 mol.% of silver prepared in w/o microemulsion.
Photocatalyst name Ag content(mol.%)
Reducing agent Sample color Phenol degradation rateconstant under UV(� < 400 nm)k (min−1)
Phenol degradation rateconstant under visible light(� > 400 nm)k (min−1)
BET surfacearea (m2/g)
Crystallitesize (nm)
Pure TiO2 0 None White 0.003 0.001 160 9Ag-TiO2 1.5% 1.5 Ascorbic acid Bright yellow 0.003 0.003 157 8.5Ag-TiO2 4.5% 4.5 Ascorbic acid Yellow 0.017 0.002 146 9.5Ag-TiO2 6.5% 6.5 Ascorbic acid Yellow 0.023 0.07 92 11Ag-TiO2 8.5% 8.5 Ascorbic acid Deep yellow 0.02 0.001 148 9Ag-TiO2 8.5% H 8.5 Hydrazine Yellow 0.015 0.003 158 8P25 Degussa 0 None White 0.018 0.001 59 20a
Ag-P25 6.5% 6.5 Ascorbic acid Violet 0.027 0.001 45 29
a Particle size provided by manufacturer.
phenol degradation rate as shown in Table 1 and Fig. 2a. The max-imum in the photocatalytic activity under UV light irradiation wasobserved for 6.5 mol.% Ag-doped TiO2. After 80 min of irradiationabout 86% of phenol was degraded. The efficiency decreased to76 and 81% for the Ag-TiO2 4.5% and Ag-TiO2 8.5% photocatalysts,respectively. The lowest photoactivity (32%) revealed undoped TiO2photocatalysts. The obtained results indicated that the rate of phe-nol decomposition in the presence of the sample Ag-TiO2 6.5% isfaster than those for commercial Degussa P25. Silver nanoparticlesdeposited on the titanium dioxide surface can acts as electron–holeseparation centers. This results in the formation of Shottky barrierat the metal-semiconductor contact region, which improves thecharge separation and thus enhances the photocatalytic activityof TiO2. In contrast, at the silver amount above its optimum, thesilver nanoparticles can also act as recombination centers, whichresults in decreasing the photocatalytic activity of TiO2 [18]. Sano
Fig. 2. Efficiency of phenol photodegradation in the presence of the TiO2 loadedwith 1.5–8.5 mol.% of silver and pure TiO2 as a reference sample: (a) in the presenceof ultraviolet radiation (400 > � > 250 nm), and (b) under visible light (� > 400 nm).Experimental conditions: Co = 0.21 mM, m (TiO2) = 125 mg, T = 10 ◦C, Qair = 5 l/h.
et al. [19] observed that the increase of silver amount resulted inAg aggregation leading to decrease in photoactivity.
The photodegradation efficiency under visible light increasedwith the increase in the silver loading up to 6.5 mol.% and thendecreased. The rate constant value increased with the increase insilver loading up to 6.5 mol.% and then decreased (see Fig. 3). Thus,it was observed that optimum silver loading for this preparationmethod was 6.5 mol.%.
According to the literature data, the fade of the photoreactionrate at higher metal loading can be accounted for the so-called“screening effect” previously described for Pt/TiO2, Ru/TiO2 andCu/TiO2 systems used for photocatalytic hydrogen production fromwater (the deposited silver makes part of the photocatalyst surfaceless accessible for photons) [20].
Our results are in good agreement with others. Seery et al. [21]observed 6–50% improvement in visible light photocatalytic degra-dation of model dye (rhodamine 6G) in the presence of Ag-TiO2prepared by photocatalytic reduction of Ag at the TiO2 surfaceand by direct calcination of sol–gel material. The rate of degrada-tion of a model dye increased from 0.06 min−1 for pure TiO2 to0.34 min−1 for 5 mol.% Ag-TiO2. It was attributed to the increasingvisible absorption capacity due to the presence of silver nanopar-ticles [21]. Dobosz and Sobczynski [22] and Liu et al. [23] bothreported silver deposits improved efficiency of anatase up to 300%for the UV-enhanced photocatalytic oxidation of phenol at silverloadings of 0.5 and 1 wt.%, respectively. Dobosz and Sobczynski [22]found that optimum silver loading amounted to 0.5 wt.%. However,even at low silver deposition (0.06 wt.%) the influence of the metaladdition on the initial photoreaction yield is very high – the reactionproceeded more than 2 times faster. For the optimum Ag loading,the rate rises as much as 3.6 times [19]. Xin et al. [24] found that theAg-TiO2 photocatalysts with appropriate content of Ag (Ag speciesconcentration is from about 3 to 5 mol.%) possess abundant elec-
Fig. 3. DR spectra of Ag-TiO2 samples loaded with 1.5–6.5 mol.% of silver.

Author's personal copy
A. Zielinska et al. / Separation and Purification Technology 72 (2010) 309–318 313
Fig. 4. XRD patterns of silver-doped titanium dioxide nanoparticles.
tron traps and favor the transfer of the electrons to surface Ag0.As a result, the recombination of photoinduced charge carriers caneffectively be inhibited.
3.2. Absorption properties
As a result of modification of titania with silver, Ag/TiO2 powdersof different colors and different color brightness were obtained, asshown in Table 1. The samples prepared by TIP hydrolysis followedby silver deposition in microemulsion system occurred from brightto deep yellow color, depending on silver content. The sample pre-pared by silver deposition at P25 TiO2 was violet. Thus, all modifiedpowders showed LSPR in visible region what has been a typical phe-nomenon of nanoparticles of noble metals and exemplary spectraare shown in Fig. 3. It is thought that LSPR peak at 380–390 nmin each absorption spectrum is superimposed on light-scatteringinducing no photochemical reactions as was recently shown byaction spectrum analysis for Au-TiO2 system [25]. It is also knownthat LSPR can be tuned from the near-UV through the visible regionand even into the mid-IR by changing the size and shape of thenanoparticles [25–27]. In this regard, almost the same position ofLSPR peaks of as-prepared Ag-TiO2 indicated that the similar sizeof silver, regardless of used amount of Ag, is deposited at the TiO2particles during the microemulsion method.
For the sample Ag-P25 6.5%, the violet color of the sample anda very wide LSPR peak (spectrum not shown here) with maximumat 650 nm indicated that larger and/or non-spherical Ag nanopar-
Fig. 5. Comparison of XRD patterns for TiO2 loaded with 6.5 mol.% of Ag: preparedby simultaneous TTIP hydrolysis and Ag+ ions reduction in microemulsion system(sample Ag-TiO2 6.5%) and by Ag+ ion reduction in the presence of P25 TiO2 in themicroemulsion system (sample Ag-TiO2 6.5% Degussa P25).
ticles [25–32] are formed at the surface of P-25 by reduction inthe microemulsion system. The LSPR peak shift, from 400 through500–600 nm after the change of nanoparticles shape from spheresthrough pentagons to triangles [30] and from 400 to 560 nm result-ing from Ag nanoparticles coalescence from 10 to 20–36 nm broadhas been already reported.
Sung-Suh et al. [33] reported characteristics of Ag-TiO2 obtainedby sol–gel method using TIP and AgNO3 as a TiO2 and silver pre-cursors, respectively. They found that Ag deposits size varied withthe Ag content in the TiO2 nanosol. For the 2 at.% Ag-TiO2 sample,Ag deposits were well dispersed on the TiO2 particles with an aver-age particle size of 2–4 nm. At higher silver contents, formationof large Ag particles (>100 nm) was observed. Thus, microemul-sion system seems favorable for the formation of small Ag particleswith narrower size distribution independent on silver content inthe reaction system.
3.3. XRD analysis
Fig. 4 shows the XRD pattern of pure and doped TiO2 pow-ders loaded with different amount of silver. Peaks marked “A” and“R” correspond to anatase and rutile phases, respectively. Bothcrystalline structures (anatase and rutile) appear for pure TiO2 pre-pared by microemulsion method followed by calcination at 450 ◦C.Our previous investigation indicated that hydrolysis of titanium(IV) isopropoxide, followed by drying at 80 ◦C and calcination at350–550 ◦C, led to well defined, broad, diffraction peaks corre-sponding only to the anatase phase [34]. Thus, the microemulsionmethod affected the crystal structure of obtained TiO2 – a slightamount of rutile phase appeared for lower calcination temperature.
The major phase of all the prepared Ag-TiO2 is an anatase,regardless of the Ag content. Thus, doping with silver promote theformation of the anatase in preference to rutile. It is well acceptedthat the concentration of oxygen vacancies strongly influences therate of the anatase to rutile transformation [10,35].
The XRD spectra of the Ag-TiO2 microemulsion, using TIP as TiO2precursor, do not show any additional diffraction peak due to silverspecies. The intensity of the mean silver peak at 37.5◦ can be maskedby the TiO2 layer, but we did not observe second silver peak at 44◦
either. Fig. 5 presents the XRD pattern of TiO2 doped by 6.5 mol.% ofAg prepared by two methods: (1) TIP hydrolysis and subsequent Agions reduction in microemulsion system, and (2) silver reduction inthe microemulsion system at the surface of P25 Degussa TiO2 (sam-ple labeled as Ag-P25 6.5%). P25 Degussa TiO2 particle size is largerthan particle size of TiO2 prepared by the microemulsion method.Thus, XRD peaks of TiO2 are narrower and thus detection of silvernanoparticles (probably larger than in the case of microemulsionsystem as was discussed previously according to violet color andLSPR shift towards longer wavelengths) can be much easier.
The crystallite sizes determined from the XRD pattern of theas-prepared photocatalysts are given in Table 1. The average sizeof anatase crystallites – for Ag-TiO2 prepared by microemulsionmethod – was between 8.5 and 11 nm. Thus, for a suitable amountof silver (ca. 2–6 mol.%), the grain size was reduced resulting in theincrease of the TiO2 surface area. For sample Ag-P25 6.5% (obtainedby Ag deposition at the surface of P25) the average crystalline sizewas around 29 nm.
3.4. BET surface area and microscopy analysis
Table 1 presents the surface morphological characterizationresults for the pure and silver-doped TiO2. It can be seen that corre-sponding to crystalline size decreasing, the specific surface area ofAg-doped TiO2 increases. The surface area and average crystallinesize for pure TiO2 are 160 m2/g and 9 nm, respectively. Sample mod-ified with 6.5 mol.% of Ag has the lowest BET surface area of about
Author's personal copy
314 A. Zielinska et al. / Separation and Purification Technology 72 (2010) 309–318
90 m2/g and the highest average crystalline size of about 11 nm.For other Ag-TiO2 samples containing from 1.5 to 8.5 mol.% of Ag,the surface area varied from 146 to 157 m2/g (see Table 1). Thus,except the sample Ag-TiO2 6.5%, the surface area of pure TiO2 andAg-doped TiO2 obtained by microemulsion method is very similar.Thus, Ag addition, only slightly affects the surface area of powdersamples obtained by microemulsion system. Additionally, the sur-face area for as-prepared Ag-TiO2 is higher than that of the TiO2P25 and than reported by others. Chao et al. [7] reported decreaseof the BET surface area for increasing Ag concentration used insol–gel method. The surface areas of doped TiO2 powders increased,being 76, 63, and 58 m2/g, respectively for TiO2 powders with 2, 4and 6 mol.% Ag doped with respect to that of 45 m2/g for the pureTiO2 powder [7]. Hamal and Klabunde [13] described Ag(S,C)-TiO2photocatalysts prepared by TIP hydrolysis in the presence of appro-priate precursors (AgNO3 and ammonium thiocyanate or thiourea)followed by calcination at 500 ◦C. The surface area of Ag(S,C)-TiO2was 86 and 71 m2/g for the sample prepared by TIP hydrolysis in thepresence of AgNO3/ammonium thiocyanate and AgNO3/thiourea,respectively.
Relations between photoactivity in Vis and UV region versusBET surface area are shown in Table 1. The obtained results indi-cated that rather other parameters, such as silver presence, causetheir enhancement in photoactivity than the surface area. The sam-ple with lower surface area, but containing the optimum amountof silver, revealed the highest photoactivity. However, it is knownfrom the literature that for visible irradiation, the surface area andparticle size of titania are not as crucial as the size of noble metal,as was already shown for Au-TiO2 composites [25].
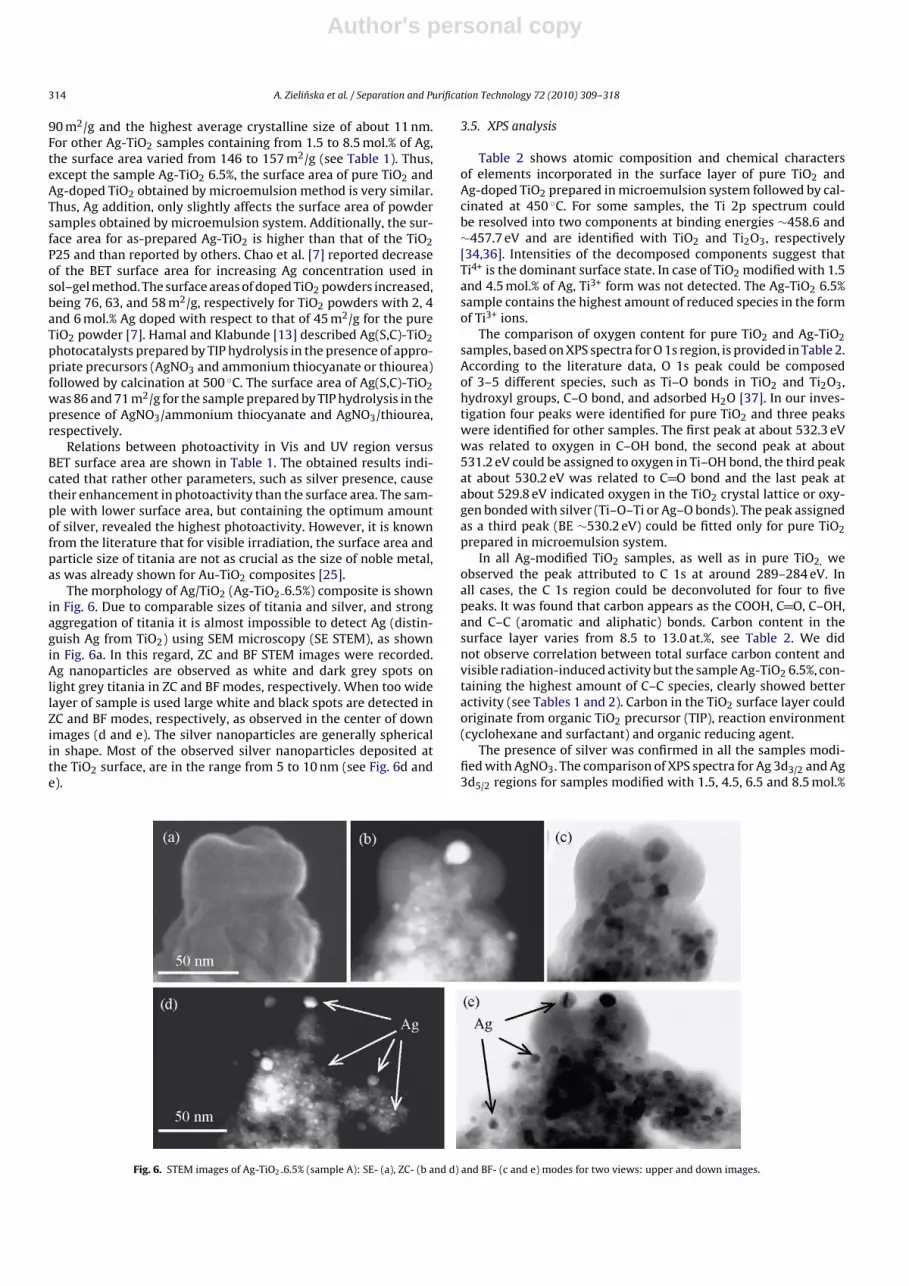
The morphology of Ag/TiO2 (Ag-TiO2 6.5%) composite is shownin Fig. 6. Due to comparable sizes of titania and silver, and strongaggregation of titania it is almost impossible to detect Ag (distin-guish Ag from TiO2) using SEM microscopy (SE STEM), as shownin Fig. 6a. In this regard, ZC and BF STEM images were recorded.Ag nanoparticles are observed as white and dark grey spots onlight grey titania in ZC and BF modes, respectively. When too widelayer of sample is used large white and black spots are detected inZC and BF modes, respectively, as observed in the center of downimages (d and e). The silver nanoparticles are generally sphericalin shape. Most of the observed silver nanoparticles deposited atthe TiO2 surface, are in the range from 5 to 10 nm (see Fig. 6d ande).
3.5. XPS analysis
Table 2 shows atomic composition and chemical charactersof elements incorporated in the surface layer of pure TiO2 andAg-doped TiO2 prepared in microemulsion system followed by cal-cinated at 450 ◦C. For some samples, the Ti 2p spectrum couldbe resolved into two components at binding energies ∼458.6 and∼457.7 eV and are identified with TiO2 and Ti2O3, respectively[34,36]. Intensities of the decomposed components suggest thatTi4+ is the dominant surface state. In case of TiO2 modified with 1.5and 4.5 mol.% of Ag, Ti3+ form was not detected. The Ag-TiO2 6.5%sample contains the highest amount of reduced species in the formof Ti3+ ions.
The comparison of oxygen content for pure TiO2 and Ag-TiO2samples, based on XPS spectra for O 1s region, is provided in Table 2.According to the literature data, O 1s peak could be composedof 3–5 different species, such as Ti–O bonds in TiO2 and Ti2O3,hydroxyl groups, C–O bond, and adsorbed H2O [37]. In our inves-tigation four peaks were identified for pure TiO2 and three peakswere identified for other samples. The first peak at about 532.3 eVwas related to oxygen in C–OH bond, the second peak at about531.2 eV could be assigned to oxygen in Ti–OH bond, the third peakat about 530.2 eV was related to C O bond and the last peak atabout 529.8 eV indicated oxygen in the TiO2 crystal lattice or oxy-gen bonded with silver (Ti–O–Ti or Ag–O bonds). The peak assignedas a third peak (BE ∼530.2 eV) could be fitted only for pure TiO2prepared in microemulsion system.
In all Ag-modified TiO2 samples, as well as in pure TiO2, weobserved the peak attributed to C 1s at around 289–284 eV. Inall cases, the C 1s region could be deconvoluted for four to fivepeaks. It was found that carbon appears as the COOH, C O, C–OH,and C–C (aromatic and aliphatic) bonds. Carbon content in thesurface layer varies from 8.5 to 13.0 at.%, see Table 2. We didnot observe correlation between total surface carbon content andvisible radiation-induced activity but the sample Ag-TiO2 6.5%, con-taining the highest amount of C–C species, clearly showed betteractivity (see Tables 1 and 2). Carbon in the TiO2 surface layer couldoriginate from organic TiO2 precursor (TIP), reaction environment(cyclohexane and surfactant) and organic reducing agent.
The presence of silver was confirmed in all the samples modi-fied with AgNO3. The comparison of XPS spectra for Ag 3d3/2 and Ag3d5/2 regions for samples modified with 1.5, 4.5, 6.5 and 8.5 mol.%
Fig. 6. STEM images of Ag-TiO2 6.5% (sample A): SE- (a), ZC- (b and d) and BF- (c and e) modes for two views: upper and down images.

Author's personal copy
A. Zielinska et al. / Separation and Purification Technology 72 (2010) 309–318 315
Tab
le2
Ato
mic
com
pos
itio
nof
Ag-
TiO
2p
hot
ocat
alys
ts.
Sam
ple
nam
eTi
con
ten
t(a
t.%
)O
con
ten
t(a
t.%
)A
gco
nte
nt
(at.
%)
Cco
nte
nt
(at.
%)
�Ti
Ti4+
(458
.6eV
)Ti
3+
(357
.7eV
)�
OC
–OH
(532
.3eV
)Ti
–OH
,CO
(531
.2eV
)C
O(5
30.2
eV)
Ti–O
–Ti,
Ag–
O(5
29.8
eV)
�A
gA
g–A
g(3
68.3
eV)
Ag 2
O(3
67.6
eV)
AgO
(367
.05
eV)
�C
–CO
OH
–CO
3(2
88.6
eV)
CO
(286
.8eV
)C
–OH
(286
.0eV
)C
–C(2
84.8
284.
1eV
)
Pure
TiO
215
.92
15.4
40.
4873
.43
3.52
7.07
12.9
949
.85
00
00
10.6
51.
172.
123.
473.
89A
g-Ti
O2
1.5%
22.8
122
.81
067
.84.
236.
70
56.8
70.
470.
10.
330.
048.
911.
130
1.66
6.12
Ag-
TiO
24.
5%25
.92
25.9
20
64.6
43.
347.
990
53.3
10.
970.
170.
710.
098.
470.
750
1.69
6.03
Ag-
TiO
26.
5%25
.33
24.2
81.
0560
.03
3.05
70
49.9
81.
640.
301.
340
13.0
0.79
0.46
1.59
10.1
6A
g-Ti
O2
8.5%
H20
.920
.01
0.8
64.5
92.
446.
40
55.7
51.
740.
311.
430
12.7
81.
50
2.43
8.85
of Ag are provided in Fig. 7. The XPS spectra of Ag 3d indicated thatthere are two or three components after deconvolution, attributedto Ag0 (368.3 eV), Ag2O (367.6 eV) and AgO (367.05 eV). The silvercontent in the surface layer increased with the increasing amountof silver precursor used during preparation procedure and differedfrom 0.47 to 1.74 at.%. However, increase from 6.5 to 8.5 wt.% ofAg+ ions in the reaction environment during preparation, did notaffect the final silver loading at the TiO2 surface. Surface contentof silver equaled to 1.64 and 1.74 at.% for TiO2 6.5% and Ag-TiO28.5% H, respectively. 0.3 at.% of surface silver was in the form ofAg0 for both samples. Thus, it was not too surprising that photoac-tivity of both samples is very similar. After 60 min UV irradiation,phenol was degraded in 85 and 80% for sample Ag-TiO2 6.5% andAg-TiO2 8.5% H, respectively. Fig. 7 and Table 2 show that for lowerconcentration, Ag species exist as Ag0, Ag2O and AgO, while athigh concentration only Ag0and Ag2O coexist at the surface andthe amount of Ag0 species increased to 0.3 at.%. Our observationsare in good agreement with others. The presence of Ag0, Ag2O andAgO at the TiO2 surface was reported by others. XPS analysis forAg-TiO2 prepared by sol–gel method by Xin et al. [24], confirmedthe presence of three peaks for binding energy 367.0, 367.7 and368.2 eV, attributed to AgO, Ag2O and Ag0, respectively. It was alsofound that during photodecomposition of N2O under UV irradia-tion on Ag-TiO2 with different Ag0 and Ag+ composition, metallicAg played crucial role in electron transfer from titania [22].
3.6. Antimicrobial susceptibility testing method (MIC)
It has been well known that silver possesses strong antibacterialactivities both as Ag nanoparticles and Ag ions. The impact of Agon microorganism is related to generation of Ag complexes withbiomolecules containing sulfur, oxygen and nitrogen such as thiols,carboxylates, amides, imidazols, indoles, and hydroxyls [38].
Determining the MIC values of antibacterial agents is a valu-able means for comparing the antibacterial effectiveness of theagents. The MIC values were the lowest concentration of Ag-TiO2 inaqueous solution that inhibited visual growth after 24 h of incuba-tion. Thus, lower MIC value means higher bioactivity. The minimalinhibitory concentration of microorganism growth for as-preparedAg-TiO2 nanocomposites was estimated using bacteria E. coli andS. aureus, yeast S. cerevisiae and pathogenic fungi belonging to Can-dida family. The effect of silver loading on MIC value is presentedin Table 3. For pure TiO2 and TiO2 loaded with 1.5 mol.% of Ag, theinhibition in microorganisms growth was not observed even forphotocatalyst concentration below 500 �g/ml. The increase in sil-ver content to 8.5 mol.% caused decreasing of the MIC value relatedto bioactivity enhancement. The minimal inhibition concentrationdiffered from 6 to 62 �g/ml, depending on microbial strain and Agconcentration (see Table 3).
What was surprising, for two photocatalysts loaded with8.5 mol.% of Ag prepared by using a different reducing agent (e.g.ascorbic acid and hydrazine), high difference in MIC was observed.The sample prepared by using hydrazine as a reducing agent (Ag-TiO2 8.5% H) had much lower bioactivity than the sample preparedwith ascorbic acid. The application of hydrazine, stronger reduc-ing agent than ascorbic acid could lead to formation of silver withlarger size particles, different silver distribution at the TiO2 surfacethan in the case of ascorbic acid resulting in a lower active surfaceand lower bioactivity.
The lower MIC value (the highest bioactivity) was observed forS. cerevisiae ATCC 9763, S. cerevisiae JG and JG CDR1 in the presenceof Ag-TiO2 6.5% sample. It was noticed that silver nanoparticlesrevealed higher antimicrobial activity against gram-negative bac-teria E. coli than for gram-positive bacteria S. aureus. These resultswere in good agreement with Kim et al. investigation [39]. Theyhave studied antimicrobial activity of silver nanoparticles obtained

Author's personal copy
316 A. Zielinska et al. / Separation and Purification Technology 72 (2010) 309–318
Fig. 7. Ag 3d XPS spectra for: (a) sample Ag-TiO2 1.5%, (b) sample Ag-TiO2 4.5%, (c) sample Ag-TiO2 6.5%, and (d) sample Ag-TiO2 8.5% H.
Table 3Minimum inhibitory concentration (MIC) of Ag-doped TiO2 for microbial growth (bacteria and fungi). MIC values were determined in the YNBG or TSB medium by a serialdilution method.
Microbial strains MIC (�g/ml)
Pure TiO2 TiO2 1.5% TiO2 4.5% TiO2 6.5% TiO2 8.5% TiO2 8.5% H
YeastCandida albicans ATCC 10231
>500 >500
31 8 16 500Candida glabrata DSM 11226 31 62 16 250Candida tropicalis KKP 334 16 62 16 250Saccharomyces cerevisiae ATCC 9763 31 8 16 250Saccharomyces cerevisiae JG 16 8 16 250Saccharomyces cerevisiae JG CDR1 16 8 16 250BacteriaEscherichia coli ATCC 10536 31 31 16 31Staphylococcus aureus ATCC 6538 62 31 31 62
Table 4Zone of microorganism’s growth inhibition for Ag-TiO2 nanoparticles.
Microbial Community Zone of inhibition for Ag-TiO2 nanoparticles, diameter of zone (mm)
Pure TiO2 TiO2 1.5% TiO2 4.5% TiO2 6.5% TiO2 8.5% TiO2 8.5% H DMSO
Candida albicans ATCC 10231 – 11 12 13 11 10 –Candida glabrata DSM 11226 – 13 14 15 15 11 –Candida tropicalis KKP 334 – 11 14 15 15 14 –Saccharomyces cerevisiae ATCC 9763 – 12 13 18 13 10 –Saccharomyces cerevisiae JG – 13 14 17 15 10 –Saccharomyces cerevisiae JG CDR1 – 14 14 17 15 10 –Escherichia coli ATCC 10536 – 20 14 15 20 12 –Staphylococcus aureus ATCC 6538 – 15 19 16 19 11 –
Author's personal copy
A. Zielinska et al. / Separation and Purification Technology 72 (2010) 309–318 317
Fig. 8. Zone of inhibition for pure TiO2 and Ag-TiO2 nanoparticles, (1) sample Ag-TiO2 6.5%; (2) sample Ag-TiO2 8.5%; (3) sample Ag-TiO2 4.5%; (4) sample Ag-TiO2
1.5% and (7) pure TiO2.
in aqueous solution. They found that the growth of E. coli bacteriawere inhibited at the low concentration of Ag nanoparticles (>3 nMAg), whereas the growth-inhibitory effects on S. aureus were mild(>33 nM Ag). The antimicrobial effects of Ag-TiO2 nanoparticlesmay be associated with characteristics of certain bacterial species.Gram-positive and gram-negative bacteria have differences in theirmembrane structure, the most distinctive of which is the thick-ness of the peptidoglycan layer. We think that lower efficiency ofthe Ag nanoparticles against S. aureus may derive from the differ-ence as a point of membrane structure. To confirm this hypothesis,further comparative study between various gram-negative andgram-positive bacteria species is needed.
Based on the zone of inhibition analysis, shown in Table 4, itwas observed that the Ag-TiO2 particles inhibited the growth ofbacteria and yeast. Photocatalyst which exhibited best bioactivitywas prepared with 6.5 mol.% of silver. The zone ratios for the Ag-TiO2 particles containing different silver amount in the range from4.5 to 8.5 mol.% were quite comparable. The images of the zone ofgrowth inhibition for S. cerevisiae and E. coli are shown in Fig. 8. TheAg-TiO2 and pure TiO2 nanoparticles are well visible as white spotslabeled as: (1) sample Ag-TiO2 6.5%; (2) sample Ag-TiO2 8.5%; (3)sample Ag-TiO2 4.5%; (4) Ag-TiO2 1.5% and (7) pure TiO2. Growthinhibition zones appearing around the spots were lined for easierdetection (see Fig. 8).
Liu et al. [40] studied silver-coated TiO2 nanoparticles preparedthrough the photoreduction of Ag+ as an antibacterial agent againstE. coli and S. aureus. The antibacterial effectiveness of the Ag-TiO2was evaluated through the determination of the minimal inhibitoryconcentration (MIC) of AgTiO2 for each species of bacteria. The MICvalues for the Ag-TiO2, on both E. coli and S. aureus, were muchlower than the MIC values for Ag metal, and quite comparableto the MIC values for AgNO3. A disc diffusion/antibiotic sensitiv-ity test was also performed using the Ag/TiO2 particles and theresults compared with the results obtained for Ag metal, AgNO3and common antibacterial agents; tetracycline, chloramphenicol,erythromycin, and neomycin. The zone of inhibition diameters forthe Ag-TiO2 particles were found to be comparable with those ofthe other antimicrobial agents [41].
3.7. Discussion
Sample Ag-TiO2 6.5% which exhibited best bio- and photoac-tivity contains about 25.3 at.% of Ti, 64.4 at.% of O, 1.6 at.% of Agand 13.0 at.% of C atoms. This sample, compared to other sam-ples, has higher amount of Ti3+ ions (∼1 at.%), silver in Ag0 form(∼0.3 at.%) and carbon (∼13 at.%). Thus, photoactivity of this sam-
Fig. 9. Photodegradation systems for polluted water and air streams: (a) Ag/TiO2-based porous ceramic filter for polluted water/air treatment; and (b) bacteriaand volatile organic compounds (VOC) sorption and degradation on an irradiatedAg/TiO2 film.
ple could result both from the presence of silver, as well as, fromthe presence of surface carbon working as a sensitizer and thepresence of oxygen vacancies (Ti3+ species). The Ag nanoparticlesdeposited on the surface of TiO2 could enhance pollutants degra-dation through: (1) enhancing the electron–hole separation andthe subsequent transfer of the trapped electron to the adsorbedO2 acting as an electron acceptor, (2) extending the light absorp-tion into the visible range and enhance surface electron excitationby plasmon resonance excited by visible light and (3) by modi-fication of the surface properties of a photocatalyst [1,33,42–43].According to the literature, incorporation of carbonaceous species(C–C) occur in highly condensed and coke-like structure, so it couldplay the role of sensitizer to induce the visible light absorptionand response [44–45]. It was found that oxygen vacancy sites (Ti3+
sites) promote trapping of holes in the surface region leading toa more efficient charge transfer process. Adsorbed oxygen on theTiO2 surface scavenges the electrons generating superoxide anionswhich undergo oxidize organic compounds [46–47]. It was alsoreported that photo emission from Ag deposited on highly reducedtitania surface (Ti+3) leaded to generation of electron–hole pairsat the metal-oxide interface [48]. While, on weekly reduced TiO2,emission from Ag particles showed characteristics of radiating Mie-plasmon with no electron–hole pair generation.
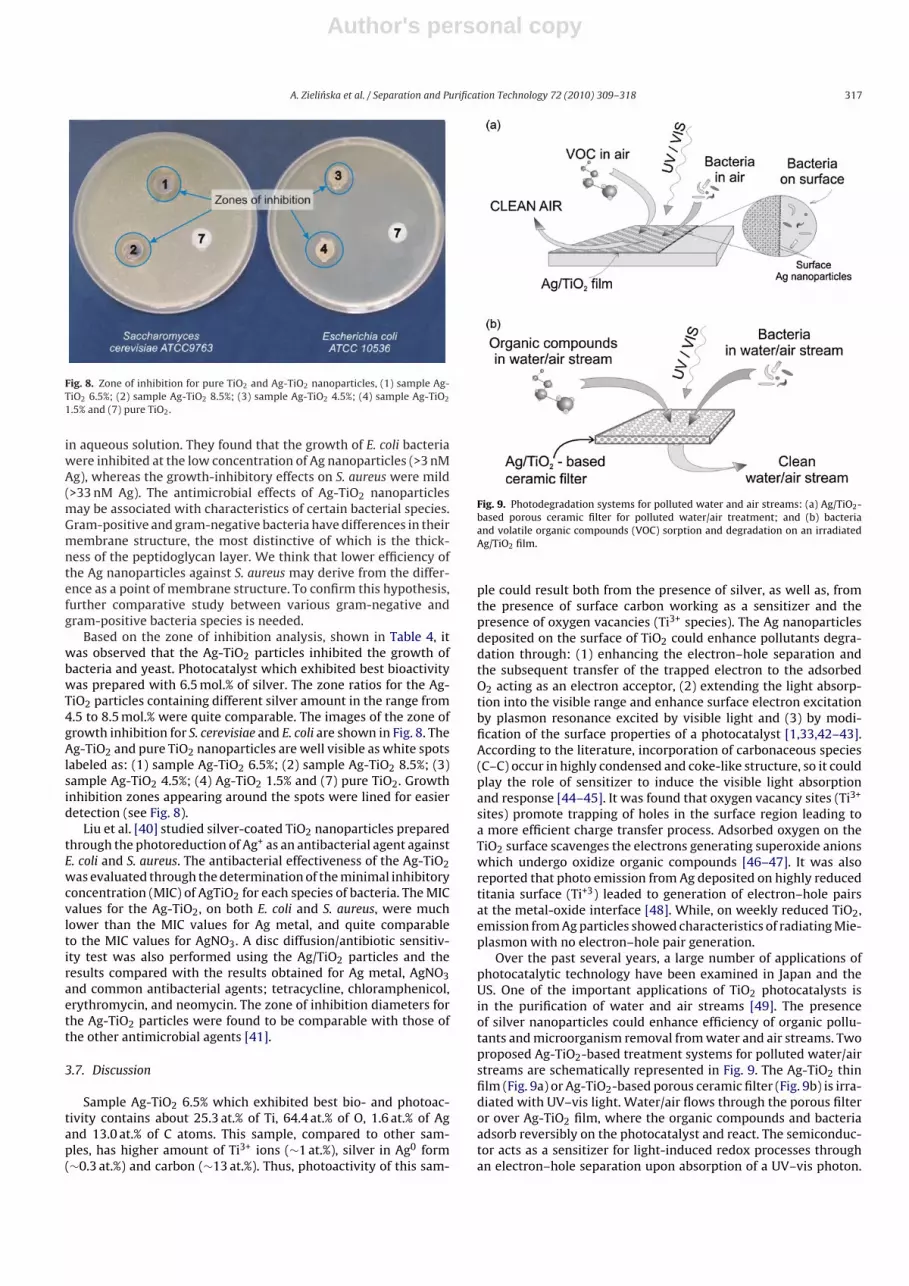
Over the past several years, a large number of applications ofphotocatalytic technology have been examined in Japan and theUS. One of the important applications of TiO2 photocatalysts isin the purification of water and air streams [49]. The presenceof silver nanoparticles could enhance efficiency of organic pollu-tants and microorganism removal from water and air streams. Twoproposed Ag-TiO2-based treatment systems for polluted water/airstreams are schematically represented in Fig. 9. The Ag-TiO2 thinfilm (Fig. 9a) or Ag-TiO2-based porous ceramic filter (Fig. 9b) is irra-diated with UV–vis light. Water/air flows through the porous filteror over Ag-TiO2 film, where the organic compounds and bacteriaadsorb reversibly on the photocatalyst and react. The semiconduc-tor acts as a sensitizer for light-induced redox processes throughan electron–hole separation upon absorption of a UV–vis photon.

Author's personal copy
318 A. Zielinska et al. / Separation and Purification Technology 72 (2010) 309–318
Excited-state electrons and holes can recombine, remain trapped inmetastable surface states or react with electron donors and accep-tors adsorbed on the TiO2 surface. The latter process initiates aseries of oxidation steps conducing to the production of interme-diate organic species and final inorganic products such as CO2 andwater. Surface available Ag nanoparticles induce the destruction ofpathogenic microorganisms. Thus, Ag-TiO2 nanoparticles appliedin air conditioning filters could purify and deodorize the interiorfrom volatile organic compounds, which are major air pollutants,emitted largely by industry, transportation, households and alsofrom pathogenic microorganisms. Application of Ag-TiO2-basedwater/air filters in hospitals, care facilities, public and commer-cial facilities and schools could reduce the spread of infections andimprove the hygienic conditions.
4. Conclusions
The Ag-TiO2 nanoparticles have been prepared using a water-in-oil microemulsion system of water/AOT/cyclohexane. It was foundthat microemulsion method allowed obtaining Ag-TiO2 nanoparti-cles with narrow Ag particle size distribution regardless Ag contentin the reaction system. XRD and the BET measurements corrobo-rate that these doped materials are made up of the homogeneousanatase crystalline phase and have high surface areas fluctuatingfrom 92 to 158 m2/g depending on silver amount. It was found thatoptimum silver loading for microemulsion method amounted to6.5 mol.% of AgNO3 used during preparation. This sample, com-pared to other samples, has higher amount of Ti3+ ions (∼1 at.%),silver in Ag0 form (∼0.3 at.%) and carbon (∼13 at.%). Thus, pho-toactivity probably resulted from the presence of silver (due toenhancing the electron–hole separation and surface plasmon reso-nance) and the presence of surface carbon working as a sensitizer.
The antimicrobial susceptibility was tested using bacteria E. coliand S. aureus, yeast S. cerevisiae and pathogenic fungi belongingto Candida family. The obtained results showed that bioactivity ofAg-TiO2 differed depending on microbial strain, Ag content and areducing agent applied during preparation. This study suggestedthat silver-doped titanium dioxide nanoparticles can be used aseffective growth inhibitors in various microorganisms.
Acknowledgments
This research was financially supported by Polish Ministry ofScience and Higher Education (grant no. N N523 487634), KAK-ENHI (Grant-in-Aid for Scientific Research) on Priority Area “StrongPhoton-Molecule Coupling Fields” (No. 470) and the Global Centerof Excellence (GCOE) Program “Catalysis as the Basis for Innovationin Material Science” from the Ministry of Education, Culture, Sports,Science and Technology (MEXT) of Japan. STEM analyses of sampleswere supported by Hokkaido Innovation through NanotechnologySupport (HINTS) of the Ministry of Education, Science, Culture andSports of Japan. E.K. acknowledges the European Commission forMarie Curie FP7-Reintegration Grant (IRG) FP7-248666.
References
[1] J. Herrmann, J. Disdier, P. Pichat, J. Phys. Chem. 90 (1986) 6028–6034.[2] B. Ohtani, K. Iwai, S. Nishimoto, S. Sato, J. Phys. Chem. B 101 (1997) 3349–3359.
[3] V. Iliev, D. Tomova, L. Bilyarska, A. Eliyas, L. Petrov, Appl. Catal. B 63 (2006)266–271.
[4] N. Halas, MRS Bull. 30 (2005) 362–367.[5] X. Yang, L. Xu, X. Yu, Y. Guo, Catal. Commun. 9 (2008) 1124–1129.[6] H. Zhang, G. Chen, Environ. Sci. Technol. 43 (2009) 2905–2910.[7] H.E. Chao, Y.U. Yun, H.U. Xingfang, A. Larbot, J. Eur. Ceram. Soc. 23 (2003)
1457–1464.[8] O. Akhavan, J. Colloid Interface Sci. 336 (2009) 117–124.[9] U.G. Akpan, B.H. Hameed, Appl. Catal. A 375 (2010) 1–11.
[10] Y. Yonezawa, N. Kometani, T. Sakaue, A. Yano, J. Photochem. Photobiol. A 171(2005) 1–8.
[11] K. Kawahara, K. Suzuki, Y. Ohko, T. Tatsuma, Phys. Chem. Chem. Phys. 7 (2005)3851–3855.
[12] H. Tran, K. Chiang, J. Scott, R. Amal, Photochem. Photobiol. Sci. 4 (2005) 565–567.
[13] D.B. Hamal, K.J. Klabunde, J. Colloid Interface Sci. 311 (2007) 514–522.
[14] W. Zhang, X. Qiao, J. Chen, Mat. Sci. Eng. B 142 (2007) 1–15.[15] R. Inaba, T. Fukahori, M. Hamamoto, T. Ohno, J. Mol. Catal. A: Chem. 260 (2006)
247–254.[16] A. Zaleska, A. Zielinska, J. Hupka, Pat. Appl. (2008) P385451.[17] A. Zielinska, A. Zaleska, J. Hupka, Proceedings. Surfactance and dispersed system
in theory and practice, in: International Scientific Conference, Ksiaz, Poland,22–24 May, 2007, pp. 521–524.
[18] A. Sclafani, M.N. Mozzanega, P. Pichat, J. Photochem. Photobiol. A 59 (1991)181–189.
[19] T. Sano, N. Negishi, D. Mas, K. Takeuchi, J. Catal. 194 (2000) 71–79.[20] A. Sobczynski, J. Mol. Catal. 39 (1987) 43–53.[21] M.K. Seery, G. Reenamole, P. Floris, S.C. Pillai, J. Photochem. Photobiol. Chem.
189 (2007) 258–263.[22] A. Dobosz, A. Sobczynski, Water Res. 37 (2003) 1489–1496.[23] S.X. Liu, Z.P. Qu, X.W. Han, C.L. Sun, Catal. Today 93–95 (2004) 877–884.[24] B. Xin, L. Jing, Z. Ren, B. Wang, H. Fu, J. Phys. Chem. B 109 (2005) 2805–
2809.[25] E. Kowalska, R. Abe, B. Ohtani, Chem. Commun. 2 (2009) 241–243.[26] E. Kowalska, O.O. Prieto-Mahaney, R. Abe, B. Ohtani, Phys. Chem. Chem. Phys.
12 (2010) 2344–2355.[27] Y. Xia, N.J. Halas, MRS Bull. 30 (2005) 338–344.[28] A.J. Haes, C.L. Haynes, A.D. McFarland, G.C. Schatz, R.P. van Duyne, S. Zou, MRS
Bull. 30 (2005) 368–375.[29] J.J. Mock, M. Barbic, D.R. Smith, D.A. Schultz, S. Schultz, J. Chem. Phys. 116 (2002)
6755–6759.[30] M. Westphalen, U. Kreibig, J. Rostalski, H. Luth, D. Meissner, Sol. Energ. Mater.
Sol. C 61 (2000) 97–105.[31] W.Y. Ma, H. Yang, J.P. Hilton, Q. Lin, L.X. Huang, J. Yao, Opt. Express 18 (2010).[32] W.-S. Liao, X. Chen, T. Yang, E.T. Castellana, J. Chen, P.C. Cremer, Biointerphases
4 (2009) 80–85.[33] H.M. Sung-Suh, J.R. Choi, H.J. Hah, S.M. Koo, Y.C. Bae, J. Photochem. Photobiol.
A 163 (2004) 37–44.[34] P. Górska, A. Zaleska, E. Kowalska, T. Klimczuk, J.W. Sobczak, E. Skwarek, W.
Janusz, J. Hupka, Appl. Catal. B 84 (2008) 440–447.[35] S. Hishita, I. Mutoh, K. Koumoto, H. Yanagida, Ceram. Int. 9 (2) (1982) 61–67.[36] H. Jensen, A. Soloviev, Z. Li, E.G. Sogaard, Appl. Surf. Sci. 246 (2005) 239–
249.[37] J. Yu, X. Zhao, Q. Zhao, Thin Solid Films 379 (2000) 7–14.[38] F. Zeng, C. Hou, S. Wu, X. Liu, Z. Tong, S. Yu, Nanotechnology 18 (2007) 1–8.[39] J.S. Kim, E. Kuk, K.N. Yu, J.-H. Kim, S.J. Park, H.J. Lee, S.H. Kim, Y.K. Park, Y.H.
Park, C.-Y. Hwang, Y.-K. Kim, Y.-S. Lee, D.-H. Jeong, M.-H. Cho, Nanomed.: Nan-otechnol. Biol. Med. 3 (2007) 95–101.
[40] Y. Liu, X. Wang, F. Yang, X. Yang, Micropor. Mesopor. Mater. 114 (2008)431–439.
[41] J. Keleher, J. Bashant, N. Heldt, L. Johnson, Y. Li, World J. Microbiol. Biotechnol.18 (2002) 133–139.
[42] A. Henglein, J. Phys. Chem. 83 (1979) 2209–2216.[43] J. Disdier, J.M. Herrmann, P. Pichat, J. Chem. Soc. Faraday Trans. I 77 (1981)
2815–2826.[44] C. Lettmann, K. Hildenbrand, H. Kisch, W. Macyk, W.F. Maier, Appl. Catal. B 32
(2001) 215–227.[45] Y. Tseng, C. Kuo, C. Huang, Y. Li, P. Chou, C. Cheng, M. Wong, Nanotechnology
17 (2006) 2490–2497.[46] G. Lu, A. Linsebigler, J.T. Yates Jr., J. Phys. Chem. 99 (1995) 7626–7631.[47] E. Wahlstrom, E.K. Vestergaard, R. Schaub, A. Ronnau, M. Vestergaard, E. Lægs-
gaard, I. Stensgaard, F. Besenbacher, Science 303 (2004) 511–513.[48] N. Nilius, N. Ernst, H.-J. Freund, Chem. Phys. Lett. 349 (2001) 351–357.[49] A. Fujishima, X. Zhang, C. R. Chim. 9 (2006) 750–760.


