Embed Size (px)
Citation preview
This thesis has been submitted in fulfilment of the requirements for a postgraduate degree
(e.g. PhD, MPhil, DClinPsychol) at the University of Edinburgh. Please note the following
terms and conditions of use:
This work is protected by copyright and other intellectual property rights, which are
retained by the thesis author, unless otherwise stated.
A copy can be downloaded for personal non-commercial research or study, without
prior permission or charge.
This thesis cannot be reproduced or quoted extensively from without first obtaining
permission in writing from the author.
The content must not be changed in any way or sold commercially in any format or
medium without the formal permission of the author.
When referring to this work, full bibliographic details including the author, title,
awarding institution and date of the thesis must be given.
The mobility and speciation of chromium in the urban-industrial environment
Gavin Sim
PhD Thesis The University of Edinburgh
2018

Declaration
I declare that this thesis has been composed solely by myself and that it has not been
submitted, in whole or in part, in any previous application for a degree. Except where states
otherwise by reference or acknowledgment, the work presented is entirely my own.

ii
Acknowledgments
Firstly, I would also like to thank the NERC E3 DTP and the BGS for funding this project.
I owe a large amount of thanks to all my supervisors, in particular Dr Margaret Graham, for
their help, support and guidance throughout this project. I must also mention Dr Lorna Eades
and the technical staff in the Geosciences department for their help with analysis and building
stuff. Finally, I would also like to thank my colleges Kenny, Michael, Ellen, John, Andrew,
Sarah, James and Sam along with the NMR lot and all the undergraduate students who I have
worked over the duration of this project. It has been a pleasure sharing the lab with them and
without them this project would not have been as enjoyable.
iii
Abstract
Chromium (Cr) is an important metal which was has been used since the industrial revolution
for various applications. It can be toxic dependant on the species present and the production
of Cr chemicals has left localised Cr pollution where waste from Cr chemical works was
dumped. The fate of Cr, which has leached out of these waste sites, with soils, sediments and
waters is dependent on its speciation and the process that leads to the changes in Cr species
in the environment is currently poorly understood. The city of Glasgow in the West of Scotland
was recognised as an industrial centre from the industrial revolution in the 1800s through to
the late 1960s. It hosted large amounts of heavy industry gaining it a reputation as industrial
powerhouse. Some of the first industries to appear along the banks of the River Clyde were
weaving and dying industries. For the dying process Cr chemicals were required to fix colour
pigments to the cloth so in the 1820s J&J White’s Shawfield Chromium Works started to meet
this demand. White developed and patented a novel way to extract Cr from chromite ore which
lead to it becoming one of the largest producers of Cr chemicals in the world during its heyday.
This new process involved roasting the ore with a diluent, an alkali carbonate, improving the
penetration of air into the melt and leading to the more efficient conversion of insoluble trivalent
Cr (Cr(III)) to soluble hexavalent Cr (Cr(VI)). This soluble Cr(VI) was leached out and
converted to the desired product. This high lime process led to the production of a waste
product, called chromite ore processing residue (COPR), which is highly alkaline and
contained approximately 4% (w/w) of Cr of which ~30% is in the form of the significantly more
toxic Cr(VI). The waste material was used as backfill at certain locations in the south of the
city, including Polmadie, where it was used in football terracing and to fill in old pits. It is
estimated that there was 2.5 million tonnes of this toxic waste material produced before the
factory shut in 1968. Research in the late 1990s and early 2000s characterised COPR in the
waste disposal sites and ways to remediate it but there was limited focus on the fate of Cr
once it gets into the wider environment. This project seeks to determine the biogeochemical
and environmental factors that influence the preservation of Cr(VI) and its transport once it
leaves the waste disposal sites, along with its bioaccessibility in Cr polluted soils.
The study site was the Polmadie Burn, a small stream which runs alongside Richmond Park
and which drains areas of COPR waste before meeting the River Clyde. Previous work has
demonstrated that it has transported a large quantity of Cr from these former industrial sites
into the River Clyde and concentrations therein are close to or sometimes slightly in excess of
UK Environmental Quality Standards for surface waters. Initial characterisation in this study
determined Cr(VI) concentrations of <4180 μg L-1 in the Polmadie Burn waters, <1200 mg kg-
1 in the underlying sediments, and <2190 mg kg-1 in the banking soils. Total Cr concentrations
in the soil and sediment were <6310 and <14900 mg kg-1, respectively. Sequential extraction
iv
results showed that 63 ± 10 and 52 ± 5 % of Cr is associated with organic matter in the soils
and sediments, respectively, with most of the rest associated with iron hydroxides.
The drying of soil and sediments can alter their physical and chemical properties leading to
release of metals bound to them. To investigate the drying of Polmadie soils and sediments
due to prolonged dry spells, drying experiments were constructed to investigate the release of
Cr when soil and sediments were rewetted after different drying periods. These results showed
that, in general, low concentrations of Cr were released with a maximum of 0.11 and 0.008%
of the Cr released from soils and sediments, respectively. They also reveal that drying of
sediments resulted in the release of Cr(VI) due to the oxidation of Cr(III) by freshly precipitated
manganese oxides which form in the sediment. This process was not observed in the soils.
Sorption of Cr(VI) to the soil, however, was a much more favourable process as over 96% of
Cr(VI) was sorbed to the soil after a 48 h shaking period. This was not a reversible process as
Cr(VI) sorbed to the banking soil was not released when the Cr loaded soil was shaken in 0.01
M calcium chloride solution showing that the Polmadie soils are a sink for Cr(VI) providing a
natural resource for immobilising Cr(VI) in ground water.
The inhalation bioaccessibility of Cr in Polmadie banking soils was quantified to estimate the
risk to human health. It was found that 59.3 ± 40 and 16.3 ± 3 mg kg-1 of bioaccessible Cr and
Cr(VI), respectively, was present in the <10 µm fraction of the banking soil. This was equivalent
to 15.1 ± 10 and 19.0 ± 8.3% of the total Cr and the total Cr(VI) in the <10 µm fraction being
bioaccessible via inhalation. The risk to people living around the area was concluded to be
minimal as the potential for creating inhalable dust from the soil was low but further work is
required looking into the airborne concentrations of Cr in the area to fully quantify the airborne
Cr concentrations.
This research has examined the fate of Cr in the environment once it leaches out of COPR
waste. It has shown that low concentrations of Cr is leached from the Polmadie sediments and
soils with the organic rich soil is able to irreversibly sorb Cr(VI) from solution. Upon drying both
the soils and sediments release a small proportion of the Cr in them when rewetting. This
shows that the Polmadie Burn sediment and banking soil is a sink for Cr by immobilising it and
also lowers its toxicity by reducing soluble Cr(VI) to Cr(III).
Although this research has used the Polmadie Burn as a case study it gives a better
understanding of the fate and species of Cr in organic rich soils. It will also help predict the
mobility and speciation of Cr present in such soils giving a better understanding of the risk of
Cr in these soils to human health.

v
vi
Lay Summary
The city of Glasgow, Scotland was an industrial centre since the industrial revolution in the
1800s until the late 1960s. During this time it hosted large amounts of heavy industry and one
such industry was the manufacturing of chromium chemicals, originally for the textile industry.
A new way of extracting chromium from its ore was developed by J&J White which helped turn
their chromium chemical factory, which operated between from the 1820s until 1968, the
largest in the world during its heyday. In its ore, chromium is found in an immobile which has
negligible toxic effects but the extraction process transformed chromium in the ore to a form
which is very mobile with a high toxicity. Contact with this toxic form of chromium can cause
skin irritation and lung cancer. The waste material produced from the extraction process lead
to ~2.5 million tonnes of waste, which contains high concentrations of toxic chromium, being
spread around Glasgow. Near the site of the former chromium factory, the Polmadie Burn, a
tributary of the River Clyde, has chromium concentrations which are approximately 1000 times
higher than the maximum concentrations permitted by the Scottish Environment Protection
Agency. Likewise, the Polmadie banking soils and stream sediments contain large amounts
of chromium. Due to the large amount of chromium in the area and the potential impact it may
have on human health, it is important to determine how much there is, especially the amount
in toxic forms, and identify any processes which can convert chromium between toxic and
non-toxic species. This project found that the banking soils and sediment tended to convert
toxic chromium to less toxic forms and also immobilised it. There was however still significant
amounts of toxic chromium found in the soils and sediments. Chromium leached from the soils
and sediments was very low and was released generally in the less-toxic form. Laboratory
experiments simulating the amount of toxic chromium released by dust into the lungs
suggested that there might be an unacceptable risk of developing cancer if exposed to the
dust daily. However, due to the secluded nature of the soils and their high moisture content of
the soil resulting in low dust formation, the results from this experiment should be used
cautiously with further study in this area required. Overall, the soils and sediment
demonstrated the ability act as a sink for chromium and they released very small amounts
during leaching.
vii
Contents Declaration ............................................................................................................................. i
Acknowledgments ..................................................................................................................ii
Abstract................................................................................................................................. iii
Lay Summary ........................................................................................................................ vi
Table of Figures .................................................................................................................. xiv
1 Introduction .................................................................................................................... 1
Overview ................................................................................................................. 1
Legacy of chromium chemical production ............................................................... 4
1.2.1 Introduction ......................................................................................... 4
1.2.2 Legacy of J&J White’s Chromium Chemical Works in Glasgow, Scotland 6
Remediation of COPR-contaminated sites ............................................................ 12
Fate of chromium in contaminated waterways ...................................................... 13
Human health impacts associated with exposure to chromium ............................. 14
Overarching aims and specific objectives ............................................................. 16
2 Literature review of the environmental chemistry of chromium ..................................... 18
Introduction ........................................................................................................... 18
2.1.1 Overview of the properties of chromium oxidation states in the environment 18
Redox reactions .................................................................................................... 19
2.2.1 Chromium(III) Oxidation .................................................................... 19
2.2.2 Chromium(VI) Reduction .................................................................. 20
2.2.3 Environmental implications of chromium redox chemistry ................. 21
Adsorption, precipitation/dissolution and complexation processes ........................ 23
2.3.1 Adsorption to mineral surfaces .......................................................... 23
2.3.2 Adsorption processes for chromium(III) ............................................. 24
2.3.3 Adsorption processes for chromium(VI) ............................................ 25
Precipitation/dissolution processes ....................................................................... 27
Complexation processes ....................................................................................... 28
3 Sample collection and laboratory methods ................................................................... 30
viii
3.1 Sample collection .................................................................................................. 30
Location of the sampling site ............................................................. 30
Overview of sample collection throughout this PhD project ............... 33
Sample collection procedures ........................................................... 44
Porewater extraction ......................................................................... 46
3.2 Soil/sediment sample preparation procedures ...................................................... 48
Glass/plasticware cleaning ................................................................ 49
3.3 Soil/sediment digestion and extraction procedures ............................................... 50
Acid digestions for pseudo-total and total elemental concentration determination
50
Sequential extraction methods for determination of elemental associations in
soils and sediments ........................................................................................ 52
Alkaline digestion for the determination of chromium(VI) concentrations in soils
and sediments ................................................................................................ 54
3.4 Simulated drying of soil and sediment in the laboratory ........................................ 55
Column leaching of soil and sediments over drying period of 4 weeks55
Batch leaching of soils and sediments over a drying period of 9 weeks59
Investigation of the sorption of chromium(VI) to Polmadie Burn banking soil and
its subsequent release .................................................................................... 60
3.5 Bioaccessibility of chromium(III) and chromium(VI) in the respirable fraction (<10 µm)
of soils and sediments ..................................................................................................... 63
Background ...................................................................................... 63
Isolation of <10 µm fraction from soil and sediment samples ............ 64
Inhalation bioaccessibility method ..................................................... 64
3.6 Gel electrophoresis ............................................................................................... 65
Background ...................................................................................... 65
Organic matter extraction from soils and sediments .......................... 65
Gel electrophoresis method .............................................................. 66
3.7 Analysis of water samples, extracts and digests ................................................... 66
ix
Inductively coupled plasma-optical emission spectroscopy (ICP-OES) and
inductively coupled plasma-mass spectroscopy (ICP-MS) .............................. 66
Colorimetric Analysis ........................................................................ 70
pH measurements ............................................................................ 72
Statistical analysis ............................................................................ 72
4 The temporal and spatial variations in chromium concentrations and associations in a
sediment-water-banking soil system, Polmadie Burn, south east Glasgow, Scotland .......... 74
4.1 Introduction ........................................................................................................... 74
4.2 Evaluation of long-term trends in water quality and in the concentrations of chromium
and other elements based on monthly sampling data (Polmadie-Malls Mire) provided by
SEPA 75
Water classification for Polmadie Burn .............................................. 79
Typical concentrations of major cations (calcium, magnesium, sodium,
potassium) over the period 2016-2017, water hardness over the period 1967-2016 and
Fe and Mn concentrations over the period 2012-2017 .................................... 88
Temporal variations in trace element concentrations including chromium 91
4.3 Characterisation of water, sediment and banking soils from the non-culverted section
of the Polmadie Burn ....................................................................................................... 99
Elemental concentrations and pH of surface water samples from Polmadie Burn
99
Elemental concentrations in porewaters isolated from soil and sediment samples
99
Organic matter content, pH and Eh of banking soils, surface sediments and
sediment cores from Polmadie Burn ............................................................. 100
Elemental concentrations in surface banking soils, surface sediments and
sediment cores from Polmadie Burn ............................................................. 103
4.4 Elemental concentrations profiles for sediment cores collected from Polmadie Burn
107
Core 1 ............................................................................................. 107
Core 2 ............................................................................................. 107
SEM-EDS analysis of Core 1 sediment samples ............................. 108
4.5 BCR sequential extraction of surface soils and sediments .................................. 117
x
Elemental distribution within the banking soil .................................. 117
Elemental distributions within the burn sediments ........................... 118
4.6 Gel Electrophoretic fractionation of organic matter extracted from the Polmadie Burn
banking soils and bottom sediments .............................................................................. 120
Electrophoretic fractionation of banking soil organic matter ............. 120
Sediment ........................................................................................ 121
4.7 Discussion of results ........................................................................................... 127
Occurrence of chromium in the Polmadie Burn sediments and banking soils
127
Associations of chromium in Polmadie Burn Banking soils and sediments 128
4.8 Summary ............................................................................................................ 132
Concentrations of chromium in the Polmadie Burn waters, banking soils and
sediments ..................................................................................................... 132
Temporal trends in the concentrations of chromium in the Polmadie Burn 132
Evidence of COPR in the Polmadie Burn waters, banking soils and sediments
133
The associations of chromium in the banking soil and sediment and the impact
on its long-term fate ...................................................................................... 133
5 Mobility of chromium in the Polmadie Burn banking soils and bottom sediments under
changing environmental conditions ................................................................................... 135
5.1 Overview and chapter structure .......................................................................... 135
5.2 Review of literature on impacts of wet/dry cycles on chromium speciation and mobility
in soils and sediments ................................................................................................... 137
5.3 Column experiments to investigate the leachability of chromium from banking soils
and sediments which have been dried for different time periods .................................... 139
Overview of sampling and sample treatment .................................. 139
Solid phase elemental concentration .............................................. 141
Results for the column leaching experiments for Polmadie Burn banking soils
and bottom sediments ................................................................................... 141
Ultrafiltration of leachate from the 120-150 mL fraction from soil and sediment
columns 162
xi
Discussion of chromium release from soil and sediments during column leaching
166
Summary ........................................................................................ 171
5.4 Batch Experiments to investigate the leachability of chromium from soils and
sediments which have been dried for different time periods ........................................... 173
Overview of sampling and sample treatment .................................. 173
Moisture content and pH of soils and sediments ............................. 174
Elemental release from soil during rewetting with increasing drying time 176
Elemental release from sediment during rewetting with increasing drying time
180
Discussion of batch leaching results for Polmadie Burn Banking Soils and
Bottom Sediments ......................................................................................... 184
Summary ........................................................................................ 188
5.5 Chromium(VI) removal from solution by banking soil .......................................... 189
Overview of sampling and method .................................................. 190
Results for the control experiment (0.01 M calcium chloride only) ... 190
Chromium adsorption and subsequent release ............................... 195
Kinetic modelling ............................................................................. 198
Discussion of the sorption and release of chromium(VI) from solution by
Polmadie banking soil ................................................................................... 200
5.6 Conclusions ........................................................................................................ 201
Mobility of chromium during rewetting of air-dried banking soil and sediments
202
Removal of chromium(VI) form solution by banking soil .................. 202
6 Bioaccessibility of chromium in the <10 µm fraction of banking soils .......................... 204
6.1 Background......................................................................................................... 204
6.2 Risk assessment of soils in the UK ..................................................................... 205
6.2.1 Definition of contaminated land ....................................................... 205
6.2.2 Assessment of soils for contamination ............................................ 205
6.2.3 Category 4 Screening Level soil guideline values as trigger values 207
xii
6.3 Comparison of Polmadie Banking soils to current trigger values ......................... 209
6.4 Bioaccessibility testing ........................................................................................ 209
6.5 Bioaccessibility of chromium from soil dusts ....................................................... 212
6.5.1 Trial experiment comparing solid to liquid ratios .............................. 212
6.5.2 Conclusions from trial experiment ................................................... 212
6.5.3 Bioaccessibility of chromium from Polmadie soil samples ............... 213
6.6 Evaluation of the bioaccessibility of Polmadie Burn banking soils ....................... 216
6.6.1 Comparison of PM10 chromium concentrations to soil guideline values and
category 4 screening levels. .......................................................................... 216
6.6.2 Comparison of the PM10 bioaccessible fraction to the CLEA model soil
assessment criteria value .............................................................................. 216
6.6.3 Suspension of Polmadie banking soil dusts and its potential health effects 217
6.6.4 Amount of Polmadie banking soil PM10 required to exceed index dose218
6.6.5 Comparison of bioaccessible concentrations with solid phase chromium
concentrations in the banking soil PM10......................................................... 221
6.7 Summary ............................................................................................................ 222
7 Summary, conclusions and further work .................................................................... 223
7.1 Fate of chromium in the Polmadie Burn surface water ........................................ 223
Chromium in the Polmadie Burn ..................................................... 223
Removal of chromium from surface water by the banking soil during flood events
224
Chromium(VI) removal from surface waters by Polmadie bottom sediments 224
7.2 Complexation of chromium with organic matter and its release from banking soil and
bottom sediment during drying ...................................................................................... 226
Chromium complexation with organic matter in banking soils and sediments
226
Influence of air-drying on the release of chromium from Polmadie banking soils
and sediment upon rewetting ........................................................................ 226
Oxidation of chromium(III) by manganese oxides upon drying and rewetting
Polmadie bottom sediments .......................................................................... 227
xiii
7.3 Mobilisation of chromium from banking soil dust in the lungs – an inhalation
bioaccessibility study ..................................................................................................... 229
UK soil risk assessment overview ................................................... 229
Bioaccessible concentrations of chromium in Polmadie banking soil <10 µm
fraction 229
7.4 Wider implications of this study ........................................................................... 231
7.5 Conclusions ........................................................................................................ 232
7.6 Further work........................................................................................................ 234
8 References ................................................................................................................ 236
Appendix 1 Correlation Matrices ....................................................................................... 243
Appendix 2: Soil and sediment data .................................................................................. 249
Appendix 3 BCR Sequential Extraction Data ..................................................................... 253
xiv
Table of Figures
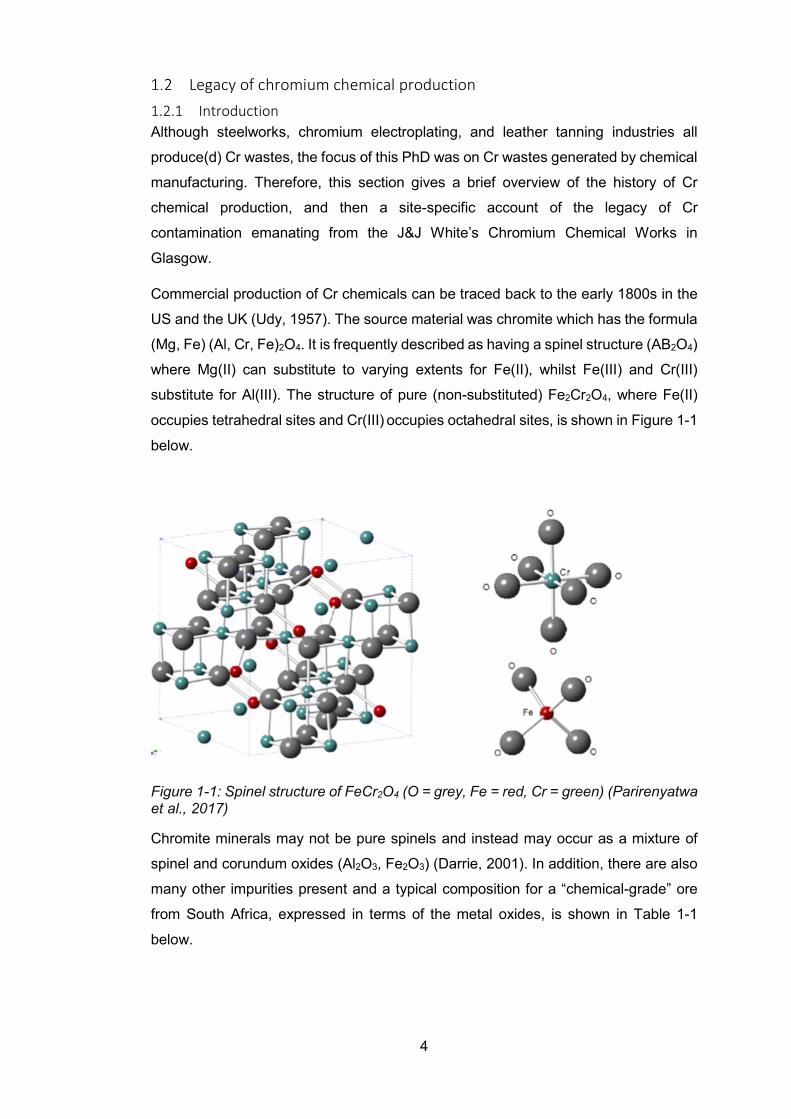
Figure 1-1: Spinel structure of FeCr2O4 (O = grey, Fe = red, Cr = green) (Parirenyatwa et al.,
2017) .................................................................................................................................... 4
Figure 1-2: Aerial photograph of southeast Glasgow in the 1950s showing the location of the
J&J White Chemical Works (orange outline), the COPR disposal area (yellow outline) and
seepage of COPR waste under the railway line (red outline) (photograph provided by Mr
James Farquar, then-retired employee). ............................................................................... 9
Figure 1-3: Photograph ca 2000 showing COPR used for terracing at Rutherglen Glencairn
Junior Football Ground, south east Glasgow, Scotland (provided by Dr. Margaret Graham,
University of Edinburgh). ....................................................................................................... 9
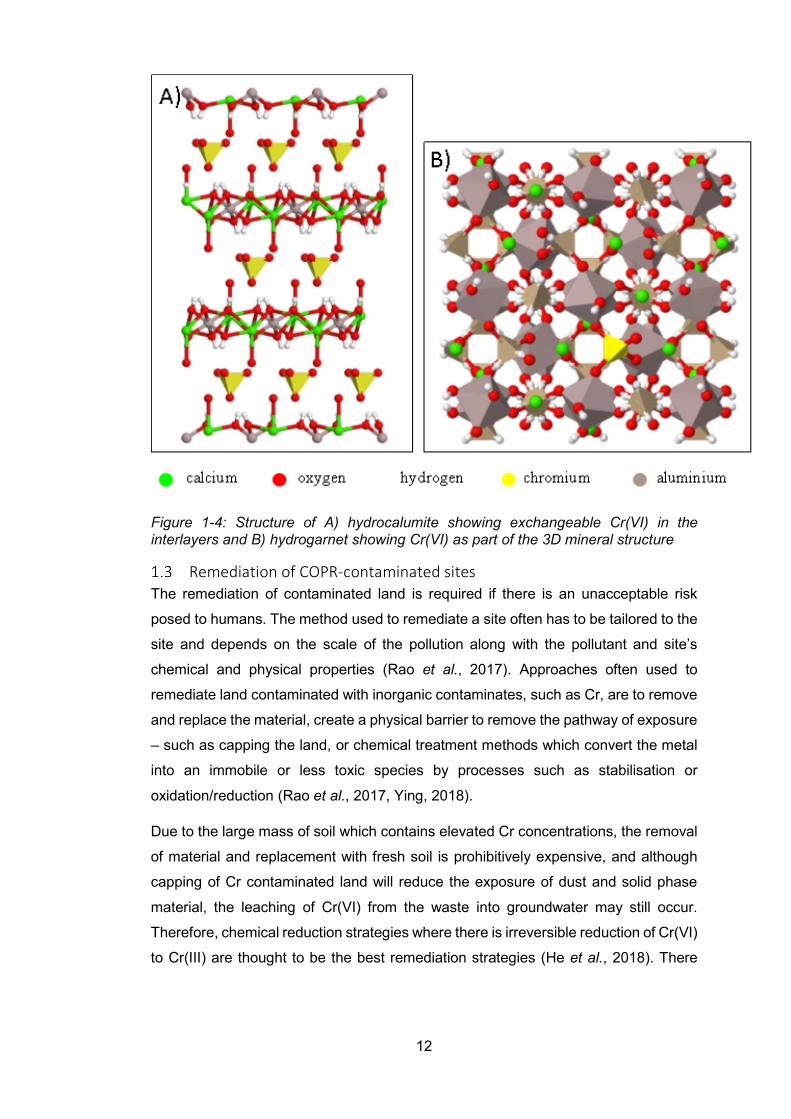
Figure 1-4: Structure of A) hydrocalumite showing exchangeable Cr(VI) in the interlayers and
B) hydrogarnet showing Cr(VI) as part of the 3D mineral structure...................................... 12
Figure 2-1: A Eh-pH diagram showing the speciation of chromium in natural aquatic systems
(Reeder et al., 2006). .......................................................................................................... 19
Figure 2-2: Chromium oxidation-reduction cycle in soils (Kotaś and Stasicka, 2000). ......... 23
Figure 2-3: Schematic diagram of the water/sediment interface in an estuarine environment
(Wadhawan et al., 2013). .................................................................................................... 23
Figure 2-4: Speciation diagram showing hydrolysis of Cr(III) in aqueous solution (Richard and
Bourg, 1991). ...................................................................................................................... 25
Figure 2-5: Competitive sorption between Cr(VI) and SO42- onto amorphous Fe oxides
(Cr(VI) = 5 x 10⁻⁶ M and FeTOT = 0.87 x 10⁻³ M) (from Rai et al., 1986). .......................... 27
Figure 3-1: Map showing the location of Richmond Park, Glasgow, with map of Scotland insert
........................................................................................................................................... 30
Figure 3-2: Route of culverted sections of the Polmadie Burn and its tributaries ................. 31
Figure 3-3: Map showing the location of Polmadie Burn along the perimeter of Richmond Park,
south east Glasgow, Scotland. The black rectangle shows the area which was sampled during
this study. ............................................................................................................................ 31
Figure 3-4: Polmadie Burn During Summer ......................................................................... 32
Figure 3-5: Polmadie Burn during winter ............................................................................. 32
Figure 3-6: Water and porewater sampling points ............................................................... 35
Figure 3-7: Sediment sampling points ................................................................................. 36
Figure 3-8: Soil sampling points .......................................................................................... 37
Figure 3-9: Schematic of the coring table (a) shows the side view and (b) a birds eye view of
the top. ................................................................................................................................ 45
Figure 3-10: Soil sampling strategy ..................................................................................... 46
xv
Figure 3-11: Schematic of the multi-level samplers used for sediment porewater extraction.
Not to scale, all measurements in mm (Dearden, 2010) ...................................................... 47
Figure 3-12: Original column design (a) and redesigned columns used for column leaching
experiment (b) ..................................................................................................................... 57
Figure 3-13: Side-on schematic of column and base giving approximate dimensions ......... 57
Figure 3-14: Input channels in column base ........................................................................ 58
Figure 3-15: Top view of base giving approximate dimensions ........................................... 58
Figure 3-16: Schematic of ICP torch ................................................................................... 67
Figure 4-1: Map showing the location of the SEPA surface water sampling point ( ) over the
period 1967-2017 (https://digimap.edina.ac.uk/) .................................................................. 76
Figure 4-2:Alkalinity (as carbonate) in Polmadie Burn (A) 1967-2017 and (B) 2010-2017 ... 80
Figure 4-3: Temporal variations in (A) Dissolved oxygen (as mg L-1) 2010-2017; (B) Dissolved
oxygen (as mg L-1) 1967-2017; (C) Temperature (°C) 2010-2017; (D) Temperature (°C) 1967-
2017 .................................................................................................................................... 82
Figure 4-4: Dissolved oxygen (as % saturation) in Polmadie Burn (A) 1967-2017 and (B) 2010-
2017 .................................................................................................................................... 83
Figure 4-5: Temporal variations in biochemical oxygen demand (A) 1967-2017 and (B) 2010-
2017 .................................................................................................................................... 85
Figure 4-6: Temporal variations in water pH in Polmadie Burn (A) 1967-2017 and (B) 2010-
2017 .................................................................................................................................... 87
Figure 4-7: The pH of urban topsoils in Glasgow. The blue box shows the area of the Polmadie
Burn (Fordyce, 2012) .......................................................................................................... 88
Figure 4-8: The CaO concentrations in urban Glasgow topsoils. The blue box shows the area
of the Polmadie Burn (Fordyce, 2012) ................................................................................. 89
Figure 4-9: Made and infilled ground in Glasgow. The blue box shows the area of the Polmadie
Burn. (Fordyce, 2012) ......................................................................................................... 89
Figure 4-10: Eh-pH diagram for Fe in an idealised solution ................................................. 90
Figure 4-11: Eh-pH diagram for Mn in an idealised solution ................................................ 91
Figure 4-12: The Cr concentrations in urban Glasgow topsoils. The blue box shows the area
of the Polmadie Burn (Fordyce, 2012) ................................................................................. 94
Figure 4-13: Temporal variations in Cr concentration in Polmadie Burn 1967-2017 total Cr (mg
L-1) (A); dissolved Cr (mg L-1) (B); percentage of Cr as dissolved Cr (%) (C) and total dissolved
solids (mg L-1) (D). .............................................................................................................. 95
Figure 4-14: Temporal variations in Cr (mg L-1) concentration in Polmadie Burn between
2010-2017 (A) total Cr and (B) dissolved Cr ........................................................................ 96
Figure 4-15: Eh-pH diagram for Cr in an idealised solution, the red box shows the pH range
found in the Polmadie Burn and the typical Eh expected in a a well oxygenated water ....... 97
xvi
Figure 4-16: Route of the Polmadie Burn, its tributaries and the area of land remediated in
2013 with calcium polysulfide .............................................................................................. 98
Figure 4-17: (A) Organic matter and (B) porewater pH profile for Core 1........................... 102
Figure 4-18: (A) Organic matter and (B) porewater pH profile for Core 2........................... 102
Figure 4-19: Earthworks showing disturbance of banking soil ........................................... 103
Figure 4-20: Box and whisker plots to describe the range of concentrations of: (A) Cr; (B)
Cr(VI); (C) Fe and (D) Mn in Polmadie soils and sediments. The box shows the 25th (lower
line), 50th (middle line) and 75th (upper line) quartiles with the mean as a broken line. The
lower and upper whiskers show the minimum and maximum concentrations, respectively.
......................................................................................................................................... 105
Figure 4-21: Box and whisker plots to describe the range of concentrations of: (A) Al; (B) Ca;
(C) and Mg in Polmadie soils and sediments. The box shows the 25th (lower line), 50th (middle
line) and 75th (upper line) quartiles with the mean as a broken line. The lower and upper
whiskers show the minimum and maximum concentrations, respectively. ......................... 106
Figure 4-22: Core profiles of: (A) Cr(tot); (B) Cr(VI); (C) Fe and (D) Mn in Sediment Core 1
......................................................................................................................................... 109
Figure 4-23: Core profiles of: (A) Al; (B) Ca and (C) Mg in Sediment Core 1 ..................... 110
Figure 4-24: Core profiles of: (A) Cr(tot); (B) Cr(VI); (C) Fe and (D) Mn in Sediment Core 2
......................................................................................................................................... 111
Figure 4-25: Core profiles of: (A) Al; (B) Ca and (C) Mg in Sediment Core 2 ..................... 112
Figure 4-26: A BSE SEM image showing quartz grain with a surface coating (A); the typical
elemental concentration of a surface coating from Site 1(B) and the elemental content of the
grain at Site 2 (C) .............................................................................................................. 113
Figure 4-27: A BSE SEM image of feldspar mineral with surface coating (A). The composition
of the mineral grain (B) and the surface coating highlighted by the white circle (C) ........... 114
Figure 4-28: A BSE SEM image showing the presence of aggregates (A). The composition of
the mineral at Site 1 (B) and the composition of mineral at Site 2 (C) ................................ 115
Figure 4-29: A BSE SEM image showing small individual grains (A). The elemental
composition of 1 is shown in (B) and the composition of 2 is shown in (C). ....................... 116
Figure 4-30: Distribution of: (A) Cr; (B) Fe; (C) Mn and (D) Al in soils and sediments along with
(E) distribution of Ca and Mg in soils ................................................................................. 119
Figure 4-31: Gel electrophoresis data for organic matter extracted from field-moist soil .... 123
Figure 4-32: Gel electrophoresis data for organic matter extracted from air-dried soil ....... 124
Figure 4-33: Gel electrophoresis data on field-moist sediment .......................................... 125
Figure 4-34: Gel electrophoresis data on air-dried sediment ............................................. 126
Figure 5-1: Filled columns prior to leaching ....................................................................... 140
xvii
Figure 4-2: Mean pH values (± 1 s.d.; n =3 except for week 0 soil) of soil and sediment column
leachate fractions .............................................................................................................. 144
Figure 5-3: Range of pH of column leachate from soil column experiments. The box shows
the 25th (lower line), 50th (middle line) and 75th (upper line) quartiles with the mean as a
broken line. The lower and upper whiskers show the range of the values. ........................ 145
Figure 5-4: Range of pH of column leachate from sediment column experiments. The box
shows the 25th (lower line), 50th (middle line) and 75th (upper line) quartiles with the mean
as a broken line. The lower and upper whiskers show the range of the values.................. 145
Figure 5-5: Mean leachate pH in soil and sediment columns ............................................. 146
Figure 5-6: Concentrations of total Cr in soil and sediment column leachate fractions ...... 148
Figure 5-7:Cr(III) concentrations and %Cr(VI) (relative to total Cr) in soil column leachate 149
Figure 4-8: Mean Cr concentrations in soil and sediment columns (A) and mean Cr(III) and
Cr(VI) concentrations in soil columns (B) .......................................................................... 150
Figure 4-9: Concentrations of Fe in soil and sediment leachate fractions .......................... 153
Figure 5-10: Concentrations of Mn in soil and sediment leachate fractions ....................... 154
Figure 5-11: Concentrations of Al in soil leachate fractions ............................................... 155
Figure 4-12: Relationship between Mn and Fe concentrations in leachates from soil (A) and
sediment (B) columns ....................................................................................................... 156
Figure 4-13: Mean Fe (A) and Mn (B) in soils and sediments column leachate along with mean
Al (C) concentrations in soil column leachates .................................................................. 157
Figure 5-14: Relationship between Ca and Mg in soil (A) and sediment (B) leachate and the
relationship between Ca and S in soil (C) and sediment (D) leachate ............................... 159
Figure 4-15: Mean concentrations of Ca (A), Mg (B) and S (C) in the soil and sediment column
leachate ............................................................................................................................ 161
Figure 5-16: Percentage of colloidal and dissolved fraction of Cr (A), Fe (B) and Mn (C) in the
120-150 mL fraction of the soil column leachate ............................................................... 164
Figure 5-17: Percentage of colloidal and dissolved fraction of Cr (A), Fe (B) and Mn (C) in the
120-150 mL fraction of the sediment column leachate ...................................................... 165
Figure 5-18: Gel electrophoretic patterns obtained for organic matter extracted from air-dried
Polmadie sediment for OM (A) and Cr concentrations (B) in fractions 1-10. ...................... 169
Figure 5-19: Gel electrophoretic patterns obtained for organic matter extracted from fresh
Polmadie Burn sediment for OM (A) and Cr concentrations (B) in fractions 1-10. ............. 170
Figure 5-20: Moisture content of soil (A) and sediment (B) along with pH of soil (C) and
sediment (D) leachate with increasing drying period ......................................................... 175
Figure 5-21: Concentration of Cr (A), Fe (B), Mn (C) and Al (D) leached from soil over a drying
time of 62 days. ................................................................................................................. 178
xviii
Figure 5-22: Concentration of Ca (A), Mg (B) and S (C) leached from soil over a drying time
of 62 days. ........................................................................................................................ 179
Figure 5-23: Concentration of Cr (A), Fe (B), Mn (C) and Al (D) leached from sediment over a
drying time of 62 days ....................................................................................................... 182
Figure 5-24: Concentration of Ca (A), Mg (B) and S (C) leached from sediment over a drying
time of 62 days.................................................................................................................. 183
Figure 5-25: Leachable Cr, Fe and Mn concentrations (A) and moisture content (B) of
sediment as drying time increases .................................................................................... 187
Figure 4-1: Areas risk of flooding in Glasgow. The blue box shows the Polmadie Burn.
(http://apps.sepa.org.uk/FRMStrategies/pdf/lpd/LPD_11_Sources.pdf) ............................. 189
Figure 4-2: Baseline leachate pH variation with shaking time ............................................ 191
Figure 4-3: Baseline leachate Cr(III) concentration variation with shaking time ................. 192
Figure 4-4: Baseline leachate Cr(VI) concentration variation with shaking time ................. 192
Figure 4-5: Leachate Cr (A), Fe (B), Mn (C) and Al (D) concentration variation with shaking
time ................................................................................................................................... 193
Figure 4-6: Leachate Ca (A), Mg (B), and S (C) concentration variation with shaking time 194
Figure 4-7: Cr(VI) sorption to soil shaken in 1.4 (A), 10 (B), 50 (C) and 100 (D) mg Cr(VI) L-1
loading solution ................................................................................................................. 196
Figure 4-8: Cr(III) release from Cr(III) loaded soil and control soil ..................................... 197
Figure 4-9: Cr(VI) release from Cr(VI) loaded soil and control soil..................................... 197
Figure 6-1: Schematic of source-receptor-pathway model ................................................ 207
Figure 6-2: Bioaccessible chromium from the soil samples ............................................... 214
Figure 6-3: Calculating Reference Dose (Environment Agency, 2009b)Error! Bookmark not defined. Figure 7-1: Schematic showing the change of leachate concentration as sediment dries .. 228
1
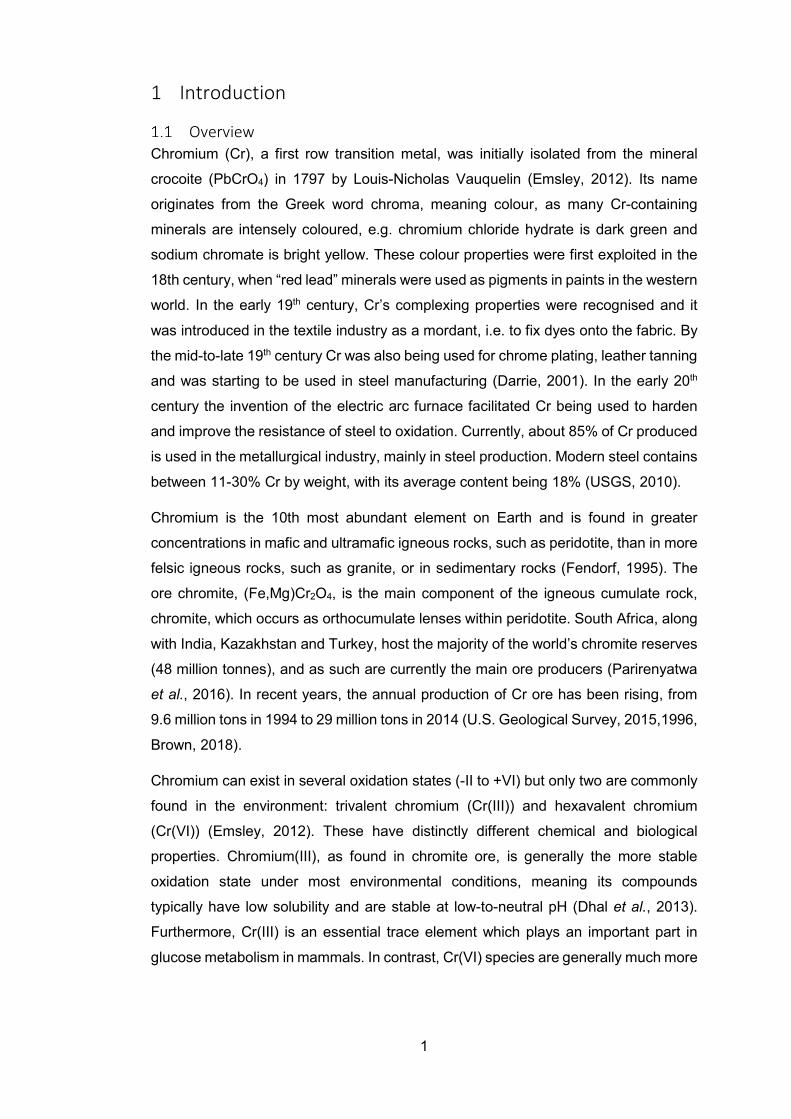
1 Introduction
Overview Chromium (Cr), a first row transition metal, was initially isolated from the mineral
crocoite (PbCrO4) in 1797 by Louis-Nicholas Vauquelin (Emsley, 2012). Its name
originates from the Greek word chroma, meaning colour, as many Cr-containing
minerals are intensely coloured, e.g. chromium chloride hydrate is dark green and
sodium chromate is bright yellow. These colour properties were first exploited in the
18th century, when “red lead” minerals were used as pigments in paints in the western
world. In the early 19th century, Cr’s complexing properties were recognised and it
was introduced in the textile industry as a mordant, i.e. to fix dyes onto the fabric. By
the mid-to-late 19th century Cr was also being used for chrome plating, leather tanning
and was starting to be used in steel manufacturing (Darrie, 2001). In the early 20th
century the invention of the electric arc furnace facilitated Cr being used to harden
and improve the resistance of steel to oxidation. Currently, about 85% of Cr produced
is used in the metallurgical industry, mainly in steel production. Modern steel contains
between 11-30% Cr by weight, with its average content being 18% (USGS, 2010).
Chromium is the 10th most abundant element on Earth and is found in greater
concentrations in mafic and ultramafic igneous rocks, such as peridotite, than in more
felsic igneous rocks, such as granite, or in sedimentary rocks (Fendorf, 1995). The
ore chromite, (Fe,Mg)Cr2O4, is the main component of the igneous cumulate rock,
chromite, which occurs as orthocumulate lenses within peridotite. South Africa, along
with India, Kazakhstan and Turkey, host the majority of the world’s chromite reserves
(48 million tonnes), and as such are currently the main ore producers (Parirenyatwa
et al., 2016). In recent years, the annual production of Cr ore has been rising, from
9.6 million tons in 1994 to 29 million tons in 2014 (U.S. Geological Survey, 2015,1996,
Brown, 2018).
Chromium can exist in several oxidation states (-II to +VI) but only two are commonly
found in the environment: trivalent chromium (Cr(III)) and hexavalent chromium
(Cr(VI)) (Emsley, 2012). These have distinctly different chemical and biological
properties. Chromium(III), as found in chromite ore, is generally the more stable
oxidation state under most environmental conditions, meaning its compounds
typically have low solubility and are stable at low-to-neutral pH (Dhal et al., 2013).
Furthermore, Cr(III) is an essential trace element which plays an important part in
glucose metabolism in mammals. In contrast, Cr(VI) species are generally much more
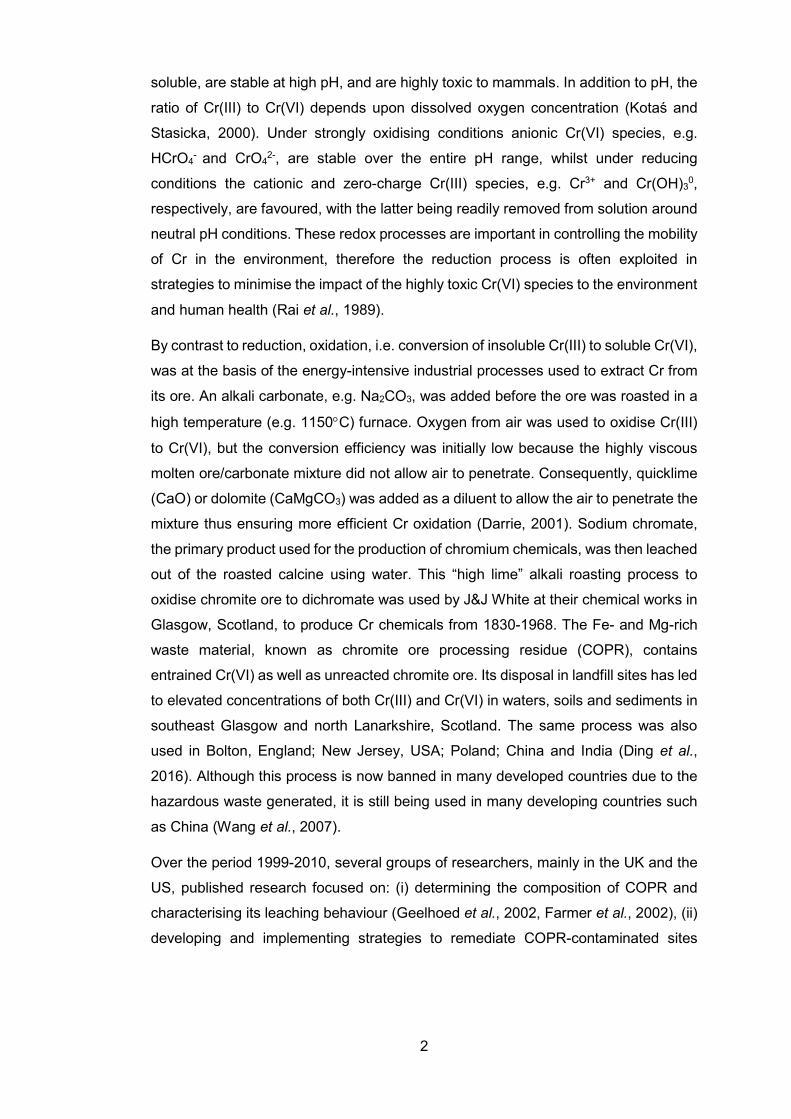
2
soluble, are stable at high pH, and are highly toxic to mammals. In addition to pH, the
ratio of Cr(III) to Cr(VI) depends upon dissolved oxygen concentration (Kotaś and
Stasicka, 2000). Under strongly oxidising conditions anionic Cr(VI) species, e.g.
HCrO4- and CrO4
2-, are stable over the entire pH range, whilst under reducing
conditions the cationic and zero-charge Cr(III) species, e.g. Cr3+ and Cr(OH)30,
respectively, are favoured, with the latter being readily removed from solution around
neutral pH conditions. These redox processes are important in controlling the mobility
of Cr in the environment, therefore the reduction process is often exploited in
strategies to minimise the impact of the highly toxic Cr(VI) species to the environment
and human health (Rai et al., 1989).
By contrast to reduction, oxidation, i.e. conversion of insoluble Cr(III) to soluble Cr(VI),
was at the basis of the energy-intensive industrial processes used to extract Cr from
its ore. An alkali carbonate, e.g. Na2CO3, was added before the ore was roasted in a
high temperature (e.g. 1150°C) furnace. Oxygen from air was used to oxidise Cr(III)
to Cr(VI), but the conversion efficiency was initially low because the highly viscous
molten ore/carbonate mixture did not allow air to penetrate. Consequently, quicklime
(CaO) or dolomite (CaMgCO3) was added as a diluent to allow the air to penetrate the
mixture thus ensuring more efficient Cr oxidation (Darrie, 2001). Sodium chromate,
the primary product used for the production of chromium chemicals, was then leached
out of the roasted calcine using water. This “high lime” alkali roasting process to
oxidise chromite ore to dichromate was used by J&J White at their chemical works in
Glasgow, Scotland, to produce Cr chemicals from 1830-1968. The Fe- and Mg-rich
waste material, known as chromite ore processing residue (COPR), contains
entrained Cr(VI) as well as unreacted chromite ore. Its disposal in landfill sites has led
to elevated concentrations of both Cr(III) and Cr(VI) in waters, soils and sediments in
southeast Glasgow and north Lanarkshire, Scotland. The same process was also
used in Bolton, England; New Jersey, USA; Poland; China and India (Ding et al.,
2016). Although this process is now banned in many developed countries due to the
hazardous waste generated, it is still being used in many developing countries such
as China (Wang et al., 2007).
Over the period 1999-2010, several groups of researchers, mainly in the UK and the
US, published research focused on: (i) determining the composition of COPR and
characterising its leaching behaviour (Geelhoed et al., 2002, Farmer et al., 2002), (ii)
developing and implementing strategies to remediate COPR-contaminated sites
3
(Farmer et al., 1999, Graham et al., 2006); and (iii) evaluating the risk to human health
associated with exposure to COPR-derived Cr (Broadway et al., 2010, Farmer and
Jarvis, 2009)
In the late 2000s through to mid-2010s in Glasgow, some of the most heavily COPR-
contaminated sites were: (i) capped to minimise infiltration/leaching by rainwater
and/or resuspension of fine dusts or; (ii) chemically remediated by converting Cr(VI)
to Cr(III) and achieving exiting groundwater Cr(VI) concentrations of less than the
relevant environmental quality standards. The widespread historical use of COPR as
a fill material, however, means that there are numerous other sites which are still
releasing Cr(VI) to ground- and surface waters. For example, the Polmadie Burn in
southeast Glasgow has sediment Cr concentrations of up to ~3500 mg kg-1 (Whalley
et al., 1999), and surface water Cr concentrations of up to ~2200 µg L-1 (Palumbo-
Roe et al., 2017). These are at least an order of magnitude higher than the respective
environmental quality standards in the UK and elsewhere. Therefore, there is
increasing concern about a proposal to divert water away from the Polmadie Burn as
part of a new water treatment plant in the locality. The impacts of such changes on Cr
behaviour in the Polmadie sediment-water-banking soil system are currently
unknown. Highly reducing conditions currently prevail in the sediments, consequently
one area of uncertainty is the impact of drying out and subsequent oxidative
processes on the sediment-bound Cr, and the extent to which Cr(VI) might be
released to the Burn waters, which then flow into the River Clyde. A second question
relates to the drying out of sediments, but also of the newly exposed banking soils
and the risk that their atmospheric suspension might pose to human health.
4
Legacy of chromium chemical production 1.2.1 Introduction Although steelworks, chromium electroplating, and leather tanning industries all
produce(d) Cr wastes, the focus of this PhD was on Cr wastes generated by chemical
manufacturing. Therefore, this section gives a brief overview of the history of Cr
chemical production, and then a site-specific account of the legacy of Cr
contamination emanating from the J&J White’s Chromium Chemical Works in
Glasgow.
Commercial production of Cr chemicals can be traced back to the early 1800s in the
US and the UK (Udy, 1957). The source material was chromite which has the formula
(Mg, Fe) (Al, Cr, Fe)2O4. It is frequently described as having a spinel structure (AB2O4)
where Mg(II) can substitute to varying extents for Fe(II), whilst Fe(III) and Cr(III)
substitute for Al(III). The structure of pure (non-substituted) Fe2Cr2O4, where Fe(II)
occupies tetrahedral sites and Cr(III) occupies octahedral sites, is shown in Figure 1-1
below.
Figure 1-1: Spinel structure of FeCr2O4 (O = grey, Fe = red, Cr = green) (Parirenyatwa et al., 2017)
Chromite minerals may not be pure spinels and instead may occur as a mixture of
spinel and corundum oxides (Al2O3, Fe2O3) (Darrie, 2001). In addition, there are also
many other impurities present and a typical composition for a “chemical-grade” ore
from South Africa, expressed in terms of the metal oxides, is shown in Table 1-1
below.
5
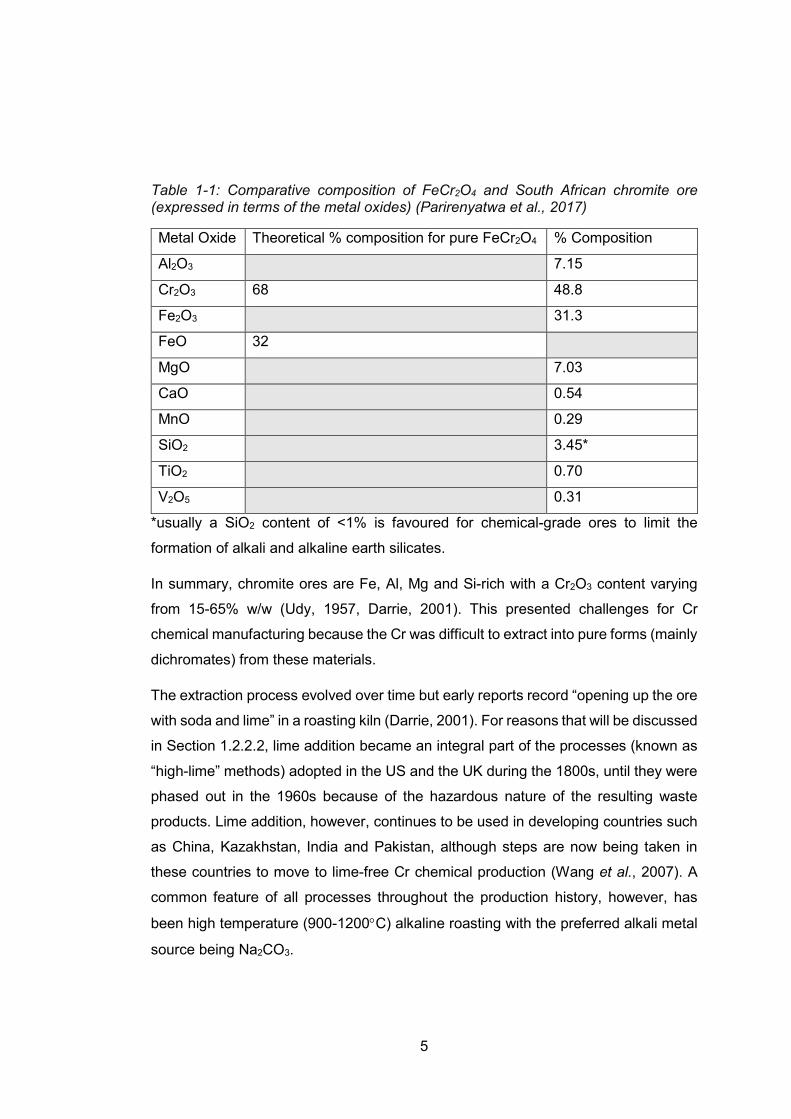
Table 1-1: Comparative composition of FeCr2O4 and South African chromite ore (expressed in terms of the metal oxides) (Parirenyatwa et al., 2017)
Metal Oxide Theoretical % composition for pure FeCr2O4 % Composition
Al2O3 7.15
Cr2O3 68 48.8
Fe2O3 31.3
FeO 32
MgO 7.03
CaO 0.54
MnO 0.29
SiO2 3.45*
TiO2 0.70
V2O5 0.31
*usually a SiO2 content of <1% is favoured for chemical-grade ores to limit the
formation of alkali and alkaline earth silicates.
In summary, chromite ores are Fe, Al, Mg and Si-rich with a Cr2O3 content varying
from 15-65% w/w (Udy, 1957, Darrie, 2001). This presented challenges for Cr
chemical manufacturing because the Cr was difficult to extract into pure forms (mainly
dichromates) from these materials.
The extraction process evolved over time but early reports record “opening up the ore
with soda and lime” in a roasting kiln (Darrie, 2001). For reasons that will be discussed
in Section 1.2.2.2, lime addition became an integral part of the processes (known as
“high-lime” methods) adopted in the US and the UK during the 1800s, until they were
phased out in the 1960s because of the hazardous nature of the resulting waste
products. Lime addition, however, continues to be used in developing countries such
as China, Kazakhstan, India and Pakistan, although steps are now being taken in
these countries to move to lime-free Cr chemical production (Wang et al., 2007). A
common feature of all processes throughout the production history, however, has
been high temperature (900-1200°C) alkaline roasting with the preferred alkali metal
source being Na2CO3.
6
As a consequence of the presence of large amounts of impurities and the high
throughputs of ore, millions of tonnes of hazardous wastes, known as chromite ore
processing residue (COPR), have been produced. Historically, approximately 1 tonne
of COPR was generated per tonne of Na2CrO4 produced, and the COPR typically
contained 8-12% Cr2O3 (w/w) (Darrie, 2001). Most COPR was used as back-fill due
to its sandy, granular structure, e.g. for clay pits, other surface mining pits, or placed
in poorly constrained landfill sites; and these locations are now often referred to as
the “contaminant legacy” of Cr chemicals production. Even in the early 2000s, it was
estimated that up to 600 kT y-1 COPR was still being generated collectively by “high-
lime” Cr chemical works around the world (Darrie, 2001), and so similar concerns
remain about the disposal of such highly alkaline, Cr-containing materials.
In Hudson County, USA, there were over 200 areas which contain COPR where it
was used as a fill material because of its favourable physical properties (Wazna et al.
2007). Approximately 800,000 m3 of COPR waste was dumped into an area of the
Hudson Bay Estuary between 1905 and 1954 (Magar et al., 2008).
In China approximately 6 million tonnes of COPR has been produced with disposal
often occurring near densely populated areas (Min et al., 2017). In India, due to the
demand of Cr chemicals for leather tanning, large amounts of Cr chemicals are
produced, often using the high lime extraction process (Matern et al., 2016). A waste
disposal site near a former Cr chemical works, which was in operation between ~1980
and 2005, contained an estimated 30,000 tonnes of waste. Other sites are still
producing Cr chemical in India, with the waste material often being used in the
construction of roads and other earth works due to the desirable physical properties
of COPR.
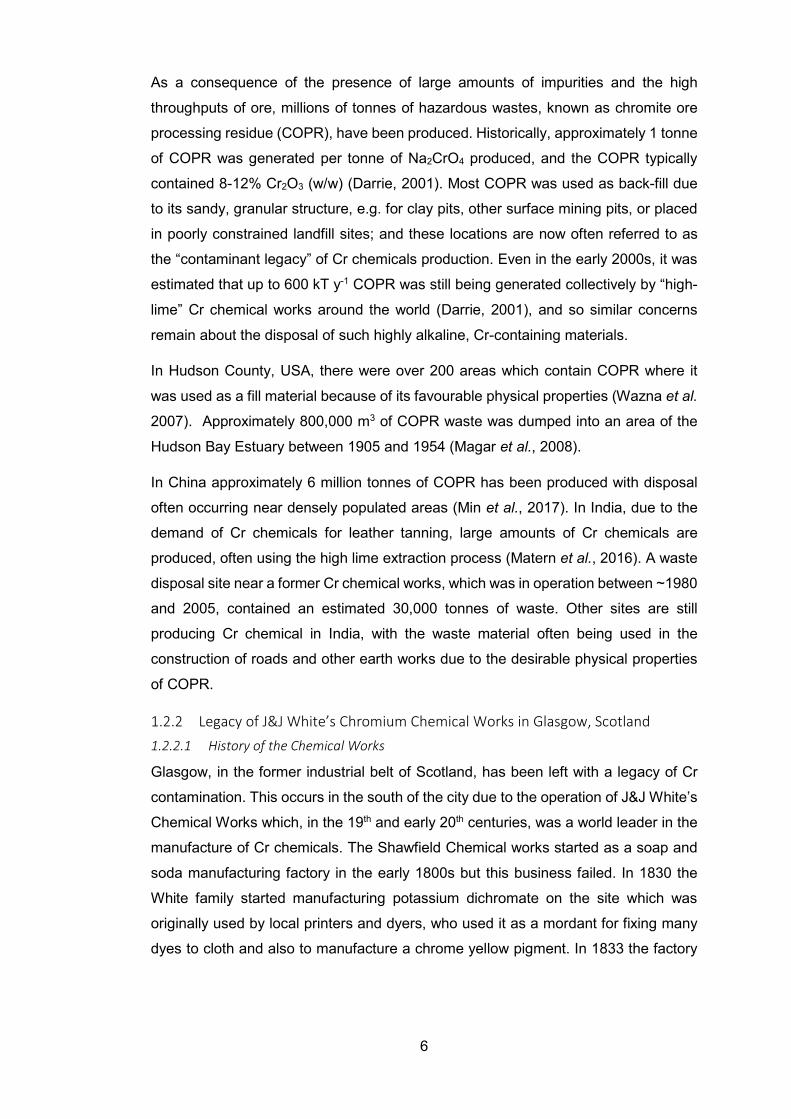
1.2.2 Legacy of J&J White’s Chromium Chemical Works in Glasgow, Scotland 1.2.2.1 History of the Chemical Works
Glasgow, in the former industrial belt of Scotland, has been left with a legacy of Cr
contamination. This occurs in the south of the city due to the operation of J&J White’s
Chemical Works which, in the 19th and early 20th centuries, was a world leader in the
manufacture of Cr chemicals. The Shawfield Chemical works started as a soap and
soda manufacturing factory in the early 1800s but this business failed. In 1830 the
White family started manufacturing potassium dichromate on the site which was
originally used by local printers and dyers, who used it as a mordant for fixing many
dyes to cloth and also to manufacture a chrome yellow pigment. In 1833 the factory
7
stopped manufacturing other chemicals and focused solely on the manufacture of
potassium dichromate which it continued to produce from Turkish and Russian
chromite ore. The factory grew in size until it covered approximately a 20 acre (8.1
ha) area along the River Clyde and employed, at its maximum, more than 500
workers. The demand for chromium chemicals increased as they were used for more
and more industrial processes, such as bleaching of oils and fats, and leather tanning.
The output from the Shawfield chemical works, at its peak, was greater than all other
factories of its kind in Great Britain (MacLehose, 1886). This commercial success was
largely due to the development of a new method for extracting chromate from chromite
ore as described in Section 1.2.2.2 below. The factory closed in 1968 due to the rising
costs of transportation and the decline in demand for chromium chemicals.
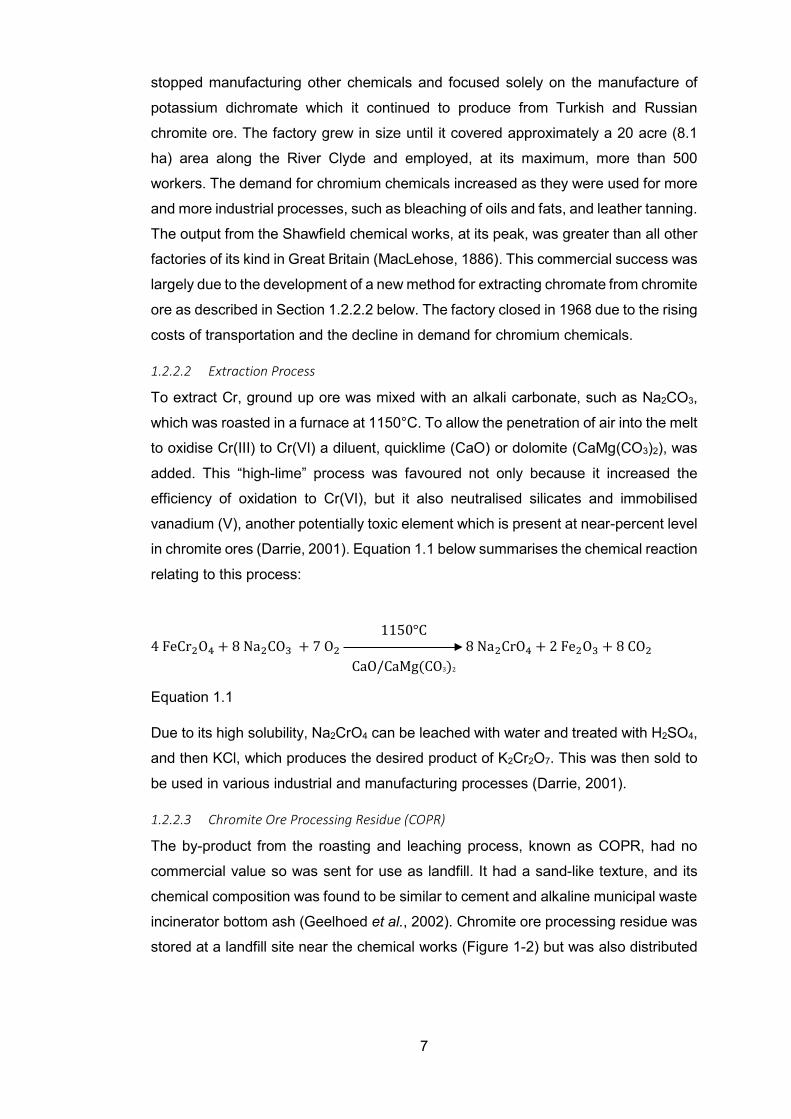
1.2.2.2 Extraction Process
To extract Cr, ground up ore was mixed with an alkali carbonate, such as Na2CO3,
which was roasted in a furnace at 1150°C. To allow the penetration of air into the melt
to oxidise Cr(III) to Cr(VI) a diluent, quicklime (CaO) or dolomite (CaMg(CO3)2), was
added. This “high-lime” process was favoured not only because it increased the
efficiency of oxidation to Cr(VI), but it also neutralised silicates and immobilised
vanadium (V), another potentially toxic element which is present at near-percent level
in chromite ores (Darrie, 2001). Equation 1.1 below summarises the chemical reaction
relating to this process:
4 FeCr2O4 + 8 Na2CO3 + 7 O2 8 Na2CrO4 + 2 Fe2O3 + 8 CO2
Equation 1.1
Due to its high solubility, Na2CrO4 can be leached with water and treated with H2SO4,
and then KCl, which produces the desired product of K2Cr2O7. This was then sold to
be used in various industrial and manufacturing processes (Darrie, 2001).
1.2.2.3 Chromite Ore Processing Residue (COPR)
The by-product from the roasting and leaching process, known as COPR, had no
commercial value so was sent for use as landfill. It had a sand-like texture, and its
chemical composition was found to be similar to cement and alkaline municipal waste
incinerator bottom ash (Geelhoed et al., 2002). Chromite ore processing residue was
stored at a landfill site near the chemical works (Figure 1-2) but was also distributed
1150°C
CaO/CaMg(CO3)2
8
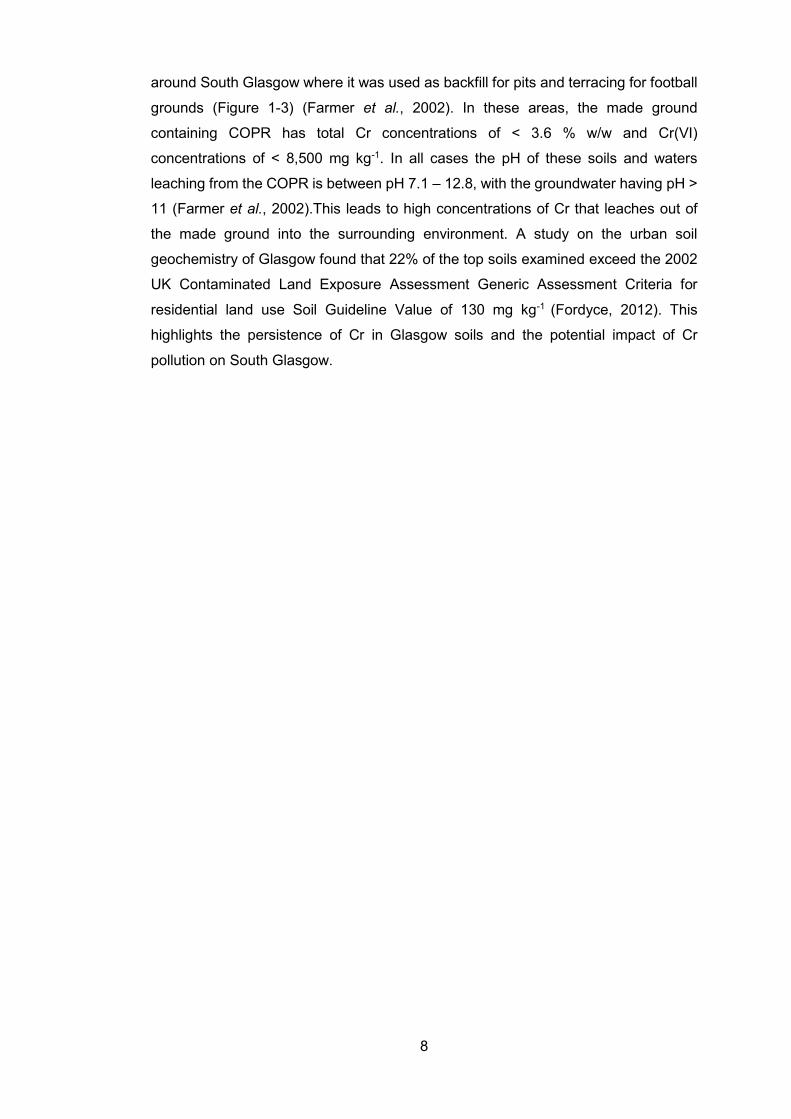
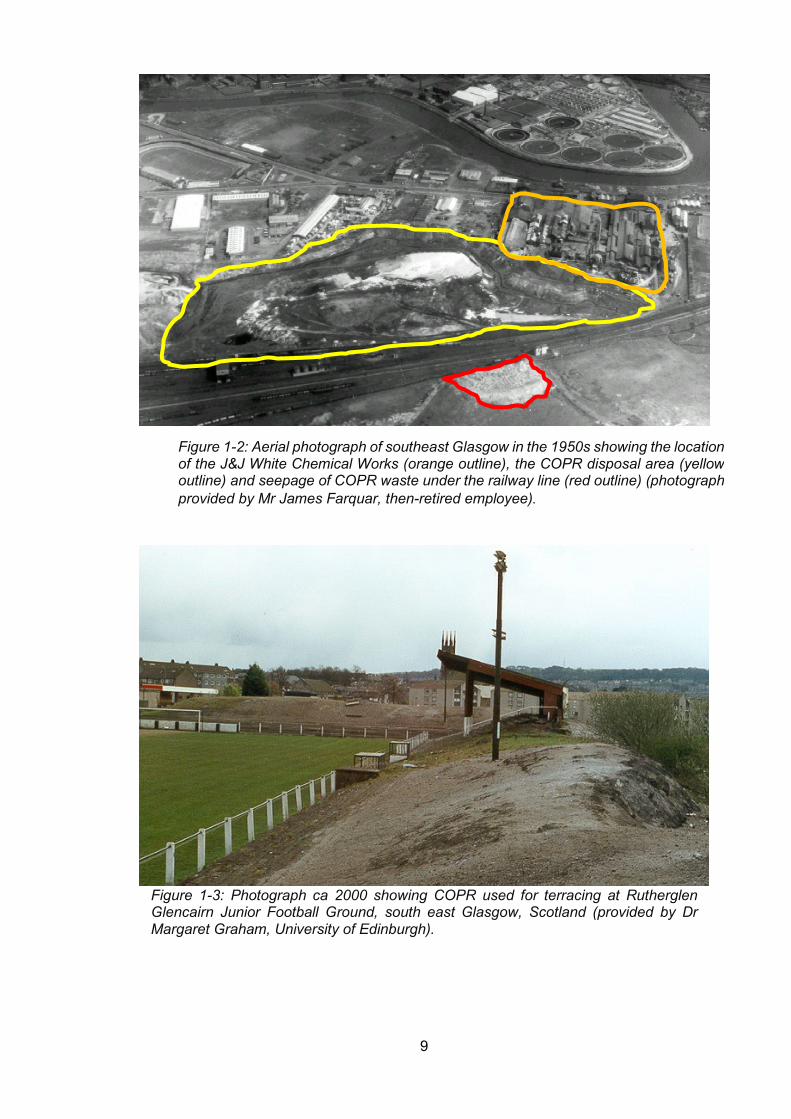
around South Glasgow where it was used as backfill for pits and terracing for football
grounds (Figure 1-3) (Farmer et al., 2002). In these areas, the made ground
containing COPR has total Cr concentrations of < 3.6 % w/w and Cr(VI)
concentrations of < 8,500 mg kg-1. In all cases the pH of these soils and waters
leaching from the COPR is between pH 7.1 – 12.8, with the groundwater having pH >
11 (Farmer et al., 2002).This leads to high concentrations of Cr that leaches out of
the made ground into the surrounding environment. A study on the urban soil
geochemistry of Glasgow found that 22% of the top soils examined exceed the 2002
UK Contaminated Land Exposure Assessment Generic Assessment Criteria for
residential land use Soil Guideline Value of 130 mg kg-1 (Fordyce, 2012). This
highlights the persistence of Cr in Glasgow soils and the potential impact of Cr
pollution on South Glasgow.
9
Figure 1-3: Photograph ca 2000 showing COPR used for terracing at Rutherglen Glencairn Junior Football Ground, south east Glasgow, Scotland (provided by Dr Margaret Graham, University of Edinburgh).
Figure 1-2: Aerial photograph of southeast Glasgow in the 1950s showing the location of the J&J White Chemical Works (orange outline), the COPR disposal area (yellow outline) and seepage of COPR waste under the railway line (red outline) (photograph provided by Mr James Farquar, then-retired employee).
10
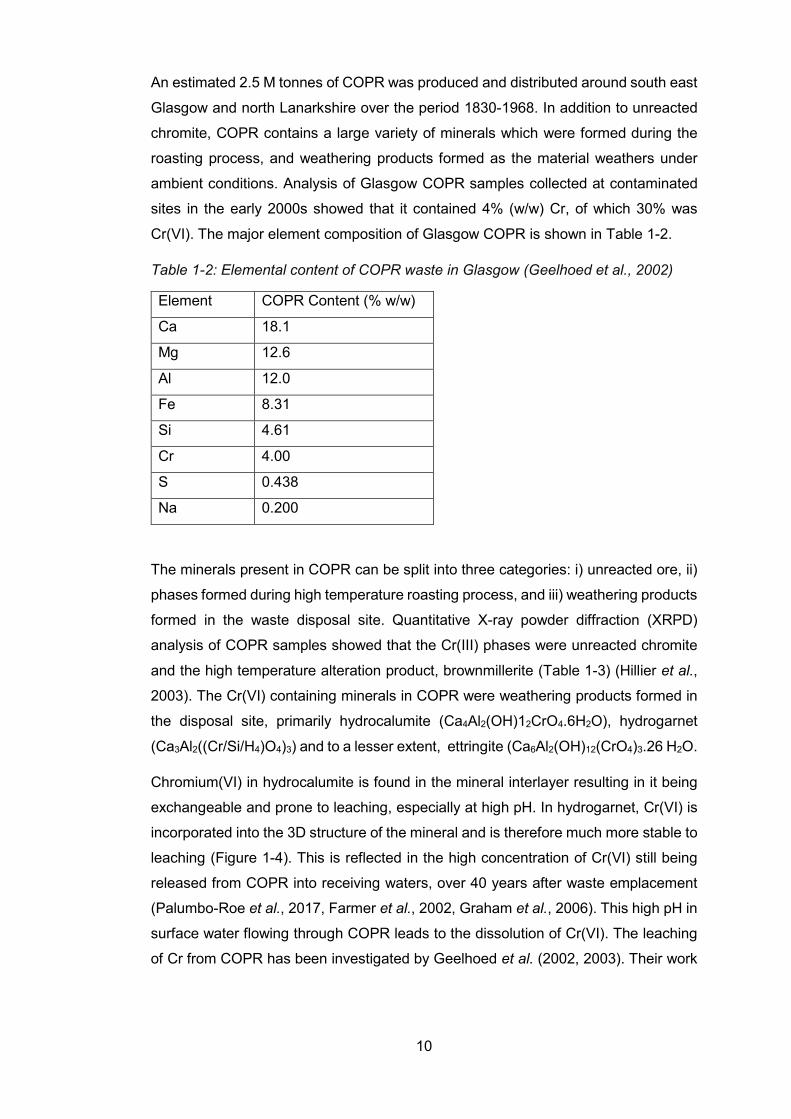
An estimated 2.5 M tonnes of COPR was produced and distributed around south east
Glasgow and north Lanarkshire over the period 1830-1968. In addition to unreacted
chromite, COPR contains a large variety of minerals which were formed during the
roasting process, and weathering products formed as the material weathers under
ambient conditions. Analysis of Glasgow COPR samples collected at contaminated
sites in the early 2000s showed that it contained 4% (w/w) Cr, of which 30% was
Cr(VI). The major element composition of Glasgow COPR is shown in Table 1-2.
Table 1-2: Elemental content of COPR waste in Glasgow (Geelhoed et al., 2002)
Element COPR Content (% w/w)
Ca 18.1
Mg 12.6
Al 12.0
Fe 8.31
Si 4.61
Cr 4.00
S 0.438
Na 0.200
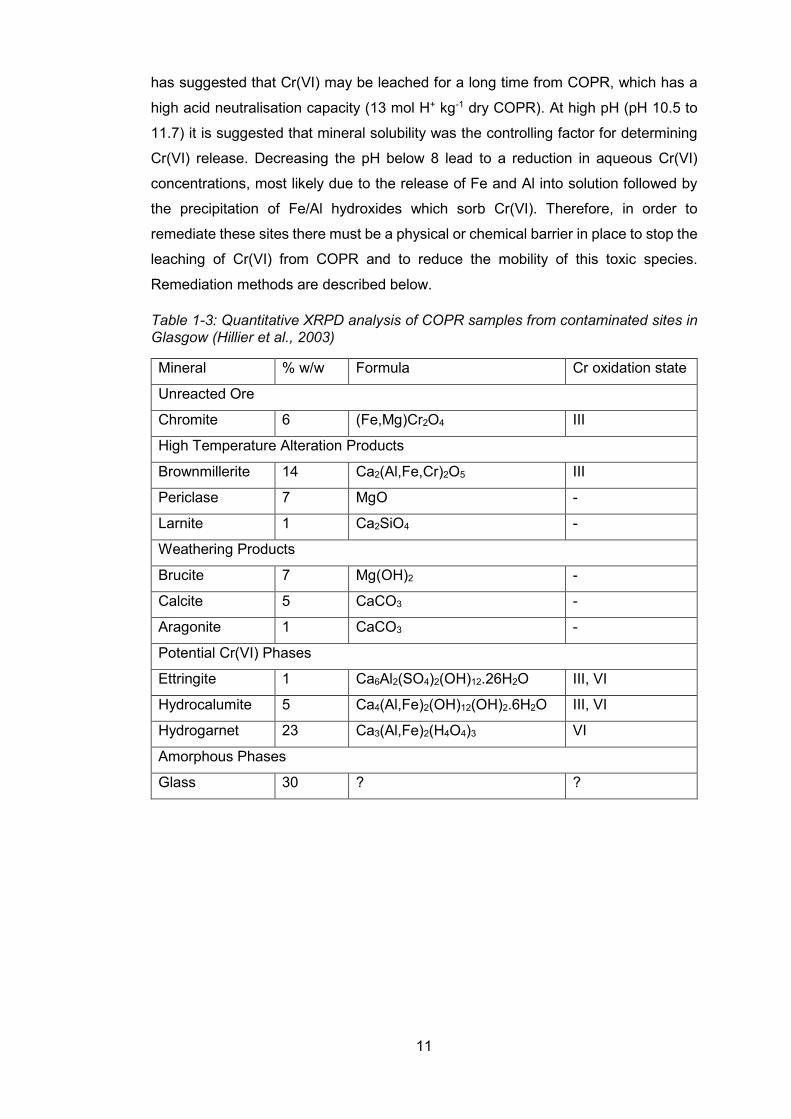
The minerals present in COPR can be split into three categories: i) unreacted ore, ii)
phases formed during high temperature roasting process, and iii) weathering products
formed in the waste disposal site. Quantitative X-ray powder diffraction (XRPD)
analysis of COPR samples showed that the Cr(III) phases were unreacted chromite
and the high temperature alteration product, brownmillerite (Table 1-3) (Hillier et al.,
2003). The Cr(VI) containing minerals in COPR were weathering products formed in
the disposal site, primarily hydrocalumite (Ca4Al2(OH)12CrO4.6H2O), hydrogarnet
(Ca3Al2((Cr/Si/H4)O4)3) and to a lesser extent, ettringite (Ca6Al2(OH)12(CrO4)3.26 H2O.
Chromium(VI) in hydrocalumite is found in the mineral interlayer resulting in it being
exchangeable and prone to leaching, especially at high pH. In hydrogarnet, Cr(VI) is
incorporated into the 3D structure of the mineral and is therefore much more stable to
leaching (Figure 1-4). This is reflected in the high concentration of Cr(VI) still being
released from COPR into receiving waters, over 40 years after waste emplacement
(Palumbo-Roe et al., 2017, Farmer et al., 2002, Graham et al., 2006). This high pH in
surface water flowing through COPR leads to the dissolution of Cr(VI). The leaching
of Cr from COPR has been investigated by Geelhoed et al. (2002, 2003). Their work
11
has suggested that Cr(VI) may be leached for a long time from COPR, which has a
high acid neutralisation capacity (13 mol H+ kg-1 dry COPR). At high pH (pH 10.5 to
11.7) it is suggested that mineral solubility was the controlling factor for determining
Cr(VI) release. Decreasing the pH below 8 lead to a reduction in aqueous Cr(VI)
concentrations, most likely due to the release of Fe and Al into solution followed by
the precipitation of Fe/Al hydroxides which sorb Cr(VI). Therefore, in order to
remediate these sites there must be a physical or chemical barrier in place to stop the
leaching of Cr(VI) from COPR and to reduce the mobility of this toxic species.
Remediation methods are described below.
Table 1-3: Quantitative XRPD analysis of COPR samples from contaminated sites in Glasgow (Hillier et al., 2003)
Mineral % w/w Formula Cr oxidation state
Unreacted Ore
Chromite 6 (Fe,Mg)Cr2O4 III
High Temperature Alteration Products
Brownmillerite 14 Ca2(Al,Fe,Cr)2O5 III
Periclase 7 MgO -
Larnite 1 Ca2SiO4 -
Weathering Products
Brucite 7 Mg(OH)2 -
Calcite 5 CaCO3 -
Aragonite 1 CaCO3 -
Potential Cr(VI) Phases
Ettringite 1 Ca6Al2(SO4)2(OH)12.26H2O III, VI
Hydrocalumite 5 Ca4(Al,Fe)2(OH)12(OH)2.6H2O III, VI
Hydrogarnet 23 Ca3(Al,Fe)2(H4O4)3 VI
Amorphous Phases
Glass 30 ? ?
12
Figure 1-4: Structure of A) hydrocalumite showing exchangeable Cr(VI) in the interlayers and B) hydrogarnet showing Cr(VI) as part of the 3D mineral structure
Remediation of COPR-contaminated sites The remediation of contaminated land is required if there is an unacceptable risk
posed to humans. The method used to remediate a site often has to be tailored to the
site and depends on the scale of the pollution along with the pollutant and site’s
chemical and physical properties (Rao et al., 2017). Approaches often used to
remediate land contaminated with inorganic contaminates, such as Cr, are to remove
and replace the material, create a physical barrier to remove the pathway of exposure
– such as capping the land, or chemical treatment methods which convert the metal
into an immobile or less toxic species by processes such as stabilisation or
oxidation/reduction (Rao et al., 2017, Ying, 2018).
Due to the large mass of soil which contains elevated Cr concentrations, the removal
of material and replacement with fresh soil is prohibitively expensive, and although
capping of Cr contaminated land will reduce the exposure of dust and solid phase
material, the leaching of Cr(VI) from the waste into groundwater may still occur.
Therefore, chemical reduction strategies where there is irreversible reduction of Cr(VI)
to Cr(III) are thought to be the best remediation strategies (He et al., 2018). There
13
have been many remediation strategies developed using Fe species, organic matter
(OM) or sulfides to reduce Cr(VI) in soils (Wang et al., 2019, Graham et al., 2006,
Guan et al., 2019), but in the extreme alkaline pH of COPR, remediation strategies
which were developed for acidic to neutral pH ranges may not be applicable (Graham
et al., 2006). One such method developed for the remediation of Cr(VI) in alkaline
waste was the use of calcium polysulfide (CaSx), which has been shown to effectively
remediate Cr in alkaline ground water and COPR waste, and has been successfully
demonstrated to reduce Cr(VI) concentrations (Wazne et al., 2007).
Calcium polysulfide was used in 2013 to successfully remediate a 1-hectare site for
the Clyde Gateway Project in Glasgow near the former J&J White Chromium works
(Graham et al., 2006, Bewley and Sojka, 2013). This, along with the capping of COPR
by building the new M74 motorway extension on top of one of the disposal sites,
effectively encasing it in concrete, have been two notable COPR remediation works
in Glasgow. However, there is still unknown land which contains high concentration
of Cr(VI) which is hard to access, for example buried several metres below the
surface. Leaching of Cr(VI) from these sites will continue to pollute groundwater and
the fate of this Cr is unknown when it interacts with sediments and banking soils.
Fate of chromium in contaminated waterways Waterways are dynamic systems where the contrasting environment of the oxic water,
anoxic sediments, and banking soils have different influences on the fate of Cr. In
areas where COPR has been dumped, the fate of Cr is important in assessing risk of
oxidation and rerelease of Cr. In the Hudson Bay, New Jersey USA, sediment near
the COPR disposal site has total Cr and Cr(VI) concentrations of up to 9190 and 30.7
mg kg-1, respectively, whilst Cr(VI) concentrations of the water were below the limit of
detection (LoD). The oxidation of Cr(III) in the sediments was measured and
determined to be minimal with no Cr(VI) detected after the suspension of sediment in
oxic water (Magar et al., 2008, Martello et al., 2007). This suggests that Cr is
immobilised in these sediments. A study by Wadhawan et al. (2013) of Baltimore
Harbour USA, showed that the anoxic sediments were able to reduce and immobilise
Cr(VI), however the resuspension of the sediment did result in the re-oxidation of
Cr(III). The contrasting results highlight the impact that site specific conditions have
on the fate of Cr in different areas.
In Glasgow, the Polmadie Burn drains an area which contains COPR and runs within
20 m of the former Cr chemical works. This stream, a tributary to the River Clyde, is
14
mainly culverted but its final 500 m section, along the perimeter of Richmond Park is
exposed. The stream is surrounded by steep, highly vegetated banks and the water
level is weakly influenced by the tidal stream of the River Clyde. The burn water,
sediment, and banking soil contain elevated Cr concentrations with up to 6.28 mg L-1
measured in surface waters and < 8,740 mg kg-1 of Cr in the sediments (Palumbo-
Roe et al., 2017, Farmer et al., 2002). A study by Palumbo-Roe et al. (2017)
investigated the persistence of Cr(VI) in the hyporheic zone and compositional
changes on Cr in the hyporheic zone along with its potential for the attenuation of Cr.
They found that Cr(VI) in the hyporheic zone Cr was able to reduce, and immobilise
Cr(VI), but the poor exchange and long half-life of solutes in the hyporheic resulted in
the low attenuation of Cr(VI) from the burn water (Palumbo-Roe et al., 2017). This
provided insight into one of the many potential processes that affects the fate of Cr in
urban waterways, but there are still many other processes which need to be
considered if the fate of Cr in this system is to be understood, for example:
i) The release of Cr from sediments during resuspension
ii) The banking soil and sediment Cr association (i.e. is it bound to Fe
hydroxides, OM or COPR minerals? etc.)
iii) The species of Cr released from soils and sediments, and the impact of
environmental changes
a. such as the long-term dry spells on the leachability of Cr when the
material is rewetted or
b. how flooding events impact the release and attenuation of Cr
It is important to investigate the potential risk that the area has on the exposure of Cr
to the local population due to the site’s history. The COPR cause high concentrations
of Cr in nearby waters, soils, and sediments whilst new housing is under construction
in the area. Evaluation of the processes outlined, along with investigating the mobility
and speciation of Cr in the area, are key in beginning to understand the exposure risk
of Cr in the area and human health.
Human health impacts associated with exposure to chromium Although exposure to high levels of Cr(III) can have a detrimental effect on human
health, these instances are more rare than exposure to Cr(VI). Moreover, Cr(III) is an
essential element for animal and human health. The main concern relates to the toxic
effects of Cr(VI). Importantly, different exposure routes can lead to a range of health
problems (PHE, 2007, ATSDR, 2012). Acute Cr(VI) poisoning usually occurs from
15
oral administration and can be fatal. Such severe exposure is unlikely to occur
naturally, instead it is mainly linked to occupational exposure with recorded cases,
usually due to accidental exposures or suicide attempts. Although not directly related
to humans, the lethal dose 50 (LD50) for rats ingesting Cr(VI) was observed to be 16
mg kg-1 and 29 mg kg-1 for female and male rats, respectively. Chronic exposure to Cr
is more likely to occur through inhalation and skin contact (ATSDR, 2012).
Chromium(VI) is a carcinogen and inhalation of Cr(VI) has been proven to result in
lung cancer (WHO, 2000). Short term exposure through skin contact can lead to
contact dermatitis, burns, and necrosis of the skin. Longer term exposure can lead to
so-called “chrome holes” which are the formation of deep ulcers on the skin (PHE,
2007)
There is a difference in toxicity between the two Cr oxidation states mainly because
Cr(VI) is more readily absorbed by the body than Cr(III). Furthermore, Cr(VI) has a
greater ability than Cr(III) to efficiently cross the cell membrane, where it is
subsequently reduced to Cr(III) which then becomes trapped in the cells. This
‘trapped’ Cr(III) can then interact with cellular macromolecules, such as DNA to cause
mutation (USEPA, 1998). The Cr(VI) reduction also produces reactive intermediates,
Cr(V) and Cr(IV), which cause further damage to tissue and DNA. The tissue damage
and mutations are considered to be the first steps in the development of the serious
health effects detailed above.
People who work with Cr and its chemicals are most at risk from chronic health effects.
This was even recognised in the early 20th century when the effects of Cr on worker
health started to be investigated (Bloomfield and Blum, 1928, Trumper, 1931). Lung
cancer was common in workers at chrome works and others who were exposed to
high concentrations of Cr dust. At the current time, those who work in chromate
production, i.e. the stainless steel industry (especially welders), and chrome
pigmentation, are likely to be exposed to the highest concentrations of airborne Cr(VI)
(ATSDR, 2012).
The general population can also be exposed to Cr(VI) due to inhaling particulate Cr
in ambient air, drinking Cr(VI) contaminated water, or ingesting food contaminated
with Cr. This generally occurs from living near industries that use Cr or near Cr waste
disposal sites. It is important to recognise that the concentrations of Cr(VI) found in
environmental matrices such as dusts, soils/sediments, and water, do not necessarily
reflect the percentage of Cr absorbed by the body (Broadway et al., 2010, Jardine et
16
al., 2013). Contaminants incorporated on dust particles suspended in the air can be
inhaled where toxic metals, such as Cr(VI), can be absorbed into the body through
the lungs. The percentage of the contaminant absorbed from the dust into the lungs
is determined as the inhalation bioaccessibility. Contaminants in soil/sediment or
water that are ingested can also be absorbed through the gastrointestinal tract. The
percentage of a contaminant absorbed through the gastrointestinal tract, i.e. the oral
bioavailability, is an important factor in determining the health risks that may be
associated with land contamination. A previous study on COPR-contaminated soil
from Glasgow demonstrated that due to the low pH of the stomach and high organic
matter content of the soil, Cr(VI) was readily reduced to the relatively nontoxic Cr(III)
form making the oral bioaccessibility of Cr in the tested soils around 5% (Broadway
et al., 2010). This suggested a lesser risk of uptake from ingested Cr, so the main
risk is perceived to be from inhaled Cr where there have been limited studies on its
inhalation bioaccessibility. The study by Broadway et al. (2010) did some limited
inhalation bioaccessibility testing and suggested that Cr(VI) was bioaccessible but
more work is needed to confirm their findings.
Overarching aims and specific objectives South Glasgow has a legacy of Cr pollution due to the disposal of COPR in landfill
and using the material for terracing in sports grounds etc. These areas impacted with
COPR have been extensively studied, but the fate of Cr once it gets into the wider
environment has yet to be fully understood. Specifically, the fate of Cr in urban
waterways needs to be investigated to understand the scope of the persistence and
potential rerelease of Cr from stream banking soils and sediments. Changes in the
environment, specifically the flow of urban streams, can change over time due to the
diversion of water courses in the forever adapting urban areas, or due to changes in
the climate leading to greater variability in rainfall. This may lead to changes in the
speciation of Cr and/or its release from previously stable states, which may in turn
have a negative effect on human health. The impact of soils with elevated Cr
concentrations on human health is important to understand, especially as land is
being reclaimed for housing and public space due to the ever-expanding population.
This may expose more people to Cr and the potential health effects of Cr, a known
carcinogen, in dust has not been fully quantified.
To address these issues and improve understanding of Cr behaviour in a
contaminated urban environment, the central aim of this thesis was to identify and
17
characterise the processes which control Cr retention and release in the Polmadie
sediment-water-banking soil system in southeast Glasgow, through direct analysis of
environmental samples and through laboratory simulations of drying and rewetting
processes. A second aim was then to evaluate the inhalation bioaccessibility of the
fine fractions of soils and assess the likely risk to human health. These aims were
achieved through the following specific objectives:
1. Evaluate the temporal trends of the constituents of the Polmadie Burn through
a freedom of information request to the Scottish Environment Protection
Agency who provide a dataset of parameters spanning the years 1967 – 2017.
2. Quantify the concentrations and speciation of Cr(III) and Cr(VI) in the
Polmadie Burn water, sediment, and banking soils, and identify their
associations through sequential analysis of the soils and sediments.
3. Evaluate the effect that drying and rewetting has on the species and release
of Cr from contaminated sediment and banking soil of the Polmadie Burn.
4. Predict the ability of the soils and sediment to act as a sink and source of Cr.
5. Define the inhalation bioaccessibility of Cr in the <10 µm fraction of banking
soil and sediment of the Polmadie Burn.
18
2 Literature review of the environmental chemistry of
chromium
Introduction Chromium is found in its 3+ and 6+ oxidation states in the environment, both of which
have contrasting chemical and physical properties, namely the solubility and binding
to particles (Rai et al., 1989). The solubility of Cr(III) is generally very low due to its
tendency to form insoluble hydroxides complexes at pH >5 and its high affinity for
organic matter (OM). On the other hand, Cr(VI) is generally soluble at pH >4 and
forms weak surface complexes with soil/sediment particles. Therefore, the speciation
of Cr must be understood to predict its mobility in the environment. This section
reviews current knowledge regarding the oxidation and reduction reactions of Cr,
along with the binding of Cr(III) and Cr(VI) to evaluate its mobility within waters, soils,
and sediments.
2.1.1 Overview of the properties of chromium oxidation states in the environment 2.1.1.1 Chromium(III)
The mobility of Cr in soils is affected by a number of factors such as: the Cr species
present, pH, redox potential, the minerals present, competing ions present, and the
OM content (Kim and Dixon, 2002, Kotaś and Stasicka, 2000, Rai et al., 1989,
Fendorf, 1995, Richard and Bourg, 1991). Chromium(III) is generally the more
common oxidation state in reducing environments. It is also the dominant species in
soils with a high OM content and low Mn concentrations. This is because OM is a
main reductant for most redox-sensitive metals in the natural environment
(Stevenson, 1982), with reduction rates that increase with decreasing pH. At pH >5 it
forms insoluble hydroxides, but when the pH decreases below pH 5 Cr(III) becomes
soluble (Fendorf, 1995). The insoluble nature of Cr(III) hydroxides at mildly acid to
alkaline pH means that most soils and sediments contain very low concentrations of
truly dissolved Cr(III), i.e. free ions and hydrolysis complexes. As well as forming
hydroxide compounds, Cr(III) also forms stable complexes with OM. Where this
occurs, the solubility of OM can greatly increase the release of Cr into solution through
its binding to dissolved and colloidal OM (Puzon et al., 2005).
2.1.1.2 Chromium(VI)
The main Cr(VI) species found in the environment are chromate (CrO42-) and
dichromate (HCrO4-), as shown in Figure 2-1. Under extremely oxidising conditions,
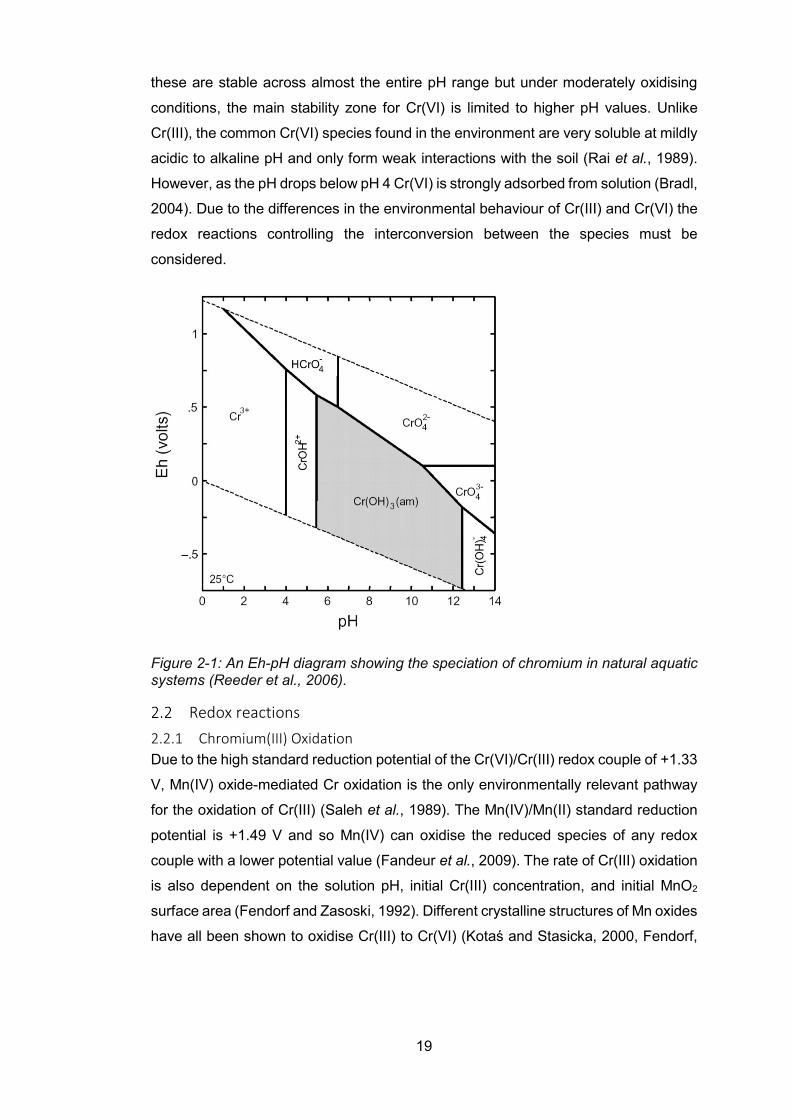
19
these are stable across almost the entire pH range but under moderately oxidising
conditions, the main stability zone for Cr(VI) is limited to higher pH values. Unlike
Cr(III), the common Cr(VI) species found in the environment are very soluble at mildly
acidic to alkaline pH and only form weak interactions with the soil (Rai et al., 1989).
However, as the pH drops below pH 4 Cr(VI) is strongly adsorbed from solution (Bradl,
2004). Due to the differences in the environmental behaviour of Cr(III) and Cr(VI) the
redox reactions controlling the interconversion between the species must be
considered.
Figure 2-1: An Eh-pH diagram showing the speciation of chromium in natural aquatic systems (Reeder et al., 2006).
Redox reactions 2.2.1 Chromium(III) Oxidation Due to the high standard reduction potential of the Cr(VI)/Cr(III) redox couple of +1.33
V, Mn(IV) oxide-mediated Cr oxidation is the only environmentally relevant pathway
for the oxidation of Cr(III) (Saleh et al., 1989). The Mn(IV)/Mn(II) standard reduction
potential is +1.49 V and so Mn(IV) can oxidise the reduced species of any redox
couple with a lower potential value (Fandeur et al., 2009). The rate of Cr(III) oxidation
is also dependent on the solution pH, initial Cr(III) concentration, and initial MnO2
surface area (Fendorf and Zasoski, 1992). Different crystalline structures of Mn oxides
have all been shown to oxidise Cr(III) to Cr(VI) (Kotaś and Stasicka, 2000, Fendorf,
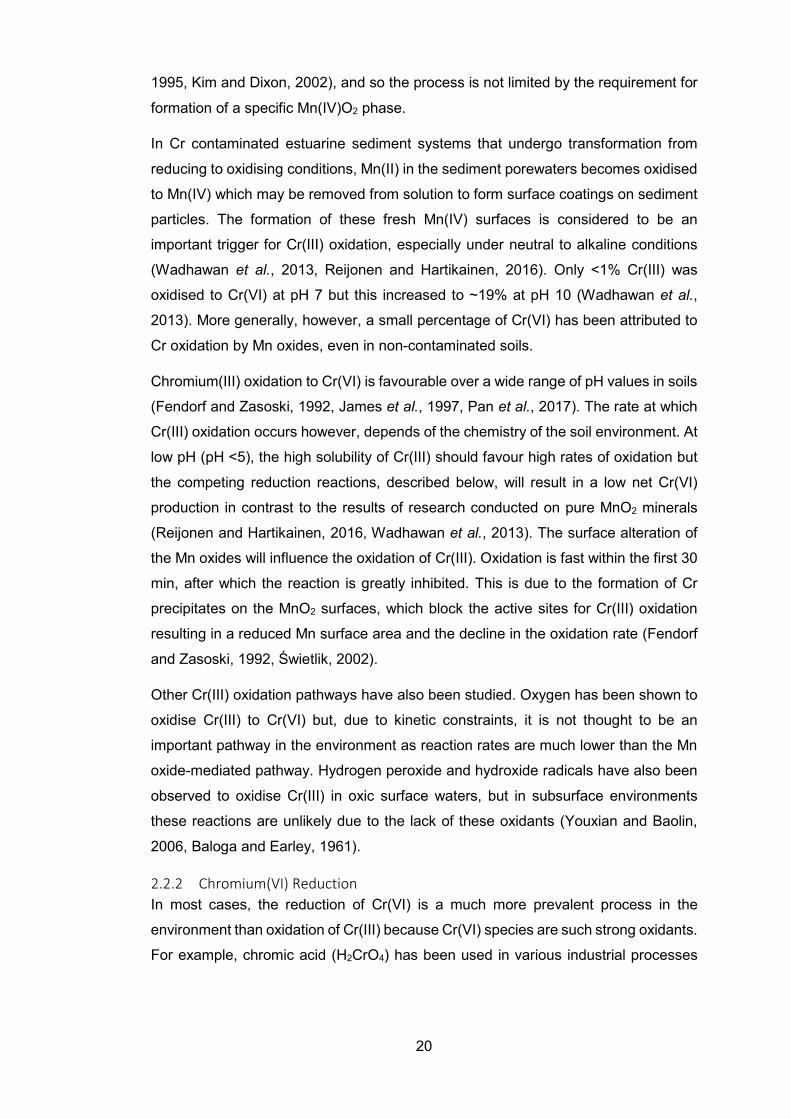
20
1995, Kim and Dixon, 2002), and so the process is not limited by the requirement for
formation of a specific Mn(IV)O2 phase.
In Cr contaminated estuarine sediment systems that undergo transformation from
reducing to oxidising conditions, Mn(II) in the sediment porewaters becomes oxidised
to Mn(IV) which may be removed from solution to form surface coatings on sediment
particles. The formation of these fresh Mn(IV) surfaces is considered to be an
important trigger for Cr(III) oxidation, especially under neutral to alkaline conditions
(Wadhawan et al., 2013, Reijonen and Hartikainen, 2016). Only <1% Cr(III) was
oxidised to Cr(VI) at pH 7 but this increased to ~19% at pH 10 (Wadhawan et al.,
2013). More generally, however, a small percentage of Cr(VI) has been attributed to
Cr oxidation by Mn oxides, even in non-contaminated soils.
Chromium(III) oxidation to Cr(VI) is favourable over a wide range of pH values in soils
(Fendorf and Zasoski, 1992, James et al., 1997, Pan et al., 2017). The rate at which
Cr(III) oxidation occurs however, depends of the chemistry of the soil environment. At
low pH (pH <5), the high solubility of Cr(III) should favour high rates of oxidation but
the competing reduction reactions, described below, will result in a low net Cr(VI)
production in contrast to the results of research conducted on pure MnO2 minerals
(Reijonen and Hartikainen, 2016, Wadhawan et al., 2013). The surface alteration of
the Mn oxides will influence the oxidation of Cr(III). Oxidation is fast within the first 30
min, after which the reaction is greatly inhibited. This is due to the formation of Cr
precipitates on the MnO2 surfaces, which block the active sites for Cr(III) oxidation
resulting in a reduced Mn surface area and the decline in the oxidation rate (Fendorf
and Zasoski, 1992, Świetlik, 2002).
Other Cr(III) oxidation pathways have also been studied. Oxygen has been shown to
oxidise Cr(III) to Cr(VI) but, due to kinetic constraints, it is not thought to be an
important pathway in the environment as reaction rates are much lower than the Mn
oxide-mediated pathway. Hydrogen peroxide and hydroxide radicals have also been
observed to oxidise Cr(III) in oxic surface waters, but in subsurface environments
these reactions are unlikely due to the lack of these oxidants (Youxian and Baolin,
2006, Baloga and Earley, 1961).
2.2.2 Chromium(VI) Reduction In most cases, the reduction of Cr(VI) is a much more prevalent process in the
environment than oxidation of Cr(III) because Cr(VI) species are such strong oxidants.
For example, chromic acid (H2CrO4) has been used in various industrial processes
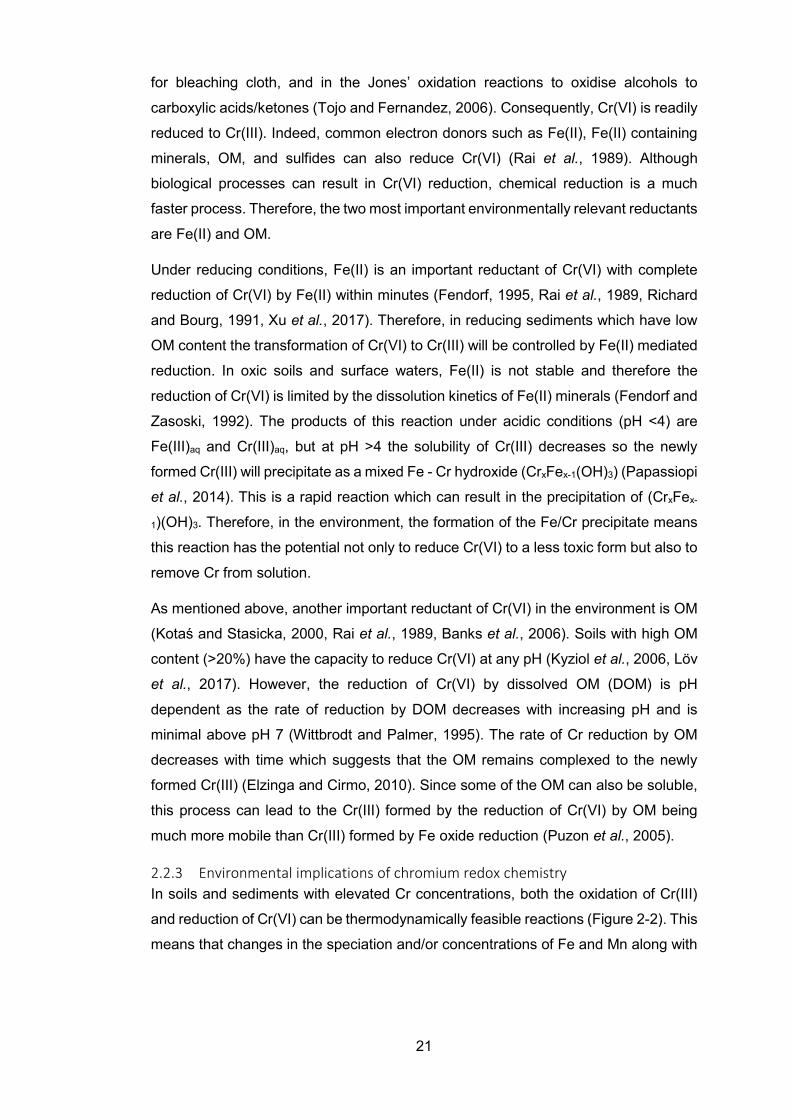
21
for bleaching cloth, and in the Jones’ oxidation reactions to oxidise alcohols to
carboxylic acids/ketones (Tojo and Fernandez, 2006). Consequently, Cr(VI) is readily
reduced to Cr(III). Indeed, common electron donors such as Fe(II), Fe(II) containing
minerals, OM, and sulfides can also reduce Cr(VI) (Rai et al., 1989). Although
biological processes can result in Cr(VI) reduction, chemical reduction is a much
faster process. Therefore, the two most important environmentally relevant reductants
are Fe(II) and OM.
Under reducing conditions, Fe(II) is an important reductant of Cr(VI) with complete
reduction of Cr(VI) by Fe(II) within minutes (Fendorf, 1995, Rai et al., 1989, Richard
and Bourg, 1991, Xu et al., 2017). Therefore, in reducing sediments which have low
OM content the transformation of Cr(VI) to Cr(III) will be controlled by Fe(II) mediated
reduction. In oxic soils and surface waters, Fe(II) is not stable and therefore the
reduction of Cr(VI) is limited by the dissolution kinetics of Fe(II) minerals (Fendorf and
Zasoski, 1992). The products of this reaction under acidic conditions (pH <4) are
Fe(III)aq and Cr(III)aq, but at pH >4 the solubility of Cr(III) decreases so the newly
formed Cr(III) will precipitate as a mixed Fe - Cr hydroxide (CrxFex-1(OH)3) (Papassiopi
et al., 2014). This is a rapid reaction which can result in the precipitation of (CrxFex-
1)(OH)3. Therefore, in the environment, the formation of the Fe/Cr precipitate means
this reaction has the potential not only to reduce Cr(VI) to a less toxic form but also to
remove Cr from solution.
As mentioned above, another important reductant of Cr(VI) in the environment is OM
(Kotaś and Stasicka, 2000, Rai et al., 1989, Banks et al., 2006). Soils with high OM
content (>20%) have the capacity to reduce Cr(VI) at any pH (Kyziol et al., 2006, Löv
et al., 2017). However, the reduction of Cr(VI) by dissolved OM (DOM) is pH
dependent as the rate of reduction by DOM decreases with increasing pH and is
minimal above pH 7 (Wittbrodt and Palmer, 1995). The rate of Cr reduction by OM
decreases with time which suggests that the OM remains complexed to the newly
formed Cr(III) (Elzinga and Cirmo, 2010). Since some of the OM can also be soluble,
this process can lead to the Cr(III) formed by the reduction of Cr(VI) by OM being
much more mobile than Cr(III) formed by Fe oxide reduction (Puzon et al., 2005).
2.2.3 Environmental implications of chromium redox chemistry In soils and sediments with elevated Cr concentrations, both the oxidation of Cr(III)
and reduction of Cr(VI) can be thermodynamically feasible reactions (Figure 2-2). This
means that changes in the speciation and/or concentrations of Fe and Mn along with
22
changes in OM content have important impacts on the species of Cr present (Reijonen
and Hartikainen, 2016, Wadhawan et al., 2013). Wadhawan et al. (2013) investigated
Cr inputs from COPR in an estuarine environment in Baltimore Harbour, an area
known to be contaminated with COPR. Characterisation of surface sediment grab
samples showed that Cr was mainly present as Cr(III) within the sediments, and there
was not a significant amount of Cr(VI) detected in either the sediment or sediment
porewaters. Laboratory experiments involving spiking sediment samples with Cr(VI)
resulted in its reduction to Cr(III) under anoxic conditions. These were followed by
experiments where anaerobic sediment samples were suspended in aerated waters.
In these 1-15% of the newly formed Cr(III) was oxidised back to Cr(VI). Results from
non-spiked control sediment samples, however, showed that none of the native Cr(III)
was oxidised.
An investigation by Reijonen et al. (2016) found that when MnO2 was added to soil
and incubated for 47 days at 22°C net Cr(III) oxidation was observed, but no net Cr(III)
oxidation was observed in soils without added MnO2. They also reported that at lower
pH the chemical availability of Cr(III) was lower and the amount of Cr(III) oxidised
increased, however the net oxidation of Cr(III) was lower due to the increased
reduction rate of Cr(VI) at lower pH (Reijonen and Hartikainen, 2016).
The composition of the soil/sediment, in particular the Mn oxide and OM content, is
likely to be key in assessing the risk of net Cr(III) oxidation when both Cr(III) oxidation
and Cr(VI) reduction reactions are considered. In aqueous environments if the
interface between the sediment and surface water is at the boundary between oxic
waters and anoxic sediments, this can lead to more complicated environmental
chemistry where Cr can transfer between the aerobic water and the anaerobic
sediment. The interactions of Cr at this interface are summarised in Figure 2-3. The
processes described above are from estuarine environments which will have different
chemistry to freshwater environments such as urban streams with a similar redox
stratification. The difference in mineral phases formed due to changes in the chemistry
may affect the stable species of Cr present and its behaviour in the urban stream
system.
23
Figure 2-2: Chromium oxidation-reduction cycle in soils (Kotaś and Stasicka, 2000).
Figure 2-3: Schematic diagram of the water/sediment interface in an estuarine environment (Wadhawan et al., 2013). Note: NOM = natural organic matter
Adsorption, precipitation/dissolution and complexation processes 2.3.1 Adsorption to mineral surfaces Many minerals found in soils and sediments exhibit pH-dependent surface charge as
represented by equations 2.1 and 2.2. The point of net zero proton charge (pHPNZPC)
is the pH at which there is net zero charge on the mineral surface. At pH < pHPNZPC,
24
mineral surfaces have a net positive charge but when pH > pHPNZPC, there is a net
negative charge on the mineral surface (Drever, 1997).
Mineral− OH + H + ↔ Mineral− OH2+ Equation 2.1
Mineral− OH ↔ Mineral− O − + H+ Equation 2.2
The pHPNZPC values are characteristic of individual minerals, e.g. clay minerals
typically have values in the range 2-4 due to the substitution of differently charged
cations in the clay lattice (such as Al3+ for Si4+), whilst Fe oxides typically have values
in the range 7-9 (Tschapek, 1974, Parks and Bruyn, 1962).
Adsorption of solution phase species, such as cationic species of Cr(III) and anionic
species of Cr(VI), is therefore a pH-dependent process which is largely controlled by
the pHPNZPC of the mineral surface, but also by the presence of other ions in solution.
As would be expected on the basis of their differing chemical characteristics, Cr(III)
and Cr(VI) also differ in their sorption behaviour. In general terms, the former exhibits
the typical sorption behaviour of a cation and its adsorption increases with pH, but
decreases when competing cations are present. In contrast, Cr(VI) exhibits the typical
sorption behaviour of an anion and its adsorption decreases with increasing pH and
when competing dissolved anions are present (Richard and Bourg, 1991). Therefore,
more detailed descriptions of their sorption behaviour will be covered separately in
the sections which follow.
2.3.2 Adsorption processes for chromium(III) As described in the preceding sections, Cr(III) is the stable form of Cr under reducing
conditions and is typically present in cationic form under strongly acidic to near-neutral
conditions. Hydrolysis occurs at relatively low pH and from pH 4 to 6, the first and
second hydrolysis products, CrOH2+ and Cr(OH)2+, dominate. Beyond pH 6, the main
species in solution is Cr(OH)30 (Figure 2-4). The onset of hydrolysis at such low pH
values is important for the behaviour of Cr(III) since hydrolysis product formation is
linearly related with the sorption, due to the disruption of the symmetric water co-
ordination sphere of hydrolysable metal ions (Fendorf, 1995). Stumm (1987) showed
that this disruption greatly enhanced ion reactivity, and so strong sorption to soil and
sediment mineral phases would be predicted (Stumm, 1987). The propensity towards
hydrolysis also imparts the low hydroxide solubility of Cr(III); the hydrolysis product,
Cr(OH)3, dominates when solution pH >6 but it is rapidly removed from solution by
precipitation (see Section 2.4).
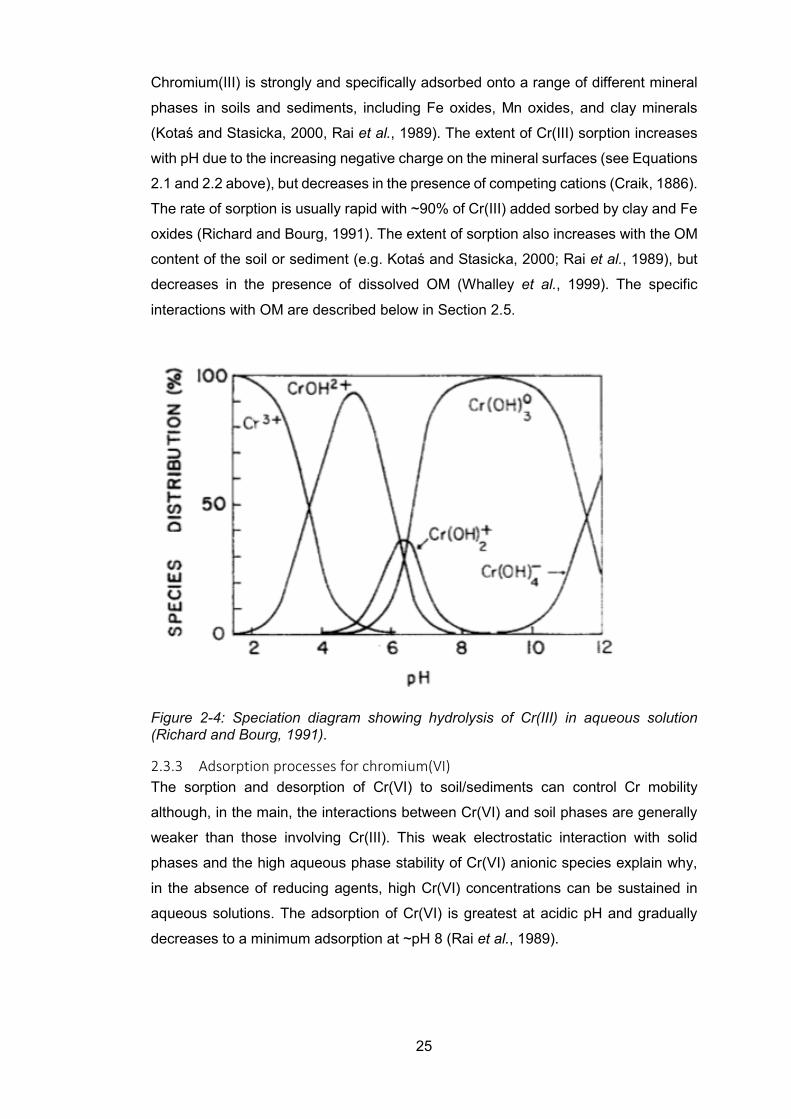
25
Chromium(III) is strongly and specifically adsorbed onto a range of different mineral
phases in soils and sediments, including Fe oxides, Mn oxides, and clay minerals
(Kotaś and Stasicka, 2000, Rai et al., 1989). The extent of Cr(III) sorption increases
with pH due to the increasing negative charge on the mineral surfaces (see Equations
2.1 and 2.2 above), but decreases in the presence of competing cations (Craik, 1886).
The rate of sorption is usually rapid with ~90% of Cr(III) added sorbed by clay and Fe
oxides (Richard and Bourg, 1991). The extent of sorption also increases with the OM
content of the soil or sediment (e.g. Kotaś and Stasicka, 2000; Rai et al., 1989), but
decreases in the presence of dissolved OM (Whalley et al., 1999). The specific
interactions with OM are described below in Section 2.5.
Figure 2-4: Speciation diagram showing hydrolysis of Cr(III) in aqueous solution (Richard and Bourg, 1991).
2.3.3 Adsorption processes for chromium(VI) The sorption and desorption of Cr(VI) to soil/sediments can control Cr mobility
although, in the main, the interactions between Cr(VI) and soil phases are generally
weaker than those involving Cr(III). This weak electrostatic interaction with solid
phases and the high aqueous phase stability of Cr(VI) anionic species explain why,
in the absence of reducing agents, high Cr(VI) concentrations can be sustained in
aqueous solutions. The adsorption of Cr(VI) is greatest at acidic pH and gradually
decreases to a minimum adsorption at ~pH 8 (Rai et al., 1989).
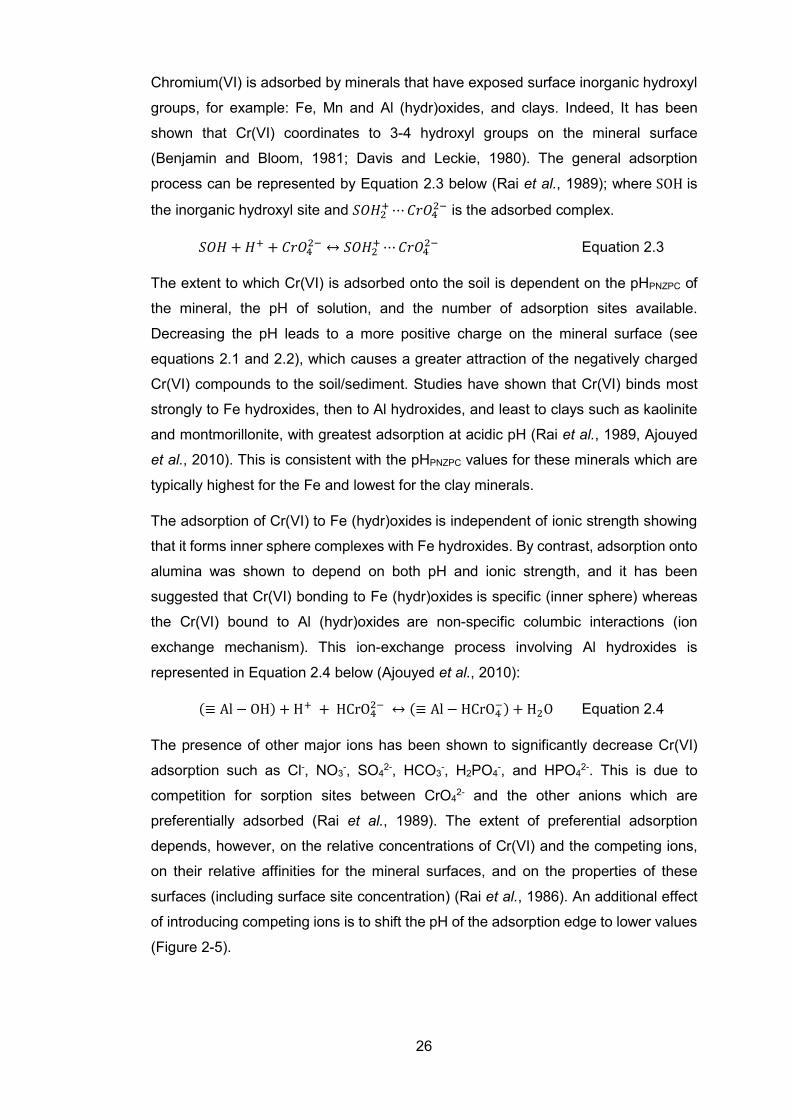
26
Chromium(VI) is adsorbed by minerals that have exposed surface inorganic hydroxyl
groups, for example: Fe, Mn and Al (hydr)oxides, and clays. Indeed, It has been
shown that Cr(VI) coordinates to 3-4 hydroxyl groups on the mineral surface
(Benjamin and Bloom, 1981; Davis and Leckie, 1980). The general adsorption
process can be represented by Equation 2.3 below (Rai et al., 1989); where SOH is
the inorganic hydroxyl site and 𝑆𝑆𝑆𝑆𝑆𝑆2+⋯𝐶𝐶𝐶𝐶𝑆𝑆42− is the adsorbed complex.
𝑆𝑆𝑆𝑆𝑆𝑆 + 𝑆𝑆+ + 𝐶𝐶𝐶𝐶𝑆𝑆42− ↔ 𝑆𝑆𝑆𝑆𝑆𝑆2+⋯𝐶𝐶𝐶𝐶𝑆𝑆42− Equation 2.3
The extent to which Cr(VI) is adsorbed onto the soil is dependent on the pHPNZPC of
the mineral, the pH of solution, and the number of adsorption sites available.
Decreasing the pH leads to a more positive charge on the mineral surface (see
equations 2.1 and 2.2), which causes a greater attraction of the negatively charged
Cr(VI) compounds to the soil/sediment. Studies have shown that Cr(VI) binds most
strongly to Fe hydroxides, then to Al hydroxides, and least to clays such as kaolinite
and montmorillonite, with greatest adsorption at acidic pH (Rai et al., 1989, Ajouyed
et al., 2010). This is consistent with the pHPNZPC values for these minerals which are
typically highest for the Fe and lowest for the clay minerals.
The adsorption of Cr(VI) to Fe (hydr)oxides is independent of ionic strength showing
that it forms inner sphere complexes with Fe hydroxides. By contrast, adsorption onto
alumina was shown to depend on both pH and ionic strength, and it has been
suggested that Cr(VI) bonding to Fe (hydr)oxides is specific (inner sphere) whereas
the Cr(VI) bound to Al (hydr)oxides are non-specific columbic interactions (ion
exchange mechanism). This ion-exchange process involving Al hydroxides is
represented in Equation 2.4 below (Ajouyed et al., 2010):
(≡ Al − OH) + H+ + HCrO42− ↔ (≡ Al − HCrO4
−) + H2O Equation 2.4
The presence of other major ions has been shown to significantly decrease Cr(VI)
adsorption such as Cl-, NO3-, SO4
2-, HCO3-, H2PO4
-, and HPO42-. This is due to
competition for sorption sites between CrO42- and the other anions which are
preferentially adsorbed (Rai et al., 1989). The extent of preferential adsorption
depends, however, on the relative concentrations of Cr(VI) and the competing ions,
on their relative affinities for the mineral surfaces, and on the properties of these
surfaces (including surface site concentration) (Rai et al., 1986). An additional effect
of introducing competing ions is to shift the pH of the adsorption edge to lower values
(Figure 2-5).
27
Figure 2-5: Competitive sorption between Cr(VI) and SO42- onto amorphous Fe oxides
(Cr(VI) = 5 x 10⁻⁶ M and FeTOT = 0.87 x 10⁻³ M) (from Rai et al., 1986).
The sorption of Cr(VI) from solution is not always a reversible process. It has been
suggested that this may be because the removal of Cr(VI) from solution may not
proceed through adsorption but through reduction to Cr(III) followed by subsequent
precipitation to the soil/sediment surface (Richard and Bourg, 1991). This has
implications for the speciation and mobility of Cr sorbed to soils and sediments. The
section below discusses the precipitation of Cr to soils.
Precipitation/dissolution processes The precipitation of Cr(VI) from solution is not thought to be an important mechanism
for the removal of Cr(VI), due to the high solubility of Cr(VI) and the lack of stable
Cr(VI) solid compounds under normal pH and Eh values found in the environment
(Rai et al., 1989). Only the formation and dissolution of solid phase Cr(III) compound
is therefore considered in this section.
At pH <4 Cr(III) will be present as Cr3+, which is readily soluble, but at higher pH it will
form Cr(OH)3, an insoluble species which will be removed from solution by
precipitation (Richard and Bourg, 1991).
The insoluble nature of Cr(III) species and the strong binding of Cr(III) to soil phases
results in low concentrations of Cr(III) in solution. Reduction of Fe in the Fe oxides as
shown in Equation 2.5 below can lead to Cr(III) being released into solution. This is
an acid consuming process resulting in an increase of pH which will most likely result
in the precipitation of Cr(OH)3.
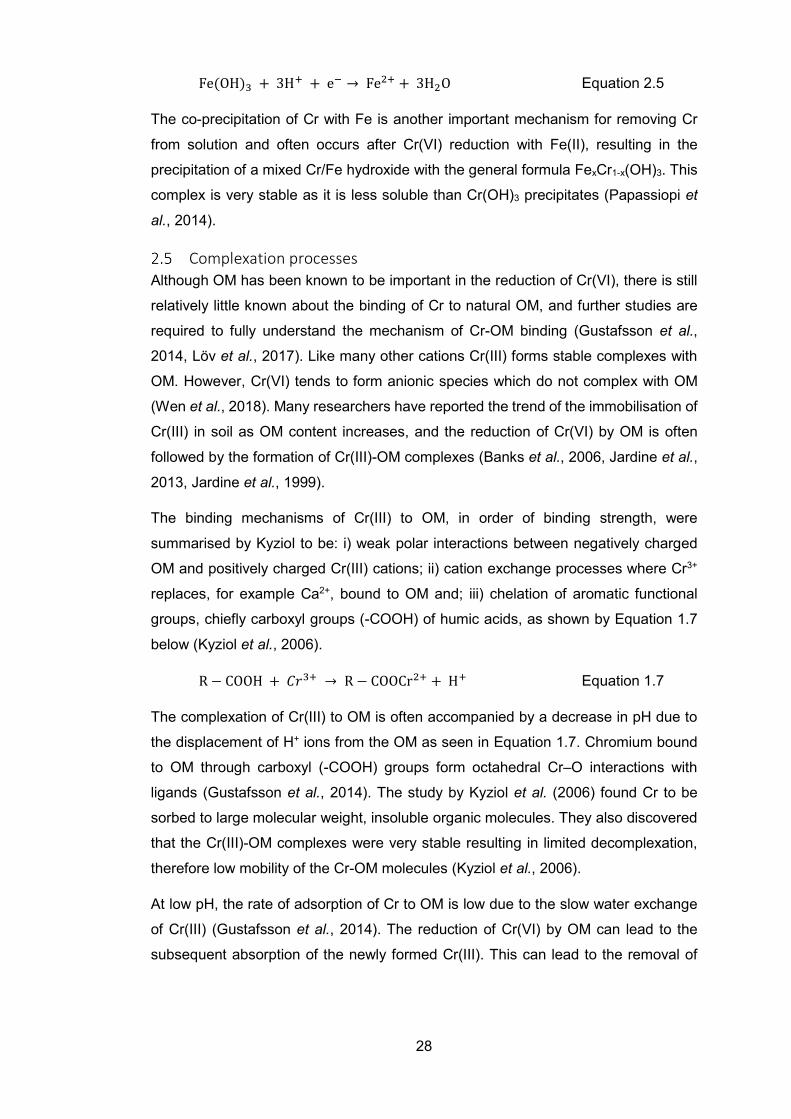
28
Fe(OH)3 + 3H+ + e− → Fe2+ + 3H2O Equation 2.5
The co-precipitation of Cr with Fe is another important mechanism for removing Cr
from solution and often occurs after Cr(VI) reduction with Fe(II), resulting in the
precipitation of a mixed Cr/Fe hydroxide with the general formula FexCr1-x(OH)3. This
complex is very stable as it is less soluble than Cr(OH)3 precipitates (Papassiopi et
al., 2014).
Complexation processes Although OM has been known to be important in the reduction of Cr(VI), there is still
relatively little known about the binding of Cr to natural OM, and further studies are
required to fully understand the mechanism of Cr-OM binding (Gustafsson et al.,
2014, Löv et al., 2017). Like many other cations Cr(III) forms stable complexes with
OM. However, Cr(VI) tends to form anionic species which do not complex with OM
(Wen et al., 2018). Many researchers have reported the trend of the immobilisation of
Cr(III) in soil as OM content increases, and the reduction of Cr(VI) by OM is often
followed by the formation of Cr(III)-OM complexes (Banks et al., 2006, Jardine et al.,
2013, Jardine et al., 1999).
The binding mechanisms of Cr(III) to OM, in order of binding strength, were
summarised by Kyziol to be: i) weak polar interactions between negatively charged
OM and positively charged Cr(III) cations; ii) cation exchange processes where Cr3+
replaces, for example Ca2+, bound to OM and; iii) chelation of aromatic functional
groups, chiefly carboxyl groups (-COOH) of humic acids, as shown by Equation 1.7
below (Kyziol et al., 2006).
R − COOH + 𝐶𝐶𝐶𝐶3+ → R − COOCr2+ + H+ Equation 1.7
The complexation of Cr(III) to OM is often accompanied by a decrease in pH due to
the displacement of H+ ions from the OM as seen in Equation 1.7. Chromium bound
to OM through carboxyl (-COOH) groups form octahedral Cr–O interactions with
ligands (Gustafsson et al., 2014). The study by Kyziol et al. (2006) found Cr to be
sorbed to large molecular weight, insoluble organic molecules. They also discovered
that the Cr(III)-OM complexes were very stable resulting in limited decomplexation,
therefore low mobility of the Cr-OM molecules (Kyziol et al., 2006).
At low pH, the rate of adsorption of Cr to OM is low due to the slow water exchange
of Cr(III) (Gustafsson et al., 2014). The reduction of Cr(VI) by OM can lead to the
subsequent absorption of the newly formed Cr(III). This can lead to the removal of

29
Cr(VI) from solution and, due to the formation of stable Cr(III)-OM complexes, much
reduced mobility of Cr (Jardine et al., 2013, Banks et al., 2006). Due to the formation
of stable Cr(III)-OM complexes, the use of organic reducing barriers are one method
which has been suggested for the removal of Cr from industrial effluent such as
tanneries. Not only do these environments reduce Cr(VI) to Cr(III), they are also very
successful in immobilising Cr(III) (Sultana et al., 2014, Vymazal, 2014). In typical river
settings the concentration of dissolved Cr(III) can be greatly overestimated due to the
presence of Cr(III)-DOM complexes, and the formation of Cr(III)-DOM can increase
the mobility of Cr in soils (Bolaños-Benítez et al., 2018).
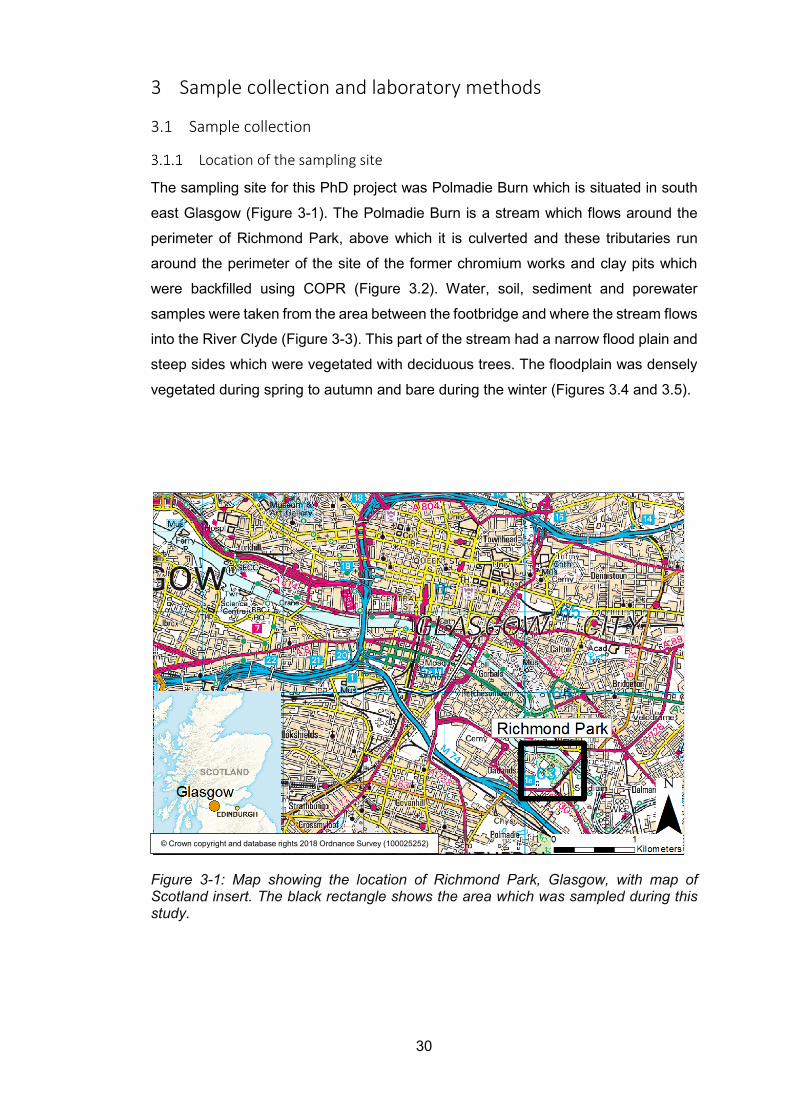
30
3 Sample collection and laboratory methods
3.1 Sample collection
Location of the sampling site
The sampling site for this PhD project was Polmadie Burn which is situated in south
east Glasgow (Figure 3-1). The Polmadie Burn is a stream which flows around the
perimeter of Richmond Park, above which it is culverted and these tributaries run
around the perimeter of the site of the former chromium works and clay pits which
were backfilled using COPR (Figure 3.2). Water, soil, sediment and porewater
samples were taken from the area between the footbridge and where the stream flows
into the River Clyde (Figure 3-3). This part of the stream had a narrow flood plain and
steep sides which were vegetated with deciduous trees. The floodplain was densely
vegetated during spring to autumn and bare during the winter (Figures 3.4 and 3.5).
Figure 3-1: Map showing the location of Richmond Park, Glasgow, with map of Scotland insert. The black rectangle shows the area which was sampled during this study.
© Crown copyright and database rights 2018 Ordnance Survey (100025252)
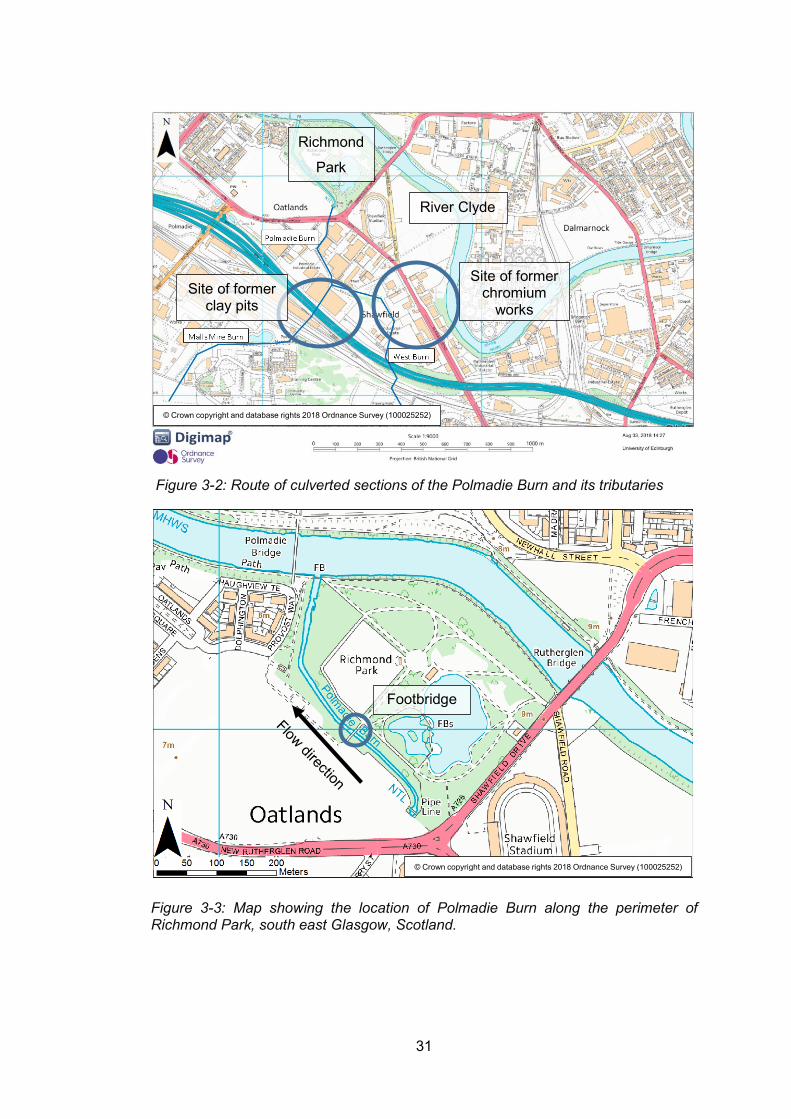
31
Figure 3-3: Map showing the location of Polmadie Burn along the perimeter of Richmond Park, south east Glasgow, Scotland.
Richmond
Park
Figure 3-2: Route of culverted sections of the Polmadie Burn and its tributaries
Richmond
Park
River Clyde
© Crown copyright and database rights 2018 Ordnance Survey (100025252)
© Crown copyright and database rights 2018 Ordnance Survey (100025252)
Footbridge
Site of former chromium
works Site of former
clay pits
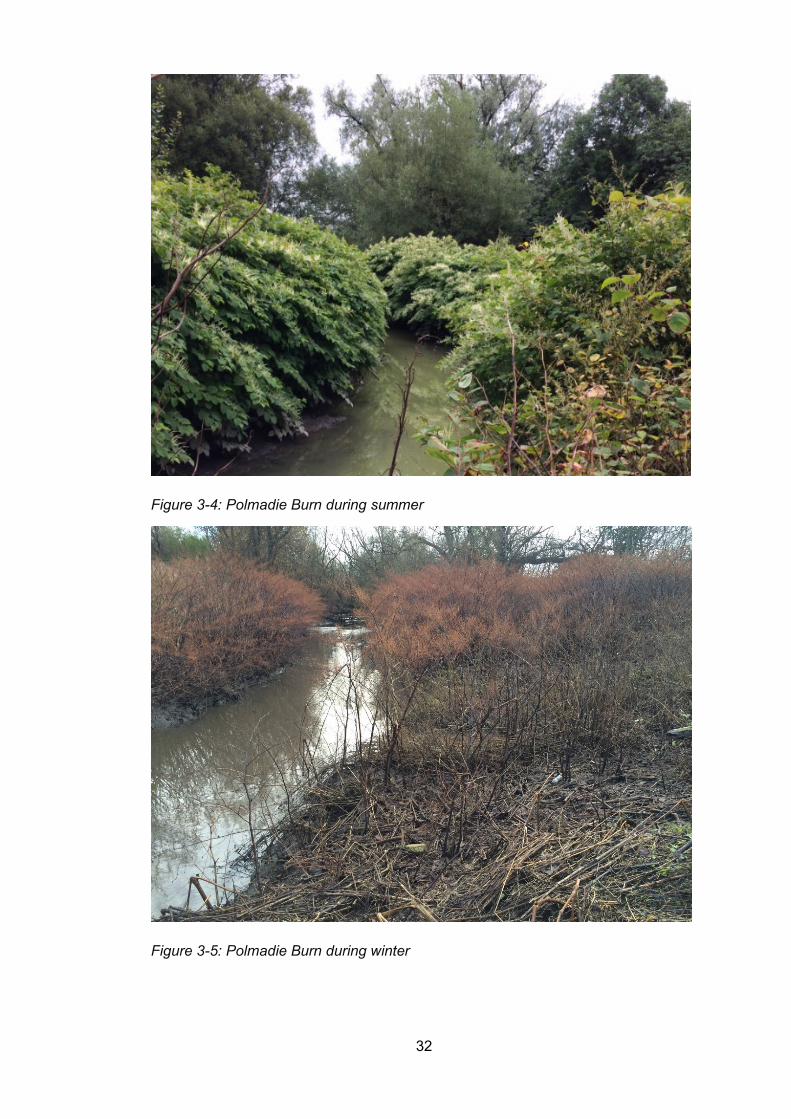
32
Figure 3-4: Polmadie Burn during summer
Figure 3-5: Polmadie Burn during winter
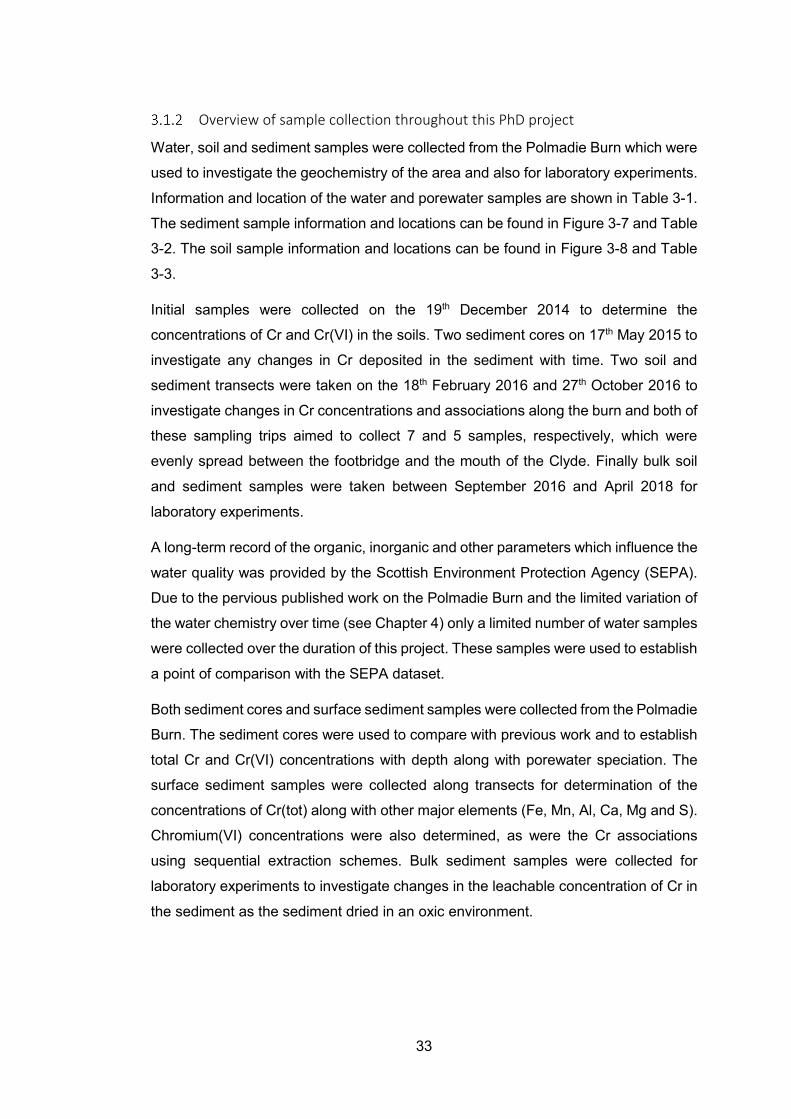
33
Overview of sample collection throughout this PhD project
Water, soil and sediment samples were collected from the Polmadie Burn which were
used to investigate the geochemistry of the area and also for laboratory experiments.
Information and location of the water and porewater samples are shown in Table 3-1.
The sediment sample information and locations can be found in Figure 3-7 and Table
3-2. The soil sample information and locations can be found in Figure 3-8 and Table
3-3.
Initial samples were collected on the 19th December 2014 to determine the
concentrations of Cr and Cr(VI) in the soils. Two sediment cores on 17th May 2015 to
investigate any changes in Cr deposited in the sediment with time. Two soil and
sediment transects were taken on the 18th February 2016 and 27th October 2016 to
investigate changes in Cr concentrations and associations along the burn and both of
these sampling trips aimed to collect 7 and 5 samples, respectively, which were
evenly spread between the footbridge and the mouth of the Clyde. Finally bulk soil
and sediment samples were taken between September 2016 and April 2018 for
laboratory experiments.
A long-term record of the organic, inorganic and other parameters which influence the
water quality was provided by the Scottish Environment Protection Agency (SEPA).
Due to the pervious published work on the Polmadie Burn and the limited variation of
the water chemistry over time (see Chapter 4) only a limited number of water samples
were collected over the duration of this project. These samples were used to establish
a point of comparison with the SEPA dataset.
Both sediment cores and surface sediment samples were collected from the Polmadie
Burn. The sediment cores were used to compare with previous work and to establish
total Cr and Cr(VI) concentrations with depth along with porewater speciation. The
surface sediment samples were collected along transects for determination of the
concentrations of Cr(tot) along with other major elements (Fe, Mn, Al, Ca, Mg and S).
Chromium(VI) concentrations were also determined, as were the Cr associations
using sequential extraction schemes. Bulk sediment samples were collected for
laboratory experiments to investigate changes in the leachable concentration of Cr in
the sediment as the sediment dried in an oxic environment.
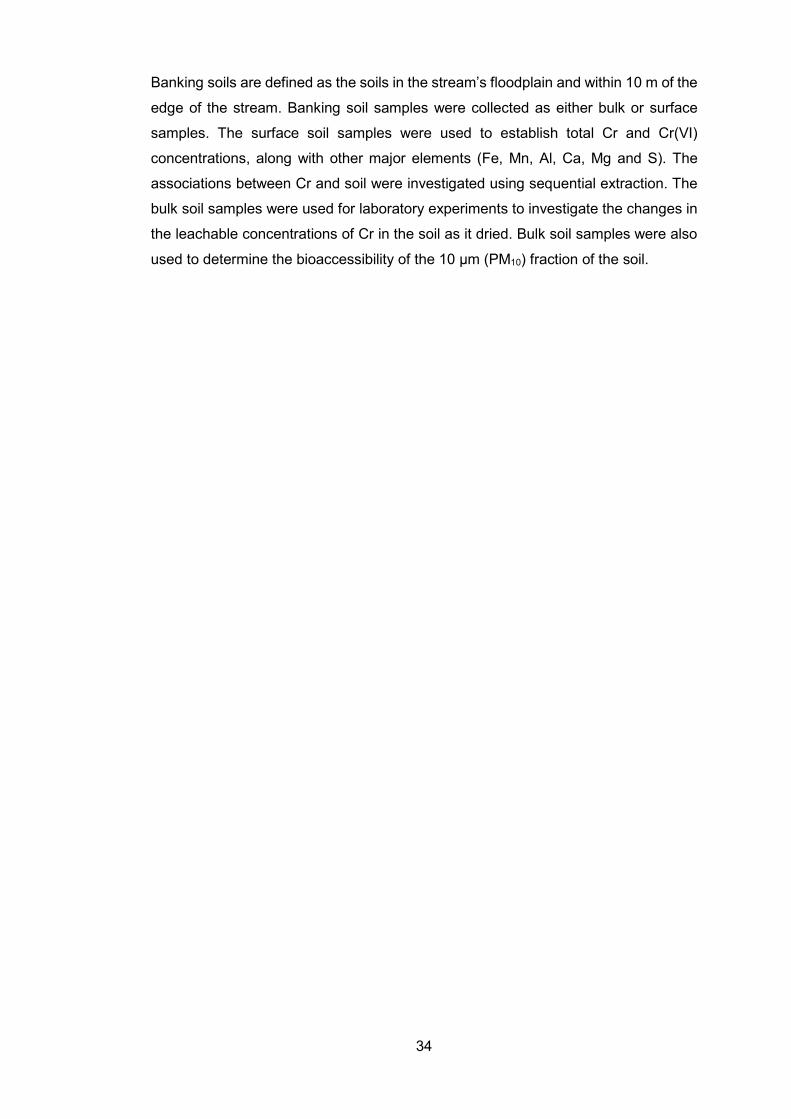
34
Banking soils are defined as the soils in the stream’s floodplain and within 10 m of the
edge of the stream. Banking soil samples were collected as either bulk or surface
samples. The surface soil samples were used to establish total Cr and Cr(VI)
concentrations, along with other major elements (Fe, Mn, Al, Ca, Mg and S). The
associations between Cr and soil were investigated using sequential extraction. The
bulk soil samples were used for laboratory experiments to investigate the changes in
the leachable concentrations of Cr in the soil as it dried. Bulk soil samples were also
used to determine the bioaccessibility of the 10 µm (PM10) fraction of the soil.
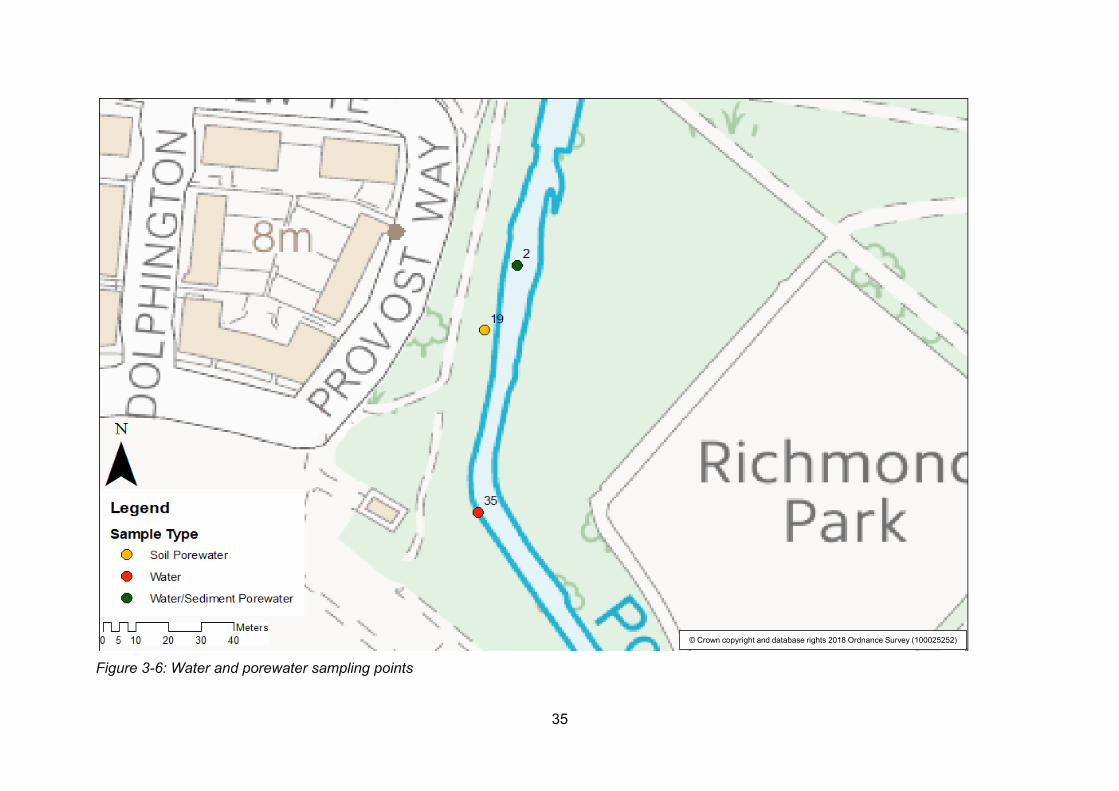
35
Figure 3-6: Water and porewater sampling points
© Crown copyright and database rights 2018 Ordnance Survey (100025252)
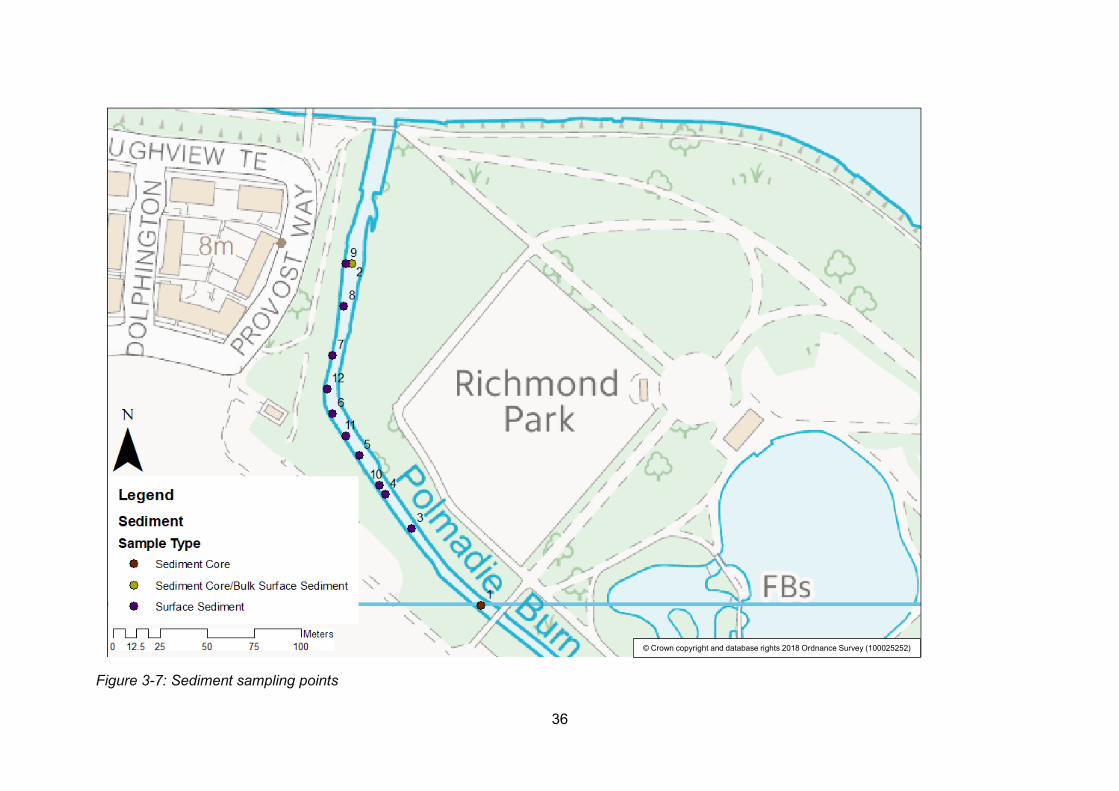
36
Figure 3-7: Sediment sampling points
© Crown copyright and database rights 2018 Ordnance Survey (100025252)
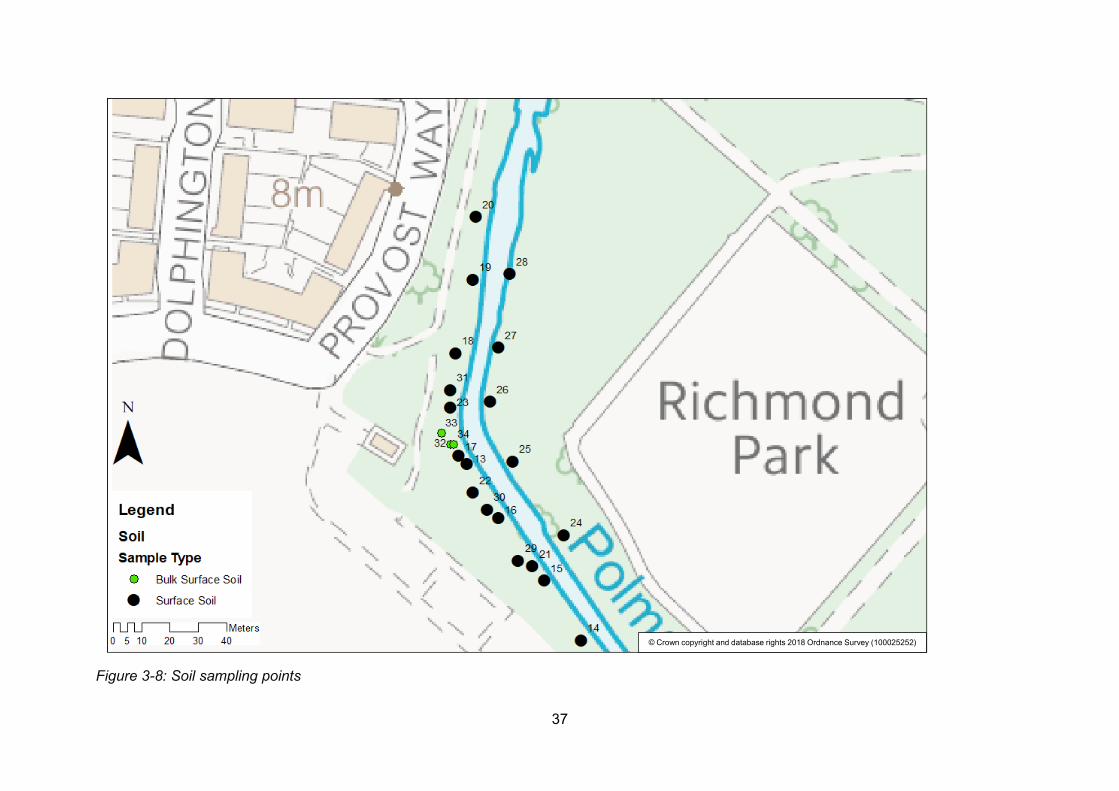
37
Figure 3-8: Soil sampling points
© Crown copyright and database rights 2018 Ordnance Survey (100025252)
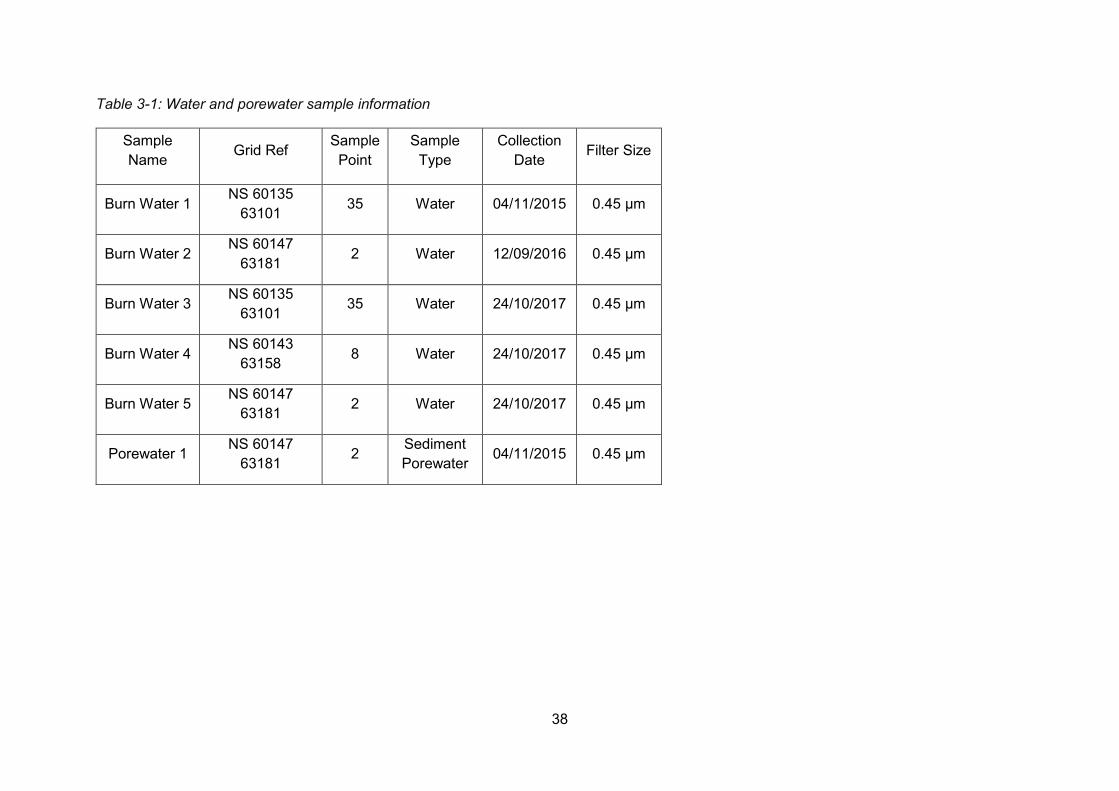
38
Table 3-1: Water and porewater sample information
Sample Name Grid Ref Sample
Point Sample
Type Collection
Date Filter Size
Burn Water 1 NS 60135 63101 35 Water 04/11/2015 0.45 µm
Burn Water 2 NS 60147 63181 2 Water 12/09/2016 0.45 µm
Burn Water 3 NS 60135 63101 35 Water 24/10/2017 0.45 µm
Burn Water 4 NS 60143 63158 8 Water 24/10/2017 0.45 µm
Burn Water 5 NS 60147 63181 2 Water 24/10/2017 0.45 µm
Porewater 1 NS 60147 63181 2 Sediment
Porewater 04/11/2015 0.45 µm
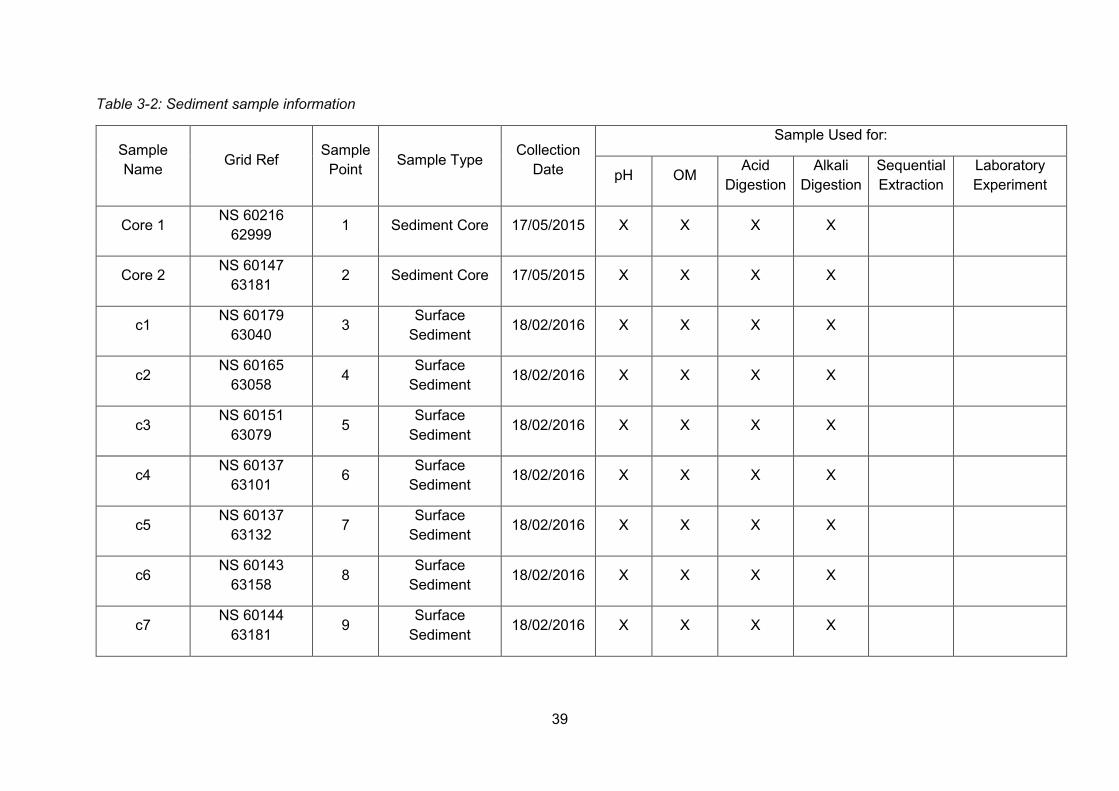
39
Table 3-2: Sediment sample information
Sample Name Grid Ref Sample
Point Sample Type Collection Date
Sample Used for:
pH OM Acid Digestion
Alkali Digestion
Sequential Extraction
Laboratory Experiment
Core 1 NS 60216 62999 1 Sediment Core 17/05/2015 X X X X
Core 2 NS 60147 63181 2 Sediment Core 17/05/2015 X X X X
c1 NS 60179 63040 3 Surface
Sediment 18/02/2016 X X X X
c2 NS 60165 63058 4 Surface
Sediment 18/02/2016 X X X X
c3 NS 60151 63079 5 Surface
Sediment 18/02/2016 X X X X
c4 NS 60137 63101 6 Surface
Sediment 18/02/2016 X X X X
c5 NS 60137 63132 7 Surface
Sediment 18/02/2016 X X X X
c6 NS 60143 63158 8 Surface
Sediment 18/02/2016 X X X X
c7 NS 60144 63181 9 Surface
Sediment 18/02/2016 X X X X
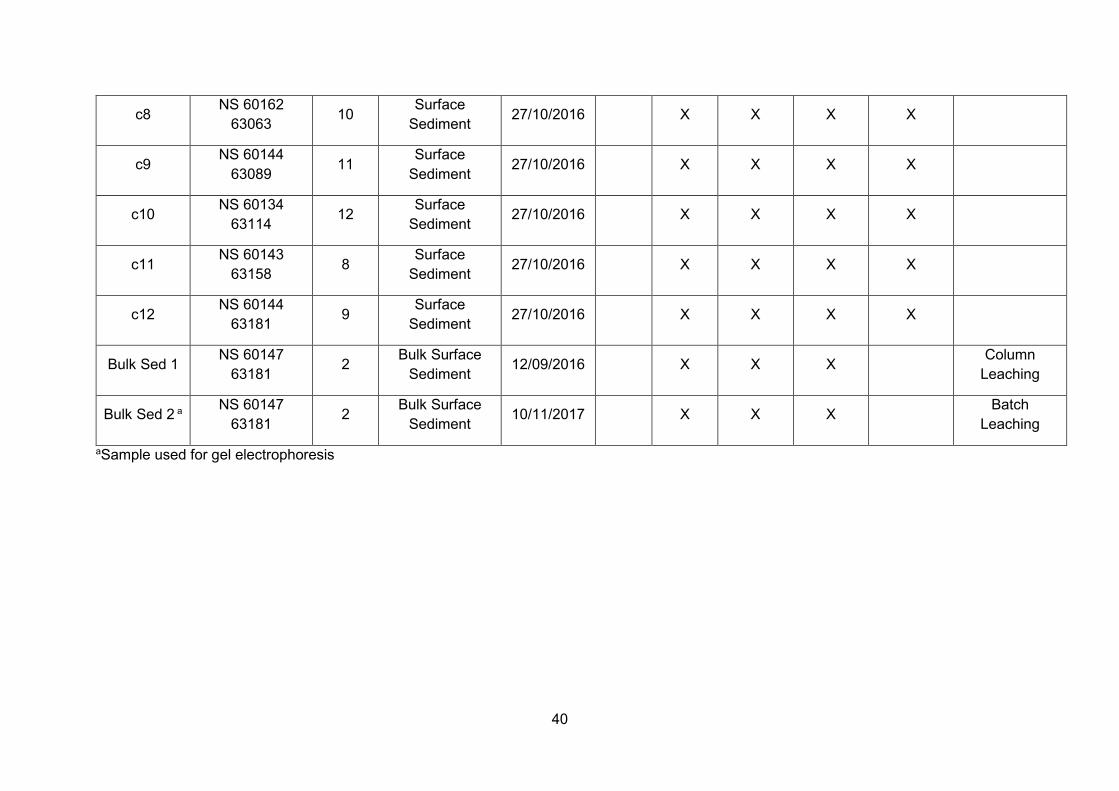
40
c8 NS 60162 63063 10 Surface
Sediment 27/10/2016 X X X X
c9 NS 60144 63089 11 Surface
Sediment 27/10/2016 X X X X
c10 NS 60134 63114 12 Surface
Sediment 27/10/2016 X X X X
c11 NS 60143 63158 8 Surface
Sediment 27/10/2016 X X X X
c12 NS 60144 63181 9 Surface
Sediment 27/10/2016 X X X X
Bulk Sed 1 NS 60147 63181 2 Bulk Surface
Sediment 12/09/2016 X X X Column
Leaching
Bulk Sed 2 a NS 60147 63181 2 Bulk Surface
Sediment 10/11/2017 X X X Batch
Leaching
aSample used for gel electrophoresis
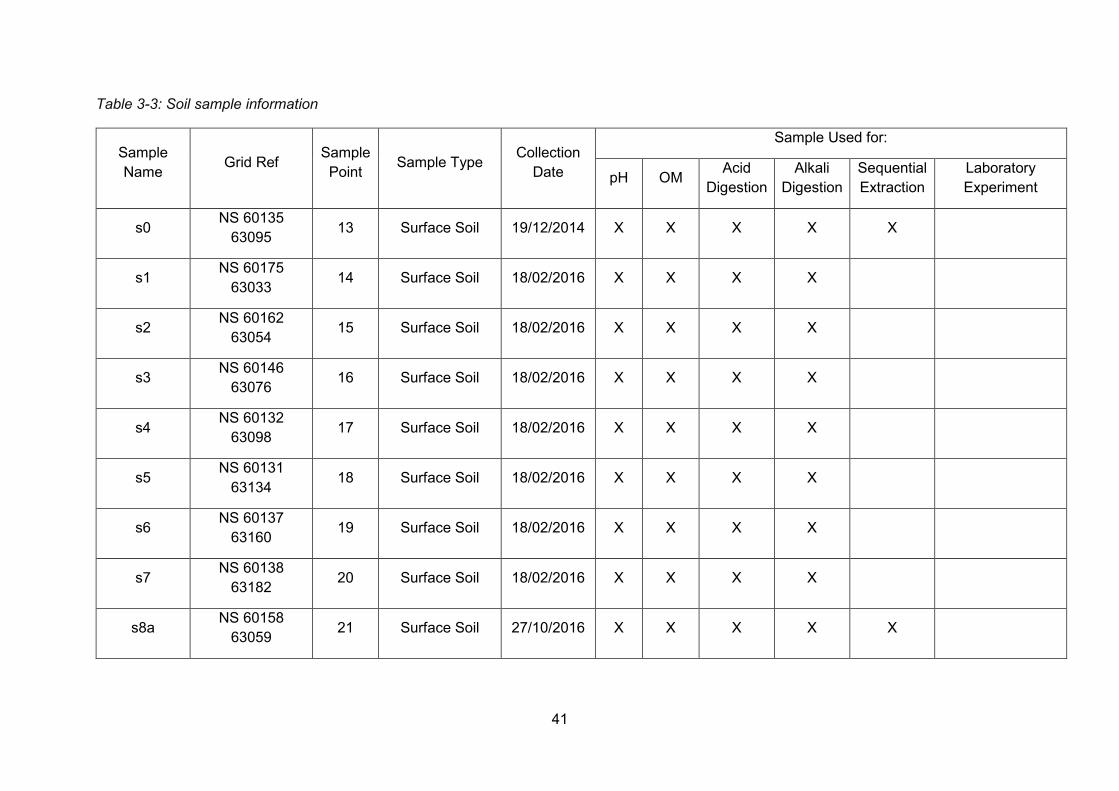
41
Table 3-3: Soil sample information
Sample Name Grid Ref Sample
Point Sample Type Collection Date
Sample Used for:
pH OM Acid Digestion
Alkali Digestion
Sequential Extraction
Laboratory Experiment
s0 NS 60135 63095 13 Surface Soil 19/12/2014 X X X X X
s1 NS 60175 63033 14 Surface Soil 18/02/2016 X X X X
s2 NS 60162 63054 15 Surface Soil 18/02/2016 X X X X
s3 NS 60146 63076 16 Surface Soil 18/02/2016 X X X X
s4 NS 60132 63098 17 Surface Soil 18/02/2016 X X X X
s5 NS 60131 63134 18 Surface Soil 18/02/2016 X X X X
s6 NS 60137 63160 19 Surface Soil 18/02/2016 X X X X
s7 NS 60138 63182 20 Surface Soil 18/02/2016 X X X X
s8a NS 60158 63059 21 Surface Soil 27/10/2016 X X X X X
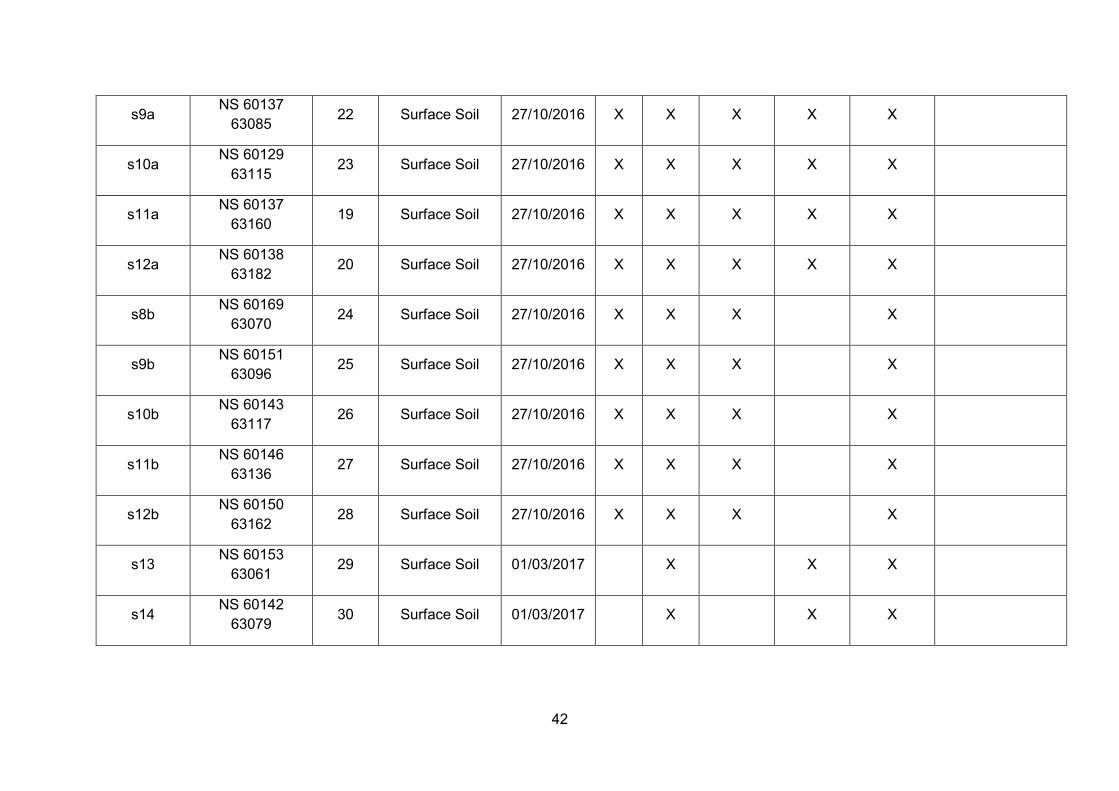
42
s9a NS 60137 63085 22 Surface Soil 27/10/2016 X X X X X
s10a NS 60129 63115 23 Surface Soil 27/10/2016 X X X X X
s11a NS 60137 63160 19 Surface Soil 27/10/2016 X X X X X
s12a NS 60138 63182 20 Surface Soil 27/10/2016 X X X X X
s8b NS 60169 63070 24 Surface Soil 27/10/2016 X X X X
s9b NS 60151 63096 25 Surface Soil 27/10/2016 X X X X
s10b NS 60143 63117 26 Surface Soil 27/10/2016 X X X X
s11b NS 60146 63136 27 Surface Soil 27/10/2016 X X X X
s12b NS 60150 63162 28 Surface Soil 27/10/2016 X X X X
s13 NS 60153 63061 29 Surface Soil 01/03/2017 X X X
s14 NS 60142 63079 30 Surface Soil 01/03/2017 X X X
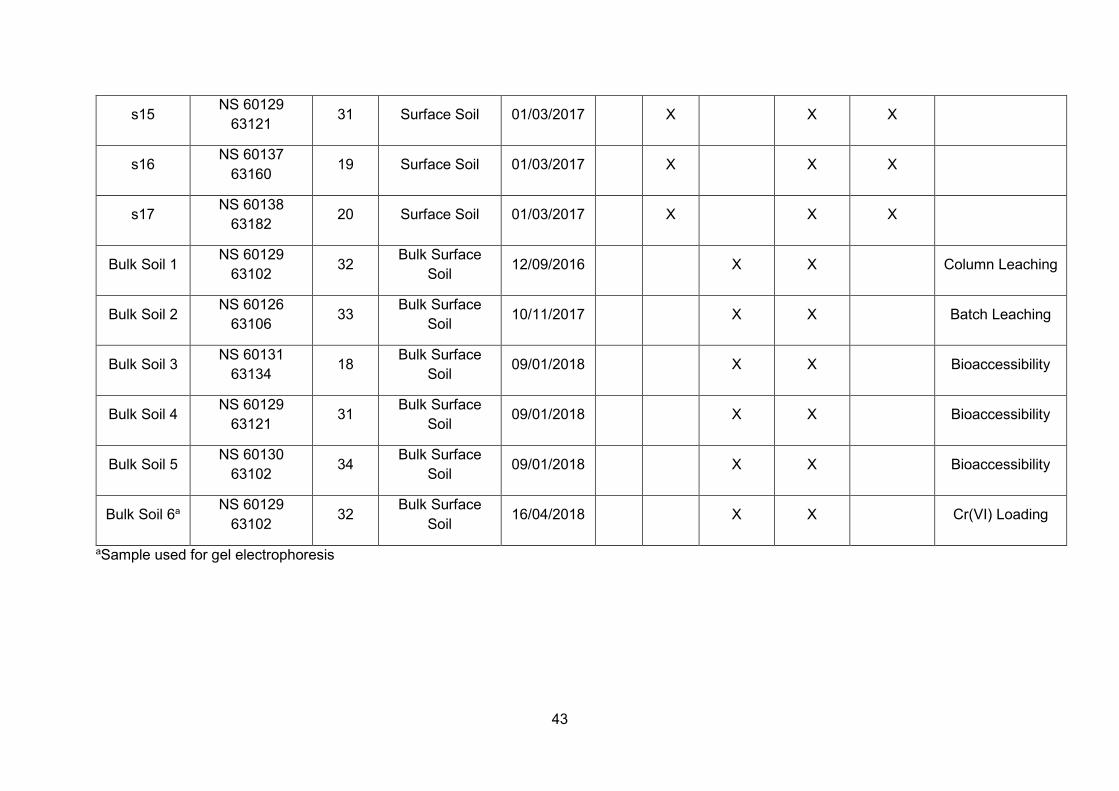
43
s15 NS 60129 63121 31 Surface Soil 01/03/2017 X X X
s16 NS 60137 63160 19 Surface Soil 01/03/2017 X X X
s17 NS 60138 63182 20 Surface Soil 01/03/2017 X X X
Bulk Soil 1 NS 60129 63102 32 Bulk Surface
Soil 12/09/2016 X X Column Leaching
Bulk Soil 2 NS 60126 63106 33 Bulk Surface
Soil 10/11/2017 X X Batch Leaching
Bulk Soil 3 NS 60131 63134 18 Bulk Surface
Soil 09/01/2018 X X Bioaccessibility
Bulk Soil 4 NS 60129 63121 31 Bulk Surface
Soil 09/01/2018 X X Bioaccessibility
Bulk Soil 5 NS 60130 63102 34 Bulk Surface
Soil 09/01/2018 X X Bioaccessibility
Bulk Soil 6a NS 60129 63102 32 Bulk Surface
Soil 16/04/2018 X X Cr(VI) Loading
aSample used for gel electrophoresis
44
Sample collection procedures
3.1.3.1 Polmadie Burn water samples
Water samples were collected in acid cleaned polyethylene bottles which were rinsed
three times before being filled whilst taking care to remove all air bubbles. The
samples were transported under ice back to the laboratory where they were filtered
through 0.45 µm nitrocellulose membranes (Whatman, Sigma Aldrich). Chromium(VI)
concentrations were determined using the diphenylcarbazide (DPC) colorimetric
method (Section 3.7.2.2). Water samples used for determination of Cr(tot), Mn and
Fe concentrations were acidified using nitric acid (Aristar, VWR International Ltd) to
get 2 % v/v HNO3 solution and were analysed using inductively couple plasma mass
spectroscopy (ICP-MS) (Section 3.7.1.3). All samples were stored at 4°C in the dark
before analysis.
3.1.3.2 Polmadie Burn sediment samples
3.1.3.2.1 Surface sediment samples
Surface sediment samples (0-20 cm) were collected using a metal spade. Samples
were either bagged in ziplock plastic bags, for small samples (<1 kg), or contained in
a clean, lidded bucket for larger samples (>1 kg) for transportation back to the
laboratory. Reducing conditions were maintained by filling the sediment sample bags
with helium in the field and then taping the bags closed before transportation.
3.1.3.2.2 Sediment cores
Two sediment cores were collected on 17th June 2015. These cores were collected
using a 10-cm diameter plastic tube which was pushed into the bottom sediment of
the Polmadie Burn to a depth of 41 and 36 cm for cores 1 and 2, respectively, and
immediately capped at the top using a rubber stopper. The vacuum created by
stoppering the top was used to extract the core intact and the bottom was capped
using a rubber stopper. Once extracted the core was then inserted into a N2-filled
glove bag on a coring table (Figure 3-9). Each core was slowly extruded under N2 and
sliced into 1-cm depth sections. The total length of the cores 1 and 2 was 26 and 24.5
cm, respectively. Each depth section was transferred to a 50 mL centrifuge tube which
was sealed within the glove box and then taped around the cap to minimise gas
exchange during transport back to the laboratory. The centrifuge tubes were stored
in an ice-filled cool box until return to the laboratory.
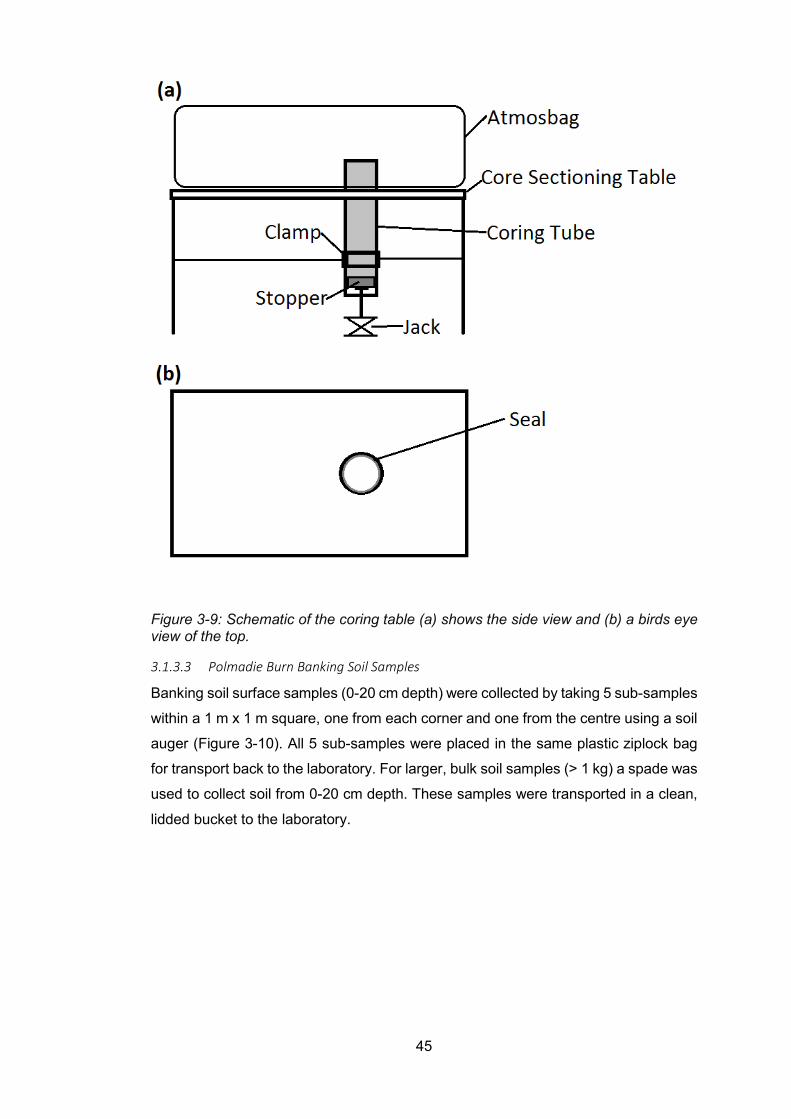
45
Figure 3-9: Schematic of the coring table (a) shows the side view and (b) a birds eye view of the top.
3.1.3.3 Polmadie Burn Banking Soil Samples
Banking soil surface samples (0-20 cm depth) were collected by taking 5 sub-samples
within a 1 m x 1 m square, one from each corner and one from the centre using a soil
auger (Figure 3-10). All 5 sub-samples were placed in the same plastic ziplock bag
for transport back to the laboratory. For larger, bulk soil samples (> 1 kg) a spade was
used to collect soil from 0-20 cm depth. These samples were transported in a clean,
lidded bucket to the laboratory.
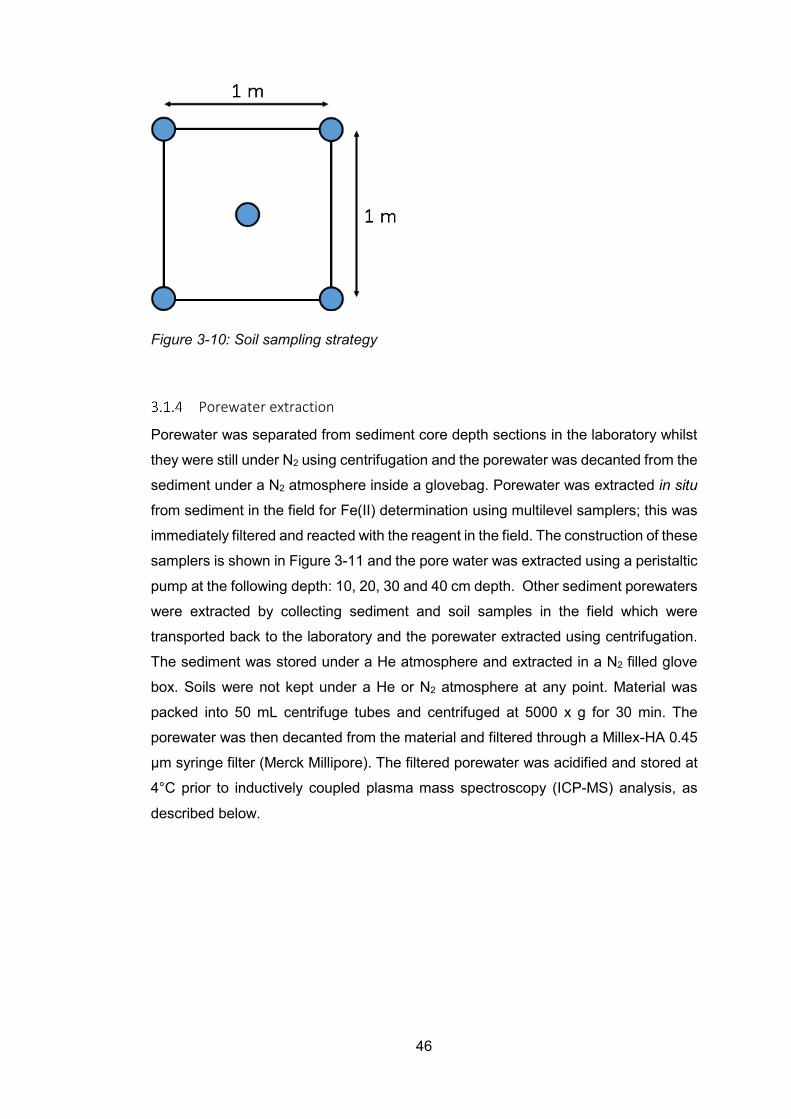
46
Figure 3-10: Soil sampling strategy
Porewater extraction
Porewater was separated from sediment core depth sections in the laboratory whilst
they were still under N2 using centrifugation and the porewater was decanted from the
sediment under a N2 atmosphere inside a glovebag. Porewater was extracted in situ
from sediment in the field for Fe(II) determination using multilevel samplers; this was
immediately filtered and reacted with the reagent in the field. The construction of these
samplers is shown in Figure 3-11 and the pore water was extracted using a peristaltic
pump at the following depth: 10, 20, 30 and 40 cm depth. Other sediment porewaters
were extracted by collecting sediment and soil samples in the field which were
transported back to the laboratory and the porewater extracted using centrifugation.
The sediment was stored under a He atmosphere and extracted in a N2 filled glove
box. Soils were not kept under a He or N2 atmosphere at any point. Material was
packed into 50 mL centrifuge tubes and centrifuged at 5000 x g for 30 min. The
porewater was then decanted from the material and filtered through a Millex-HA 0.45
µm syringe filter (Merck Millipore). The filtered porewater was acidified and stored at
4°C prior to inductively coupled plasma mass spectroscopy (ICP-MS) analysis, as
described below.
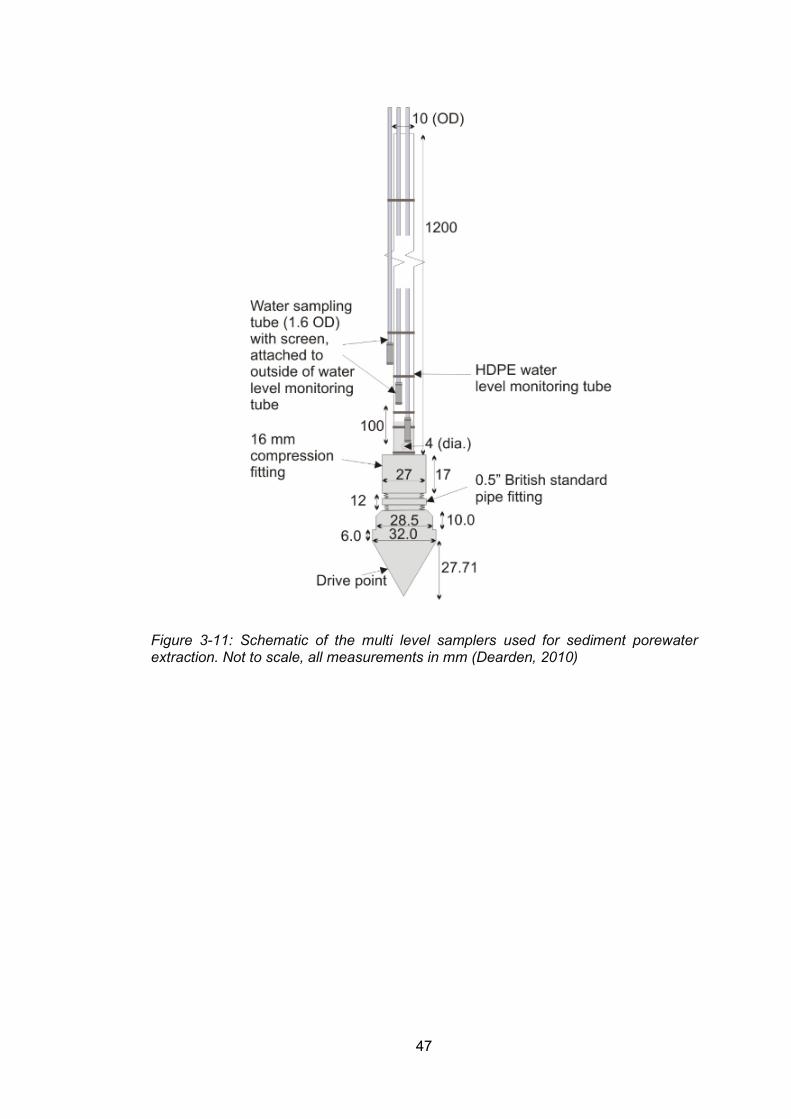
47
Figure 3-11: Schematic of the multi level samplers used for sediment porewater extraction. Not to scale, all measurements in mm (Dearden, 2010)
48
3.2 Soil/sediment sample preparation procedures
3.2.1.1 Safety precautions when handling dry soil and sediment
Due to the health hazards associated with Cr(VI) certain precautions were
implemented for the storage and handling of the soils and sediments collected for this
project. Material was dried in a room with controlled access and the samples were
covered with paper towels to minimise dust disturbance. When handling the dry
materials disposable coveralls were worn along with a respirator with a filter rating of
P3 to minimise exposure to any dust formed. To dispose of any spilled material
surfaces were damped to discourage dust formation before being swept up and
disposed of through the appropriate waste stream.
3.2.1.2 Homogenisation of soil and sediment samples by dry sieving
Sieving removes material over a certain diameter, and was used to remove large
material, such as large stones, plant material and cloth present in the soils and
sediments and also helps to homogenise the samples. Once air-dried, each sample
was sieved through a 2 mm sieve, unless stated otherwise. Soil and sediment
samples collected for laboratory drying experiments were initially sieved through a 5
mm mesh to improve the homogeneity of the sample and were then sieved through a
2 mm mesh to further homogenise the sample before leaching.
3.2.1.3 Air drying of soil and sediment samples for digestion procedures
To prepare the sieved soil and sediment samples for digestions, they were air-dried
in a drying cabinet at ambient temperatures until they reached a constant mass. Once
dried the samples were stored in labelled plastic ziplock bags.
3.2.1.4 Air drying of soil and sediment samples for laboratory drying experiments
Material was pre-screened through a 5 mm mesh to homogenise the samples and
remove any large twigs, stones and cloth before being spread out in large plastic trays
in a ~5 cm layer to dry at 20°C. For the column experiment (Section 3.4.1) the
soil/sediment was left to dry for 4 weeks with sub-samples taken at 0, 2 and 4 weeks
of drying time. For the batch experiment (Section 3.4.2), samples were left to dry with
sub-samples taken at 0, 1, 2, 5, 8, 12, 16, 21, 26, 35, 43, 50 and 62 days. These sub-
samples were sieved through a 2 mm mesh before being used for the experiments.
49
3.2.1.5 Preservation of soil and sediment samples for sequential extraction and gel
electrophoresis procedures
Field-moist soil samples were stored in plastic ziplock bags at 4°C in a fridge before
use and were used within 2 weeks of collection.
3.2.1.6 Ball milling of soil and sediment samples for digestion procedures
To increase the homogeneity, air-dried and sieved soil and sediment samples were
ball milled using a Retsch MM 200 ball mill until they formed a fine powder before
digestion to improve precision of total elemental concentration data.
3.2.1.7 Determination of organic matter by the loss on ignition method
To remove organic matter from air-dried, sieved soil and sediment samples, 0.25 g
aliquots (n= 3) were accurately weighed and then oven-dried at 105°C overnight. The
oven-dried sample mass was recorded before they were placed in a muffle oven and
ashed at 450°C for 4 h. Once cooled the ashed sample mass was recorded and the
% organic matter in each of the samples was then calculated using Equation 3.1.
% 𝑜𝑜𝐶𝐶𝑜𝑜𝑜𝑜𝑜𝑜𝑜𝑜𝑜𝑜 𝑚𝑚𝑜𝑜𝑚𝑚𝑚𝑚𝑚𝑚𝐶𝐶 = 𝑜𝑜𝑜𝑜𝑜𝑜n 𝑑𝑑𝑑𝑑𝑑𝑑𝑜𝑜𝑑𝑑 𝑚𝑚𝑚𝑚𝑚𝑚𝑚𝑚−𝑚𝑚𝑚𝑚ℎ𝑜𝑜𝑑𝑑 𝑚𝑚𝑚𝑚𝑚𝑚𝑚𝑚𝑜𝑜𝑜𝑜𝑜𝑜n 𝑑𝑑𝑑𝑑𝑑𝑑𝑜𝑜𝑑𝑑 𝑚𝑚𝑚𝑚𝑚𝑚𝑚𝑚
× 100% Equation 3.1
Glass/plasticware cleaning
All glassware used for trace analysis was first rinsed using tap water and scrubbed to
remove any visible dirt. The glassware was then placed in a 5 M nitric acid (Analar)
bath and boiled for 3 h. The glassware was removed from the acid bath, rinsed using
deionised water and then submerged in a deionised water bath which was also boiled
for 3 h. The washed glassware was rinsed as it was removed from the water bath
using deionised water and then dried at 60°C in a clean drying cabinet.
Plasticware was rinsed with tap water to remove visible dirt before being submerged
in a 5% nitric acid (Analar) bath where it was left for 24 h. On removal, the plasticware
was rinsed using deionised water and then dried at 60°C in a clean drying cabinet.
50
3.3 Soil/sediment digestion and extraction procedures
Acid digestions for pseudo-total and total elemental concentration
determination
3.3.1.1 Background
Before analysis of trace element concentrations using ICP-OES, the elements of
interest must be in solution. This is typically achieved by dissolution of the metals in
the soils/sediments using strong mineral acids. Common acids include concentrated
(conc.) HNO3 alone or conc. HNO3 in combination with other mineral acids such as:
(i) aqua regia (3:1 ratio, by volume, of conc. HNO3 to conc. HCl); and (ii) conc. HNO3:
conc. HF acids (e.g. 9:1 ratio, by volume).
Boiling aqua regia will break down most minerals, but not silicates, making it suitable
as a pseudo-total digestion method. Aqua regia digestions were used for digesting
the residual phase of the BCR sequential analysis as stated in the BCR protocol
(Rauret et al., 1999). It was also used to obtain the pseudo-total metal concentrations
so they could be compared to the sum of the fractions from the sequential extraction
to evaluate the element recoveries (Bacon and Davidson, 2008). To obtain total
digestion a mixture of HNO3 and hydrofluoric acid (HF) is required to breakdown
silicate minerals in the matrix. The United States Environmental Protection Agency
(US EPA) Method 3052 was followed in order to digest soil and sediment samples
using a Mars 6 microwave digestion system (CEM Corporation).
The concentrations of the following elements – Cr, Fe, Mn, Ca, Mg, Al and S – were
measured in the soil and sediment samples collected during this project. Iron and Mn
concentrations were analysed due to their importance in Cr oxidation and reduction
reactions in the soils and sediments. Calcium, Mg, Al and S are prevalent in COPR
so were analysed to investigate the influence of COPR in the samples.
Whilst handling strong acids and performing digestions certain safety precautions
were followed to minimise the risk of injury. Minimal amounts of acid were used which
was handled inside a chemical fumehood using chemical resistant gloves worn on top
of disposable nitrile gloves. Due to the toxicity of HF, extra precautions were taken to
minimise injury, including having the calcium gluconate gel nearby and performing all
digestions with HF in sealed vessels within a Mars 6 microwave unit which reduced
exposure. All waste acid was quenched and neutralised before disposal.
51
3.3.1.2 Hotplate aqua regia digestion method for pseudo-total elemental concentration
determination in soils and sediments
Aqua regia digestions were used to determine the pseudo-total concentrations of Cr
and other elements (Fe, Mn, Ca, Mg, Al and S) in the soils and sediments. Accurately
weighed aliquots (n = 3) of soil/sediment samples, 0.25 g, were oven-dried in pyrex
beakers at 105°C overnight, cooled and then reweighed before being dry-ashed in a
muffle furnace at 450°C for 4 h. To the ashed samples, 15 mL of concentrated HCl
(Aristar, VWR International Ltd) and 5 mL of concentrated HNO3 (Aristar, VWR
International Ltd) was added. Each beaker was covered with a watch glass and the
mixture refluxed on a hotplate for 2 h (11466:1995, 1995). After cooling, the mixture
was filtered using Whatman 420 hardened ashless filter paper into a clean beaker.
The clean beaker was heated uncovered on the hotplate until the filtrate had been
concentrated to approximately 1 mL, which was then transferred to a 25 mL volumetric
flask, along with 2% v/v HNO3 (Aristar, VWR International Ltd) washings. The
solutions were made up to the mark with 2% v/v HNO3 (Aristar, VWR International
Ltd) and stored in a 30 mL Sterlin tubes at 4°C before ICP-OES analysis.
3.3.1.3 Microwave-assisted HF/HNO3 digestion method for total elemental concentration
determination in soils and sediments
Soil and sediment samples were digested using a modified version of the US EPA
Method 3052. The modification involved ashing the samples to remove organic matter
prior to microwave-assisted digestion. Replicate 0.25 g aliquots (n=3) of soil and
sediments were oven-dried and ashed as described in section 3.2.1.4 and 3.2.1.7.
The ashed samples were then transferred to polytetrafluoroethylene (PTFE)
microwave vessels. To each vessel, 9 mL of conc. HNO3 (Aristar, VWR International
Ltd) and 1 mL of conc. HF (Aristar, VWR International Ltd) was added and the mixture
was digested at 180°C for 9 min. After digestion, the microwave carousel was left to
cool and then transferred into a fume cupboard. The vessels were carefully opened
within the fume cupboard and each solution transferred to a PTFE beaker where it
was evaporated to approximately 1 mL on a hotplate within the fume cupboard. These
solutions were transferred, with washings using 2% v/v HNO3 (Aristar, VWR
International Ltd), into 25 mL volumetric flasks and made up to the mark using 2% v/v
nitric acid (Aristar, VWR International Ltd). Each solution was filtered using Whatman
420 hardened ashless filter papers before storage in the fridge at 4°C in a 30 mL
Sterlin tube prior to analysis.
52
3.3.1.4 Digestion quality control
For each set of digestions two reagent blanks and two replicates of a reference
material were used. The reference materials used was a CRM 7002 Light Sandy Soil
(with elevated analyte levels), ANALYTIKA Ltd. The certified values for total and
pseudo-total (aqua regia digestions) concentrations of Cr in this reference material
was 179 ± 8 and 147 ± 8 mg kg-1, respectively. These quality control samples were
digested in the exact same way as the samples.
Sequential extraction methods for determination of elemental associations in
soils and sediments
3.3.2.1 Background
Whilst several different sequential extraction procedures exist (Tessier et al., 1979,
Tack and Verloo, 1995), inconsistency in the different methodology resulted in a
harmonised method being produced by the Bureau Communautaire de Référence
(BCR). This method was then further updated to produce the modified BCR sequential
extraction which was used in this study (Ure et al., 1993, Rauret et al., 1999).
Sequential extractions uses selective extractants to selectively remove the elements
of interest from different geochemical fractions from soils or sediments. This can
provide useful information which improves our understanding of elemental
interactions with soil/sediments and, when used in conjunction with other
experiments, it can help to understand element remobilisation. The three target
phases of the modified BCR sequential extraction are the exchangeable, reducible
and oxidisable fractions (Table 3-4). Along with these three fractions, the residual
material from Step 3 was digested using an aqua regia digestion as described above
in Section 3.3.1.2. A summary of the three fractions and their target phases is shown
in Table 3-4.
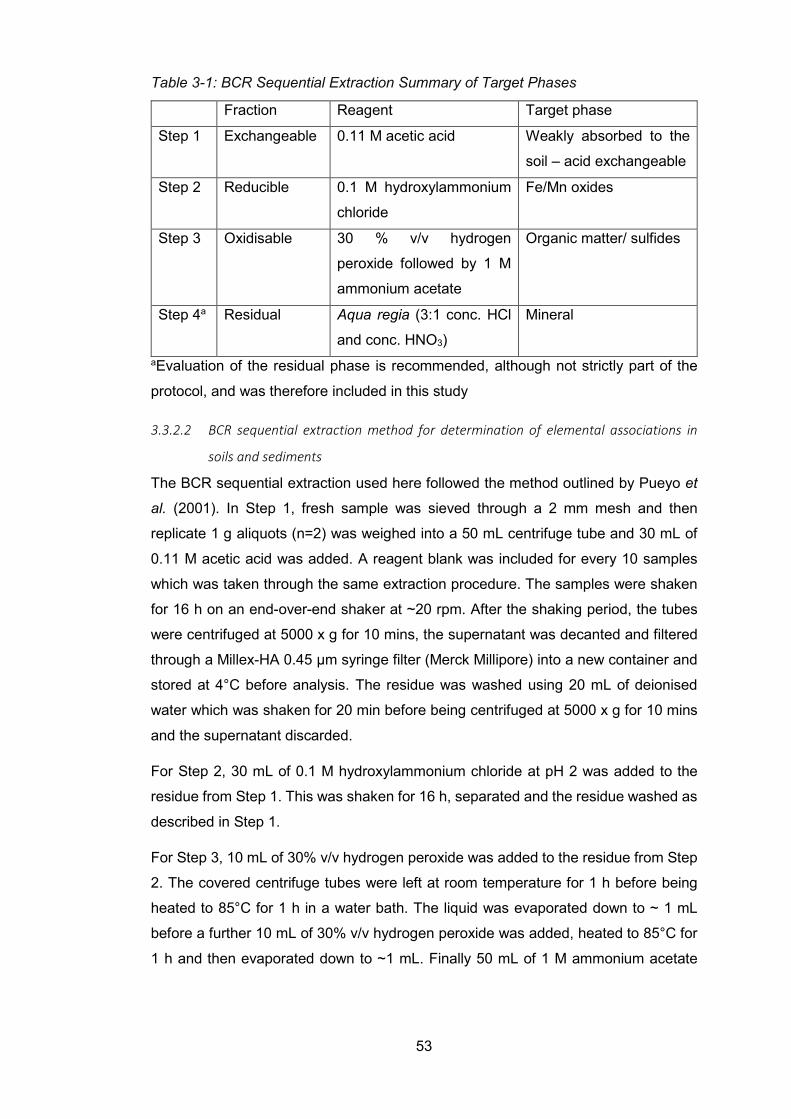
53
Table 3-1: BCR Sequential Extraction Summary of Target Phases
aEvaluation of the residual phase is recommended, although not strictly part of the
protocol, and was therefore included in this study
3.3.2.2 BCR sequential extraction method for determination of elemental associations in
soils and sediments
The BCR sequential extraction used here followed the method outlined by Pueyo et
al. (2001). In Step 1, fresh sample was sieved through a 2 mm mesh and then
replicate 1 g aliquots (n=2) was weighed into a 50 mL centrifuge tube and 30 mL of
0.11 M acetic acid was added. A reagent blank was included for every 10 samples
which was taken through the same extraction procedure. The samples were shaken
for 16 h on an end-over-end shaker at ~20 rpm. After the shaking period, the tubes
were centrifuged at 5000 x g for 10 mins, the supernatant was decanted and filtered
through a Millex-HA 0.45 µm syringe filter (Merck Millipore) into a new container and
stored at 4°C before analysis. The residue was washed using 20 mL of deionised
water which was shaken for 20 min before being centrifuged at 5000 x g for 10 mins
and the supernatant discarded.
For Step 2, 30 mL of 0.1 M hydroxylammonium chloride at pH 2 was added to the
residue from Step 1. This was shaken for 16 h, separated and the residue washed as
described in Step 1.
For Step 3, 10 mL of 30% v/v hydrogen peroxide was added to the residue from Step
2. The covered centrifuge tubes were left at room temperature for 1 h before being
heated to 85°C for 1 h in a water bath. The liquid was evaporated down to ~ 1 mL
before a further 10 mL of 30% v/v hydrogen peroxide was added, heated to 85°C for
1 h and then evaporated down to ~1 mL. Finally 50 mL of 1 M ammonium acetate
Fraction Reagent Target phase
Step 1 Exchangeable 0.11 M acetic acid Weakly absorbed to the
soil – acid exchangeable
Step 2 Reducible 0.1 M hydroxylammonium
chloride
Fe/Mn oxides
Step 3 Oxidisable 30 % v/v hydrogen
peroxide followed by 1 M
ammonium acetate
Organic matter/ sulfides
Step 4a Residual Aqua regia (3:1 conc. HCl
and conc. HNO3)
Mineral
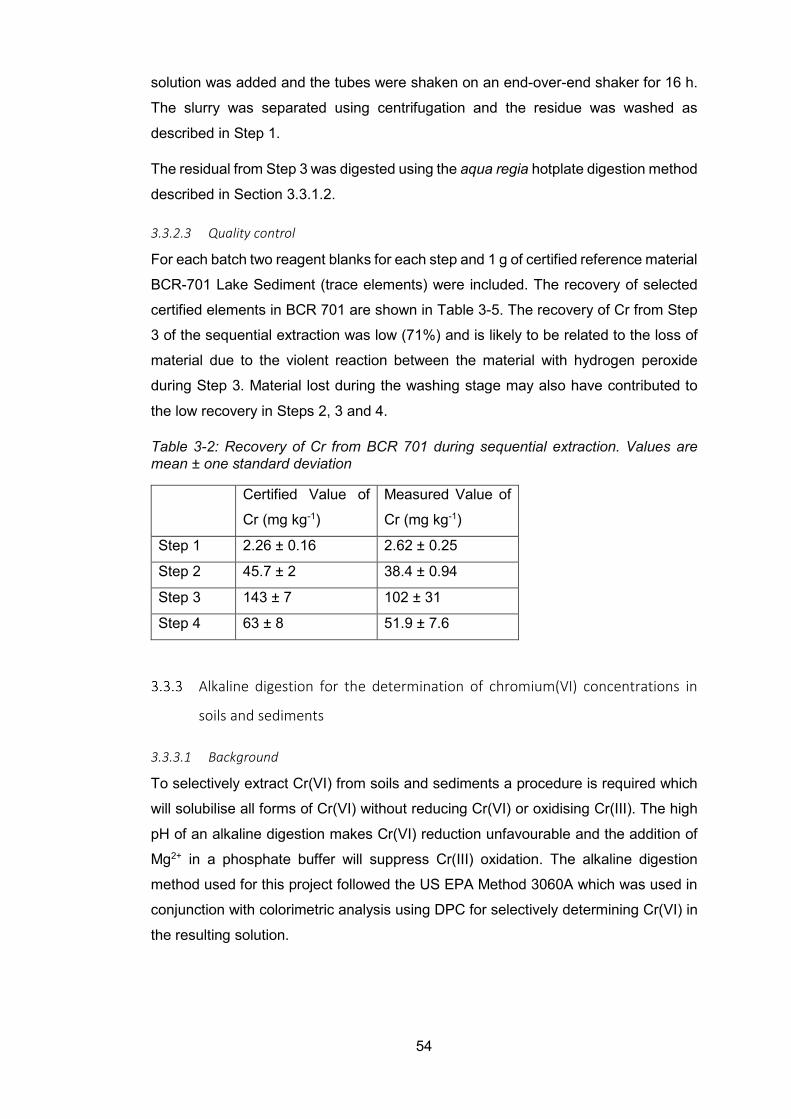
54
solution was added and the tubes were shaken on an end-over-end shaker for 16 h.
The slurry was separated using centrifugation and the residue was washed as
described in Step 1.
The residual from Step 3 was digested using the aqua regia hotplate digestion method
described in Section 3.3.1.2.
3.3.2.3 Quality control
For each batch two reagent blanks for each step and 1 g of certified reference material
BCR-701 Lake Sediment (trace elements) were included. The recovery of selected
certified elements in BCR 701 are shown in Table 3-5. The recovery of Cr from Step
3 of the sequential extraction was low (71%) and is likely to be related to the loss of
material due to the violent reaction between the material with hydrogen peroxide
during Step 3. Material lost during the washing stage may also have contributed to
the low recovery in Steps 2, 3 and 4.
Table 3-2: Recovery of Cr from BCR 701 during sequential extraction. Values are mean ± one standard deviation
Certified Value of
Cr (mg kg-1)
Measured Value of
Cr (mg kg-1)
Step 1 2.26 ± 0.16 2.62 ± 0.25
Step 2 45.7 ± 2 38.4 ± 0.94
Step 3 143 ± 7 102 ± 31
Step 4 63 ± 8 51.9 ± 7.6
Alkaline digestion for the determination of chromium(VI) concentrations in
soils and sediments
3.3.3.1 Background
To selectively extract Cr(VI) from soils and sediments a procedure is required which
will solubilise all forms of Cr(VI) without reducing Cr(VI) or oxidising Cr(III). The high
pH of an alkaline digestion makes Cr(VI) reduction unfavourable and the addition of
Mg2+ in a phosphate buffer will suppress Cr(III) oxidation. The alkaline digestion
method used for this project followed the US EPA Method 3060A which was used in
conjunction with colorimetric analysis using DPC for selectively determining Cr(VI) in
the resulting solution.
55
Organic matter is a known reductant of Cr(VI) although this is only observed at low
pH. The DPC colorimetric reaction occurs at acidic pH so the reduction of Cr(VI)
during this stage can greatly reduce the concentration of Cr(VI) measured in the
samples. To get around this problem it has been shown that ashing soil samples
before digestion does not change the oxidation state of Cr making this a required step
in Cr(VI) analysis (Broadway, 2008).
3.3.3.2 USEPA method 3060a for alkaline digestion of soils and sediments in preparation for
chromium(VI) concentration determination
The digestion followed USEPA Method 3060A. The alkaline digestion fluid used was
0.5 M sodium hydroxide/0.28 M sodium carbonate which was prepared by dissolving
20 g of sodium hydroxide and 30 g of sodium carbonate in 1 L of deionised water. Soil
and sediment samples (2 g wet mass) were dry-ashed at 450°C for 4 h before addition
of 30 mL of the digestion fluid along with 0.5 mL of phosphate buffer (8.71 g of K2HPO4
and 6.80 g of KH2PO4 in 100 mL of deionised water) and approximately 0.4 g of
magnesium chloride. The slurry was stirred for 5 min and then heated on a hotplate
at 90 – 95°C for 1 h, with stirring every 15 min. After cooling, the slurry was filtered
through a Whatman 542 hardened ashless filter paper into a 100 mL volumetric flask.
The solution was then diluted, if required before analysis using the DPC colorimetric
method (Section 3.7.2.2)
3.3.3.3 Quality control
Each set of digestions included two reagent blanks and a certified reference material
(CRM041 Chromium VI – Sandy Loam, Sigma Aldrich) to assess the recovery of the
digestion. The measured concentrations of the CRM041 Cr(VI) was 63.0 ± 6.1 mg
kg-1 (n=11) (certified value 66.5 ± 5.51).
3.4 Simulated drying of soil and sediment in the laboratory
Column leaching of soil and sediments over drying period of 4 weeks
3.4.1.1 Background
The aim of the column experiments was to determine the changes in leachable Cr
concentrations in soils and sediments over a drying period of 4 weeks, thus simulating
conditions in the natural environment.
Glasgow is located on the West Coast of Scotland which has a relatively mild and wet
climate. Historical rainfall data shows that the mean monthly rainfall is 93 mm and rain
56
falls, on average, every second day. During periods of drying soil, pH can decrease
due to the disruption and alteration of organic matter and the Eh can increase due to
oxygen being able to diffuse through the soil more easily. The alteration of these
factors may influence the leachability of Cr from soils after periods of dry weather.
Sediments, unlike soils are better protected from drying as the Polmadie Burn was
observed to flow on all sampling occasions over the duration of this project. However,
dredging of material to deepen waterways, such as canals, to improve their
navigability can lead to sediments with high concentrations of potentially toxic
elements, including Cr, drying out. Since this change in environment can lead to
drastic changes in metal leachability, sediment was also included in the simulated
drying experiments to investigate the mobility of Cr in anoxic sediments upon drying
in an oxic environment.
This section describes the experiments that were carried out to determine the effect
of drying on the mobility of Cr in soils and sediments. For these experiments, bulk soil
and sediment surface samples were collected which were air-dried for different time
intervals (0, 2 and 4 weeks). Typically there is 1 mm of precipitation or more on 47%
of the days per month in Glasgow so a drying period of up to 4 weeks was chosen as
it was deemed unlikely for a dry period to last longer than this.
The bulk material was homogenised as described in Section 3.2.1.2, sub-sampled
and uniformly packed into leaching columns. To determine the amount of Cr that could
be leached by deionised water and synthetic rainwater, the different waters were fed
in at the base and decanted at the top to stop compaction of the material during
leaching. The synthetic rainwater was 0.01 M CaCl2 solution (OECD, 2004) adjusted
to pH 5, the mean pH of precipitation falling in South West Scotland (DEFRA, 2018).
The design of the columns is outlined below.
3.4.1.2 Optimisation of column design
The original column design used gravity fed columns where the leachate was added
to the top of the column on the material surface and collected from the base of the
columns. Due to issues with compaction – especially with the sediment samples – it
became clear that a different approach was required. The columns were redesigned
so that they were again gravity fed, but the leachate was added to the base of the
columns and travelled up the column before being decanted from the top (Figure
3-12). This reduced the effect of compaction on the material
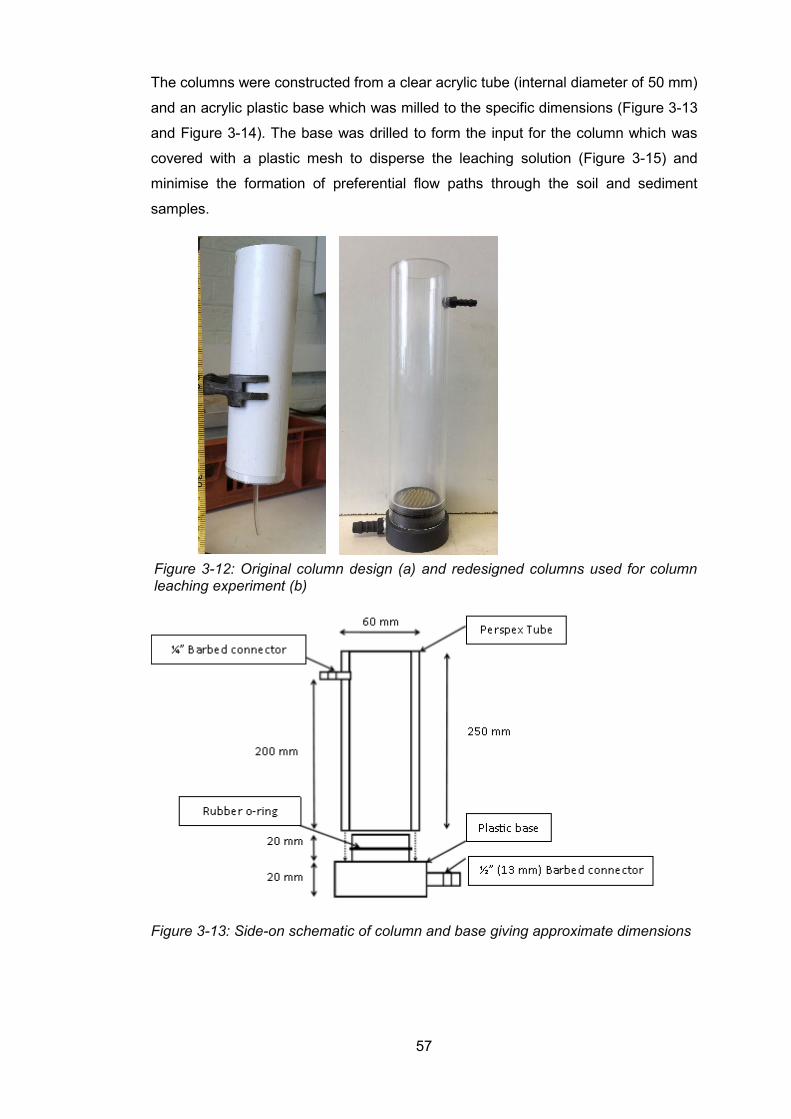
57
The columns were constructed from a clear acrylic tube (internal diameter of 50 mm)
and an acrylic plastic base which was milled to the specific dimensions (Figure 3-13
and Figure 3-14). The base was drilled to form the input for the column which was
covered with a plastic mesh to disperse the leaching solution (Figure 3-15) and
minimise the formation of preferential flow paths through the soil and sediment
samples.
Figure 3-13: Side-on schematic of column and base giving approximate dimensions
Figure 3-12: Original column design (a) and redesigned columns used for column leaching experiment (b)
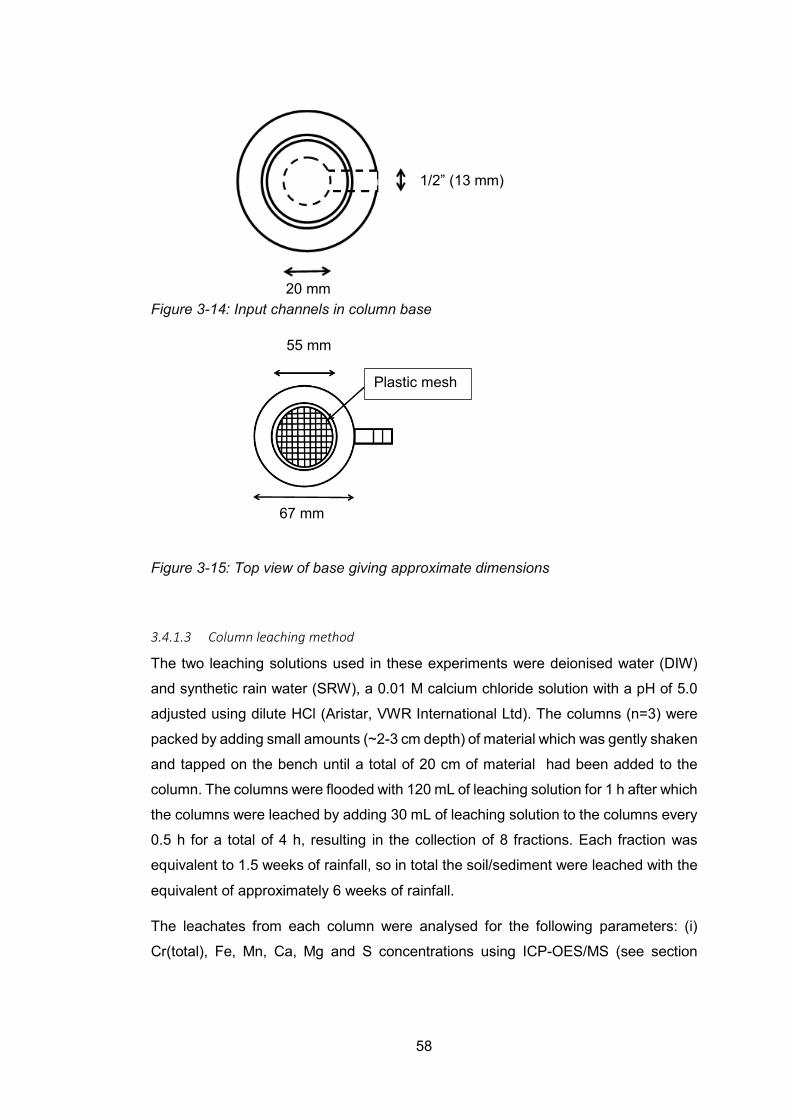
58
Figure 3-14: Input channels in column base
Figure 3-15: Top view of base giving approximate dimensions
3.4.1.3 Column leaching method
The two leaching solutions used in these experiments were deionised water (DIW)
and synthetic rain water (SRW), a 0.01 M calcium chloride solution with a pH of 5.0
adjusted using dilute HCl (Aristar, VWR International Ltd). The columns (n=3) were
packed by adding small amounts (~2-3 cm depth) of material which was gently shaken
and tapped on the bench until a total of 20 cm of material had been added to the
column. The columns were flooded with 120 mL of leaching solution for 1 h after which
the columns were leached by adding 30 mL of leaching solution to the columns every
0.5 h for a total of 4 h, resulting in the collection of 8 fractions. Each fraction was
equivalent to 1.5 weeks of rainfall, so in total the soil/sediment were leached with the
equivalent of approximately 6 weeks of rainfall.
The leachates from each column were analysed for the following parameters: (i)
Cr(total), Fe, Mn, Ca, Mg and S concentrations using ICP-OES/MS (see section
55 mm
67 mm
Plastic mesh
1/2” (13 mm)
20 mm
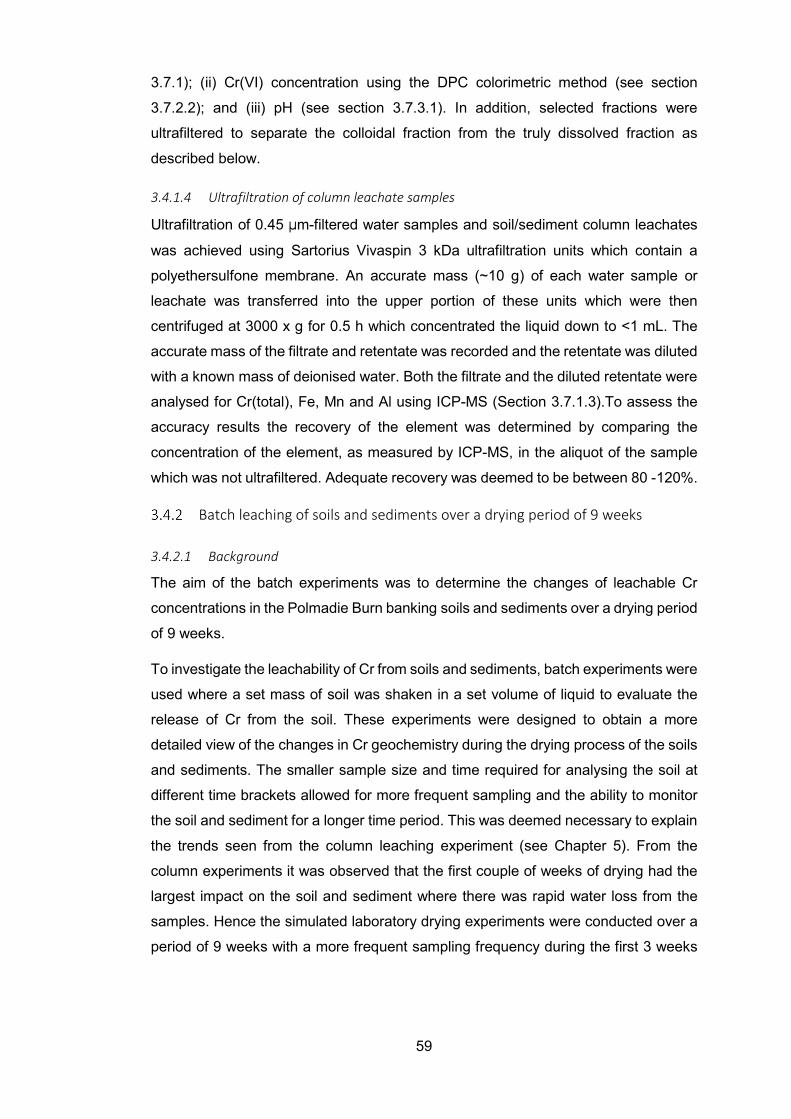
59
3.7.1); (ii) Cr(VI) concentration using the DPC colorimetric method (see section
3.7.2.2); and (iii) pH (see section 3.7.3.1). In addition, selected fractions were
ultrafiltered to separate the colloidal fraction from the truly dissolved fraction as
described below.
3.4.1.4 Ultrafiltration of column leachate samples
Ultrafiltration of 0.45 µm-filtered water samples and soil/sediment column leachates
was achieved using Sartorius Vivaspin 3 kDa ultrafiltration units which contain a
polyethersulfone membrane. An accurate mass (~10 g) of each water sample or
leachate was transferred into the upper portion of these units which were then
centrifuged at 3000 x g for 0.5 h which concentrated the liquid down to <1 mL. The
accurate mass of the filtrate and retentate was recorded and the retentate was diluted
with a known mass of deionised water. Both the filtrate and the diluted retentate were
analysed for Cr(total), Fe, Mn and Al using ICP-MS (Section 3.7.1.3).To assess the
accuracy results the recovery of the element was determined by comparing the
concentration of the element, as measured by ICP-MS, in the aliquot of the sample
which was not ultrafiltered. Adequate recovery was deemed to be between 80 -120%.
Batch leaching of soils and sediments over a drying period of 9 weeks
3.4.2.1 Background
The aim of the batch experiments was to determine the changes of leachable Cr
concentrations in the Polmadie Burn banking soils and sediments over a drying period
of 9 weeks.
To investigate the leachability of Cr from soils and sediments, batch experiments were
used where a set mass of soil was shaken in a set volume of liquid to evaluate the
release of Cr from the soil. These experiments were designed to obtain a more
detailed view of the changes in Cr geochemistry during the drying process of the soils
and sediments. The smaller sample size and time required for analysing the soil at
different time brackets allowed for more frequent sampling and the ability to monitor
the soil and sediment for a longer time period. This was deemed necessary to explain
the trends seen from the column leaching experiment (see Chapter 5). From the
column experiments it was observed that the first couple of weeks of drying had the
largest impact on the soil and sediment where there was rapid water loss from the
samples. Hence the simulated laboratory drying experiments were conducted over a
period of 9 weeks with a more frequent sampling frequency during the first 3 weeks
60
of drying and less frequently over the final 6 weeks. This allowed for a higher
resolution than the column experiment which only examined limited time intervals
during the drying period of 4 weeks.
The solid to liquid (S:L) ratio was 1:2 for this experiment. This low S:L ratio was used
to simulate the infiltration of rainwater into soil rather than the suspension of material
in water. Sediment was investigated using this experiment to examine the changes in
Cr leachability if the sediment is dredged and allowed to dry in an oxic environment.
From the column leaching experiments it was shown that there was no significant
difference between the concentrations of Cr leached by the synthetic rain water
compared to deionised water so the batch experiments used synthetic rain water (as
described in section 3.4.1.1).
3.4.2.2 Drying experiment
Soil and sediment was collected, sieved through a 5 mm mesh to homogenise the
sample and left to air dry. At certain time intervals (0, 1, 2, 5, 8, 12, 16, 21, 26, 35, 43,
50 and 62 days) sub-samples (n=3) were sieved through a 2 mm mesh and used for
leaching. The leaching process used 10 g (field-moist) of the sieved material which
was placed in a 50 mL centrifuge tube and to which 20 mL of synthetic rain water
(0.01 M calcium chloride solution with a pH of 5) was added and the tubes were
shaken at ~20 rpm on an end-over-end shaker for 1 h. After shaking, the samples
were centrifuged at 5000 x g for 10 min and the supernatant was removed, filtered
through a Millex-HA 0.45 µm syringe filter (Merck Millipore) and stored at 4°C before
analysis. The following parameters were analysed: (i) Cr(VI) concentration using the
DPC colorimetric method (see section 3.7.2.2); (ii) Cr(total), Fe and Mn concentrations
using ICP-MS (see section 3.7.1.3); (iii) Ca, S and Mg concentrations using ICP-OES
(see section 3.7.1.2); and (iv) pH (see section 3.7.3.1).
Investigation of the sorption of chromium(VI) to Polmadie Burn banking soil
and its subsequent release
3.4.3.1 Background
The aim of these laboratory experiments was to investigate the sorption of Cr to the
banking soil of the Polmadie Burn and then its subsequent release upon leaching.
To understand the role that the banking soil of the Polmadie Burn has as a Cr reservoir
its ability to sorb and retain Cr needs to be quantified. Hence these laboratory
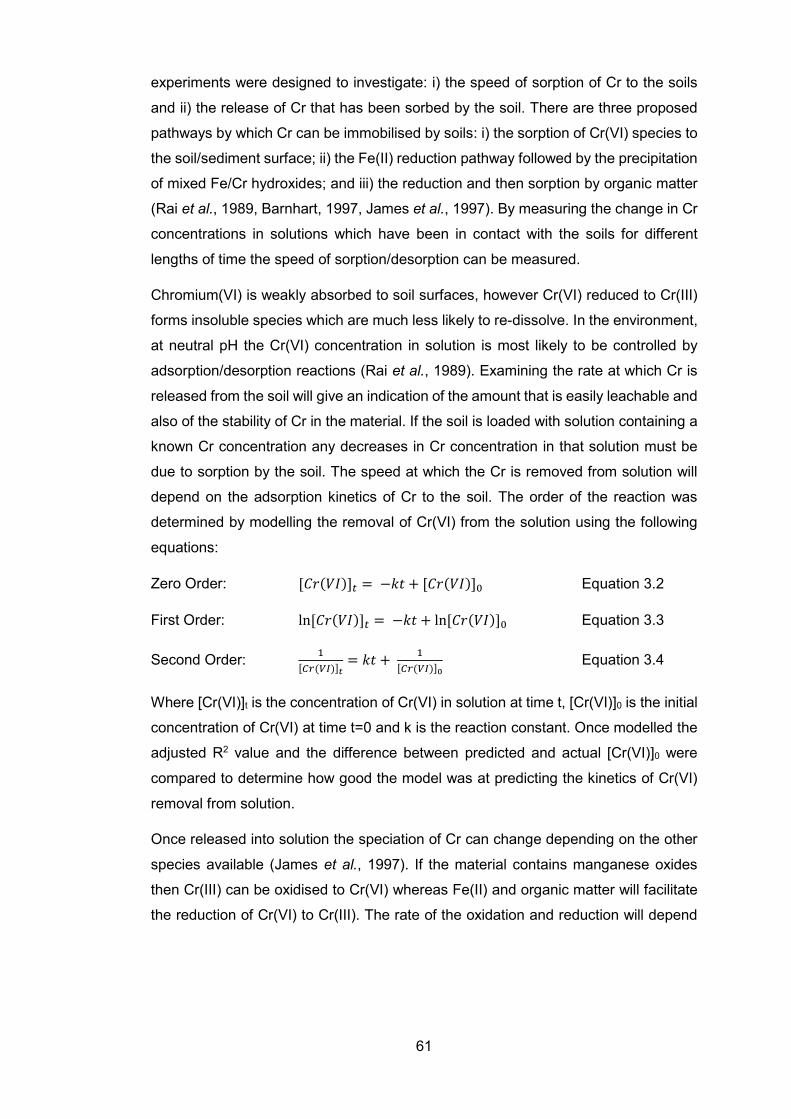
61
experiments were designed to investigate: i) the speed of sorption of Cr to the soils
and ii) the release of Cr that has been sorbed by the soil. There are three proposed
pathways by which Cr can be immobilised by soils: i) the sorption of Cr(VI) species to
the soil/sediment surface; ii) the Fe(II) reduction pathway followed by the precipitation
of mixed Fe/Cr hydroxides; and iii) the reduction and then sorption by organic matter
(Rai et al., 1989, Barnhart, 1997, James et al., 1997). By measuring the change in Cr
concentrations in solutions which have been in contact with the soils for different
lengths of time the speed of sorption/desorption can be measured.
Chromium(VI) is weakly absorbed to soil surfaces, however Cr(VI) reduced to Cr(III)
forms insoluble species which are much less likely to re-dissolve. In the environment,
at neutral pH the Cr(VI) concentration in solution is most likely to be controlled by
adsorption/desorption reactions (Rai et al., 1989). Examining the rate at which Cr is
released from the soil will give an indication of the amount that is easily leachable and
also of the stability of Cr in the material. If the soil is loaded with solution containing a
known Cr concentration any decreases in Cr concentration in that solution must be
due to sorption by the soil. The speed at which the Cr is removed from solution will
depend on the adsorption kinetics of Cr to the soil. The order of the reaction was
determined by modelling the removal of Cr(VI) from the solution using the following
equations:
Zero Order: [𝐶𝐶𝐶𝐶(𝑉𝑉𝑉𝑉)]𝑡𝑡 = −𝑘𝑘𝑚𝑚 + [𝐶𝐶𝐶𝐶(𝑉𝑉𝑉𝑉)]0 Equation 3.2
First Order: ln[𝐶𝐶𝐶𝐶(𝑉𝑉𝑉𝑉)]𝑡𝑡 = −𝑘𝑘𝑚𝑚 + ln[𝐶𝐶𝐶𝐶(𝑉𝑉𝑉𝑉)]0 Equation 3.3
Second Order: 1[𝐶𝐶𝑑𝑑(𝑉𝑉𝑉𝑉)]𝑡𝑡
= 𝑘𝑘𝑚𝑚 + 1[𝐶𝐶𝑑𝑑(𝑉𝑉𝑉𝑉)]0
Equation 3.4
Where [Cr(VI)]t is the concentration of Cr(VI) in solution at time t, [Cr(VI)]0 is the initial
concentration of Cr(VI) at time t=0 and k is the reaction constant. Once modelled the
adjusted R2 value and the difference between predicted and actual [Cr(VI)]0 were
compared to determine how good the model was at predicting the kinetics of Cr(VI)
removal from solution.
Once released into solution the speciation of Cr can change depending on the other
species available (James et al., 1997). If the material contains manganese oxides
then Cr(III) can be oxidised to Cr(VI) whereas Fe(II) and organic matter will facilitate
the reduction of Cr(VI) to Cr(III). The rate of the oxidation and reduction will depend
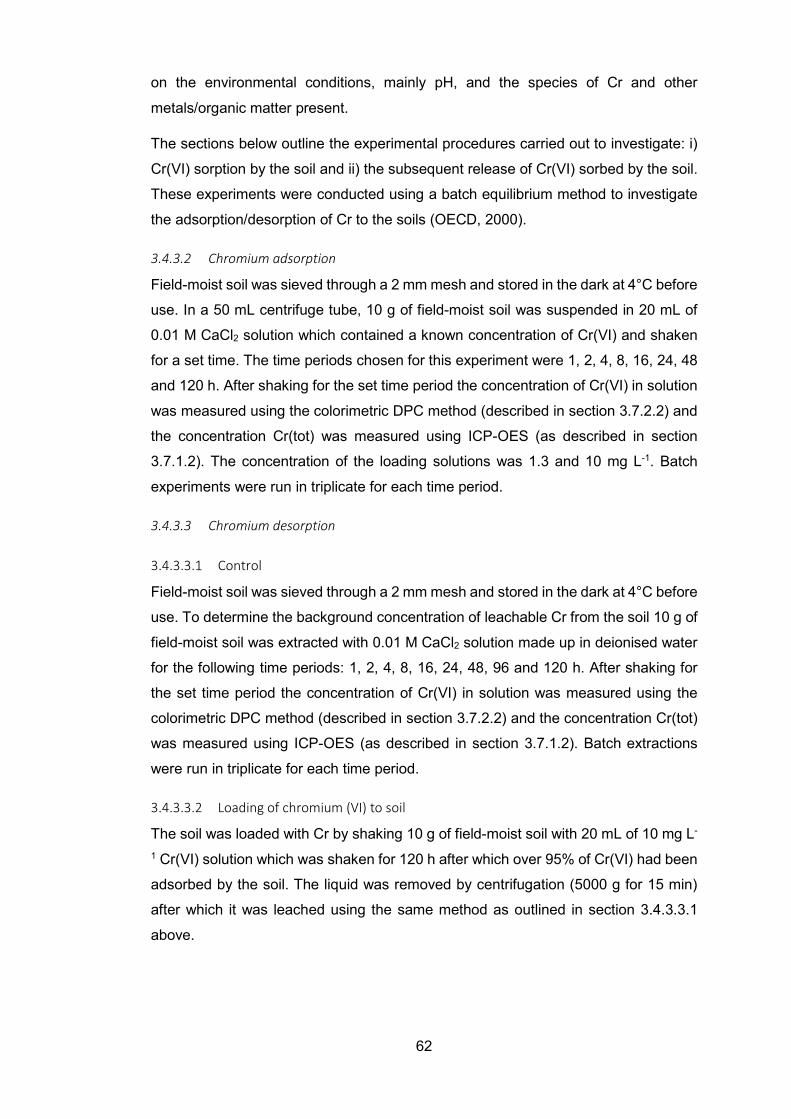
62
on the environmental conditions, mainly pH, and the species of Cr and other
metals/organic matter present.
The sections below outline the experimental procedures carried out to investigate: i)
Cr(VI) sorption by the soil and ii) the subsequent release of Cr(VI) sorbed by the soil.
These experiments were conducted using a batch equilibrium method to investigate
the adsorption/desorption of Cr to the soils (OECD, 2000).
3.4.3.2 Chromium adsorption
Field-moist soil was sieved through a 2 mm mesh and stored in the dark at 4°C before
use. In a 50 mL centrifuge tube, 10 g of field-moist soil was suspended in 20 mL of
0.01 M CaCl2 solution which contained a known concentration of Cr(VI) and shaken
for a set time. The time periods chosen for this experiment were 1, 2, 4, 8, 16, 24, 48
and 120 h. After shaking for the set time period the concentration of Cr(VI) in solution
was measured using the colorimetric DPC method (described in section 3.7.2.2) and
the concentration Cr(tot) was measured using ICP-OES (as described in section
3.7.1.2). The concentration of the loading solutions was 1.3 and 10 mg L-1. Batch
experiments were run in triplicate for each time period.
3.4.3.3 Chromium desorption
3.4.3.3.1 Control
Field-moist soil was sieved through a 2 mm mesh and stored in the dark at 4°C before
use. To determine the background concentration of leachable Cr from the soil 10 g of
field-moist soil was extracted with 0.01 M CaCl2 solution made up in deionised water
for the following time periods: 1, 2, 4, 8, 16, 24, 48, 96 and 120 h. After shaking for
the set time period the concentration of Cr(VI) in solution was measured using the
colorimetric DPC method (described in section 3.7.2.2) and the concentration Cr(tot)
was measured using ICP-OES (as described in section 3.7.1.2). Batch extractions
were run in triplicate for each time period.
3.4.3.3.2 Loading of chromium (VI) to soil
The soil was loaded with Cr by shaking 10 g of field-moist soil with 20 mL of 10 mg L-
1 Cr(VI) solution which was shaken for 120 h after which over 95% of Cr(VI) had been
adsorbed by the soil. The liquid was removed by centrifugation (5000 g for 15 min)
after which it was leached using the same method as outlined in section 3.4.3.3.1
above.
63
3.5 Bioaccessibility of chromium(III) and chromium(VI) in the respirable
fraction (<10 µm) of soils and sediments
Background
Chromium(III) is an essential nutrient but Cr(VI) is known to have adverse health
effects where chronic exposure can lead to contact dermatitis when in contact with
the skin, leading to skin irritation, rash or ulcers. Ingestion of Cr(VI) can lead to organ
damage – specifically the liver and kidneys – and inhalation of airborne Cr can lead
to respiratory irritation and also cancer of the lung and throat. Ingestion of Cr(VI) from
soils which have a high OM content results in the reduction of Cr(VI) to Cr(III) in the
acidic environment of the stomach by the organic matter. Once passed into the
intestines the rise in pH results in the Cr(III) becoming insoluble and therefore
precipitates and is passed out of the body (Broadway, 2008). The inhalation
bioaccessibility of Cr(VI) is more poorly understood but, since Cr(VI) is a known
carcinogen, it is important to quantify the risk associated with exposure to Cr
containing soil to evaluate the potential uptake of Cr(VI) from dust.
Soil/sediment particles that are larger than 10 µm in diameter are too large to enter
the lungs so any inhalation bioaccessibility study must use material which is smaller
than this size fraction. Traditional methods to separate and isolate different particle
size ranges involve passing soils/sediments through a sieve of a known aperture size,
either as dry material or assisted by the addition of water. This method becomes
problematic when trying to collect a large enough amount of <10 µm material for a
series of bioaccessibility tests and so other methods had to be investigated. Laser
particle size analysis, although useful for identifying the particle size distribution within
soils and sediments, is not suitable for this purpose because size fractions cannot be
isolated. Thus the available methods for isolating particles of <10 µm are narrowed to
the use of gravity settling.
The Stokes equation can be used to determine how fast a particle of a certain
diameter will travel through a medium (Equation 2.1):
𝑉𝑉𝑡𝑡 = 𝑔𝑔𝑑𝑑2�𝜌𝜌𝑝𝑝−𝜌𝜌𝑚𝑚�18 µ
Equation 3.5
where Vt is the terminal velocity of the particle (cm s-1), g is the acceleration due to
gravity (9.81 m s-2), d is the diameter of the particle, ρp is the density of the particle,
ρm is the density of the medium and µ is the viscosity of the medium.
64
Using Equation 2.1, a 10 µm particle with a density of 2650 kg m-3 (the mean density
of soil particles) settling in methanol, which has a density of 792 kg m-3 and a viscosity
of 0.000594 kg m-1 s-1, will have a terminal velocity of 1.05 cm min-1.
Isolation of <10 µm fraction from soil and sediment samples
Soil was collected from three sites (see Table 3-2) by the Polmadie Burn which was
transported back to the laboratory where it was sieved through a 2 mm mesh and then
air dried for 1 week. Aggregates in the material were gently broken up using a mortar
and pestle and the material was dry-sieved sequentially through 2 mm, 90 µm, 53 µm
and finally a 38 µm stainless steel sieve. Approximately 10 g of the <38 µm fraction
from each sample was then suspended in ~280 mL methanol which was poured into
a 250 mL measuring cylinder and left to settle for 1 h. The terminal velocity, as
calculated in Equation 2.1 was 1.05 cm min-1 therefore the theoretical time for a
particle to settle 20 cm is 19.0 min. To ensure all material greater than 10 µm was
removed the suspension was left for 1 h to settle. After the settling period, the top 20
cm of liquid was decanted. The measuring cylinder was topped up to the original level,
the material was re-suspended and the process was repeated a further two times to
ensure that the maximum amount of the <10 µm fraction was recovered. The three
fractions were combined and left to dry. From approximately 75 g of the <38 µm
fraction approximately 3 g of <10 µm was recovered.
The extraction of potentially toxic elements from PM10 will depend on the extract used
to simulate the lung fluid. The synthetic lung fluid used for this study was Gamble’s
solution which has a chemical composition that closely mimics the lungs Table 3-6
(Wragg and Klinck, 2007). This mixture of chemicals mimics the composition of the
lungs and the surfactants and other ligands present in the fluid will influence
sequestration of metals by the synthetic lung fluid.
Inhalation bioaccessibility method
Approximately 0.10 g of <10 µm material was accurately weighed and then
suspended in 10 mL of Gamble’s solution. The suspension was shaken on an end-
over-end shaker for 2 h at 38°C before being centrifuged at 5000 x g for 2 min. The
supernatant was decanted, the Gamble’s solution was replaced and the process was
repeated three more times to give a total of 4 fractions (0-2, 2-4, 4-6 and 6-8 h). For
each fraction, the concentration of Cr(VI) was determined using the DPC colorimetric
method (see section 3.7.2.2) and the concentrations of total Cr were determined using
ICP-MS.
65
Table 3-3: Composition of Gamble's solution (Wragg and Klinck, 2007)
Chemical Mass in 1 L (g)
Sodium chloride 6.779
Ammonium chloride 0.535
Sodium hydrogen carbonate 2.268
Glycine 0.375
Calcium chloride 0.022
Sodium citrate 0.059
L-Cysteine 0.121
Sodium hydrogen phosphate 0.187
Sulphuric acid (5 mM)
Diethylenetriaminepentaacetic acid (DTPA) 0.080
Benzalkonium chloride (ABAC) 0.050
3.6 Gel electrophoresis
Background
To investigate the association of Cr with organic matter, gel electrophoresis was used
to separate dissolved organic matter based on its size and charge. The gel
electrophoresis principle works by creating an agarose gel bed which was submerged
in a tris(trimethylsilyl) borate (tris borate) buffer solution with a well in which the soil
extracted organic matter was added. An electric current was applied to the gel and
the charged particles are drawn to the oppositely charged terminal. The speed, and
therefore the distance, that the particle travels at will depend on their size and charge.
Small highly charged colloids will travel further than large ones with less charge. By
correlating the occurrence of Cr with organic matter in these bands it was possible to
determine the association of Cr and organic matter.
Organic matter extraction from soils and sediments
To extract the organic matter from the soils and sediments a sodium hydroxide
solution was used. To a centrifuge tube 10 g of soil/sediment was added to 20 mL of
0.1 M sodium hydroxide which was prepared by dissolving 0.4 g of sodium hydroxide
in a 100 mL volumetric flask made up to the mark with deionised water. The mixture
was shaken on an end-over-end shaker for 1 h and then the extractant was separated
from the soil/sediment by centrifugation at 5000 g for 10 min. The extractant was then
66
filtered through a Millex-HA 0.45 µm syringe filter (Merck Millipore) before being
added to the gel electrophoresis well.
Gel electrophoresis method
The tris-borate buffer solution was prepared by dissolving 5.4 g of 2-amino-2-
hydroxymethyl-propane-1,3-diol and 2.75 g of orthoboric acid in a 1 L volumetric flask
which was made up to the mark using deionised water. The 1% w/v agarose gel was
prepared by gently heating 1.5 g of agarose powder in 150 mL of tris-borate buffer.
The mixture was then gently heated in a microwave oven (300 W for approximately 3
min) until the agarose dissolved. The hot gel was then poured into the gel tray where
a well was created using a comb and left to cool for 30 min. The tank was filled with
tris-borate buffer solution with the well closest to the negative terminal as the organic
matter has a high negative charge. Approximately 2 mL of the soil or sediment
extractant was added to the well and a fixed current of 20 mA was applied across the
gel for 30 min. The gel was then cut into 10 strips of 1 cm width.
To extract the liquid from the gel the strips were frozen and defrosted and then
centrifuged (5000 g for 20 min) to separate the liquid from the gel. The relative organic
matter concentrations in each gel was determined by measuring the absorbance of
the liquid at 254 nm (section 3.7.2.4) and the Cr, Fe, Mn and Al concentrations were
measured using ICP-MS (section 3.7.1.3).
3.7 Analysis of water samples, extracts and digests
Inductively coupled plasma-optical emission spectroscopy (ICP-OES) and
inductively coupled plasma-mass spectroscopy (ICP-MS)
3.7.1.1 Background
The concentrations of elements dissolved in an aqueous solution can be analysed
using inductively coupled plasma-optical emission spectroscopy (ICP-OES) or
inductively coupled plasma-mass spectroscopy (ICP-MS). These techniques use an
argon plasma which is created by passing argon gas through a high power radio
frequency (RF) signal which causes it to ionise creating a gaseous mixture of positive
ions and electrons which have a net neutral charge. The large amount of energy
produced during this process creates temperatures of up to 10,000 K which atomises
and ionises the samples (Figure 3-16). In ICP-OES the relaxation of electrons to lower
energy states releases a photon which has a wavelength unique to that energy gap.
This means different elements produce light of discrete values which identifies the
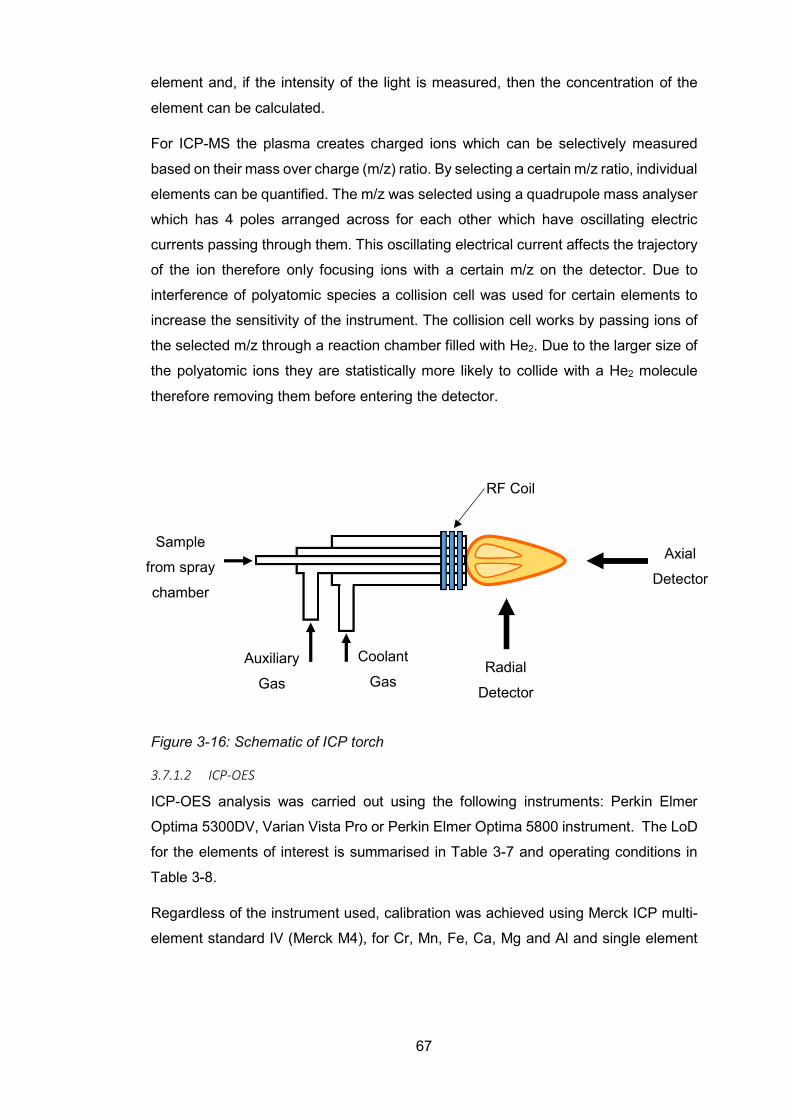
67
element and, if the intensity of the light is measured, then the concentration of the
element can be calculated.
For ICP-MS the plasma creates charged ions which can be selectively measured
based on their mass over charge (m/z) ratio. By selecting a certain m/z ratio, individual
elements can be quantified. The m/z was selected using a quadrupole mass analyser
which has 4 poles arranged across for each other which have oscillating electric
currents passing through them. This oscillating electrical current affects the trajectory
of the ion therefore only focusing ions with a certain m/z on the detector. Due to
interference of polyatomic species a collision cell was used for certain elements to
increase the sensitivity of the instrument. The collision cell works by passing ions of
the selected m/z through a reaction chamber filled with He2. Due to the larger size of
the polyatomic ions they are statistically more likely to collide with a He2 molecule
therefore removing them before entering the detector.
3.7.1.2 ICP-OES
ICP-OES analysis was carried out using the following instruments: Perkin Elmer
Optima 5300DV, Varian Vista Pro or Perkin Elmer Optima 5800 instrument. The LoD
for the elements of interest is summarised in Table 3-7 and operating conditions in
Table 3-8.
Regardless of the instrument used, calibration was achieved using Merck ICP multi-
element standard IV (Merck M4), for Cr, Mn, Fe, Ca, Mg and Al and single element
Axial
Detector
Radial
Detector
Sample
from spray
chamber
Auxiliary
Gas
Coolant
Gas
Figure 3-16: Schematic of ICP torch
RF Coil
68
calibration standard for S (Merck). When used in axial detection mode, the following
concentrations were used: 0.1, 0.5, 1, 5, 10, 20, 50, 100 and 200 mg L-1. When radial
detection was used the following standards were used: 10, 50, 100, 500 and 1000 mg
L-1. Two separate calibrations were used to determine the elemental concentration
when using axial view: a low calibration of 0 to 10 mg L-1 and a high calibration of 0
to 200 mg L-1. Independent checks, e.g. a x10 dilution of Merck ICP multi-element
standard VI (Merck M6) and a x10 dilution of WavCal (Perkin Elmer) was used to test
the accuracy at the beginning of each sample run. During analysis a calibration check
(Merck M4) and a rinse (2 % v/v Aristar, VWR International Ltd HNO3) was analysed
every 10 samples to ensure there was no drift.

69
Table 3-4: Limit of detection from ICP analysis
Element ICP-OES (mg L-1)
ICP-MS (µg L-1)
Cr 0.378 0.154 Fe 0.234 4.01 Mn 0.194 0.660 Al 0.901 5.14 Ca 0.557 - Mg 0.565 - S 0.248 -
Table 3-5: ICP-OES operating conditions
Parameter Value
Nebuliser Gem Tip cross flow
Spray Chamber Scott Type
Plasma Gas Flow (Ar) 10 L min-1
Auxiliary Gas Flow (Ar) 0.2 L min-1
Carrier Gas Flow (Ar) 0.6 L min-1
RF Power 1500 W
Pump Flow Rate 1.5 L min-1
Plasma Mode Axial and Radiala aRadial view was only used for a select number of samples where concentrations
were higher than 200 mg L-1
3.7.1.3 ICP-MS
ICP-MS was carried out using an Agilent 7500ce instrument. The LoD of this
instrument is summarised in Table 3-7 and it was used to analyse samples which had
element concentrations lower than the LoD of the ICP-OES.
The instrument was calibrated using Merck M4 solution which was diluted using the
same matrix as the samples, when possible, to the following concentrations: 0.1, 0.5,
1, 5, 10, 50, 100, 500, 1000 µg L-1. The calibration was validated using Standard
Reference Material 1640a Trace Metals in Freshwater (SRM 1640a) and, as with the
ICP-OES analysis, drift checks and rinses were included after every 6 samples. When
the sample matrix did not match the matrix of the standards an internal standard was
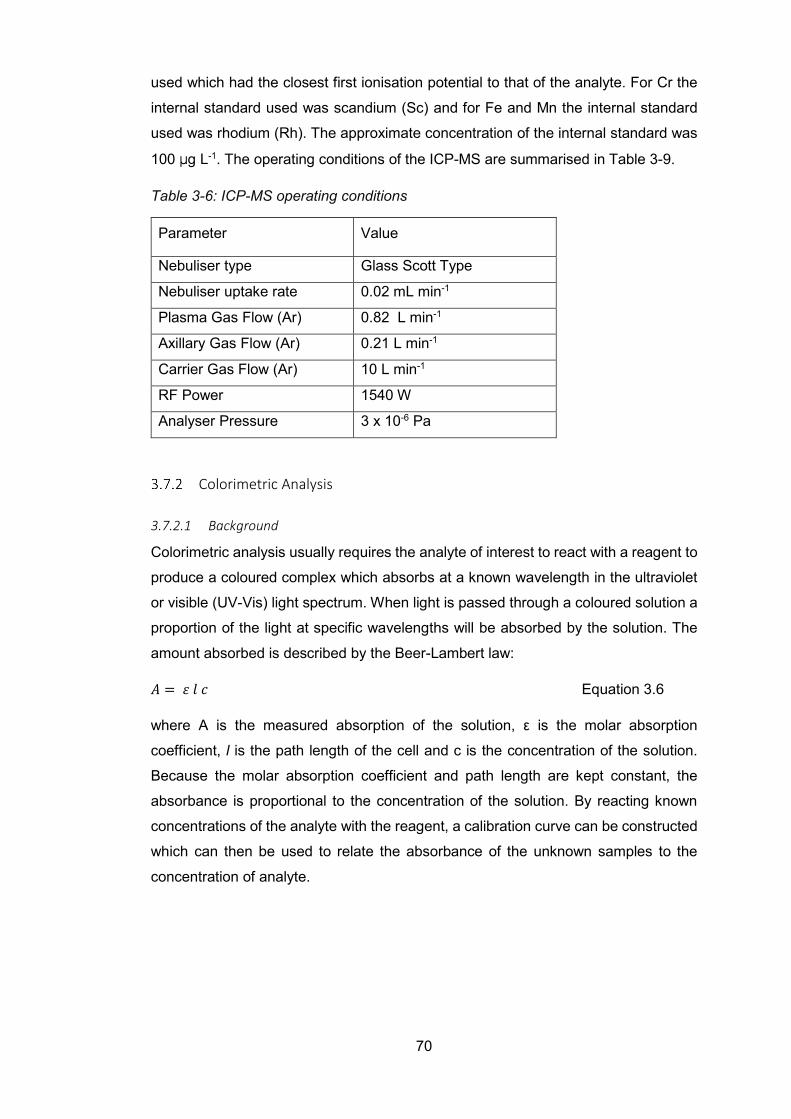
70
used which had the closest first ionisation potential to that of the analyte. For Cr the
internal standard used was scandium (Sc) and for Fe and Mn the internal standard
used was rhodium (Rh). The approximate concentration of the internal standard was
100 µg L-1. The operating conditions of the ICP-MS are summarised in Table 3-9.
Table 3-6: ICP-MS operating conditions
Parameter Value
Nebuliser type Glass Scott Type
Nebuliser uptake rate 0.02 mL min-1
Plasma Gas Flow (Ar) 0.82 L min-1
Axillary Gas Flow (Ar) 0.21 L min-1
Carrier Gas Flow (Ar) 10 L min-1
RF Power 1540 W
Analyser Pressure 3 x 10⁻⁶ Pa
Colorimetric Analysis
3.7.2.1 Background
Colorimetric analysis usually requires the analyte of interest to react with a reagent to
produce a coloured complex which absorbs at a known wavelength in the ultraviolet
or visible (UV-Vis) light spectrum. When light is passed through a coloured solution a
proportion of the light at specific wavelengths will be absorbed by the solution. The
amount absorbed is described by the Beer-Lambert law:
𝐴𝐴 = 𝜀𝜀 𝑙𝑙 𝑜𝑜 Equation 3.6
where A is the measured absorption of the solution, ε is the molar absorption
coefficient, l is the path length of the cell and c is the concentration of the solution.
Because the molar absorption coefficient and path length are kept constant, the
absorbance is proportional to the concentration of the solution. By reacting known
concentrations of the analyte with the reagent, a calibration curve can be constructed
which can then be used to relate the absorbance of the unknown samples to the
concentration of analyte.
71
3.7.2.2 Diphenylcarbazide chromium(VI) determination
Chromium(VI) can be selectively analysed by reacting it with 1,5–diphenylcarbazide
(DPC) at an acidic pH to form a purple colour which has a maximum absorbance at
540 nm. The method used was a modified version of the USEPA Method 7196
Chromium, Hexavalent (Colorimetric). Instead of acidifying the solution before adding
the DPC solution, the DPC solution was acidified using orthophosphoric acid to
ensure that the final solution pH was that required for the complexation reaction to
take place.
Acidified DPC solution was made by dissolving 0.095 g of DPC in 25 mL of acetone
(Fisher Scientific, Reagent Grade), 30 mL of orthophosphoric acid (Fisher Scientific,
Reagent Grade) and 70 mL of deionised water. Once made up the acidified DPC
solution is light sensitive and rapidly degrades so fresh solution was made up as
required and stored in a brown glass bottle for no more than 2 days. A Cr(VI) stock
solution of 0.5 g L-1 was prepared by dissolving 0.141 g of potassium dichromate
(Reagent Grade, Fisher Scientific) in 100 mL of deionised water. A working Cr(VI)
stock solution of 5 mg L-1 was prepared by diluting 1 mL of this stock solution with 99
mL of deionised water in a 100 mL volumetric flask. The working stock solution was
used to prepare Cr(VI) standards which had Cr(VI) concentrations of 0.02, 0.04, 0.1,
0.2, 0.4, 1, 2 and 5 mg L-1. In a 25 mL volumetric flask 2.5 mL of acidified DPC solution
was added to 5 mL of standard/sample, agitated and then left for 20 min for the colour
to develop. Afterwards, the solution was made up to the mark with deionised water
and then analysed at 540 nm using a Shimadzu UV-2700 UV-Vis spectrometer.
For each analysis at least 3 reagent blank samples were analysed and the
concentration of the 5 mg L-1 Cr(VI) standard was checked using ICP-OES to ensure
the accuracy of the calibration standards.
3.7.2.3 Ferrozine iron(II) determination
Iron(II) concentrations in porewater samples were determined using the ferrozine
method (Viollier et al., 2000). 100 µL of ferrozine solution (0.01 M of ferrozine in 0.1
M ammonium acetate solution) was added to 1 mL of porewater. The absorbance was
measured at 562 nm using a UV/Vis spectrometer to determine the Fe(II)
concentration in solution. The instrument was calibrated using the following FeCl3
concentrations: 0.1, 0.5, 1 and 5 mg L-1 of Fe. An 800 µL aliquot of each of the
standards was added to the ferrozine reduced using 150 µL hydroxylamine
hydrochloride solution (1.4 M) made up in HCl (2 M) and 50 µL of 10 M ammonium
72
acetate buffer, adjusted to pH 9.5 with a solution of ammonium hydroxide, before
measuring the absorbance.
3.7.2.4 Organic matter analysis
The dissolved organic matter concentration (DOM) in waters has been shown to have
a linear relationship with the absorbance at 254 nm due to the aromatic structures
found in humic substances which are known to absorb UV light. To measure the
relative concentration of DOM in each fraction separated using gel electrophoresis,
the absorbance of each fraction between 550 - 200 nm was measured at 1 nm
intervals at a medium scan rate using a Shimadzu UV 2700 UV-Vis spectrometer.
pH measurements
3.7.3.1 Water samples
The pH of aqueous samples was measured using a Jenway 33505 pH meter which
had automatic temperature correction and was calibrated using pH 4 and 7 buffer
solutions (Fisher Scientific). Calibration checks were made every 10 samples to
ensure there was no drift in the measurements.
3.7.3.2 Soil and sediment
To measure the pH of soil and sediment samples 5 g of the soil/sediment was weighed
into a 50 mL centrifuge tube along with 20 mL of 0.01 M CaCl2 solution. This was
mixed on an end-over-end shaker at 30 rpm for 15 min. The pH of the slurry was then
left to settle for 10 min before being analysed using the same method as outlined
above for water samples.
3.7.3.3 Field pH and redox measurements
Field pH and Eh measurements were taken using a Hannah HI98120 probe which
was calibrated prior to use.
Statistical analysis
In order to aid the interpretation of the results, statistical methods were used to
determine if there were significant differences or correlations between results. The
normality of the data was checked by performing an Anderson-Darling normality test
using Origin 2016. Data which was not normally distributed was log10 transformed and
retested for normality. If, upon retesting, the log10 transformed data was not normally
distributed an equivalent non-parametric test was selected. Statistical analysis was
performed using Minitab 17 Statistical Software. Due to the large number of datasets

73
which were not normally distributed, Spearman’s Rank correlation coefficient was
used when testing the correlation between data. To determine statistical differences
between soil and sediment in the column leaching test Student T-test or Mann-
Whitney U (non-parametric) tests were used. The statistical significant level used was
p<0.05 unless stated otherwise.
74
4 The temporal and spatial variations in chromium
concentrations and associations in a sediment-water-banking
soil system, Polmadie Burn, south east Glasgow, Scotland
4.1 Introduction To understand changes in the mobility and speciation of Cr in the environment the
geochemistry of the area must first be characterised. The speciation, and
consequently the mobility, of Cr is largely influenced by pH and redox status as well
as the presence of Fe, Mn and organic matter (OM). For industrially contaminated
sites such as those in south east Glasgow, the mineralogical associations of Cr within
the soil and sediment can also be important. This chapter characterises the
geochemistry of the Polmadie Burn banking soils and sediments to help understand
the changes that lead to Cr (in)mobilisation. The key questions that will be addressed
in this chapter are:
i) What are the concentrations of Cr in the Polmadie Burn system including
surface waters, soil and sediment porewaters along with the solid phase
Cr concentrations in the banking soils and sediments?
ii) Are there any temporal trends in the concentrations of Cr in the Polmadie
Burn?
iii) What impact does COPR have as a source of Cr on the system?
iv) What are the main associations of Cr in the banking soil and sediment and
how does this impact its long-term fate?
This chapter first discusses the long-term data provided by SEPA collected from the
Polmadie Burn water over the years 1967 to 2017 to identify long-term trends and
evaluate the stream’s compliance with the European Union’s Water Framework
Directive (WFD). The rest of the chapter presents data collected over the course of
this project from samples taken from the Polmadie Burn water, banking soils and
sediments to characterise system.
75
4.2 Evaluation of long-term trends in water quality and in the concentrations
of chromium and other elements based on monthly sampling data
(Polmadie-Malls Mire) provided by SEPA
Routine water quality monitoring was carried out by the Scottish Environment
Protection Agency (SEPA) at the Polmadie Burn (NS 60238 62983) (Figure 4-1) from
1967 to the current time. A freedom of information request was made and monthly
concentration data for the range of parameters, shown in Table 4-1 and Table 4-2,
was provided for the period 25/01/1967 to 28/09/2017. Some parameters were only
measured during part of this time period and the dates/numbers of measurements are
also recorded in Table 4-1 and Table 4-2. The mean (± 1 s.d.), median, maximum and
minimum values were calculated for each parameter over the entire time period and
are summarised in Table 4-1 and Table 4-2. Non-metal, nutrient and other water
chemistry data is summarised in Table 4-1 and metal and metalloid data is
summarised in Table 4-2. The content of these tables will be explained in more detail
below where the temporal trends are investigated.
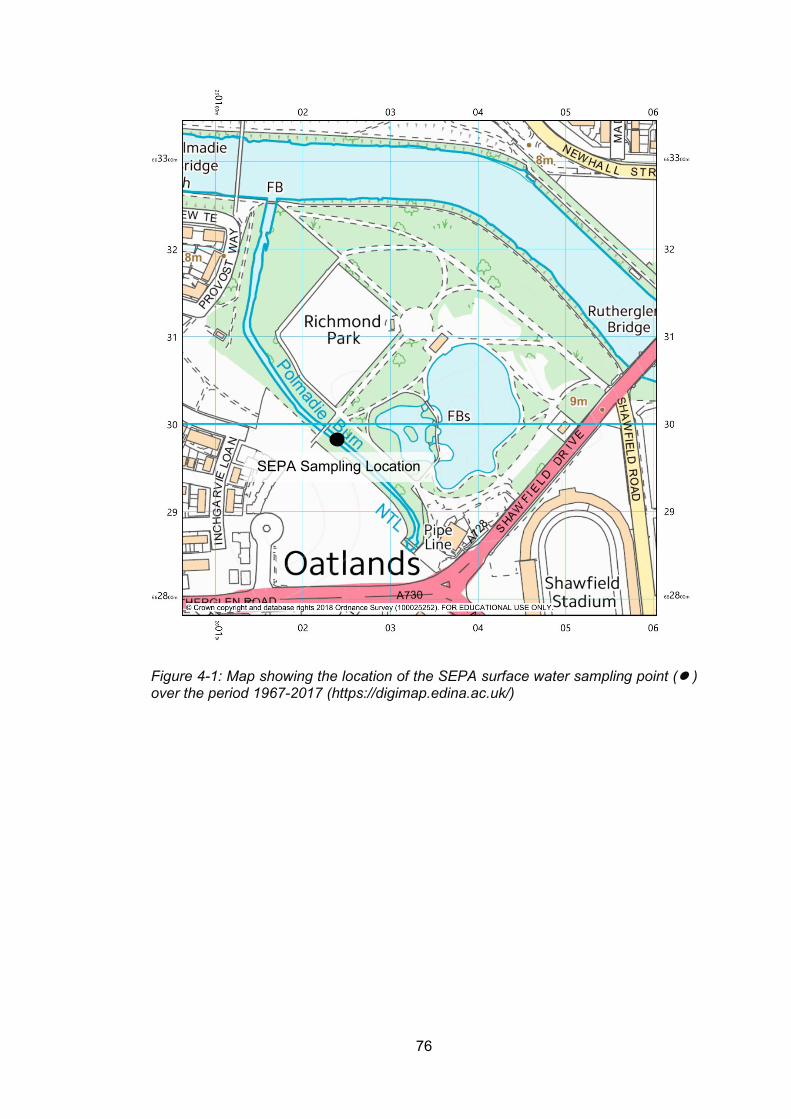
76
Figure 4-1: Map showing the location of the SEPA surface water sampling point ( ) over the period 1967-2017 (https://digimap.edina.ac.uk/)
SEPA Sampling Location
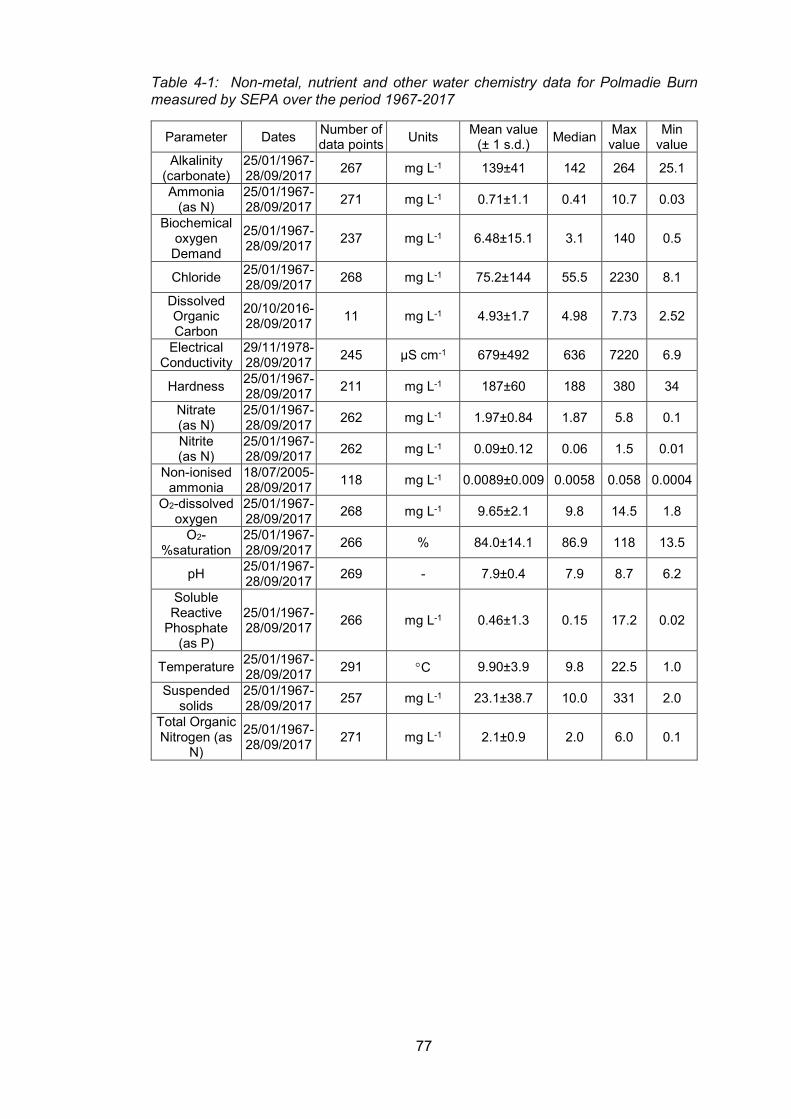
77
Table 4-1: Non-metal, nutrient and other water chemistry data for Polmadie Burn measured by SEPA over the period 1967-2017
Parameter Dates Number of data points Units Mean value
(± 1 s.d.) Median Max value
Min value
Alkalinity (carbonate)
25/01/1967-28/09/2017 267 mg L-1 139±41 142 264 25.1
Ammonia (as N)
25/01/1967-28/09/2017 271 mg L-1 0.71±1.1 0.41 10.7 0.03
Biochemical oxygen
Demand
25/01/1967-28/09/2017 237 mg L-1 6.48±15.1 3.1 140 0.5
Chloride 25/01/1967-28/09/2017 268 mg L-1 75.2±144 55.5 2230 8.1
Dissolved Organic Carbon
20/10/2016-28/09/2017 11 mg L-1 4.93±1.7 4.98 7.73 2.52
Electrical Conductivity
29/11/1978-28/09/2017 245 µS cm-1 679±492 636 7220 6.9
Hardness 25/01/1967-28/09/2017 211 mg L-1 187±60 188 380 34
Nitrate (as N)
25/01/1967-28/09/2017 262 mg L-1 1.97±0.84 1.87 5.8 0.1
Nitrite (as N)
25/01/1967-28/09/2017 262 mg L-1 0.09±0.12 0.06 1.5 0.01
Non-ionised ammonia
18/07/2005-28/09/2017 118 mg L-1 0.0089±0.009 0.0058 0.058 0.0004
O2-dissolved oxygen
25/01/1967-28/09/2017 268 mg L-1 9.65±2.1 9.8 14.5 1.8
O2-%saturation
25/01/1967-28/09/2017 266 % 84.0±14.1 86.9 118 13.5
pH 25/01/1967-28/09/2017 269 - 7.9±0.4 7.9 8.7 6.2
Soluble Reactive
Phosphate (as P)
25/01/1967-28/09/2017 266 mg L-1 0.46±1.3 0.15 17.2 0.02
Temperature 25/01/1967-28/09/2017 291 °C 9.90±3.9 9.8 22.5 1.0
Suspended solids
25/01/1967-28/09/2017 257 mg L-1 23.1±38.7 10.0 331 2.0
Total Organic Nitrogen (as
N)
25/01/1967-28/09/2017 271 mg L-1 2.1±0.9 2.0 6.0 0.1
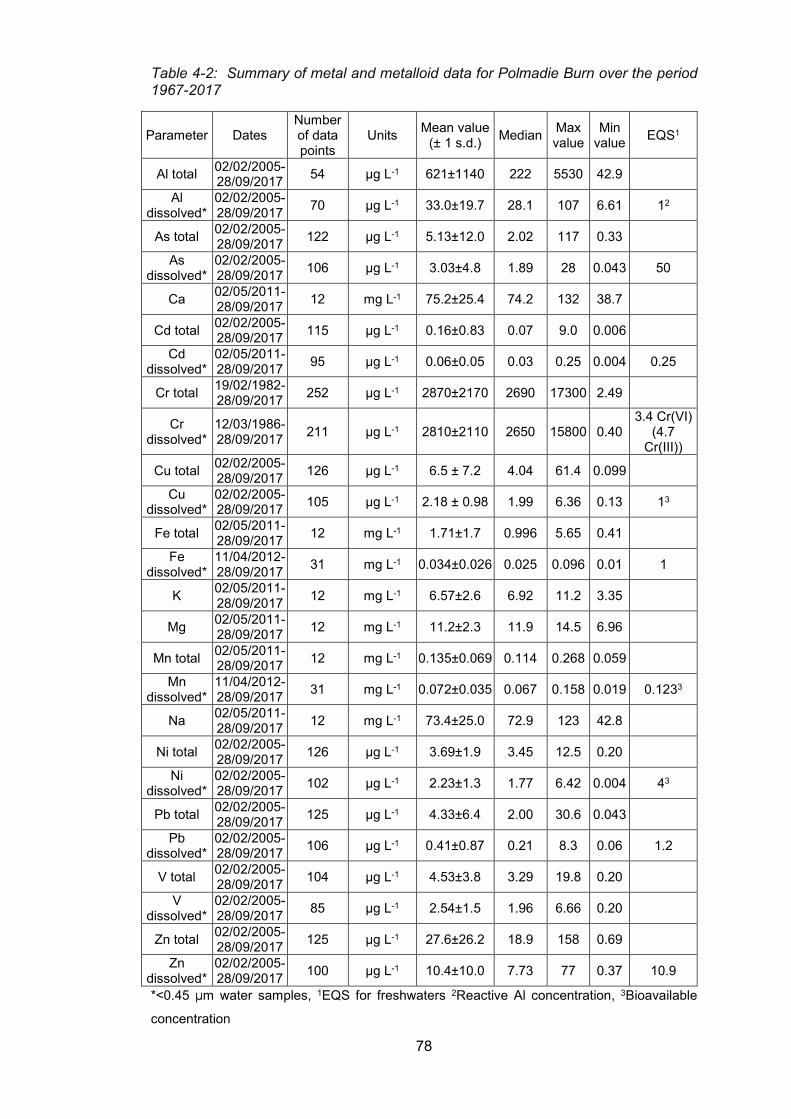
78
Table 4-2: Summary of metal and metalloid data for Polmadie Burn over the period 1967-2017
Parameter Dates Number of data points
Units Mean value (± 1 s.d.) Median Max
value Min
value EQS1
Al total 02/02/2005-28/09/2017 54 µg L-1 621±1140 222 5530 42.9
Al dissolved*
02/02/2005-28/09/2017 70 µg L-1 33.0±19.7 28.1 107 6.61 12
As total 02/02/2005-28/09/2017 122 µg L-1 5.13±12.0 2.02 117 0.33
As dissolved*
02/02/2005-28/09/2017 106 µg L-1 3.03±4.8 1.89 28 0.043 50
Ca 02/05/2011-28/09/2017 12 mg L-1 75.2±25.4 74.2 132 38.7
Cd total 02/02/2005-28/09/2017 115 µg L-1 0.16±0.83 0.07 9.0 0.006
Cd dissolved*
02/05/2011-28/09/2017 95 µg L-1 0.06±0.05 0.03 0.25 0.004 0.25
Cr total 19/02/1982-28/09/2017 252 µg L-1 2870±2170 2690 17300 2.49
Cr dissolved*
12/03/1986-28/09/2017 211 µg L-1 2810±2110 2650 15800 0.40
3.4 Cr(VI) (4.7
Cr(III))
Cu total 02/02/2005-28/09/2017 126 µg L-1 6.5 ± 7.2 4.04 61.4 0.099
Cu dissolved*
02/02/2005-28/09/2017 105 µg L-1 2.18 ± 0.98 1.99 6.36 0.13 13
Fe total 02/05/2011-28/09/2017 12 mg L-1 1.71±1.7 0.996 5.65 0.41
Fe dissolved*
11/04/2012-28/09/2017 31 mg L-1 0.034±0.026 0.025 0.096 0.01 1
K 02/05/2011-28/09/2017 12 mg L-1 6.57±2.6 6.92 11.2 3.35
Mg 02/05/2011-28/09/2017 12 mg L-1 11.2±2.3 11.9 14.5 6.96
Mn total 02/05/2011-28/09/2017 12 mg L-1 0.135±0.069 0.114 0.268 0.059
Mn dissolved*
11/04/2012-28/09/2017 31 mg L-1 0.072±0.035 0.067 0.158 0.019 0.1233
Na 02/05/2011-28/09/2017 12 mg L-1 73.4±25.0 72.9 123 42.8
Ni total 02/02/2005-28/09/2017 126 µg L-1 3.69±1.9 3.45 12.5 0.20
Ni dissolved*
02/02/2005-28/09/2017 102 µg L-1 2.23±1.3 1.77 6.42 0.004 43
Pb total 02/02/2005-28/09/2017 125 µg L-1 4.33±6.4 2.00 30.6 0.043
Pb dissolved*
02/02/2005-28/09/2017 106 µg L-1 0.41±0.87 0.21 8.3 0.06 1.2
V total 02/02/2005-28/09/2017 104 µg L-1 4.53±3.8 3.29 19.8 0.20
V dissolved*
02/02/2005-28/09/2017 85 µg L-1 2.54±1.5 1.96 6.66 0.20
Zn total 02/02/2005-28/09/2017 125 µg L-1 27.6±26.2 18.9 158 0.69
Zn dissolved*
02/02/2005-28/09/2017 100 µg L-1 10.4±10.0 7.73 77 0.37 10.9
*<0.45 µm water samples, 1EQS for freshwaters 2Reactive Al concentration, 3Bioavailable
concentration
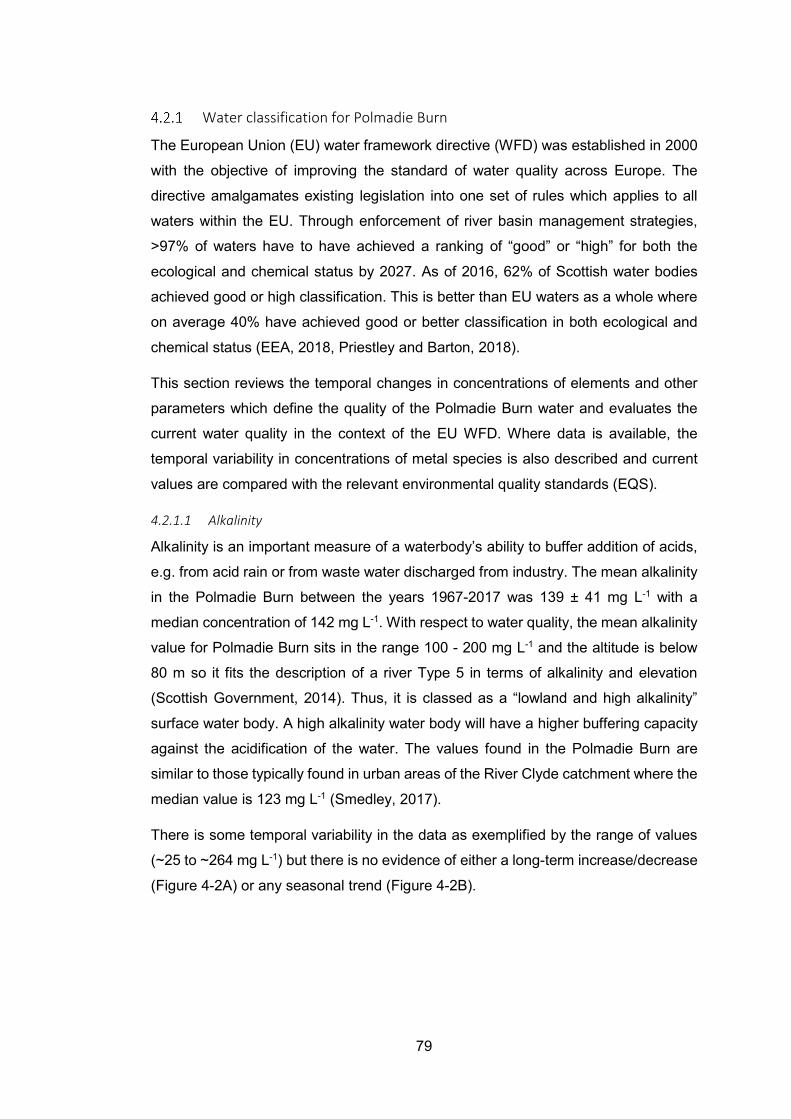
79
Water classification for Polmadie Burn
The European Union (EU) water framework directive (WFD) was established in 2000
with the objective of improving the standard of water quality across Europe. The
directive amalgamates existing legislation into one set of rules which applies to all
waters within the EU. Through enforcement of river basin management strategies,
>97% of waters have to have achieved a ranking of “good” or “high” for both the
ecological and chemical status by 2027. As of 2016, 62% of Scottish water bodies
achieved good or high classification. This is better than EU waters as a whole where
on average 40% have achieved good or better classification in both ecological and
chemical status (EEA, 2018, Priestley and Barton, 2018).
This section reviews the temporal changes in concentrations of elements and other
parameters which define the quality of the Polmadie Burn water and evaluates the
current water quality in the context of the EU WFD. Where data is available, the
temporal variability in concentrations of metal species is also described and current
values are compared with the relevant environmental quality standards (EQS).
4.2.1.1 Alkalinity
Alkalinity is an important measure of a waterbody’s ability to buffer addition of acids,
e.g. from acid rain or from waste water discharged from industry. The mean alkalinity
in the Polmadie Burn between the years 1967-2017 was 139 ± 41 mg L-1 with a
median concentration of 142 mg L-1. With respect to water quality, the mean alkalinity
value for Polmadie Burn sits in the range 100 - 200 mg L-1 and the altitude is below
80 m so it fits the description of a river Type 5 in terms of alkalinity and elevation
(Scottish Government, 2014). Thus, it is classed as a “lowland and high alkalinity”
surface water body. A high alkalinity water body will have a higher buffering capacity
against the acidification of the water. The values found in the Polmadie Burn are
similar to those typically found in urban areas of the River Clyde catchment where the
median value is 123 mg L-1 (Smedley, 2017).
There is some temporal variability in the data as exemplified by the range of values
(~25 to ~264 mg L-1) but there is no evidence of either a long-term increase/decrease
(Figure 4-2A) or any seasonal trend (Figure 4-2B).
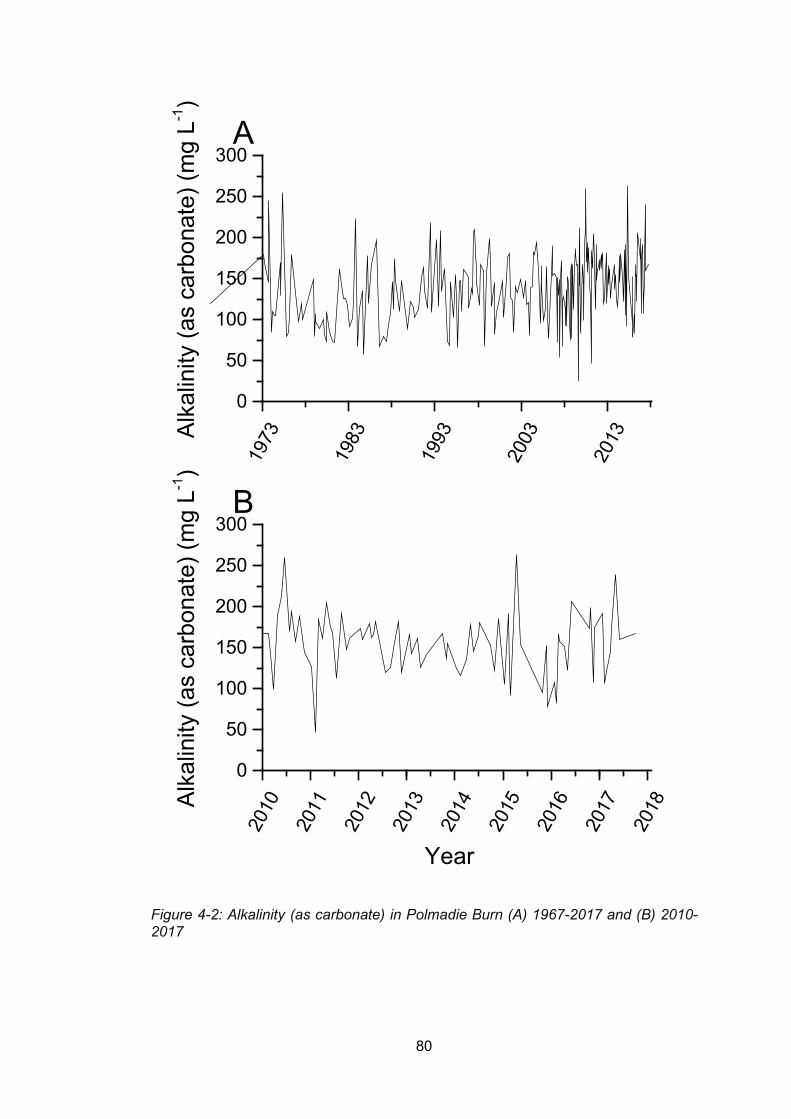
80
Figure 4-2: Alkalinity (as carbonate) in Polmadie Burn (A) 1967-2017 and (B) 2010-2017
1973
1983
1993
2003
2013
0
50
100
150
200
250
300
2010
2011
2012
2013
2014
2015
2016
2017
2018
0
50
100
150
200
250
300
Alka
linity
(as
carb
onat
e) (m
g L-1
)
A
Year
Alka
linity
(as
carb
onat
e) (m
g L-1
)
B
81
4.2.1.2 Dissolved oxygen concentrations and temperature
Dissolved oxygen concentrations in a waterbody are important for sustaining aquatic
life. Low oxygen concentrations indicate the formation of eutrophic conditions which
occur due to the loss of oxygen which is used during the metabolism of organic matter
by bacteria. Warm, stagnant water with high levels of nutrients favour the formation
of eutrophic conditions. The mean dissolved oxygen concentration in the Polmadie
Burn was 9.65 ± 2.1 mg L-1 (Figure 4-3). This value can be converted into the oxygen
saturation level which gives an indication of how much oxygen is dissolved in the
water compared to the theoretical maximum of 100%.
The Polmadie Burn is classed as a “lowland and high alkalinity” water so the dissolved
oxygen levels (% saturation) should be >70% for high or 60-70% for good status under
the EU WFD. Based on the entire data set, the mean dissolved oxygen (as %
saturation) was 84.0 ± 14% but the 10th percentile value, which is used as the basis
for classification, is only 67.3 % and so Polmadie Burn achieves good status. Based
on the 2010-2017 data, the 10th percentile value is 71.4% and so now Polmadie Burn
will be classified as achieving high status (Figure 4-4).
There is some evidence of seasonal variation with lowest dissolved oxygen levels
typically occurring over summer into early autumn (June-September/October) (Figure
4-3). This is possibly due to the changes in the water temperature where warmer
water promotes biological activity therefore increases the rate of oxygen consumption
as indicated by the inverse relationship shown between water temperature and
dissolved oxygen concentrations. The biological reduction of Fe(III) to Fe(II), which
has been shown to reduce Cr(VI), may coincide with changes in the Cr speciation
found in the burn with a higher percentage of Cr found in as Cr(III) during the summer
months.
82
2010
2011
2012
2013
2014
2015
2016
2017
2018
2
4
6
8
10
12
14
1973
1983
1993
2003
2013
0
2
4
6
8
10
12
14
2010
2011
2012
2013
2014
2015
2016
2017
2018
0
5
10
15
20
1973
1983
1993
2003
2013
0
5
10
15
20
YearYear
Dis
solv
ed O
xyge
n (m
g L-1
)
A
Dis
solv
ed O
xyge
n (m
g L-1
)
B
Wat
er T
empe
ratu
re (°
C)
C
Wat
er T
empe
ratu
re (°
C)
D
Figure 4-3: Temporal variations in (A) Dissolved oxygen (as mg L-1) 2010-2017; (B) Dissolved oxygen (as mg L-1) 1967-2017; (C) Temperature (°C) 2010-2017; (D) Temperature (°C) 1967-2017
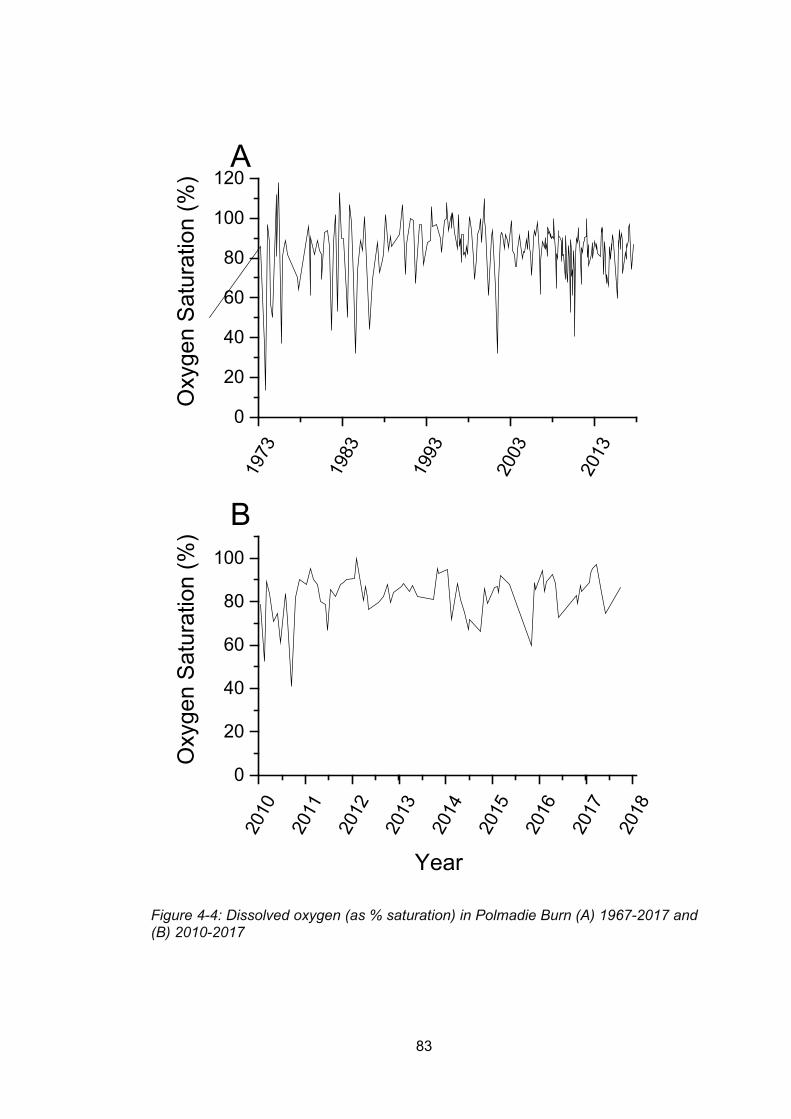
83
Figure 4-4: Dissolved oxygen (as % saturation) in Polmadie Burn (A) 1967-2017 and (B) 2010-2017
1973
1983
1993
2003
2013
0
20
40
60
80
100
120
2010
2011
2012
2013
2014
2015
2016
2017
2018
0
20
40
60
80
100
Oxy
gen
Satu
ratio
n (%
)A
Oxy
gen
Satu
ratio
n (%
)
Year
B
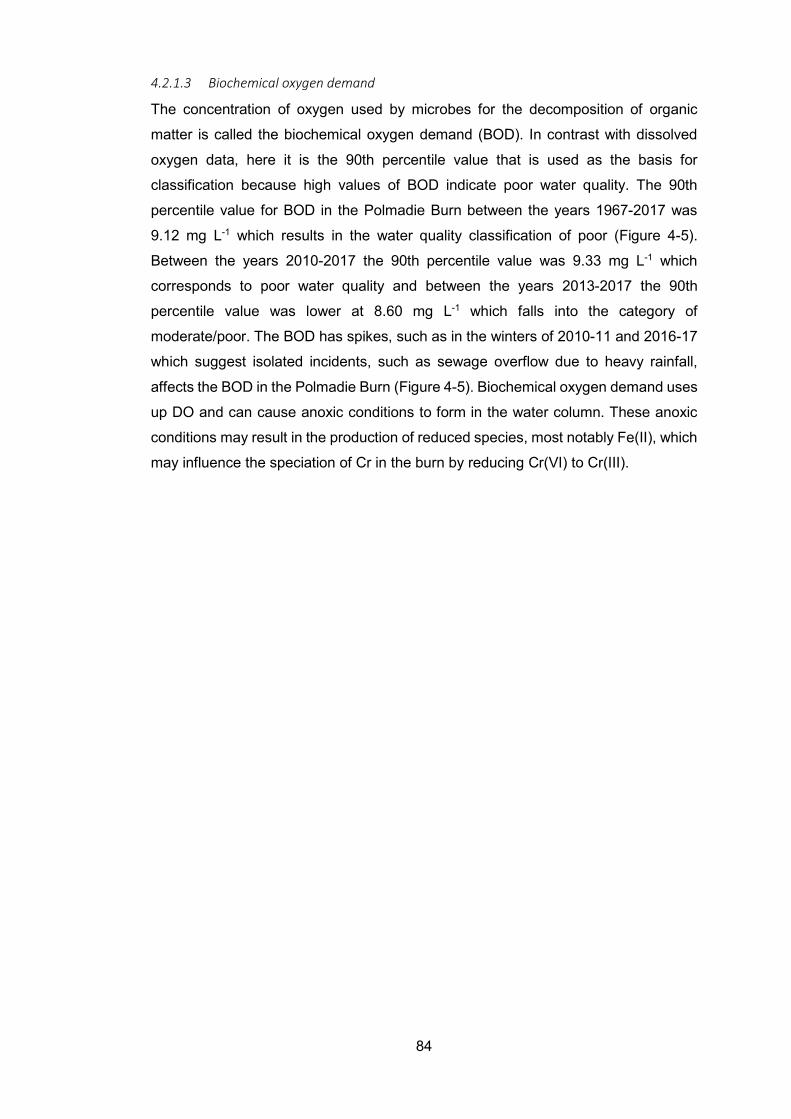
84
4.2.1.3 Biochemical oxygen demand
The concentration of oxygen used by microbes for the decomposition of organic
matter is called the biochemical oxygen demand (BOD). In contrast with dissolved
oxygen data, here it is the 90th percentile value that is used as the basis for
classification because high values of BOD indicate poor water quality. The 90th
percentile value for BOD in the Polmadie Burn between the years 1967-2017 was
9.12 mg L-1 which results in the water quality classification of poor (Figure 4-5).
Between the years 2010-2017 the 90th percentile value was 9.33 mg L-1 which
corresponds to poor water quality and between the years 2013-2017 the 90th
percentile value was lower at 8.60 mg L-1 which falls into the category of
moderate/poor. The BOD has spikes, such as in the winters of 2010-11 and 2016-17
which suggest isolated incidents, such as sewage overflow due to heavy rainfall,
affects the BOD in the Polmadie Burn (Figure 4-5). Biochemical oxygen demand uses
up DO and can cause anoxic conditions to form in the water column. These anoxic
conditions may result in the production of reduced species, most notably Fe(II), which
may influence the speciation of Cr in the burn by reducing Cr(VI) to Cr(III).
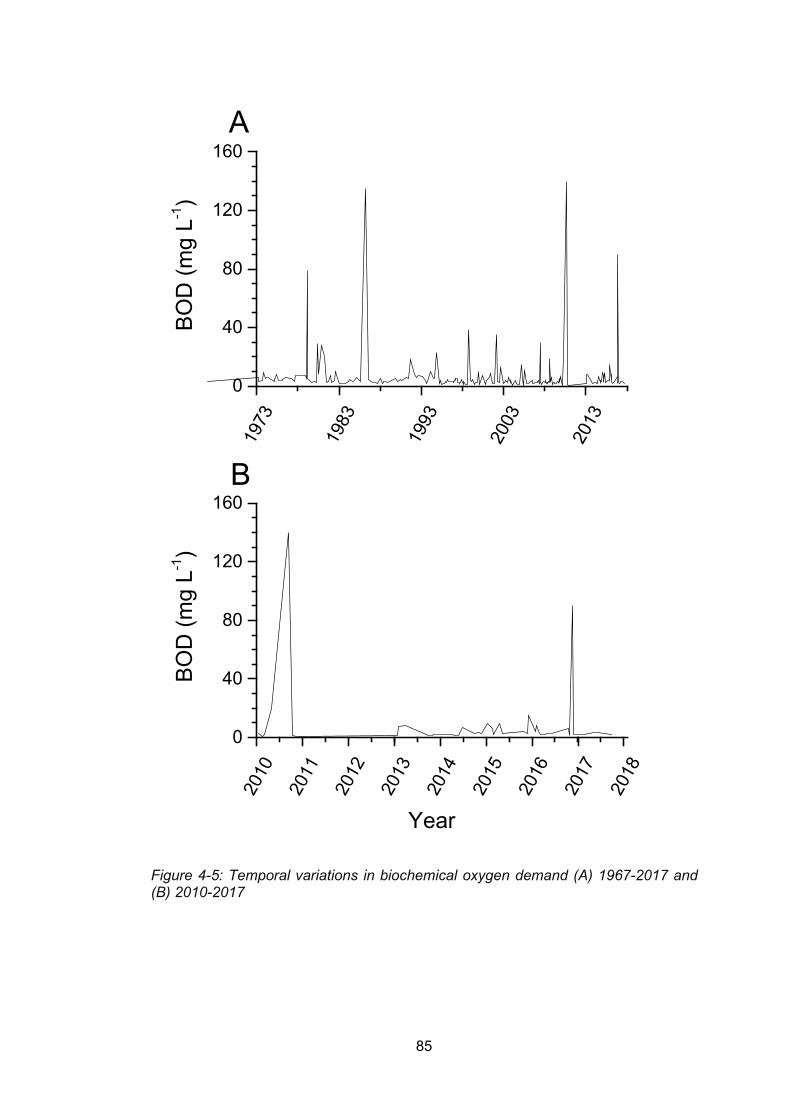
85
Figure 4-5: Temporal variations in biochemical oxygen demand (A) 1967-2017 and (B) 2010-2017
1973
1983
1993
2003
2013
0
40
80
120
160
2010
2011
2012
2013
2014
2015
2016
2017
2018
0
40
80
120
160
BOD
(mg
L-1)
A
Year
BOD
(mg
L-1)
B
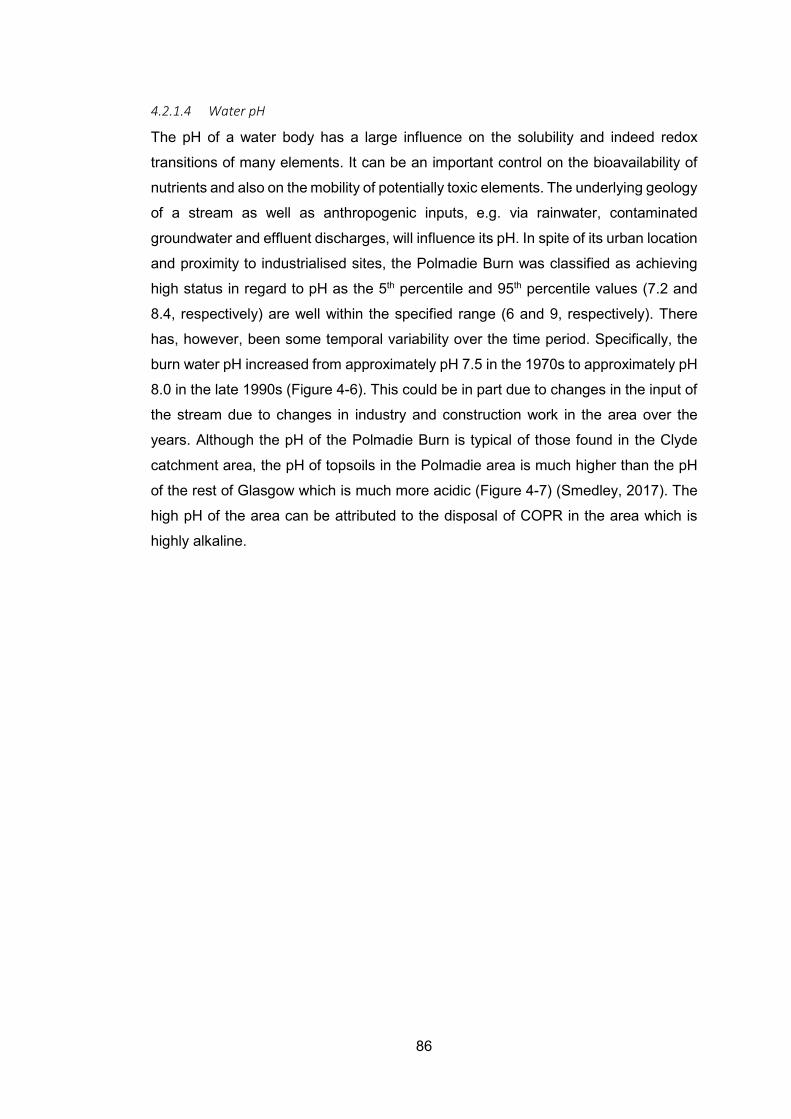
86
4.2.1.4 Water pH
The pH of a water body has a large influence on the solubility and indeed redox
transitions of many elements. It can be an important control on the bioavailability of
nutrients and also on the mobility of potentially toxic elements. The underlying geology
of a stream as well as anthropogenic inputs, e.g. via rainwater, contaminated
groundwater and effluent discharges, will influence its pH. In spite of its urban location
and proximity to industrialised sites, the Polmadie Burn was classified as achieving
high status in regard to pH as the 5th percentile and 95th percentile values (7.2 and
8.4, respectively) are well within the specified range (6 and 9, respectively). There
has, however, been some temporal variability over the time period. Specifically, the
burn water pH increased from approximately pH 7.5 in the 1970s to approximately pH
8.0 in the late 1990s (Figure 4-6). This could be in part due to changes in the input of
the stream due to changes in industry and construction work in the area over the
years. Although the pH of the Polmadie Burn is typical of those found in the Clyde
catchment area, the pH of topsoils in the Polmadie area is much higher than the pH
of the rest of Glasgow which is much more acidic (Figure 4-7) (Smedley, 2017). The
high pH of the area can be attributed to the disposal of COPR in the area which is
highly alkaline.
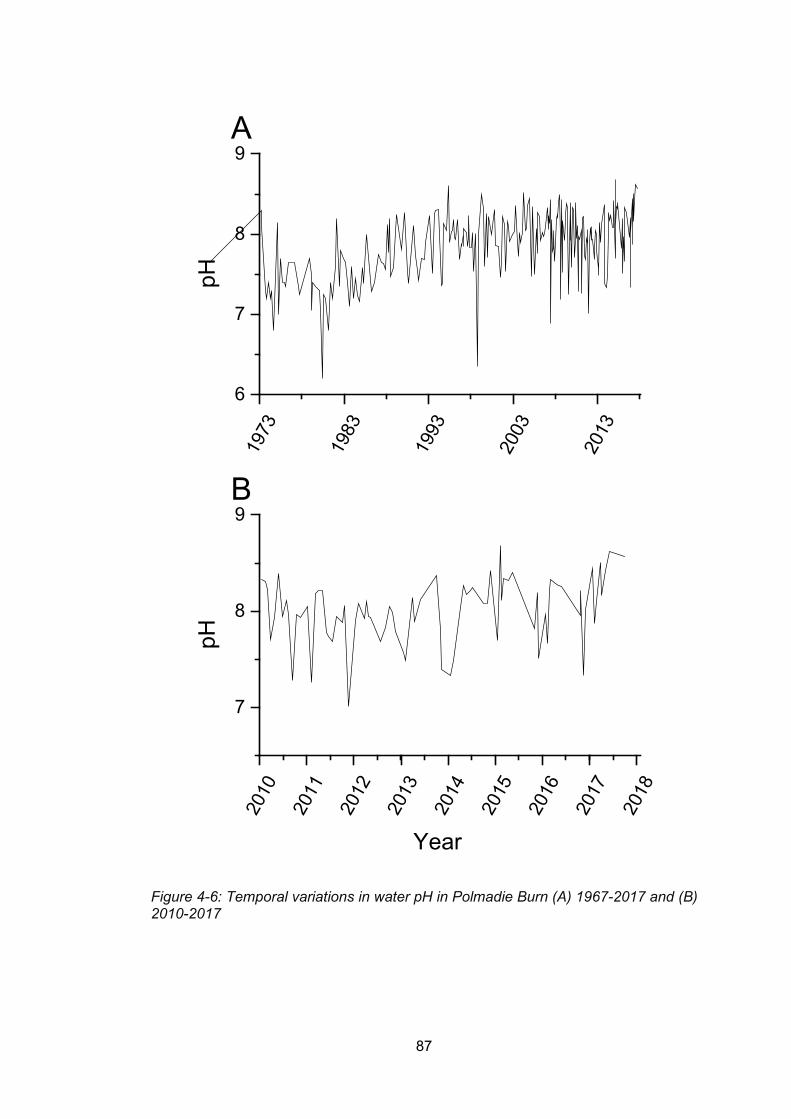
87
Figure 4-6: Temporal variations in water pH in Polmadie Burn (A) 1967-2017 and (B) 2010-2017
1973
1983
1993
2003
2013
6
7
8
9
2010
2011
2012
2013
2014
2015
2016
2017
2018
7
8
9
pH
A
pH
Year
B
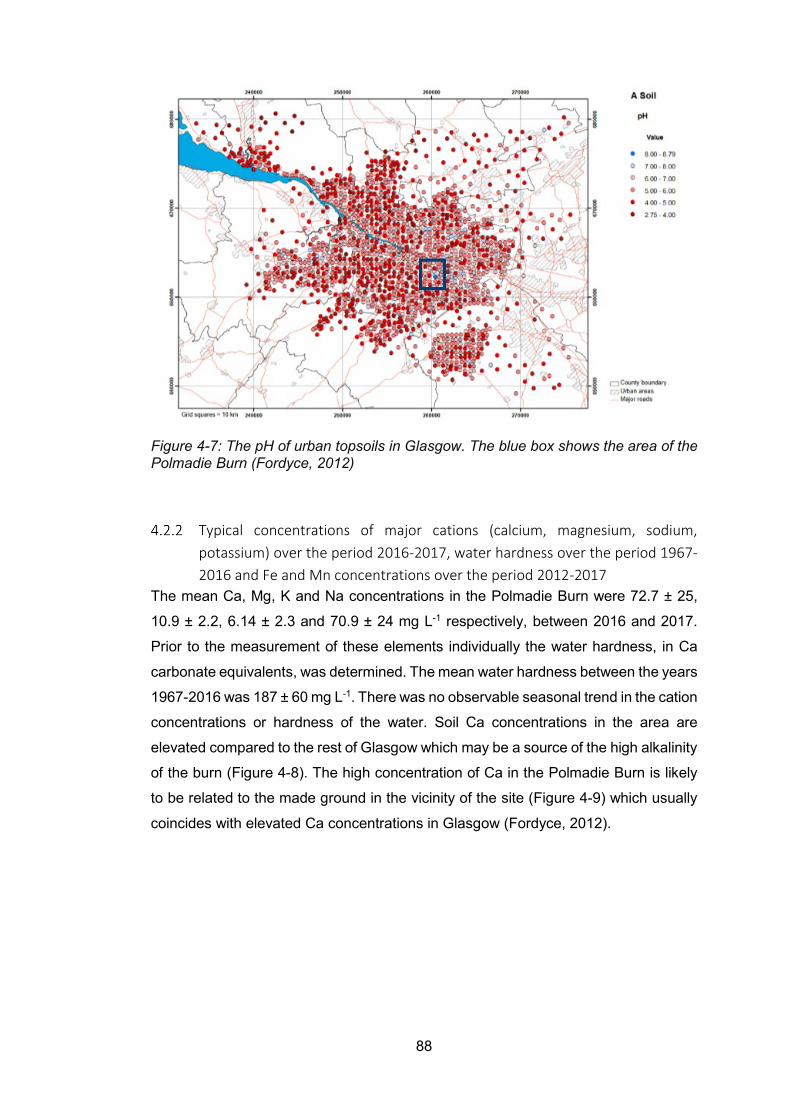
88
Figure 4-7: The pH of urban topsoils in Glasgow. The blue box shows the area of the Polmadie Burn (Fordyce, 2012)
Typical concentrations of major cations (calcium, magnesium, sodium, potassium) over the period 2016-2017, water hardness over the period 1967-2016 and Fe and Mn concentrations over the period 2012-2017
The mean Ca, Mg, K and Na concentrations in the Polmadie Burn were 72.7 ± 25,
10.9 ± 2.2, 6.14 ± 2.3 and 70.9 ± 24 mg L-1 respectively, between 2016 and 2017.
Prior to the measurement of these elements individually the water hardness, in Ca
carbonate equivalents, was determined. The mean water hardness between the years
1967-2016 was 187 ± 60 mg L-1. There was no observable seasonal trend in the cation
concentrations or hardness of the water. Soil Ca concentrations in the area are
elevated compared to the rest of Glasgow which may be a source of the high alkalinity
of the burn (Figure 4-8). The high concentration of Ca in the Polmadie Burn is likely
to be related to the made ground in the vicinity of the site (Figure 4-9) which usually
coincides with elevated Ca concentrations in Glasgow (Fordyce, 2012).
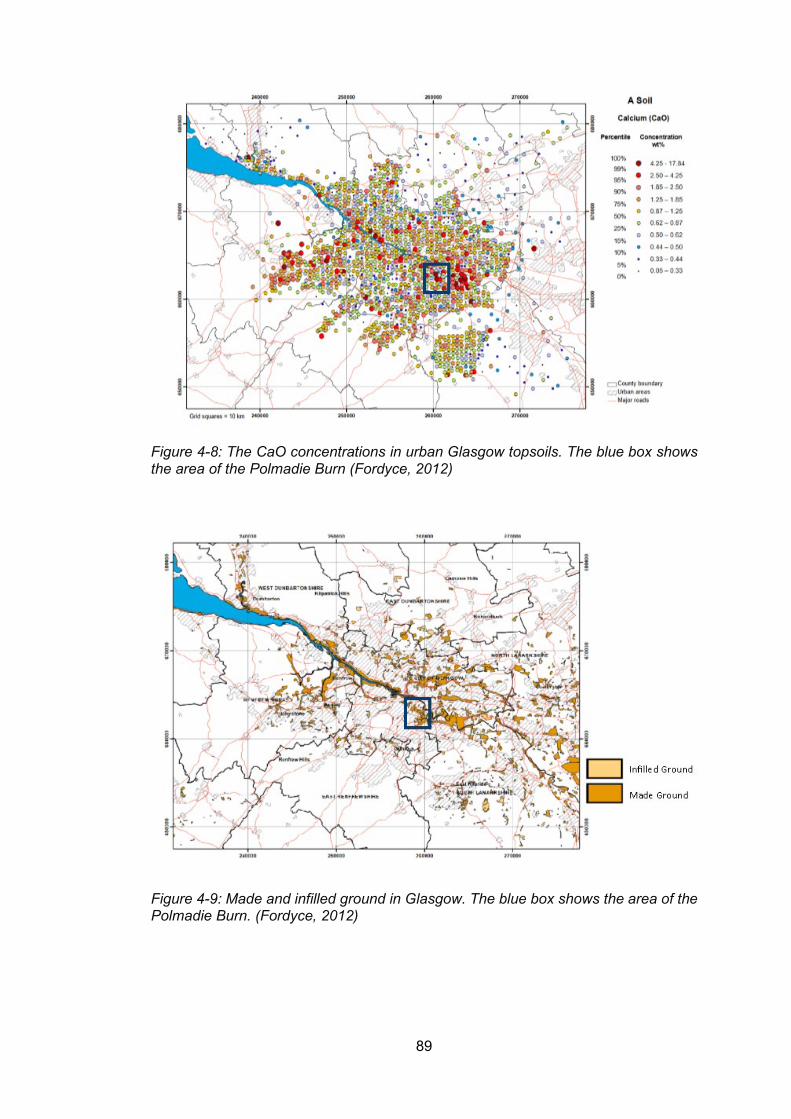
89
Figure 4-8: The CaO concentrations in urban Glasgow topsoils. The blue box shows the area of the Polmadie Burn (Fordyce, 2012)
Figure 4-9: Made and infilled ground in Glasgow. The blue box shows the area of the Polmadie Burn. (Fordyce, 2012)
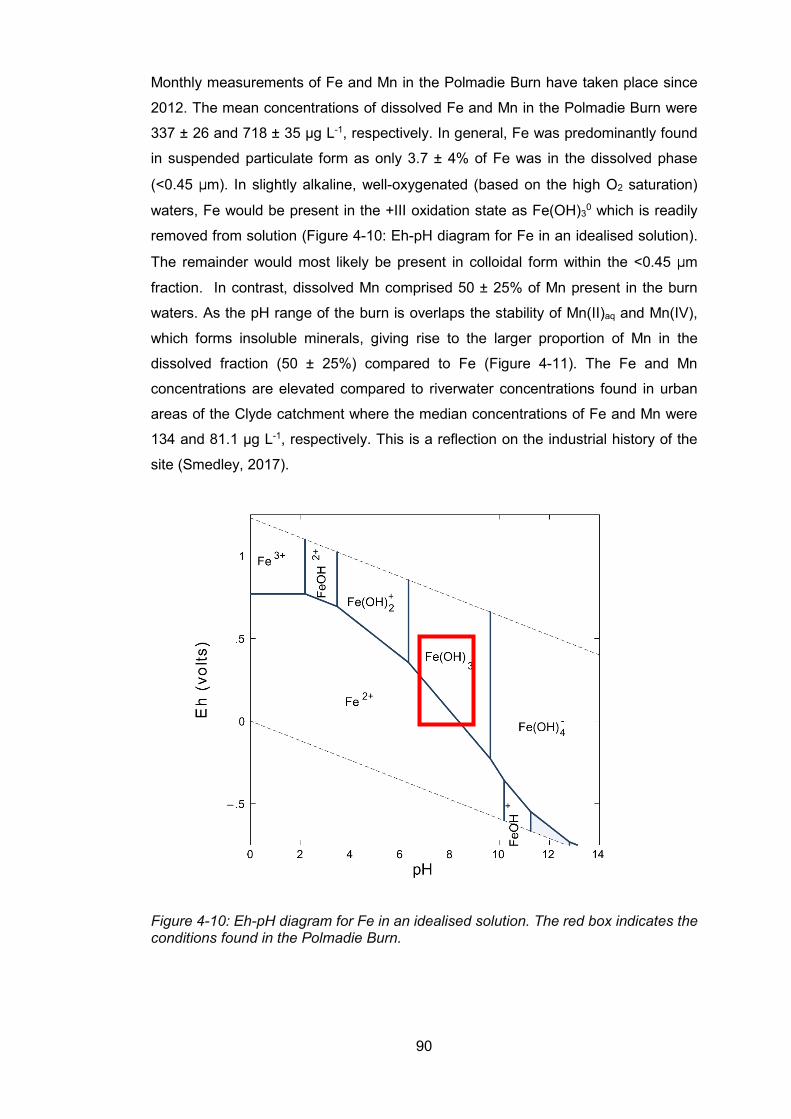
90
Monthly measurements of Fe and Mn in the Polmadie Burn have taken place since
2012. The mean concentrations of dissolved Fe and Mn in the Polmadie Burn were
337 ± 26 and 718 ± 35 µg L-1, respectively. In general, Fe was predominantly found
in suspended particulate form as only 3.7 ± 4% of Fe was in the dissolved phase
(<0.45 µm). In slightly alkaline, well-oxygenated (based on the high O2 saturation)
waters, Fe would be present in the +III oxidation state as Fe(OH)30 which is readily
removed from solution (Figure 4-10: Eh-pH diagram for Fe in an idealised solution).
The remainder would most likely be present in colloidal form within the <0.45 µm
fraction. In contrast, dissolved Mn comprised 50 ± 25% of Mn present in the burn
waters. As the pH range of the burn is overlaps the stability of Mn(II)aq and Mn(IV),
which forms insoluble minerals, giving rise to the larger proportion of Mn in the
dissolved fraction (50 ± 25%) compared to Fe (Figure 4-11). The Fe and Mn
concentrations are elevated compared to riverwater concentrations found in urban
areas of the Clyde catchment where the median concentrations of Fe and Mn were
134 and 81.1 µg L-1, respectively. This is a reflection on the industrial history of the
site (Smedley, 2017).
Figure 4-10: Eh-pH diagram for Fe in an idealised solution. The red box indicates the conditions found in the Polmadie Burn.
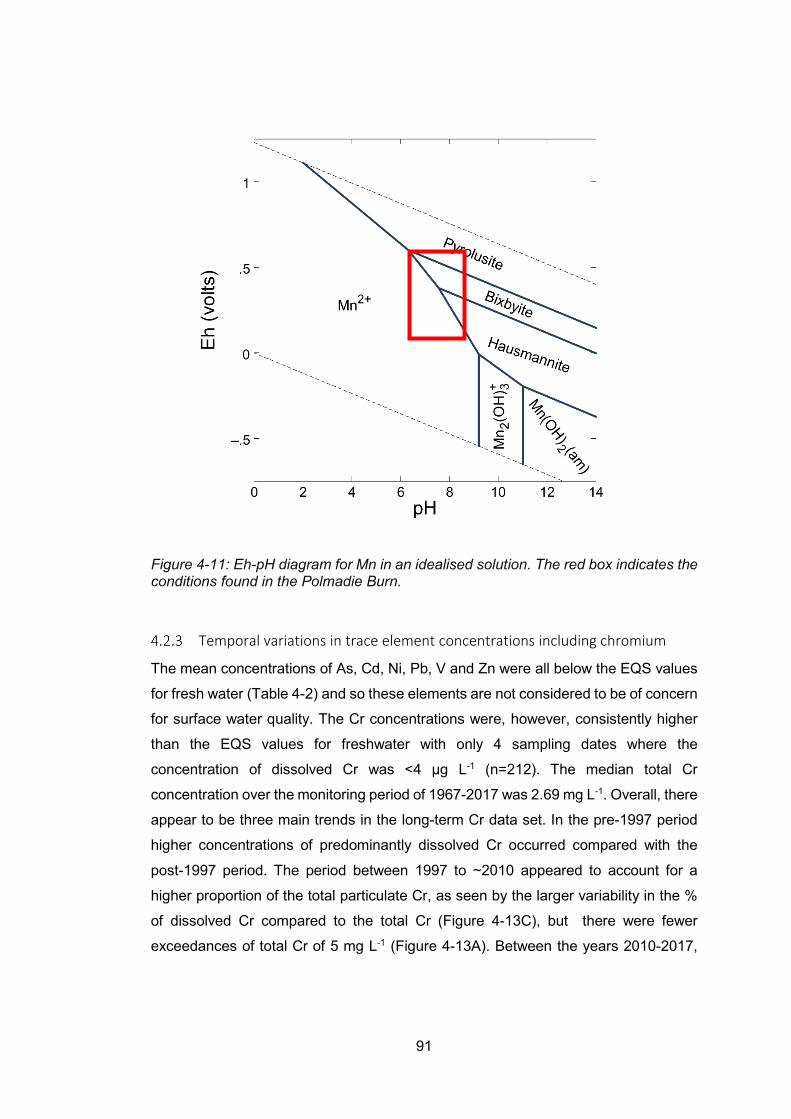
91
Figure 4-11: Eh-pH diagram for Mn in an idealised solution. The red box indicates the conditions found in the Polmadie Burn.
Temporal variations in trace element concentrations including chromium
The mean concentrations of As, Cd, Ni, Pb, V and Zn were all below the EQS values
for fresh water (Table 4-2) and so these elements are not considered to be of concern
for surface water quality. The Cr concentrations were, however, consistently higher
than the EQS values for freshwater with only 4 sampling dates where the
concentration of dissolved Cr was <4 µg L-1 (n=212). The median total Cr
concentration over the monitoring period of 1967-2017 was 2.69 mg L-1. Overall, there
appear to be three main trends in the long-term Cr data set. In the pre-1997 period
higher concentrations of predominantly dissolved Cr occurred compared with the
post-1997 period. The period between 1997 to ~2010 appeared to account for a
higher proportion of the total particulate Cr, as seen by the larger variability in the %
of dissolved Cr compared to the total Cr (Figure 4-13C), but there were fewer
exceedances of total Cr of 5 mg L-1 (Figure 4-13A). Between the years 2010-2017,
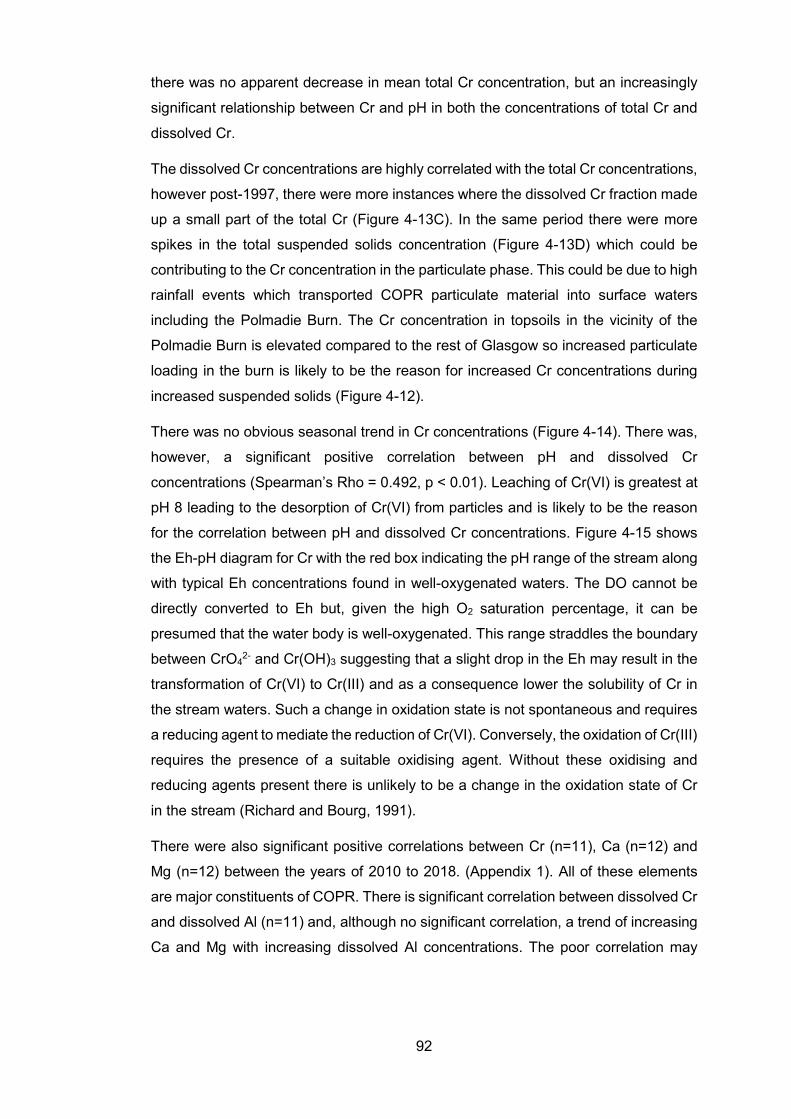
92
there was no apparent decrease in mean total Cr concentration, but an increasingly
significant relationship between Cr and pH in both the concentrations of total Cr and
dissolved Cr.
The dissolved Cr concentrations are highly correlated with the total Cr concentrations,
however post-1997, there were more instances where the dissolved Cr fraction made
up a small part of the total Cr (Figure 4-13C). In the same period there were more
spikes in the total suspended solids concentration (Figure 4-13D) which could be
contributing to the Cr concentration in the particulate phase. This could be due to high
rainfall events which transported COPR particulate material into surface waters
including the Polmadie Burn. The Cr concentration in topsoils in the vicinity of the
Polmadie Burn is elevated compared to the rest of Glasgow so increased particulate
loading in the burn is likely to be the reason for increased Cr concentrations during
increased suspended solids (Figure 4-12).
There was no obvious seasonal trend in Cr concentrations (Figure 4-14). There was,
however, a significant positive correlation between pH and dissolved Cr
concentrations (Spearman’s Rho = 0.492, p < 0.01). Leaching of Cr(VI) is greatest at
pH 8 leading to the desorption of Cr(VI) from particles and is likely to be the reason
for the correlation between pH and dissolved Cr concentrations. Figure 4-15 shows
the Eh-pH diagram for Cr with the red box indicating the pH range of the stream along
with typical Eh concentrations found in well-oxygenated waters. The DO cannot be
directly converted to Eh but, given the high O2 saturation percentage, it can be
presumed that the water body is well-oxygenated. This range straddles the boundary
between CrO42- and Cr(OH)3 suggesting that a slight drop in the Eh may result in the
transformation of Cr(VI) to Cr(III) and as a consequence lower the solubility of Cr in
the stream waters. Such a change in oxidation state is not spontaneous and requires
a reducing agent to mediate the reduction of Cr(VI). Conversely, the oxidation of Cr(III)
requires the presence of a suitable oxidising agent. Without these oxidising and
reducing agents present there is unlikely to be a change in the oxidation state of Cr
in the stream (Richard and Bourg, 1991).
There were also significant positive correlations between Cr (n=11), Ca (n=12) and
Mg (n=12) between the years of 2010 to 2018. (Appendix 1). All of these elements
are major constituents of COPR. There is significant correlation between dissolved Cr
and dissolved Al (n=11) and, although no significant correlation, a trend of increasing
Ca and Mg with increasing dissolved Al concentrations. The poor correlation may
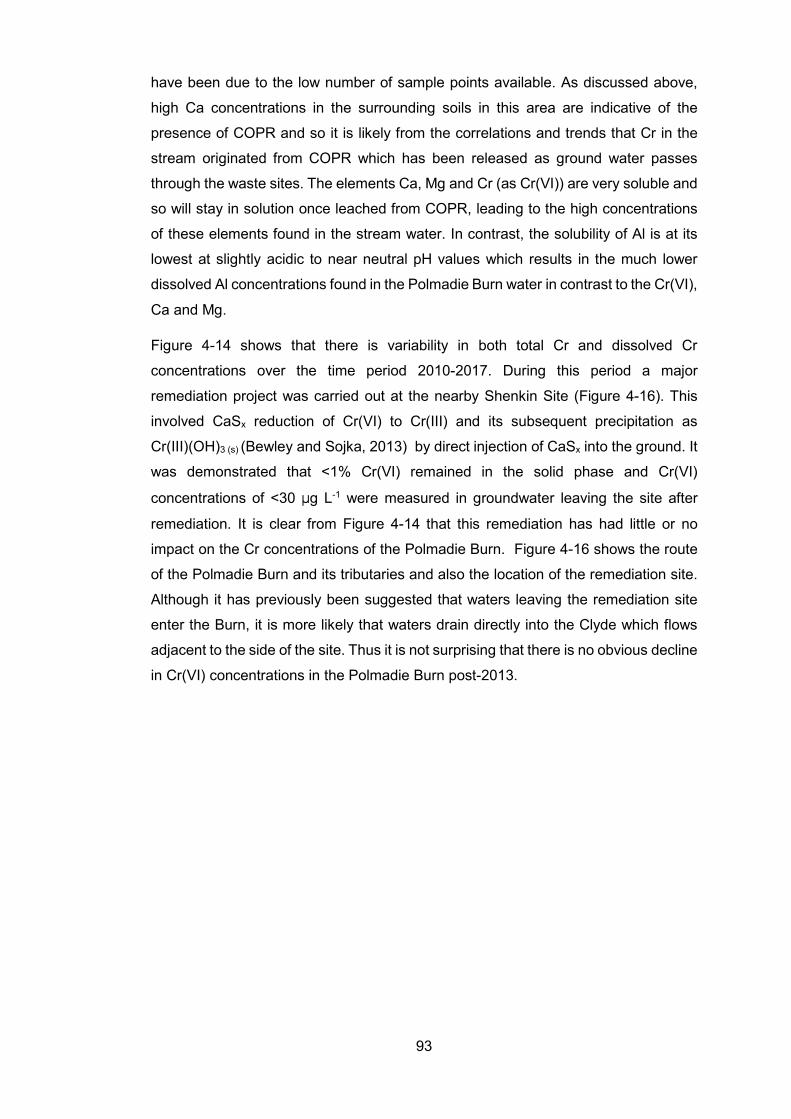
93
have been due to the low number of sample points available. As discussed above,
high Ca concentrations in the surrounding soils in this area are indicative of the
presence of COPR and so it is likely from the correlations and trends that Cr in the
stream originated from COPR which has been released as ground water passes
through the waste sites. The elements Ca, Mg and Cr (as Cr(VI)) are very soluble and
so will stay in solution once leached from COPR, leading to the high concentrations
of these elements found in the stream water. In contrast, the solubility of Al is at its
lowest at slightly acidic to near neutral pH values which results in the much lower
dissolved Al concentrations found in the Polmadie Burn water in contrast to the Cr(VI),
Ca and Mg.
Figure 4-14 shows that there is variability in both total Cr and dissolved Cr
concentrations over the time period 2010-2017. During this period a major
remediation project was carried out at the nearby Shenkin Site (Figure 4-16). This
involved CaSx reduction of Cr(VI) to Cr(III) and its subsequent precipitation as
Cr(III)(OH)3 (s) (Bewley and Sojka, 2013) by direct injection of CaSx into the ground. It
was demonstrated that <1% Cr(VI) remained in the solid phase and Cr(VI)
concentrations of <30 µg L-1 were measured in groundwater leaving the site after
remediation. It is clear from Figure 4-14 that this remediation has had little or no
impact on the Cr concentrations of the Polmadie Burn. Figure 4-16 shows the route
of the Polmadie Burn and its tributaries and also the location of the remediation site.
Although it has previously been suggested that waters leaving the remediation site
enter the Burn, it is more likely that waters drain directly into the Clyde which flows
adjacent to the side of the site. Thus it is not surprising that there is no obvious decline
in Cr(VI) concentrations in the Polmadie Burn post-2013.
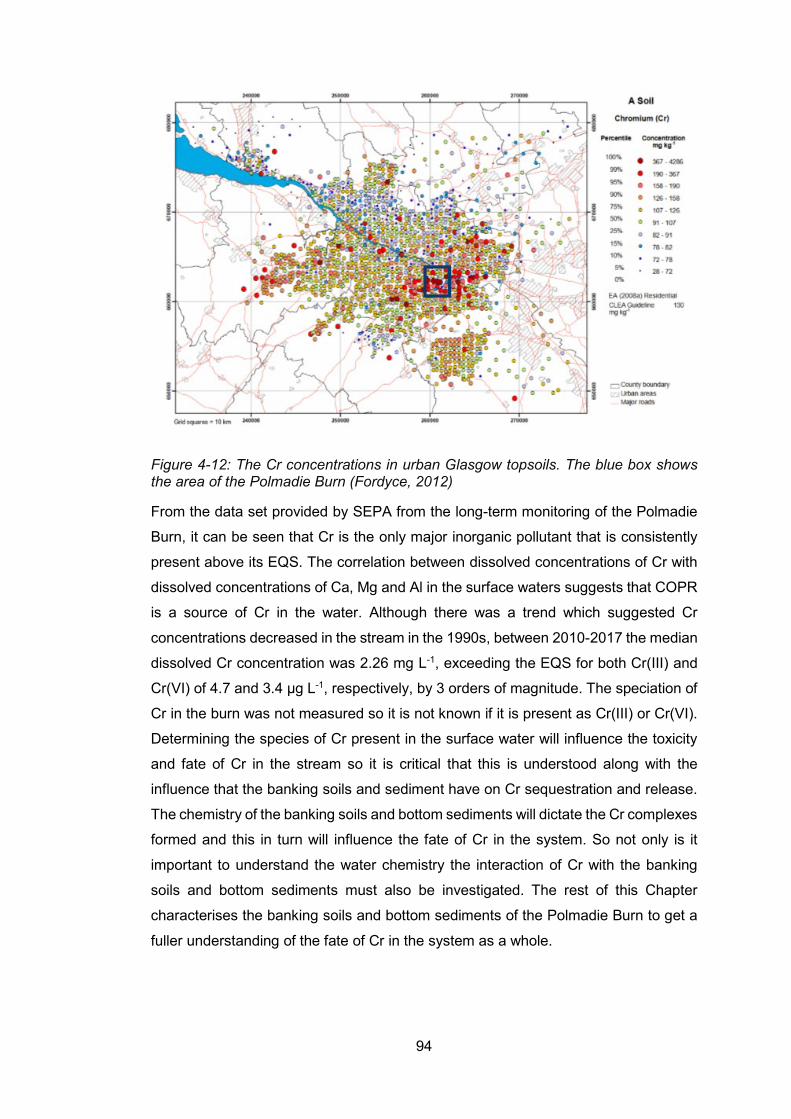
94
Figure 4-12: The Cr concentrations in urban Glasgow topsoils. The blue box shows the area of the Polmadie Burn (Fordyce, 2012)
From the data set provided by SEPA from the long-term monitoring of the Polmadie
Burn, it can be seen that Cr is the only major inorganic pollutant that is consistently
present above its EQS. The correlation between dissolved concentrations of Cr with
dissolved concentrations of Ca, Mg and Al in the surface waters suggests that COPR
is a source of Cr in the water. Although there was a trend which suggested Cr
concentrations decreased in the stream in the 1990s, between 2010-2017 the median
dissolved Cr concentration was 2.26 mg L-1, exceeding the EQS for both Cr(III) and
Cr(VI) of 4.7 and 3.4 µg L-1, respectively, by 3 orders of magnitude. The speciation of
Cr in the burn was not measured so it is not known if it is present as Cr(III) or Cr(VI).
Determining the species of Cr present in the surface water will influence the toxicity
and fate of Cr in the stream so it is critical that this is understood along with the
influence that the banking soils and sediment have on Cr sequestration and release.
The chemistry of the banking soils and bottom sediments will dictate the Cr complexes
formed and this in turn will influence the fate of Cr in the system. So not only is it
important to understand the water chemistry the interaction of Cr with the banking
soils and bottom sediments must also be investigated. The rest of this Chapter
characterises the banking soils and bottom sediments of the Polmadie Burn to get a
fuller understanding of the fate of Cr in the system as a whole.
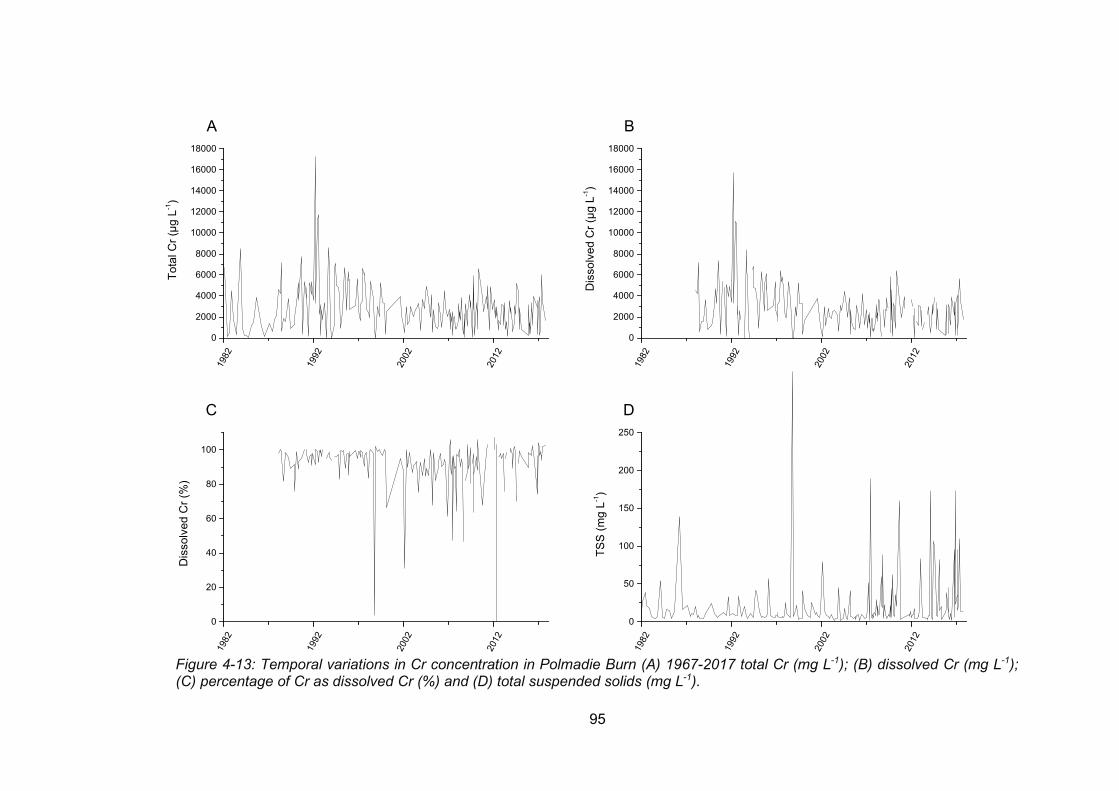
95
1982
1992
2002
2012
0
2000
4000
6000
8000
10000
12000
14000
16000
18000
1982
1992
2002
2012
0
2000
4000
6000
8000
10000
12000
14000
16000
18000
1982
1992
2002
2012
0
20
40
60
80
100
1982
1992
2002
2012
0
50
100
150
200
250
Tota
l Cr (
µg L
-1)
A
Dis
solv
ed C
r (µg
L-1)
B
Dis
solv
ed C
r (%
)
C
Year
TSS
(mg
L-1)
Year
D
Figure 4-13: Temporal variations in Cr concentration in Polmadie Burn (A) 1967-2017 total Cr (mg L-1); (B) dissolved Cr (mg L-1); (C) percentage of Cr as dissolved Cr (%) and (D) total suspended solids (mg L-1).
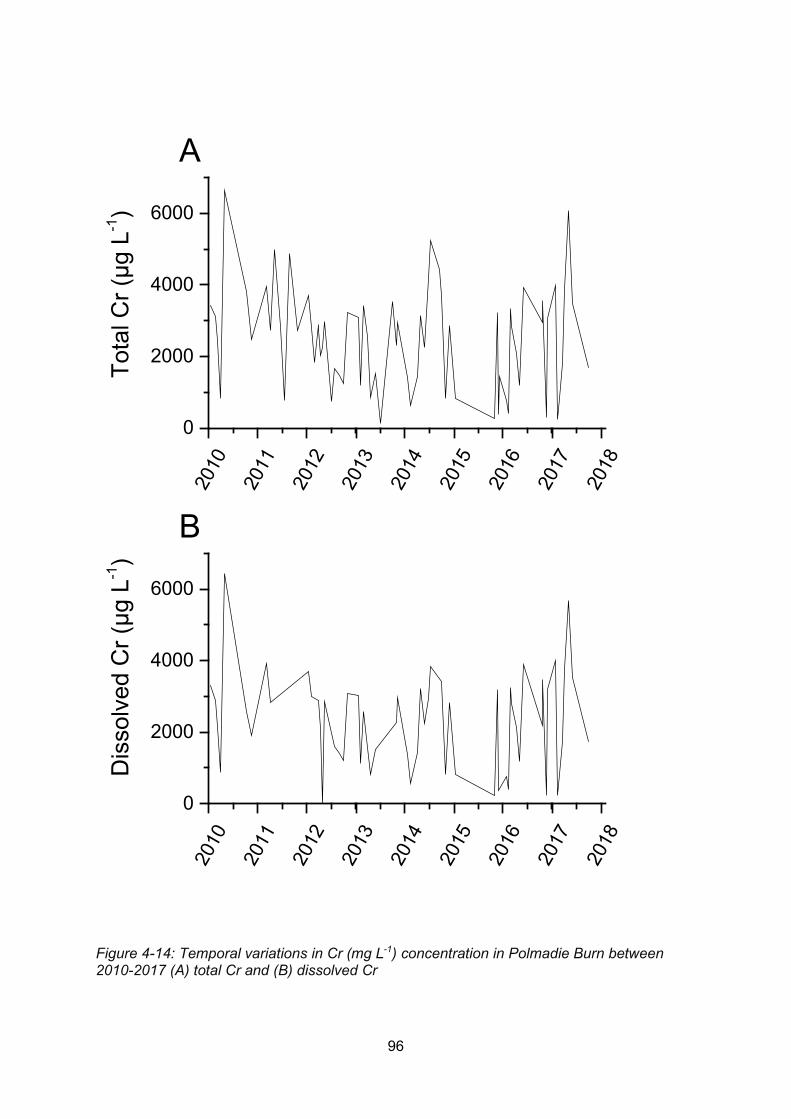
96
Figure 4-14: Temporal variations in Cr (mg L-1) concentration in Polmadie Burn between 2010-2017 (A) total Cr and (B) dissolved Cr
2010
2011
2012
2013
2014
2015
2016
2017
2018
0
2000
4000
600020
1020
1120
1220
1320
1420
1520
1620
1720
18
0
2000
4000
6000
Tota
l Cr (
µg L
-1)
AD
isso
lved
Cr (
µg L
-1)
B
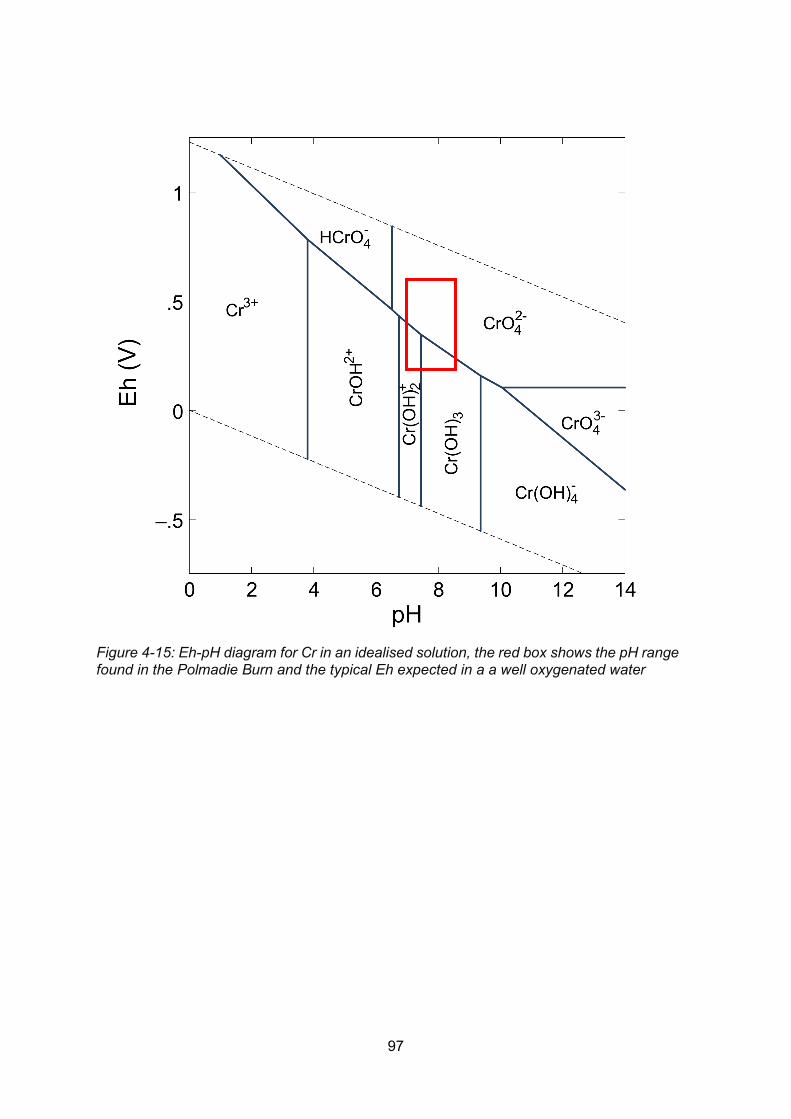
97
Figure 4-15: Eh-pH diagram for Cr in an idealised solution, the red box shows the pH range found in the Polmadie Burn and the typical Eh expected in a a well oxygenated water
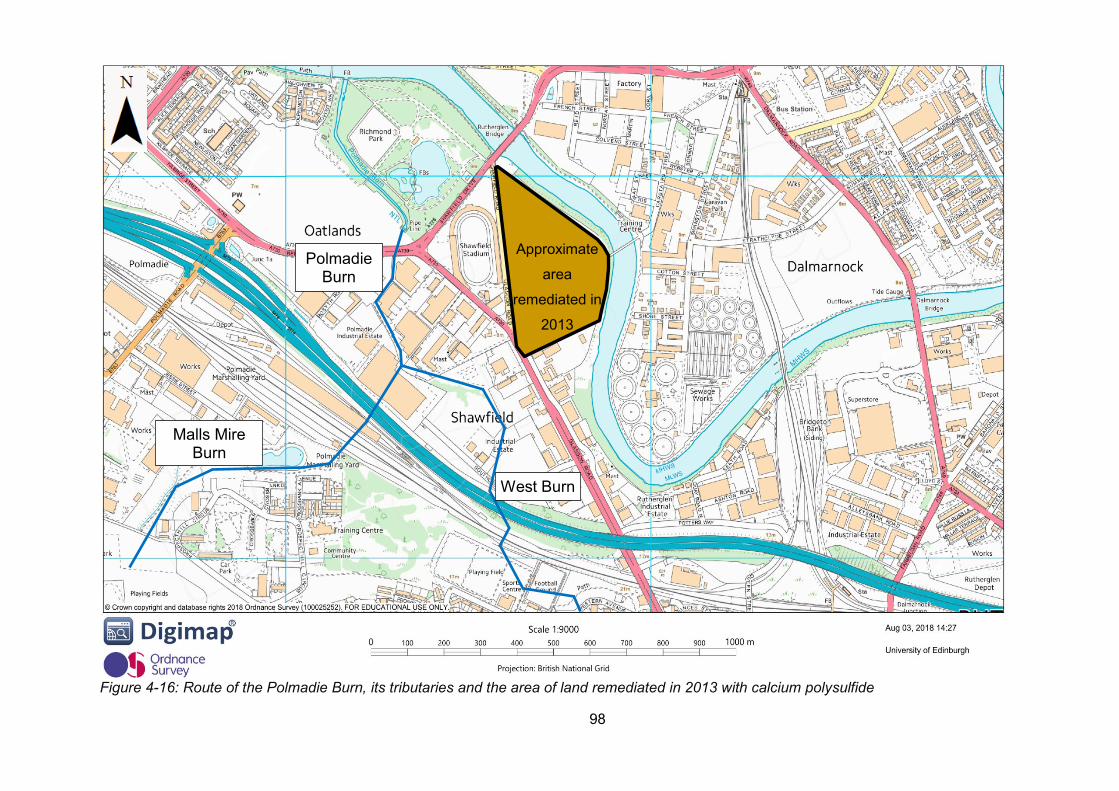
98
Polmadie Burn
West Burn
Malls Mire Burn
Approximate
area
remediated in
2013
Figure 4-16: Route of the Polmadie Burn, its tributaries and the area of land remediated in 2013 with calcium polysulfide
99
4.3 Characterisation of water, sediment and banking soils from the non-culverted
section of the Polmadie Burn
From the evaluation of the dataset provided by SEPA in Section 4.2 it is apparent that the only
inorganic pollutant of interest in the Polmadie Burn is Cr. Therefore to understand the impact
that Cr has on the Polmadie Burn banking soils and sediment the concentration of Cr along
with Fe and Mn concentrations as well as the OM content of the soils were determined due to
their importance in the redox cycling of Cr. The concentrations of Ca, Mg and Al, which are
major constituents of COPR, were also determined.
The remainder of this chapter will therefore examine the water and soil phase elemental
composition, along with sequential extraction and mineralogical data, to identify potential
sources of Cr in the banking soils and sediments. The data is presented in Sections 4.3-4.6
followed by a discussion of the results in Section 4.7.
Elemental concentrations and pH of surface water samples from Polmadie Burn
Polmadie Burn water samples (n=3) were collected in Nov 2015, Sept 2016 and March 2017.
More information on the location of the samples and the sampling strategy can be found in
Sections 3.1.2 and 3.1.3.1. The mean pH of the burn was 7.64 ± 0.35. The mean Cr
concentration in the dissolved (<0.45 µm) fraction of the stream water was 2.36 ± 1.5 mg L-1.
This is very similar to the SEPA long-term (2010-2017) mean dissolved Cr concentration of
2.29 ± 1.4 mg L-1. The mean Cr(VI) concentration in the dissolved fraction was 2.24 ± 1.5 mg
L-1 which was equivalent to 94 ± 4 % of total dissolved Cr present in the burn. There was no
speciation data provided by SEPA so the oxidation state of Cr present is not known. From the
results of the Cr speciation it is suggested that Cr is found predominantly in streamwater as
Cr(VI) species.
Mean Fe and Mn concentrations in the Polmadie Burn were 197 ± 160 and 45.0 ± 25 µg L-1,
respectively.
Elemental concentrations in porewaters isolated from soil and sediment samples
Porewaters were isolated using the method described in Section 3.1.4 from (i) bulk sediment
samples (n=6) collected on 11th November 2015 which were analysed for Fe(II) concentrations
and (ii) banking soil (n=3) and burn sediment (n=2) samples collected on the 27th October
2016 which were analysed for Cr, Cr(VI), Fe and Mn concentrations. The locations of these
soil and sediment samples are shown in Section 3.1.1. The concentrations of Cr, Fe and Mn
in the 0.45 µm-filtered porewaters were determined by ICP-MS (see Section 3.7.1.3), the
Cr(VI) concentration was determined using the DPC method described in Section 3.7.2.2 and
100
the concentration of Fe(II) was determined using the ferrozine method as described in Section
3.7.2.3.
The mean Cr concentration in soil and sediment filtered porewaters was 91.1 ± 23 and 1.49 ±
0.34 µg L-1, respectively. Chromium(VI) was not detected in any of the porewaters. The Fe
concentrations in soil and sediment filtered porewaters taken on the 27th October 2016 was
655 ± 130 and 2540 ± 570 µg L-1, respectively. In the soil porewaters Fe(II) concentrations
were <LoD and the sediment porewaters taken on the 11th November 2015 contained 4540
± 670 µg L-1 of Fe(II). The mean concentration of Mn in soil and sediment porewaters was
87.9 ± 82 and 1020 ± 830 µg L-1, respectively.
The concentration and speciation of Cr was ~3 orders of magnitude lower in the sediment
porewater compared to the concentrations found in the stream water and porewater Cr(VI)
concentrations were <LoD whereas it was the dominant species in the stream water. Opposite
trends were seen for Fe and Mn which were found in larger concentrations in the sediment
porewater (2540 ± 570 and 1020 ± 830 µg L-1, respectively) compared to the stream water
(197 ± 160 and 45.0 ± 25 µg L-1, respectively). The high concentration of Fe(II) found in the
sediment porewater (4540 ± 670 µg L-1) indicates the contrast between the reducing
sediments and the more oxic water, as reflected by the high DO concentrations reported by
SEPA.
Organic matter content, pH and Eh of banking soils, surface sediments and sediment
cores from Polmadie Burn
4.3.3.1 Banking soils
Surface banking soils were collected on several occasions and from multiple locations (see
Section 3.1.1). The mean organic matter content was 22.4 ± 4.7% (w/w) (n = 23) and the mean
soil pH was 6.63 ± 0.33 (n=18). The range of pH values was 6.11 to 7.21. From previous work,
the mean organic matter content for Glasgow top soils was 9.5% (Fordyce, 2012),
approximately half of the organic matter content of the Polmadie Burn banking soils. This could
be due to the fast growing, dense vegetation which grows along the bank, and which dies
during the winter. There are also deciduous trees which overhang the site and provide an
additional input of organic matter. The mean pH of Glasgow soils is 5.31 which was
approximately 1.3 units lower than the mean pH of the Polmadie banking soils. The slightly
elevated pH of the soils could be due to the presence of COPR which has a high pH and a
large buffering capacity (Farmer et al., 1999, Farmer et al., 2002). The Eh of the bulk soil
sample taken on the 12th September 2016 was 230 mV which was mildly oxidising.
101
4.3.3.2 Bulk sediments samples
Surface burn sediments were collected on several occasions and from multiple locations (see
Section 3.1.1). The organic matter content of the sediment was 8.78 ± 6.2% (n = 12) and the
mean pH was 6.97 ± 0.32 and it ranged between pH 6.53 and 7.43 (n= 7). The OM content of
the sediments was lower than the OM content of the banking soils by approximately a factor
of 2 and the pH of the sediments was approximately 0.4 units higher than the soils.
Sediment samples taken from Sample Point 10 (Section 3.1.1) in October 2016 had the
highest OM content of 23.8 ± 0.35, approximately 5 times higher than the sediment sample
taken at Sample Point 4 which was 4.67 ± 0.29 %. It must be noted that the banking soils
between Sample Point 1 and Sample Point 10 had been disturbed shortly before the sampling
in October 2016 potentially resulting in soil material being transported into the sediment and
contributing to the high OM content in the sample taken at Sample Point 10. The Eh of the
bulk surface sediment taken on the 12th September 2016 was -134 mV highlighting its reducing
nature.
4.3.3.3 Sediment core profiles
Sediment cores were collected on the 17th May 2015 from locations shown in Section 3.1.1 in
order to determine the changes in elemental composition with depth. The OM content and pH
of Cores 1 and 2 did not show similar trends (Figure 4-17A and Figure 4-18A). In Core 1, the
OM was 10.2 ± 1.6% dry weight (dwt) for the 0-4 cm depth sections before decreasing to 4.18
± 0.83% dwt over the 4-12 cm depth sections. The OM content then increased to 11.6 ± 3.1%
dwt over the rest of the core (12- 18 cm depth) (Figure 4-17A). In Core 2, the top 0-2 cm had
an OM content of 4.74 ± 2.4% dwt which then increased to a maximum of 27.0 ± 2.6% dwt at
10-11 cm depth before decreasing again. There was a decrease in OM between 9 and 10 cm
depth (Figure 4-18A).
The pH of the sediment porewater of Core 1 tended to increase with depth whereas the pH of
Core 2 increased sharply from pH 8.22 to pH 8.49 between the surface and 2 cm depth. The
pH then decreased to a minimum of pH 8.16 at 6 cm depth before rising with depth again
(Figure 4-17B). The pH then tended to increase with depth to pH 7.0 at 7 cm and pH 7.47 at
15 cm depth. For Core 2 the pH increased from 8.22 at depth 0-1 cm to 8.49 at 2-3 cm depth.
There pH then decreased with depth until 5-6 cm depth to 8.16 before increasing again with
depth until 8-9 cm depth where the pH was 8.50 (Figure 4-18B).
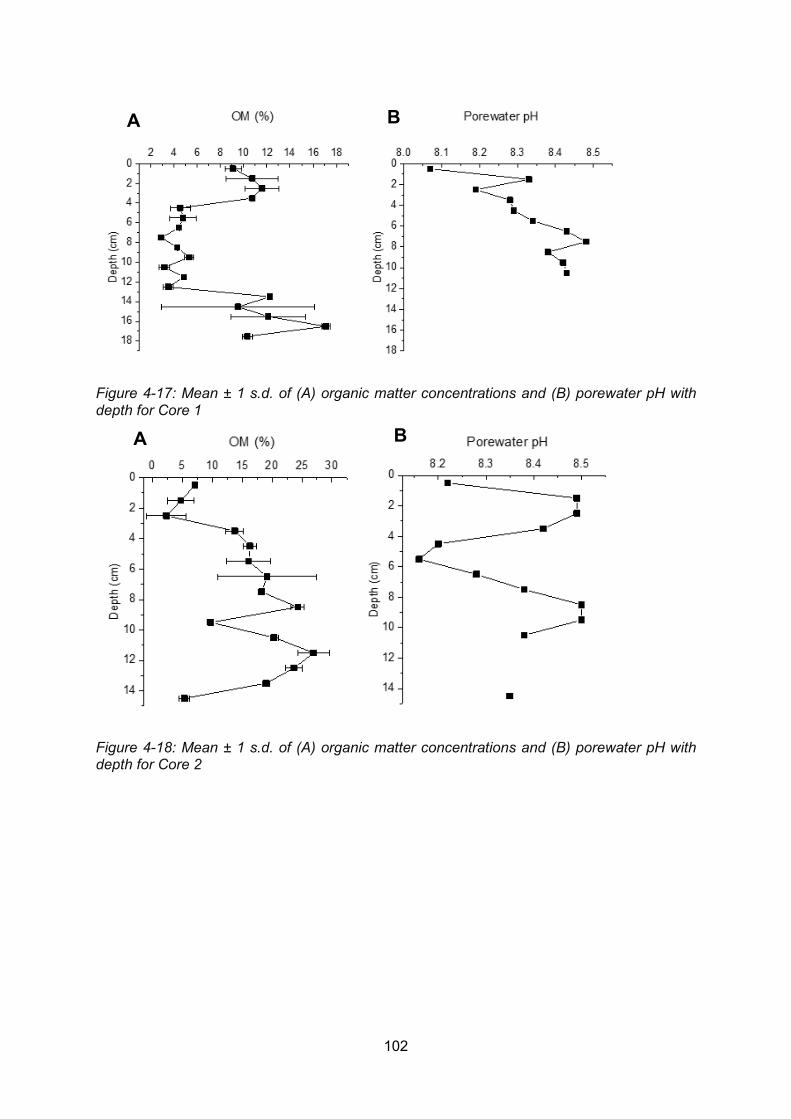
102
Figure 4-17: Mean ± 1 s.d. of (A) organic matter concentrations and (B) porewater pH with depth for Core 1
Figure 4-18: Mean ± 1 s.d. of (A) organic matter concentrations and (B) porewater pH with depth for Core 2
A B
A B
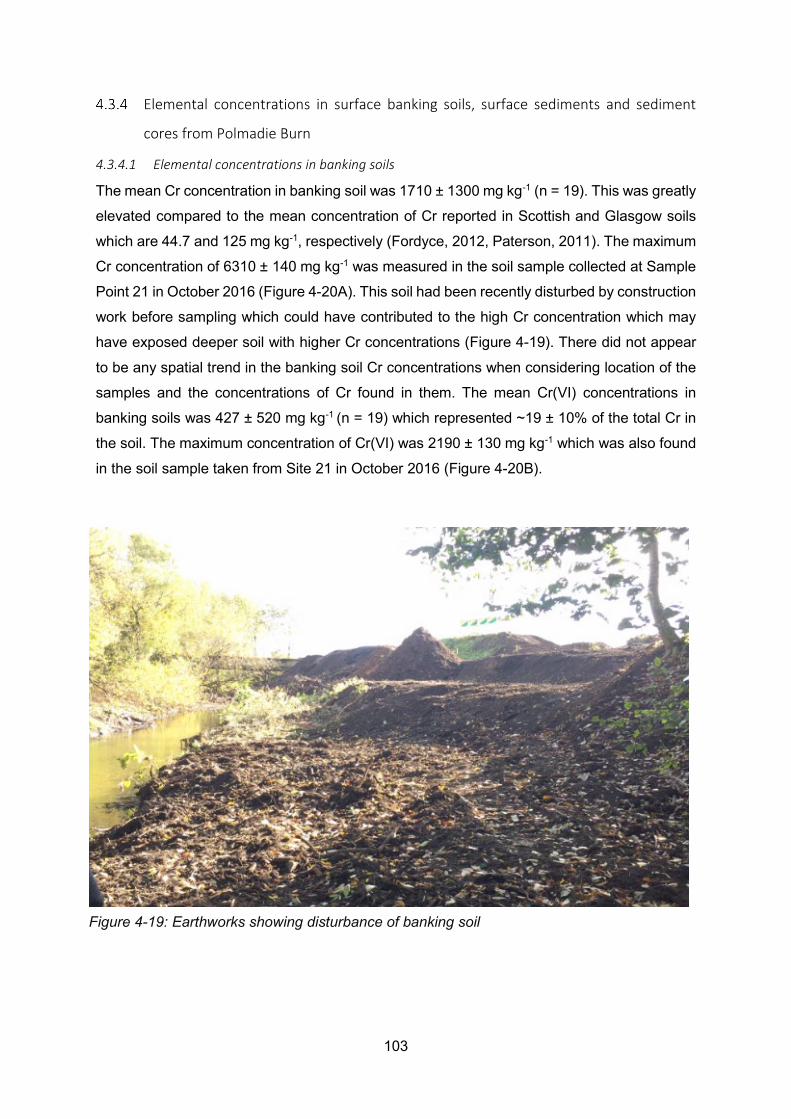
103
Elemental concentrations in surface banking soils, surface sediments and sediment
cores from Polmadie Burn
4.3.4.1 Elemental concentrations in banking soils
The mean Cr concentration in banking soil was 1710 ± 1300 mg kg-1 (n = 19). This was greatly
elevated compared to the mean concentration of Cr reported in Scottish and Glasgow soils
which are 44.7 and 125 mg kg-1, respectively (Fordyce, 2012, Paterson, 2011). The maximum
Cr concentration of 6310 ± 140 mg kg-1 was measured in the soil sample collected at Sample
Point 21 in October 2016 (Figure 4-20A). This soil had been recently disturbed by construction
work before sampling which could have contributed to the high Cr concentration which may
have exposed deeper soil with higher Cr concentrations (Figure 4-19). There did not appear
to be any spatial trend in the banking soil Cr concentrations when considering location of the
samples and the concentrations of Cr found in them. The mean Cr(VI) concentrations in
banking soils was 427 ± 520 mg kg-1 (n = 19) which represented ~19 ± 10% of the total Cr in
the soil. The maximum concentration of Cr(VI) was 2190 ± 130 mg kg-1 which was also found
in the soil sample taken from Site 21 in October 2016 (Figure 4-20B).
Figure 4-19: Earthworks showing disturbance of banking soil
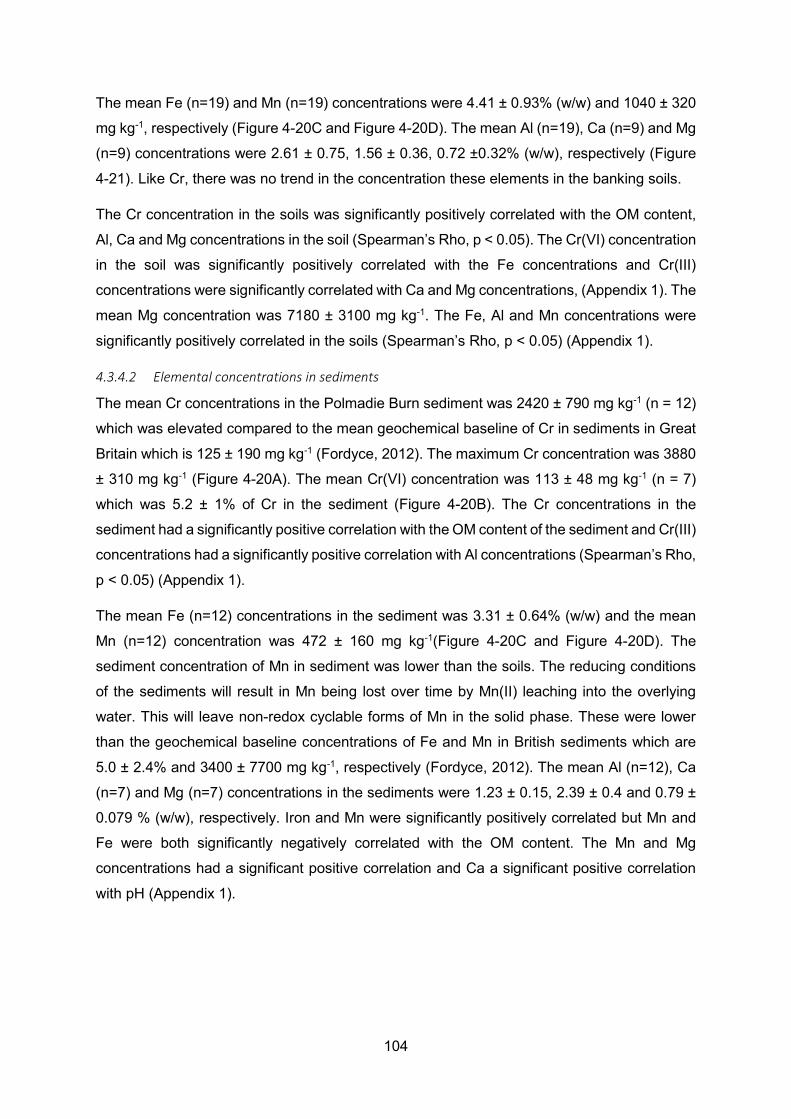
104
The mean Fe (n=19) and Mn (n=19) concentrations were 4.41 ± 0.93% (w/w) and 1040 ± 320
mg kg-1, respectively (Figure 4-20C and Figure 4-20D). The mean Al (n=19), Ca (n=9) and Mg
(n=9) concentrations were 2.61 ± 0.75, 1.56 ± 0.36, 0.72 ±0.32% (w/w), respectively (Figure
4-21). Like Cr, there was no trend in the concentration these elements in the banking soils.
The Cr concentration in the soils was significantly positively correlated with the OM content,
Al, Ca and Mg concentrations in the soil (Spearman’s Rho, p < 0.05). The Cr(VI) concentration
in the soil was significantly positively correlated with the Fe concentrations and Cr(III)
concentrations were significantly correlated with Ca and Mg concentrations, (Appendix 1). The
mean Mg concentration was 7180 ± 3100 mg kg-1. The Fe, Al and Mn concentrations were
significantly positively correlated in the soils (Spearman’s Rho, p < 0.05) (Appendix 1).
4.3.4.2 Elemental concentrations in sediments
The mean Cr concentrations in the Polmadie Burn sediment was 2420 ± 790 mg kg-1 (n = 12)
which was elevated compared to the mean geochemical baseline of Cr in sediments in Great
Britain which is 125 ± 190 mg kg-1 (Fordyce, 2012). The maximum Cr concentration was 3880
± 310 mg kg-1 (Figure 4-20A). The mean Cr(VI) concentration was 113 ± 48 mg kg-1 (n = 7)
which was 5.2 ± 1% of Cr in the sediment (Figure 4-20B). The Cr concentrations in the
sediment had a significantly positive correlation with the OM content of the sediment and Cr(III)
concentrations had a significantly positive correlation with Al concentrations (Spearman’s Rho,
p < 0.05) (Appendix 1).
The mean Fe (n=12) concentrations in the sediment was 3.31 ± 0.64% (w/w) and the mean
Mn (n=12) concentration was 472 ± 160 mg kg-1(Figure 4-20C and Figure 4-20D). The
sediment concentration of Mn in sediment was lower than the soils. The reducing conditions
of the sediments will result in Mn being lost over time by Mn(II) leaching into the overlying
water. This will leave non-redox cyclable forms of Mn in the solid phase. These were lower
than the geochemical baseline concentrations of Fe and Mn in British sediments which are
5.0 ± 2.4% and 3400 ± 7700 mg kg-1, respectively (Fordyce, 2012). The mean Al (n=12), Ca
(n=7) and Mg (n=7) concentrations in the sediments were 1.23 ± 0.15, 2.39 ± 0.4 and 0.79 ±
0.079 % (w/w), respectively. Iron and Mn were significantly positively correlated but Mn and
Fe were both significantly negatively correlated with the OM content. The Mn and Mg
concentrations had a significant positive correlation and Ca a significant positive correlation
with pH (Appendix 1).
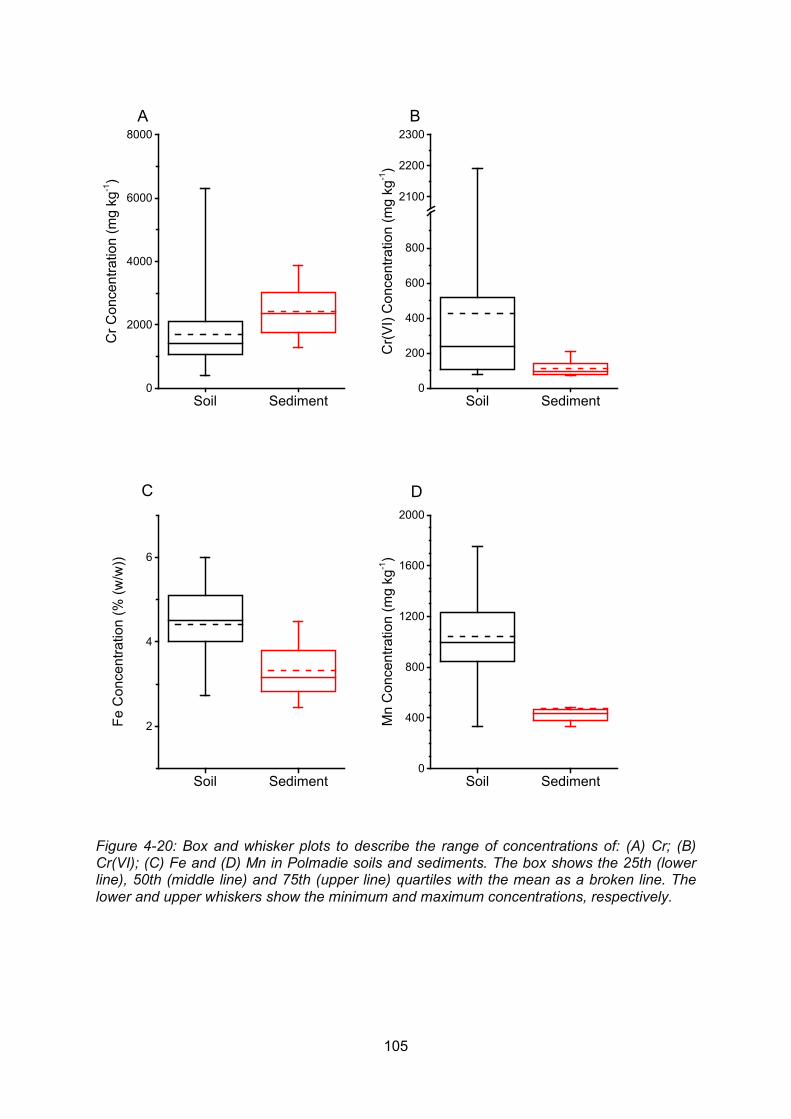
105
Figure 4-20: Box and whisker plots to describe the range of concentrations of: (A) Cr; (B) Cr(VI); (C) Fe and (D) Mn in Polmadie soils and sediments. The box shows the 25th (lower line), 50th (middle line) and 75th (upper line) quartiles with the mean as a broken line. The lower and upper whiskers show the minimum and maximum concentrations, respectively.
Soil Sediment0
2000
4000
6000
8000
Cr C
once
ntra
tion
(mg
kg-1)
A
Soil Sediment0
200
400
600
800
2100
2200
2300
Cr(V
I) C
once
ntra
tion
(mg
kg-1)
B
Soil Sediment
2
4
6
Fe C
once
ntra
tion
(% (w
/w))
C
Soil Sediment0
400
800
1200
1600
2000
Mn
Con
cent
ratio
n (m
g kg
-1)
D
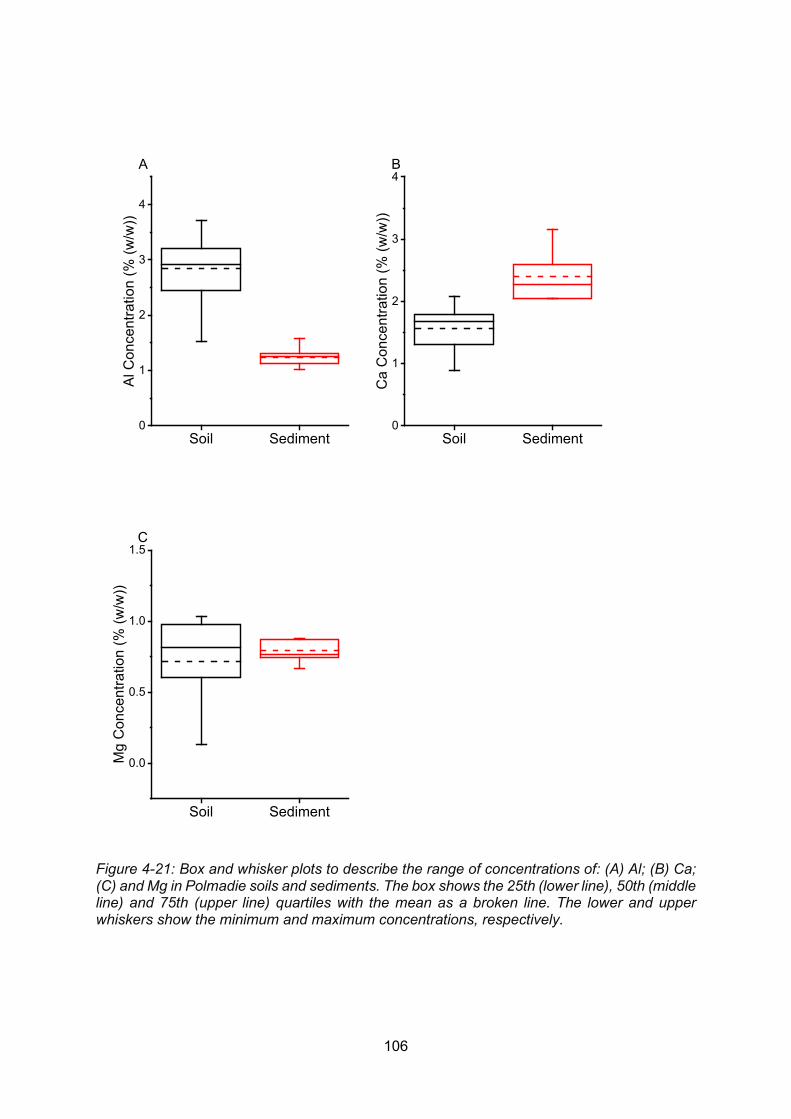
106
Figure 4-21: Box and whisker plots to describe the range of concentrations of: (A) Al; (B) Ca; (C) and Mg in Polmadie soils and sediments. The box shows the 25th (lower line), 50th (middle line) and 75th (upper line) quartiles with the mean as a broken line. The lower and upper whiskers show the minimum and maximum concentrations, respectively.
Soil Sediment0
1
2
3
4
Al C
once
ntra
tion
(% (w
/w))
A
Soil Sediment0
1
2
3
4
Ca
Con
cent
ratio
n (%
(w/w
) )
B
Soil Sediment
0.0
0.5
1.0
1.5
Mg
Con
cent
ratio
n (%
(w/w
))
C
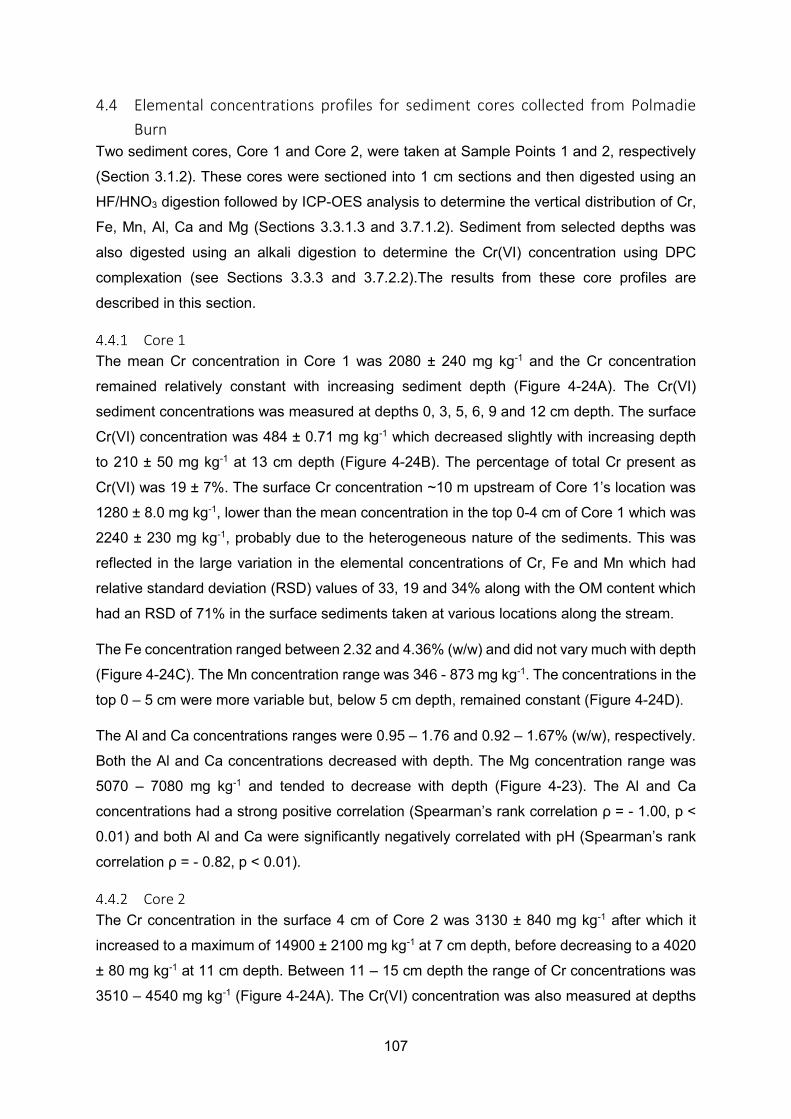
107
4.4 Elemental concentrations profiles for sediment cores collected from Polmadie Burn
Two sediment cores, Core 1 and Core 2, were taken at Sample Points 1 and 2, respectively
(Section 3.1.2). These cores were sectioned into 1 cm sections and then digested using an
HF/HNO3 digestion followed by ICP-OES analysis to determine the vertical distribution of Cr,
Fe, Mn, Al, Ca and Mg (Sections 3.3.1.3 and 3.7.1.2). Sediment from selected depths was
also digested using an alkali digestion to determine the Cr(VI) concentration using DPC
complexation (see Sections 3.3.3 and 3.7.2.2).The results from these core profiles are
described in this section.
Core 1 The mean Cr concentration in Core 1 was 2080 ± 240 mg kg-1 and the Cr concentration
remained relatively constant with increasing sediment depth (Figure 4-24A). The Cr(VI)
sediment concentrations was measured at depths 0, 3, 5, 6, 9 and 12 cm depth. The surface
Cr(VI) concentration was 484 ± 0.71 mg kg-1 which decreased slightly with increasing depth
to 210 ± 50 mg kg-1 at 13 cm depth (Figure 4-24B). The percentage of total Cr present as
Cr(VI) was 19 ± 7%. The surface Cr concentration ~10 m upstream of Core 1’s location was
1280 ± 8.0 mg kg-1, lower than the mean concentration in the top 0-4 cm of Core 1 which was
2240 ± 230 mg kg-1, probably due to the heterogeneous nature of the sediments. This was
reflected in the large variation in the elemental concentrations of Cr, Fe and Mn which had
relative standard deviation (RSD) values of 33, 19 and 34% along with the OM content which
had an RSD of 71% in the surface sediments taken at various locations along the stream.
The Fe concentration ranged between 2.32 and 4.36% (w/w) and did not vary much with depth
(Figure 4-24C). The Mn concentration range was 346 - 873 mg kg-1. The concentrations in the
top 0 – 5 cm were more variable but, below 5 cm depth, remained constant (Figure 4-24D).
The Al and Ca concentrations ranges were 0.95 – 1.76 and 0.92 – 1.67% (w/w), respectively.
Both the Al and Ca concentrations decreased with depth. The Mg concentration range was
5070 – 7080 mg kg-1 and tended to decrease with depth (Figure 4-23). The Al and Ca
concentrations had a strong positive correlation (Spearman’s rank correlation ρ = - 1.00, p <
0.01) and both Al and Ca were significantly negatively correlated with pH (Spearman’s rank
correlation ρ = - 0.82, p < 0.01).
Core 2 The Cr concentration in the surface 4 cm of Core 2 was 3130 ± 840 mg kg-1 after which it
increased to a maximum of 14900 ± 2100 mg kg-1 at 7 cm depth, before decreasing to a 4020
± 80 mg kg-1 at 11 cm depth. Between 11 – 15 cm depth the range of Cr concentrations was
3510 – 4540 mg kg-1 (Figure 4-24A). The Cr(VI) concentration was also measured at depths
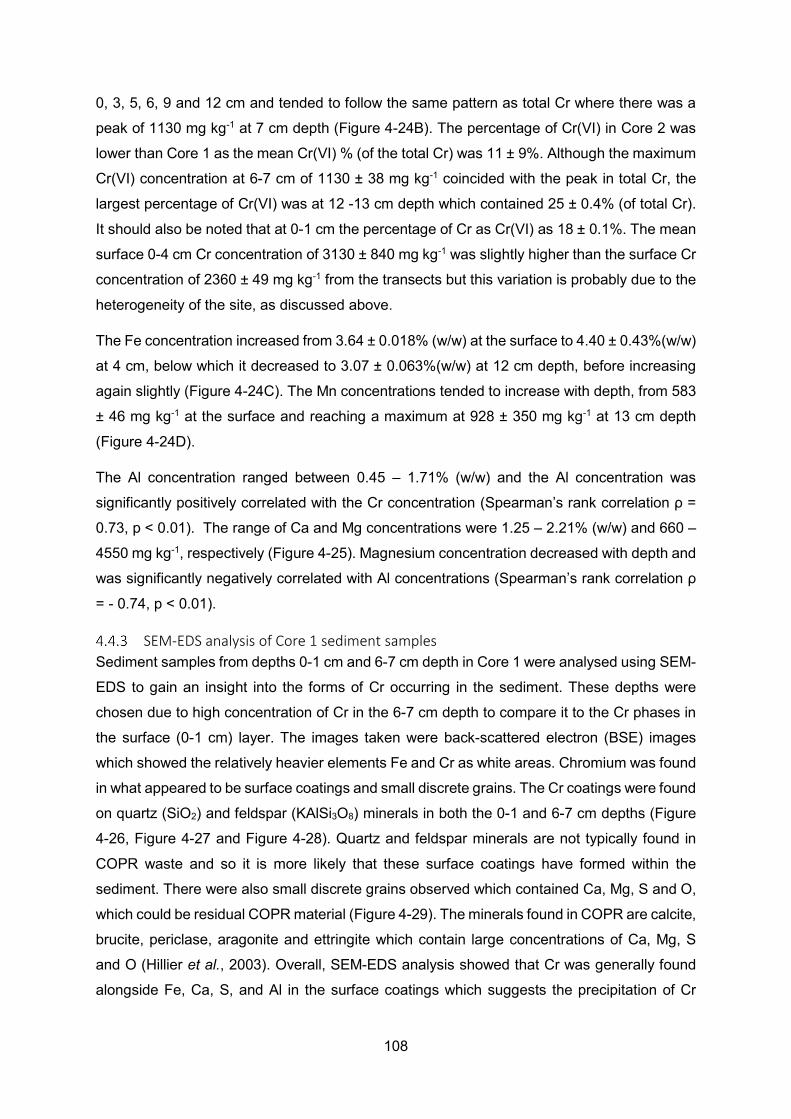
108
0, 3, 5, 6, 9 and 12 cm and tended to follow the same pattern as total Cr where there was a
peak of 1130 mg kg-1 at 7 cm depth (Figure 4-24B). The percentage of Cr(VI) in Core 2 was
lower than Core 1 as the mean Cr(VI) % (of the total Cr) was 11 ± 9%. Although the maximum
Cr(VI) concentration at 6-7 cm of 1130 ± 38 mg kg-1 coincided with the peak in total Cr, the
largest percentage of Cr(VI) was at 12 -13 cm depth which contained 25 ± 0.4% (of total Cr).
It should also be noted that at 0-1 cm the percentage of Cr as Cr(VI) as 18 ± 0.1%. The mean
surface 0-4 cm Cr concentration of 3130 ± 840 mg kg-1 was slightly higher than the surface Cr
concentration of 2360 ± 49 mg kg-1 from the transects but this variation is probably due to the
heterogeneity of the site, as discussed above.
The Fe concentration increased from 3.64 ± 0.018% (w/w) at the surface to 4.40 ± 0.43%(w/w)
at 4 cm, below which it decreased to 3.07 ± 0.063%(w/w) at 12 cm depth, before increasing
again slightly (Figure 4-24C). The Mn concentrations tended to increase with depth, from 583
± 46 mg kg-1 at the surface and reaching a maximum at 928 ± 350 mg kg-1 at 13 cm depth
(Figure 4-24D).
The Al concentration ranged between 0.45 – 1.71% (w/w) and the Al concentration was
significantly positively correlated with the Cr concentration (Spearman’s rank correlation ρ =
0.73, p < 0.01). The range of Ca and Mg concentrations were 1.25 – 2.21% (w/w) and 660 –
4550 mg kg-1, respectively (Figure 4-25). Magnesium concentration decreased with depth and
was significantly negatively correlated with Al concentrations (Spearman’s rank correlation ρ
= - 0.74, p < 0.01).
SEM-EDS analysis of Core 1 sediment samples Sediment samples from depths 0-1 cm and 6-7 cm depth in Core 1 were analysed using SEM-
EDS to gain an insight into the forms of Cr occurring in the sediment. These depths were
chosen due to high concentration of Cr in the 6-7 cm depth to compare it to the Cr phases in
the surface (0-1 cm) layer. The images taken were back-scattered electron (BSE) images
which showed the relatively heavier elements Fe and Cr as white areas. Chromium was found
in what appeared to be surface coatings and small discrete grains. The Cr coatings were found
on quartz (SiO2) and feldspar (KAlSi3O8) minerals in both the 0-1 and 6-7 cm depths (Figure
4-26, Figure 4-27 and Figure 4-28). Quartz and feldspar minerals are not typically found in
COPR waste and so it is more likely that these surface coatings have formed within the
sediment. There were also small discrete grains observed which contained Ca, Mg, S and O,
which could be residual COPR material (Figure 4-29). The minerals found in COPR are calcite,
brucite, periclase, aragonite and ettringite which contain large concentrations of Ca, Mg, S
and O (Hillier et al., 2003). Overall, SEM-EDS analysis showed that Cr was generally found
alongside Fe, Ca, S, and Al in the surface coatings which suggests the precipitation of Cr
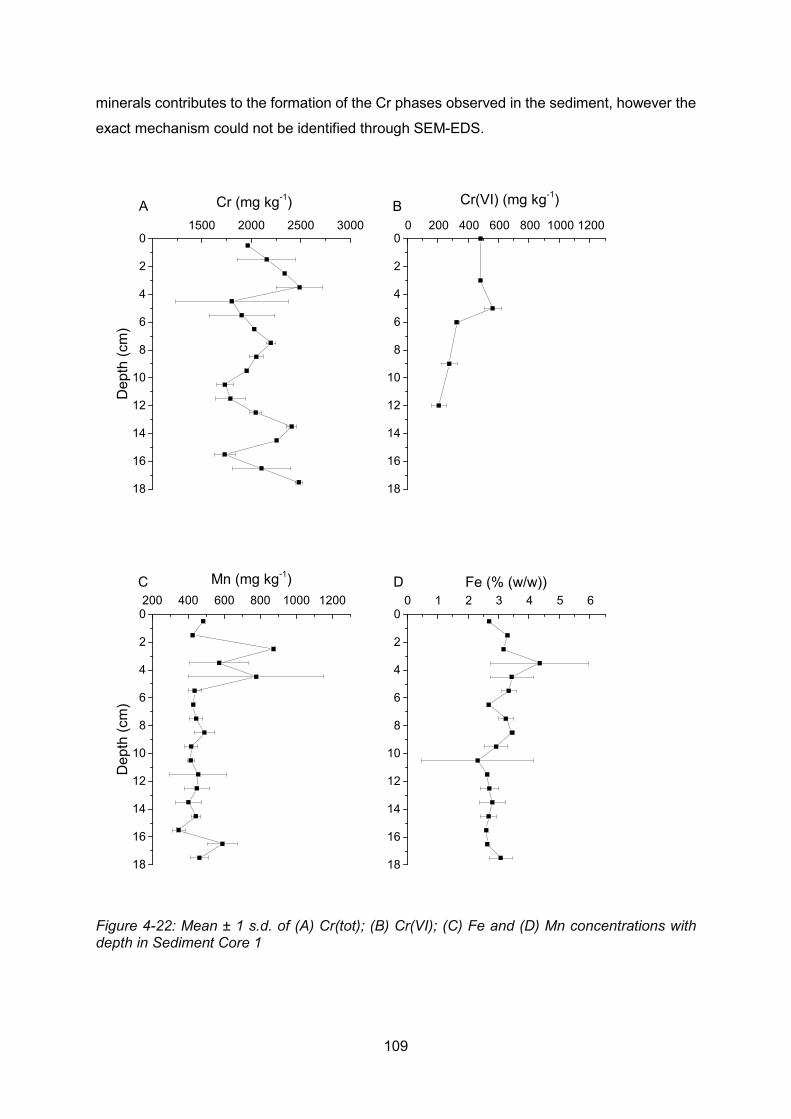
109
minerals contributes to the formation of the Cr phases observed in the sediment, however the
exact mechanism could not be identified through SEM-EDS.
Figure 4-22: Mean ± 1 s.d. of (A) Cr(tot); (B) Cr(VI); (C) Fe and (D) Mn concentrations with depth in Sediment Core 1
18
16
14
12
10
8
6
4
2
01500 2000 2500 3000
18
16
14
12
10
8
6
4
2
00 200 400 600 800 1000 1200
18
16
14
12
10
8
6
4
2
0200 400 600 800 1000 1200
18
16
14
12
10
8
6
4
2
00 1 2 3 4 5 6
Cr (mg kg-1)
Dep
th (c
m)
A Cr(VI) (mg kg-1)B
Mn (mg kg-1)
Dep
th (c
m)
C Fe (% (w/w))D
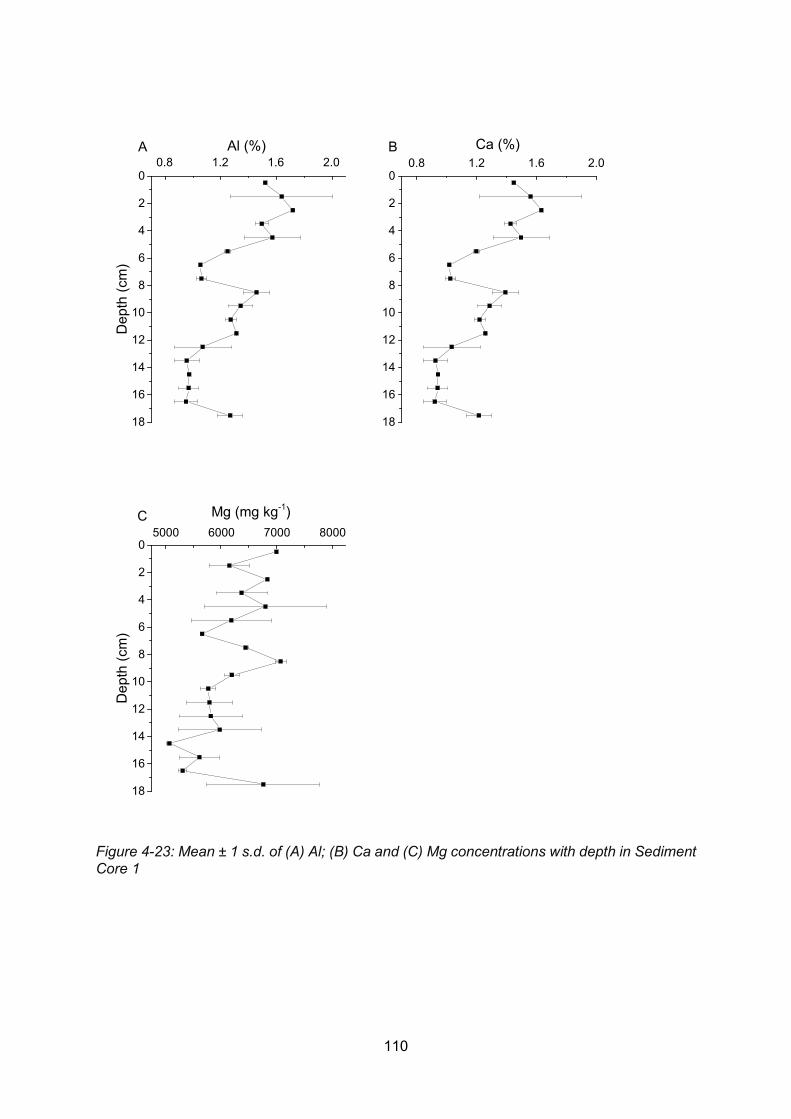
110
Figure 4-23: Mean ± 1 s.d. of (A) Al; (B) Ca and (C) Mg concentrations with depth in Sediment Core 1
18
16
14
12
10
8
6
4
2
00.8 1.2 1.6 2.0
18
16
14
12
10
8
6
4
2
00.8 1.2 1.6 2.0
18
16
14
12
10
8
6
4
2
05000 6000 7000 8000
Al (%)
Dep
th (c
m)
A Ca (%)B
Mg (mg kg-1)
Dep
th (c
m)
C
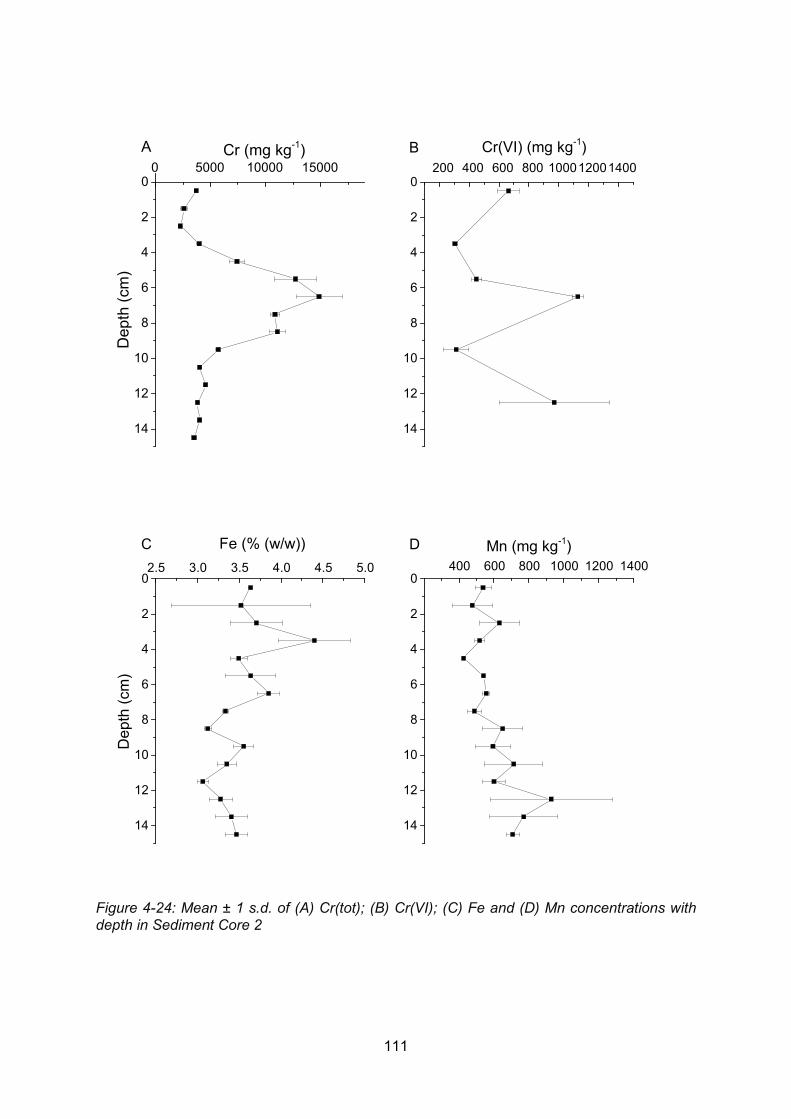
111
Figure 4-24: Mean ± 1 s.d. of (A) Cr(tot); (B) Cr(VI); (C) Fe and (D) Mn concentrations with depth in Sediment Core 2
14
12
10
8
6
4
2
00 5000 10000 15000
14
12
10
8
6
4
2
02.5 3.0 3.5 4.0 4.5 5.0
14
12
10
8
6
4
2
0200 400 600 800 100012001400
14
12
10
8
6
4
2
0400 600 800 1000 1200 1400
Cr (mg kg-1)
Dep
th (c
m)
A
Fe (% (w/w))C
Cr(VI) (mg kg-1)B
Dep
th (c
m)
Mn (mg kg-1)D
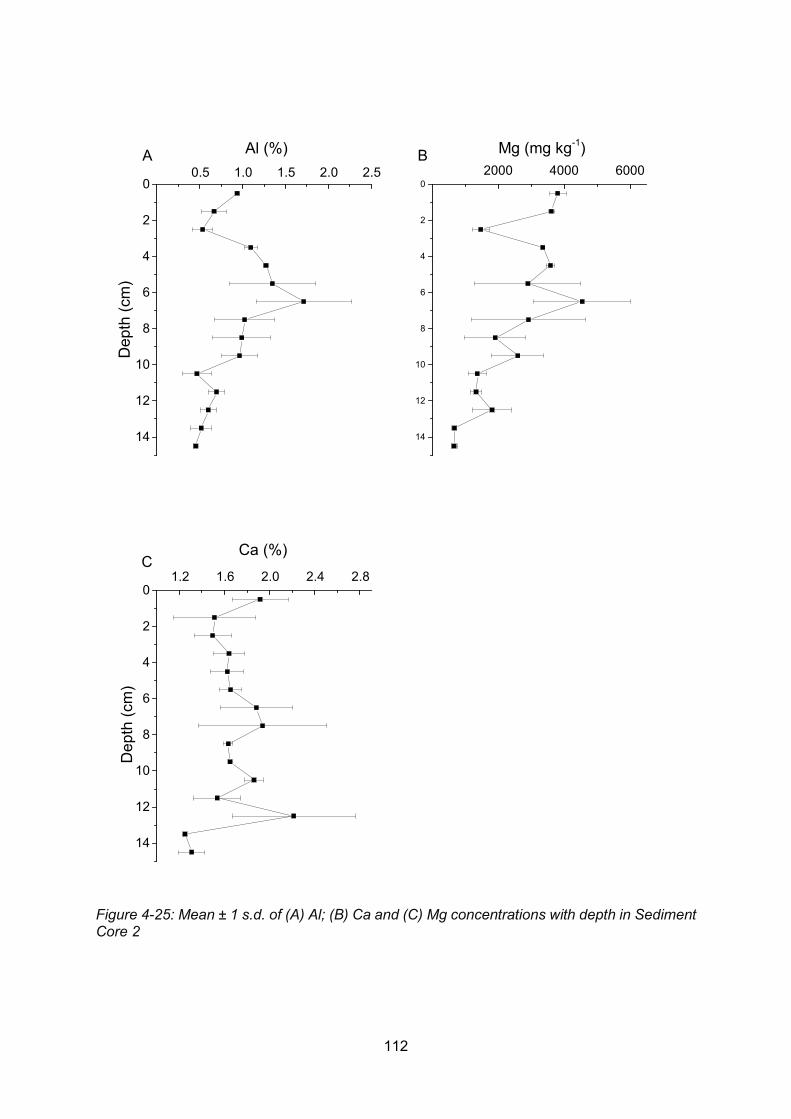
112
Figure 4-25: Mean ± 1 s.d. of (A) Al; (B) Ca and (C) Mg concentrations with depth in Sediment Core 2
14
12
10
8
6
4
2
00.5 1.0 1.5 2.0 2.5
14
12
10
8
6
4
2
02000 4000 6000
14
12
10
8
6
4
2
01.2 1.6 2.0 2.4 2.8
Dep
th (c
m)
Dep
th (c
m)
Al (%)A Mg (mg kg-1)B
Ca (%)C
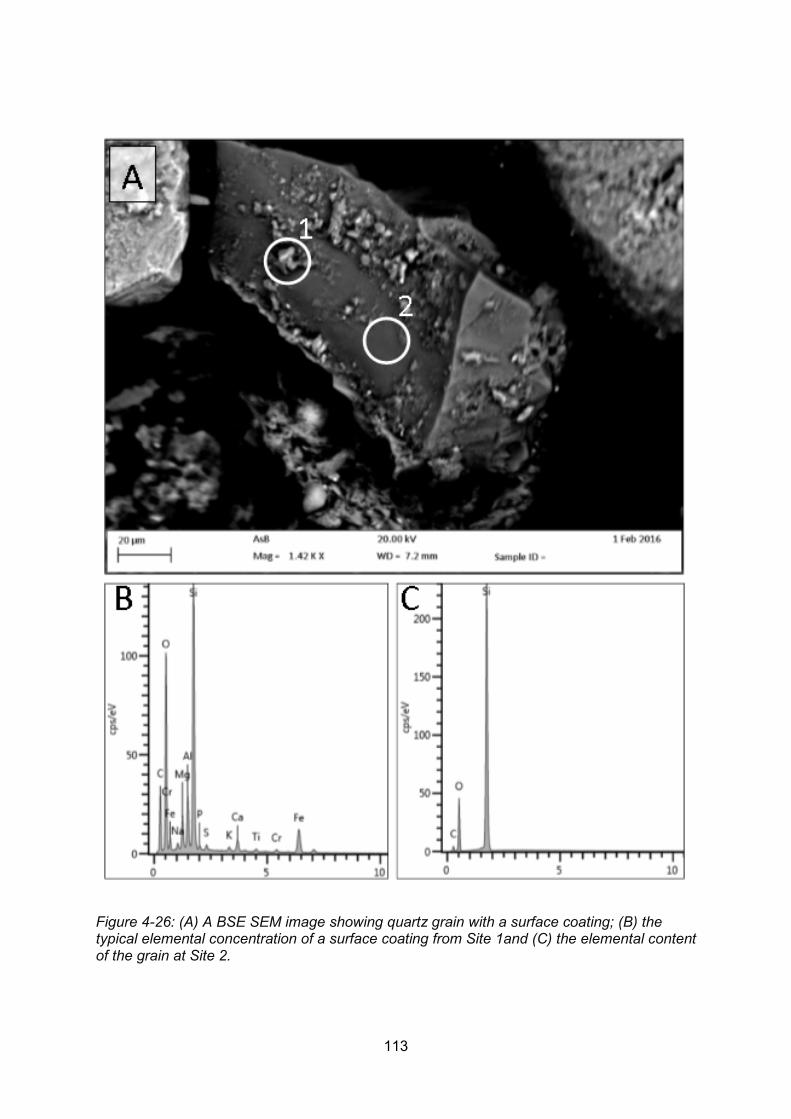
113
Figure 4-26: (A) A BSE SEM image showing quartz grain with a surface coating; (B) the typical elemental concentration of a surface coating from Site 1and (C) the elemental content of the grain at Site 2.
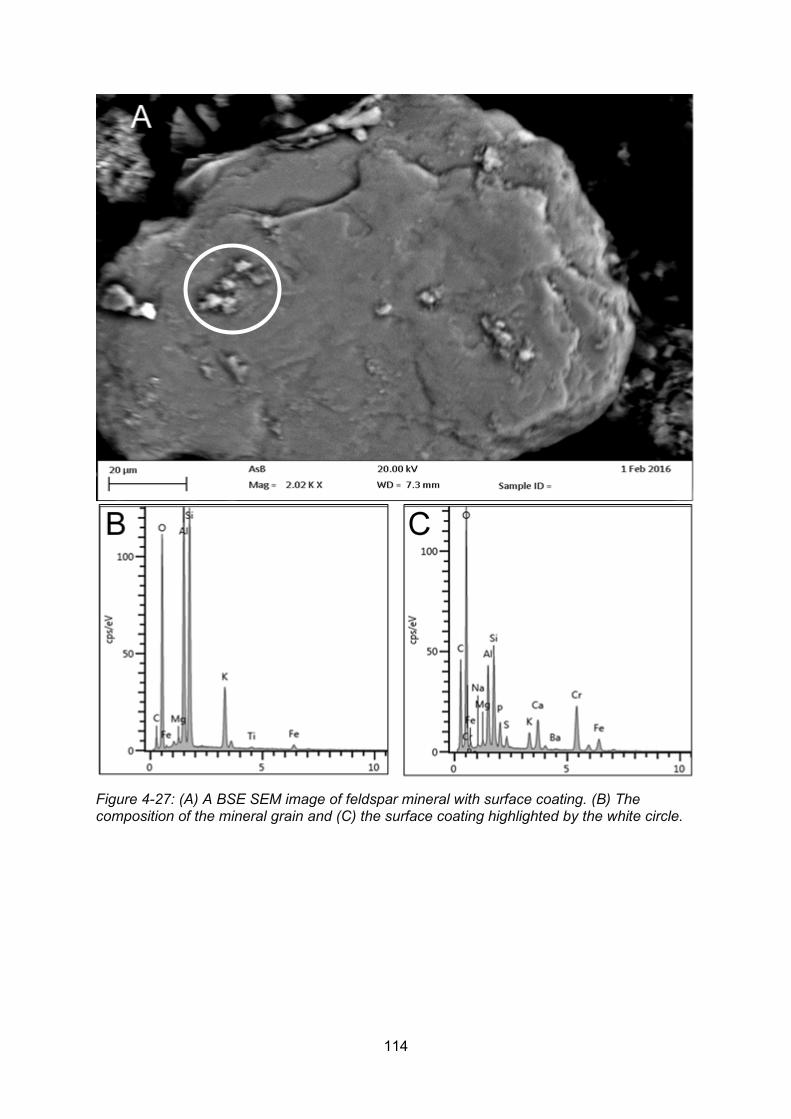
114
Figure 4-27: (A) A BSE SEM image of feldspar mineral with surface coating. (B) The composition of the mineral grain and (C) the surface coating highlighted by the white circle.
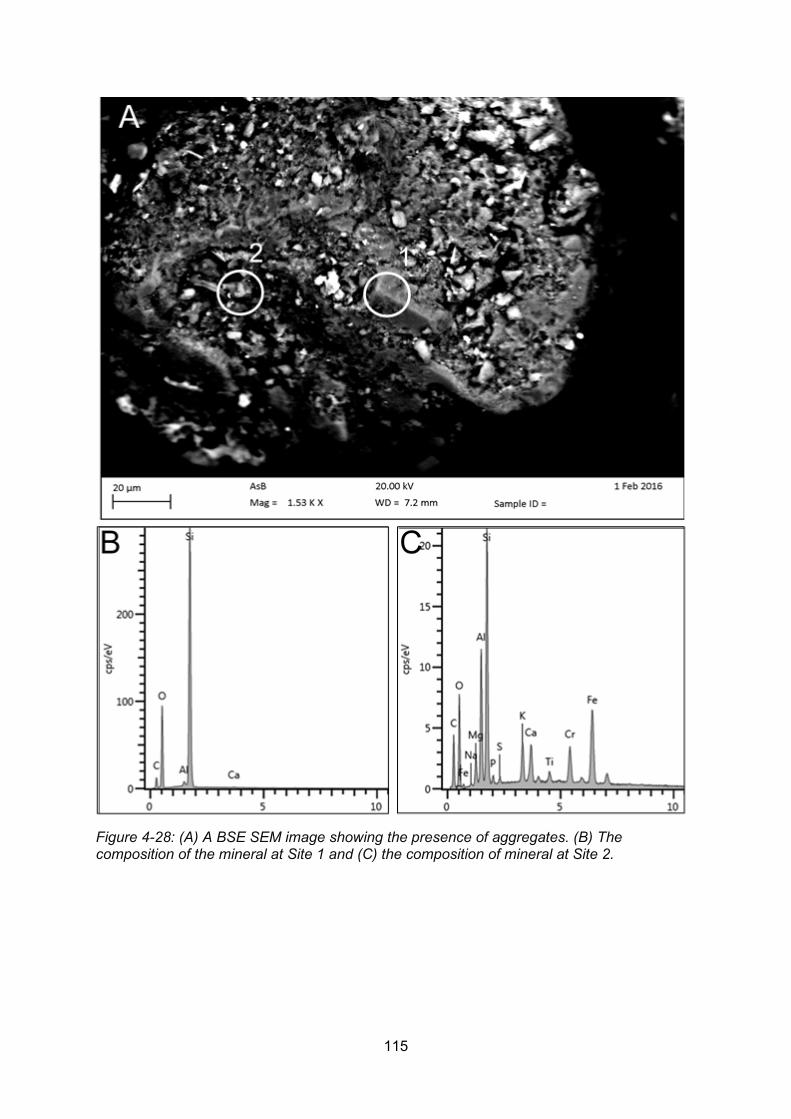
115
Figure 4-28: (A) A BSE SEM image showing the presence of aggregates. (B) The composition of the mineral at Site 1 and (C) the composition of mineral at Site 2.
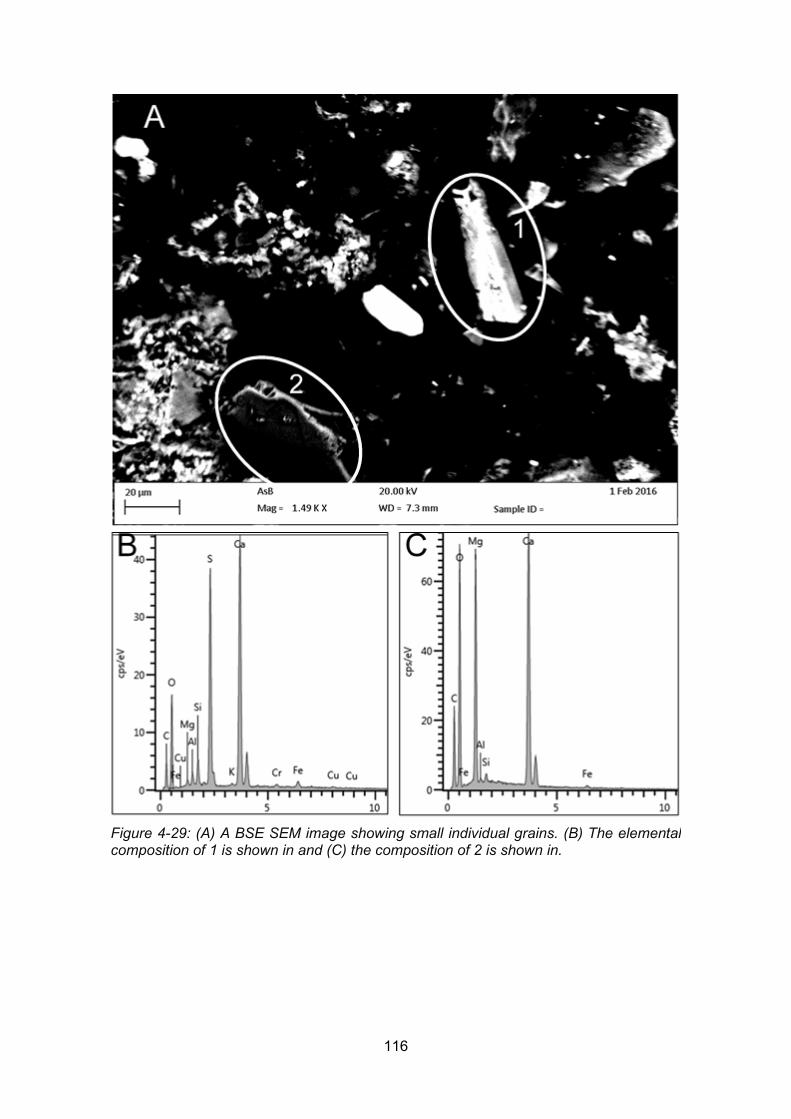
116
Figure 4-29: (A) A BSE SEM image showing small individual grains. (B) The elemental composition of 1 is shown in and (C) the composition of 2 is shown in.
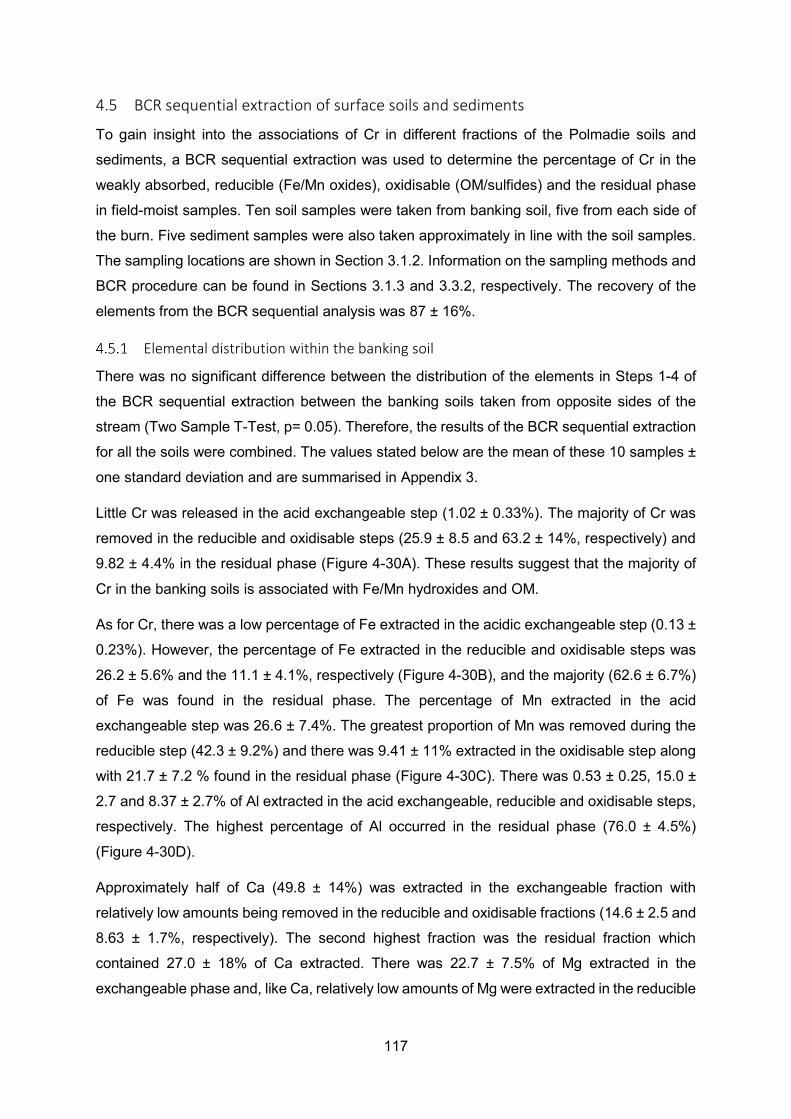
117
4.5 BCR sequential extraction of surface soils and sediments
To gain insight into the associations of Cr in different fractions of the Polmadie soils and
sediments, a BCR sequential extraction was used to determine the percentage of Cr in the
weakly absorbed, reducible (Fe/Mn oxides), oxidisable (OM/sulfides) and the residual phase
in field-moist samples. Ten soil samples were taken from banking soil, five from each side of
the burn. Five sediment samples were also taken approximately in line with the soil samples.
The sampling locations are shown in Section 3.1.2. Information on the sampling methods and
BCR procedure can be found in Sections 3.1.3 and 3.3.2, respectively. The recovery of the
elements from the BCR sequential analysis was 87 ± 16%.
Elemental distribution within the banking soil
There was no significant difference between the distribution of the elements in Steps 1-4 of
the BCR sequential extraction between the banking soils taken from opposite sides of the
stream (Two Sample T-Test, p= 0.05). Therefore, the results of the BCR sequential extraction
for all the soils were combined. The values stated below are the mean of these 10 samples ±
one standard deviation and are summarised in Appendix 3.
Little Cr was released in the acid exchangeable step (1.02 ± 0.33%). The majority of Cr was
removed in the reducible and oxidisable steps (25.9 ± 8.5 and 63.2 ± 14%, respectively) and
9.82 ± 4.4% in the residual phase (Figure 4-30A). These results suggest that the majority of
Cr in the banking soils is associated with Fe/Mn hydroxides and OM.
As for Cr, there was a low percentage of Fe extracted in the acidic exchangeable step (0.13 ±
0.23%). However, the percentage of Fe extracted in the reducible and oxidisable steps was
26.2 ± 5.6% and the 11.1 ± 4.1%, respectively (Figure 4-30B), and the majority (62.6 ± 6.7%)
of Fe was found in the residual phase. The percentage of Mn extracted in the acid
exchangeable step was 26.6 ± 7.4%. The greatest proportion of Mn was removed during the
reducible step (42.3 ± 9.2%) and there was 9.41 ± 11% extracted in the oxidisable step along
with 21.7 ± 7.2 % found in the residual phase (Figure 4-30C). There was 0.53 ± 0.25, 15.0 ±
2.7 and 8.37 ± 2.7% of Al extracted in the acid exchangeable, reducible and oxidisable steps,
respectively. The highest percentage of Al occurred in the residual phase (76.0 ± 4.5%)
(Figure 4-30D).
Approximately half of Ca (49.8 ± 14%) was extracted in the exchangeable fraction with
relatively low amounts being removed in the reducible and oxidisable fractions (14.6 ± 2.5 and
8.63 ± 1.7%, respectively). The second highest fraction was the residual fraction which
contained 27.0 ± 18% of Ca extracted. There was 22.7 ± 7.5% of Mg extracted in the
exchangeable phase and, like Ca, relatively low amounts of Mg were extracted in the reducible
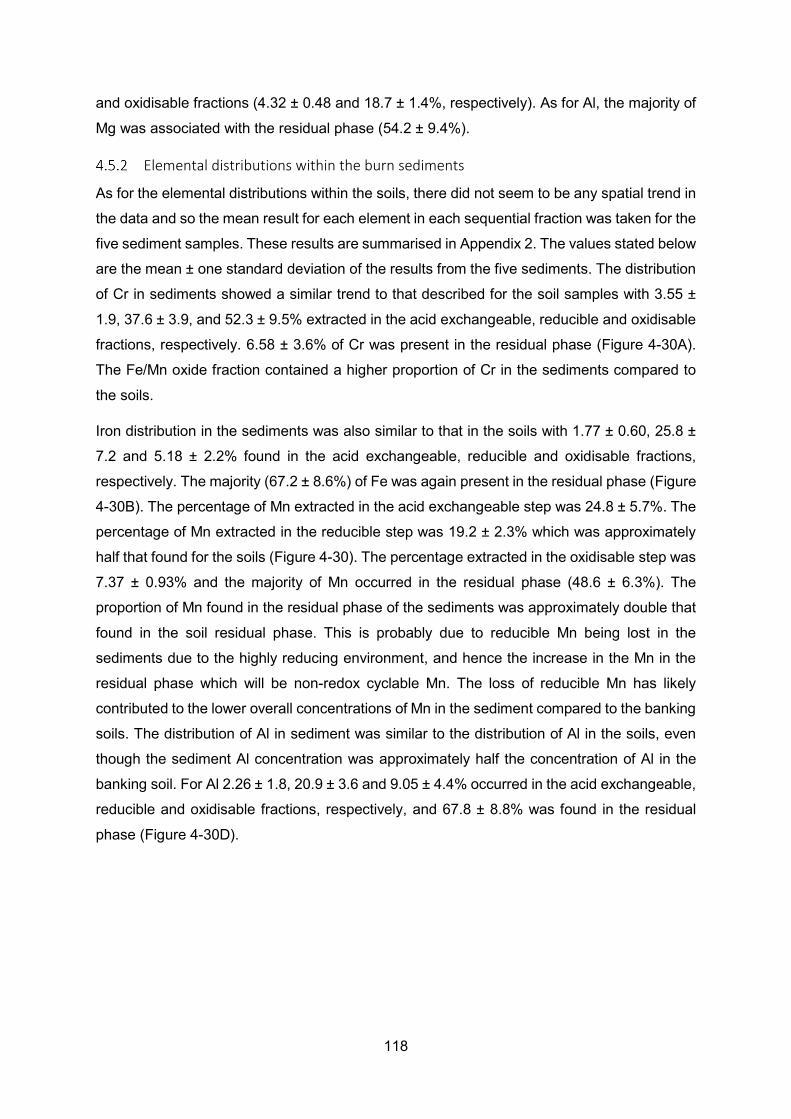
118
and oxidisable fractions (4.32 ± 0.48 and 18.7 ± 1.4%, respectively). As for Al, the majority of
Mg was associated with the residual phase (54.2 ± 9.4%).
Elemental distributions within the burn sediments
As for the elemental distributions within the soils, there did not seem to be any spatial trend in
the data and so the mean result for each element in each sequential fraction was taken for the
five sediment samples. These results are summarised in Appendix 2. The values stated below
are the mean ± one standard deviation of the results from the five sediments. The distribution
of Cr in sediments showed a similar trend to that described for the soil samples with 3.55 ±
1.9, 37.6 ± 3.9, and 52.3 ± 9.5% extracted in the acid exchangeable, reducible and oxidisable
fractions, respectively. 6.58 ± 3.6% of Cr was present in the residual phase (Figure 4-30A).
The Fe/Mn oxide fraction contained a higher proportion of Cr in the sediments compared to
the soils.
Iron distribution in the sediments was also similar to that in the soils with 1.77 ± 0.60, 25.8 ±
7.2 and 5.18 ± 2.2% found in the acid exchangeable, reducible and oxidisable fractions,
respectively. The majority (67.2 ± 8.6%) of Fe was again present in the residual phase (Figure
4-30B). The percentage of Mn extracted in the acid exchangeable step was 24.8 ± 5.7%. The
percentage of Mn extracted in the reducible step was 19.2 ± 2.3% which was approximately
half that found for the soils (Figure 4-30). The percentage extracted in the oxidisable step was
7.37 ± 0.93% and the majority of Mn occurred in the residual phase (48.6 ± 6.3%). The
proportion of Mn found in the residual phase of the sediments was approximately double that
found in the soil residual phase. This is probably due to reducible Mn being lost in the
sediments due to the highly reducing environment, and hence the increase in the Mn in the
residual phase which will be non-redox cyclable Mn. The loss of reducible Mn has likely
contributed to the lower overall concentrations of Mn in the sediment compared to the banking
soils. The distribution of Al in sediment was similar to the distribution of Al in the soils, even
though the sediment Al concentration was approximately half the concentration of Al in the
banking soil. For Al 2.26 ± 1.8, 20.9 ± 3.6 and 9.05 ± 4.4% occurred in the acid exchangeable,
reducible and oxidisable fractions, respectively, and 67.8 ± 8.8% was found in the residual
phase (Figure 4-30D).
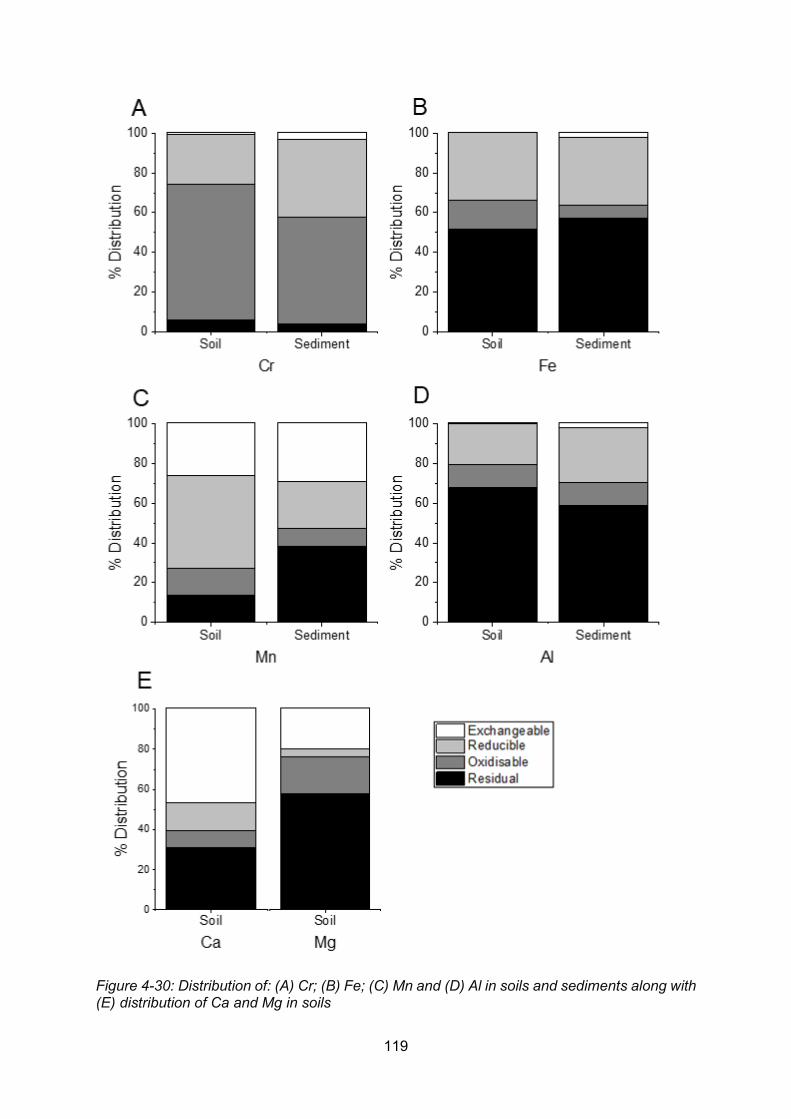
119
Figure 4-30: Distribution of: (A) Cr; (B) Fe; (C) Mn and (D) Al in soils and sediments along with (E) distribution of Ca and Mg in soils
120
4.6 Gel Electrophoretic fractionation of organic matter extracted from the Polmadie
Burn banking soils and bottom sediments
Gel electrophoresis has been successfully shown to separate OM extracted from soils based
on their molecular weight and charge (Graham et al., 2008). The principle works by applying
difference in potential (voltage) across a gel which is filled with a buffer solution and to which
the soil OM is added to a well. This potential difference separates the material based on its
charge density and size and therefore can be useful for determining the associations of metals
to different types of OM. Since sulfides can also be removed in the oxidisable step of the
sequential extraction methods, this technique was used here to confirm the association of Cr
and OM that was suggested by the BCR sequential extraction for both banking soils and
stream sediments.
Organic matter was extracted using a 0.1 M NaOH extraction from dried soil, field-moist soil,
dried sediment and field-moist sediment to investigate the differences in Cr/OM interactions
as banking soil and sediments dry. The dried soil and sediment used for this experiment were
air-dried for 4 weeks. The electrophoresis gel was prepared as described in Section 3.6.3 and
the wells of the horizontal bed electrophoresis unit were filled with 0.045 M Tris-borate buffer
(Graham et al., 2008). Approximately 2 mL of the extracted OM was transferred to the gel well
and the electrophoretic procedure was run using conditions of fixed current (20 mA) for 30 min
(Graham et al., 2008). All of the organic material emerged from the gel well and a brown band
was observed. Under UV light, a white band was observed ahead of the brown band. The gel
was then cut into ten 0.5 cm strips, fraction 1 the closest 0.5 cm section to the well and fraction
10 the furthest, each was placed in a separate centrifuge tube, frozen and then thawed.
Centrifugation (5000 x g for 20 min) was used to isolate the dissolved OM (DOM) from the gel.
An aliquot of leachate recovered from each strip was analysed using ICP-MS to determine the
Cr, Fe and Mn concentration. The absorbance of the leachate was measured using UV-Vis
spectrometer over the wavelength 200 – 550 nm. The ratio of the slope of the natural logarithm
of the absorbance between 275 and 295 nm to the slope of the natural logarithm of the
absorbance between 350 and 400 nm was taken. This value gives an indication of the
molecular weight and source of the OM extracted (Helms et al., 2008). Although the DOM
concentration was not directly measured in the solution released after a freeze-thaw method,
the UV absorbance at 254 nm was used as a proxy to obtain the relative DOM concentrations
(USEPA, 2009).
Electrophoretic fractionation of banking soil organic matter
A brown colour was observed in electrophoretic fractions 4 and 5, i.e. 1.5-2 and 2-2.5 cm from
the gel well, in the OM extracted from both the field-moist and dried soil samples. Fractions 5
121
and 6 also showed fluorescence under UV light. The maximum absorbance at 254 nm
(corrected for dilutions which were made before the spectra were obtained) was ~3.6 in F5 of
the extractant from field-moist soil and ~3.7 in F4 of the extractant from dried soil, matching
well with the visual observations. The slope ratio initially decreased to a minimum value at the
position of the OM bands (F4-6) for both the air-dried and field-moist samples. The mean slope
ratio for the field-moist and air-dried OM in F4-6 was 0.644 ± 0.14 and 0.722 ± 0.13,
respectively (Figure 4-31 and Figure 4-32).
The maximum concentrations of Cr were 239 and 314 µg L-1 in F4 in the extractant from field-
moist and dried soil, respectively. This coincides with the position of the brown band observed
visually and confirmed by the absorbance at 254 nm. The same distribution was observed for
Fe which had a maximum concentration of 1410 and 981 µg L-1 in F4 in the extractant from
field-moist and dried soil, respectively. Thus, both Cr and Fe co-migrate with OM in the gel
electrophoresis system, indicating that they are in some way associated, Both Cr and Fe may
be directly bound to the negatively charged OM or Cr may be bound to Fe which is intimately
associated with the OM. It may indeed be a mixture of both of these associations, which would
be highly consistent with the sequential extraction results.
The Mn concentrations in the gel fractions were generally a lot lower than those for Cr and Fe,
as expected both from the sequential extraction results and from previously published work
which shows that Mn does not associated strongly with OM. In addition, the electrophoretic
distribution pattern for Mn was not the same as for Cr and Fe, as Mn concentrations peaked
in F3. Maximum Mn concentrations of 49.9 and 32.6 µg L-1 were found in F3 of the extractant
from field-moist and dried soil, respectively. Thus it appears that the small amount of Mn
associated with extracted OM was associated with a less mobile component. The significance
of the difference between the Cr/OM associations from DOM extracted from dried and field-
moist soils is discussed in a later chapter.
Sediment
A brown colour was observed in F2 and 3 in the OM extracted from field-moist sediment and
so the sediment OM was less electrophoretically mobile than that in the soil. A pale brown
colour was also observed in F2 and 3 of the OM extracted from dried sediment. The maximum
absorbance at 254 nm was ~2.1 in F4 of the OM extracted from field-moist sediment but only
~0.3 in F3 of the OM extracted from dried sediment. The mean slope ratio for OM extracted
from the field-moist and air-dried sediments in F2-4 was 1.26 ± 0.095 and 1.32 ± 0.032
respectively. This was higher than the soil slope ratio implying that the type of OM differs
between the soil and sediment. This is possible due to the soils having a greater input of leaf
122
litter from the vegetated banks whereas OM in the sediment may be derived more from
sewage overflows.
The maximum Cr concentrations were 271 µg L-1 in F4 of the field-moist sediment extractant
and 30.6 µg L-1 in F6 of the extractant from dried sediment. Maximum Fe concentrations were
1420 µgL-1 in F3 of the field-moist sediment extractant and 38.4 µg L-1 in F3 of the extractant
from dried sediment. The maximum concentrations of Mn were 49.1 µg L-1 in F4 of the field-
moist sediment extractant and 6.04 µg L-1 in F2 of the extractant from dried sediment. This
shows that in the field-moist sediments Cr is bound to OM complexes which compliments the
results shown in the BCR sequential extraction. The significance of the difference between
the Cr-OM interactions in the field-moist and air-dried sediments will discussed in a later
chapter.
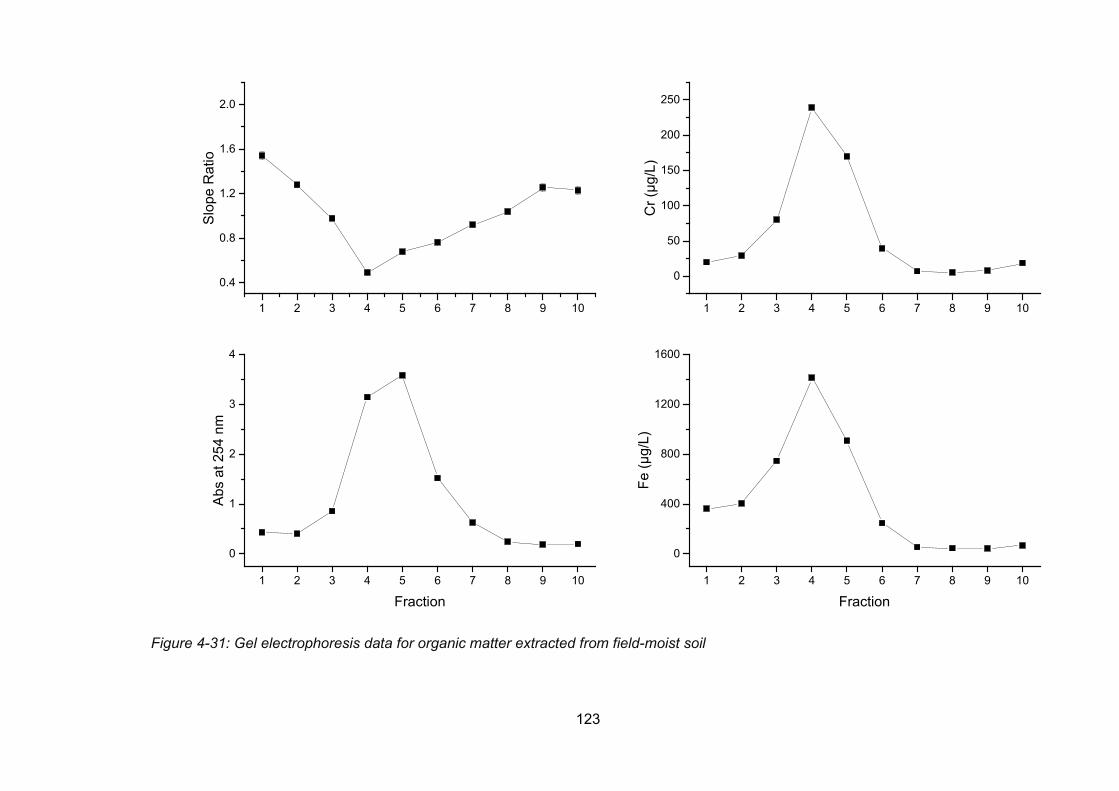
123
Figure 4-31: Gel electrophoresis data for organic matter extracted from field-moist soil
1 2 3 4 5 6 7 8 9 10
0.4
0.8
1.2
1.6
2.0
1 2 3 4 5 6 7 8 9 10
0
50
100
150
200
250
1 2 3 4 5 6 7 8 9 10
0
1
2
3
4
1 2 3 4 5 6 7 8 9 10
0
400
800
1200
1600
Slop
e R
atio
Cr (
µg/L
)
Abs
at 2
54 n
m
Fraction
Fe (µ
g/L)
Fraction
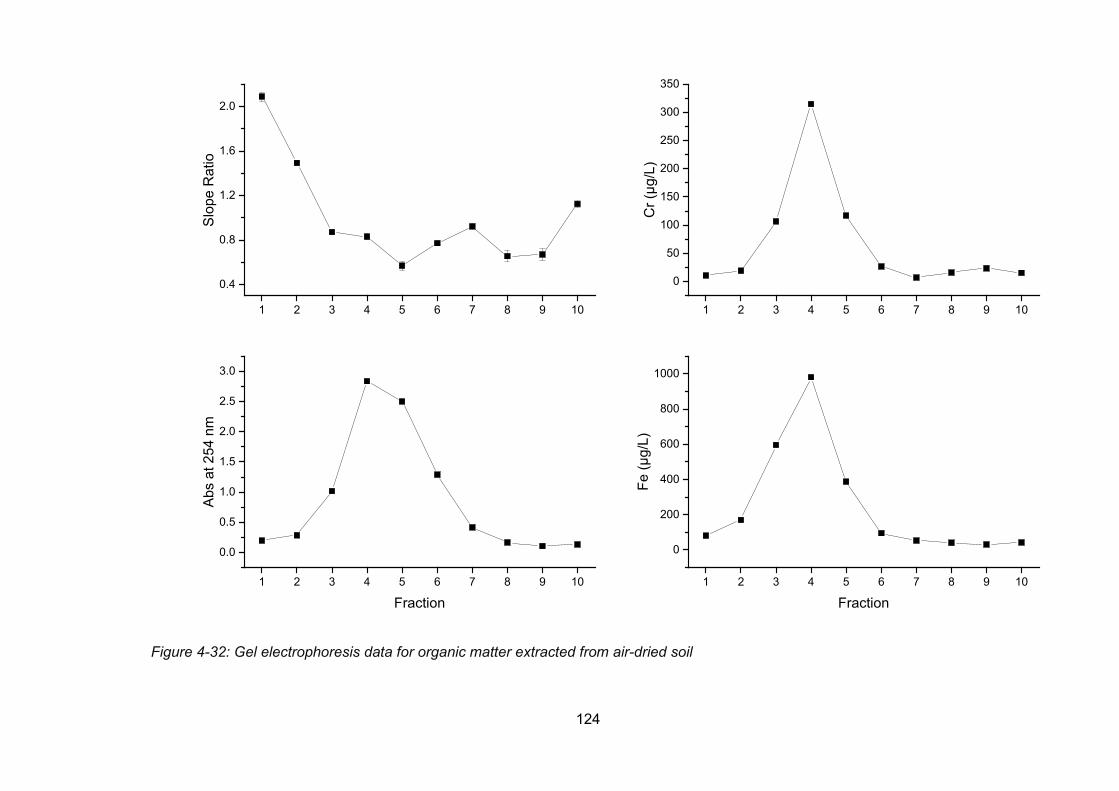
124
Figure 4-32: Gel electrophoresis data for organic matter extracted from air-dried soil
1 2 3 4 5 6 7 8 9 10
0.4
0.8
1.2
1.6
2.0
1 2 3 4 5 6 7 8 9 10
0
50
100
150
200
250
300
350
1 2 3 4 5 6 7 8 9 10
0.0
0.5
1.0
1.5
2.0
2.5
3.0
1 2 3 4 5 6 7 8 9 10
0
200
400
600
800
1000
Slop
e R
atio
Cr (
µg/L
)
Abs
at 2
54 n
m
Fraction
Fe (µ
g/L)
Fraction
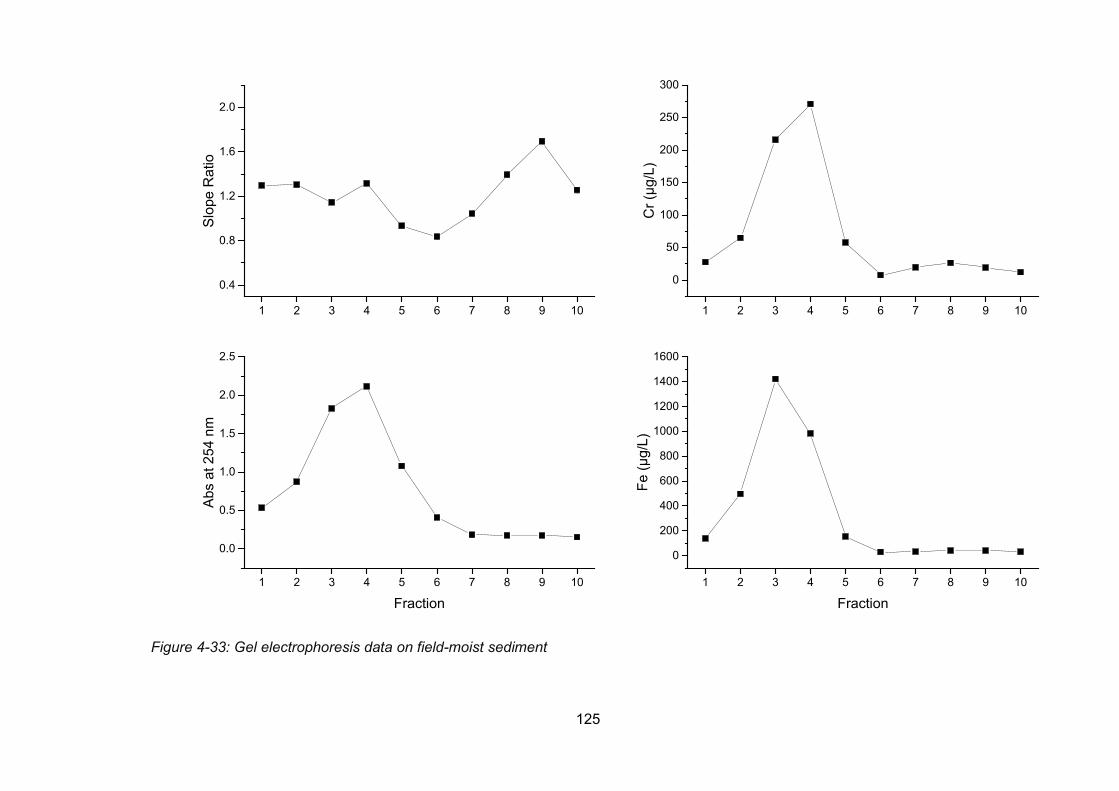
125
Figure 4-33: Gel electrophoresis data on field-moist sediment
1 2 3 4 5 6 7 8 9 10
0.4
0.8
1.2
1.6
2.0
1 2 3 4 5 6 7 8 9 10
0
50
100
150
200
250
300
1 2 3 4 5 6 7 8 9 10
0.0
0.5
1.0
1.5
2.0
2.5
1 2 3 4 5 6 7 8 9 10
0
200
400
600
800
1000
1200
1400
1600
Slop
e R
atio
Cr (
µg/L
)
Abs
at 2
54 n
m
Fraction
Fe (µ
g/L)
Fraction
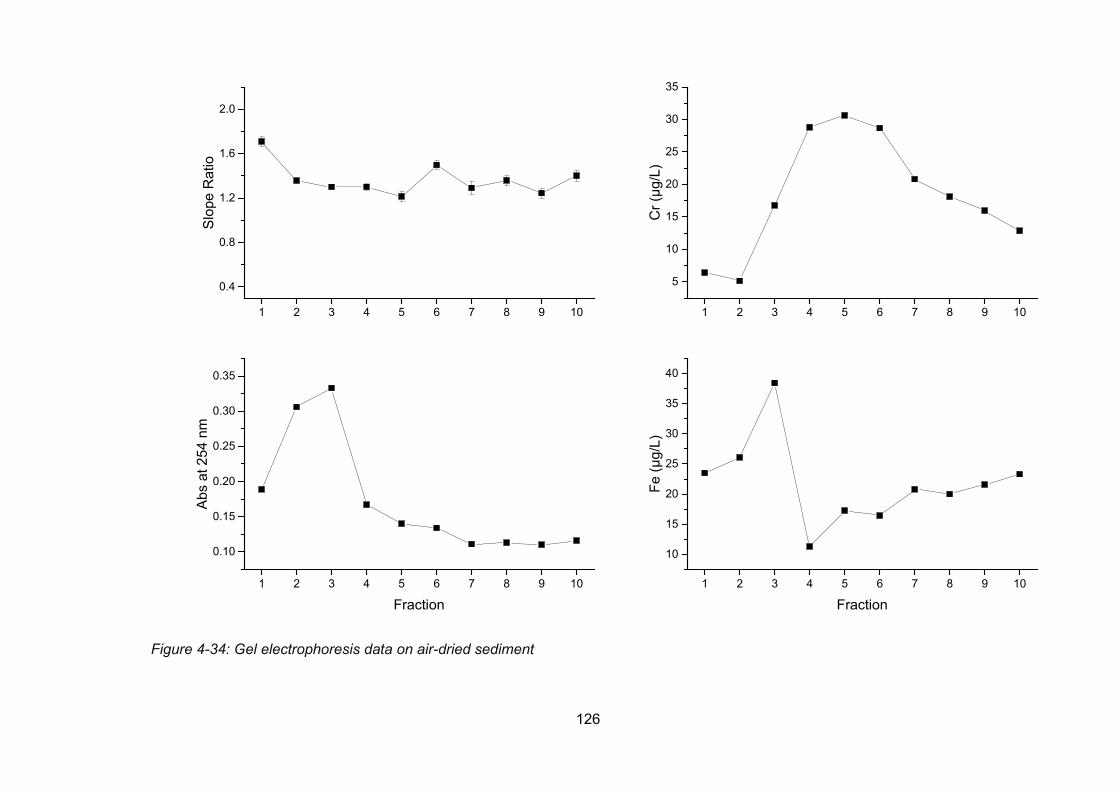
126
Figure 4-34: Gel electrophoresis data on air-dried sediment
1 2 3 4 5 6 7 8 9 10
0.4
0.8
1.2
1.6
2.0
1 2 3 4 5 6 7 8 9 10
5
10
15
20
25
30
35
1 2 3 4 5 6 7 8 9 10
0.10
0.15
0.20
0.25
0.30
0.35
1 2 3 4 5 6 7 8 9 10
10
15
20
25
30
35
40
Slop
e R
atio
Cr (
µg/L
)
Abs
at 2
54 n
m
Fraction
Fe (µ
g/L)
Fraction
127
4.7 Discussion of results
Occurrence of chromium in the Polmadie Burn sediments and banking soils
When the outlier of 6310 mg kg-1 was removed (Grubbs’ test, G=3.52, p<0.01) there
was significantly more Cr in the sediments (2420 ± 790 mg kg-1) compared to the
banking soil (1460 ± 703 mg kg-1) (T-test, T= -3.41, p<0.01). The catchment of the
Polmadie Burn flows through areas which have been impacted by COPR which
originated from the J&J White Chromium Chemical Works (Farmer et al., 2002).
Previous work has shown that detrital COPR particles are present in the Polmadie
Burn sediment which contribute to their high concentrations of Cr (<8800 mg kg-1 in
the 150 µm fraction) (Palumbo-Roe et al., 2017). The same study showed that mineral
coatings containing Cr were present in the Polmadie Burn sediment. Similar material
was found using SEM-EDS analysis of the sediments in this project. The surface
coatings on quartz grains and feldspar minerals are unlikely to have originated from
COPR waste indicating the formation of these coatings in the sediment. This is
consistent with Cr(VI) having been reduced by Fe(II) which has been observed to
precipitate as a mixed Fe/Cr hydroxide (Papassiopi et al., 2014).
A slight decrease in Cr concentrations in the Polmadie Burn between the culvert and
its entrance to the River Clyde was observed by Palumbo-Roe et al. (2017). This
suggested that Cr(VI) is attenuated by precipitation and/or adsorption reactions to the
sediment surface although the exact mechanism was not determined (Palumbo-Roe
et al., 2017). The same study reported minimal penetration of burn water into the
sediment indicate the large variation of Cl concentrations in the stream water but
limited response in the sediment porewater. This suggests that, although the
sediment is effective in immobilising Cr(VI), there is limited exchange between the
surface water and sediment porewater allowing Cr(VI) to remain in solution (Palumbo-
Roe et al., 2017).
The highly reducing conditions indicated by the presence of Fe(II) coupled with the
lack of Cr(VI) in the sediment porewaters strongly support the hypothesis that Cr(VI)
is unstable under the prevailing conditions and is removed onto the surfaces of
sediment particles. Indeed, there was also significantly less Cr(VI) in the surface
sediments (113 ± 48 mg kg-1) compared to the soils (427 ± 520 mg kg-1) (Mann-
Whitney, U=240, p=0.01). Also, the percentage of total Cr as Cr(VI) was significantly
128
lower in the surface sediments compared to the banking soils (Mann-Whitney, U=294,
p=0.03). The observed behaviour is also consistent with previously published studies
which show that reducing sediments which contain high concentrations of Fe(II) will
result in the rapid reduction of Cr(VI) to Cr(III). It has been shown that the rate of
Cr(VI) reduction by Fe(II) decreases as pH increases up to pH 4.5 and then increases
as pH rises above pH 5.5 (Pettine et al., 1998). In the sediment porewater which has
pH > 8 this reaction will rapidly reduce all soluble Cr(VI) in the sediment to Cr(III)
which will then precipitate as an insoluble mixed Fe/Cr hydroxide to form surface
coatings.
In this study, it has also been observed that both Cr(III) and Cr(VI) can be present in
the sediments even when the pH and redox conditions indicate that Cr(III) should be
the thermodynamically stable species (Figure 4-15). For example, the percentage of
Cr in the form of Cr(VI) found in the surface 0 – 1 cm of the sediment cores 1 and 2
was 24.6 ± 0.036 and 17.9 ± 2.0%, respectively, which tended to decrease with depth
in both cores with depth to 14.2 ± 2.7 and 5.50 ± 1.5% at 9-10 cm depth. The
persistence of Cr(VI) in the Polmadie sediment has been documented before and has
been attributed to the weathering of COPR minerals which forms a crust protecting
the Cr(VI) inside these minerals from weathering (Hillier et al., 2003). The process of
ball milling to break up these particles and the use of an alkaline digestion will release
Cr(VI) from the internal surfaces within the sediment and soil.
As well as Fe(II), OM is also important in the reduction of Cr(VI). At circumneutral pH
the reduction of Cr(VI) by DOM is not a favourable process but the reduction of Cr(VI)
by solid OM is (Kyziol et al., 2006, Löv et al., 2017). The oxic soils, have high
concentrations of OM (22.4 ± 4.7%) but Fe(II) is thermodynamically unstable and will
rapidly oxidise to Fe(III), as shown by the absence of Fe(II) in the soil porewaters
(Figure 4-10). Thus it is hypothesised that the mean rate of Cr(VI) reduction in the
banking soils will be much lower than in the sediments due to low concentrations of
Fe(II). The results of this study are consistent with such a hypothesis; in the surface
soils 18.9 ± 15% of Cr was Cr(VI) compared to 5.17 ± 1.3% in the surface sediments.
The reduction of Cr(VI) in the soils is a less favourable process due to the limited
abundance of Fe(II) and the low rate of DOM reduction at circumneutral pH.
Associations of chromium in Polmadie Burn Banking soils and sediments
Sequential extraction of Polmadie soils and sediments suggested that Cr is mainly
associated with OM and Fe/Mn oxides in both the banking soil and sediment. The
129
results from the gel electrophoretic fractionation of OM extracted from field-moist soils
and sediments further confirms that Cr present in the Polmadie banking soils and
sediments is associated with OM by the positive correlation observed between OM
and Cr in each of the fractions. This is consistent with literature which suggests that
OM complexes with Cr(III) to form stable complexes and often acts as a sink for Cr
(Kyziol et al., 2006). The association between Fe, Cr and OM shown by the gel
electrophoresis data was also seen by Löv et al. 2017 who used EXAFS to investigate
the speciation of Cr and Fe in soil and colloids. They found that Fe and Cr were not
directly bound, and they hypothesised that Cr bound to OM which coated Fe minerals
was the reason for their association (Löv et al., 2017). It is likely that this mechanism
is present in the Polmadie banking soils and sediments, explaining the positive
correlation between Cr, Fe and OM.
A study by Elzinga and Cirmo 2010 who used sequential extractions to investigate
the associations of Cr in soil found a similar distribution of Cr in COPR derived soils
when using the BCR sequential extraction procedure. This was combined with x-ray
absorption spectroscopy data which showed that Cr in their soil was present as the
mineral chromite, bound to OM and mixed Cr/Fe hydroxides (Elzinga and Cirmo,
2010). The mobility of an Cr(III) can be increased if it is bound to OM in the soil.
Elements bound to suspended or dissolved OM will increase its solubility and leads
to the supersaturation of Cr(III) in waters (Banks et al., 2006).
Another important phase that Cr is associated to in the soils and sediments was
Fe/Mn hydroxides as shown by the large proportion of Cr extracted in the reducible
fraction of the BCR sequential extraction. The reduction of Fe minerals will release
metals which are associated with these complexes and is the process which is utilised
by Step 2 in the BCR sequential extraction (Rauret et al., 1999). The sequential
extractions showed that more Cr was held in the Fe/Mn fraction in the sediments (37.5
± 3.9%) compared to the banking soils (25.9 ± 8.5). This attributed to the reduction of
Cr(VI) by Fe(II) in the sediment leading to the formation of mixed Fe/Cr hydroxide
precipitates which coat the surface of sediment particles.
The same process is not thought to be as important in the banking soils as Fe(II) is
unstable and will rapidly oxidise to form insoluble Fe(III) compounds in the soils. The
higher Fe(II) concentrations in the sediment which reduces Cr(VI) will result in a higher
proportion of Cr being found in the Fe/Mn (hydr)oxide fraction of the sequential
130
extraction. This is supported by the significantly larger proportion of total Cr occurring
as Cr(VI) in the banking soils compared to the sediments.
In banking soils, the presence of Cr(III) containing minerals from COPR, such as
brownmillerite, and other weathering products from COPR minerals may contribute to
the Cr concentrations released during the reducible step of the BCR sequential
extraction. Adsorption of Cr(VI) to soil has been shown to be a mechanism which can
lead to the immobilisation of Cr(VI), although competition for the sorption sites can
greatly reduce Cr(VI) adsorption (Rai et al., 1989, Richard and Bourg, 1991, Choppala
et al., 2018). Charged mineral surfaces, such as Al, Fe and Mn hydroxides can adsorb
anionic species and at pH 6-7 the adsorption of chromate to these Fe and Al
(hydr)oxides is a favoured process (Rai et al., 1989). This may account for some of
the Cr found in the Fe oxide phase in the soils although it is not possible from the data
here to determine its contribution to the soil Cr concentration.
In the banking soil, Cr was positively correlated with Al, Ca and Mg suggesting they
come from the same source. The main elements found in COPR are Ca, Mg, Al and
Cr which make up 18.1, 12.6, 12.0 and 4.0% (w/w) of the material, respectively
(Geelhoed et al., 2002, Hillier et al., 2003). From the sequential extraction data, the
proportion of Cr in the exchangeable fraction was 0.96 ± 0.33 and 3.72 ± 1.9% in the
soils and sediments, respectively. Although the proportion of Cr extracted in the
exchangeable fraction was low, the proportion of Ca and Mg extracted in the
exchangeable fraction was 49.8 ± 14 and 22.7 ± 7.5%, respectively. The use of acetic
acid in this step will dissolve carbonates, such as CaCO3 and MgCO3 contributing to
the high concentration of Ca and Mg in this fraction. The low proportion of Cr released
in the exchangeable step compared to Ca and Mg is likely to be due to the weathering
of COPR to form secondary minerals, such as Fe/Cr oxides, and also the
incorporation of any leached Cr into OM. Chromium(VI) held in the COPR minerals is
easily leached and therefore would be expected to be seen in Step 1 of the BCR
sequential extraction along with Ca and Mg (Geelhoed et al., 2003). In the Polmadie
soils the mean Ca concentration of 1.56 ± 0.32% was elevated compared to the mean
Glasgow soil concentrations of 0.82%. Elevated concentrations of Ca have been
found in Glasgow soils around the vicinity of the Cr chemical works due to the use of
lime in the extraction process.
As mentioned, there was a low proportion of Cr associated with the residual phase,
with 5.64 ± 4.4 and 3.87 ± 3.6% of Cr occurring in the residual phase of the soils and
131
sediments, respectively. Elements released in the residual phase are usually
associated with silicate minerals which are resistant to weathering and therefore are
likely to persist in the soils (Davidson et al., 1998). The absolute concentration of Cr
in the residual phase was 89.5 ± 58 and 108 ± 38 mg kg-1 for the banking soils and
sediments. These values were not too dissimilar to the baseline Cr concentrations in
Glasgow top soils which had a median value of 108 mg kg-1 (Fordyce, 2012). The
persistence of chromite (FeCrO3) from COPR is to be expected in the residual phase
as it is a stable mineral which is resistant to chemical weathering. This may provide a
source for of Cr extracted in the residual step of the sequential extraction, however,
due to the similar concentration of Cr in the residual phase to the baseline
concentration of Cr in Glasgow soils, the contribution of chromite to the overall Cr
concentrations in the Polmadie banking soils and sediments is not known (Elzinga
and Cirmo, 2010).
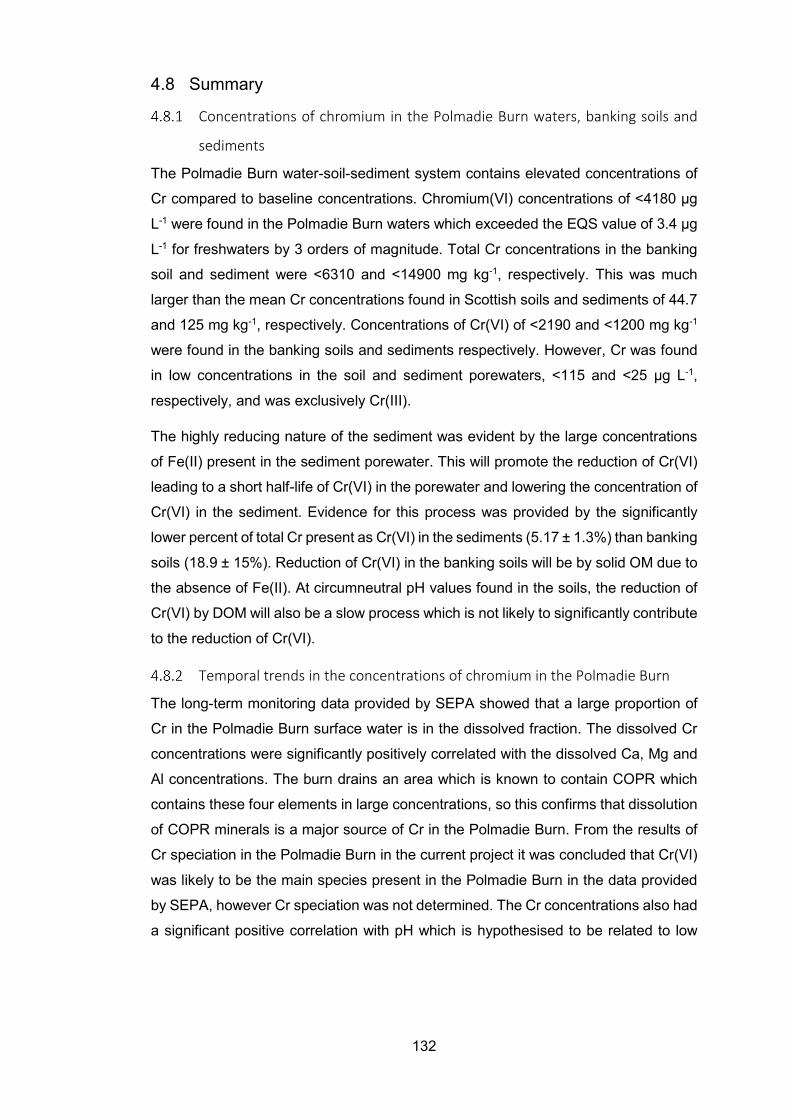
132
4.8 Summary
Concentrations of chromium in the Polmadie Burn waters, banking soils and
sediments
The Polmadie Burn water-soil-sediment system contains elevated concentrations of
Cr compared to baseline concentrations. Chromium(VI) concentrations of <4180 μg
L-1 were found in the Polmadie Burn waters which exceeded the EQS value of 3.4 µg
L-1 for freshwaters by 3 orders of magnitude. Total Cr concentrations in the banking
soil and sediment were <6310 and <14900 mg kg-1, respectively. This was much
larger than the mean Cr concentrations found in Scottish soils and sediments of 44.7
and 125 mg kg-1, respectively. Concentrations of Cr(VI) of <2190 and <1200 mg kg-1
were found in the banking soils and sediments respectively. However, Cr was found
in low concentrations in the soil and sediment porewaters, <115 and <25 µg L-1,
respectively, and was exclusively Cr(III).
The highly reducing nature of the sediment was evident by the large concentrations
of Fe(II) present in the sediment porewater. This will promote the reduction of Cr(VI)
leading to a short half-life of Cr(VI) in the porewater and lowering the concentration of
Cr(VI) in the sediment. Evidence for this process was provided by the significantly
lower percent of total Cr present as Cr(VI) in the sediments (5.17 ± 1.3%) than banking
soils (18.9 ± 15%). Reduction of Cr(VI) in the banking soils will be by solid OM due to
the absence of Fe(II). At circumneutral pH values found in the soils, the reduction of
Cr(VI) by DOM will also be a slow process which is not likely to significantly contribute
to the reduction of Cr(VI).
Temporal trends in the concentrations of chromium in the Polmadie Burn
The long-term monitoring data provided by SEPA showed that a large proportion of
Cr in the Polmadie Burn surface water is in the dissolved fraction. The dissolved Cr
concentrations were significantly positively correlated with the dissolved Ca, Mg and
Al concentrations. The burn drains an area which is known to contain COPR which
contains these four elements in large concentrations, so this confirms that dissolution
of COPR minerals is a major source of Cr in the Polmadie Burn. From the results of
Cr speciation in the Polmadie Burn in the current project it was concluded that Cr(VI)
was likely to be the main species present in the Polmadie Burn in the data provided
by SEPA, however Cr speciation was not determined. The Cr concentrations also had
a significant positive correlation with pH which is hypothesised to be related to low
133
adsorption of Cr(VI) at pH 8 leading to the increased adsorption, and therefore slight
reduction in Cr(VI) concentrations as the pH decreases.
Between 1990 and 2000 Cr concentrations in the Polmadie Burn appeared to
decrease. The mean pre-2000 total Cr concentration was 3.57 ± 2.8 mg L-1 and the
post-2000 mean Cr concentration was 2.38 ± 1.4 mg L-1. Chromium concentrations
over the period of 2010-2017 did not show any decrease and the Cr remediation
works carried out at a nearby site in 2013 has not appeared to influence the Cr
concentrations in the stream, although it is not known if the remediated area drained
into the Polmadie Burn.
Evidence of COPR in the Polmadie Burn waters, banking soils and sediments
Due to the high concentration of dissolved Cr(VI) in the Polmadie Burn and its
correlation with Ca, Mg and Al it is most likely the source of Cr is due to the dissolution
of COPR material in the stream’s catchment area. The slow dissolution kinetics of
Cr(VI) from COPR and the large amount of COPR in the area suggests it is likely that
the high streamwater Cr concentrations will persist.
From the SEM-EDS data the small discrete grains containing Ca, Mg, S and O
indicate that detrital COPR material has been transported into the sediment. The input
of COPR material into the stream is likely to be the reason for the large peak of Cr at
6-7 cm depth in sediment core 2. There was evidence of Cr in surface coatings of
quartz and feldspar minerals which indicate in situ formation of Cr/Fe precipitates. In
the soils, no direct evidence of COPR minerals was found, however there was a
significant positive correlation between soil Cr concentrations with Ca and Mg,
although these elements were extracted in different fractions of BCR sequential
extraction. There was also a significant positive correlation between Cr and OM
concentrations in the banking soils. This suggests that the COPR has been weathered
and Cr(VI) associated with the material has been leached and has formed secondary
minerals and/or been reduced then incorporated into OM.
The associations of chromium in the banking soil and sediment and the impact
on its long-term fate
Associations of Cr were investigated using BCR sequential extraction which showed
that the majority of Cr, 63 ± 9.5 and 52 ± 5%, is associated with OM in the soils and
sediments, respectively. This was confirmed by the gel electrophoresis which
confirmed a significant positive correlation between OM and Cr. The other major
134
phase was Fe hydroxides, which contained 25.0 ± 8.5 and 38.8 ± 3.9% of Cr in soils
and sediments, respectively. Little Cr was present in the exchangeable and residual
phases, again suggesting that COPR present in the material has been weathered
releasing Cr which has been incorporated into Fe/Cr hydroxides, sorbed to Fe/Mn
surfaces or incorporated into OM.
The formation of mixed Fe/Cr hydroxides, as hypothesised to be happening in the
sediments, results in the formation of stable insoluble compounds resulting in the
immobilisation of Cr. Literature suggests that formation Cr-OM complexes are stable
but the lability of the OM can influence the mobility of Cr bound to OM. The next
chapter will investigate the leachable concentrations of Cr from banking soils and
sediments to investigate its mobility.
135
5 Mobility of chromium in the Polmadie Burn banking soils and
bottom sediments under changing environmental conditions
5.1 Overview and chapter structure Chapter 3 demonstrated that: (i) both banking soils and bottom sediments contained
elevated concentrations not only of total Cr but also Cr(VI); and (ii) in both banking
soils and bottom sediments, a large proportion of Cr was associated with OM and
most of the remainder was associated with Fe/Mn oxides. There were, however,
distinct differences between the soil and sedimentary environments, namely: (i) OM
content, which was approximately a factor of 2 higher in soils; (ii) pH which was about
0.5 units higher in the sediment; (iii) redox conditions, which were typically strongly
reducing in the sediments but oxidising in the soils. These differences may mean that
the soils and sediments respond differently to environmental changes, e.g. prolonged
dry periods followed by intense wet periods. Such scenarios are likely to be of wide
global relevance over coming decades due to climate change. However, these may
have imminent local significance for the behaviour of Cr at the Polmadie Burn site
because of the proposed diversion of waters as part of two schemes:
(i) the culverting and diversion of the West Burn to avoid the Cr-waste contaminated
area. This scheme is in progress but has not been switched on yet (SEPA Pers.
comm.).
(ii) a further scheme that is being considered is the realignment of the Richmond Park
Combined Sewer Overflow (CSO) which joins the Polmadie burn at the north end of
the culverted section. The plan is to screen and reroute the discharge so that it directly
discharges into the Clyde which will reduce the water flow in the Polmadie Burn
(SEPA Pers. Comm.,).
Both the West Burn and the Richmond Park CSO are connected to the Polmadie Burn
and so diversion of water through these new schemes will reduce water flow and lead
to increased exposure of banking soils and bottom sediments, especially in warmer
summer periods in the Polmadie Burn. There are concerns about the impact of the
lower flow and increased sediment exposure to oxygenated conditions on Cr mobility.
This chapter considers these issues and will start with a focused review of the
literature on impacts of wetting and drying cycles on Cr speciation and mobility in
contrasting environmental settings. Thereafter, the results for a series of laboratory

136
experiments investigating the changes in leachable Cr concentrations as banking soil
and bottom sediments dry over different time periods will be presented. This will be
followed by discussion on the likely impacts of wet/dry cycles on the release of Cr(VI)
from Polmadie Burn banking soils and bottom sediments to the burn waters which
flow into the River Clyde. Following the discussion on drying, the sorption of Cr to soil
during periods of flooding during heavy periods of rain, should the proposed water
diversion schemes not go ahead, is considered by simulating the loading of Cr(VI) to
soils through a series of batch experiments.
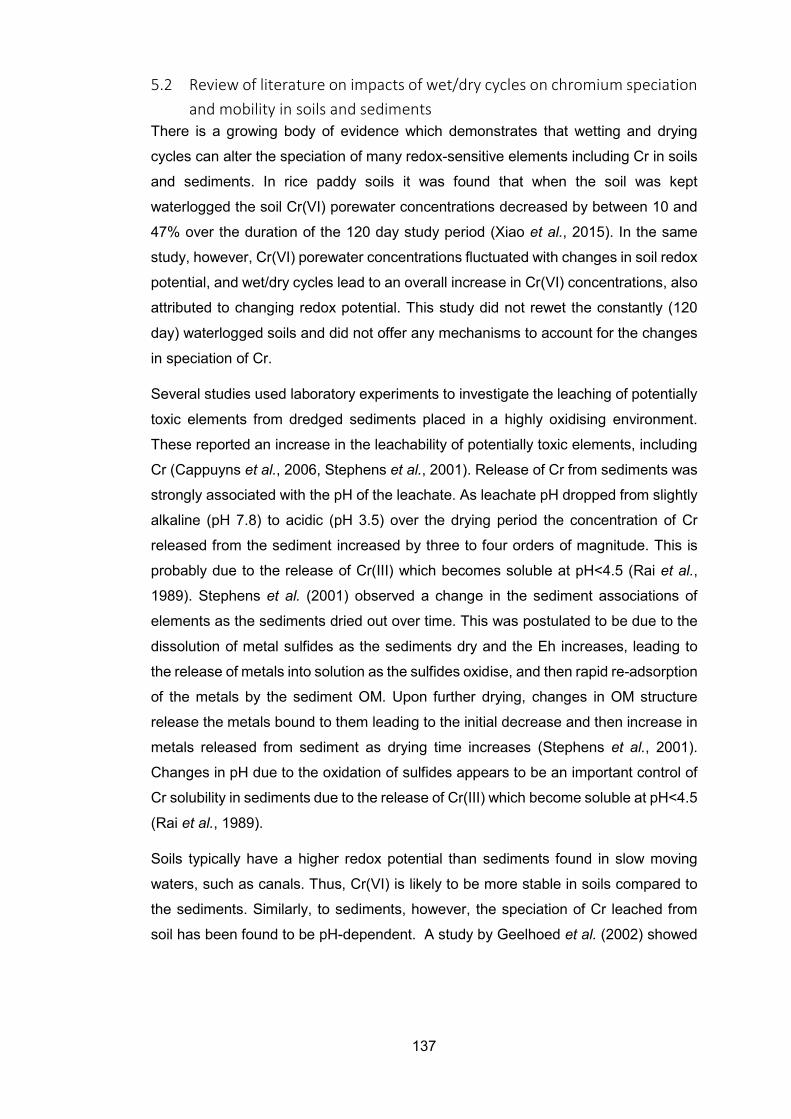
137
5.2 Review of literature on impacts of wet/dry cycles on chromium speciation and mobility in soils and sediments
There is a growing body of evidence which demonstrates that wetting and drying
cycles can alter the speciation of many redox-sensitive elements including Cr in soils
and sediments. In rice paddy soils it was found that when the soil was kept
waterlogged the soil Cr(VI) porewater concentrations decreased by between 10 and
47% over the duration of the 120 day study period (Xiao et al., 2015). In the same
study, however, Cr(VI) porewater concentrations fluctuated with changes in soil redox
potential, and wet/dry cycles lead to an overall increase in Cr(VI) concentrations, also
attributed to changing redox potential. This study did not rewet the constantly (120
day) waterlogged soils and did not offer any mechanisms to account for the changes
in speciation of Cr.
Several studies used laboratory experiments to investigate the leaching of potentially
toxic elements from dredged sediments placed in a highly oxidising environment.
These reported an increase in the leachability of potentially toxic elements, including
Cr (Cappuyns et al., 2006, Stephens et al., 2001). Release of Cr from sediments was
strongly associated with the pH of the leachate. As leachate pH dropped from slightly
alkaline (pH 7.8) to acidic (pH 3.5) over the drying period the concentration of Cr
released from the sediment increased by three to four orders of magnitude. This is
probably due to the release of Cr(III) which becomes soluble at pH<4.5 (Rai et al.,
1989). Stephens et al. (2001) observed a change in the sediment associations of
elements as the sediments dried out over time. This was postulated to be due to the
dissolution of metal sulfides as the sediments dry and the Eh increases, leading to
the release of metals into solution as the sulfides oxidise, and then rapid re-adsorption
of the metals by the sediment OM. Upon further drying, changes in OM structure
release the metals bound to them leading to the initial decrease and then increase in
metals released from sediment as drying time increases (Stephens et al., 2001).
Changes in pH due to the oxidation of sulfides appears to be an important control of
Cr solubility in sediments due to the release of Cr(III) which become soluble at pH<4.5
(Rai et al., 1989).
Soils typically have a higher redox potential than sediments found in slow moving
waters, such as canals. Thus, Cr(VI) is likely to be more stable in soils compared to
the sediments. Similarly, to sediments, however, the speciation of Cr leached from
soil has been found to be pH-dependent. A study by Geelhoed et al. (2002) showed
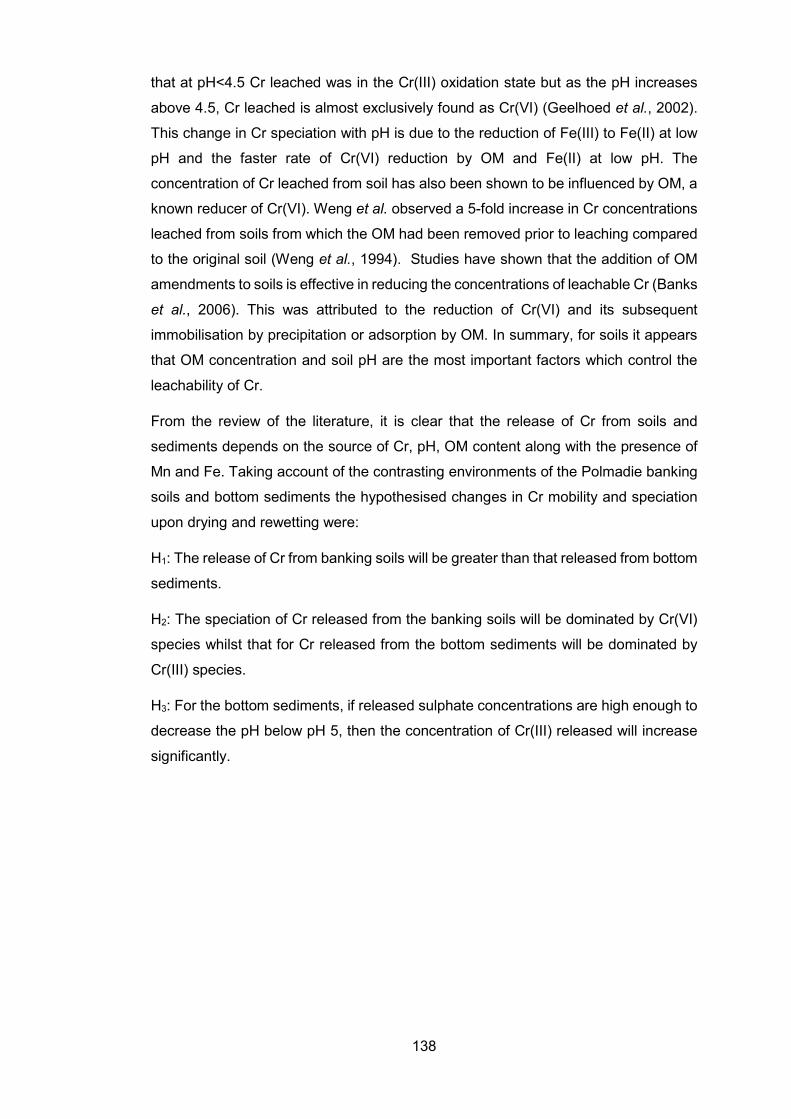
138
that at pH<4.5 Cr leached was in the Cr(III) oxidation state but as the pH increases
above 4.5, Cr leached is almost exclusively found as Cr(VI) (Geelhoed et al., 2002).
This change in Cr speciation with pH is due to the reduction of Fe(III) to Fe(II) at low
pH and the faster rate of Cr(VI) reduction by OM and Fe(II) at low pH. The
concentration of Cr leached from soil has also been shown to be influenced by OM, a
known reducer of Cr(VI). Weng et al. observed a 5-fold increase in Cr concentrations
leached from soils from which the OM had been removed prior to leaching compared
to the original soil (Weng et al., 1994). Studies have shown that the addition of OM
amendments to soils is effective in reducing the concentrations of leachable Cr (Banks
et al., 2006). This was attributed to the reduction of Cr(VI) and its subsequent
immobilisation by precipitation or adsorption by OM. In summary, for soils it appears
that OM concentration and soil pH are the most important factors which control the
leachability of Cr.
From the review of the literature, it is clear that the release of Cr from soils and
sediments depends on the source of Cr, pH, OM content along with the presence of
Mn and Fe. Taking account of the contrasting environments of the Polmadie banking
soils and bottom sediments the hypothesised changes in Cr mobility and speciation
upon drying and rewetting were:
H1: The release of Cr from banking soils will be greater than that released from bottom
sediments.
H2: The speciation of Cr released from the banking soils will be dominated by Cr(VI)
species whilst that for Cr released from the bottom sediments will be dominated by
Cr(III) species.
H3: For the bottom sediments, if released sulphate concentrations are high enough to
decrease the pH below pH 5, then the concentration of Cr(III) released will increase
significantly.
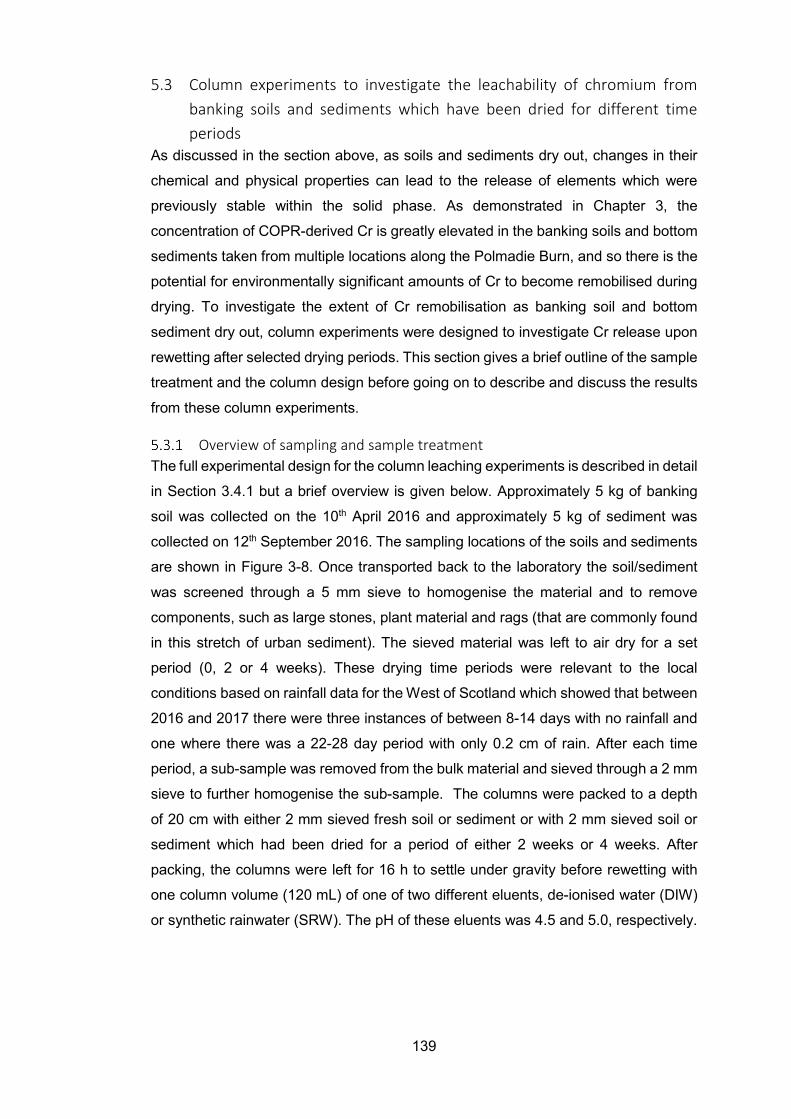
139
5.3 Column experiments to investigate the leachability of chromium from banking soils and sediments which have been dried for different time periods
As discussed in the section above, as soils and sediments dry out, changes in their
chemical and physical properties can lead to the release of elements which were
previously stable within the solid phase. As demonstrated in Chapter 3, the
concentration of COPR-derived Cr is greatly elevated in the banking soils and bottom
sediments taken from multiple locations along the Polmadie Burn, and so there is the
potential for environmentally significant amounts of Cr to become remobilised during
drying. To investigate the extent of Cr remobilisation as banking soil and bottom
sediment dry out, column experiments were designed to investigate Cr release upon
rewetting after selected drying periods. This section gives a brief outline of the sample
treatment and the column design before going on to describe and discuss the results
from these column experiments.
Overview of sampling and sample treatment The full experimental design for the column leaching experiments is described in detail
in Section 3.4.1 but a brief overview is given below. Approximately 5 kg of banking
soil was collected on the 10th April 2016 and approximately 5 kg of sediment was
collected on 12th September 2016. The sampling locations of the soils and sediments
are shown in Figure 3-8. Once transported back to the laboratory the soil/sediment
was screened through a 5 mm sieve to homogenise the material and to remove
components, such as large stones, plant material and rags (that are commonly found
in this stretch of urban sediment). The sieved material was left to air dry for a set
period (0, 2 or 4 weeks). These drying time periods were relevant to the local
conditions based on rainfall data for the West of Scotland which showed that between
2016 and 2017 there were three instances of between 8-14 days with no rainfall and
one where there was a 22-28 day period with only 0.2 cm of rain. After each time
period, a sub-sample was removed from the bulk material and sieved through a 2 mm
sieve to further homogenise the sub-sample. The columns were packed to a depth
of 20 cm with either 2 mm sieved fresh soil or sediment or with 2 mm sieved soil or
sediment which had been dried for a period of either 2 weeks or 4 weeks. After
packing, the columns were left for 16 h to settle under gravity before rewetting with
one column volume (120 mL) of one of two different eluents, de-ionised water (DIW)
or synthetic rainwater (SRW). The pH of these eluents was 4.5 and 5.0, respectively.
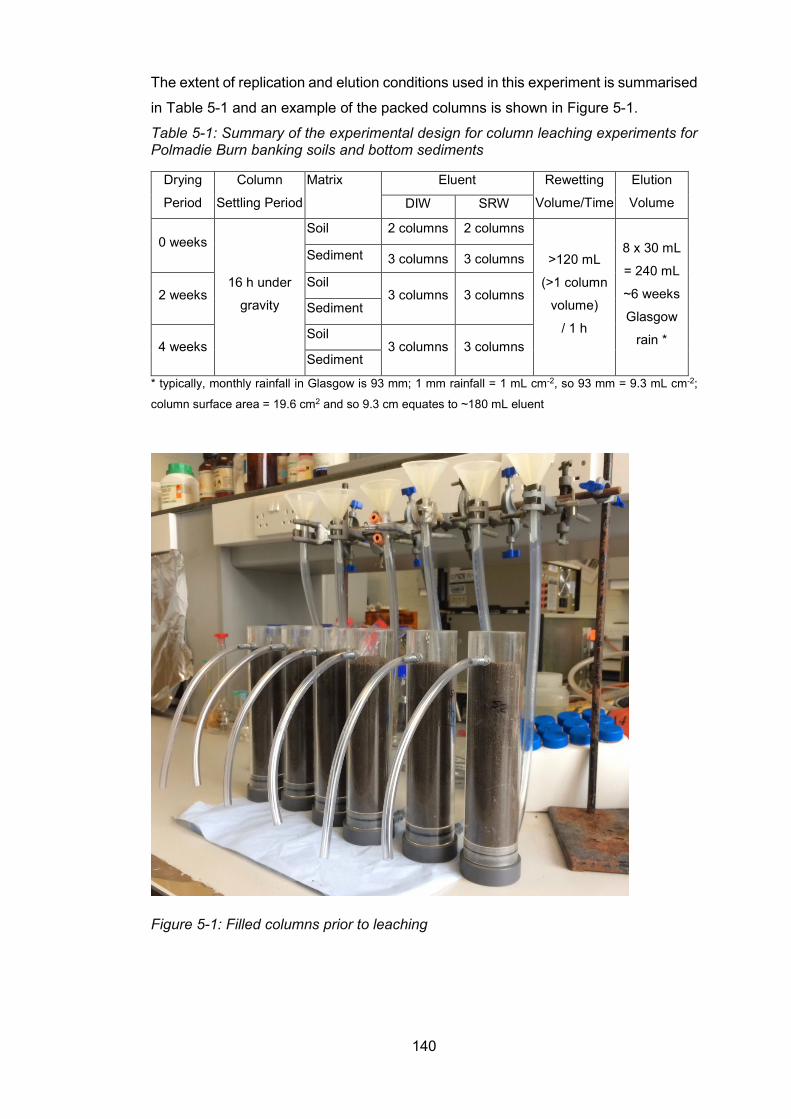
140
The extent of replication and elution conditions used in this experiment is summarised
in Table 5-1 and an example of the packed columns is shown in Figure 5-1.
Table 5-1: Summary of the experimental design for column leaching experiments for Polmadie Burn banking soils and bottom sediments
Drying
Period
Column
Settling Period
Matrix Eluent Rewetting
Volume/Time
Elution
Volume DIW SRW
0 weeks
16 h under
gravity
Soil 2 columns 2 columns
>120 mL
(>1 column
volume)
/ 1 h
8 x 30 mL
= 240 mL
~6 weeks
Glasgow
rain *
Sediment 3 columns 3 columns
2 weeks Soil
3 columns 3 columns Sediment
4 weeks Soil
3 columns 3 columns Sediment
* typically, monthly rainfall in Glasgow is 93 mm; 1 mm rainfall = 1 mL cm-2, so 93 mm = 9.3 mL cm-2;
column surface area = 19.6 cm2 and so 9.3 cm equates to ~180 mL eluent
Figure 5-1: Filled columns prior to leaching
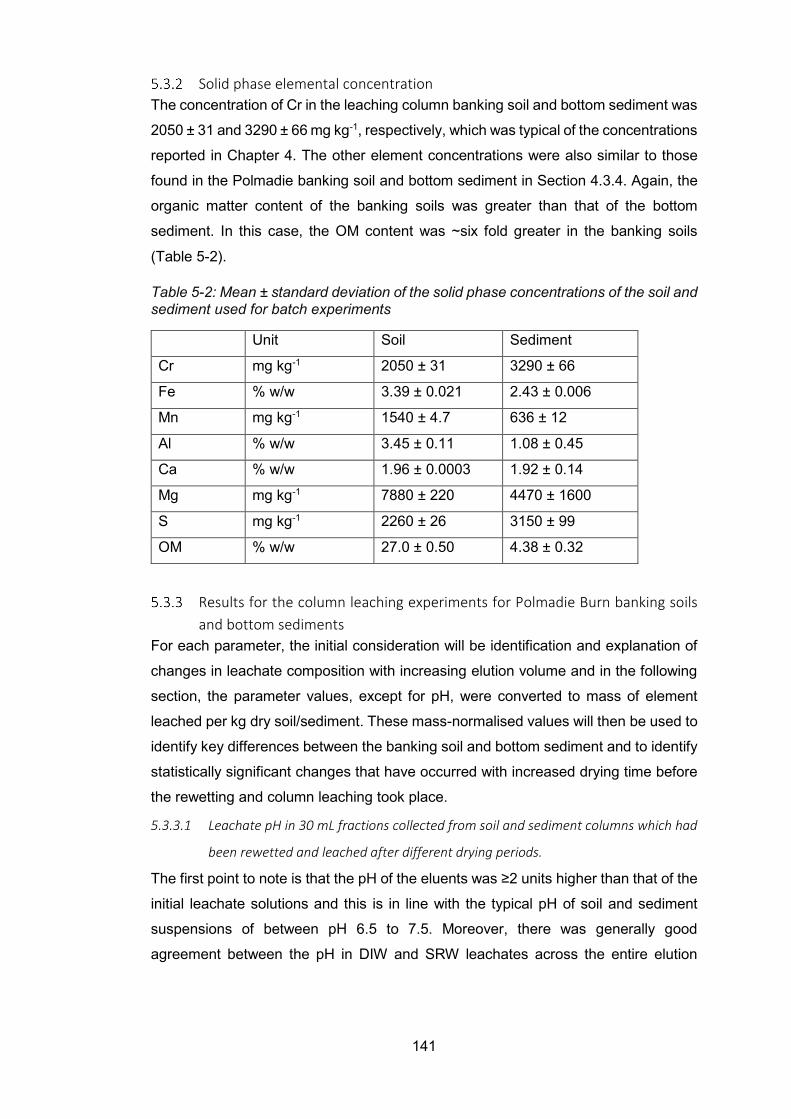
141
Solid phase elemental concentration The concentration of Cr in the leaching column banking soil and bottom sediment was
2050 ± 31 and 3290 ± 66 mg kg-1, respectively, which was typical of the concentrations
reported in Chapter 4. The other element concentrations were also similar to those
found in the Polmadie banking soil and bottom sediment in Section 4.3.4. Again, the
organic matter content of the banking soils was greater than that of the bottom
sediment. In this case, the OM content was ~six fold greater in the banking soils
(Table 5-2).
Table 5-2: Mean ± standard deviation of the solid phase concentrations of the soil and sediment used for batch experiments
Unit Soil Sediment
Cr mg kg-1 2050 ± 31 3290 ± 66
Fe % w/w 3.39 ± 0.021 2.43 ± 0.006
Mn mg kg-1 1540 ± 4.7 636 ± 12
Al % w/w 3.45 ± 0.11 1.08 ± 0.45
Ca % w/w 1.96 ± 0.0003 1.92 ± 0.14
Mg mg kg-1 7880 ± 220 4470 ± 1600
S mg kg-1 2260 ± 26 3150 ± 99
OM % w/w 27.0 ± 0.50 4.38 ± 0.32
Results for the column leaching experiments for Polmadie Burn banking soils and bottom sediments
For each parameter, the initial consideration will be identification and explanation of
changes in leachate composition with increasing elution volume and in the following
section, the parameter values, except for pH, were converted to mass of element
leached per kg dry soil/sediment. These mass-normalised values will then be used to
identify key differences between the banking soil and bottom sediment and to identify
statistically significant changes that have occurred with increased drying time before
the rewetting and column leaching took place.
5.3.3.1 Leachate pH in 30 mL fractions collected from soil and sediment columns which had
been rewetted and leached after different drying periods.
The first point to note is that the pH of the eluents was ≥2 units higher than that of the
initial leachate solutions and this is in line with the typical pH of soil and sediment
suspensions of between pH 6.5 to 7.5. Moreover, there was generally good
agreement between the pH in DIW and SRW leachates across the entire elution
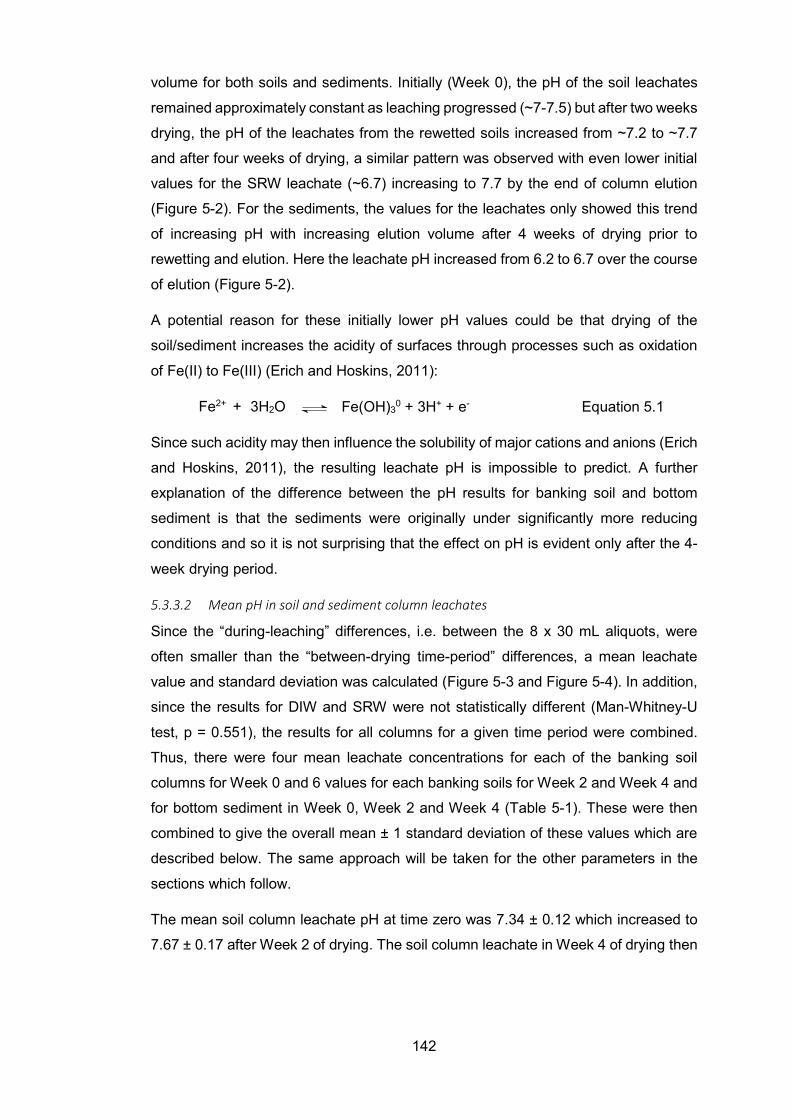
142
volume for both soils and sediments. Initially (Week 0), the pH of the soil leachates
remained approximately constant as leaching progressed (~7-7.5) but after two weeks
drying, the pH of the leachates from the rewetted soils increased from ~7.2 to ~7.7
and after four weeks of drying, a similar pattern was observed with even lower initial
values for the SRW leachate (~6.7) increasing to 7.7 by the end of column elution
(Figure 5-2). For the sediments, the values for the leachates only showed this trend
of increasing pH with increasing elution volume after 4 weeks of drying prior to
rewetting and elution. Here the leachate pH increased from 6.2 to 6.7 over the course
of elution (Figure 5-2).
A potential reason for these initially lower pH values could be that drying of the
soil/sediment increases the acidity of surfaces through processes such as oxidation
of Fe(II) to Fe(III) (Erich and Hoskins, 2011):
Fe2+ + 3H2O Fe(OH)30 + 3H+ + e- Equation 5.1
Since such acidity may then influence the solubility of major cations and anions (Erich
and Hoskins, 2011), the resulting leachate pH is impossible to predict. A further
explanation of the difference between the pH results for banking soil and bottom
sediment is that the sediments were originally under significantly more reducing
conditions and so it is not surprising that the effect on pH is evident only after the 4-
week drying period.
5.3.3.2 Mean pH in soil and sediment column leachates
Since the “during-leaching” differences, i.e. between the 8 x 30 mL aliquots, were
often smaller than the “between-drying time-period” differences, a mean leachate
value and standard deviation was calculated (Figure 5-3 and Figure 5-4). In addition,
since the results for DIW and SRW were not statistically different (Man-Whitney-U
test, p = 0.551), the results for all columns for a given time period were combined.
Thus, there were four mean leachate concentrations for each of the banking soil
columns for Week 0 and 6 values for each banking soils for Week 2 and Week 4 and
for bottom sediment in Week 0, Week 2 and Week 4 (Table 5-1). These were then
combined to give the overall mean ± 1 standard deviation of these values which are
described below. The same approach will be taken for the other parameters in the
sections which follow.
The mean soil column leachate pH at time zero was 7.34 ± 0.12 which increased to
7.67 ± 0.17 after Week 2 of drying. The soil column leachate in Week 4 of drying then

143
decreased to 7.37 ± 0.28. The initial sediment column leachate at Week 0 was 7.80
± 0.11 was significantly higher than that for the soil column leachates (Mann-Whitney
test, p<0.01). After the two-week drying period, however, unlike soils the sediment pH
decreased to 7.68 ± 0.21 which was similar to the soil pH at Week 2. After the four-
week drying period the sediment column leachate pH, like the soil pH, decreased to
7.29 ± 0.27 (Figure 5-5).
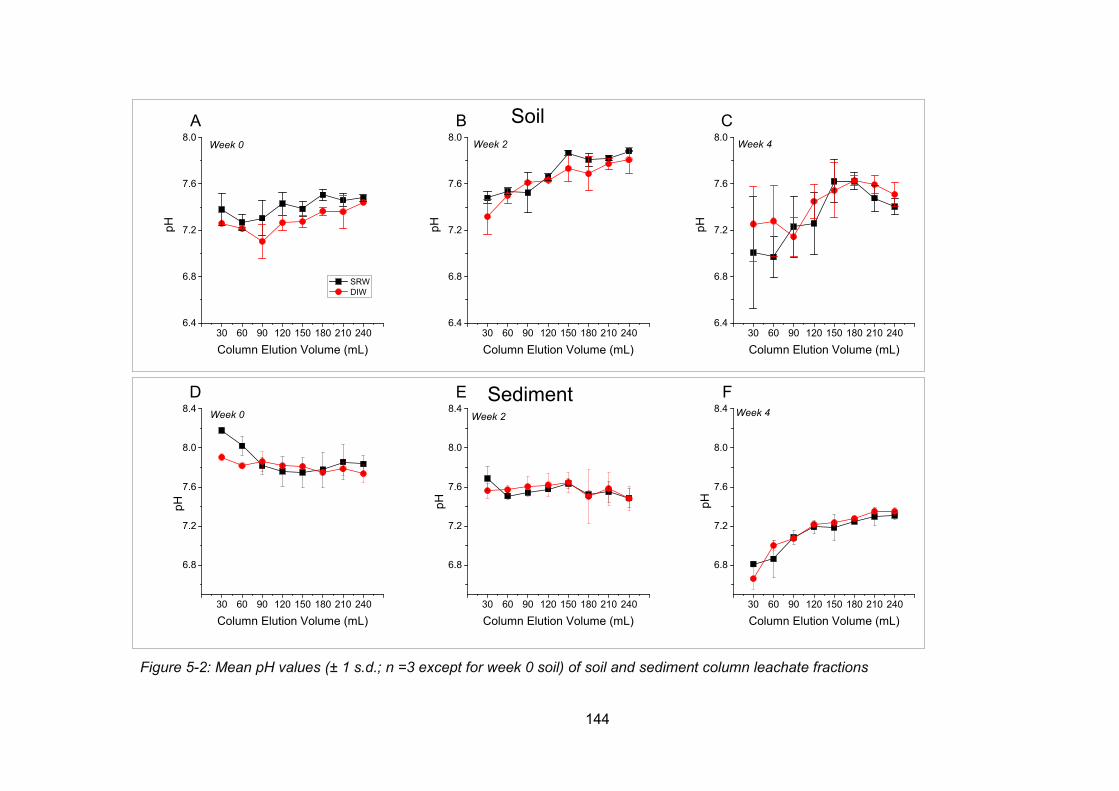
144
Figure 5-2: Mean pH values (± 1 s.d.; n =3 except for week 0 soil) of soil and sediment column leachate fractions
30 60 90 120 150 180 210 2406.4
6.8
7.2
7.6
8.0
30 60 90 120 150 180 210 2406.4
6.8
7.2
7.6
8.0
30 60 90 120 150 180 210 2406.4
6.8
7.2
7.6
8.0
30 60 90 120 150 180 210 240
6.8
7.2
7.6
8.0
8.4
30 60 90 120 150 180 210 240
6.8
7.2
7.6
8.0
8.4
30 60 90 120 150 180 210 240
6.8
7.2
7.6
8.0
8.4
pH
Column Elution Volume (mL)
SRW DIW
A
Sediment
SoilWeek 0
pH
Column Elution Volume (mL)
B
pHpH
Column Elution Volume (mL)
C
pH
Week 0
Column Elution Volume (mL)
D
Week 4Week 2
Week 2 Week 4
pH
Column Elution Volume (mL)
E
Column Elution Volume (mL)
F
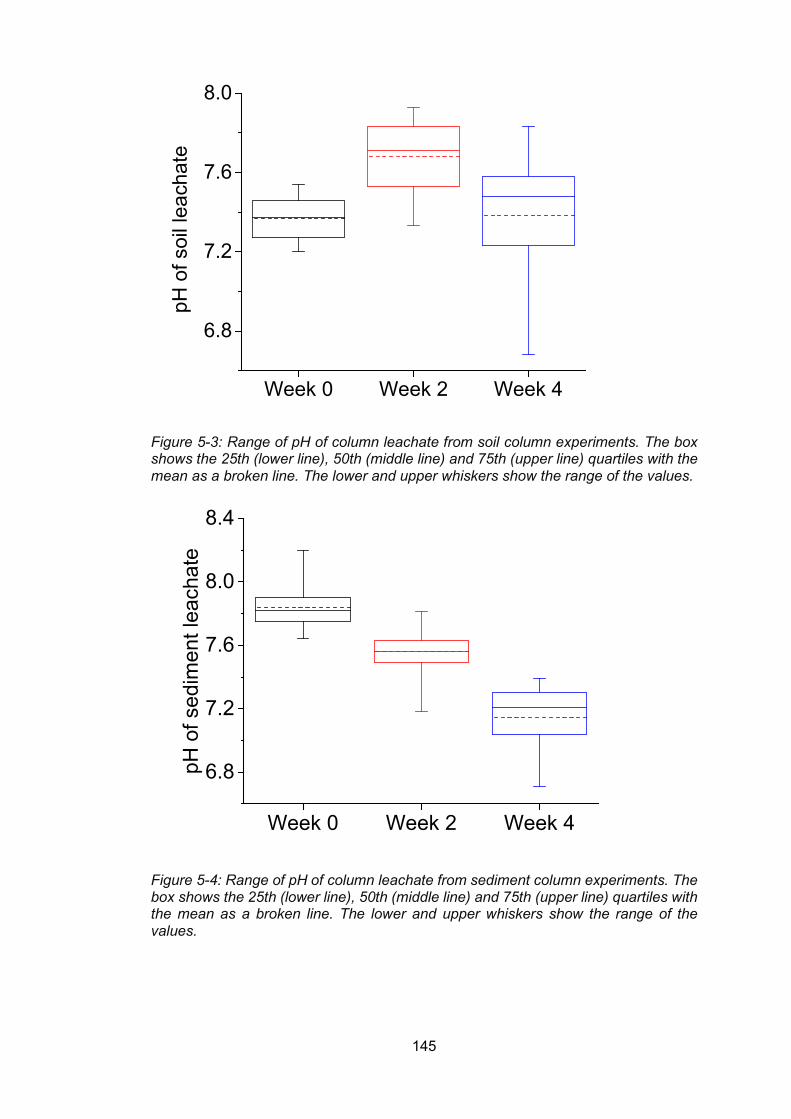
145
Figure 5-3: Range of pH of column leachate from soil column experiments. The box shows the 25th (lower line), 50th (middle line) and 75th (upper line) quartiles with the mean as a broken line. The lower and upper whiskers show the range of the values.
Figure 5-4: Range of pH of column leachate from sediment column experiments. The box shows the 25th (lower line), 50th (middle line) and 75th (upper line) quartiles with the mean as a broken line. The lower and upper whiskers show the range of the values.
Week 0 Week 2 Week 4
6.8
7.2
7.6
8.0
pH o
f soi
l lea
chat
e
Week 0 Week 2 Week 4
6.8
7.2
7.6
8.0
8.4
pH o
f sed
imen
t lea
chat
e
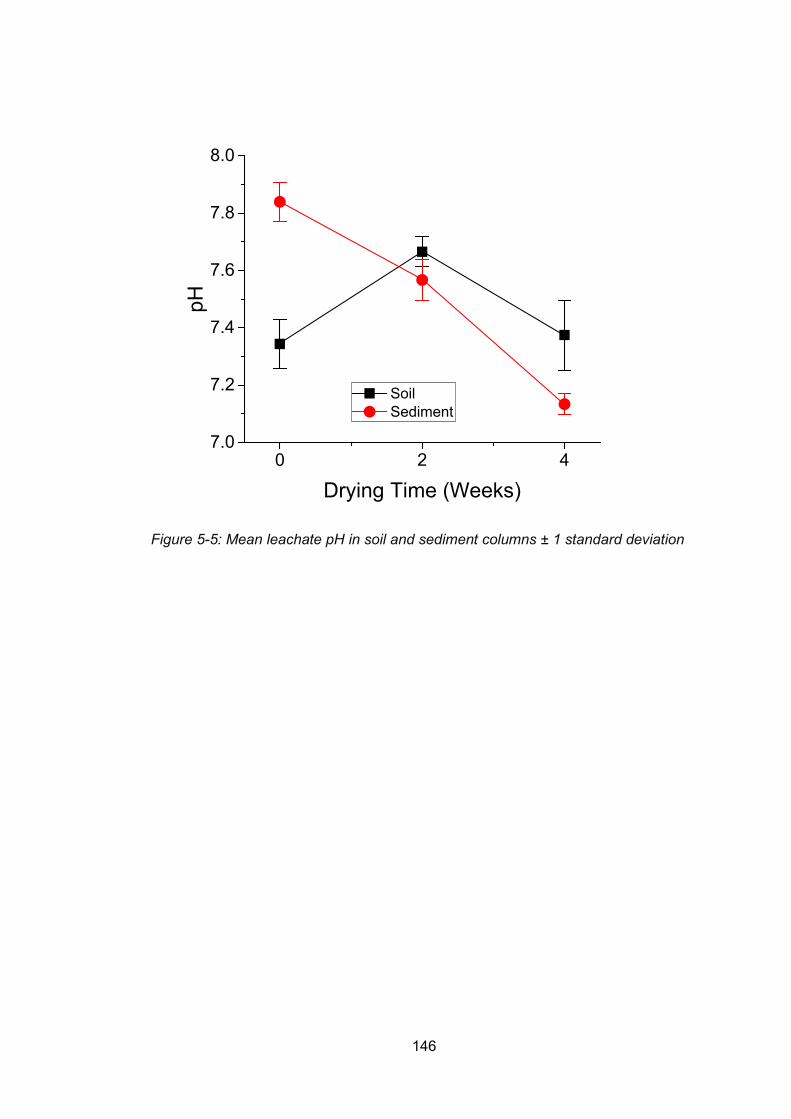
146
Figure 5-5: Mean leachate pH in soil and sediment columns ± 1 standard deviation
0 2 47.0
7.2
7.4
7.6
7.8
8.0
pH
Drying Time (Weeks)
Soil Sediment
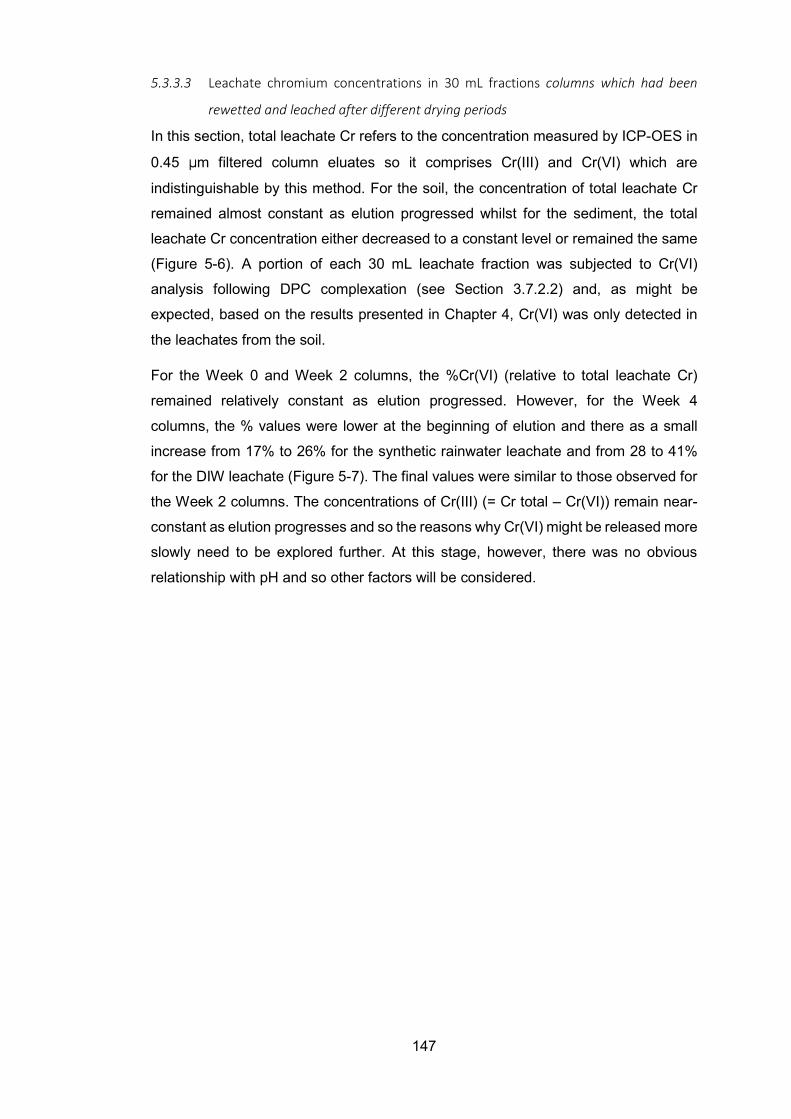
147
5.3.3.3 Leachate chromium concentrations in 30 mL fractions columns which had been
rewetted and leached after different drying periods
In this section, total leachate Cr refers to the concentration measured by ICP-OES in
0.45 µm filtered column eluates so it comprises Cr(III) and Cr(VI) which are
indistinguishable by this method. For the soil, the concentration of total leachate Cr
remained almost constant as elution progressed whilst for the sediment, the total
leachate Cr concentration either decreased to a constant level or remained the same
(Figure 5-6). A portion of each 30 mL leachate fraction was subjected to Cr(VI)
analysis following DPC complexation (see Section 3.7.2.2) and, as might be
expected, based on the results presented in Chapter 4, Cr(VI) was only detected in
the leachates from the soil.
For the Week 0 and Week 2 columns, the %Cr(VI) (relative to total leachate Cr)
remained relatively constant as elution progressed. However, for the Week 4
columns, the % values were lower at the beginning of elution and there as a small
increase from 17% to 26% for the synthetic rainwater leachate and from 28 to 41%
for the DIW leachate (Figure 5-7). The final values were similar to those observed for
the Week 2 columns. The concentrations of Cr(III) (= Cr total – Cr(VI)) remain near-
constant as elution progresses and so the reasons why Cr(VI) might be released more
slowly need to be explored further. At this stage, however, there was no obvious
relationship with pH and so other factors will be considered.
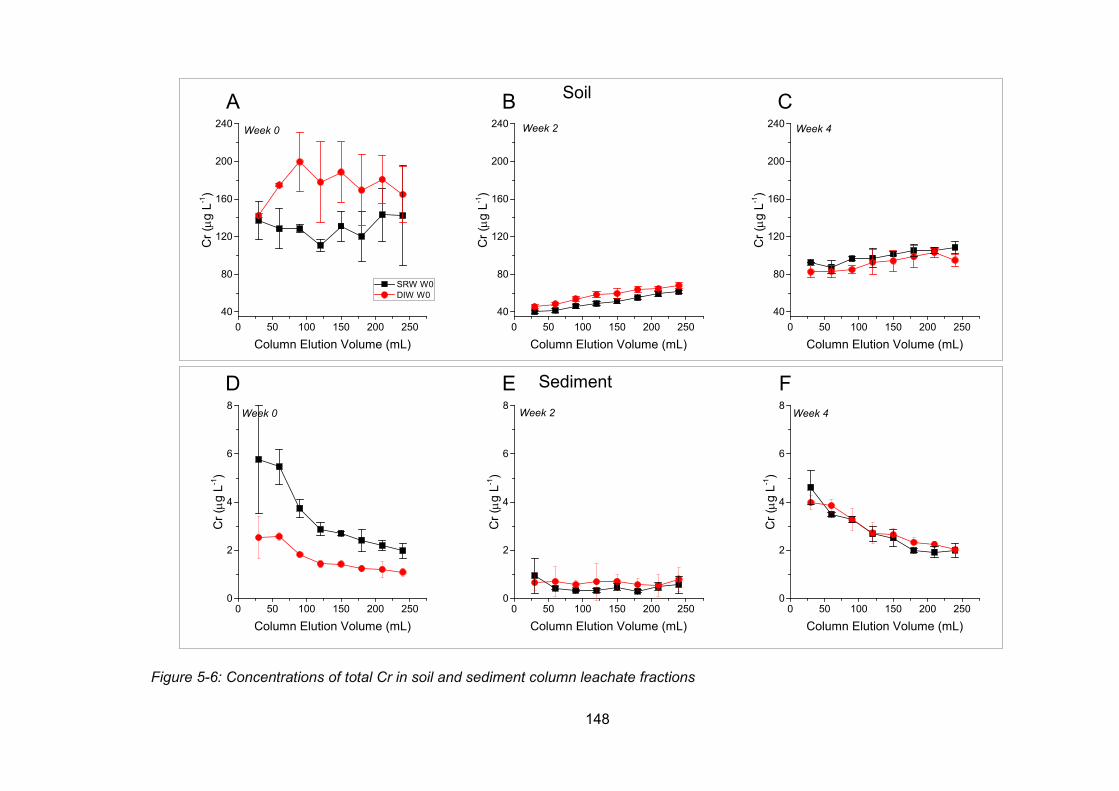
148
Figure 5-6: Concentrations of total Cr in soil and sediment column leachate fractions
0 50 100 150 200 25040
80
120
160
200
240
0 50 100 150 200 25040
80
120
160
200
240
0 50 100 150 200 25040
80
120
160
200
240
0 50 100 150 200 2500
2
4
6
8
0 50 100 150 200 2500
2
4
6
8
0 50 100 150 200 2500
2
4
6
8
Cr (µg
L-1)
Column Elution Volume (mL)
A
Week 0 Week 2
Sediment
Soil
Week 4
Week 0 Week 2 Week 4
Cr (µg
L-1)
Column Elution Volume (mL)
B
Cr (µg
L-1)
Column Elution Volume (mL)
C
Cr (µg
L-1)
Column Elution Volume (mL)
SRW W0 DIW W0
D
Cr (µg
L-1)
Column Elution Volume (mL)
E
Cr (µg
L-1)
Column Elution Volume (mL)
F
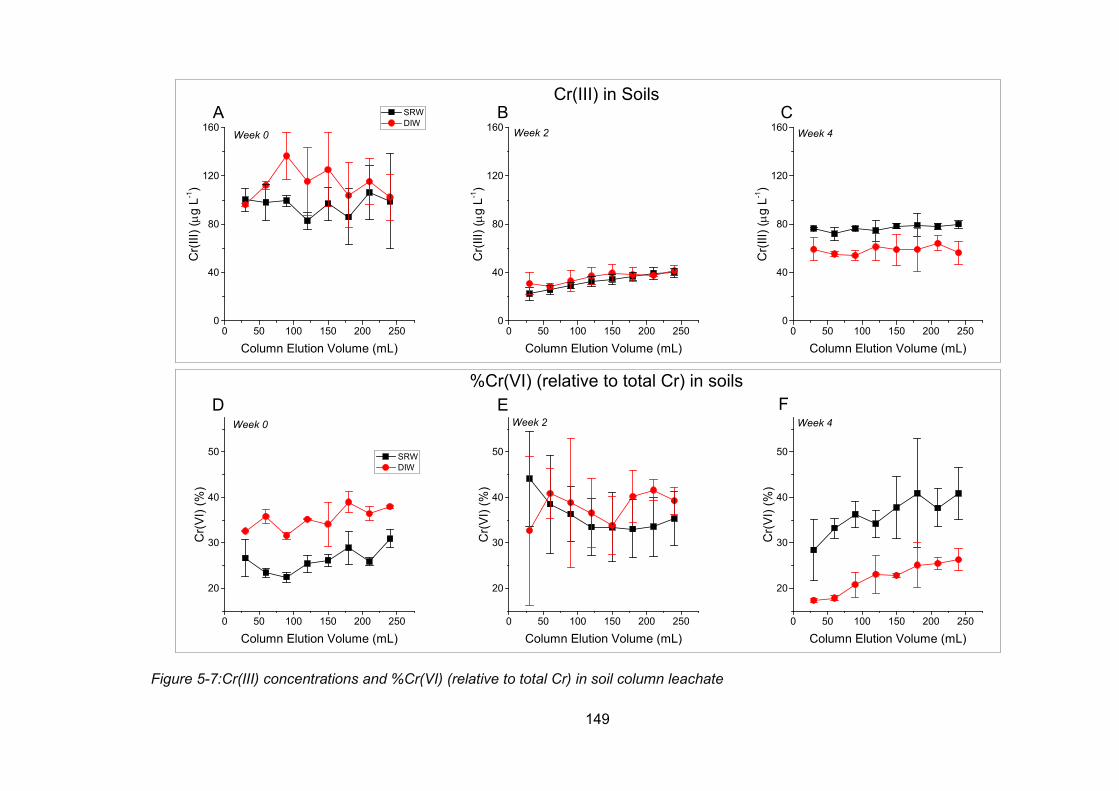
149
Figure 5-7:Cr(III) concentrations and %Cr(VI) (relative to total Cr) in soil column leachate
0 50 100 150 200 2500
40
80
120
160
0 50 100 150 200 2500
40
80
120
160
0 50 100 150 200 2500
40
80
120
160
0 50 100 150 200 250
20
30
40
50
0 50 100 150 200 250
20
30
40
50
0 50 100 150 200 250
20
30
40
50
Cr(I
II) (µ
g L-1
)
Column Elution Volume (mL)
SRW DIW
AWeek 4Week 2Week 0
Cr(I
II) (µ
g L-1
)
Column Elution Volume (mL)
B
Cr(I
II) (µ
g L-1
)
Column Elution Volume (mL)
C
SRW DIW
Cr(V
I) (%
)
Column Elution Volume (mL)
DWeek 4Week 2Week 0
Cr(V
I) (%
)
Column Elution Volume (mL)
E
Cr(V
I) (%
)
Column Elution Volume (mL)
F
Cr(III) in Soils
%Cr(VI) (relative to total Cr) in soils
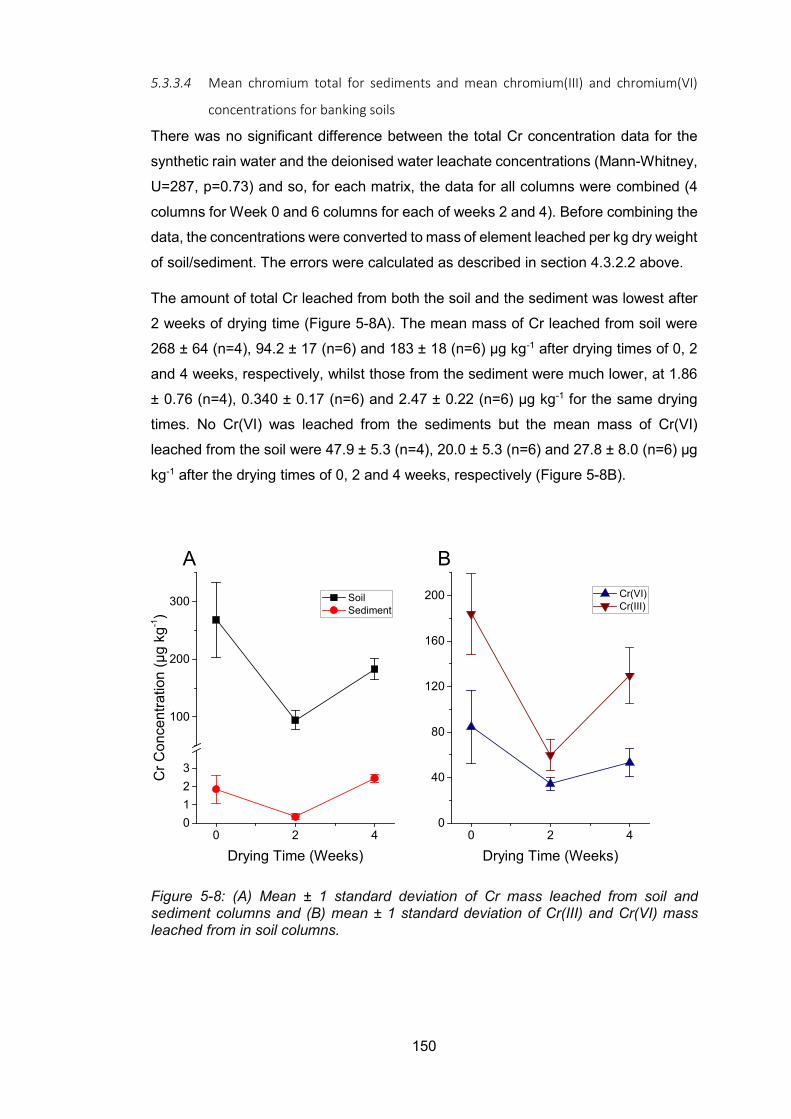
150
5.3.3.4 Mean chromium total for sediments and mean chromium(III) and chromium(VI)
concentrations for banking soils
There was no significant difference between the total Cr concentration data for the
synthetic rain water and the deionised water leachate concentrations (Mann-Whitney,
U=287, p=0.73) and so, for each matrix, the data for all columns were combined (4
columns for Week 0 and 6 columns for each of weeks 2 and 4). Before combining the
data, the concentrations were converted to mass of element leached per kg dry weight
of soil/sediment. The errors were calculated as described in section 4.3.2.2 above.
The amount of total Cr leached from both the soil and the sediment was lowest after
2 weeks of drying time (Figure 5-8A). The mean mass of Cr leached from soil were
268 ± 64 (n=4), 94.2 ± 17 (n=6) and 183 ± 18 (n=6) µg kg-1 after drying times of 0, 2
and 4 weeks, respectively, whilst those from the sediment were much lower, at 1.86
± 0.76 (n=4), 0.340 ± 0.17 (n=6) and 2.47 ± 0.22 (n=6) µg kg-1 for the same drying
times. No Cr(VI) was leached from the sediments but the mean mass of Cr(VI)
leached from the soil were 47.9 ± 5.3 (n=4), 20.0 ± 5.3 (n=6) and 27.8 ± 8.0 (n=6) µg
kg-1 after the drying times of 0, 2 and 4 weeks, respectively (Figure 5-8B).
0 2 40123
100
200
300
0 2 40
40
80
120
160
200
Cr C
once
ntra
tion
(µg
kg-1)
Drying Time (Weeks)
Soil Sediment
A
Drying Time (Weeks)
Cr(VI) Cr(III)
B
Figure 5-8: (A) Mean ± 1 standard deviation of Cr mass leached from soil and sediment columns and (B) mean ± 1 standard deviation of Cr(III) and Cr(VI) mass leached from in soil columns.
151
5.3.3.5 Iron, manganese and aluminium concentrations in 30 mL leachates from soil and
sediment columns which had been rewetted and leached after different drying
periods
In the Week 0 columns, the soil leachate Fe concentrations were in the range ~1600-
3000 µg L-1 (equivalent to 28.6-53.6 µM). The concentrations were typically higher
and increased more rapidly when DIW was used to leach the columns. For the
sediment columns, the reverse trend was true and SRW released more Fe compared
with DIW (Figure 5-9). The concentrations were typically higher and increased more
rapidly as elution progressed when DIW was used to leach the columns. The trend
was also different with decreasing Fe concentrations towards the end of the column
elution. As for the Week 0 columns, the Fe concentrations leached from the Week 2
soil columns increased as elution progressed whilst those for the sediment columns
decreased. There was little difference between the results obtained using the two
leaching solutions, DIW and SRW. For the Week 4 soil columns, there was a very
slight increase in leachate Fe concentrations as elution progressed but almost no
change for the sediment columns. There was very good agreement between the DIW
and SRW leachate data for both soil and sediment columns in the Week 4 column.
There was no obvious relation between total Cr or %Cr(VI) and Fe concentration in
leachates as between Weeks 0, 2 and 4. Although both %Cr(VI) and Fe concentration
did increase slightly for the Week 4 soil columns, there was a more substantial
increase with increasing elution volume for the Week 2 columns but this was not
accompanied by an increase in %Cr(VI). For the Week 4 data, if a relationship
between %Cr(VI) and Fe were to be invoked, it would most likely be caused by
dissolution of Fe phases to which Cr(VI) was adsorbed rather than by an oxidation
(Cr(III)/Cr(VI))/reduction (Fe(III)/Fe(II)) mechanism since only Mn(IV) has been shown
to be capable of Cr(III) oxidation in natural systems (Fandeur et al., 2009).
The trends for Mn concentration in soil and sediment leachates appear quite similar
to those described above for Fe (Figure 5-10). The relationship between Mn and Fe
is quite different for the soil compared with the sediment leachates. For the soil, there
was no single relationship to describe the Mn and Fe data over all time periods whilst
for the sediment, there was a significant strong positive correlation (Spearman’s rank
correlation, p<0.01) (Figure 5-12).
For the soil columns, leachate Al concentrations were very closely related to those of
Fe over all time periods (Figure 5-11). Taken together with the Mn data, this suggests

152
that a similar mechanism of release is involved in the release of Fe and Al but there
may be a different process or processes involved in the release of Mn from the soil.
This will be explored further in the section which follows.
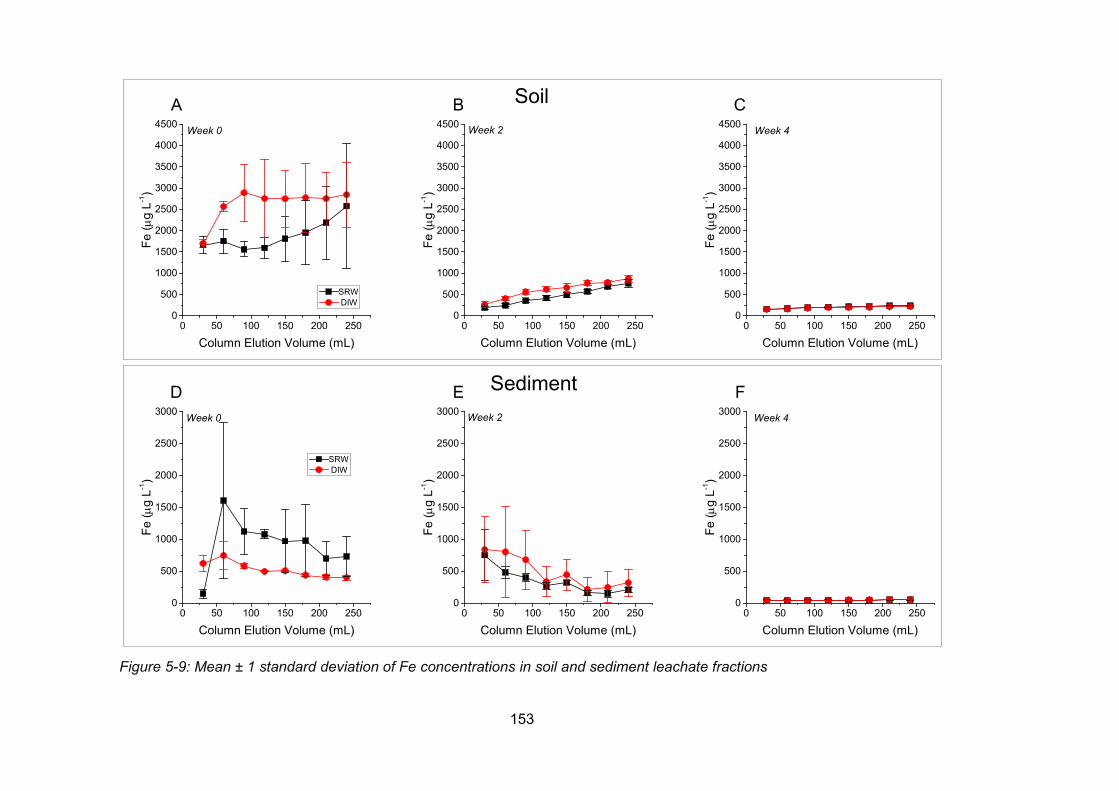
153
0 50 100 150 200 2500
500
1000
1500
2000
2500
3000
3500
4000
4500
0 50 100 150 200 2500
500
1000
1500
2000
2500
3000
3500
4000
4500
0 50 100 150 200 2500
500
1000
1500
2000
2500
3000
3500
4000
4500
0 50 100 150 200 2500
500
1000
1500
2000
2500
3000
0 50 100 150 200 2500
500
1000
1500
2000
2500
3000
0 50 100 150 200 2500
500
1000
1500
2000
2500
3000
Fe (µ
g L-1
)
Column Elution Volume (mL)
SRW DIW
AWeek 4Week 2Week 0
Week 4Week 2Week 0Fe
(µg
L-1)
Column Elution Volume (mL)
B Soil
Sediment
Fe (µ
g L-1
)
Column Elution Volume (mL)
C
SRW DIW
Fe (µ
g L-1
)
Column Elution Volume (mL)
D
Fe (µ
g L-1
)
Column Elution Volume (mL)
E
Fe (µ
g L-1
)
Column Elution Volume (mL)
F
Figure 5-9: Mean ± 1 standard deviation of Fe concentrations in soil and sediment leachate fractions
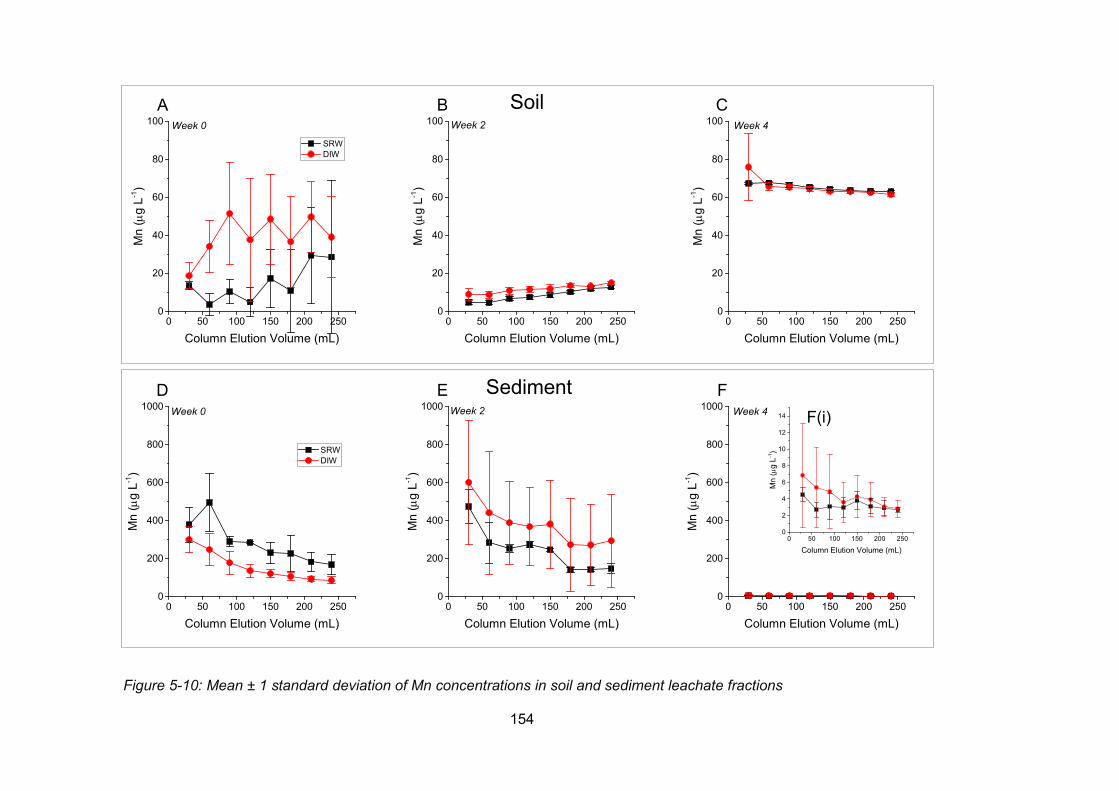
154
Figure 5-10: Mean ± 1 standard deviation of Mn concentrations in soil and sediment leachate fractions
0 50 100 150 200 2500
20
40
60
80
100
0 50 100 150 200 2500
20
40
60
80
100
0 50 100 150 200 2500
20
40
60
80
100
0 50 100 150 200 2500
200
400
600
800
1000
0 50 100 150 200 2500
200
400
600
800
1000
0 50 100 150 200 2500
200
400
600
800
1000
0 50 100 150 200 2500
2
4
6
8
10
12
14
Mn
(µg
L-1)
Column Elution Volume (mL)
SRW DIW
AWeek 4Week 2Week 0
Mn
(µg
L-1)
Column Elution Volume (mL)
B
Mn
( µg
L-1)
Column Elution Volume (mL)
C
SRW DIW
Mn
(µg
L-1)
Column Elution Volume (mL)
D Sediment
Soil
Week 4Week 2Week 0M
n (µ
g L-1
)
Column Elution Volume (mL)
E
Mn
(µg
L-1)
Column Elution Volume (mL)
F
Mn
(µg
L-1)
Column Elution Volume (mL)
F(i)
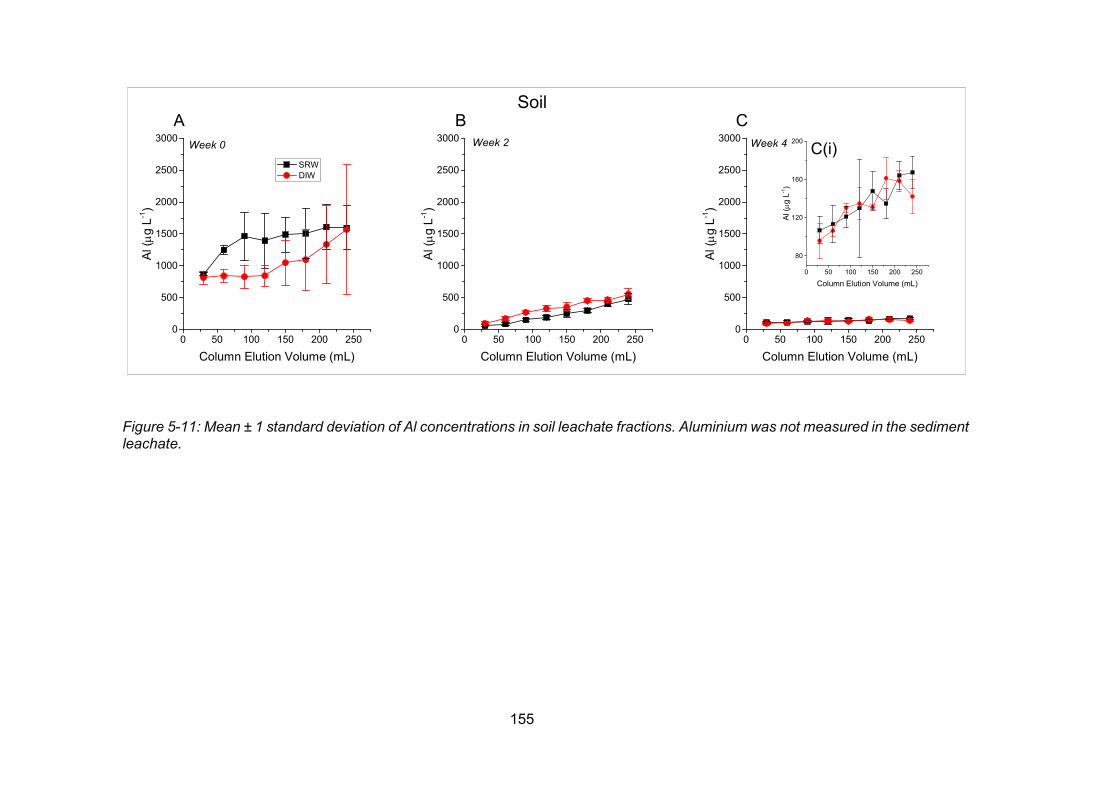
155
Figure 5-11: Mean ± 1 standard deviation of Al concentrations in soil leachate fractions. Aluminium was not measured in the sediment leachate.
0 50 100 150 200 2500
500
1000
1500
2000
2500
3000
0 50 100 150 200 2500
500
1000
1500
2000
2500
3000
0 50 100 150 200 2500
500
1000
1500
2000
2500
3000
0 50 100 150 200 250
80
120
160
200Al
(µg
L-1)
Column Elution Volume (mL)
SRW DIW
A
Al (µ
g L-1
)
Column Elution Volume (mL)
B
Al (µ
g L-1
)
Column Elution Volume (mL)
C
Al (µ
g L-1
)
Column Elution Volume (mL)
Soil
Week 4Week 2Week 0 C(i)
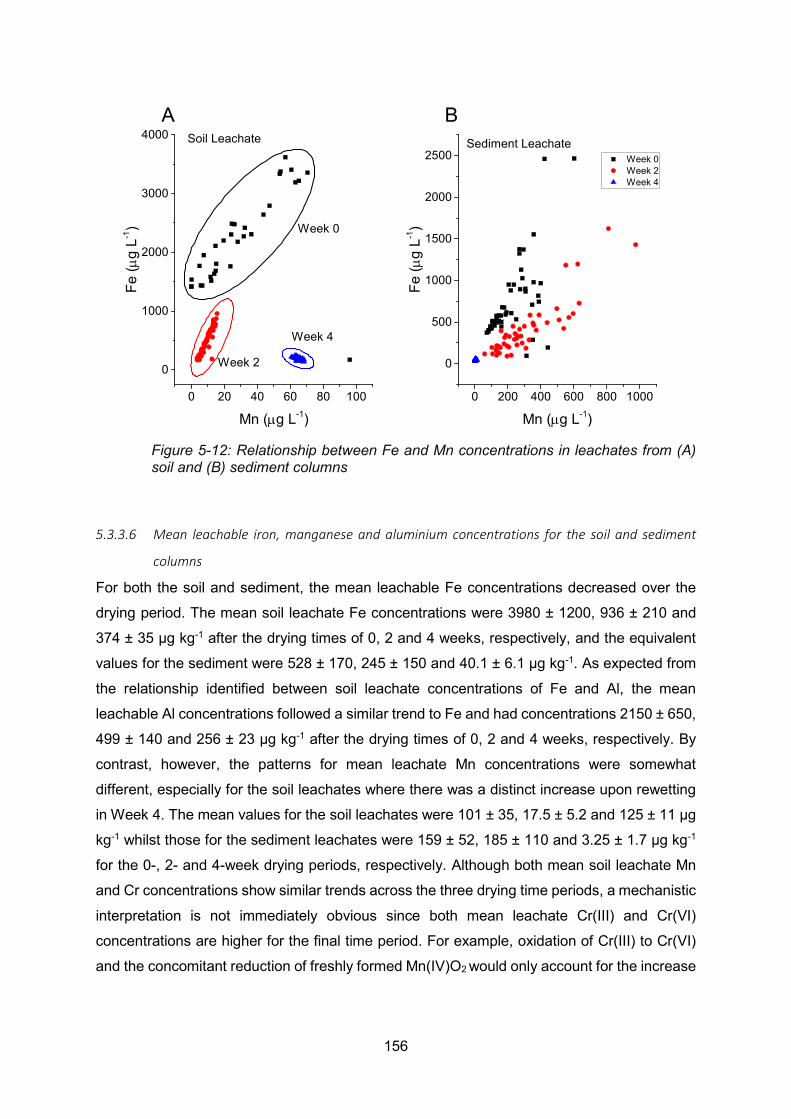
156
5.3.3.6 Mean leachable iron, manganese and aluminium concentrations for the soil and sediment
columns
For both the soil and sediment, the mean leachable Fe concentrations decreased over the
drying period. The mean soil leachate Fe concentrations were 3980 ± 1200, 936 ± 210 and
374 ± 35 µg kg-1 after the drying times of 0, 2 and 4 weeks, respectively, and the equivalent
values for the sediment were 528 ± 170, 245 ± 150 and 40.1 ± 6.1 µg kg-1. As expected from
the relationship identified between soil leachate concentrations of Fe and Al, the mean
leachable Al concentrations followed a similar trend to Fe and had concentrations 2150 ± 650,
499 ± 140 and 256 ± 23 µg kg-1 after the drying times of 0, 2 and 4 weeks, respectively. By
contrast, however, the patterns for mean leachate Mn concentrations were somewhat
different, especially for the soil leachates where there was a distinct increase upon rewetting
in Week 4. The mean values for the soil leachates were 101 ± 35, 17.5 ± 5.2 and 125 ± 11 µg
kg-1 whilst those for the sediment leachates were 159 ± 52, 185 ± 110 and 3.25 ± 1.7 µg kg-1
for the 0-, 2- and 4-week drying periods, respectively. Although both mean soil leachate Mn
and Cr concentrations show similar trends across the three drying time periods, a mechanistic
interpretation is not immediately obvious since both mean leachate Cr(III) and Cr(VI)
concentrations are higher for the final time period. For example, oxidation of Cr(III) to Cr(VI)
and the concomitant reduction of freshly formed Mn(IV)O2 would only account for the increase
0 200 400 600 800 1000
0
500
1000
1500
2000
2500
0 20 40 60 80 100
0
1000
2000
3000
4000Sediment Leachate
Week 0 Week 2 Week 4
Fe (µ
g L-1
)Mn (µg L-1)
B
Week 4
Week 2
Fe (µ
g L-1
)
Mn (µg L-1)
Week 0
ASoil Leachate
Figure 5-12: Relationship between Fe and Mn concentrations in leachates from (A) soil and (B) sediment columns
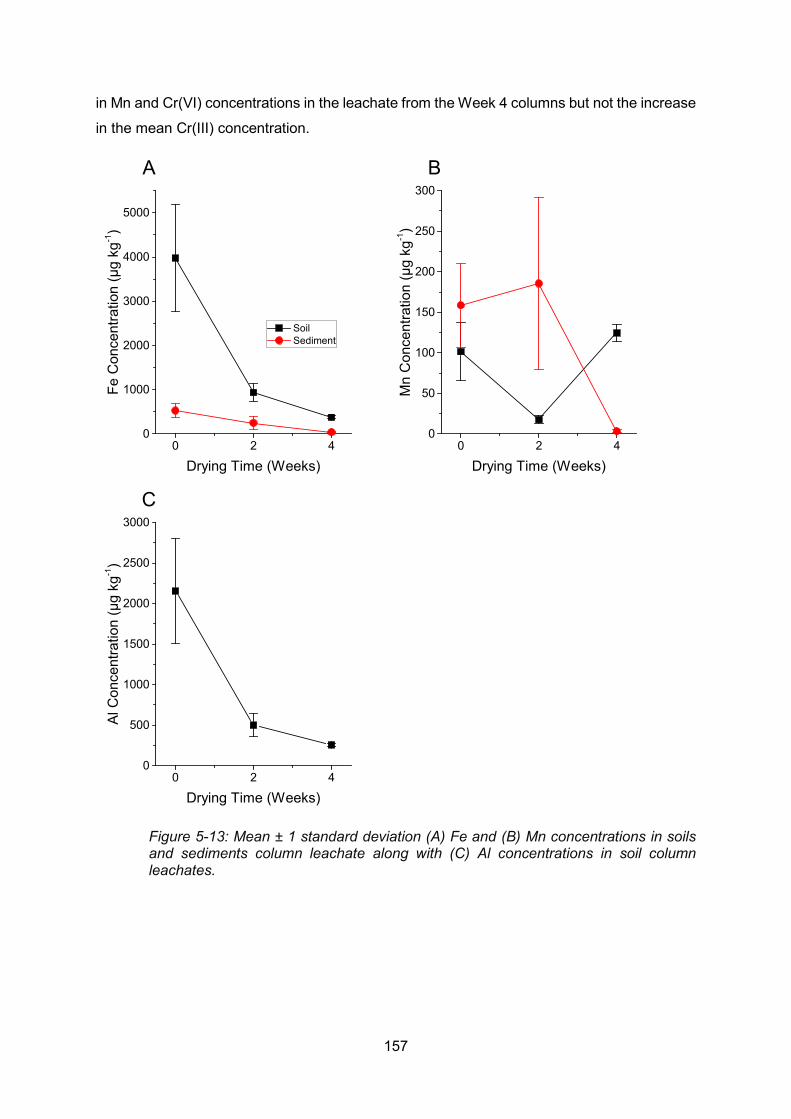
157
in Mn and Cr(VI) concentrations in the leachate from the Week 4 columns but not the increase
in the mean Cr(III) concentration.
0 2 40
1000
2000
3000
4000
5000
0 2 40
50
100
150
200
250
300
0 2 40
500
1000
1500
2000
2500
3000
Fe C
once
ntra
tion
(µg
kg-1)
Drying Time (Weeks)
Soil Sediment
A
Mn
Con
cent
ratio
n (µ
g kg
-1)
Drying Time (Weeks)
B
Al C
once
ntra
tion
(µg
kg-1)
Drying Time (Weeks)
C
Figure 5-13: Mean ± 1 standard deviation (A) Fe and (B) Mn concentrations in soils and sediments column leachate along with (C) Al concentrations in soil column leachates.
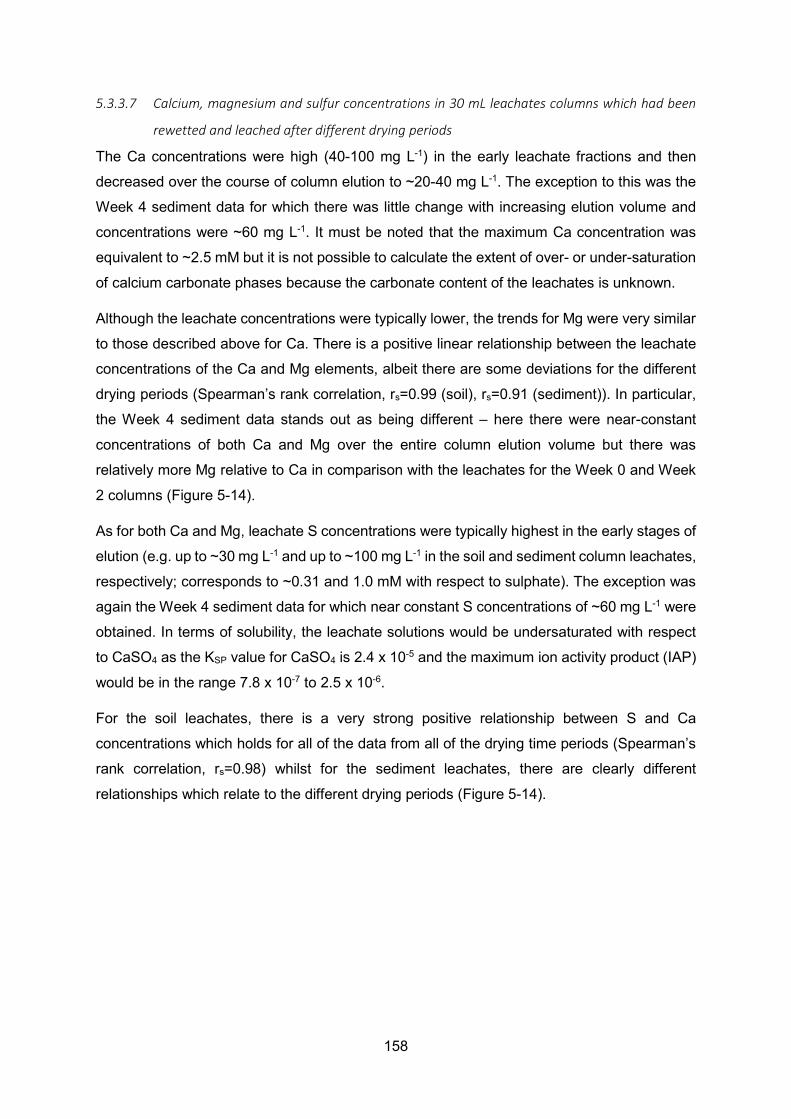
158
5.3.3.7 Calcium, magnesium and sulfur concentrations in 30 mL leachates columns which had been
rewetted and leached after different drying periods
The Ca concentrations were high (40-100 mg L-1) in the early leachate fractions and then
decreased over the course of column elution to ~20-40 mg L-1. The exception to this was the
Week 4 sediment data for which there was little change with increasing elution volume and
concentrations were ~60 mg L-1. It must be noted that the maximum Ca concentration was
equivalent to ~2.5 mM but it is not possible to calculate the extent of over- or under-saturation
of calcium carbonate phases because the carbonate content of the leachates is unknown.
Although the leachate concentrations were typically lower, the trends for Mg were very similar
to those described above for Ca. There is a positive linear relationship between the leachate
concentrations of the Ca and Mg elements, albeit there are some deviations for the different
drying periods (Spearman’s rank correlation, rs=0.99 (soil), rs=0.91 (sediment)). In particular,
the Week 4 sediment data stands out as being different – here there were near-constant
concentrations of both Ca and Mg over the entire column elution volume but there was
relatively more Mg relative to Ca in comparison with the leachates for the Week 0 and Week
2 columns (Figure 5-14).
As for both Ca and Mg, leachate S concentrations were typically highest in the early stages of
elution (e.g. up to ~30 mg L-1 and up to ~100 mg L-1 in the soil and sediment column leachates,
respectively; corresponds to ~0.31 and 1.0 mM with respect to sulphate). The exception was
again the Week 4 sediment data for which near constant S concentrations of ~60 mg L-1 were
obtained. In terms of solubility, the leachate solutions would be undersaturated with respect
to CaSO4 as the KSP value for CaSO4 is 2.4 x 10⁻⁵ and the maximum ion activity product (IAP)
would be in the range 7.8 x 10⁻⁷ to 2.5 x 10⁻⁶.
For the soil leachates, there is a very strong positive relationship between S and Ca
concentrations which holds for all of the data from all of the drying time periods (Spearman’s
rank correlation, rs=0.98) whilst for the sediment leachates, there are clearly different
relationships which relate to the different drying periods (Figure 5-14).
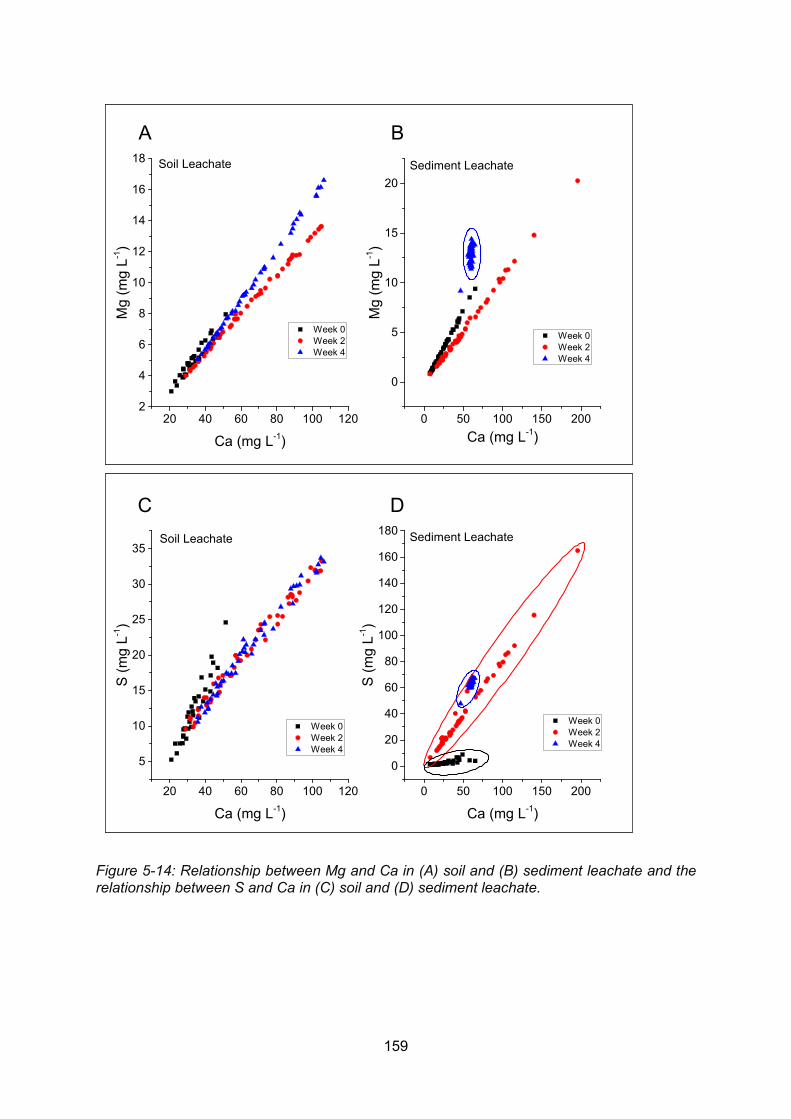
159
Figure 5-14: Relationship between Mg and Ca in (A) soil and (B) sediment leachate and the relationship between S and Ca in (C) soil and (D) sediment leachate.
20 40 60 80 100 1202
4
6
8
10
12
14
16
18
0 50 100 150 200
0
5
10
15
20
20 40 60 80 100 120
5
10
15
20
25
30
35
0 50 100 150 200
0
20
40
60
80
100
120
140
160
180
Week 0 Week 2 Week 4
Mg
(mg
L-1)
Ca (mg L-1)
ASoil Leachate Sediment Leachate
Week 0 Week 2 Week 4
Mg
(mg
L-1)
Ca (mg L-1)
B
Soil Leachate
Week 0 Week 2 Week 4
S (m
g L-1
)
Ca (mg L-1)
CSediment Leachate
Week 0 Week 2 Week 4
S (m
g L-1
)
Ca (mg L-1)
D
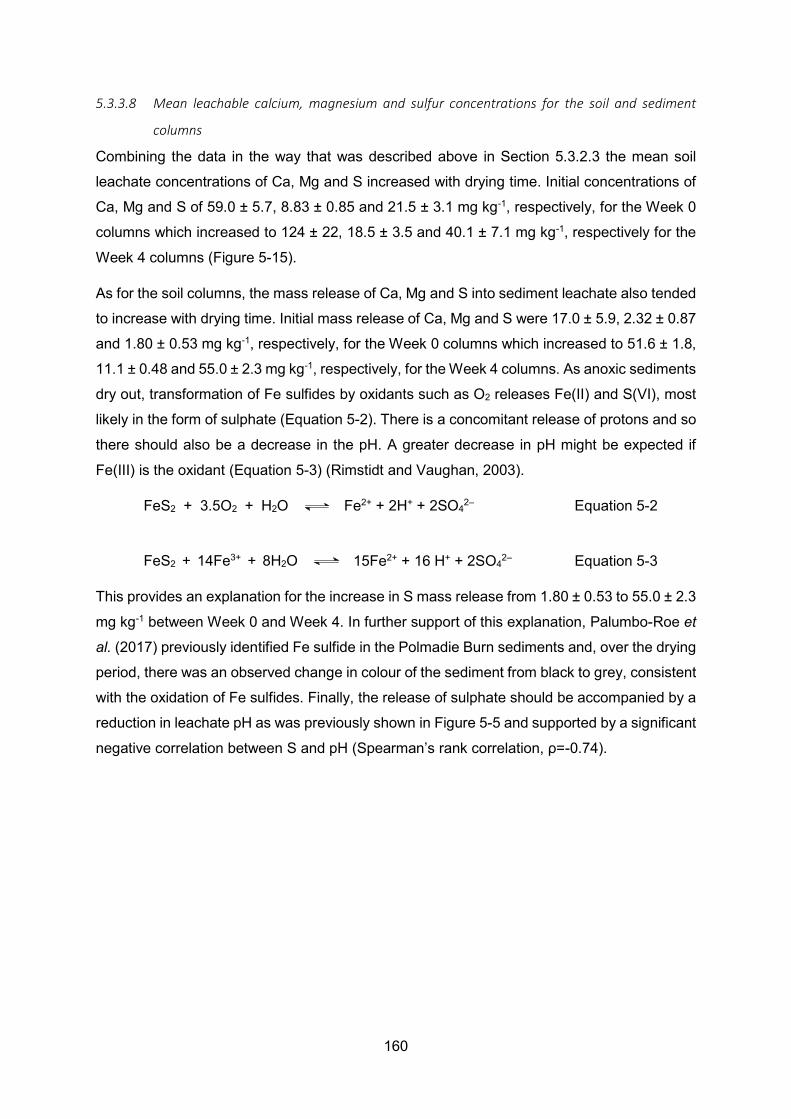
160
5.3.3.8 Mean leachable calcium, magnesium and sulfur concentrations for the soil and sediment
columns
Combining the data in the way that was described above in Section 5.3.2.3 the mean soil
leachate concentrations of Ca, Mg and S increased with drying time. Initial concentrations of
Ca, Mg and S of 59.0 ± 5.7, 8.83 ± 0.85 and 21.5 ± 3.1 mg kg-1, respectively, for the Week 0
columns which increased to 124 ± 22, 18.5 ± 3.5 and 40.1 ± 7.1 mg kg-1, respectively for the
Week 4 columns (Figure 5-15).
As for the soil columns, the mass release of Ca, Mg and S into sediment leachate also tended
to increase with drying time. Initial mass release of Ca, Mg and S were 17.0 ± 5.9, 2.32 ± 0.87
and 1.80 ± 0.53 mg kg-1, respectively, for the Week 0 columns which increased to 51.6 ± 1.8,
11.1 ± 0.48 and 55.0 ± 2.3 mg kg-1, respectively, for the Week 4 columns. As anoxic sediments
dry out, transformation of Fe sulfides by oxidants such as O2 releases Fe(II) and S(VI), most
likely in the form of sulphate (Equation 5-2). There is a concomitant release of protons and so
there should also be a decrease in the pH. A greater decrease in pH might be expected if
Fe(III) is the oxidant (Equation 5-3) (Rimstidt and Vaughan, 2003).
FeS2 + 3.5O2 + H2O Fe2+ + 2H+ + 2SO42– Equation 5-2
FeS2 + 14Fe3+ + 8H2O 15Fe2+ + 16 H+ + 2SO42– Equation 5-3
This provides an explanation for the increase in S mass release from 1.80 ± 0.53 to 55.0 ± 2.3
mg kg-1 between Week 0 and Week 4. In further support of this explanation, Palumbo-Roe et
al. (2017) previously identified Fe sulfide in the Polmadie Burn sediments and, over the drying
period, there was an observed change in colour of the sediment from black to grey, consistent
with the oxidation of Fe sulfides. Finally, the release of sulphate should be accompanied by a
reduction in leachate pH as was previously shown in Figure 5-5 and supported by a significant
negative correlation between S and pH (Spearman’s rank correlation, ρ=-0.74).
161
0 2 40
50
100
150
0 2 40
5
10
15
20
25
0 2 40
20
40
60
Ca
Con
cent
ratio
n (m
g kg
-1)
Drying Time (Weeks)
Soil Sediment
A
Mg
Con
cent
ratio
n (m
g kg
-1)
Drying Time (Weeks)
BS
Con
cent
ratio
n (m
g kg
-1)
Drying Time (Weeks)
C
Figure 5-15: Mean ± 1 standard deviation of the mass release of (A) Ca, (B) Mg and (C) S from the soil and sediment column leachate.
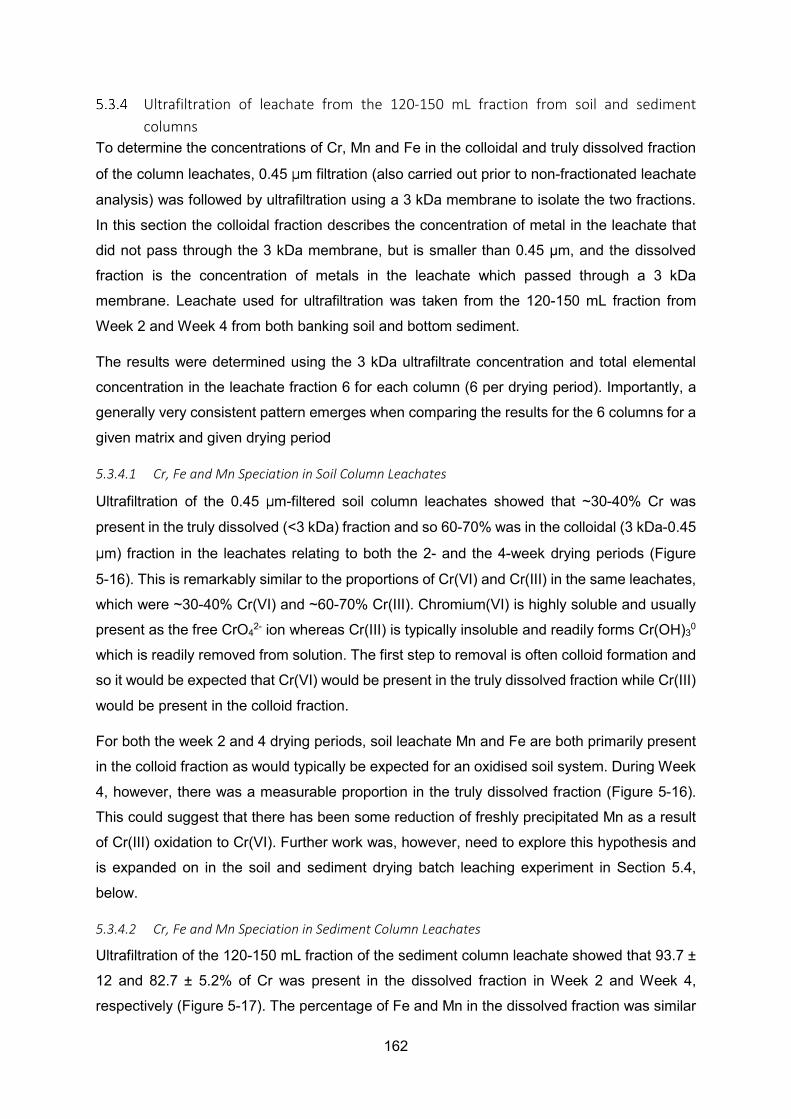
162
Ultrafiltration of leachate from the 120-150 mL fraction from soil and sediment columns
To determine the concentrations of Cr, Mn and Fe in the colloidal and truly dissolved fraction
of the column leachates, 0.45 µm filtration (also carried out prior to non-fractionated leachate
analysis) was followed by ultrafiltration using a 3 kDa membrane to isolate the two fractions.
In this section the colloidal fraction describes the concentration of metal in the leachate that
did not pass through the 3 kDa membrane, but is smaller than 0.45 µm, and the dissolved
fraction is the concentration of metals in the leachate which passed through a 3 kDa
membrane. Leachate used for ultrafiltration was taken from the 120-150 mL fraction from
Week 2 and Week 4 from both banking soil and bottom sediment.
The results were determined using the 3 kDa ultrafiltrate concentration and total elemental
concentration in the leachate fraction 6 for each column (6 per drying period). Importantly, a
generally very consistent pattern emerges when comparing the results for the 6 columns for a
given matrix and given drying period
5.3.4.1 Cr, Fe and Mn Speciation in Soil Column Leachates
Ultrafiltration of the 0.45 µm-filtered soil column leachates showed that ~30-40% Cr was
present in the truly dissolved (<3 kDa) fraction and so 60-70% was in the colloidal (3 kDa-0.45
µm) fraction in the leachates relating to both the 2- and the 4-week drying periods (Figure
5-16). This is remarkably similar to the proportions of Cr(VI) and Cr(III) in the same leachates,
which were ~30-40% Cr(VI) and ~60-70% Cr(III). Chromium(VI) is highly soluble and usually
present as the free CrO42- ion whereas Cr(III) is typically insoluble and readily forms Cr(OH)3
0
which is readily removed from solution. The first step to removal is often colloid formation and
so it would be expected that Cr(VI) would be present in the truly dissolved fraction while Cr(III)
would be present in the colloid fraction.
For both the week 2 and 4 drying periods, soil leachate Mn and Fe are both primarily present
in the colloid fraction as would typically be expected for an oxidised soil system. During Week
4, however, there was a measurable proportion in the truly dissolved fraction (Figure 5-16).
This could suggest that there has been some reduction of freshly precipitated Mn as a result
of Cr(III) oxidation to Cr(VI). Further work was, however, need to explore this hypothesis and
is expanded on in the soil and sediment drying batch leaching experiment in Section 5.4,
below.
5.3.4.2 Cr, Fe and Mn Speciation in Sediment Column Leachates
Ultrafiltration of the 120-150 mL fraction of the sediment column leachate showed that 93.7 ±
12 and 82.7 ± 5.2% of Cr was present in the dissolved fraction in Week 2 and Week 4,
respectively (Figure 5-17). The percentage of Fe and Mn in the dissolved fraction was similar

163
in Week 2 and Week 4. The percentage of Fe in the dissolved fraction of the 120-150 mL
fraction of the column leachate was 25.9 ± 8.6 which increased to 75.2 ± 11% in Week 2 and
Week 4, respectively. The percentage of Mn in the dissolved fraction was 95.5 ± 4.3% in the
dissolved fraction in Week 2 which dropped to 13.2 ± 11% in Week 4 (Figure 5-17). In the
sediment leachates, the distribution of colloidal and truly dissolved forms changed between
Weeks 2 and 4 for Fe and Mn although for Cr, there was no change. The change in colloidal
and dissolved fractions of Fe and Mn is reflective of the change in speciation of the elements
as their reduced forms (Fe(II) and Mn(II)) are more soluble than the oxidised versions which
are generally insoluble. This is also shown by the reduction of the total concentrations of Mn
and Fe in the leachate.
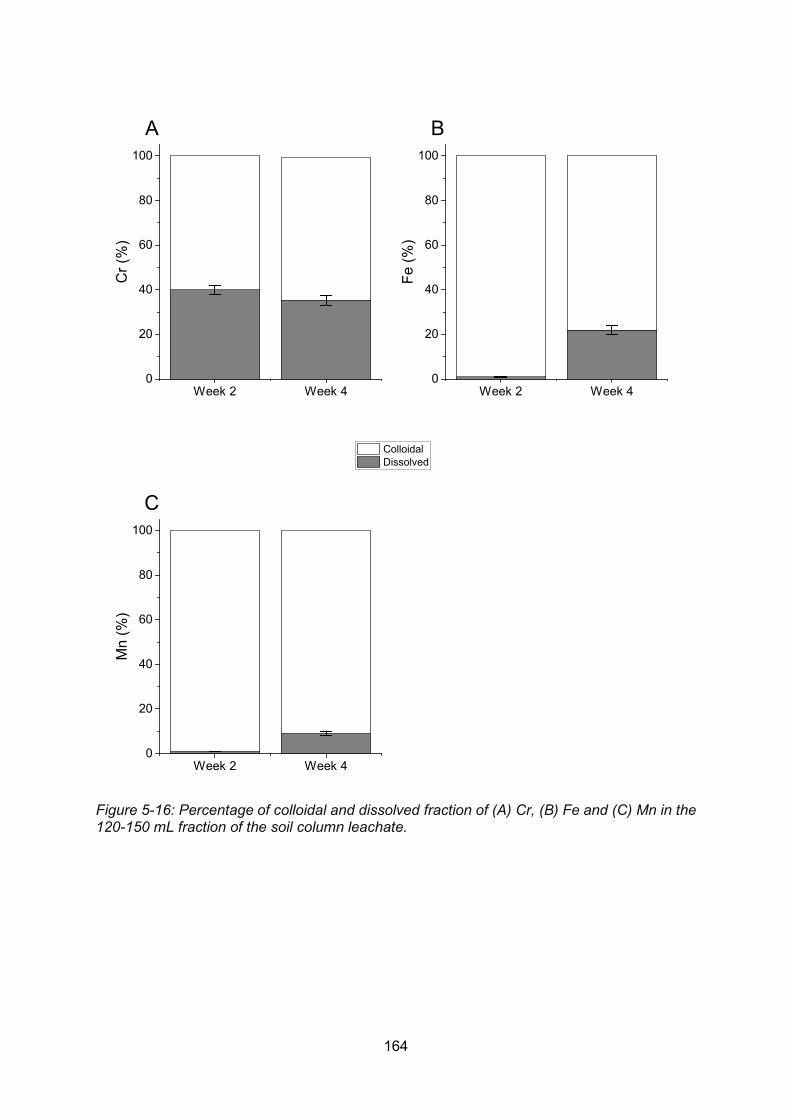
164
Figure 5-16: Percentage of colloidal and dissolved fraction of (A) Cr, (B) Fe and (C) Mn in the 120-150 mL fraction of the soil column leachate.
Week 2 Week 40
20
40
60
80
100
Cr (
%)
Colloidal Dissolved
A
Week 2 Week 40
20
40
60
80
100
Fe (%
)
B
Week 2 Week 40
20
40
60
80
100
Mn
(%)
C
165
Figure 5-17: Percentage of colloidal and dissolved fraction of Cr (A), Fe (B) and Mn (C) in the 120-150 mL fraction of the sediment column leachate
Week 2 Week 40
20
40
60
80
100
Cr (
%)
A
Week 2 Week 40
20
40
60
80
100
Fe (%
)
B
Week 2 Week 40
20
40
60
80
100
Mn
(%)
Colloidal Dissolved
C
166
Discussion of chromium release from soil and sediments during column leaching 5.3.5.1 Comparison of chromium and chromium(VI) concentrations in soil and sediment column
leachates
The range of Cr mass leached from soil columns, 79.5 - 349 µg kg-1, was significantly greater
than the Cr concentration leached from sediment columns which was in the range of 0.20 –
2.86 µg kg-1. The Cr(VI), as a percentage of total Cr leached from the soil columns, was in the
range 20.7 – 42.8%. However no Cr(VI) was detected in any of the sediment leachates (Table
5-3). For total Cr, both the soil and sediment column results followed the same trend with the
lowest concentrations leached after a 2-week drying period.
Previously published results for leaching of COPR material where 3 years of Glasgow
rainwater were passed through the column showed that after initially higher concentrations
were released, Cr(VI) continued to be released at a near-constant level over the entire time
period (Geelhoed et al., 2003). After 3 years of rainfall, only 7 mmol Cr(VI) kg-1 (0.36 g Cr(VI)
kg-1) which was equivalent to 3% of the total Cr present in the COPR had been removed
(Geelhoed et al., 2003).
Scaling the results of this study up from 1 month (240 mL leachate ~ 1 month of Glasgow rain)
to 3 years, the amount of Cr(VI) leached would be equivalent to 0.2-0.4% of the Cr(VI) content
in the banking soils. For total Cr in the leachate, the values would be equivalent to 0.06-0.28%
of the total Cr content of the banking soils. For the sediment, 3 years of leaching would release
0.000005-0.0008% of Cr in the sediment which, based on this experiment, suggests a
significantly lower Cr remobilisation potential from sediment compared with soil. This
difference in mobility can be explained only in part by the presence of Cr(VI) in the soil.
The reducing conditions which prevailed within the Polmadie Burn bottom sediments meant
that Cr(VI) had been efficiently converted to Cr(III), likely at least in part due to Fe(II) oxidation
which leads to the immobilisation of Cr in the form of insoluble mixed Cr/Fe hydroxides.
Sequential extraction results showed that although the proportion of Cr bound to Fe
(hydr)oxides was greater than that for soils, some 60% was still associated with OM.
Reduction and subsequent complexation of Cr(III) by organic matter may also lead to Cr
sequestration and this form is not easily observed using SEM-EDX. Organic matter has been
reported in the literature to form stable complexes with Cr(III) (Gustafsson et al., 2014, Banks
et al., 2006, Elzinga and Cirmo, 2010).
For COPR collected from several locations in SE Glasgow/N Lanarkshire, the Cr(VI)
containing minerals were determined to be: Cr(VI)-substituted ettringite
(Ca6Al2(OH)12(CrO4)3.26 H2O), hydrocalumite (Ca4Al2(OH)12CrO4.6 H2O) and hydrogarnet
(Ca3Al2((Cr/Si/H4)O4)3) (Geelhoed et al., 2002). Based on this earlier work, it might be
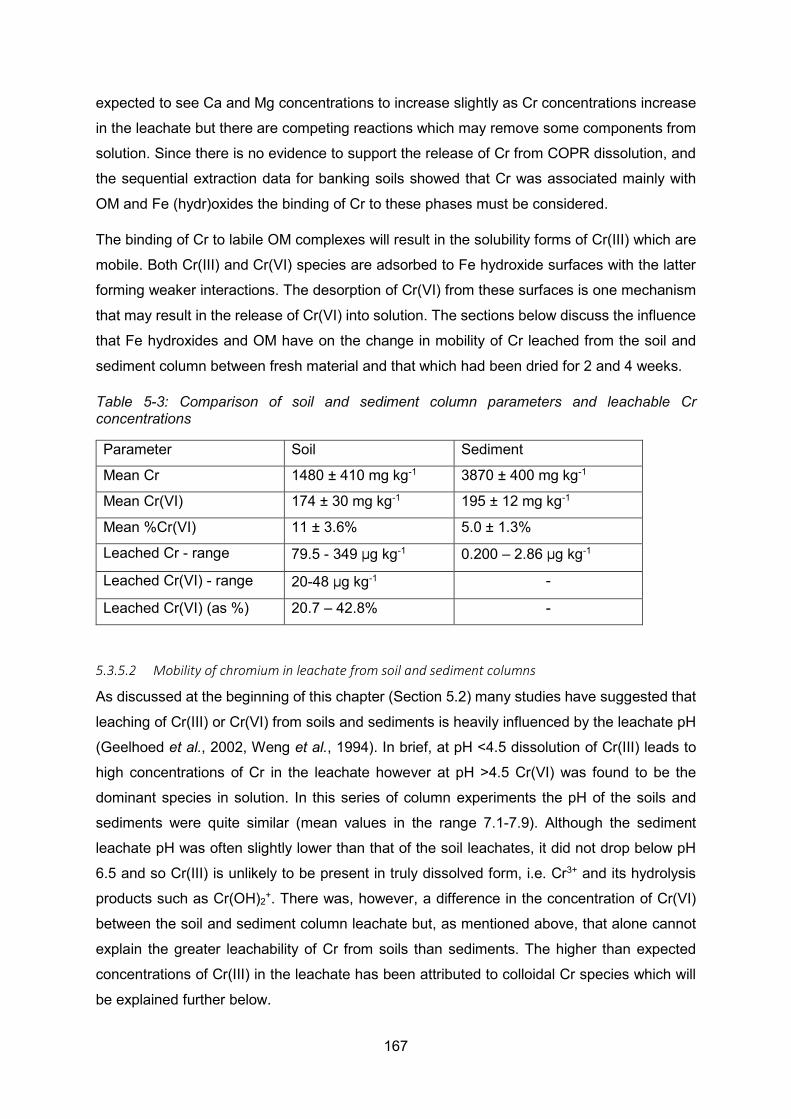
167
expected to see Ca and Mg concentrations to increase slightly as Cr concentrations increase
in the leachate but there are competing reactions which may remove some components from
solution. Since there is no evidence to support the release of Cr from COPR dissolution, and
the sequential extraction data for banking soils showed that Cr was associated mainly with
OM and Fe (hydr)oxides the binding of Cr to these phases must be considered.
The binding of Cr to labile OM complexes will result in the solubility forms of Cr(III) which are
mobile. Both Cr(III) and Cr(VI) species are adsorbed to Fe hydroxide surfaces with the latter
forming weaker interactions. The desorption of Cr(VI) from these surfaces is one mechanism
that may result in the release of Cr(VI) into solution. The sections below discuss the influence
that Fe hydroxides and OM have on the change in mobility of Cr leached from the soil and
sediment column between fresh material and that which had been dried for 2 and 4 weeks.
Table 5-3: Comparison of soil and sediment column parameters and leachable Cr concentrations
Parameter Soil Sediment
Mean Cr 1480 ± 410 mg kg-1 3870 ± 400 mg kg-1
Mean Cr(VI) 174 ± 30 mg kg-1 195 ± 12 mg kg-1
Mean %Cr(VI) 11 ± 3.6% 5.0 ± 1.3%
Leached Cr - range 79.5 - 349 µg kg-1 0.200 – 2.86 µg kg-1
Leached Cr(VI) - range 20-48 µg kg-1 -
Leached Cr(VI) (as %) 20.7 – 42.8% -
5.3.5.2 Mobility of chromium in leachate from soil and sediment columns
As discussed at the beginning of this chapter (Section 5.2) many studies have suggested that
leaching of Cr(III) or Cr(VI) from soils and sediments is heavily influenced by the leachate pH
(Geelhoed et al., 2002, Weng et al., 1994). In brief, at pH <4.5 dissolution of Cr(III) leads to
high concentrations of Cr in the leachate however at pH >4.5 Cr(VI) was found to be the
dominant species in solution. In this series of column experiments the pH of the soils and
sediments were quite similar (mean values in the range 7.1-7.9). Although the sediment
leachate pH was often slightly lower than that of the soil leachates, it did not drop below pH
6.5 and so Cr(III) is unlikely to be present in truly dissolved form, i.e. Cr3+ and its hydrolysis
products such as Cr(OH)2+. There was, however, a difference in the concentration of Cr(VI)
between the soil and sediment column leachate but, as mentioned above, that alone cannot
explain the greater leachability of Cr from soils than sediments. The higher than expected
concentrations of Cr(III) in the leachate has been attributed to colloidal Cr species which will
be explained further below.
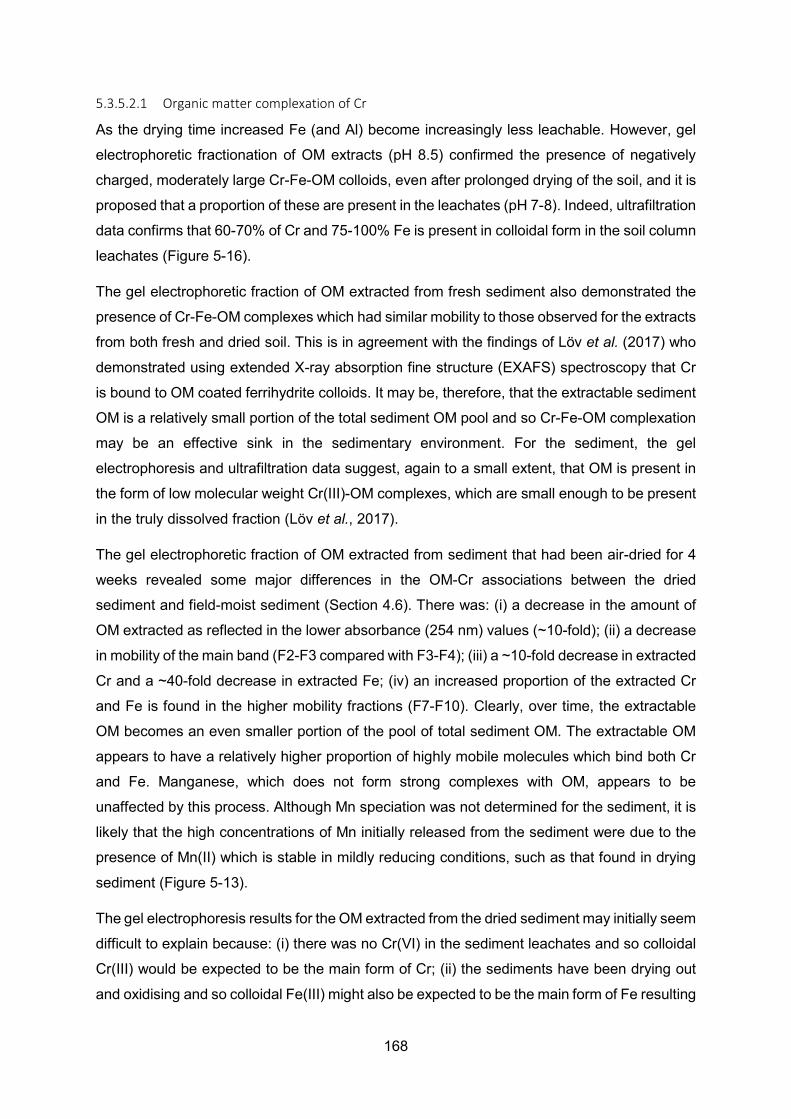
168
5.3.5.2.1 Organic matter complexation of Cr
As the drying time increased Fe (and Al) become increasingly less leachable. However, gel
electrophoretic fractionation of OM extracts (pH 8.5) confirmed the presence of negatively
charged, moderately large Cr-Fe-OM colloids, even after prolonged drying of the soil, and it is
proposed that a proportion of these are present in the leachates (pH 7-8). Indeed, ultrafiltration
data confirms that 60-70% of Cr and 75-100% Fe is present in colloidal form in the soil column
leachates (Figure 5-16).
The gel electrophoretic fraction of OM extracted from fresh sediment also demonstrated the
presence of Cr-Fe-OM complexes which had similar mobility to those observed for the extracts
from both fresh and dried soil. This is in agreement with the findings of Löv et al. (2017) who
demonstrated using extended X-ray absorption fine structure (EXAFS) spectroscopy that Cr
is bound to OM coated ferrihydrite colloids. It may be, therefore, that the extractable sediment
OM is a relatively small portion of the total sediment OM pool and so Cr-Fe-OM complexation
may be an effective sink in the sedimentary environment. For the sediment, the gel
electrophoresis and ultrafiltration data suggest, again to a small extent, that OM is present in
the form of low molecular weight Cr(III)-OM complexes, which are small enough to be present
in the truly dissolved fraction (Löv et al., 2017).
The gel electrophoretic fraction of OM extracted from sediment that had been air-dried for 4
weeks revealed some major differences in the OM-Cr associations between the dried
sediment and field-moist sediment (Section 4.6). There was: (i) a decrease in the amount of
OM extracted as reflected in the lower absorbance (254 nm) values (~10-fold); (ii) a decrease
in mobility of the main band (F2-F3 compared with F3-F4); (iii) a ~10-fold decrease in extracted
Cr and a ~40-fold decrease in extracted Fe; (iv) an increased proportion of the extracted Cr
and Fe is found in the higher mobility fractions (F7-F10). Clearly, over time, the extractable
OM becomes an even smaller portion of the pool of total sediment OM. The extractable OM
appears to have a relatively higher proportion of highly mobile molecules which bind both Cr
and Fe. Manganese, which does not form strong complexes with OM, appears to be
unaffected by this process. Although Mn speciation was not determined for the sediment, it is
likely that the high concentrations of Mn initially released from the sediment were due to the
presence of Mn(II) which is stable in mildly reducing conditions, such as that found in drying
sediment (Figure 5-13).
The gel electrophoresis results for the OM extracted from the dried sediment may initially seem
difficult to explain because: (i) there was no Cr(VI) in the sediment leachates and so colloidal
Cr(III) would be expected to be the main form of Cr; (ii) the sediments have been drying out
and oxidising and so colloidal Fe(III) might also be expected to be the main form of Fe resulting
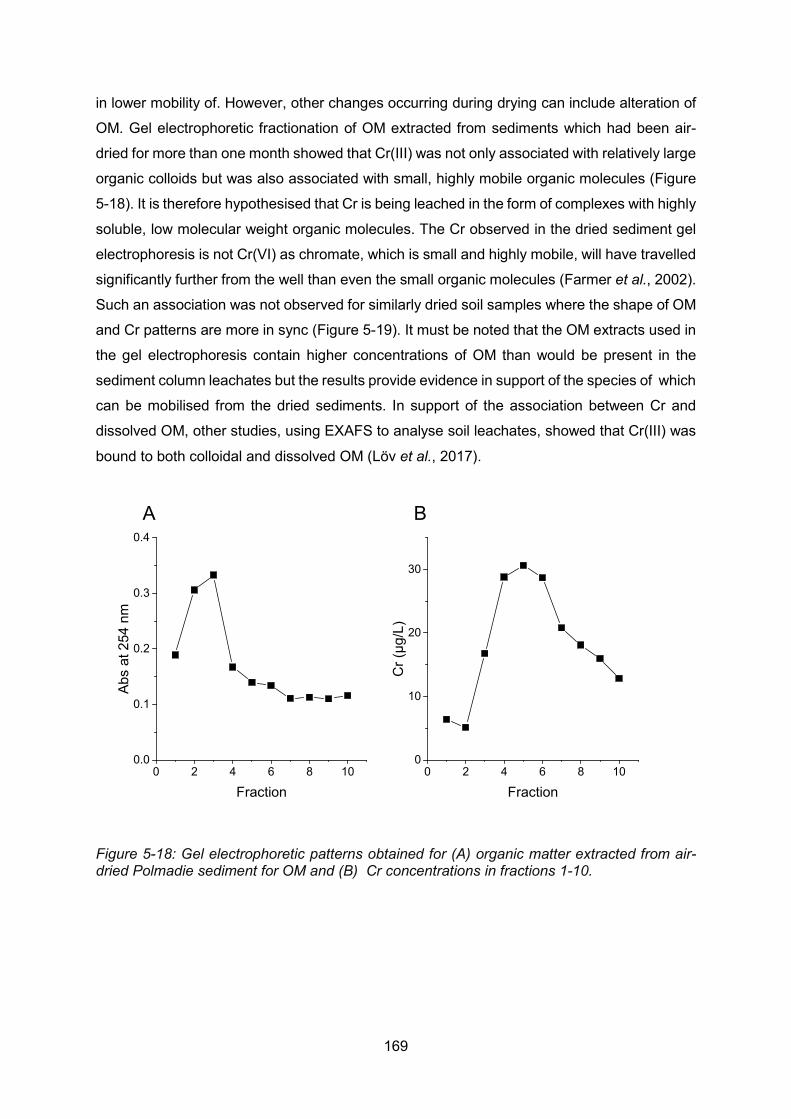
169
in lower mobility of. However, other changes occurring during drying can include alteration of
OM. Gel electrophoretic fractionation of OM extracted from sediments which had been air-
dried for more than one month showed that Cr(III) was not only associated with relatively large
organic colloids but was also associated with small, highly mobile organic molecules (Figure
5-18). It is therefore hypothesised that Cr is being leached in the form of complexes with highly
soluble, low molecular weight organic molecules. The Cr observed in the dried sediment gel
electrophoresis is not Cr(VI) as chromate, which is small and highly mobile, will have travelled
significantly further from the well than even the small organic molecules (Farmer et al., 2002).
Such an association was not observed for similarly dried soil samples where the shape of OM
and Cr patterns are more in sync (Figure 5-19). It must be noted that the OM extracts used in
the gel electrophoresis contain higher concentrations of OM than would be present in the
sediment column leachates but the results provide evidence in support of the species of which
can be mobilised from the dried sediments. In support of the association between Cr and
dissolved OM, other studies, using EXAFS to analyse soil leachates, showed that Cr(III) was
bound to both colloidal and dissolved OM (Löv et al., 2017).
Figure 5-18: Gel electrophoretic patterns obtained for (A) organic matter extracted from air-dried Polmadie sediment for OM and (B) Cr concentrations in fractions 1-10.
0 2 4 6 8 100.0
0.1
0.2
0.3
0.4
0 2 4 6 8 100
10
20
30
Abs
at 2
54 n
m
Fraction
A
Cr (
µg/L
)
Fraction
B
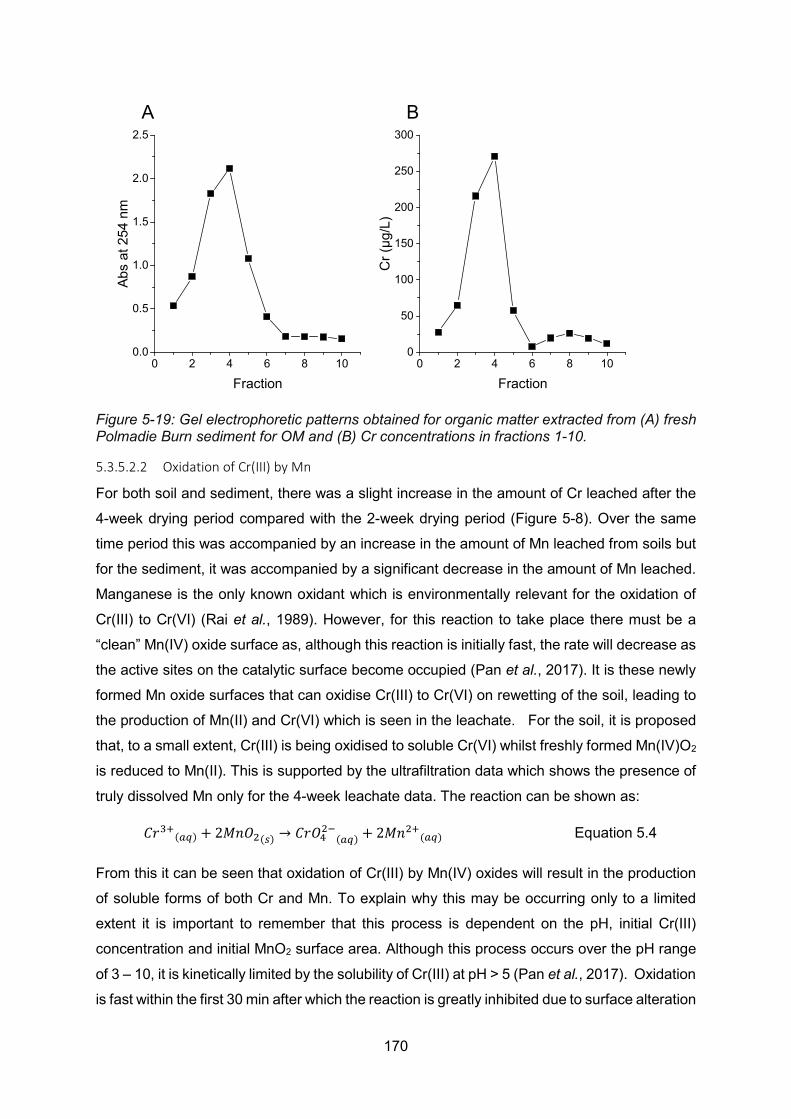
170
Figure 5-19: Gel electrophoretic patterns obtained for organic matter extracted from (A) fresh Polmadie Burn sediment for OM and (B) Cr concentrations in fractions 1-10.
5.3.5.2.2 Oxidation of Cr(III) by Mn
For both soil and sediment, there was a slight increase in the amount of Cr leached after the
4-week drying period compared with the 2-week drying period (Figure 5-8). Over the same
time period this was accompanied by an increase in the amount of Mn leached from soils but
for the sediment, it was accompanied by a significant decrease in the amount of Mn leached.
Manganese is the only known oxidant which is environmentally relevant for the oxidation of
Cr(III) to Cr(VI) (Rai et al., 1989). However, for this reaction to take place there must be a
“clean” Mn(IV) oxide surface as, although this reaction is initially fast, the rate will decrease as
the active sites on the catalytic surface become occupied (Pan et al., 2017). It is these newly
formed Mn oxide surfaces that can oxidise Cr(III) to Cr(VI) on rewetting of the soil, leading to
the production of Mn(II) and Cr(VI) which is seen in the leachate. For the soil, it is proposed
that, to a small extent, Cr(III) is being oxidised to soluble Cr(VI) whilst freshly formed Mn(IV)O2
is reduced to Mn(II). This is supported by the ultrafiltration data which shows the presence of
truly dissolved Mn only for the 4-week leachate data. The reaction can be shown as:
𝐶𝐶𝐶𝐶3+(𝑚𝑚𝑎𝑎) + 2𝑀𝑀𝑜𝑜𝑆𝑆2(𝑚𝑚) → 𝐶𝐶𝐶𝐶𝑆𝑆42−(𝑚𝑚𝑎𝑎) + 2𝑀𝑀𝑜𝑜2+(𝑚𝑚𝑎𝑎) Equation 5.4
From this it can be seen that oxidation of Cr(III) by Mn(IV) oxides will result in the production
of soluble forms of both Cr and Mn. To explain why this may be occurring only to a limited
extent it is important to remember that this process is dependent on the pH, initial Cr(III)
concentration and initial MnO2 surface area. Although this process occurs over the pH range
of 3 – 10, it is kinetically limited by the solubility of Cr(III) at pH > 5 (Pan et al., 2017). Oxidation
is fast within the first 30 min after which the reaction is greatly inhibited due to surface alteration
0 2 4 6 8 100.0
0.5
1.0
1.5
2.0
2.5
0 2 4 6 8 100
50
100
150
200
250
300Ab
s at
254
nm
Fraction
A
Cr (
µg/L
)Fraction
B
171
of the MnO2 surfaces, probably due to precipitation of Cr(III) onto the Mn oxide surface
(Fendorf and Zasoski, 1992, Świetlik, 2002). This means that there must be a fresh source of
Mn surfaces in these soils to facilitate this reaction. Manganese(II) oxidised to Mn(IV) which
precipitates on surfaces will provide a new surface for Cr(III) oxidation to occur.
When the Eh increases as the sediment dries there will be a point where Mn(II) is no longer
stable and it will precipitate as Mn(IV) oxide, resulting in the significant decrease in the
leachable Mn concentrations in Week 4. It is this precipitation of Mn(II) which results in the
decrease of Mn leachate concentrations observed in the sediment column leachate as drying
time increases. This is significant because freshly precipitated Mn(IV) oxides may provide a
surface for the oxidation of Cr(III) to Cr(VI) leading to leachable Cr(VI) in the leachate. Whilst
this was not observed in this experiment, if the sediment had dried for longer Cr(VI) may have
been observed in the leachate. It is therefore hypothesised that the alteration of OM is the
reason for changes in the leachable Cr concentrations found in the column leachate.
Summary The results from the column experiments have shown that there is a significant difference
between the mobility of Cr in the Polmadie Burn banking soil and bottom sediments. The
leaching experiment was equivalent to 6 weeks of Glasgow rainfall and the maximum
percentage of Cr released over the experiment from the banking soils and bottom sediments
was <0.023 and <0.00008%, respectively, based on the maximum concentration of Cr leached
from the mean Cr concentration in the banking soils and sediment. Even though the total Cr
concentration in both the soils and sediments are significantly elevated compared with the
baseline Cr concentrations in Glasgow these results show that the amounts of Cr that would
be released after 4 weeks drying and then 4 weeks of rainfall would indeed be very small.
The lower Cr concentration in sediment column leachates is due largely to the highly reducing
nature of the Polmadie Burn sediments resulting in the reduction of Cr(VI) by Fe(II) to
precipitate as stable Cr/Fe hydroxides. Although as shown in Section 4.3.3 the oxic banking
soils provide an environment where Cr(VI) is stable, the relatively high concentrations of Cr(III)
in soil leachate did not agree with literature which suggested that Cr(VI) would be the dominant
species leached at pH>5. Ultrafiltration data demonstrated, however, that Cr released from
soil was associated with colloidal particles as well as in the truly dissolved fraction. Combining
the ultrafiltration results with those for gel electrophoretic fractionation of extracted soil organic
matter, leached Cr was (i) most likely associated with Fe/OM in the colloid fraction or (ii)
present as Cr(VI) in the truly dissolved fraction. The presence of “truly dissolved” (<3 kDa)
Cr(III) in the sediment leachates, where no Cr(VI) was detected, was initially harder to explain
172
but gel electrophoresis showed that, especially after 4 weeks of drying, there was the
formation of small, mobile OM-Cr(III) complexes which may pass through a 3 kDa membrane.
More generally, it is possible that the decrease in Cr, Fe and Al leachate concentrations as
drying time increases is due to the changing in the leachability of OM. Interestingly, the
leachate concentrations of Cr from both soils and sediment columns decreased between
Week 0 and Week 2 then increased between Week 2 and Week 4. This trend was also
observed for Mn concentrations in the soil column leachates, suggesting that the oxidation of
Cr(III) to produce soluble Cr(VI) and Mn(II) may be occurring. To further investigate the
changes in Cr concentrations and its relationship with Mn batch experiments were carried out.
These experiments allowed the changes in the elemental concentrations leached to be
sampled more frequently over the duration of the drying period, and over a longer time period,
to gain a more detailed understanding of the mechanisms of Cr release from Polmadie Burn
banking soils and bottom sediments upon rewetting after drying.
173
5.4 Batch Experiments to investigate the leachability of chromium from soils and sediments which have been dried for different time periods
To investigate the changes in elemental concentrations, with especial focus on the Cr and Mn
concentrations, found in the column leachate a study was required which had shorter time
intervals between subsamples over the drying period. Due to the large mass of banking soil
and bottom sediment required to fill the columns (>20 kg of soil and sediment) and the large
costs associated with analysis and consumables, it was not feasible to expand the column
experiment described in the section above to the required resolution. It was therefore decided
to use batch leaching experiments which reduced the mass of material required along with the
number of samples to analyse (one rather than eight solutions per time step) but still provided
the information about the changes in the leachate composition when banking soil and bottom
sediments are rewetted after set drying periods. The drying time periods used for these batch
experiments were: 0, 1, 2, 5, 8, 12, 16, 21, 26, 35, 43, 50 and 62 days with all time step
replicates in triplicate. Due to the non-significant difference in the elements leached from
banking soils and bottom sediments by SRW and DIW in the column leaching experiments,
only SRW was used as the leaching solution.
Section 5.4.1 below gives a brief overview of the sampling and batch leaching method. This
is followed by the results from the batch leaching experiments (Section 5.3). This section then
compares the batch and column leaching experiments before finally discuss the results from
the batch leaching, leading to an improved mechanistic understanding of Cr release from the
Polmadie Burn banking soil and bottom sediment.
Overview of sampling and sample treatment Approximately 5 kg of surface banking soil and surface sediment was collected on the 10th
November 2017 (Section 3.1.2). The material was passed through a 5 mm sieve to remove
debris, as described in Section 5.3.1, and then left to dry. After set time intervals a sub-sample
of the soil or sediment was removed, passed through a 2 mm sieve to further homogenise the
sample. Triplicate portions (10 g) of the homogenised material were weighed into 50 mL
centrifuge tubes. To each of the tubes 20 mL of SRW (Section 5.3.1), was added and the
tubes were shaken at 20 rpm on an end-over-end shaker for 1 h. This time period was chosen
to coincide with the 1 h rewetting time of the columns so that the results would be comparable
to the first aliquot of the column leaching experiments. After centrifugation at 5000 x g for 10
min the supernatant was removed and filtered through a 0.45 µm filter and stored at 4°C in
the dark before analysis.
174
Moisture content and pH of soils and sediments The moisture content of the soil decreased linearly from 63.3 ± 0.24% to 11.1 ± 0.21 % during
43 days of drying, after which it decreased at a much lower rate reaching 6.64 ± 0.19 % after
62 days of drying (Figure 5-20A). The sediment moisture content decreased linearly from 26.7
± 0.44 % to 3.40 ± 0.19 % over the first 21 days of drying. After day 21 the moisture content
remained constant at 2.68 ± 0.42 % until day 62, showing that the sediment had already
reached a steady state with respect to moisture content (Figure 5-20B). The slower moisture
loss by the soils can be attributed to their higher OM content. The dry mass of the material
was used to determine the mass of element leached.
The pH of the soil leachate decreased from an initial value of 7.84 ± 0.015 to 7.46 ± 0.17 after
8 days of drying. Between days 8 and 62 the mean pH of the leachate was 7.53 ± 0.076
(Figure 5-20C). The steady decrease in pH over the first 15 days of drying did not follow the
trend shown by the column experiments where the leachate pH of the fresh sample (Week 0)
was 7.34 ± 0.12 which increased between Week 0 and Week 2 before decreasing between
Week 2 and Week 4. The pH of the soil column leachate in Week 2 and Week 4 was similar
to the pH observed in the batch leachate of 7.38 ± 0.23 and 7.61 ± 0.0051 for soils dried for
16 and 26 days, respectively.
The sediment leachate pH decreased from 7.97 ± 0.081 to 6.63 ± 0.22. After this minimum
the pH increased and levelled off at 7.35 ± 0.054 between days 26 to 62 of drying, (Figure
5-20D). This was similar to the trend observed in the column leaching experiment where the
pH decreased linearly over the drying period from 7.80 ± 0.11 at Week 0 to 7.29 ± 0.27.
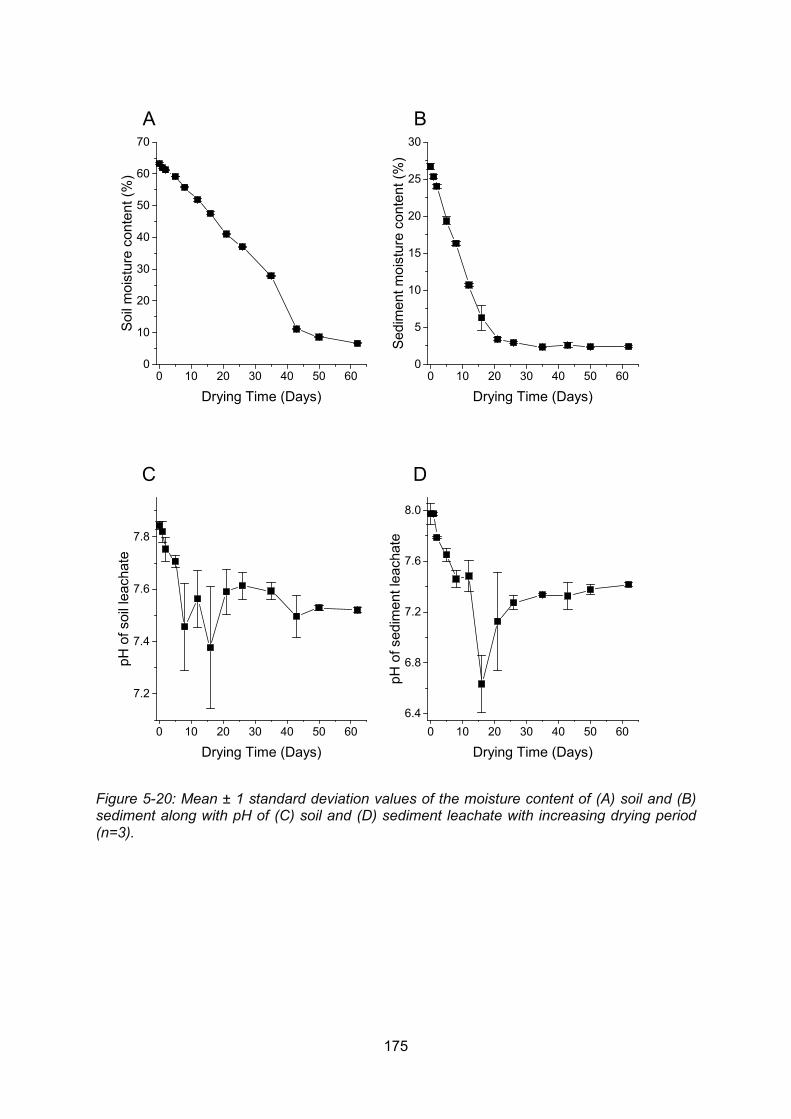
175
Figure 5-20: Mean ± 1 standard deviation values of the moisture content of (A) soil and (B) sediment along with pH of (C) soil and (D) sediment leachate with increasing drying period (n=3).
0 10 20 30 40 50 600
10
20
30
40
50
60
70
0 10 20 30 40 50 600
5
10
15
20
25
30
0 10 20 30 40 50 60
7.2
7.4
7.6
7.8
0 10 20 30 40 50 606.4
6.8
7.2
7.6
8.0
Soil
moi
stur
e co
nten
t (%
)
Drying Time (Days)
A
Sedi
men
t moi
stur
e co
nten
t (%
)Drying Time (Days)
BpH
of s
oil l
each
ate
Drying Time (Days)
C
pH o
f sed
imen
t lea
chat
e
Drying Time (Days)
D
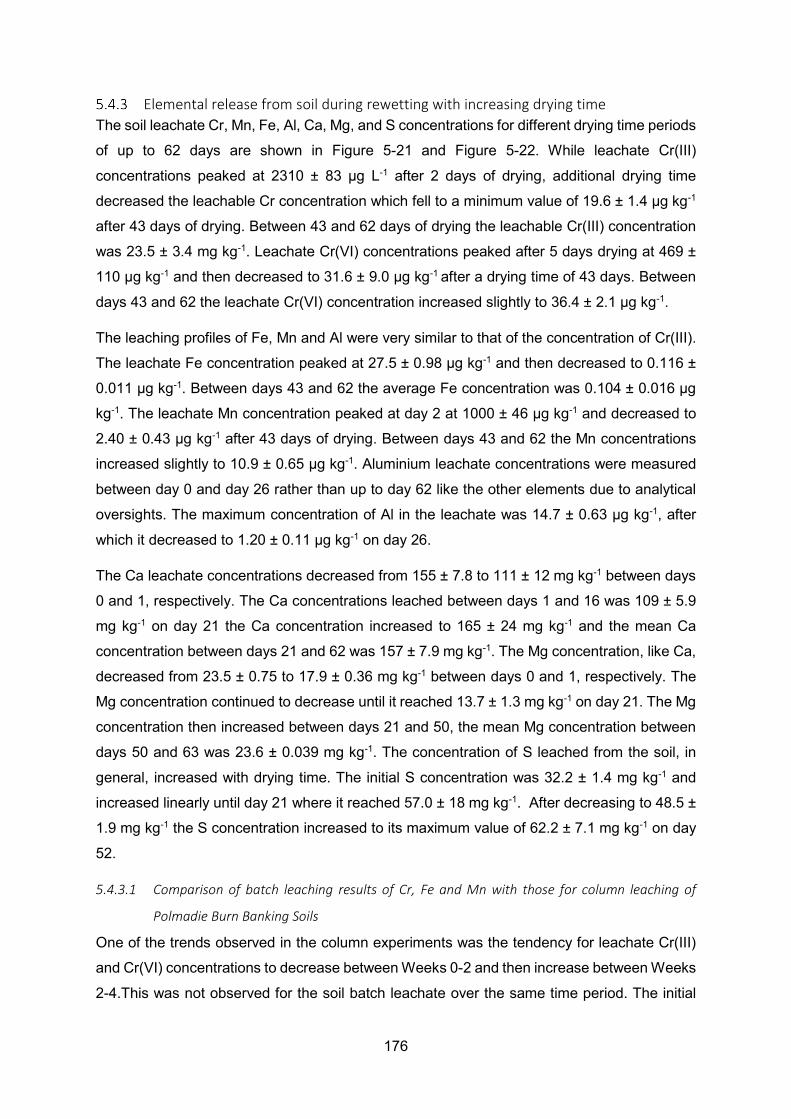
176
Elemental release from soil during rewetting with increasing drying time The soil leachate Cr, Mn, Fe, Al, Ca, Mg, and S concentrations for different drying time periods
of up to 62 days are shown in Figure 5-21 and Figure 5-22. While leachate Cr(III)
concentrations peaked at 2310 ± 83 µg L-1 after 2 days of drying, additional drying time
decreased the leachable Cr concentration which fell to a minimum value of 19.6 ± 1.4 µg kg-1
after 43 days of drying. Between 43 and 62 days of drying the leachable Cr(III) concentration
was 23.5 ± 3.4 mg kg-1. Leachate Cr(VI) concentrations peaked after 5 days drying at 469 ±
110 µg kg-1 and then decreased to 31.6 ± 9.0 µg kg-1 after a drying time of 43 days. Between
days 43 and 62 the leachate Cr(VI) concentration increased slightly to 36.4 ± 2.1 µg kg-1.
The leaching profiles of Fe, Mn and Al were very similar to that of the concentration of Cr(III).
The leachate Fe concentration peaked at 27.5 ± 0.98 µg kg-1 and then decreased to 0.116 ±
0.011 µg kg-1. Between days 43 and 62 the average Fe concentration was 0.104 ± 0.016 µg
kg-1. The leachate Mn concentration peaked at day 2 at 1000 ± 46 µg kg-1 and decreased to
2.40 ± 0.43 µg kg-1 after 43 days of drying. Between days 43 and 62 the Mn concentrations
increased slightly to 10.9 ± 0.65 µg kg-1. Aluminium leachate concentrations were measured
between day 0 and day 26 rather than up to day 62 like the other elements due to analytical
oversights. The maximum concentration of Al in the leachate was 14.7 ± 0.63 µg kg-1, after
which it decreased to 1.20 ± 0.11 µg kg-1 on day 26.
The Ca leachate concentrations decreased from 155 ± 7.8 to 111 ± 12 mg kg-1 between days
0 and 1, respectively. The Ca concentrations leached between days 1 and 16 was 109 ± 5.9
mg kg-1 on day 21 the Ca concentration increased to 165 ± 24 mg kg-1 and the mean Ca
concentration between days 21 and 62 was 157 ± 7.9 mg kg-1. The Mg concentration, like Ca,
decreased from 23.5 ± 0.75 to 17.9 ± 0.36 mg kg-1 between days 0 and 1, respectively. The
Mg concentration continued to decrease until it reached 13.7 ± 1.3 mg kg-1 on day 21. The Mg
concentration then increased between days 21 and 50, the mean Mg concentration between
days 50 and 63 was 23.6 ± 0.039 mg kg-1. The concentration of S leached from the soil, in
general, increased with drying time. The initial S concentration was 32.2 ± 1.4 mg kg-1 and
increased linearly until day 21 where it reached 57.0 ± 18 mg kg-1. After decreasing to 48.5 ±
1.9 mg kg-1 the S concentration increased to its maximum value of 62.2 ± 7.1 mg kg-1 on day
52.
5.4.3.1 Comparison of batch leaching results of Cr, Fe and Mn with those for column leaching of
Polmadie Burn Banking Soils
One of the trends observed in the column experiments was the tendency for leachate Cr(III)
and Cr(VI) concentrations to decrease between Weeks 0-2 and then increase between Weeks
2-4.This was not observed for the soil batch leachate over the same time period. The initial
177
concentration of leachable Cr(III) was 1763 ± 160 µg kg-1 and the Cr(III) concentration leached
after 16 and 26 days of drying was 725 ± 42 and 193 ± 11 µg kg-1, respectively, and continued
to decrease until Day 62. The Cr(VI) concentration in the batch leachate showed an increase
in the amount of leachable Cr(VI) over the first 5 days of drying before decreasing over the
rest of the drying period although there is a very slight increase in the Cr(VI) concentration
leached on Day 62 (36.4 ± 2.1 µg kg-1) compared to Day 50 (32.4 ± 2.5 µg kg-1).
The Mn concentration in the soil column leachable showed the same trend as Cr described in
the paragraph above and the column leachate Fe concentration decrease over the drying
period. In the batch leachate both Fe and Mn were highly correlated with Cr(III) concentrations
which supports the hypothesis that Cr(III) in the leachates is associated with colloids, since Fe
and Mn, as shown by the ultrafiltration data in Section 5.3.2.10, were found mainly in the
colloidal fraction.
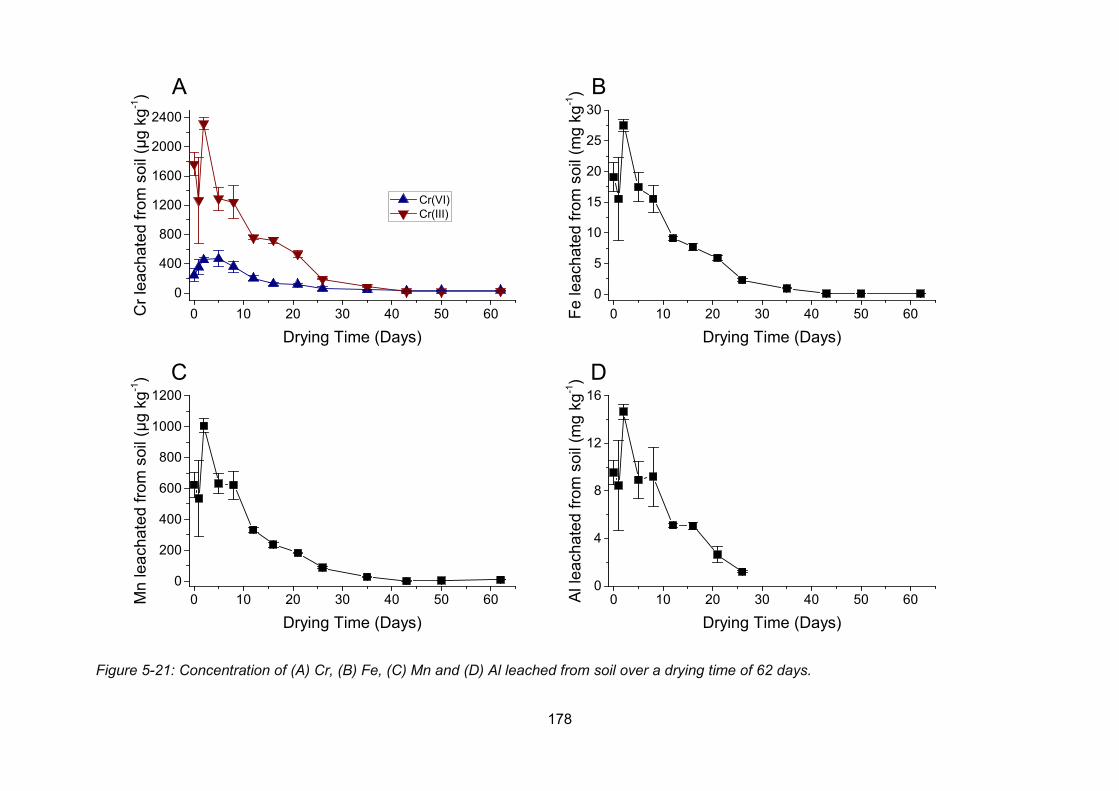
178
Figure 5-21: Concentration of (A) Cr, (B) Fe, (C) Mn and (D) Al leached from soil over a drying time of 62 days.
0 10 20 30 40 50 600
400
800
1200
1600
2000
2400
0 10 20 30 40 50 600
5
10
15
20
25
30
0 10 20 30 40 50 600
200
400
600
800
1000
1200
0 10 20 30 40 50 600
4
8
12
16
Cr l
each
ated
from
soi
l (µg
kg-1
)
Drying Time (Days)
Cr(VI) Cr(III)
A
Fe le
acha
ted
from
soi
l (m
g kg
-1)
Drying Time (Days)
B
Mn
leac
hate
d fro
m s
oil (
µg k
g-1)
Drying Time (Days)
C
Al le
acha
ted
from
soi
l (m
g kg
-1)
Drying Time (Days)
D
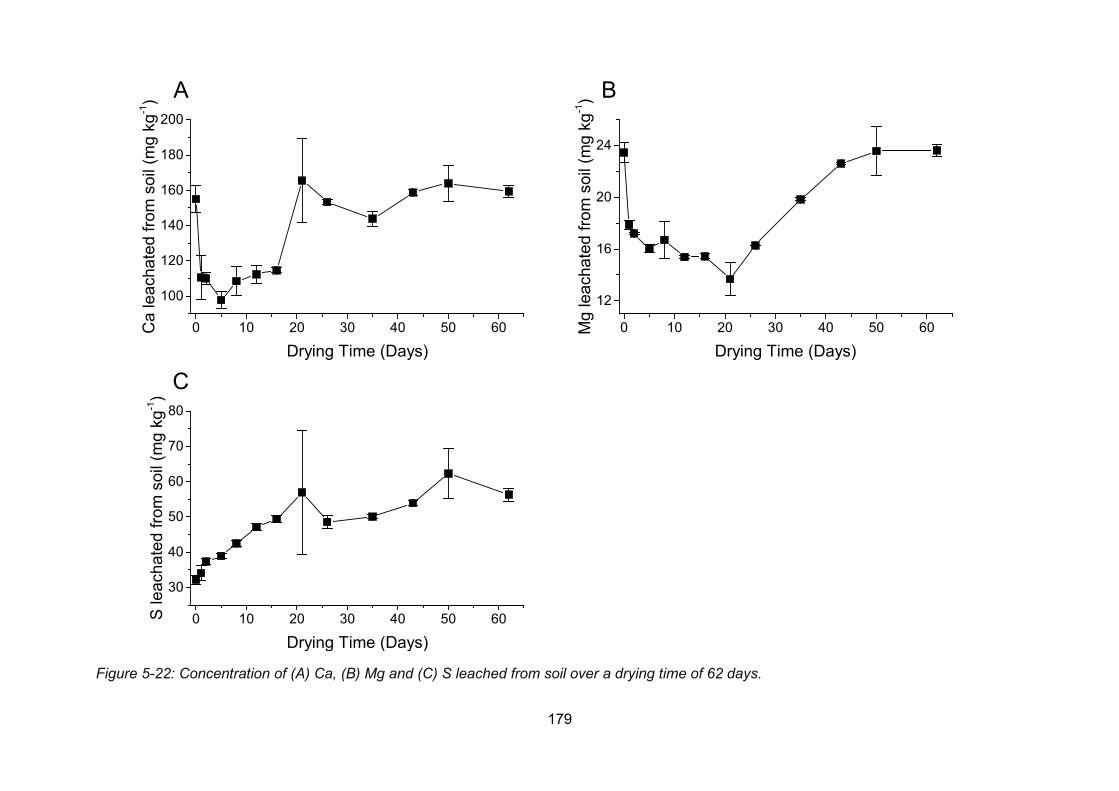
179
Figure 5-22: Concentration of (A) Ca, (B) Mg and (C) S leached from soil over a drying time of 62 days.
0 10 20 30 40 50 60
100
120
140
160
180
200
0 10 20 30 40 50 60
12
16
20
24
0 10 20 30 40 50 60
30
40
50
60
70
80
Ca
leac
hate
d fro
m s
oil (
mg
kg-1)
Drying Time (Days)
A
Mg
leac
hate
d fro
m s
oil (
mg
kg-1)
Drying Time (Days)
B
S le
acha
ted
from
soi
l (m
g kg
-1)
Drying Time (Days)
C
180
Elemental release from sediment during rewetting with increasing drying time The change in leachable Cr, Fe, Mn, Al, Ca, Mg, and S concentrations in sediment over the
period of 62 days as it dried are shown in Figures 5-23 and 5-24. Leachate Cr concentrations
decreased from 266 ± 41 µg kg-1 to 17.4 µg kg-1 between days 0 and 2, respectively. The Cr
concentration continued to decrease until it reached 4.66 ± 0.31 µg kg-1 on day 16. Between
days 16 and 43 the Cr concentration increased and the mean concentration of leachable Cr
was 36.3 ± 2.9 µg kg-1 between days 43 and 62. Between days 35 to 62 Cr(VI) was detected
in the leachate (Appendix 2). The Cr(VI) was 150 and 121 % of the total Cr in the leachate in
days 35 and 43, respectively. This is probably due to the uncertainties associated with the
measurements of Cr and Cr(VI) at low concentrations but show there was a change in the
speciation of Cr released after day 35 from exclusively Cr(III) to Cr(III) and Cr(VI).
The concentration of Fe released from the sediment decreased from 254 ± 41 µg kg-1 to 3.58
± 0.26 µg kg-1 on day 12. The Fe concentration between days 12 to 62 remained low with a
mean concentration of 2.42 ± 0.67 µg kg-1. The leachable Mn concentration increased from
198 ± 20 µg kg1 on day 0 to 711 ± 1.6 µg kg-1 on day 2. The Mn concentrations decreased
from 681 ± 46 µg kg-1 on day 5 to 37.1 ± 2.5 µg kg-1 on day 12. The Mn concentration then
increased slightly to 66.0 ± 3.9 µg kg-1 on day 21 before increasing between days 21 and 35
to 259 ± 10 µg kg-1. The mean concentration of Mn between days 35 and 62 was 271 ± 16 µg
kg-1. The leachable Al concentration was monitored between days 0 and 16. Over this period
the Al concentration decreased from 275 ± 2.9 µg kg-1 to 149 ± 15 µg kg-1.
The leaching of Ca, Mg and S followed a similar general trend where the leachable
concentration of the element increased linearly over a period before reaching, and remaining
at, constant concentration for the duration of the remaining time. The leachable Ca
concentration increased from 49.9 ± 2.9 mg kg-1 on day 0 to 1030 ± 41 mg kg-1 on day 8.
Between day 8 and day 62 the mean Ca leachable concentration was 1060 ± 60 mg kg-1. The
leachable Mg concentration increased from 6.82 ± 0.061 mg kg-1 to 48.0 mg kg-1 on day 5.
Between days 5 and 62 the mean Mg concentration was 48.2 ± 2.1 mg kg-1. The leachable
concentrations of S increased from 20.4 ± 1.2 mg kg-1 on day 0 to day 12 where it reached a
maximum of 1170 ± 68 mg kg-1. It then decreased slightly and the mean leachable S
concentration between day 16 and 62 was 907 ± 35 mg kg-1.
5.4.4.1 Comparison of batch leaching Cr, Fe and Mn results with those for column leaching of
Polmadie Burn Bottom Sediments
In the sediment batch leachate Cr concentrations was significantly lower than in the soil batch
leachate. This was also observed for Cr concentrations in the column experiments. The
sediment column Cr concentration followed the same trend as the soil Cr concentration with
181
a decrease in Weeks 0-2 and then increase between Weeks 2-4 which was also observed in
the leachable Cr in the sediment batch experiment (Figure 5-21A and Figure 5-23A). The initial
sediment batch Cr concentration on Day 0 was 226 ± 41 µg kg-1 which decreased rapidly to
4.66 ± 0.31 µg kg-1 on Day 16 and then increased to 15.9 ± 2.7 µg kg-1 after 26 days of drying.
After a drying time of 26 days Cr(VI) was observed in the sediment batch leachate. No Cr(VI)
was detected in the sediment column leachate.
The trend observed in the sediment column leachate was Fe concentration to decrease as
drying time increased. This was also observed in batch sediment leachates over the same
time intervals but at different rates. Initial Fe concentrations in the sediment batch leachate
was 254 ± 41 µg kg-1 which decreased to 1.21 ± 0.20 and 2.47 ± 1.0 µg kg-1 after the drying
times of 16 and 26 days, respectively. The sediment column Mn leachate concentration did
not follow the same trend as in the sediment batch leachate. In the sediment column leachate
the Mn concentration increased between Week 0 and Week 2 and then decreased between
Week 2 and Week 4, however the sediment batch Mn leachate concentration decreased from
198 ± 1.8 on Day 0 to 58.6 ± 5.21 µg kg-1 on Day 16 and then increased to 191 ± 11 µg kg-1.
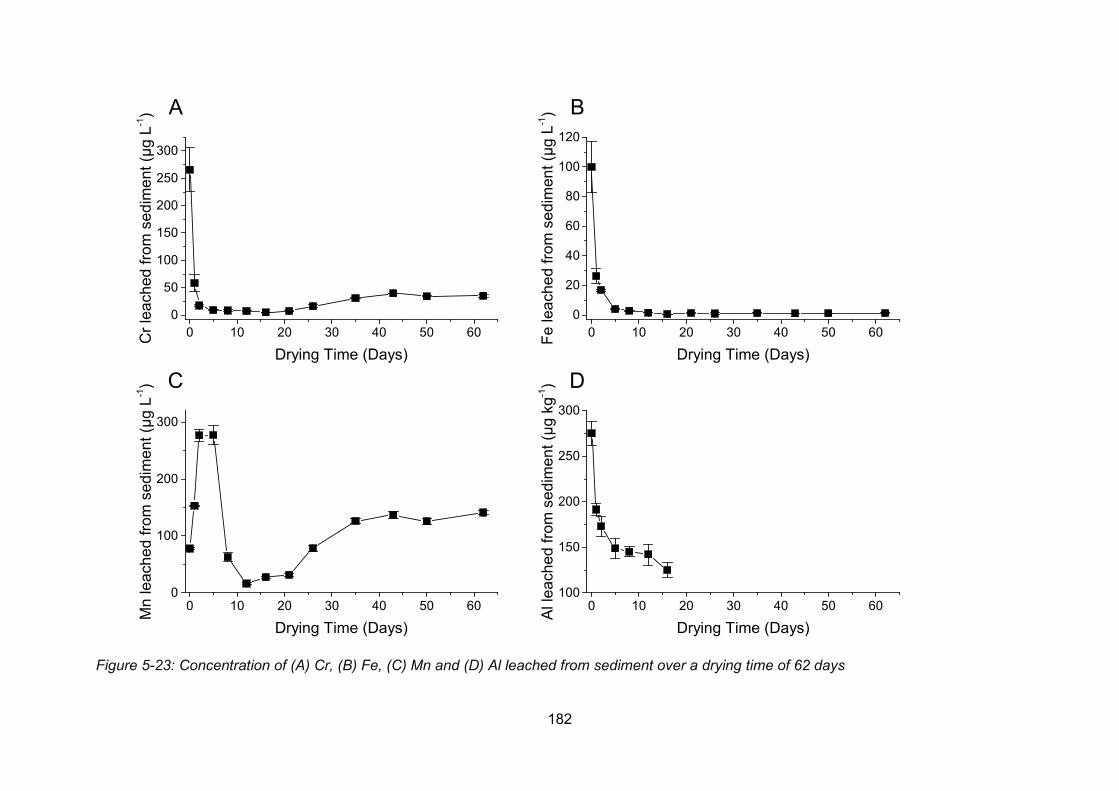
182
Figure 5-23: Concentration of (A) Cr, (B) Fe, (C) Mn and (D) Al leached from sediment over a drying time of 62 days
0 10 20 30 40 50 600
50
100
150
200
250
300
0 10 20 30 40 50 600
20
40
60
80
100
120
0 10 20 30 40 50 600
100
200
300
0 10 20 30 40 50 60100
150
200
250
300
Cr l
each
ed fr
om s
edim
ent (
µg L
-1)
Drying Time (Days)
A
Fe le
ache
d fro
m s
edim
ent (
µg L
-1)
Drying Time (Days)
BM
n le
ache
d fro
m s
edim
ent (
µg L
-1)
Drying Time (Days)
C
Al le
ache
d fro
m s
edim
ent (
µg k
g-1)
Drying Time (Days)
D
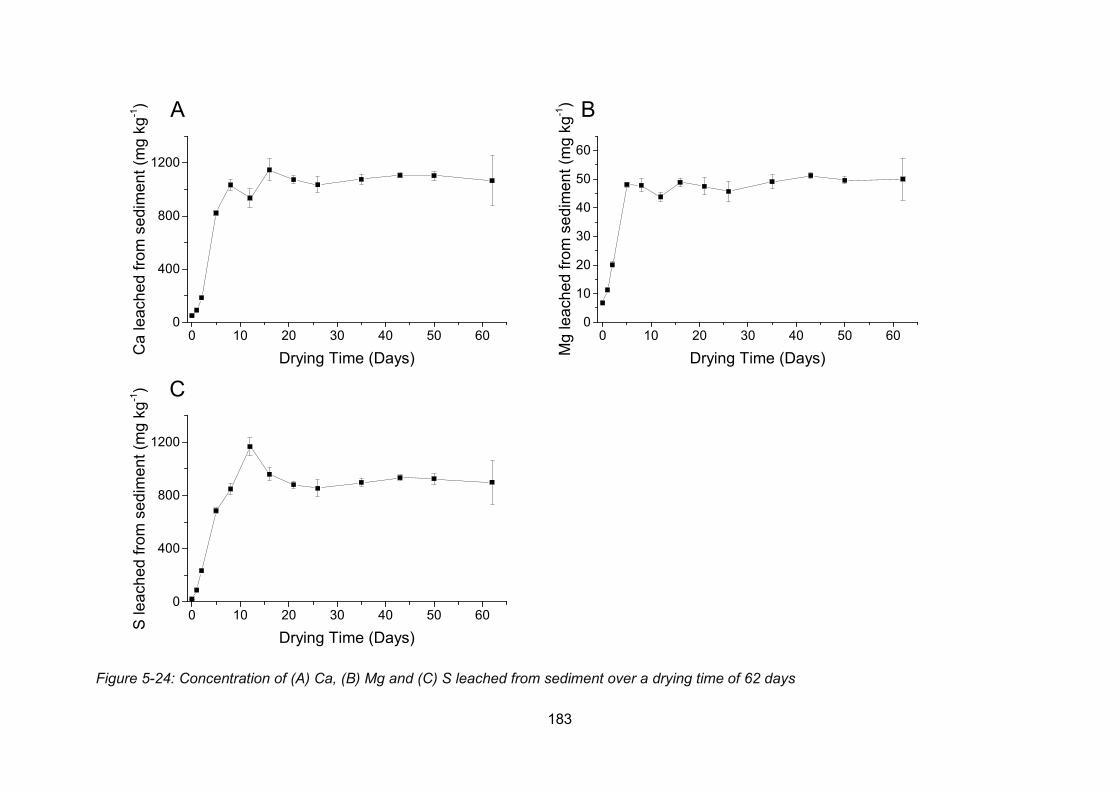
183
Figure 5-24: Concentration of (A) Ca, (B) Mg and (C) S leached from sediment over a drying time of 62 days
0 10 20 30 40 50 600
400
800
1200
0 10 20 30 40 50 600
10
20
30
40
50
60
0 10 20 30 40 50 600
400
800
1200
Ca
leac
hed
from
sed
imen
t (m
g kg
-1)
Drying Time (Days)
A
Mg
leac
hed
from
sed
imen
t (m
g kg
-1)
Drying Time (Days)
BS
leac
hed
from
sed
imen
t (m
g kg
-1)
Drying Time (Days)
C
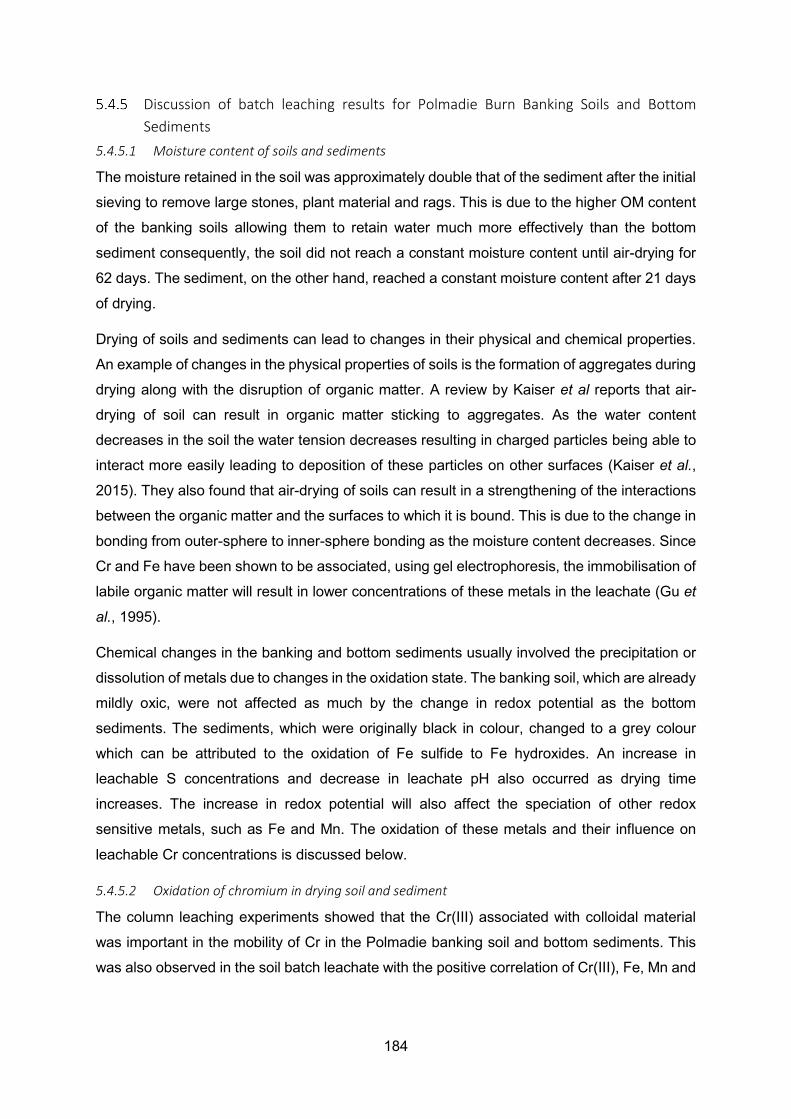
184
Discussion of batch leaching results for Polmadie Burn Banking Soils and Bottom Sediments
5.4.5.1 Moisture content of soils and sediments
The moisture retained in the soil was approximately double that of the sediment after the initial
sieving to remove large stones, plant material and rags. This is due to the higher OM content
of the banking soils allowing them to retain water much more effectively than the bottom
sediment consequently, the soil did not reach a constant moisture content until air-drying for
62 days. The sediment, on the other hand, reached a constant moisture content after 21 days
of drying.
Drying of soils and sediments can lead to changes in their physical and chemical properties.
An example of changes in the physical properties of soils is the formation of aggregates during
drying along with the disruption of organic matter. A review by Kaiser et al reports that air-
drying of soil can result in organic matter sticking to aggregates. As the water content
decreases in the soil the water tension decreases resulting in charged particles being able to
interact more easily leading to deposition of these particles on other surfaces (Kaiser et al.,
2015). They also found that air-drying of soils can result in a strengthening of the interactions
between the organic matter and the surfaces to which it is bound. This is due to the change in
bonding from outer-sphere to inner-sphere bonding as the moisture content decreases. Since
Cr and Fe have been shown to be associated, using gel electrophoresis, the immobilisation of
labile organic matter will result in lower concentrations of these metals in the leachate (Gu et
al., 1995).
Chemical changes in the banking and bottom sediments usually involved the precipitation or
dissolution of metals due to changes in the oxidation state. The banking soil, which are already
mildly oxic, were not affected as much by the change in redox potential as the bottom
sediments. The sediments, which were originally black in colour, changed to a grey colour
which can be attributed to the oxidation of Fe sulfide to Fe hydroxides. An increase in
leachable S concentrations and decrease in leachate pH also occurred as drying time
increases. The increase in redox potential will also affect the speciation of other redox
sensitive metals, such as Fe and Mn. The oxidation of these metals and their influence on
leachable Cr concentrations is discussed below.
5.4.5.2 Oxidation of chromium in drying soil and sediment
The column leaching experiments showed that the Cr(III) associated with colloidal material
was important in the mobility of Cr in the Polmadie banking soil and bottom sediments. This
was also observed in the soil batch leachate with the positive correlation of Cr(III), Fe, Mn and
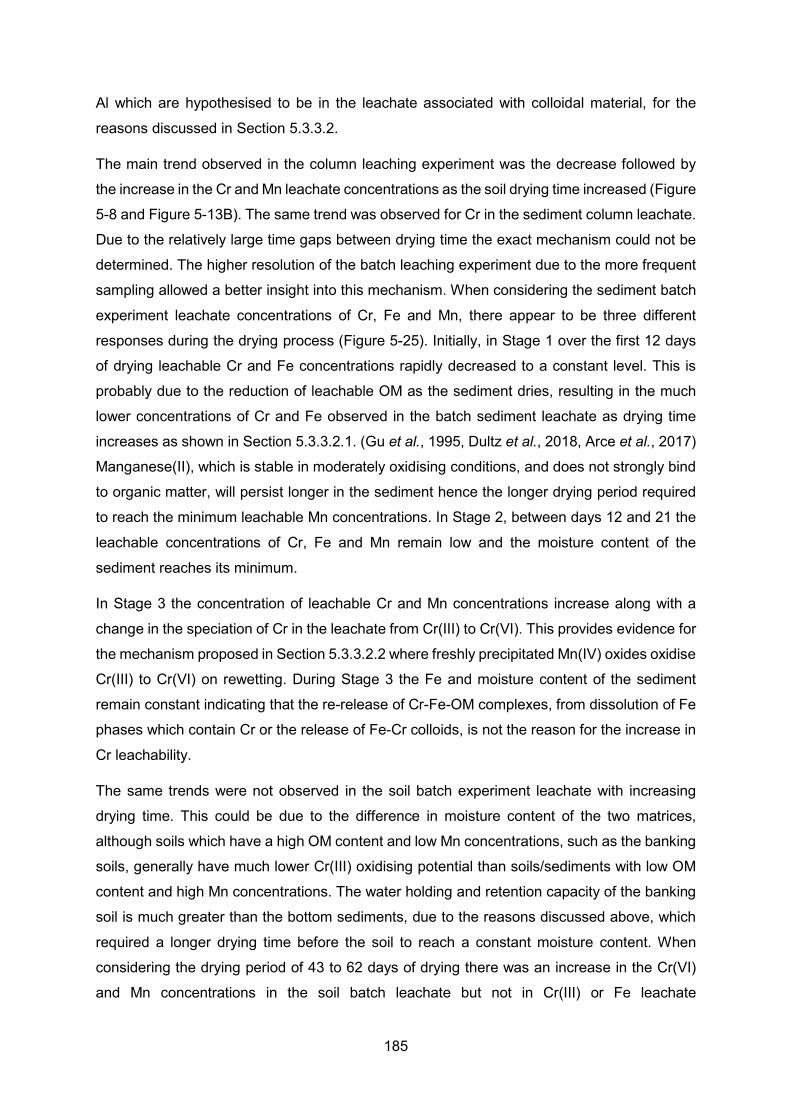
185
Al which are hypothesised to be in the leachate associated with colloidal material, for the
reasons discussed in Section 5.3.3.2.
The main trend observed in the column leaching experiment was the decrease followed by
the increase in the Cr and Mn leachate concentrations as the soil drying time increased (Figure
5-8 and Figure 5-13B). The same trend was observed for Cr in the sediment column leachate.
Due to the relatively large time gaps between drying time the exact mechanism could not be
determined. The higher resolution of the batch leaching experiment due to the more frequent
sampling allowed a better insight into this mechanism. When considering the sediment batch
experiment leachate concentrations of Cr, Fe and Mn, there appear to be three different
responses during the drying process (Figure 5-25). Initially, in Stage 1 over the first 12 days
of drying leachable Cr and Fe concentrations rapidly decreased to a constant level. This is
probably due to the reduction of leachable OM as the sediment dries, resulting in the much
lower concentrations of Cr and Fe observed in the batch sediment leachate as drying time
increases as shown in Section 5.3.3.2.1. (Gu et al., 1995, Dultz et al., 2018, Arce et al., 2017)
Manganese(II), which is stable in moderately oxidising conditions, and does not strongly bind
to organic matter, will persist longer in the sediment hence the longer drying period required
to reach the minimum leachable Mn concentrations. In Stage 2, between days 12 and 21 the
leachable concentrations of Cr, Fe and Mn remain low and the moisture content of the
sediment reaches its minimum.
In Stage 3 the concentration of leachable Cr and Mn concentrations increase along with a
change in the speciation of Cr in the leachate from Cr(III) to Cr(VI). This provides evidence for
the mechanism proposed in Section 5.3.3.2.2 where freshly precipitated Mn(IV) oxides oxidise
Cr(III) to Cr(VI) on rewetting. During Stage 3 the Fe and moisture content of the sediment
remain constant indicating that the re-release of Cr-Fe-OM complexes, from dissolution of Fe
phases which contain Cr or the release of Fe-Cr colloids, is not the reason for the increase in
Cr leachability.
The same trends were not observed in the soil batch experiment leachate with increasing
drying time. This could be due to the difference in moisture content of the two matrices,
although soils which have a high OM content and low Mn concentrations, such as the banking
soils, generally have much lower Cr(III) oxidising potential than soils/sediments with low OM
content and high Mn concentrations. The water holding and retention capacity of the banking
soil is much greater than the bottom sediments, due to the reasons discussed above, which
required a longer drying time before the soil to reach a constant moisture content. When
considering the drying period of 43 to 62 days of drying there was an increase in the Cr(VI)
and Mn concentrations in the soil batch leachate but not in Cr(III) or Fe leachate

186
concentrations. A longer period of drying would be required to confirm this trend but the
oxidation of Cr(III) in dried bottom sediments is more likely that in the highly organic banking
soil.
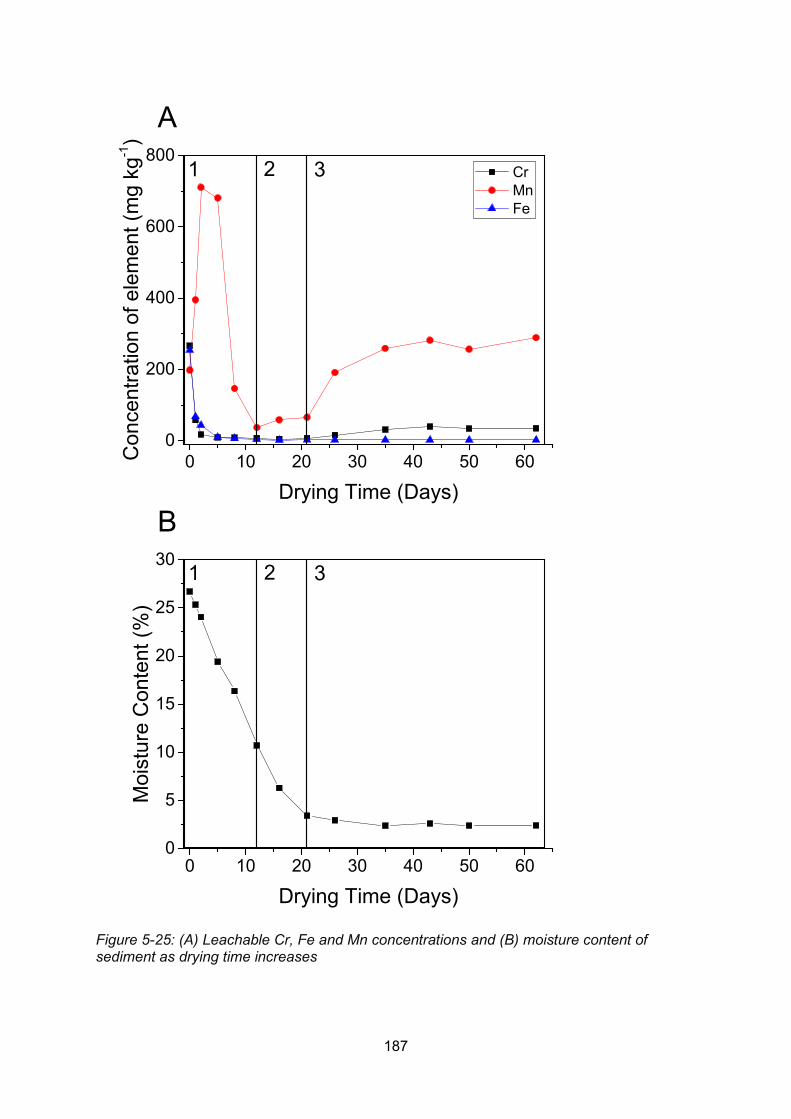
187
Figure 5-25: (A) Leachable Cr, Fe and Mn concentrations and (B) moisture content of sediment as drying time increases
0 10 20 30 40 50 600
200
400
600
800
0 10 20 30 40 50 600
5
10
15
20
25
30
Con
cent
ratio
n of
ele
men
t (m
g kg
-1)
Drying Time (Days)
Cr Mn Fe
A1 2 3
Moi
stur
e C
onte
nt (%
)
Drying Time (Days)
B1 2 3
188
Summary Like the column drying experiment there was a significant larger concentration of Cr leached
from the banking soil compared to the bottom sediment. As drying time increased the
concentration of Cr(III) and Cr(VI) in the leachate upon rewetting tended to decrease. The soil
batch leachate Cr(III) concentrations were positively correlated with Fe, Mn and Al. At pH > 5
Cr(III) is very insoluble, therefore its presence in the leachate is due associations with colloidal
material and OM. As soil dries the disruption of OM and the formation of aggregates will
decrease the leachability of Cr(III). Leachate Cr(VI) concentrations also tended to decrease
as drying time increased, leading to an overall reduction of Cr released upon rewetting as
drying time of soil increases.
The release of Cr upon rewetting of sediment dried for different lengths of time showed a
different trend to the soils. The increase in redox potential as the sediment dries leads to the
oxidation of Fe and Mn which precipitate to form Fe and Mn(IV) oxides. The freshly
precipitated Mn(IV) oxides oxidise Cr(III) upon rewetting resulting in the release of Cr(VI) and
Mn(II). This process was not seen in the air-dried soils which contained high OM content and
low Mn concentrations which have been shown in the literature to have a low oxidation
potential for Cr(III).
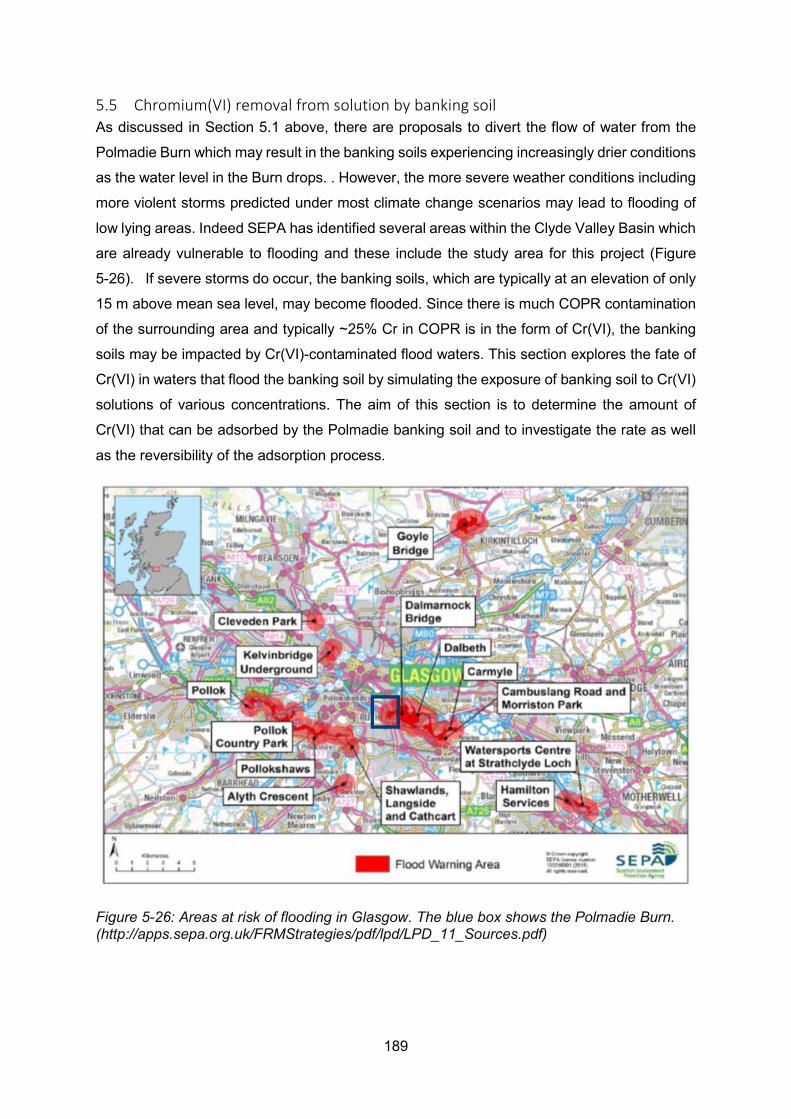
189
5.5 Chromium(VI) removal from solution by banking soil As discussed in Section 5.1 above, there are proposals to divert the flow of water from the
Polmadie Burn which may result in the banking soils experiencing increasingly drier conditions
as the water level in the Burn drops. . However, the more severe weather conditions including
more violent storms predicted under most climate change scenarios may lead to flooding of
low lying areas. Indeed SEPA has identified several areas within the Clyde Valley Basin which
are already vulnerable to flooding and these include the study area for this project (Figure
5-26). If severe storms do occur, the banking soils, which are typically at an elevation of only
15 m above mean sea level, may become flooded. Since there is much COPR contamination
of the surrounding area and typically ~25% Cr in COPR is in the form of Cr(VI), the banking
soils may be impacted by Cr(VI)-contaminated flood waters. This section explores the fate of
Cr(VI) in waters that flood the banking soil by simulating the exposure of banking soil to Cr(VI)
solutions of various concentrations. The aim of this section is to determine the amount of
Cr(VI) that can be adsorbed by the Polmadie banking soil and to investigate the rate as well
as the reversibility of the adsorption process.
Figure 5-26: Areas at risk of flooding in Glasgow. The blue box shows the Polmadie Burn. (http://apps.sepa.org.uk/FRMStrategies/pdf/lpd/LPD_11_Sources.pdf)
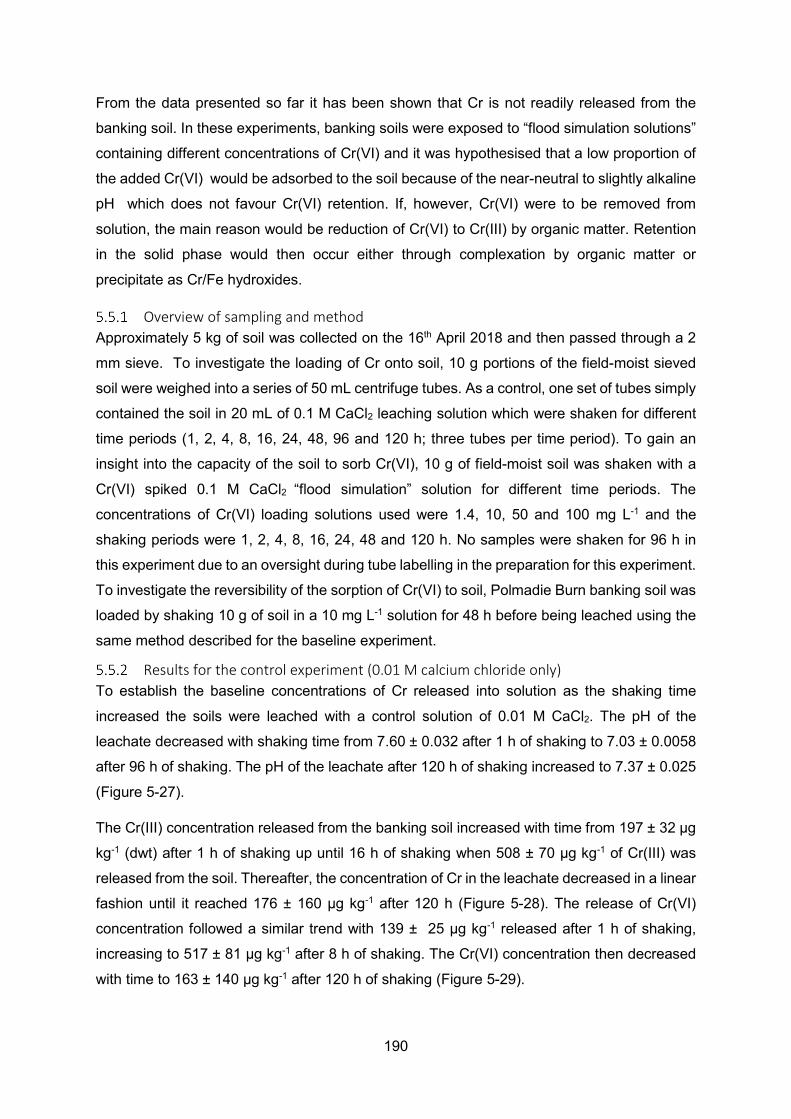
190
From the data presented so far it has been shown that Cr is not readily released from the
banking soil. In these experiments, banking soils were exposed to “flood simulation solutions”
containing different concentrations of Cr(VI) and it was hypothesised that a low proportion of
the added Cr(VI) would be adsorbed to the soil because of the near-neutral to slightly alkaline
pH which does not favour Cr(VI) retention. If, however, Cr(VI) were to be removed from
solution, the main reason would be reduction of Cr(VI) to Cr(III) by organic matter. Retention
in the solid phase would then occur either through complexation by organic matter or
precipitate as Cr/Fe hydroxides.
Overview of sampling and method Approximately 5 kg of soil was collected on the 16th April 2018 and then passed through a 2
mm sieve. To investigate the loading of Cr onto soil, 10 g portions of the field-moist sieved
soil were weighed into a series of 50 mL centrifuge tubes. As a control, one set of tubes simply
contained the soil in 20 mL of 0.1 M CaCl2 leaching solution which were shaken for different
time periods (1, 2, 4, 8, 16, 24, 48, 96 and 120 h; three tubes per time period). To gain an
insight into the capacity of the soil to sorb Cr(VI), 10 g of field-moist soil was shaken with a
Cr(VI) spiked 0.1 M CaCl2 “flood simulation” solution for different time periods. The
concentrations of Cr(VI) loading solutions used were 1.4, 10, 50 and 100 mg L-1 and the
shaking periods were 1, 2, 4, 8, 16, 24, 48 and 120 h. No samples were shaken for 96 h in
this experiment due to an oversight during tube labelling in the preparation for this experiment.
To investigate the reversibility of the sorption of Cr(VI) to soil, Polmadie Burn banking soil was
loaded by shaking 10 g of soil in a 10 mg L-1 solution for 48 h before being leached using the
same method described for the baseline experiment.
Results for the control experiment (0.01 M calcium chloride only) To establish the baseline concentrations of Cr released into solution as the shaking time
increased the soils were leached with a control solution of 0.01 M CaCl2. The pH of the
leachate decreased with shaking time from 7.60 ± 0.032 after 1 h of shaking to 7.03 ± 0.0058
after 96 h of shaking. The pH of the leachate after 120 h of shaking increased to 7.37 ± 0.025
(Figure 5-27).
The Cr(III) concentration released from the banking soil increased with time from 197 ± 32 µg
kg-1 (dwt) after 1 h of shaking up until 16 h of shaking when 508 ± 70 µg kg-1 of Cr(III) was
released from the soil. Thereafter, the concentration of Cr in the leachate decreased in a linear
fashion until it reached 176 ± 160 µg kg-1 after 120 h (Figure 5-28). The release of Cr(VI)
concentration followed a similar trend with 139 ± 25 µg kg-1 released after 1 h of shaking,
increasing to 517 ± 81 µg kg-1 after 8 h of shaking. The Cr(VI) concentration then decreased
with time to 163 ± 140 µg kg-1 after 120 h of shaking (Figure 5-29).
191
Figure 5-27: Baseline leachate pH variation with shaking time
The same trend described for Cr was observed for Fe, Mn and Al which were directly
correlated (Appendix 1) with the (total) Cr concentration released from the soil (Figure 5-30).
The concentrations of Ca, Mg and S released from the soil increased with shaking time but
did not follow the same trend as Cr, Fe, Mn and Al. Although the concentrations of each of Ca,
Mg and S increased over most/all of the experimental period (100 h for Ca, 120 h for Mg and
S), there was a stronger correlation between the concentrations of Ca and Mg (Figure 5-31).
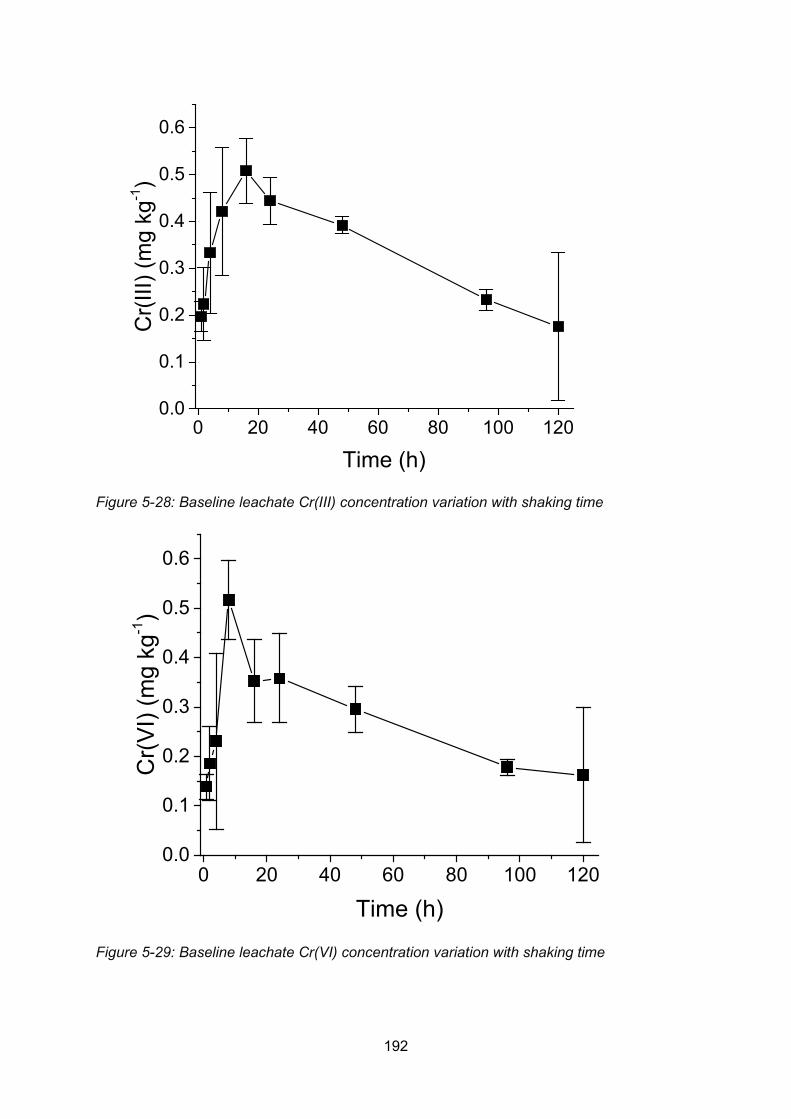
192
Figure 5-28: Baseline leachate Cr(III) concentration variation with shaking time
Figure 5-29: Baseline leachate Cr(VI) concentration variation with shaking time
0 20 40 60 80 100 1200.0
0.1
0.2
0.3
0.4
0.5
0.6C
r(III)
(mg
kg-1)
Time (h)
0 20 40 60 80 100 1200.0
0.1
0.2
0.3
0.4
0.5
0.6
Cr(V
I) (m
g kg
-1)
Time (h)
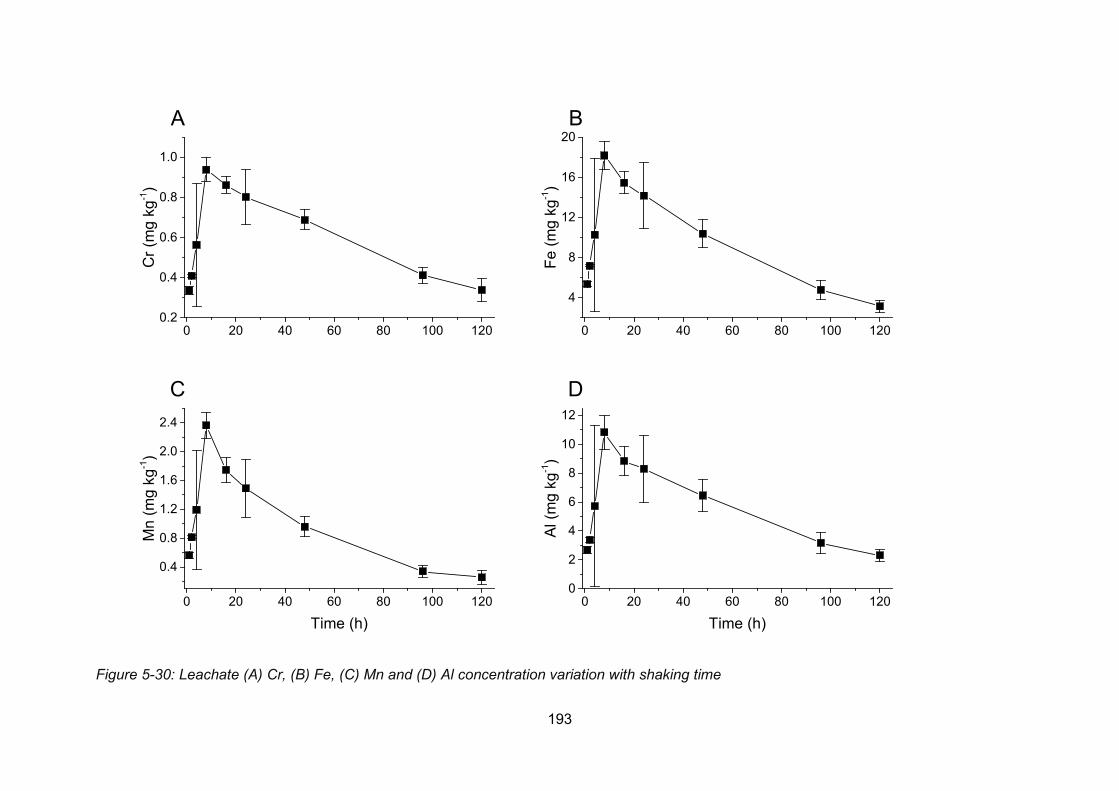
193
Figure 5-30: Leachate (A) Cr, (B) Fe, (C) Mn and (D) Al concentration variation with shaking time
0 20 40 60 80 100 1200.2
0.4
0.6
0.8
1.0
0 20 40 60 80 100 120
4
8
12
16
20
0 20 40 60 80 100 120
0.4
0.8
1.2
1.6
2.0
2.4
0 20 40 60 80 100 1200
2
4
6
8
10
12
Cr (
mg
kg-1)
A
Fe (m
g kg
-1)
BM
n (m
g kg
-1)
Time (h)
C
Al (m
g kg
-1)
Time (h)
D
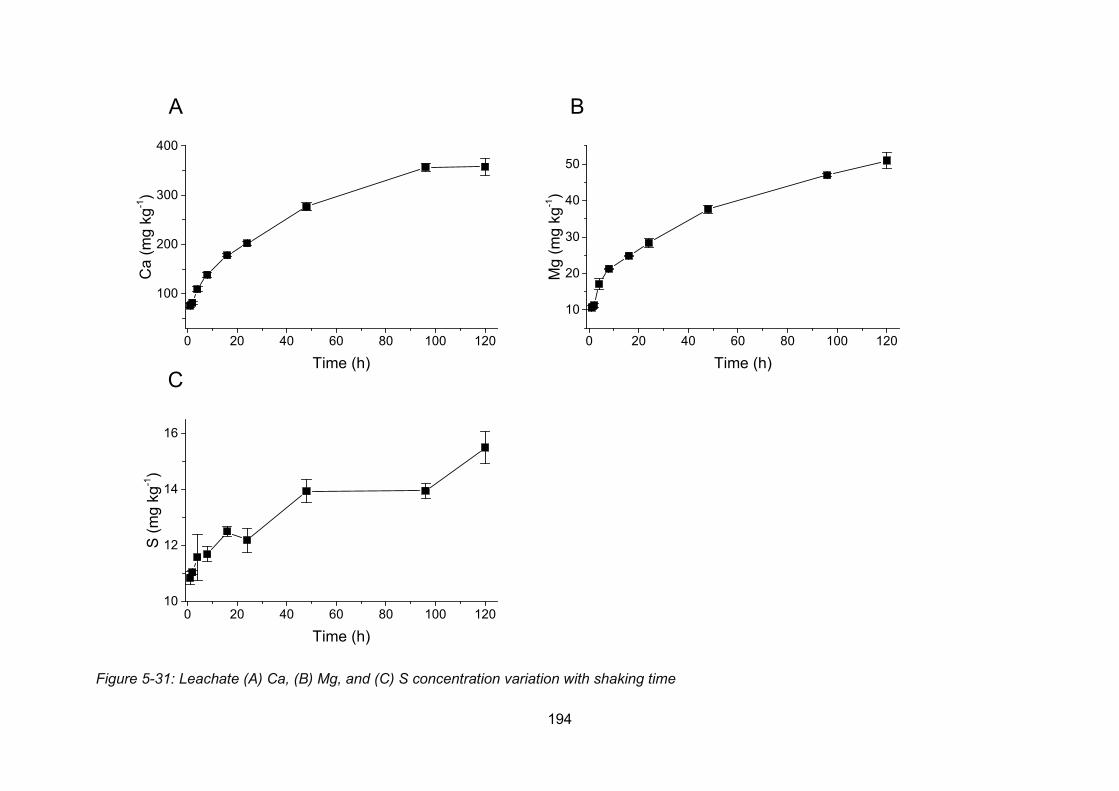
194
Figure 5-31: Leachate (A) Ca, (B) Mg, and (C) S concentration variation with shaking time
0 20 40 60 80 100 120
100
200
300
400
0 20 40 60 80 100 120
10
20
30
40
50
0 20 40 60 80 100 12010
12
14
16
Ca
(mg
kg-1)
Time (h)
A
Mg
(mg
kg-1)
Time (h)
B
S (m
g kg
-1)
Time (h)
C
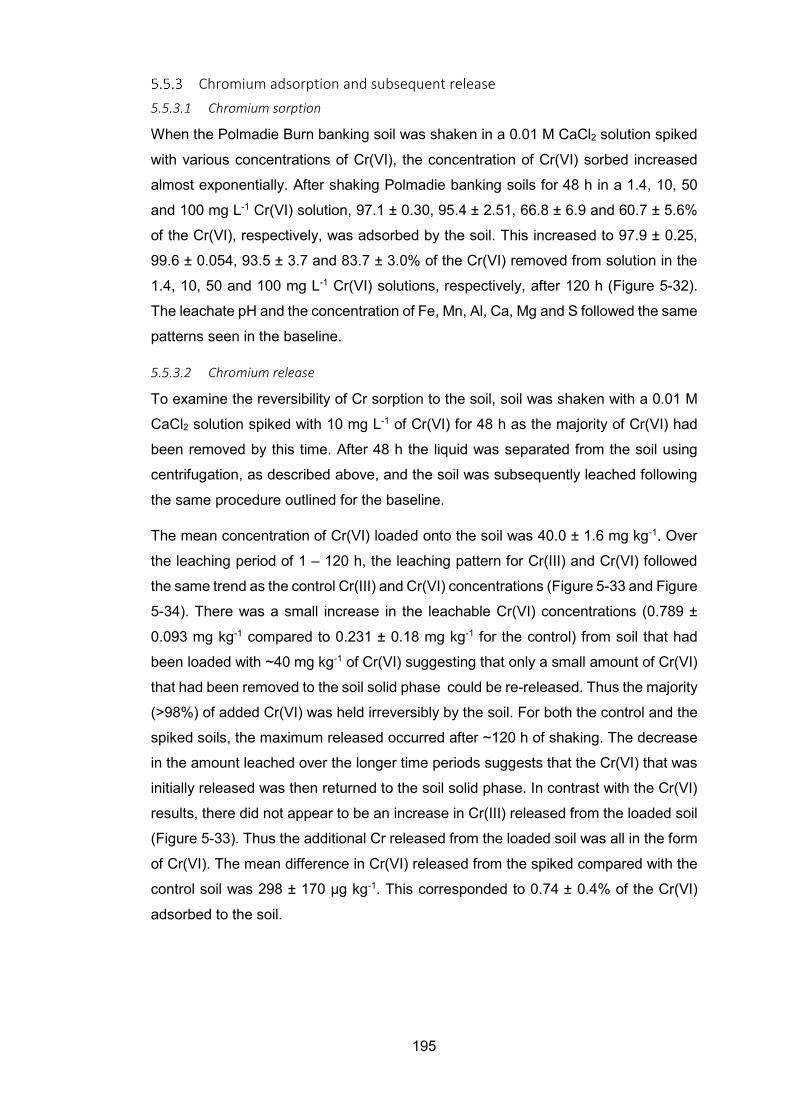
195
Chromium adsorption and subsequent release 5.5.3.1 Chromium sorption
When the Polmadie Burn banking soil was shaken in a 0.01 M CaCl2 solution spiked
with various concentrations of Cr(VI), the concentration of Cr(VI) sorbed increased
almost exponentially. After shaking Polmadie banking soils for 48 h in a 1.4, 10, 50
and 100 mg L-1 Cr(VI) solution, 97.1 ± 0.30, 95.4 ± 2.51, 66.8 ± 6.9 and 60.7 ± 5.6%
of the Cr(VI), respectively, was adsorbed by the soil. This increased to 97.9 ± 0.25,
99.6 ± 0.054, 93.5 ± 3.7 and 83.7 ± 3.0% of the Cr(VI) removed from solution in the
1.4, 10, 50 and 100 mg L-1 Cr(VI) solutions, respectively, after 120 h (Figure 5-32).
The leachate pH and the concentration of Fe, Mn, Al, Ca, Mg and S followed the same
patterns seen in the baseline.
5.5.3.2 Chromium release
To examine the reversibility of Cr sorption to the soil, soil was shaken with a 0.01 M
CaCl2 solution spiked with 10 mg L-1 of Cr(VI) for 48 h as the majority of Cr(VI) had
been removed by this time. After 48 h the liquid was separated from the soil using
centrifugation, as described above, and the soil was subsequently leached following
the same procedure outlined for the baseline.
The mean concentration of Cr(VI) loaded onto the soil was 40.0 ± 1.6 mg kg-1. Over
the leaching period of 1 – 120 h, the leaching pattern for Cr(III) and Cr(VI) followed
the same trend as the control Cr(III) and Cr(VI) concentrations (Figure 5-33 and Figure
5-34). There was a small increase in the leachable Cr(VI) concentrations (0.789 ±
0.093 mg kg-1 compared to 0.231 ± 0.18 mg kg-1 for the control) from soil that had
been loaded with ~40 mg kg-1 of Cr(VI) suggesting that only a small amount of Cr(VI)
that had been removed to the soil solid phase could be re-released. Thus the majority
(>98%) of added Cr(VI) was held irreversibly by the soil. For both the control and the
spiked soils, the maximum released occurred after ~120 h of shaking. The decrease
in the amount leached over the longer time periods suggests that the Cr(VI) that was
initially released was then returned to the soil solid phase. In contrast with the Cr(VI)
results, there did not appear to be an increase in Cr(III) released from the loaded soil
(Figure 5-33). Thus the additional Cr released from the loaded soil was all in the form
of Cr(VI). The mean difference in Cr(VI) released from the spiked compared with the
control soil was 298 ± 170 µg kg-1. This corresponded to 0.74 ± 0.4% of the Cr(VI)
adsorbed to the soil.
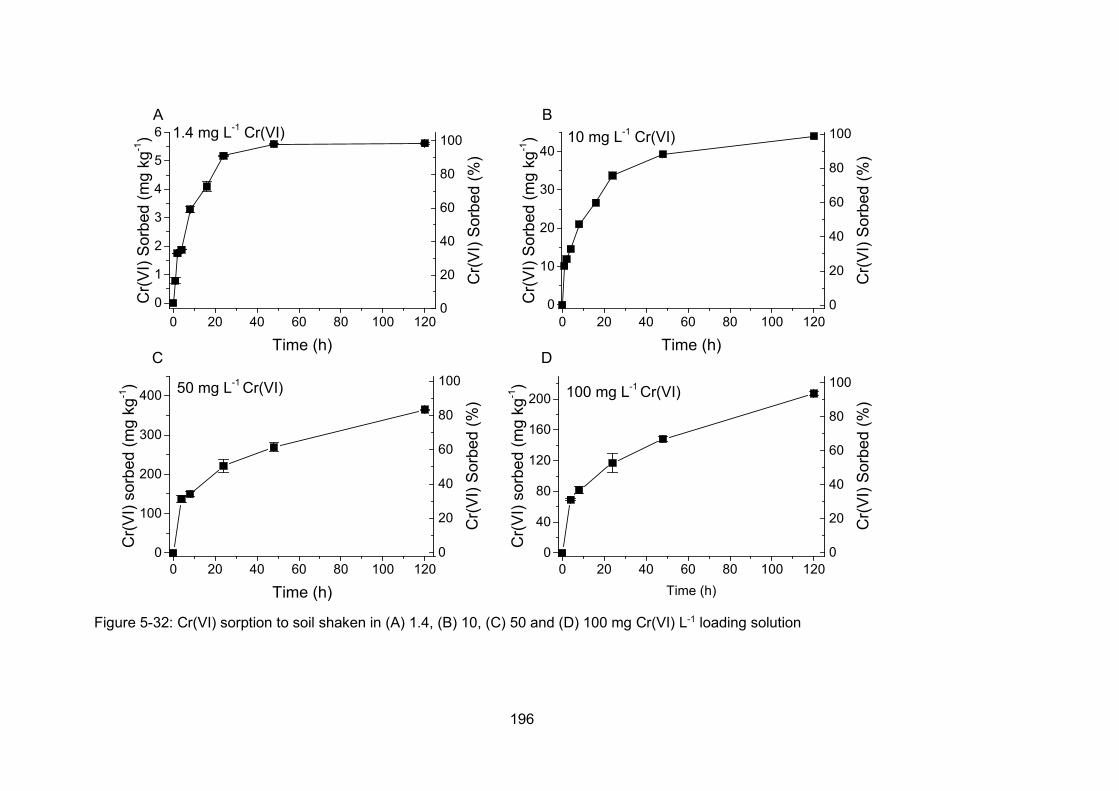
196
Figure 5-32: Cr(VI) sorption to soil shaken in (A) 1.4, (B) 10, (C) 50 and (D) 100 mg Cr(VI) L-1 loading solution
0 20 40 60 80 100 1200
1
2
3
4
5
6
0 20 40 60 80 100 1200
10
20
30
40
0 20 40 60 80 100 1200
100
200
300
400
0 20 40 60 80 100 1200
40
80
120
160
200
Cr(V
I) So
rbed
(mg
kg-1)
Time (h)
A
0
20
40
60
80
100
Cr(V
I) So
rbed
(%)
10 mg L-1 Cr(VI)
Cr(V
I) So
rbed
(mg
kg-1)
Time (h)
B1.4 mg L-1 Cr(VI)
0
20
40
60
80
100
Cr(V
I) So
rbed
(%)
50 mg L-1 Cr(VI)
Cr(V
I) so
rbed
(mg
kg-1)
Time (h)
C
0
20
40
60
80
100
Cr(V
I) So
rbed
(%) 100 mg L-1 Cr(VI)
Cr(V
I) so
rbed
(mg
kg-1)
Time (h)
D
0
20
40
60
80
100
Cr(V
I) So
rbed
(%)
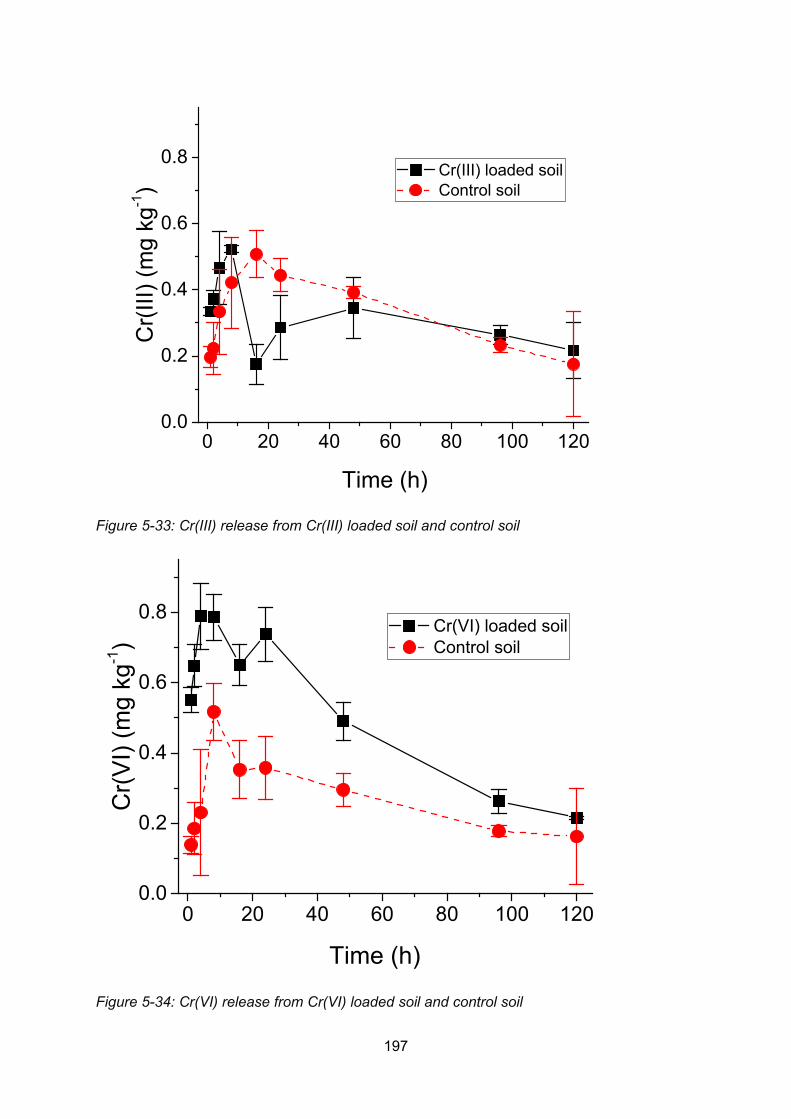
197
Figure 5-33: Cr(III) release from Cr(III) loaded soil and control soil
Figure 5-34: Cr(VI) release from Cr(VI) loaded soil and control soil
0 20 40 60 80 100 1200.0
0.2
0.4
0.6
0.8C
r(III)
(mg
kg-1)
Time (h)
Cr(III) loaded soil Control soil
0 20 40 60 80 100 1200.0
0.2
0.4
0.6
0.8
Cr(V
I) (m
g kg
-1)
Time (h)
Cr(VI) loaded soil Control soil
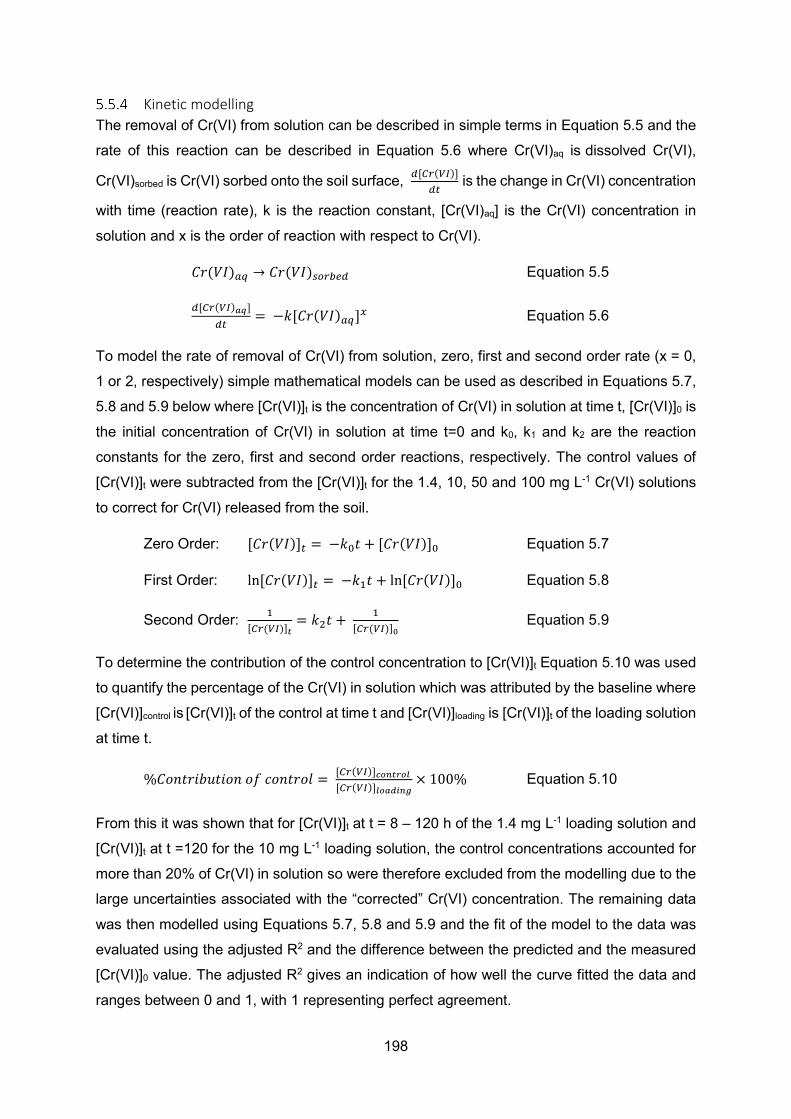
198
Kinetic modelling The removal of Cr(VI) from solution can be described in simple terms in Equation 5.5 and the
rate of this reaction can be described in Equation 5.6 where Cr(VI)aq is dissolved Cr(VI),
Cr(VI)sorbed is Cr(VI) sorbed onto the soil surface, 𝑑𝑑[𝐶𝐶𝑑𝑑(𝑉𝑉𝑉𝑉)]𝑑𝑑𝑡𝑡
is the change in Cr(VI) concentration
with time (reaction rate), k is the reaction constant, [Cr(VI)aq] is the Cr(VI) concentration in
solution and x is the order of reaction with respect to Cr(VI).
𝐶𝐶𝐶𝐶(𝑉𝑉𝑉𝑉)𝑚𝑚𝑎𝑎 → 𝐶𝐶𝐶𝐶(𝑉𝑉𝑉𝑉)𝑚𝑚𝑜𝑜𝑑𝑑𝑠𝑠𝑜𝑜𝑑𝑑 Equation 5.5
𝑑𝑑[𝐶𝐶𝑑𝑑(𝑉𝑉𝑉𝑉)𝑎𝑎𝑎𝑎]𝑑𝑑𝑡𝑡
= −𝑘𝑘[𝐶𝐶𝐶𝐶(𝑉𝑉𝑉𝑉)𝑚𝑚𝑎𝑎]𝑥𝑥 Equation 5.6
To model the rate of removal of Cr(VI) from solution, zero, first and second order rate (x = 0,
1 or 2, respectively) simple mathematical models can be used as described in Equations 5.7,
5.8 and 5.9 below where [Cr(VI)]t is the concentration of Cr(VI) in solution at time t, [Cr(VI)]0 is
the initial concentration of Cr(VI) in solution at time t=0 and k0, k1 and k2 are the reaction
constants for the zero, first and second order reactions, respectively. The control values of
[Cr(VI)]t were subtracted from the [Cr(VI)]t for the 1.4, 10, 50 and 100 mg L-1 Cr(VI) solutions
to correct for Cr(VI) released from the soil.
Zero Order: [𝐶𝐶𝐶𝐶(𝑉𝑉𝑉𝑉)]𝑡𝑡 = −𝑘𝑘0𝑚𝑚 + [𝐶𝐶𝐶𝐶(𝑉𝑉𝑉𝑉)]0 Equation 5.7
First Order: ln[𝐶𝐶𝐶𝐶(𝑉𝑉𝑉𝑉)]𝑡𝑡 = −𝑘𝑘1𝑚𝑚 + ln[𝐶𝐶𝐶𝐶(𝑉𝑉𝑉𝑉)]0 Equation 5.8
Second Order: 1[𝐶𝐶𝑑𝑑(𝑉𝑉𝑉𝑉)]𝑡𝑡
= 𝑘𝑘2𝑚𝑚 + 1[𝐶𝐶𝑑𝑑(𝑉𝑉𝑉𝑉)]0
Equation 5.9
To determine the contribution of the control concentration to [Cr(VI)]t Equation 5.10 was used
to quantify the percentage of the Cr(VI) in solution which was attributed by the baseline where
[Cr(VI)]control is [Cr(VI)]t of the control at time t and [Cr(VI)]loading is [Cr(VI)]t of the loading solution
at time t.
%𝐶𝐶𝑜𝑜𝑜𝑜𝑚𝑚𝐶𝐶𝑜𝑜𝐶𝐶𝐶𝐶𝑚𝑚𝑜𝑜𝑜𝑜𝑜𝑜 𝑜𝑜𝑜𝑜 𝑜𝑜𝑜𝑜𝑜𝑜𝑚𝑚𝐶𝐶𝑜𝑜𝑙𝑙 = [𝐶𝐶𝑑𝑑(𝑉𝑉𝑉𝑉)]𝑐𝑐𝑐𝑐𝑐𝑐𝑡𝑡𝑐𝑐𝑐𝑐𝑐𝑐 [𝐶𝐶𝑑𝑑(𝑉𝑉𝑉𝑉)]𝑐𝑐𝑐𝑐𝑎𝑎𝑙𝑙𝑙𝑙𝑐𝑐𝑙𝑙
× 100% Equation 5.10
From this it was shown that for [Cr(VI)]t at t = 8 – 120 h of the 1.4 mg L-1 loading solution and
[Cr(VI)]t at t =120 for the 10 mg L-1 loading solution, the control concentrations accounted for
more than 20% of Cr(VI) in solution so were therefore excluded from the modelling due to the
large uncertainties associated with the “corrected” Cr(VI) concentration. The remaining data
was then modelled using Equations 5.7, 5.8 and 5.9 and the fit of the model to the data was
evaluated using the adjusted R2 and the difference between the predicted and the measured
[Cr(VI)]0 value. The adjusted R2 gives an indication of how well the curve fitted the data and
ranges between 0 and 1, with 1 representing perfect agreement.
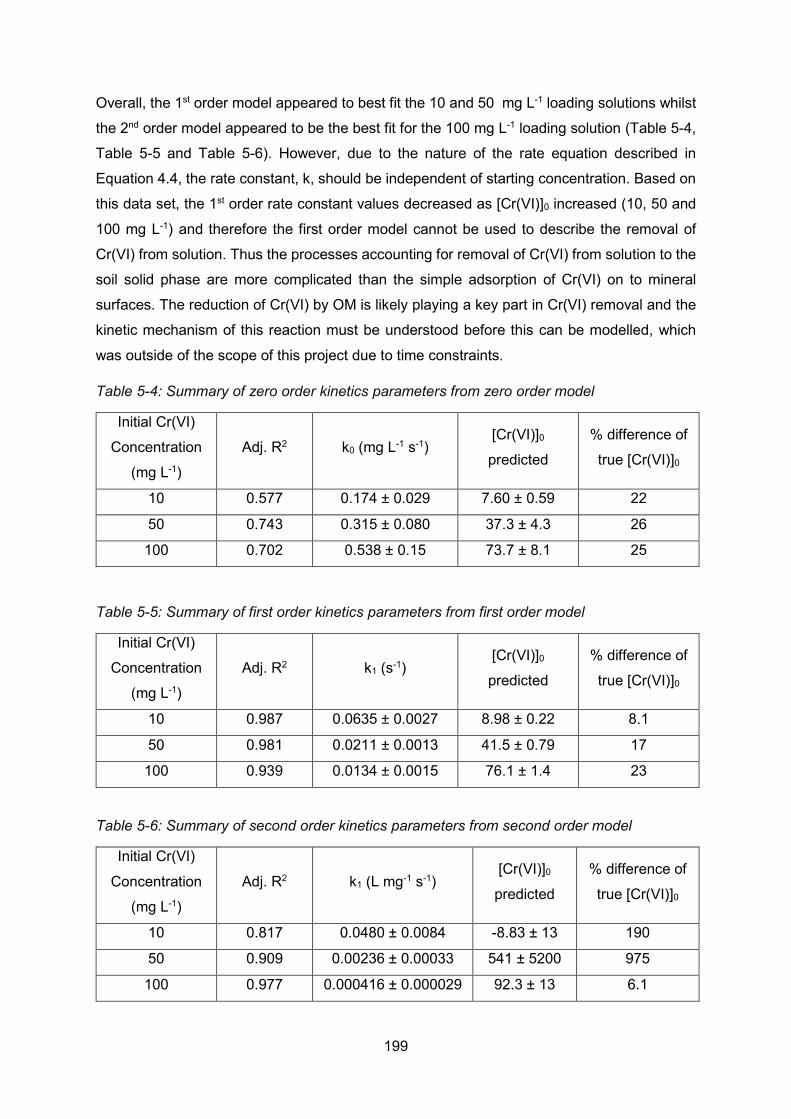
199
Overall, the 1st order model appeared to best fit the 10 and 50 mg L-1 loading solutions whilst
the 2nd order model appeared to be the best fit for the 100 mg L-1 loading solution (Table 5-4,
Table 5-5 and Table 5-6). However, due to the nature of the rate equation described in
Equation 4.4, the rate constant, k, should be independent of starting concentration. Based on
this data set, the 1st order rate constant values decreased as [Cr(VI)]0 increased (10, 50 and
100 mg L-1) and therefore the first order model cannot be used to describe the removal of
Cr(VI) from solution. Thus the processes accounting for removal of Cr(VI) from solution to the
soil solid phase are more complicated than the simple adsorption of Cr(VI) on to mineral
surfaces. The reduction of Cr(VI) by OM is likely playing a key part in Cr(VI) removal and the
kinetic mechanism of this reaction must be understood before this can be modelled, which
was outside of the scope of this project due to time constraints.
Table 5-4: Summary of zero order kinetics parameters from zero order model
Initial Cr(VI)
Concentration
(mg L-1)
Adj. R2 k0 (mg L-1 s-1) [Cr(VI)]0
predicted
% difference of
true [Cr(VI)]0
10 0.577 0.174 ± 0.029 7.60 ± 0.59 22
50 0.743 0.315 ± 0.080 37.3 ± 4.3 26
100 0.702 0.538 ± 0.15 73.7 ± 8.1 25
Table 5-5: Summary of first order kinetics parameters from first order model
Initial Cr(VI)
Concentration
(mg L-1)
Adj. R2 k1 (s-1) [Cr(VI)]0
predicted
% difference of
true [Cr(VI)]0
10 0.987 0.0635 ± 0.0027 8.98 ± 0.22 8.1
50 0.981 0.0211 ± 0.0013 41.5 ± 0.79 17
100 0.939 0.0134 ± 0.0015 76.1 ± 1.4 23
Table 5-6: Summary of second order kinetics parameters from second order model
Initial Cr(VI)
Concentration
(mg L-1)
Adj. R2 k1 (L mg-1 s-1) [Cr(VI)]0
predicted
% difference of
true [Cr(VI)]0
10 0.817 0.0480 ± 0.0084 -8.83 ± 13 190
50 0.909 0.00236 ± 0.00033 541 ± 5200 975
100 0.977 0.000416 ± 0.000029 92.3 ± 13 6.1
200
Discussion of the sorption and release of chromium(VI) from solution by Polmadie banking soil
In contrast with the initial hypothesis, the results for the Cr(VI) adsorption batch experiments
show that Cr(VI) is effectively removed from solution when it was shaken with Polmadie
banking soil but the rate of this reaction could not be accurately modelled using zero, first or
second order kinetics.
There are two mechanisms described in the literature which are important for Cr(VI) removal
from solution by soils: i) the adsorption of Cr(VI) by exposed hydroxyl groups on metal
hydroxides and ii) the reduction of Cr(VI) and the subsequent precipitation or complexation of
Cr(III). Although in the environment Cr(VI) is adsorbed to mineral surfaces which have
exposed hydroxyl groups including Fe and Al oxides, this process is limited by the number of
adsorption sites and pH. Above pH 6 the adsorption of Cr(VI) to soil minerals decreases
sharply to a minimum around pH 8 (Rai et al., 1989). The mean pH of the leachate was 7.36
± 0.19 so Cr(VI) adsorption is likely to play a minimal part in the removal of Cr(VI) from solution.
Mpouras et al. (2017) found that the adsorption of Cr(VI) adsorption to soil was constant in the
pH range of 4-7 with ~50% of added Cr(VI) adsorbed but this fraction sharply decreased above
pH 7 to almost 0 at pH 8.5. The small increase in Cr(VI) released from the Cr(VI) loaded soil
compared to the control soil does, however, show that there must have been a small amount
of Cr(VI) adsorption. However, it is unlikely that this process plays a major role in the removal
of Cr(VI) from solution over the duration of the shaking experiment. It is more likely that a
reduction/precipitation reaction is removing Cr(VI) from solution.
The reduction to Cr(III) by Fe(II) would result in the precipitation of mixed Fe/Cr hydroxides
which have very low solubility at pH >4.5 (Rai et al., 1989, Papassiopi et al., 2014). However
the low concentrations of Fe(II) found in the soil porewater (Section 4.3.2) makes this process
unlikely to account for the removal of significant quantities of Cr(VI) from solution. This leaves
reduction of Cr(VI) by organic matter as the mechanism which is most likely to lead to the
removal of Cr(VI) from the loading solutions. From the literature, this mechanism is especially
prevalent in soils with high organic matter content and low Mn concentrations (Kožuh et al.,
2000, Reijonen and Hartikainen, 2016). Although many researchers have reported that the
reduction of Cr(VI) by dissolved OM is a slow process at neutral pH, Kožuh et al. demonstrated
that at neutral pH solid organic matter was very effective at reducing Cr(VI) (Kožuh et al.,
2000). Their results show that all Cr(VI) in solution was removed after 10 days when up to 50
mg kg-1 of Cr(VI) was loaded onto a soil with a high OM content. Chromium(VI) reduced by
OM can precipitate as insoluble Cr(III) hydroxides, which will remove Cr from the solution, or
be incorporated into OM. Evidence for Cr association with OM complexes in the Polmadie
banking soils was already demonstrated by the co-migration of Cr and OM during gel
201
electrophoretic experiments (Section 4.6). Although Cr(III) bound to labile OM may be
released back into solution leading to the remobilisation of Cr, the low percentage of Cr(III)
leached compared to the soil Cr(III) concentrations in both the column and batch leaching
experiments suggests that this is unlikely to result in the remobilisation of significant
concentrations of Cr(III). This was further demonstrated by the low concentrations of Cr(III)
released during the leaching of loaded soil as there was no difference between the loaded and
the control soil (Figure 5-33). Further work investigating the fate of the Cr(VI) which was loaded
on the soil is recommended. Alkaline digestion of control and Cr(VI) loaded soil and a
HF/HNO3 digestion would determine the amount, along with the species, of Cr that is sorbed
by the soil. Extraction and subsequent analysis of the OM using gel electrophoresis may also
give a further insight into the role of OM on sequestering Cr(VI) from solution.
Although no quantitative kinetic data could be gained from the modelling of the removal of
Cr(VI) from solution by the soil, it is still important to consider why. This is likely to be due to
the complex nature of the process of Cr(VI) reduction by OM. The reaction rate of Cr(VI) with
soil fulvic acids (SFA) was determined by Wittbrodt and Palmer (1995) to be dependent on
Cr(VI) concentration, SFA concentration, initial Cr(VI) concentration and pH. Although the rate
equation described by Wittbrody and Palmer (1995) was for the reduction of Cr(VI) with DOM
rather than solid phase soil OM, it indicates that the reaction has many variables and is likely
a reason why simple models do not fit the data (Wittbrodt and Palmer, 1995).
In spite of the lack of elucidation of the kinetics of the removal process, it is clear that the soil
has a large sorption capacity due to the almost complete removal (>95%) of Cr(VI) from
solution after 48 h in the 1.4 and 10 mg L-1 loading solutions. These concentrations are
comparable to the concentrations that are found in the Polmadie Burn waters (Chapter 4.3.1)
and demonstrates that Cr(VI) is not only removed from solution, it is also immobilised by the
soil due to the low release of Cr from soils loaded with ~40 mg kg-1 of Cr(VI). The maximum
amount of Cr(VI) sorbed to the soil was 369 ± 1.5 mg kg-1 after 120 h in the 100 mg L-1 Cr(VI)
loading solution. This value does not reflect the true sorption potential of the soil in the
environment which may be much higher than these laboratory suggest. These results show
that the soils play an important part in immobilising Cr(VI) in groundwater that flows through
them alluding to the possible role of these soils as a natural barrier to reduce and immobilise
Cr(VI) in groundwater.
5.6 Conclusions This chapter has explored the mobility of Cr in Polmadie banking soils and bottom sediments:
(i) during prolonged drying spells followed by intense rainfall; and (ii) the adsorption of Cr by
the banking soil from stream water during flood events. Banking soil and bottom sediments
202
were air-dried for up 62 days and the mobility of Cr was analysed during rewetting after
different drying periods using both column and batch leaching laboratory experiments. To
investigate the adsorption of Cr(VI) to banking soil, batch shaking experiments were designed
where Cr(VI) loading solutions were used to simulate the immersion of the banking soil by
stream water.
Mobility of chromium during rewetting of air-dried banking soil and sediments From the column and batch leaching experiments it has been established that Cr is not readily
released from the soil or sediments upon drying. The maximum percentage of Cr released
from soils and sediments was <0.023 and <0.00008%, respectively, of the solid phase
concentration and, in general, as drying time increases the leachable Cr(III) and Cr(VI)
concentrations decrease. Chromium(III) forms stable complexes with OM and the labile
concentration of OM in the soil is important in the release of Cr(III) from the banking soil. As
drying time increases the concentration of leachable Cr(III) decreases which is likely to be
related to the alteration of OM with drying time. Chromium(VI) was present in all the soil
leachates but it is not the dominant species released into solution from the banking soils.This
agrees with the literature which reports that the mobility of Cr(III) is dominated by
thermodynamically stable Cr(III)-OM complexes in pH neutral soils.
Less Cr was released from bottom sediments compared to Cr from soils. The highly reducing
environment of the sediment with high Fe(II) concentrations has a large reduction capacity for
Cr(VI) to Cr(III) which is likely to precipitate as insoluble mixed Fe/Cr hydroxides and also be
bound to OM. The lower concentrations of labile OM in the sediment results in the lower
leachability of Cr from the sediments, but, by using gel electrophoresis, Cr(III) was shown to
be associated with small highly mobile organic molecules. During drying, once the sediments
reached a constant moisture content, the oxidation of Mn(II) and its subsequent precipitation
to form Mn(IV) oxides allowed the oxidation of Cr(III) to Cr(VI) upon rewetting which is seen
by the increase in Cr and Mn released from air-dried sediment. This was also accompanied
by a change in the Cr speciation released, from exclusively Cr(III) in fresh sediment, to Cr(VI)
after reaching constant moisture content.
Removal of chromium(VI) form solution by banking soil The banking soils have shown the ability to irreversibly remove Cr(VI) from solution when they
were shaken in Cr(VI) loading solutions of up to 100 mg L-1. This experiment showed that after
120 h over 93% of Cr(VI) was removed from 1.4, 10 and 50 mg L-1 Cr(VI) loading solutions
and over 83% of the Cr(VI) was removed from a solution containing 100 mg L-1 Cr(VI). The
sorption of Cr(VI) from solution could not be modelled using zero, first or second order kinetics
suggesting that the process is more complex than a simple adsorption of Cr(VI) to the soil
surface. Up to 2% of Cr(VI) adsorbed during the loading of 40 mg kg-1 of Cr(VI) to banking soil
203
was released during leaching with 0.01 M CaCl2 solution. The Cr(VI) that was released
appeared to be re-adsorbed by the end of the 120 h shaking period. This suggests that the
removal of Cr(VI) from solution was not a simple adsorption process. It is therefore
hypothesised that the main Cr(VI) removal mechanism was through the reduction of Cr(VI) by
organic matter. The fate of the reduced Cr(VI) is most likely to be incorporation into OM to
form Cr(III)-OM complexes or by the precipitation of Cr(III) hydroxides.
The rate equation for the reduction of Cr(VI) by DOM has been shown to be dependent on
multiple factors, such as the Cr(VI) concentration, DOM concentration, initial Cr(VI)
concentration and the pH. The results of this study show that the removal of Cr(VI) could be
explained by a simple zero, first or second order rate model and further work is needed to
more fully characterise the likely role of solid phase soil organic matter in this process..
Although kinetic data could not be obtained, the maximum sorption capacity of the soil
observed was 369 ± 1.5 mg kg-1 but the true maximum sorption capacity is certainly larger
than this although impossible to predict from the data. This shows the potential of the Polmadie
banking soil to act as a natural barrier which is able to remove Cr(VI) from groundwater.
Therefore it is likely these soils play a part in reducing the Cr(VI) concentrations entering the
Polmadie Burn rather than acting as a source.
204
6 Bioaccessibility of chromium in the <10 µm fraction of banking soils
6.1 Background
The toxicity of Cr(III) is vastly different from Cr(VI) as Cr(III) is an essential micronutrient
whereas exposure to Cr(VI) can result in a number of health effects as described in Section
1.5. Although acute exposure to Cr(VI) is relatively rare, chronic exposure to Cr(VI) can cause
contact dermatitis, skin irritation and the development of cancer, most notably lung cancer
(WHO, 2000). This is because Cr(VI) has the ability to efficiently cross the cell membrane
where it is subsequently reduced to Cr(III). The product Cr(III) can interact with DNA to cause
mutation along with the Cr(VI) reduction which produces the reactive intermediates, Cr(V) and
Cr(IV), causing further damage to tissue and DNA (USEPA, 1998).
Although the people who are most at risk from chronic health effects are those who work with
Cr and its chemicals, chronic exposure to low environmental concentrations of Cr(VI) has the
potential to increase an individual’s lifetime risk of cancer (WHO, 2000). Exposure may result
from “contact” with Cr-containing industrial materials/wastes/contaminated soils, Cr(VI)-
contaminated water, or food contaminated with Cr(VI). In the UK, contact with Cr-containing
materials/waste and, in particular, exposure to contaminated soil, is typically the most
important exposure pathways and is generally the most likely risk for people who live near
industries that use or produce Cr-containing materials, or who live near Cr waste disposal
sites. Exposure to Cr(VI) in contaminated soils can occur in three was: i) dermal contact; ii)
ingestion; and iii) inhalation. Dermal contact can occur through activities such as gardening
and playing. Children are likely to experience greater exposure than adults because play
activities bring them into greater contact with soil (Science Communication Unit, 2013,
Nielsen and Kristiansen, 2004). For this reason also, children are known to consume more
soil than adults, via hand to mouth contact. In addition, ingestion can occur in adults and
children by inadvertent swallowing of dust and by soil stuck to food produce as well as by
eating vegetables grown on contaminated land (Environment Agency, 2009b). The inhalation
of dust can happen via the breathing in of suspended soil dusts. An important factor to consider
is also the track back of soil into homes where it dries making the resuspension of Cr
contaminated soil more likely (Environment Agency, 2009c).
It is important to recognise that the concentrations of Cr(VI) found in environmental matrices
such as dusts, soils/sediments and water do not necessarily reflect the percentage of Cr
absorbed by the body (Broadway et al., 2010, Jardine et al., 2013). In order to determine the
health risks for those living in, working in and visiting areas which contain elevated
concentrations of Cr(VI), the exposure route must be considered along with the threshold
concentrations, which result in detrimental health. Once the level of unacceptable risk has
205
been determined, tests to determine the potential exposure to contaminants, such as Cr(VI),
can be carried out to evaluate if an area is safe to be used for its specified purpose. This
section discusses the methods used to assess the health risks of contaminants in soils, before
evaluating the inhalation bioaccessibility of Cr in the Polmadie banking soils. Finally, the
results from the bioaccessibility experiment are discussed with respect to the current
guidelines and the health of those living in and visiting this area of Glasgow.
6.2 Risk assessment of soils in the UK
6.2.1 Definition of contaminated land
As set out in the Environmental Protection Act 1990 Part IIA, land is defined as contaminated
in the UK if: i) it poses a significant risk to human health, property or protected species: ii)
there is significant pollution of water (surface or ground); or iii) it will cause harm due to
radioactivity. Once land has been identified as potentially contaminated it must be remediated
to lower the risk to acceptable levels before the site can be developed for its intended use.
Most land that is deemed to be potentially contaminated is remediated during the planning
process and there are relatively few sites in the UK that are classed as contaminated land. To
determine if the risk is significant, socio-political judgement is required and this takes into
account the overarching effects of the pollution and defines what society believes is
acceptable risk (Environmental Protection Act, 1990, Environment Agency, 2009c).
6.2.2 Assessment of soils for contamination
In UK soils, risk to human health is assessed via the Contaminated Land Exposure
Assessment (CLEA) model, which was developed by the Environment Agency (EA)
(Environment Agency, 2009c). In Scotland, the Scottish Environment Protection Agency
(SEPA), the regulatory body tasked with protecting and improving the environment, has
broadly adopted the CLEA model for assessing land contamination. The approach to
assessing land contamination is based on the source-pathway-receptor concept. This
considers the quantity of a contaminant in the soil (the source) and who is exposed to the
contaminant (the receptor). Both need to be linked by a mechanism by which the receptor is
exposed to the contaminant in concentrations that pose an unacceptable risk (pathway)
(Figure 6-1). This method of risk assessment has three steps: i) preliminary risk assessment;
ii) generic quantitative risk assessment; and iii) detailed quantitative risk assessment
(Environment Agency, 2004). The preliminary risk assessment seeks to develop a conceptual
model of the site and to establish any potentially unacceptable risks that may be present. This
is usually a desk-based exercise and, if any potential pollutant linkages are identified, the site
will be investigated further by carrying out the generic quantitative risk assessment. This
involves measuring the soil pollutant concentration and comparing it to a soil guideline value
206
(SGV). For the generic assessment criteria (GAC), soil guideline values (SGVs) have been
produced to assist with assessing the risk associated with long-term exposure to chemical
contamination in the soil. These values should be considered as “trigger values”. If the GAC
SGV is not exceeded, the land is considered not to pose an unacceptable risk. If the GAC
SGV is exceeded, this does not mean that the land is contaminated, rather that further
investigation is required to determine if the risk is indeed unacceptable. The detailed
quantitative risk assessment is site-specific and looks at the pollution linkages that have been
identified in the previous steps to assess their risk. If at this point there is an unacceptable
risk, the site must be remediated (Environment Agency, 2009c).
The GAC SGV values have been derived based on the toxicological evidence for specific
potentially harmful substances and likely soil exposure from the available literature. This
information has been compiled into a series of reports that provide technical guidance to
regulators. The toxicological reports typically define a health criteria value (HCV), which
represents a tolerable, or minimal risk, to human health from long-term exposure to the
contaminant in soil and are used as the basis of the SGV (Environment Agency, 2009b).
To aid the risk assessment of soils in the UK the EA has developed the CLEA software, a
Microsoft Excel-based tool, which derives generic assessment criteria values for soils based
on the characteristics of the contaminants and the receptors. It can also be used to derive site
specific soil assessment criteria and the risk posed by a contaminant to human health under
given circumstances (Environment Agency, 2009a).
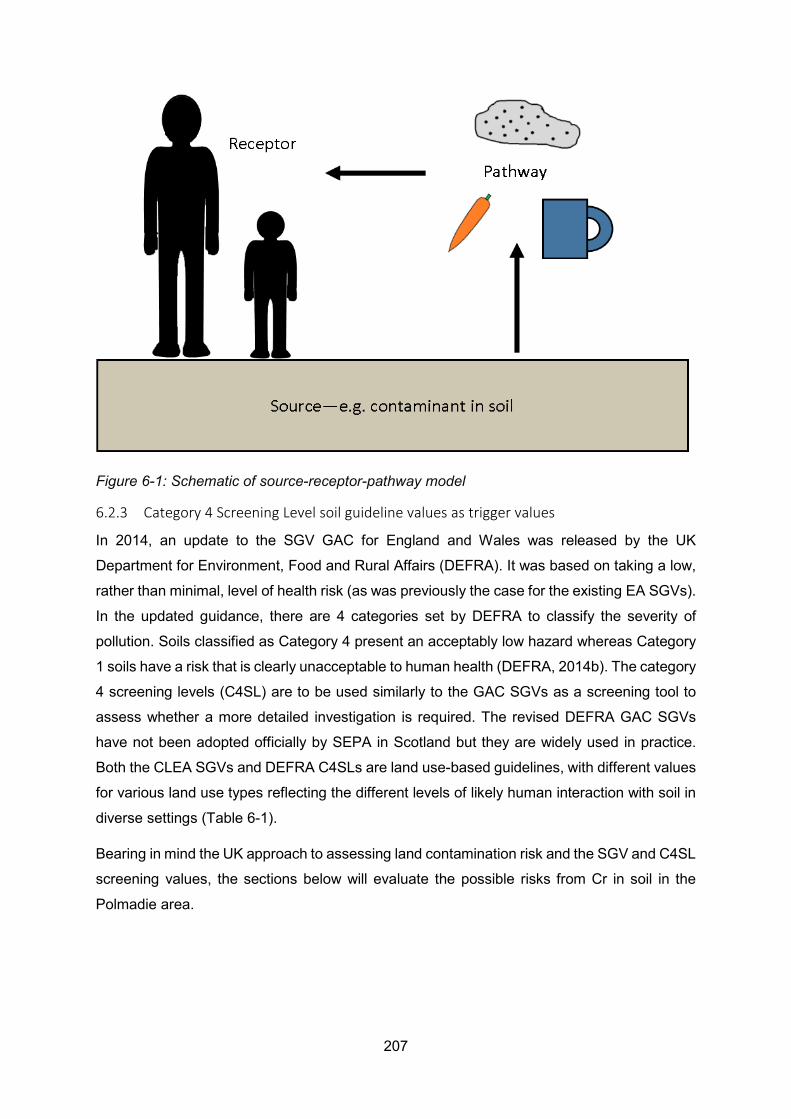
207
Figure 6-1: Schematic of source-receptor-pathway model
6.2.3 Category 4 Screening Level soil guideline values as trigger values
In 2014, an update to the SGV GAC for England and Wales was released by the UK
Department for Environment, Food and Rural Affairs (DEFRA). It was based on taking a low,
rather than minimal, level of health risk (as was previously the case for the existing EA SGVs).
In the updated guidance, there are 4 categories set by DEFRA to classify the severity of
pollution. Soils classified as Category 4 present an acceptably low hazard whereas Category
1 soils have a risk that is clearly unacceptable to human health (DEFRA, 2014b). The category
4 screening levels (C4SL) are to be used similarly to the GAC SGVs as a screening tool to
assess whether a more detailed investigation is required. The revised DEFRA GAC SGVs
have not been adopted officially by SEPA in Scotland but they are widely used in practice.
Both the CLEA SGVs and DEFRA C4SLs are land use-based guidelines, with different values
for various land use types reflecting the different levels of likely human interaction with soil in
diverse settings (Table 6-1).
Bearing in mind the UK approach to assessing land contamination risk and the SGV and C4SL
screening values, the sections below will evaluate the possible risks from Cr in soil in the
Polmadie area.
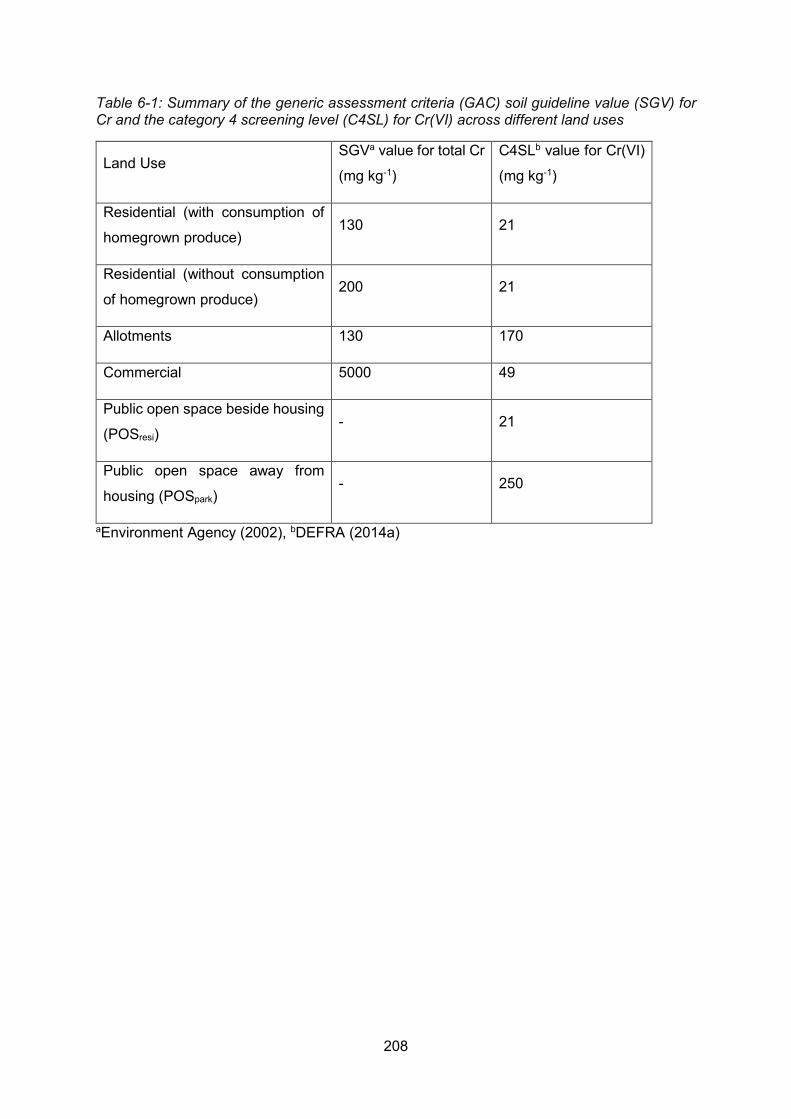
208
Table 6-1: Summary of the generic assessment criteria (GAC) soil guideline value (SGV) for Cr and the category 4 screening level (C4SL) for Cr(VI) across different land uses
Land Use SGVa value for total Cr
(mg kg-1)
C4SLb value for Cr(VI)
(mg kg-1)
Residential (with consumption of
homegrown produce) 130 21
Residential (without consumption
of homegrown produce) 200 21
Allotments 130 170
Commercial 5000 49
Public open space beside housing
(POSresi) - 21
Public open space away from
housing (POSpark) - 250
aEnvironment Agency (2002), bDEFRA (2014a)
209
6.3 Comparison of Polmadie Banking soils to current trigger values
To carry out a preliminary assessment of possible human health risks from exposure to the
banking soil from the Polmadie Burn, the total Cr and Cr(VI) concentrations in 19 surface soils
collected from both banks of the Burn were compared to the UK GAC SGVs and C4SL values.
The Burn is bounded on the east side by Richmond Park and on the west side by housing
developments (Figure 3-3). Given the proximity of housing to the burn, for the purposes of a
preliminary risk assessment the most precautionary SGVs for residential land use with plant
uptake were used for comparison. The range of total Cr concentrations in the banking soil,
from both sides of the Burn, was 416 – 6310 mg kg-1 which exceeded the CLEA residential
GAC SGV of 130 mg kg-1. Similarly, concentrations of 76.7 – 2019 mg kg-1 of Cr(VI) were
found in banking soils from both sides of the stream, which exceeded the GAC C4SL for Cr(VI)
for public open spaces close to housing of 21 mg kg-1 (Table 6-1). Due to the concentration of
Cr(VI) in the banking soil exceeding the SGV and C4SL values, it was decided to investigate
the inhalation bioaccessibility of the soil to determine the risk associated with inhaling Cr(VI)
containing dust originating from the banking soil. The reason for focussing on the inhalation
exposure route is explained in the following section.
6.4 Bioaccessibility testing
The bioaccessibility of a chemical is defined as the fraction of the chemical that is soluble and
available for absorption by the human body (Semple et al., 2004). Although bioaccessibility
tests are not mandatory, they are recommended as part of phase two site specific risk
assessments (DEFRA, 2014b). Bioaccessibility tests were developed by Ruby et al. (1993) to
provide an in vitro approach to predict the oral ingestion bioaccessibility of metals from solid
matrices. The method has since been optimised to help refine the assessment of human
exposure to soil via ingestion and inhalation route (Ruby et al., 1993). Bioaccessibility tests
are in vitro tests which mimic conditions of the human stomach and gastrointestinal tract or
the lungs to simulate absorption of pollutants on ingestion or inhalation, respectively. They are
a cost-effective alternative to expensive in vivo animal studies and are also ethically more
sound (Wragg et al., 2011). Before measuring the inhalation bioaccessibility fraction of soil,
the size of particles that can be inhaled into the lungs must be considered. It is generally
accepted that the largest diameter of particle that can be inhaled into the lungs is 10 µm
therefore the <10 µm fraction (PM10) of soils must be isolated and used for the inhalation
bioaccessibility testing. The bioaccessibility risk assessment in this study focused on the
inhalation rather than the oral exposure route for three reasons:
(i) Public access to the Polmadie Burn is restricted, and the banking soils are not likely to form
the substrate for growing vegetables/direct soil contact etc. in the future that may be of concern
210
for oral bioaccessibility. However, as outlined in Section 5.1, there are plans to divert water
inputs away from the Burn, which will lead to lower flow rates in the future and potentially
greater drying out of the banking soil, especially during prolonged dry spells. This could lead
to greater resuspension of soil dust from the banking soil and possible risk of human exposure
via inhalation.
(ii) Previous studies close to the Polmadie area of Glasgow (Broadway et al., 2010) and from
other parts of the world have shown that the oral ingestion bioaccessibility of Cr(VI) in soils is
low because Cr(VI) in the stomach is reduced to Cr(III) due to the presence of dissolved
organic matter from the soil in the acidic environment (pH = 1) of the stomach. This facilitates
the reduction of any ingested Cr(VI) and the Cr(III) formed will then precipitate once it moves
into the intestines. Here the pH rises to above pH 6, and Cr(III) is mainly excreted from the
body (Broadway et al., 2010, Ljung et al., 2007, Morman et al., 2009). Indeed, Broadway et
al. quantified the oral bioaccessibility of Cr in 27 Glasgow soils and found that the Cr(VI) was
converted to Cr(III) and therefore only the bioaccessibility of total Cr in the soils could be
determined as the fate Cr(VI) and Cr(III) could not be differentiated. The bioaccessible fraction
of Cr in these soils ranged from <3 to 1156 mg kg-1 and all of were below the site-specific
assessment criteria (SSAC) for the individual sites except one. Low bioaccessibility of Cr in
soils has also been reported by other researchers who found the bioaccessible fraction of Cr
was <5% in soils (Morman et al., 2009, Ljung et al., 2007). These studies did not take into
account the speciation of Cr in the soils but it can be presumed that any Cr(VI) will be reduced
to Cr(III) in the stomach, minimising the uptake of Cr(VI) by the body.
(iii) Very limited studies have been carried out on Cr inhalation bioaccessibility compared to
oral ingestion bioaccessibility. A few studies have looked at the inhalation bioaccessibility of
Cr from ferrochromium dust, which contains a mixture of Cr(III) and elemental Cr (Hedberg et
al., 2010, Midander et al., 2010). The most relevant study by Broadway et al. (2010),
mentioned above, quantified the inhalation bioaccessibility of the PM10 fraction of three
Glasgow soils. They found that the 24 h inhalation bioaccessibility of Cr in the PM10 fraction
of Glasgow soils was <296 ± 32 and 18 ± 4 mg kg-1 for total Cr and Cr(VI), respectively. This
corresponded to a bioaccessibility fraction for total Cr of <14% (Broadway et al., 2010).
The soils selected for inhalation bioaccessibility in the Broadway et al. 2010 study were from
an area in Glasgow near the Polmadie Burn which was made-ground using COPR. The
Polmadie banking soils that were analysed in the current study were not as heavily impacted
with COPR but contained elevated concentrations of Cr (and Cr(VI)) in the soil which was
associated with OM and Fe hydroxides.
211
In this study, the Cr inhalation bioaccessibility of three bulk soil samples (Section 3.1.2) was
determined by first isolating the PM10 fraction from the soils using gravity settling before
determining the concentration of Cr and Cr(VI) leached using Gamble’s solution (Sections
3.5.3 and 3.7, respectively). Gamble’s solution was developed to mimic the fluid found in lungs
and has been used in numerous studies to determine the in vitro inhalation bioaccessibility of
metals (Boisa et al., 2014, Wragg and Klinck, 2007, Wiseman et al., 2018).
Before measuring the bioaccessibility of Cr(VI) in these soils preliminary experiments were
conducted to optimise the bioaccessibility procedure used by Wragg and Klinck (2007) and
the optimisation of the procedure looked to determine the ideal solid to liquid (S:L) ratio. The
procedure of Wragg and Klinck (2007) used an S:L ratio of 1:67 but literature has suggested
that in the lungs the solid to liquid ratio is likely to be between 1:500 and 1:50,000 (Julien et
al., 2011, Wragg and Klinck, 2007). To explore the difference in bioaccessibility of different
S:L ratios, the amount of bioaccessible Cr(VI) removed from the material was compared using
S:L ratios of 1:67 and 1:500.
The results below describe the outcome of the preliminary experiment and the justification for
using the method chosen to determine the bioaccessibility of Cr in the PM10 fraction of the
Polmadie banking soils. It then goes on to document the bioaccessibility of Cr found in the
Polmadie banking soils and compares these values to the current relevant soil guidelines to
assess the implications of these results for the risk assessment of the site.
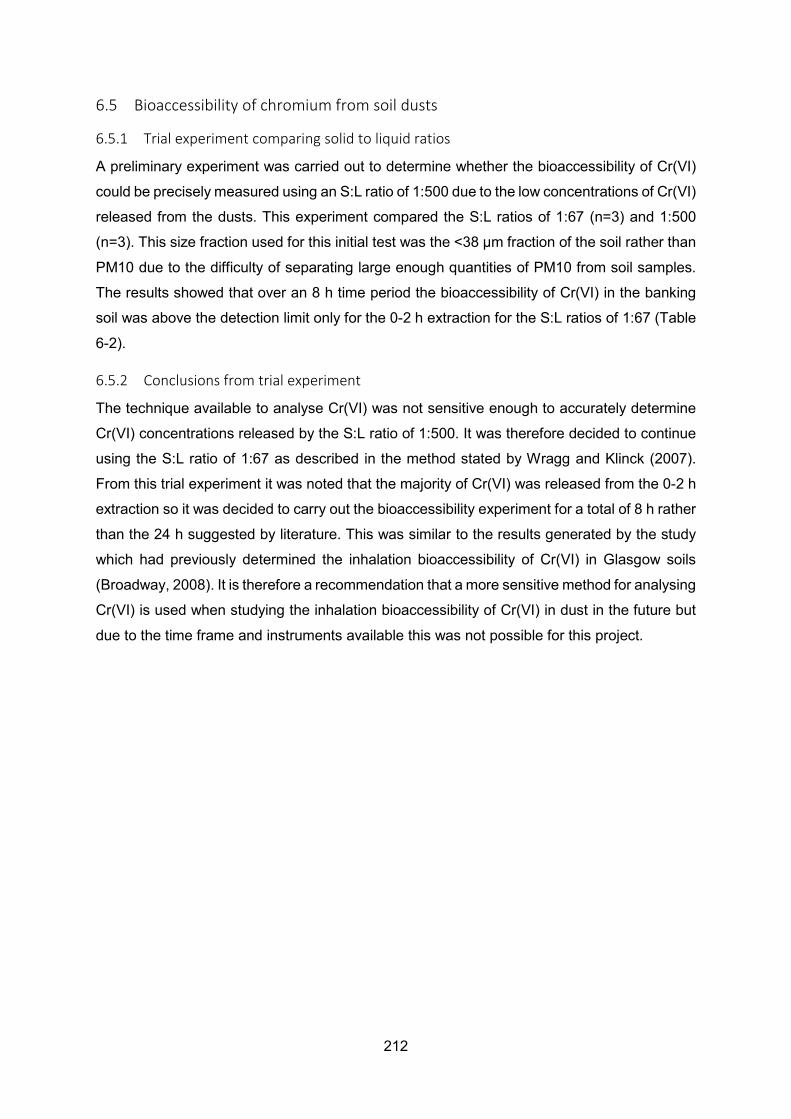
212
6.5 Bioaccessibility of chromium from soil dusts
6.5.1 Trial experiment comparing solid to liquid ratios
A preliminary experiment was carried out to determine whether the bioaccessibility of Cr(VI)
could be precisely measured using an S:L ratio of 1:500 due to the low concentrations of Cr(VI)
released from the dusts. This experiment compared the S:L ratios of 1:67 (n=3) and 1:500
(n=3). This size fraction used for this initial test was the <38 µm fraction of the soil rather than
PM10 due to the difficulty of separating large enough quantities of PM10 from soil samples.
The results showed that over an 8 h time period the bioaccessibility of Cr(VI) in the banking
soil was above the detection limit only for the 0-2 h extraction for the S:L ratios of 1:67 (Table
6-2).
6.5.2 Conclusions from trial experiment
The technique available to analyse Cr(VI) was not sensitive enough to accurately determine
Cr(VI) concentrations released by the S:L ratio of 1:500. It was therefore decided to continue
using the S:L ratio of 1:67 as described in the method stated by Wragg and Klinck (2007).
From this trial experiment it was noted that the majority of Cr(VI) was released from the 0-2 h
extraction so it was decided to carry out the bioaccessibility experiment for a total of 8 h rather
than the 24 h suggested by literature. This was similar to the results generated by the study
which had previously determined the inhalation bioaccessibility of Cr(VI) in Glasgow soils
(Broadway, 2008). It is therefore a recommendation that a more sensitive method for analysing
Cr(VI) is used when studying the inhalation bioaccessibility of Cr(VI) in dust in the future but
due to the time frame and instruments available this was not possible for this project.
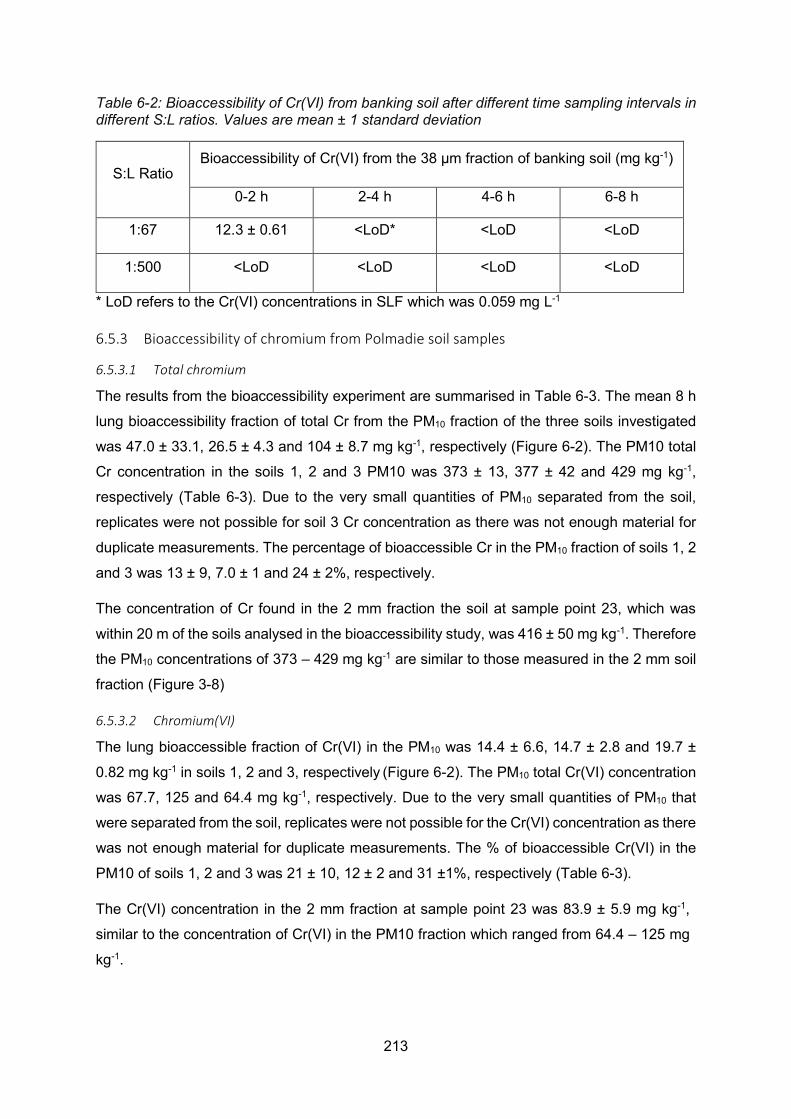
213
Table 6-2: Bioaccessibility of Cr(VI) from banking soil after different time sampling intervals in different S:L ratios. Values are mean ± 1 standard deviation
S:L Ratio Bioaccessibility of Cr(VI) from the 38 µm fraction of banking soil (mg kg-1)
0-2 h 2-4 h 4-6 h 6-8 h
1:67 12.3 ± 0.61 <LoD* <LoD <LoD
1:500 <LoD <LoD <LoD <LoD
* LoD refers to the Cr(VI) concentrations in SLF which was 0.059 mg L-1
6.5.3 Bioaccessibility of chromium from Polmadie soil samples
6.5.3.1 Total chromium
The results from the bioaccessibility experiment are summarised in Table 6-3. The mean 8 h
lung bioaccessibility fraction of total Cr from the PM10 fraction of the three soils investigated
was 47.0 ± 33.1, 26.5 ± 4.3 and 104 ± 8.7 mg kg-1, respectively (Figure 6-2). The PM10 total
Cr concentration in the soils 1, 2 and 3 PM10 was 373 ± 13, 377 ± 42 and 429 mg kg-1,
respectively (Table 6-3). Due to the very small quantities of PM10 separated from the soil,
replicates were not possible for soil 3 Cr concentration as there was not enough material for
duplicate measurements. The percentage of bioaccessible Cr in the PM10 fraction of soils 1, 2
and 3 was 13 ± 9, 7.0 ± 1 and 24 ± 2%, respectively.
The concentration of Cr found in the 2 mm fraction the soil at sample point 23, which was
within 20 m of the soils analysed in the bioaccessibility study, was 416 ± 50 mg kg-1. Therefore
the PM10 concentrations of 373 – 429 mg kg-1 are similar to those measured in the 2 mm soil
fraction (Figure 3-8)
6.5.3.2 Chromium(VI)
The lung bioaccessible fraction of Cr(VI) in the PM10 was 14.4 ± 6.6, 14.7 ± 2.8 and 19.7 ±
0.82 mg kg-1 in soils 1, 2 and 3, respectively (Figure 6-2). The PM10 total Cr(VI) concentration
was 67.7, 125 and 64.4 mg kg-1, respectively. Due to the very small quantities of PM10 that
were separated from the soil, replicates were not possible for the Cr(VI) concentration as there
was not enough material for duplicate measurements. The % of bioaccessible Cr(VI) in the
PM10 of soils 1, 2 and 3 was 21 ± 10, 12 ± 2 and 31 ±1%, respectively (Table 6-3).
The Cr(VI) concentration in the 2 mm fraction at sample point 23 was 83.9 ± 5.9 mg kg-1,
similar to the concentration of Cr(VI) in the PM10 fraction which ranged from 64.4 – 125 mg
kg-1.
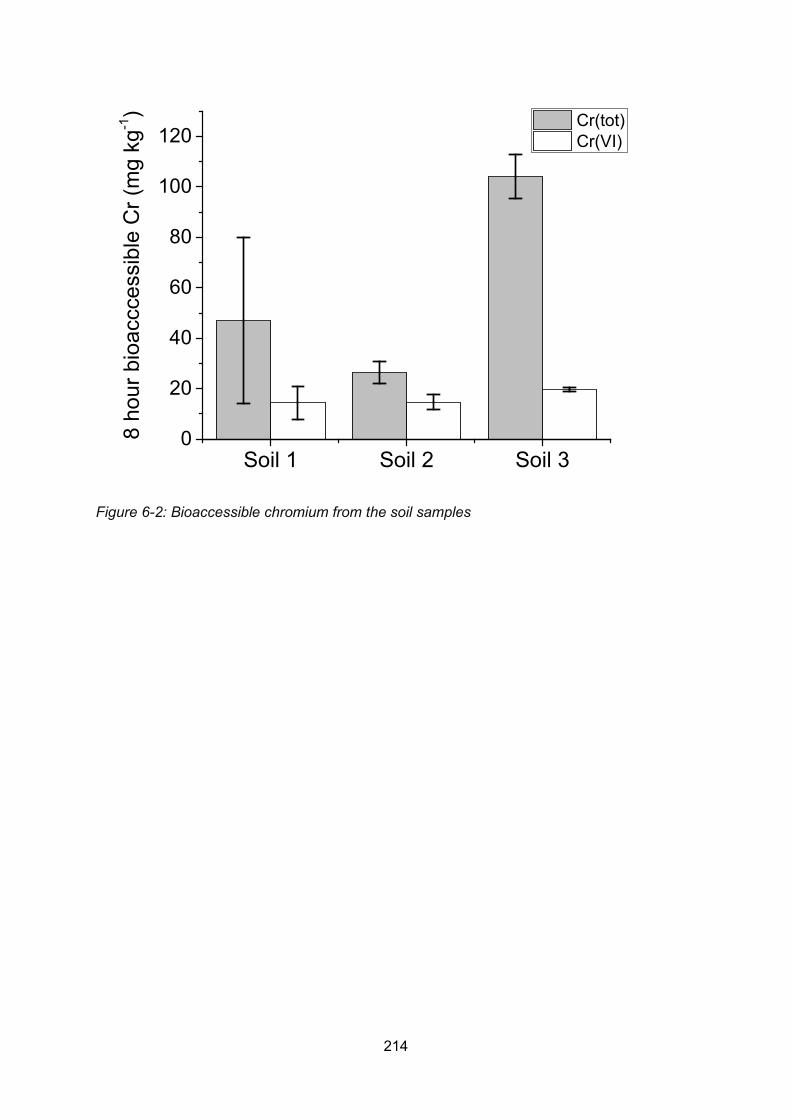
214
Figure 6-2: Bioaccessible chromium from the soil samples
Soil 1 Soil 2 Soil 30
20
40
60
80
100
1208
hour
bio
accc
essi
ble
Cr (
mg
kg-1) Cr(tot)
Cr(VI)
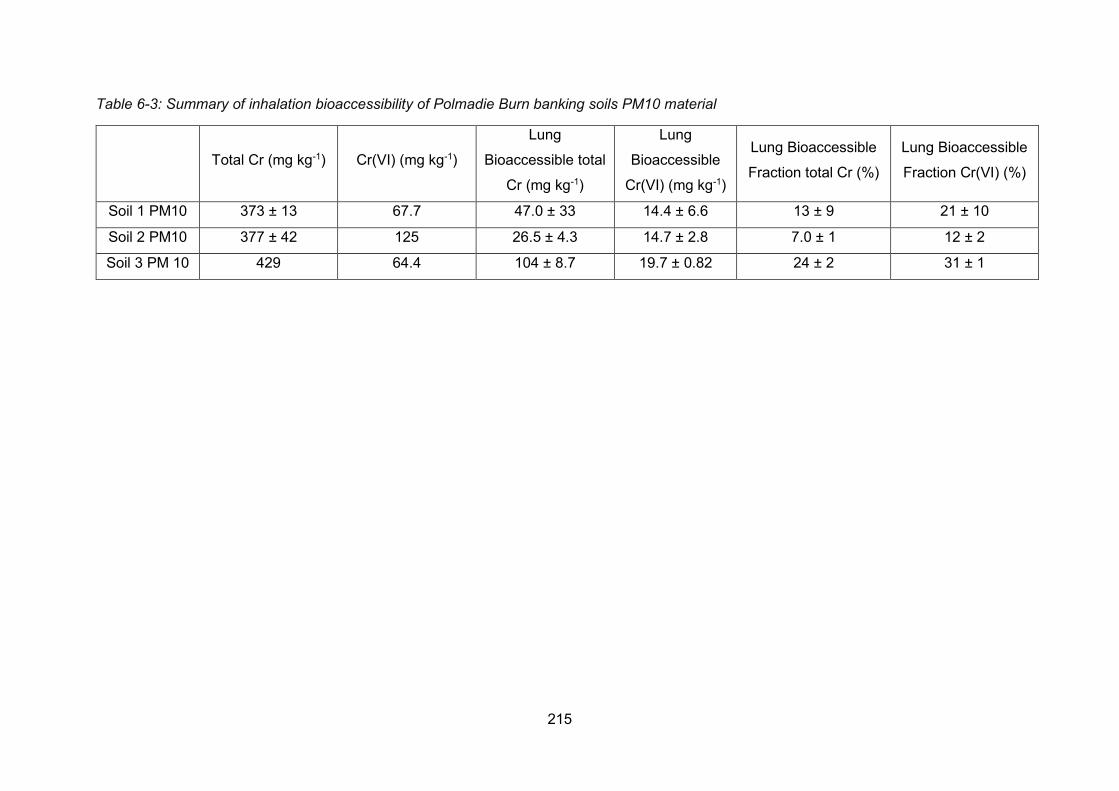
215
Table 6-3: Summary of inhalation bioaccessibility of Polmadie Burn banking soils PM10 material
Total Cr (mg kg-1) Cr(VI) (mg kg-1)
Lung
Bioaccessible total
Cr (mg kg-1)
Lung
Bioaccessible
Cr(VI) (mg kg-1)
Lung Bioaccessible
Fraction total Cr (%)
Lung Bioaccessible
Fraction Cr(VI) (%)
Soil 1 PM10 373 ± 13 67.7 47.0 ± 33 14.4 ± 6.6 13 ± 9 21 ± 10
Soil 2 PM10 377 ± 42 125 26.5 ± 4.3 14.7 ± 2.8 7.0 ± 1 12 ± 2
Soil 3 PM 10 429 64.4 104 ± 8.7 19.7 ± 0.82 24 ± 2 31 ± 1
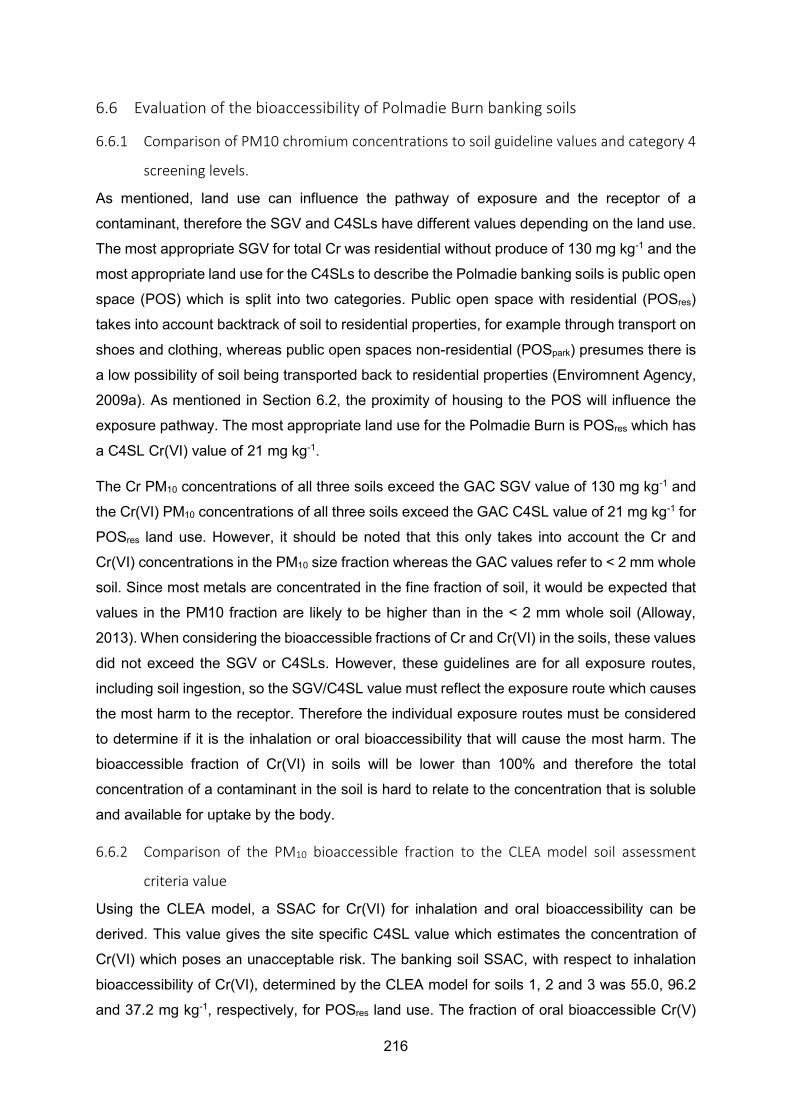
216
6.6 Evaluation of the bioaccessibility of Polmadie Burn banking soils
6.6.1 Comparison of PM10 chromium concentrations to soil guideline values and category 4
screening levels.
As mentioned, land use can influence the pathway of exposure and the receptor of a
contaminant, therefore the SGV and C4SLs have different values depending on the land use.
The most appropriate SGV for total Cr was residential without produce of 130 mg kg-1 and the
most appropriate land use for the C4SLs to describe the Polmadie banking soils is public open
space (POS) which is split into two categories. Public open space with residential (POSres)
takes into account backtrack of soil to residential properties, for example through transport on
shoes and clothing, whereas public open spaces non-residential (POSpark) presumes there is
a low possibility of soil being transported back to residential properties (Enviromnent Agency,
2009a). As mentioned in Section 6.2, the proximity of housing to the POS will influence the
exposure pathway. The most appropriate land use for the Polmadie Burn is POSres which has
a C4SL Cr(VI) value of 21 mg kg-1.
The Cr PM10 concentrations of all three soils exceed the GAC SGV value of 130 mg kg-1 and
the Cr(VI) PM10 concentrations of all three soils exceed the GAC C4SL value of 21 mg kg-1 for
POSres land use. However, it should be noted that this only takes into account the Cr and
Cr(VI) concentrations in the PM10 size fraction whereas the GAC values refer to < 2 mm whole
soil. Since most metals are concentrated in the fine fraction of soil, it would be expected that
values in the PM10 fraction are likely to be higher than in the < 2 mm whole soil (Alloway,
2013). When considering the bioaccessible fractions of Cr and Cr(VI) in the soils, these values
did not exceed the SGV or C4SLs. However, these guidelines are for all exposure routes,
including soil ingestion, so the SGV/C4SL value must reflect the exposure route which causes
the most harm to the receptor. Therefore the individual exposure routes must be considered
to determine if it is the inhalation or oral bioaccessibility that will cause the most harm. The
bioaccessible fraction of Cr(VI) in soils will be lower than 100% and therefore the total
concentration of a contaminant in the soil is hard to relate to the concentration that is soluble
and available for uptake by the body.
6.6.2 Comparison of the PM10 bioaccessible fraction to the CLEA model soil assessment
criteria value
Using the CLEA model, a SSAC for Cr(VI) for inhalation and oral bioaccessibility can be
derived. This value gives the site specific C4SL value which estimates the concentration of
Cr(VI) which poses an unacceptable risk. The banking soil SSAC, with respect to inhalation
bioaccessibility of Cr(VI), determined by the CLEA model for soils 1, 2 and 3 was 55.0, 96.2
and 37.2 mg kg-1, respectively, for POSres land use. The fraction of oral bioaccessible Cr(V)
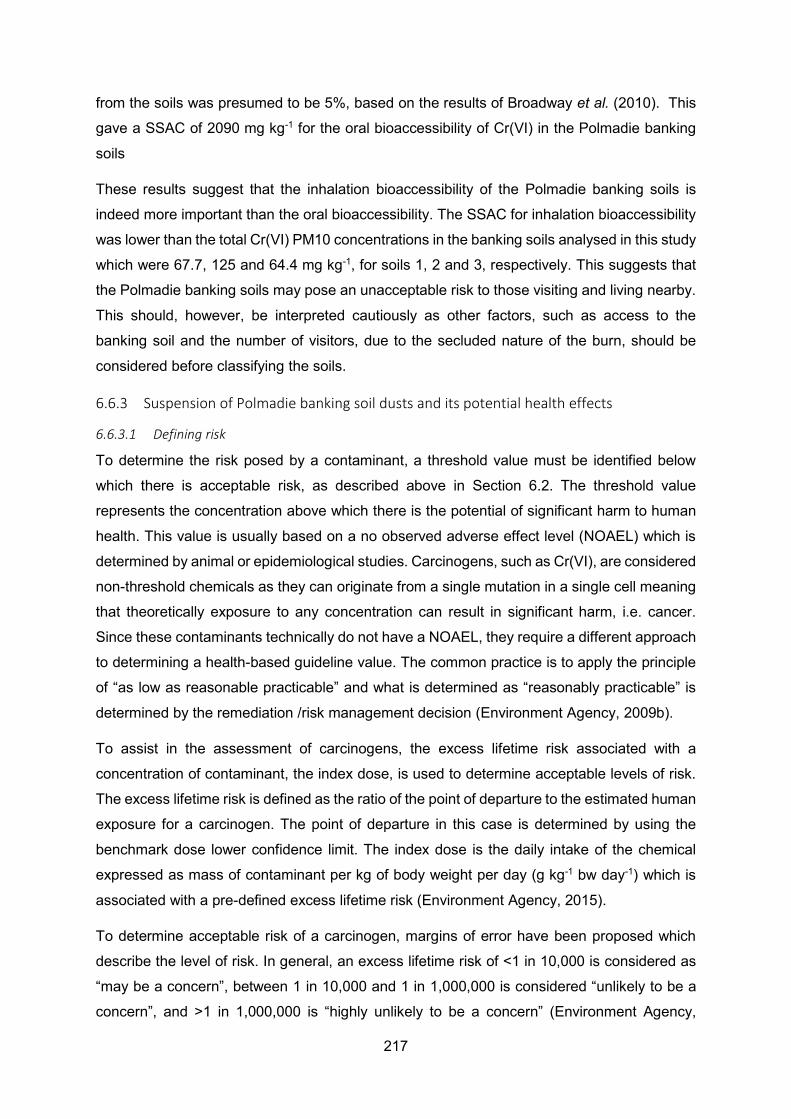
217
from the soils was presumed to be 5%, based on the results of Broadway et al. (2010). This
gave a SSAC of 2090 mg kg-1 for the oral bioaccessibility of Cr(VI) in the Polmadie banking
soils
These results suggest that the inhalation bioaccessibility of the Polmadie banking soils is
indeed more important than the oral bioaccessibility. The SSAC for inhalation bioaccessibility
was lower than the total Cr(VI) PM10 concentrations in the banking soils analysed in this study
which were 67.7, 125 and 64.4 mg kg-1, for soils 1, 2 and 3, respectively. This suggests that
the Polmadie banking soils may pose an unacceptable risk to those visiting and living nearby.
This should, however, be interpreted cautiously as other factors, such as access to the
banking soil and the number of visitors, due to the secluded nature of the burn, should be
considered before classifying the soils.
6.6.3 Suspension of Polmadie banking soil dusts and its potential health effects
6.6.3.1 Defining risk
To determine the risk posed by a contaminant, a threshold value must be identified below
which there is acceptable risk, as described above in Section 6.2. The threshold value
represents the concentration above which there is the potential of significant harm to human
health. This value is usually based on a no observed adverse effect level (NOAEL) which is
determined by animal or epidemiological studies. Carcinogens, such as Cr(VI), are considered
non-threshold chemicals as they can originate from a single mutation in a single cell meaning
that theoretically exposure to any concentration can result in significant harm, i.e. cancer.
Since these contaminants technically do not have a NOAEL, they require a different approach
to determining a health-based guideline value. The common practice is to apply the principle
of “as low as reasonable practicable” and what is determined as “reasonably practicable” is
determined by the remediation /risk management decision (Environment Agency, 2009b).
To assist in the assessment of carcinogens, the excess lifetime risk associated with a
concentration of contaminant, the index dose, is used to determine acceptable levels of risk.
The excess lifetime risk is defined as the ratio of the point of departure to the estimated human
exposure for a carcinogen. The point of departure in this case is determined by using the
benchmark dose lower confidence limit. The index dose is the daily intake of the chemical
expressed as mass of contaminant per kg of body weight per day (g kg-1 bw day-1) which is
associated with a pre-defined excess lifetime risk (Environment Agency, 2015).
To determine acceptable risk of a carcinogen, margins of error have been proposed which
describe the level of risk. In general, an excess lifetime risk of <1 in 10,000 is considered as
“may be a concern”, between 1 in 10,000 and 1 in 1,000,000 is considered “unlikely to be a
concern”, and >1 in 1,000,000 is “highly unlikely to be a concern” (Environment Agency,
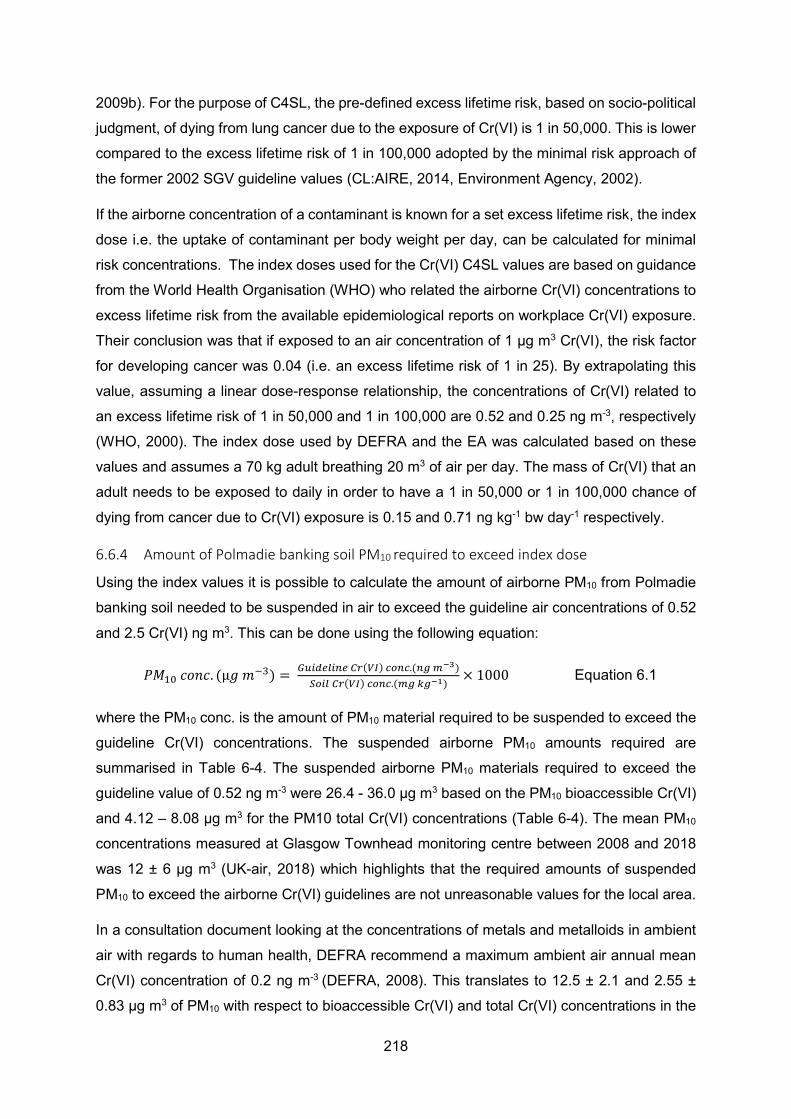
218
2009b). For the purpose of C4SL, the pre-defined excess lifetime risk, based on socio-political
judgment, of dying from lung cancer due to the exposure of Cr(VI) is 1 in 50,000. This is lower
compared to the excess lifetime risk of 1 in 100,000 adopted by the minimal risk approach of
the former 2002 SGV guideline values (CL:AIRE, 2014, Environment Agency, 2002).
If the airborne concentration of a contaminant is known for a set excess lifetime risk, the index
dose i.e. the uptake of contaminant per body weight per day, can be calculated for minimal
risk concentrations. The index doses used for the Cr(VI) C4SL values are based on guidance
from the World Health Organisation (WHO) who related the airborne Cr(VI) concentrations to
excess lifetime risk from the available epidemiological reports on workplace Cr(VI) exposure.
Their conclusion was that if exposed to an air concentration of 1 µg m3 Cr(VI), the risk factor
for developing cancer was 0.04 (i.e. an excess lifetime risk of 1 in 25). By extrapolating this
value, assuming a linear dose-response relationship, the concentrations of Cr(VI) related to
an excess lifetime risk of 1 in 50,000 and 1 in 100,000 are 0.52 and 0.25 ng m-3, respectively
(WHO, 2000). The index dose used by DEFRA and the EA was calculated based on these
values and assumes a 70 kg adult breathing 20 m3 of air per day. The mass of Cr(VI) that an
adult needs to be exposed to daily in order to have a 1 in 50,000 or 1 in 100,000 chance of
dying from cancer due to Cr(VI) exposure is 0.15 and 0.71 ng kg-1 bw day-1 respectively.
6.6.4 Amount of Polmadie banking soil PM10 required to exceed index dose
Using the index values it is possible to calculate the amount of airborne PM10 from Polmadie
banking soil needed to be suspended in air to exceed the guideline air concentrations of 0.52
and 2.5 Cr(VI) ng m3. This can be done using the following equation:
𝑃𝑃𝑀𝑀10 𝑜𝑜𝑜𝑜𝑜𝑜𝑜𝑜. (µ𝑜𝑜 𝑚𝑚−3) = 𝐺𝐺𝐺𝐺𝑑𝑑𝑑𝑑𝑜𝑜𝐺𝐺𝑑𝑑𝐺𝐺𝑜𝑜 𝐶𝐶𝑑𝑑(𝑉𝑉𝑉𝑉) 𝑐𝑐𝑜𝑜𝐺𝐺𝑐𝑐.(𝐺𝐺𝑔𝑔 𝑚𝑚−3)𝑆𝑆𝑜𝑜𝑑𝑑𝐺𝐺 𝐶𝐶𝑑𝑑(𝑉𝑉𝑉𝑉) 𝑐𝑐𝑜𝑜𝐺𝐺𝑐𝑐.(𝑚𝑚𝑔𝑔 𝑘𝑘𝑔𝑔−1)
× 1000 Equation 6.1
where the PM10 conc. is the amount of PM10 material required to be suspended to exceed the
guideline Cr(VI) concentrations. The suspended airborne PM10 amounts required are
summarised in Table 6-4. The suspended airborne PM10 materials required to exceed the
guideline value of 0.52 ng m-3 were 26.4 - 36.0 µg m3 based on the PM10 bioaccessible Cr(VI)
and 4.12 – 8.08 µg m3 for the PM10 total Cr(VI) concentrations (Table 6-4). The mean PM10
concentrations measured at Glasgow Townhead monitoring centre between 2008 and 2018
was 12 ± 6 µg m3 (UK-air, 2018) which highlights that the required amounts of suspended
PM10 to exceed the airborne Cr(VI) guidelines are not unreasonable values for the local area.
In a consultation document looking at the concentrations of metals and metalloids in ambient
air with regards to human health, DEFRA recommend a maximum ambient air annual mean
Cr(VI) concentration of 0.2 ng m-3 (DEFRA, 2008). This translates to 12.5 ± 2.1 and 2.55 ±
0.83 µg m3 of PM10 with respect to bioaccessible Cr(VI) and total Cr(VI) concentrations in the

219
Polmadie banking soils, respectively. However, without knowing the current Polmadie Cr(VI)
airborne concentration and the contribution to airborne dust from the banking soil, it is not
possible to comment further on the significance of this value.
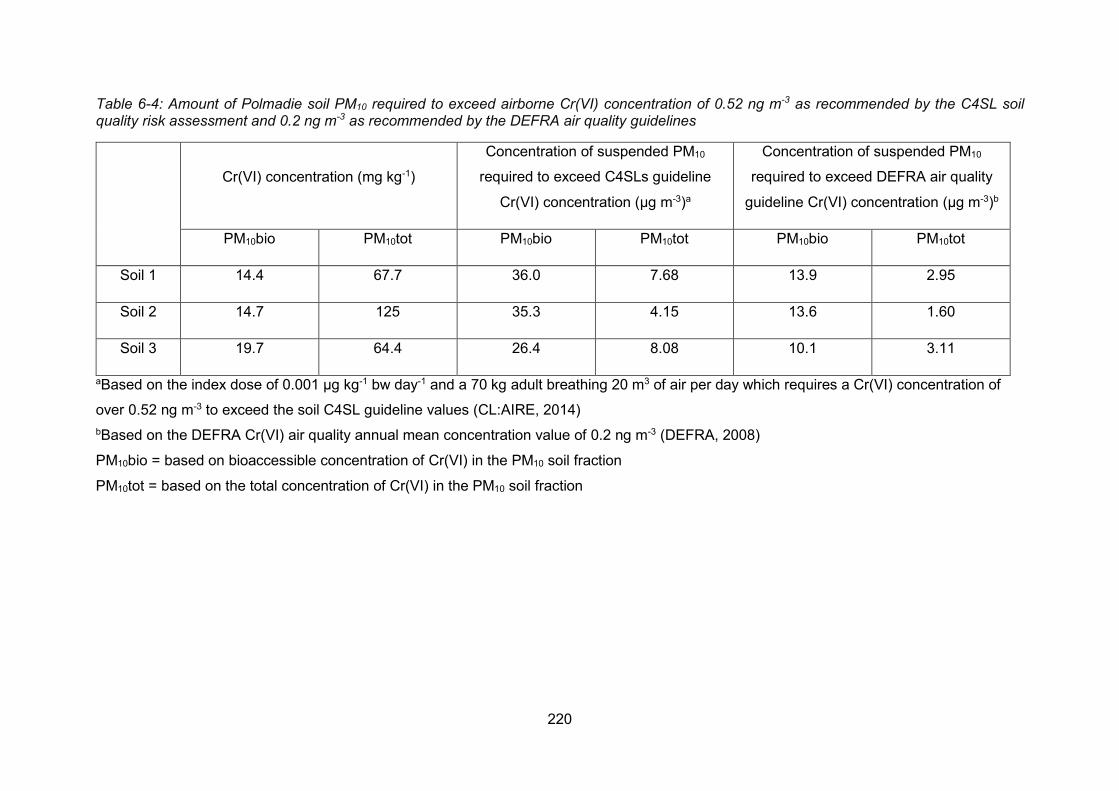
220
Table 6-4: Amount of Polmadie soil PM10 required to exceed airborne Cr(VI) concentration of 0.52 ng m-3 as recommended by the C4SL soil quality risk assessment and 0.2 ng m-3 as recommended by the DEFRA air quality guidelines
Cr(VI) concentration (mg kg-1)
Concentration of suspended PM10
required to exceed C4SLs guideline
Cr(VI) concentration (µg m-3)a
Concentration of suspended PM10
required to exceed DEFRA air quality
guideline Cr(VI) concentration (µg m-3)b
PM10bio PM10tot PM10bio PM10tot PM10bio PM10tot
Soil 1 14.4 67.7 36.0 7.68 13.9 2.95
Soil 2 14.7 125 35.3 4.15 13.6 1.60
Soil 3 19.7 64.4 26.4 8.08 10.1 3.11
aBased on the index dose of 0.001 µg kg-1 bw day-1 and a 70 kg adult breathing 20 m3 of air per day which requires a Cr(VI) concentration of
over 0.52 ng m-3 to exceed the soil C4SL guideline values (CL:AIRE, 2014) bBased on the DEFRA Cr(VI) air quality annual mean concentration value of 0.2 ng m-3 (DEFRA, 2008)
PM10bio = based on bioaccessible concentration of Cr(VI) in the PM10 soil fraction
PM10tot = based on the total concentration of Cr(VI) in the PM10 soil fraction
221
6.6.5 Comparison of bioaccessible concentrations with solid phase chromium concentrations
in the banking soil PM10
The current approach by DEFRA is to use a conservative method which presumes that all
Cr(VI) in dust is bioaccessible (DEFRA, 2014b). In the case of the Polmadie banking soil the
inhalation bioaccessibility of Cr(VI) was 21 ± 9% therefore there is approximately a 5-fold
difference in the concentration of suspended PM10 required to exceed the guideline value
depending on whether the bioaccessible fraction or total concentration of Cr(VI) is used. Since
the index values are calculated using airborne Cr(VI) concentrations, the exposure to soil PM10
required should be based on the bioaccessible Cr(VI) concentrations rather than the solid
phase Cr(VI) concentration. This means the current method used taking the total concentration
of Cr(VI) in dusts is not necessarily the best value when determining the exposure to Cr(VI).
It also shows that the current conservative approach by the CLEA model that assumes that all
airborne Cr(VI) is absorbed by the body will overestimate the true concentration of Cr(VI)
absorbed.
The soil guidelines also state that the inhalation of soil derived dusts for public open space
and parks is estimated to contribute to 0.03% of the total exposure to Cr(VI); however, the
amount of dust produced should be considered on a site by site basis. The factors influencing
the production of dust are: the climate and coverage of the site; vehicle movements on the
site; and whether Cr(VI) is present in a dusty form (DEFRA, 2014a, Envrionment Agency,
2002). As shown here, Cr(VI) is present in the PM10 fraction of the Polmadie banking soil and
the vegetation coverage is minimal in places resulting in bare soil – especially during winter
months. However, under current conditions the Polmadie banking soil is unlikely to dry
completely considering the banking soil’s large water holding capacity and the wet climate of
Glasgow. Due to these reasons it is likely that the banking soil will produce a limited amount
of dust. If the burn is diverted and there are prolonged dry spells the dust produced by the soil
is likely to increase. Additionally, the amount of soil that is transported into nearby homes is
unknown but important to assess when considering the exposure to Cr(VI) of local residents.
222
6.7 Summary
The mean PM10 Cr(VI) bioaccessibility fraction of three banking soils was 16.3 ± 3 mg kg-1
which corresponded to 19.0 ± 8.3% of the PM10 total Cr(VI). The bioaccessible fraction of
Cr(VI) did not exceed the C4SL value for POSres land use, but the solid phase Cr(VI)
concentration of 85.8 ± 34 mg kg-1 did. This highlights a discrepancy between the
bioaccessible and solid phase concentrations of a contaminant, and challenges the current
practice of presuming 100% bioaccessibility when carrying out a soil risk assessment. The
question remains as to whether or not this is the best practice. The methods used to derive
C4SL screening values are highly conservative and act as a guideline prompting further
investigation if exceeded. This project investigated the bioaccessible fraction of total Cr and
Cr(VI) in PM10 fraction of Polmadie soils. The PM10 total Cr(VI) concentrations exceeded the
site-specific assessment criteria value provided by the CLEA model, however the secluded
nature of the soil may reduce exposure to the soil to acceptable levels. To gain a better
understanding of the risk posed, the actual airborne concentration of Cr(VI) in the area is
required. An assessment of this was outside the scope of this project but is highly
recommended to be determined if the true exposure to Cr(VI) by the local population is to be
measured. The bioaccessibility should also be measured on this dust to determine the fraction
of Cr(VI) that is potentially available to be absorbed by the body as this is unlikely to be 100%
as assumed by the CLEA model.
223
7 Summary, conclusions and further work
7.1 Fate of chromium in the Polmadie Burn surface water
Chromium in the Polmadie Burn
Long-term monitoring data was provided by SEPA which included concentrations of nutrients
and inorganic constituents in the Polmadie Burn waters over the period 1967 to 2017. The
Polmadie Burn is classified as a lowland (<80 m altitude) and high alkalinity (>50 mg L-1)
surface water body. This categorisation is then used to determine the water quality with
respect to several other parameters such as dissolved oxygen concentrations. At the current
time, the water is neutral/slightly alkaline with a pH range (5th to 95th percentile) of pH 7.2 -8.4
which is consistent with high status. However, for BOD, Polmadie Burn is classified as
moderate/poor suggesting that anoxic conditions may result in the formation of anoxic
conditions Metal and metalloid concentrations with the exception of Cr, were typically below
their respective EQS values. The median Cr concentration over the monitoring period of 1967-
2017 was 2.69 mg L-1 exceeding the EQS value for Cr(VI) of 3.4 µg L-1 by ~3 orders of
magnitude. Although SEPA did not determine Cr speciation, analysis of 0.45 µm-filtered Burn
water in this PhD project showed that it was almost exclusively present as Cr(VI). This is a
concern because exposure to Cr(VI) can lead to a variety of human health effects, ranging
from contact dermatitis to lung cancer.
The long-term temporal trends in the Cr concentrations were analysed which suggest that
there had been a decrease in the Cr concentrations during the 1990s, with pre and post 2000
median values of 2.46 and 2.17 mg L-1, respectively. However, the concentration over the
time period 2010-2017 has been relatively stable at 2.26 mg L-1. Over this period, it was
evident that the dissolved Cr concentrations were directly correlated with pH. Glasgow COPR
is a highly alkaline material which has been shown to impact upon the pH and Cr
concentrations in groundwater and surface water (Farmer et al., 2002, Geelhoed et al., 2003)
and this may well still be an importance source of Cr to the Polmadie Burn waters. In addition,
however, banking soil leaching experiments revealed a positive correlation between leached
Cr concentration and Ca and Mg concentrations. This had previously been observed by
Geelhoed et al. (2002) in leaching studies of COPR and so runoff from banking soils may also
continue to be a source of COPR-derived Cr in these surface waters (Geelhoed et al., 2002).
224
Removal of chromium from surface water by the banking soil during flood events
7.1.2.1 Chromium(VI) removal from simulated flood waters by Polmadie banking soil
The mean total Cr concentration in the banking soils was 1710 ± 1300 mg kg-1 and Cr(VI)
comprised 18.9 ± 15% of the total soil. Sequential extraction showed that most of the Cr was
associated with organic matter which comprised ~22.4 ± 4.7% of the dry soil mass. Most of
the remainder of the Cr was associated with Fe/Mn (hydr)oxides. In support, gel
electrophoresis showed that Cr and Fe were intimately associated with the soil organic matter.
It was therefore hypothesised that Cr(III) was present as Cr(III)-organic complexes of Cr(III)-
Fe(III)-OM ternary complexes and that Cr(VI) may be adsorbed to Fe(III) oxides. Sorption
studies showed that the banking soils could retain significant additional amounts of Cr (added
in the form of dissolved Cr(VI)). At least an additional 350 mg kg-1 could be sorbed by the
banking soils and only <2% was re-released upon leaching with 0.01 M CaCl2 solution.
Although the speciation of Cr in the solid phase could not be determined, the results suggest
that OM may play an important role in the removal of Cr from the aqueous phase by reducing
Cr(VI) to Cr(III). The rationale for this interpretation is summarised as follows: under oxic
conditions Fe(II) will spontaneously and rapidly (within minutes) oxidise to Fe(III) to form
insoluble hydroxide precipitates so therefore it is not considered to be important for the
reduction of Cr(VI) in the Polmadie banking soils which are mildly oxidising. Chromium(VI)
may, however, be adsorbed by these insoluble (hydr)oxides but this process occurs only to a
very limited extent under the prevailing conditions (Rai et al., 1989, Richard and Bourg, 1991).
Therefore for the circumneutral pH, oxic banking soils it is most probable that the solid phase
OM reduces Cr(VI) and retains it either directly (complexation) or indirectly (bridging Fe)
(Banks et al., 2006, Kyziol et al., 2006, Löv et al., 2017).
Chromium(VI) removal from surface waters by Polmadie bottom sediments
The removal of Cr(VI) from surface waters by the reduction of Cr(VI) by Fe(II) bottom
sediments was shown by Palumbo-Roe et al. (2017). This was also indicated in this PhD
project by the high concentrations of Cr(VI) in the surface water which contained no detectable
Fe(II), however the opposite (high Fe(II) concentrations with no detectable Cr(VI)) was found
in the sediments. The Polmadie Burn water is generally slow flowing and events causing
sediment re-suspension are considered to be rare. Debris such as rags cover a significant
proportion of the bed sediment and this may play an additional role in limiting the contact
between the bottom sediments and the Cr(VI)-containing Burn waters. Nevertheless, within
the anoxic bottom sediments, Fe(II) is stable and, in this highly reducing environment, Cr(VI)
will be quickly reduced to form Cr(III) which precipitates to form surface coatings (Hillier et al.,
2003, Palumbo-Roe et al., 2017). Supporting evidence for Cr-Fe-containing surface coatings
was obtained using SEM-EDX in this project. Although the sediment’s ability to effectively

225
remove Cr(VI) from the aqueous phase is considered to be high, as shown by the high
concentrations of Fe(II) and limited concentrations of Cr(III) found in the sediment porewaters,
the limited infiltration of surface water to the sediment is a physical constraint limiting its
effectiveness to remove Cr(VI) from overlying waters.
226
7.2 Complexation of chromium with organic matter and its release from banking soil
and bottom sediment during drying
Chromium complexation with organic matter in banking soils and sediments
Sequential extraction analysis of banking soil and bottom sediments showed that the majority
of Cr was associated with OM and Fe/Mn hydroxides. These associations between Cr and
OM were confirmed further using gel electrophoresis. Although these were observed for field-
moist soils and sediments and air-dried soils, there was a distinct difference in: i) the type of
organic molecules Cr was associated with and ii) the amount of OM extracted from air-dried
sediment. Chromium associated with OM extracted from air-dried sediment was bound to
smaller, more mobile organic molecules as demonstrated by the greater distance travelled
during the gel electrophoresis compared to the OM extracted from field-moist sediment. In the
field-moist sediment there is small proportion of Cr associated with small organic molecules
also, but the majority is bound to larger organic molecules which closely resembles the
interactions of Cr with OM extracted from field-moist and air-dried banking soil. This has
implications because any change in labile OM concentrations will affect the mobility of Cr in
the soils and sediments due to the large proportion of the overall Cr concentration in this
fraction.
Influence of air-drying on the release of chromium from Polmadie banking soils and
sediment upon rewetting
The drying of banking soil and sediment due to prolonged dried spells was simulated in the
laboratory through a series of experiments that monitored the release of Cr from the banking
soils and bottom sediments upon rewetting after increasing drying time. Column leaching
experiments monitored the release of Cr from fresh banking soil and bottom sediment and
from material which had been air-dried for the time periods of 2 and 4 weeks. In addition to
the column leaching experiments, batch leaching experiments were conducted which
monitored the changes in leachable Cr concentrations from fresh banking soil and bottom
sediments and from material which had been air-dried for 1, 2, 5, 8, 12, 16, 21, 26, 35, 43, 50
and 62 days.
7.2.2.1 Leachate chromium concentration and speciation upon rewetting
The first thing that must be noted from the leaching experiments was the contrast in Cr
concentrations leached from banking soils and bottom sediments. Specifically, concentrations
of Cr leached from banking soils were in general an order of magnitude higher than those
leached from bottom sediments. This contrast is mainly due to the larger OM content of the
banking soils compared to bottom sediments. As discussed above, Cr forms complexes which
contain Fe and OM so when soil is rewetted, the mobilisation of these molecules and the
227
formation of colloids will result in the release of Cr into solution. For both the banking soil and
bottom sediments, the Cr leachate concentrations tended to decrease as the drying time
increased. This is most likely due to the reduction in the mobility of OM-Cr-Fe complexes as
drying time increased due to the immobilisation of these species.
Although the concentration of leachable Cr decreased after Week 2 and 4 of drying, as shown
by the column experiments results, leachable Cr concentrations decreased over the initial 2-
week drying period but then increased between Weeks 2 and 4. This was observed for the
leachable Cr concentrations upon rewetting of both banking soils and bottom sediments and
for leachable Mn concentrations in the banking soil, but not for any other element or parameter
analysed. This was hypothesised to be due to the oxidation of Cr(III) by Mn(IV) which will
subsequently release Cr(VI) and Mn(II) into solution during rewetting. More frequent sampling
intervals allowed greater detail to be gained on changes in leachable Cr concentrations as
drying time increased and can be explained from the results from the batch drying experiment
of the bottom sediment which are discussed in detail in the section below.
Oxidation of chromium(III) by manganese oxides upon drying and rewetting Polmadie
bottom sediments
During the batch drying and rewetting of bottom sediments (Section 5.4.4) it was clear that
there were two processes occurring. Over the first 21 days of drying, leachable Cr
concentrations decreased with drying time until the sediment reached a constant moisture
content. After day 21 of drying the leachable Cr concertation increased with Cr(VI) being
detected in the leachate. This process is illustrated in the schematic shown in Figure 7-1.
During the initial drying phase, leachable Cr is hypothesised to be complexed to dissolved and
colloidal OM in the leachate, as implied by the ultrafiltration data from the leaching column
data. The redox potential is also sufficiently low so that Mn(II) is stable. As the sediment dries,
the immobilisation of the Cr-Fe-OM fraction results in the decrease in Cr(III) leached upon
rewetting and the rise in redox potential results in the oxidation of Mn(II) which precipitates as
Mn(IV) oxides. The freshly formed Mn(IV) oxides will oxidise Cr(III) in the sediments to form
soluble Cr(VI) and subsequently be reduced to Mn(II), which will also be released into solution.
This is an important consideration if Polmadie bottom sediment is allowed to dry for long
periods of time. Currently the rain-free periods in Glasgow are 1-2 weeks (3 instances between
November 2017 and November 2018) and only one instance where there was a 2-4 week dry
period between November 2017 and November 2018.
Although the increase in leachate Cr(VI) and Mn concentrations as drying time increased was
not seen as clearly in the batch leaching experiment of the banking soils, the soil column
experiment showed that this was most likely occurring in the soils also. The higher OM content
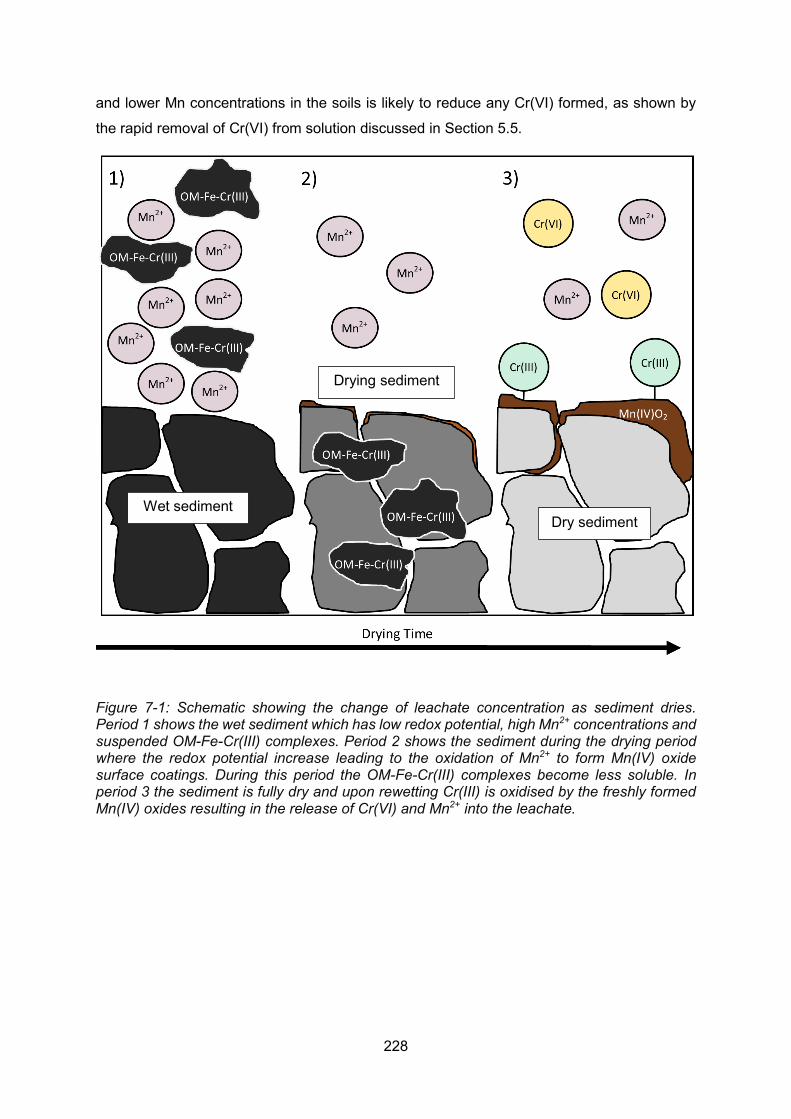
228
and lower Mn concentrations in the soils is likely to reduce any Cr(VI) formed, as shown by
the rapid removal of Cr(VI) from solution discussed in Section 5.5.
Figure 7-1: Schematic showing the change of leachate concentration as sediment dries. Period 1 shows the wet sediment which has low redox potential, high Mn2+ concentrations and suspended OM-Fe-Cr(III) complexes. Period 2 shows the sediment during the drying period where the redox potential increase leading to the oxidation of Mn2+ to form Mn(IV) oxide surface coatings. During this period the OM-Fe-Cr(III) complexes become less soluble. In period 3 the sediment is fully dry and upon rewetting Cr(III) is oxidised by the freshly formed Mn(IV) oxides resulting in the release of Cr(VI) and Mn2+ into the leachate.
Wet sediment
Drying sediment
Dry sediment
229
7.3 Mobilisation of chromium from banking soil dust in the lungs – an inhalation
bioaccessibility study
UK soil risk assessment overview
To protect people from exposure to contaminants in soil, the UK Environment Agency (EA)
developed the Contaminated Land Exposure Assessment, a three-step risk assessment
method, for assessing potentially contaminated land. This method first considers the site
history to identify potential risks to human health. Once this has been carried out, a generic
risk assessment uses predefined trigger values to determine whether further investigation is
required and, if needed, the final step is a detailed risk assessment which determines if the
risk to human health is acceptable or not. The current trigger values in use are the category 4
screening levels (C4SLs) set out by DEFRA. These values have been developed by
considering the available literature on the health effects of contaminants, the concentrations
required before detrimental health affects occur and what society deems to be unacceptable
risks. The Scottish Environment Protection Agency (SEPA) has largely adopted the same
methods that the DEFRA use as described here.
Due to the history of COPR disposal in the surrounding area and high concentrations of Cr in
the Polmadie Burn water, an investigation into the Cr concentrations in the banking soils and
sediment was needed to quantify the amount of Cr in the proximity of a public park and new
housing development. The banking soil analysed over the course of this project (n=19)
showed a range of total Cr concentrations of 418 – 6310 mg kg-1 and the Cr(VI) concentration
of 76.7 – 2190 mg kg-1. For all soils they exceed the Cr(VI) C4SL of 21 mg kg-1 for public open
space beside residential areas land use. Although the concentrations of Cr(VI) found in the
soils are above the trigger value, it does not necessarily mean that the soil poses an
unacceptable risk to human health as the soil concentrations do not necessarily reflect how
much Cr(VI) is bioaccessible which is the important aspect with regards to health. As
demonstrated above, the quantities of Cr leached from the soil is a very small fraction of the
concentrations present in the soils. To estimate the risk to human health created by inhalation
of dust from the Polmadie banking soil, the inhalation bioaccessibility of the banking soils was
measured.
Bioaccessible concentrations of chromium in Polmadie banking soil <10 µm fraction
The largest particle size that can enter human lungs is considered to be 10 µm and so the
bioaccessibility of the PM10 fraction (particles of up to 10 µm) of the soil must be used before
considering the inhalation bioaccessibility. The bioaccessible fraction of total Cr and Cr(VI) in
the banking soil PM10 fraction was 59.2 ± 40 and 16.3 ± 3.0 mg kg-1, respectively. This
corresponded to 15.1 ± 10 and 19.0 ± 8.3% of the total Cr and Cr(VI) concentration,
230
respectively. The mean PM10 total Cr(VI) concentration of 85.8 ± 34 mg kg-1, was above the
C4SL trigger value of 21 mg kg-1 however the PM10 bioaccessible fraction was below this
value. The site-specific assessment criteria was determined for each site and the PM total
Cr(VI) exceeded this value for each site. However, due to the secluded nature of the site, with
limited access it is recommended that further studies investigating the concentration of Cr(VI)
in airborne dust in the site are conducted to gain a better understanding of the exposure to
those who live in the area. A detailed evaluation of the inhalation bioaccessibility of the
Polmadie banking soils can be found in Chapter 6.
Although the oxidation state of Cr was determined in the inhalation bioaccessibility leachate,
there was no further investigation into the associations of Cr in the PM10 fraction or in the
leachate. From the results of the soil leaching experiments it is however possible to predict
the factors affecting the Cr mobilisation in the lungs. Chromium mobilisation in the lungs is
likely to be due to: i) the mobilisation of Cr(III)-OM complexes and ii) the desorption of Cr(VI)
adsorbed to PM10. The most important mobilisation of Cr from Polmadie banking soils is the
complexation of Cr(III) with labile OM. As shown by the leaching experiments, the species of
Cr extracted in the inhalation bioaccessibility assessment of Cr was predominantly in the Cr(III)
form. This was due to the mobilisation of OM which was an important mechanism influencing
the concentration of bioaccessible Cr(III). Since Cr(VI) does not form stable complexes with
OM, the release of Cr(VI) adsorbed by the soil is likely to be a source of bioaccessible Cr(VI).
From the results of the bioaccessibility test it could be seen that there was much larger
variation in the bioaccessible Cr(III) concentrations (RSD = 68%) compared to the Cr(VI) (RSD
= 18%). The variation of the PM10 total Cr(III) concentration was relatively low (RSD = 8.0%)
this suggests that there is a variable in the PM10 which is controlling the bioaccessibility of
Cr(III). This could be due to the variations in the composition of OM between the sites but
further work investigating the Cr-OM complexes, for example using gel electrophoresis, is
needed to identify if this is the case.
It was also noted that the release of Cr from the PM10 fraction during the inhalation
bioaccessibility was much larger than the concentration of Cr leached from the banking soil
by the batch and column leaching experiments. This is due to the small size fraction of the
PM10 which has a much larger surface area per mass than the whole soil, leading to higher
capacity to adsorb Cr(VI). The lower S:L ratio will also increase the desorption kinetics and
the chelating agents in the Gamble’s solution will promote the solubility of Cr.
231
7.4 Wider implications of this study
Former urban-industrial environments are becoming more valuable due to the increased
demand for development land to support the continued migration of people to urban centres.
Therefore, the behaviour of pollutants in urban waterways and soils needs to be understood
to predict the exposure pathways resulting in detrimental effects on human health. To aid with
the risk assessment of potentially contaminated land this PhD project has shown that the total
Cr concentrations in the soil is not an appropriate parameter as it does not reflect the risk of
exposure to toxic species of Cr or its release to ground/surface water. This PhD project has
explored the processes that lead to the interconversion of Cr(III)/Cr(VI) in the sediments and
highly vegetated banking soils of urban streams. The results show that the reduction and
immobilisation of Cr(VI) in these soils and sediments was a more predominant process than
the Cr(III) oxidation making these sediments and soils a sink for Cr(VI). The drying of highly
organic banking soils resulted in the decrease of leachable Cr concentrations when the soil
was rewetting, suggesting that the rerelease of Cr back into ground/surface water was
minimal. The high capacity of these organic soils for immobilising Cr suggests that some urban
soils could potentially be used as a natural barrier to reduce Cr(VI) concentrations from
industrial effluents, such as tannery waste. In Cr impacted waterways, the banking soils may
contain inhalation bioaccessible Cr(VI) and this risk will need to be quantified on an individual
site basis.
The main hazard identified by this PhD project is the potential risk of increased leachable
Cr(VI) concentrations from dried sediments. This may have implications for the disposal of
dredged sediments which have high Cr concentrations as the oxidation and subsequent
release of Cr(VI) may result in the release of Cr back into the environment. This may be also
applicable to soils with low organic matter content. The results of the drying experiments have
shown that drying/wetting cycles of exposed sediments and soils are an important natural
process that governs Cr(VI) release. This has particular relevance for areas of the world, such
as India which still produces COPR and has regular and distinct wet and dry seasons (in the
form of the Monsoon) where they may be seasonal releases of Cr(VI) from soil. This is
particularly true as it has been reported that COPR is increasingly being used as road
aggregate, which will dramatically increase its prevalence in the environment.
232
7.5 Conclusions
- From the dataset provided by SEPA Cr in the Polmadie Burn surface waters was
identified to be the only inorganic pollutant which constantly exceeded its EQS. The
mean concentration of Cr between the years of 1982 and 2017 was 2.88 ± 2.2 mg L-1
which was approximately 3 orders of magnitude higher than the EQS for Cr(VI) in
freshwaters. The species of Cr in the surface water was not determined by SEPA but
the majority of Cr (91 ± 15%) was in the <0.45 µm fraction suggesting that it was Cr(VI).
From the analysis of the Polmadie Burn surface water it was shown that the majority
of Cr is present as Cr(VI)
- Surface water Cr and Cr(VI) concentrations of <4.03 and <3.94 mg L-1, respectively,
were found in the Polmadie Burn. Banking soil concentrations contained <6310 mg
kg-1 of total Cr and <2190 mg kg-1 of Cr(VI). The majority of Cr was associated with
(OM 63.2 ± 9.5%) and Fe hydroxides (25.9 ± 8.5%). Burn sediment concentrations
were <14,900 mg kg-1 of total Cr and < 1200 mg kg-1 of Cr(VI) were found in the
sediment. Like the soils, the majority of Cr was found associated with OM (52.2 ± 5.4%)
and Fe hydroxides (37.6 ± 3.9%). Gel electrophoresis of OM extracted from Polmadie
banking soils and sediments suggested that Cr was predominately bound to OM and
Fe complexes were found
- Overall there were low leachable Cr concentrations in both soils and sediments as the
maximum amount of Cr released was < 0.023% of Cr from the banking soil and
<0.00008% of Cr from sediment after the material was leached with the equivalent of
6 weeks of rain. Chromium leached from soils contain between 30-40% or Cr(VI)
whereas Cr released from sediments was almost exclusively Cr(III).
- The drying of Polmadie Burn banking soil and sediment generally resulted in a
decrease in the leachable total Cr and Cr(VI) concentrations which was attributed to
the alteration of OM as the material dried. Upon drying the Cr concentrations decrease
and then increased again along with leachable Mn concentrations. This was shown to
be due to the oxidation of Mn(II) to form Mn(IV) oxides when the material dries,
resulting in the oxidation of Cr(III) along with the reduction of Mn(IV) to form soluble
Cr(VI) and Mn(II).
233
- Both soils and sediments showed the potential to act as a sink for Cr(VI). The proposed
mechanism for the immobilisation of Cr(VI) in sediments is reduction by Fe(II) followed
by the precipitation of Fe/Cr hydroxides. In soils the reduction of Cr(VI) by solid OM is
likely to be followed by the incorporation of Cr into OM.
- The banking soil showed the ability to remove over 99% of Cr(VI) from a 1.4 and 10
mg L-1 Cr(VI) solution over a period of 120 h. The rate of removal of Cr(VI) from solution
by the banking soils did not follow zero, first or second order kinetics suggesting that
this process was not a simple adsorption reaction and that the reduction of Cr(VI) by
OM was the main driving force for Cr(VI) removal. It was demonstrated that the banking
soil has the potential to sorb over 365 mg kg-1 of Cr(VI) suggesting that these soils may
be a natural barrier in the removal of Cr(VI) from groundwater.
- The removal of Cr(VI) from the Polmadie Burn surface water by the sediment is thought
to be limited due to the low hydraulic exchange between the surface water and the
sediment porewater.
- The inhalation bioaccessibility of Cr(VI) from the PM10 fraction of three banking soil
samples was found to be 14.4 – 19.7 mg kg-1. The PM10 total Cr(VI) concentrations
ranged between 64.4 and 125 mg kg-1 which exceeded the CLEA C4SL Cr(VI)
concentration of 21 mg kg-1 for POSres land use. The site specific Cr(VI) concentrations
were determined using the bioaccessibility data and the Cr(VI) concentrations of the
PM10. In all three soils the PM10 total Cr(VI) concentrations exceeded the site specific
Cr concentration. However, due to the secluded nature of the Polmadie Burn and the
high moisture content of the soils, which will result in low dust formation, the true risk
is likely to be lower.
234
7.6 Further work
This study has determined the speciation and mobility of Cr in a water-soil-sediment system.
To build on this research, future work looking at effective remediation strategies of Cr(VI) using
soils with a high OM content to provide low cost barriers which remove Cr(VI) from
groundwater. To understand how these “organic barriers” work, OM-Cr complexes should be
understood better to identify the important functional groups on the OM. This could be done
using size exclusion chromatography to gain a better understanding of the OM characteristics
that bind to Cr species. This technique can provide information on the molecular size
characteristics that are associated with Cr species both in sediments and soils. Furthermore,
these fractions can then be characterised using advanced techniques such as Fourier
transform infrared (FTIR) spectroscopy, nuclear magnetic resonance (NMR) spectroscopy
and UV-Vis spectral parameters e.g. spectral slope ratios; E2:E3. This can glean information
on molecular character, (e.g. aromatic, aliphatic) of the OM and the dominant functional
groups present in the OM fraction. Fourier-transform ion cyclotron resonance mass
spectroscopy (FTICR-MS) will give an insight to the characteristics and relative composition
of OM in the system, allowing use to gain fine scale information on OM bound Cr.
The fate of Cr in soils that have a low OM content should also be understood since COPR has
been produced in various places around the world all of which will have different soil
characteristics. Based on the results of this study, the addition of OM ammendments may help
reduce Cr mobility in soils and further tests should be carried out to investigate its suitability
as a low cost remediation strategy for Cr(VI).
To get a better understanding of the Cr species present in the Polmadie Burn soils and
sediment the use of X-ray absorption near edge structure (XANES) and extended X-ray
absorption fine structure (EXAFS) will give ultrafine speciation data of Cr in the soils and
sediments. This will give a better understanding of the species of Cr that is bound to soils and
sediments, and allow us to better understand what phases dictate Cr species availability.
Using time resolved XANES will offer an opportunity to quantify the effect OM has on the
sorption kinetics of Cr species on banking soils.
The method used for the inhalation bioaccessibility of Cr(VI) containing dusts still needs
refined. Future work improving the LoD of the analytical methods would allow the lower solid
to liquid ratios, which are more representative of the lungs, to be used which may affect how
the risk is determined in the future. Future work investigating the inhalation risk of
bioaccessible Cr(VI) in the ambient PM10 concentrations of Richmond Park will help
determine the risk of Cr(VI) exposure to those living in the new housing development at the
site. Quantification of PM10 in the Richmond Park air is required to accurately model the Cr
235
inhalation risk. Following this, the PM10 total Cr(VI) concentrations along with the
bioaccessible Cr(VI) concentrations can be measured to understand the flux of PM10
associated Cr. Given the low concentration of Cr(VI) associated with PM10 fractions, the use
of high performance liquid chromatography coupled with ICP-MS will give a greater sensitivity
to detecting Cr(VI) in the inhalation bioaccessibility fractions.
236
8 References
AJOUYED, O., HUREL, C., AMMARI, M., ALLAL, L. B. & MARMIER, N. 2010. Sorption of Cr(VI) onto natural iron and aluminum (oxy)hydroxides: Effects of pH, ionic strength and initial concentration. Journal of Hazardous Materials, 174, 616-622.
ALLOWAY, B. J. 2013. Heavy Metals in Soils: Trace Metals and Metalloids in Soils and their Bioavailability, Springer.
ARCE, G., MONTECINOS, M., GUERRA, P., ESCAURIAZA, C., COQUERY, M. & PASTÉN, P. 2017. Enhancement of particle aggregation in the presence of organic matter during neutralization of acid drainage in a stream confluence and its effect on arsenic immobilization. Chemosphere, 180, 574-583.
ATSDR 2012. Toxicological Profile for Chromium. In: U.S. DEPARTMENT OF HEALTH AND HUMAN SERVICES (ed.).
BACON, J. R. & DAVIDSON, C. M. 2008. Is there a future for sequential chemical extraction? Analyst, 133, 25-46.
BALOGA, M. R. & EARLEY, J. E. 1961. The Kinetics of the Oxidation of Cr(III) to Cr(VI) by Hydrogen Peroxide. Journal of the American Chemical Society, 83, 4906-4909.
BANKS, M. K., SCHWAB, A. P. & HENDERSON, C. 2006. Leaching and reduction of chromium in soil as affected by soil organic content and plants. Chemosphere, 62, 255-264.
BARNHART, J. 1997. Chromium chemistry and implications for environmental fate and toxicity. Journal of Soil Contamination, 6, 561-568.
BEWLEY, R. & SOJKA, G. 2013. In Situ 'Deliverability' Trials Using Calcium Polysulfide to Treat Chromium Contamination at Shawfield, Glasgow. Contaminated Land: Applications in Real Environments.
BLOOMFIELD, J. J. & BLUM, W. 1928. HEALTH HAZARDS IN CHROMIUM PLATING. Public Health Reports, 43, 2330-2351.
BOISA, N., ELOM, N., DEAN, J. R., DEARY, M. E., BIRD, G. & ENTWISTLE, J. A. 2014. Development and application of an inhalation bioaccessibility method (IBM) for lead in the PM10 size fraction of soil. Environment International, 70, 132-142.
BOLAÑOS-BENÍTEZ, V., VAN HULLEBUSCH, E. D., GARNIER, J., QUANTIN, C., THARAUD, M., LENS, P. N. L. & SIVRY, Y. 2018. Assessing chromium mobility in natural surface waters: Colloidal contribution to the isotopically exchangeable pool of chromium (EwCr value). Applied Geochemistry, 92, 19-29.
BRADL, H. B. 2004. Adsorption of heavy metal ions on soils and soils constituents. Journal of Colloid and Interface Science, 277, 1-18.
BROADWAY, A. 2008. Development of methodologies for soil metal bioaccessibility and human health risk. PhD, University of Edinburgh.
BROADWAY, A., CAVE, M. R., WRAGG, J., FORDYCE, F. M., BEWLEY, R. J. F., GRAHAM, M. C., NGWENYA, B. T. & FARMER, J. G. 2010. Determination of the bioaccessibility of chromium in Glasgow soil and the implications for human health risk assessment. Science of The Total Environment, 409, 267-277.
BROWN, T. J. I., N.E.; RAYCRAFT, E.R.; SHAW, R.A.; HOBBS, S.F.; EVERETT, P.; DEADY, E.A.; BIDE, T.. 2018. World Mineral Production 2012-16. Nottingham UK: British Geological Survey.
CAPPUYNS, V., SWENNEN, R. & DEVIVIER, A. 2006. Dredged river sediments: Potential chemical time bombs? A case study. Water Air and Soil Pollution, 171, 49-66.
CHOPPALA, G., KUNHIKRISHNAN, A., SESHADRI, B., PARK, J. H., BUSH, R. & BOLAN, N. 2018. Comparative sorption of chromium species as influenced by pH, surface charge and organic matter content in contaminated soils. Journal of Geochemical Exploration, 184, 255-260.
CL:AIRE 2014. SP1010 – Development of Category 4 Screening Levels for Assessment of Land Affected by Contamination. In: ENVIRONMENTS, C. L. A. I. R. (ed.).
237
CRAIK, J. E., JOHN; GALBRAITH, JAMES 1886. Memoirs and Portraits of One Hundred Glasgow Men who have Died During the Last Thirty Years, and in their Lives did Much to Make the City what it Now is., Glasgow, James Maclehose & Sons.
DARRIE, G. 2001. Commercial Extraction Technology and Process Waste Disposal in the Manufacture of Chromium chemicals From Ore. Environmental Geochemistry and Health, 23, 187-193.
DAVIDSON, C. M., DUNCAN, A. L., LITTLEJOHN, D., URE, A. M. & GARDEN, L. M. 1998. A critical evaluation of the three-stage BCR sequential extraction procedure to assess the potential mobility and toxicity of heavy metals in industrially-contaminated land. Analytica Chimica Acta, 363, 45-55.
DEARDEN, R. P.-R., B. 2010. Technical notes : hyporheic zone sampling procedures. British Geological Survey.
DEFRA 2008. Consultation on guidelines for metals and metalloids in ambient air for the protection of human health
DEFRA 2014a. Category 4 Screening Levels (C4SL) for assessment of land affected by contamination Appendix G Provisonal C4CLs for Chromium(VI). In: DEFRA (ed.).
DEFRA 2014b. SP1010: Development of Category 4 Screening Levels for Assessment of Land Affected by Contamination – Policy Companion Document.
DEFRA 2018. pH in precipitation between the years 2000-2016 in Eskdalemuir. uk-air.defra.gov.uk. DHAL, B., THATOI, H. N., DAS, N. N. & PANDEY, B. D. 2013. Chemical and microbial remediation of
hexavalent chromium from contaminated soil and mining/metallurgical solid waste: A review. Journal of Hazardous Materials, 250, 272-291.
DING, W., STEWART, D. I., HUMPHREYS, P. N., ROUT, S. P. & BURKE, I. T. 2016. Role of an organic carbon-rich soil and Fe(III) reduction in reducing the toxicity and environmental mobility of chromium(VI) at a COPR disposal site. Science of The Total Environment, 541, 1191-1199.
DREVER, J. J. 1997. The Geochemistry of Natural Waters: Surface and Groundwater Environments, Englewood Cliffs, Prentice Hall.
DULTZ, S., STEINKE, H., MIKUTTA, R., WOCHE, S. K. & GUGGENBERGER, G. 2018. Impact of organic matter types on surface charge and aggregation of goethite. Colloids and Surfaces A: Physicochemical and Engineering Aspects, 554, 156-168.
EEA 2018. European waters: Assessment of status and pressures 2018. Luxembourg: Publications Office of the European Union.
ELZINGA, E. J. & CIRMO, A. 2010. Application of sequential extractions and X-ray absorption spectroscopy to determine the speciation of chromium in Northern New Jersey marsh soils developed in chromite ore processing residue (COPR). Journal of Hazardous Materials, 183, 145-154.
EMSLEY, J. 2012. Chromium [Online]. RSC. Available: http://www.rsc.org/periodic-table/element/24/chromium [Accessed 26/10/2015 2015].
ENVIRONMENT AGENCY, 2002. Soil Guidline Values for Chromium Contamination. In: DEFRA (ed.). ENVIRONMENT AGENCY, 2004. Model Procedures for the Management of Land Contamination. ENVIRONMENT AGENCY, 2009a. CLEA Software (Version 1.05) Handbook. ENVIRONMENT AGENCY, 2009b. Human health toxicological assessment of contaminants in soil ENVIRONMENT AGENCY, 2009c. Updated technical background to the CLEA model ERICH, M. S. & HOSKINS, B. R. 2011. Effects of Soil Drying on Soil pH and Nutrient Extractability.
Communications in Soil Science and Plant Analysis, 42, 1167-1176. EUROPEAN COMMISSION, 2009. The Climate Change Challenge for European Regions. Brussels. FANDEUR, D., JUILLOT, F., MORIN, G., OLIVI, L., COGNIGNI, A., WEBB, S. M., AMBROSI, J.-P., FRITSCH,
E., GUYOT, F. & BROWN, J. G. E. 2009. XANES Evidence for Oxidation of Cr(III) to Cr(VI) by Mn-Oxides in a Lateritic Regolith Developed on Serpentinized Ultramafic Rocks of New Caledonia. Environmental Science & Technology, 43, 7384-7390.
FARMER, J. G., GRAHAM, M. C., THOMAS, R. P., LICONA-MANZUR, C., LICONA-MANZUR, C., PATERSON, E., CAMPBELL, C. D., GEELHOED, J. S., LUMSDON, D. G., MEEUSSEN, J. C. L., ROE, M. J.,
238
CONNER, A., FALLICK, A. E. & BEWLEY, R. J. F. 1999. Assessment and Modelling of the Environmental Chemistry and Potential for Remediative Treatment of Chromium-Contaminated Land. Environmental Geochemistry and Health, 21, 331-337.
FARMER, J. G. & JARVIS, R. 2009. Strategies for improving human health in contaminated situations: a review of past, present and possible future approaches. Environmental Geochemistry And Health, 31, 227-238.
FARMER, J. G., THOMAS, R. P., GRAHAM, M. C., GEELHOED, J. S., LUMSDON, D. G. & PATERSON, E. 2002. Chromium speciation and fractionation in ground and surface waters in the vicinity of chromite ore processing residue disposal sites. Journal of Environmental Monitoring, 4, 235-243.
FENDORF, S. E. 1995. Surface reactions of chromium in soils and waters. Geoderma, 67, 55-71. FENDORF, S. E. & ZASOSKI, R. J. 1992. Chromium(III) oxidation by .delta.-manganese oxide (MnO2). 1.
Characterization. Environmental Science & Technology, 26, 79-85. FORDYCE, F. M. N., S.E.; LISTER, T.R.; O DOCHARTAIGH, B.E.; COOPER, R.; ALLEN, M.; INGHAM, M.;
GOWING, C.; VICKERS, B.P.; SCHEIB, A. 2012. Urban soil geochemistry of Glasgow. Edinburgh, UK: British Geological Survey.
GEELHOED, J. S., MEEUSSEN, J. C., ROE, M. J., HILLIER, S., THOMAS, R. P., FARMER, J. G. & PATERSON, E. 2003. Chromium remediation or release? Effect of iron(II) sulfate addition on chromium(VI) leaching from columns of chromite ore processing residue. Environ Sci Technol, 37, 3206-13.
GEELHOED, J. S., MEEUSSEN, J. C. L., HILLIER, S., LUMSDON, D. G., THOMAS, R. P., FARMER, J. G. & PATERSON, E. 2002. Identification and geochemical modeling of processes controlling leaching of Cr(VI) and other major elements from chromite ore processing residue. Geochimica Et Cosmochimica Acta, 66, 3927-3942.
GOVERNMENT, S. 2014. The Scotland River Basin District (Standards) Directions 2014. GRAHAM, M. C., FARMER, J. G., ANDERSON, P., PATERSON, E., HILLIER, S., LUMSDON, D. G. & BEWLEY,
R. J. F. 2006. Calcium polysulfide remediation of hexavalent chromium contamination from chromite ore processing residue. Science of The Total Environment, 364, 32-44.
GRAHAM, M. C., OLIVER, I. W., MACKENZIE, A. B., ELLAM, R. M. & FARMER, J. G. 2008. An integrated colloid fractionation approach applied to the characterisation of porewater uranium–humic interactions at a depleted uranium contaminated site. Science of The Total Environment, 404, 207-217.
GU, B., SCHMITT, J., CHEN, Z., LIANG, L. & MCCARTHY, J. F. 1995. Adsorption and desorption of different organic matter fractions on iron oxide. Geochimica et Cosmochimica Acta, 59, 219-229.
GUAN, C.-Y., TSENG, Y.-H., TSANG, D. C. W., HU, A. & YU, C.-P. 2019. Wetland plant microbial fuel cells for remediation of hexavalent chromium contaminated soils and electricity production. Journal of Hazardous Materials, 365, 137-145.
GUSTAFSSON, J. P., PERSSON, I., OROMIEH, A. G., VAN SCHAIK, J. W. J., SJÖSTEDT, C. & KLEJA, D. B. 2014. Chromium(III) Complexation to Natural Organic Matter: Mechanisms and Modeling. Environmental Science & Technology, 48, 1753-1761.
HE, X., ZHONG, P. & QIU, X. 2018. Remediation of hexavalent chromium in contaminated soil by Fe(II)-Al layered double hydroxide. Chemosphere, 210, 1157-1166.
HEDBERG, Y., GUSTAFSSON, J., KARLSSON, H. L., MÖLLER, L. & WALLINDER, I. O. 2010. Bioaccessibility, bioavailability and toxicity of commercially relevant iron- and chromium-based particles: in vitro studies with an inhalation perspective. Particle and Fibre Toxicology, 7, 23-23.
HELMS, J. R., STUBBINS, A., RITCHIE, J. D., MINOR, E. C., KIEBER, D. J. & MOPPER, K. 2008. Absorption spectral slopes and slope ratios as indicators of molecular weight, source, and photobleaching of chromophoric dissolved organic matter. Limnology and Oceanography, 53, 955-969.
HILLIER, S., ROE, M. J., GEELHOED, J. S., FRASER, A. R., FARMER, J. G. & PATERSON, E. 2003. Role of quantitative mineralogical analysis in the investigation of sites contaminated by chromite ore processing residue. Science of The Total Environment, 308, 195-210.
239
ISO 11466:1995, 1995. Soil quality. Chemical methods. Extraction of trace elements soluble in aqua regia. Geneva, Switzerland: ISO.
JAMES, B. R., PETURA, J. C., VITALE, R. J. & MUSSOLINE, G. R. 1997. Oxidation-reduction chemistry of chromium: Relevance to the regulation and remediation of chromate-contaminated soils. Journal of Soil Contamination, 6, 569-580.
JARDINE, P. M., FENDORF, S. E., MAYES, M. A., LARSEN, I. L., BROOKS, S. C. & BAILEY, W. B. 1999. Fate and Transport of Hexavalent Chromium in Undisturbed Heterogeneous Soil. Environmental Science & Technology, 33, 2939-2944.
JARDINE, P. M., STEWART, M. A., BARNETT, M. O., BASTA, N. T., BROOKS, S. C., FENDORF, S. & MEHLHORN, T. L. 2013. Influence of Soil Geochemical and Physical Properties on Chromium(VI) Sorption and Bioaccessibility. Environmental Science & Technology, 47, 11241-11248.
JULIEN, C., ESPERANZA, P., BRUNO, M. & ALLEMAN, L. Y. 2011. Development of an in vitro method to estimate lung bioaccessibility of metals from atmospheric particles. Journal of Environmental Monitoring, 13, 621-630.
KAISER, M., KLEBER, M. & BERHE, A. A. 2015. How air-drying and rewetting modify soil organic matter characteristics: An assessment to improve data interpretation and inference. Soil Biology and Biochemistry, 80, 324-340.
KIM, J. G. & DIXON, J. B. 2002. Oxidation and fate of chromium in soils. Soil Science and Plant Nutrition, 48, 483-490.
KOTAŚ, J. & STASICKA, Z. 2000. Chromium occurrence in the environment and methods of its speciation. Environmental Pollution, 107, 263-283.
KOŽUH, N., ŠTUPAR, J. & GORENC, B. 2000. Reduction and Oxidation Processes of Chromium in Soils. Environmental Science & Technology, 34, 112-119.
KYZIOL, J., TWARDOWSKA, I. & SCHMITT-KOPPLIN, P. 2006. The role of humic substances in chromium sorption onto natural organic matter (peat). Chemosphere, 63, 1974-1982.
LAND, E. P. A. P. A. C. 1990. LJUNG, K., OOMEN, A., DUITS, M., SELINUS, O. & BERGLUND, M. 2007. Bioaccessibility of metals in
urban playground soils. Journal of Environmental Science and Health, Part A, 42, 1241-1250. LÖV, Å., SJÖSTEDT, C., LARSBO, M., PERSSON, I., GUSTAFSSON, J. P., CORNELIS, G. & KLEJA, D. B. 2017.
Solubility and transport of Cr(III) in a historically contaminated soil – Evidence of a rapidly reacting dimeric Cr(III) organic matter complex. Chemosphere, 189, 709-716.
MACLEHOSE, J. 1886. Memoirs And Portraits Of One Hundred Glasgow Men Who Have Died During The Last Thirty Years, And In Their Lives Did Much To Make The City What It Now Is, Glasgow, James Maclehose And Sons.
MAGAR, V. S., MARTELLO, L., SOUTHWORTH, B., FUCHSMAN, P., SORENSEN, M. & WENNING, R. J. 2008. Geochemical stability of chromium in sediments from the lower Hackensack River, New Jersey. Science of The Total Environment, 394, 103-111.
MARTELLO, L., FUCHSMAN, P., SORENSEN, M., MAGAR, V. & WENNING, R. J. 2007. Chromium geochemistry and bioaccumulation in sediments from the lower Hackensack River, New Jersey. Archives Of Environmental Contamination And Toxicology, 53, 337-350.
MATERN, K., KLETTI, H. & MANSFELDT, T. 2016. Chemical and mineralogical characterization of chromite ore processing residue from two recent Indian disposal sites. Chemosphere, 155, 188-195.
MIDANDER, K., FRUTOS, A., HEDBERG, Y., DARRIE, G. & ODNEVALL WALLINDER, I. 2010. Bioaccessibility studies of ferro-chromium alloy particles for a simulated inhalation scenario. A comparative study with the pure metals and stainless steel. Integrated Environmental Assessment and Management, 6.
MIN, X., WANG, Y., CHAI, L., YANG, Z. & LIAO, Q. 2017. High-resolution analyses reveal structural diversity patterns of microbial communities in Chromite Ore Processing Residue (COPR) contaminated soils. Chemosphere, 183, 266-276.
240
MORMAN, S. A., PLUMLEE, G. S. & SMITH, D. B. 2009. Application of in vitro extraction studies to evaluate element bioaccessibility in soils from a transect across the United States and Canada. Applied Geochemistry, 24, 1454-1463.
MPOURAS, T., CHRYSOCHOOU, M., DERMATAS, D. 2017. Investigation of hexavalent chromium sorption in serpentine sediments. Journal of Contaminant Hydrology, 197, 29-38. NIELSEN, J. B. & KRISTIANSEN, J. 2004. Remediation of soil from lead-contaminated kindergartens reduces the amount of lead adhering to children's hands. Journal Of Exposure Analysis And Environmental Epidemiology, 15, 282. OECD 2000. Test No. 106: Adsorption -- Desorption Using a Batch Equilibrium Method, OECD Publishing. OECD 2004. Test No. 312: Leaching in Soil Columns. PALUMBO-ROE, B., BANKS, V. J., BONSOR, H. C., HAMILTON, E. M. & WATTS, M. J. 2017. Limitations
on the role of the hyporheic zone in chromium natural attenuation in a contaminated urban stream. Applied Geochemistry, 83, 108-120.
PAN, C., LIU, H., CATALANO, J. G., QIAN, A., WANG, Z. & GIAMMAR, D. E. 2017. Rates of Cr(VI) Generation from CrxFe1–x(OH)3 Solids upon Reaction with Manganese Oxide. Environmental Science & Technology, 51, 12416-12423.
PAPASSIOPI, N., VAXEVANIDOU, K., CHRISTOU, C., KARAGIANNI, E. & ANTIPAS, G. S. E. 2014. Synthesis, characterization and stability of Cr(III) and Fe(III) hydroxides. Journal of Hazardous Materials, 264, 490-497.
PARIRENYATWA, S., ESCUDERO-CASTEJON, L., SANCHEZ-SEGADO, S., HARA, Y. & JHA, A. 2016. Comparative study of alkali roasting and leaching of chromite ores and titaniferous minerals. Hydrometallurgy, 165, 213-226.
PARKS, G. A. & BRUYN, P. L. D. 1962. THE ZERO POINT OF CHARGE OF OXIDES. The Journal of Physical Chemistry, 66, 967-973.
PATERSON, E. 2011. Geochemical Atlas for Scottish Topsoils, Aberdeen, The Macaulay Land Use Reserach Institute.
PETTINE, M., D’OTTONE, L., CAMPANELLA, L., MILLERO, F. J. & PASSINO, R. 1998. The reduction of chromium (VI) by iron (II) in aqueous solutions. Geochimica et Cosmochimica Acta, 62, 1509-1519.
PRIESTLEY, S. & BARTON, C. 2018. Commoncs Breifing Papers CBP-7246: Water Quality. PUZON, G. J., ROBERTS, A. G., KRAMER, D. M. & XUN, L. 2005. Formation of Soluble
Organo−Chromium(III) Complexes after Chromate Reduction in the Presence of Cellular Organics. Environmental Science & Technology, 39, 2811-2817.
RAI, D., EARY, L. E. & ZACHARA, J. M. 1989. Environmental chemistry of chromium. Science of The Total Environment, 86, 15-23.
RAO, M. N., SULTANA, R. & KOTA, S. H. 2017. Chapter 7 - Soil Remediation Technologies. In: RAO, M. N., SULTANA, R. & KOTA, S. H. (eds.) Solid and Hazardous Waste Management. Butterworth-Heinemann.
RAURET, G., F. LÓPEZ-SÁNCHEZ, J., SAHUQUILLO, A., RUBIO, R., DAVIDSON, C., URE, A. & QUEVAUVILLER, P. 1999. Improvement of the BCR three step sequential extraction procedure prior to the certification of new sediment and soil reference materials. Journal of Environmental Monitoring, 1, 57-61.
REEDER, R. J., SCHOONEN, M. A. A. & LANZIROTTI, A. 2006. Metal Speciation and Its Role in Bioaccessibility and Bioavailability. Reviews in Mineralogy and Geochemistry, 64, 59-113.
REIJONEN, I. & HARTIKAINEN, H. 2016. Oxidation mechanisms and chemical bioavailability of chromium in agricultural soil – pH as the master variable. Applied Geochemistry, 74, 84-93.
RICHARD, F. C. & BOURG, A. C. M. 1991. Aqueous geochemistry of chromium: A review. Water Research, 25, 807-816.
RIMSTIDT, J. D. & VAUGHAN, D. J. 2003. Pyrite oxidation: a state-of-the-art assessment of the reaction mechanism. Geochimica et Cosmochimica Acta, 67, 873-880.
241
RUBY, M. V., DAVIS, A., LINK, T. E., SCHOOF, R., CHANEY, R. L., FREEMAN, G. B. & BERGSTROM, P. 1993. Development of an in vitro screening test to evaluate the in vivo bioaccessibility of ingested mine-waste lead. Environmental Science & Technology, 27, 2870-2877.
SALEH, F. Y., PARKERTON, T. F., LEWIS, R. V., HUANG, J. H. & DICKSON, K. L. 1989. Kinetics of chromium transformations in the environment. Science of The Total Environment, 86, 25-41.
SCIENCE COMMUNICATION UNIT, U. O. T. W. O. & ENGLAND 2013. Science for Environment Policy In-depth Report: Soil Contamination: Impacts on Human Health. Report produced for the European Commission DG Environment.
SEMPLE, K., DOICK, K., JONES, K., BURAUEL, P., CRAVEN, A. & HARMS, H. 2004. Defining bioavailability and bioaccessibility of contaminated soil and sediment is complicated. Environmental Science & Technology, 38, 228A-231A.
SEPA Glasgow City Rivers and Streams. SMEDLEY, P. L. B., J.M.; FORDYCE, F.M.; EVERETT, P.A.; CHENERY, S.; ELLEN, R.. 2017. Stream-water
geochemical atlas of the Clyde Basin. Nottingham: British Geological Survey. STEPHENS, S. R., ALLOWAY, B. J., PARKER, A., CARTER, J. E. & HODSON, M. E. 2001. Changes in the
leachability of metals from dredged canal sediments during drying and oxidation. Environmental Pollution, 114, 407-413.
STEVENSON, F. J. 1982. Humus Chemistry: Genesis, Composition, Reactions, Canada, John Wiley & Sons.
STUMM, W. A. 1987. Aquatic surface chemistry: Chemical processes at the particle-water interface, John Wiley & Sons.
SULTANA, M.-Y., AKRATOS, C. S., PAVLOU, S. & VAYENAS, D. V. 2014. Chromium removal in constructed wetlands: A review. International Biodeterioration & Biodegradation, 96, 181-190.
ŚWIETLIK, R. 2002. Kinetic Study of Redox Processes of Chromium in Natural River Water. Pol. J. Environ. Stud., 11, 441-447.
TACK, F. & VERLOO, M. 1995. Chemical Speciation and Fractionation in Soil and Sediment Heavy Metal Analysis: A Review.
TESSIER, A., CAMPBELL, P. G. C. & BISSON, M. 1979. SEQUENTIAL EXTRACTION PROCEDURE FOR THE SPECIATION OF PARTICULATE TRACE-METALS. Analytical Chemistry, 51, 844-851.
TOJO, G. & FERNANDEZ, M. I. 2006. Oxidation of Alcohols to Aldehydes and Ketones, Springer US. TRUMPER, H. B. 1931. The health of the worker in chromium plating. British Medical Journal, 1931,
705-706. TSCHAPEK, T., AND WASOWSKI 1974. The Point of Zero Charge (pzc) of Kaolinite and SiO2 + Al2O3
Mixtures. Clay Minerals, 10. U.S. GEOLOGICAL SURVEY 1996. Mineral Commodity Summaries 1996. U.S. Geological Survey. U.S. GEOLOGICAL SURVEY 2015. Mineral Commodity Summaries 2015. U.S. Geological Survey. UDY, M. J. 1957. Chromium. Chemistry of Chromium and Its Compounds. Volume I, New York, Reinhold
Publishing. UK-AIR 2018. Daily Mean PM10 Concentrations at Glasgow Townhead. In: DEFRA (ed.). URE, A. M., QUEVAUVILLER, P., MUNTAU, H. & GRIEPINK, B. 1993. Speciation of Heavy Metals in Soils
and Sediments. An Account of the Improvement and Harmonization of Extraction Techniques Undertaken Under the Auspices of the BCR of the Commission of the European Communities. International Journal of Environmental Analytical Chemistry, 51, 135-151.
USEPA 1998. Toxicological Review of Hexavalent Chromium. In: U.S. EVIRONMENTAL PROTECTION AGENCY (ed.). Washington, DC: U.S. Environmental Protection Agency,.
USEPA 2009. Method 415.3 Determination Of Total Organic Carbon And Specific UV Absorbance At 254 nm in Source Water and Drinking Water. Cincinnati, Ohio: USEPA.
USGS 2010. USGS Mineral Resources Program Chromium - Makes Stainless Steel Stainless.
242
VIOLLIER, E., INGLETT, P. W., HUNTER, K., ROYCHOUDHURY, A. N. & VAN CAPPELLEN, P. 2000. The ferrozine method revisited: Fe(II)/Fe(III) determination in natural waters. Applied Geochemistry, 15, 785-790.
VYMAZAL, J. 2014. Constructed wetlands for treatment of industrial wastewaters: A review. Ecological Engineering, 73, 724-751.
WADHAWAN, A. R., STONE, A. T. & BOUWER, E. J. 2013. Biogeochemical Controls on Hexavalent Chromium Formation in Estuarine Sediments. Environmental Science & Technology, 47, 8220-8228.
WANG, T., HE, M. & PAN, Q. 2007. A new method for the treatment of chromite ore processing residues. Journal of Hazardous Materials, 149, 440-444.
WANG, T., LIU, Y., WANG, J., WANG, X., LIU, B. & WANG, Y. 2019. In-situ remediation of hexavalent chromium contaminated groundwater and saturated soil using stabilized iron sulfide nanoparticles. Journal of Environmental Management, 231, 679-686.
WAZNE, M., JAGUPILLA, S. C., MOON, D. H., JAGUPILLA, S. C., CHRISTODOULATOS, C. & KIM, M. G. 2007. Assessment of calcium polysulfide for the remediation of hexavalent chromium in chromite ore processing residue (COPR). Journal of Hazardous Materials, 143, 620-628.
WEN, J., LI, Z., HUANG, B., LUO, N., HUANG, M., YANG, R., ZHANG, Q., ZHAI, X. & ZENG, G. 2018. The complexation of rhizosphere and nonrhizosphere soil organic matter with chromium: Using elemental analysis combined with FTIR spectroscopy. Ecotoxicology and Environmental Safety, 154, 52-58.
WENG, C. H., HUANG, C. P., ALLEN, H. E., CHENG, A. H. D. & SANDERS, P. F. 1994. Chromium leaching behavior in soil derived from chromite ore processing waste. Science of The Total Environment, 154, 71-86.
WHALLEY, C., HURSTHOUSE, A., ROWLATT, S., IQBAL-ZAHID, P., VAUGHAN, H. & DURANT, R. 1999. Chromium speciation in natural waters draining contaminated land, Glasgow, U.K. Water, Air and Soil Pollution, 112, 389-405.
WHO 2000. WHO air quality guidelines for Europe Chapter 6.4 Chromium. WISEMAN, C. L. S., NIU, J., LEVESQUE, C., CHÉNIER, M. & RASMUSSEN, P. E. 2018. An assessment of
the inhalation bioaccessibility of platinum group elements in road dust using a simulated lung fluid. Environmental Pollution, 241, 1009-1017.
WITTBRODT, P. R. & PALMER, C. D. 1995. Reduction of Cr(VI) in the Presence of Excess Soil Fulvic Acid. Environmental Science & Technology, 29, 255-263.
WRAGG, J., CAVE, M., BASTA, N., BRANDON, E., CASTEEL, S., DENYS, S., GRON, C., OOMEN, A., REIMER, K., TACK, K. & VAN DE WIELE, T. 2011. An inter-laboratory trial of the unified BARGE bioaccessibility method for arsenic, cadmium and lead in soil. Science of The Total Environment, 409, 4016-4030.
WRAGG, J. & KLINCK, B. 2007. The bioaccessibility of lead from Welsh mine waste using a respiratory uptake test. Journal of Environmental Science and Health, Part A, 42, 1223-1231.
XIAO, W., YE, X., YANG, X., LI, T., ZHAO, S. & ZHANG, Q. 2015. Effects of alternating wetting and drying versus continuous flooding on chromium fate in paddy soils. Ecotoxicology and Environmental Safety, 113, 439-445.
XU, F., LIU, Y., ZACHARA, J., BOWDEN, M., KENNEDY, D., PLYMALE, A. E. & LIU, C. 2017. Redox transformation and reductive immobilization of Cr(VI) in the Columbia River hyporheic zone sediments. Journal of Hydrology, 555, 278-287.
YING, G.-G. 2018. Chapter 14 - Remediation and Mitigation Strategies. In: MAESTRONI, B. & CANNAVAN, A. (eds.) Integrated Analytical Approaches for Pesticide Management. Academic Press.
YOUXIAN, W. & BAOLIN, D. 2006. Inhibition of FeS on Chromium(III) Oxidation by Biogenic Manganese Oxides. Environmental Engineering Science, 23, 552-560.
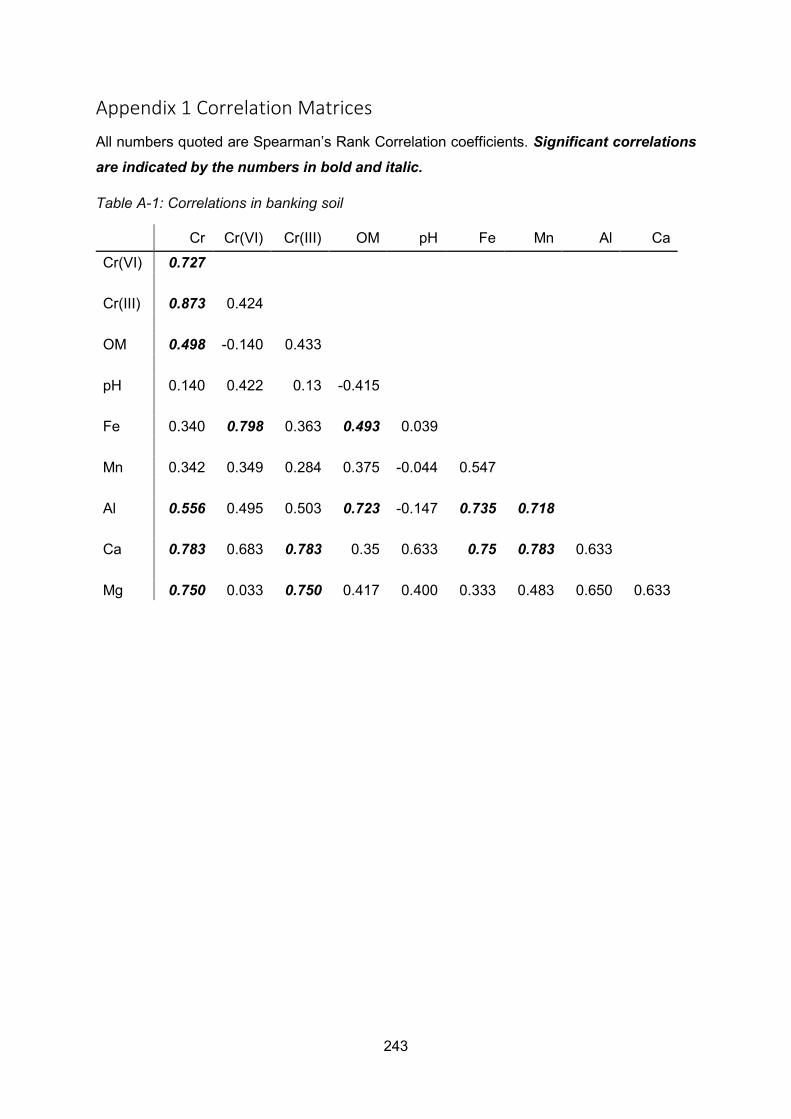
243
Appendix 1 Correlation Matrices
All numbers quoted are Spearman’s Rank Correlation coefficients. Significant correlations are indicated by the numbers in bold and italic.
Table A-1: Correlations in banking soil
Cr Cr(VI) Cr(III) OM pH Fe Mn Al Ca Cr(VI) 0.727 Cr(III) 0.873 0.424 OM 0.498 -0.140 0.433
pH 0.140 0.422 0.13 -0.415 Fe 0.340 0.798 0.363 0.493 0.039 Mn 0.342 0.349 0.284 0.375 -0.044 0.547 Al 0.556 0.495 0.503 0.723 -0.147 0.735 0.718 Ca 0.783 0.683 0.783 0.35 0.633 0.75 0.783 0.633 Mg 0.750 0.033 0.750 0.417 0.400 0.333 0.483 0.650 0.633
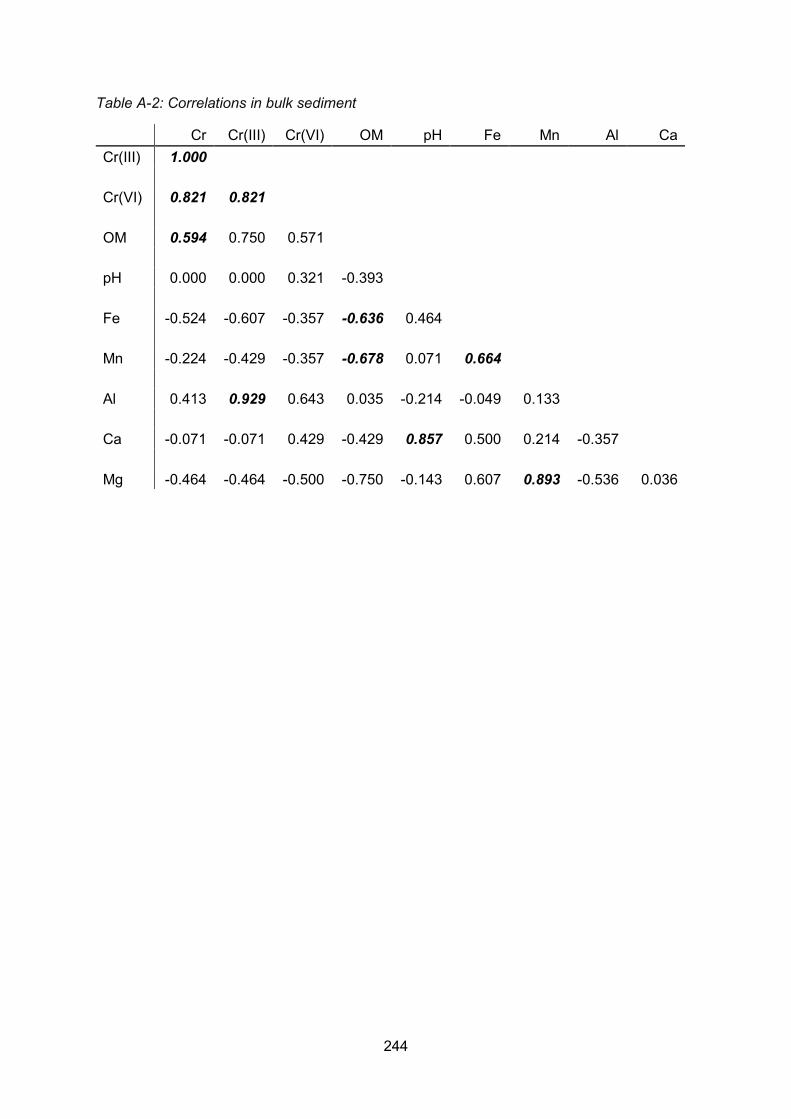
244
Table A-2: Correlations in bulk sediment
Cr Cr(III) Cr(VI) OM pH Fe Mn Al Ca Cr(III) 1.000 Cr(VI) 0.821 0.821 OM 0.594 0.750 0.571 pH 0.000 0.000 0.321 -0.393 Fe -0.524 -0.607 -0.357 -0.636 0.464 Mn -0.224 -0.429 -0.357 -0.678 0.071 0.664 Al 0.413 0.929 0.643 0.035 -0.214 -0.049 0.133 Ca -0.071 -0.071 0.429 -0.429 0.857 0.500 0.214 -0.357 Mg -0.464 -0.464 -0.500 -0.750 -0.143 0.607 0.893 -0.536 0.036
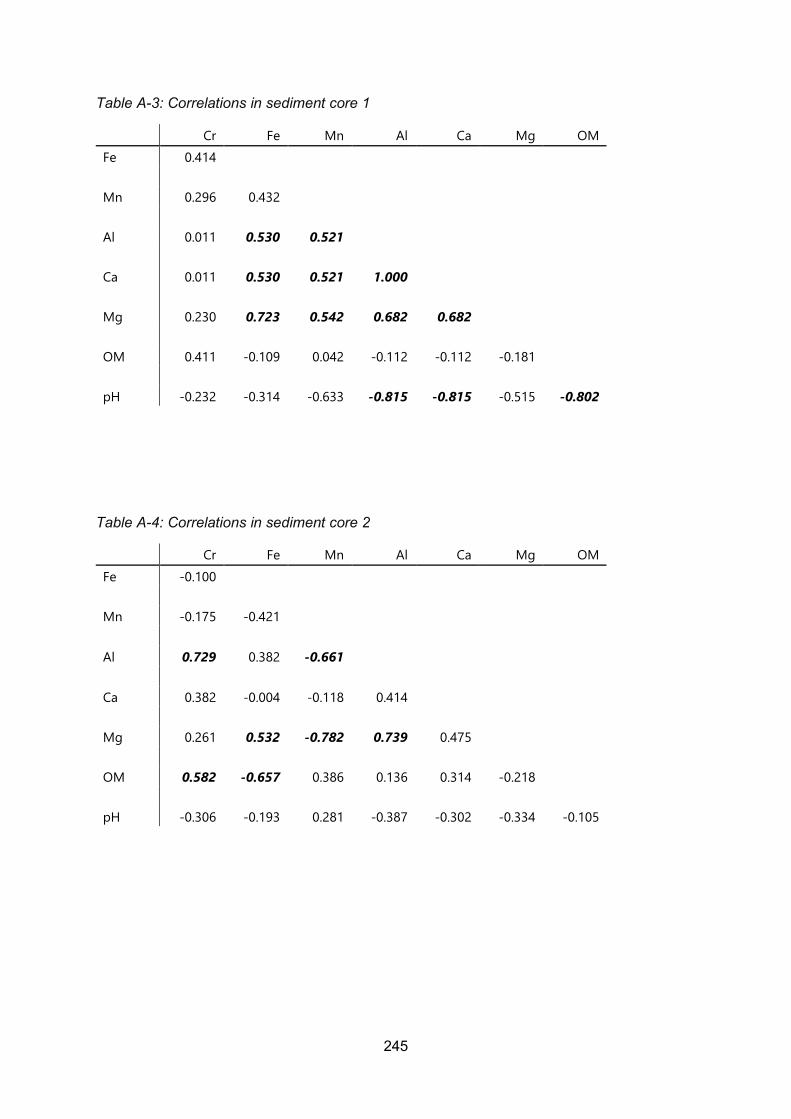
245
Table A-3: Correlations in sediment core 1
Cr Fe Mn Al Ca Mg OM Fe 0.414 Mn 0.296 0.432 Al 0.011 0.530 0.521 Ca 0.011 0.530 0.521 1.000 Mg 0.230 0.723 0.542 0.682 0.682 OM 0.411 -0.109 0.042 -0.112 -0.112 -0.181 pH -0.232 -0.314 -0.633 -0.815 -0.815 -0.515 -0.802
Table A-4: Correlations in sediment core 2
Cr Fe Mn Al Ca Mg OM Fe -0.100 Mn -0.175 -0.421 Al 0.729 0.382 -0.661 Ca 0.382 -0.004 -0.118 0.414 Mg 0.261 0.532 -0.782 0.739 0.475 OM 0.582 -0.657 0.386 0.136 0.314 -0.218 pH -0.306 -0.193 0.281 -0.387 -0.302 -0.334 -0.105
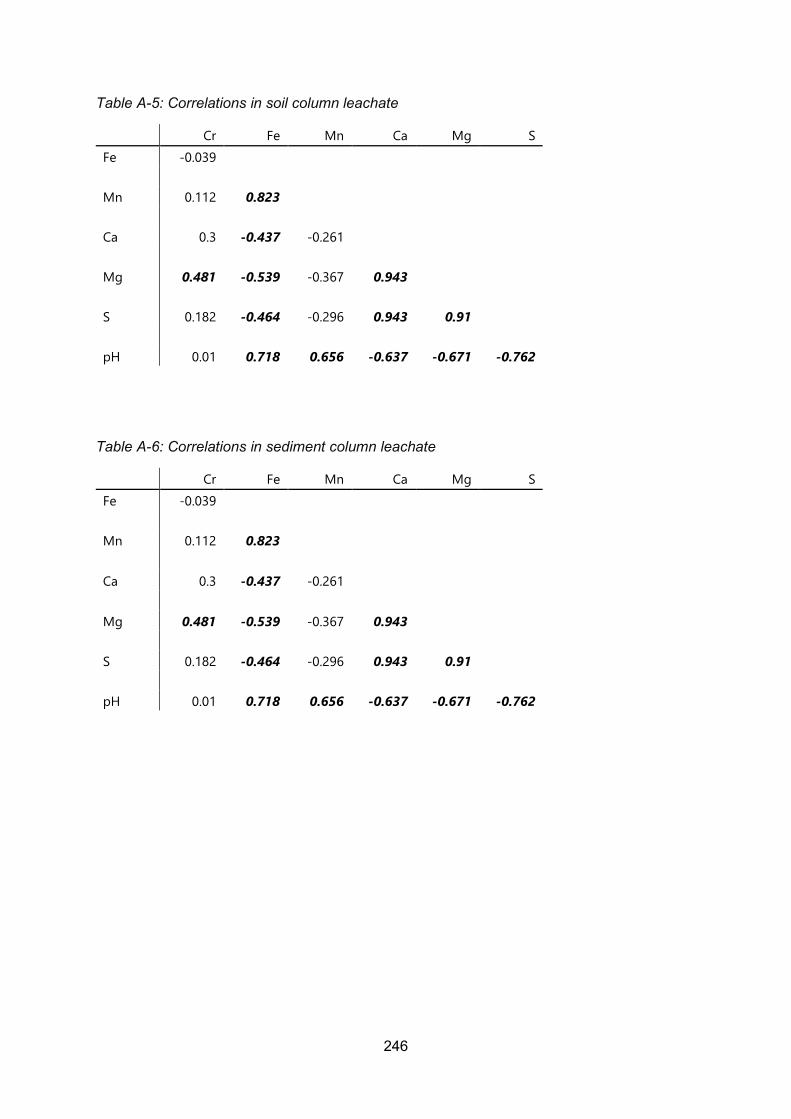
246
Table A-5: Correlations in soil column leachate
Cr Fe Mn Ca Mg S Fe -0.039 Mn 0.112 0.823 Ca 0.3 -0.437 -0.261 Mg 0.481 -0.539 -0.367 0.943 S 0.182 -0.464 -0.296 0.943 0.91 pH 0.01 0.718 0.656 -0.637 -0.671 -0.762
Table A-6: Correlations in sediment column leachate
Cr Fe Mn Ca Mg S Fe -0.039 Mn 0.112 0.823 Ca 0.3 -0.437 -0.261 Mg 0.481 -0.539 -0.367 0.943 S 0.182 -0.464 -0.296 0.943 0.91 pH 0.01 0.718 0.656 -0.637 -0.671 -0.762
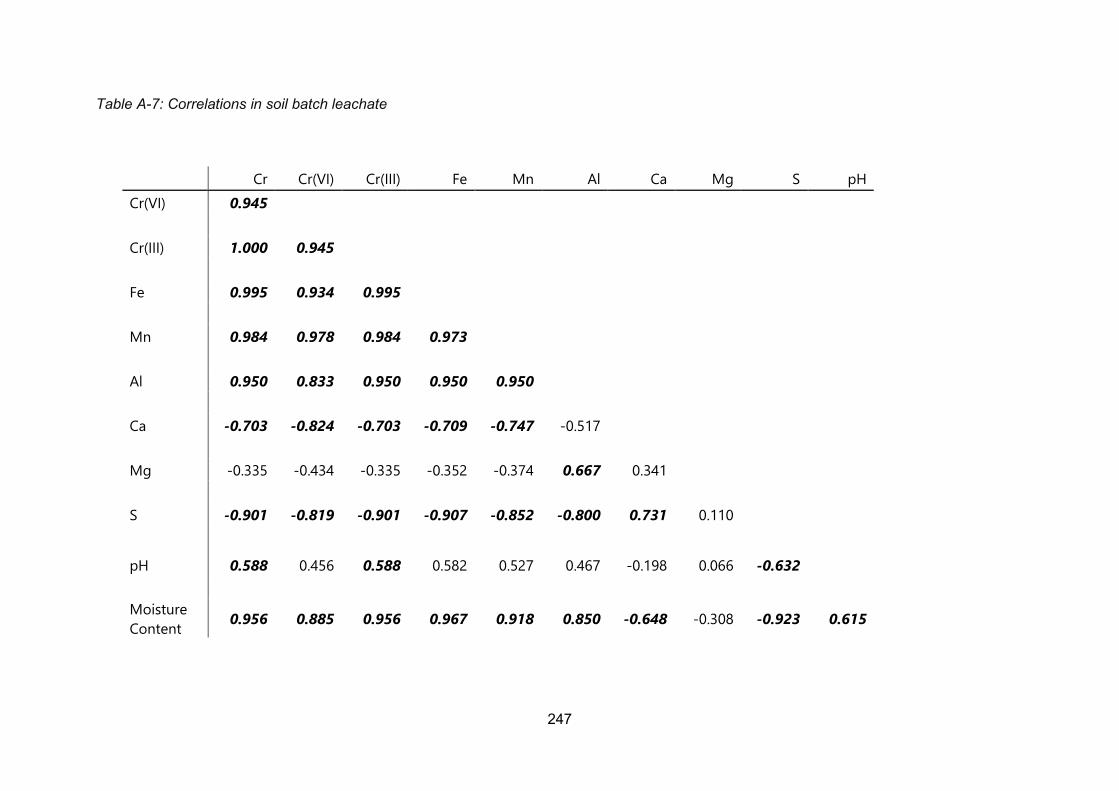
247
Table A-7: Correlations in soil batch leachate
Cr Cr(VI) Cr(III) Fe Mn Al Ca Mg S pH Cr(VI) 0.945 Cr(III) 1.000 0.945 Fe 0.995 0.934 0.995 Mn 0.984 0.978 0.984 0.973 Al 0.950 0.833 0.950 0.950 0.950 Ca -0.703 -0.824 -0.703 -0.709 -0.747 -0.517 Mg -0.335 -0.434 -0.335 -0.352 -0.374 0.667 0.341 S -0.901 -0.819 -0.901 -0.907 -0.852 -0.800 0.731 0.110
pH 0.588 0.456 0.588 0.582 0.527 0.467 -0.198 0.066 -0.632
Moisture Content 0.956 0.885 0.956 0.967 0.918 0.850 -0.648 -0.308 -0.923 0.615
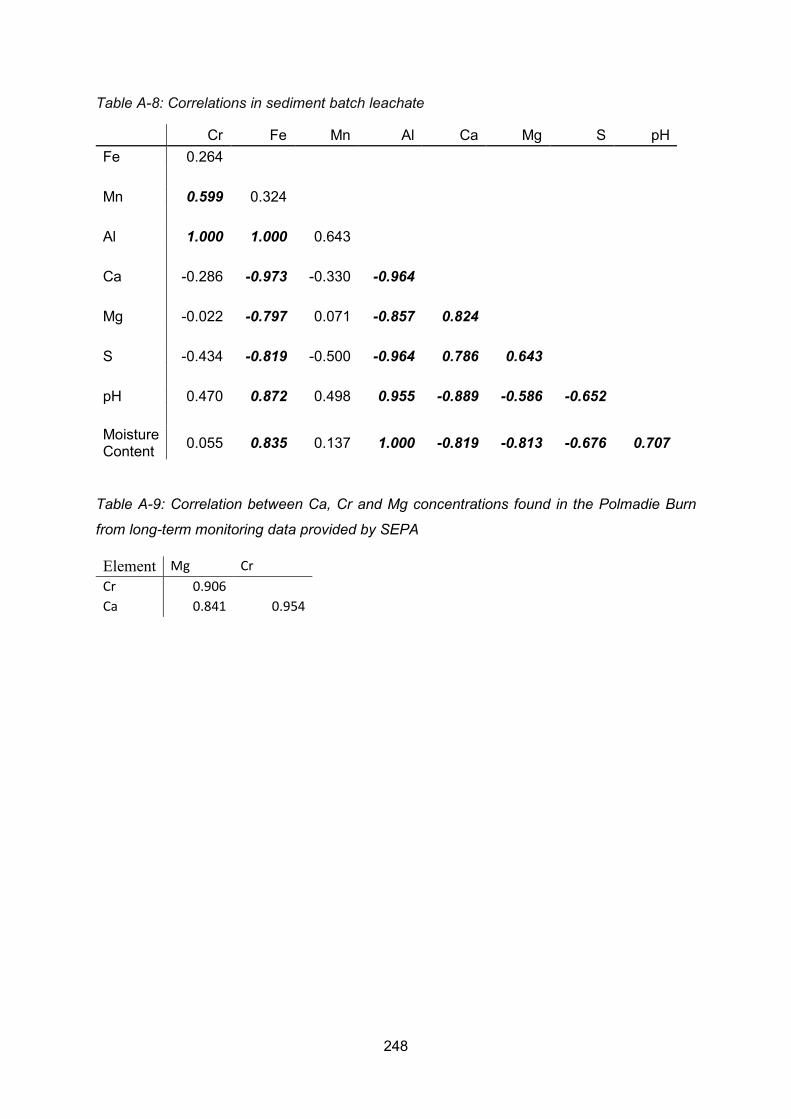
248
Table A-8: Correlations in sediment batch leachate
Cr Fe Mn Al Ca Mg S pH Fe 0.264 Mn 0.599 0.324 Al 1.000 1.000 0.643 Ca -0.286 -0.973 -0.330 -0.964 Mg -0.022 -0.797 0.071 -0.857 0.824 S -0.434 -0.819 -0.500 -0.964 0.786 0.643 pH 0.470 0.872 0.498 0.955 -0.889 -0.586 -0.652 Moisture Content 0.055 0.835 0.137 1.000 -0.819 -0.813 -0.676 0.707
Table A-9: Correlation between Ca, Cr and Mg concentrations found in the Polmadie Burn
from long-term monitoring data provided by SEPA
Element Mg Cr Cr 0.906
Ca 0.841 0.954
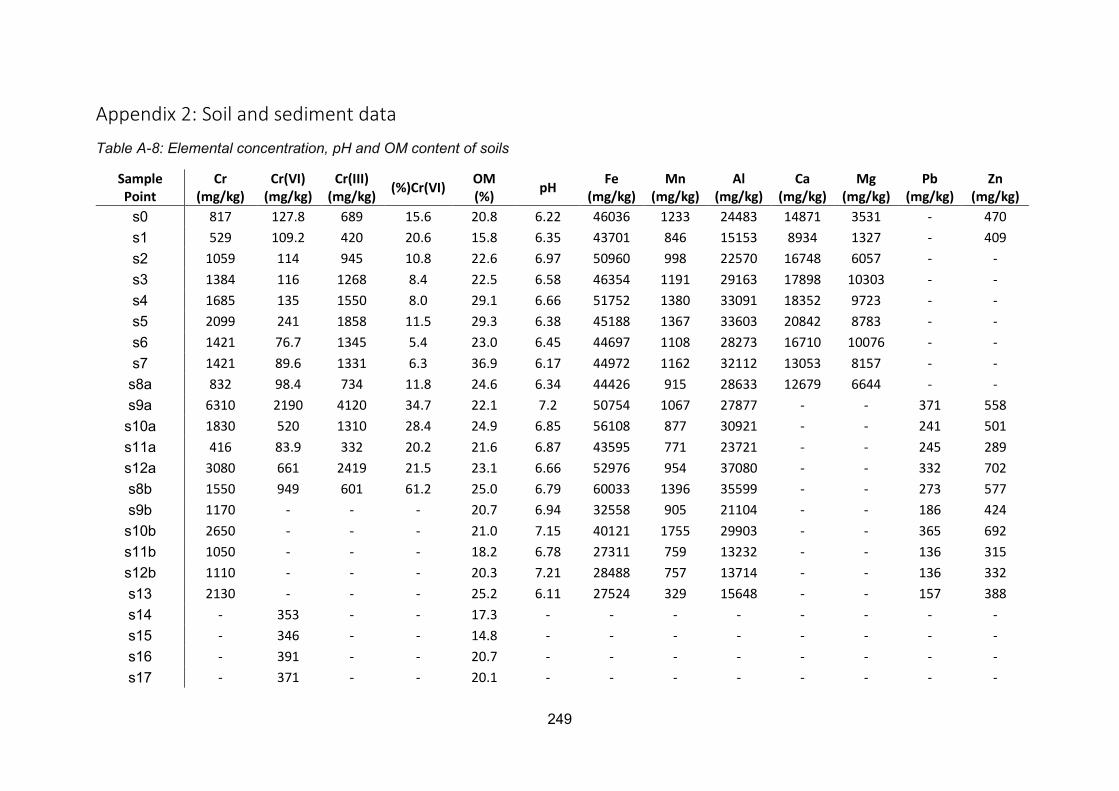
249
Appendix 2: Soil and sediment data
Table A-8: Elemental concentration, pH and OM content of soils
Sample Point
Cr (mg/kg)
Cr(VI) (mg/kg)
Cr(III) (mg/kg) (%)Cr(VI) OM
(%) pH Fe (mg/kg)
Mn (mg/kg)
Al (mg/kg)
Ca (mg/kg)
Mg (mg/kg)
Pb (mg/kg)
Zn (mg/kg)
s0 817 127.8 689 15.6 20.8 6.22 46036 1233 24483 14871 3531 - 470 s1 529 109.2 420 20.6 15.8 6.35 43701 846 15153 8934 1327 - 409 s2 1059 114 945 10.8 22.6 6.97 50960 998 22570 16748 6057 - - s3 1384 116 1268 8.4 22.5 6.58 46354 1191 29163 17898 10303 - - s4 1685 135 1550 8.0 29.1 6.66 51752 1380 33091 18352 9723 - - s5 2099 241 1858 11.5 29.3 6.38 45188 1367 33603 20842 8783 - - s6 1421 76.7 1345 5.4 23.0 6.45 44697 1108 28273 16710 10076 - - s7 1421 89.6 1331 6.3 36.9 6.17 44972 1162 32112 13053 8157 - -
s8a 832 98.4 734 11.8 24.6 6.34 44426 915 28633 12679 6644 - - s9a 6310 2190 4120 34.7 22.1 7.2 50754 1067 27877 - - 371 558 s10a 1830 520 1310 28.4 24.9 6.85 56108 877 30921 - - 241 501 s11a 416 83.9 332 20.2 21.6 6.87 43595 771 23721 - - 245 289 s12a 3080 661 2419 21.5 23.1 6.66 52976 954 37080 - - 332 702 s8b 1550 949 601 61.2 25.0 6.79 60033 1396 35599 - - 273 577 s9b 1170 - - - 20.7 6.94 32558 905 21104 - - 186 424 s10b 2650 - - - 21.0 7.15 40121 1755 29903 - - 365 692 s11b 1050 - - - 18.2 6.78 27311 759 13232 - - 136 315 s12b 1110 - - - 20.3 7.21 28488 757 13714 - - 136 332 s13 2130 - - - 25.2 6.11 27524 329 15648 - - 157 388 s14 - 353 - - 17.3 - - - - - - - - s15 - 346 - - 14.8 - - - - - - - - s16 - 391 - - 20.7 - - - - - - - - s17 - 371 - - 20.1 - - - - - - - -
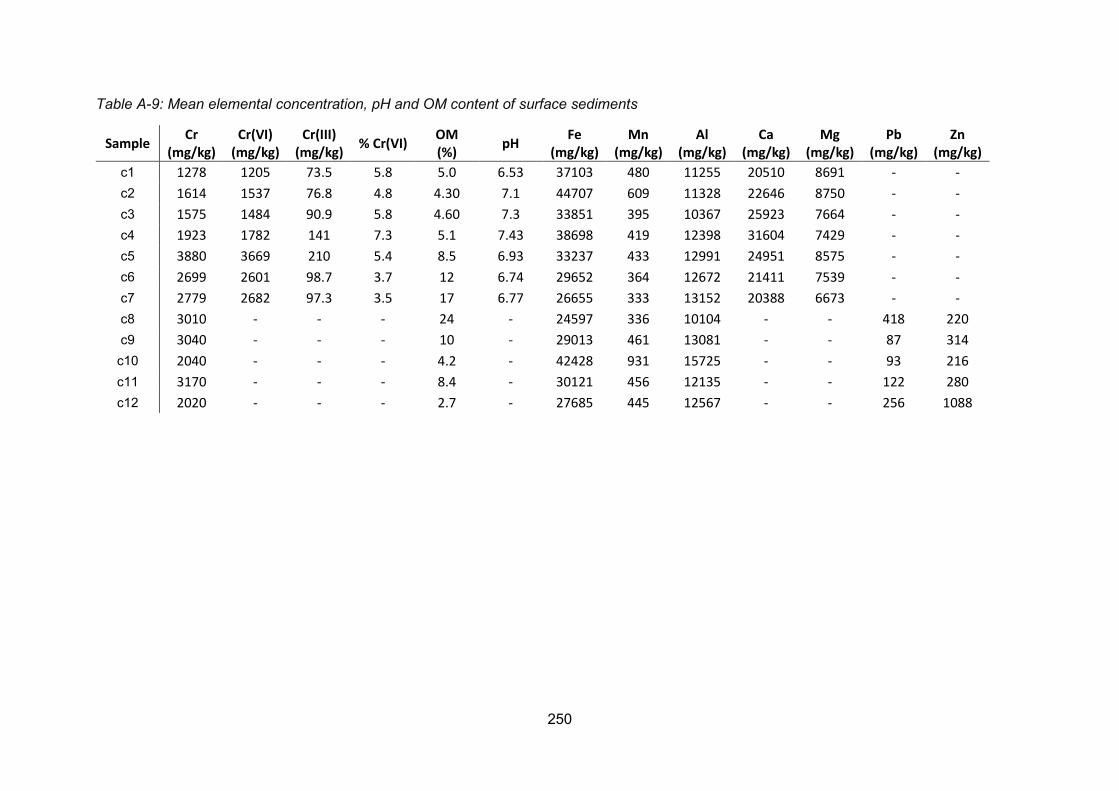
250
Table A-9: Mean elemental concentration, pH and OM content of surface sediments
Sample Cr (mg/kg)
Cr(VI) (mg/kg)
Cr(III) (mg/kg) % Cr(VI) OM
(%) pH Fe (mg/kg)
Mn (mg/kg)
Al (mg/kg)
Ca (mg/kg)
Mg (mg/kg)
Pb (mg/kg)
Zn (mg/kg)
c1 1278 1205 73.5 5.8 5.0 6.53 37103 480 11255 20510 8691 - - c2 1614 1537 76.8 4.8 4.30 7.1 44707 609 11328 22646 8750 - - c3 1575 1484 90.9 5.8 4.60 7.3 33851 395 10367 25923 7664 - - c4 1923 1782 141 7.3 5.1 7.43 38698 419 12398 31604 7429 - - c5 3880 3669 210 5.4 8.5 6.93 33237 433 12991 24951 8575 - - c6 2699 2601 98.7 3.7 12 6.74 29652 364 12672 21411 7539 - - c7 2779 2682 97.3 3.5 17 6.77 26655 333 13152 20388 6673 - - c8 3010 - - - 24 - 24597 336 10104 - - 418 220 c9 3040 - - - 10 - 29013 461 13081 - - 87 314 c10 2040 - - - 4.2 - 42428 931 15725 - - 93 216 c11 3170 - - - 8.4 - 30121 456 12135 - - 122 280 c12 2020 - - - 2.7 - 27685 445 12567 - - 256 1088
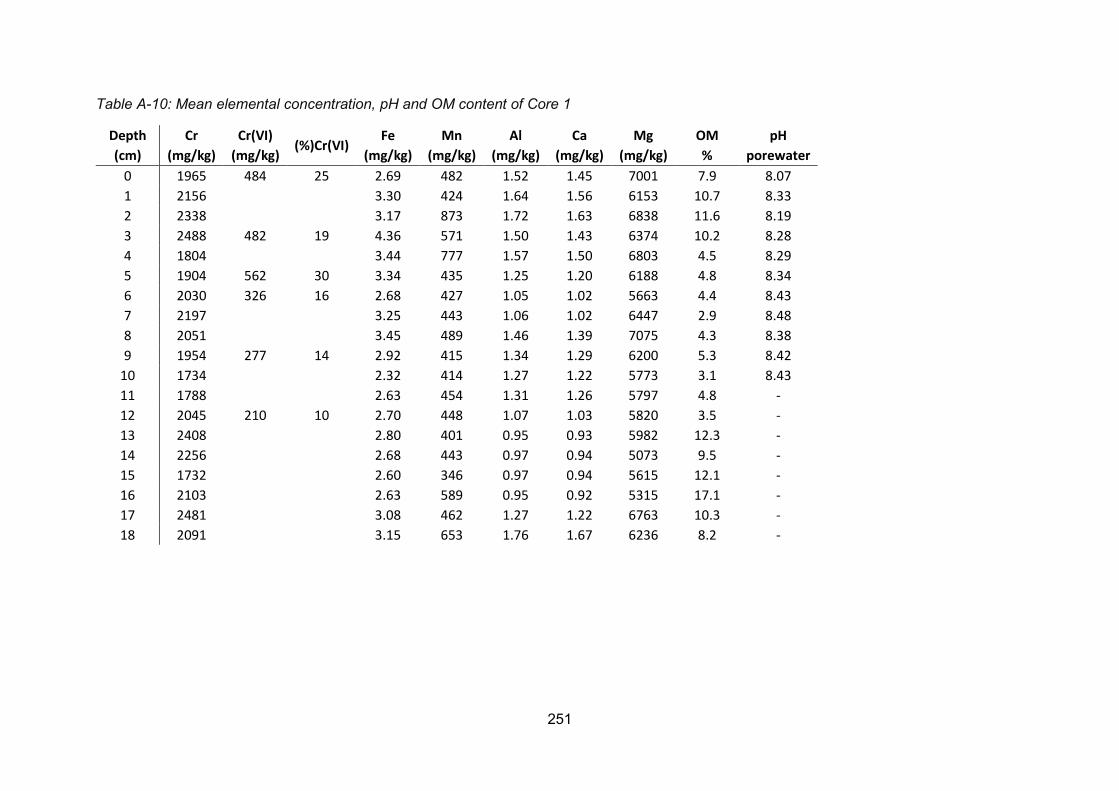
251
Table A-10: Mean elemental concentration, pH and OM content of Core 1
Depth Cr Cr(VI) (%)Cr(VI)
Fe Mn Al Ca Mg OM pH (cm) (mg/kg) (mg/kg) (mg/kg) (mg/kg) (mg/kg) (mg/kg) (mg/kg) % porewater
0 1965 484 25 2.69 482 1.52 1.45 7001 7.9 8.07 1 2156 3.30 424 1.64 1.56 6153 10.7 8.33 2 2338 3.17 873 1.72 1.63 6838 11.6 8.19 3 2488 482 19 4.36 571 1.50 1.43 6374 10.2 8.28 4 1804 3.44 777 1.57 1.50 6803 4.5 8.29 5 1904 562 30 3.34 435 1.25 1.20 6188 4.8 8.34 6 2030 326 16 2.68 427 1.05 1.02 5663 4.4 8.43 7 2197 3.25 443 1.06 1.02 6447 2.9 8.48 8 2051 3.45 489 1.46 1.39 7075 4.3 8.38 9 1954 277 14 2.92 415 1.34 1.29 6200 5.3 8.42
10 1734 2.32 414 1.27 1.22 5773 3.1 8.43 11 1788 2.63 454 1.31 1.26 5797 4.8 - 12 2045 210 10 2.70 448 1.07 1.03 5820 3.5 - 13 2408 2.80 401 0.95 0.93 5982 12.3 - 14 2256 2.68 443 0.97 0.94 5073 9.5 - 15 1732 2.60 346 0.97 0.94 5615 12.1 - 16 2103 2.63 589 0.95 0.92 5315 17.1 - 17 2481 3.08 462 1.27 1.22 6763 10.3 - 18 2091 3.15 653 1.76 1.67 6236 8.2 -
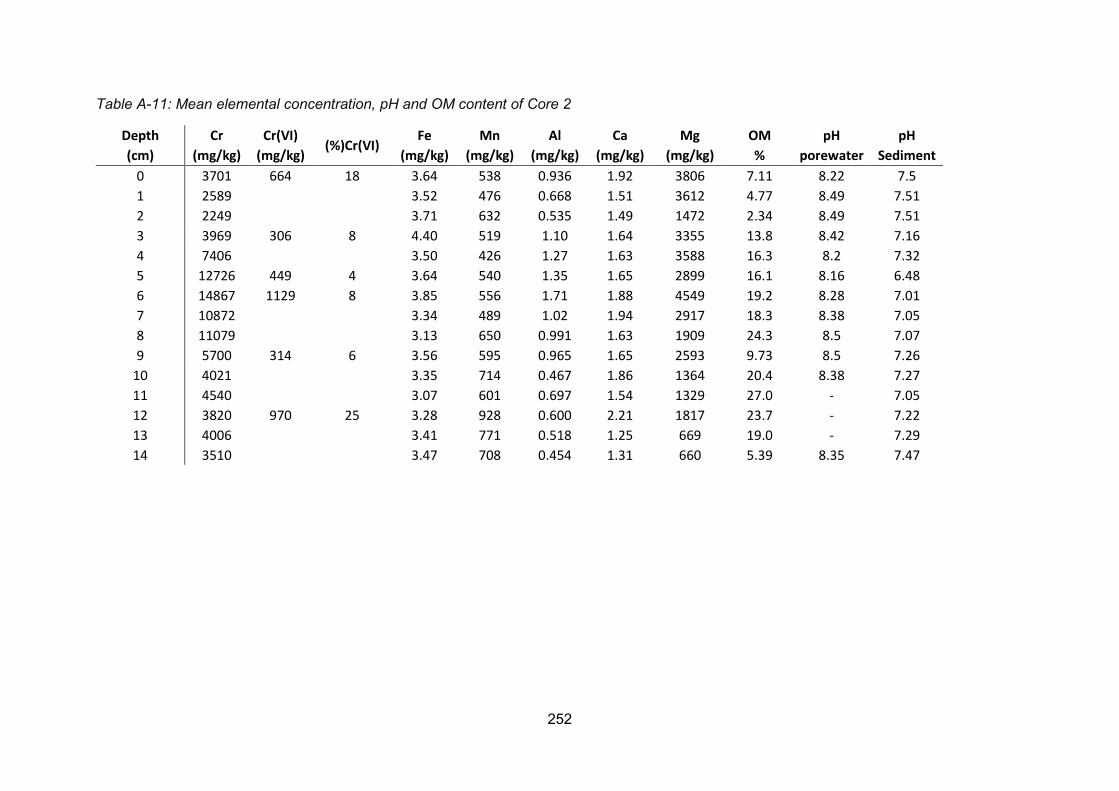
252
Table A-11: Mean elemental concentration, pH and OM content of Core 2
Depth Cr Cr(VI) (%)Cr(VI)
Fe Mn Al Ca Mg OM pH pH (cm) (mg/kg) (mg/kg) (mg/kg) (mg/kg) (mg/kg) (mg/kg) (mg/kg) % porewater Sediment
0 3701 664 18 3.64 538 0.936 1.92 3806 7.11 8.22 7.5 1 2589 3.52 476 0.668 1.51 3612 4.77 8.49 7.51 2 2249 3.71 632 0.535 1.49 1472 2.34 8.49 7.51 3 3969 306 8 4.40 519 1.10 1.64 3355 13.8 8.42 7.16 4 7406 3.50 426 1.27 1.63 3588 16.3 8.2 7.32 5 12726 449 4 3.64 540 1.35 1.65 2899 16.1 8.16 6.48 6 14867 1129 8 3.85 556 1.71 1.88 4549 19.2 8.28 7.01 7 10872 3.34 489 1.02 1.94 2917 18.3 8.38 7.05 8 11079 3.13 650 0.991 1.63 1909 24.3 8.5 7.07 9 5700 314 6 3.56 595 0.965 1.65 2593 9.73 8.5 7.26
10 4021 3.35 714 0.467 1.86 1364 20.4 8.38 7.27 11 4540 3.07 601 0.697 1.54 1329 27.0 - 7.05 12 3820 970 25 3.28 928 0.600 2.21 1817 23.7 - 7.22 13 4006 3.41 771 0.518 1.25 669 19.0 - 7.29 14 3510 3.47 708 0.454 1.31 660 5.39 8.35 7.47
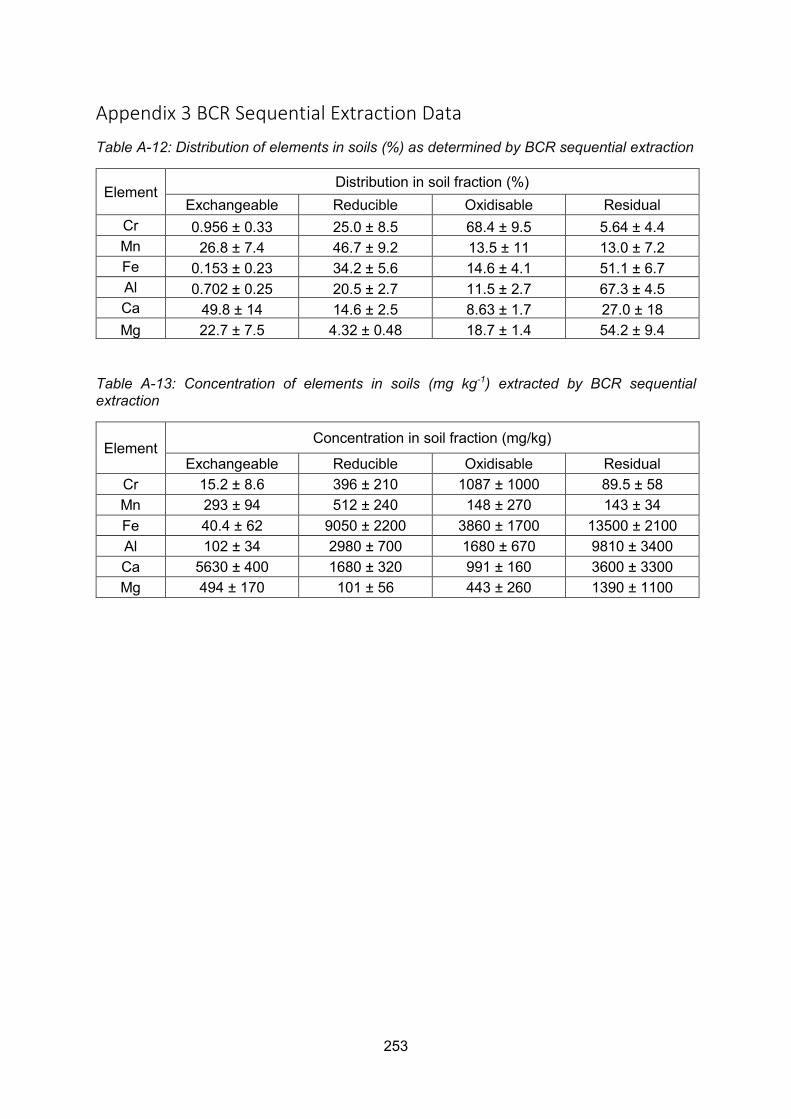
253
Appendix 3 BCR Sequential Extraction Data
Table A-12: Distribution of elements in soils (%) as determined by BCR sequential extraction
Element Distribution in soil fraction (%)
Exchangeable Reducible Oxidisable Residual Cr 0.956 ± 0.33 25.0 ± 8.5 68.4 ± 9.5 5.64 ± 4.4 Mn 26.8 ± 7.4 46.7 ± 9.2 13.5 ± 11 13.0 ± 7.2 Fe 0.153 ± 0.23 34.2 ± 5.6 14.6 ± 4.1 51.1 ± 6.7 Al 0.702 ± 0.25 20.5 ± 2.7 11.5 ± 2.7 67.3 ± 4.5 Ca 49.8 ± 14 14.6 ± 2.5 8.63 ± 1.7 27.0 ± 18 Mg 22.7 ± 7.5 4.32 ± 0.48 18.7 ± 1.4 54.2 ± 9.4
Table A-13: Concentration of elements in soils (mg kg-1) extracted by BCR sequential extraction
Element Concentration in soil fraction (mg/kg)
Exchangeable Reducible Oxidisable Residual Cr 15.2 ± 8.6 396 ± 210 1087 ± 1000 89.5 ± 58 Mn 293 ± 94 512 ± 240 148 ± 270 143 ± 34 Fe 40.4 ± 62 9050 ± 2200 3860 ± 1700 13500 ± 2100 Al 102 ± 34 2980 ± 700 1680 ± 670 9810 ± 3400 Ca 5630 ± 400 1680 ± 320 991 ± 160 3600 ± 3300 Mg 494 ± 170 101 ± 56 443 ± 260 1390 ± 1100
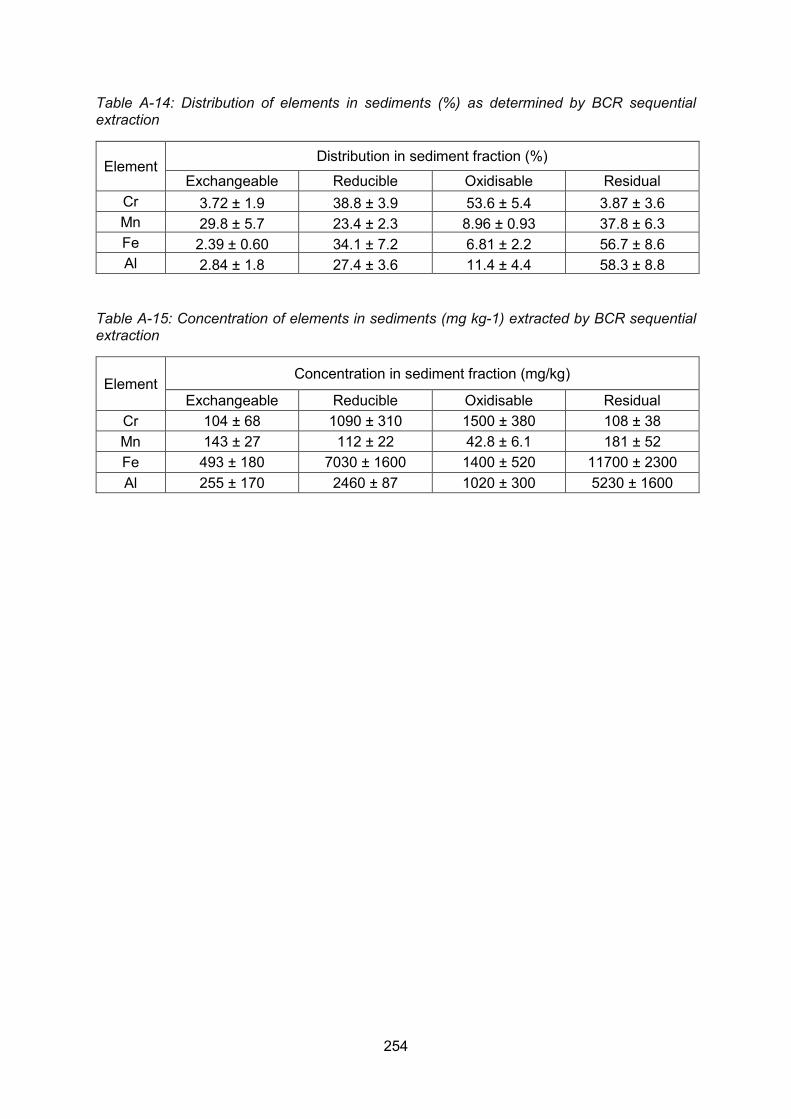
254
Table A-14: Distribution of elements in sediments (%) as determined by BCR sequential extraction
Element Distribution in sediment fraction (%)
Exchangeable Reducible Oxidisable Residual Cr 3.72 ± 1.9 38.8 ± 3.9 53.6 ± 5.4 3.87 ± 3.6 Mn 29.8 ± 5.7 23.4 ± 2.3 8.96 ± 0.93 37.8 ± 6.3 Fe 2.39 ± 0.60 34.1 ± 7.2 6.81 ± 2.2 56.7 ± 8.6 Al 2.84 ± 1.8 27.4 ± 3.6 11.4 ± 4.4 58.3 ± 8.8
Table A-15: Concentration of elements in sediments (mg kg-1) extracted by BCR sequential extraction
Element Concentration in sediment fraction (mg/kg)
Exchangeable Reducible Oxidisable Residual Cr 104 ± 68 1090 ± 310 1500 ± 380 108 ± 38 Mn 143 ± 27 112 ± 22 42.8 ± 6.1 181 ± 52 Fe 493 ± 180 7030 ± 1600 1400 ± 520 11700 ± 2300 Al 255 ± 170 2460 ± 87 1020 ± 300 5230 ± 1600


