Embed Size (px)
Citation preview
A Cost-Effectiveness Analysis of Early Literacy Interventions
Jessica Simon
Submitted in partial fulfillment of the requirements for the degree of
Doctor of Philosophy under the Executive Committee
of the Graduate School of Arts and Sciences COLUMBIA UNIVERSITY
2011

© 2011 Jessica Simon
All rights reserved
ABSTRACT
A Cost-Effectiveness Analysis of Early Literacy Interventions
Jessica Simon
Success in early literacy activities is associated with improved educational
outcomes, including reduced dropout risk, in-grade retention, and special education
referrals. When considering programs that will work for a particular school and context;
cost-effectiveness analysis may provide useful information for decision makers.
The study provides information about the cost-effectiveness of four early literacy
programs that the What Works Clearinghouse (WWC), a government agency that
evaluates effectiveness research in education, has determined show evidence of
effectiveness: Accelerated Reader, Classwide Peer Tutoring, Reading Recovery, and
Success for All. By using meta-analytic techniques to combine effect sizes for different
studies and weighting literacy outcomes, the study provides new information about the
relative effectiveness of early literacy programs. In particular, by weighting literacy
outcomes, the study casts new light upon the relative importance of different kinds of
literacy outcomes for creating successful beginning readers. Costs are often ignored, but
are a necessary consideration given budget constraints. Rigorous measurement of
program costs and presentation of cost-effectiveness ratios provides information about
the relative cost-effectiveness of four "effective" programs.
Using meta-analytic results with confidence intervals, Accelerated Reader -- a
relatively small add-on software program -- appears to be more cost-effective than
Reading Recovery, a one-to-one tutoring program. Using point estimates for all four
programs, Accelerated Reader and Classwide Peer Tutoring, two relatively small add-on
programs, appear to be more cost-effective options than Reading Recovery and Success
for All, two relatively more intensive interventions. Cost-effectiveness analysis should

be one tool considered by decision makers, considered alongside goals for different
subpopulations, individual contexts, and needs.
i
A COST-EFFECTIVENESS ANALYSIS OF EARLY LITERACY
INTERVENTIONS
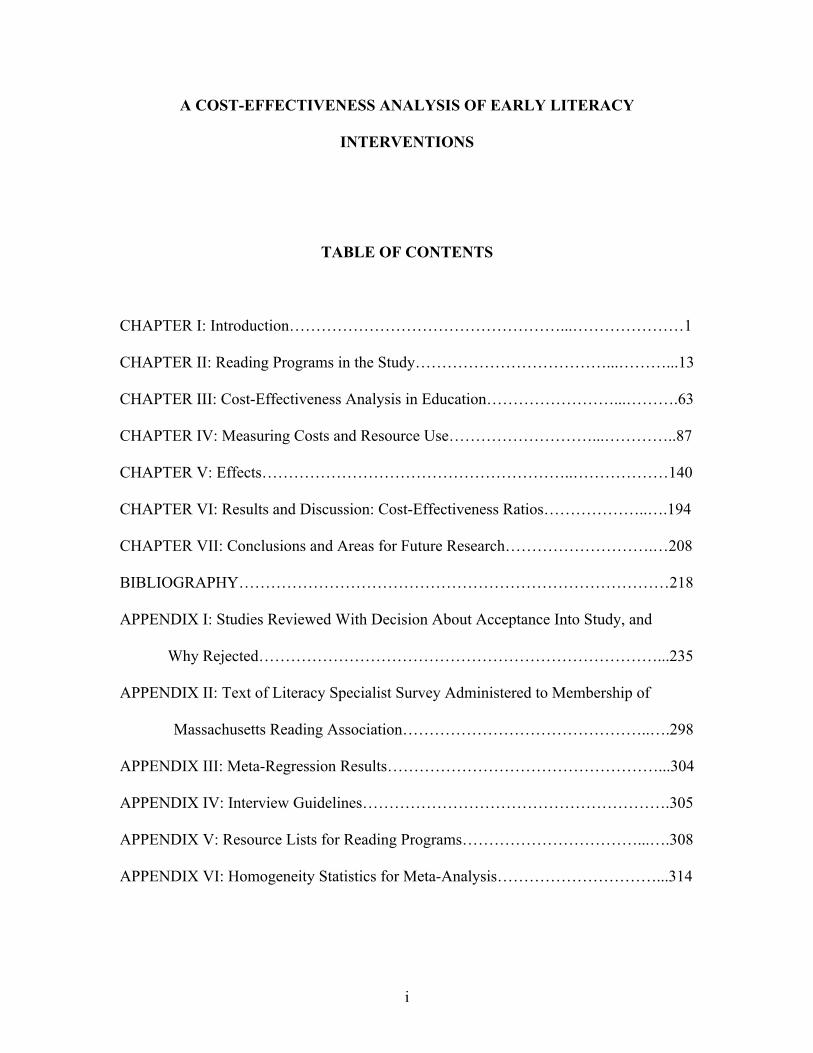
TABLE OF CONTENTS
CHAPTER I: Introduction……………………………………………...…………………1
CHAPTER II: Reading Programs in the Study………………………………...………...13
CHAPTER III: Cost-Effectiveness Analysis in Education……………………...……….63
CHAPTER IV: Measuring Costs and Resource Use………………………...…………..87
CHAPTER V: Effects…………………………………………………..………………140
CHAPTER VI: Results and Discussion: Cost-Effectiveness Ratios………………..….194
CHAPTER VII: Conclusions and Areas for Future Research……………………….…208
BIBLIOGRAPHY………………………………………………………………………218
APPENDIX I: Studies Reviewed With Decision About Acceptance Into Study, and
Why Rejected…………………………………………………………………...235
APPENDIX II: Text of Literacy Specialist Survey Administered to Membership of
Massachusetts Reading Association………………………………………..….298
APPENDIX III: Meta-Regression Results……………………………………………...304
APPENDIX IV: Interview Guidelines………………………………………………….305
APPENDIX V: Resource Lists for Reading Programs……………………………...….308
APPENDIX VI: Homogeneity Statistics for Meta-Analysis…………………………...314

ii
LIST OF TABLES
Table 1: Description of Intended Populations for Four Reading Programs……………...31
Table 2: Overview of Accelerated Reader/Reading Renaissance………………..………34
Table 3: Overview of Classwide Peer Tutoring…………………………….……………41
Table 4: Overview of Reading Recovery………………………………………………...46
Table 5: Overview of Success for All……………………………………………………53
Table 6: Brief Overview of Steps to Conduct a Rigorous Cost-Effectiveness Analysis...69
Table 7: Existing Cost-Effectiveness Analyses of Accelerated Reader…………………76
Table 8: Existing Cost-Effectiveness Analyses of Reading Recovery…………………..81
Table 9: Existing Cost-Effectiveness Analysis of Success for All………………………85
Table 10: Description of Categories Used in the Ingredients Method…………………...90
Table 11: Description of Principal Contact Information Received and Responses….....100
Table 12: Assumptions for Cost Calculations………………………………………….102
Table 13: Description of Implementations of AR in Effectiveness Studies……………110
Table 14: Cost Estimates to Implement AR for Grades K to 6………………………...112
Table 15: Description of Implementation in Effectiveness Study of CWPT…………...118
Table 16: Cost Estimates to Implement CWPT for Grades K to 6…………………..…119
Table 17: Description of Implementations of Effectiveness Studies of RR…..………..125
Table 18: Cost Estimates to Implement RR for Struggling Readers in Grade 1……………….128
Table 19: Description of Implementations of Effectiveness Studies of SFA…………..133
Table 20: Cost Estimates to Implement SFA for Grades K-2………………………….136
iii
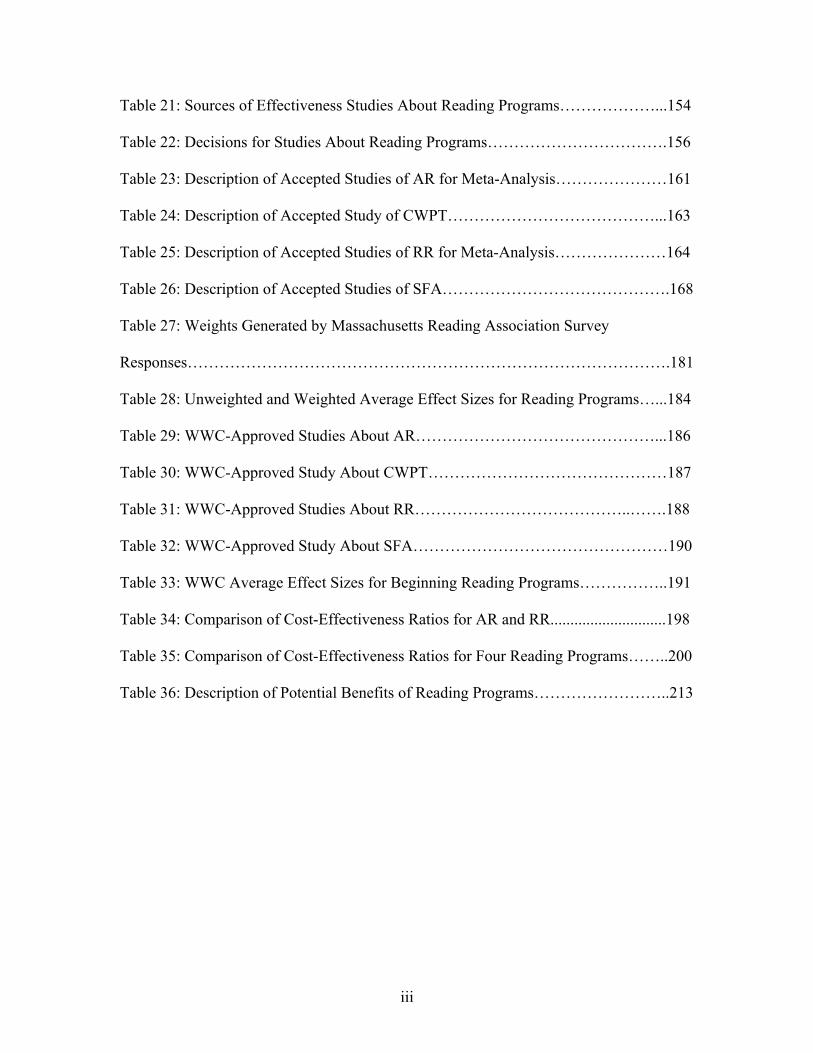
Table 21: Sources of Effectiveness Studies About Reading Programs………………...154
Table 22: Decisions for Studies About Reading Programs…………………………….156
Table 23: Description of Accepted Studies of AR for Meta-Analysis…………………161
Table 24: Description of Accepted Study of CWPT…………………………………...163
Table 25: Description of Accepted Studies of RR for Meta-Analysis…………………164
Table 26: Description of Accepted Studies of SFA…………………………………….168
Table 27: Weights Generated by Massachusetts Reading Association Survey
Responses……………………………………………………………………………….181
Table 28: Unweighted and Weighted Average Effect Sizes for Reading Programs…...184
Table 29: WWC-Approved Studies About AR………………………………………...186
Table 30: WWC-Approved Study About CWPT………………………………………187
Table 31: WWC-Approved Studies About RR…………………………………..…….188
Table 32: WWC-Approved Study About SFA…………………………………………190
Table 33: WWC Average Effect Sizes for Beginning Reading Programs……………..191
Table 34: Comparison of Cost-Effectiveness Ratios for AR and RR.............................198
Table 35: Comparison of Cost-Effectiveness Ratios for Four Reading Programs……..200
Table 36: Description of Potential Benefits of Reading Programs……………………..213
iv
ACKNOWLEDGMENTS This work would not have been possible without the collaboration, support, and
insight of many people. I am grateful to my advisor, Henry Levin, for his wisdom,
mentorship, and dedication. I would like to thank the committee members: I am grateful
to Michael Kieffer for reading and commenting on early drafts with such insight; and to
Thomas Bailey, Clive Belfield, and Francisco Rivera-Batiz, for their helpful suggestions
and feedback. I am also thankful for the gracious collaboration of the Massachusetts
Reading Association, and for conversations with national program staff from the four
reading programs in the study, as well as the school leaders who took the time to talk
with me about their individual implementations. I am appreciative of comments made by
David Wilson and Andrew Gelman regarding the statistical analyses conducted in this
manuscript.

v
DEDICATION
This work is dedicated to my husband for his confidence in me and his unfailing support,
and to my daughter – my favorite developing reader.
1
CHAPTER I: Introduction
Policymakers and school leaders with limited budgets must determine how best to
allocate scarce financial and temporal resources. Decision makers must consider whose
performance to improve – for example, whether an educational intervention should focus
on improving scores for as many students as possible, for those who are close to meeting
state standards, or for particular struggling students. They must also consider the outcome
they hope to improve by implementing an educational intervention. Although test scores
are readily available, they are probably not the final outcome of interest. Other results,
such as high school dropout rates or labor market outcomes, may be of greater
importance but would require long-term studies that are difficult and expensive to
conduct, and may not answer the question that is immediately relevant. Often, school
leaders are held accountable for students’ scores, so research showing how educational
interventions affect test scores may be immediately useful to decision makers.
The most effective means of generating test score gains for students may not
come from the most cost-effective program (Levin, Glass, & Meister, 1987). Although
cost-effectiveness analyses alone cannot drive educational decision making, this study is
intended to provide information that may improve selection of early reading interventions
appropriate to a particular school’s or district’s goals and context. The study provides a
rationale for considering early literacy interventions and for the use of cost-effectiveness
methodology. It also examines different kinds of reading outcomes, and provides new
perspective on how agencies like the What Works Clearinghouse (WWC) may help
decision makers choose an educational program.
The dissertation presents a rigorous cost-effectiveness analysis that:
2
• Evaluates study and outcome quality based on a specific set of criteria.
• Weights effectiveness measures using results from a survey of literacy
professionals to apply specialists’ perspectives on the role of various literacy
outcomes in creating successful beginning readers.
• Combines effectiveness measures for two programs via meta-analysis and
describing confidence intervals of effect size rather than point estimates.
• Estimates program costs via program developer information using the ingredients
method.
The study contributes to the field by providing policy makers with new
information about choosing a beginning reading program. The weighting of effectiveness
measures provides a substantive contribution by clarifying the magnitude of effects from
research about reading programs. In this way, decision makers and researchers can focus
on the kinds of higher- or lower-order reading outcomes they would like to affect to
create successful beginning readers, rather than assuming that all beginning reading
programs could improve outcomes in the same way.
The rigorous measurement of costs, too, is an important contribution of this
dissertation. Although educational decision makers are constrained by budgets, there is a
lack of consistent, clear, published cost information about educational programs (King
Rice, 1997; Tsang, 1997). Costs are often estimated carelessly or haphazardly, or not
linked to effectiveness measures. Understatement of program costs and required
personnel time hinders real-world implementations of educational programs, yet existing
cost-effectiveness analyses of the reading programs in this study do not measure costs in
3
a thorough manner using a cost analysis method. This dissertation uses the ingredients
method (Levin & McEwan, 2001) to provide complete and systematic average cost
estimates for each of the programs.
Further, the results are intended to provide a framework for decision makers who
are selecting a reading program. The WWC provides a context for looking at outcomes,
but this is the first time that WWC results have been linked with their costs, so that the
recognized effectiveness of alternatives can be compared in a cost-effectiveness
framework.
Why Focus on Reading Programs?
There are many possible areas to direct resources, but there are important reasons
for a decision maker to focus on early literacy programs. Success in literacy-related
activities is associated with ultimate educational outcomes, including educational
attainment. Failure in literacy-related activities is associated with special education
referral and placement, grade retention, and/or poor attitudes and motivation about
reading. Children at risk of reading failure in the United States are more likely to be
nonwhite, nonnative speakers of English, and of low socioeconomic status (Snow, Burns,
& Griffin,1998). Introducing a high quality reading program or intervention could help to
close an achievement gap early on, prevent reading failure for those at risk, and improve
outcomes for average or high-achieving students.
4
How Do Children Learn to Read?
Pre-Literacy Skills
Learning to read is a complex process that begins long before school starts and
before children are exposed to any literacy programming. Home environment and
preschool experiences may affect academic achievement in kindergarten and beyond. A
description of how children learn to read may facilitate an understanding of why certain
programs may be more effective for different populations, such as struggling readers.
Home literacy environment and resources are well-documented predictors of
success in early literacy activities (Scarborough, Dobrich, & Hager, 1991). Although
parental education and household income are frequently-used proxies (Burgess, Hecht, &
Lonigan, 2002), home literacy environment is a complex combination of attitudes,
activities, and behaviors (Burgess, Hecht, & Lonigan, 2002). Activities such as reading
aloud, which are more likely to take place in homes with relatively richer reading
environments, help children to acquire knowledge of print and how books work.
Extensive “print exposure” is correlated with phonemic awareness, or the “understanding
that speech is composed of a series of individual sounds” (Yopp, 1992) and the ability to
identify letters of the alphabet (Rashid, Morris, & Sevcik, 2005). Homes with richer
literacy environments encourage oral language development, vocabulary, and de-
contextualized language and allow children to experience and imitate a variety of literacy
skills, increasing the likelihood that children will enter kindergarten ready to learn to read
(Edwards, 2007). Compared to peers, children living in deficient home literacy
environments are also more likely to be deficient in oral language skills. Children who
5
enter school with deficiencies in both oral and phonological skills will require additional
support (Gough, 1996; Torgeson, 2002).
A consensus exists that children cannot learn to read without gaining phonemic
awareness (Gough, 1996), which supports “early decoding” (Snow, 1991). Before
learning to read, children generally learn to speak and to understand how different sounds
correspond to different words. Children as young as two or three may play with words by
switching letters around in words or creating rhymes (Snow, Burns, & Griffin, 1998).
These activities, and others such as dividing a word into its individual sounds –e.g., that
/r/ /u/ /n/ is pronounced “run” – fall under the category of phonemic awareness because
children who have gained this skill show that they “have control over the smallest unit of
their speech, phonemes” (Yopp, 1992). Reading curricula must account for disparities in
initial endowments of pre-literacy or early literacy skills. An effective reading curriculum
could help to bridge achievement gaps in reading between white and African American
and Latino students (Teale, Paciga, & Hoffman, 2007).
Beginning Literacy Development
This section describes briefly literacy skill development in kindergarten and first
grade to provide context for the potential choice between various early literacy programs.
In 1998, two-thirds of kindergarteners started off the school year able to identify letters,
and 30% could identify beginning sounds in words. By the end of kindergarten, almost all
(94%) of children could identify the letters of the alphabet and 70% could identify
beginning sounds in words (U.S. Department of Education (DOE), 2003). Far fewer
children entered kindergarten able to read – 3% could identify sight words (i.e., often-
6
used words) and 1% could read words in context upon kindergarten entrance; by the end
of first grade, 78% could identify sight words and just 44% could read words in context
(U.S. DOE, 2003).
As mentioned in the section describing the effects of home literacy environment,
race/ethnicity, socioeconomic status, home literacy resources, and maternal education
were associated with the skills children demonstrated at the beginning of kindergarten. A
child’s health and attitude about academic tasks were also correlated with better reading
outcomes. By the end of first grade, gender differences emerged as well. Boys were less
likely than girls to be able to read sight words or words in context.
Students who demonstrate fewer reading readiness skills in kindergarten may
remain at a disadvantage in later grades. A research synthesis found medium sized
correlations between reading readiness in kindergarten and later literacy achievement.
Amongst 21 studies, the average correlation between letter-sound knowledge in
kindergarten and later reading achievement was 0.57. Amongst 24 studies, the average
correlation between letter identification in kindergarten and later reading achievement
was 0.52 (Scarborough, 1998; as cited by Scarborough, 2002). The correlation between
kindergarten abilities and later reading achievement is not nearly as strong as the
correlation between first or second grade reading scores and later reading scores, which
showed a correlation of 0.75 (Scarborough, 2002). This information may be useful for
decision makers. For example, for a decision maker looking to improve reading test
scores, a program to help first or second graders may appear to be an efficacious choice.
7
The Predictive Power of Beginning Literacy Achievement
Early reading achievement has shown a correlation with later reading
achievement. Juel (1988) showed that children who were poor readers at the end of first
grade had a very high probability (0.88) of still being poor readers at the end of fourth
grade, although this study was limited by a small sample size of just 54 children. For
children who were not retained in grade, poor student achievement and dropout risk
appear to be correlated. This risk may start early. Ensminger and Slusarcick (1992) found
that students who started their school careers with low grades were at higher risk of high
school dropout. Temple, Reynolds, and Miedel (2000) analyzed data from the Chicago
Child Parent Centers and found that high school dropouts had a significantly lower
kindergarten word score than continuing students (61.5 versus 64.7). Alexander et al.’s
research (2001) on a sample of children in Baltimore showed that first grade performance
predicted dropout risk.
Compared to children whose grades were in the A-B range in first grade, students
in the D-F range were 41 percentage points more likely to drop out (Alexander et al.,
2001). Poor performance in the earliest grades can lead to disengagement, poor behavior,
less involvement in classroom activities, and increased risk of dropout (Finn, 1989).
Improved grades and evaluations could reduce dropout risk by encouraging students to
develop a better self-perception.
Grade retention and learning disabilities are associated with increased dropout
risk (Hammond et al, 2007). Alexander et al. (1997) reported that 80% of students
retained in the first grade “were in low reading groups and/or received special education
services” (Alexander et al., 1997 p. 104). Retention may not be an effective way to
8
improve poor readers’ skills. A study comparing nine children who had been retained in
the first grade to 10 children who were poor readers but had not been retained showed
that retention may have played a part in improving the retained children’s word
recognition, but not reading comprehension (Juel & Leavell, 1988). Students are
presumably retained to improve proximal and ultimate outcomes, but those who are
retained in grade may be at higher risk for dropout. An analysis of data from the National
Education Longitudinal Study (NELS) ‘88 showed that poor, minority students who had
been retained were more than 11 times as likely to drop out as those who were not
(Rumberger, 1995).
Alexander et al. (2001) also showed that retention was associated with dropout
risk, even for students retained as early as the first grade. Three-quarters (73%) of
children from low SES backgrounds retained in the first grade dropped out, compared
with 57% of children from low SES backgrounds who had not been retained. Children
from high SES backgrounds were less likely to drop out, with just 36% of those retained
and 13% of those not retained leaving school before graduation. As Rumberger (2004)
pointed out, these findings suggest an additive effect to negative student experiences and
poor performance, and underscore the importance of positive academic and social
experiences in early grades, especially for those with lower achievement levels. The
finding also emphasizes the effect of socioeconomic status on school performance.
The income gap in proficiency rates on standardized tests may affect dropout risk.
The Annie Casey Foundation analyzed National Assessment of Educational Progress
(NAEP) data for fourth graders and found that while 49% of low income students scored
below basic, just 20% of moderate/high income students scored as low (Shore & Shore,
9
2009). Eventual dropouts and graduates also had different mean absences in the first
grade – a mean of 16.4 absences for future dropouts and 10.2 absences for future
graduates. “Chronic” kindergarten absences were immediately associated with lower
student achievement, particularly for students living in poverty (Chang & Romero, 2008).
Children from poorer families may have less access to medical and dental care, poorer
nutritional opportunities, and are more likely to have begun life at lower birth weights, all
of which have been shown to have an effect on school outcomes years later (Rothstein,
2008).
A complex set of variables appears to be associated with poor scores on
achievement tests and/or dropout risk. Literacy inventions cannot provide solutions for
these kinds of issues, but an effective program may have the potential to engage young
readers and improve proximal outcomes. In so doing, perhaps an effective early literacy
intervention could change a student’s educational trajectory.
Components of Successful Beginning Reading Programs
The choice of a reading program may also be affected by ideological differences
about teaching children to read. In the 1980s and 1990s, proponents of phonics
instruction and whole language instruction engaged in the “reading wars.” Underlying the
“reading wars” is the question of whether children require explicit, direct instruction or
whether learning to read is a natural process involving the use of “whole language.” Over
time, reading specialists have advocated for an integrated literacy approach. This
approach is intended to introduce components of both whole language and phonics
simultaneously to allow students to use different kinds of literacy tools to “[support]
10
literacy development” (Snow, Burns, & Griffin, 1998). Although “balanced” literacy is a
term that is also used, Snow, Burns, and Griffin (1998) suggest that “integrated” is a
better descriptor. A balanced approach does not indicate that different components of
early literacy will be introduced together, whereas “integrated” implies that different
components will be used at once.
Certain components of reading programs may play a critical role in fostering
success in early literacy. Phonemic awareness and phonics are critical components of
beginning reading achievement. Phonics instruction has a positive impact on literacy
achievement for all beginning readers, but especially for struggling readers (Foorman &
Torgeson, 2001; Torgeson, 2002). Explicit instruction in phonological skills may be
critical to reading success for those readers that do not or cannot learn these skills via
implicit instruction (Shaywitz et al., 1999, Iversen & Tunmer 1993, Foorman &
Torgeson, 2001). Shaywitz et al.’s 1999 paper is a long-term follow-up study that showed
that differences in phonological skills persisted over time and allowed for differentiation
between poor, average, and superior readers. Phonological skills on their own would be
useless to readers, so improvements in this area should be associated with high levels of
comprehension (Nathan & Stanovich, 1991; Torgeson, 2002). A study of 100 children
from two schools, mostly white and middle class, showed that phonemic awareness
accounted for up to 40% of the variation in first grade reading ability (Mann, 1993).
A number of literacy interventions have been designed to target children’s needs
during the critical beginning reading years. In some cases, reading programs are intended
to improve the skills of struggling readers by providing supplementary services. In other
cases, reading programs are provided to all students with the intention of improving
11
reading skills for the entire class. Literacy intervention programs are based on various
personnel delivering services (e.g., peer tutoring versus highly trained literacy
specialists), as well as various ideologies about how children learn to read. Given what is
known about how children learn to read, successful beginning reading programs could be
expected to include a number of different components: a focus on phonics and phonemic
awareness particularly for struggling readers or readers at risk for difficulties, and an
emphasis on comprehension (Torgeson, 2002). It may also be useful for teachers to tailor
the program for different children’s needs and for different kinds of readers. For example,
struggling readers need more explicit, intensive, and supportive instruction (Torgeson,
2002).
The rest of the dissertation focuses on determining the extent of existing evidence
about various programs’ effectiveness, and tying the effectiveness to cost data. The
dissertation provides information about the relative cost-effectiveness of four reading
programs that have evidence of program effectiveness according to the What Works
Clearinghouse, a government agency.
The remaining chapters of the dissertation are organized as follows:
• Chapter 2 introduces the What Works Clearinghouse (WWC), and describes
four reading programs that this government panel has found to be “effective”
– Accelerated Reader (AR), Classwide Peer Tutoring (CWPT), Reading
Recovery (RR), and Success for All (SFA).
• Chapter 3 outlines cost-effectiveness analysis in education.
12
• Chapter 4 describes cost measurement and explains how to measure costs
properly. The chapter then contains cost estimates for each program including
a sensitivity analysis based on varying discount rates.
• Chapter 5 defines and describes the “effectiveness” of educational
programming and a description of studies that were synthesized. The chapter
also contains a meta-analysis for Accelerated Reader (AR) and Reading
Recovery (RR), and presents average effect sizes for all four reading programs
as published by the WWC.
• Chapter 6 presents cost-effectiveness ratios for each of the programs and
discusses results. To compare all four programs, WWC estimates are used.
For AR and RR, confidence intervals for cost-effectiveness ratios are
presented using the results of the meta-analysis.
• Chapter 7 offers conclusions, considerations for decision-makers, and
describes areas for future research.
13
CHAPTER 2: READING PROGRAMS IN THE STUDY
This chapter describes the What Works Clearinghouse (WWC), a government
agency that independently evaluates the results of effectiveness research in education.
After discussing the WWC, the chapter details each of the reading programs included in
the study – Accelerated Reader (AR), Classwide Peer Tutoring (CWPT), Reading
Recovery (RR), and Success for All (SFA). This review will provide a description and
rationale for using WWC results, as well as an understanding of the characteristics of the
four reading programs to be examined.
What Is the What Works Clearinghouse (WWC) and How Is It Relevant to This Study?
The What Works Clearinghouse (WWC) evaluates reports on educational
programs and interventions as part of the U.S. government’s Institute of Education
Sciences. Established in 2002, the WWC was intended “to provide educators,
policymakers, researchers, and the public with a central and trusted source of scientific
evidence of what works in education” (Mathematica Policy Research Web site, 2011).
When the Clearinghouse was established, the American Institutes for Research (AIR) and
the Campbell Collaboration administered the study reviews.
The WWC offers “systematic reviews” of existing research to determine which
studies have provided what they call scientific evidence (WWC About Us, 2008). The
panel prefers experimental, controlled trials, but some studies using quasi-experimental
methods are accepted if they meet a set of criteria. The acceptance criteria, which include
study and evidence standards, are:
14
• The study must have been conducted within a specific time frame, which differs
for each intervention area. For the beginning reading category, the time frame was
1983 to 2005. A few studies that were prepared (not necessarily published works)
in 2006 were also included in the report.
• The intervention has to fall within the category being evaluated (e.g., a math
program could not be evaluated under the heading of early literacy interventions).
• The students in the sample have to be in the appropriate age group (e.g., a reading
program targeting middle school students could not be evaluated as part of the
early literacy category).
• At least one outcome measured in the study should be relevant to the category
(e.g., if the outcome category is achievement measures, then a study measuring
student engagement would not qualify).
• The outcome measures have to be valid (e.g., a test rather than self-report of
skills; the validity of the measures may not always be reported).
• The data presented must permit the calculation of effect sizes (e.g., means and
standard deviations) or effect sizes must be reported in the study.
• The study must either be experimental or quasi-experimental designs (i.e., “quasi-
experiments with equating, regression discontinuity designs, and single-case
designs” (WWC, 2008)).
For studies published in 2007 or later, if the authors state that they used
randomization, then they must explain how it was done. If the method
described does not constitute true randomization, or if there are high rates
or differential levels of attrition between groups, the WWC will note that
15
the study met standards with reservation rather than meeting evidence
standards. For studies published prior to 2007, claims of randomization are
taken at face value.
• For quasi-experiments, evidence standards are similar to those for experimental
work. Groups must be shown to be equivalent at baseline according to some
proxy measure; there should not be substantial nor differential attrition.
• For both experimental and quasi-experimental work, other factors assessed
include: whether the authors used statistical controls/adjustments to address
differences between groups at baseline; whether there is evidence that anything
changed for the groups to “contaminate” (WWC, 2008) the analysis of the effects
of the intervention; there should be evidence that more than one teacher was
assigned to each condition to avoid the “teacher-intervention confound” (WWC,
2008); and unit of assignment and unit of analysis should be the same.
Support for the Rationale Behind WWC Evidence Standards
The WWC’s standards have been controversial, in part because of the variety of
researchers who contribute to education research. In trying to assess program effects,
researchers from many different disciplines offer different kinds of qualitative and
quantitative studies in an attempt to determine “what works” in education. The
Clearinghouse’s evidence standards use a set of criteria that are common in other kinds of
research, such as health and medical research or economics. In health research, random
assignment is a common method to ascertain the effect of a drug or health program.
Quasi-experimental designs, such as regression discontinuity or instrumental variables,
16
are commonly used by economists and statisticians to estimate program effects when
random assignment was not possible. These methods have the advantage of providing
information about the counterfactual. That is, because experimental and quasi-
experimental groups show that the two groups being compared were equivalent at
baseline, changes at the end of the study may be attributed to the program. Further
information about effectiveness in education literature will be provided in chapter 5. The
remainder of this section provides support for the choices made by the WWC in
developing its evidence standards.
Randomized experiments, often described as a gold standard, involve assigning
study participants to a treatment or control group at random. On average, the groups will
be equivalent to one another and differences in the outcome measure can be attributed to
the intervention. Even when conducted properly, however, experiments may not be
generalizable to the population at large or even to another setting (Shadish, Cook, &
Campbell, 2002). Problems such as differential attrition over the course of the study can
affect results. Formal probability sampling may be helpful if researchers wish to
generalize about the effects of their study (Shadish, Cook, & Campbell, 2002).
Although described as a gold standard, experimental work is relatively
uncommon in school-based research; it is primarily seen in preschool-level and
prevention research (Cook, 2002). Cook (2002) offers a number of reasons for this.
(Experimental evaluation in education will be discussed in more detail in Chapter 5.)
First, schools are held accountable for results. A large, multiyear instructional experiment
run by schools that did not result in improved test scores could result in repercussions for
administrators and/or teachers. Second, political and cultural perceptions amongst
17
education researchers could prevent experiments from being carried out. Cook (2002)
notes that within the area of prevention research, many evaluators are psychologists or
economists, fields in which experimental results are valued. He also notes that
experimental research is expensive, and not funded in education research to the extent
that it is in other fields, such as health. Finally, Cook (2002) notes that, as practitioners,
educational decision makers may not be interested in experimental results to determine
“what works” in their own schools or contexts.
Because it would be difficult to find randomized experimental work about a
variety of educational interventions, it would not be realistic for the WWC to limit its
acceptance of studies to those that use experimental methods. Quasi-experimental studies
are common in social science research, frequently because of ethical concerns or data
availability. Because these studies do not use random assignment, participants self-select
or are sorted by others such as teachers (Shadish, Cook, & Campbell, 2002). Overall,
quasi-experimental evidence may be less compelling than experimental evidence because
comparison groups may differ from the treatment group in unobservable or unobserved
ways. Traditionally, economists tried to use statistical controls to equate treatment and
comparison groups, but the resulting estimates often differed from experimental evidence
(Shadish, Cook, & Campbell, 2002). Natural experiments, where researchers may use
exogenous variation to compare two groups, may be appropriate if a suitable comparison
condition is available.
Experimental and quasi-experimental studies allow causal inferences to be made,
although they are not without their limitations. In particular, results from experimental
and quasi-experimental studies may be affected by sampling issues or the point in time in
18
which the study was conducted (Shadish, Cook, & Campbell, 2002, p. 18). Study design
factors must be assessed with care. The method of assignment, the type and number of
pretests and posttests, the quality of the assessments, and other outcome measures should
be evaluated to determine threats to reliability and validity. If techniques such as
matching are used in quasi-experimental studies, it is important to evaluate how, and how
well, the matching was done (Shadish, Cook, & Campbell, 2002, p. 119). Even if random
assignment has been used, differential attrition could affect results and inferences should
treatment and control groups no longer be equivalent by the end of the study (Shadish,
Cook, & Campbell, 2002, p. 62). Threats to internal validity are greater for quasi-
experimental designs because the treatment and comparison groups are unlikely to vary
randomly; in that case, reconsidering design features may ameliorate these problems
(Shadish, Cook, & Campbell, 2002).
Non-experimental designs are common in the literature, but they are unlikely to
provide similar evidence of program effectiveness as experimental or quasi-experimental
work. Non-experimental studies may lack important components such as random
assignment or statistical controls, pretests, and/or control or comparison groups (Shadish,
Cook, & Campbell, 2002). Without a comparison group or a pretest, it may be very
difficult to make causal inferences about program effects unless there are well-known
expectations about the dependent variable, although using multiple posttests may help
this design somewhat (Shadish, Cook, & Campbell, p. 106-107). A pretest-posttest design
without a control group would not provide high quality information about how the
treatment group would have performed in the absence of the intervention (Shadish, Cook,
19
& Campbell, 2002, p. 108). Ideally, pretests and posttests should be used, and the same
instruments should be administered to both treatment and control/comparison groups.
Of course, a single kind of study cannot provide a final word about program
effectiveness or program replicability or scalability. Qualitative work and studies without
comparison groups do not provide information about the counterfactual, but may provide
important information to help interested parties understand and contextualize a program.
By not accepting these kinds of studies, the WWC standards allow an increased level of
confidence that approved studies were conducted in such a way that any changes between
treatment and comparison groups are attributable to the intervention. This is valuable
information for decision makers, researchers, and other interested parties who want to
know if a given program “worked.”
The final WWC criterion, concerning the unit of assignment and unit of analysis,
has been the subject of debate (Murray, 1998). To explain the controversy, Murray
(1998) uses the following example. When carrying out a group-randomized study, it is
common for schools to be assigned to a certain condition, for the intervention to be
delivered (or not delivered) to whole classes, and for data about individual students to be
analyzed. When schools, rather than students, are allocated to a condition, the WWC
would contend that the study does not meet evidence standards. Because the unit of
assignment (schools) has been randomized to study conditions, it is the only one for
which errors can be assumed to be independent. Analyzing data for other units (such as
students) would be accompanied by a greater Type I error rate, or a greater likelihood of
finding program effects when there were none. On the other hand, when the unit of
assignment and analysis are the same, statistical power will be lower (Murray, 1998, p.
20
105-106). Murray concludes that those who wish to avoid inflated Type I error and those
who prefer not to have low statistical power are both correct. He argues that the debate
may be misplaced altogether, and that researchers should instead focus on choosing the
correct analytical methods for the research question and the available data.
Reading programs and studies approved by the WWC have been independently
reviewed by the panel and are based upon a consistent set of criteria for selecting studies.
From a political perspective, “approval” by the WWC may be important or attractive to
school decision makers. Programs with WWC endorsement may gain press or popularity
and thereby apparent legitimacy. In addition to studies that were accepted by the WWC, I
evaluated studies about the selected programs that had been reviewed but rejected for
inclusion. I also reviewed studies that did not appear to have been reviewed by the
WWC, such as unpublished masters theses and doctoral dissertations, and resources listed
on or available via Education Resources Information Center (ERIC).
I had anticipated finding a number of articles or web sites that provided support
for the WWC and its work. It was difficult, however, to find citations or articles that
included an endorsement specifically for the government agency even though the
WWC’s evidence standards and methodological criteria appear to be appropriate for their
mission. Rohland (2003) offered a description of the WWC and endorsed the idea of the
Clearinghouse when it was in development stages. He endorses the idea and the incipient
work of the WWC. At the time of writing, no content area reports had been published or
disseminated. The objective of the WWC – to provide a centralized place for decision
makers, researchers, and the public to access information about educational interventions
and content areas – certainly sounds useful for interested parties. As Rohland warned,
21
though, a major hurdle for the WWC would be how to present information that would be
generalizable for practitioners seeking to implement programs in their own settings.
Rohland (2003) did not discuss in detail the nature of the criteria used to
determine that a study met study and/or evidence standards. In 2008, an independent
panel determined that the process used by the WWC was scientifically valid; the paper
did not address the specific process used to approve studies or respond to criticism about
the restrictive nature of criteria, however (Brown, Card, et al., 2008). Researchers and
evaluators associated with the WWC promote its criteria as replicable and as easy for
decision makers to understand. Because of the ease of understanding, decision makers in
schools and districts will be able to use the WWC information to determine whether a
given program is right for their school context (Dynarski, 2008).
Since the WWC evaluates studies in a consistent way, and since the evidence
standards appear reasonable, examining programs that were “approved” by the agency
provided a convenient approach to initially select programs and studies to include in this
study. As minimal criteria, each study must be systematically reviewed to determine
which measures are included in the composite “general reading achievement”
designation, the sample sizes in treatment/experimental and comparison/control groups,
the time horizon under which the study was conducted, the follow-up period, and whether
the study properly uses experimental and quasi-experimental methods. The panel does
not make designations based upon the relative comprehensiveness of assessment
measures, in part because such an undertaking would be beyond the scope of the mission
of the Clearinghouse, and because there is a lack of consensus about what constitutes a
“comprehensive measure.” This suggests that a relatively simple assessment that favors
22
the treatment group would appear to have the same weight as a very thorough
assessment. Finally, the Panel states that their approval of effectiveness studies is not
intended to be the final word on a program’s effectiveness. Rather, the WWC seeks to be
one avenue by which to consider educational program and to encourage the use of
scientific research standards in educational research and program evaluation.
Criticisms and Limitations of the WWC
The WWC has been criticized for determining that very few studies provide
evidence of effectiveness, in part because experimental and quasi-experimental work may
not be the only ways to show effectiveness. It is unclear, however, how quantitative work
could convincingly show program effectiveness if the counterfactual is not explored by
examining a control or comparison group. Critics of the WWC also maintain that meeting
evidence standards does not imply quality. For example, studies that administer the same
posttests to comparison and treatment students when only the treatment group has been
taught the specific skills needed to master the test will result in inflated effect sizes,
especially compared to effect sizes for performance on independent tests (Slavin &
Madden, 2008). The WWC accepts both types of studies if they meet evidence standards.
Slavin and Madden (2008) decried the use of standardized test scores as effectiveness
measures. They contended that effect sizes are not enough to determine effectiveness;
program rationale and social value must also be taken into consideration (also see
Confrey, 2006). Slavin (2008) also noted that the WWC does not require a minimum
study duration, so that studies showing posttest effects after a few months are de facto
weighted the same as studies showing effects after a number of years. Studies with short
23
follow-up periods may be low in external validity. Further, the WWC lacks criteria about
sample sizes, excluding only those studies in which there was “one teacher or school per
condition,” so that inferences may be drawn about a program’s effectiveness despite
small samples.
If researchers feel there is an incentive to publish studies that meet WWC criteria,
the WWC may encourage researchers to “game the evaluation” (Confrey, 2006) by
relying on a set of methodological rules to follow. Although this would appear to suggest
that more rigorous studies would be produced, there are limitations to following a list of
methodological rules. For example, because the WWC does not evaluate whether
treatment students are tested more frequently using a given assessment, studies produced
in which treatment students had taken a given type of assessment many more times than
comparison students may not provide helpful new information. It is also worth noting that
programs may not be replicable in other contexts, so a program with approved
effectiveness studies may not be effective in another school or district, or for different
groups of students (e.g., ELL or students with learning disabilities).
Finally, the WWC does not systematically consider costs to provide information
about “what works.” Their main page for each intervention provides a brief and
incomplete list of costs for materials, or a description of how staff time might be used,
without using a method (Levin & McEwan, 2001). The ingredients method is a
systematic way of listing all of the components – personnel, facilities, equipment and
materials, other inputs, and client inputs – that are required to implement an intervention,
and then determining their costs (see Chapter 4). Where costs are presented by the WWC,
they are not linked to effectiveness, nor are program costs compared to one another. This

24
renders WWC designations far less useful for policy or decision making, as costs should
not be estimated and presented carelessly.
Ross et al. (2007) point out that the lack of rigorous cost studies in educational
research makes it far more difficult to actually determine “what works” in education
because costs constrain a decision maker’s choices. Tsang (1997) notes that an
“underestimation of costs…can cause difficulty during program implementation,” so that
it is critical to use a thorough method for listing and costing out all of the components of
a program. Tsang (1997) highlights potential reasons for a lack of thorough cost
estimation in education research: lack of expertise, lack of information, and lack of
interest on the part of decision makers to allow costs to drive politically important
decisions. A fuller discussion of this topic can be found in Chapter 4.
The next section introduces the National Reading Panel’s 2000 study to explain
how the WWC categorizes reading outcomes.
The National Reading Panel’s “Five Pillars” – Categorizing WWC Reading Outcomes
In 2000, the National Reading Panel (NRP), commissioned by the National
Institute of Child Health and Human Development (NICHD), published a report entitled
“Teaching Children to Read.” The NRP, a committee comprised of scientists and
researchers, analyzed existing published experimental and quasi-experimental studies.
Due to the prohibitively large number of studies published about reading, they used
Preventing Reading Difficulties in Young Children (Snow, Burns, & Griffin, 1998) to
provide guidance about priority areas (NICHD, 2000). The Panel was divided into
subgroups to focus on the areas of alphabetics, fluency, and comprehension. They
25
identified research published in peer reviewed journals that focused on preschool through
grade 12. They examined sample characteristics, length of intervention, follow-up
periods, implementation fidelity, and outcome measures (NICHD, 2000).
Accepted studies had to show effect sizes or provide appropriate data for their
calculation (e.g., means and standard deviations). The studies included in the NRP’s
meta-analysis focused on preschool through grade 12. The Panel determined that five
areas were critical to effective reading instruction: phonemic awareness, phonics,
fluency, vocabulary, and comprehension. They concluded that all must be part of an
effective reading program or intervention, though some areas – such as phonemic
awareness – must be incorporated in the earlier grades and are not effective later. These
five areas were ultimately incorporated into Reading First, part of the No Child Left
Behind legislation.
Phonemic Awareness
Phonemic awareness is the “ability to focus on and manipulate phonemes in
spoken words” (NICHD, 2000). According to the definition used by the NRP, this differs
from phonics instruction because it does not include tasks such as blending phonemes
with letters or segmenting words (NICHD, 2000). As discussed in Chapter 1, phonemic
awareness is an important pre-reading skill with some predictive power as to later reading
achievement (Juel, 1988; Scarborough, 1991; Scarborough, 2002). Their meta-analysis of
studies using phonemic awareness outcomes found an overall effect size of 0.86, an
effect size of 0.53 for reading outcomes, and an effect size of 0.59 for spelling. The panel
concluded that phonemic awareness was an important skill necessary for learning to read,
26
that the skill could be taught, and that a phonemic awareness program alone was not
enough to constitute a complete reading program (NICHD, 2000).
Phonics
Phonics instruction is intended for beginning readers, and “is a way of teaching
reading that stresses the acquisition of letter-sound correspondences and their use to read
and spell words” (NICHD, 2000). Phonics instruction helps children to understand how
the letters of the alphabet relate to phonemes. Systematic phonics instruction offers “a
planned, sequential set of phonic elements…[taught]…explicitly and systematically”
(NICHD, 2000). The NRP’s meta-analysis of studies using explicit phonics instruction
outcomes yielded an effect size of 0.44, suggesting that phonics instruction represented a
learning benefit to students, relative to no phonics instruction or phonics instruction that
was not systematic (NICHD, 2000). They also evaluated the effect sizes for different
kinds of phonics programs individually, and determined that the lowest effect size
amongst that group was 0.27 for miscellaneous phonics programs (NICHD, 2000).
Fluency
Fluency is an important reading skill, in which reading is done with “speed,
accuracy, and proper expression” (NICHD, 2000). The Panel noted that fluency is a
frequently overlooked critical reading skill (Snow et al., 1998). The Panel analyzed the
effect of guided oral reading on reading fluency. The meta-analysis yielded effect sizes of
0.55 for accuracy, 0.44 for fluency, and 0.35 for comprehension; studies with composite
27
effect size measures had a mean effect size of 0.50 (NICHD, 2000). The results suggest
that guided oral reading is an important task in developing readers.
Vocabulary
In the NRP’s report, vocabulary is included under the heading of comprehension.
As their report points out, vocabulary and comprehension are not separable skills.
Vocabulary concerns the understanding of words, while comprehension concerns
understanding in “larger units” (NICHD, 2000). The Panel determined that quantitative
work about vocabulary instruction could not be synthesized using meta-analytic methods
because of differences between studies. A qualitative synthesis suggested that
contextualized vocabulary instruction improved comprehension.
Comprehension
Comprehension is the ultimate goal of reading – “the process of simultaneously
extracting and constructing meaning through interaction and involvement with written
language” (Snow, 2002). Research work examined by the NRP focused on strategies used
to encourage comprehension growth. Early research focused on individual strategies,
followed by research that focused on use of multiple strategies. The most recent research
the Panel reviewed focused on teacher preparation for introducing different
comprehension strategies (NICHD, 2000). Because of differences in methodology and
instructional strategies, the NRP did not conduct their own meta-analysis for
comprehension. Rather, they reported results from two published meta-analyses
(Rosenshine & Meister, 1994; Rosenshine, et al., 1996). Using the meta-analyses, the
28
NRP reported effect sizes for 0.95 for multiple choice, 0.85 for short answer, 0.85 for
summary, and 0.36 for standardized tests. The NRP states that it evaluated the meta-
analysis according to its standard criteria (NICHD, 2000).
The NRP’s work is important for elucidating different areas of effective literacy
instruction. It did not, however, suggest to decision makers how to consider or evaluate
reading programs in their own setting. The so-called “five pillars” have been met with
some controversy; critics assert that the Panel’s choice of studies affected their
conclusions. Specifically, and much like criticism leveled against the WWC,
Cunningham (2001) argues that the narrow criteria for including a study in the Panel’s
meta-analysis was too restrictive given the type of research work that had been conducted
by literacy researchers, or perhaps that is possible for literacy researchers to conduct,
given the difficulty of estimating variables like intrinsic motivation or engagement.
The Panel may not have looked at all of the relevant areas that impact effective
reading instruction. Motivation, free reading activities, and teacher characteristics, for
example, were topics that may not have been appropriately studied (Kim, 2008). In
addition, the composition of the Panel may have affected its conclusions. Twelve of the
14 members held doctorates, and there were no practitioners, either elementary or
secondary school teachers, on the committee (Kim, 2008; Cunningham, 2001).
A variety of components are necessary for effective reading instruction, but all
reading outcomes are not created equal. Some outcomes may be more important for
creating a successful beginning reader, and others may be more difficult to teach. Once a
study meets the WWC’s evidence standards, there is no further designation between
29
different types of outcomes. This may create the impression that a program that has been
shown to have a large effect size for fluency, for example, has had the same impact as a
program with a study that has a large effect size for comprehension.
The WWC’s Beginning Reading Category
The beginning reading category of the WWC includes programs, policies, and
practices that are intended to improve alphabetics, fluency, comprehension, or general
reading achievement (a composite of any two or more of the other categories). To be
considered a beginning reading intervention, participants must be in kindergarten through
grade three. The WWC does not limit length of follow-up, so that outcomes at any point
in time could be assessed so long as participation in the intervention occurred during the
relevant grades (WWC, 2006).
Interventions include programs, including curricula, add-on programs,
professional development, textbooks or software; policies, including actions such as
mainstreaming students with learning disabilities into regular classrooms; and practices,
described as activities such as reading aloud or home literacy environments (WWC,
2006). As noted earlier when discussing general WWC criteria, the Clearinghouse looked
for published and unpublished works including conference proceedings. The time frame
for the beginning reading category was 1983-2005; for conference papers, the time frame
was 1998-2005. A few studies ready for review in 2006 were included as well (WWC,
2006). Because reading studies are typically of short duration, the WWC decided that the
minimum study duration was to be one day post-intervention (WWC, 2006).
30
As of August 1, 2008, the WWC listed 174 beginning reading interventions. All
of the interventions on the list are evaluated separately, but some of them are part of a
larger umbrella of strategies (e.g., 12 “Direct Instruction” strategies were included). The
WWC had independently reviewed studies about each of the interventions.
Working With WWC Approved Programs in a Cost-Effectiveness Analysis
Cost-effectiveness analysis is a comparative endeavor in which alternatives with
similar goals and outcome measures must be put side by side. Four interventions are
included in this analysis: Accelerated Reader/Reading Renaissance, Classwide Peer
Tutoring, Reading Recovery, and Success for All. The WWC grouped these programs
according to the same outcome, general reading achievement. This provides a heuristic
for the same effectiveness measure and allows these programs to be included in the same
cost-effectiveness analysis. “General reading achievement” is a composite of different
reading outcomes. Reading programs under this heading were found to affect more than
one of the following domains: alphabetics, fluency, and comprehension, and/or a total
reading score such as a standardized test score (note that a standardized score is referred
to as “general achievement” in WWC technical appendices). Alphabetics is a composite
category that includes outcomes such as phonemic awareness, phonological awareness,
letter recognition, print awareness and phonics. Within the WWC designation, much like
the NRP description, comprehension includes vocabulary-related outcomes.
Another intervention, Little Books, had an approved effectiveness study. I could
not find any studies that met the evidence criteria and were conducted in the U.S. I
excluded studies conducted outside the U.S. due to differences in demographics, length
31
of school year and day, age at school entry, and many other differences that would be
difficult to control for given the small number of appropriate effectiveness studies for
each program. Also, studies conducted in different countries could make it more difficult
to provide standardized cost measures since teacher salaries, facility costs, and equipment
prices might differ. Because of the potential for so much omitted variable bias studies
conducted in different countries were included, I proceeded by analyzing four programs.
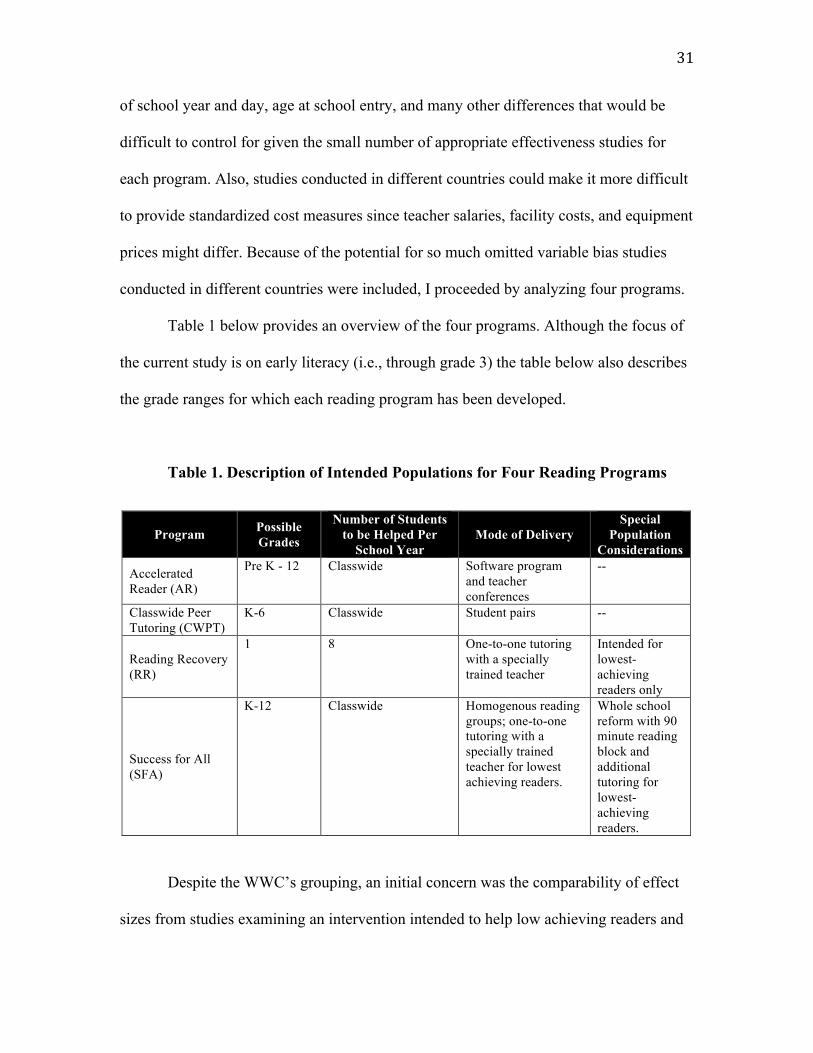
Table 1 below provides an overview of the four programs. Although the focus of
the current study is on early literacy (i.e., through grade 3) the table below also describes
the grade ranges for which each reading program has been developed.
Table 1. Description of Intended Populations for Four Reading Programs
Despite the WWC’s grouping, an initial concern was the comparability of effect
sizes from studies examining an intervention intended to help low achieving readers and
Program Possible Grades
Number of Students to be Helped Per
School Year Mode of Delivery
Special Population
Considerations
Accelerated Reader (AR)
Pre K - 12 Classwide Software program and teacher conferences
--
Classwide Peer Tutoring (CWPT)
K-6 Classwide Student pairs --
Reading Recovery (RR)
1 8 One-to-one tutoring with a specially trained teacher
Intended for lowest-achieving readers only
Success for All (SFA)
K-12 Classwide Homogenous reading groups; one-to-one tutoring with a specially trained teacher for lowest achieving readers.
Whole school reform with 90 minute reading block and additional tutoring for lowest-achieving readers.
32
effect sizes from studies analyzing programs that are intended for all students. The
WWC’s presentation of effect sizes implies that all program effects should be regarded as
representing the same growth, even though they do not take account of student sample
characteristics. As a result of participation in a reading program, the test scores of
students at lower achievement levels may be affected differently than scores of average
or high-achieving readers. In RR, for example, only first graders at risk of reading failure
may participate. Studies of RR only examine the effects of the intervention upon students
who had been among the lowest achieving readers in the first grade. The other three
programs being examined are delivered to the entire class, and usually to children in
multiple grades. SFA does have a tutoring component for low-achieving readers, so
although a sufficient number of studies did not show disaggregated results for struggling
readers, if there had been more studies with the appropriate data it would have been
possible to consider this group separate from the rest of the class.
As mentioned in the previous section, the WWC defines an intervention as any
policy, practice, or program, which implies that comparing classwide programs such as
Accelerated Reader to one-to-one tutoring programs like Reading Recovery is acceptable
within this context. Within the WWC framework, the term intervention is not necessarily
used to describe a program or practice that is intended to improve the achievement of the
lowest performers or those at risk. This is an important distinction because the four
programs to be compared focus on different populations. Accelerated Reader and
Classwide Peer Tutoring are delivered to an entire class and in any context. Success for
All is a whole school reform with a one-to-one tutoring component for struggling readers.
Reading Recovery is to be implemented with the lowest-achieving readers in the first
33
grade. Ultimately, because of the small number of effectiveness studies and the fact that
only RR studies consistently focused on low achieving readers, this dissertation compares
all four programs. It is worth mentioning, however, that comparing effect sizes based
upon different populations may introduce bias.
Also, different types of reading outcomes are included in the various studies. It
may be more difficult to achieve results in reading comprehension than to achieve similar
effect sizes in letter identification or phonemic awareness. As described earlier, WWC
reports do not evaluate differences in types of assessments, outcomes, or in the duration
of effects, so it appears that all outcomes are equally weighted. Some literacy outcomes
are likely more important in creating a successful reader. This study attempts to address
this issue by weighting literacy outcomes according to the result of a survey of literacy
specialists.
The next section of this chapter introduces the four programs included in the
analysis and summarizes their main components, limitations, and existing research.
The Four Programs
This section provides an overview of Accelerated Reader/Reading Renaissance,
Classwide Peer Tutoring, Reading Recovery, and Success for All. It then describes the
major components of the programs.
Accelerated Reader/Reading Renaissance: A Computerized Intervention
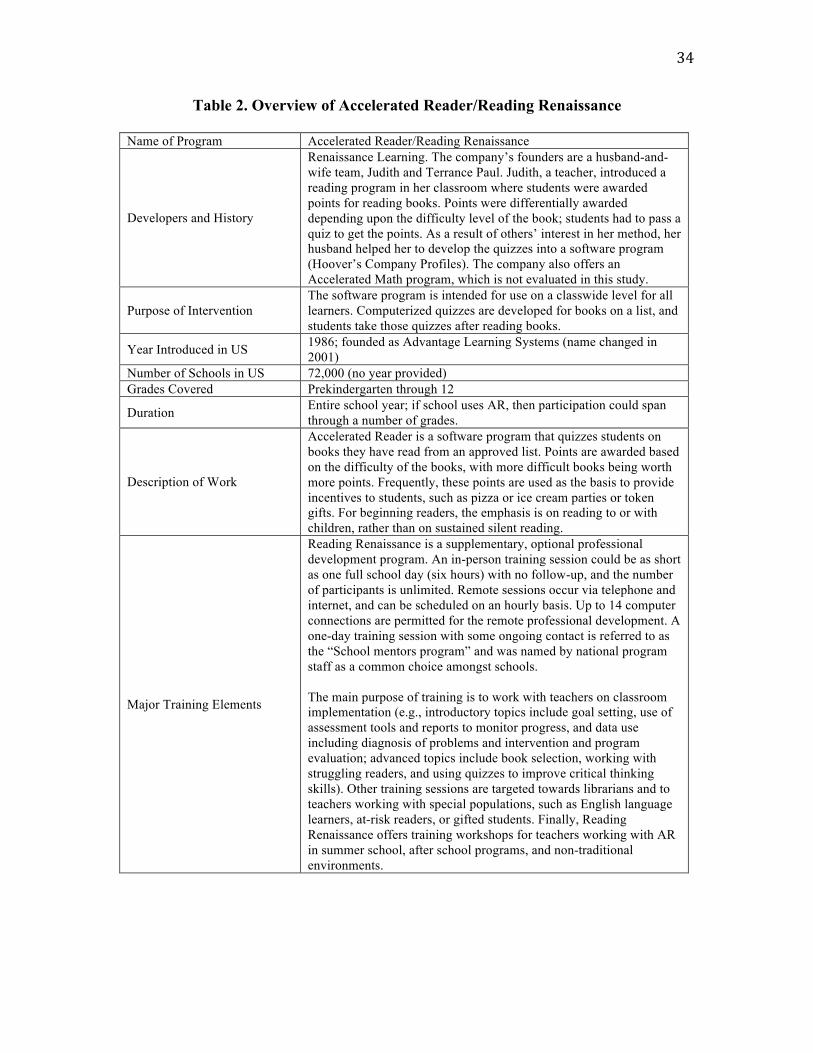
Table 2 summarizes the major components of Accelerated Reader/Reading
Renaissance to facilitate an understanding of the program.
34
Table 2. Overview of Accelerated Reader/Reading Renaissance
Name of Program Accelerated Reader/Reading Renaissance
Developers and History
Renaissance Learning. The company’s founders are a husband-and-wife team, Judith and Terrance Paul. Judith, a teacher, introduced a reading program in her classroom where students were awarded points for reading books. Points were differentially awarded depending upon the difficulty level of the book; students had to pass a quiz to get the points. As a result of others’ interest in her method, her husband helped her to develop the quizzes into a software program (Hoover’s Company Profiles). The company also offers an Accelerated Math program, which is not evaluated in this study.
Purpose of Intervention The software program is intended for use on a classwide level for all learners. Computerized quizzes are developed for books on a list, and students take those quizzes after reading books.
Year Introduced in US 1986; founded as Advantage Learning Systems (name changed in 2001)
Number of Schools in US 72,000 (no year provided) Grades Covered Prekindergarten through 12
Duration Entire school year; if school uses AR, then participation could span through a number of grades.
Description of Work
Accelerated Reader is a software program that quizzes students on books they have read from an approved list. Points are awarded based on the difficulty of the books, with more difficult books being worth more points. Frequently, these points are used as the basis to provide incentives to students, such as pizza or ice cream parties or token gifts. For beginning readers, the emphasis is on reading to or with children, rather than on sustained silent reading.
Major Training Elements
Reading Renaissance is a supplementary, optional professional development program. An in-person training session could be as short as one full school day (six hours) with no follow-up, and the number of participants is unlimited. Remote sessions occur via telephone and internet, and can be scheduled on an hourly basis. Up to 14 computer connections are permitted for the remote professional development. A one-day training session with some ongoing contact is referred to as the “School mentors program” and was named by national program staff as a common choice amongst schools. The main purpose of training is to work with teachers on classroom implementation (e.g., introductory topics include goal setting, use of assessment tools and reports to monitor progress, and data use including diagnosis of problems and intervention and program evaluation; advanced topics include book selection, working with struggling readers, and using quizzes to improve critical thinking skills). Other training sessions are targeted towards librarians and to teachers working with special populations, such as English language learners, at-risk readers, or gifted students. Finally, Reading Renaissance offers training workshops for teachers working with AR in summer school, after school programs, and non-traditional environments.
35
Description of Accelerated Reader/Reading Renaissance
Renaissance Learning markets its software program, Accelerated Reader, and its
professional development program, Reading Renaissance, for use in prekindergarten
through 12th grades (Renaissance Learning web site, accessed 2011). The Accelerated
Reader software is used to administer reading quizzes and is intended for classwide use.
Quizzes provide individualized information about students’ progress and challenges,
facilitating teachers’ feedback to students, parents, and other school personnel
(Renaissance Learning web site, accessed 2011). The program’s format is
straightforward: after completing a book, students take computerized reading quizzes.
Quizzes consist of multiple choice questions to assess comprehension of the book. They
may contain five, 10, or 20 questions, with the number of questions increasing with the
reading level. More than 65,000 schools participated in Reading Renaissance, a
professional development program for teachers, in 2004 (Nunnery et al., 2006).
Accelerated Reader is based upon the principles of “quality, quantity, and
challenge” (Borman & Dowling 2004), where quality is defined as performance on
proprietary quizzes, quantity refers to the number of books read, and challenge implies
that students read within a range of appropriate ability levels. Students in lower
elementary grades are expected to receive scores of 85% or greater correct on quizzes,
although individual schools may set different passing grades. Teachers can continually
monitor students’ scores and receive constant information about struggling students. It is
common for schools using AR to offer incentives to children who achieve a certain
number of points through their reading (Krashen, 2002). Incentives could include books
or bookmarks, or perhaps t-shirts or pizza parties.
36
In younger grades, children may read on their own, a parent may read to or with
the child at home, or teachers can read the book to groups or the whole class. In first
grade, quizzes may not be administered until the spring, or the class may take quizzes as
a group in the fall. Teachers decide when to start AR with first graders based on
individual students’ reading skills and progress. It is not clear what first graders who are
unready to participate in AR would be doing during scheduled AR time. The program
format and focus on practice reading suggests that it may be more effective for adolescent
readers (i.e., after grade three).
There are more than 65,000 quizzes available (Borman & Dowling, 2004),
suggesting that students have a wide selection of books from which to choose. Students
do not have to read the same books as others in the class. Books are assigned a reading
level by Renaissance Learning, based upon the book’s length and difficulty. Each book is
worth a certain number of points depending upon the reading level, with more difficult
books worth more points. Students are assigned a different points goal for the term or
school year depending on initial reading level and previous performance. Initial reading
level is determined by the 10-minute STAR reading test. Test results are used to
determine a “zone of proximal development” for each student. The zone of proximal
development for AR describes “the readability range from which students should be
selecting books to achieve optimal growth in reading skills without experiencing
frustration” (Renaissance Learning web site, accessed 2011). This appears to be a
subjective method of goal assignment. A brief exam determines an initial reading level,
but it is not clear how the number of points a student is expected to earn over the course
of the year is determined or how previous performance is taken into account.
37
Quiz results may be used immediately by teachers to help students select
appropriate books, diagnose issues for specific students, and aggregate data to identify
classroom-level issues. AR is not an instructional method, since the students using the
program are reading independently and then taking computerized quizzes to assess some
level of comprehension. AR may or may not replace other kinds of classroom reading
instruction, but some of the time spent on going to the library, taking quizzes, and
selecting books may detract from instructional time in reading or other subjects.
Schools are not required to supplement Accelerated Reader with Reading
Renaissance training, and effectiveness research does not always clarify whether schools
had offered Reading Renaissance professional development, or the extent of any training.
Schools can design their own professional development, which may occur remotely, in-
person, or both. In-person training must occur for a minimum of six hours (one school
day), while web training can be contracted for fewer hours. Schools may decide how
many hours of training they would like based on their individual needs. In addition to
formal training, schools may purchase a contract to communicate with RR trainers or
consultants via telephone. Subscribers may also access asynchronous, pre-recorded
webinars and tutorials via the Renaissance Learning website.
Schools that implement both Accelerated Reader and Reading Renaissance meet
federal criteria for a comprehensive school reform, resulting in eligibility for government
grants as large as $225,000 over three years. From a financing perspective, this may
provide an incentive to introduce the program. Nunnery et al. (2006) stated that program
costs ranged from $30,000 to $75,000 a year depending on the aspects of the program
that are adopted. This estimate was based upon 2004 calculations by the National
38
Clearinghouse for Comprehensive School Reform, though that website is no longer
available and it was not possible to see the methods used to create those estimates.
Discussion of Components of AR
AR software is marketed as a classwide program. Instructional technology
research suggests that the format of reading software is particularly helpful for children at
risk of reading failure (Bishop & Edwards Santoro, 2006), although I could not find any
evaluations of the characteristics of AR software. Beginning reading software may be
useful for struggling readers if it incorporates “the five pillars”– phonemic awareness,
phonics, fluency, vocabulary, and comprehension (NICHD, 2000). AR quizzes focus on
reading comprehension, suggesting that struggling emergent readers would not benefit
from the format or content of the quizzes. Bishop and Edwards Santoro (2006)
recommended that software focus on motivation and assessment. The quiz grades and
points system allow for assessment of student achievement and progress, and points and
prizes may be considered motivating. It is unlikely, though, that the quizzes themselves
would be particularly motivating for struggling beginning readers.
A concern about AR is that children could become accustomed to “reading for the
test.” Pavonetti, Brimmer, and Cipielewski (2002) conducted a follow-up study to
analyze reading habits of seventh graders in three middle schools to determine whether
former AR participants were “more likely to continue higher levels of recreational
reading in middle school” than a comparison group of children who did not participate in
AR in elementary school. They did not find significant differences in recognition of book
titles based on previous experience with AR. Differential scores on the Title Recognition
Test served as a proxy variable for different number of books read. This would seem to
39
be an imperfect proxy because title recognition cannot imply that a child has read a book.
The instrument’s instructions specify that some of the titles have been invented,
presumably to limit the number of guesses respondents will make when they do not know
whether a book title is legitimate. Results suggested that students who had been exposed
to AR in elementary school may not have continued to read independently any more than
children who had not received the program. In addition to using an imperfect proxy, the
authors did not provide information about equivalence of the groups at baseline, so it is
impossible to know whether students who participated in AR or schools that implemented
AR were different from those who did not based upon other characteristics.
They also reported anecdotes about schools where children were not allowed to
talk after independent reading time because teachers feared that they would share
information that would allow others to answer quiz questions without reading the book.
Other anecdotal evidence suggested that some students shared quiz information, allowing
them to pass quizzes without reading the books.
There is a debate regarding whether incentives are appropriate for improving
reading behavior. Although Renaissance Learning does not state that rewards should be
offered, a 1997 program report acknowledges that the points system lends itself to
provision of incentives, saying: “Teachers and librarians can use this information in a
variety of ways; many use it as the basis for extrinsic awards, many others do not”
(Institute for Academic Excellence, 1997). The report goes on to state that teachers or
school decision makers should feel free to decide whether to use extrinsic rewards based
upon their own school context and students’ needs, and that rewards may help to “jump-
start” the instrinsic motivation of reluctant readers.
40
If incentives encourage reading, then children’s reading habits may change after
incentives are no longer offered. Marinak and Gambrell (2008) suggest that no rewards,
or a carefully chosen reward like books, were more motivating to students in terms of
time spent reading and number of words read than a token reward such as a PEZ
dispenser or toys. They conducted a study of 75 third graders who were randomly
selected from amongst 1200 third graders in three schools. The children in the three
groups were shown to be equivalent on a pretest measuring their motivation to read. The
children were randomly assigned either not to receive any prize, to receive a paperback
book, or to receive a token gift. They found that students who were promised a book or
were in the control condition read more words than children who were promised a token
gift. They concluded that token rewards were de-motivating for students and
recommended that educators who plan to use incentives choose “reading-related
rewards.” More generally, extrinsic motivation may not have lasting effects. Students
may perform because of the presence of incentives and will lose interest when incentives
are no longer provided (Pintrich & Schunk, 2002; Stipek, 1988). Deci and Ryan have
noted that incentives may “undermine” intrinsic motivation because “people tend to
interpret rewards, directives, deadlines, and threats as controllers of their behavior, which
thwarts their need for autonomy” (Weiner & Craighead, ed., 2010).
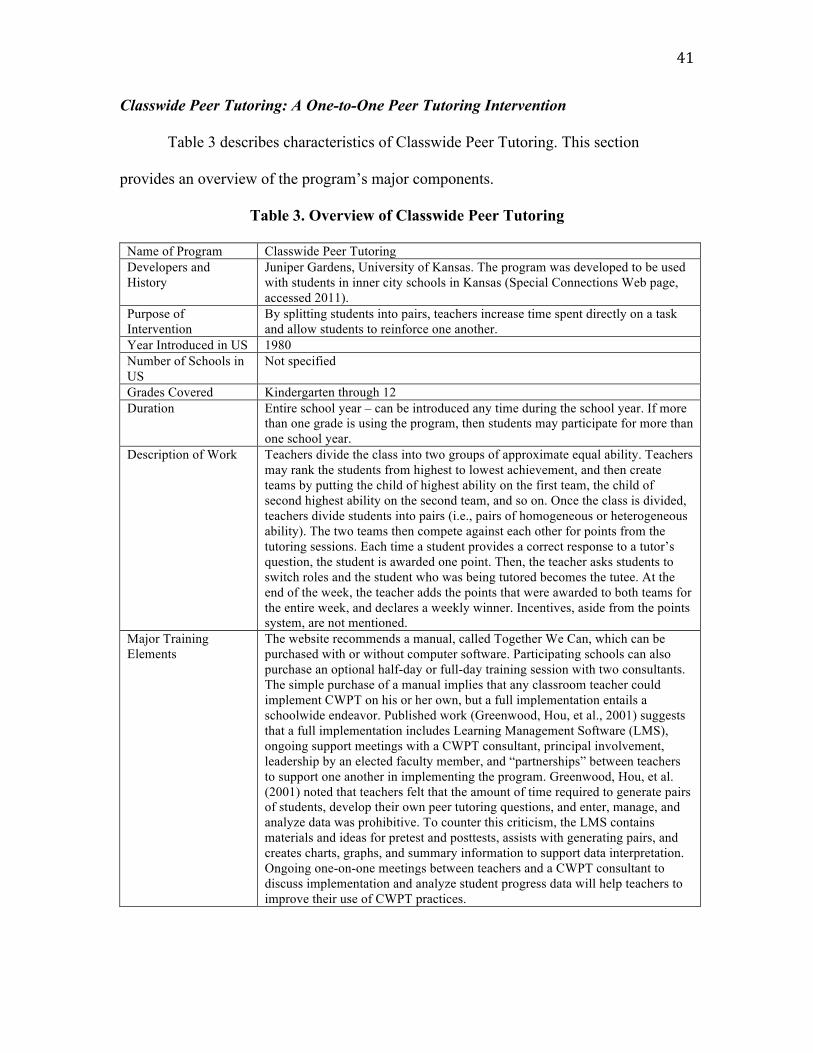
41
Classwide Peer Tutoring: A One-to-One Peer Tutoring Intervention
Table 3 describes characteristics of Classwide Peer Tutoring. This section
provides an overview of the program’s major components.
Table 3. Overview of Classwide Peer Tutoring
Name of Program Classwide Peer Tutoring Developers and History
Juniper Gardens, University of Kansas. The program was developed to be used with students in inner city schools in Kansas (Special Connections Web page, accessed 2011).
Purpose of Intervention
By splitting students into pairs, teachers increase time spent directly on a task and allow students to reinforce one another.
Year Introduced in US 1980 Number of Schools in US
Not specified
Grades Covered Kindergarten through 12 Duration Entire school year – can be introduced any time during the school year. If more
than one grade is using the program, then students may participate for more than one school year.
Description of Work Teachers divide the class into two groups of approximate equal ability. Teachers may rank the students from highest to lowest achievement, and then create teams by putting the child of highest ability on the first team, the child of second highest ability on the second team, and so on. Once the class is divided, teachers divide students into pairs (i.e., pairs of homogeneous or heterogeneous ability). The two teams then compete against each other for points from the tutoring sessions. Each time a student provides a correct response to a tutor’s question, the student is awarded one point. Then, the teacher asks students to switch roles and the student who was being tutored becomes the tutee. At the end of the week, the teacher adds the points that were awarded to both teams for the entire week, and declares a weekly winner. Incentives, aside from the points system, are not mentioned.
Major Training Elements
The website recommends a manual, called Together We Can, which can be purchased with or without computer software. Participating schools can also purchase an optional half-day or full-day training session with two consultants. The simple purchase of a manual implies that any classroom teacher could implement CWPT on his or her own, but a full implementation entails a schoolwide endeavor. Published work (Greenwood, Hou, et al., 2001) suggests that a full implementation includes Learning Management Software (LMS), ongoing support meetings with a CWPT consultant, principal involvement, leadership by an elected faculty member, and “partnerships” between teachers to support one another in implementing the program. Greenwood, Hou, et al. (2001) noted that teachers felt that the amount of time required to generate pairs of students, develop their own peer tutoring questions, and enter, manage, and analyze data was prohibitive. To counter this criticism, the LMS contains materials and ideas for pretest and posttests, assists with generating pairs, and creates charts, graphs, and summary information to support data interpretation. Ongoing one-on-one meetings between teachers and a CWPT consultant to discuss implementation and analyze student progress data will help teachers to improve their use of CWPT practices.
42
Description of Classwide Peer Tutoring
Classwide Peer Tutoring (CWPT) is intended for use in regular and special
education classrooms, and with children that have been diagnosed with learning
disabilities. The program requires students to work in pairs, or “dyads,” to study reading,
math, and/or spelling. Individual teachers may design instruction based on district
guidelines. CWPT is organized in a “basketball game format” where the class is “divided
into two equal ability teams who are competing to be the winning team by earning the
most points during the tutoring process” (Special Connections Web page, accessed 2008).
CWPT works according to a particular schedule. On Mondays, students are pre-tested on
the material for that week. Mondays through Thursdays, students are paired off for 30
minutes of CWPT time: 20 minutes of tutoring, and 10 minutes for “material preparation”
(Promising Practices Network, accessed 2008). Students are post-tested on Fridays.
Pretests and posttests should cover the same content area. Preferably, all of the pretest
and posttest questions should be different, although the site specifies that questions
should at the very least be in a different order. Greenwood, Hou, Delquadri, Terry, and
Arreaga-Mayer (2001) noted that teachers often found that the pretest materials were too
easy, so they could adapt the difficulty level of the peer tutoring material during the week
for some or all students.
The program can be implemented with any materials or existing curriculum.
Teachers using the learning management software (LMS) can use the program to
download curriculum ideas and materials (Greenwood, Hou, et al., 2001). Common areas
for peer tutoring in beginning reading include spelling, oral reading fluency, retelling a
43
story, predicting what happens next in a story, and answering comprehension questions
generated by the teacher (Greenwood, Hou, et al., 2001).
Teachers can choose their preferred pairing method for their class. Teachers using
the LMS can use the program to generate dyads for the week. For example, a student may
peer tutor a classmate at a similar ability level, or higher achieving students may be
paired with those who are struggling. Both members serve as tutor and tutee, which may
increase engagement and motivation especially for lower achieving students (Fulk &
King, 2001). Greenwood, Hou, et al. (2001) suggest that teachers should generate new
pairs every week.
CWPT program developers note that their program relies on minimal training and
the use of an inexpensive manual. A study showed that teachers attained the level of
training required to implement CWPT in 90 minutes and did not need further training or
assistance to do so properly (Maheady & Harper, 1991). Other work (Greenwood, Hou,
et al., 2001), however, showed that a full implementation involved substantially more
training, buy-in, and ongoing support than the use of a single manual. The introduction of
proprietary software, ongoing support for teachers, monitoring of implementation via
observations, and scheduled discussions to evaluate student data and progress had a
positive impact on the extent and fidelity of CWPT implementation.
Discussion of Components of CWPT
Peer tutoring benefits the tutor as well as the child being tutored (Dineen, Clark,
& Risley, 1997). The format may be effective for struggling, average, and high achieving
students (Jason, Ferone, & Soucy, 1979). Shanahan (1995) presented findings from
44
various meta-analyses of tutoring programs. Although he does not distinguish between
syntheses that used studies of peer tutoring or tutoring by paraprofessionals, or by
academic area, he finds fairly large effect sizes (at least 0.36), especially in primary
grades. He notes that effects may be overstated because tutees tend to be low achievers
and their posttest scores may have demonstrated regression to the mean. Al Otaiba and
Torgeson (2007), in a review of studies on classwide interventions for kindergarteners
and first graders, suggest that the peer tutoring format is effective for struggling readers.
Students who worked one-on-one with an adult tutor, however, seemed to benefit more.
Children who benefit from a less intensive early intervention, such as peer tutoring, may
be placed upon a more successful reading trajectory (Al Otaiba & Torgeson, 2007). Al
Otaiba and Torgeson (2007) caution, however, about the dearth of studies with long
follow-up periods, which limit an understanding of true program effects.
Greenwood, Terry, et al. (1992) highlighted “quality assurance,” or
implementation, issues as potential impediments to improved student outcomes as a result
of using CWPT. For any educational program, however, it would be reasonable to expect
that the best results would be seen given appropriate fidelity of implementation. In
Greenwood, Terry, et al. (1992), when examining the effect of CWPT on spelling test
outcomes, the words used at pretest needed to be sufficiently challenging; teachers
needed to provide the opportunity for students to participate frequently enough; and
students needed to earn enough points to remain motivated. The points are a kind of
symbolic reward (Fulk & King, 2001). A symbolic reward could not be considered to be
extrinsically motivating to the same extent as toys or pizza parties, but it seems fair to
assume that scoring points could be somewhat encouraging. Greenwood, Hou, et al.
45
(2001) stated that teachers who did not use the points system for CWPT “risked lowering
student outcomes and students’ satisfaction and interest” (p. 66), though they did not
report whether they had conducted experiments or analyzed student data to reach that
conclusion. Competing against a team of classmates also could be considered to
“[provide] contingent group reinforcement” (Greenwood, Hou, et al., 2001 p. 66) and
serve as a motivator.
Another limitation of peer tutoring concerns the tutors themselves; peer tutors
may not be as effective as older or more highly trained tutors (Al Otaiba & Torgeson,
2007). Studies that examined the effects of tutoring by a licensed teacher showed higher
effect sizes than peer tutoring (Shanahan, 1995). Of course, when potential effect size
gains are just one consideration among many, this may be less important to a decision
maker. Peer tutoring, as we will see in the chapter on costs, is far cheaper to implement
and demands much less teacher training time than a one-to-one tutoring program like
Reading Recovery.
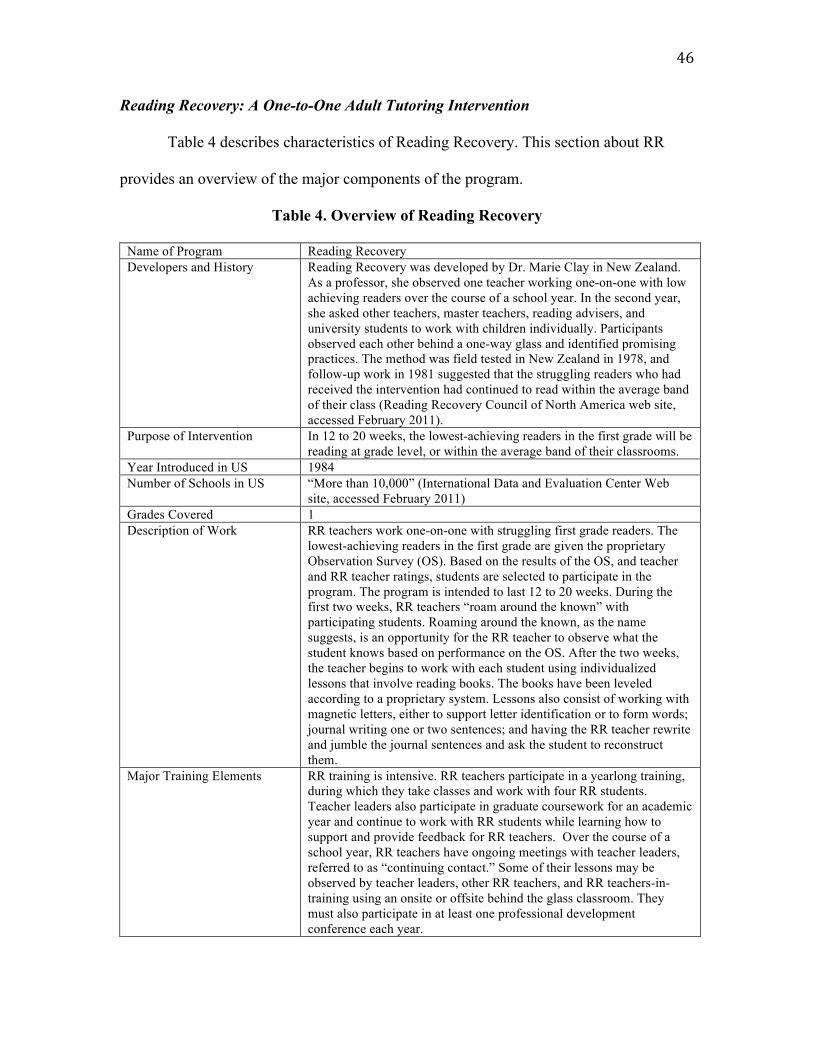
46
Reading Recovery: A One-to-One Adult Tutoring Intervention
Table 4 describes characteristics of Reading Recovery. This section about RR
provides an overview of the major components of the program.
Table 4. Overview of Reading Recovery
Name of Program Reading Recovery Developers and History Reading Recovery was developed by Dr. Marie Clay in New Zealand.
As a professor, she observed one teacher working one-on-one with low achieving readers over the course of a school year. In the second year, she asked other teachers, master teachers, reading advisers, and university students to work with children individually. Participants observed each other behind a one-way glass and identified promising practices. The method was field tested in New Zealand in 1978, and follow-up work in 1981 suggested that the struggling readers who had received the intervention had continued to read within the average band of their class (Reading Recovery Council of North America web site, accessed February 2011).
Purpose of Intervention In 12 to 20 weeks, the lowest-achieving readers in the first grade will be reading at grade level, or within the average band of their classrooms.
Year Introduced in US 1984 Number of Schools in US “More than 10,000” (International Data and Evaluation Center Web
site, accessed February 2011) Grades Covered 1 Description of Work RR teachers work one-on-one with struggling first grade readers. The
lowest-achieving readers in the first grade are given the proprietary Observation Survey (OS). Based on the results of the OS, and teacher and RR teacher ratings, students are selected to participate in the program. The program is intended to last 12 to 20 weeks. During the first two weeks, RR teachers “roam around the known” with participating students. Roaming around the known, as the name suggests, is an opportunity for the RR teacher to observe what the student knows based on performance on the OS. After the two weeks, the teacher begins to work with each student using individualized lessons that involve reading books. The books have been leveled according to a proprietary system. Lessons also consist of working with magnetic letters, either to support letter identification or to form words; journal writing one or two sentences; and having the RR teacher rewrite and jumble the journal sentences and ask the student to reconstruct them.
Major Training Elements RR training is intensive. RR teachers participate in a yearlong training, during which they take classes and work with four RR students. Teacher leaders also participate in graduate coursework for an academic year and continue to work with RR students while learning how to support and provide feedback for RR teachers. Over the course of a school year, RR teachers have ongoing meetings with teacher leaders, referred to as “continuing contact.” Some of their lessons may be observed by teacher leaders, other RR teachers, and RR teachers-in-training using an onsite or offsite behind the glass classroom. They must also participate in at least one professional development conference each year.

47
Description of Reading Recovery
Reading Recovery (RR) is a short term reading intervention intended to last 12 to
20 weeks. The program’s goal is to raise the achievement levels of the lowest readers to
the average of their classrooms. RR is a one-to-one tutoring program administered by a
specially trained RR teacher.
RR tutoring sessions supplement regular classroom reading instruction. RR is a
pull-out program; students are removed from their regular classroom to work with the RR
teacher for 30 minutes. It can be assumed that students miss other kinds of instruction
during the time that they are with the RR teacher. Students are chosen to participate based
on performance on the proprietary Observation Survey (OS), as well as teachers’
subjective ratings of children’s performance relative to the rest of their class. The OS
consists of letter identification, concepts about print (where students demonstrate skills
such as knowing that text goes from left to right), writing vocabulary (where students are
asked to write down all the words they know), hearing and recording sounds (where the
teacher says one or two sentences and asks the child to write down all of the sounds or
words they heard), and word tests. Typically, only students being considered for the
intervention take the OS. Students who participate in RR take the OS in the fall, at
program entry, midyear, at program exit, and at the end of the year, suggesting more
familiarity with the instrument than other struggling readers who were not part of RR.
Students who have been selected to participate receive daily, 30-minute sessions
with an RR teacher and are discontinued if they make adequate progress, or
recommended for further services (e.g., special education, bilingual, or compensatory
services) if sufficient progress is not made. The decision to discontinue a student is based
48
on a number of factors, including the reading text level attained by the student. A text
level of 16 is considered grade level for the spring of first grade. Students are typically
discontinued from the program when they reach this milestone. When a student is
discontinued, another low-achieving student takes his or her place and begins a series of
one-on-one lessons. In the U.S., Reading Recovery teachers and teacher leaders are
trained at designated university sites, including Lesley University and The Ohio State
University. Teachers who wish to become RR teachers must already be working in
schools or districts using the intervention and must have at least three years of elementary
school experience. During the training year, RR teachers-in-training take graduate
coursework which may be applied towards a master’s degree but does not lead to a
master’s degree, participate in four to six ongoing support and mentoring sessions with
teacher leaders called “continuing contact,” and begin working with four RR students
over the course of the school year. After the training year, RR teachers continue to
participate in four to six continuing contact sessions and must participate in at least one
professional development conference each year.
Reading Recovery teachers conduct RR lessons for half the school day and work
in another capacity in the school for the rest of the school day (e.g., reading teacher, Title
I teacher). As part of RR, RR teachers work with four students per day; an RR teacher
could work with a maximum of eight RR students per year. A teacher may work with
fewer students if he or she exceeds the average number of lessons per student, or if
students are frequently absent and it takes longer to reach the required number of lessons.
RR teachers are supported by a teacher leader, who works with an average of 26
RR teachers (International Data and Evaluation Center, 2008-2009). The number of
49
teachers supported by the teacher leader depends on the geographic area, and the number
of schools/districts implementing RR. RR teachers who wish to become teacher leaders
must take 18-20 graduate credits. During the training year, a teacher-leader-in-training
will also work closely with an existing teacher leader to learn how to support and mentor
RR teachers. They also teach four RR students during that academic year. Teacher
leaders continue to work with a few RR students each year, depending on the number of
teachers in training, existing RR teachers’ needs, and geographic considerations.
For the first two weeks of the intervention, RR teachers spend the half-hour lesson
“roaming around the known” with participating students. They observe the student
reading or working with text and letters based upon the results of the OS. After two
weeks, they are familiar with students’ individual needs and design lessons that are
tailored for the specific student. The teacher then begins RR lessons, which include
rereading two books from the previous day; listening to the student read a book from the
previous day and taking a running record; allowing the student to use magnetic letters to
work on letter identification; writing a sentence or two about whatever they might like to
write about; jumbling the words in the sentence for students to put back together; and
introducing and reading a new book (Center, Wheldall, & Freeman, 2004). A running
record provides thorough, word-by-word documentation of a students’ reading of a given
text. Teachers place a check above words that are read correctly, and indicate where
words were sounded out, read incorrectly, required a prompt, or were skipped. Over time,
running records can be used to understand a child’s progress or challenges.
RR text levels help to determine whether a child is to be discontinued from the
program, with a level of 16 typically considered “average” for the spring of first grade.
50
Text levels are not based on an interval scale; rather, the lower levels are more closely
spaced in terms of difficulty, and then the higher levels become substantially more
difficult. RR requires schools to purchase leveled books and materials, but teachers can
search online databases or request a list of thousands of books that have “Reading
Recovery text levels” if they are using existing books in their libraries.
Discussion of Components of Reading Recovery
Published work (e.g., Bloom, 1981; Wasik, 1998) supports RR’s format. RR is a
particularly expensive intervention because one-to-one tutoring is carried out by certified,
highly trained teachers (Wasik, 1998). Wasik (1998) notes that replacing highly trained
tutors with volunteers appears to be an attractive option, but volunteer tutors would be
costly. They need strong leadership from a reading specialist, ongoing training and
feedback, structured elements for their tutoring, the opportunity to provide consistent and
intensive sessions, and use of high quality materials. Even without accounting for the
opportunity cost of volunteer reading tutors’ time, it is plain to see that the use of
volunteers is far from free. Juel (1996) advocates for tutoring experiences that are
“scaffolded,” according to the Vygotskian definition of a zone of proximal development,
which is the difference between what a novice can do with or without an expert’s
collaboration. She notes that RR teachers “help children develop self-improving
strategies to facilitate reading within the context of reading” (Juel, 1996), which she
postulates will contribute to improved student achievement and attitudes.
Often, RR’s effect on student achievement is assessed by looking at text level
growth, even though text level may not be the best measure to use. Because the books
51
used in RR are not assigned text levels according to an interval scale, criticism suggests
that studies of RR cannot use text level gains to show that a treatment group
outperformed a comparison group (Center, Wheldall, & Freeman, 2004). Denton et al.
(2006) assessed the reliability and validity of the OS, and determined that many of the
subtests had inadequate floors and ceilings. The text level and writing vocabulary
subtests, however, were found to be valid for evaluation purposes. An additional criticism
about research using the proprietary OS is the same as criticism about any program that
uses a proprietary measure to assess program effects. Students in the treatment group are
more likely to be exposed to the skills needed to do well on the test, and may have been
exposed to the assessment over the course of the school year rather than just at pretest
and posttest. This renders the information less useful for determining program effects.
Criticism of RR centers around the high cost of the program relative to the few
children served, as well as the lack of evidence of sustained program effectiveness.
Because the decision to discontinue a student from the program is somewhat subjective,
critics assert that effectiveness research is based upon “selective attrition” by removing
those who are recommended for other services, and does not represent true program
effects (Elbaum, Vaugn, et al., 2000). Children are selected to participate using the
Observation Survey and teachers’ own judgment, so that it is difficult to know whether
RR teachers work with the children who were legitimately most in need. RR is delivered
only to low achieving first graders, and would not be used for the whole class or students
in other grades. The RR teacher may work with groups or in some other capacity for the
rest of the day, but results for students helped in that capacity are not typically described
or included in any RR data.
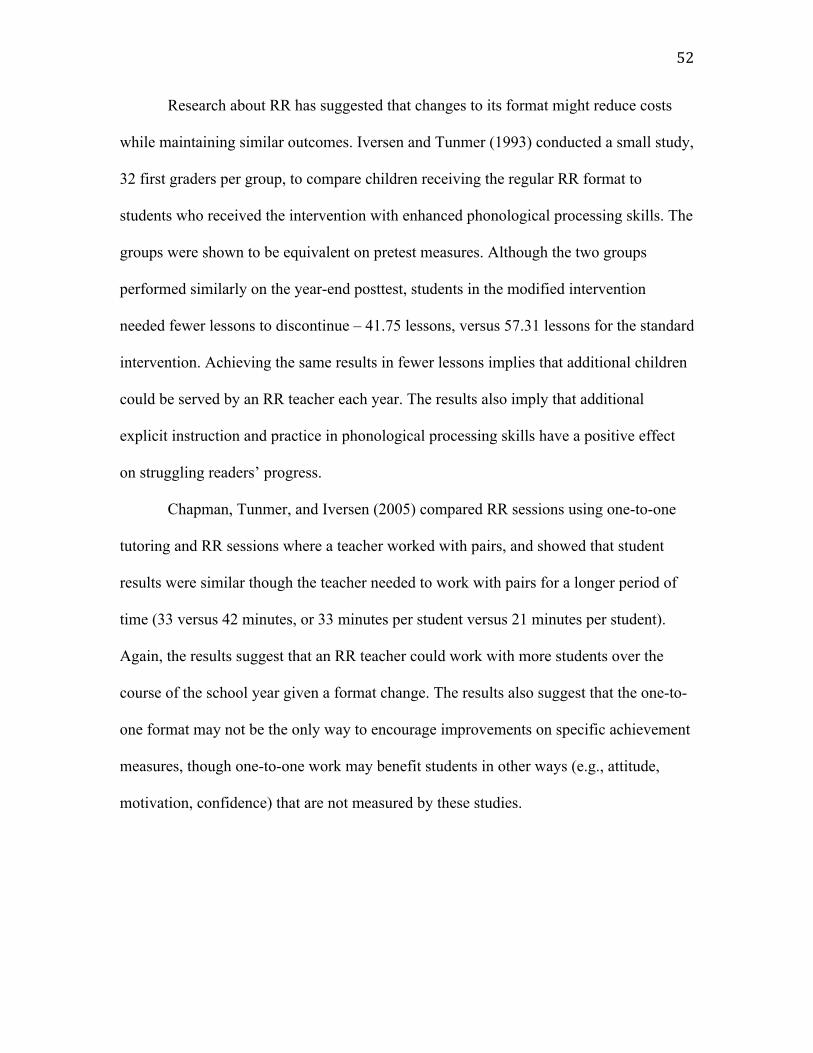
52
Research about RR has suggested that changes to its format might reduce costs
while maintaining similar outcomes. Iversen and Tunmer (1993) conducted a small study,
32 first graders per group, to compare children receiving the regular RR format to
students who received the intervention with enhanced phonological processing skills. The
groups were shown to be equivalent on pretest measures. Although the two groups
performed similarly on the year-end posttest, students in the modified intervention
needed fewer lessons to discontinue – 41.75 lessons, versus 57.31 lessons for the standard
intervention. Achieving the same results in fewer lessons implies that additional children
could be served by an RR teacher each year. The results also imply that additional
explicit instruction and practice in phonological processing skills have a positive effect
on struggling readers’ progress.
Chapman, Tunmer, and Iversen (2005) compared RR sessions using one-to-one
tutoring and RR sessions where a teacher worked with pairs, and showed that student
results were similar though the teacher needed to work with pairs for a longer period of
time (33 versus 42 minutes, or 33 minutes per student versus 21 minutes per student).
Again, the results suggest that an RR teacher could work with more students over the
course of the school year given a format change. The results also suggest that the one-to-
one format may not be the only way to encourage improvements on specific achievement
measures, though one-to-one work may benefit students in other ways (e.g., attitude,
motivation, confidence) that are not measured by these studies.
53
Success for All: A Comprehensive School Reform With Reading Blocks and Tutoring
Table 5 describes characteristics of Success for All. This section about SFA
provides an overview of the major components of the program.
Table 5. Overview of Success for All
Name of Program Success for All Developers and History Success for All Foundation. Robert Slavin and Nancy Madden
developed SFA together in the 1980s and first implemented their ideas in a school in Baltimore during the 1986-1987 school year. The initial school implemented a version of the Reading Roots program, a reading block with a specific set of tasks, with supplemental tutoring for the lowest achieving readers.
Purpose of Intervention As the name of the program suggests, “Success for All” is built on the belief that all students can succeed. It is a whole school reform with a focus on prevention, early intervention, and individualized attention to each child.
Year Introduced in US 1986 Number of Schools in US 1,300 (in 2005 according to an interview on
http://www.pbs.org/makingschoolswork/sbs/sfa/index.html) Grades Covered Prekindergarten-12 Description of Work SFA is a comprehensive school reform that restructures a school. The
restructuring includes the hiring of an SFA facilitator and a social worker. The program puts in place a family support team to encourage parent involvement and lead workshops intended to improve parents’ involvement, and an advisory committee to monitor implementation progress. A primary component of the instructional program is a 90 minute reading block, during which students are split into smaller, homogeneous groups of 15-20 students (Pikulski, 1994). Within the reading groups, students have the opportunity to work in pairs, to respond to comprehension questions as a group, and to “share stories” by reading aloud with teachers. A supplemental tutoring service is offered to the lowest achieving readers, usually one-third of the first grade class.
Major Training Elements Teachers receive an intensive three day training and a set of manuals that include the curriculum and materials they will need. Over the course of the school year, they are observed by SFA trainers and the principal and have the opportunity to participate in progress and implementation related meetings. Principal and facilitator are expected to participate in a five day training in Baltimore.
Success for All (SFA) was developed by the Success for All Foundation and
funded by schools, the government, and foundations. Unlike the other three programs in
this study, SFA is not just a literacy program. It is a comprehensive reform intended to
restructure the school and increase family involvement by introducing support teams.
54
SFA schools use specific curricula, even at the prekindergarten or kindergarten level.
SFA works on the principles of prevention, whereby high-quality curricula are offered as
early as prekindergarten; intensive early intervention for children who need it; and
continuous assessment to provide individualized services and attention to all children
(Slavin, Madden, & Chambers, 2001).
The elementary program is intended for students in pre-kindergarten through
grade six (SFA Foundation Web site). SFA includes a comprehensive reading
component, beginning with 90-minute reading blocks using the Reading Roots program.
Teachers participate in training to learn to use Reading Roots, which can be introduced in
kindergarten (Slavin, Madden, & Chambers, 2001). Reading Roots focuses on the six
major areas of early literacy: “phonemic awareness, phonics, decoding, word recognition
strategies, fluency, and comprehension” (SFA Web site). In younger grades, teachers will
begin the reading block by reading aloud to students and focusing on retelling. “Shared
stories” are introduced, which include small print to be read aloud by the teacher and
large print to be read aloud by students. As the difficulty level increases, the teacher reads
a decreasing portion of the book and students are expected to read a growing portion
(Slavin, Madden, & Chambers, 2001).
During the 90 minute reading block, students in grades one through five are
placed into homogeneous reading groups that span across grades (Cooper, Slavin, &
Madden, 1998; Slavin, Madden, & Chambers, 2001). Reading groups are to have 15-20
students (Pikulski, 1994) and are led by tutors or other staff such as librarians or art
teachers (Slavin, Madden, & Chambers, 2001).
55
Ability grouping for reading is controversial. A meta-analysis about ability
grouping resulted in an effect size of 0.12 in favor of homogenous groups, although the
authors included studies of elementary, secondary, and post-secondary students and did
not look only at reading groups (Lou, Abrami, et al., 1996). Kulik (1993) suggests that
existing research shows that ability grouping benefits high ability students. Gamoran
(1992) suggested that ability grouping may be inequitable, leading to worse outcomes for
low achieving students. This sort of equity consideration could be an important factor in
deciding whether to adopt SFA.
In kindergarten and first grade, teachers use the Reading Roots program, which
replaces the standard curriculum with new materials. As part of the reading block,
students are encouraged to work together. For example, students may work in pairs to
practice phonemic awareness tasks, predict what will happen next in a story, or retell a
story (Slavin, Madden, & Chambers, 2001). During direct instruction, the reading group
is encouraged to respond to questions as a group (Slavin, Madden, & Chambers, 2001).
Reading Roots consists of a 20-minute comprehension lesson in which students may be
asked to tell and retell a story, a 50-minute shared story, and a 20-minute language
development lesson (Slavin, Madden, & Chambers, 2001).
Starting in second grade and for the rest of elementary school, teachers use the
Reading Wings program, which incorporates the district’s standard readers or novels but
requires teachers to use a comprehension-focused, proprietary “cooperative learning
process” (Slavin, Madden, & Chambers, 2001, p. 16). A Reading Wings reading block
consists of six activities: reading with a partner; identifying story details and writing a
few paragraphs on a related topic such as creating a new ending for the story; vocabulary
56
lessons via practicing words out loud and creating sentences to show a understanding of
words’ meaning; retelling a story to a student partner; and practicing spelling with a
student partner. After three class lessons, students take a comprehension test to assess
how well they have understood what they have read (Slavin, Madden, & Chambers,
2001). In addition to homogeneous reading groups, students in the Reading Wings
program are assigned to teams. Teams are heterogeneous groups of five students of
varying ages and reading levels (Slavin, Madden, & Chambers, 2001). Teams earn points
for weekly quiz grades, book reports, writing assignments, and parental forms that
indicate children have been reading at home (Slavin, Madden, & Chambers, 2001).
Students who require additional help with reading skills, generally the lowest-
achieving third of first graders and lowest twenty percent of second graders, receive one-
on-one tutoring with certified teachers. When possible, the program specified that a
child’s own classroom teacher serve as the tutor (Pikulski, 1994). In practice, tutoring is
generally carried out by paraprofessionals (Chambers, Abrami, et al., 2005). Tutoring is
intended to complement classroom instruction, and tutors will often work on the same
story or material that had been introduced in class (Slavin, Madden, & Chambers, 2001).
The information supporting one-to-one tutoring in the RR format is likely applicable for
one-to-one tutoring in SFA as well if highly trained teachers provide the tutoring,
although SFA does not include the intensive training component that RR does. Vaughn,
Linan-Thompson, et al. (2003) showed that, for a 13 week intervention, one-to-one or
small group (one-to-three) instruction was more effective for struggling second grade
readers than a larger group (10 students). They show that the groups were equivalent on a
57
phoneme segmentation task at pretest, suggesting that the format of instruction may have
made a difference.
Tutoring software called Alphie’s Alley may also be used for the lowest-
achieving readers. The software is intended to supplement a session with a tutor, rather
than for the child to use on his or her own (Chambers, Abrami, et al., 2005). The software
includes videos for tutors to watch as a form of professional development, and the
software automatically analyzes student responses and designs an interaction plan for the
tutor on the spot (Chambers, Abrami, et al., 2005). It would appear that the software is
intended to supplement tutoring sessions provided by tutors who are less qualified than
certified teachers.
Program documentation suggests that class sizes be reduced schoolwide, which
may be difficult to achieve given limited physical space. Students take reading
assessments every eight weeks to help gauge their progress (Cooper, Slavin, & Madden,
1998). Teachers, school leaders, and the SFA coach review student progress together to
determine how students are doing. The assessments are tied to the curriculum, and for
beginning readers usually contain an oral and written component (Slavin, Madden, &
Chambers, 2001).
Aside from instructional changes, a Family Support Team and a full-time SFA
facilitator are supposed to be employed by SFA schools to encourage parental
involvement and improve the quality of implementation (Florida Center for Reading
Research brief). The family support team consists of a Title I parent liaison, the assistant
principal, the school counselor/social worker, the SFA facilitator, and any other
appropriate staff (Slavin, Madden, & Chambers, 2001). The team may organize
58
workshops for parents, contacts parents when children are having problems such as
chronic absences, works with teachers to solve behavioral issues, and recruits and trains
parents volunteers (Slavin, Madden, & Chambers, 2001). The family support team is also
part of the advisory board, where they are to be joined by the principal, the facilitator,
parents, and teachers to discuss the program’s progress.
School leaders, such as the principal and facilitator, are expected to participate in
a five-day SFA training in Baltimore. In the schools, SFA implementation begins with a
three-day in-service training. For teachers in younger grades, training focuses on SFA’s
reading program (Slavin, Madden, & Chambers, 2001). In addition to the initial training,
ongoing coaching, workshops, and observations are intended to help teachers to carry out
the various components of the SFA reading program. Ongoing training is to be led by
SFA trainers. Principals should play a very active role in ensuring the success of SFA,
including motivating teachers.
Discussion of Components of Success for All
Success for All requires substantial effort to implement, including intensive time
commitment from school personnel, a dedicated social worker for the school, and
increased parental involvement. Additional parental involvement and a stronger family-
school connection should have an impact on student performance. A meta-analysis of 41
studies of general parental involvement in urban settings found an effect size of 0.74 for
general parental involvement, which included a variety of measures such as
communication, homework, reading with children, expectations, attendance/participation
in school functions, or a composite. The same study found an effect size of 0.27 for
59
formal parental involvement programs, which were not clearly defined in the paper. It
was unclear what the specific outcome measures were, whether studies used equivalent
comparison groups or comparison groups at all, or study quality (Jeynes, 2005). In a
longitudinal study of 187 firstborn children born to low-income mothers in Minnesota,
parental involvement in school, parental expectations, and the quality of instruction a
mother could provide in an academic task had a greater effect on third grade children’s
achievement than maternal education, child’s IQ, or the child’s previous academic
achievement (Englund, Luckner, et al., 2004).
Buy-in is a critical piece of successful implementation of a whole school reform
for teachers. SFA requires teachers to vote on whether to adopt the program. This
suggests that teachers have some choice in the matter, though a small study of 49 teachers
in schools implementing SFA suggested that an affirmative vote to adopt the program
may have resulted from administrative pressure or funding availability (Datnow &
Castellano, 2000). Overall, support for SFA and effects on implementation suggested that
a teacher’s personal feelings about the program did not necessarily impact fidelity of
implementation. Most teachers adapted the program to their needs, and spent more time
on given tasks than the manuals prescribed (Datnow & Castellano, 2000). Many
complaints concerned materials and the lesson plans. Datnow and Castellano (2000)
identified materials developed by an outside source as the cause of teacher skepticism.
They theorized that a reform that allowed for teacher development of instructional plans
or format might have greater buy-in. Some teachers even admitted to “faking it” when
trainers came by to observe lessons and then going back to their own methods of
implementation (Datnow & Castellano, 2000, p. 792). Although the study was small, it is
60
worth noting that in one of the schools just 35% of teachers (seven of 20) were still
teaching at the school within three years of implementing SFA. The results from one
school cannot be considered representative, but this is an important issue because teacher
turnover is costly. A recent study (Barnes, Crowe, & Schaefer, 2008) calculated a district
cost of $9,501 per teacher leaving the district, based upon five districts located around the
U.S.. Training a new teacher in the SFA method and the learning curve required for
proper program implementation would represent a substantial cost.
Implementation is a key component of a comprehensive school reform’s (CSR)
success, and is partially dependent upon funding, resources, planning time, and parental
and/or community involvement. Some factors may be beyond a decision maker’s control.
Given the appropriate environment and a relatively long time, perhaps five to 10 years, a
school can fully implement a given whole school reform (Desimone, 2002). In general,
CSRs are difficult to implement because they involve tremendous buy-in from everyone
involved: administrators, teachers, other staff, parents, and students. A CSR may not have
instantaneous effects; a meta-analysis of 29 studies of CSRs suggested that the strongest
effects of these programs are typically seen after at least five years of implementation
(Borman, Hewes, et al., 2003). If a decision maker needs or expects a “quick fix,” a CSR
could be a frustrating solution. For teachers, too, the process of adopting a CSR could be
stressful, as implementation within their own classroom could be a personal and
emotional process (Schmidt & Datnow, 2005).
A successful CSR works on so many areas that looking at a single outcome or
group of outcomes cannot provide an accurate view of all of the ways in which a reform
has enhanced effectiveness or productivity (Levin, 2002b). It would not be possible, for
61
example, to measure changes in a school’s overall productivity by looking only at reading
outcomes, or even by looking only at academic measures such as all standardized test
results. Presumably a whole school reform that requires substantial buy-in, ongoing
training, and family support could affect many kinds of non-academic outcomes. Even
given SFA’s major focus on reading, Levin (2002) cautions that “any attempt to limit
effectiveness studies to a single objective will be suspect as an overall assessment of
effectiveness of the reform model.” Nonetheless, this thesis focuses on reading outcomes
for SFA to ensure comparability with the outcomes of other programs in the study.
The federal government has offered substantial support to school leaders to
introduce whole school reforms, particularly by expansions to Title I legislation in 1988
and 1994 and 1997’s Comprehensive School Reform Demonstration (CSRD) program.
This provides an incentive for decision makers to consider implementing whole school
reforms. Since the 1990s, whole school reforms have focused on improvements to
teaching and learning, to changing the “structure and organization” of schools, and to
changing how and perhaps by whom content is delivered. Legislation such as No Child
Left Behind (NCLB) emphasizes test preparation and achievement test scores, and likely
has an impact on the kind of whole school reform a decision maker can consider.
Summary
This chapter provided an overview of the WWC and its methods, as well as the
rationale for working with WWC-approved programs in the analysis. The chapter also
provided details about each of the four programs. Three of the programs – Accelerated
Reader, Classwide Peer Tutoring, and Reading Recovery – are add-on reading programs.
62
Success for All is a whole school reform. The programs differ in terms of mode of
delivery, and also to whom services will be delivered. AR and CWPT are small add-ons
intended for a whole class, while RR is intended only for struggling first graders and SFA
is intended to restructure everything about a school.
This chapter is intended to contextualize the programs to help readers better
understand the choices faced by decision makers. For example, a decision maker who
believes in the restructuring process and prescriptive instructional format may be
interested in enacting the kind of implementation required by SFA. The program
descriptions should help to elucidate some of the issues in conducing a cost-effectiveness
analysis of reading programs that are intended to work upon the same outcomes, but use
very different methods to achieve this goal. Decision makers may have a variety of
reasons to prefer a specific kind of program, depending on their own setting. Some of the
decision making process may be political or rhetorical, but ultimately some portion of the
concerns must be based upon budgets. The next chapter begins the process of
determining relative cost effectiveness by measuring the costs of each program.
63
CHAPTER 3: COST EFFECTIVENESS ANALYSIS IN EDUCATION
By combining costs with information about effectiveness, the comparative nature
of cost-effectiveness analysis makes it a useful tool for those who may choose amongst
different interventions. This sort of analysis provides a way to compare outcomes in
terms of results adjusted for costs among alternatives that have “common objectives”
(Levin, 2002). A presentation of carefully estimated costs allows decision makers to
consider which alternatives they could afford given budget constraints; by combining
them with information about effectiveness, the decision maker is given information about
how to improve outcomes given a specific budget or how to reach a desired level of
effectiveness in the least costly manner (Levin & McEwan, 2001, p. 6). The ingredients
method and cost measurement will be fully described in Chapter 4, and effectiveness
measures will be fully described in Chapter 5. The next section of this chapter provides a
brief overview of the method.
Overview of Cost-Effectiveness Methodology
This section provides an overview of cost-effectiveness methodology. Cost-
effectiveness analysis is one type of cost analysis in education. Other kinds of analyses
include cost-benefit analysis, cost-utility analysis, and cost-feasibility analysis (Levin &
McEwan, 2001). Before defining and describing cost-effectiveness analysis, I present
brief descriptions of other kinds of cost analyses.
Cost-benefit analysis allows analysts “to evaluate alternatives according to their
costs and benefits when each is measured in monetary terms” (Levin & McEwan, 2001,
p. 11). Analysts must assign monetary values not only to the costs, but to all of the
64
benefits. Programs should be implemented only if benefits exceed costs (Levin &
McEwan, 2001). Some of those benefits, such as motivation, are difficult to measure.
When the benefits of a program would be hard to measure in monetary terms, cost-
benefit analysis may not be the right choice of methods.
Cost-utility analysis uses the concept of utility, or value, to order alternatives
according to individuals’ preferences (Levin & McEwan, 2001). A common measure in
cost-utility analysis is the QALY, or quality adjusted life year. Often used in health, this
measure implies that improvements in health outcomes are associated with some quality
measure. Two different interventions could add the same number of years to a person’s
life, but one of the interventions might permit a better quality of life (Levin & McEwan,
2001).
Cost-feasibility analysis, unlike the other analyses described, relies only on the
thorough calculation of costs. If the costs exceed the allocated budget or resources, there
is no reason to analyze the program further (Levin & McEwan, 2001).
Cost-effectiveness analysis involves the comparison of alternative programs or
interventions affecting the same outcome to one another. As the name suggests, analysts
examine both costs and effectiveness to determine “which program or intervention
provides the most effectiveness (on a single criterion measure) at the lowest cost” (White,
Alpers, DiPerna, et al., 2004). To conduct a rigorous cost-effectiveness analysis, careful
attention must be paid both to cost and effectiveness measures. This section provides an
overview of a rigorous cost-effectiveness analysis in education. This summary provides
context for understanding the relative quality of existing cost-effectiveness studies about
the reading programs, but is not intended to be exhaustive (see Chapter 5).
65
Cost-effectiveness analysis must begin with the identification of a problem. For
example, a decision maker may wish to introduce a program or intervention to improve
students’ test scores in reading. Although a decision maker may wish to implement the
most effective program, he or she is likely constrained by a budget – a limited amount of
money and resources that can be spent on any new program. The results of a cost-
effectiveness analysis may provide decision makers with new information to help the
selection process. To conduct the analysis after identifying the problem, the analyst must
identify alternatives that are intended to work on the same outcome. In the case of the
example scenario, the analyst could look for programs or interventions with evidence of
improving test score performance in reading. All programs that could satisfy the decision
maker’s needs, even politically unpopular ones, should be included in the analysis (Levin
& McEwan, 2001).
Once programs with “evidence” have been identified, the nature and extent of this
evidence should be carefully evaluated. Chapter 2 provided some information about
assessing evidence in educational research and evaluation studies in the context of WWC
decision rules; Chapter 5 will provide more detailed information in the context of
effectiveness measures used in this study. As was described earlier, experimental work is
regarded as a gold standard. If subjects are randomly assigned to treatment and control
groups, on average they will be the same on important baseline characteristics. Then,
posttest differences between the groups can be attributed to the intervention.
Experimental research is seen less frequently in education research than in other fields,
such as public health (Cook, 2002; see Chapters 2 and 5). Quasi-experimental work in
which treatment and comparison groups are shown to be equivalent at baseline on a
66
number of measures may provide appropriate evidence of program effects. It is possible
to use results from one very well-conducted study as an effectiveness measure, or to
combine results using statistical techniques to create a composite effect size.
The first step in the analysis is to describe all of the resources that are used to
implement the intervention. These resources do not include only those for which schools
have made a cash outlay, but also resources that are used within a school that could have
been put to other uses. For example, even if a classroom already had a computer, it
should be included in this list of resources if it is to be used in the intervention. In the
absence of the intervention, the computer could have been used for other purposes, by
other students, or by other school personnel. If resources are donated to the school, those
resources must be included in the list too, and costs eventually determined for them.
It may seem complicated to determine all of the different resources used to
implement an intervention, but the ingredients method provides analysts with a
systematic, thorough way of thinking about the elements to include. This thorough
accounting of resources will allow decision makers to ascertain whether it would be
feasible to introduce the program in their own context (Levin & McEwan, 2001). The
method facilitates a complete list of all of the elements and resources that go into
implementing an intervention. Analysts must consider all of the resources to enact a
particular intervention, and they should only consider the additional resources required to
provide the program in addition to regular school services (Levin & McEwan, 2001).
Using the method, ingredients fall under a few broad categories: personnel, facilities,
equipment/materials, other inputs (those that do not fit in to the first three categories), and

67
client inputs (transportation, program fees). More information about the ingredients
method and the categories of ingredients is contained in Chapter 4.
Once a comprehensive resource list has been prepared, a total cost can be
calculated that will give decision makers a complete view of what is required to introduce
the intervention. Costs are not simply defined as prices or budget items. To measure costs
fully, the concept of opportunity cost must also be considered. That is, each time we use a
resource for a given purpose, we could not use it for any other purpose. If we use a
classroom to provide reading tutoring, we could not use it for pre-kindergarten,
mathematics classes, rent it to someone else, or put it to any other use. When calculating
costs for a cost-effectiveness study, analysts must consider all of the resources that have
been put to use by the intervention and determine what price they could have commanded
if put to their second-best use.
Prices must be assigned to each of the ingredients used in the program. These
prices, added together, will equal the program’s total cost. Many ingredients will have
market prices, and when that is the case they should be used. For example, the price of a
teacher’s time can be considered his or her salary plus benefits (Levin & McEwan, 2001),
divided by the relevant number of hours. For other ingredients – Levin and McEwan
(2001) use the example of calculating the cost of a facility such as a school building –
there is no market to set prices that determine the cost. For these kinds of ingredients,
analysts could research estimates such as the cost to lease a similar space or calculate the
interest and rent foregone. In cases where the analyst will be using results from existing
effectiveness studies, he or she should examine the work to determine the ingredients
used for the specific implementation(s).
68
Once costs and effectiveness measures have been prepared, relative cost-
effectiveness is determined by calculating cost-effectiveness ratios – generally effect size
divided by costs to show the amount of effectiveness gained per unit of cost (Levin &
McEwan, 2001). The highest ratio among alternatives may be of particular interest to a
decision maker who wishes to implement the most cost-effective program amongst
alternatives, but should not be the only factor driving a decision. Also, sensitivity analysis
assists in dealing with uncertainty by testing plausible assumptions that may modify the
estimates of costs and effects. By changing a key assumption or assumptions, analysts
can test whether cost-effectiveness ratios change. Should results change after conducting
a sensitivity analysis, then analysts and decision makers would have to consider which
options are the most reasonable as they ponder how best to interpret the results.
To summarize the information from this section of the chapter, Table 6 lists the
steps that must be taken to conduct a high-quality cost-effectiveness study in the first
column, and then explains further what is to be done.
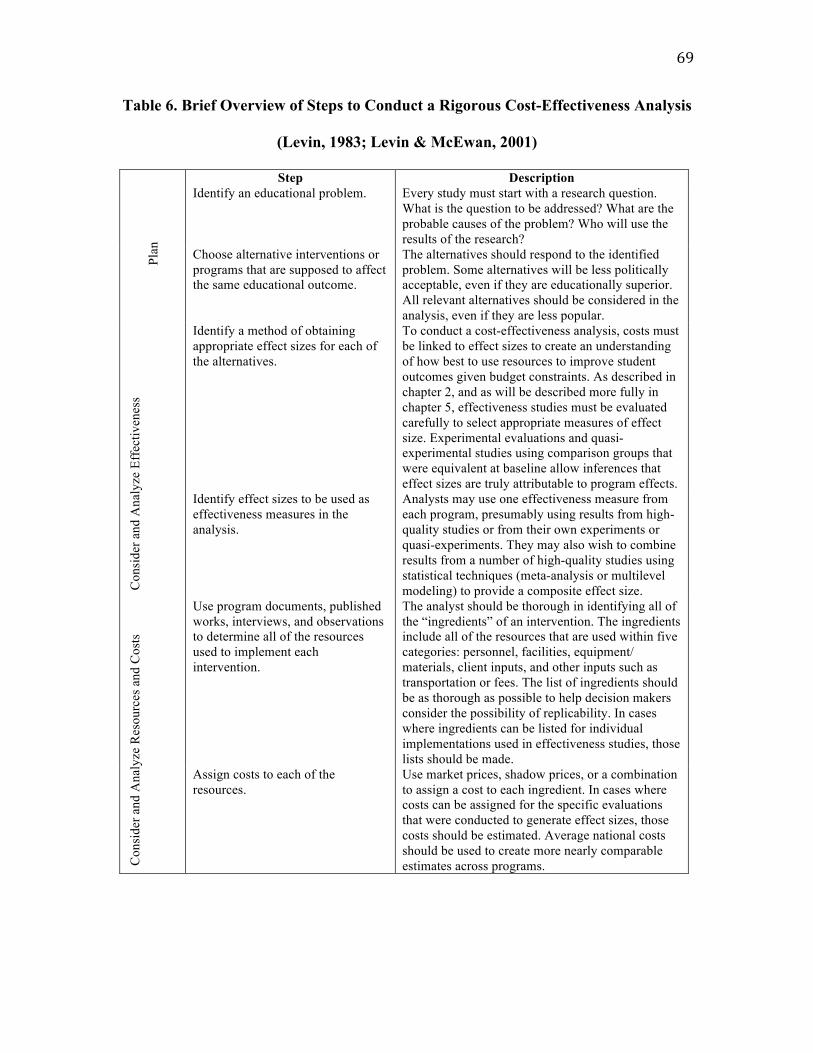
69
Table 6. Brief Overview of Steps to Conduct a Rigorous Cost-Effectiveness Analysis
(Levin, 1983; Levin & McEwan, 2001)
Step Description Identify an educational problem. Every study must start with a research question.
What is the question to be addressed? What are the probable causes of the problem? Who will use the results of the research?
Plan
Choose alternative interventions or programs that are supposed to affect the same educational outcome.
The alternatives should respond to the identified problem. Some alternatives will be less politically acceptable, even if they are educationally superior. All relevant alternatives should be considered in the analysis, even if they are less popular.
Identify a method of obtaining appropriate effect sizes for each of the alternatives.
To conduct a cost-effectiveness analysis, costs must be linked to effect sizes to create an understanding of how best to use resources to improve student outcomes given budget constraints. As described in chapter 2, and as will be described more fully in chapter 5, effectiveness studies must be evaluated carefully to select appropriate measures of effect size. Experimental evaluations and quasi-experimental studies using comparison groups that were equivalent at baseline allow inferences that effect sizes are truly attributable to program effects.
Con
side
r and
Ana
lyze
Eff
ectiv
enes
s
Identify effect sizes to be used as effectiveness measures in the analysis.
Analysts may use one effectiveness measure from each program, presumably using results from high-quality studies or from their own experiments or quasi-experiments. They may also wish to combine results from a number of high-quality studies using statistical techniques (meta-analysis or multilevel modeling) to provide a composite effect size.
Use program documents, published works, interviews, and observations to determine all of the resources used to implement each intervention.
The analyst should be thorough in identifying all of the “ingredients” of an intervention. The ingredients include all of the resources that are used within five categories: personnel, facilities, equipment/ materials, client inputs, and other inputs such as transportation or fees. The list of ingredients should be as thorough as possible to help decision makers consider the possibility of replicability. In cases where ingredients can be listed for individual implementations used in effectiveness studies, those lists should be made.
Con
side
r and
Ana
lyze
Res
ourc
es a
nd C
osts
Assign costs to each of the resources.
Use market prices, shadow prices, or a combination to assign a cost to each ingredient. In cases where costs can be assigned for the specific evaluations that were conducted to generate effect sizes, those costs should be estimated. Average national costs should be used to create more nearly comparable estimates across programs.
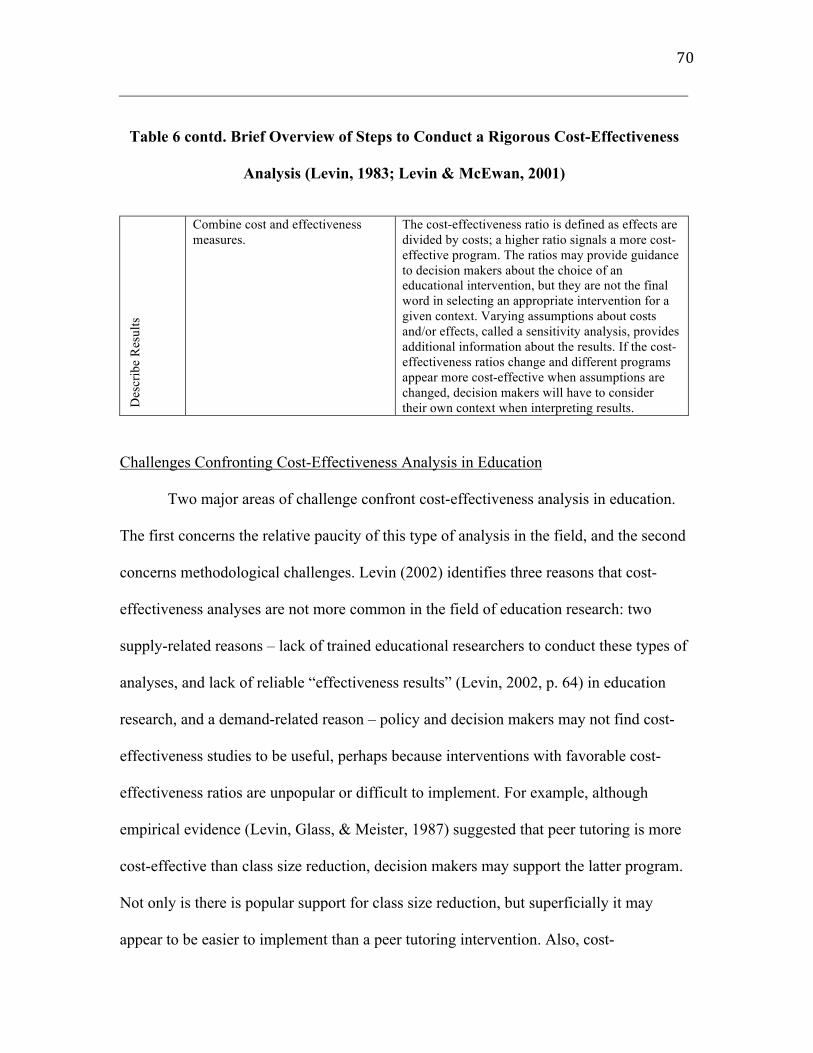
70
Table 6 contd. Brief Overview of Steps to Conduct a Rigorous Cost-Effectiveness
Analysis (Levin, 1983; Levin & McEwan, 2001)
Des
crib
e R
esul
ts
Combine cost and effectiveness measures.
The cost-effectiveness ratio is defined as effects are divided by costs; a higher ratio signals a more cost-effective program. The ratios may provide guidance to decision makers about the choice of an educational intervention, but they are not the final word in selecting an appropriate intervention for a given context. Varying assumptions about costs and/or effects, called a sensitivity analysis, provides additional information about the results. If the cost-effectiveness ratios change and different programs appear more cost-effective when assumptions are changed, decision makers will have to consider their own context when interpreting results.
Challenges Confronting Cost-Effectiveness Analysis in Education
Two major areas of challenge confront cost-effectiveness analysis in education.
The first concerns the relative paucity of this type of analysis in the field, and the second
concerns methodological challenges. Levin (2002) identifies three reasons that cost-
effectiveness analyses are not more common in the field of education research: two
supply-related reasons – lack of trained educational researchers to conduct these types of
analyses, and lack of reliable “effectiveness results” (Levin, 2002, p. 64) in education
research, and a demand-related reason – policy and decision makers may not find cost-
effectiveness studies to be useful, perhaps because interventions with favorable cost-
effectiveness ratios are unpopular or difficult to implement. For example, although
empirical evidence (Levin, Glass, & Meister, 1987) suggested that peer tutoring is more
cost-effective than class size reduction, decision makers may support the latter program.
Not only is there is popular support for class size reduction, but superficially it may
appear to be easier to implement than a peer tutoring intervention. Also, cost-
71
effectiveness studies impose a constraint upon decision makers. The presence of cost-
effectiveness results suggests that decision makers may have to justify their decision.
Levin raises other issues regarding the comparison of alternatives with similar
educational objectives. For example, the design used to generate effectiveness measures
must be considered. This includes considerations about the sample, particularly in terms
of variables that are not measured or would be very difficult to measure properly –
required staff buy-in may differ among interventions, and staff at schools undergoing a
whole school reform may be more “energized” than staff at schools in which a similar
reform is not being enacted (Levin 2002b, p. 11).
Programs are most likely implemented differently in various schools, another
challenge to measuring costs. Resource use as described by a program developer is most
likely a best-case scenario, whereas effectiveness studies likely describe real-world,
imperfect implementations. Some resources recommended by the program developers
(e.g., volunteers or specific kinds of space) may be impossible to find and schools
implementing the programs will have to find other solutions. Chapter 4, which describes
costs, attempts to deal with this issue by presenting standard costs for each program.
Existing Cost-Effectiveness Analyses of Reading Programs in the Study
Framework for Considering Existing Cost-Effectiveness Analyses
This section details existing cost-effectiveness studies of the reading programs in
this study, and discusses the results and limitations of existing work. Cost-effectiveness
analysis in education is somewhat rare, and where it has been conducted it is often
methodologically weak. King Rice (1997), Clune (1999; as cited by Levin & McEwan,
72
2002) and Levin (2001) examined the quality of published cost-effectiveness analyses in
education. All three studies determined that much of the published work in this area was
not rigorous. Cost measures were often simple, including only costs that would appear in
a budget; other critical components, such as opportunity costs, were often excluded. Ross
et al. (2007) examined the quality of cost studies in education and found that
approximately one-third (31 of 103) of the cost studies they found met minimal criteria –
“a credible design for assessing program effects, they provided data on costs and benefits,
and they related costs and benefits using a defensible procedure” (Ross et al., 2007, p.
481). Further, they determined that only five evaluations met all of their criteria, and that
three of those evaluations were written by a single researcher. Ross et al (2007) found
that few cost studies in education discounted costs or included a sensitivity analysis,
limiting the quality of the findings. Also, existing cost-effectiveness studies may be
limited by the quality of effectiveness measures of an educational program.
Clune (2002) examined a sample of studies using the term “cost-effectiveness” in the
ERIC database, and classified them within four categories:
1. Rhetorical studies, which use the term “cost-effective” but do not actually
measure costs or effectiveness.
2. Minimal studies, which may list some costs and cite effectiveness research.
3. Substantial studies, which provide substantial cost and effectiveness data but
with mistakes (such as using budgets or subjective ratings, or lacking data to
calculate cost-effectiveness for alternatives).
73
4. Plausible studies, which use the ingredients or resource cost method and compare
the program to alternatives.
After identifying 541 abstracts whose outcomes concerned K-12 education and
assigning each a category based on the classification above, Clune found that 83% of
cost-effectiveness studies were rhetorical or minimal, and that just 17% represented a
substantial or plausible cost-effectiveness analysis. The rest of this chapter describes
existing cost-effectiveness analyses of the reading programs in the study – one of AR,
two of RR and one of SFA – that included the term “cost-effectiveness” in their titles. No
cost-effectiveness studies of Classwide Peer Tutoring were found. As might be expected
given Clune’s (2002) results, all of the existing work suggests that there is substantial
room for a rigorous cost-effectiveness analysis of early literacy interventions.
Existing Cost-Effectiveness Analyses of Accelerated Reader
Two cost-effectiveness analyses of AR have been published (Yeh, 2007; Yeh,
2009). In both studies, Yeh refers to AR as rapid formative assessment. He states that he
uses a pseudonym for the program to ensure that readers do not assume an affiliation with
the program or that program funds have paid for the research in any way (Yeh, 2009).
Between the two studies, he concludes that AR is far more cost effective than class size
reduction, increasing per pupil expenditure, voucher programs, charter schools, and
increased accountability of school systems in the form of standardized tests.
In his earlier study (Yeh, 2007), Yeh compares AR to four educational
alternatives: increasing per pupil expenditure by 10%, voucher programs, charter schools,
and increased accountability via test development and administration. He attempts to use

74
the ingredients method for AR and determines that AR can be provided at a cost of $22
per student or $28 per student if the opportunity cost of teacher training time is taken into
account. These costs seem extremely low because the following ingredients are not
accounted for: hours spent in training, ongoing observations, time spent supervising
students, time spent evaluating student results; use of computers; and librarian or other
personnel time spent to update library books to include AR book levels. Yeh varies his
cost assumptions to conduct two sensitivity analyses. In both cases, the costs that are
varied should have been included in the initial estimate of costs.
In the first sensitivity analysis, Yeh assumes that one computer per classroom
would be sufficient to administer AR quizzes. This assumption understates costs because
only one student may use the computer at a time to take a quiz. If each classroom
provided students access to just one computer, quiz administration for the entire class
would require a prohibitive amount of time and would take students away from other
instruction and subjects. If other computers (e.g., in libraries or computer labs) are to be
used for the intervention, then the cost of the computers must be included. In the second
sensitivity analysis, Yeh assumes that teachers must spend some time related to AR,
perhaps to grade or review data. Again, this cost should have been included in initial
estimates. Yeh assumes teachers spend 15 minutes per day for the entire class, but does
not state how that number was calculated or chosen.
Yeh (2007) does not attempt to use the ingredients method to determine the costs
of the other four programs, instead offering quick calculations based on numbers
published by places like the National Center for Education Statistics (NCES). Further, the
75
quality of studies used to generate effect sizes for the cost-effectiveness ratios is not
discussed.
In a second cost-effectiveness analysis, Yeh (2009) compares AR to one
alternative, class size reduction. This time, Yeh uses the same cost estimate of AR that
was used in his earlier paper (Yeh, 2007) and simply refers readers to the earlier paper if
they are interested in details about cost calculations. He uses estimates of class size
reduction that were calculated by RAND. The effect size measures Yeh uses for class
size reduction are drawn from the Project STAR natural experiment in Tennessee and
two additional attempts in California and Wisconsin. He determines that all three class
size reduction studies used to generate effectiveness measures employed more restrictive
policies than RAND’s class size reduction estimates. He decides to use the more
expensive cost estimate generated by RAND anyway, and calls it an upper bound of the
cost-effectiveness of class size reduction. This would appear to be a mismatch between
the costs of class size reduction and the effect size measures, and it is not clear why Yeh
proceeds with the estimates. Ultimately, he determines that AR is the more cost-effective
alternative, but costs are not measured thoroughly and the quality of studies used to
generate the effect size measures is not addressed.
The table below provides an overview of both cost-effectiveness studies
conducted by Yeh and summarizes the issues with each in the last row. As the detailed
summaries in this section suggest, neither one of these studies represents a rigorous effort
to determine the relative cost-effectiveness of AR.
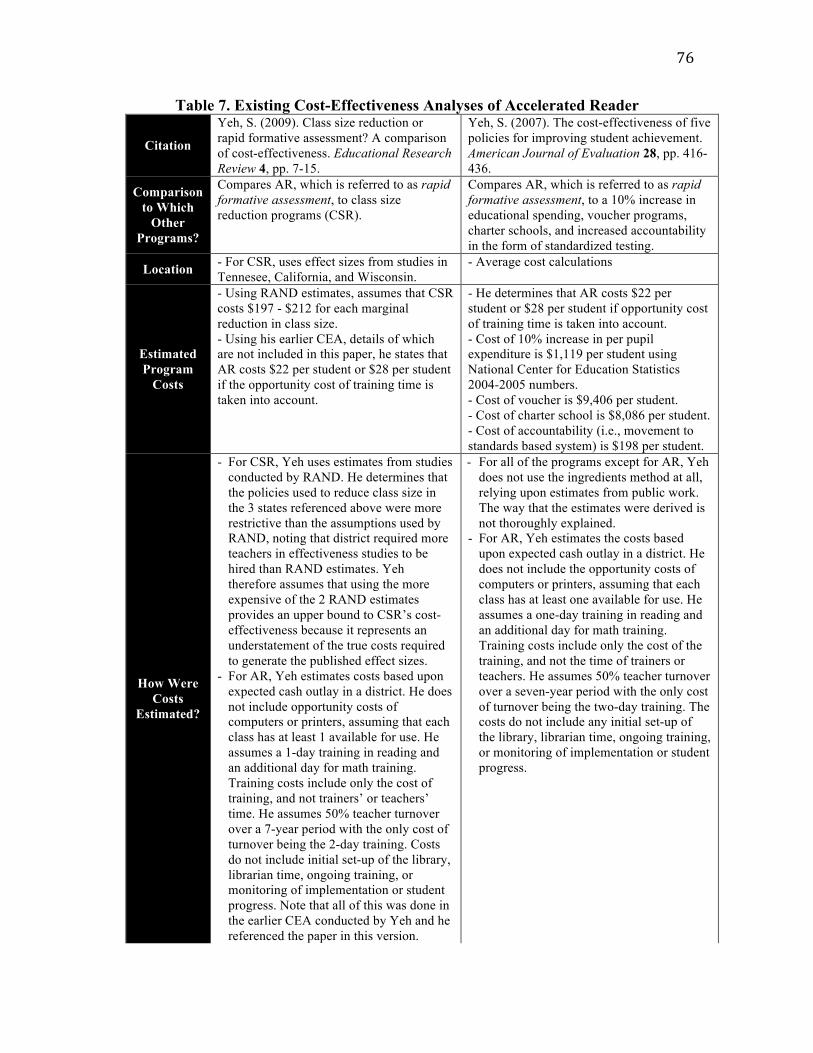
76
Table 7. Existing Cost-Effectiveness Analyses of Accelerated Reader
Citation
Yeh, S. (2009). Class size reduction or rapid formative assessment? A comparison of cost-effectiveness. Educational Research Review 4, pp. 7-15.
Yeh, S. (2007). The cost-effectiveness of five policies for improving student achievement. American Journal of Evaluation 28, pp. 416-436.
Comparison to Which
Other Programs?
Compares AR, which is referred to as rapid formative assessment, to class size reduction programs (CSR).
Compares AR, which is referred to as rapid formative assessment, to a 10% increase in educational spending, voucher programs, charter schools, and increased accountability in the form of standardized testing.
Location - For CSR, uses effect sizes from studies in Tennesee, California, and Wisconsin.
- Average cost calculations
Estimated Program
Costs
- Using RAND estimates, assumes that CSR costs $197 - $212 for each marginal reduction in class size. - Using his earlier CEA, details of which are not included in this paper, he states that AR costs $22 per student or $28 per student if the opportunity cost of training time is taken into account.
- He determines that AR costs $22 per student or $28 per student if opportunity cost of training time is taken into account. - Cost of 10% increase in per pupil expenditure is $1,119 per student using National Center for Education Statistics 2004-2005 numbers. - Cost of voucher is $9,406 per student. - Cost of charter school is $8,086 per student. - Cost of accountability (i.e., movement to standards based system) is $198 per student.
How Were Costs
Estimated?
- For CSR, Yeh uses estimates from studies conducted by RAND. He determines that the policies used to reduce class size in the 3 states referenced above were more restrictive than the assumptions used by RAND, noting that district required more teachers in effectiveness studies to be hired than RAND estimates. Yeh therefore assumes that using the more expensive of the 2 RAND estimates provides an upper bound to CSR’s cost-effectiveness because it represents an understatement of the true costs required to generate the published effect sizes.
- For AR, Yeh estimates costs based upon expected cash outlay in a district. He does not include opportunity costs of computers or printers, assuming that each class has at least 1 available for use. He assumes a 1-day training in reading and an additional day for math training. Training costs include only the cost of training, and not trainers’ or teachers’ time. He assumes 50% teacher turnover over a 7-year period with the only cost of turnover being the 2-day training. Costs do not include initial set-up of the library, librarian time, ongoing training, or monitoring of implementation or student progress. Note that all of this was done in the earlier CEA conducted by Yeh and he referenced the paper in this version.
- For all of the programs except for AR, Yeh does not use the ingredients method at all, relying upon estimates from public work. The way that the estimates were derived is not thoroughly explained.
- For AR, Yeh estimates the costs based upon expected cash outlay in a district. He does not include the opportunity costs of computers or printers, assuming that each class has at least one available for use. He assumes a one-day training in reading and an additional day for math training. Training costs include only the cost of the training, and not the time of trainers or teachers. He assumes 50% teacher turnover over a seven-year period with the only cost of turnover being the two-day training. The costs do not include any initial set-up of the library, librarian time, ongoing training, or monitoring of implementation or student progress.
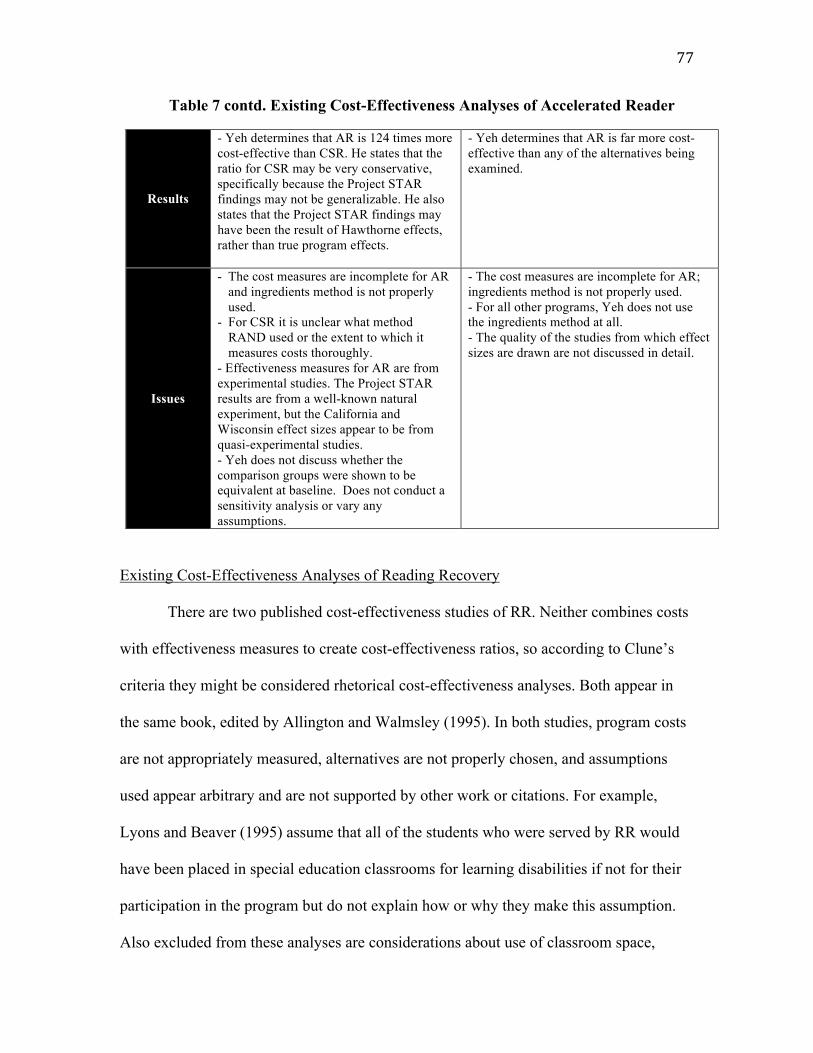
77
Table 7 contd. Existing Cost-Effectiveness Analyses of Accelerated Reader
Results
- Yeh determines that AR is 124 times more cost-effective than CSR. He states that the ratio for CSR may be very conservative, specifically because the Project STAR findings may not be generalizable. He also states that the Project STAR findings may have been the result of Hawthorne effects, rather than true program effects.
- Yeh determines that AR is far more cost-effective than any of the alternatives being examined.
Issues
- The cost measures are incomplete for AR and ingredients method is not properly used.
- For CSR it is unclear what method RAND used or the extent to which it measures costs thoroughly.
- Effectiveness measures for AR are from experimental studies. The Project STAR results are from a well-known natural experiment, but the California and Wisconsin effect sizes appear to be from quasi-experimental studies. - Yeh does not discuss whether the comparison groups were shown to be equivalent at baseline. Does not conduct a sensitivity analysis or vary any assumptions.
- The cost measures are incomplete for AR; ingredients method is not properly used. - For all other programs, Yeh does not use the ingredients method at all. - The quality of the studies from which effect sizes are drawn are not discussed in detail.
Existing Cost-Effectiveness Analyses of Reading Recovery
There are two published cost-effectiveness studies of RR. Neither combines costs
with effectiveness measures to create cost-effectiveness ratios, so according to Clune’s
criteria they might be considered rhetorical cost-effectiveness analyses. Both appear in
the same book, edited by Allington and Walmsley (1995). In both studies, program costs
are not appropriately measured, alternatives are not properly chosen, and assumptions
used appear arbitrary and are not supported by other work or citations. For example,
Lyons and Beaver (1995) assume that all of the students who were served by RR would
have been placed in special education classrooms for learning disabilities if not for their
participation in the program but do not explain how or why they make this assumption.
Also excluded from these analyses are considerations about use of classroom space,
78
estimates of teacher time including training and professional development, and teacher
trainers’ time.
Dyer and Binkney (1995) examine a school district in Ohio. They compare RR to
Chapter I services, consisting of pullout services for 35 minutes, three to five days a
week. That is the only “alternative” in the study, even though it is a program that is
already present in schools. They then include cost analyses of in-grade retention and
special education costs.
Dyer and Binkney do not use the ingredients method to calculate costs, relying
instead on average teacher salaries for the cost of RR, average special education teacher
salaries for the cost of special education, average per pupil expenditure for in-grade
retention, and quote a calculation from another paper as the cost of Chapter I services.
The authors mention the high cost of training RR teachers and teacher leaders, but decide
not to include training costs because the “ongoing costs” are the result of teacher salaries.
Chapter I services are cheaper than RR on an annual basis, $943 versus $2,063, but the
authors assume that Chapter I services must be provided for all five years of elementary
school without providing a basis for the assumption. Therefore, Chapter I is a more
expensive option. The effectiveness of RR, Chapter I, in-grade retention, and special
education are not examined. It is also unclear whether in-grade retention and special
education should be considered educational alternatives, or whether their prevention is a
kind of cost savings that should be included in a cost-benefit analysis of the program.
They do not present any cost-effectiveness ratios. In all, the term “cost-effectiveness”
appears to be used rhetorically rather than as a result of having applied a specific method.
79
Lyons and Beaver also examine in-grade retention and special education costs to
prognosticate about what would have happened in the absence of RR, even though there
are no comparison groups or research citations that suggest the likely educational
trajectory of a low-achieving reader who does not receive RR. The in-grade retention rate
dropped by half after the district introduced RR, so the authors attribute the decrease in
retentions to the intervention and to “good classroom instruction,” even though they do
not investigate other reasons why the in-grade retention rate could have changed (e.g.,
administrative effects, change in district policy about retention, specific kinds of changes
in classroom instruction, changes in student characteristics).
Approximately the same number of children were retained in the comparison
periods, 72 students between 1984 and 1987 and 63 students between 1987 and 1991,
even though grade one enrollment grew from 1,772 in the earlier period to 2,123 in the
later period. The reason for the change in the percentage of students retained in-grade is
unclear. The authors further assume that in the absence of RR, all of the children who
were served by the program would have been diagnosed with learning disabilities. They
assume that children who participate in RR and successfully complete the program will
never be retained or require special education services, even though they do not provide
evidence that progress made during RR is sustained over a number of school years. They
do not include any measures of progress, and do not examine any effectiveness measures.
The term “cost effectiveness,” again, appears to be rhetorical rather than methodological.
In these studies of RR, authors overstate the costs of special education. Placement
in special education classes for reading difficulties costs less than the average student’s
cost of special education. Reading difficulties will be less expensive than services for
80
moderate or severe disabilities, which are included in the averages. Presumably, many of
the students who participate in RR and wind up making adequate progress have a specific
learning disability, and do not have other disabilities as defined by the Individuals With
Disabilities Education Act (IDEA), such as orthopedic impairment, mental retardation,
multiple disabilities, or autism (SEEP, p. iv).
The Special Education Expenditure Project (SEEP) at the American Institutes for
Research (AIR) examined special education costs for a sample of 10,000 U.S. children in
1999-2000, representing 45 states and the District of Columbia. That year, the average
per pupil expenditure in regular classrooms was $6,556 (SEEP, p. 4). In a public school,
average special education costs for a specific learning disability such as reading failure
were approximately half of the average costs of special education for a child with
multiple disabilities -- $10,558 compared to $20,995. The average cost of special
education was calculated to be $12,525 (SEEP, p. 4), or $1,967 more than the average
cost of special education for a child with a specific learning disability. If special
education were a relevant outcome of interest, overestimating the cost of special
education by almost $2,000 per child is a substantial overstatement of costs. Also, the
average cost of special education for a child with a learning disability represents a point
estimate within a narrow confidence interval, $9,807 to $11,309 (SEEP, p. 5), implying
that children with specific learning disabilities receive similar services.
Table 8 describes the two studies of RR identified as “cost-effectiveness
analysis,” and provides details about their limitations.
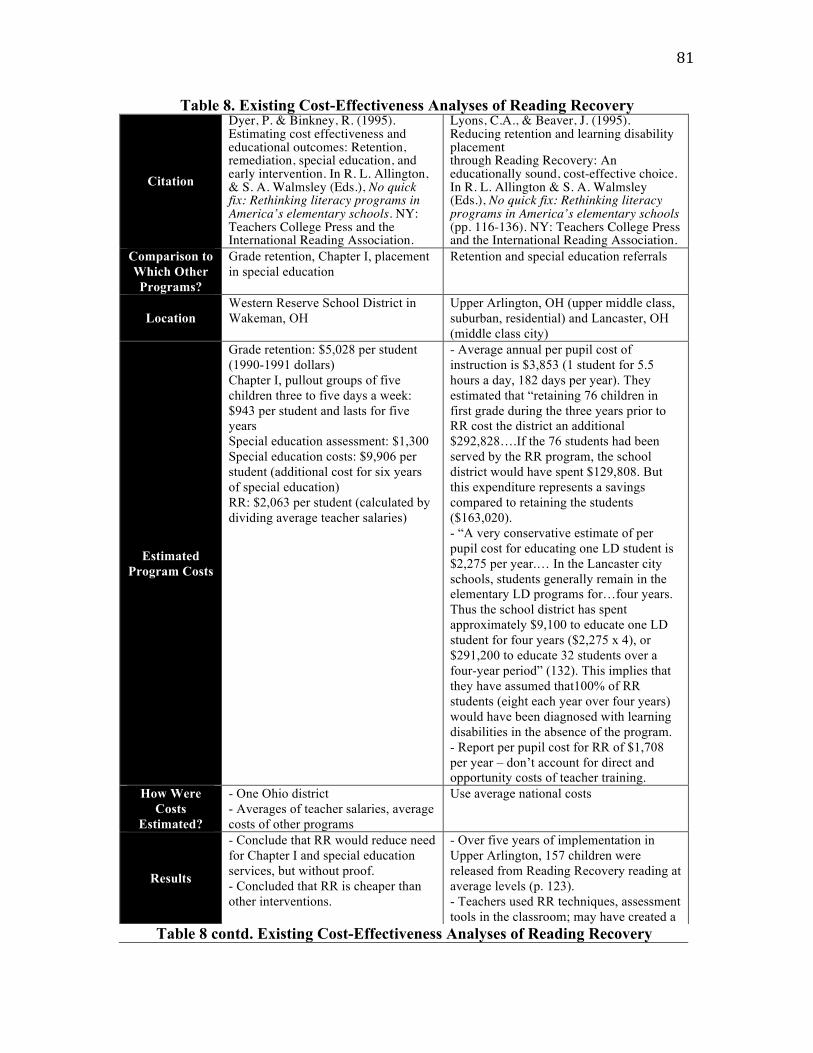
81
Table 8. Existing Cost-Effectiveness Analyses of Reading Recovery
Citation
Dyer, P. & Binkney, R. (1995). Estimating cost effectiveness and educational outcomes: Retention, remediation, special education, and early intervention. In R. L. Allington, & S. A. Walmsley (Eds.), No quick fix: Rethinking literacy programs in America’s elementary schools. NY: Teachers College Press and the International Reading Association.
Lyons, C.A., & Beaver, J. (1995). Reducing retention and learning disability placement through Reading Recovery: An educationally sound, cost-effective choice. In R. L. Allington & S. A. Walmsley (Eds.), No quick fix: Rethinking literacy programs in America’s elementary schools (pp. 116-136). NY: Teachers College Press and the International Reading Association.
Comparison to Which Other Programs?
Grade retention, Chapter I, placement in special education
Retention and special education referrals
Location Western Reserve School District in Wakeman, OH
Upper Arlington, OH (upper middle class, suburban, residential) and Lancaster, OH (middle class city)
Estimated Program Costs
Grade retention: $5,028 per student (1990-1991 dollars) Chapter I, pullout groups of five children three to five days a week: $943 per student and lasts for five years Special education assessment: $1,300 Special education costs: $9,906 per student (additional cost for six years of special education) RR: $2,063 per student (calculated by dividing average teacher salaries)
- Average annual per pupil cost of instruction is $3,853 (1 student for 5.5 hours a day, 182 days per year). They estimated that “retaining 76 children in first grade during the three years prior to RR cost the district an additional $292,828….If the 76 students had been served by the RR program, the school district would have spent $129,808. But this expenditure represents a savings compared to retaining the students ($163,020). - “A very conservative estimate of per pupil cost for educating one LD student is $2,275 per year.… In the Lancaster city schools, students generally remain in the elementary LD programs for…four years. Thus the school district has spent approximately $9,100 to educate one LD student for four years ($2,275 x 4), or $291,200 to educate 32 students over a four-year period” (132). This implies that they have assumed that100% of RR students (eight each year over four years) would have been diagnosed with learning disabilities in the absence of the program. - Report per pupil cost for RR of $1,708 per year – don’t account for direct and opportunity costs of teacher training.
How Were Costs
Estimated?
- One Ohio district - Averages of teacher salaries, average costs of other programs
Use average national costs
Results
- Conclude that RR would reduce need for Chapter I and special education services, but without proof. - Concluded that RR is cheaper than other interventions.
- Over five years of implementation in Upper Arlington, 157 children were released from Reading Recovery reading at average levels (p. 123). - Teachers used RR techniques, assessment tools in the classroom; may have created a
Table 8 contd. Existing Cost-Effectiveness Analyses of Reading Recovery
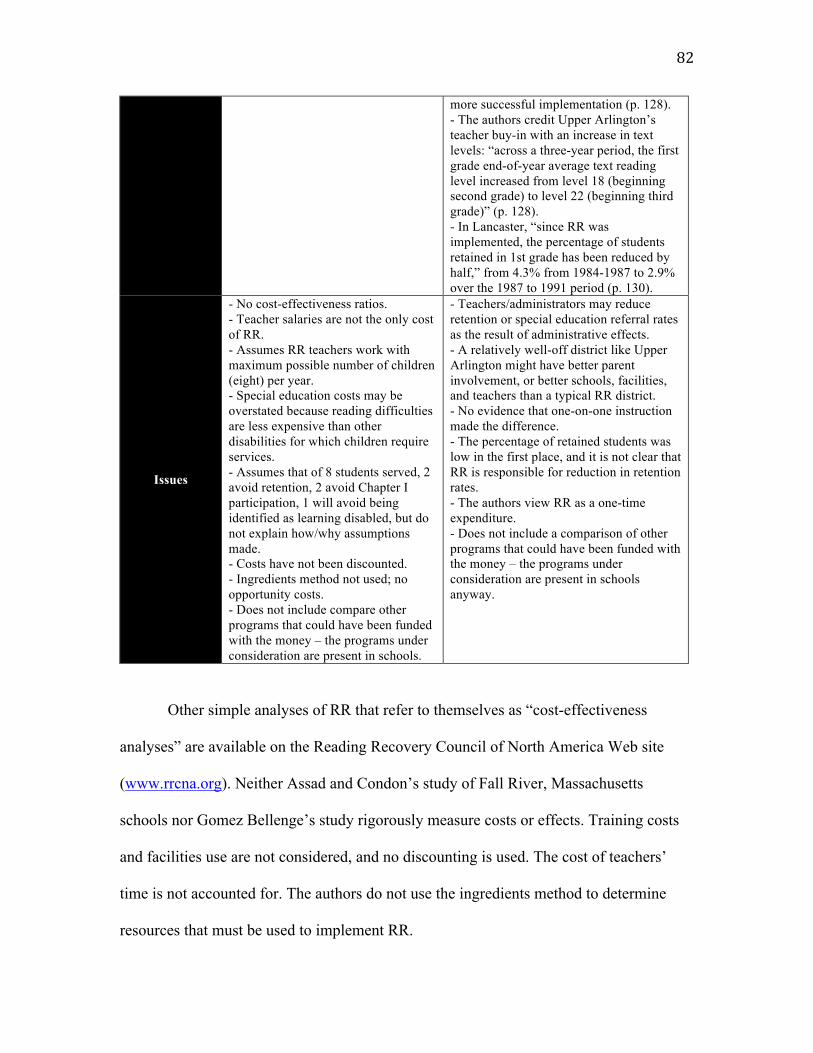
82
more successful implementation (p. 128). - The authors credit Upper Arlington’s teacher buy-in with an increase in text levels: “across a three-year period, the first grade end-of-year average text reading level increased from level 18 (beginning second grade) to level 22 (beginning third grade)” (p. 128). - In Lancaster, “since RR was implemented, the percentage of students retained in 1st grade has been reduced by half,” from 4.3% from 1984-1987 to 2.9% over the 1987 to 1991 period (p. 130).
Issues
- No cost-effectiveness ratios. - Teacher salaries are not the only cost of RR. - Assumes RR teachers work with maximum possible number of children (eight) per year. - Special education costs may be overstated because reading difficulties are less expensive than other disabilities for which children require services. - Assumes that of 8 students served, 2 avoid retention, 2 avoid Chapter I participation, 1 will avoid being identified as learning disabled, but do not explain how/why assumptions made. - Costs have not been discounted. - Ingredients method not used; no opportunity costs. - Does not include compare other programs that could have been funded with the money – the programs under consideration are present in schools.
- Teachers/administrators may reduce retention or special education referral rates as the result of administrative effects. - A relatively well-off district like Upper Arlington might have better parent involvement, or better schools, facilities, and teachers than a typical RR district. - No evidence that one-on-one instruction made the difference. - The percentage of retained students was low in the first place, and it is not clear that RR is responsible for reduction in retention rates. - The authors view RR as a one-time expenditure. - Does not include a comparison of other programs that could have been funded with the money – the programs under consideration are present in schools anyway.
Other simple analyses of RR that refer to themselves as “cost-effectiveness
analyses” are available on the Reading Recovery Council of North America Web site
(www.rrcna.org). Neither Assad and Condon’s study of Fall River, Massachusetts
schools nor Gomez Bellenge’s study rigorously measure costs or effects. Training costs
and facilities use are not considered, and no discounting is used. The cost of teachers’
time is not accounted for. The authors do not use the ingredients method to determine
resources that must be used to implement RR.
83
Both studies compare RR to an alternative of having no other intervention or
using Title I services only. When the studies compare students receiving RR to those who
did not receive an intervention, they do not actually compare groups based upon
effectiveness research. The studies do not examine effectiveness measures at all, focusing
instead on comparisons of costs. As described for Dyer and Binkney (1995) and Lyons
and Beaver (1995), the authors make arbitrary assumptions about referrals to special
education or use of Title I services. RR is not actually compared to another educational
alternative in any of the studies.
The studies about RR in this section have not properly applied the ingredients
method or combined costs with effectiveness measures. They do not compare RR to
educational alternatives, but instead try to make an argument about cost-savings. It would
not be appropriate to consider any of the existing work to be a cost-effectiveness analysis.
Cost-Effectiveness Analyses of Success for All
One cost-effectiveness analysis of SFA exists in the literature. Borman and Hewes
(2002) conducted compared SFA to Perry Preschool, Abecedarian preschool, and class
size reduction (Project STAR in Tennessee). Costs are estimated by using averages,
rather than determining program costs for actual implementations. The authors say that
they used the ingredients method to calculate costs for SFA, but the extent to which the
methodology has been applied is unclear. A summary table in the paper shows salary and
training costs, but does not account for facilities, equipment, materials, or any other costs.
They do not use the ingredients method for the other four programs, instead relying on
published calculations. The cost of class size reduction, for example, is extrapolated
84
using Levin, Glass, and Meister’s (1987) calculations converted into 2000 dollars. Costs
for the Abecedarian program and Perry Preschool are taken from two published studies,
and the method of measuring those costs is not discussed.
The authors conduct a quasi-experimental study to assess the effects of SFA. At
pretest, students in SFA schools had significantly lower scores than students in non-SFA
schools. The groups were not equivalent at baseline, suggesting that differences at
posttest cannot be attributed solely to the intervention. The authors show that, despite
losing approximately 60% of the sample due to missing data, attrition did not affect
pretest score distribution. The authors compare differential rates of in-grade retention and
special education placement between SFA and control schools. While 9% of SFA
students were retained by 8th grade, 23% of control students were retained. They also find
that SFA students spent 0.5 years in special education, compared to 0.8 years for the
control students. The authors do not note that differences in these outcomes may be the
result of administrative effects. Eighth grade scores suggest an advantage for SFA
students, with an effect size of 0.29 for reading. Effect sizes for the other programs were
taken from published studies, the quality of which is not discussed.
The results suggest that SFA is as cost-effective, if not slightly more so, than three
other well-publicized and well-researched interventions. For SFA, the authors calculate a
cost-effectiveness ratio of 0.09, compared to 0.07 for class size reduction and Perry
Preschool and 0.03 for the Abecedarian program. The study’s application is limited,
however, because readers do not know the method used to measure costs for each
program, and the eighth grade follow-up effect size for SFA are not based on groups that
were equivalent at the beginning of the study.
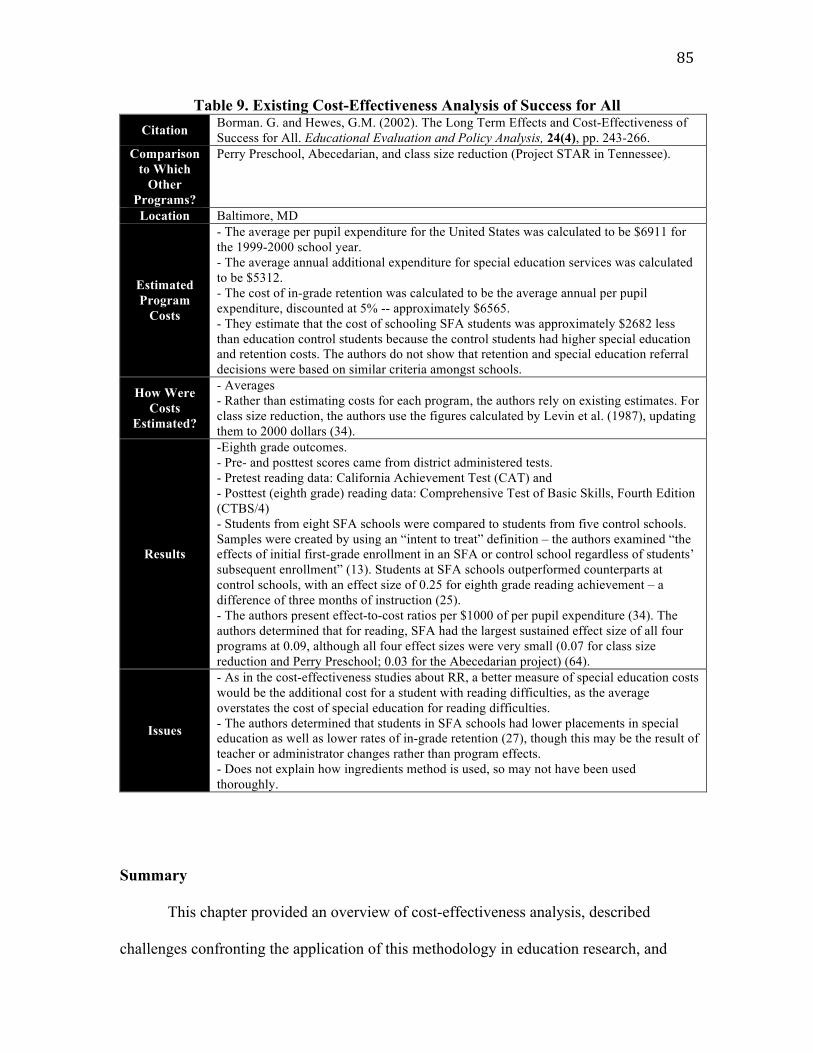
85
Table 9. Existing Cost-Effectiveness Analysis of Success for All Citation Borman. G. and Hewes, G.M. (2002). The Long Term Effects and Cost-Effectiveness of
Success for All. Educational Evaluation and Policy Analysis, 24(4), pp. 243-266. Comparison
to Which Other
Programs?
Perry Preschool, Abecedarian, and class size reduction (Project STAR in Tennessee).
Location Baltimore, MD
Estimated Program
Costs
- The average per pupil expenditure for the United States was calculated to be $6911 for the 1999-2000 school year. - The average annual additional expenditure for special education services was calculated to be $5312. - The cost of in-grade retention was calculated to be the average annual per pupil expenditure, discounted at 5% -- approximately $6565. - They estimate that the cost of schooling SFA students was approximately $2682 less than education control students because the control students had higher special education and retention costs. The authors do not show that retention and special education referral decisions were based on similar criteria amongst schools.
How Were Costs
Estimated?
- Averages - Rather than estimating costs for each program, the authors rely on existing estimates. For class size reduction, the authors use the figures calculated by Levin et al. (1987), updating them to 2000 dollars (34).
Results
-Eighth grade outcomes. - Pre- and posttest scores came from district administered tests. - Pretest reading data: California Achievement Test (CAT) and - Posttest (eighth grade) reading data: Comprehensive Test of Basic Skills, Fourth Edition (CTBS/4) - Students from eight SFA schools were compared to students from five control schools. Samples were created by using an “intent to treat” definition – the authors examined “the effects of initial first-grade enrollment in an SFA or control school regardless of students’ subsequent enrollment” (13). Students at SFA schools outperformed counterparts at control schools, with an effect size of 0.25 for eighth grade reading achievement – a difference of three months of instruction (25). - The authors present effect-to-cost ratios per $1000 of per pupil expenditure (34). The authors determined that for reading, SFA had the largest sustained effect size of all four programs at 0.09, although all four effect sizes were very small (0.07 for class size reduction and Perry Preschool; 0.03 for the Abecedarian project) (64).
Issues
- As in the cost-effectiveness studies about RR, a better measure of special education costs would be the additional cost for a student with reading difficulties, as the average overstates the cost of special education for reading difficulties. - The authors determined that students in SFA schools had lower placements in special education as well as lower rates of in-grade retention (27), though this may be the result of teacher or administrator changes rather than program effects. - Does not explain how ingredients method is used, so may not have been used thoroughly.
Summary
This chapter provided an overview of cost-effectiveness analysis, described
challenges confronting the application of this methodology in education research, and
86
reviewed existing cost-effectiveness analyses for three reading programs included in the
study. For the fourth program, Classwide Peer Tutoring, I was unable to find any cost-
effectiveness analyses. The existing cost-effectiveness studies did not properly apply the
ingredients method, or did not provide thorough information about the use of the method
to determine whether it was properly applied. Studies of RR do not compare the
intervention to alternatives, so that they should not be considered cost-effectiveness
analyses. Studies of AR and SFA make a more systematic attempt, but for both programs,
existing cost-effectiveness studies suffer from important weaknesses. A rigorous cost-
effectiveness analysis will provide new information about the choice of a cost-effective
reading program.
The next chapter describes the ingredients method in more detail and uses the
ingredients method to calculate costs for each program.
87
CHAPTER 4: MEASURING COSTS AND RESOURCE USE
This chapter describes the notion of costs in economics terms, as well as potential
issues to consider in cost measurement. It then provides a detailed overview the
ingredients method for determining resource use and measuring costs. Finally, the
method is applied to the four reading programs in the study to find average costs for one
year of implementation as well as per student costs for one year of implementation.
Defining Costs
In general, the public may think of costs as money spent or line items in a budget.
The economic definition of costs differs from that perception. In economics, costs are the
“value of sacrificed opportunities” that “are not synonymous with monetary outlays”
(Besanko & Braeutigam, 2009, p. 247). This concept is referred to as opportunity cost. In
every situation, choices exist for one’s money, time, or resources. When we choose one
alternative, we could not direct the money, time, or resource to any of the other
alternatives. Opportunity cost, then, is defined as the “payoff associated with the best of
alternatives not chosen” (Besanko & Braeutigam, 2010, p. 247).
Besanko and Brauetigam (2010) distinguish between explicit costs, which involve
a monetary outlay, and implicit costs, which do not. Implicit costs might include rent
foregone by not leasing part of a facility, or time spent by a teacher on a task like tutoring
a child in reading instead of conducting other classroom activities. Economic costs,
opportunity costs that include all implicit and explicit costs, are distinct from accounting
costs, which cover explicit costs made in the past (Besanko & Braeutigam, 2010, p. 250).
An accounting statement, which typically reviews previous years’ costs, would not
88
include the implicit costs required to implement a program. Similarly, budgets show
planned expenditures and provide some helpful information, but are insufficient to
calculate total costs of an educational program. Although it would seem intuitive to use
readily available budgets to calculate the total costs of a program, they will exclude
implicit costs. Budgets and accounting statements were not designed to calculate
economic costs, and may not be audited, so they will be incomplete for purpose of a cost-
effectiveness study. They are likely to lack information about “volunteers, donated items,
or “unpaid” inputs, and “resources that have already been paid for or are included in
another agency’s budget will not be accounted for” (Levin & McEwan 2001, p. 45), and
may not include amortized or “embedded costs” (Levin & McEwan, 2001, p. 45-46).
Some of the information that is likely to appear in a budget, such as an estimation of the
cost of a particular resource in a particular market, will be useful.
The opportunity cost of staff time is a critical, frequently overlooked implicit cost
of program implementation. Staff time includes not only time spent to prepare and
implement an intervention, but also any classes, training sessions, meetings, conferences,
or data entry and management. Aside from the teacher actually implementing the
program, other staff may be involved: for example, librarians, computer teachers,
principals, or paraprofessionals. The participation of existing personnel must be included
in cost estimates, because their time and effort could have been used for other purposes if
not for the program. Training and professional development costs must be included and
amortized. After determining volunteers’ if such personnel will be used, staff time spent
in that capacity must be accounted for as well. In another context, it may be impossible
for a principal to attract qualified volunteers, and so the costs of the personnel who have

89
volunteered must be included so that programs could be replicated using similar
resources (i.e., staff with similar experience, skills, and qualifications). Although the
prospect of determining all explicit and implicit costs sounds daunting, the ingredients
method facilitates cost estimation.
The Ingredients Method
Levin (1983) described a clear-cut way to account for all of the costs of an
intervention properly. Called the ingredients method, it illustrates a thorough way to list
all of the resources required to implement an intervention. All of the resources that must
be used to implement a program, including explicit and implicit costs, are referred to as
ingredients. The first step is to create a complete list of all of the ingredients required to
implement the intervention. The analyst will place values on the items – that is, assign
costs – after all of the ingredients have been listed thoroughly. Levin and McEwan (2001)
divide ingredients into five main areas: personnel, facilities, equipment and materials,
other inputs (e.g., insurance and phone service) and required client inputs (e.g.,
transportation, fees). This method requires that all ingredients have an associated cost;
even if the program developer or school does not pay for them, donated resources such as
facilities or volunteer time have a cost to someone (Levin, 1988). The table below
describes the five categories of ingredients and considerations to ensure an exhaustive list
of the resources used:
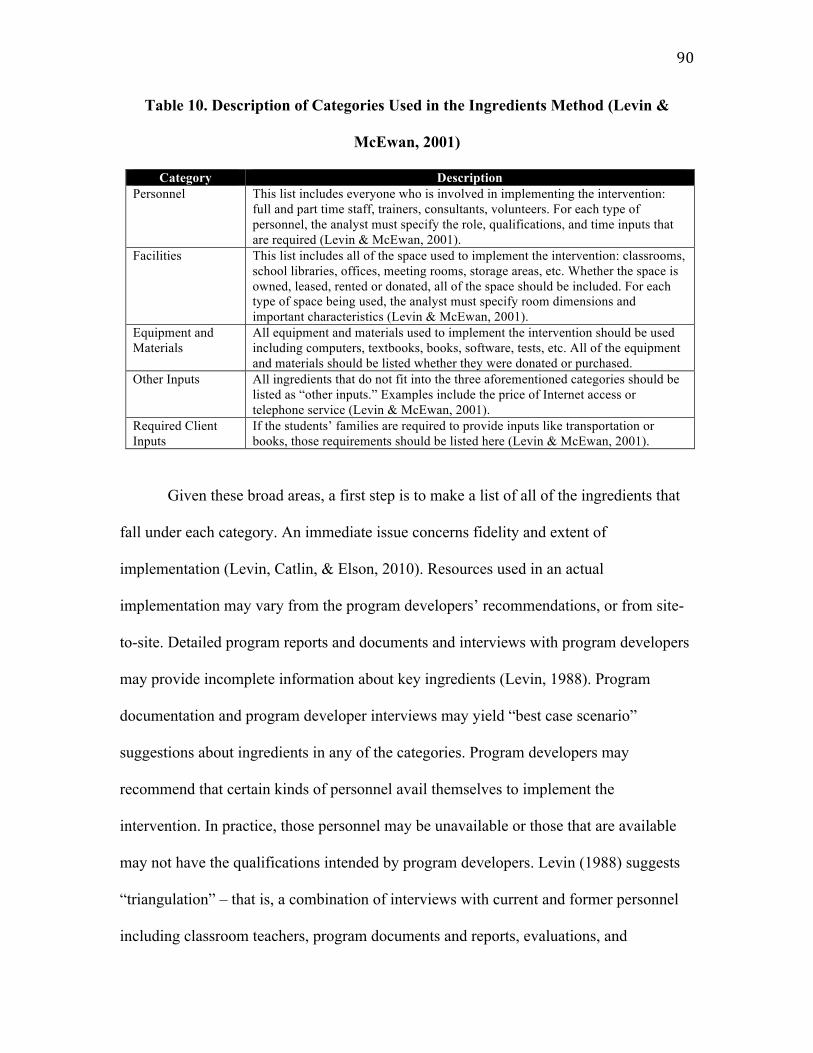
90
Table 10. Description of Categories Used in the Ingredients Method (Levin &
McEwan, 2001)
Category Description Personnel This list includes everyone who is involved in implementing the intervention:
full and part time staff, trainers, consultants, volunteers. For each type of personnel, the analyst must specify the role, qualifications, and time inputs that are required (Levin & McEwan, 2001).
Facilities This list includes all of the space used to implement the intervention: classrooms, school libraries, offices, meeting rooms, storage areas, etc. Whether the space is owned, leased, rented or donated, all of the space should be included. For each type of space being used, the analyst must specify room dimensions and important characteristics (Levin & McEwan, 2001).
Equipment and Materials
All equipment and materials used to implement the intervention should be used including computers, textbooks, books, software, tests, etc. All of the equipment and materials should be listed whether they were donated or purchased.
Other Inputs All ingredients that do not fit into the three aforementioned categories should be listed as “other inputs.” Examples include the price of Internet access or telephone service (Levin & McEwan, 2001).
Required Client Inputs
If the students’ families are required to provide inputs like transportation or books, those requirements should be listed here (Levin & McEwan, 2001).
Given these broad areas, a first step is to make a list of all of the ingredients that
fall under each category. An immediate issue concerns fidelity and extent of
implementation (Levin, Catlin, & Elson, 2010). Resources used in an actual
implementation may vary from the program developers’ recommendations, or from site-
to-site. Detailed program reports and documents and interviews with program developers
may provide incomplete information about key ingredients (Levin, 1988). Program
documentation and program developer interviews may yield “best case scenario”
suggestions about ingredients in any of the categories. Program developers may
recommend that certain kinds of personnel avail themselves to implement the
intervention. In practice, those personnel may be unavailable or those that are available
may not have the qualifications intended by program developers. Levin (1988) suggests
“triangulation” – that is, a combination of interviews with current and former personnel
including classroom teachers, program documents and reports, evaluations, and
91
observations in classrooms, of training sessions, and of meetings. This will allow the
analyst to create an average estimate of total costs. In cases where a specific effectiveness
study is being used, the analyst should try to determine the particular characteristics of
the intervention that was under review. This will prevent a mismatch of the effects of a
real-world implementation with costs that reflect a program developer’s ideal.
Assuming that all students will continue to receive typical school services, it is
necessary only to determine the costs of the additional ingredients of the intervention.
This is called marginal cost analysis and will be the method used in this study. All
ingredients should be listed as precisely as possible, and the most precise measurement of
costs should be for those ingredients that contribute the most to the intervention, such as
personnel costs.
Valuation of Ingredients
Once an exhaustive list of ingredients has been prepared, values must be placed
upon them using market or shadow prices (Levin & McEwan, 2001, p. 60-61). For some
ingredients, valuation may be straightforward. For other ingredients, the analyst must
consider different factors before ultimately assigning a value to an ingredient. When
considering the value of facilities or equipment, for example, the entire cost of the
machine or space cannot be attributed to a single year. Equipment and facilities are used
over time. To account for the use of these types of ingredients in a given year, we can
apply the concept of depreciation (Levin & McEwan, 2001).
Assets such as equipment must be depreciated over the length of time they are
used to generate outcomes, such as profit or improved test scores. In a simple scenario to

92
depreciate an asset, the analyst must know how long the equipment is to be used (or, its
estimated useful life), and subtract equal amounts each year over the estimated useful life
(Droms & Wright, 2010). If we assume that an item has an estimated useful life of five
years, will be worth nothing at the end of five years, and is worth $1,000 now, we would
subtract $200 each year. In addition to depreciation, though, we must consider the interest
rate that has been foregone because the resource was not invested or rented. Levin and
McEwan (2001) provide a table that annualizes the cost of a facility based upon the
chosen interest rate and the estimated useful life.
The Time Value of Money and Discount Rates
When an educational intervention lasts for more than one year, analysts must take
account of inflation, or the way in which prices rise over time. If costs are listed for the
years in which they were incurred, they are called nominal costs. When all costs have
been translated into a base year’s price level, they are called real costs (Levin &
McEwan, 2001). Levin and McEwan (2001) suggest using the Consumer Price Index
(CPI), a readily available resource, for the inflation rate.
Costs must be discounted because future costs are considered to be “less of a burden
than costs occurring in the present” (Levin & McEwan 2001, p. 90). Also, people have a
time preference for the present (Schotter, 2008, p. 272). Given an interest rate of r, if we
put money in the bank for a year, at the end of that year we would have our money times
(1+r). Thinking about the future, if we wanted to have X dollars in t years, we would
have to put X/(1+r)t today (Schotter, 2008, p. 272). To calculate the present value of a
93
future expenditure over a time period t, we use the formula PV = Cost/(1+r)t-1 (Levin &
McEwan, 2001, p. 92).
The equations in the preceding paragraph suggest that the value of the revenue stream
or present value of the future cost is dependent on r, the interest rate. It would seem
important, then, to choose an appropriate interest rate. A recent paper suggests that a
social discount rate of 3.5% is appropriate for projects that are not expected to have
effects beyond 50 years (Moore, Boardman, et al., 2004). They suggest that the lower and
upper bounds for this estimate are 2% and 5%, respectively (Moore, Boardman, et al.,
2004, p. 806). This estimate is based on the optimal growth rate method, which assumes
“the amount of public investment in order to maximize the well-being of society now and
in the future” (Moore, Boardman, et al., 2004, p. 795). The social discount rate, o, is
calculated as a function of d+ge, which is the discount rate plus growth in consumption
times “the absolute value of the rate at which the marginal value of that consumption
decreases as per capita consumption increases” (Moore, Boardman, et al., 2004, p. 796).
Using Moore, Boardman, et al.’s (2004) estimates, sensitivity analysis could include 2%
and 5%, with a discount rate of 3.5%. I prepared short-term cost analyses, one school
year, to most closely match the duration of follow-up in the effectiveness studies. Had the
duration of follow-up been longer in the studies, I would have had to consider the ways in
which cost distribution can change over time (Levin & McEwan, 2001, p. 94).
Application of the Ingredients Method for Reading Programs
This project used review of program documentation, evaluation reports, and a small
number of interviews to determine a full list of ingredients for AR, CWPT, RR, and SFA.
As described in the previous section, the first step was to create a list of ingredients for
94
each of the programs. This step required consideration of all of the resources required to
implement the program. At this step, the purpose of the list was to determine all of the
ingredients to be used. In all cases, it was necessary to review substantial number of
proposals, program documents, marketing pieces, and evaluation reports to determine
both ingredients and their use. To understand why, let us consider the example of staff
training when a new reading program is introduced. A program document may specify
that “training” is to occur, but is not particular about how many days the training will last,
who should attend, or who conducts the training. Another document may specify the
experience level of the trainer, and a third may specify the number of expected number of
days or hours of training.
For each program, I listed a number of ingredients. I divided the lists according to the
categories suggested by the ingredients method – personnel, facilities, equipment or
materials, other inputs, and client inputs. I listed each ingredient and then wrote out as
complete of a description as I could. For personnel, descriptions included the estimated
number of hours spent on the intervention, including training and implementation. For
facilities, the description included the size of the classroom or space and the number of
classrooms estimated to be required. For equipment, materials, and other inputs, I
described the estimated number of items required (e.g., for quizzes, computers, or books)
as well as explanations of each item.
After compiling the lists of ingredients, I contacted national program developers to
ask them to review their program’s list of ingredients for one year’s worth of
implementation. Program developers were asked to examine the list of ingredients and to
comment about its accuracy, but were not asked to consider, estimate, or verify costs. By
95
reviewing ingredients with the program developers, I intended to confirm that I had
understood requirements for an appropriate implementation of one year of the reading
program. This made sense because studies of AR, on average, had a one year follow-up
period; studies of RR had a longer follow-up period in some cases, but the intervention
can only be provided for up to 20 weeks in the first grade. For AR, CWPT, and RR, the
national program staff consented to review the list of resources via email. They reviewed
the ingredients, provided comments, and responded to additional questions. For SFA, the
national program developers would only state an estimated cost for a few years’ worth of
training and materials that did not appear to be supported by published work, so it was
necessary to rely on program documentation, evaluation reports, published articles, and
the SFA Foundation Web site. The lists that were shared with program developers are
presented in the appendix, because to some extent they differ from the ingredients lists
that were ultimately used to calculate program costs.
It is likely that the national program developers recommend ingredients that
constitute a best-case scenario, so it would have been instructive to understand
ingredients used in practice. When the program developers specified that “trained
volunteers” or “parents” would take on responsibility, for example, I wanted to know
whether and how many volunteers or parents were actually available for actual
implementations, whether the hours they availed themselves were similar to program
developer expectations, and the experience level of such personnel. I also wanted to learn
more about how actual implementations, such as the ones in the effectiveness studies,
differed from program developer expectations. Effectiveness studies used in the current
study often did not provide thorough descriptions of implementation. (For more
96
information about how those studies were chosen, see Chapter 5. The descriptions of the
implementations from each study will be presented following the tables outlining
resource use and costs.)
After receiving principals’ contact information, I was instructed or asked to contact
the school or program leaders via email but was initially asked not to call. For AR, two
principals’ names and email addresses were shared. For CWPT, the national program
staff shared two trainers’ names and email addresses. For RR, the national program staff
shared nine principals’ names and email addresses, and the teacher leader who responded
to my note also offered to talk about the program. For RR, I was given the names of
principals located in Massachusetts only, so themes elucidated from the interviews could
have been specific to that locale. For SFA, I received the names of two principals
implementing the program in their schools.
I had wished to conduct enough interviews to get a sense for themes and variations in
program implementation. Although it would have been prohibitively difficult to interview
enough school leaders to generate representative samples of the reading program
implementations, I thought that conducting at least five interviews for each program
would have allowed me to see trends in program implementation. Because I was unable
to obtain contact information for that many principals, and/or because principals did not
consent to be interviewed, I did not conduct more than two interviews per program. For
AR and SFA, both of the principals whose names I was given were willing to talk. For
CWPT, the trainers never responded to emails and the publishing company did not return
my phone calls after I left two messages. For RR, one principal and one teacher leader
from the list of nine were willing to talk. Another principal offered to make time “later,”
97
but never responded to additional phone calls or emails. The other principals did not
respond at all.
The national program staff selected the principals or school leaders that I could
contact, presumably leading to bias in the confirmed ingredients used (Levin and
McEwan 2002, p. 81). The rationale for choosing the names was not shared with me,
though I presumed that contact information would be provided for school leaders who
would serve as “references” for the programs. Given national program staff’s incentive to
provide contact information for those that would offer a positive review of the program, it
is likely that I talked to people who had higher quality implementations than the average.
I assumed that the principals and school leaders with whom I spoke were likely to over-
specify ingredients relative to typical implementation of each intervention. With the
limited information from a small number of interviews, it is hard to know the direction of
the bias in costs. There is no reason to assume that the schools led by principals who
participated in interviews are at all representative of average, or any, other schools who
use or have used the program. For example, the interviews could not shed light on how
geographic location or relative urbanicity may impact program implementation.
In terms of developing cost estimates from the ingredients lists, knowing that the
program developers would have provided information about successful implementations
does not help to predict the direction of total costs. It may be more expensive to
implement a program poorly, or it may be more expensive to implement it well. The
effectiveness literature usually does not make clear the extent or quality of program
implementations (see the description of ingredients and costs for each program for further
information about real world implementations). It would make sense that schools with
98
higher-quality implementations would be studied, and that program evaluators would not
seek to evaluate or publish results for poorly implemented programs. The minimal
number of interviews I conducted provides some anecdotal evidence, but it is not possible
to know whether the specific implementations were outliers. Additionally, when
principals did agree to be interviewed, they usually did not have time to answer all of the
questions in the interview guidelines so I could not gain a complete picture of the
implementation. The anecdotal evidence gained from the program interviews will be
detailed in the next section, which describes ingredients and costs for each program.
Once I had the names of school leaders, I tried to schedule interviews to last from 15-
30 minutes, depending on how much time the interviewee would agree to share. As the
national program staff had requested, I introduced myself and explained the project via e-
mail, the text of which is presented in the interview guidelines appendix. If a principal or
other leader did not respond to the first note I sent, I sent three follow-up emails, each
two weeks apart, to reintroduce my request and asked whether the principal or school
leader could spare any amount of time to respond to a few questions. I also tried to follow
up with phone calls when telephone numbers had been shared with me. Ultimately, two
interviews were conducted for AR and SFA; two were conducted for RR, one with a
teacher leader and one with a principal; and no interviews were conducted for CWPT.
For RR, three principals’ email addresses were given to me without a phone number and
six principals’ email addresses were given to me with phone numbers. I sent the emails to
all of the principals in RR schools and when I had phone numbers I also made a phone
call after three weeks to see if I could find the principals in their office or encourage a
response after leaving a message. I was able to leave two messages and did not receive
99
return phone calls. For CWPT, someone from the national program staff sent a note to
two trainers on my behalf. They did not respond to a request to contact me about real-
world implementations of the program.
For AR and SFA, the principals had been expecting my emails, and both were
responsive after the first email or after one reminder. For RR, one principal consented to
participate in an interview after the first email. Another principal responded to say that
she would have time later in the month, but she did not respond to additional emails or to
a phone call. Other principals did not respond to follow-up emails sent every two weeks
for six weeks’ time. When I had been given phone numbers and instructed to call before
8:30am, I called the principals (six principals). Otherwise, I relied on email
communication. For CWPT, the national program staff claimed that they did not have a
list of schools implementing the program, and directed me to the publisher of their
tutoring manual. I called the publisher and left a message. I received a return message
stating that they were not sure what I was asking about. I left another message and sent an
email and did not receive a response. The national program developer then emailed two
trainers asking them to get in touch with me if they were interested or had time. Neither
one of them responded to her or to me about the request.
Table 11 describes the contact information received and how many school leaders
responded.
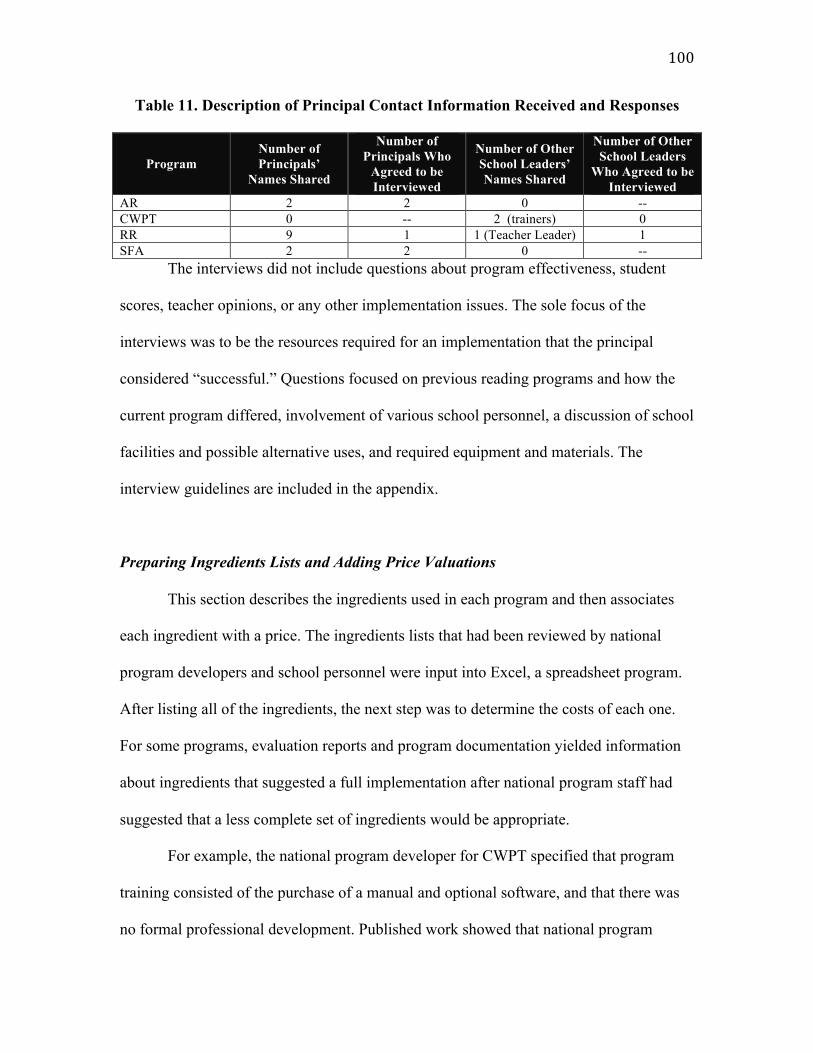
100
Table 11. Description of Principal Contact Information Received and Responses
Program Number of Principals’
Names Shared
Number of Principals Who
Agreed to be Interviewed
Number of Other School Leaders’ Names Shared
Number of Other School Leaders
Who Agreed to be Interviewed
AR 2 2 0 -- CWPT 0 -- 2 (trainers) 0 RR 9 1 1 (Teacher Leader) 1 SFA 2 2 0 --
The interviews did not include questions about program effectiveness, student
scores, teacher opinions, or any other implementation issues. The sole focus of the
interviews was to be the resources required for an implementation that the principal
considered “successful.” Questions focused on previous reading programs and how the
current program differed, involvement of various school personnel, a discussion of school
facilities and possible alternative uses, and required equipment and materials. The
interview guidelines are included in the appendix.
Preparing Ingredients Lists and Adding Price Valuations
This section describes the ingredients used in each program and then associates
each ingredient with a price. The ingredients lists that had been reviewed by national
program developers and school personnel were input into Excel, a spreadsheet program.
After listing all of the ingredients, the next step was to determine the costs of each one.
For some programs, evaluation reports and program documentation yielded information
about ingredients that suggested a full implementation after national program staff had
suggested that a less complete set of ingredients would be appropriate.
For example, the national program developer for CWPT specified that program
training consisted of the purchase of a manual and optional software, and that there was
no formal professional development. Published work showed that national program
101
developers had designed a method of fully implementing the program using proprietary
software, and involving principals, consultants, and teachers in professional development,
observations, and data analysis (Greenwood, Hou, et al., 2001). The ingredients list and
costs presented for CWPT will be based upon the full implementation using the software
program. Also, for Accelerated Reader the extent of recommended and actual training
was unclear based on national program developer and principal interviews.
Documentation from the state legislature of Nevada included a list of recommended
professional development and training for full implementation
(http://www.leg.state.nv.us/Division/fiscal/leBeape/2004report/3e-READING.html), which included 30
hours’ worth of professional development for teachers including training, observation,
and ongoing support, and six hours for the school librarian.
Valuing Ingredients
Costs are presented in 2007 dollars, since that is the most recent year for which
some of the Schools and Staffing data were available. Standard costs are used for each
ingredient so that total costs would not be sensitive to the location of particular
applications of the reading program. This helps make costs as comparable as possible,
especially since the effectiveness studies were conducted in various parts of the U.S.
where wages and real estate costs would differ. Assumptions were made for all four
programs to calculate hourly wages, per square foot costs of classroom space, years over
which training, software, and other materials were amortized, and discount rates:
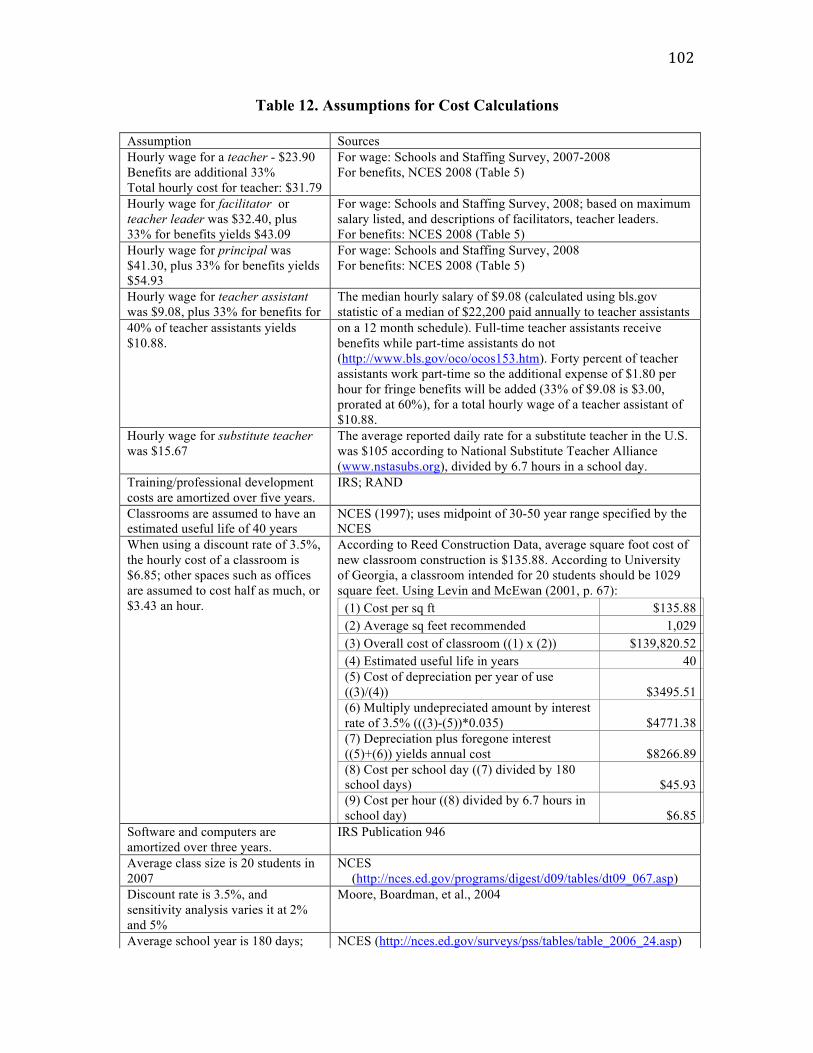
102
Table 12. Assumptions for Cost Calculations
Assumption Sources Hourly wage for a teacher - $23.90 Benefits are additional 33% Total hourly cost for teacher: $31.79
For wage: Schools and Staffing Survey, 2007-2008 For benefits, NCES 2008 (Table 5)
Hourly wage for facilitator or teacher leader was $32.40, plus 33% for benefits yields $43.09
For wage: Schools and Staffing Survey, 2008; based on maximum salary listed, and descriptions of facilitators, teacher leaders. For benefits: NCES 2008 (Table 5)
Hourly wage for principal was $41.30, plus 33% for benefits yields $54.93
For wage: Schools and Staffing Survey, 2008 For benefits: NCES 2008 (Table 5)
Hourly wage for teacher assistant was $9.08, plus 33% for benefits for
The median hourly salary of $9.08 (calculated using bls.gov statistic of a median of $22,200 paid annually to teacher assistants
40% of teacher assistants yields $10.88.
on a 12 month schedule). Full-time teacher assistants receive benefits while part-time assistants do not (http://www.bls.gov/oco/ocos153.htm). Forty percent of teacher assistants work part-time so the additional expense of $1.80 per hour for fringe benefits will be added (33% of $9.08 is $3.00, prorated at 60%), for a total hourly wage of a teacher assistant of $10.88.
Hourly wage for substitute teacher was $15.67
The average reported daily rate for a substitute teacher in the U.S. was $105 according to National Substitute Teacher Alliance (www.nstasubs.org), divided by 6.7 hours in a school day.
Training/professional development costs are amortized over five years.
IRS; RAND
Classrooms are assumed to have an estimated useful life of 40 years
NCES (1997); uses midpoint of 30-50 year range specified by the NCES
When using a discount rate of 3.5%, the hourly cost of a classroom is $6.85; other spaces such as offices are assumed to cost half as much, or $3.43 an hour.
According to Reed Construction Data, average square foot cost of new classroom construction is $135.88. According to University of Georgia, a classroom intended for 20 students should be 1029 square feet. Using Levin and McEwan (2001, p. 67):
(1) Cost per sq ft $135.88 (2) Average sq feet recommended 1,029 (3) Overall cost of classroom ((1) x (2)) $139,820.52 (4) Estimated useful life in years 40 (5) Cost of depreciation per year of use ((3)/(4)) $3495.51 (6) Multiply undepreciated amount by interest rate of 3.5% (((3)-(5))*0.035) $4771.38 (7) Depreciation plus foregone interest ((5)+(6)) yields annual cost $8266.89 (8) Cost per school day ((7) divided by 180 school days) $45.93 (9) Cost per hour ((8) divided by 6.7 hours in school day) $6.85
Software and computers are amortized over three years.
IRS Publication 946
Average class size is 20 students in 2007
NCES (http://nces.ed.gov/programs/digest/d09/tables/dt09_067.asp)
Discount rate is 3.5%, and sensitivity analysis varies it at 2% and 5%
Moore, Boardman, et al., 2004
Average school year is 180 days; NCES (http://nces.ed.gov/surveys/pss/tables/table_2006_24.asp)
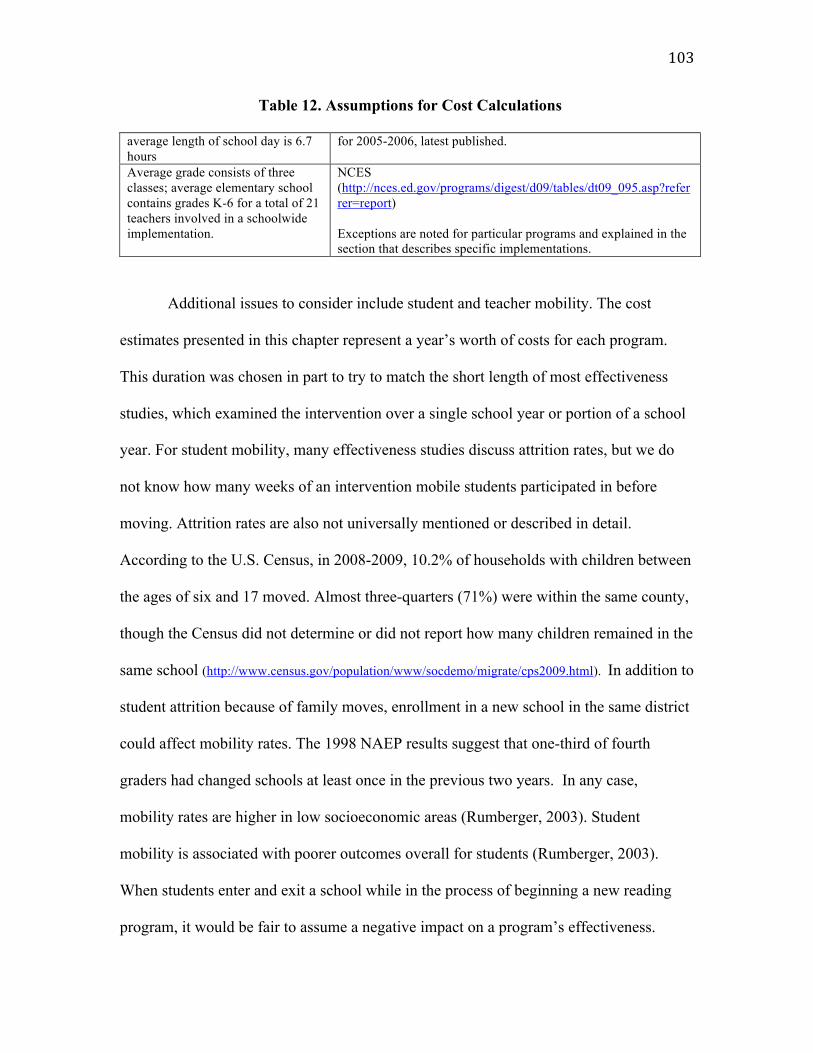
103
Table 12. Assumptions for Cost Calculations
average length of school day is 6.7 hours
for 2005-2006, latest published.
Average grade consists of three classes; average elementary school contains grades K-6 for a total of 21 teachers involved in a schoolwide implementation.
NCES (http://nces.ed.gov/programs/digest/d09/tables/dt09_095.asp?referrer=report) Exceptions are noted for particular programs and explained in the section that describes specific implementations.
Additional issues to consider include student and teacher mobility. The cost
estimates presented in this chapter represent a year’s worth of costs for each program.
This duration was chosen in part to try to match the short length of most effectiveness
studies, which examined the intervention over a single school year or portion of a school
year. For student mobility, many effectiveness studies discuss attrition rates, but we do
not know how many weeks of an intervention mobile students participated in before
moving. Attrition rates are also not universally mentioned or described in detail.
According to the U.S. Census, in 2008-2009, 10.2% of households with children between
the ages of six and 17 moved. Almost three-quarters (71%) were within the same county,
though the Census did not determine or did not report how many children remained in the
same school (http://www.census.gov/population/www/socdemo/migrate/cps2009.html). In addition to
student attrition because of family moves, enrollment in a new school in the same district
could affect mobility rates. The 1998 NAEP results suggest that one-third of fourth
graders had changed schools at least once in the previous two years. In any case,
mobility rates are higher in low socioeconomic areas (Rumberger, 2003). Student
mobility is associated with poorer outcomes overall for students (Rumberger, 2003).
When students enter and exit a school while in the process of beginning a new reading
program, it would be fair to assume a negative impact on a program’s effectiveness.
104
When effectiveness research focuses on pretest and posttests, then, attrition is an
important issue because, as Rumberger (2003) suggests, students with poorer outcomes
are more likely to move.
Regarding teacher mobility (i.e., a teacher receives specific training to implement
a program and then leaves before implementing it), training costs are considered “sunk
costs” for the particular teacher who was trained. According to the IES, at the end of the
2003-2004 school year, 17% of all public and private school elementary and secondary
teachers left their schools, primarily due to transfers. In high poverty schools, 21% of
teachers left their schools at the end of the same school year (IES
http://nces.ed.gov/programs/coe/2008/section4/indicator31.asp). Assuming a rate of 20%
teacher turnover each year, for the one year’s worth of costs I amortized 80% of the
training costs over five years and did not amortize 20% of the costs.
The costs for AR, CWPT, and SFA also do not take account of teacher or student
absences, both of which could impact the delivery of services and student outcomes.
When teachers are absent and a substitute teacher must be hired, the substitute may not be
able to deliver services properly. Substitute teachers may not know the students and have
not participated in training sessions, so teacher absence may result in the loss of program
instructional time. Similarly, absent students cannot participate and may fall behind in
their progress with the program. For RR, an unpublished paper (Dexter, Simon, &
Fiedler, 2009) was used to show that student and teacher absences and unavailability
reduced the number of complete interventions from the advertised eight per school year
to an average of 6.4. Cost estimates for RR are presented first for eight students, and then
for the average delivery of completed services to 6.4 students. Certainly RR is not the
105
only program for which student and teacher unavailability has had an effect on the
delivery of services, but it is the only program that has made the data available.
The following section provides a detailed breakdown of ingredients and estimated
program costs, and describes important issues and considerations. The information
provided about individual implementations is shared to provide the reader with additional
considerations about real-world implementations and how they may differ from the
national program developers’ prescription, but were not used for the purpose of creating
the ingredients lists. Costs presented in this section represent average costs for each
program. This was done in order to make the costs across programs more nearly
comparable, rather than subject to geographical or school-level idiosyncrasies. Also, the
effect sizes presented in Chapter 5 will be for specific implementations, the precise
details of which are often unknown because they are not well-described in the papers.
Because it is not possible to estimate costs based upon the specific implementations in
each of the effectiveness studies, it seemed reasonable to use average costs. Levin and
McEwan (2002; p. 89) caution that this type of cost estimation is limited by not
considering the ingredients and costs of a set of real-world implementations.
Accelerated Reader
The ingredients used to implement AR are largely concentrated on personnel. As
noted in the list of assumptions, I assume that a participating class has 20 students (NCES
Digest of Education Statistics 2009, Table 67; data are for 2007-2008, the most recently
reported). AR program developers noted that available personnel could be the most
variable component of the program. In fact, the two interviewees noted that they had
106
access to different personnel. The national program staff recommend that, when
available, schools should find volunteers to help set up the library or administer quizzes.
In one school, there were no volunteers, which meant that the school librarian was
responsible for start-up tasks like coding books. In the other school, retired teachers
volunteered to participate in the implementation of AR. Based upon the requirements of a
volunteer position – coding and reshelving books, turning on computers, making sure
students access quizzes with the correct title if they are taking them in the library – I
assume that the skills required to carry out these tasks could be done by an assistant
teacher.
To estimate the costs of a full implementation of AR, I include the 30-hour
training program recommended by the Nevada state legislature for implementation of AR
(http://www.leg.state.nv.us/Division/fiscal/leBeape/2004report/3e-READING.html). The
Nevada state legislature recommended in-person, on-site seminars with Renaissance
consultants rather than webinars. They published the 2004 price list, so I converted the
seminar costs to 2007 dollars using the Consumer Price Index (CPI). Prices for training
include all consultant fees (i.e., travel, expenses), and then for each seminar I determined
teacher, librarian, and/or principal time to participate.
The first seminar they recommend is a one-day introductory meeting that trains
teachers to understand the student’s zone of proximal development, help them to select
books, get a software overview, and manage paperwork. The second recommended
seminar is specifically for the school librarian, to learn AR strategies for the library. The
next seminars should be offered later in the school year: an advanced seminar for two
days’ worth of time that includes a review of reading problems and lesson planning; a
one day seminar about using AR reports to solve reading problems; and an on-site
consulting day with an AR consultant to address any schoolwide or individual issues.
107
There is also an annual contract for ongoing support via web and telephone, which the
Nevada legislature recommended purchasing. One of the two principals interviewed
about AR had opted for one session of in-person training and the ongoing support
package, and felt that the in-person training had been invaluable.
Although AR is a software program and children take the quizzes on their own,
teachers must devote considerable time to fostering reading improvement in the course of
using the program. Once children are old enough to read, reading level is determined by a
computerized assessment at the beginning of the school year. The teacher must then
evaluate students’ quizzes and monitor that the student is making adequate progress and
reading increasingly difficult books. Students may need teachers’ help in selecting books
and finding the right reading level. After passing three quizzes with a score of 85 or
higher, teachers should encourage students to try the next reading level. If a student is
unable to pass three quizzes in a row, the student should be encouraged to try a lower
reading level. Teachers read to those who are yet unable to read, and those students take
verbally administered quizzes to assess comprehension.
Teachers may also hold conferences with students on a fairly frequent basis
(Hodgins, 2009, in which teachers use each student’s reading log and reading goals to
conduct individualized, one-on-one meetings to improve student performance. Hodgins
(2009) conducted observations of AR implementation in intermediate grades in a school
identified by the AR program as a model school. He found that teachers used the half-
hour AR reading time to hold conferences and review student data. Hodgins’ (2009) non-
representative survey of teachers suggested that teachers spent as many as six hours a
week on AR activities, including reading time, suggesting that it could take 3.5 hours a
week to review data and quizzes, hold student conferences, and assist in book selection.
108
The table below represents total costs to implement AR for one year for
kindergarten through sixth grades, as well as the per-student cost. Although the effect
sizes used will come from studies examining beginning readers, professional
development and training sessions are offered at a schoolwide level. It seemed reasonable
to take account of the logic of including all of the teachers in a professional development
model because I did not find evidence that schoolwide implementation of AR was
generally tailored to a few specific grades.
The school librarian, too, must be involved in AR implementation. Quizzes are
available for hundreds of thousands of books, and teachers may also design their own
quizzes for books that are not in the AR quiz system. The program requires that the
school library be reorganized by book level, and that books are color coded with a sticker
to help students select books at an appropriate level (Hodgins, 2009). It is assumed that
each class heads to the library once a week for AR-related book check out and a lesson
(Hodgins, 2009), in addition to the regularly scheduled AR time. Estimates from the
national program developer suggested that the librarian would need a full week (i.e., 33.5
hours) to reorganize the library, with a library assistant’s full-time help.
The interviews about AR suggest that, at least anecdotally, extrinsic motivation in
the form of pencils or ice cream parties encourage students to read more. One of the
principals felt that parents supported the program because they thought it increased the
number of books their children read. As technology and software improve, it makes sense
to think ahead to the ways in which computers and software could help to improve
reading skills.
109
In one school, using the existing computer lab and presumably the computer
teacher or librarian’s time to administer quizzes and supervise children is a more
expensive option than purchasing the Neo devices sold by AR for the purpose of
administering quizzes. The Neo computers are a low-cost option for administering
quizzes; they also have word processing software. The Neo is a small, handheld device
with a screen that displays up to six lines of text. It runs on AAA batteries. Neos allow
users to connect to the Internet via wireless technology, so although the device cannot be
used to surf web pages, teachers can upload quizzes or add quiz questions in real time.
AR offers a free download of a program called Neo Share that teachers can put on a
laptop or desktop computer to facilitate this process. Teachers can also ask real time
questions and have students vote in a TV quiz show kind of format (Spectronics Web
site, 2011). One of the principals that I interviewed stated that each Neo cost $149, which
was confirmed by the Renaissance Learning web site (September 2010). Neos presented
a lower cost solution than adding computers to a computer lab. Also, in a computer lab,
there might not be enough available machines for each student to take a quiz when they
were ready. The average cost estimates assume that the school purchased Neos for
schoolwide use as part of a full implementation, and that a computer lab or classroom
computers would only be used three times a year to administer STAR reading tests.
Implementations in Effectiveness Studies
The table below describes the characteristics of implementations as described in
effectiveness studies that were accepted for inclusion in the dissertation. Chapter 5 will
provide extensive detail about studies that were included to provide measures of
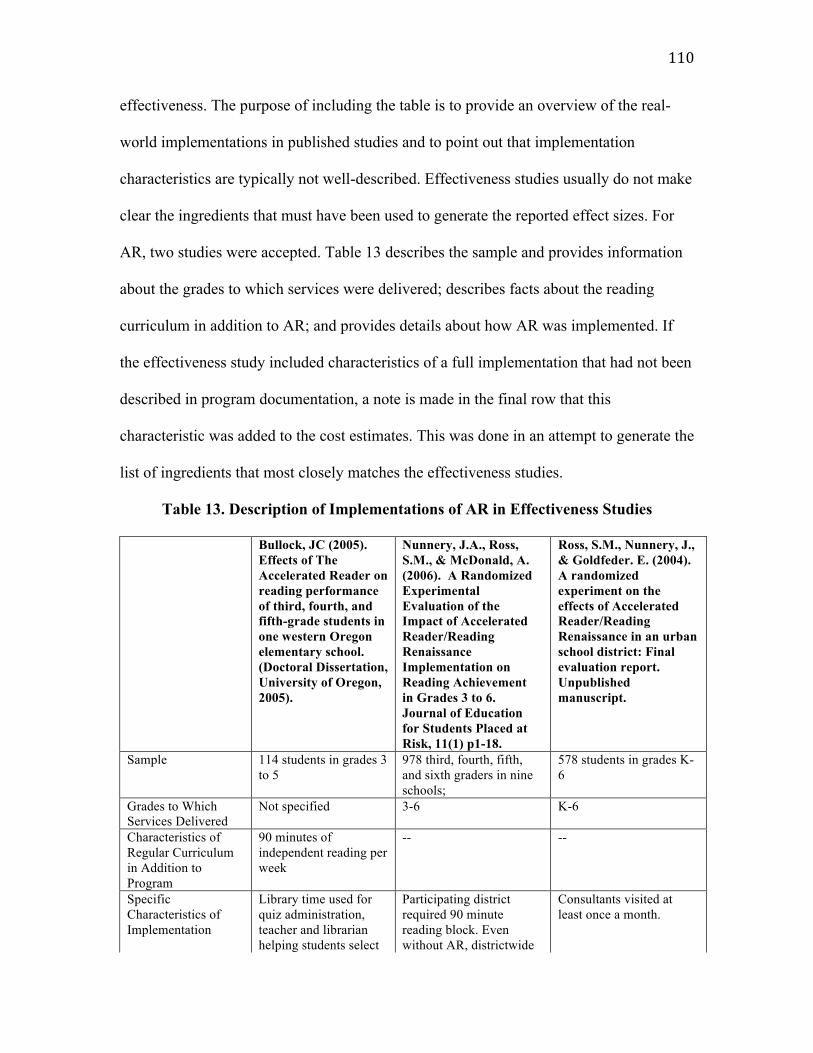
110
effectiveness. The purpose of including the table is to provide an overview of the real-
world implementations in published studies and to point out that implementation
characteristics are typically not well-described. Effectiveness studies usually do not make
clear the ingredients that must have been used to generate the reported effect sizes. For
AR, two studies were accepted. Table 13 describes the sample and provides information
about the grades to which services were delivered; describes facts about the reading
curriculum in addition to AR; and provides details about how AR was implemented. If
the effectiveness study included characteristics of a full implementation that had not been
described in program documentation, a note is made in the final row that this
characteristic was added to the cost estimates. This was done in an attempt to generate the
list of ingredients that most closely matches the effectiveness studies.
Table 13. Description of Implementations of AR in Effectiveness Studies
Bullock, JC (2005). Effects of The Accelerated Reader on reading performance of third, fourth, and fifth-grade students in one western Oregon elementary school. (Doctoral Dissertation, University of Oregon, 2005).
Nunnery, J.A., Ross, S.M., & McDonald, A. (2006). A Randomized Experimental Evaluation of the Impact of Accelerated Reader/Reading Renaissance Implementation on Reading Achievement in Grades 3 to 6. Journal of Education for Students Placed at Risk, 11(1) p1-18.
Ross, S.M., Nunnery, J., & Goldfeder. E. (2004). A randomized experiment on the effects of Accelerated Reader/Reading Renaissance in an urban school district: Final evaluation report. Unpublished manuscript.
Sample 114 students in grades 3 to 5
978 third, fourth, fifth, and sixth graders in nine schools;
578 students in grades K-6
Grades to Which Services Delivered
Not specified 3-6 K-6
Characteristics of Regular Curriculum in Addition to Program
90 minutes of independent reading per week
-- --
Specific Characteristics of Implementation
Library time used for quiz administration, teacher and librarian helping students select
Participating district required 90 minute reading block. Even without AR, districtwide
Consultants visited at least once a month.

111
Table 13 contd. Description of Implementations of AR in Effectiveness Studies
books. Librarian printed quiz reports for teachers.
reading goal of 25 books per student. In AR classrooms, 60 minutes of reading and quizzes, no incentives (unclear whether reading block was then 30 minutes long and AR was conducted instead of regular reading curriculum, or in addition to it). Two consultants paid monthly visits to the school; one met with administration and one with teachers. Each kept an implementation log.
Applied to Cost Estimates?
Library time of 45 minutes once a week is applied to cost estimates
Monthly meetings from two consultants are added to estimates. Assume one day a month for principal time and divide one day per month amongst 21 teachers (0.32 hours per month, or 3.2 hours over 10 month school year).
More detail about consultant visits was provided in the Nunnery, Ross, and McDonald (2006) study, so I noted that monthly visits were mentioned again.
Cost Estimation
The table below shows how the ingredients method was used to estimate average
costs for an implementation of AR in a K-6 elementary school for one school year,
assuming 20 students per class, three classes per grade. Following the table are
descriptions of how the hours are allocated amongst staff and facilities, as well as the
quantities and any assumptions about equipment and materials used.
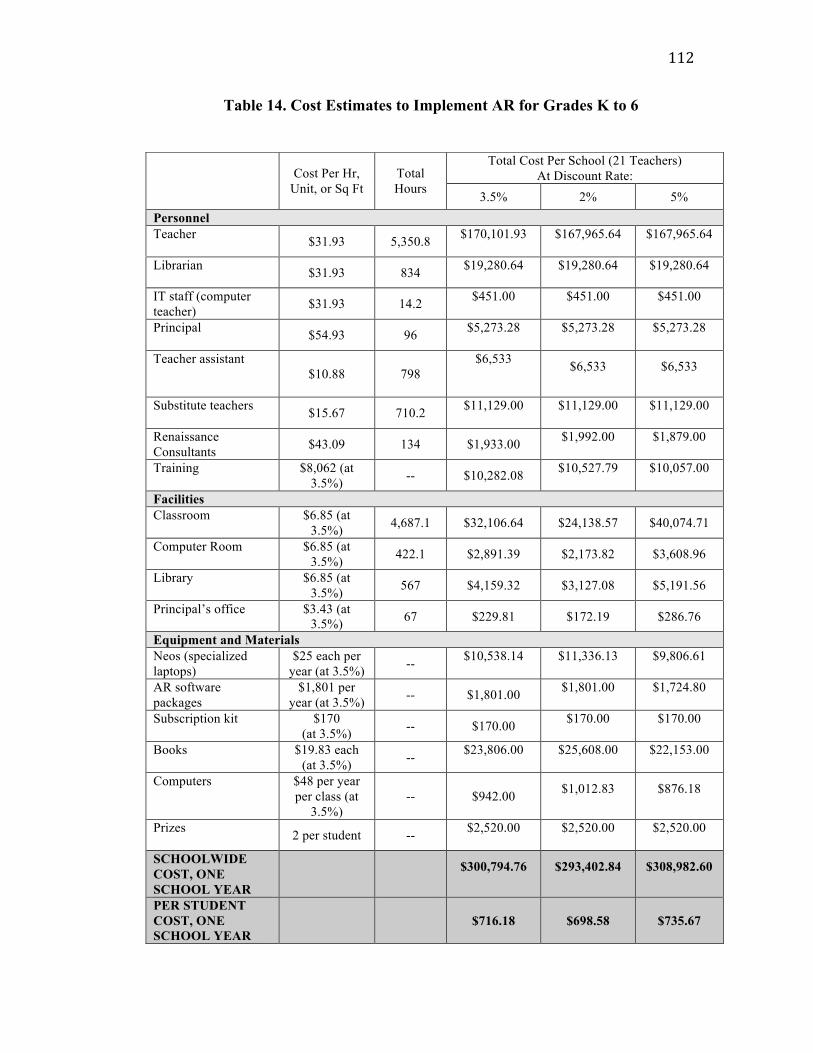
112
Table 14. Cost Estimates to Implement AR for Grades K to 6
Total Cost Per School (21 Teachers) At Discount Rate: Cost Per Hr,
Unit, or Sq Ft Total Hours 3.5% 2% 5%
Personnel Teacher $31.93 5,350.8 $170,101.93
$167,965.64
$167,965.64
Librarian $31.93 834 $19,280.64
$19,280.64
$19,280.64
IT staff (computer teacher) $31.93 14.2 $451.00
$451.00
$451.00
Principal $54.93 96 $5,273.28
$5,273.28
$5,273.28
Teacher assistant
$10.88 798 $6,533
$6,533
$6,533
Substitute teachers $15.67 710.2 $11,129.00
$11,129.00
$11,129.00
Renaissance Consultants $43.09 134 $1,933.00 $1,992.00
$1,879.00
Training $8,062 (at
3.5%) -- $10,282.08 $10,527.79
$10,057.00
Facilities Classroom $6.85 (at
3.5%) 4,687.1 $32,106.64 $24,138.57 $40,074.71
Computer Room $6.85 (at 3.5%) 422.1 $2,891.39 $2,173.82 $3,608.96
Library $6.85 (at 3.5%) 567 $4,159.32 $3,127.08 $5,191.56
Principal’s office $3.43 (at 3.5%) 67 $229.81 $172.19 $286.76
Equipment and Materials Neos (specialized laptops)
$25 each per year (at 3.5%) -- $10,538.14
$11,336.13
$9,806.61
AR software packages
$1,801 per year (at 3.5%) -- $1,801.00 $1,801.00
$1,724.80
Subscription kit $170
(at 3.5%) -- $170.00 $170.00
$170.00
Books $19.83 each (at 3.5%) -- $23,806.00
$25,608.00
$22,153.00
Computers $48 per year
per class (at 3.5%)
-- $942.00 $1,012.83
$876.18
Prizes 2 per student -- $2,520.00
$2,520.00
$2,520.00
SCHOOLWIDE COST, ONE SCHOOL YEAR
$300,794.76
$293,402.84
$308,982.60
PER STUDENT COST, ONE SCHOOL YEAR
$716.18 $698.58 $735.67
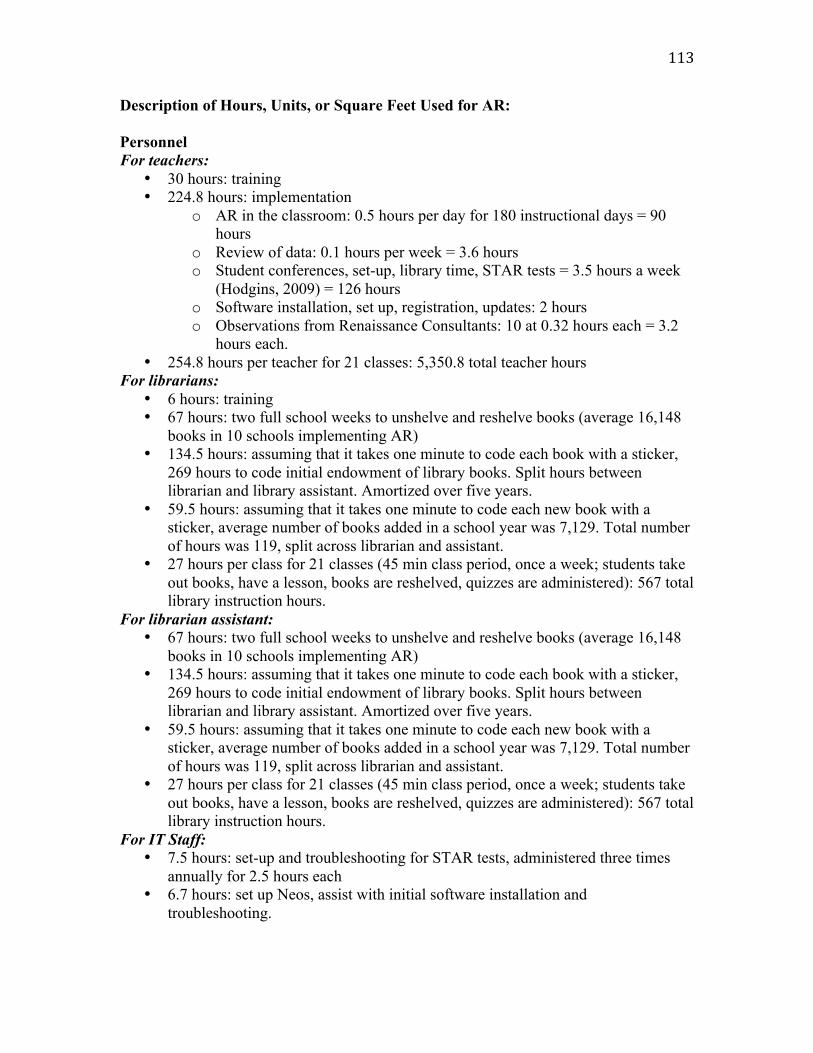
113
Description of Hours, Units, or Square Feet Used for AR:
Personnel For teachers:
• 30 hours: training • 224.8 hours: implementation
o AR in the classroom: 0.5 hours per day for 180 instructional days = 90 hours
o Review of data: 0.1 hours per week = 3.6 hours o Student conferences, set-up, library time, STAR tests = 3.5 hours a week
(Hodgins, 2009) = 126 hours o Software installation, set up, registration, updates: 2 hours o Observations from Renaissance Consultants: 10 at 0.32 hours each = 3.2
hours each. • 254.8 hours per teacher for 21 classes: 5,350.8 total teacher hours
For librarians: • 6 hours: training • 67 hours: two full school weeks to unshelve and reshelve books (average 16,148
books in 10 schools implementing AR) • 134.5 hours: assuming that it takes one minute to code each book with a sticker,
269 hours to code initial endowment of library books. Split hours between librarian and library assistant. Amortized over five years.
• 59.5 hours: assuming that it takes one minute to code each new book with a sticker, average number of books added in a school year was 7,129. Total number of hours was 119, split across librarian and assistant.
• 27 hours per class for 21 classes (45 min class period, once a week; students take out books, have a lesson, books are reshelved, quizzes are administered): 567 total library instruction hours.
For librarian assistant: • 67 hours: two full school weeks to unshelve and reshelve books (average 16,148
books in 10 schools implementing AR) • 134.5 hours: assuming that it takes one minute to code each book with a sticker,
269 hours to code initial endowment of library books. Split hours between librarian and library assistant. Amortized over five years.
• 59.5 hours: assuming that it takes one minute to code each new book with a sticker, average number of books added in a school year was 7,129. Total number of hours was 119, split across librarian and assistant.
• 27 hours per class for 21 classes (45 min class period, once a week; students take out books, have a lesson, books are reshelved, quizzes are administered): 567 total library instruction hours.
For IT Staff: • 7.5 hours: set-up and troubleshooting for STAR tests, administered three times
annually for 2.5 hours each • 6.7 hours: set up Neos, assist with initial software installation and
troubleshooting.
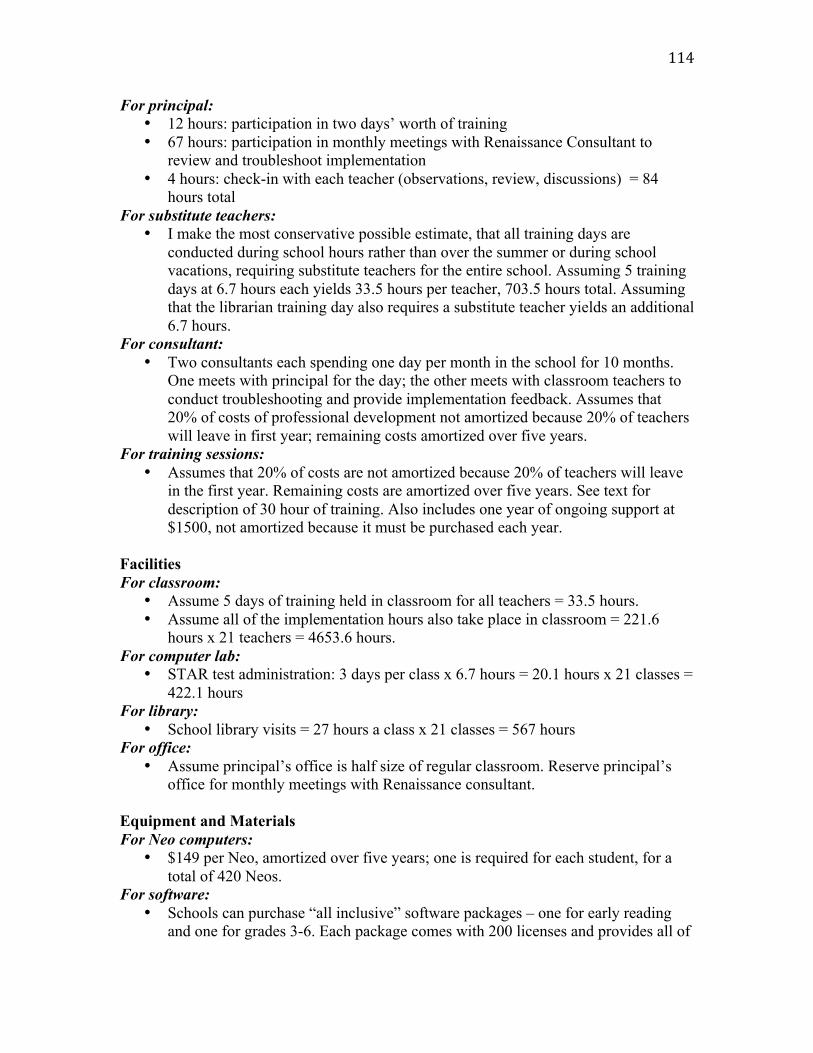
114
For principal: • 12 hours: participation in two days’ worth of training • 67 hours: participation in monthly meetings with Renaissance Consultant to
review and troubleshoot implementation • 4 hours: check-in with each teacher (observations, review, discussions) = 84
hours total For substitute teachers:
• I make the most conservative possible estimate, that all training days are conducted during school hours rather than over the summer or during school vacations, requiring substitute teachers for the entire school. Assuming 5 training days at 6.7 hours each yields 33.5 hours per teacher, 703.5 hours total. Assuming that the librarian training day also requires a substitute teacher yields an additional 6.7 hours.
For consultant: • Two consultants each spending one day per month in the school for 10 months.
One meets with principal for the day; the other meets with classroom teachers to conduct troubleshooting and provide implementation feedback. Assumes that 20% of costs of professional development not amortized because 20% of teachers will leave in first year; remaining costs amortized over five years.
For training sessions: • Assumes that 20% of costs are not amortized because 20% of teachers will leave
in the first year. Remaining costs are amortized over five years. See text for description of 30 hour of training. Also includes one year of ongoing support at $1500, not amortized because it must be purchased each year.
Facilities For classroom:
• Assume 5 days of training held in classroom for all teachers = 33.5 hours. • Assume all of the implementation hours also take place in classroom = 221.6
hours x 21 teachers = 4653.6 hours. For computer lab:
• STAR test administration: 3 days per class x 6.7 hours = 20.1 hours x 21 classes = 422.1 hours
For library: • School library visits = 27 hours a class x 21 classes = 567 hours
For office: • Assume principal’s office is half size of regular classroom. Reserve principal’s
office for monthly meetings with Renaissance consultant. Equipment and Materials For Neo computers:
• $149 per Neo, amortized over five years; one is required for each student, for a total of 420 Neos.
For software: • Schools can purchase “all inclusive” software packages – one for early reading
and one for grades 3-6. Each package comes with 200 licenses and provides all of
115
the necessary software, tests, quizzes, and data analysis capabilities. Each costs $2995 and is amortized over three years at 3.5%.
For additional licenses: • Given that the two software packages each provide 200 licenses, and that K-2 will
use Early Literacy, 240 students will use AR Reading (grades 3-6) requiring annual purchase of 40 licenses at $4.25 each.
For books: • Based on an analysis of 10 elementary and elementary/middle schools, the
average circulation increased from 16,147 to 44,920 books over four years, or 7,129 books a year (see http://research.renlearn.com/research/pdfs/242.pdf). Cost of a book is estimated to be $19.83 assuming half paperback ($19.08) and half hardcover ($20.57) purchases ( http://www.schoollibraryjournal.com/article/CA386702.html) and converting to 2007 dollars.
For computers: • Computer assumed to cost $639 (dell.com), and 25% of its use devoted to AR
related usage by the teacher. For 21 classes, total cost is $942 a year. For incentives:
• Assume incentives worth approximately $2 each x 20 students x 3 per year for 21 classes.
Table 14 shows that the total annual cost estimate for AR at approximately
$300,000 a year, ranging from approximately $293,000 at a discount rate of 2% to
approximately $309,000 at a 5% discount rate. The annual per student cost for a school of
420 students ranges from $699 to $736. The per student cost is higher at a higher
discount rate, primarily because of the cost of training and facilities.
Classwide Peer Tutoring
Like Accelerated Reader, Classwide Peer Tutoring is delivered to an entire class.
Assume again that a participating class has 20 students and that there are three classes to
a grade (NCES Digest of Education Statistics 2009, Table 67; data are for 2007-2008, the
most recently reported). The table below describes the school-year costs of CWPT,
derived from two published sources. One of the sources provided a description of how to
116
implement the Learning Management System software with a comprehensive training
and follow-up model (Greenwood, Hou, et al., 2001). The other source provided an
application of the Learning Management System model to English language learners
(Greenwood, Arreaga-Mayer, et al., 2001). Although English language learners are not
the focus of this study, the paper provided specific information about training lengths and
ongoing consultations with teachers.
Greenwood, Hou, et al. (2001) noted that CWPT was often implemented on a
classwide rather than schoolwide basis. Because the administration or district leaders
might be uninvolved in the selection and implementation of the program, it was common
for teachers to learn that they would not be allowed to continue to implement CWPT in
their classrooms. The national program staff sought to create a model that would
encourage schoolwide adoption of CWPT. This model included a training component and
ongoing professional development/support from a CWPT consultant. Greenwood, Hou, et
al. describe key roles for successful implementation. The school must designate a
building facilitator from amongst the faculty. This person must be involved in an extra
three-day training. The CWPT web site specified that an on-site training was offered in
Kansas City in 2002 (i.e., the web site had not been updated since the web page had been
designed for the 2002 meeting). I could not find any further information to suggest that
in-person conferences took place in Kansas City after that, so I assumed that the CWPT
consultant spent an extra three days providing one-on-one training to the building
facilitator in the school. After receiving the three days of training, the building facilitator
helps to train teachers, observes teachers 12 times over the course of the school year and
provides feedback about how CWPT is going, works with the principal to discuss data
117
and evaluation, and is the liaison with the CWPT consultant. The CWPT consultant is an
outside consultant who provides training and ongoing support, and attends data sharing
sessions. The principal is expected to design the data and evaluation plan, attend the four
hour training session, meet regularly with the building facilitator, observe CWPT
sessions and provide feedback, and meet with the consultants about data. The teachers
who implement CWPT are also expected to engage in observations of other teachers’
implementations, and then provide feedback.
Implementations in Effectiveness Studies
The table below describes the characteristics of implementations as described in
effectiveness studies that were accepted for inclusion in the dissertation. Chapter 5 will
provide extensive detail about studies that were included to provide measures of
effectiveness. The purpose of including the table is to provide an overview of the real-
world implementations in published studies and to point out that implementation
characteristics are typically not well-described. Effectiveness studies usually do not make
clear the ingredients that must have been used to generate the reported effect sizes. For
CWPT, one study was accepted. The table below describes the sample and provides
information about the grades to which services were delivered; describes facts about the
reading curriculum in addition to the program being implemented; and provides details
about how the program itself was implemented. If the effectiveness study included
characteristics of a full implementation that had not been described in program
documentation, a note is made in the final row that this characteristic was added to the
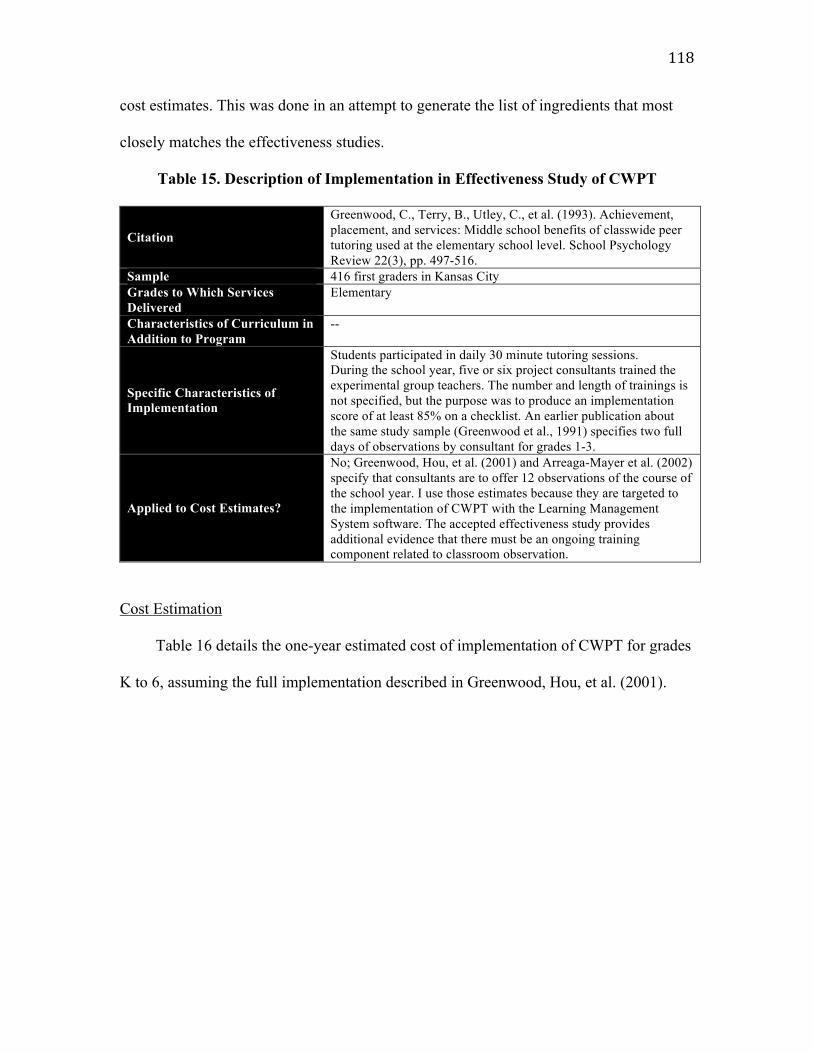
118
cost estimates. This was done in an attempt to generate the list of ingredients that most
closely matches the effectiveness studies.
Table 15. Description of Implementation in Effectiveness Study of CWPT
Citation
Greenwood, C., Terry, B., Utley, C., et al. (1993). Achievement, placement, and services: Middle school benefits of classwide peer tutoring used at the elementary school level. School Psychology Review 22(3), pp. 497-516.
Sample 416 first graders in Kansas City Grades to Which Services Delivered
Elementary
Characteristics of Curriculum in Addition to Program
--
Specific Characteristics of Implementation
Students participated in daily 30 minute tutoring sessions. During the school year, five or six project consultants trained the experimental group teachers. The number and length of trainings is not specified, but the purpose was to produce an implementation score of at least 85% on a checklist. An earlier publication about the same study sample (Greenwood et al., 1991) specifies two full days of observations by consultant for grades 1-3.
Applied to Cost Estimates?
No; Greenwood, Hou, et al. (2001) and Arreaga-Mayer et al. (2002) specify that consultants are to offer 12 observations of the course of the school year. I use those estimates because they are targeted to the implementation of CWPT with the Learning Management System software. The accepted effectiveness study provides additional evidence that there must be an ongoing training component related to classroom observation.
Cost Estimation
Table 16 details the one-year estimated cost of implementation of CWPT for grades
K to 6, assuming the full implementation described in Greenwood, Hou, et al. (2001).
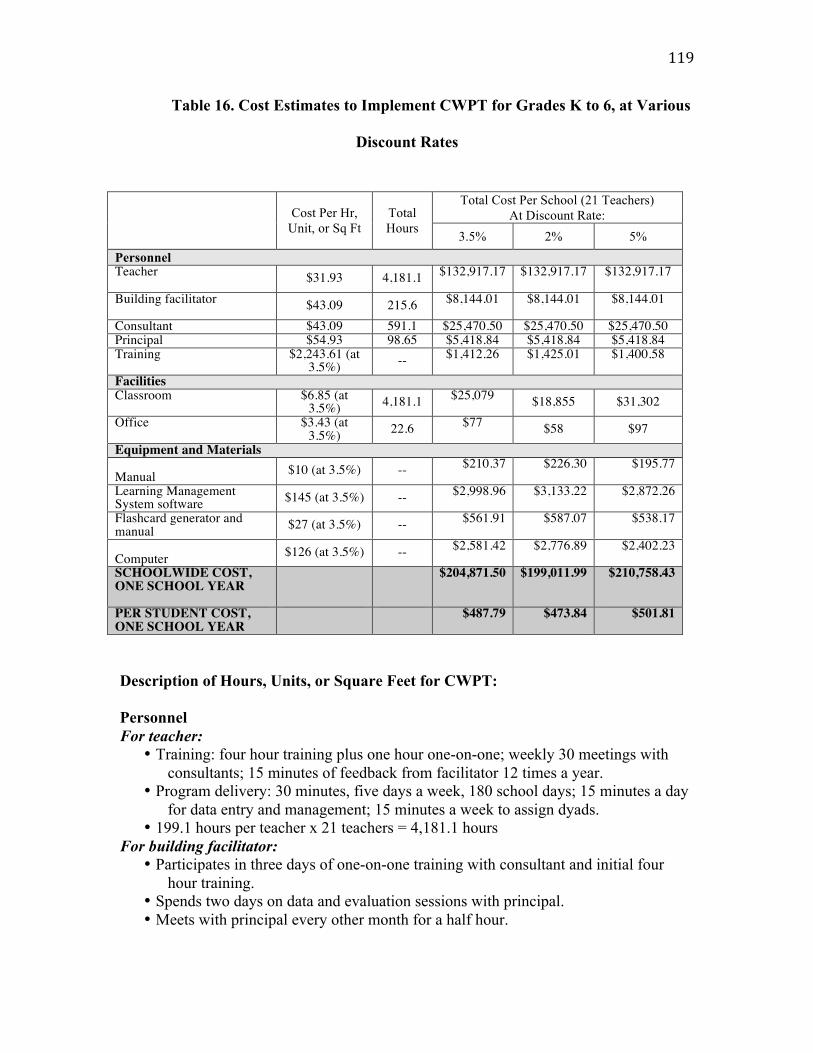
119
Table 16. Cost Estimates to Implement CWPT for Grades K to 6, at Various
Discount Rates
Description of Hours, Units, or Square Feet for CWPT:
Personnel For teacher:
• Training: four hour training plus one hour one-on-one; weekly 30 meetings with consultants; 15 minutes of feedback from facilitator 12 times a year.
• Program delivery: 30 minutes, five days a week, 180 school days; 15 minutes a day for data entry and management; 15 minutes a week to assign dyads.
• 199.1 hours per teacher x 21 teachers = 4,181.1 hours For building facilitator:
• Participates in three days of one-on-one training with consultant and initial four hour training.
• Spends two days on data and evaluation sessions with principal. • Meets with principal every other month for a half hour.
Total Cost Per School (21 Teachers) At Discount Rate: Cost Per Hr,
Unit, or Sq Ft Total Hours 3.5% 2% 5%
Personnel Teacher $31.93 4,181.1 $132,917.17
$132,917.17
$132,917.17
Building facilitator $43.09 215.6 $8,144.01
$8,144.01
$8,144.01
Consultant $43.09 591.1 $25,470.50 $25,470.50 $25,470.50 Principal $54.93 98.65 $5,418.84 $5,418.84 $5,418.84 Training $2,243.61 (at
3.5%) -- $1,412.26
$1,425.01
$1,400.58
Facilities Classroom $6.85 (at
3.5%) 4,181.1 $25,079 $18,855 $31,302
Office $3.43 (at 3.5%) 22.6 $77
$58 $97 Equipment and Materials
Manual $10 (at 3.5%) -- $210.37
$226.30
$195.77
Learning Management System software $145 (at 3.5%) -- $2,998.96
$3,133.22
$2,872.26
Flashcard generator and manual $27 (at 3.5%) -- $561.91
$587.07
$538.17
Computer $126 (at 3.5%) -- $2,581.42
$2,776.89
$2,402.23
SCHOOLWIDE COST, ONE SCHOOL YEAR
$204,871.50
$199,011.99
$210,758.43
PER STUDENT COST, ONE SCHOOL YEAR
$487.79 $473.84
$501.81
120
• For 2 months: observations of teachers 2x/month; rest of year, 1 per month (12 total; assume 30 minute observations, 15 minutes of feedback). Data eval plan, data sharing sessions
• 215.6 hours per teacher For principal:
• Participates in 4 hour training. • Participates in 30 minute observations of each teacher every other month, plus 15
minutes of feedback time (45 minutes x 5 = 3.75 hours per teacher x 21 teachers = 78.75 hours).
• Participates in 30-minute meetings every other month (5 per school year) with building facilitator. Data eval plan, sharing sessions assumed to take 2 full days each year.
For consultant: • Spends three full days training building facilitator; participates in four hour
training. = 24.1 hours • For each teacher: 36 half hour meetings plus prep time of 15 minutes per meeting
= 0.75*36 = 27 hours per teacher, 567 hours total. • 591.1 hours total
For training: • Trainers: 2 trainers at 4 hours for whole group training and 1 hour of one-on-one
time with each teacher (21 hours total) ; assume $43.09 per hour per trainer, with 80% amortized over five years and 20% not amortized assuming turnover.
• Trainers’ flight and expenses are estimated to be $497 each ($994 total) using http://www.bts.gov/press_releases/2010/bts025_10/html/bts025_10.html http://www.gsa.gov/portal/content/101518 http://www.gsa.gov/portal/content/10198
Facilities For classroom:
• Used by teachers for training and implementation; see entry under teachers for full description of training, obervations, and implementation.
• 199.1 hours per teacher x 21 teachers = 4181.1 hours For office:
• Assume office is half-size of classroom. • Office to be used for three day training of building facilitator (3 days at 6.7 hours a
day = 20.1 hours) • Office to be used for meetings between building facilitator and principal (0.5 hours
x 5 meetings = 2.5 hours) Equipment For tutoring manual:
• Manual costs $59.49; amortized over five years. Manual to be provided to each teacher.
For software: • Software and manual cost $475; amortized over three years. Each teacher requires
their own software.

121
For Flash card generator: • Generator and manual cost $89; amortized over three years. Each teacher requires
one. For computer:
• Cost of $639 (Dell.com) amortized over 3 years. Each teacher needs a computer.
The estimated annual cost of implementing CWPT in a 420-student elementary
school would be $200,000. At a 2% discount rate, the annual per student cost of the
program would be approximately $474; at a 3.5% discount rate it would be
approximately $488; and at a 5% discount rate the approximate annual per student cost
would be $502. The per student cost rises with the discount rate, primarily because of the
cost of facilities.
Reading Recovery
Reading Recovery is a one-to-one intervention, in which a trained RR teacher holds
daily 30-minute lessons with low achieving readers. Services are only delivered to first
graders, and only struggling readers may participate. Struggling readers are chosen based
on performance on the Observation Survey, which was developed by Dr. Marie Clay, as
well as teachers’ subjective assessments of student need. RR teachers work in their
capacity as RR teachers for half of each school day, theoretically working with four
students per day. They work in some other capacity (e.g., Title I teacher) for the other
half of the day. RR teachers may work with as many as eight RR students per year. The
number of students served in the RR teacher’s other capacity would vary depending on
the role he or she has been assigned. The costs of RR detailed below only account for the
portion of the day spent on RR activities. RR implementation involves substantial up-
front costs, namely graduate-level training for teachers. Teacher leaders also devote

122
considerable amounts of time to working with new and existing RR teachers, both on-site
in the teachers’ schools and at the training site. According to a personal interview with
one teacher leader, depending on how many RR teachers are within his or her
geographical area, a teacher could expect one or two visits, or possibly many more. A
teacher leader’s salary is paid by the districts, so it is important to know how many
teachers he or she would mentor. According to the International Data and Evaluation
Center (IDEC; www.idecweb.us) in 2008-2009, each teacher leader mentored 26 RR
teachers.
In the cost estimates below, which are for one school’s implementation of RR, I
assume that there is one RR teacher per school. I assume that a teacher leader, given his
or her expected qualifications of a master’s degree and more than five years of
experience, is at the high end of the teacher salary scale. Although RR teacher and
teacher leader salaries are not published, personal communication from national program
staff at Lesley University suggests that teacher leader salaries are $20,000-$25,000
greater than that of an RR teacher. With benefits, the teacher leader salary is estimated at
$43.09. There is also an entry for a “behind the glass” classroom. This classroom is
housed at one school or training site and allows teachers and teacher leaders in training to
observe RR lessons through a one-way glass. The cost of $25,000 is discounted over 40
years.
The interviews (with one principal and one teacher leader) suggested that, as
program documentation states, RR involves a very structured implementation. It seems
that one of the major areas where costs could vary was in the number of children served
per year. Although the RR teacher is supposed to spend a half-day on RR work
123
(approximately 3.35 hours per day) he or she may be redirected to other tasks. Also, if an
RR teacher is absent, the principal and teacher leader both mentioned that substitute
teachers are never hired because of the intricate nature of one-on-one work – the
instructional time is merely lost. The number of children served could deviate from the
advertised total of eight per year due to a variety of factors – student absence or attrition
due to mobility, teacher absence, or lessons missed because an RR teacher was asked to
take on other tasks such as test administration or classroom coverage. In the 2007-2008
school year, the average RR teacher provided 6.4 complete interventions in which
children were either discontinued or recommended for further services (Dexter, Simon, &
Fiedler, 2009). RR program developers assume that RR teachers provide eight complete
interventions over the course of a school year. Analysis of the International Data and
Evaluation Center (IDEC) data showed that RR teachers worked with eight students
altogether, but on average 1.6 students had an incomplete series of lessons because they
moved, the school year ended, or they exited RR for another reason.
Implementations in Effectiveness Studies
The table below describes the characteristics of implementations as described in
effectiveness studies that were accepted for inclusion in the dissertation. Chapter 5 will
provide extensive detail about studies that were included to provide measures of
effectiveness. The purpose of including the table is to provide an overview of the real-
world implementations in published studies and to point out that implementation
characteristics are typically not well-described. Effectiveness studies usually do not make
clear the ingredients that must have been used to generate the reported effect sizes. For
RR, 10 studies were accepted and nine were ultimately included in the meta-analysis. The
124
table below describes the sample and provides information about the grades to which
services were delivered; describes facts about the reading curriculum in addition to the
program being implemented; and provides details about how the program itself was
implemented. If the effectiveness study included characteristics of a full implementation
that had not been described in program documentation, a note is made in the final row
that this characteristic was added to the cost estimates. This was done in an attempt to
generate the list of ingredients that most closely matches the effectiveness studies.
Perhaps because RR is a very prescriptive intervention, the effectiveness studies tended
to describe program developer recommendations for implementation rather than outlining
individual implementations. Two studies did not mention any specifics about
implementation (Huggins, 1998 and Campbell, 2004). The characteristics mentioned by
the other eight studies are included below. For all studies of RR, the sample consists of
first graders perceived to be at-risk of reading failure. The studies do not provide any
information about the school’s general reading curriculum.
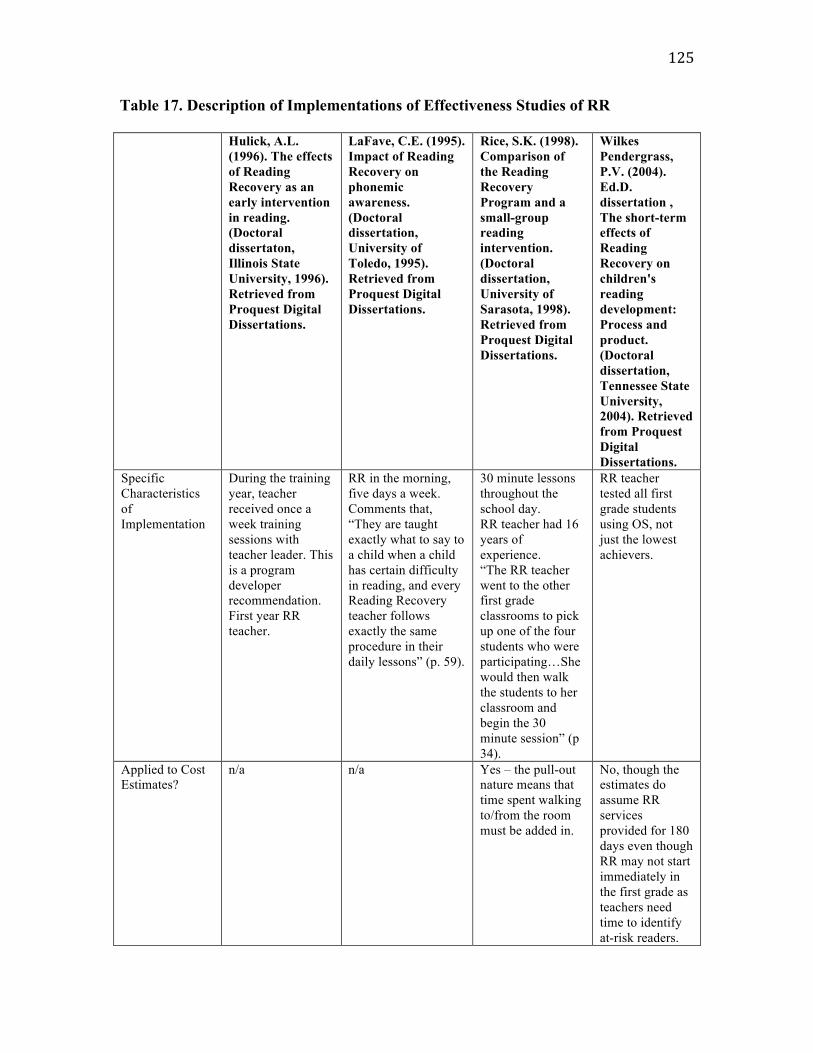
125
Table 17. Description of Implementations of Effectiveness Studies of RR
Hulick, A.L. (1996). The effects of Reading Recovery as an early intervention in reading. (Doctoral dissertaton, Illinois State University, 1996). Retrieved from Proquest Digital Dissertations.
LaFave, C.E. (1995). Impact of Reading Recovery on phonemic awareness. (Doctoral dissertation, University of Toledo, 1995). Retrieved from Proquest Digital Dissertations.
Rice, S.K. (1998). Comparison of the Reading Recovery Program and a small-group reading intervention. (Doctoral dissertation, University of Sarasota, 1998). Retrieved from Proquest Digital Dissertations.
Wilkes Pendergrass, P.V. (2004). Ed.D. dissertation , The short-term effects of Reading Recovery on children's reading development: Process and product. (Doctoral dissertation, Tennessee State University, 2004). Retrieved from Proquest Digital Dissertations.
Specific Characteristics of Implementation
During the training year, teacher received once a week training sessions with teacher leader. This is a program developer recommendation. First year RR teacher.
RR in the morning, five days a week. Comments that, “They are taught exactly what to say to a child when a child has certain difficulty in reading, and every Reading Recovery teacher follows exactly the same procedure in their daily lessons” (p. 59).
30 minute lessons throughout the school day. RR teacher had 16 years of experience. “The RR teacher went to the other first grade classrooms to pick up one of the four students who were participating…She would then walk the students to her classroom and begin the 30 minute session” (p 34).
RR teacher tested all first grade students using OS, not just the lowest achievers.
Applied to Cost Estimates?
n/a n/a Yes – the pull-out nature means that time spent walking to/from the room must be added in.
No, though the estimates do assume RR services provided for 180 days even though RR may not start immediately in the first grade as teachers need time to identify at-risk readers.
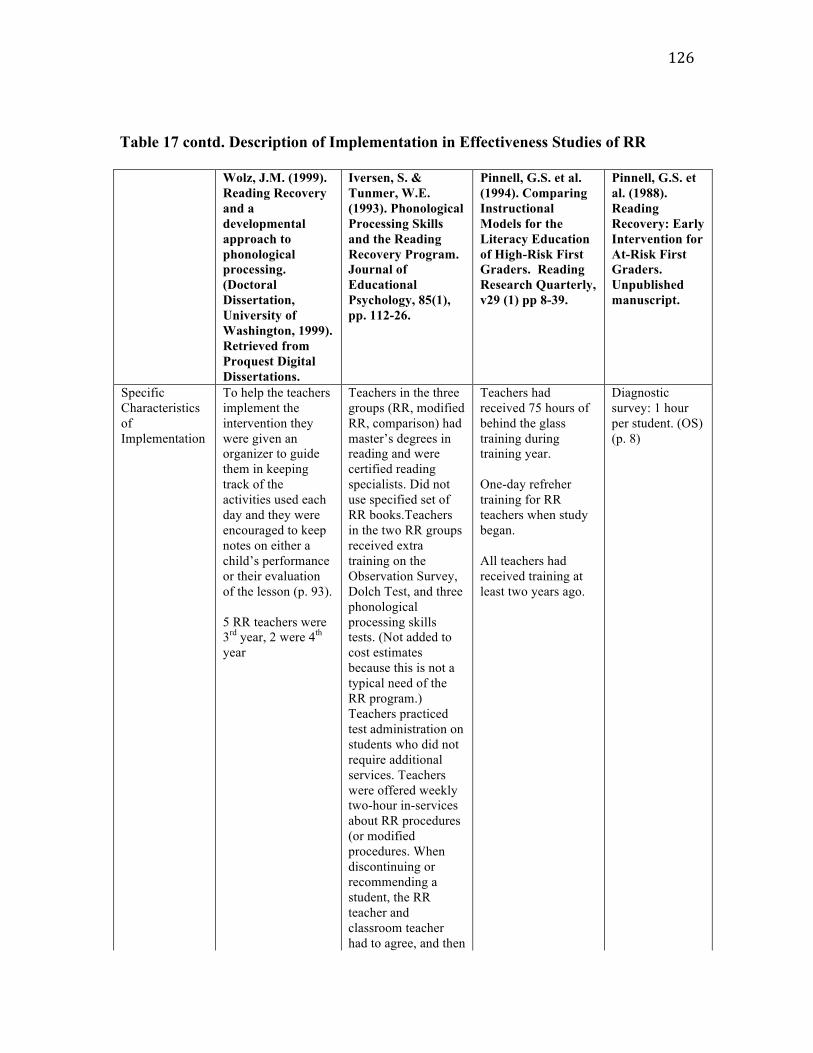
126
Table 17 contd. Description of Implementation in Effectiveness Studies of RR
Wolz, J.M. (1999). Reading Recovery and a developmental approach to phonological processing. (Doctoral Dissertation, University of Washington, 1999). Retrieved from Proquest Digital Dissertations.
Iversen, S. & Tunmer, W.E. (1993). Phonological Processing Skills and the Reading Recovery Program. Journal of Educational Psychology, 85(1), pp. 112-26.
Pinnell, G.S. et al. (1994). Comparing Instructional Models for the Literacy Education of High-Risk First Graders. Reading Research Quarterly, v29 (1) pp 8-39.
Pinnell, G.S. et al. (1988). Reading Recovery: Early Intervention for At-Risk First Graders. Unpublished manuscript.
Specific Characteristics of Implementation
To help the teachers implement the intervention they were given an organizer to guide them in keeping track of the activities used each day and they were encouraged to keep notes on either a child’s performance or their evaluation of the lesson (p. 93). 5 RR teachers were 3rd year, 2 were 4th year
Teachers in the three groups (RR, modified RR, comparison) had master’s degrees in reading and were certified reading specialists. Did not use specified set of RR books.Teachers in the two RR groups received extra training on the Observation Survey, Dolch Test, and three phonological processing skills tests. (Not added to cost estimates because this is not a typical need of the RR program.) Teachers practiced test administration on students who did not require additional services. Teachers were offered weekly two-hour in-services about RR procedures (or modified procedures. When discontinuing or recommending a student, the RR teacher and classroom teacher had to agree, and then
Teachers had received 75 hours of behind the glass training during training year. One-day refreher training for RR teachers when study began. All teachers had received training at least two years ago.
Diagnostic survey: 1 hour per student. (OS) (p. 8)
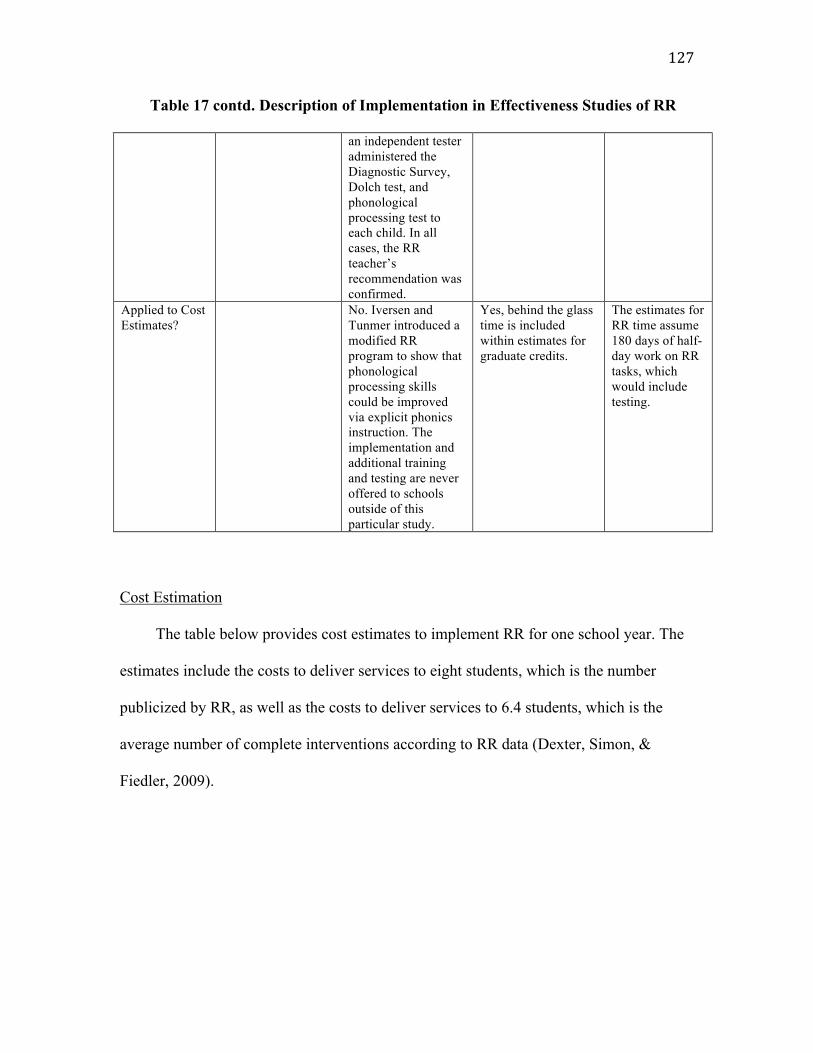
127
Table 17 contd. Description of Implementation in Effectiveness Studies of RR
an independent tester administered the Diagnostic Survey, Dolch test, and phonological processing test to each child. In all cases, the RR teacher’s recommendation was confirmed.
Applied to Cost Estimates?
No. Iversen and Tunmer introduced a modified RR program to show that phonological processing skills could be improved via explicit phonics instruction. The implementation and additional training and testing are never offered to schools outside of this particular study.
Yes, behind the glass time is included within estimates for graduate credits.
The estimates for RR time assume 180 days of half-day work on RR tasks, which would include testing.
Cost Estimation
The table below provides cost estimates to implement RR for one school year. The
estimates include the costs to deliver services to eight students, which is the number
publicized by RR, as well as the costs to deliver services to 6.4 students, which is the
average number of complete interventions according to RR data (Dexter, Simon, &
Fiedler, 2009).
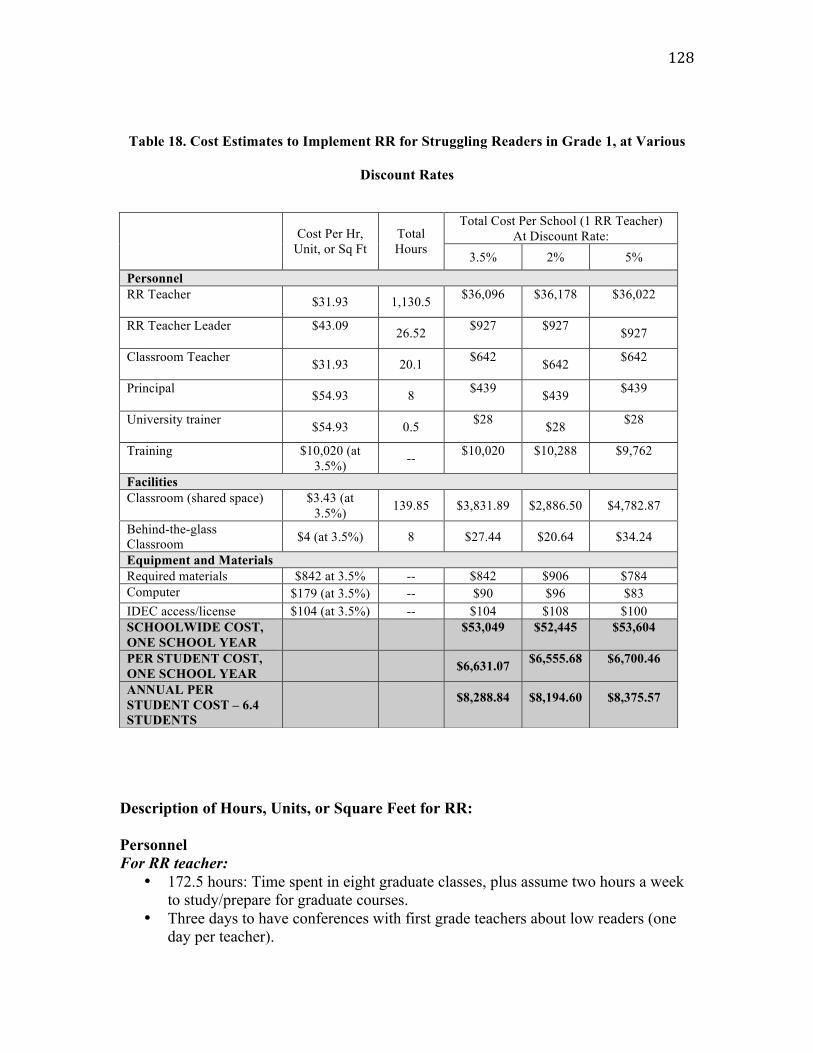
128
Table 18. Cost Estimates to Implement RR for Struggling Readers in Grade 1, at Various
Discount Rates
Description of Hours, Units, or Square Feet for RR:
Personnel For RR teacher:
• 172.5 hours: Time spent in eight graduate classes, plus assume two hours a week to study/prepare for graduate courses.
• Three days to have conferences with first grade teachers about low readers (one day per teacher).
Total Cost Per School (1 RR Teacher) At Discount Rate: Cost Per Hr,
Unit, or Sq Ft Total Hours 3.5% 2% 5%
Personnel RR Teacher $31.93 1,130.5 $36,096
$36,178
$36,022
RR Teacher Leader $43.09
26.52 $927
$927 $927
Classroom Teacher $31.93 20.1 $642 $642 $642
Principal $54.93 8 $439
$439 $439
University trainer $54.93 0.5 $28 $28 $28
Training $10,020 (at
3.5%) -- $10,020
$10,288
$9,762
Facilities Classroom (shared space) $3.43 (at
3.5%) 139.85 $3,831.89 $2,886.50 $4,782.87
Behind-the-glass Classroom $4 (at 3.5%) 8 $27.44 $20.64 $34.24
Equipment and Materials Required materials $842 at 3.5% -- $842 $906 $784 Computer $179 (at 3.5%) -- $90 $96 $83 IDEC access/license $104 (at 3.5%) -- $104 $108 $100 SCHOOLWIDE COST, ONE SCHOOL YEAR
$53,049
$52,445
$53,604
PER STUDENT COST, ONE SCHOOL YEAR
$6,631.07 $6,555.68
$6,700.46
ANNUAL PER STUDENT COST – 6.4 STUDENTS
$8,288.84
$8,194.60
$8,375.57
129
• One full day for preparation and participation in data-sharing meetings with principal.
• 119.75 for each 20 week intervention: o Assume 0.8375 hours for each student (0.5 hours for lesson, but RR
teachers spend half-day on RR and half-day on other activities. Given a school day is 6.7 hours long, I divide the day in half and then in quarters to obtain 0.8375 hours spent per student.
o This includes bringing student from and to classroom, setting up, and finishing paperwork. I also budget one hour per week for data entry and management. 119.75 x 8 = 958 hours
For Teacher Leader: • 5 hours: share for each RR teacher (of 26) of the time spent in TL grad courses
(16 credits; see entry under training). • 21 hours: continuing contact with each RR teacher
For university trainer: • 0.52 hours: share for each RR teacher (of 26) of time spent with university trainer.
Two days of university trainer time spent on one-on-one visits with teacher leader, is 13.4 hours divided by 26 to represent number of RR teachers each TL works with.
For classroom teacher: • Assume that each first grade teacher spends the equivalent of a school day (6.7
hours) referring at-risk readers and having conferences with RR teacher. Three teachers per grade yields 20.1 hours.
For principal: • Four hours: participation in principals’ meeting • Four hours: data sharing sessions (2 per year) with RR teacher
For training: • RR teacher:
o 8 graduate credits, estimated at $790 per credit based upon Lesley University, a training site; 80% amortized over five years and 20% not amortized.
o “Continuing contact” meetings with teacher leader: 21 hours for TL and teacher, plus annual $2,000 fee
o Annual Literacy for All conference, $800 all-inclusive plus two days’ worth of teacher’s time; 80% amortized over five years and 20% not amortized.
• Teacher leader: o 16 graduate courses and fees are $28,240 to be paid to The Ohio State
University, over five years. The price is divided by 26, the average number of teachers a TL supported in 2008-2009 (idecweb.us); ; 80% amortized over five years and 20% not amortized.
o TL annual association fee is $3,500, divided by 26 teachers. o TL receives 2 days’ worth of visits from university trainer at $850 each
plus travel expenses (estimated at $362 based on IRS). o TL conferences, two per year at $1,400 each, all-inclusive; 80% amortized
over five years and 20% not amortized.
130
Facilities For classroom:
• RR teachers are typically given a half-sized room/office or share space with someone else, so cost of $6.85/hour for full sized class is divided by 2.
• 20.1 hours: conferences with classroom teachers • For each intervention: 119.75 hours (see above: 0.8375 hours per student for four
students per day plus data entry/management time of one hour/week). For Behind-the-Glass classroom:
• Assume 8 hours of training using off-site behind-the-glass classroom. The cost of $25,000 is discounted over 40 years.
Equipment For books and materials:
• RR sells required books, magnetic letters, chalkboard, paper for $5,000. The cost is amortized over five years.
For computer used for data entry/management: • Cost of $639 (Dell.com) amortized over 3 years; assume 50% of time spent using
computer is for RR because RR is a half-day position. For International Data and Evaluation Center Access:
• $350 set-up fee amortized over five years, plus $45 annual subscription fee.
The total cost of implementing RR for one school year was estimated to be
approximately $53,000 at a 3.5% discount rate. Because services are delivered to just
eight students a year, the per student cost of RR is approximately $6,631. For eight
students served, the per student cost ranges from $6,556 at a 2% discount rate to $6,700
for a 5% discount rate. If we assume that complete services are delivered to 6.4 students a
year (Dexter, Simon, & Fiedler, 2009), the per-student cost of a complete intervention is
$8,289 at a 3.5% discount rate. For 6.4 students served, the per student cost ranges from
$8,195 at a 2% discount rate to $8,376 at a 5% discount rate. The per student cost rises
with the discount rate, primarily because of training and facilities costs.
131
Success for All
SFA is a whole school reform intended to restructure an entire school. It involves
an explicit reading component, in which 90 minutes a day consists of reading instruction.
It is unclear how the rest of the day is scheduled in an SFA school. For struggling
readers, additional time is spent on reading in the form of one-on-one, 20-minute daily
tutoring sessions. In the cost estimates, I assume that 45 minutes would have been
devoted to reading in the absence of the program, and therefore subtract 45 minutes of
time from the estimate of teacher hours. The ingredients and costs are described for the
full extent of the comprehensive school reform; the reading portion of the program could
not have been purchased separately.
Both of the principals that agreed to be interviewed said that the 90 minute
reading block was a non-negotiable part of the day. One of the components of SFA that
could force schools to incur substantial costs was the requirement for class size reduction.
As described in Chapter 2, SFA assumes that reading groups are as small as 15 students.
In an “average” school with 420 students in 21 classrooms four additional classroom
spaces would have to be used.
Both principals discussed the difficulty of finding space for reading groups. SFA
requires that students are sorted into ability groups for reading. The principals noted that
gyms, offices, and even large storage closets could be used. One principal said that the
reading time required that prekindergarten classrooms be used for reading, so pre-
kindergarten was held in the afternoon instead of the morning. This clearly would have
an impact on parents of pre-kindergarteners, and perhaps on the pre-kindergarten
students.
132
SFA sets out specific staffing requirements, including a trainer, a facilitator, and a
social worker. Their time is assumed to be devoted to SFA at 100%, and it is also
assumed that the facilitator and social worker focus only on the students to whom SFA
services are being delivered. Also, parents are supposed to serve as school volunteers. I
assumed two parent volunteers in the estimate of time spent for the family support team,
and the advisory committee. This estimate assumes that a few parents would each
volunteer or be involved over the course of a school year. To estimate the cost of a
parent’s time, I use the median hourly rate for a worker in the U.S. published on the
Bureau of Labor Statistics web site, which was $15.95 in 2010 or $15.43 in 2007 dollars.
Although the cost of a “volunteer” would not be paid by the school, in order to present
information about how to replicate the intervention in another setting with similarly
qualified paid personnel, the hourly rate for a volunteer must be counted in these
estimates.
Implementations in Effectiveness Studies
The table below describes the characteristics of implementations as described in
effectiveness studies that were accepted for inclusion in the dissertation. Chapter 5 will
provide extensive detail about studies that were included to provide measures of
effectiveness. The table provides an overview of the actual implementations as described
in published studies, and demonstrates that implementation characteristics are typically
not well-described. Effectiveness studies usually do not clarify the ingredients that must
have been used to generate the reported effect sizes. For SFA, four studies were accepted.
The table below describes the sample; describes facts about the reading curriculum in
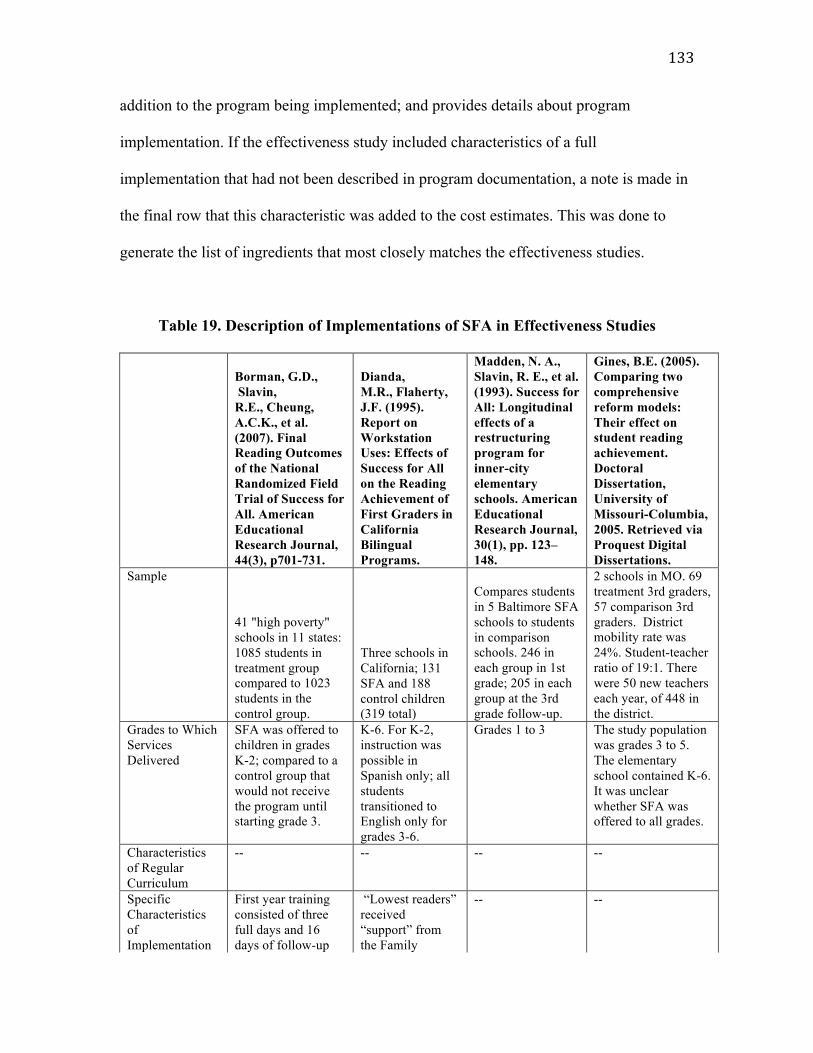
133
addition to the program being implemented; and provides details about program
implementation. If the effectiveness study included characteristics of a full
implementation that had not been described in program documentation, a note is made in
the final row that this characteristic was added to the cost estimates. This was done to
generate the list of ingredients that most closely matches the effectiveness studies.
Table 19. Description of Implementations of SFA in Effectiveness Studies
Borman, G.D., Slavin, R.E., Cheung, A.C.K., et al. (2007). Final Reading Outcomes of the National Randomized Field Trial of Success for All. American Educational Research Journal, 44(3), p701-731.
Dianda, M.R., Flaherty, J.F. (1995). Report on Workstation Uses: Effects of Success for All on the Reading Achievement of First Graders in California Bilingual Programs.
Madden, N. A., Slavin, R. E., et al. (1993). Success for All: Longitudinal effects of a restructuring program for inner-city elementary schools. American Educational Research Journal, 30(1), pp. 123–148.
Gines, B.E. (2005). Comparing two comprehensive reform models: Their effect on student reading achievement. Doctoral Dissertation, University of Missouri-Columbia, 2005. Retrieved via Proquest Digital Dissertations.
Sample
41 "high poverty" schools in 11 states: 1085 students in treatment group compared to 1023 students in the control group.
Three schools in California; 131 SFA and 188 control children (319 total)
Compares students in 5 Baltimore SFA schools to students in comparison schools. 246 in each group in 1st grade; 205 in each group at the 3rd grade follow-up.
2 schools in MO. 69 treatment 3rd graders, 57 comparison 3rd graders. District mobility rate was 24%. Student-teacher ratio of 19:1. There were 50 new teachers each year, of 448 in the district.
Grades to Which Services Delivered
SFA was offered to children in grades K-2; compared to a control group that would not receive the program until starting grade 3.
K-6. For K-2, instruction was possible in Spanish only; all students transitioned to English only for grades 3-6.
Grades 1 to 3 The study population was grades 3 to 5. The elementary school contained K-6. It was unclear whether SFA was offered to all grades.
Characteristics of Regular Curriculum
-- -- -- --
Specific Characteristics of Implementation
First year training consisted of three full days and 16 days of follow-up
“Lowest readers” received “support” from the Family
-- --
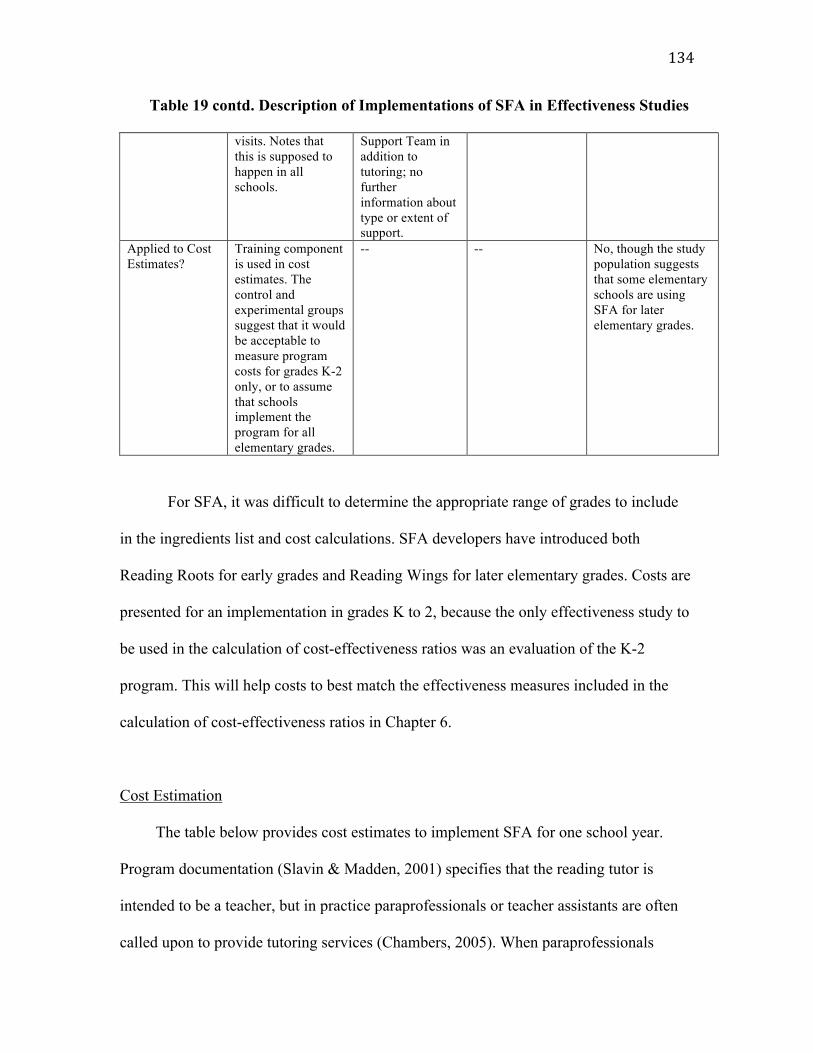
134
Table 19 contd. Description of Implementations of SFA in Effectiveness Studies
visits. Notes that this is supposed to happen in all schools.
Support Team in addition to tutoring; no further information about type or extent of support.
Applied to Cost Estimates?
Training component is used in cost estimates. The control and experimental groups suggest that it would be acceptable to measure program costs for grades K-2 only, or to assume that schools implement the program for all elementary grades.
-- -- No, though the study population suggests that some elementary schools are using SFA for later elementary grades.
For SFA, it was difficult to determine the appropriate range of grades to include
in the ingredients list and cost calculations. SFA developers have introduced both
Reading Roots for early grades and Reading Wings for later elementary grades. Costs are
presented for an implementation in grades K to 2, because the only effectiveness study to
be used in the calculation of cost-effectiveness ratios was an evaluation of the K-2
program. This will help costs to best match the effectiveness measures included in the
calculation of cost-effectiveness ratios in Chapter 6.
Cost Estimation
The table below provides cost estimates to implement SFA for one school year.
Program documentation (Slavin & Madden, 2001) specifies that the reading tutor is
intended to be a teacher, but in practice paraprofessionals or teacher assistants are often
called upon to provide tutoring services (Chambers, 2005). When paraprofessionals

135
conduct tutoring sessions, it is expected that they use software called Alphie’s Alley to
support the experience. Presumably, tutors who are not teachers would require additional
oversight. Although the use of teacher assistants or paraprofessionals as reading tutors is
mentioned in the literature, I could not find appropriate descriptions of paraprofessional
training, monitoring, and professional development, software requirements or costs, or
details about implementations in which non-teachers worked as tutors. For these reasons,
I do not present cost estimates for the use of non-teachers as tutors even though there has
been mention of this staffing change in the literature.
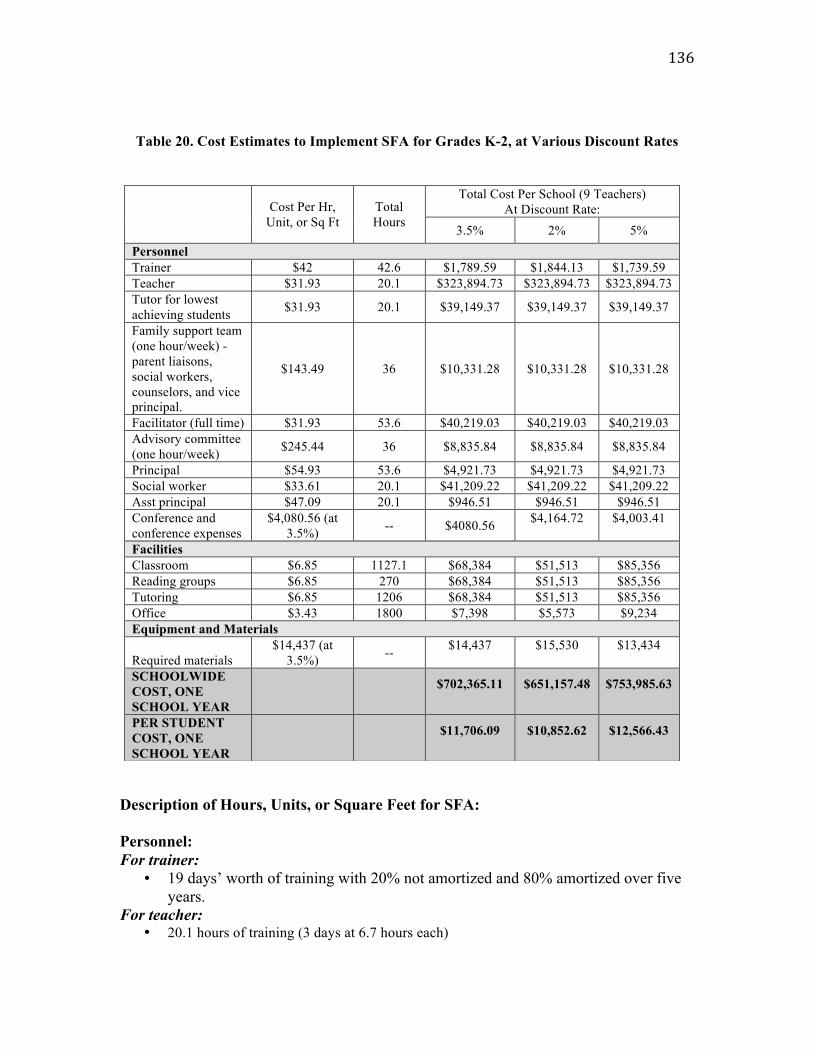
136
Table 20. Cost Estimates to Implement SFA for Grades K-2, at Various Discount Rates
Description of Hours, Units, or Square Feet for SFA:
Personnel: For trainer:
• 19 days’ worth of training with 20% not amortized and 80% amortized over five years.
For teacher: • 20.1 hours of training (3 days at 6.7 hours each)
Total Cost Per School (9 Teachers) At Discount Rate: Cost Per Hr,
Unit, or Sq Ft Total Hours 3.5% 2% 5%
Personnel Trainer $42 42.6 $1,789.59 $1,844.13 $1,739.59 Teacher $31.93 20.1 $323,894.73 $323,894.73 $323,894.73 Tutor for lowest achieving students $31.93 20.1 $39,149.37 $39,149.37 $39,149.37
Family support team (one hour/week) - parent liaisons, social workers, counselors, and vice principal.
$143.49 36 $10,331.28 $10,331.28 $10,331.28
Facilitator (full time) $31.93 53.6 $40,219.03 $40,219.03 $40,219.03 Advisory committee (one hour/week) $245.44 36 $8,835.84 $8,835.84 $8,835.84
Principal $54.93 53.6 $4,921.73 $4,921.73 $4,921.73 Social worker $33.61 20.1 $41,209.22 $41,209.22 $41,209.22 Asst principal $47.09 20.1 $946.51 $946.51 $946.51 Conference and conference expenses
$4,080.56 (at 3.5%) -- $4080.56 $4,164.72
$4,003.41
Facilities Classroom $6.85 1127.1 $68,384 $51,513 $85,356 Reading groups $6.85 270 $68,384 $51,513 $85,356 Tutoring $6.85 1206 $68,384 $51,513 $85,356 Office $3.43 1800 $7,398 $5,573 $9,234 Equipment and Materials
Required materials $14,437 (at
3.5%) -- $14,437
$15,530
$13,434
SCHOOLWIDE COST, ONE SCHOOL YEAR
$702,365.11
$651,157.48
$753,985.63
PER STUDENT COST, ONE SCHOOL YEAR
$11,706.09
$10,852.62
$12,566.43
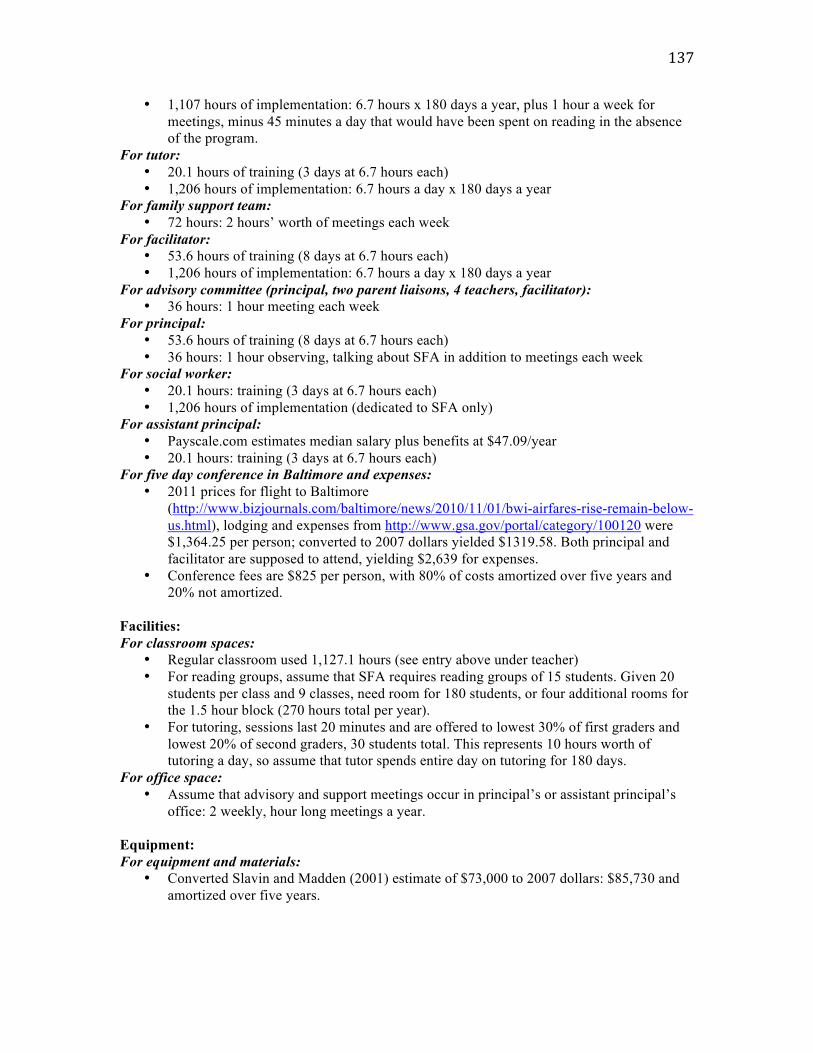
137
• 1,107 hours of implementation: 6.7 hours x 180 days a year, plus 1 hour a week for meetings, minus 45 minutes a day that would have been spent on reading in the absence of the program.
For tutor: • 20.1 hours of training (3 days at 6.7 hours each) • 1,206 hours of implementation: 6.7 hours a day x 180 days a year
For family support team: • 72 hours: 2 hours’ worth of meetings each week
For facilitator: • 53.6 hours of training (8 days at 6.7 hours each) • 1,206 hours of implementation: 6.7 hours a day x 180 days a year
For advisory committee (principal, two parent liaisons, 4 teachers, facilitator): • 36 hours: 1 hour meeting each week
For principal: • 53.6 hours of training (8 days at 6.7 hours each) • 36 hours: 1 hour observing, talking about SFA in addition to meetings each week
For social worker: • 20.1 hours: training (3 days at 6.7 hours each) • 1,206 hours of implementation (dedicated to SFA only)
For assistant principal: • Payscale.com estimates median salary plus benefits at $47.09/year • 20.1 hours: training (3 days at 6.7 hours each)
For five day conference in Baltimore and expenses: • 2011 prices for flight to Baltimore
(http://www.bizjournals.com/baltimore/news/2010/11/01/bwi-airfares-rise-remain-below-us.html), lodging and expenses from http://www.gsa.gov/portal/category/100120 were $1,364.25 per person; converted to 2007 dollars yielded $1319.58. Both principal and facilitator are supposed to attend, yielding $2,639 for expenses.
• Conference fees are $825 per person, with 80% of costs amortized over five years and 20% not amortized.
Facilities: For classroom spaces:
• Regular classroom used 1,127.1 hours (see entry above under teacher) • For reading groups, assume that SFA requires reading groups of 15 students. Given 20
students per class and 9 classes, need room for 180 students, or four additional rooms for the 1.5 hour block (270 hours total per year).
• For tutoring, sessions last 20 minutes and are offered to lowest 30% of first graders and lowest 20% of second graders, 30 students total. This represents 10 hours worth of tutoring a day, so assume that tutor spends entire day on tutoring for 180 days.
For office space: • Assume that advisory and support meetings occur in principal’s or assistant principal’s
office: 2 weekly, hour long meetings a year. Equipment: For equipment and materials:
• Converted Slavin and Madden (2001) estimate of $73,000 to 2007 dollars: $85,730 and amortized over five years.
138
The total cost of implementing SFA for one school year was estimated to be
approximately $700,000 at a 3.5% discount rate. When implemented in grades K-2,
services are delivered to 60 students a year with a per student cost is approximately
$11,706. The total cost ranged from approximately $650,000 at a 2% discount rate to
approximately $750,000 at a 5% discount rate. The per pupil costs of the program ranged
from $10,852 to $12,566. The per pupil costs rose with the discount rate, primarily
because of training and facilities costs. Compared to the other programs, the table
suggests that more personnel are involved in an SFA implementation, and the personnel
costs are substantial. The cost of equipment and materials is also very high compared to
other programs. Although program documentation provides a price for the equipment and
materials, the details about what is included for that price are sparse.
Summary
This chapter presented an overview of the ingredients method, described
assumptions for calculating costs for each reading program, and presented costs for each
of the programs for one school year. Small add-on programs intended for schoolwide
delivery, AR and CWPT, were far less expensive on a per-student basis than RR or SFA.
SFA emerged as the most expensive program on a per-student basis because of the
intensive time commitments required of school personnel. RR, too, requires substantial
commitment from school personnel and is targeted to a specific population, struggling
first graders. Unlike SFA, however, RR expects limited involvement from classroom
teachers and the principal, and focuses its intensive time commitments on a dedicated RR
teacher who conducts RR lessons in a part-time capacity. Costs are the first piece of the

139
cost-effectiveness analysis; the next step is to evaluate effects for each of the programs.
The next chapter presents a review of the effectiveness measures for each of the studies.
140
CHAPTER 5: EFFECTS
Considering Effectiveness
In addition to proper cost measurement, a cost-effectiveness analysis must include
a measure of the effect of each program. In context, the term effectiveness refers to
measures that show that an intervention has changed outcomes for participants, or what
Rossi et al. (2003) refer to as program effects (p. 206). Measures of educational program
effectiveness often include test scores, because such outcomes are relatively easy to
obtain, have been politically useful in a high-stakes educational atmosphere, and are
predictors of later outcomes (Alexander et al., 2001; Finn, 1989). Rossi et al. (2003)
distinguish between proximal and distal effects. Proximal effects are immediate and
could include a standardized test score, while distal effects are measured far out in the
future. Distal effects of interest could include outcomes such as high school graduation
rates or labor market outcomes. Distal effects are more difficult to measure or to attribute
to the past intervention (Rossi et al., 2003). Although Rossi et al. (2003) acknowledge
that relatively few sources of outcome data exist, they note that “[a]cademic achievement
is conventionally measured with standard achievement tests and grade point averages” (p.
217).
Sustained program effects (e.g., a treatment group maintains higher achievement
test scores than a comparison group over several years) may be more useful for decision
makers than program effects studied over the short run such as the same school year.
Using a number of outcomes, and different kinds of outcome measures, may help to
reveal a number of effects and give decision makers more specific information about the
program effects that have been generated. Unfortunately, in practice, much of the
141
education research appears to focus on short term follow-up periods; a school year’s
worth of follow-up is common. Studies often use standardized test scores as outcome
measures, though there may be other interesting outcomes to consider and explore.
Because my study will focus on combining measures of effectiveness from existing
studies, it uses effect sizes for proximal, intended outcomes.
Many different variables aside from the immediate school program being studied
affect outcomes. This makes it difficult to attribute improvement in reading achievement
to program effects (Rossi et al., 2003). Educational achievement is influenced by factors
such as school resources and quality (Greenwald, Hedges, & Laine, 1996; Card &
Krueger, 1990), teacher effects (Kane & Staiger, 2008; Miller, Murnane, & Willett, 2007;
Clotfelter, Ladd, & Vigdor, 2007), family characteristics (Dahl & Lochner, 2008; Currie
& Thomas, 1995), or peer effects (Angrist & Lang, 2002). Taking account of the many
other events occurring in participants’ lives may make it difficult to isolate changes in
educational outcomes from participation in the program. Experimental and quasi-
experimental research designs attempt to solve this problem (Campbell & Stanley, 1963;
Shadish, Cook, & Campbell, 2002).
Although causal inferences can be made using experimental and quasi-
experimental methods, challenges to making inferences include sampling issues, the point
in time in which the study was conducted, or other threats to validity (Shadish, Cook, &
Campbell 2002, p.18). Randomized experiments allow the researcher complete control
over the study (Morgan & Winship, 2007). In a controlled experiment, researcher may
assign study participants to a treatment or control group at random. The researcher then
introduces an independent variable, such as a medicine or educational program, to the
142
treatment group and not to the control group (Jackson, 2009). On average, the groups
should not show statistically significant differences on baseline measures, and differences
in the outcome measure can be attributed to the intervention. In a properly controlled
experiment, all factors except for the independent variable are controlled by the
researcher and should be the same for both groups over the course of the intervention
(Jackson, 2009). This implies that all aspects of people’s lives that could contribute to
differential effects should be controlled to be sure that program effects are correctly
attributed to the program; this obviously is prohibitively difficult in most cases. A
researcher may not control for all of the other variables that would affect posttest
performance; these variables are called confounds, and if they cannot be controlled for,
bias is introduced into the results (Jackson, 2009). Over time, some people may leave the
study; this is called attrition. Even if treatment and control groups were equivalent at
baseline or on a pretest, differential attrition between the groups may result in treatment
and control groups that are not comparable at the end of the study (Shadish, Cook, &
Campbell, 2002). It would be difficult to properly conduct a controlled experiment on
students participating in an educational intervention, given all of the constraints described
in the preceding paragraph.
Quasi-experimental studies are common in social science research, frequently
because of ethical concerns or data availability. These studies do not use random
assignment, meaning that participants may self-select or be sorted for treatment by others
such as teachers (Shadish, Cook, & Campbell, 2002, p. 14). If treatment groups are
shown to be equivalent to a comparison group at baseline, and if issues such as
differential attrition do not affect the equivalence of the groups over the study’s duration,
143
researchers can compare groups to assess program effects. Non-equivalent comparison
groups are a threat to the internal validity of a quasi-experimental study (Jackson, 2009).
These are also issues confronted in experimental work, but the mechanism by which
participants are assigned in quasi-experimental studies (e.g., self-selection or sorting by
others) poses an immediate threat to a study’s validity. Overall, quasi-experimental
evidence may be less compelling than experimental evidence because it is difficult to
prove that comparison and treatment groups did not differ in important, unobservable
ways (Shadish, Cook, & Campbell, 2002). Ideally, pretests and posttests should both be
used and the same instruments should be administered to both treatment and
control/comparison groups.
If techniques such as matching are used in quasi-experimental studies, it is
important to evaluate how, and how well, the matching was done (Shadish, Cook, &
Campbell, 2002). Matching is a way to ensure that treatment and comparison groups are
equivalent at baseline. When this technique is used, participants in each group are
literally matched to one another on a variable or variables of interest (Jackson, 2009).
When matching has been done well, studies using matched pairs have a high level of
statistical power because the participants in each group are similar on a number of
measures. In practice, it can be difficult to create a high-quality matched pairs study
because it is difficult to find pairs of people who are similar on a number of
characteristics (Jackson, 2009). In education research, where students may be matched on
a pretest score and a few demographic measures, children within pairs may still vary on
many other characteristics that ultimately affect program outcomes.
144
Threats to internal validity are greater for quasi-experimental designs than
experimental ones because the treatment and comparison groups are unlikely to differ
randomly (Shadish, Cook, & Campbell, 2002). When treatment and comparison groups
are not equivalent on baseline measures such as test scores or demographics, they may
vary in other important ways that we cannot observe. This is called omitted variable bias.
When comparison groups are nonequivalent, there is a list of common problems that
threaten study validity. History is one such problem, whereby “changes in the dependent
variable may be due to outside events that take place over the course of the study”
(Jackson, 2009, p. 213). Maturation, or changes in the dependent variable occurring as a
result of study subjects growing older, is another pitfall of nonequivalent comparison
groups. The testing effect occurs when repeated testing leads to study subjects improving
or worsening on the dependent variable measure. Regression to the mean is a problem
that occurs specifically when study subjects perform at the extreme, with either very high
or very low scores. Over time, students who started out with scores at either end of the
distribution will be “less extreme at later testing” (Jackson, 2009, p. 213). Jackson (2009)
also warns of the instrumentation effect, whereby changes in the dependent variable are
actually due to changes in the instrument or assessment used. All of these threats to
validity should be considered when assessing study quality and deciding how to interpret
reported program effects.
For experimental and quasi-experimental work, researchers must also consider
whether “there…is a difference in the way the two groups are treated” (Jackson, 2009, p.
205). In the case of an educational program, researchers would have to know that the
treatment group had truly received the anticipated services and that the program had been
145
implemented as intended. They would also need to know that the comparison group did
not receive similar or special services for the duration of the study. Fidelity and extent of
implementation appear to have an important effect on outcomes (Greenwood, Tapia, et
al., 2003), though more research needs to be done in this area (O’Donnell, 2008).
Non-experimental designs are common in education research. Non-experimental
studies lack random assignment, pretests, and/or control or comparison groups (Shadish,
Cook, & Campbell, 2002, p.18). Without a comparison group or a pretest, it may be
difficult to make causal inferences unless there are well-known expectations about the
dependent variable; using multiple posttests also helps this design (Shadish, Cook, &
Campbell, 2002, p. 106-107). A pretest-posttest design without a control group would not
provide information about the counterfactual, or how the treatment group would have
performed in the absence of the intervention (Shadish, Cook, & Campbell, 2002). In non-
experimental studies, the relationship that researchers observe and report may be due to
omitted variables or may be spurious (Johnson and Christensen, 2010).
Methodology
Given all of the limitations and cautions described above, I considered how to
create the numerator for cost-effectiveness ratios. One way to generate effectiveness
measures would be to conduct my own experiments to determine the effectiveness of
each program versus a control group. This was not possible because of constraints on
budget and time. Another solution would be to find data that had already been collected
and analyze it using quasi-experimental methods to see whether the program had an
effect. I did not consider this to be a plausible option because it is very difficult to
146
conduct an appropriate post hoc analysis of data that had been collected by someone else
and for another purpose. I decided that the most reasonable and practical solution would
be a rigorous meta-analysis of existing studies to generate average effect sizes.
It may be difficult to apply the results of a meta-analysis to a cost-effectiveness
analysis because the average effect size from many different versions of an intervention
does not provide the specific information required for a cost-effectiveness analysis.
Rather, it provides information about the average effectiveness of a program or
intervention (Levin, 2002, p. 128). Despite that limitation, I decided that it would be
appropriate to use this method. The methodological justifications were twofold: first, I
had developed a set of criteria that would permit me to accept only the most rigorous
studies; second, the two programs for which enough studies were available to conduct a
meta-analysis met Levin’s criteria for programs likely to use similar resources in different
implementations. AR is an add-on program for which start-up and maintenance are likely
to be similar in the situations included in this project. Similarly, RR is a program in
which the major costs – staff training and time – would be theorized not to vary much
because the developers require specific training and implementation. The analysis
assumes that it was possible to determine the characteristics of a full implementation
given published and unpublished reports and evaluations, and program developer
interviews. It further assumes that published research showing program effectiveness is
also likely to be based upon full implementations, or at least more successful
implementations.
Even given a fairly prescriptive program, fidelity of implementation may vary
amongst sites or teachers, leading to substantially dissimilar implementations of so-called
147
identical programs or curricula (Greenwood, Tapia, et al., 2003; O’Donnell, 2008).
Fidelity of implementation is not just a quality assurance issue (O’Donnell, 2008). When
implementations are dissimilar, they may be unalike in terms of effectiveness
(O’Donnell, 2008; Dusenbery et al., 2003). Evaluators should include a measure of
fidelity of implementation, as “quality and extent of implementation can affect program
outcomes and to gain confidence that the observed outcomes can be attributed to the
intervention” (O’Donnell, 2008, p. 42).
An additional consideration regarding the use of meta-analysis was based on the
use of existing studies by the What Works Clearinghouse (WWC). As discussed earlier,
the WWC provides information about existing effectiveness research on educational
interventions. The WWC presents information about specific studies that meet a set of
criteria, leading to a tacit implication that the studies may be considered together for an
“overall” effect. The WWC, however, presents simple averages rather than conducting a
meta-analysis for programs with more than one approved effectiveness study. Therefore,
a statistical combination of effect sizes is reasonable.
The WWC presents effect sizes for each program it has reviewed. Effect sizes
present a “common measure” (Levin, 2002b, p.17) allowing different instruments to be
compared. Although students in the various studies did not take the same reading test, it
is possible to compare effect sizes because results are put into standard deviation units.
The effect size is calculated as the difference between mean scores of treatment and
control or comparison groups, divided by the pooled standard deviation. This is called
Cohen’s d (Cohen, 1992), and is a commonly used measure in education research studies.
Cohen’s d is scale-free and should be interpreted as the number of standard deviation
units between the two means (Valentine & Cooper, 2003, p. 4).
148
Effect sizes are being used in this study primarily to facilitate the calculation of
cost-effectiveness ratios, but in general, they may be preferable to significance testing in
cases where researchers wish to know about practical significance rather than statistical
significance. Significance testing tells researchers whether two means are different but
does not assess the magnitude of the difference (Kirk, 1996). Given an effect size, Cohen
(1992) suggests that an effect size is small if it is approximately 0.2, medium if it is
approximately 0.5, and large if it is approximately 0.8. Although it is convenient to have
a decision rule, this categorization may not be useful for educational research results
(Thompson, 2008). Effect sizes from educational effectiveness research that appear small
according to Cohen’s classification may still be practically important (Valentine &
Cooper, 2003, p. 5). For example, an increase from the 50th to the 75th percentile on the
Iowa Test of Basic Skills would appear to be substantial growth. Feldt (1973) found that
in order to achieve that sort of percentile increase on six subtests, the effect size would
range from 0.25 to 0.37 standard deviations depending on grade level. Even though the
percentile growth is substantial, Cohen’s (1992) decision rule would suggest that the
effect sizes are small to medium.
Hill, Bloom, et al. (2007) and Konstantopoulus and Hedges (2006) discuss how to
interpret effect sizes to assess the practical or educational significance of a result, without
a decision rule. Effect sizes should be considered in the context of the populations being
studied, the intervention being examined, and the outcome measures being used (Hill,
Bloom, et al., 2007). Larger effect sizes tend to occur in lower grades; an effect size of,
say, 0.10 standard deviations suggests a more substantial change in upper grades than in
lower ones (Hill, Bloom, et al., 2007, p. 12-13). In the absence of an intervention, a
149
typical year’s worth of growth in reading was approximately one standard deviation from
grades one to two, and 0.6 standard deviations between grades two and three (Hill,
Bloom, et al., 2007, p. 10-11).
Similarly, effect sizes between groups such as blacks and whites or males and
females must be evaluated according to the existing achievement gap between those
groups (Hill, Bloom, et al., 2007). Using National Assessment of Educational Progress,
(NAEP) data, a “feasible goal” of moving a school in the 10th percentile of achievement
to the 30th percentile would require a change of 0.75 standard deviations, or 6.3 scale
points on the NAEP reading test, but just “correspond to a 15-20% [reduction] of the
Black-White achievement gap, a 17-26% [reduction] of the Hispanic-White gap, and a
15-20% [reduction] of the parental education achievement gap” (Konstantopoulos &
Hedges, 2006, p. 27-28). They conclude that “even powerful interventions would be
considered as not so effective if evaluated under the achievement gap framework”
(Konstantopoulos & Hedges, 2006, p. 26). NAEP is not administered to beginning
readers, but this example is instructive in terms of thinking about large versus policy-
relevant effects.
In addition, the instruments used as posttests may differ in focus or scope (Levin
2002b, p. 18). Hill, Bloom, et al. (2007) examined 61 random assignment studies in
education and found wide variation in reported effect sizes depending upon the type of
assessment that was used to measure achievement. “Broadly focused standardized tests”
yielded an overall effect size of 0.07, while “specialized tests” yielded an effect size of
0.44 (Hill, Bloom, et al., 2007). In cases where proprietary or very specialized
instruments are used, we may expect to find larger effect sizes.
150
Study Identification
I identified studies from which effect sizes could be synthesized to create a
weighted average effect size. To find studies, I used the following sources:
• WWC list of reviewed studies, reviewed again according to my criteria.
• Proquest Digital Dissertations.
• Education Resources Information Center (ERIC).
After reviewing 128 articles about Classwide Peer Tutoring, I determined that one
study met the criteria for inclusion. Classwide Peer Tutoring was retained in the analysis,
but its lone measure of effect size from one study makes the results less generalizable
than other programs with effect sizes from a larger number of studies.
The following criteria were used to determine whether a study met evidence
standards:
• The study was available online; through the Columbia University libraries; via
interlibrary loan; or could be easily purchased (e.g., through Amazon).
• The study was written or available in English.
• The study took place in the U.S. (otherwise, differences in school year,
curriculum, ages, demographic characteristics, and many other characteristics
could bias effect sizes).
• The study was quantitative and used experimental or quasi-experimental methods.
• Students were the unit of analysis (i.e., not class/school averages, teachers, etc.).
• Students were in kindergarten through third grade when they participated in the
program or intervention.
151
• Children were learning to read in English (i.e., studies of Lee Conmigo (SFA) and
Descubriendo la Lectura (RR) were not considered).
• The unit of analysis did not have to equal unit of measurement. On this criteria,
note that there is an important difference between my standards and the WWC: I
accepted studies where schools were matched and then some pretest showed that
the differences between students were not significant. WWC does not accept
studies with a mismatched unit of analysis. Chapter 2 provides more information
on this particular WWC criterion and the debate surrounding unit of measurement
and unit of analysis.
• Reading achievement was the outcome variable (i.e., one of the NRP’s five
components of reading instruction; studies about reading attitudes, etc. omitted).
• Children in the treatment group were compared to students receiving no
intervention or some other intervention (or program).
• Pretest scores on a test measuring initial reading achievement levels showed that
students in treatment/experimental and comparison/control groups did not have
significantly different scores (i.e., treatment and comparison groups were
equivalent at baseline).
• Pre- and post-test were administered to treatment and comparison groups at the
same time.
Many studies of the four beginning reading programs do not meet these evidence
standards. In particular, it was somewhat difficult to find studies using comparison
groups, as well as studies where a pretest showed that initial scores were not significantly
152
different. Small sample sizes and brief periods of follow-up are also common issues,
though neither will be grounds for exclusion from this study. Lench (2001) suggests that
study quality may be more important than sample size, so I accepted studies no matter
how small so long as they met the evidence standards. The WWC determined that
beginning reading studies are typically of such a short duration that it would be
appropriate to accept studies whose duration was one day post-intervention (WWC,
2006); I decided to do the same.
Follow-up periods, too, must be considered and properly accounted for when
considering program effects. The period between pre-test and post-test differs among all
of the studies, and some studies offer information about more than one post-test. Studies
with a shorter interval between pre-testing and post-testing may be more likely to show
better results, because of the short duration between program completion and follow-up.
Including the follow-up period as a covariate in a meta-regression allowed me to account
for follow-up in calculating effect size estimates.
Also, selection bias must be considered as a thread to comparisons of the
programs. Schools that decide to implement reading programs must “buy in” to the
programs. It may be fair to assume that after buying in to a program and spending time
developing it, an enthusiastic staff would be more likely to implement it properly, leading
to larger effect sizes. A program like a comprehensive school reform that required more
buy-in may therefore be expected to have larger effects than a small add-on program that
required little buy-in (Levin & McEwan 2002, p. 78). On the other hand, because a
comprehensive school reform presumably affects so many different school outcomes, it is
153
not clear whether we could expect a large effect size on a single outcome or group of
outcomes such as reading measures.
In total, I reviewed 833 studies – 155 about AR, 127 about CWPT, 361 about RR,
and 190 about SFA. For each program, studies were initially identified by searching for
the name of the program. Of the 833 studies, 159 were not actually about the reading
programs being examined (four for AR, 14 for CWPT, 35 for RR, and 106 for SFA). The
high percentage of studies initially identified as being about SFA but actually not about
the program tended to occur because “success for all” appears to be a fairly common
phrase used in dissertation abstracts. Other reasons that a study was labeled as not being
about the program included a mention of the program by study respondents during an
interview or write-in survey response, although the program itself was not examined.
Table 21 provides a summary of the sources of the studies that were identified as
being about the reading program and were reviewed for inclusion in the current study.
Sources were identified as books, doctoral dissertations, masters theses, published work,
and unpublished work. If a study appeared in a journal, it was identified as published
work. Although the particular peer review process for each journal is unknown, it is
assumed that there is some sort of review process for publication in a journal to
“[evaluate]…academic merit” (Marsh & Ball, 1989). If a study indexed on ERIC was
described as a monograph, research center report, report to a particular principal or
superintendent, or it was not indicated that it was published anywhere or used to satisfy
the requirements of a masters or doctoral program, it was classified as an unpublished
work.
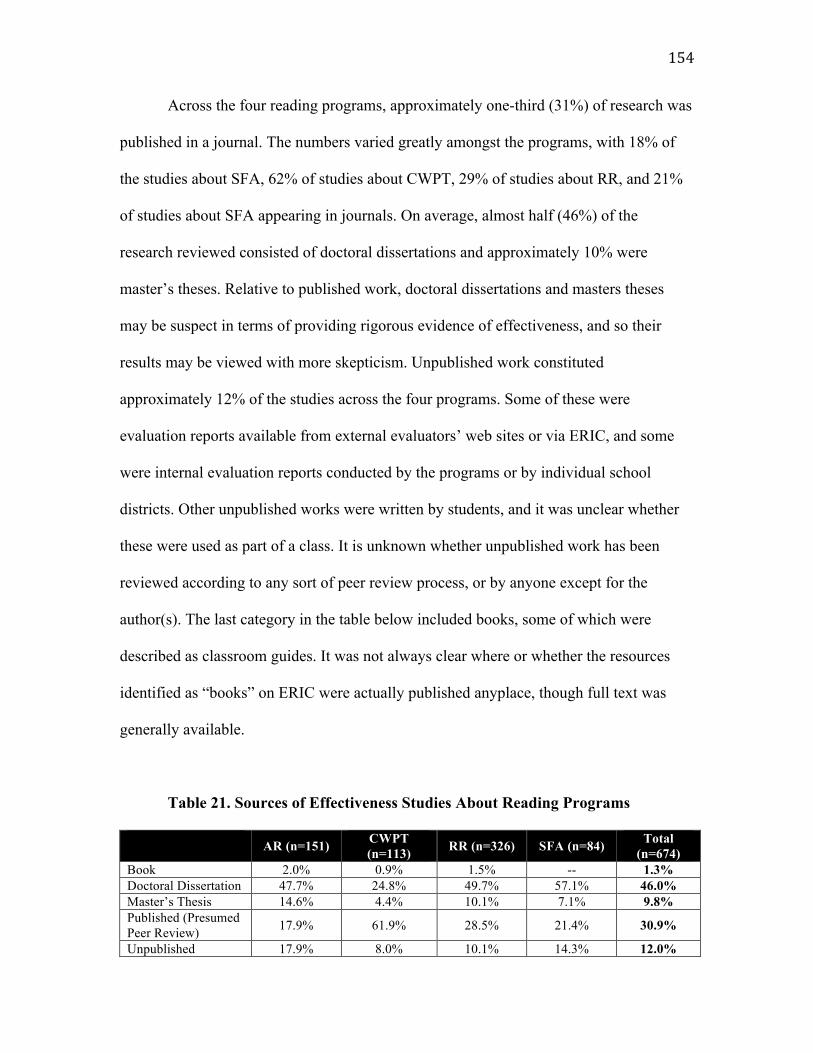
154
Across the four reading programs, approximately one-third (31%) of research was
published in a journal. The numbers varied greatly amongst the programs, with 18% of
the studies about SFA, 62% of studies about CWPT, 29% of studies about RR, and 21%
of studies about SFA appearing in journals. On average, almost half (46%) of the
research reviewed consisted of doctoral dissertations and approximately 10% were
master’s theses. Relative to published work, doctoral dissertations and masters theses
may be suspect in terms of providing rigorous evidence of effectiveness, and so their
results may be viewed with more skepticism. Unpublished work constituted
approximately 12% of the studies across the four programs. Some of these were
evaluation reports available from external evaluators’ web sites or via ERIC, and some
were internal evaluation reports conducted by the programs or by individual school
districts. Other unpublished works were written by students, and it was unclear whether
these were used as part of a class. It is unknown whether unpublished work has been
reviewed according to any sort of peer review process, or by anyone except for the
author(s). The last category in the table below included books, some of which were
described as classroom guides. It was not always clear where or whether the resources
identified as “books” on ERIC were actually published anyplace, though full text was
generally available.
Table 21. Sources of Effectiveness Studies About Reading Programs
AR (n=151) CWPT (n=113) RR (n=326) SFA (n=84) Total
(n=674) Book 2.0% 0.9% 1.5% -- 1.3% Doctoral Dissertation 47.7% 24.8% 49.7% 57.1% 46.0% Master’s Thesis 14.6% 4.4% 10.1% 7.1% 9.8% Published (Presumed Peer Review) 17.9% 61.9% 28.5% 21.4% 30.9%
Unpublished 17.9% 8.0% 10.1% 14.3% 12.0%
155
After determining that a given study was actually about one of the reading
programs, I evaluated the studies using a consistent set of evidence standards. The
evidence standards were a cascade – if a study was not quantitative, for example, it was
not evaluated any further. The order of evidence standards was:
- Quantitative
- Took place in U.S.
- Unit of analysis was students in grades K-3 at time of participation in program
- Uses reading achievement as an outcome variable
- Compares program participants to control or comparison group receiving no
intervention or another intervention
- The program had to be implemented as intended (e.g., RR provided one-to-
one tutoring by a trained RR teacher, and not to small groups or provided by a
volunteer)
- Control/comparison and experimental/treatment groups were shown to be
equivalent at baseline.
- Summary statistics required to calculate effect sizes were available (e.g.,
means, standard deviations, sample sizes).
After removing the studies that were not actually evaluations of the programs
being studied, the table below shows the breakdown of why studies did not meet
evidence standards. Again, if a study was not quantitative, it was not evaluated further.
Qualitative work might not have taken place in the U.S. or studied K-3 students, but that
would not be described in the table below. In the table below, a designation of other
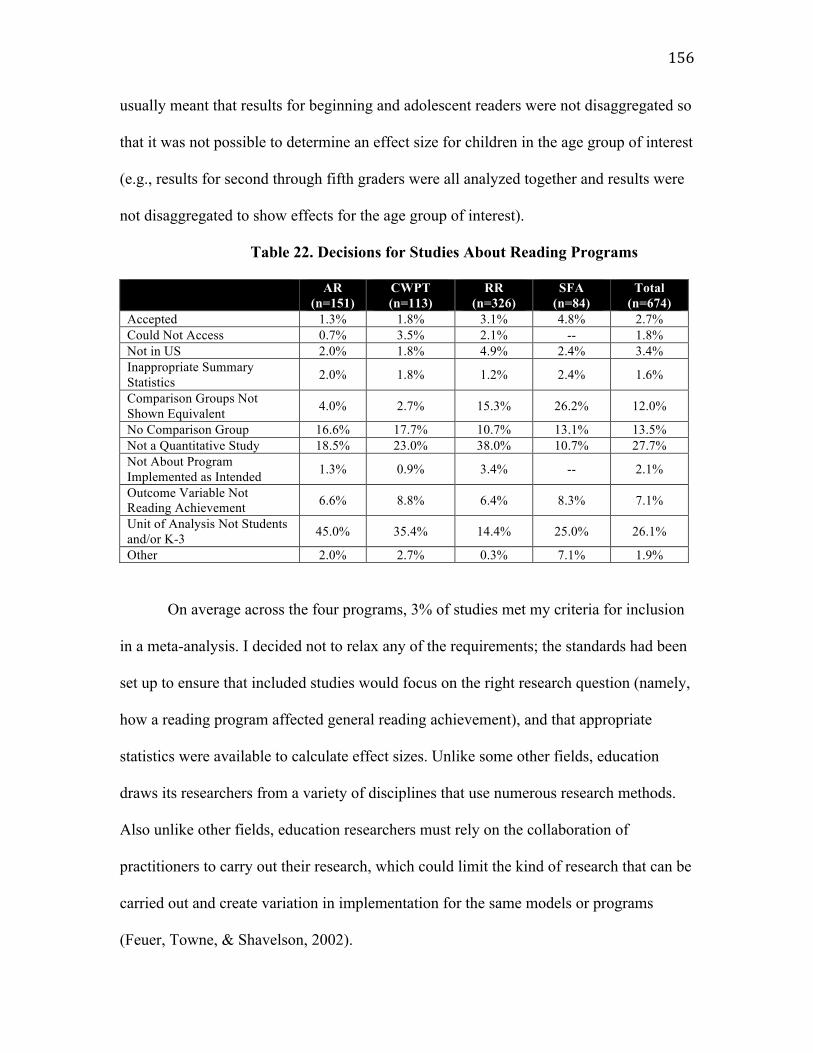
156
usually meant that results for beginning and adolescent readers were not disaggregated so
that it was not possible to determine an effect size for children in the age group of interest
(e.g., results for second through fifth graders were all analyzed together and results were
not disaggregated to show effects for the age group of interest).
Table 22. Decisions for Studies About Reading Programs
AR (n=151)
CWPT (n=113)
RR (n=326)
SFA (n=84)
Total (n=674)
Accepted 1.3% 1.8% 3.1% 4.8% 2.7% Could Not Access 0.7% 3.5% 2.1% -- 1.8% Not in US 2.0% 1.8% 4.9% 2.4% 3.4% Inappropriate Summary Statistics 2.0% 1.8% 1.2% 2.4% 1.6%
Comparison Groups Not Shown Equivalent 4.0% 2.7% 15.3% 26.2% 12.0%
No Comparison Group 16.6% 17.7% 10.7% 13.1% 13.5% Not a Quantitative Study 18.5% 23.0% 38.0% 10.7% 27.7% Not About Program Implemented as Intended 1.3% 0.9% 3.4% -- 2.1%
Outcome Variable Not Reading Achievement 6.6% 8.8% 6.4% 8.3% 7.1%
Unit of Analysis Not Students and/or K-3 45.0% 35.4% 14.4% 25.0% 26.1%
Other 2.0% 2.7% 0.3% 7.1% 1.9%
On average across the four programs, 3% of studies met my criteria for inclusion
in a meta-analysis. I decided not to relax any of the requirements; the standards had been
set up to ensure that included studies would focus on the right research question (namely,
how a reading program affected general reading achievement), and that appropriate
statistics were available to calculate effect sizes. Unlike some other fields, education
draws its researchers from a variety of disciplines that use numerous research methods.
Also unlike other fields, education researchers must rely on the collaboration of
practitioners to carry out their research, which could limit the kind of research that can be
carried out and create variation in implementation for the same models or programs
(Feuer, Towne, & Shavelson, 2002).
157
Another factor that may shape the kind of research conducted by education
researchers includes training in a school of education. Students prepared in schools of
education may not be exposed to enough rigorous courses in methodology and may not
have the educational background to conduct complicated quantitative research (Labaree,
2003). Although this limitation may be less of an issue for peer reviewed publications, it
may be reflected when attempting to use dissertations as rigorous sources of effectiveness
research. The table above is not intended to make a statement about the quality of
education research, nor am I advocating that particular methodology be used to answer
educational questions. My evidence standards were simply set up to facilitate the
calculations required to determine average effect sizes for this particular analysis.
The next section of this chapter describes the studies containing the effect size
measures (or, the information to calculate effect sizes) that will be included in the meta-
analysis for each program. Most of the studies did not use random assignment, though
they did show that the treatment and comparison groups did not have significantly
different scores on some sort of relevant measure at pretest and usually reported about the
similarity of demographic characteristics. Even so, the groups may have differed in ways
that were not observed and/or measured. For example, teachers who are selected to
participate in a reading program may have “bought in” to the new practices and
principles, and will be more motivated or effective in their teaching. As mentioned
earlier, study quality is limited by small group sizes and short follow-up periods – in one
case, as short as 10 weeks. Many of the studies are relatively old; much has changed in
the policy climate and in terms of U.S. demographics over the last 10, 20, and 30 years,
so the results may be less applicable. Also, effectiveness studies frequently examine
158
schools or students in a specific geographic area. Even when demographic information is
presented, it is usually limited to a breakdown of students by race/ethnicity, gender, and
free or reduced lunch status. Generally, we may not have enough information to conclude
that the study would be replicable or generalizable to another setting or context.
Finally, because of the way in which supplemental reading programs and
comprehensive school reforms are funded, the children attending the elementary schools
being studied were more likely to be eligible for free or reduced price lunch than the
average public school student in the U.S. (see reviews of studies considered for each
program for a presentation of demographic characteristics of schools in each study).
Across the U.S., 42.9% of public elementary school students were eligible for a free or
reduced price lunch in the 2007-2008 school year. Many of the studies described a
population in which a much higher percentage of children were eligible for a free or
reduced price meal. This makes sense because supplemental reading programs are often
funded by Title I funding, which is set aside for the schools in which more than 40% of
students come from poor families (NCES, 2011). In 2007-2008, approximately 43% of
elementary schools met this criterion (Schools and Staffing Survey 2007-2008, Table 10).
Accepted Studies
This section reviews the accepted studies about each of the four reading
programs. The studies that I accepted based on my evidence standards are described, as
are the studies that met WWC evidence standards.
159
Accelerated Reader
Four studies about AR met my evidence standards, but it appeared that two of the
four described the same sample of students. Communication with the primary author
could not confirm that the study populations differed, so I included three studies in my
meta-analysis of AR. Two of the studies were large – Nunnery, Ross, and McDonald
(2006) examined 250 third graders and Ross, Nunnery, and Goldfeder (2004) analyzed
data for 578 kindergarteners through third graders. Bullock’s dissertation looked at 32
third graders (16 in each group). In total, the three AR studies examined 860 children in
treatment or control groups. All three studies focused on districts with a relatively high
percentage of children eligible for free or reduced lunch: 61% in Bullock’s study, 81% in
Ross, Nunnery, and Goldfeder (2004), and 83% in Nunnery, Ross, and McDonald (2006).
The results of these studies may be particularly helpful for thinking about what works in
low income communities or for children from less advantaged backgrounds. All of the
studies compared children who participated in AR to those who did not participate in any
supplemental reading program, though we do not know much about the reading
curriculum in non-AR schools.
The three studies had varying follow-up periods: 0.38 school years for Bullock
(2005), 1 school year for Nunnery, Ross, et al (2006) and 2 school years for Ross,
Nunnery and Goldfeder (2004) for an average of 1.2 school years. The results of the two
larger studies show bigger effect sizes for AR than Bullock’s small study. Bullock’s
sample (16 in each group) is small enough that his study likely did not have very much
statistical power, and the study duration may have been too short to discover program
effects. A longer follow-up period may have resulted in positive effects because students
160
would have had ample time to become accustomed to the format and achieve better
results. We also do not know about the quality of implementation in the school.
Bullock’s dissertation (2005), a quasi-experimental study of the effectiveness of AR for
third through fifth graders, ultimately did not find significant differences on vocabulary
and comprehension posttests between treatment and comparison groups. This is in stark
contrast to the study conducted by the Center for Research in Education Policy (CREP)
(2004), which found fairly large effect sizes on STAR computer adaptive tests (reading
for older grades, early literacy for lower grades).
The CREP study had a larger sample size, while Bullock’s study was conducted
across six classrooms in one school, which could explain the differences in findings.
Buy-in for the CREP study may have been more substantial, as teachers were told that
they would be able to participate in AR the following year whether or not they were
chosen to be treatment group teachers, and AR services and materials were provided to
participating schools at no cost. Also, students in the CREP study were assessed on the
basis of performance on computer adaptive tests. Because students in the treatment group
had been taking computer-based AR quizzes for the duration of the study, they may have
been better-prepared for this mode of delivery or have had better test-taking skills.
For effectiveness studies of AR, if the outcome measure is the STAR test, effect
sizes may be large and in favor of AR students because it is a proprietary exam. Students
who received AR services may have become more familiar with the instrument or types
of questions. It is not always clear whether comparison group students would have been
as familiar with the format and questioning as students who had participated in AR.
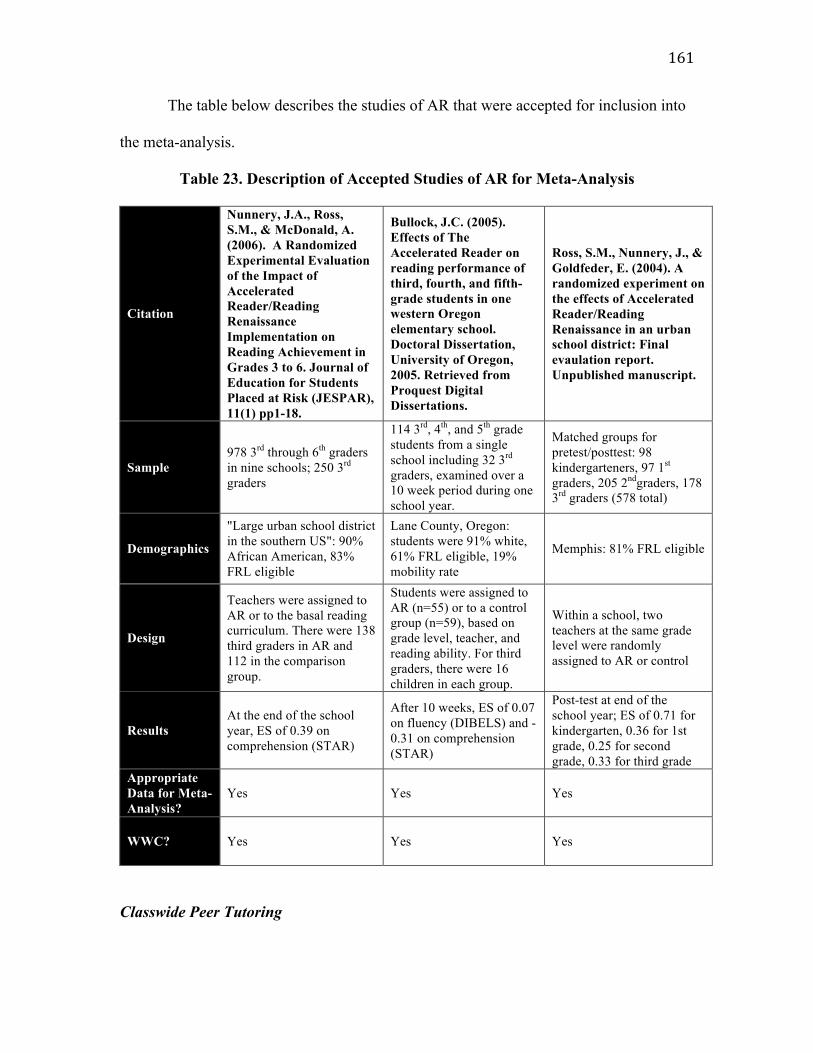
161
The table below describes the studies of AR that were accepted for inclusion into
the meta-analysis.
Table 23. Description of Accepted Studies of AR for Meta-Analysis
Citation
Nunnery, J.A., Ross, S.M., & McDonald, A. (2006). A Randomized Experimental Evaluation of the Impact of Accelerated Reader/Reading Renaissance Implementation on Reading Achievement in Grades 3 to 6. Journal of Education for Students Placed at Risk (JESPAR), 11(1) pp1-18.
Bullock, J.C. (2005). Effects of The Accelerated Reader on reading performance of third, fourth, and fifth-grade students in one western Oregon elementary school. Doctoral Dissertation, University of Oregon, 2005. Retrieved from Proquest Digital Dissertations.
Ross, S.M., Nunnery, J., & Goldfeder, E. (2004). A randomized experiment on the effects of Accelerated Reader/Reading Renaissance in an urban school district: Final evaulation report. Unpublished manuscript.
Sample 978 3rd through 6th graders in nine schools; 250 3rd graders
114 3rd, 4th, and 5th grade students from a single school including 32 3rd graders, examined over a 10 week period during one school year.
Matched groups for pretest/posttest: 98 kindergarteners, 97 1st graders, 205 2ndgraders, 178 3rd graders (578 total)
Demographics
"Large urban school district in the southern US": 90% African American, 83% FRL eligible
Lane County, Oregon: students were 91% white, 61% FRL eligible, 19% mobility rate
Memphis: 81% FRL eligible
Design
Teachers were assigned to AR or to the basal reading curriculum. There were 138 third graders in AR and 112 in the comparison group.
Students were assigned to AR (n=55) or to a control group (n=59), based on grade level, teacher, and reading ability. For third graders, there were 16 children in each group.
Within a school, two teachers at the same grade level were randomly assigned to AR or control
Results At the end of the school year, ES of 0.39 on comprehension (STAR)
After 10 weeks, ES of 0.07 on fluency (DIBELS) and -0.31 on comprehension (STAR)
Post-test at end of the school year; ES of 0.71 for kindergarten, 0.36 for 1st grade, 0.25 for second grade, 0.33 for third grade
Appropriate Data for Meta-Analysis?
Yes Yes Yes
WWC? Yes Yes Yes
Classwide Peer Tutoring
162
The discussion of CWPT must be interpreted with more caution than the other
programs, because only one study of the program met evidence standards. Although the
study involved a relatively large follow-up of 303 students, the sample was comprised
entirely of students from Kansas City who attended first grade in the 1980s. It is not clear
that we could generalize the results to other places, or to first graders in 2010. The study
population was predominantly students of color. The authors did not present information
about any proxy variables to measure or describe the socioeconomic status of the sample,
but we do know that all of the schools received Chapter I funding. The students who did
not participate in CWPT were described as not participating in any intervention though
we do not know about differences in curriculum, teaching effectiveness, or other
variables.
The findings from this study could not be combined using meta-analytic
techniques, even though the paper presented both fourth and sixth grade follow-up
results. The authors did not list all of the required information and the primary author did
not respond to requests for additional information. The WWC’s technical appendix
describing this paper notes that the panel had to contact the study’s primary author to find
out the sample sizes for the fourth grade follow-up. The numbers were excluded from
consideration because of differential attrition. Some students who had been lost to
follow-up in the fourth grade were located in the sixth grade when they attended a
common middle school (WWC, 2007). The information about the sixth grade follow-up
included effect sizes without any sample sizes, means, standard deviations, or results of
significance tests, and so could not be included in calculations of composite dependent
effect sizes.
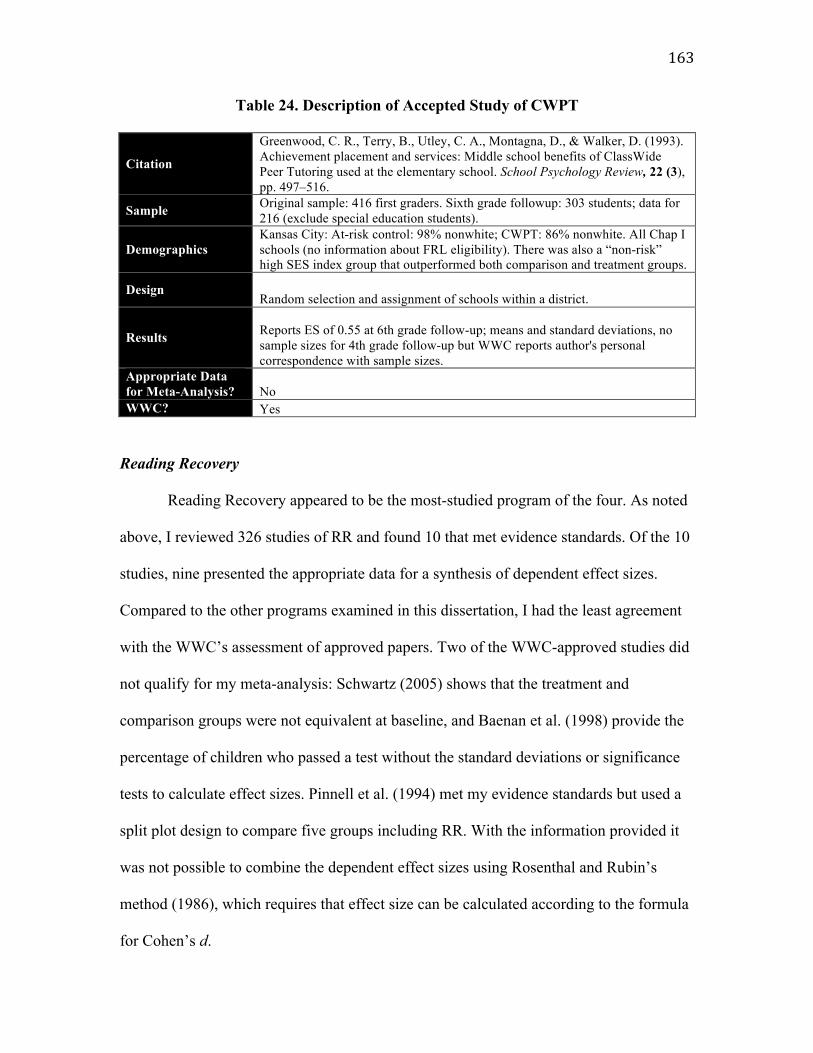
163
Table 24. Description of Accepted Study of CWPT
Citation
Greenwood, C. R., Terry, B., Utley, C. A., Montagna, D., & Walker, D. (1993). Achievement placement and services: Middle school benefits of ClassWide Peer Tutoring used at the elementary school. School Psychology Review, 22 (3), pp. 497–516.
Sample Original sample: 416 first graders. Sixth grade followup: 303 students; data for 216 (exclude special education students).
Demographics Kansas City: At-risk control: 98% nonwhite; CWPT: 86% nonwhite. All Chap I schools (no information about FRL eligibility). There was also a “non-risk” high SES index group that outperformed both comparison and treatment groups.
Design Random selection and assignment of schools within a district.
Results Reports ES of 0.55 at 6th grade follow-up; means and standard deviations, no sample sizes for 4th grade follow-up but WWC reports author's personal correspondence with sample sizes.
Appropriate Data for Meta-Analysis? No WWC? Yes
Reading Recovery
Reading Recovery appeared to be the most-studied program of the four. As noted
above, I reviewed 326 studies of RR and found 10 that met evidence standards. Of the 10
studies, nine presented the appropriate data for a synthesis of dependent effect sizes.
Compared to the other programs examined in this dissertation, I had the least agreement
with the WWC’s assessment of approved papers. Two of the WWC-approved studies did
not qualify for my meta-analysis: Schwartz (2005) shows that the treatment and
comparison groups were not equivalent at baseline, and Baenan et al. (1998) provide the
percentage of children who passed a test without the standard deviations or significance
tests to calculate effect sizes. Pinnell et al. (1994) met my evidence standards but used a
split plot design to compare five groups including RR. With the information provided it
was not possible to combine the dependent effect sizes using Rosenthal and Rubin’s
method (1986), which requires that effect size can be calculated according to the formula
for Cohen’s d.
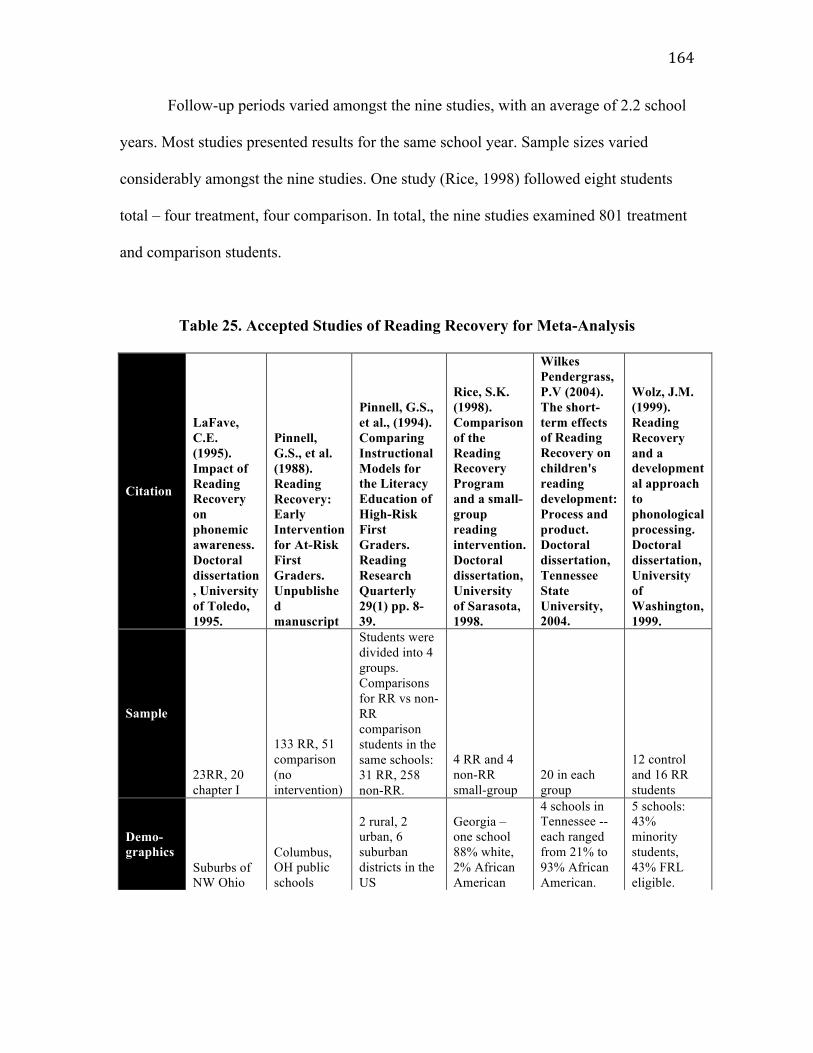
164
Follow-up periods varied amongst the nine studies, with an average of 2.2 school
years. Most studies presented results for the same school year. Sample sizes varied
considerably amongst the nine studies. One study (Rice, 1998) followed eight students
total – four treatment, four comparison. In total, the nine studies examined 801 treatment
and comparison students.
Table 25. Accepted Studies of Reading Recovery for Meta-Analysis
Citation
LaFave, C.E. (1995). Impact of Reading Recovery on phonemic awareness. Doctoral dissertation, University of Toledo, 1995.
Pinnell, G.S., et al. (1988). Reading Recovery: Early Intervention for At-Risk First Graders. Unpublished manuscript
Pinnell, G.S., et al., (1994). Comparing Instructional Models for the Literacy Education of High-Risk First Graders. Reading Research Quarterly 29(1) pp. 8-39.
Rice, S.K. (1998). Comparison of the Reading Recovery Program and a small-group reading intervention. Doctoral dissertation, University of Sarasota, 1998.
Wilkes Pendergrass, P.V (2004). The short-term effects of Reading Recovery on children's reading development: Process and product. Doctoral dissertation, Tennessee State University, 2004.
Wolz, J.M. (1999). Reading Recovery and a developmental approach to phonological processing. Doctoral dissertation, University of Washington, 1999.
Sample
23RR, 20 chapter I
133 RR, 51 comparison (no intervention)
Students were divided into 4 groups. Comparisons for RR vs non-RR comparison students in the same schools: 31 RR, 258 non-RR.
4 RR and 4 non-RR small-group
20 in each group
12 control and 16 RR students
Demo-graphics
Suburbs of NW Ohio
Columbus, OH public schools
2 rural, 2 urban, 6 suburban districts in the US
Georgia – one school 88% white, 2% African American
4 schools in Tennessee -- each ranged from 21% to 93% African American.
5 schools: 43% minority students, 43% FRL eligible.
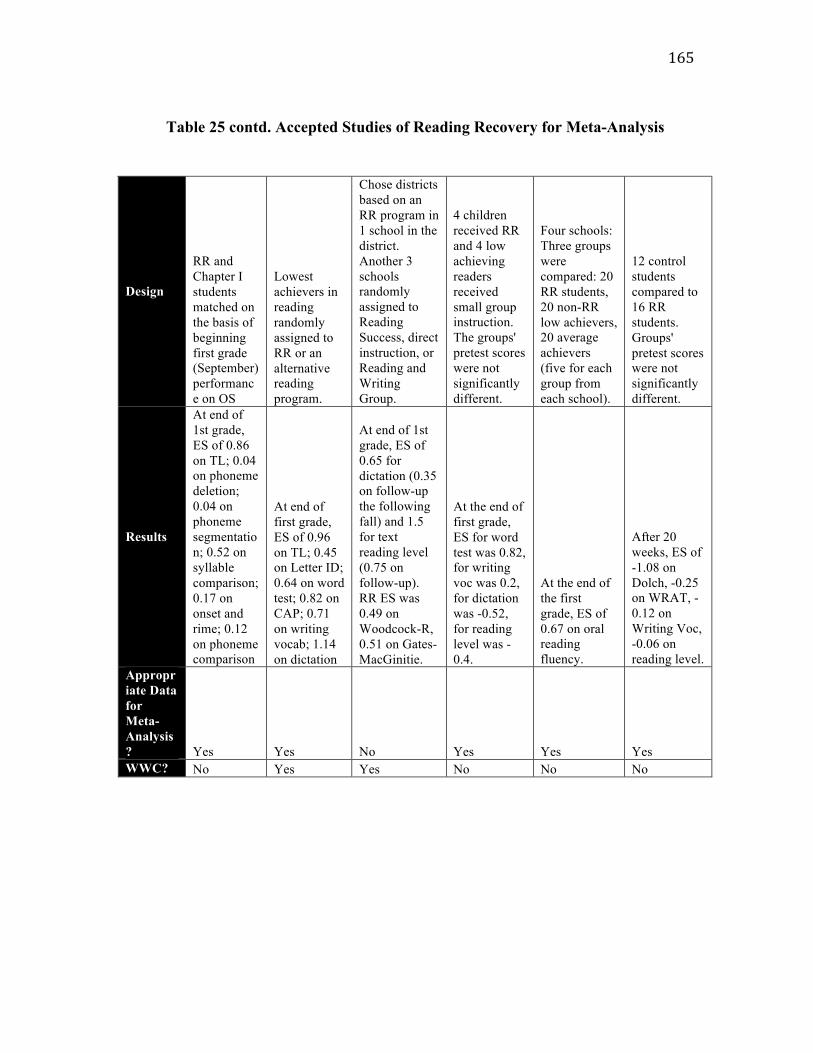
165
Table 25 contd. Accepted Studies of Reading Recovery for Meta-Analysis
Design
RR and Chapter I students matched on the basis of beginning first grade (September) performance on OS
Lowest achievers in reading randomly assigned to RR or an alternative reading program.
Chose districts based on an RR program in 1 school in the district. Another 3 schools randomly assigned to Reading Success, direct instruction, or Reading and Writing Group.
4 children received RR and 4 low achieving readers received small group instruction. The groups' pretest scores were not significantly different.
Four schools: Three groups were compared: 20 RR students, 20 non-RR low achievers, 20 average achievers (five for each group from each school).
12 control students compared to 16 RR students. Groups' pretest scores were not significantly different.
Results
At end of 1st grade, ES of 0.86 on TL; 0.04 on phoneme deletion; 0.04 on phoneme segmentation; 0.52 on syllable comparison; 0.17 on onset and rime; 0.12 on phoneme comparison
At end of first grade, ES of 0.96 on TL; 0.45 on Letter ID; 0.64 on word test; 0.82 on CAP; 0.71 on writing vocab; 1.14 on dictation
At end of 1st grade, ES of 0.65 for dictation (0.35 on follow-up the following fall) and 1.5 for text reading level (0.75 on follow-up). RR ES was 0.49 on Woodcock-R, 0.51 on Gates-MacGinitie.
At the end of first grade, ES for word test was 0.82, for writing voc was 0.2, for dictation was -0.52, for reading level was -0.4.
At the end of the first grade, ES of 0.67 on oral reading fluency.
After 20 weeks, ES of -1.08 on Dolch, -0.25 on WRAT, -0.12 on Writing Voc, -0.06 on reading level.
Appropriate Data for Meta-Analysis? Yes Yes No Yes Yes Yes WWC? No Yes Yes No No No
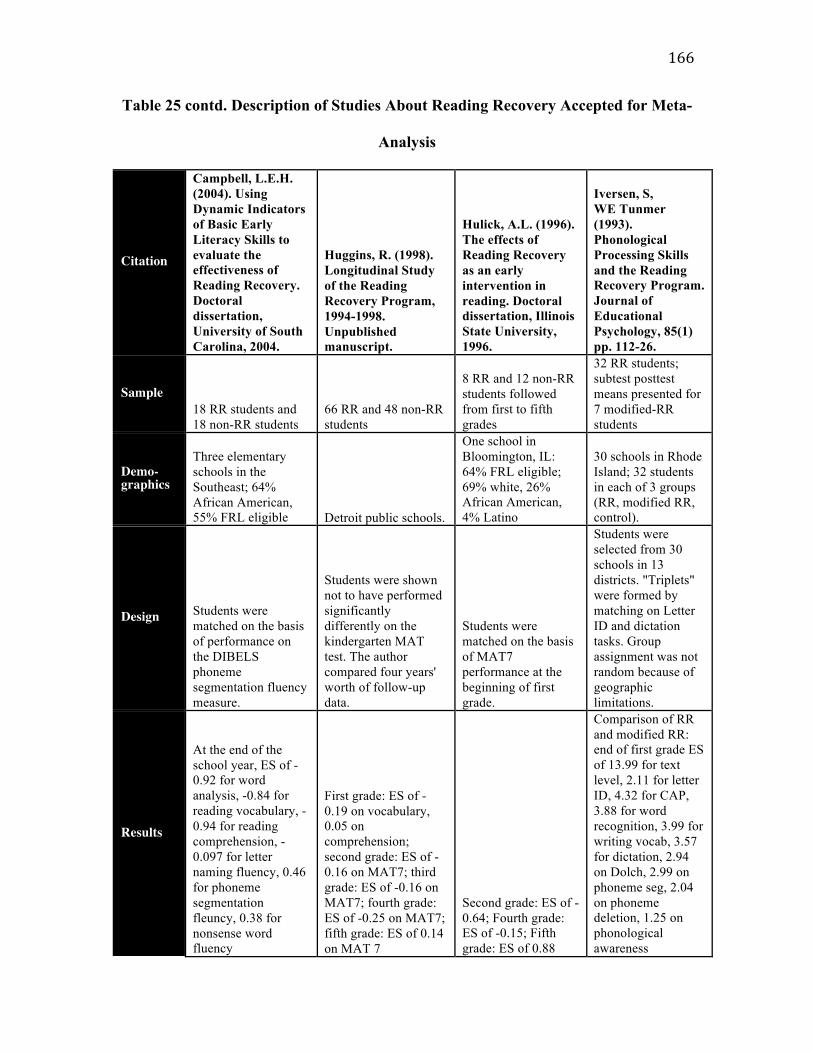
166
Table 25 contd. Description of Studies About Reading Recovery Accepted for Meta-
Analysis
Citation
Campbell, L.E.H. (2004). Using Dynamic Indicators of Basic Early Literacy Skills to evaluate the effectiveness of Reading Recovery. Doctoral dissertation, University of South Carolina, 2004.
Huggins, R. (1998). Longitudinal Study of the Reading Recovery Program, 1994-1998. Unpublished manuscript.
Hulick, A.L. (1996). The effects of Reading Recovery as an early intervention in reading. Doctoral dissertation, Illinois State University, 1996.
Iversen, S, WE Tunmer (1993). Phonological Processing Skills and the Reading Recovery Program. Journal of Educational Psychology, 85(1) pp. 112-26.
Sample 18 RR students and 18 non-RR students
66 RR and 48 non-RR students
8 RR and 12 non-RR students followed from first to fifth grades
32 RR students; subtest posttest means presented for 7 modified-RR students
Demo-graphics
Three elementary schools in the Southeast; 64% African American, 55% FRL eligible Detroit public schools.
One school in Bloomington, IL: 64% FRL eligible; 69% white, 26% African American, 4% Latino
30 schools in Rhode Island; 32 students in each of 3 groups (RR, modified RR, control).
Design Students were matched on the basis of performance on the DIBELS phoneme segmentation fluency measure.
Students were shown not to have performed significantly differently on the kindergarten MAT test. The author compared four years' worth of follow-up data.
Students were matched on the basis of MAT7 performance at the beginning of first grade.
Students were selected from 30 schools in 13 districts. "Triplets" were formed by matching on Letter ID and dictation tasks. Group assignment was not random because of geographic limitations.
Results
At the end of the school year, ES of -0.92 for word analysis, -0.84 for reading vocabulary, -0.94 for reading comprehension, -0.097 for letter naming fluency, 0.46 for phoneme segmentation fleuncy, 0.38 for nonsense word fluency
First grade: ES of -0.19 on vocabulary, 0.05 on comprehension; second grade: ES of -0.16 on MAT7; third grade: ES of -0.16 on MAT7; fourth grade: ES of -0.25 on MAT7; fifth grade: ES of 0.14 on MAT 7
Second grade: ES of -0.64; Fourth grade: ES of -0.15; Fifth grade: ES of 0.88
Comparison of RR and modified RR: end of first grade ES of 13.99 for text level, 2.11 for letter ID, 4.32 for CAP, 3.88 for word recognition, 3.99 for writing vocab, 3.57 for dictation, 2.94 on Dolch, 2.99 on phoneme seg, 2.04 on phoneme deletion, 1.25 on phonological awareness
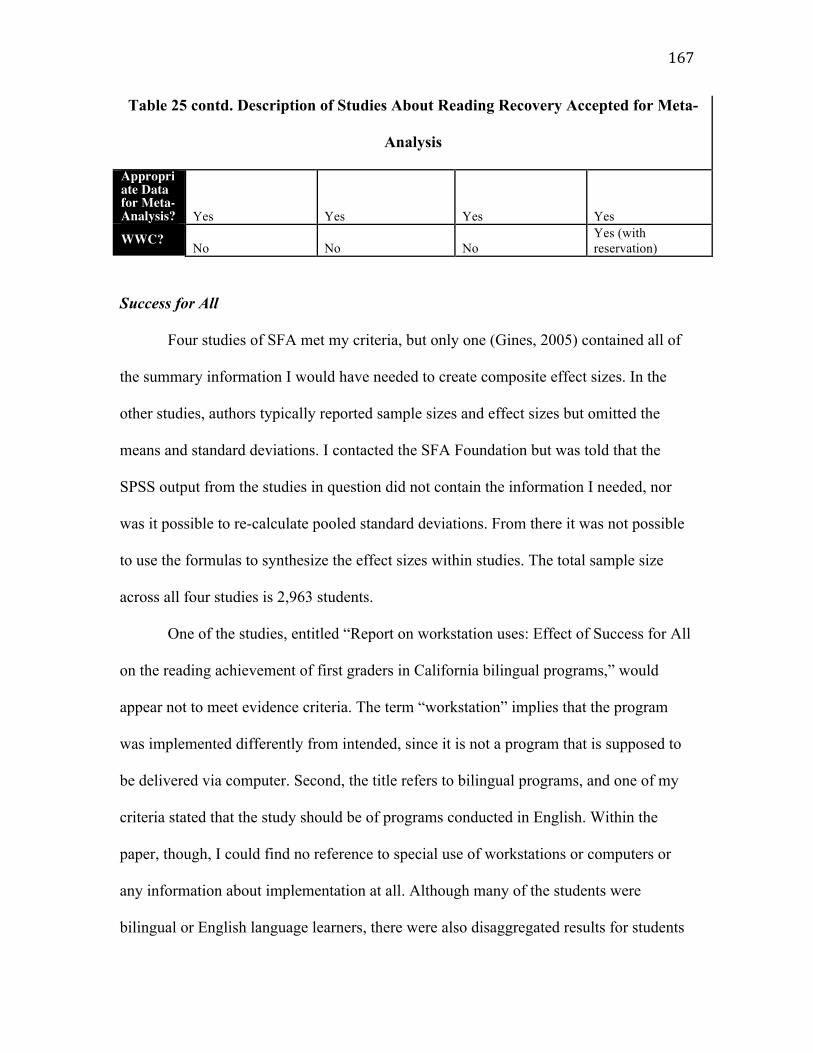
167
Table 25 contd. Description of Studies About Reading Recovery Accepted for Meta-
Analysis
Appropriate Data for Meta-Analysis? Yes Yes Yes Yes
WWC? No No No
Yes (with reservation)
Success for All
Four studies of SFA met my criteria, but only one (Gines, 2005) contained all of
the summary information I would have needed to create composite effect sizes. In the
other studies, authors typically reported sample sizes and effect sizes but omitted the
means and standard deviations. I contacted the SFA Foundation but was told that the
SPSS output from the studies in question did not contain the information I needed, nor
was it possible to re-calculate pooled standard deviations. From there it was not possible
to use the formulas to synthesize the effect sizes within studies. The total sample size
across all four studies is 2,963 students.
One of the studies, entitled “Report on workstation uses: Effect of Success for All
on the reading achievement of first graders in California bilingual programs,” would
appear not to meet evidence criteria. The term “workstation” implies that the program
was implemented differently from intended, since it is not a program that is supposed to
be delivered via computer. Second, the title refers to bilingual programs, and one of my
criteria stated that the study should be of programs conducted in English. Within the
paper, though, I could find no reference to special use of workstations or computers or
any information about implementation at all. Although many of the students were
bilingual or English language learners, there were also disaggregated results for students
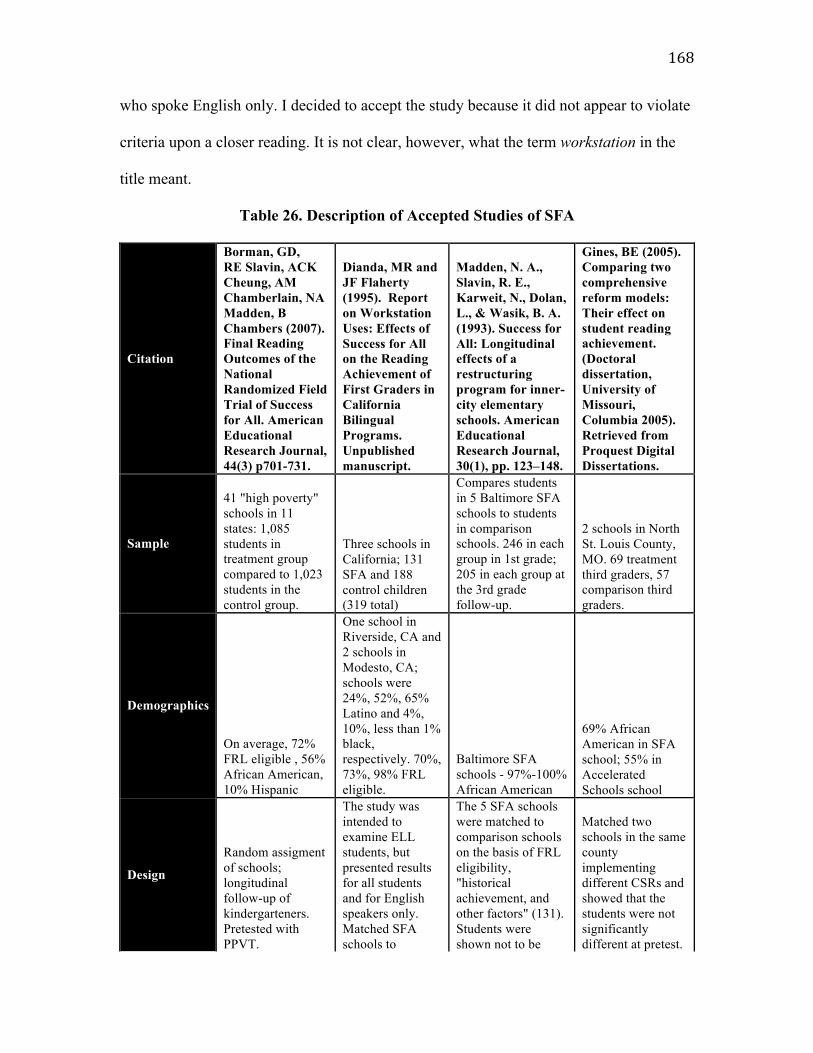
168
who spoke English only. I decided to accept the study because it did not appear to violate
criteria upon a closer reading. It is not clear, however, what the term workstation in the
title meant.
Table 26. Description of Accepted Studies of SFA
Citation
Borman, GD, RE Slavin, ACK Cheung, AM Chamberlain, NA Madden, B Chambers (2007). Final Reading Outcomes of the National Randomized Field Trial of Success for All. American Educational Research Journal, 44(3) p701-731.
Dianda, MR and JF Flaherty (1995). Report on Workstation Uses: Effects of Success for All on the Reading Achievement of First Graders in California Bilingual Programs. Unpublished manuscript.
Madden, N. A., Slavin, R. E., Karweit, N., Dolan, L., & Wasik, B. A. (1993). Success for All: Longitudinal effects of a restructuring program for inner-city elementary schools. American Educational Research Journal, 30(1), pp. 123–148.
Gines, BE (2005). Comparing two comprehensive reform models: Their effect on student reading achievement. (Doctoral dissertation, University of Missouri, Columbia 2005). Retrieved from Proquest Digital Dissertations.
Sample
41 "high poverty" schools in 11 states: 1,085 students in treatment group compared to 1,023 students in the control group.
Three schools in California; 131 SFA and 188 control children (319 total)
Compares students in 5 Baltimore SFA schools to students in comparison schools. 246 in each group in 1st grade; 205 in each group at the 3rd grade follow-up.
2 schools in North St. Louis County, MO. 69 treatment third graders, 57 comparison third graders.
Demographics
On average, 72% FRL eligible , 56% African American, 10% Hispanic
One school in Riverside, CA and 2 schools in Modesto, CA; schools were 24%, 52%, 65% Latino and 4%, 10%, less than 1% black, respectively. 70%, 73%, 98% FRL eligible.
Baltimore SFA schools - 97%-100% African American
69% African American in SFA school; 55% in Accelerated Schools school
Design
Random assigment of schools; longitudinal follow-up of kindergarteners. Pretested with PPVT.
The study was intended to examine ELL students, but presented results for all students and for English speakers only. Matched SFA schools to
The 5 SFA schools were matched to comparison schools on the basis of FRL eligibility, "historical achievement, and other factors" (131). Students were shown not to be
Matched two schools in the same county implementing different CSRs and showed that the students were not significantly different at pretest.
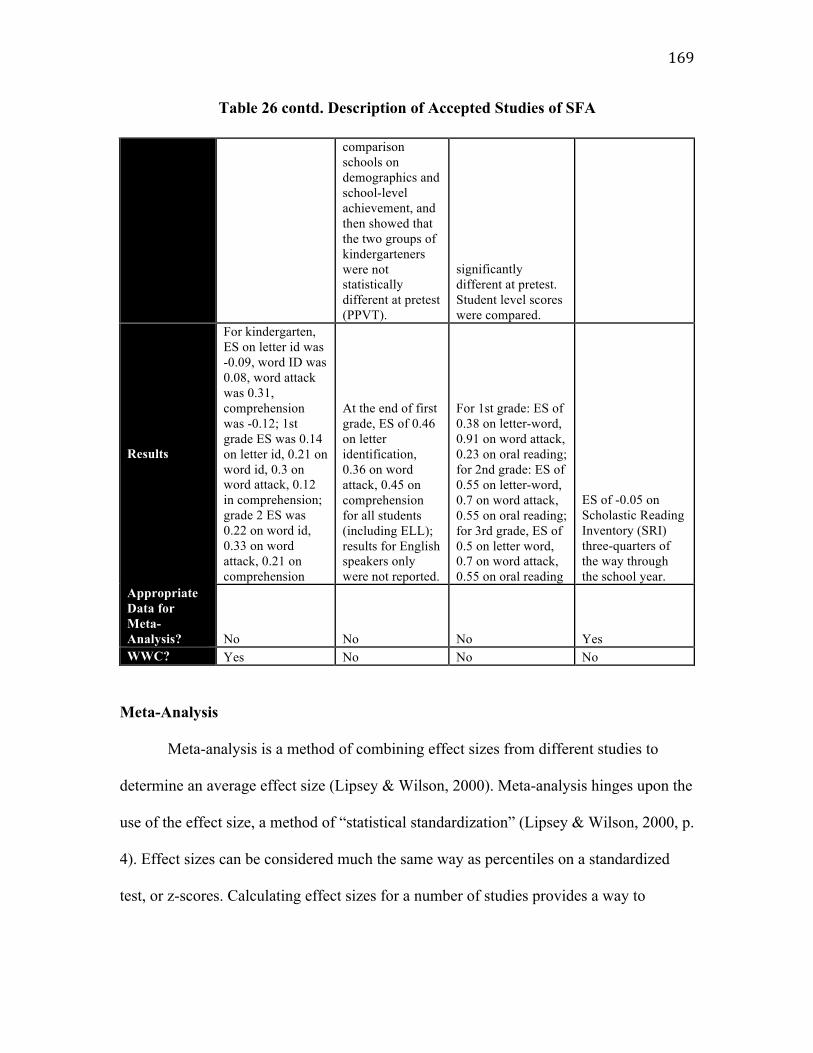
169
Table 26 contd. Description of Accepted Studies of SFA
comparison schools on demographics and school-level achievement, and then showed that the two groups of kindergarteners were not statistically different at pretest (PPVT).
significantly different at pretest. Student level scores were compared.
Results
For kindergarten, ES on letter id was -0.09, word ID was 0.08, word attack was 0.31, comprehension was -0.12; 1st grade ES was 0.14 on letter id, 0.21 on word id, 0.3 on word attack, 0.12 in comprehension; grade 2 ES was 0.22 on word id, 0.33 on word attack, 0.21 on comprehension
At the end of first grade, ES of 0.46 on letter identification, 0.36 on word attack, 0.45 on comprehension for all students (including ELL); results for English speakers only were not reported.
For 1st grade: ES of 0.38 on letter-word, 0.91 on word attack, 0.23 on oral reading; for 2nd grade: ES of 0.55 on letter-word, 0.7 on word attack, 0.55 on oral reading; for 3rd grade, ES of 0.5 on letter word, 0.7 on word attack, 0.55 on oral reading
ES of -0.05 on Scholastic Reading Inventory (SRI) three-quarters of the way through the school year.
Appropriate Data for Meta-Analysis? No No No Yes WWC? Yes No No No
Meta-Analysis
Meta-analysis is a method of combining effect sizes from different studies to
determine an average effect size (Lipsey & Wilson, 2000). Meta-analysis hinges upon the
use of the effect size, a method of “statistical standardization” (Lipsey & Wilson, 2000, p.
4). Effect sizes can be considered much the same way as percentiles on a standardized
test, or z-scores. Calculating effect sizes for a number of studies provides a way to
170
compare results even when the instruments used were very different (Lipsey & Wilson,
2000, p. 4).
As mentioned earlier, effect sizes may be preferable to reports of statistical
significance because they show the magnitude of the effect and allow for ready
comparison to other programs. Statistical significance is a representation of the sampling
error around a point estimate, and the error is highly dependent upon sample size (Lipsey
&Wilson, 2000). Meta-analytic methods can be used to combine effect sizes within
studies, and then effect sizes across studies, to generate an average effect size. The
average effect size could then be used in calculations for cost-effectiveness ratios.
The studies that met evidence standards presented a few methodological issues.
First, although some studies met evidence standards based on methodology and the
information presented, the summary statistics required to perform the statistical
calculations for this specific type of meta-analysis were not always available. Ultimately,
I decided to proceed by conducting a meta-analysis for two of the programs: AR (three
studies) and RR (nine studies). The number of studies for each program was small. This
has been shown to bias the results, particularly the standard errors (Brannick & Hall,
2001). Meta-analyses of few studies, however, are relatively common (Hoyle, 1999).
Traditional meta-analysis assumes that each study contributes one effect size. The
studies that met evidence standards usually included a number of effect sizes for various
outcomes. Studies that present a number of different outcome measures are called
multiple endpoint studies. They may be interesting for readers and decision makers, but
they present statistical challenges in terms of appropriately combining dependent effect
sizes. When a study presents a number of effect sizes, the outcomes may consist of

171
different assessments, skills, and/or scales (e.g., a vocabulary test, an assessment of
phonemic awareness, and results of a comprehension quiz). In some cases, the authors
may have provided effect sizes for different subpopulations (e.g., the entire group, lowest
25% of readers, English language learners) or for different grades. When this is the case,
it is not clear that effect sizes for different subgroups would or should be the same. A
reading program or intervention could be expected to affect different subpopulations in
different ways. Also, when a study contributes two or more effect sizes, this violates a
key assumption for meta-analysis – namely, that effect sizes are independent.
A number of methods have been proposed to account for dependent effect sizes,
including using a predetermined decision rule to accept just one; taking the simple
average, which is technically incorrect because it does not take account of the variance of
the estimates; or choosing an effect size from each study at random. Rosenthal and Rubin
(1986) proposed the method used in this study for combining dependent effect sizes when
the effect size is based upon the standardized mean difference. Using their method, the
average effect size is straightforward to calculate once the researcher has generated the
required summary statistics.
To calculate the variance for each of the effect sizes, I used Hedges et al.’s (2010)
suggestion to square the pooled standard deviations for each effect size within a study,
and then take the simple average of that. The inverse variance weights were then
calculated using these numbers. Because of the small number of studies and the
homogeneity of all of the effect size estimates (as measured by the Q statistic; see
Appendix VI), it was appropriate to calculate the average variance and use the following
equation:
172
(Hedges, Tipton, & Johnson, 2010)
which is the fixed effect estimate. Between-study correlations would have to be known to
calculate the random effects inverse variance weight. A common problem is that
correlations and covariance matrices are not typically published as part of a research
study. Ishak, Platt, et al. (2008) showed that when the number of studies was small, a
correlation of 1 or -1 was a typical finding, so again, the fixed effects estimate of inverse
variance weights would likely be appropriate.
The average effect size is estimated as follows: the numerator is the study weight
times the effect size, and the denominator is the square root of the multiple correlation
times the sum of study weights, squared + (one minus the multiple correlation) times the
sum of study weights squared. The assumptions of the formula require that only studies
that use Cohen’s d (or allow it to be calculated) are included. Studies that used other
measures to obtain the effect size had to be excluded to use this method.
(Rosenthal & Rubin, 1986)
By using the data analysis feature in Excel and running a regression using effect
size as the dependent variable and the treatment and control means as covariates, I
obtained summary statistics including obtained multiple correlations, mean squared
errors, and t-statistics. I had access to a number of variables that described the studies at
the study level, such as sample sizes and demographics. All of these variables would have
had the same value for each of the outcome measures in the study, however, rendering
them useless for a regression. The only variables I had that differed at the study level for

173
each of the outcome measures were the posttest means. The covariates I was able to use
may seem tautological, because effect size is calculated using the treatment and
comparison group means. Since the purpose of the data analysis for this step was to
generate multiple correlations, including these means as predictors is similar to the health
literature in which outcome rates are included as covariates. These types of models are
referred to as modeling “underlying risk” (Burns, Catty, et al., 2007, Thompson &
Higgins, 2002). Although the meta-regression is not complex enough using these means
as covariates, this kind of usage is found in the literature and provides a way to generate
the necessary summary statistics to proceed with the method.
After calculating these numbers, I was able to use David Wilson’s formulas
(accessed via http://mason.gmu.edu/~dwilsonb/ma.html) to determine the average effect
size across studies. Wilson’s published formulas use the inverse variance weight.
An addition was the publication of more than one article or report using the same
study sample. When more than one study has been published about the same sample, only
one can contribute effect sizes to the meta-analysis (Stevens & Taylor, 2009; Petitti,
2000). The decision rule I used was to include the study with the longest follow-up
period. Presumably, a decision maker would wish choose the program with the most far-
reaching outcomes, suggesting that the study with the longest follow-up period would be
of greatest interest and use.
Weighting Literacy Outcomes
As mentioned earlier, Levin (2002b, p. 18) cautions about the use of effect sizes
because various instruments that are used may not place the same amount of emphasis on

174
different skills. It is clear that the beginning reading instruments used as assessments
were not all the same – for example, the effect size for a phonemic awareness task does
not require the same skills as an oral dictation task, which would not use the same skills
as taking a standardized state test. To deal with this issue, I created a survey to categorize
literacy instruments according to the components of essential reading instruction
identified by the National Reading Panel (NRP) (2000): phonemic awareness, phonics,
fluency, vocabulary, and comprehension. (The NRP’s report was discussed in detail in
Chapter 2.) This is a form of sensitivity analysis for the effectiveness part of the cost-
effectiveness ratios. By varying the weights placed on each of the outcome measures, we
can see how cost-effectiveness ratios change as a result of changes in the overall
effectiveness measure when they have been weighted differently.
The five areas identified by the NRP as critical components of reading instruction
were incorporated into Reading First, part of the No Child Left Behind legislation.
Because of the widespread impact of this legislation, experienced literacy professionals
are likely to be extremely familiar with the NRP’s findings. If we hypothesize that some
types of literacy outcomes may be more important for creating a successful beginning
reader, then it may be instructive to ask literacy professionals to weight literacy outcomes
to respond to Levin’s (2002b) criticism of the use of effect sizes from different
instruments in cost-effectiveness analyses.
Also, the rationale for weighting literacy outcomes concerns the way in which the
WWC ultimately presents studies. Once a study meets the WWC’s evidence standards,
the Clearinghouse does not distinguish between different types of outcomes. A survey of
education professionals whose primary area of expertise or interest is literacy would help
175
create weights for different reading outcomes. The results of such a survey would provide
perspective as to how various outcomes are regarded in terms of creating a successful
beginning (i.e., kindergarten through grade three) reader. A constant sum scaling – that is,
allocation of 100 points amongst the outcomes to obtain an estimate of weights – would
be a simple way to generate the weights.
Weights assigned to the five components of effective literacy instruction will be
most credible if a group of known literacy specialists responds to the survey. The
Massachusetts Reading Association (MRA) agreed to invite their membership of nearly
1,500 professionals (approximately half of whom were considered to be “engaged”
members) to respond to a short survey about effective literacy instruction. The survey
was administered on the Internet using Survey Monkey, a web based application.
Internet-based surveys are relatively low cost compared to paper surveys. Also, Web
surveys simplify data entry and management and allow respondents to remain
anonymous. Greenlaw and Brown-Welty (2009) showed that an Internet survey of
American Evaluation Association (AEA) members also had the advantage of a higher
response rate than a traditional paper survey (52.5% versus 43.0%) (472). I hypothesized
that a Web-based survey would increase the response rate and perhaps the likelihood of
getting a representative sample of respondents. An eight-question survey was unlikely to
pose a burden to potential respondents in terms of time commitment. Studies
investigating the effect of web-based questionnaire length on response rates appeared to
focus on much longer surveys (Vicente & Reis, 2010).
To encourage respondents to complete the survey, I collaborated with the MRA to
create an instrument that consisted only of questions that were directly relevant to the
176
research question, and that were expected to be of particular interest to potential
respondents (Cook, Heath, & Thompson, 2000). The survey was brief, consisting of eight
questions. Initially, I thought that just one question was required to generate the weights
needed for the dissertation research. The MRA wished to develop additional questions to
learn more about their members’ thoughts on creating successful readers. (Please see
Appendix 2 for the full text of the survey.) The final version of the survey included two
questions to create weights for the dissertation: I asked respondents to allocate 100 points
amongst the five outcomes for all beginning (i.e., K-3) readers as well as for struggling
beginning (i.e., K-3) readers. The allocation of points amongst alternatives in surveys is
called “constant sum scaling” (Plug, 1977). By choosing a relatively small number of
outcomes amongst which to allocate 100 points, the task was likely to be easy for
respondents to complete (McDaniel & Gates, 1998).
The survey was launched in August 2010 via the Internet. Telephone and mail
surveys were not administered. The President of the MRA emailed a letter of
introduction, including text from me that described the survey and the purpose of the
research. The MRA would not release its membership email list to me to use to generate
survey invitations; instead, they sent an email with a link to the survey. To ensure
respondents’ anonymity, the survey was unauthenticated. This means that respondents
did not receive an email with a personalized link, but rather received a mass email and all
clicked through to the same link. All responses were anonymous and there was no way to
track who had responded or even to prevent people from responding more than once.
Because everyone shared the same link, it could not be tied to any particular invitation or
email address. It would have been impossible to authenticate the survey and identify
177
respondents by a unique identifier such as email address because the MRA was only
willing to send the invitation via their email marketing system.
Because participation was to be anonymous and because all respondents shared
the same survey link, it was not possible to offer an incentive to individuals to encourage
them to complete the survey. Prior to agreeing to collaborate with me, the MRA board
requested that survey results be shared with the membership. Because of this agreement
and the measures taken to ensure respondents’ anonymity, respondents could not be
offered a preview of the survey results as a “teaser” or incentive. Cook et al. (2000)
conducted a meta-analysis of web and mail survey response rates, and found that
incentives did not increase response rates. Incentives may be of greater value for longer
or more tedious surveys, where such obstacles to responding have a negative impact on
response rates (Cook et al., 2000).
A survey invitation was emailed to 1,476 members; 16 emails bounced and I
removed myself from the list of eligible respondents, resulting in 1,459 members invited
to participate. A reminder e-mail was sent in September 2010, two weeks after the survey
launch. The reminder text included an appeal from the president and additional text from
me. In all, 148 people (10.1% of all invited) responded to the survey. Of those who did
click through to the survey page, approximately 93% of respondents (136 people)
completed the survey. Most of the drop-off occurred after the two constant sum scaling
questions (allocation amongst alternatives of 100 points) that were to be used in the
dissertation. This suggests that drop-off was not an important issue for the two questions
required for the dissertation research.
178
A response rate of 10% is low and respondents can be considered to have been
“self selected” (Fowler, 2009, p. 51). The effect on precision of estimates with such a low
response rate is considerable: given a 10% response rate, if 50% of respondents answered
yes to a given dichotomous question, the actual rate of people responding yes in the
population as a whole could range from 5% to 95% (Fowler, 2009, p. 55).
The total number of people invited may not be the most appropriate denominator
for the response rate, however. According to a prior evaluation by an MRA member,
approximately 41% (600 members) of the membership can be considered active or
engaged. I was unable to obtain a copy of the evaluation or more details about how an
active status was determined. The fee to join the MRA was $25 in 2010, which is a
relatively small amount of money. Members may be willing to pay the fee to maintain
their connection to the group without planning to participate in association surveys,
conferences, and publications. A representative of the MRA suggested that calculating
the response rate using the number of active members could be more appropriate than the
total number that received the invitation. Doing so would yield a response rate of 24.7%,
which would imply a slightly improved precision of survey estimates. According to
Fowler, when the response rate is 30%, if 50% of respondents answer “yes” to a
dichotomous yes/no question then the actual number is somewhere between 15% and
85%, inclusive.
A high response rate is essential in cases where the researcher is hoping for a
representative sample of respondents so that results can be generalized to a larger
population. Results of the current survey cannot be generalized to the population of U.S.
literacy specialists – we do not know how members of the Massachusetts Reading
179
Association, whose membership is open to all interested parties, differ from professionals
around the country who have indicated an interest or specialty in literacy. We do not even
know whether MRA members could be considered literacy specialists by any objective
standard. The survey results, then, can be used to begin a discussion about how self-
defined and self-selected literacy professionals view the literacy pillars determined by an
academic committee. For an exploratory study like this one, a low response rate may not
be a critical issue.
A survey of members of the MRA may be considered a convenience sample – we
do not know who joins the MRA, or whether their perspectives on literacy education
differ from those of specialists that do not join the MRA. We do not know whether ideas
about beginning literacy amongst Massachusetts literacy professionals are different from
professionals in other states. The results are suggestive rather than final, and all
conclusions should be interpreted with great caution. Finally, I was not able to confirm
that the survey respondents were representative of the MRA membership. I had asked a
question to allow respondents to indicate their primary affiliation, such as elementary
school teacher, secondary school teacher, reading teacher, administrator, or professor. In
2010, the MRA conducted an evaluation of its members at their annual conference. I was
unable to obtain a copy of the results to compare the previous evaluation’s responses
about members’ professional backgrounds to the current survey responses.
Results
I present average effect sizes for a number of scenarios: first, Table 27 below
compares average effect sizes for AR and RR using Rosenthal and Rubin’s method and
180
Hedges et al.’s calculation. For RR, two analyses are presented: one using the composite
effect sizes that include all outcome measures, and another that computes composite
effect sizes with text level omitted. The WWC omits text level from its consideration of
the RR’s effectiveness because the instrument is on an ordinal, rather than an interval,
scale. Removing text level from the analysis lowered the composite effect size of RR but
did not have an effect on the results using confidence intervals.
The following average effect sizes are shown: synthesized, unweighted effect
sizes; synthesized effect sizes that have been weighted by the MRA’s weights for all
beginning readers; and synthesized effect sizes that have been weighted by the MRA’s
weights for struggling beginning readers.
Comprehension, which may be considered the ultimate outcome of literacy
instruction (Snow, 2002) was weighted as 1 and all of the other outcomes were weighted
relative to comprehension. For a test of “general reading achievement” across a number
of domains, I averaged the five weights. For all beginning readers, the MRA survey
results suggested that comprehension was the most important of the outcomes. Compared
to the other four pillars, comprehension appeared to be considerably more important. For
struggling readers, however, the membership placed greater importance upon phonemic
awareness skills and phonics. The results make sense given the results of the NRP’s
research report (described in Chapter 2). Children must gain skills in phonics and
phonemic awareness in order to learn to read. Without focusing on those skills, a
struggling beginning reader would be less likely to become a successful reader.
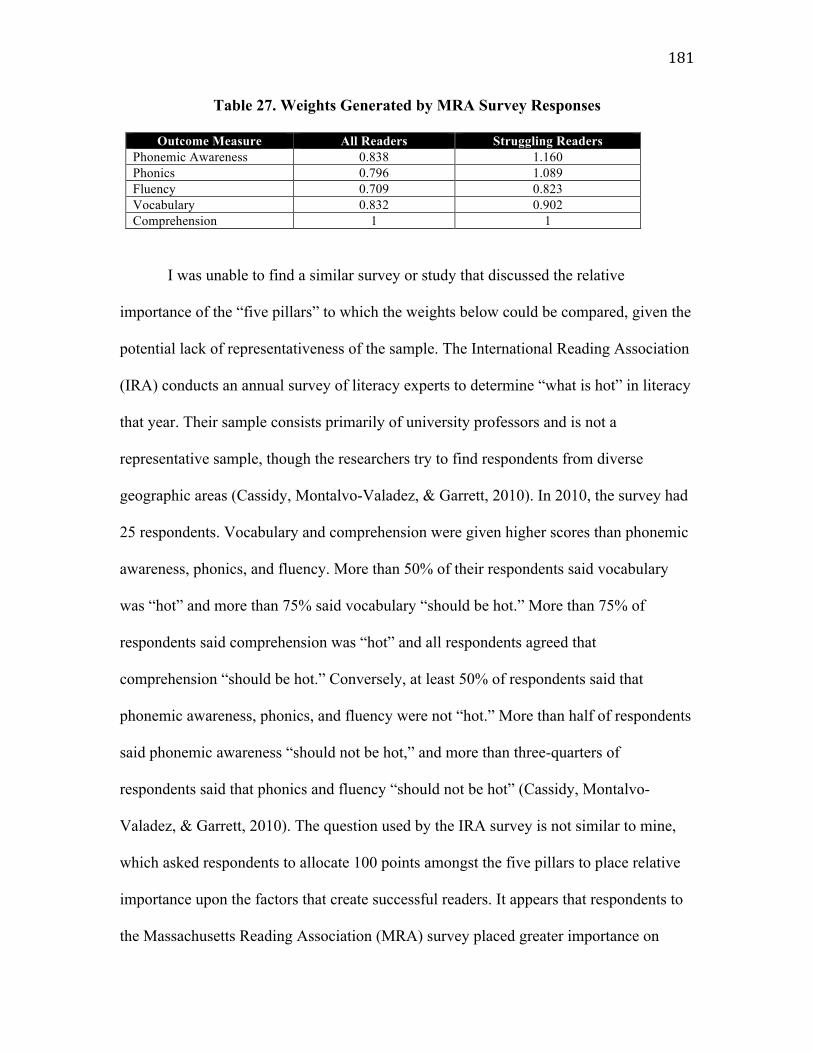
181
Table 27. Weights Generated by MRA Survey Responses
Outcome Measure All Readers Struggling Readers Phonemic Awareness 0.838 1.160 Phonics 0.796 1.089 Fluency 0.709 0.823 Vocabulary 0.832 0.902 Comprehension 1 1
I was unable to find a similar survey or study that discussed the relative
importance of the “five pillars” to which the weights below could be compared, given the
potential lack of representativeness of the sample. The International Reading Association
(IRA) conducts an annual survey of literacy experts to determine “what is hot” in literacy
that year. Their sample consists primarily of university professors and is not a
representative sample, though the researchers try to find respondents from diverse
geographic areas (Cassidy, Montalvo-Valadez, & Garrett, 2010). In 2010, the survey had
25 respondents. Vocabulary and comprehension were given higher scores than phonemic
awareness, phonics, and fluency. More than 50% of their respondents said vocabulary
was “hot” and more than 75% said vocabulary “should be hot.” More than 75% of
respondents said comprehension was “hot” and all respondents agreed that
comprehension “should be hot.” Conversely, at least 50% of respondents said that
phonemic awareness, phonics, and fluency were not “hot.” More than half of respondents
said phonemic awareness “should not be hot,” and more than three-quarters of
respondents said that phonics and fluency “should not be hot” (Cassidy, Montalvo-
Valadez, & Garrett, 2010). The question used by the IRA survey is not similar to mine,
which asked respondents to allocate 100 points amongst the five pillars to place relative
importance upon the factors that create successful readers. It appears that respondents to
the Massachusetts Reading Association (MRA) survey placed greater importance on
182
acquiring phonemic awareness skills for all readers, and upon phonemic awareness and
phonics skills for struggling readers. Most of the MRA respondents were practitioners,
rather than professors, so this may account for a different perspective. In addition, factors
that create a successful reader may not be “hot” topics, and the dissimilarity of the
questions may prevent any useful comparison of the two surveys.
Applying Weights to Effect Size Estimates
After generating point estimates of effect size using Rosenthal and Rubin’s
method, I conducted meta-regressions in SPSS. This section presents weighted effect
sizes using the results from the MRA survey. Because of the small number of studies in
each meta-analysis, I included one covariate in each meta-regression: the length of
follow-up of each study. The coefficient on follow-up was not significant for any of the
regressions, perhaps because follow-up lengths were similar and there were very few
studies of each program. The standard errors for the average effect size for AR were far
smaller than those for RR, even though more studies of RR were included in the meta-
analysis. The result is somewhat surprising because of the attention RR purports to pay to
implementation fidelity, which is expected to lead to less error variance (Stockard, 2010).
The larger standard errors for studies of RR may have occurred because there was
more variation in follow-up for RR than for AR (2.17 years on average for RR, with a
standard error of 0.254, versus 1.1 years of follow-up for AR with a standard error of
0.04). For RR, the coefficient on follow-up was negative which suggests that the effects
of the program faded away over time. For AR, the coefficient on follow-up was positive
in all regressions. Perhaps students’ outcomes improved over time after being exposed to
183
AR. On the other hand, because just three studies were included, Bullock’s very small
and very short-term study with its mixed results may have had undue influence on the
coefficient. Regardless, the coefficient on follow-up was not statistically significant for
either program (see appendix).
Table 28 also shows estimates for meta-regressions of effect sizes for RR when
text level (one of the outcomes of RR’s proprietary Observation Survey) is excluded. The
point estimates for the composite effect size across studies dropped from approximately
0.9 to approximately 0.6, with wide confidence intervals suggesting that the effect sizes
across studies were widely variable. By using the weights on each of the components of
effective literacy instruction to calculate composite effect sizes, the average effect sizes
are a bit different. The weight for each component was applied on the basis of the effect
size measure that had been reported in the study. If a study reported an effect size for an
oral fluency exercise, for example, it would be weighted by 0.709 for all readers and by
0.823 for struggling readers. Only RR and SFA have specific components in place for
struggling readers, but decision makers interested in improving outcomes for at-risk
readers may find it helpful to see whether weighting according to the kinds of outcomes
believed to help that particular population appeared to change the ranking of reading
programs. The weights were close enough not to have changed the effect size estimates
by very much, regardless of whether the studies were unweighted, weighted for all
beginning readers, or weighted only for struggling readers. The outcomes used in each of
the accepted studies impact the weighting and composite effect sizes. The weights
themselves were affected by the respondents to the Massachusetts Reading Association
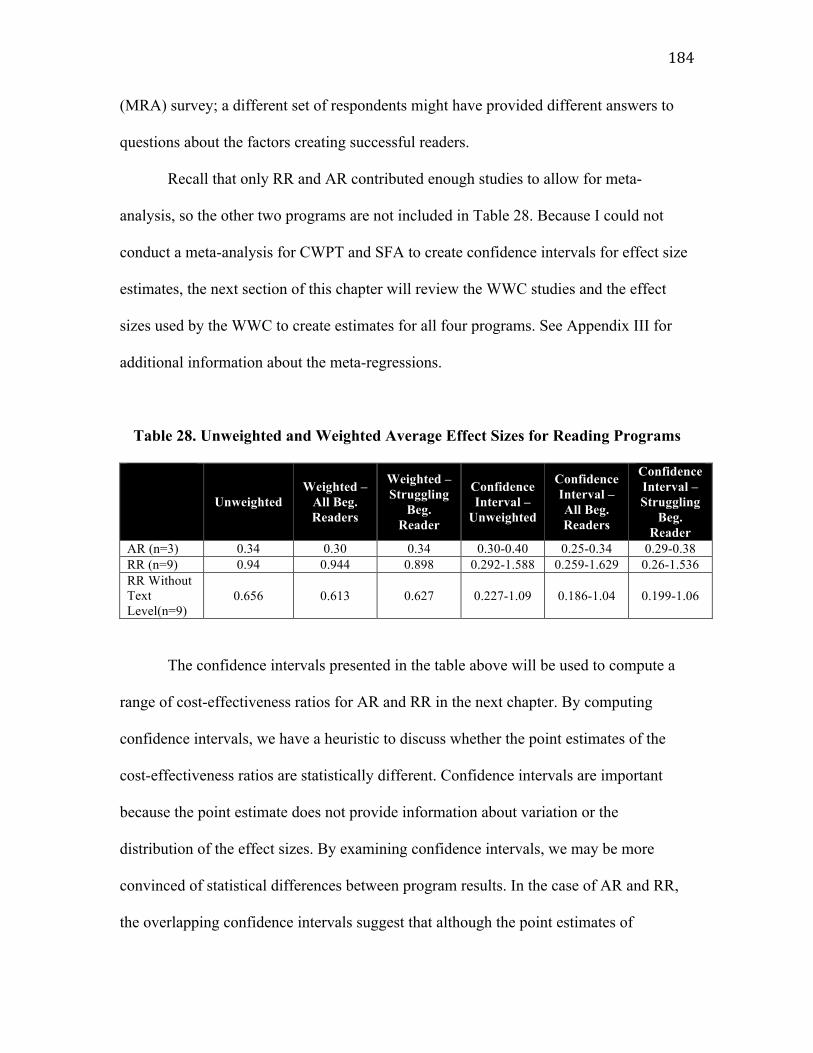
184
(MRA) survey; a different set of respondents might have provided different answers to
questions about the factors creating successful readers.
Recall that only RR and AR contributed enough studies to allow for meta-
analysis, so the other two programs are not included in Table 28. Because I could not
conduct a meta-analysis for CWPT and SFA to create confidence intervals for effect size
estimates, the next section of this chapter will review the WWC studies and the effect
sizes used by the WWC to create estimates for all four programs. See Appendix III for
additional information about the meta-regressions.
Table 28. Unweighted and Weighted Average Effect Sizes for Reading Programs
Unweighted Weighted –
All Beg. Readers
Weighted – Struggling
Beg. Reader
Confidence Interval –
Unweighted
Confidence Interval – All Beg. Readers
Confidence Interval – Struggling
Beg. Reader
AR (n=3) 0.34 0.30 0.34 0.30-0.40 0.25-0.34 0.29-0.38 RR (n=9) 0.94 0.944 0.898 0.292-1.588 0.259-1.629 0.26-1.536 RR Without Text Level(n=9)
0.656 0.613 0.627 0.227-1.09 0.186-1.04 0.199-1.06
The confidence intervals presented in the table above will be used to compute a
range of cost-effectiveness ratios for AR and RR in the next chapter. By computing
confidence intervals, we have a heuristic to discuss whether the point estimates of the
cost-effectiveness ratios are statistically different. Confidence intervals are important
because the point estimate does not provide information about variation or the
distribution of the effect sizes. By examining confidence intervals, we may be more
convinced of statistical differences between program results. In the case of AR and RR,
the overlapping confidence intervals suggest that although the point estimates of
185
effectiveness for RR were much larger than those for AR, we cannot conclude that RR
was the more effective program. Unpaired t-tests also suggested that the difference
between the point estimates were not significantly different, with p values of
approximately 0.38, although the small sample sizes and the difference between sample
sizes suggest that results should be interpreted with caution.
To compare all four programs despite not being able to conduct meta-analyses for
CWPT and SFA, I used the WWC composite effect size estimates. The WWC and I did
not always agree on the set of studies to be included for each program, so the next section
contains a summary of WWC-accepted papers and their characteristics. Explanations of
why I excluded them from my analysis are included as appropriate. Although the studies
I approved sometimes differed from those accepted by the WWC, it was reasonable to
combine their estimates to compare programs because their numbers have been
publicized, and because it was the only way to be able to compare the four programs.
WWC Effect Sizes
AR WWC-Approved Effectiveness Studies
The two studies of AR that met WWC criteria are two of the studies that I
accepted: Bullock’s 2005 dissertation and the Ross, Nunnery and Goldfeder (2004)
evaluation. They are described below in Table 29.
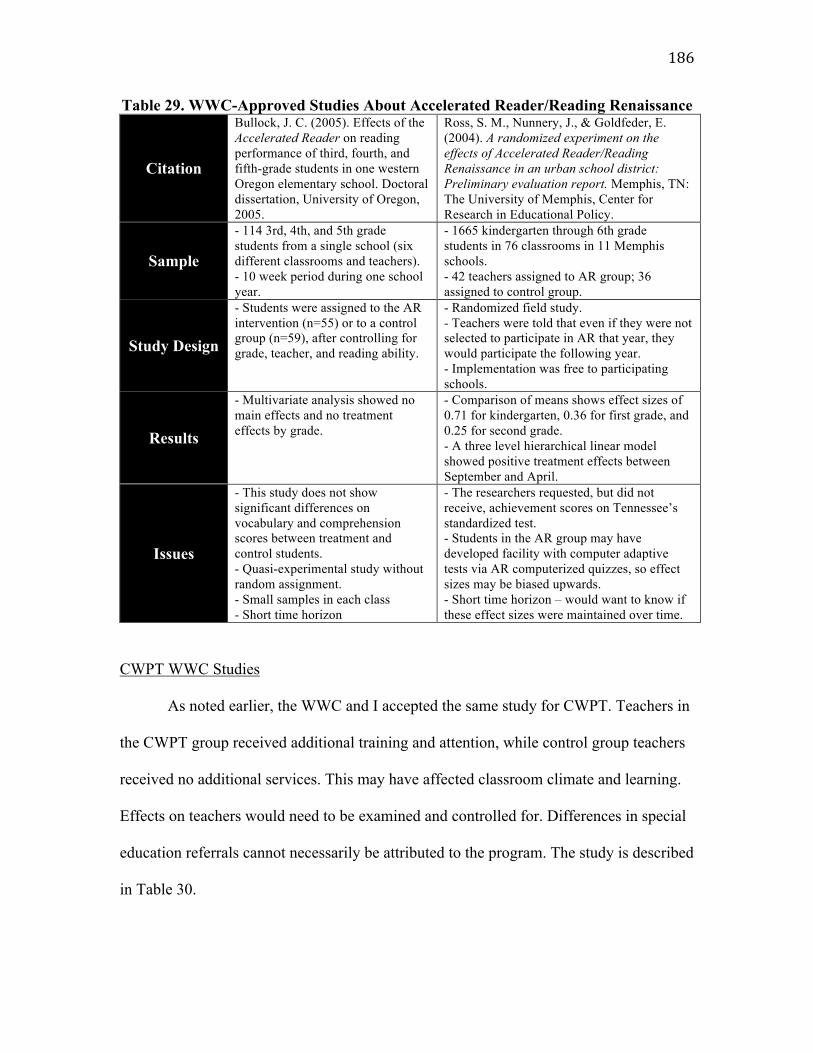
186
Table 29. WWC-Approved Studies About Accelerated Reader/Reading Renaissance
Citation
Bullock, J. C. (2005). Effects of the Accelerated Reader on reading performance of third, fourth, and fifth-grade students in one western Oregon elementary school. Doctoral dissertation, University of Oregon, 2005.
Ross, S. M., Nunnery, J., & Goldfeder, E. (2004). A randomized experiment on the effects of Accelerated Reader/Reading Renaissance in an urban school district: Preliminary evaluation report. Memphis, TN: The University of Memphis, Center for Research in Educational Policy.
Sample
- 114 3rd, 4th, and 5th grade students from a single school (six different classrooms and teachers). - 10 week period during one school year.
- 1665 kindergarten through 6th grade students in 76 classrooms in 11 Memphis schools. - 42 teachers assigned to AR group; 36 assigned to control group.
Study Design
- Students were assigned to the AR intervention (n=55) or to a control group (n=59), after controlling for grade, teacher, and reading ability.
- Randomized field study. - Teachers were told that even if they were not selected to participate in AR that year, they would participate the following year. - Implementation was free to participating schools.
Results
- Multivariate analysis showed no main effects and no treatment effects by grade.
- Comparison of means shows effect sizes of 0.71 for kindergarten, 0.36 for first grade, and 0.25 for second grade. - A three level hierarchical linear model showed positive treatment effects between September and April.
Issues
- This study does not show significant differences on vocabulary and comprehension scores between treatment and control students. - Quasi-experimental study without random assignment. - Small samples in each class - Short time horizon
- The researchers requested, but did not receive, achievement scores on Tennessee’s standardized test. - Students in the AR group may have developed facility with computer adaptive tests via AR computerized quizzes, so effect sizes may be biased upwards. - Short time horizon – would want to know if these effect sizes were maintained over time.
CWPT WWC Studies
As noted earlier, the WWC and I accepted the same study for CWPT. Teachers in
the CWPT group received additional training and attention, while control group teachers
received no additional services. This may have affected classroom climate and learning.
Effects on teachers would need to be examined and controlled for. Differences in special
education referrals cannot necessarily be attributed to the program. The study is described
in Table 30.
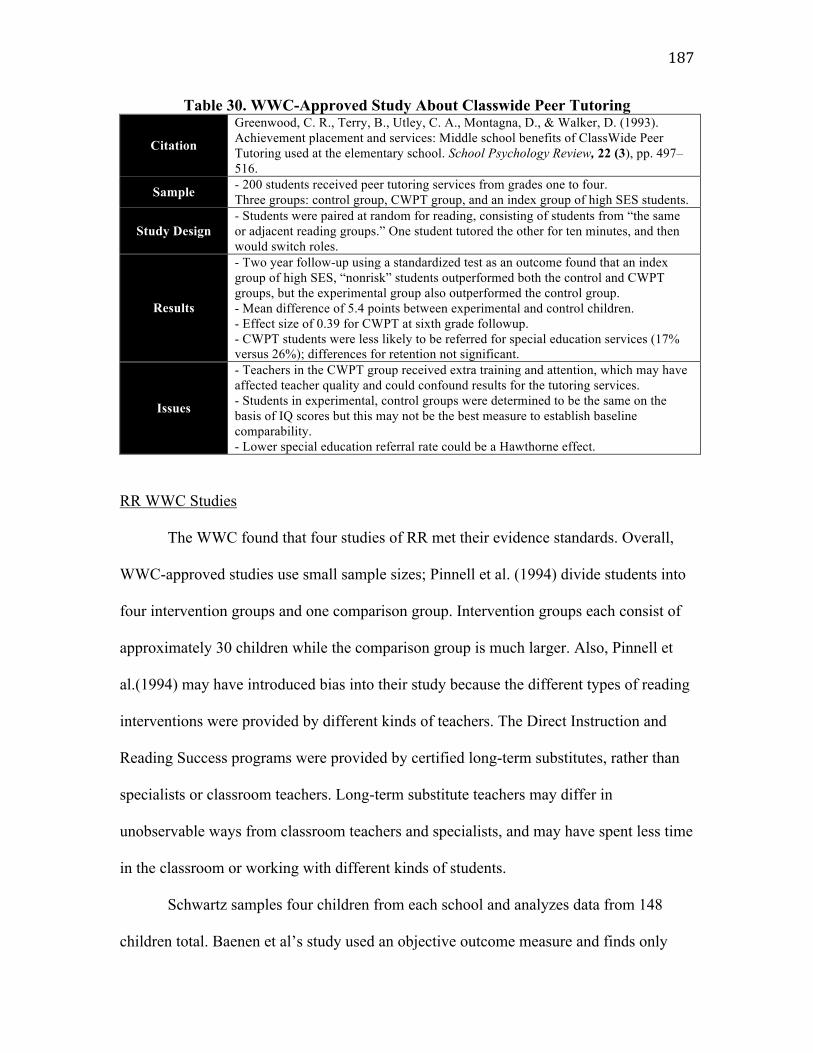
187
Table 30. WWC-Approved Study About Classwide Peer Tutoring
Citation
Greenwood, C. R., Terry, B., Utley, C. A., Montagna, D., & Walker, D. (1993). Achievement placement and services: Middle school benefits of ClassWide Peer Tutoring used at the elementary school. School Psychology Review, 22 (3), pp. 497–516.
Sample - 200 students received peer tutoring services from grades one to four. Three groups: control group, CWPT group, and an index group of high SES students.
Study Design - Students were paired at random for reading, consisting of students from “the same or adjacent reading groups.” One student tutored the other for ten minutes, and then would switch roles.
Results
- Two year follow-up using a standardized test as an outcome found that an index group of high SES, “nonrisk” students outperformed both the control and CWPT groups, but the experimental group also outperformed the control group. - Mean difference of 5.4 points between experimental and control children. - Effect size of 0.39 for CWPT at sixth grade followup. - CWPT students were less likely to be referred for special education services (17% versus 26%); differences for retention not significant.
Issues
- Teachers in the CWPT group received extra training and attention, which may have affected teacher quality and could confound results for the tutoring services. - Students in experimental, control groups were determined to be the same on the basis of IQ scores but this may not be the best measure to establish baseline comparability. - Lower special education referral rate could be a Hawthorne effect.
RR WWC Studies
The WWC found that four studies of RR met their evidence standards. Overall,
WWC-approved studies use small sample sizes; Pinnell et al. (1994) divide students into
four intervention groups and one comparison group. Intervention groups each consist of
approximately 30 children while the comparison group is much larger. Also, Pinnell et
al.(1994) may have introduced bias into their study because the different types of reading
interventions were provided by different kinds of teachers. The Direct Instruction and
Reading Success programs were provided by certified long-term substitutes, rather than
specialists or classroom teachers. Long-term substitute teachers may differ in
unobservable ways from classroom teachers and specialists, and may have spent less time
in the classroom or working with different kinds of students.
Schwartz samples four children from each school and analyzes data from 148
children total. Baenen et al’s study used an objective outcome measure and finds only
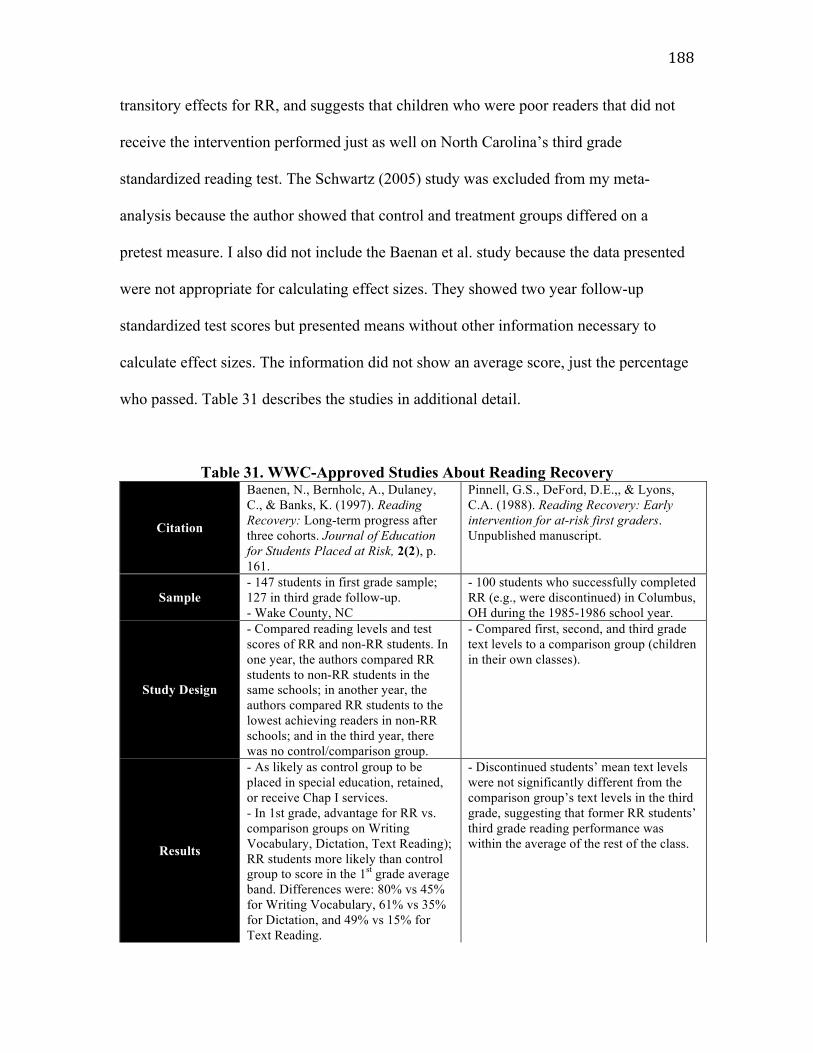
188
transitory effects for RR, and suggests that children who were poor readers that did not
receive the intervention performed just as well on North Carolina’s third grade
standardized reading test. The Schwartz (2005) study was excluded from my meta-
analysis because the author showed that control and treatment groups differed on a
pretest measure. I also did not include the Baenan et al. study because the data presented
were not appropriate for calculating effect sizes. They showed two year follow-up
standardized test scores but presented means without other information necessary to
calculate effect sizes. The information did not show an average score, just the percentage
who passed. Table 31 describes the studies in additional detail.
Table 31. WWC-Approved Studies About Reading Recovery
Citation
Baenen, N., Bernholc, A., Dulaney, C., & Banks, K. (1997). Reading Recovery: Long-term progress after three cohorts. Journal of Education for Students Placed at Risk, 2(2), p. 161.
Pinnell, G.S., DeFord, D.E.,, & Lyons, C.A. (1988). Reading Recovery: Early intervention for at-risk first graders. Unpublished manuscript.
Sample - 147 students in first grade sample; 127 in third grade follow-up. - Wake County, NC
- 100 students who successfully completed RR (e.g., were discontinued) in Columbus, OH during the 1985-1986 school year.
Study Design
- Compared reading levels and test scores of RR and non-RR students. In one year, the authors compared RR students to non-RR students in the same schools; in another year, the authors compared RR students to the lowest achieving readers in non-RR schools; and in the third year, there was no control/comparison group.
- Compared first, second, and third grade text levels to a comparison group (children in their own classes).
Results
- As likely as control group to be placed in special education, retained, or receive Chap I services. - In 1st grade, advantage for RR vs. comparison groups on Writing Vocabulary, Dictation, Text Reading); RR students more likely than control group to score in the 1st grade average band. Differences were: 80% vs 45% for Writing Vocabulary, 61% vs 35% for Dictation, and 49% vs 15% for Text Reading.
- Discontinued students’ mean text levels were not significantly different from the comparison group’s text levels in the third grade, suggesting that former RR students’ third grade reading performance was within the average of the rest of the class.
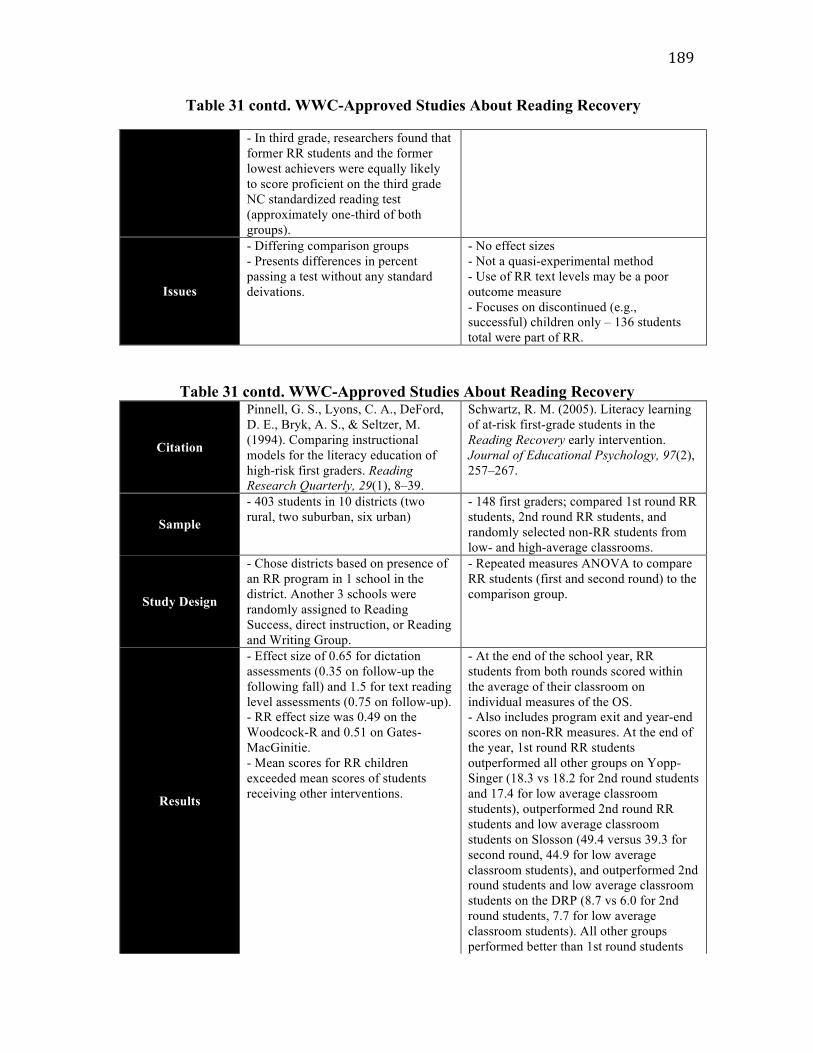
189
Table 31 contd. WWC-Approved Studies About Reading Recovery
- In third grade, researchers found that former RR students and the former lowest achievers were equally likely to score proficient on the third grade NC standardized reading test (approximately one-third of both groups).
Issues
- Differing comparison groups - Presents differences in percent passing a test without any standard deivations.
- No effect sizes - Not a quasi-experimental method - Use of RR text levels may be a poor outcome measure - Focuses on discontinued (e.g., successful) children only – 136 students total were part of RR.
Table 31 contd. WWC-Approved Studies About Reading Recovery
Citation
Pinnell, G. S., Lyons, C. A., DeFord, D. E., Bryk, A. S., & Seltzer, M. (1994). Comparing instructional models for the literacy education of high-risk first graders. Reading Research Quarterly, 29(1), 8–39.
Schwartz, R. M. (2005). Literacy learning of at-risk first-grade students in the Reading Recovery early intervention. Journal of Educational Psychology, 97(2), 257–267.
Sample
- 403 students in 10 districts (two rural, two suburban, six urban)
- 148 first graders; compared 1st round RR students, 2nd round RR students, and randomly selected non-RR students from low- and high-average classrooms.
Study Design
- Chose districts based on presence of an RR program in 1 school in the district. Another 3 schools were randomly assigned to Reading Success, direct instruction, or Reading and Writing Group.
- Repeated measures ANOVA to compare RR students (first and second round) to the comparison group.
Results
- Effect size of 0.65 for dictation assessments (0.35 on follow-up the following fall) and 1.5 for text reading level assessments (0.75 on follow-up). - RR effect size was 0.49 on the Woodcock-R and 0.51 on Gates-MacGinitie. - Mean scores for RR children exceeded mean scores of students receiving other interventions.
- At the end of the school year, RR students from both rounds scored within the average of their classroom on individual measures of the OS. - Also includes program exit and year-end scores on non-RR measures. At the end of the year, 1st round RR students outperformed all other groups on Yopp-Singer (18.3 vs 18.2 for 2nd round students and 17.4 for low average classroom students), outperformed 2nd round RR students and low average classroom students on Slosson (49.4 versus 39.3 for second round, 44.9 for low average classroom students), and outperformed 2nd round students and low average classroom students on the DRP (8.7 vs 6.0 for 2nd round students, 7.7 for low average classroom students). All other groups performed better than 1st round students
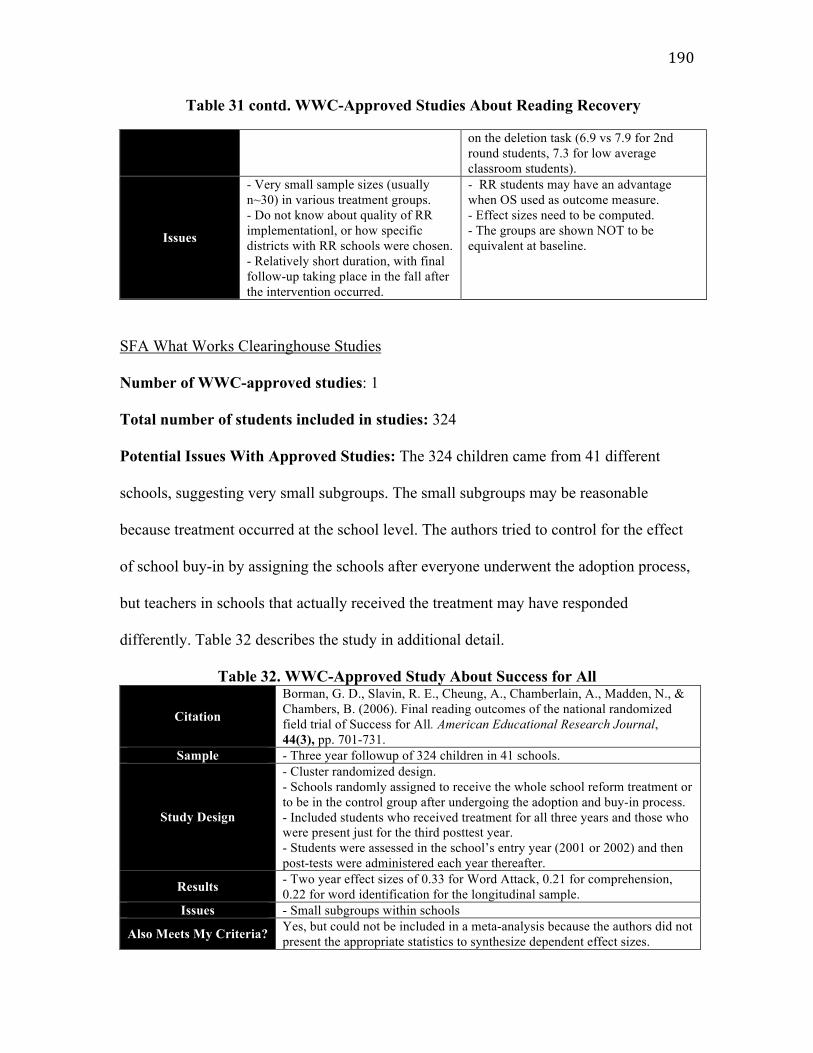
190
Table 31 contd. WWC-Approved Studies About Reading Recovery
on the deletion task (6.9 vs 7.9 for 2nd
round students, 7.3 for low average classroom students).
Issues
- Very small sample sizes (usually n~30) in various treatment groups. - Do not know about quality of RR implementationl, or how specific districts with RR schools were chosen. - Relatively short duration, with final follow-up taking place in the fall after the intervention occurred.
- RR students may have an advantage when OS used as outcome measure. - Effect sizes need to be computed. - The groups are shown NOT to be equivalent at baseline.
SFA What Works Clearinghouse Studies
Number of WWC-approved studies: 1
Total number of students included in studies: 324
Potential Issues With Approved Studies: The 324 children came from 41 different
schools, suggesting very small subgroups. The small subgroups may be reasonable
because treatment occurred at the school level. The authors tried to control for the effect
of school buy-in by assigning the schools after everyone underwent the adoption process,
but teachers in schools that actually received the treatment may have responded
differently. Table 32 describes the study in additional detail.
Table 32. WWC-Approved Study About Success for All
Citation
Borman, G. D., Slavin, R. E., Cheung, A., Chamberlain, A., Madden, N., & Chambers, B. (2006). Final reading outcomes of the national randomized field trial of Success for All. American Educational Research Journal, 44(3), pp. 701-731.
Sample - Three year followup of 324 children in 41 schools.
Study Design
- Cluster randomized design. - Schools randomly assigned to receive the whole school reform treatment or to be in the control group after undergoing the adoption and buy-in process. - Included students who received treatment for all three years and those who were present just for the third posttest year. - Students were assessed in the school’s entry year (2001 or 2002) and then post-tests were administered each year thereafter.
Results - Two year effect sizes of 0.33 for Word Attack, 0.21 for comprehension, 0.22 for word identification for the longitudinal sample.
Issues - Small subgroups within schools
Also Meets My Criteria? Yes, but could not be included in a meta-analysis because the authors did not present the appropriate statistics to synthesize dependent effect sizes.
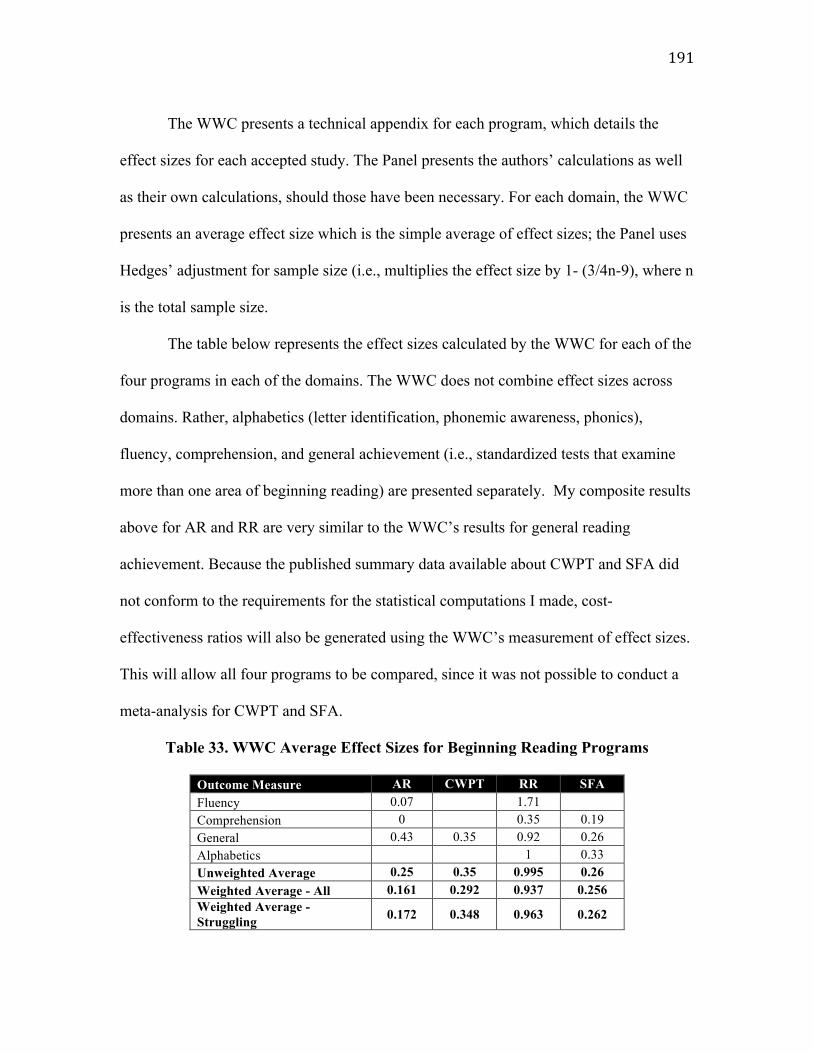
191
The WWC presents a technical appendix for each program, which details the
effect sizes for each accepted study. The Panel presents the authors’ calculations as well
as their own calculations, should those have been necessary. For each domain, the WWC
presents an average effect size which is the simple average of effect sizes; the Panel uses
Hedges’ adjustment for sample size (i.e., multiplies the effect size by 1- (3/4n-9), where n
is the total sample size.
The table below represents the effect sizes calculated by the WWC for each of the
four programs in each of the domains. The WWC does not combine effect sizes across
domains. Rather, alphabetics (letter identification, phonemic awareness, phonics),
fluency, comprehension, and general achievement (i.e., standardized tests that examine
more than one area of beginning reading) are presented separately. My composite results
above for AR and RR are very similar to the WWC’s results for general reading
achievement. Because the published summary data available about CWPT and SFA did
not conform to the requirements for the statistical computations I made, cost-
effectiveness ratios will also be generated using the WWC’s measurement of effect sizes.
This will allow all four programs to be compared, since it was not possible to conduct a
meta-analysis for CWPT and SFA.
Table 33. WWC Average Effect Sizes for Beginning Reading Programs
Outcome Measure AR CWPT RR SFA Fluency 0.07 1.71 Comprehension 0 0.35 0.19 General 0.43 0.35 0.92 0.26 Alphabetics 1 0.33 Unweighted Average 0.25 0.35 0.995 0.26 Weighted Average - All 0.161 0.292 0.937 0.256 Weighted Average - Struggling 0.172 0.348 0.963 0.262
192
It is not clear how best to interpret the table above, because effect sizes are not
combined across domains. Also, effect sizes are just one piece of the WWC’s screening.
Programs are ultimately rated as “positive, potentially positive, mixed, no discernible
effects, potentially negative, or negative.” The WWC uses information about these
studies in a different manner than I am using the information. The WWC seeks to create a
holistic view of an intervention’s effects, such that studies that cannot contribute
appropriate student-level effect sizes (e.g., cluster analysis that show school level effects)
still contribute to the overall rating of effects. The WWC also uses simple averages of
effect sizes within a domain. I calculated weighted averages for all reading outcome
domains using the MRA weights, as described above.
Challenges and Limitations in Calculating Composite Effect Sizes
As this chapter described, there were some challenges in considering how to
calculate composite effect sizes for this type of project. There are two major concerns
surrounding the independence of effect size estimates. First, many studies contribute
more than one effect size (multiple endpoint studies). Researchers often present posttest
results on a number of assessments or subtests. The various effect sizes contain valuable
information about changes or growth in different kind of skills, such that an analyst
would want to include some or all measures in a research synthesis. The effect sizes from
the same study are not independent, a violation of the assumptions of meta-analysis that
must be dealt with statistically. A second issue arises when a group of researchers writes
more than one article about the same sample of children, perhaps administering different
assessments in each study. Although the assessments may be different, the underlying
193
characteristics of the study sample are the same, suggesting non-independence of effect
size estimates. In these cases, a decision rule must be set out in advance about which
study to include.
Meta-analysis is not the only way that effect sizes could have been combined.
Evidence suggests that it would have been appropriate to create a multilevel model using
a study as the Level II unit of analysis (Saxe et al., 2007; de la Torre et al., 2007; Kim
and Frees, 2007). Hox (2002) suggests that the intercept-only model in HLM provides the
same effect size estimate as “classical meta-analysis.” HLM includes an option to use a
known variance weight, which is then applied to the effect sizes (outcome) at Level I.
The program can account for dependence among effect size estimates, facilitating the
inclusion of a number of estimates from each study. Because of the small number of
studies to be included, it would not be possible to include a number of covariates in a
multilevel model, and so meta-analysis is an equally reasonable approach.
Summary
This chapter included a discussion of effects and effectiveness measures,
proposed a way to combine effect sizes within and across studies, and presented
composite effect sizes for the reading programs being studied. The next chapter combines
per-pupil cost results from Chapter 4 and the composite effect sizes from this chapter to
create cost-effectiveness ratios. This will allow a discussion of the relative cost
effectiveness of the four alternative reading programs.
194
CHAPTER 6: RESULTS AND DISCUSSION – COST EFFECTIVENESS RATIOS
Readers of cost-effectiveness studies may be most interested in learning the
results of the analysis, and gaining information about which program is the most cost-
effective. Using the per student costs calculated in Chapter 4 and the effect sizes from
Chapter 5, this chapter combines costs and effects under different assumptions to create a
set of cost-effectiveness ratios. Cost-effectiveness ratios are calculated by presenting
effect size divided by cost (e.g., Harris, 2009; Levin, Glass, & Meister, 1987); this shows
the extent of effectiveness, in the form of effect size, gained per unit of cost. When the
ratio is calculated as effects divided by costs then the most cost-effective program is the
one with the highest ratio. In this study, the ratios of effects divided by costs were small
enough (i.e., in the ten-thousandths or smaller) that it seemed more intuitive to divide
costs by 1,000 to present gain in effect size per $1,000 (Levin, Glass, & Meister, 1987).
Once calculated, cost-effectiveness ratios allow for a “ranking” of programs, from most
to least desirable on the basis of the ratio. Mathematically, there are a few ways to have a
lower cost effectiveness ratio: relatively lower costs than the comparison programs;
relatively higher effects; or a combination of the two.
The ratios presented in this chapter use confidence intervals whenever possible.
By examining ratios with associated confidence intervals, decision makers have the
opportunity to understand the relative distribution of the ratio, and a heuristic to
understand whether two reading programs’ cost-effectiveness ratios are significantly
different. Also, the presentation of confidence intervals facilitates an intuitive
understanding of the effects of sampling variation upon the cost-effectiveness estimates
(Gardiner, Hogan, et al., 1995). For two of the programs, Accelerated Reader and
195
Reading Recovery, Chapter 5 showed the results of meta-analyses of effect sizes from the
effectiveness studies. The meta-analyses allowed for the calculation of confidence
intervals around the effect sizes. For CWPT and SFA, I was not able to conduct meta-
analyses of effect sizes. To compare all four programs, it was only possible to use the
results of the sensitivity analysis for costs. That sensitivity analysis involved varying the
discount rate, at 2%, 3.5%, and 5% (Moore, Boardman, et al., 2004).
By weighting literacy outcomes, the cost-effectiveness ratios in this chapter may
provide more useful information for decision makers trying to choose amongst reading
programs. As we saw in the previous chapter, all literacy outcomes are not created equal.
The weighted effect sizes used to calculate cost-effectiveness ratios in this chapter may
help decision makers to understand whether a particular program would be relatively
more effective in terms of improving specific kinds of reading skills or areas of literacy.
The survey of Massachusetts Reading Association (MRA) members suggested that
struggling readers required a different focus of literacy skill building than all beginning
readers. Decision makers may use the weighted cost-effectiveness ratios to consider
whether the outcomes that a given reading program has been shown to impact are the
same outcomes they would like to improve.
The following sets of ratios will be presented:
For meta-analytic estimates of AR and RR:
• Costs discounted at 2%, 3.5% 5%; unweighted and weighted effect size averages of
AR and RR (point estimate as well as lower and upper bounds of confidence
intervals)
For WWC estimates of all four programs:
196
• Costs discounted at 2%, 3.5%, 5%; unweighted and weighted effect size averages
Finally, I compare my cost-effectiveness ratios for AR and RR to those generated
for all four programs using the average effect sizes published by the WWC.
Meta-Analytic Estimates
This section presents cost-effectiveness ratios for AR and RR using confidence
intervals of effect sizes. In Chapter 5, I showed that average effect sizes of AR and RR
have associated confidence intervals. Confidence intervals around the effect sizes provide
substantially more information than point estimates alone. Both the point estimates and
the confidence intervals suggest that AR is more cost-effective than RR at a discount rate
of 3.5%, regardless of how the outcome measures are weighted. Although the weighted
literacy outcomes do not change the cost-effectiveness results in this study, the change in
average ratios as a result of using weighted measures suggests that weighting literacy
outcomes may affect a decision about which program to select had different instruments,
study populations, or programs been used. Existing effectiveness studies use a variety of
measures and it is not always clear why specific assessments were selected. Focusing on
literacy outcomes that are considered to be relatively more important suggests that the
existing literature may emphasize effect sizes for measures that are relatively less
important in creating a successful beginning reader.
The results are similar when text level is excluded from the analysis of effect sizes
for RR, suggesting AR is the more cost-effective program. The WWC removes text level
from its consideration of RR effect sizes because text level is on an ordinal scale. For
197
example, an improvement on the text level from 1 to 5, does not represent the same
interval as an improvement from 16 to 20. The results of the meta-regression for RR
without effect sizes for text level are included below. Once text level is excluded, cost-
effectiveness ratios for RR and AR are again significantly different in favor of AR. The
intervals for RR are wide, because effect sizes varied considerably amongst studies.
Although the AR program is intended for all readers, the weighted average effect
size for all readers was the lowest of the three average effect sizes. This is because the
AR measures on which there were positive effect sizes were typically not measures of
comprehension, which was the most highly weighted outcome in the group. Even though
RR is not intended for all readers, the outcomes that were weighted more highly by the
Massachusetts Reading Association (MRA) are the kinds of outcomes used by RR
researchers. Decision makers considering AR may wish to consider how to use the
program to focus on struggling readers, even though the program is intended and
marketed for classwide and schoolwide use. The outcomes AR appears to affect, or at
least the ones that were assessed in the effectiveness literature, were weighted more
highly for struggling readers. Even though the program is intended for the whole class, it
is relatively inexpensive compared to programs like SFA or RR. School leaders may wish
to look for opportunities to help struggling readers using the software. In so doing, the
cost distribution of AR would be changed, which would lead to additional opportunities
to explore the effectiveness and cost-effectiveness of AR should school leaders attempt
different kinds of implementations for readers at different points on the distribution.
The table below presents the confidence intervals for mean effect sizes of AR and
RR. In no instance do the confidence intervals overlap. Although formal statistical testing
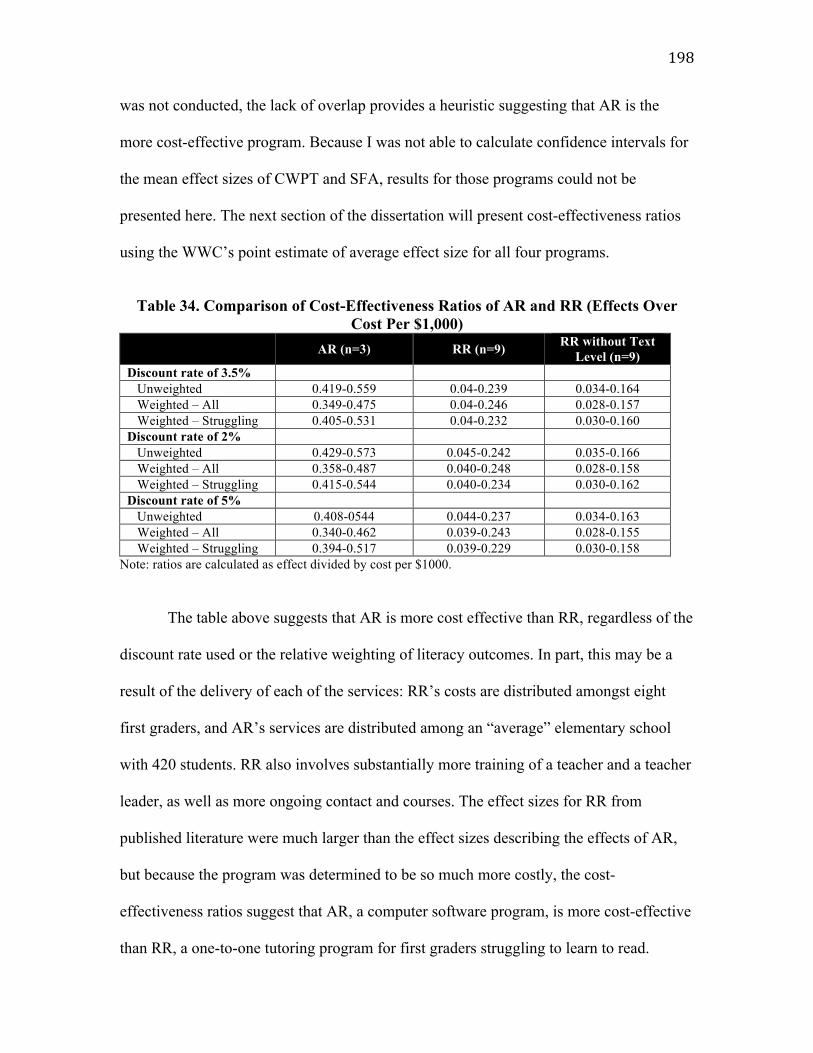
198
was not conducted, the lack of overlap provides a heuristic suggesting that AR is the
more cost-effective program. Because I was not able to calculate confidence intervals for
the mean effect sizes of CWPT and SFA, results for those programs could not be
presented here. The next section of the dissertation will present cost-effectiveness ratios
using the WWC’s point estimate of average effect size for all four programs.
Table 34. Comparison of Cost-Effectiveness Ratios of AR and RR (Effects Over
Cost Per $1,000) AR (n=3) RR (n=9) RR without Text
Level (n=9) Discount rate of 3.5% Unweighted 0.419-0.559 0.04-0.239 0.034-0.164 Weighted – All 0.349-0.475 0.04-0.246 0.028-0.157 Weighted – Struggling 0.405-0.531 0.04-0.232 0.030-0.160 Discount rate of 2% Unweighted 0.429-0.573 0.045-0.242 0.035-0.166 Weighted – All 0.358-0.487 0.040-0.248 0.028-0.158 Weighted – Struggling 0.415-0.544 0.040-0.234 0.030-0.162 Discount rate of 5% Unweighted 0.408-0544 0.044-0.237 0.034-0.163 Weighted – All 0.340-0.462 0.039-0.243 0.028-0.155 Weighted – Struggling 0.394-0.517 0.039-0.229 0.030-0.158
Note: ratios are calculated as effect divided by cost per $1000.
The table above suggests that AR is more cost effective than RR, regardless of the
discount rate used or the relative weighting of literacy outcomes. In part, this may be a
result of the delivery of each of the services: RR’s costs are distributed amongst eight
first graders, and AR’s services are distributed among an “average” elementary school
with 420 students. RR also involves substantially more training of a teacher and a teacher
leader, as well as more ongoing contact and courses. The effect sizes for RR from
published literature were much larger than the effect sizes describing the effects of AR,
but because the program was determined to be so much more costly, the cost-
effectiveness ratios suggest that AR, a computer software program, is more cost-effective
than RR, a one-to-one tutoring program for first graders struggling to learn to read.
199
WWC Estimates
To compare the four reading programs, I used the WWC estimates of effect size.
The WWC technical appendices specify that overall effect sizes are calculated via simple
averages across domains. I present below the cost-effectiveness ratios for a number of
assumptions:
• Varying the discount rate from 2%-5% for per student costs
• Using the “general reading achievement” effect size from the WWC technical
appendices for the program (this is the effect size on a standardized test)
• Using the unweighted average of effect sizes
• Applying the MRA weights to create weighted averages of effect sizes.
• Note that the WWC effect sizes for RR always omit effect sizes for text level
from RR’s proprietary Observation Survey. As described in the previous
section, the WWC omits text level as an outcome measure because the test is
not an equal interval scale.
The table below suggests that the averages of effect sizes for AR and RR are
similar to the composite effect sizes from the meta-analysis, described in Chapter 5.
Ratios are presented for four categories: unweighted averages; averages weighted using
the Massachusetts Reading Association (MRA) weights for all and struggling beginning
readers; and the WWC’s general reading achievement category. The general reading
achievement category is used by the WWC to describe outcomes in which more than one
reading area (e.g., alphabetics and fluency) were combined in a way that cannot be
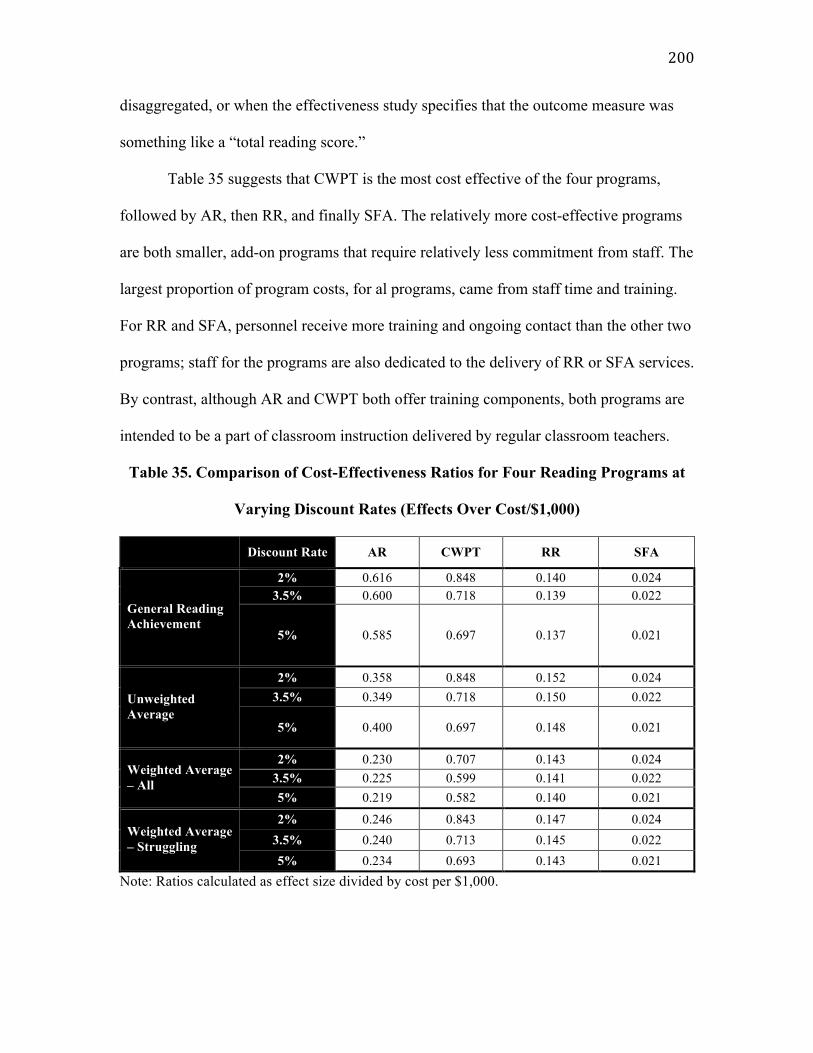
200
disaggregated, or when the effectiveness study specifies that the outcome measure was
something like a “total reading score.”
Table 35 suggests that CWPT is the most cost effective of the four programs,
followed by AR, then RR, and finally SFA. The relatively more cost-effective programs
are both smaller, add-on programs that require relatively less commitment from staff. The
largest proportion of program costs, for al programs, came from staff time and training.
For RR and SFA, personnel receive more training and ongoing contact than the other two
programs; staff for the programs are also dedicated to the delivery of RR or SFA services.
By contrast, although AR and CWPT both offer training components, both programs are
intended to be a part of classroom instruction delivered by regular classroom teachers.
Table 35. Comparison of Cost-Effectiveness Ratios for Four Reading Programs at
Varying Discount Rates (Effects Over Cost/$1,000)
Discount Rate AR CWPT RR SFA
2% 0.616 0.848 0.140 0.024 3.5% 0.600 0.718 0.139 0.022
General Reading Achievement
5% 0.585 0.697 0.137 0.021
2% 0.358 0.848 0.152 0.024 3.5% 0.349 0.718 0.150 0.022 Unweighted
Average 5% 0.400 0.697 0.148 0.021
2% 0.230 0.707 0.143 0.024 3.5% 0.225 0.599 0.141 0.022 Weighted Average
– All 5% 0.219 0.582 0.140 0.021
2% 0.246 0.843 0.147 0.024 3.5% 0.240 0.713 0.145 0.022
Weighted Average – Struggling
5% 0.234 0.693 0.143 0.021 Note: Ratios calculated as effect size divided by cost per $1,000.
201
CWPT also had a relatively high effect size based upon one study. Because the
effectiveness results are based on one study and the costs are based upon program
developer reporting and a paper about CWPT, the results for CWPT must be interpreted
with great caution. Although the accepted paper was methodologically rigorous, we do
not have any other studies to which we can compare the effect sizes to see if similar
results would be found in another context or by another set of researchers. As described
in Chapter 5, the single accepted study about CWPT was a relatively large follow-up with
303 students. The sample was comprised of predominantly non-white students from
Kansas City who attended first grade in Chapter I (Title I) schools in the 1980s. It is not
clear that we could generalize the results to other places, or to first graders in 2010. The
students who did not participate in CWPT were described as not participating in any
intervention though we do not know about differences in curriculum, teaching
effectiveness, or other variables.
AR had the second highest set of cost effectiveness ratios, particularly for the
general reading achievement category. The ratios for this category should be interpreted
with caution. The measure of “general reading achievement” is a standardized reading
test. As mentioned in Chapter 5, the standardized test used for studies of AR is often the
STAR literacy or early reading exam. It is plausible that effect sizes were large in favor
of AR students because the STAR test is a proprietary exam and students who were
exposed to AR may have been more familiar with the instrument or types of questions. It
is not always clear whether comparison group students would have been as familiar with
the format and questioning as students who had participated in AR. For all of the other
programs, the standardized test used was not a proprietary instrument.
202
RR had the third highest set of cost effectiveness ratios, despite having the highest
effect sizes of all four programs. Because the costs of RR are divided amongst just eight
students a year, the program is less cost-effective than programs that deliver services to
an entire school. Decision makers who wish to implement RR in their schools may have a
different set of preferences than decision makers who are interested in peer tutoring or a
software program. Given RR’s singular focus on at-risk readers in the first grade,
decision makers who are most interested in helping this particular population of readers
may be less interested in the program’s cost-effectiveness relative to smaller add-on
programs in which services are provided to all students.
Finally, SFA had the lowest set of cost-effectiveness ratios of the four programs.
Given all of the outputs a whole school reform is supposed to affect (Levin & McEwan,
2002), this result is not surprising. Although the daily schedule of SFA schools appears to
focus upon reading instruction and improvement, the program also requires the
introduction of numerous personnel – a facilitator, a reading tutor, a dedicated social
worker, parent volunteers, and trainers. The assistant principal and principal are also
expected to participate in training sessions. Classroom teachers and the reading tutor are
the only staff members working specifically to improve reading outcomes via curriculum
delivery. The other staff, while playing an important role in the restructuring and
functioning of the school, are not involved in instructing students themselves. Given all
of the personnel involved in restructuring an SFA school that do not specifically work on
reading instruction, and the relatively low effect sizes found in the approved studies of
SFA, it is not surprising that the cost-effectiveness ratios for reading appear low
compared to smaller, add-on programs.
203
Discussion
This chapter combined cost and effectiveness data to present cost-effectiveness
ratios for four early reading programs. The two reading programs that emerged as being
relatively more cost-effective, AR and CWPT, were also the two programs with the
lowest per pupil cost. AR and CWPT are smaller add-on programs requiring less staff
investment than RR and SFA. AR and CWPT are also assumed to be delivered to an
entire school of 420 students, while RR is delivered to a maximum of eight students per
year and SFA was assumed to be delivered to three grades (kindergarten through grade
2). Although studies of RR showed the largest effect sizes, when the high per-student cost
was considered along with effectiveness, RR was shown not to be the most cost-effective
of the reading programs.
It is also interesting to consider the cost-effectiveness ratios calculated by using
the meta-analytic estimates since the more effective program emerges as less cost-
effective. RR appears to be an extremely costly program on a per-student basis, and
results of the meta-analysis suggest that it is more effective than AR, and over a longer
follow-up period, regardless of whether RR’s proprietary text level measure is included.
We do not know whether AR’s gains would be sustained over a longer follow-up period.
RR participants show very high effect sizes relative to AR participants, but because so
few children can participate in RR, costs are distributed amongst just eight students and
AR appears to be the more cost effective program. Because I was able to conduct meta-
analysis for AR and RR effectiveness data, and generate confidence intervals, I can place
more confidence in the results generated for these programs.
204
Although AR is the more cost effective program, we cannot conclude that it
would automatically be the better choice for every school considering an early reading
program. The choice between AR and RR may come down to context. If a decision
maker is looking to improve the scores of the children with the weakest reading
performance, then he or she may wish to invest in RR. If the decision maker’s interest is
in improving the scores of the lowest achieving readers via one-on-one attention, then the
results of this cost-effectiveness analysis may not provide such a decision maker with the
information he or she needs. If the interest is in finding the most cost-effective program
for the weakest readers, then the comparison would need to be amongst reading programs
intended for that population. The decision to invest in RR involves a substantial
commitment, including training an RR teacher, providng the opportunity to remain
involved in conferences and professional development, and pulling students out of classes
for the RR lessons. Aside from the outlay of cash and investment in a specific teacher,
RR is also not intended to raise a school’s standardized test scores. In a best case
scenario, an RR teacher can work with eight RR children over the course of the school
day (although it should be reiterated that RR teachers work in another capacity during the
other part of the school day). Additionally, the scenario in which AR fared worst was
when the average effect size was computed for all readers and the comprehension
measure received the most weight. When AR did use a comprehension test, it was
typically their proprietary STAR instrument. AR may work on different skills than RR,
which may be an important consideration for decision makers – which reading skills
should be improved?
205
AR, on the other hand, is a program that is intended for an entire class. Students
work at their own pace and find books that interest them. The program focuses on
extrinsic motivation, including prizes and pizza or ice cream parties. It is unclear from the
literature whether AR actually motivates children to become lifelong readers once the
program ends and the prizes stop, or if students are able to game the system to earn the
most quiz points by sharing questions or choosing particular books.
Decision makers may also be concerned with deciding which population to help.
Perhaps because the reading programs described in this study are often paid for with Title
I funds, or other funding that is dependent on the relative socioeconomic status of
children in the school, the studies are more likely to focus on students that are at risk –
free/reduced price lunch eligible, African American or Hispanic/Latino. This information
may provide useful information to those decision makers that are looking to implement a
program using similar funding sources. Schools are eligible for Title I funding if 40% or
more of the students are from poor families (NCES, 2011).
Decision makers should look more carefully at the effectiveness literature to
understand the populations that were studied as well as the results. If decision makers are
clear as to whether the populations studied are at all similar to their school’s population
and whether it is likely or possible to replicate positive results, the choice between
programs may be easier. The meta-analyses and the WWC studies do not focus on
English language learners or learning disabled students that are not part of traditional
classroom settings. Because I had so few studies to include in a meta-analysis, it was
most prudent to use length of study follow-up as the lone covariate. Should more studies
have been available, it would have been useful and instructive to have been able to
206
include factors such as urbanicity of the school, percent of children on free/reduced price
lunch, percent of students who were African American and Hispanic/Latino, parent or
family variables, and other student-related factors. Given comparability of treatment and
control/comparison groups, the average effect sizes also do not take into account any
teacher-related variables such as experience, education, or ability to motivate students.
Because the results of the meta-regression could not be used to add insight to other issues
surrounding the average effect sizes, the study is somewhat limited in terms of
interpreting results.
The ratios calculated in the study are limited by the quantity and quality of
existing effectiveness research as well as the small number of interviews conducted to
describe costs. Although the results should be interpreted cautiously, it makes sense to
recommend that peer tutoring should be explored more fully as a low cost way to
improve achievement and attitudes. AR and RR should also be explored in more detail.
Specifically, because AR is much cheaper on a per-student basis and can be used for all
students, will gains in effectiveness be considered large enough by a decision maker?
Given that RR is only intended for a maximum of eight students per year, all in first
grade, in which contexts would it be a decision maker’s best choice?
The results do not suggest that whole school reform is the best option in terms of
improving beginning reading achievement. For a program like SFA, even the focus on
reading instruction must be considered alongside all of the non-instructional staff that
must be added for a full implementation. By considering reading outcomes alone, the
study is limited because SFA incorporates a number of personnel to work upon many
school outcomes. Comparing RR and SFA to smaller add-on programs may not have
207
been the most sensible choice even though they are all purported to show effects for the
same outcome.
Overall, the WWC may have limited usefulness for school or district decision
makers. By providing simple averages of effect sizes and a very limited discussion of
costs that does not consider staff time, decision makers would have to do plenty of
legwork to determine if a program that “works” could be within the budget and effective
in his or her school or district. The estimates provided by the WWC can be combined
with cost measures, but it is difficult to make any final decisions about relative cost-
effectiveness based on point estimates. The WWC should be considered a first step for
decision makers who are trying to find an appropriate educational program or
intervention to introduce to their schools. In the same way, cost-effectiveness analysis
can be seen as a useful tool for helping decision makers to determine which program
could work best in their own context – but it is a first step, and not a final decision rule.
Summary
This chapter presented cost-effectiveness ratios for four beginning reading
programs. Results suggest that add-on programs like Accelerated Reader and Classwide
Peer Tutoring are more cost-effective for improving reading outcomes than programs that
require greater commitment from personnel, such as Reading Recovery and Success for
All. Cost-effectiveness ratios may not provide all of the information a decision maker
requires to make a decision for a particular context or for particular groups of students.
The next and final chapter of the dissertation presents conclusions, and suggests areas for
future research.
208
CHAPTER 7: CONCLUSIONS AND AREAS FOR FUTURE RESEARCH
Educational decision makers are faced with many educational programs from
which to choose, and are challenged by limited budgets and pressure to choose an
intervention that works. This cost-effectiveness analysis was intended to present new and
helpful information about beginning reading programs. For decision makers who may be
considering the choice amongst reading programs, a cost-effectiveness analysis cannot
provide the final word about which program to choose. This chapter presents final
thoughts about the dosage and implementation of an intervention and explains why these
issues are important when considering the results of a cost-effectiveness study. It also
presents ideas for how future research could expand upon the research question explored
in this study to provide additional perspective for decision makers who might be
interested in combining information about costs and benefits when choosing a reading
program.
Dosage and Implementation
This section describes issues related to dosage and implementation factors.
Dosage relates to how much of an intervention to use, and whether additional
expenditures to be made on a program might improve student achievement.
Implementation refers to the quality of the program once introduced into a school, and
whether expenditures are being directed in ways that could be expected to have an effect
on student achievement.
Cost-effectiveness ratios, when expressed as effects divided by cost per thousand,
may be interpreted as the amount of effectiveness gained for a thousand dollars. A
209
decision maker examining a set of cost-effectiveness ratios may wonder if additional
expenditures have a linear relationship with program effects. Given a 0.1 standard
deviation unit increase in effectiveness for $1,000 per student, for example, could a
decision maker spending $2,000 per student expect to see a 0.2 standard deviation unit
increase in effectiveness? There are diminishing returns to school expenditures, rather
than a linear relationship in which increasing expenditures would forever lead to
increased student achievement (Johnson & Stafford, 1973).
For cost-effectiveness analyses, returns to increasing expenditures are expected to
increase, albeit with diminishing returns rather than a linear relationship (Weinstein,
2010; Helmchen, Kaestner, & Lo Sasso, 2008). Diminishing returns implies that, as
expenditures increase by the same increment, additional increases in effectiveness
decrease (Besanko & Braeutigam, 2010). Decision makers who wish to maximize
student improvement must determine the appropriate “dosage” of a reading program to
do so. It is possible that adding more money to the program – for example, by enhancing
teacher training, hiring more experienced staff who are better paid, or purchasing newer
materials – would improve student experiences and achievement. There would be a point,
however, after which continuing to increase expenditures on an effective program would
increase achievement by smaller and smaller increments. It is also unclear what the right
mix of ingredients for each program would be – should the dosage be increased by
spending more time on the program, by requiring additional teacher training, by
purchasing new equipment, or doing some combination of different kinds of activities?
Changes to program “dosage,” then, should be considered along with the extent of
program implementation. The way in which the programs are described in particular
210
effectiveness studies may provide information about dosage and implementation that may
help decision makers to think about how they would introduce a program in their school.
Variations in implementation of the same intervention may cause differences in program
effects (O’Donnell, 2008; Dusenbery et al., 2003). Implementation and dosage issues are
somewhat similar in the sense that the “amount” of intervention provided changes based
on how well, or how much, the intervention is applied. For less prescriptive programs
that provide a number of options from which decision makers may choose, it is important
to review the individual characteristics of the program in specific schools when
considering costs and effects.
One challenge in completing this study was the lack of information about dosage
and implementation. In all cases, average costs were presented in an attempt to provide
the most comparable information, but these costs are point estimates. Any variation in
dosage and implementation may result in different costs and effects for individual
schools, as a result of differences in the kind or extent of the ingredients used. This is an
issue not only for decision makers, but for researchers who wish to present an accurate
and well-matched set of costs and effectiveness measures when conducting a cost-
effectiveness analysis. Because descriptions of dosage and implementation in
effectiveness studies was usually so limited, the effectiveness studies did not provide
additional information to be used to determine how individual costs
Future Research
This study makes a contribution to the field of reading research by providing the
results of a rigorous cost-effectiveness analysis, an infrequently used methodology, and
211
further research could extend the results by examining the question in different ways. The
outcomes used for the analysis were relatively short-term results from standardized
assessments. These proximal outcomes provide specific information about the cost-
effectiveness of reading programs based on short-run achievement outcomes, but they are
not the only outcomes of interest. A cost-benefit analysis would consider other kinds of
outcomes, such as cost-savings as a result of reduced special education referrals or
reduced rates of in-grade retention. Small add-on programs, which seem relatively more
cost-effective in the context of short run outcomes, may not be the most cost-beneficial
programs due to fading program effects (Clarke & Clarke, 1989).
Changes to the student population being served in individual implementations
could be considered in future work. The current study assumed that there were 20
students per class and three classes per grade based on the average number of students in
elementary school classrooms in the U.S. in 2007-2008 (NCES, 2008). If we assume that
there are 25 students in a class, average costs would decrease for Accelerated Reader and
Classwide Peer Tutoring because the fixed costs of training teachers to use the program
would be shared amongst more students, although in the case of Accelerated Reader
some additional equipment for quiz taking would have to be used. For Reading Recovery,
in which a fixed number of struggling readers are to be served, changing the number of
students in a class would not change average costs. For Success for All, which requires
that class sizes be reduced, changing the average number of students in a class would
result in higher facilities costs, as additional classrooms or space would have to be used
to reduce class sizes, but in reduced fixed costs of teacher training as well as social
worker, SFA consultant, and facilitator time. Adjusting the number of students in a class
212
increases the variable, student-dependent costs of the program and decreases fixed costs,
such as those dependent on teacher or school factors. Changing the assumption about
average class size may have had an effect on the ranking suggested by the cost-
effectiveness ratios, and additional work could explore different assumptions about class
or school size, perhaps using the same set of interventions and effectiveness studies.
Warner (2009) points out that a cost-effectiveness analysis can assist in the
decision making process but cannot be considered a decision rule. Further research
should explore the costs and effectiveness of early reading programs in more detail. On
the cost side, it would be helpful to conduct interviews with a large number of principals
or school leaders to gain a better -- or even representative – understanding of trends,
variations, and themes in real world implementation. On the effects side, rigorous quasi-
experimental work should be done for each of the programs to determine whether the
results of existing effectiveness studies can be replicated. If this could be done for a large
enough group, secondary analysis of student-level data could reveal additional
information about effectiveness. The next section describes a potential cost-benefit
analysis examining early literacy interventions; such an analysis would make an
important contribution by considering a full range of outcomes and cost-savings
generated by reading programs.
Potential Cost-Benefit Analysis of Reading Programs
The cost-effectiveness ratios presented in this study open a discussion about
selecting a reading program, but do not refer to cost savings (Warner, 2009); a cost-
benefit analysis would do so. As Warner (2009) points out, one shortcoming of a CEA is
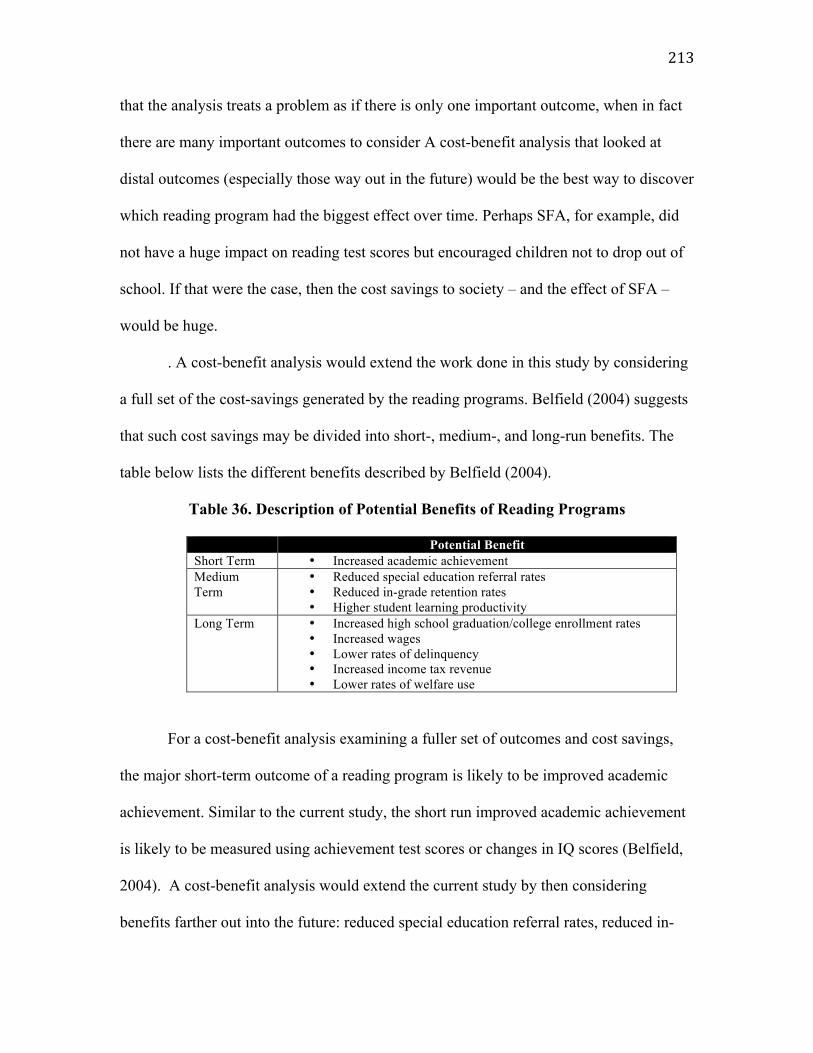
213
that the analysis treats a problem as if there is only one important outcome, when in fact
there are many important outcomes to consider A cost-benefit analysis that looked at
distal outcomes (especially those way out in the future) would be the best way to discover
which reading program had the biggest effect over time. Perhaps SFA, for example, did
not have a huge impact on reading test scores but encouraged children not to drop out of
school. If that were the case, then the cost savings to society – and the effect of SFA –
would be huge.
. A cost-benefit analysis would extend the work done in this study by considering
a full set of the cost-savings generated by the reading programs. Belfield (2004) suggests
that such cost savings may be divided into short-, medium-, and long-run benefits. The
table below lists the different benefits described by Belfield (2004).
Table 36. Description of Potential Benefits of Reading Programs
Potential Benefit Short Term • Increased academic achievement Medium Term
• Reduced special education referral rates • Reduced in-grade retention rates • Higher student learning productivity
Long Term • Increased high school graduation/college enrollment rates • Increased wages • Lower rates of delinquency • Increased income tax revenue • Lower rates of welfare use
For a cost-benefit analysis examining a fuller set of outcomes and cost savings,
the major short-term outcome of a reading program is likely to be improved academic
achievement. Similar to the current study, the short run improved academic achievement
is likely to be measured using achievement test scores or changes in IQ scores (Belfield,
2004). A cost-benefit analysis would extend the current study by then considering
benefits farther out into the future: reduced special education referral rates, reduced in-
214
grade retention rates, and student learning productivity. Belfield (2004) defines student
learning productivity as the result of improved academic achievement, meaning students
that are easier to educate and that have positive peer effects. Ultimate outcomes in a cost-
benefit analysis might include increased high school graduation rates or college
enrollment rates, increased wages and, as a result, increased income tax revenue, lower
rates of delinquency and thereby lower costs to the justice system.
Tracking treatment and comparison groups over the amount of time required to
conduct a thorough cost-benefit analysis examining distal effects would be expensive and
require many years. Rigorous cost-benefit analyses of early childhood programs have
tracked former participants and comparison cohorts well past high school graduation
(e.g., Reynolds, Temple, Robertson, & Mann, 2003; Belfield, Nores, Barnett, &
Schweinhart, 2006). A High Scope/Perry Preschool cost-benefit analysis included data
from a longitudinal follow-up at age 40 (Belfied, Nores, Barnett, & Schweinhart, 2006).
Unlike a cost-effectiveness analysis, which can be conducted with relatively short-term
outcomes to help decision makers trying to make a relatively quick decision based on
available information, cost-benefit analyses require a substantially greater commitment in
terms of time and data collection. It is also not clear that the results of a cost-benefit
analysis would necessarily conform to decision makers’ preferences. Although a decision
maker might be interested in improving long-term outcomes for children, he or she may
be held accountable for shorter-term outcomes such as test scores. If the impact on test
scores is relatively small, even if the program had other long-term effects of interest, a
decision maker might opt not to adopt the program with better long-term results.
215
Final Considerations
Although the evidence suggests that comprehensive school reform may not be the
best way to improve beginning reading scores and that small add-on programs will be
relatively more cost-effective, cost-effectiveness ratios cannot be the only factor
considered when choosing an appropriate reading program. Issues such as needs of
specific students, the number of students or specific subpopulations to be served by the
program, school climate, teacher and administrator buy-in, among others, may have an
impact on a program’s success. In addition, decision makers may have limited budgets
with which to add a reading program, so some options may be out of reach. Teacher
attrition and student mobility may also have an impact on the choice of reading programs.
Because I relied on existing literature, measures of effectiveness are short-term
and relatively few. The analysis relies on existing outcomes, in which the specific
instruments used may have provided treatment groups with an advantage because of
increased exposure relative to comparison groups (i.e., the Observation Survey for RR
studies or STAR test for AR studies).
If estimates could have been generated for outcomes other than immediate test
score gains, such as changes in high school graduation rates, the cost-effectiveness ratios
may have looked different. If all students across programs were tested with the same
instruments, then the ratios may have differed as well. Although decision makers may be
seeking long-term solutions, it is probably fairest to examine proximal outcomes because
program effects tend to fade over time without additional supports (Clarke & Clarke,
1989). If a beginning reading program is shown to be effective or cost-effective, decision
makers should examine effective program components to facilitate the maintenance of
216
any achievement gains. Thinking about RR, for example, let us assume that a child
received 20 weeks of one-to-one instruction and then returns to a classroom where the
techniques of RR are not used and he or she does not receive one-on-one attention. It is
not clear that we could expect a child who had initially been identified as a struggling
reader to maintain gains made in RR.
Because of the limitations of this kind of work, the results of this study should be
considered suggestive, rather than final. RR, the program with the largest effect sizes,
was the third most cost-effective program because its costs are distributed over so few
students. Peer tutoring appears to be a very cost-effective option, but the examination of
CWPT was limited by the use of effect sizes from a single study. SFA appears to be the
least cost-effective of the options, but that is based on the WWC’s simple averages rather
than a statistical synthesis of effect sizes. Also, it is not clear that reading tests would be
the right outcomes to examine the effectiveness of a whole school reform like SFA. The
analysis of AR and RR was also limited by conducting a research synthesis of a relatively
small number of studies, although it appears that a classwide program that distributes
costs over many students is more cost-effective than a one-to-one tutoring program for at-
risk first graders. Finally, the cost estimations were limited by using standard costs for
each program that did not take into account the many differences amongst real-world
implementations.
Ultimately, decision makers must determine how to allocate scarce resources: is it
more desirable to save a few students from reading failure, or to buoy the scores of an
entire class? What role do educational standards and the pressure to meet them play in a
decision maker’s process? This study suggests that smaller, add-on programs would be a
217
relatively more cost-effective choice than an intensive one-to-one tutoring program or a
whole school reform. It is possible that a different pattern would have emerged if longer-
term follow-up had been conducted, since the effects of smaller programs may be hard to
maintain without additional supports (Clarke & Clarke, 1989). Even given this
limitation, this study makes a unique contribution by statistically synthesizing effect
sizes; weighting composite effect size measures according to the preferences of literacy
specialists; and combining costs and effectiveness measures.
By using cost-effectiveness analysis to examine four literacy programs that fell
under the WWC designation of affecting “general reading achievement,” this study
provides a novel way of presenting information to decision makers that takes into account
the desire to maximize student outcomes within budget constraints. Additional cost-
effectiveness research in this area could focus on specific populations of interest –
interventions targeted solely to struggling readers or English language learners, and
should further explore the possibilities of working with a representative group of literacy
specialists to weight reading outcomes. There is great potential for cost-effectiveness
analysis to play an important role in selecting educational programs and helping decision
makers to understand whether and how they will work for a given context.
218
Bibliography ---. Investing in school technology: strategies to meet the funding challenge. November 1997. Retrieved February 2011 from http://www2.ed.gov/pubs/techinvest/chap3a.html. Al Otaiba, S. & Torgeson, J. (2007). Effects from intensive standardized kindergarten and first-grade interventions for the prevention of reading difficulties. In Handbook of response to intervention. Retrieved January 2011 from Springer E-Books. Alexander, K.L., Entwisle, D.R., & Horsey, C.S. (1997). From first grade forward: early foundations of high school dropout. Sociology of Education, 70(2), pp. 87-107. Alexander, K.L., Entwisle, D.R. & Kabbani, N.S. (2001). The dropout process in life course perspective: Early risk factors at home and school. Teachers College Record, 103(5), pp. 760-822. Angrist, K.D. & Lang, J. (2002). How important are classroom peer effects? Evidence from Boston’s METCO Program. NBER Working Paper w9263. Ashdown, J., & Simic, O. (2000). Is early literacy intervention effective for English Language Learners? Evidence from Reading Recovery. Literacy Teaching and Learning, 5(1), pp. 27-42. Assad, S. & Condon, M. (1996). Demonstrating the effectiveness of Reading Recovery: Because it makes a difference. Network News, pp. 10-14. Baenan, N., Bernholc, A., Dulaney, C., & Banks, K. (1997). Reading Recovery: Long term progress after three cohorts. Journal of Education of Students Placed at Risk, 2(2), pp. 161-181. Barnes, G., Crowe, E., & Schaefer, B. (2007). The cost of teacher turnover in five school districts: a pilot study. National Commission on Teaching and America’s Future. Retrieved February 2011 from http://www.kidsohio.org/wp-content/uploads/2008/02/national-commission-on-teaching-and-americas-future_-the-cost-of-teacher-turnover-in-five-school-districts.pdf. Belfield, C.R. (2004). Early childhood education: how important are the cost-savings to the school system? Retrieved April 2011 from http://www.plan4preschool.org/documents/ny-cost-saving.pdf. Belfield, C.R. (2006). The use of cost-benefit analysis in guiding investments in human capital in elementary and secondary school. Retrieved April 2011 from http://www.cbcse.org/modules/download_gallery/dlc.php?file=22. Belfield, C.R., Nores, M., Barnett, S., & Schweinhart, L. (2006). The High/Scope Perry Preschool program: cost-benefit analysis using data from the age-40 follow-up. Journal of Human Resources, 41(1), pp. 162-190. Besanko, D. & Braeutigam, RR. (2010). Microeconomics. New Jersey: John Wiley and Sons. Bishop, M.J. & Edwards Santoro, L. (2006). Evaluating beginning reading software for at-risk readers. Psychology in the Schools, 43(1), pp. 57 – 70.
219
Bitter, C., O’Day, J., Gubbins, P., & Socias, M. (2009). What works to improve student literacy achievement? An examination of instructional practices in a balanced literacy approach. Journal of Education for Students Placed at Risk, 14(1), pp. 17-44. Bloom, B.S. (1981). All our children learning. New York: McGraw Hill. Borman, G.D. & Dowling, N.M. (2004). Testing the Reading Renaissance program theory: A multilevel analysis of student and classroom effects on reading achievement. Retrieved January 2009 from http://www.education.wisc.edu/elpa/people/faculty/Borman/BormanDowling2004_RdgRenProg.pdf. Borman, G.D. & Hewes, G.M. (2003). The long-term effects and cost-effectiveness of Success for All. Retrieved January 2009 from http://www.successforall.org/_images/pdfs/LTEffectsandCostEffofSFA-2003.pdf. Borman, G.D., Slavin, R.E., Cheung, A.C.K., Chamberlain, A.M., Madden, N.A., & Chambers, B. (2005). The national randomized field trial of Success for All: Second- year outcomes. American Educational Research Journal, 42(4), pp. 673-696. Brannick, M.T. & Hall, S.M. (2001). Reducing bias in the Schmidt-Hunter meta-analysis. Retrieved November 2010 from http://luna.cas.usf.edu/~mbrannic/files/conf/siopk.htm. Brown, H., Card, D., Dickersin, K., Greenhouse, J., King, J. & Littell, J. (2008). Report of the What Works Clearinghouse expert panel. Retrieved January 2009 from http://ies.ed.gov/director/board/pdf/panelreport.pdf. Brown, W., Denton, E., Kelly, P., & Neal, J. (1999). Reading Recovery effectiveness: A five-year success story in San Luis Coastal Unified School District. ERS Spectrum, 17(1), pp. 3-12. Bureau of Labor Statistics (n.d.). National Occupational Employment and Wage Estimates United States. Retrieved February 2011 from http://bls.gov/oes/current/oes_nat.htm. Burgess, S.R., Hecht, S.A., & Lonigan, C.J. (2002). Relations of the home literacy environment (HLE) to the development of reading-related abilities: A one-year longitudinal study. Reading Research Quarterly, 37(4), pp. 408–426. Burns, T., Catty, J., Dash, M., Roberts, C., Lockwood, A., & Marshall, M. (2007). Use of intensive case management to reduce time in the hospital in people With severe mental illness: Systematic review and meta-regression. Retrieved October 2010 from http://www.bmj.com/content/335/7615/336.full.pdf. Campbell, D.T. & Stanley, J.C. (1963). Experimental and quasi-experimental designs for research. Massachusetts: Houghton Mifflin Co., 1963. Card, D., & Krueger, A. (1990). Does school quality matter? Returns to education and the characteristics of public schools in the United States. NBER Working Papers 3358, National Bureau of Economic Research, Inc.
220
Cassidy, J., Montalvo-Valadez, C., & Garrett, S.D. (2010). Literacy trends and issues: a look at the Five Pillars and the cement that supports them. The Reading Teacher, 63(8), pp. 644-655. Center, Y., Wheldall, K. & Freeman. L. (2004). Evaluating the effectiveness of Reading Recovery: a critique. In Literacy: reading, processes, and teaching, D. Wray, ed. New York: Routledge Falmer. Chambers, B., Abrami, P.C., Tucker, B.J., Slavin, R.E., Madden, N.A., Cheung, A., & Gifford, R. (2005). Computer-assisted tutoring in Success for All: Reading outcomes for first graders. Retrieved February 2011 from www.successforall.net/_images/pdfs/Computer_Tutor_11_20_05.doc. Chang, H.N. and Romero, M. (2008). Present, engaged, and accounted for: The critical importance of addressing chronic absence in the early grades. Report of the National Center for Children in Poverty, Columbia University. Retrieved September 2008 from http://www.nccp.org/publications/pdf/text_837.pdf. Chapman, J., Iversen, S., & Tunmer, W. (2005). The Effects of varying group size on the Reading Recovery approach to preventive early intervention. Journal of Learning Disabilities, 5, pp. 456-472. Clarke, A.M. & Clarke, A.D.B. (1989). The later cognitive effects of early intervention. Intelligence, 13(4), pp. 289-297. Clotfelter, C.T., Ladd, H.F. & Vigdor, J.L. (2007). Are teacher absences worth worrying about in the U.S.? NBER Working Paper w13648. Clune, W.H. (2002). Methodological strength and policy usefulness of cost-effectiveness research. In Cost-effectiveness and educational policy, H.M. Levin and P.J. McEwan, ed., Eye on Education: New York. Cohen, J. (1992). A primer on power. Psychological Bulletin, 112(1), pp. 155-159. Confrey, J. (2006). Comparing and contrasting the National Research Council Report on evaluating curricular effectiveness with the What Works Clearinghouse approach. Educational Evaluation and Policy Analysis, 28(3), pp. 195-213. Cook, T.D. (2002). Randomized experiments in educational policy research: A critical examination of the reasons the educational evaluation community has offered for not doing them. Educational Evaluation and Policy Analysis, 24(3), pp.175–199. Cook, C,. Heath, F. & Thompson, R.L. (2000). A meta-analysis of response rates in web- or internet-based surveys. Educational and Psychological Measurement, 60(6), pp. 821-836. Cooper, R., Slavin, R.E. & N Madden, N. (1998). Success for All: Improving the quality of implementation of whole-school change through the use of a national reform network. Education and Urban Society, 30(3), pp. 385–408. Cuddeback, M.J. & Ceprano, M.A. (2002). The use of Accelerated Reader with emergent readers. Reading Improvement, 39, pp. 89-96.
221
Cunningham, J.W. (2001). The National Panel Reading Report. Reading Research Quarterly, 36(3), pp. 326-335. Currie, J. & Thomas, D. (1995). Race, children’s cognitive achievement, and the bell curve. NBER Working Paper 5240. Dahl, G. & Lochner, L. (2008). The impact of family income on child achievement: evidence from the Earned Income Tax Credit. NBER Working Paper 14599. Datnow, A., & Castellano, M (2000). Teachers' responses to Success for All: How beliefs, experiences and adaptations shape implementation. American Educational Research Journal, 37(3), pp. 775-799. De La O, A.L. & Rubenson, D. (2010). Strategies for dealing with the problem of non-overlapping units of assignment and outcome measurement in field experiments. Annals of the Academy of Political and Social Science, 628(1), pp. 189-199. de la Torre, J., Camilli, G., Vargas, S. & Vernon, R.F. (2007). Illustration of a multilevel model for meta-analysis. Measurement and Evaluation in Counseling and Development, 40(3), pp. 169-180. Denti, L.G. & Guerin, G. (1999). Dropout prevention: The case for enhanced literacy efforts. The Clearing House, 72(4), pp. 231-235. Denton, D.A., Ciancio, D.J., & Fletcher, J.M. (2006). Validity, reliability, and utility of the Observation Survey of Early Literacy Achievement. Reading Research Quarterly, 41(1), pp. 8-34. Desimone, L. (2002). How can comprehensive school reform models be successfully implemented? Review of Educational Research, 72(3), pp. 433-479. Dexter, E., Simon, J. & Fiedler, J. (2009). How the time flies: Analyzing instructional time in Reading Recovery. Unpublished manuscript. Dineen, J.P., Clark, H.B., & Risley, T.R. (1977). Peer tutoring among elementary students: educational benefits to the tutor. Journal of Applied Behavior Analysis, 10(2), pp. 231-238. Droms, W.G. & Wright, J.O. (2010). Finance and accounting for non-financial majors: all the basics you need to know. New York: Basic Books/Perseus Books Group. Dusenbury, L., Brannigan, R., Falco, M., & Hansen, W. B. (2003). A review of research on fidelity of implementation: Implications for drug abuse prevention in school settings. Health Education Research Theory and Practice, 18, 237–256. Dyer, P. & Binkney, R. (1995). Estimating cost effectiveness and educational outcomes: Retention, remediation, special education, and early intervention. In R. L. Allington, & S. A. Walmsley (Eds.), No quick fix: Rethinking literacy programs in America’s elementary schools. NY: Teachers College Press and the International Reading Association. Dynarski, M. (2008). Comments on Slavin: Bringing answers to educators: Guiding principles for research syntheses. Educational Researcher, 37(1), pp. 27-29.

222
Edwards, P.A. (2007). Home literacy environments: What we know and what we need to know. In Shaping Literacy Achievement, M. Pressley and A.K. Billman, ed. New York: Guilford Press. Elbaum, B., Vaughn, S., Hughes, M.T., & Moody, S.W. (2000). How effective are one-to-one tutoring programs in reading for elementary students at risk for reading failure? A Meta-Analysis of the Intervention Research. Journal of Educational Psychology, 92(4), pp. 605-619. Englund, M.M., Luckner, A.E., Whaley, G.J.L, & Egeland, B. (2004). Children’s achievement in early elementary school: Longitudinal effects of parental involvement, expectations, and quality of assistance. Journal of Educational Psychology, 96, pp. 723-730. Ensminger, M.E. and Slusarcick, A.L. (1992). Paths to high school graduation or dropout: A longitudinal study of a first-grade cohort. Sociology of Education, 65(2), pp. 95-115. Eunice Kennedy Shriver National Institute of Child Health and Human Development, NIH, DHHS. (2000). Report of the National Reading Panel: Teaching children to read (00-4769). Washington, DC: U.S. Government Printing Office. Feldt, L.S. (1973). What size samples for methods/materials experiments? Journal of Educational Measurement, 10(3), pp. 221-226. Feuer, M.J., Towne, L., & Shavelson, R.J. (2002). Scientific culture and educational research. Educational Researcher, 31(4), pp. 4-14. Finn, J.D. (1989). Withdrawing from school. Review of Educational Research, 59(2), pp. 117-142. Fletcher, J.D., Hawley, D.E., & Piele, P.K. (1990). Costs, effects, and utility of microcomputer assisted instruction in the classroom. American Educational Research Journal, 27(4), pp. 783-806. Florida Center for Reading Research (2002). Success for All. Retrieved December 2008 from http://www.fcrr.org/FCRRReports/PDF/Success_for_All_Report.pdf.
Foorman, B.R. & Torgeson, J. (2001). Critical elements of classroom and small-group instruction promote reading success in all children. Learning Disabilities Research and Practice, 16(4), pp. 203-212.
Fowler, F.J. (2009). Survey Research Methods, 4th Edition. Sage Publications: California. Fulk, B. & King, K. (2001). Classwide Peer Tutoring at work. Teaching Exceptional Children, 34(2), pp. 49-53.
Gall, M. (2001). Figuring out the importance of research results: Statistical significance versus practical significance. Retrieved October 2010 from http://pages.uoregon.edu/mgall/statistical_significance_v.htm.
223
Gamoran, A. (1992). Synthesis of research: is ability grouping equitable? Educational Leadership, 50(2) pp. 11-17. Gardiner, J., Hogan, A., Holmes-Rovner, M., Rovner, D., Griffith, L., & Kupersmith, J. (1995). Confidence intervals for cost-effectiveness ratios. Medical Decision Making, 15(3), pp. 254-263. Glennan, T.K. and Melmed, A. (1996). Fostering the use of educational technology: Elements of a national strategy. Retrieved February 2011 from http://www.rand.org/pubs/monograph_reports/MR682/contents.html. Gómez-Bellengé, F.X. (2002). Measuring the cost of Reading Recovery: A Practical Approach. The Journal of Reading Recovery, 2(1), pp. 47-54. Gómez-Bellengé, F.X. (2007). Measuring the impact of Reading Recovery. The Journal of Reading Recovery, 6(2), pp. 53-56. Gough, P.B. (1996). How children learn to read and why they fail. Annals of Dyslexia, 46(1), pp. 1-20. Greenlaw, C. & Brown-Welty, S. (2009). A comparison of web-based and internet-based survey methods. Evaluation Review, 33(5), pp. 464-480. Greenwood, C.R., Delquadri, J.C., & Hall, R.V. (1989). Longitudinal effects of Classwide Peer Tutoring. Journal of Educational Psychology, 81(3), pp. 371-383. Greenwood, C.R., Terry, B., Arreaga-Mayer, C., & Finney, R. (1992). The Classwide Peer Tutoring program: Implementation factors moderating students’ achievement. Journal of Applied Behavior Analysis, 25(1), pp. 101-116.
Greenwood, C.R., Hou, L.S., Delquadri, J., Terry, B.J., & Arreaga-Mayer, C. (2001). Classwide Peer Tutoring Learning Management System (pp. 61-86). In Technology, curriculum, and professional development. J.P. Woodward and L. Cuban, ed. California: Sage Publications.
Greenwood, C.R., Tapia, Y., Abbott, M., & Walton, C. (2003). A building-based case study of evidence-based literacy practices implementation, reading behavior, and growth in reading fluency, K—4. The Journal of Special Education, 37(2), pp. 95-110.
Greenwood, C.R., Arreaga-Mayer, C., Utley, C.A., Gavin, K.M., & Terry, B.J. (2001). Classwide Peer Tutoring Learning Management System: application With elementary-level English language learners. Remedial and Special Education, 22(1), pp. 34-47. Greenwald, R., Hedges, L.V., & Laine, R.D. (1996). The effect of school resources on student achievement. Review of Educational Research, 66, pp. 361-96. Grehan, A.W., Harrison, L.W, Ross, S.M., Nunnery, J.A., Wohlleb, J.C., Dejarnette, K., Williams, E.R., & Dorn, L. (2007). An evaluation of the Reading Recovery intervention program in an at-risk urban setting. Presented at the annual meeting of the American Educational Research Association, Chicago, IL. Available for download at the CREP Web site:
224
Hammond, C., Linton, D., Smink, J., & Drew, S. (2007). Dropout risk factors and exemplary programs. Clemson, SC: National Dropout Prevention Center, Communities In Schools, Inc. Hanson, R.A. & Farrell, D. (1995). The long-term effects on high school seniors of learning to read in kindergarten. Reading Research Quarterly, 30(4), pp. 908-933. Harris, D.N. (2009). Toward policy-relevant benchmarks for cost-effectiveness analysis. Educational Evaluation and Policy Analysis, 31(1), pp. 3-29. Hill, C.J., Bloom, H.S., Rebeck Black, A., & Lipsey, M.W. (2007). Empirical benchmarks for interpreting effect sizes in research. Unpublished manuscript. Retrieved February 2011 from http://www.mdrc.org/publications/459/abstract.html. Hedges, L.V., Tipton, E., & Johnson, M.C. (2010). Robust variance estimation in meta-regression with dependent effect size estimates. Research Synthesis Methods, 1(1), pp. 39-65. Hodgins, G. (2009). The Accelerated Reader program at a “model” elementary school. Doctoral dissertation, Northern Arizona University, 2009. Retrieved via Proquest Digital Dissertations. Hoover’s company profiles (n.d.). Renaissance Learning, Incorporated. Retrieved February 2011 from http://www.answers.com/topic/renaissance-learning-inc#Company_History. Hox, J.J. (2002). Multilevel analysis: techniques and applications. New Jersey: Laurence Erlbaum Associates. Hoyle, R.H. (1999). Statistical strategies for small sample research. California: Sage Publications. Institute for Academic Excellence (1997). Toward a balanced approach to reading motivation: resolving the extrinsic-intrinsic rewards debate. Retrieved February 2011 from http://www.eric.ed.gov/ERICWebPortal/search/detailmini.jsp?_nfpb=true&_&ERICExtSearch_SearchValue_0=ED421687&ERICExtSearch_SearchType_0=no&accno=ED421687. Institute for Education Sciences (n.d.). What Works Clearinghouse “about us” section. Retrieved August 2008 from http://ies.ed.gov/ncee/wwc/aboutus/. Institute for Education Sciences (2006). WWC evidence protocol for beginning reading interventions. Retrieved February 2011 from http://ies.ed.gov/ncee/wwc/references/idocviewer/doc.aspx?docid=27&%3Btocid=1. Institute for Education Sciences (2007). What Works Clearinghouse intervention report on Reading Recovery. Retrieved August 2008 from http://ies.ed.gov/ncee/wwc/pdf/WWC_Reading_Recovery_031907.pdf. Institute for Education Sciences (2007b). What Works Clearinghouse topic report on beginning reading. Retrieved August 2008 from http://ies.ed.gov/ncee/wwc/pdf/BR_TR_08_13_07.pdf.
225
Institute for Education Sciences (2007c). Intervention Report: Classwide Peer Tutoring Appendix. Downloaded February 2011 from http://ies.ed.gov/ncee/wwc/reports/beginning_reading/cwpt/. Internal Revenue Service (n.d.). Overview of Depreciation. Retrieved February 2011 from http://www.irs.gov/publications/p946/ch01.html. Institute for Education Sciences (2008). What Works Clearinghouse evidence standards for reviewing studies. Retrieved January 2011 from ies.ed.gov/ncee/wwc/pdf/study_standards_final.pdf.
“Intrinsic motivation.” In I. Weiner and W.E. Craighead, ed (2010). The Corsini Encyclopedia of Psychology, vol 2. New Jersey: John Wiley and Sons.
Ishak, K.J., Platt, R.W., Joseph, L., & Hanley, J.A. (2008). Impact of approximating or ignoring within-study covariances in multivariate meta-analysis. Statistics in Medicine, 27(5), pp. 670-686.
Iversen, S. & Tunmer, W.E. (1993). Phonological processing skills and the Reading Recovery program. Journal of Educational Psychology, 85, pp. 112-120. Jackson, S.L. (2009). Research methods and statistics: A critical thinking approach. California: Wadsworth Publishing.
Jason, L.A., Ferone, L., & Soucy, G. (1979). Teaching peer-tutoring behaviors in first- and third-grade classrooms. Psychology in the Schools, 16(2), pp. 261-269.
Jeynes, W. (2005). A meta-analysis of the relation of parental involvement to urban elementary school student academic achievement. Urban Education, 40(3), pp. 237-269. Johnson B. & Christensen, L. (2010). Educational research. California: Sage Publications. Johnson, G.E. & Stafford, F.P. (1973). Social returns to quantity and quality of schooling. Journal of Human Resources, 8(2), pp. 139-155. Juel, C. (1988). Learning to read and write: a longitudinal study of 54 children from first to fourth grades. Journal of Educational Psychology, 80(4), pp. 437-447.
Juel, C. (1996). What makes literacy tutoring effective? Reading Research Quarterly, 31(3), pp. 268-289.
Juel C. & Leavell, J.A. (1988). Retention and nonretention of at-risk readers in first grade and their subsequent reading achievement. Journal of Learning Disabilities, 21(9), pp. 571-580.
Justice, L.M. & Pullen, P.C. (2003). Promising interventions for promoting emergent literacy skills: Three evidence-based approaches. Topics in Early Childhood Special Education, 23(3), pp. 99-113. Kane, T.J. & Staiger, D. (2008). Estimating teacher impacts on student achievement: an experimental evaluation. NBER Working Paper w14607.
226
Kim, J.S. & Frees, E.W. (2007). Multilevel modeling With correlated effects. Psychometrika, 72(4), pp. 505-533. Kim, J.S. (2008). Research and the Reading Wars. Phi Delta Kappan, 89(5), pp. 372-375. King, J.A. (1994). Meeting the educational needs of at-risk students: A cost analysis of three models. Educational Evaluation and Policy Analysis, 16(1), pp. 1-19. King Rice, J. (1997). Cost analysis in education: paradox and possibility. Educational Evaluation and Policy Analysis, 19(4), pp. 309-317. Kirk, R.E. (1996). Practical significance: A concept whose time has come. Educational and Psychological Measurement, 56(5), pp. 746-759. Kohler, F.W. & Greenwood, C.R. (1990). Effects of collateral peer supportive behaviors within the Classwide Peer Tutoring program. Journal of Applied Behavior Analysis, 23(3), pp. 307-322. Konstantopoulos, S. & Hedges, L. (2006). How large an effect can we expect from school reforms? IZA working paper 2371. Krashen, S. (2002). The (lack of) experimental evidence supporting the use of Accelerated Reader. School Libraries in Canada, 22(2), pp. 24-26. Kulik, J.A. (1993). An analysis of the research on ability grouping. The National Research Center on the Gifted and Talented. Retrieved February 2011 from http://www.giftedteam.org/pdf/links/ability_grouping_studies2.pdf. Labaree, D.F. (2003). The peculiar problems of preparing educational researchers. Educational Researcher, 32(4), pp. 13-22. Laska, E.M., Meisner, M., & Siegel, C. (1999). Power and sample size in cost-effectiveness analysis. Medical Decision Making, 19(3), pp. 339-343. Lazarus, B.D. & Callahan, T. (2000). Attitudes towards reading expressed by elementary school students with reading disabilities. Reading Psychology, 21, pp. 271-282. Lench, R.V. (2001). Some practical guidelines for effective sample-size determination. American Statistician, 55(3), pp. 187-193. Levin, H.M. (1983). Cost-effectiveness. California: Sage Publications, 1983. Levin, H.M. (1988). Cost-effectiveness and educational policy. Educational Evaluation and Policy Analysis 10(1), pp. 51-69. Levin, H.M. (1994). Little things mean a lot. Educational Policy, 8(4), pp. 396-403. Levin, H.M. (2001). Waiting for Godot: Cost-effectiveness analysis in education. New Directions for Evaluation, 90, pp. 55-68. Levin, H.M. (2002). The Cost-effectiveness of whole school reform. Urban Diversity Series No.114. ERIC Clearinghouse on Urban Education.
227
Levin, H.M., Belfield, C., Muennig, P., & Rouse, C. (2007). The costs and benefits of an excellent education for all of America’s children. Center for Benefit-Cost Studies of Education, http://www.cbcse.org/pages/cost-benefit-studies/leeds-national-benefit-cost-studies.php. Last accessed August 2008. Levin, H. M., Catlin, D., & Elson, A. (2010). Adolescent literacy programs: Costs of implementation. New York, NY: Carnegie Corporation of New York. Levin, H.M., Glass, G.V., & Meister, G.R. (1987). Cost-effectiveness and computer-assisted instruction. Evaluation Review, 11, pp. 50-72. Levin, H.M. & McEwan, P.J. (2001). Cost-effectiveness analysis: Methods and applications. California: Sage Publications. Levin, H.M., & McEwan, P.J., Ed. (2002). Cost-effectiveness and educational policy. New York: Eye on Education Books. Lindo, E.J. (2006). The African American presence in reading intervention experiments. Remedial and Special Education, 27(3), pp. 148-153. Lipsey, M. & Wilson, D.B., (2000). Practical meta-analysis. California: Sage Publications. Lou, Y., Abrami, P.C., Spence, J.C., Poulson, C., Chambers, B., & d’Apollonia, S. (1996). Within-class grouping: a meta-analysis. Review of educational research 66(4), pp. 423-458. Lyons, C.A., & Beaver, J. (1995). Reducing retention and learning disability placement through Reading Recovery: An educationally sound, cost-effective choice. In R. L. Allington & S. A. Walmsley (Eds.), No quick fix: Rethinking literacy programs in America’s elementary schools (pp. 116-136). NY: Teachers College Press and the International Reading Association. Mann, V. (1993). Phoneme awareness and future reading ability. Journal of Learning Disabilities 26(4), pp. 259-269. Marinak, B.A. & Gambrell, L.B. (2008). Intrinsic motivation and rewards: What sustains young children’s engagement with text? Literacy Research and Instruction 47(1), pp. 9-26. Marsh, H.W. & Ball, S. (1989). The peer review process used to evaluate manuscripts submitted to academic journals: interjudgmental reliability. The Journal of Experimental Education 57(2), pp. 151-169. Mathematica Policy Research (n.d.). Finding out what works in education. Retrieved February 2011 from http://www.mathematica-mpr.com/education/whatworks.asp McCormick, C.E. (1999). Using the Little Books from A to Z with five year olds. NHSA Dialog, 3(1), pp. 81-85. McCormick, C.E. & Mason, J.M. (1986). Use of Little Books at home: A minimal intervention strategy that fosters early reading. Technical Report No. 388. Illinois University, Urbana Center for the Study of Reading.
228
McDaniel, C.D. & Gates, R.H. (1998). Marketing research essentials. Ohio: South-Western Publishing Company. McGaw, B. & Glass, G.V. (1980). Choice of the metric for effect Size in meta-analysis. American Educational Research Journal 17(3), pp. 325-337. Miller, R.T., Murnane, R.J., & Willett, J.B. (2007). Do teacher absences impact student achievement? Evidence from one urban school district. NBER Working Paper w13356. Miskell, C. & Song, M. (2004). Passing Reading First: Prominence and processes in an elite policy network. Educational Evaluation and Policy Analysis, 26(2), pp. 89-109. Morgan, S.L. & Winship, C. (2007). Counterfactuals and causal inference: methods and principles for social research. New York: Cambridge University Press. Moore, M., Boardman, A, Vining, A, Weimer, D, & Greenberg, D. (2004). Just give me a number! Practical values for the social discount rate. Journal of Policy Analysis and Management, 23(4), pp. 789-812. Muennig, P. (2008). Cost-effectiveness analysis in health: 2d Edition. California: Jossey Bass. Murray, D.M. (1998). Design and analysis of group-randomized trials. New York: Oxford University Press. Nathan, R.G. & Stanovich, K.E. (1991). The causes and consequences of differences in reading fluency. Theory Into Practice, 30(3), pp. 176-184. National Clearinghouse for Educational Facilities Data and Statistics (n.d.). Retrieved February 2011 from http://www.edfacilities.org/ds/index.cfm. Normore, A.H. & Ilon, L. (2006). Cost-effective school inputs: Is class size reduction the best educational expenditure for Florida? Educational Policy, 20(2), pp. 429-454. Nunnery, J.A., Ross, S.M., & McDonald, A. (2006). A randomized experimental evaluation of the impact of Accelerated Reader/Reading Renaissance implementation on reading achievement in grades 3 to 6. Journal of Education for Students Placed at Risk, 11(1), pp. 1-18. O’Connor, E.A. & Simic, O. (2002). The effect of Reading Recovery on special education referrals and placements. Psychology in the Schools, 39(6), pp. 635-646.
O’Donnell, C.L. (2008). Defining, conceptualizing, and measuring fidelity of implementation and its relationship to outcomes in K–12 curriculum intervention research. Review of Educational Research, 78(1), pp. 33-84.
Paul, T., VanderZee, D., Rue, T., & Swanson, S. (1996). Impact of the Accelerated Reader technology-based literacy program on overall academic achievement and school attendance. Unpublished manuscript. Pavonetti, L.M., Brimmer, K.M. & Cipielewski, J.F. (2002). Accelerated Reader: What are the lasting effects on the reading habits of middle school students exposed to
229
Accelerated Reader in the elementary grades? Journal of Adolescent and Adult Literacy, 46(4), pp. 300-311. Petitti, D. (2000). Meta-analysis, decision analysis, and cost-effectiveness analysis: methods for quantitative synthesis in medicine. New York: Oxford University Press. Phillips, L.M. (1996). Longitudinal effects of early literacy concepts on reading achievement: a kindergarten intervention and five-year follow-up. Journal of Literacy Research, 28(1), pp. 173-195. Pikulski, J. (1994). Preventing reading failure: a review of five effective programs. The Reading Teacher, 48(1), pp. 30-39. Pinnell, G.S., Lyons, C.A., DeFord, D.E., Bryk, A., & Seltzer, N. (1994). Comparing instructional models for the literacy education of high-risk first graders. Reading Research Quarterly, 29, pp. 8-39. Pintrich, P.R., & Schunk, D.H. (2002). Motivation in education: Theory, research, and applications. (2nd edition). New Jersey: Merrill, Prentice Hall. Plug, C. (1977). Number preferences in ratio estimation and constant-sum scaling. The American Journal of Psychology, 90(4), pp. 699-704. RAND Reading Study Group (Snow, C., Chair) (2002). Reading for Understanding, Toward an R&D Program in Reading Comprehension. Santa Monica: RAND.
Rashid, F.L., Morris, R.D., & Sevcik, R.A. (2005). Relationship between home literacy environment and reading achievement in children with reading disabilities. Journal of Learning Disabilities, 38(1), pp. 2-11.
Reed Construction data: construction cost estimating elementary school construction costs (n.d.). Retrieved February 2011 from http://www.reedconstructiondata.com/rsmeans/models/elementary-school/. Reynolds, A.J., Temple, J.A., Robertson, D.L., & Mann, E.A. (2001). Long-term effects of an early childhood intervention on educational achievement and juvenile arrest. Journal of the American Medical Association, 285(18), pp. 2339-2346. Rodgers, S.M. and Gómez Bellengé, F. (2003). Closing the achievement gap in Ohio with Reading Recovery. Journal of Reading Recovery, 3(1), pp. 65-74. Rohland, M. (2003). The What Works Clearinghouse: helping educators find evidence-based research and interventions. Retrieved January 2011 from www.temple.edu/lss/pdf/spotlights/700/spot713.pdf. Rosenthal, R. & Rubin, D.B. (1986). Meta-analytic procedures for combining studies with multiple effect sizes. Psychological Bulletin, 99(3), pp. 400-406. Ross, J.A., Barkaoui, K., & Scott, G. (2007). Evaluations that consider the cost of educational programs: the contribution of high-quality studies. American Journal of Evaluation, 28(4), pp. 477-492.
230
Ross, J. (2008). Cost-utility analysis in educational needs assessment. Evaluation and Program Planning, 31(4), pp. 356-367. Rossi, P.H., Lipsey, M., & Freeman, H.E. (2004). Evaluation: a systematic approach. Sage Publications. Rothstein, R (2008). Whose problem is poverty? Educational Leadership, 65(7), pp. 8-13. Rumberger, R.W. (1995). Dropping out of middle school: a multilevel analysis of students and schools. American Educational Research Journal, 32(3), pp. 583-625. Rumberger, R.W. (2003). The causes and consequences of student mobility. Journal of Negro Education, 72, pp. 6-21. Rumberger, R.W. (2004). “Why students drop out of school.” In Gary Orfield (Ed.), Dropouts in America: Confronting the Graduation Rate Crisis (pp.131-155). Cambridge, MA: Harvard Education Press. Rumberger, R.W. (2007). Early predictors of high school graduation and dropout. California Dropout Research Project Statistical Brief No. 3. Retrieved February 2009 from http://www.hewlett.org/NR/rdonlyres/E8ED37AA-CD56-466D-93A6- A3EBA798C6D2/1231/CDRP_EarlyPredictorsofHighSchoolGraduationandDropo.pdf. Rumberger, R.W. & Lim, S.A. (2008). Why students drop out of school: a review of 25 years of research. California Dropout Research Project Working Paper No. 15. Retrieved February 2009 from http://www.lmri.ucsb.edu/dropouts/pubs_reports.htm. Saxe, L., Tighe, E., Phillips, B., & Kadushin, C. (2007). Reconsidering the size and characteristics of the American Jewish population: new estimates of a larger and more diverse community. Steinhardt Social Research Institute Working Paper. Retrieved September 2010 from http://bir.brandeis.edu/bitstream/handle/10192/23007/Rec_AJP_V1.3.pdf?sequence=1. Scarborough, H.S. (2002). Connecting early language and literacy to later reading (dis)abilities: evidence, theory, and practice. In Handbook of Early Literacy Research . New York: Guilford Press. Scarborough, H.S., Dobrich, W., & Hager, M. (1991). Preschool literacy experience and later achievement. Journal of Learning Disabilities, 24(8), pp. 508-511. Schmidt, M. & Datnow, A. (2005). Teachers’ sense-making about comprehensive school reform: the influence of emotions. Teaching and Teacher Education, 21(8), pp. 949-965. Schoenfeld, A.H. (2006). “Mathematics teaching and learning.” In Alexander, PA and PH Winne, ed. Handbook of Educational Psychology. New Jersey: Lawrence Erlbaum Associates. Schotter, A. (2008). Microeconomics: a modern approach. Ohio: South-Western Cengage Learning. Scull, J.A. and Lo Bianco, J. (2008). Successful engagement in an early literacy Iintervention. Journal of Early Childhood Literacy, 8(2), pp. 123-150.
231
Shadish, W.R., Cook, T.D., & Campbell, D.T. (2002). Experimental and quasi-experimental designs for generalized causal inference. Boston: Houghton Mifflin Company. Shanahan, T. and Barr, R. (1995). Reading Recovery: an independent evaluation of the effects of an early instructional intervention for at-risk learners. Reading Research Quarterly, 30(4), pp. 958-996. Shaywitz, S.E., Fletcher, J.M., Holahan, J.M., Shneider, A.E., Marchione, K.E., Stuebing, K.K., Francis, D.J., Pugh, K.R., & Shaywitz, B.A. (1999). Persistence of dyslexia: the Connecticut longitudinal study at adolescence. Pediatrics, 104(6), pp. 1351-1359. Shore, R. & Shore, B. (2009). Kids Count indicator brief: reducing the high school dropout rate. Annie Casey Foundation Retrieved February 2011 from http://www.aecf.org/KnowledgeCenter/Publications.aspx?pubguid={3DE81D1E-A011-4B6E-91E5-D62D8907BC29}. Sideridis, G.D., Utley, C., Greenwood, C.R., Delquadri, J., Dawson, H., Palmer, P., & Reddy, S. (1997). Classwide Peer Tutoring: effects on the spelling performance and social interactions of students with mild disabilities and their typical peers in an integrated instructional setting. Journal of Behavioral Education, 7(4), pp. 435-462. Slavin, R.E. (2008). What works? Issues in synthesizing educational program evaluations. Educational Researcher, 37(1), pp. 5-14. Slavin, R.E., Karweit, N.L., & Wasik, B.A. (1992). Preventing early school failure: what works? Educational Leadership, 50(4), pp. 10-18. Slavin, R.E. & Madden, N.A. (2008). Understanding bias due to measures inherent to treatments in systematic reviews in education. Paper presented at the Society for Research on Effective Education, Virginia. Retrieved February 2009 from http://www.bestevidence.org/methods/understand_bias_Mar_2008.pdf. Slavin, R.E., Madden, N.A., & Chambers, B. (2001). One million children: Success for All. California: Corwin Press. Slavin, R.E., Madden, N.A., Chambers, B., & Haxby, B. (2008). Two million children: Success for All. California: Corwin Press. Slavin, R.E., Madden, N.A., Dolan, L.J., Wasik, B.A., Ross, S.M., & and Smith, L.J. (1993). Wherever and whenever we choose: the replication of Success for All. Retrieved February 2011 from http://www.successforall.net/_images/pdfs/whenever.htm.
Snow, C.E. (1991). The theoretical basis for relationships between language and literacy in development. Journal of Research in Childhood Education, 6(1), pp. 5-10.
Snow, C.E., Burns, M.S., & Griffin, P., ed. (1998). Preventing Reading Difficulties in Young Children. Washington, DC: National Academy Press.
232
Song, M. & Herman, R. (2010). Critical issues and common pitfalls in designing and conducting impact studies in education. Educational Evaluation and Policy Analysis 32(3), pp. 351-371. Special Connections, University of Kansas (n.d.). Retrieved January 2009 from http://www.specialconnections.ku.edu/cgibin/ cgiwrap/specconn/main.php?cat=instruction§ion=cwpt/main Stevens, J.R. & Taylor, A.M. (2009). Hierarchical dependence in meta-analysis. Journal of Educational and Behavioral Statistics, 34(1), pp. 46-73. Stinnett, A.A. & Mullahy, J. (1998). Net health benefits : a new framework for the analysis of uncertainty in cost-effectiveness analysis. Medical Decision Making, 18(2), pp. S68-S80. Stipek, D.J. (1988). Motivation to learn: from theory to practice. New Jersey: Prentice Hall. Stockard, J. (2010). An analysis of the fidelity implementation policies of the What Works Clearinghouse. Retrieved February 2011 from cie.asu.edu/ojs/index.php/cieatasu/article/download/398/43. Success for All Foundation Web site (n.d.). Retrieved January 2009 from http://www.successforall.net/elementary/sfa.htm. Taylor, B.M., Pearson, P.D., Peterson, D.S., & Rodriguez, M.C. (2003). Reading growth in high-poverty classrooms: the influence of teacher practices that encourage cognitive engagement in literacy learning. The Elementary School Journal, 104(1), pp. 3-28. Taylor, J., Roehrig, A.D., Hensler, B.S., Connor, C.M., & Schatschneider, C. (2010). Teacher quality moderates the genetic effects on early reading. Science, 328, pp. 512-514. Teale, W.H., Paciga, K.A., & Hoffman, J.L. (2007). Beginning reading instruction in urban schools: The curriculum gap ensures a continuing achievement gap. The Reading Teacher, 61(4), pp. 344-348. Temple, J.A., Reynolds, A.J., & Miedel, W.T. (2000). Can early intervention prevent high school dropout? Evidence from the Chicago Child-Parent Centers. Urban education, 35(1), pp. 31-56. Thalheimer, W., & Cook, S. (2002). How to calculate effect sizes from published research articles: A simplified methodology. Retrieved September 2010 from http://work-learning.com/effect_sizes.htm. Thompson, B. (2008). Computing and interpreting effect sizes, confidence intervals, and confidence intervals for effect sizes. In J. Osborne (Ed.), Best practices in quantitative methods (pp. 246-262). Newbury Park, CA: Sage Publications. Thompson, S.G. & Higgins, J.P.T. (2002). How should meta-regression analyses be interpreted and undertaken? Statistics in Medicine, 21(11), pp. 1559-1573. Torgeson, J.K. (2002). The prevention of reading difficulties. Journal of School Psychology, 40, pp. 7-26.
233
Trostel, P.A. (2005). Nonlinearity in the return to education. Journal of Applied Economics, 8(1), pp. 191-202. Tsang, M. (1997). Cost analysis for improved policy making in education. Educational Evaluation and Policy Analysis, 19(4), pp. 18-24. U.S. Department of Education, National Center for Education Statistics (2003). Reading—Young children’s achievement and classroom experiences, NCES 2003–070, by Kristin Denton, Jerry West, and Jill Walston. Washington, DC. U.S. General Services Administration: Per diem Rates for Maryland (n.d.). Retrieved February 2011 from http://www.gsa.gov/portal/category/100120. Valentine, J. C. & Cooper, H. (2003). Effect size substantive interpretation guidelines: Issues in the interpretation of effect sizes. Washington, DC: What Works Clearinghouse. Vaughn, S., Linan-Thompson, S., Kouzekanani, K., Pedrotty Bryant, D., Dickson, S., & Blozis, S.A. (2003). Reading instruction grouping for students with reading difficulties. Remedial and special education, 24(5), pp. 301-315. Vicente, P. & Reis, E. (2010). Using questionnaire design to fight nonresponse bias in web surveys. Social Science Computer Review, 28(2), pp. 251-267. Walters, P.B., Laureau, A., & Ranis, S.H. (2009). Education research on trial. New York: Routledge Publishing. Warner, K.E. (1989). Issues in cost effectiveness in health care. Journal of Public Health Dentistry 49(5). Retrieved November 2010 from http://deepblue.lib.umich.edu/bitstream/2027.42/65700/1/j.1752-7325.1989.tb02085.x.pdf. Wasik, B.A. (1998). Using volunteers as reading tutors: guidelines for successful practices. The Reading Teacher, 51(7), pp. 562-570. Wasik, B.A. & Slavin, R.E. (1993). Preventing early reading failure with one-to-one tutoring: a review of five programs. Reading Research Quarterly, 28(2), pp. 179-200. Weinstein, M.C. & Skinner, J.A. (2010). Comparative effectiveness and health care spending – implications for reform. New England Journal of Medicine, 362, pp. 460-465. White, J.L., Albers, C.A., DiPerna, J.C., Elliott, S.N., Kratochwill, T.R., & Roach, A.T. (2004). Cost analysis in educational decision-making: approaches, procedures, and case examples. Wisconsin Center for Education Research. Retrieved February 2011 from http://harbaugh.uoregon.edu/Readings/Education/Cost%20Analysis%20Final%20Version21-14-04%20(2).doc.
Whitehead, J.F. (1999). Effect of the Reading Renaissance approach or a traditional basal approach on reading achievement in third grade. Doctoral Dissertation, Mercer University, 1999. Retrieved August 2008 from Educational Resources Information Center. Yeh, S.S. (2007). The cost-effectiveness of five policies for improving student achievement. American Journal of Evaluation, 28(4), pp. 416–436.

234
Yeh, S.S. (2009). Class size reduction or rapid formative assessment?: A comparison of cost-effectiveness. Educational Research Review, 4(1), pp. 7–15. Yopp, H.K. (1992). Developing phonemic awareness in young children. The Reading Teacher, 45(9), pp. 696-703.

235
Appendix I: Studies Reviewed With Decision About Acceptance Into Study, and Why Rejected
Prog Type
of Study
Citation Decision
1 AR Diss Ciccia, Melinda, Ed.D., Wilmington University (Delaware), 2009. Accelerated Reader and its impact on special education students at Middletown High School.
The unit of analysis was not students in grades K-3.
2 AR Diss Canty, Eunice, Ed.D., Walden University, 2009. Comparison of a teacher's positive affect and a teacher's neutral affect on student participation in the accelerated reader program.
The experimental group was not compared to a control or comparison group.
3 AR Diss Trevino-Diaz, Benita Darlene, Ed.D., University of Houston, 2009. Elementary students' experiences of the Accelerated Reader program in a South Texas border school.
The study was not quantitative.
4 AR Diss Gomez, Frank, II, Ed.D., University of Southern California, 2009. English language learners utilizing the Accelerated Reader program.
The unit of analysis was not students in grades K-3.
5 AR Diss Hodgins, Gary, Ed.D., Northern Arizona University, 2009. The Accelerated Reader program at a "model" elementary school.
The study’s outcome variable was not reading achievement.
6 AR Diss Trueb, Kathleen J., Ed.D., Lindenwood University, 2009. The effects of motivational independent reading programs on elementary at-risk students' reading skills.
The unit of analysis was not students in grades K-3.
7 AR Diss Blackburn, Cherrie Ann Shannon, Ed.D., Walden University, 2009. The effect of brain-based instructional techniques on the reading skills of elementary students.
The unit of analysis was not students in grades K-3.
8 AR Diss Churchwell, Dawn Earheart, Ed.D., Tennessee State University, 2009. The impact of reading achievement on overall academic achievement.
The unit of analysis was not students in grades K-3.
9 AR Diss Brown, Janie, Ed.D., East Tennessee State University, 2008. A comparative analysis of TCAP reading-language arts scores between students who used "Accelerated Reader" and students who used Sustained Silent Reading.
The unit of analysis was not students in grades K-3.
10 AR Diss Williamson, Amy M., Ed.D., Baylor University, 2008. An examination of the relationship of Accelerated Reader implementation, secondary reading programs, and TAKS Reading pass rates for ninth grade students in selected central Texas school districts.
The unit of analysis was not students in grades K-3.
11 AR Diss Williams, Cathy Harris, Ph.D., Auburn The unit of analysis was
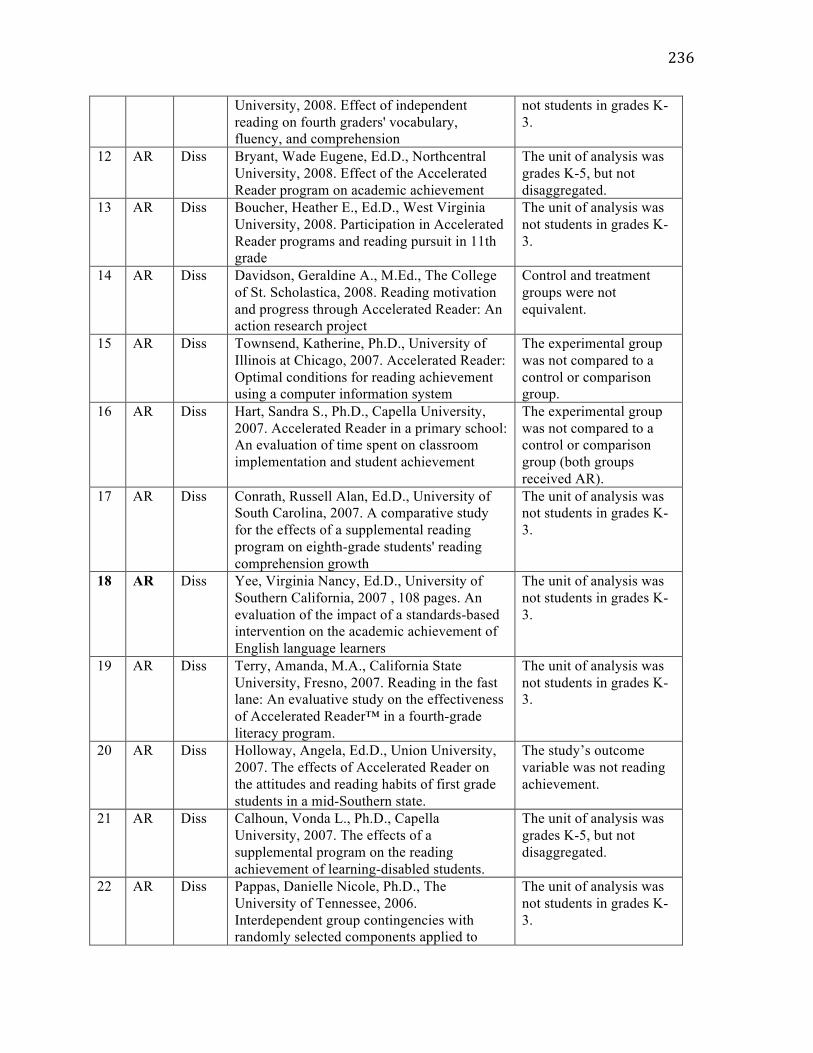
236
University, 2008. Effect of independent reading on fourth graders' vocabulary, fluency, and comprehension
not students in grades K-3.
12 AR Diss Bryant, Wade Eugene, Ed.D., Northcentral University, 2008. Effect of the Accelerated Reader program on academic achievement
The unit of analysis was grades K-5, but not disaggregated.
13 AR Diss Boucher, Heather E., Ed.D., West Virginia University, 2008. Participation in Accelerated Reader programs and reading pursuit in 11th grade
The unit of analysis was not students in grades K-3.
14 AR Diss Davidson, Geraldine A., M.Ed., The College of St. Scholastica, 2008. Reading motivation and progress through Accelerated Reader: An action research project
Control and treatment groups were not equivalent.
15 AR Diss Townsend, Katherine, Ph.D., University of Illinois at Chicago, 2007. Accelerated Reader: Optimal conditions for reading achievement using a computer information system
The experimental group was not compared to a control or comparison group.
16 AR Diss Hart, Sandra S., Ph.D., Capella University, 2007. Accelerated Reader in a primary school: An evaluation of time spent on classroom implementation and student achievement
The experimental group was not compared to a control or comparison group (both groups received AR).
17 AR Diss Conrath, Russell Alan, Ed.D., University of South Carolina, 2007. A comparative study for the effects of a supplemental reading program on eighth-grade students' reading comprehension growth
The unit of analysis was not students in grades K-3.
18 AR Diss Yee, Virginia Nancy, Ed.D., University of Southern California, 2007 , 108 pages. An evaluation of the impact of a standards-based intervention on the academic achievement of English language learners
The unit of analysis was not students in grades K-3.
19 AR Diss Terry, Amanda, M.A., California State University, Fresno, 2007. Reading in the fast lane: An evaluative study on the effectiveness of Accelerated Reader™ in a fourth-grade literacy program.
The unit of analysis was not students in grades K-3.
20 AR Diss Holloway, Angela, Ed.D., Union University, 2007. The effects of Accelerated Reader on the attitudes and reading habits of first grade students in a mid-Southern state.
The study’s outcome variable was not reading achievement.
21 AR Diss Calhoun, Vonda L., Ph.D., Capella University, 2007. The effects of a supplemental program on the reading achievement of learning-disabled students.
The unit of analysis was grades K-5, but not disaggregated.
22 AR Diss Pappas, Danielle Nicole, Ph.D., The University of Tennessee, 2006. Interdependent group contingencies with randomly selected components applied to
The unit of analysis was not students in grades K-3.

237
class-wide performance in the Accelerated Reader program.
23 AR Diss Focarile, Deborah Ann, Ed.D., Baylor University, 2006. The Accelerated Reader Program and students' attitude towards reading.
The study’s outcome variable was not reading achievement.
24 AR Diss Rodriguez-Blanco, Orfa, Ed.D., Texas A&M University - Kingsville, 2006. The impact of the Accelerated Reader Program on third grade/fourth grade bilingual students' TAKS reading scores in a South Texas border town.
The experimental group was not compared to a control or comparison group.
25 AR Diss Elmore, Olivia Carol, Ph.D., Texas A&M University, 2005. Analysis of the principal's perceptions of the implementation and impact of the Accelerated Reader and other selected reading strategies used by Texas Gold Performance elementary schools.
The unit of analysis was not students in grades K-3.
26 AR Diss White, W. Quinn, Ph.D., The Ohio State University, 2005. An investigation of the Accelerated Reader program in one small school district: Students', teachers', and administrators' perceptions.
This was not a quantitative study.
27 AR Diss Smith, Inga, Ed.D., Nova Southeastern University, 2005. Can Accelerated Reader and cooperative learning enhance the reading achievement of Level 1 high school students on the Florida Comprehensive Assessment Test?
The unit of analysis was not students in grades K-3.
28 AR Diss Eliason, Bert, D.Ed., University of Oregon, 2005. Effects of Accelerated Reader on student attitudes toward reading.
The study’s outcome variable was not reading achievement.
29 AR Diss Bullock, Jonathon C., D.Ed., University of Oregon, 2005. Effects of The Accelerated Reader on reading performance of third, fourth, and fifth-grade students in one western Oregon elementary school.
Accepted.
30 AR Diss Lewis, Susan Carol Salyer, Ed.D., East Tennessee State University, 2005. Evaluating alternative methodologies to teaching reading to sixth-grade students and the association with student achievement.
The unit of analysis was not students in grades K-3.
31 AR Diss Schreiber, Marlene J., Ed.D., Widener University, 2005. Factors affecting the efficacy of an Accelerated Reader program: A case study.
The unit of analysis was not students in grades K-3.
32 AR Diss Kelly, Clarissa, Ed.D., Nova Southeastern University, 2005. Implementation of reading improvement strategies at a small elementary school in a rural area.
Does not provide information to calculate effect sizes.
33 AR Diss Kerns, Gene M., Ed.D., University of The unit of analysis was
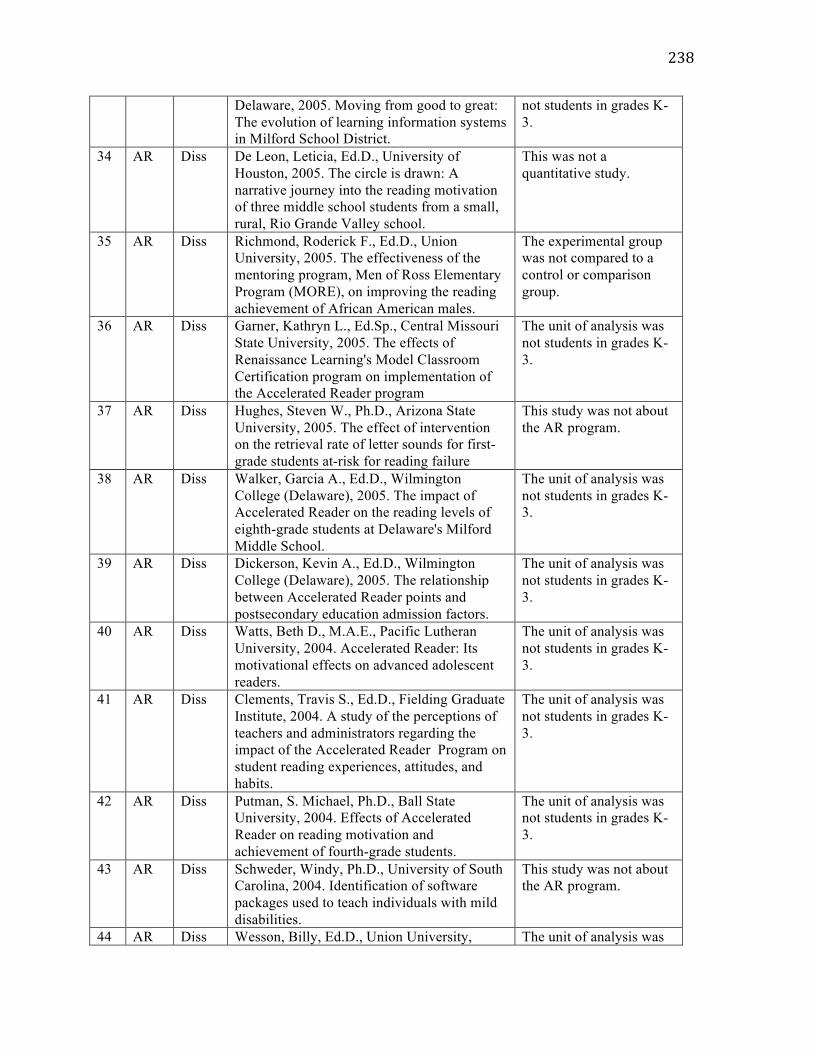
238
Delaware, 2005. Moving from good to great: The evolution of learning information systems in Milford School District.
not students in grades K-3.
34 AR Diss De Leon, Leticia, Ed.D., University of Houston, 2005. The circle is drawn: A narrative journey into the reading motivation of three middle school students from a small, rural, Rio Grande Valley school.
This was not a quantitative study.
35 AR Diss Richmond, Roderick F., Ed.D., Union University, 2005. The effectiveness of the mentoring program, Men of Ross Elementary Program (MORE), on improving the reading achievement of African American males.
The experimental group was not compared to a control or comparison group.
36 AR Diss Garner, Kathryn L., Ed.Sp., Central Missouri State University, 2005. The effects of Renaissance Learning's Model Classroom Certification program on implementation of the Accelerated Reader program
The unit of analysis was not students in grades K-3.
37 AR Diss Hughes, Steven W., Ph.D., Arizona State University, 2005. The effect of intervention on the retrieval rate of letter sounds for first-grade students at-risk for reading failure
This study was not about the AR program.
38 AR Diss Walker, Garcia A., Ed.D., Wilmington College (Delaware), 2005. The impact of Accelerated Reader on the reading levels of eighth-grade students at Delaware's Milford Middle School.
The unit of analysis was not students in grades K-3.
39 AR Diss Dickerson, Kevin A., Ed.D., Wilmington College (Delaware), 2005. The relationship between Accelerated Reader points and postsecondary education admission factors.
The unit of analysis was not students in grades K-3.
40 AR Diss Watts, Beth D., M.A.E., Pacific Lutheran University, 2004. Accelerated Reader: Its motivational effects on advanced adolescent readers.
The unit of analysis was not students in grades K-3.
41 AR Diss Clements, Travis S., Ed.D., Fielding Graduate Institute, 2004. A study of the perceptions of teachers and administrators regarding the impact of the Accelerated Reader Program on student reading experiences, attitudes, and habits.
The unit of analysis was not students in grades K-3.
42 AR Diss Putman, S. Michael, Ph.D., Ball State University, 2004. Effects of Accelerated Reader on reading motivation and achievement of fourth-grade students.
The unit of analysis was not students in grades K-3.
43 AR Diss Schweder, Windy, Ph.D., University of South Carolina, 2004. Identification of software packages used to teach individuals with mild disabilities.
This study was not about the AR program.
44 AR Diss Wesson, Billy, Ed.D., Union University, The unit of analysis was
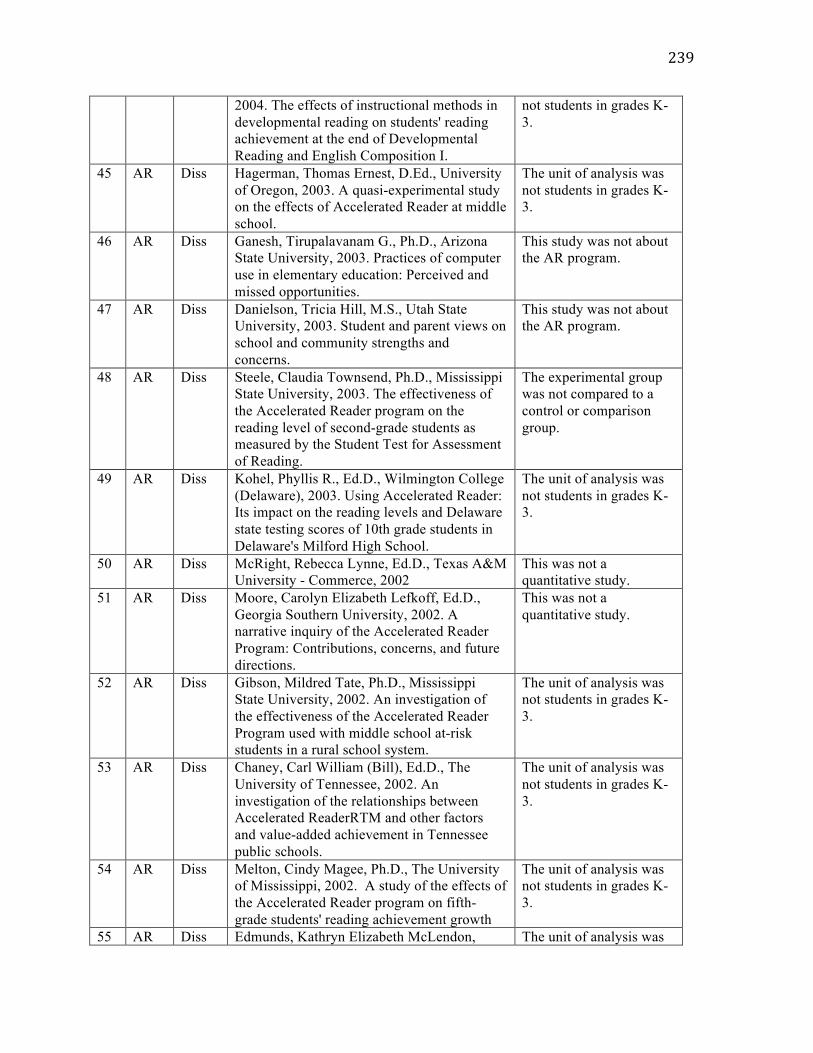
239
2004. The effects of instructional methods in developmental reading on students' reading achievement at the end of Developmental Reading and English Composition I.
not students in grades K-3.
45 AR Diss Hagerman, Thomas Ernest, D.Ed., University of Oregon, 2003. A quasi-experimental study on the effects of Accelerated Reader at middle school.
The unit of analysis was not students in grades K-3.
46 AR Diss Ganesh, Tirupalavanam G., Ph.D., Arizona State University, 2003. Practices of computer use in elementary education: Perceived and missed opportunities.
This study was not about the AR program.
47 AR Diss Danielson, Tricia Hill, M.S., Utah State University, 2003. Student and parent views on school and community strengths and concerns.
This study was not about the AR program.
48 AR Diss Steele, Claudia Townsend, Ph.D., Mississippi State University, 2003. The effectiveness of the Accelerated Reader program on the reading level of second-grade students as measured by the Student Test for Assessment of Reading.
The experimental group was not compared to a control or comparison group.
49 AR Diss Kohel, Phyllis R., Ed.D., Wilmington College (Delaware), 2003. Using Accelerated Reader: Its impact on the reading levels and Delaware state testing scores of 10th grade students in Delaware's Milford High School.
The unit of analysis was not students in grades K-3.
50 AR Diss McRight, Rebecca Lynne, Ed.D., Texas A&M University - Commerce, 2002
This was not a quantitative study.
51 AR Diss Moore, Carolyn Elizabeth Lefkoff, Ed.D., Georgia Southern University, 2002. A narrative inquiry of the Accelerated Reader Program: Contributions, concerns, and future directions.
This was not a quantitative study.
52 AR Diss Gibson, Mildred Tate, Ph.D., Mississippi State University, 2002. An investigation of the effectiveness of the Accelerated Reader Program used with middle school at-risk students in a rural school system.
The unit of analysis was not students in grades K-3.
53 AR Diss Chaney, Carl William (Bill), Ed.D., The University of Tennessee, 2002. An investigation of the relationships between Accelerated ReaderRTM and other factors and value-added achievement in Tennessee public schools.
The unit of analysis was not students in grades K-3.
54 AR Diss Melton, Cindy Magee, Ph.D., The University of Mississippi, 2002. A study of the effects of the Accelerated Reader program on fifth-grade students' reading achievement growth
The unit of analysis was not students in grades K-3.
55 AR Diss Edmunds, Kathryn Elizabeth McLendon, The unit of analysis was
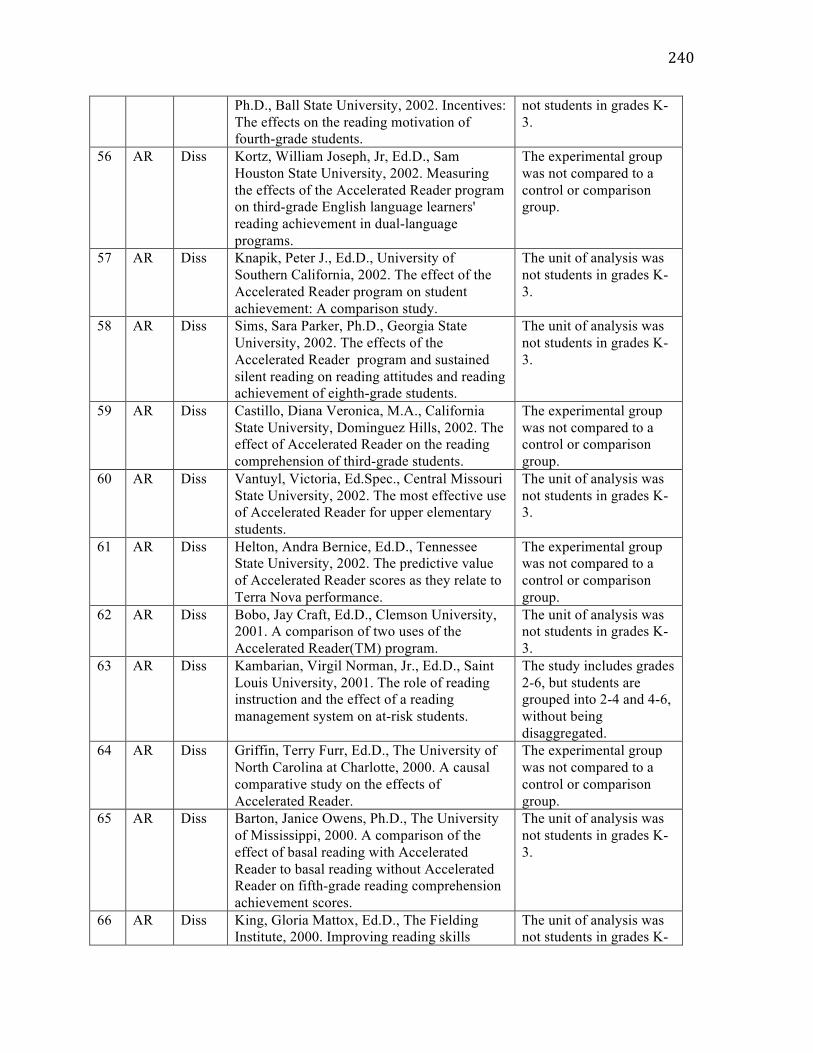
240
Ph.D., Ball State University, 2002. Incentives: The effects on the reading motivation of fourth-grade students.
not students in grades K-3.
56 AR Diss Kortz, William Joseph, Jr, Ed.D., Sam Houston State University, 2002. Measuring the effects of the Accelerated Reader program on third-grade English language learners' reading achievement in dual-language programs.
The experimental group was not compared to a control or comparison group.
57 AR Diss Knapik, Peter J., Ed.D., University of Southern California, 2002. The effect of the Accelerated Reader program on student achievement: A comparison study.
The unit of analysis was not students in grades K-3.
58 AR Diss Sims, Sara Parker, Ph.D., Georgia State University, 2002. The effects of the Accelerated Reader program and sustained silent reading on reading attitudes and reading achievement of eighth-grade students.
The unit of analysis was not students in grades K-3.
59 AR Diss Castillo, Diana Veronica, M.A., California State University, Dominguez Hills, 2002. The effect of Accelerated Reader on the reading comprehension of third-grade students.
The experimental group was not compared to a control or comparison group.
60 AR Diss Vantuyl, Victoria, Ed.Spec., Central Missouri State University, 2002. The most effective use of Accelerated Reader for upper elementary students.
The unit of analysis was not students in grades K-3.
61 AR Diss Helton, Andra Bernice, Ed.D., Tennessee State University, 2002. The predictive value of Accelerated Reader scores as they relate to Terra Nova performance.
The experimental group was not compared to a control or comparison group.
62 AR Diss Bobo, Jay Craft, Ed.D., Clemson University, 2001. A comparison of two uses of the Accelerated Reader(TM) program.
The unit of analysis was not students in grades K-3.
63 AR Diss Kambarian, Virgil Norman, Jr., Ed.D., Saint Louis University, 2001. The role of reading instruction and the effect of a reading management system on at-risk students.
The study includes grades 2-6, but students are grouped into 2-4 and 4-6, without being disaggregated.
64 AR Diss Griffin, Terry Furr, Ed.D., The University of North Carolina at Charlotte, 2000. A causal comparative study on the effects of Accelerated Reader.
The experimental group was not compared to a control or comparison group.
65 AR Diss Barton, Janice Owens, Ph.D., The University of Mississippi, 2000. A comparison of the effect of basal reading with Accelerated Reader to basal reading without Accelerated Reader on fifth-grade reading comprehension achievement scores.
The unit of analysis was not students in grades K-3.
66 AR Diss King, Gloria Mattox, Ed.D., The Fielding Institute, 2000. Improving reading skills
The unit of analysis was not students in grades K-

241
through identifying and utilizing students' learning styles.
3.
67 AR Diss Jarrell, Dennis K., Ed.D., Saint Louis University, 2000. The effects of computer access on reading achievement.
The unit of analysis was not students in grades K-3.
68 AR Diss Rogers, Linda Sue, Ed.D., Georgia Southern University, 2000. The perceived impact of the Accelerated Reader Program in an elementary school.
The unit of analysis was not students in grades K-3.
69 AR Diss Morse, Deborah J., M.Ed., Grand Valley State University, 1999. Accelerated Reader: Does it work?
The experimental group was not compared to a control or comparison group.
70 AR Diss Howard, Carol Ann, Ph.D., Old Dominion University, 1999. An evaluation of the Accelerated Reader program in grades 3--5 on reading vocabulary, comprehension, and attitude in an urban southeastern school district in Virginia.
The experimental group was not compared to a control or comparison group.
71 AR Diss Vega, Christina, Ed.D., University of Sarasota, 1999. A research conducted to study the effect of Accelerated Reader designed to help increase reading levels in a third-grade class of at-risk students
The experimental group was not compared to a control or comparison group.
72 AR Diss Pratt, Mitchell O., Ph.D., Nova Southeastern University, 1999. A study of the computerized reading management program, Accelerated Reader, and its effect on reading among primary grade students.
Control and treatment groups were not shown to be equivalent.
73 AR Diss Kunz, Janice Rose Rakers, Ph.D., Saint Louis University, 1999. Does the Accelerated Reader program have an impact on the improvement of children's reading scores in Illinois?
The treatment and control groups were not shown to be equivalent on a pretest.
74 AR Diss Harrell, JoAnne Patricia, M.Ed., Grand Valley State University, 1999. Independent readers increase library use.
The experimental group was not compared to a control or comparison group.
75 AR Diss Verano, Angela, M.A., Pacific Lutheran University, 1999. Student-teacher reading conferences: An approach to understanding text through talk.
This was not a quantitative study.
76 AR Diss Bork, Ronald Dale, Ed.D., Saint Louis University, 1999. The effectiveness of the Accelerated Reader program on improving student instructional reading levels as measured by the Standardized Test for Assessment of Reading.
The experimental group was not compared to a control or comparison group.
77 AR Diss Holman, Gina Gurley, Ed.D., University of Sarasota, 1998. Correlational study to
The unit of analysis was not students in grades K-

242
determine the effects of the Accelerated Reader Program on the reading comprehension of fourth and fifth-grade students in Early County, Georgia.
3.
78 AR Diss Spradley, Teresa Gibson, Ed.D., The University of Southern Mississippi, 1998. The Accelerated Reader program and ITBS normal curve equivalents for reading, mathematics, and language of sixth-grade students.
The unit of analysis was not students in grades K-3.
79 AR Diss Ubel, Renita Kathleen Pohl, Ed.D., University of Kansas, 1998. The attitudes of teachers in one county in Kansas toward their school improvement plan assessments.
The unit of analysis was not students in grades K-3.
80 AR Diss Knox, Mary Laird, Ed.D., University of South Florida, 1996. An experimental study of the effects of "the Accelerated Reader program" and a teacher directed program on reading comprehension and vocabulary of fourth and fifth grade students.
The unit of analysis was not students in grades K-3.
81 AR Diss Ansari, Shirin B., Ph.D., United States International University, 1996. Can reading skills be acquired despite deficits in phonemic awareness: A study of reading skills in children with Down's syndrome.
This was not a quantitative study.
82 AR Diss McMillan, Mary Katherine, Ed.D., University of Houston, 1996. The effect of the Accelerated Reader Program on the reading comprehension and the reading motivation of fourth-grade students
The unit of analysis was not students in grades K-3.
1 CT Diss Nardiello, Sharon L., M.A.S.E., Caldwell College, 2009 . Classwide peer tutoring.
The experimental group was not compared to a control or comparison group.
2 CT Diss Karagiannakis, Anastasia, Ph.D., McGill University (Canada), 2008. Classwide Peer Tutoring: Social status and self-concept of boys with and without behaviour problems.
Does not examine students in USA.
3 CT Diss Marshak, Lisa R., Ph.D., George Mason University, 2008. Curriculum enhancements in inclusive social studies classrooms: Effects on students with and without disabilities.
The unit of analysis was not students in grades K-3.
4 CT Diss McDuffie, Kimberly A., Ph.D., George Mason University, 2006. Promoting success in content area classes: Is value added through co-teaching?
The unit of analysis was not students in grades K-3.
5 CT Diss Weidinger, Deborah, Ph.D., The University of Kansas, 2006. The effects of classwide peer tutoring on the acquisition of kindergarten reading and math skills.
Accepted.
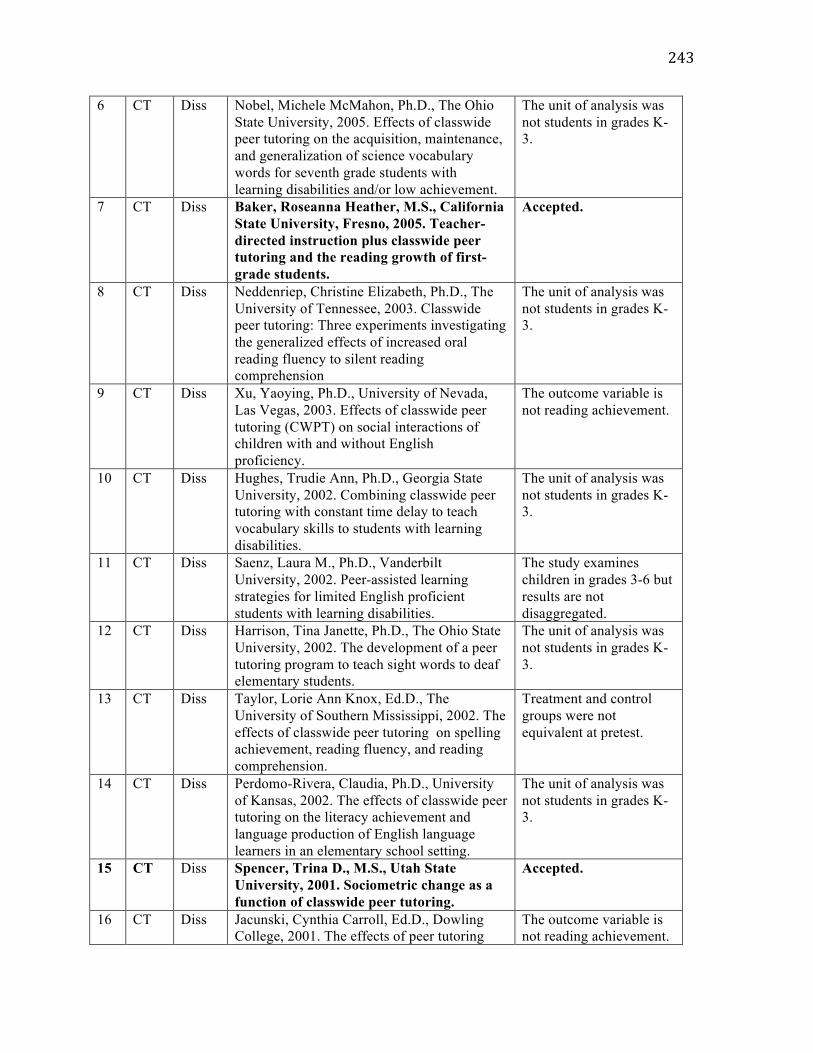
243
6 CT Diss Nobel, Michele McMahon, Ph.D., The Ohio State University, 2005. Effects of classwide peer tutoring on the acquisition, maintenance, and generalization of science vocabulary words for seventh grade students with learning disabilities and/or low achievement.
The unit of analysis was not students in grades K-3.
7 CT Diss Baker, Roseanna Heather, M.S., California State University, Fresno, 2005. Teacher-directed instruction plus classwide peer tutoring and the reading growth of first-grade students.
Accepted.
8 CT Diss Neddenriep, Christine Elizabeth, Ph.D., The University of Tennessee, 2003. Classwide peer tutoring: Three experiments investigating the generalized effects of increased oral reading fluency to silent reading comprehension
The unit of analysis was not students in grades K-3.
9 CT Diss Xu, Yaoying, Ph.D., University of Nevada, Las Vegas, 2003. Effects of classwide peer tutoring (CWPT) on social interactions of children with and without English proficiency.
The outcome variable is not reading achievement.
10 CT Diss Hughes, Trudie Ann, Ph.D., Georgia State University, 2002. Combining classwide peer tutoring with constant time delay to teach vocabulary skills to students with learning disabilities.
The unit of analysis was not students in grades K-3.
11 CT Diss Saenz, Laura M., Ph.D., Vanderbilt University, 2002. Peer-assisted learning strategies for limited English proficient students with learning disabilities.
The study examines children in grades 3-6 but results are not disaggregated.
12 CT Diss Harrison, Tina Janette, Ph.D., The Ohio State University, 2002. The development of a peer tutoring program to teach sight words to deaf elementary students.
The unit of analysis was not students in grades K-3.
13 CT Diss Taylor, Lorie Ann Knox, Ed.D., The University of Southern Mississippi, 2002. The effects of classwide peer tutoring on spelling achievement, reading fluency, and reading comprehension.
Treatment and control groups were not equivalent at pretest.
14 CT Diss Perdomo-Rivera, Claudia, Ph.D., University of Kansas, 2002. The effects of classwide peer tutoring on the literacy achievement and language production of English language learners in an elementary school setting.
The unit of analysis was not students in grades K-3.
15 CT Diss Spencer, Trina D., M.S., Utah State University, 2001. Sociometric change as a function of classwide peer tutoring.
Accepted.
16 CT Diss Jacunski, Cynthia Carroll, Ed.D., Dowling College, 2001. The effects of peer tutoring
The outcome variable is not reading achievement.

244
and direct instruction on the social studies skills performance of elementary school children with learning disabilities in inclusion and self-contained settings.
17 CT Diss Veerkamp, Mary Baldwin, Ph.D., University of Kansas, 2001. The effects of classwide peer tutoring on the reading achievement of urban middle school students.
The unit of analysis was not students in grades K-3.
18 CT Diss Li, Li, Ph.D., Utah State University, 1999. The effects of varying amounts of practice during classwide peer tutoring on spelling performance of third graders.
The experimental group was not compared to a control or comparison group.
19 CT Diss Stevens, Michelle Leigh, Psy.D., Alfred University, 1998. Effects of classwide peer tutoring on the classroom behavior and academic performance of students with ADHD.
The unit of analysis was not students in grades K-3.
20 CT Diss Thomas, Dawn Dee Christian, Ph.D., University of Kansas, 1998. Teacher-adapted classwide peer tutoring: Effects on the spelling performance and academic engagement of students with and without disabilities in an integrated instructional setting.
The unit of analysis was not students in grades K-3.
21 CT Diss Tucek, Susan Louise, M.A., Grand Valley State University, 1998. The effects of classed peer tutoring on students with learning disabilities' basic reading skills.
The unit of analysis was not students in grades K-3.
22 CT Diss VanDyke, Jeffrey Alan, M.Ed., Grand Valley State University, 1997. Reading comprehension needs of students with learning disabilities in an inclusion setting: Classwide peer tutoring with a summarization strategy
The unit of analysis was not students in grades K-3.
23 CT Diss Matheson, Carol, Ph.D., The Pennsylvania State University, 1997. The effects of ClassWide Peer Tutoring on the academic achievement and classroom deportment of children with attention deficit hyperactivity disorder.
The unit of analysis was not students in grades K-3.
24 CT Diss Mortweet, Susan Lynn, Ph.D., University of Kansas, 1996. The academic and social effects of classwide peer tutoring for students with educable mental retardation and their typical peers in an inclusive classroom.
The experimental group was not compared to a control or comparison group.
25 CT Diss Allsopp, David Henderson, Ph.D., University of Florida, 1995
The unit of analysis was not students in grades K-3.
26 CT Diss Sideridis, Georgios Dimitri, Ph.D., University of Kansas, 1995. Classwide Peer Tutoring:
The unit of analysis was not students in grades K-
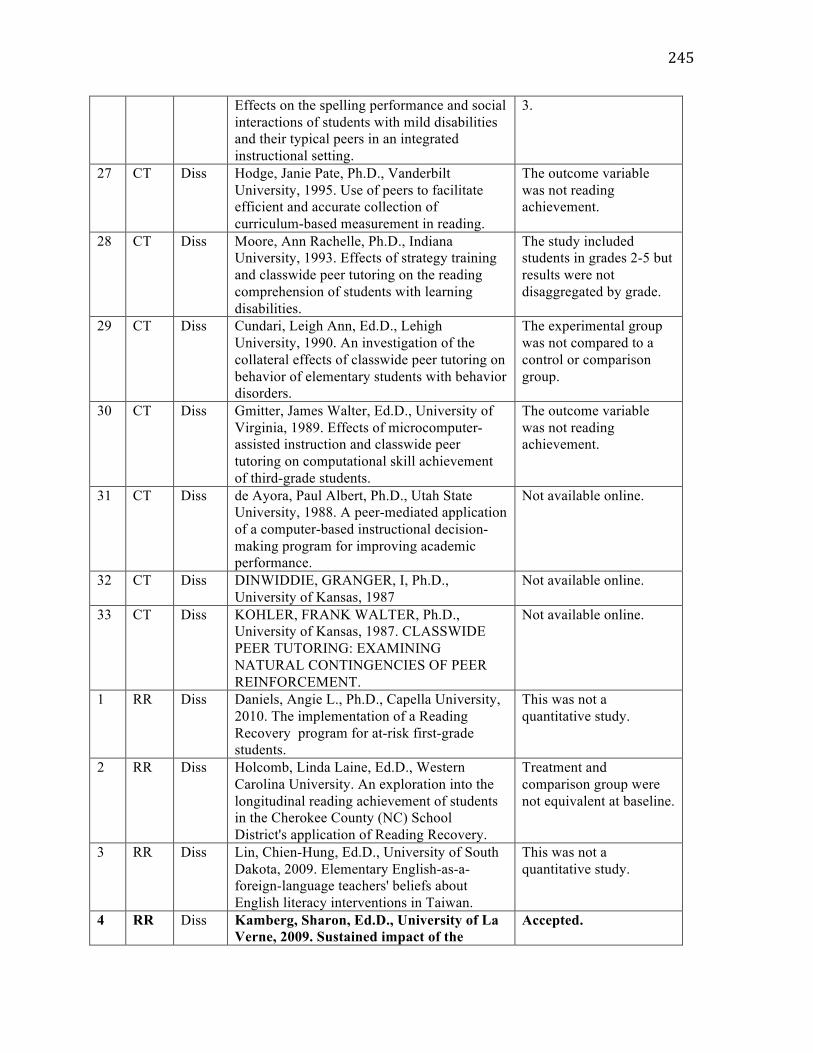
245
Effects on the spelling performance and social interactions of students with mild disabilities and their typical peers in an integrated instructional setting.
3.
27 CT Diss Hodge, Janie Pate, Ph.D., Vanderbilt University, 1995. Use of peers to facilitate efficient and accurate collection of curriculum-based measurement in reading.
The outcome variable was not reading achievement.
28 CT Diss Moore, Ann Rachelle, Ph.D., Indiana University, 1993. Effects of strategy training and classwide peer tutoring on the reading comprehension of students with learning disabilities.
The study included students in grades 2-5 but results were not disaggregated by grade.
29 CT Diss Cundari, Leigh Ann, Ed.D., Lehigh University, 1990. An investigation of the collateral effects of classwide peer tutoring on behavior of elementary students with behavior disorders.
The experimental group was not compared to a control or comparison group.
30 CT Diss Gmitter, James Walter, Ed.D., University of Virginia, 1989. Effects of microcomputer-assisted instruction and classwide peer tutoring on computational skill achievement of third-grade students.
The outcome variable was not reading achievement.
31 CT Diss de Ayora, Paul Albert, Ph.D., Utah State University, 1988. A peer-mediated application of a computer-based instructional decision-making program for improving academic performance.
Not available online.
32 CT Diss DINWIDDIE, GRANGER, I, Ph.D., University of Kansas, 1987
Not available online.
33 CT Diss KOHLER, FRANK WALTER, Ph.D., University of Kansas, 1987. CLASSWIDE PEER TUTORING: EXAMINING NATURAL CONTINGENCIES OF PEER REINFORCEMENT.
Not available online.
1 RR Diss Daniels, Angie L., Ph.D., Capella University, 2010. The implementation of a Reading Recovery program for at-risk first-grade students.
This was not a quantitative study.
2 RR Diss Holcomb, Linda Laine, Ed.D., Western Carolina University. An exploration into the longitudinal reading achievement of students in the Cherokee County (NC) School District's application of Reading Recovery.
Treatment and comparison group were not equivalent at baseline.
3 RR Diss Lin, Chien-Hung, Ed.D., University of South Dakota, 2009. Elementary English-as-a-foreign-language teachers' beliefs about English literacy interventions in Taiwan.
This was not a quantitative study.
4 RR Diss Kamberg, Sharon, Ed.D., University of La Verne, 2009. Sustained impact of the
Accepted.

246
Reading Recovery early intervention as students move into more content-laden grades.
5 RR Diss Hipp, Dawn M., Ed.D., Cardinal Stritch University, 2008. A case study: The effectiveness of a modified Reading Recovery format for an intermediate struggling reader.
The unit of analysis was not students in grades K-3.
6 RR Diss Jamison, Gaynell R., Ed.S., University of Arkansas at Little Rock, 2008. A longitudinal study of the sustained gains of former discontinued Reading RecoveryRTM students.
Treatment and comparison group were not equivalent at baseline.
7 RR Diss Wyatt, Elizabeth Jane, Ed.S., University of Arkansas at Little Rock, 2008. A study of the long range effects of Reading Recovery™ on student achievement on the Arkansas Benchmark Examination.
Treatment and comparison group were not equivalent at baseline.
8 RR Diss Shamey, Tera, Ed.D., Wayne State University, 2008. Effects of early elementary Reading Recovery programs on middle-school students: A longitudinal evaluation.
Accepted.
9 RR Diss Sangster, Mary B., Ph.D., Colorado State University, 2008. Oral language structure: Success for first grade students in a reading intervention program.
The experimental group was not compared to a control or comparison group.
10 RR Diss Williams, Florence, Ph.D., University of Missouri - Saint Louis, 2008. The effects of multisensory phonics and visualization interventions on struggling readers' word identification, fluency, and comprehension.
Not about RR.
11 RR Diss Petersen, Janet K., Ed.D., University of South Dakota, 2007. Actions and training in renewal plans designed by Reading RecoveryRTM teacher leaders
The unit of analysis was not students in grades K-3.
12 RR Diss Potter, Wendy, Ed.D., The University of Nebraska - Lincoln, . An analysis of the achievement gap of discontinued reading recovery students: A longitudinal study of reading recovery students.
The experimental group was not compared to a control or comparison group.
13 RR Diss Paterson, Joan P., M.Ed., University of Manitoba (Canada), 2007. An exploration of orientation to new text within the context of the Reading Recovery(TM) lesson.
This was not a quantitative study.
14 RR Diss Lee, Polly Ann, Ph.D., Purdue University, 2007. An exploration of how teacher language scaffolds the development of strategic processing in emergent readers.
The outcome variable was not reading achievement.
15 RR Diss Duerr, Sally A., Ed.D., Walden University, 2007. Communication, efficacy, and student
The outcome variable was not reading

247
reading achievement: An unbroken circle. achievement. 16 RR Diss Sullivan, Lisa Jane Reagan, Ed.D., University
of South Dakota, 2007. Perceptions of Reading Recovery teachers regarding teacher change and professional development.
The unit of analysis was not students in grades K-3.
17 RR Diss Daniel, Ashley Faye, M.S., University of Arkansas, 2007. Reading Recovery: An evaluation of one school district's academic outcomes.
Accepted.
18 RR Diss Wilson, Diedra L., Ed.D., Pepperdine University, 2007. Teachers' self-reports of their preference for and use of Reading Recovery
The experimental group was not compared to a control or comparison group.
19 RR Diss Brown, Timothy, Ph.D., Capella University, 2007. The lasting effects of the Reading Recovery Program on the reading achievement on at risk youth.
Accepted.
20 RR Diss Seaman, Kristin, M.A., Hofstra University, 2007. Traveling seeds: How students' natural curiosity leads to understanding.
The outcome variable was not reading achievement.
21 RR Diss Caraway, Melissa Ann Hudgins, Ph.D., Texas Woman's University, 2006. A cross-sectional study of performance on high-stakes state assessment by at-risk students who were served in an early intervention program.
Treatment and comparison group were not equivalent at baseline.
22 RR Diss Gapp, Susan C., Ed.D., University of South Dakota, 2006. An examination of end of treatment Reading Recovery decisions and later achievement.
The experimental group was not compared to a control or comparison group.
23 RR Diss Byra, M. Adelle, Ph.D., University of Wyoming, 2006. An investigation of the interactions of Reading RecoveryRTM teachers during colleague visits.
This was not a quantitative study.
24 RR Diss Moen, April D., D.Ed., Capella University, 2006. A study of the transition of discontinued Reading Recovery students from grade one to grade four.
This was not a quantitative study.
25 RR Diss Williams, Rebecca Berry, Psy.D., The Chicago School of Professional Psychology, 2006. Development of Bridges: An educational program to increase the early identification and intervention for inner-city Catholic school students who have reading problems.
Not about RR.
26 RR Diss McCabe, Marie, Ph.D., University of Michigan, 2006. Enhancing face value: A description of teacher and student negotiation of power and politeness in a one-to-one first-grade reading intervention.
The outcome variable was not reading achievement.
27 RR Diss Gonzales, Karen Elizabeth, Ph.D., Texas This was not a

248
Woman's University, 2006. Indicators of self-monitoring in early reading
quantitative study.
28 RR Diss Heenan, Rachel Ann, Ed.D., University of Southern California, 2006. Literacy and deafness: A qualitative analysis into the efficacy of an adapted Reading Recovery program.
This was not a quantitative study.
29 RR Diss Flowers, Linda J., Ph.D., Southern Illinois University at Carbondale, 2006. The short- and long-term reading performance of former Reading Recovery students.
The experimental group was not compared to a control or comparison group.
30 RR Diss Dixon, Joseph Boyd, Ph.D., The University of Southern Mississippi, 2005. California's elementary school principals' philosophies, perceptions, and practices regarding retention in relationship to the No Child Left Behind Act.
This was not a quantitative study.
31 RR Diss Kahl, Kathleen M., Ed.D., Widener University, 2005. Comparing outcomes of two early reading interventions: Reading Recovery and direct instruction.
Accepted.
32 RR Diss Dunn, Michael W., Ph.D., Indiana University, 2005. Diagnosing disability through response-to-intervention: An analysis of Reading Recovery as a valid predictor of reading disabilities.
The experimental group was not compared to a control or comparison group.
33 RR Diss Pitt, Heather, M.A.Ed., Mount Saint Vincent University (Canada), 2005. Do Reading Recovery(TM) students in the Annapolis Valley Regional School Board sustain their gains in reading processing?
The experimental group was not compared to a control or comparison group.
34 RR Diss Rabe, Bonnie Lee, Ph.D., The University of Connecticut, 2005. Enhancing teachers' learning: Implications and recommendations.
This was not a quantitative study.
35 RR Diss McGrath Hovland, Michelle R., Ed.D., University of South Dakota, 2005. Inquiry into problem solving in Reading Recovery.
This was not a quantitative study.
36 RR Diss Concha, Judith Seeber, Ph.D., University of Maryland, College Park, 2005. Reading Recovery children and early literacy development: Investigation into phonological awareness, orthographic knowledge, oral reading processing, and reading comprehension processing.
The experimental group was not compared to a control or comparison group.
37 RR Diss Van Bramer, Joan M., Ph.D., State University of New York at Albany, 2005. The role of revealing and telling in self-regulated literacy learning.
This was not a quantitative study.
38 RR Diss Weber, Martha Jane, Ph.D., University of Arkansas, 2004. A case study of literacy
This was not a quantitative study.

249
acquisition for a Mexican-American second language learner in a first-grade balanced literacy classroom.
39 RR Diss Gerhardt, Gretchen, M.A.Ed., Mount Saint Vincent University (Canada), 2004. An exploration of teaching methods for children experiencing difficulties in reading and writing: A case study.
Not about RR.
40 RR Diss Cole, Deborah A., M.Ed., University of Prince Edward Island (Canada), 2004. A second chance to learn: One child's path to literacy.
This was not a quantitative study.
41 RR Diss Harris, Edward Maurice, Ph.D., Union Institute and University, 2004. Evaluation of the reorganization of Northboro Elementary School in Palm Beach County, Florida: A ten-year perspective
The unit of analysis was not students in grades K-3.
42 RR Diss Scott, Marguerite Cager, Ed.D., Johnson & Wales University, 2004. Home literacy environment: The impact of training on student achievement and home literacy environment practices.
The unit of analysis was not students in grades K-3.
43 RR Diss Yerington, Leslie, Ed.D., University of San Diego, 2004. Language interactions between Reading Recovery teachers and their English-language learners.
This was not a quantitative study.
44 RR Diss Schuster, Renee, Ed.D., Saint Louis University, 2004. Professional development and student literacy: A program evaluation of literacy coaching.
Not about RR.
45 RR Diss Peligian, Susan L., Ed.D., Harvard University, 2004. Resisting instructional change: The stories of five public school teachers.
Not about RR.
46 RR Diss Matczuk, Allyson, M.Ed., The University of Manitoba (Canada), 2004. Teacher support to foster change over time in the writing development of six-year-old children within the context of the Reading Recovery Program.
The outcome variable was not reading achievement.
47 RR Diss Cox, Lillian Sharon, Ed.D., University of Missouri - Columbia, 2004. Teacher empowerment change and Reading RecoveryRTM professional development training.
The unit of analysis was not students in grades K-3.
48 RR Diss Bartley, Marianne T., Ed.D., Lehigh University, 2004. The design and application of a cost benefit analysis model to two early intervention reading programs: Reading Recovery and Book Buddies.
Does not include estimation of effects.
49 RR Diss Yemeh, Paul Naah, Ed.D., University of Kentucky, 2004. The instructional literacy
This was not a quantitative study.

250
experiences of two Reading Recovery children.
50 RR Diss Shoulders, Michael Dwayne, Ed.D., Tennessee State University, 2004. The long-term effectiveness of the Reading Recovery program.
Treatment and comparison group were not shown to be equivalent at baseline.
51 RR Diss Wilkes Pendergrass, Paula V., Ed.D., Tennessee State University, 2004. The short-term effects of Reading Recovery on children's reading development: Process and product.
Accepted.
52 RR Diss Mykysey, Nadia, Ed.D., University of Pennsylvania, 2004. The sustainability of gains in reading measures of Spanish-speaking children who experience Reading Recovery: A four-year retrospective quasi-experimental study.`
Accepted.
53 RR Diss Campbell, Lorraine Ellen Henry, Ph.D., University of South Carolina, 2004. Using Dynamic Indicators of Basic Early Literacy Skills to evaluate the effectiveness of Reading Recovery.
Accepted.
54 RR Diss Hill, Susan Morris, Ph.D., The University of Alabama at Birmingham, 2003. A description of the relationships among factors thought to be associated with literacy growth in primary children.
Not about RR.
55 RR Diss Reddick, Stephanie J., Ed.D., Saint Louis University, 2003. An analysis of four southeast Missouri school districts and the impact of their leadership on student reading achievement.
The unit of analysis was not students in grades K-3.
56 RR Diss Murphy, Judith A., Ed.D., Northern Illinois University, 2003. An application of growth curve analysis: The evaluation of a reading intervention program.
Accepted, but note that only discontinued RR students comprise the treatment group.
57 RR Diss Christman, Michael Stephen, Ed.D., The University of Rochester, 2003. An examination of the effects and costs of the Reading Recovery Program in an urban school district.
The treatment and control groups were not shown to be equivalent at baseline.
58 RR Diss Litt, Deborah Gordon, Ph.D., University of Maryland, College Park, 2003. An exploration of the double-deficit hypothesis in the Reading Recovery population.
The experimental group was not compared to a control or comparison group.
59 RR Diss Outson, Kelly Ray, Ed.D., Texas Woman's University, 2003. Choosing and introducing new books: An investigation of teacher decision-making.
This was not a quantitative study.
60 RR Diss Robinson, Nancy Reed, Ed.D., Virginia This was not a
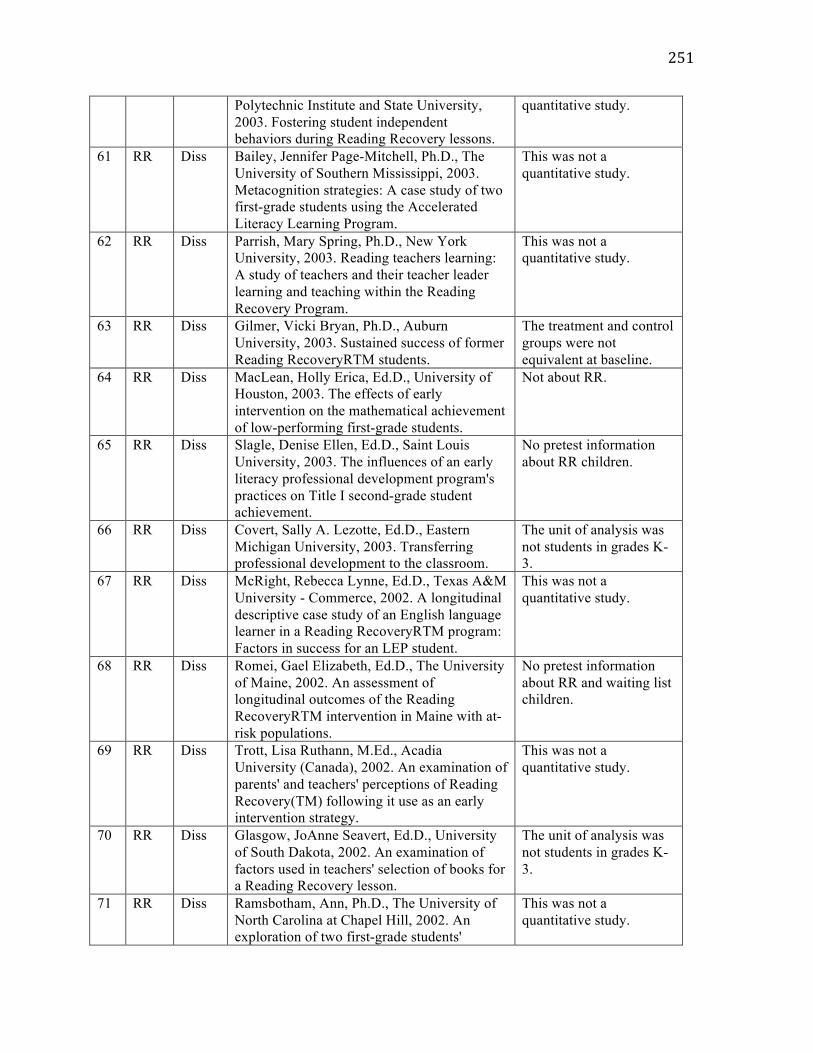
251
Polytechnic Institute and State University, 2003. Fostering student independent behaviors during Reading Recovery lessons.
quantitative study.
61 RR Diss Bailey, Jennifer Page-Mitchell, Ph.D., The University of Southern Mississippi, 2003. Metacognition strategies: A case study of two first-grade students using the Accelerated Literacy Learning Program.
This was not a quantitative study.
62 RR Diss Parrish, Mary Spring, Ph.D., New York University, 2003. Reading teachers learning: A study of teachers and their teacher leader learning and teaching within the Reading Recovery Program.
This was not a quantitative study.
63 RR Diss Gilmer, Vicki Bryan, Ph.D., Auburn University, 2003. Sustained success of former Reading RecoveryRTM students.
The treatment and control groups were not equivalent at baseline.
64 RR Diss MacLean, Holly Erica, Ed.D., University of Houston, 2003. The effects of early intervention on the mathematical achievement of low-performing first-grade students.
Not about RR.
65 RR Diss Slagle, Denise Ellen, Ed.D., Saint Louis University, 2003. The influences of an early literacy professional development program's practices on Title I second-grade student achievement.
No pretest information about RR children.
66 RR Diss Covert, Sally A. Lezotte, Ed.D., Eastern Michigan University, 2003. Transferring professional development to the classroom.
The unit of analysis was not students in grades K-3.
67 RR Diss McRight, Rebecca Lynne, Ed.D., Texas A&M University - Commerce, 2002. A longitudinal descriptive case study of an English language learner in a Reading RecoveryRTM program: Factors in success for an LEP student.
This was not a quantitative study.
68 RR Diss Romei, Gael Elizabeth, Ed.D., The University of Maine, 2002. An assessment of longitudinal outcomes of the Reading RecoveryRTM intervention in Maine with at-risk populations.
No pretest information about RR and waiting list children.
69 RR Diss Trott, Lisa Ruthann, M.Ed., Acadia University (Canada), 2002. An examination of parents' and teachers' perceptions of Reading Recovery(TM) following it use as an early intervention strategy.
This was not a quantitative study.
70 RR Diss Glasgow, JoAnne Seavert, Ed.D., University of South Dakota, 2002. An examination of factors used in teachers' selection of books for a Reading Recovery lesson.
The unit of analysis was not students in grades K-3.
71 RR Diss Ramsbotham, Ann, Ph.D., The University of North Carolina at Chapel Hill, 2002. An exploration of two first-grade students'
This was not a quantitative study.

252
cognitive strategic development in Reading Recovery reading and writing.
72 RR Diss Stephens, Heather Love, Ed.D., Texas A&M University - Commerce, 2002. Cross-age tutoring program coordinated with classroom instruction: Effects on elementary students' reading and writing achievement.
No pretest information.
73 RR Diss Dauphinee, Jean Elizabeth, Ph.D., New York University, 2002. Factors influencing the institutionalization of Reading Recovery: A survey of schools in New York and New Jersey.
The unit of analysis was not students in grades K-3.
74 RR Diss Dasinger, Sheryl Boland, Ph.D., The University of Alabama, 2002. Instructional scaffolding and the development of self-regulated reading strategies of at-risk first graders in a Reading Recovery program.
The unit of analysis was not students in grades K-3.
75 RR Diss Willis, Lucinda Rightnour, Ph.D., Virginia Polytechnic Institute and State University, 2002. Portraitures of field-dependent children with reading disabilities: Colored overlays as an instructional intervention.
This was not a quantitative study.
76 RR Diss Penney, Tracy F., M.Ed., Memorial University of Newfoundland (Canada), 2002. Reading Recovery(TM) implementation in Labrador: A two-year longitudinal study of the long-term effects of Reading Recovery™.
Accepted, but note that only discontinued RR students comprise the treatment group.
77 RR Diss Meyer, Amie Michelle, Ph.D., Loyola University of Chicago, 2002. Reading self-concept: Examining the impact of participation in Reading Recovery on the reading self-concept of first-grade students.
The outcome variable was not reading achievement.
78 RR Diss Devetski-Hamilton, Susan, Ph.D., Saint Louis University, 2002. The psycho-social and academic plight of the struggling reader and the impact of early intervention.
This was not a quantitative study.
79 RR Diss Rennick, Larry Wayne, Ed.D., Saint Louis University, 2002. The relationship between staff development in balanced literacy instruction for kindergarten teachers and student literacy achievement.
Not about RR.
80 RR Diss Manga, Jill Oliver, Ed.D., University of Maryland College Park, 2001. An examination of the transferability of Reading Recovery practices from Reading Recovery teachers to first-grade classroom teachers.
The unit of analysis was not students in grades K-3.
81 RR Diss Whetton, Dana Jaye, Ed.D., University of Southern California, 2001. An examination of California school districts' response to AB
Not about RR.
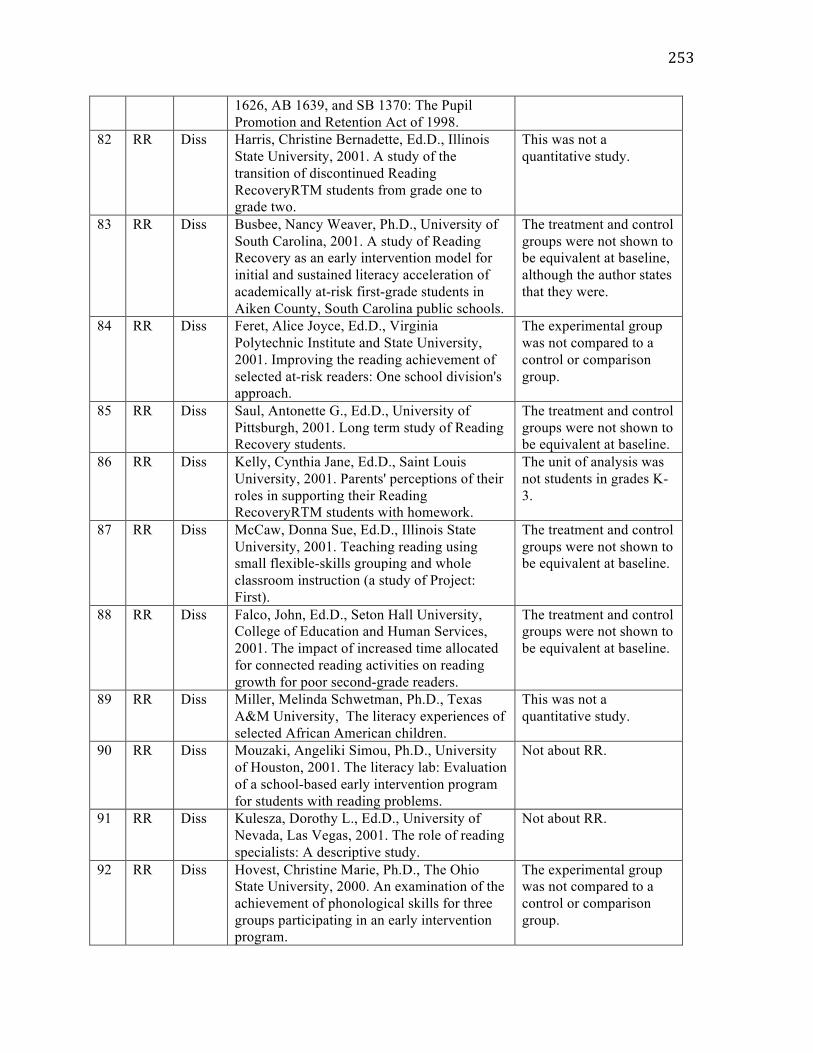
253
1626, AB 1639, and SB 1370: The Pupil Promotion and Retention Act of 1998.
82 RR Diss Harris, Christine Bernadette, Ed.D., Illinois State University, 2001. A study of the transition of discontinued Reading RecoveryRTM students from grade one to grade two.
This was not a quantitative study.
83 RR Diss Busbee, Nancy Weaver, Ph.D., University of South Carolina, 2001. A study of Reading Recovery as an early intervention model for initial and sustained literacy acceleration of academically at-risk first-grade students in Aiken County, South Carolina public schools.
The treatment and control groups were not shown to be equivalent at baseline, although the author states that they were.
84 RR Diss Feret, Alice Joyce, Ed.D., Virginia Polytechnic Institute and State University, 2001. Improving the reading achievement of selected at-risk readers: One school division's approach.
The experimental group was not compared to a control or comparison group.
85 RR Diss Saul, Antonette G., Ed.D., University of Pittsburgh, 2001. Long term study of Reading Recovery students.
The treatment and control groups were not shown to be equivalent at baseline.
86 RR Diss Kelly, Cynthia Jane, Ed.D., Saint Louis University, 2001. Parents' perceptions of their roles in supporting their Reading RecoveryRTM students with homework.
The unit of analysis was not students in grades K-3.
87 RR Diss McCaw, Donna Sue, Ed.D., Illinois State University, 2001. Teaching reading using small flexible-skills grouping and whole classroom instruction (a study of Project: First).
The treatment and control groups were not shown to be equivalent at baseline.
88 RR Diss Falco, John, Ed.D., Seton Hall University, College of Education and Human Services, 2001. The impact of increased time allocated for connected reading activities on reading growth for poor second-grade readers.
The treatment and control groups were not shown to be equivalent at baseline.
89 RR Diss Miller, Melinda Schwetman, Ph.D., Texas A&M University, The literacy experiences of selected African American children.
This was not a quantitative study.
90 RR Diss Mouzaki, Angeliki Simou, Ph.D., University of Houston, 2001. The literacy lab: Evaluation of a school-based early intervention program for students with reading problems.
Not about RR.
91 RR Diss Kulesza, Dorothy L., Ed.D., University of Nevada, Las Vegas, 2001. The role of reading specialists: A descriptive study.
Not about RR.
92 RR Diss Hovest, Christine Marie, Ph.D., The Ohio State University, 2000. An examination of the achievement of phonological skills for three groups participating in an early intervention program.
The experimental group was not compared to a control or comparison group.
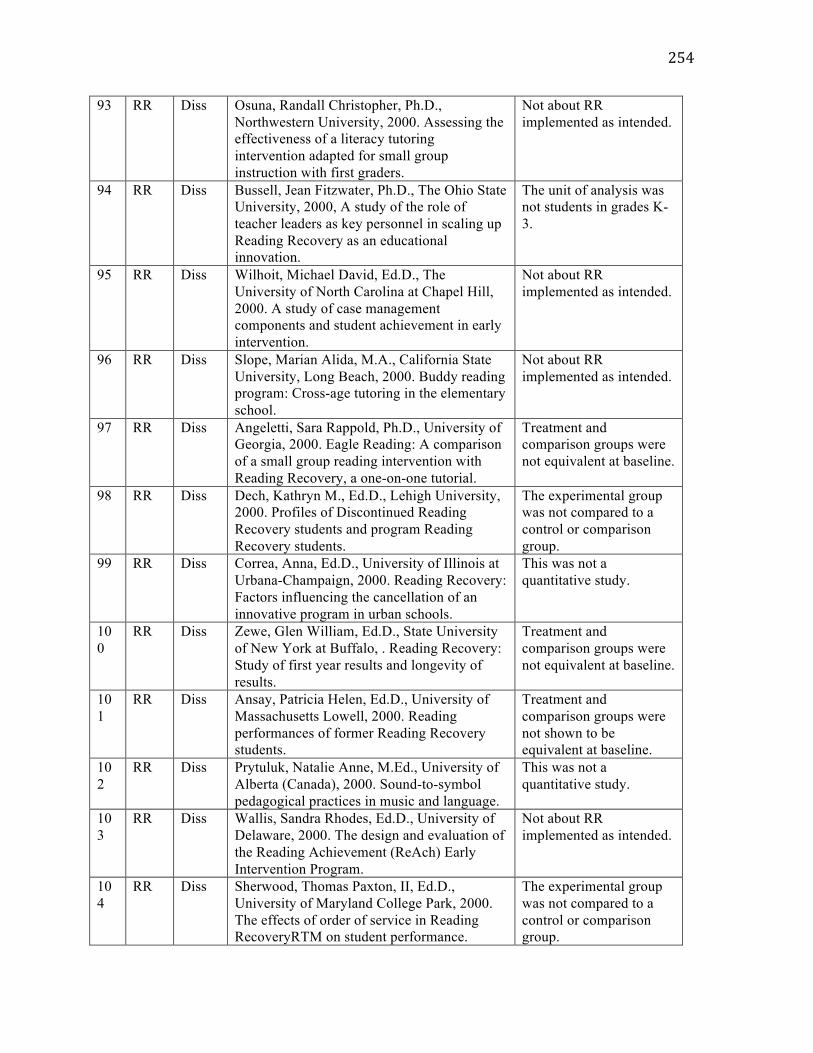
254
93 RR Diss Osuna, Randall Christopher, Ph.D., Northwestern University, 2000. Assessing the effectiveness of a literacy tutoring intervention adapted for small group instruction with first graders.
Not about RR implemented as intended.
94 RR Diss Bussell, Jean Fitzwater, Ph.D., The Ohio State University, 2000, A study of the role of teacher leaders as key personnel in scaling up Reading Recovery as an educational innovation.
The unit of analysis was not students in grades K-3.
95 RR Diss Wilhoit, Michael David, Ed.D., The University of North Carolina at Chapel Hill, 2000. A study of case management components and student achievement in early intervention.
Not about RR implemented as intended.
96 RR Diss Slope, Marian Alida, M.A., California State University, Long Beach, 2000. Buddy reading program: Cross-age tutoring in the elementary school.
Not about RR implemented as intended.
97 RR Diss Angeletti, Sara Rappold, Ph.D., University of Georgia, 2000. Eagle Reading: A comparison of a small group reading intervention with Reading Recovery, a one-on-one tutorial.
Treatment and comparison groups were not equivalent at baseline.
98 RR Diss Dech, Kathryn M., Ed.D., Lehigh University, 2000. Profiles of Discontinued Reading Recovery students and program Reading Recovery students.
The experimental group was not compared to a control or comparison group.
99 RR Diss Correa, Anna, Ed.D., University of Illinois at Urbana-Champaign, 2000. Reading Recovery: Factors influencing the cancellation of an innovative program in urban schools.
This was not a quantitative study.
100
RR Diss Zewe, Glen William, Ed.D., State University of New York at Buffalo, . Reading Recovery: Study of first year results and longevity of results.
Treatment and comparison groups were not equivalent at baseline.
101
RR Diss Ansay, Patricia Helen, Ed.D., University of Massachusetts Lowell, 2000. Reading performances of former Reading Recovery students.
Treatment and comparison groups were not shown to be equivalent at baseline.
102
RR Diss Prytuluk, Natalie Anne, M.Ed., University of Alberta (Canada), 2000. Sound-to-symbol pedagogical practices in music and language.
This was not a quantitative study.
103
RR Diss Wallis, Sandra Rhodes, Ed.D., University of Delaware, 2000. The design and evaluation of the Reading Achievement (ReAch) Early Intervention Program.
Not about RR implemented as intended.
104
RR Diss Sherwood, Thomas Paxton, II, Ed.D., University of Maryland College Park, 2000. The effects of order of service in Reading RecoveryRTM on student performance.
The experimental group was not compared to a control or comparison group.

255
105
RR Diss Jackson, Mary Anne, Ed.D., University of Houston, . The effects of district size and socioeconomic status on the implementation of innovations, using Reading Recovery(R) as the example.
The unit of analysis was not students in grades K-3.
106
RR Diss Koczur, Kenneth P., Ed.D., Widener University, 2000. The effects of Reading Recovery on children's behavior beyond academic achievement in reading.
The outcome variable was not reading achievement.
107
RR Diss Winstead, Brian Norman, Ed.D., University of Southern California, 2000. The effect of tutoring group size on reading performance in at-risk emergent readers.
Treatment and comparison groups were not shown to be equivalent at baseline.
108
RR Diss Lewis, Sharon Abston, Ed.D., University of Houston, 2000. The evolution of an effective Reading RecoveryRTM School Team: A developmental approach to systemic school-wide intervention.
The unit of analysis was not students in grades K-3.
109
RR Diss Collins, Enid Waters, Ph.D., University of Illinois at Urbana-Champaign, 2000. The immediate and sustained effects of the Reading Recovery program on grade one and grade four at-risk students: A longitudinal study.
Accepted.
110
RR Diss Paine, David Stewart, Ed.D., University of La Verne, 2000. To what degree have the effects of Reading Recovery been sustained in second and third grade as measured by standardized test scores in reading and their relationship to exiting text reading levels?
The experimental group was not compared to a control or comparison group.
111
RR Diss McManus, Delana Ann, Ed.D., Oklahoma State University, 1999. A modified Reading Recovery Program can be successful in a second-grade Title I reading program.
Not about RR implemented as intended.
112
RR Diss Fugate, Teresa Ann, Ph.D., Oklahoma State University, 1999. Analyses of Reading Recovery(R) teachers based on professional development stages and years of experience.
The unit of analysis was not students in grades K-3.
113
RR Diss Davis, Victoria Sue, Ph.D., Indiana State University, 1999. A study of the influence elementary principals have in regard to Reading Recovery programs.
This was not a quantitative study.
114
RR Diss Markwald-Sagui, Deborah Ann, M.A., Texas Woman's University, 1999. Best practices for educating students with learning disabilities, integrated with students of average to above-average intelligence
Not about RR.
115
RR Diss Shrake, Lillian Roberta, Ph.D., Southern Illinois University at Carbondale, 1999. Effecting change in an early literacy program:
This was not a quantitative study.

256
A change agent focus. 116
RR Diss Mowat, Jennifer Margaret, M.Ed., The University of Manitoba (Canada), 1999. Marie Clay's Reading Recovery: A critical review.
This was not a quantitative study.
117
RR Diss Wolz, Jane M., Ph.D., University of Washington, 1999. Reading Recovery and a developmental approach to phonological processing.
Accepted.
118
RR Diss Burrows, Nina McKinnon, M.A., Texas Woman's University, 1999. Reading strategies of a low-progress first grade student.
This was not a quantitative study.
119
RR Diss Crowell, Kimberly J., Ph.D., Auburn University, 1999. The impact of cross-age tutoring on at-risk third-graders' reading levels and habituation of strategic reading behaviors.
This was not a quantitative study.
120
RR Diss Brown, Kathy Laboard, Ed.D., South Carolina State University, 1999. The impact of Reading Recovery intervention on the reading achievement of selected second grade students.
Treatment and comparison groups were not shown to be equivalent at baseline.
121
RR Diss Rhodes, Joan Anne, Ph.D., Virginia Commonwealth University, 1998. A comparison of the effects of individualized writing instruction with and without phonemic segmentation on the standard spelling performance of at-risk first graders.
Not about RR.
122
RR Diss Swain, Audrey Mary, M.Ed., Memorial University of Newfoundland (Canada), 1998. An evaluation of an instructional intervention program based on Clay's Reading Recovery Program for elementary school students.
Not about RR implemented as intended.
123
RR Diss Spratley, Sylvia Eaddy, Ed.D., The George Washington University, 1998. An investigation of interventions and programs K-5 elementary schools used to address the needs of at-risk students.
Not about RR.
124
RR Diss Luchi, Patricia M., Ed.D., Eastern Michigan University, 1998. A study of the long-term effectiveness and systemic impact of Reading Recovery: An early intervention program for at-risk readers.
Treatment and comparison groups were not shown to be equivalent at baseline.
125
RR Diss Rice, Sonja Kertisha, Ed.D., University of Sarasota, 1998. Comparison of the Reading Recovery Program and a small-group reading intervention.
Accepted.
126
RR Diss Wilson-Bridgman, Jennifer Ruth, Ph.D., State University of New York at Buffalo, 1998. Curricular and communicative congruence: A key to success for students at-risk of reading
This was not a quantitative study.

257
failure 127
RR Diss Price, Carolyn Jane Money, Ph.D., Texas Woman's University, 1998. Early intervention: Reading Recovery, a study of the factors of success in one Texas school district.
This was not a quantitative study.
128
RR Diss Henry, Justina M. Robinson, Ph.D., Kent State University, 1998. First graders' perceptions of reading and reading instruction in the classroom and Reading Recovery.
This was not a quantitative study.
129
RR Diss Regier, Natalie A., M.Ed., The University of Regina (Canada), 1998. Journey into literacy: An exploration of how one child became literate in an early intervention program.
This was not a quantitative study.
130
RR Diss Gibson Graham, Marie Frances, Ed.D., University of South Dakota, 1998. Program characteristics influencing the discontinuing rates of Reading Recovery program children.
The experimental group was not compared to a comparison or control group.
131
RR Diss Warnes, Diane Kathleen, M.A., California State University, Fresno, 1998. Reading Recovery training: A staff development model affecting change in classroom literacy instruction.
This was not a quantitative study.
132
RR Diss Lubitz, Deborah S., Ed.D., Arizona State University, 1998. Teacher-student interaction in a small group reading intervention program
Not about RR implemented as intended.
133
RR Diss Rock, Catherine Louise, Ed.D., University of Central Florida, 1998. The effectiveness of Reading Recovery for limited English proficient students with varying personality types.
The experimental group was not compared to a comparison or control group.
134
RR Diss Rumbaugh, Will Cantey, Ed.D., University of Georgia, 1998.The impact of Reading Recovery on students' self-concepts.
The outcome variable was not reading achievement.
135
RR Diss Forbes, Rosalie Lowe, Ph.D., The University of Iowa, 1998. The nature of evaluation of instructional effectiveness while observing one-on-one reading tutoring sessions.
The unit of analysis was not students in grades K-3.
136
RR Diss Moon, M. Louise, Ed.D., Western Michigan University, 1998. The relationship of Reading Recovery teachers' efficacy to length of service and school system support
The unit of analysis was not students in grades K-3.
137
RR Diss Rodgers, Emily Marie, Ph.D., The Ohio State University, 1998. Understanding teacher and student talk during literacy instruction in a one-to-one tutoring setting.
This was not a quantitative study.
138
RR Diss Hicks, Lea Cynthia Palmer, Ph.D., Auburn University, 1997. A comparative study of individual patterns of literacy acquisition within two literacy intervention contexts
The author provides graphs to show pretest and posttest scores, but they are not labeled such

258
based on Reading Recovery techniques. that it would be possible to know the exact scores.
138
RR Diss Di Nello, Justine Marie, Ph.D., Cleveland State University, 1997. An early reading intervention program: Reading Recovery's impact upon diverse populations.
The experimental group was not compared to a comparison or control group.
140
RR Diss Simpson, Stella Hannah, Ed.D., Tennessee State University, 1997. A principal's perspective of the implementation of Reading Recovery in six metropolitan Nashville elementary schools.
The treatment and comparison groups were not equivalent at baseline.
141
RR Diss Dell, Nancy Farmer, Ed.D., University of South Carolina, 1997. A study of the attitudes of administrators, teachers, parents, and students toward Reading Recovery.
The outcome variable was not reading achievement.
142
RR Diss McLaughlin, John Joseph, M.Ed., The University of New Brunswick (Canada), 1997. Finding the commas: A phenomenological study of Reading Recovery.
This was not a quantitative study.
143
RR Diss Watts, Elizabeth Lionne, Ph.D., The Florida State University, 1997. Reading rescue: Case studies of English language learners in a middle school.
Not about RR.
144
RR Diss Fullilove, Bryska Elizabeth, Ed.D., The University of Mississippi, 1997. Reading Recovery(RTM): An experimental analysis of teachers' perceptions of teaching reading.
The unit of analysis was not students in grades K-3.
145
RR Diss Anderson, Nancy L., Ph.D., The Ohio State University, 1997. Reconstructing scaffolded writing instruction from Reading Recovery.
The outcome variable was not reading achievement.
146
RR Diss Brown, Linda A., Ed.D., United States International University, 1997. Student performance in a Reading Recovery program and the identification of specific learning disabilities.
The experimental group was not compared to a comparison or control group.
147
RR Diss Joseph, Laurice Marie, Ph.D., The Ohio State University, 1997. The effectiveness of a word box instructional approach on word identification and spelling performance for a sample of students with learning disabilities.
The experimental group was not compared to a comparison or control group.
148
RR Diss McGraw, Marsha Diane Kent, Ed.D., The University of Arizona, 1997. The effects of Reading Recovery on literacy achievement of black and white students.
The experimental group was not compared to a comparison or control group.
149
RR Diss Brocato, Lori Ann, Ph.D., Louisiana State University and Agricultural & Mechanical College, 1997. The impact of early literacy intervention groups in conjunction with Reading Recovery.
The experimental group was not compared to a comparison or control group.

259
150
RR Diss Lohff, Elizabeth Ann, Ph.D., The University of Arizona, 1997. The Literacy Assistance Project: A case study of an early intervention reading program.
Not about RR.
151
RR Diss Zielinski, Linda Alice, Ed.D., Saint Louis University, 1997. The long term effectiveness of Reading Recovery in a small, rural school district.
Pretest means and sample sizes are shown, but no standard deviations/standard errors.
152
RR Diss Gallentine-Todd, Gay, Ed.D., University of La Verne, 1997. The sustained effects of the Reading Recovery program.
The experimental group was not compared to a comparison or control group.
153
RR Diss Stroman, Janice M., Ed.D., Texas Woman's University, 1997. What does collaboration reveal about teaching for strategies in a first-grade classroom?
This was not a quantitative study.
154
RR Diss Allen, LaVerne McWilliams, Ph.D., Jackson State University, 1996. Administrators' perceptions of the effectiveness of Reading Recovery as an early literacy intervention program for at risk first graders.
The unit of analysis was not students in grades K-3.
155
RR Diss Hedrick, Denise Everhart, Ed.D., The University of North Carolina at Greensboro, 1996. An administrative review of an early reading intervention.
Not about RR.
156
RR Diss Falkenberg, Bradd Alan, Ph.D., The University of Texas at Austin, 1996. Grade retention and promotion practices in elementary schools: A qualitative investigation.
Not about RR.
157
RR Diss Evans, Tamara Lynne Pollack, Ph.D., Auburn University, 1996. "I can read deze books!": A qualitative comparison of the Reading Recovery program and a small group reading intervention.
This was not a quantitative study.
158
RR Diss Montebruno, Rosana, M.Ed., The University of Manitoba (Canada), 1996. Implementing Reading Recovery: Encouraging critical reflection on early literacy instructional practices.
The unit of analysis was not students in grades K-3.
159
RR Diss Brown, Sheelah Mackin, Ed.D., University of Bridgeport, 1996. Leadership practices, job satisfaction and leadership activities of trained Reading Recovery(RTM) teachers.
The unit of analysis was not students in grades K-3.
160
RR Diss Cole, Phyllis A. Blackstone, Ed.D., Boston University, 1996. Parental participation in the literacy learning of Reading Recovery students in first, second, and third grades.
The unit of analysis was not students in grades K-3.
16 RR Diss Hanisch, Thomas J., Ed.D., University of Not about RR.

260
1 Virginia, 1996. Preschool and elementary programs for at-risk students: Effective practices, costs, and funding.
162
RR Diss Fayz, Marcelene, M.A., Eastern Michigan University, 1996. Reading recovery intervention and the differences in gains made by at-risk first graders when compared to their peer group.
Compares class-level averages without any standard deviations.
163
RR Diss Hulick, Abby Lynn, Ed.D., Illinois State University, 1996. The effects of Reading Recovery as an early intervention in reading.
Accepted.
164
RR Diss Winchell, Kathryn Joy, M.Ed., The University of Manitoba (Canada), 1996. The effects of Reading Recovery as an early instructional intervention: Eight case studies
Accepted.
165
RR Diss Rodway, L. Joyce, M.Ed., Memorial University of Newfoundland (Canada), 1996. The implementation of an adaptation of Clay's (1985) Reading Recovery Program in a regular grade one classroom by a regular grade one teacher.
Not about RR implemented as intended.
166
RR Diss Rozzelle, Mary Jan, Ed.D., The College of William and Mary, 1996. The long-term effectiveness of the Reading Recovery Program.
The treatment and comparison groups were not equivalent at baseline.
167
RR Diss Walters, Mary Lightsey, Ed.D., The University of Southern Mississippi, 1996. The relationship between Reading Recovery story-writing activity and student achievement and acceleration rate.
The outcome variable was not reading achievement.
168
RR Diss Nierstheimer, Susan L. Hodges, Ph.D., Purdue University, 1996. Understanding preservice teachers' beliefs about children experiencing difficulty learning to read
Not about RR.
169
RR Diss Conner, Sandra Smith, M.A., Texas Woman's University, 1995. A case study of an adult emergent reader.
This was not a quantitative study.
170
RR Diss Lynch, Linda Lou, Ed.D., Pepperdine University, 1995. A case study to assist a school district's decision-making process regarding early reading intervention.
The unit of analysis was not students in grades K-3.
171
RR Diss Acalin, Tracy Ann, M.S., California State University, Fullerton, . A comparison of Reading Recovery to Project READ.
Accepted.
172
RR Diss Howard, Mary Cynthia, Ed.D., Oklahoma State University, 1995. A comparative study of the reading proficiency of discontinued reading recovery students with their second-
The treatment and comparison groups were not equivalent at baseline.

261
grade peers. 173
RR Diss Blackburn, Doreen J., Ph.D., Texas Woman's University, 1995. Changes in a Chapter 1 program when Reading Recovery(RTM) was implemented: Its impact on one district.
This was not a quantitative study.
174
RR Diss LaFave, Cheryl Edna, Ph.D., The University of Toledo, 1995. Impact of Reading Recovery on phonemic awareness.
Accepted. Posttest at 14 weeks, but RR takes longer than that.
175
RR Diss McClain, Lucille Werts, Ph.D., Walden University, . Implementing Reading Recovery in the Greenville County (South Carolina) schools: An exploratory study.
This was not a quantitative study.
176
RR Diss Sires, Edward Eugene, Ed.D., University of South Carolina, 1995. The implementation of curricular change: Reading Recovery at Summerville Elementary School.
This was not a quantitative study.
177
RR Diss Fletcher, Susan Henderson, Ph.D., Texas Woman's University, 1995. The predictive validity of the Kindergarten Diagnostic Instrument (KDI).
Not about RR.
178
RR Diss Paarmann, Lynn Camden, Ph.D., Virginia Commonwealth University, 1995. Two first-grade teachers and the Reading Recovery Program: Processes, interactions, and perceptions.
The unit of analysis was not students in grades K-3.
179
RR Diss Dufresne, Michele Lauroesch, Ed.D., University of Massachusetts Amherst, 1994. Accessing literacy: A study of first-grade children participating in an early intervention program.
This was not a quantitative study.
180
RR Diss Reynolds, DeEtta Kay, Ed.D., University of San Francisco, 1994 . A critical analysis of the Reading Recovery Program: A transcultural model for teacher education from New Zealand to California.
This was not a quantitative study.
181
RR Diss Opacic, Cheryl Hyten, Ed.D., University of Southern California, 1994. An evaluation of the Reading Recovery in reading and writing for elementary students in a middle class suburban school district.
The treatment and comparison groups were not equivalent at baseline.
182
RR Diss Collins, Vikki Kendrick, Ph.D., Georgia State University, 1994. Automaticity in information processing.
The treatment and comparison groups were not shown to be equivalent at baseline.
183
RR Diss Janacek, Therese Lynn, M.S., University of Houston-Clear Lake, 1994. Description of the relationship between first grade Reading Recovery students' learning styles and their reading and writing growth.
This was not a quantitative study.
18 RR Diss Mott, Linda Usher, Ph.D., Texas Woman's The outcome variable

262
4 University, 1994. Generating ideas during story negotiation: Inter-action and intra-action
was not reading achievement.
185
RR Diss Addington, Thomas Eugene, M.A., California State University, Fresno, 1994. Literature and elementary age pupils' program: An evaluation of a reading intervention program through the use of curriculum-based measurement.
Not about RR implemented as intended.
186
RR Diss Elliott, Cynthia Betterton, Ph.D., Texas Woman's University, 1994. Pedagogical reasoning: Understanding teacher decision-making in a cognitive apprenticeship setting.
This was not a quantitative study.
187
RR Diss Hatfield, Paula Ann, Ed.D., The University of Maine, 1994. Performance characteristics of discontinued versus not discontinued children in the Reading Recovery program.
The experimental group was not compared to a comparison or control group.
188
RR Diss Calabrese, Kathryn Ann, Ph.D., Miami University, 1994. Reading Recovery: Teacher training and professional identities.
This was not a quantitative study.
189
RR Diss Willig, Deborah Redler, Ph.D., University of South Florida, 1993. A correlational study of factors associated with reading failure of at-risk first-grade students.
Not about RR.
190
RR Diss Bursiek, Mary Ann, Ph.D., University of Colorado at Boulder, 1993. Literacy interventions for low-achieving first graders.
Not available online.
191
RR Diss Vannatta, Rita Busch, Ed.D., University of South Dakota, 1993. Reading Recovery as an early intervention program.
Not available online.
192
RR Diss Schmidt, Denise Babcock, M.A., Pacific Lutheran University, 1993. The effect of Reading Recovery(tm) on Special Education and Chapter One programs.
The outcome variable was not reading achievement.
193
RR Diss Grugel, Barbara Jean, Ed.D., Indiana University of Pennsylvania, 1993. The effect of a holistic language environment on the spelling/writing and phonological awareness of kindergarten children.
Not about RR.
194
RR Diss Leiby, Brenda Diane, Ed.D., Temple University, 1993. The effects of a transitional year on first graders in the Reading Recovery program.
Not available online.
195
RR Diss Bufalino, Janet Marie, Ed.D., Indiana University of Pennsylvania, 1993. The sustained effects of Reading Recovery intervention on the reading comprehension of second graders.
Treatment and comparison groups were not shown to be equivalent at baseline.
196
RR Diss Powell, Larry Edward, Ph.D., Ohio University, 1993. The use of and attitudes toward performance assessment in a primary
Not about RR.
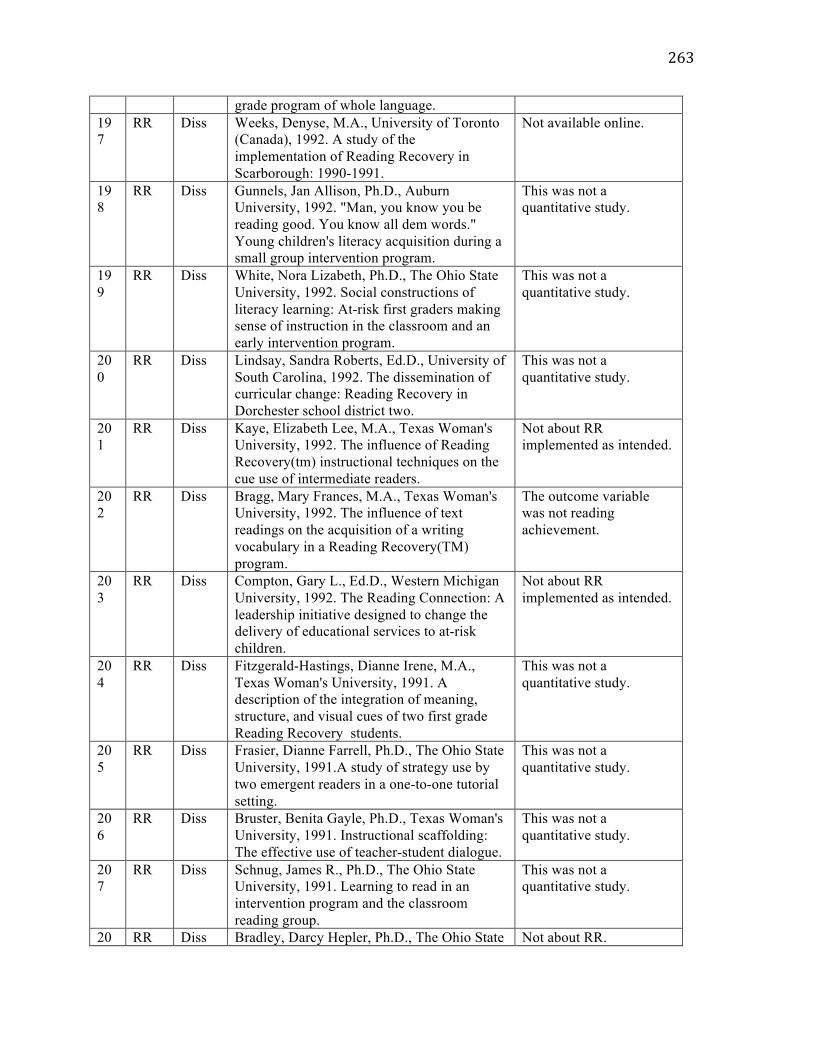
263
grade program of whole language. 197
RR Diss Weeks, Denyse, M.A., University of Toronto (Canada), 1992. A study of the implementation of Reading Recovery in Scarborough: 1990-1991.
Not available online.
198
RR Diss Gunnels, Jan Allison, Ph.D., Auburn University, 1992. "Man, you know you be reading good. You know all dem words." Young children's literacy acquisition during a small group intervention program.
This was not a quantitative study.
199
RR Diss White, Nora Lizabeth, Ph.D., The Ohio State University, 1992. Social constructions of literacy learning: At-risk first graders making sense of instruction in the classroom and an early intervention program.
This was not a quantitative study.
200
RR Diss Lindsay, Sandra Roberts, Ed.D., University of South Carolina, 1992. The dissemination of curricular change: Reading Recovery in Dorchester school district two.
This was not a quantitative study.
201
RR Diss Kaye, Elizabeth Lee, M.A., Texas Woman's University, 1992. The influence of Reading Recovery(tm) instructional techniques on the cue use of intermediate readers.
Not about RR implemented as intended.
202
RR Diss Bragg, Mary Frances, M.A., Texas Woman's University, 1992. The influence of text readings on the acquisition of a writing vocabulary in a Reading Recovery(TM) program.
The outcome variable was not reading achievement.
203
RR Diss Compton, Gary L., Ed.D., Western Michigan University, 1992. The Reading Connection: A leadership initiative designed to change the delivery of educational services to at-risk children.
Not about RR implemented as intended.
204
RR Diss Fitzgerald-Hastings, Dianne Irene, M.A., Texas Woman's University, 1991. A description of the integration of meaning, structure, and visual cues of two first grade Reading Recovery students.
This was not a quantitative study.
205
RR Diss Frasier, Dianne Farrell, Ph.D., The Ohio State University, 1991.A study of strategy use by two emergent readers in a one-to-one tutorial setting.
This was not a quantitative study.
206
RR Diss Bruster, Benita Gayle, Ph.D., Texas Woman's University, 1991. Instructional scaffolding: The effective use of teacher-student dialogue.
This was not a quantitative study.
207
RR Diss Schnug, James R., Ph.D., The Ohio State University, 1991. Learning to read in an intervention program and the classroom reading group.
This was not a quantitative study.
20 RR Diss Bradley, Darcy Hepler, Ph.D., The Ohio State Not about RR.

264
8 University, 1991. Reconceptualizing literacy learning for adult new literates in one-to-one teacher/student interactions.
209
RR Diss Shannon, Darla Sandifer, Ph.D., Texas Woman's University, 1990. A descriptive study of verbal challenge and teacher response to verbal challenge in Reading Recovery teacher training.
The unit of analysis was not students in grades K-3.
210
RR Diss Handerhan, Eleanor Casagrande, Ph.D., The Ohio State University, 1990. Reading instruction as defined by "successful" teachers and their first-grade students within an early intervention program.
The outcome variable was not reading achievement.
211
RR Diss Wilson, Valerie L., Ph.D., The Ohio State University, 1988. A study of teacher development in an interactive inservice setting.
The unit of analysis was not students in grades K-3.
212
RR Diss Peterson, Barbara Leach, Ph.D., The Ohio State University, 1988. Characteristics of texts that support beginning readers.
The unit of analysis was not students in grades K-3.
213
RR Diss Strong, Elizabeth Lee, Ph.D., The Ohio State University, 1988. Nurturing early literacy: A literature based program for at-risk first graders.
This was not a quantitative study.
214
RR Diss HOLLAND, KATHLEEN ELIZABETH, Ph.D., The Ohio State University, 1987. THE IMPACT OF THE READING RECOVERY PROGRAM ON PARENTS AND HOME LITERACY CONTEXTS. (VOLUMES I AND II).
This was not a quantitative study.
215
RR Diss WOOLSEY, DANIEL PHELPS, Ph.D., The Ohio State University, 1986. FIRST GRADE CHILDREN'S RESPONSES TO TEACHER CHANGE IN LITERACY CONTEXTS (READING, WRITING.
This was not a quantitative study.
216
RR Diss Taylor, Michal G., Ph.D., Oakland University, 2006. Responses to intervention: A pragmatic investigation of schools as systems, early intervention and special education
The outcome variable was not reading achievement.
217
RR Diss Mays, Lydia Criss, Ph.D., Georgia State University, 2009. Linking theory to practice: Understanding how two Reading Recovery teachers' reflections inform their teaching practices
The unit of analysis was not students in grades K-3.
1 SFA Diss Gilpatrick, Robin Sue Holzworth, Ed.D., Walden University, 2010. Classroom management strategies and behavioral interventions to support academic
The outcome variable was not reading achievement.

265
achievement. 2 SFA Diss Castagna, Daniel R., Ed.D., University of
Pittsburgh, 2008. A quantitative case study analysis of the 4Sight benchmark assessment.
The unit of analysis was not students in grades K-3.
3 SFA Diss Hunt, Wade L., Ed.D., Widener University, 2008. "Effect of grading a benchmark assessment on student performance"
The unit of analysis was not students in grades K-3.
4 SFA Diss Rauch, Mary E. Armstrong, D.Ed., Indiana University of Pennsylvania, 2008. Possible predictive factors for the Greater Johnstown school district's Pennsylvania System of School Assessment reading results.
The unit of analysis was not students in grades K-3.
5 SFA Diss Gander, Brian David, D.Ed., University of Oregon, 2007. A comparison of early reading outcomes and program costs in four primary reading programs for improved decision-making.
Treatment and comparison groups were not shown to be equivalent at baseline.
6 SFA Diss Smith-Davis, Stacey L., Ed.D., University of Central Florida, 2007. Does Success For All impact reading achievement of students with learning disabilities.
Treatment and comparison groups were not shown to be equivalent at baseline.
7 SFA Diss Jackson, Winston D., Ed.D., Seton Hall University, 2006. An investigation of the impact of the Success for All whole-school reform model on the Elementary School Proficiency Assessment and the New Jersey Assessment of Skills and Knowledge in an urban district.
The unit of analysis was not students in grades K-3.
8 SFA Diss Hicks, Jill Elizabeth, Ed.D., Texas A&M University - Commerce, 2006. A systems analysis of the Success for All reading program: Student achievement and teacher perceptions.
The experimental/treatment group was not compared to a control/comparison group.
9 SFA Diss Alonzo, Teresa Lopez, Ed.D., University of Southern California, 2006. Closing achievement gaps through data-driven decision making in a Success for All school.
This was not a quantitative study.
10 SFA Diss Mason, Bryce, Ph.D., The Pardee RAND Graduate School, 2005. Achievement effects of five comprehensive school reform designs implemented in Los Angeles Unified School District.
Treatment and comparison groups were not shown to be equivalent at baseline.
11 SFA Diss Ross, Terry, Ph.D., Mississippi State University, 2005. An investigation of the Success For All reading program in three Mississippi elementary schools.
The experimental/treatment group was not compared to a control/comparison group.
12 SFA Diss Weaver, Liesa McAlexander, Ph.D., Mississippi State University, 2005. An investigation of the Success for All reading
The experimental/treatment group was not compared

266
program in three Mississippi schools to a control/comparison group.
13 SFA Diss Gines, Bobby E., Ed.D., University of Missouri - Columbia, 2005. Comparing two comprehensive reform models: Their effect on student reading achievement.
Accepted.
14 SFA Diss Peurach, Donald J., Ph.D., University of Michigan, 2005. Designing and managing comprehensive school reform: The case of Success for All.
This was not a quantitative study.
15 SFA Diss Correnti, Richard J., Ph.D., University of Michigan, 2005. Literacy instruction in CSR schools: Consequences of design specification on teacher practice.
The unit of analysis was not students in grades K-3.
16 SFA Diss Dere, Mirlene, Ph.D., Union Institute and University, 2005. "Success for All" and "America's Choice": A comparative evaluation of two alternative instructional programs for elementary school students.
The unit of analysis was not students in grades K-3.
17 SFA Diss Greenlaw, Mary J., Ed.D., University of Hartford, 2004. A case study examining the relationships among teachers' perceptions of the Success for All reading program, teachers' sense of efficacy, students' attitudes toward reading and students' reading achievement.
The experimental/treatment group was not compared to a control/comparison group.
18 SFA Diss Moore Hankerson, Kimberlyn, Ed.D., The George Washington University, 2004. A cross-case study of the practices of the Success for All (SFA) facilitator.
This was not a quantitative study.
19 SFA Diss Stewart, Jonathan A., M.S., Utah State University, 2004. An analysis of bilingual programs in the context of a schoolwide reading program.
The experimental/treatment group was not compared to a control/comparison group.
20 SFA Diss Hess, Patricia M., Ed.D., University of the Pacific, 2004. A study of teachers' selection and implementation of meta-cognitive reading strategies for fourth/fifth grade reading comprehension from a Success For All reading program perspective: Moving beyond the fundamentals.
The unit of analysis was not students in grades K-3.
21 SFA Diss Alamillo, Laura A., Ph.D., University of California, Berkeley, 2004. Chicano/a children's perspective on Chicano/a children's literature.
This was not a quantitative study.
22 SFA Diss McCollum-Rogers, Sharon Ann, Ph.D., The University of Southern Mississippi, 2004. Comparing Direct Instruction and Success for All with a Basal Reading program in relation to student achievement.
Experimental/treatment and control/comparison groups are not shown to be equivalent at baseline.
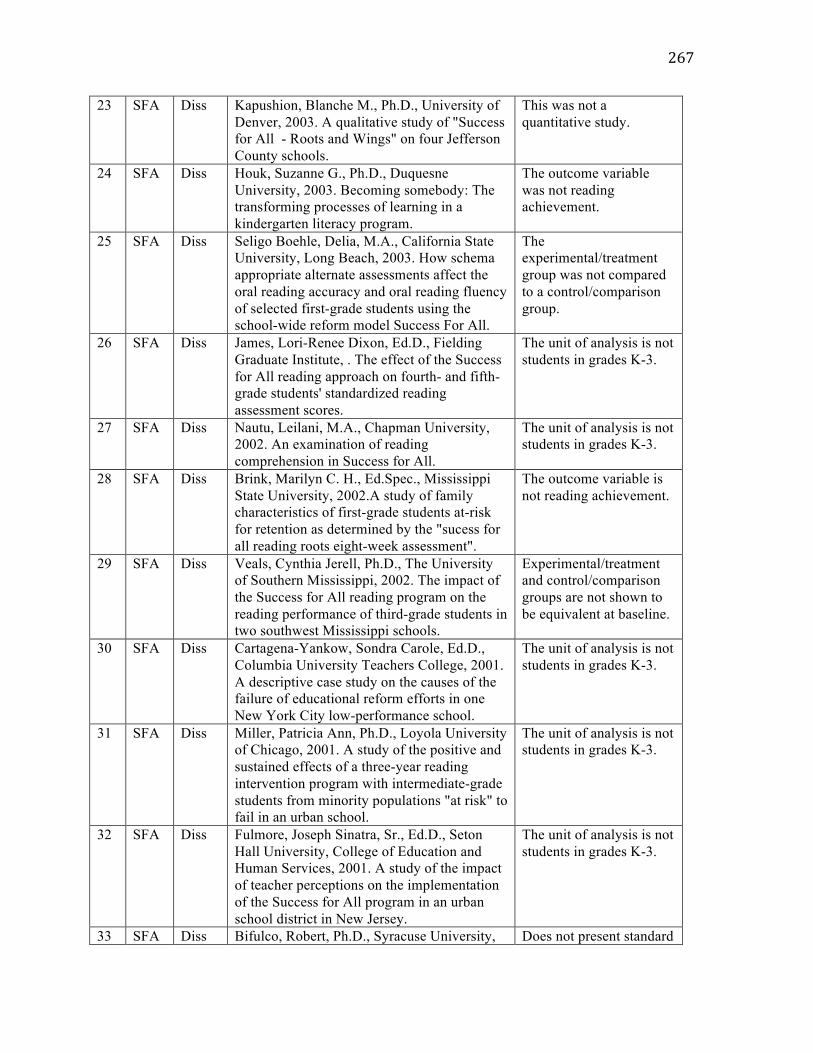
267
23 SFA Diss Kapushion, Blanche M., Ph.D., University of Denver, 2003. A qualitative study of "Success for All - Roots and Wings" on four Jefferson County schools.
This was not a quantitative study.
24 SFA Diss Houk, Suzanne G., Ph.D., Duquesne University, 2003. Becoming somebody: The transforming processes of learning in a kindergarten literacy program.
The outcome variable was not reading achievement.
25 SFA Diss Seligo Boehle, Delia, M.A., California State University, Long Beach, 2003. How schema appropriate alternate assessments affect the oral reading accuracy and oral reading fluency of selected first-grade students using the school-wide reform model Success For All.
The experimental/treatment group was not compared to a control/comparison group.
26 SFA Diss James, Lori-Renee Dixon, Ed.D., Fielding Graduate Institute, . The effect of the Success for All reading approach on fourth- and fifth-grade students' standardized reading assessment scores.
The unit of analysis is not students in grades K-3.
27 SFA Diss Nautu, Leilani, M.A., Chapman University, 2002. An examination of reading comprehension in Success for All.
The unit of analysis is not students in grades K-3.
28 SFA Diss Brink, Marilyn C. H., Ed.Spec., Mississippi State University, 2002.A study of family characteristics of first-grade students at-risk for retention as determined by the "sucess for all reading roots eight-week assessment".
The outcome variable is not reading achievement.
29 SFA Diss Veals, Cynthia Jerell, Ph.D., The University of Southern Mississippi, 2002. The impact of the Success for All reading program on the reading performance of third-grade students in two southwest Mississippi schools.
Experimental/treatment and control/comparison groups are not shown to be equivalent at baseline.
30 SFA Diss Cartagena-Yankow, Sondra Carole, Ed.D., Columbia University Teachers College, 2001. A descriptive case study on the causes of the failure of educational reform efforts in one New York City low-performance school.
The unit of analysis is not students in grades K-3.
31 SFA Diss Miller, Patricia Ann, Ph.D., Loyola University of Chicago, 2001. A study of the positive and sustained effects of a three-year reading intervention program with intermediate-grade students from minority populations "at risk" to fail in an urban school.
The unit of analysis is not students in grades K-3.
32 SFA Diss Fulmore, Joseph Sinatra, Sr., Ed.D., Seton Hall University, College of Education and Human Services, 2001. A study of the impact of teacher perceptions on the implementation of the Success for All program in an urban school district in New Jersey.
The unit of analysis is not students in grades K-3.
33 SFA Diss Bifulco, Robert, Ph.D., Syracuse University, Does not present standard

268
2001. Do whole-school reform models boost student performance: Evidence from New York City.
deviations or standard errors; effect sizes cannot be calculated.
34 SFA Diss Grehan, Anna Warren, Ph.D., The University of Memphis, 2001. The effects of the Success for All program on improving reading readiness skills for at-risk students in kindergarten.
Experimental/treatment and control/comparison groups are not shown to be equivalent at baseline.
35 SFA Diss Dubin, Gail Fishberg, Ed.D., Seton Hall University, College of Education and Human Services, 2001. The role of the principal under mandated decentralized governance in four models of Whole School Reform in New Jersey.
This was not a quantitative study.
36 SFA Diss Lucius, Lisa Benjamin, Ph.D., The University of Mississippi, 2000. A comparison of three kindergarten curricula on language and literacy performance.
Experimental/treatment and control/comparison groups are not shown to be equivalent at baseline.
37 SFA Diss Dillon, Irene Cecelia, Ed.D., Texas Southern University, 2000. A comparative study of compensatory education outcomes of at-risk students.
Experimental/treatment and control/comparison groups are not shown to be equivalent at baseline.
38 SFA Diss Guillot, Karen Parker, Ph.D., Louisiana State University and Agricultural & Mechanical College, 2000. An inquiry into the impact of teacher variances within the implementation of the Success for All reading program in two school districts.
This was not a quantitative study.
39 SFA Diss Wells, Lauren Rabb, Ph.D., Mississippi State University, 2000. An investigation of the Success for All reading program at two Mississippi elementary schools.
The experimental/treatment group was not compared to a control/comparison group.
40 SFA Diss Daniel, Cathy Elaine Smith, Ph.D., Louisiana State University and Agricultural & Mechanical College, 2000. A study of the effects of two instructional programs in reading on student reading self-efficacy, personal perceptions of the learning environment and reading levels.
The outcome variable was not reading achievement.
41 SFA Diss Massue, Francine M., M.A., Concordia University (Canada), 2000. Effects of engaging in success for all on children's causal attributions.
The unit of analysis was not students in grades K-3.
42 SFA Diss Pierce, Julie Ann, M.A., University of Nevada, Reno, 2000. Influence of the Success For All program upon reading achievement scores.
The experimental/treatment group was not compared to a control/comparison group.
43 SFA Diss Schneider, Frederick H., Ph.D., Texas A&M Experimental/treatment

269
University, 1999. Impact of the "Success for All" program in the teaching of reading for third grade students in selected elementary schools in the Pasadena Independent School District.
and control/comparison groups are not shown to be equivalent at baseline.
44 SFA Diss Tychsen, Anita, Ph.D., The University of Wisconsin - Madison, 1999. The power of the purse: An examination of how schools reallocated resources to implement reform strategies
This was not a quantitative study.
45 SFA Diss Atkinson, Cheryl Lynn-Howell, Ed.D., Virginia Polytechnic Institute and State University, 1998. An analysis of the impact of "Success For All" on reading, attendance, and academic self-efficacy with at-risk elementary school students.
Experimental/treatment and control/comparison groups are not shown to be equivalent at baseline.
46 SFA Diss Rozier, Mary Katherine, Ed.D., Miami University, 1998. Elementary students' perception of homogeneous grouping in the Success for All reading program.
The outcome variable was not reading achievement.
47 SFA Diss Shanks, Frances I., Ed.D., The University of Memphis, 1998. Emergent literacy, writing achievement, and Success for All.
Experimental/treatment and control/comparison groups are not shown to be equivalent at baseline
48 SFA Diss Alexander, Karen Elaine, Ed.D., Texas Southern University, 1998. The effectiveness of the Success For All reading program on the reading performances of fourth-grade urban elementary pupils.
The unit of analysis was not students in grades K-3.
49 SFA Diss Simpson, Stella Hannah, Ed.D., Tennessee State University, 1997.
See record under Reading Recovery.
50 SFA Diss Chaffee, Cindy Lu, Ed.D., University of La Verne, 1997. Initiating National Reform Projects in California elementary schools.
The unit of analysis was not students in grades K-3.
51 SFA Diss Nath, Leslie Rusin, Ph.D., The University of Memphis, 1996. A peer tutoring training model for cooperative groupings: Is the effectiveness of cooperative groupings enhanced by students obtaining peer tutoring skills?
The outcome variable was not reading achievement.
52 SFA Diss Hanisch, Thomas J., Ed.D., University of Virginia, 1996. Preschool and elementary programs for at-risk students: Effective practices, costs, and funding.
The unit of analysis was not students in grades K-3.
53 SFA Diss Bradford, Mary Alice Elizabeth, Ph.D., Walden University, 1996. Reduction of early reading failure by means of one-to-one tutoring: A case study.
The experimental/treatment group was not compared to a control/comparison group.

270
54 SFA Diss Nunnery, John Alan, Ed.D., The University of Memphis, 1995. An assessment of Success For All program component effects on the reading achievement of at-risk first-grade students.
Experimental/treatment and control/comparison groups are not shown to be equivalent at baseline.
83 AR ERIC Ecklund, Britt K.; Lamon, Kathryn M. Improving Reading Achievement Through Increased Motivation, Specific Skill Enhancement, and Practice Time for Elementary Students (ED503058)
Experimental/treatment and control/comparison groups are not shown to be equivalent at baseline.
84 AR ERIC Thompson, Gail; Madhuri, Marga; Taylor, Deborah. How the Accelerated Reader Program Can Become Counterproductive for High School Students (EJ817076)
The unit of analysis was not students in grades K-3.
85 AR ERIC Schmidt, Renita. Really Reading: What Does Accelerated Reader Teach Adults and Children? (EJ783692)
Not a quantitative study.
86 AR ERIC McAllister, Deborah A., Ed.; Fritch, Sarah C., Ed. Culminating Experience Action Research Projects, Volume 8, Part 1, Spring 2006 (ED495484)
The unit of analysis was not students in grades K-3.
87 AR ERIC Melton, Cindy M.; Smothers, Bobbie C.; Anderson, Eugene; Fulton, Ray; Replogle, William H.; Thomas, Lisa. A Study of the Effects of the Accelerated Reader Program on Fifth Grade Students' Reading Achievement Growth (EJ703706)
The unit of analysis was not students in grades K-3.
88 AR ERIC
Deshler, Donald D.; Palincsar, Annemarie Sullivan; Biancarosa, Gina; Nair, Marnie. Informed Choices for Struggling Adolescent Readers: A Research-Based Guide to Instructional Programs and Practices (ED497895)
The unit of analysis was not students in grades K-3.
89 AR ERIC Nunnery, John A.; Ross, Steven M.; McDonald, Aaron. A Randomized Experimental Evaluation of the Impact of Accelerated Reader/Reading Renaissance Implementation on Reading Achievement in Grades 3 to 6 (EJ733705). Journal of Education for Students Placed at Risk (JESPAR), v11 n1 p1-18 2006
Accepted
90 AR ERIC Groce, Robin D.; Groce, Eric C. Deconstructing the Accelerated Reader Program (EJ739320). Reading Horizons, v46 n1 p17-30 Sep-Oct 2005.
Outcome variable is not reading achievement.
91 AR ERIC Stanfield, Gayle M. Incentives: The Effects on Reading Attitude and Reading Behaviors of Third-Grade Students (ED494453)
Outcome variable is not reading achievement.
92 AR ERIC
Pavonetti, Linda M.; Brimmer, Kathyrn M.; Cipielewski, James F. Accelerated Reader: What Are the Lasting Effects on the Reading Habits of Middle School Students Exposed to Accelerated Reader in Elementary Grades? (EJ659014) Journal of Adolescent & Adult Literacy, v46 n4 p300-11 Dec-Jan 2002-2003.
Outcome variable is not reading achievement.
93 AR ERIC Putman, S. Michael. Computer-Based Reading Technology in the Classroom: The Affective
The unit of analysis was not students in grades K-
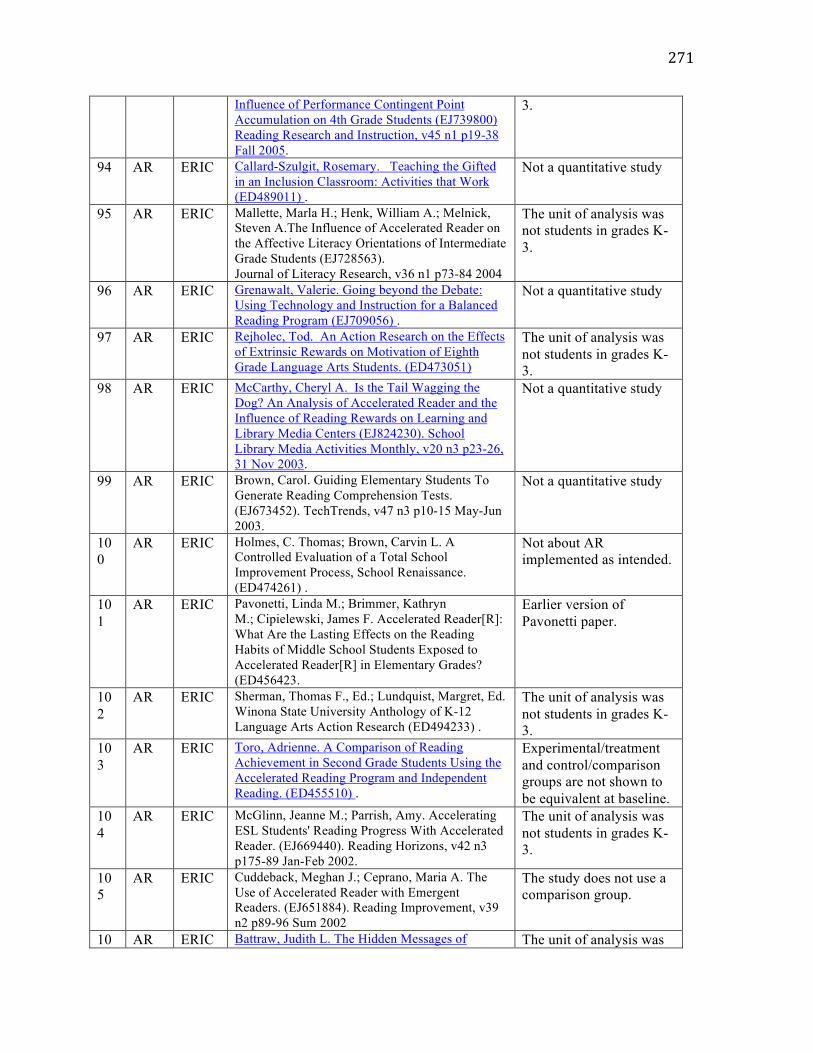
271
Influence of Performance Contingent Point Accumulation on 4th Grade Students (EJ739800) Reading Research and Instruction, v45 n1 p19-38 Fall 2005.
3.
94 AR ERIC Callard-Szulgit, Rosemary. Teaching the Gifted in an Inclusion Classroom: Activities that Work (ED489011) .
Not a quantitative study
95 AR ERIC Mallette, Marla H.; Henk, William A.; Melnick, Steven A.The Influence of Accelerated Reader on the Affective Literacy Orientations of Intermediate Grade Students (EJ728563). Journal of Literacy Research, v36 n1 p73-84 2004
The unit of analysis was not students in grades K-3.
96 AR ERIC Grenawalt, Valerie. Going beyond the Debate: Using Technology and Instruction for a Balanced Reading Program (EJ709056) .
Not a quantitative study
97 AR ERIC Rejholec, Tod. An Action Research on the Effects of Extrinsic Rewards on Motivation of Eighth Grade Language Arts Students. (ED473051)
The unit of analysis was not students in grades K-3.
98 AR ERIC McCarthy, Cheryl A. Is the Tail Wagging the Dog? An Analysis of Accelerated Reader and the Influence of Reading Rewards on Learning and Library Media Centers (EJ824230). School Library Media Activities Monthly, v20 n3 p23-26, 31 Nov 2003.
Not a quantitative study
99 AR ERIC Brown, Carol. Guiding Elementary Students To Generate Reading Comprehension Tests. (EJ673452). TechTrends, v47 n3 p10-15 May-Jun 2003.
Not a quantitative study
100
AR ERIC Holmes, C. Thomas; Brown, Carvin L. A Controlled Evaluation of a Total School Improvement Process, School Renaissance. (ED474261) .
Not about AR implemented as intended.
101
AR ERIC Pavonetti, Linda M.; Brimmer, Kathryn M.; Cipielewski, James F. Accelerated Reader[R]: What Are the Lasting Effects on the Reading Habits of Middle School Students Exposed to Accelerated Reader[R] in Elementary Grades? (ED456423.
Earlier version of Pavonetti paper.
102
AR ERIC Sherman, Thomas F., Ed.; Lundquist, Margret, Ed. Winona State University Anthology of K-12 Language Arts Action Research (ED494233) .
The unit of analysis was not students in grades K-3.
103
AR ERIC Toro, Adrienne. A Comparison of Reading Achievement in Second Grade Students Using the Accelerated Reading Program and Independent Reading. (ED455510) .
Experimental/treatment and control/comparison groups are not shown to be equivalent at baseline.
104
AR ERIC McGlinn, Jeanne M.; Parrish, Amy. Accelerating ESL Students' Reading Progress With Accelerated Reader. (EJ669440). Reading Horizons, v42 n3 p175-89 Jan-Feb 2002.
The unit of analysis was not students in grades K-3.
105
AR ERIC Cuddeback, Meghan J.; Ceprano, Maria A. The Use of Accelerated Reader with Emergent Readers. (EJ651884). Reading Improvement, v39 n2 p89-96 Sum 2002
The study does not use a comparison group.
10 AR ERIC Battraw, Judith L. The Hidden Messages of The unit of analysis was
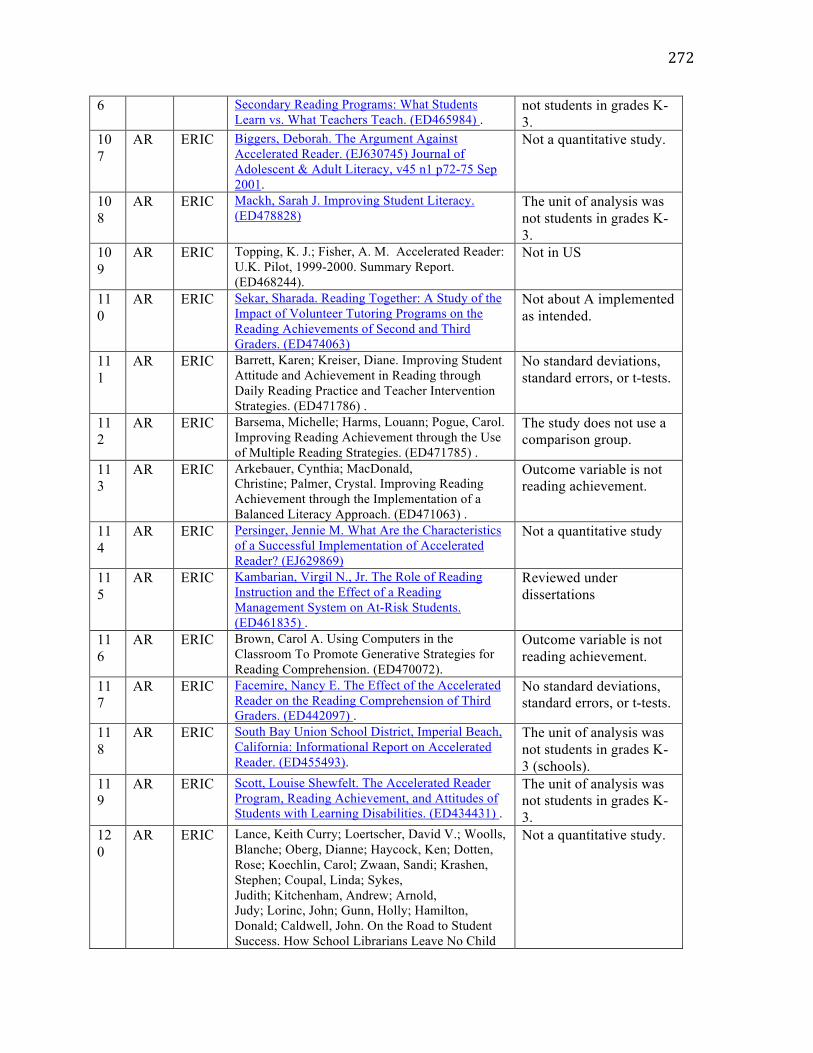
272
6 Secondary Reading Programs: What Students Learn vs. What Teachers Teach. (ED465984) .
not students in grades K-3.
107
AR ERIC Biggers, Deborah. The Argument Against Accelerated Reader. (EJ630745) Journal of Adolescent & Adult Literacy, v45 n1 p72-75 Sep 2001.
Not a quantitative study.
108
AR ERIC Mackh, Sarah J. Improving Student Literacy. (ED478828)
The unit of analysis was not students in grades K-3.
109
AR ERIC Topping, K. J.; Fisher, A. M. Accelerated Reader: U.K. Pilot, 1999-2000. Summary Report. (ED468244).
Not in US
110
AR ERIC Sekar, Sharada. Reading Together: A Study of the Impact of Volunteer Tutoring Programs on the Reading Achievements of Second and Third Graders. (ED474063)
Not about A implemented as intended.
111
AR ERIC Barrett, Karen; Kreiser, Diane. Improving Student Attitude and Achievement in Reading through Daily Reading Practice and Teacher Intervention Strategies. (ED471786) .
No standard deviations, standard errors, or t-tests.
112
AR ERIC Barsema, Michelle; Harms, Louann; Pogue, Carol. Improving Reading Achievement through the Use of Multiple Reading Strategies. (ED471785) .
The study does not use a comparison group.
113
AR ERIC Arkebauer, Cynthia; MacDonald, Christine; Palmer, Crystal. Improving Reading Achievement through the Implementation of a Balanced Literacy Approach. (ED471063) .
Outcome variable is not reading achievement.
114
AR ERIC Persinger, Jennie M. What Are the Characteristics of a Successful Implementation of Accelerated Reader? (EJ629869)
Not a quantitative study
115
AR ERIC Kambarian, Virgil N., Jr. The Role of Reading Instruction and the Effect of a Reading Management System on At-Risk Students. (ED461835) .
Reviewed under dissertations
116
AR ERIC Brown, Carol A. Using Computers in the Classroom To Promote Generative Strategies for Reading Comprehension. (ED470072).
Outcome variable is not reading achievement.
117
AR ERIC Facemire, Nancy E. The Effect of the Accelerated Reader on the Reading Comprehension of Third Graders. (ED442097) .
No standard deviations, standard errors, or t-tests.
118
AR ERIC South Bay Union School District, Imperial Beach, California: Informational Report on Accelerated Reader. (ED455493).
The unit of analysis was not students in grades K-3 (schools).
119
AR ERIC Scott, Louise Shewfelt. The Accelerated Reader Program, Reading Achievement, and Attitudes of Students with Learning Disabilities. (ED434431) .
The unit of analysis was not students in grades K-3.
120
AR ERIC Lance, Keith Curry; Loertscher, David V.; Woolls, Blanche; Oberg, Dianne; Haycock, Ken; Dotten, Rose; Koechlin, Carol; Zwaan, Sandi; Krashen, Stephen; Coupal, Linda; Sykes, Judith; Kitchenham, Andrew; Arnold, Judy; Lorinc, John; Gunn, Holly; Hamilton, Donald; Caldwell, John. On the Road to Student Success. How School Librarians Leave No Child
Not a quantitative study.
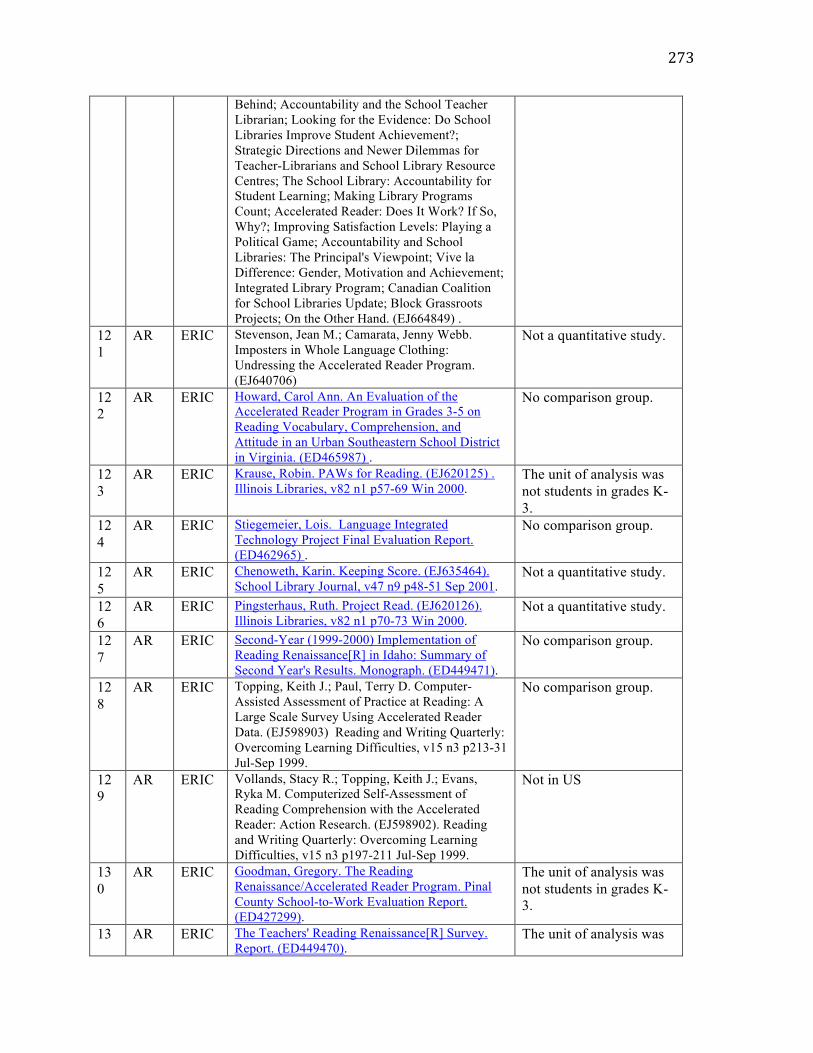
273
Behind; Accountability and the School Teacher Librarian; Looking for the Evidence: Do School Libraries Improve Student Achievement?; Strategic Directions and Newer Dilemmas for Teacher-Librarians and School Library Resource Centres; The School Library: Accountability for Student Learning; Making Library Programs Count; Accelerated Reader: Does It Work? If So, Why?; Improving Satisfaction Levels: Playing a Political Game; Accountability and School Libraries: The Principal's Viewpoint; Vive la Difference: Gender, Motivation and Achievement; Integrated Library Program; Canadian Coalition for School Libraries Update; Block Grassroots Projects; On the Other Hand. (EJ664849) .
121
AR ERIC Stevenson, Jean M.; Camarata, Jenny Webb. Imposters in Whole Language Clothing: Undressing the Accelerated Reader Program. (EJ640706)
Not a quantitative study.
122
AR ERIC Howard, Carol Ann. An Evaluation of the Accelerated Reader Program in Grades 3-5 on Reading Vocabulary, Comprehension, and Attitude in an Urban Southeastern School District in Virginia. (ED465987) .
No comparison group.
123
AR ERIC Krause, Robin. PAWs for Reading. (EJ620125) . Illinois Libraries, v82 n1 p57-69 Win 2000.
The unit of analysis was not students in grades K-3.
124
AR ERIC Stiegemeier, Lois. Language Integrated Technology Project Final Evaluation Report. (ED462965) .
No comparison group.
125
AR ERIC Chenoweth, Karin. Keeping Score. (EJ635464). School Library Journal, v47 n9 p48-51 Sep 2001.
Not a quantitative study.
126
AR ERIC Pingsterhaus, Ruth. Project Read. (EJ620126). Illinois Libraries, v82 n1 p70-73 Win 2000.
Not a quantitative study.
127
AR ERIC Second-Year (1999-2000) Implementation of Reading Renaissance[R] in Idaho: Summary of Second Year's Results. Monograph. (ED449471).
No comparison group.
128
AR ERIC Topping, Keith J.; Paul, Terry D. Computer-Assisted Assessment of Practice at Reading: A Large Scale Survey Using Accelerated Reader Data. (EJ598903) Reading and Writing Quarterly: Overcoming Learning Difficulties, v15 n3 p213-31 Jul-Sep 1999.
No comparison group.
129
AR ERIC Vollands, Stacy R.; Topping, Keith J.; Evans, Ryka M. Computerized Self-Assessment of Reading Comprehension with the Accelerated Reader: Action Research. (EJ598902). Reading and Writing Quarterly: Overcoming Learning Difficulties, v15 n3 p197-211 Jul-Sep 1999.
Not in US
130
AR ERIC Goodman, Gregory. The Reading Renaissance/Accelerated Reader Program. Pinal County School-to-Work Evaluation Report. (ED427299).
The unit of analysis was not students in grades K-3.
13 AR ERIC The Teachers' Reading Renaissance[R] Survey. Report. (ED449470).
The unit of analysis was
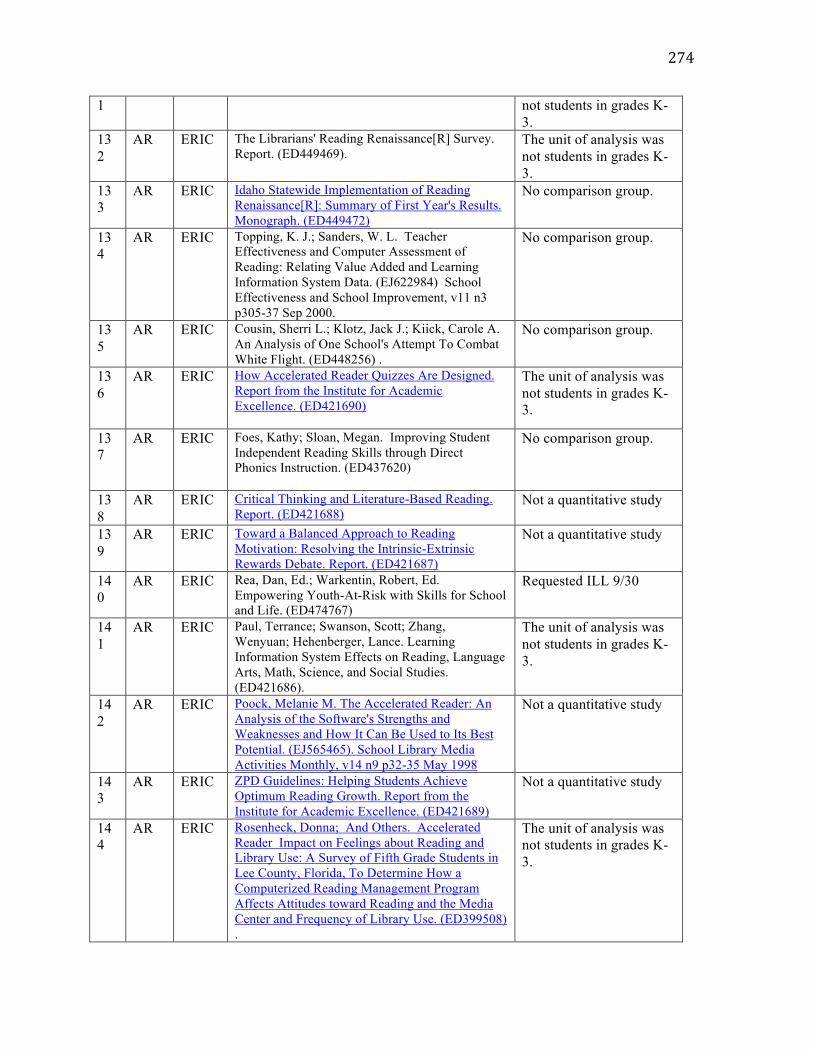
274
1 not students in grades K-3.
132
AR ERIC The Librarians' Reading Renaissance[R] Survey. Report. (ED449469).
The unit of analysis was not students in grades K-3.
133
AR ERIC Idaho Statewide Implementation of Reading Renaissance[R]: Summary of First Year's Results. Monograph. (ED449472)
No comparison group.
134
AR ERIC Topping, K. J.; Sanders, W. L. Teacher Effectiveness and Computer Assessment of Reading: Relating Value Added and Learning Information System Data. (EJ622984) School Effectiveness and School Improvement, v11 n3 p305-37 Sep 2000.
No comparison group.
135
AR ERIC Cousin, Sherri L.; Klotz, Jack J.; Kiick, Carole A. An Analysis of One School's Attempt To Combat White Flight. (ED448256) .
No comparison group.
136
AR ERIC How Accelerated Reader Quizzes Are Designed. Report from the Institute for Academic Excellence. (ED421690)
The unit of analysis was not students in grades K-3.
137
AR ERIC Foes, Kathy; Sloan, Megan. Improving Student Independent Reading Skills through Direct Phonics Instruction. (ED437620)
No comparison group.
138
AR ERIC Critical Thinking and Literature-Based Reading. Report. (ED421688)
Not a quantitative study
139
AR ERIC Toward a Balanced Approach to Reading Motivation: Resolving the Intrinsic-Extrinsic Rewards Debate. Report. (ED421687)
Not a quantitative study
140
AR ERIC Rea, Dan, Ed.; Warkentin, Robert, Ed. Empowering Youth-At-Risk with Skills for School and Life. (ED474767)
Requested ILL 9/30
141
AR ERIC Paul, Terrance; Swanson, Scott; Zhang, Wenyuan; Hehenberger, Lance. Learning Information System Effects on Reading, Language Arts, Math, Science, and Social Studies. (ED421686).
The unit of analysis was not students in grades K-3.
142
AR ERIC Poock, Melanie M. The Accelerated Reader: An Analysis of the Software's Strengths and Weaknesses and How It Can Be Used to Its Best Potential. (EJ565465). School Library Media Activities Monthly, v14 n9 p32-35 May 1998
Not a quantitative study
143
AR ERIC ZPD Guidelines: Helping Students Achieve Optimum Reading Growth. Report from the Institute for Academic Excellence. (ED421689)
Not a quantitative study
144
AR ERIC Rosenheck, Donna; And Others. Accelerated Reader Impact on Feelings about Reading and Library Use: A Survey of Fifth Grade Students in Lee County, Florida, To Determine How a Computerized Reading Management Program Affects Attitudes toward Reading and the Media Center and Frequency of Library Use. (ED399508) .
The unit of analysis was not students in grades K-3.
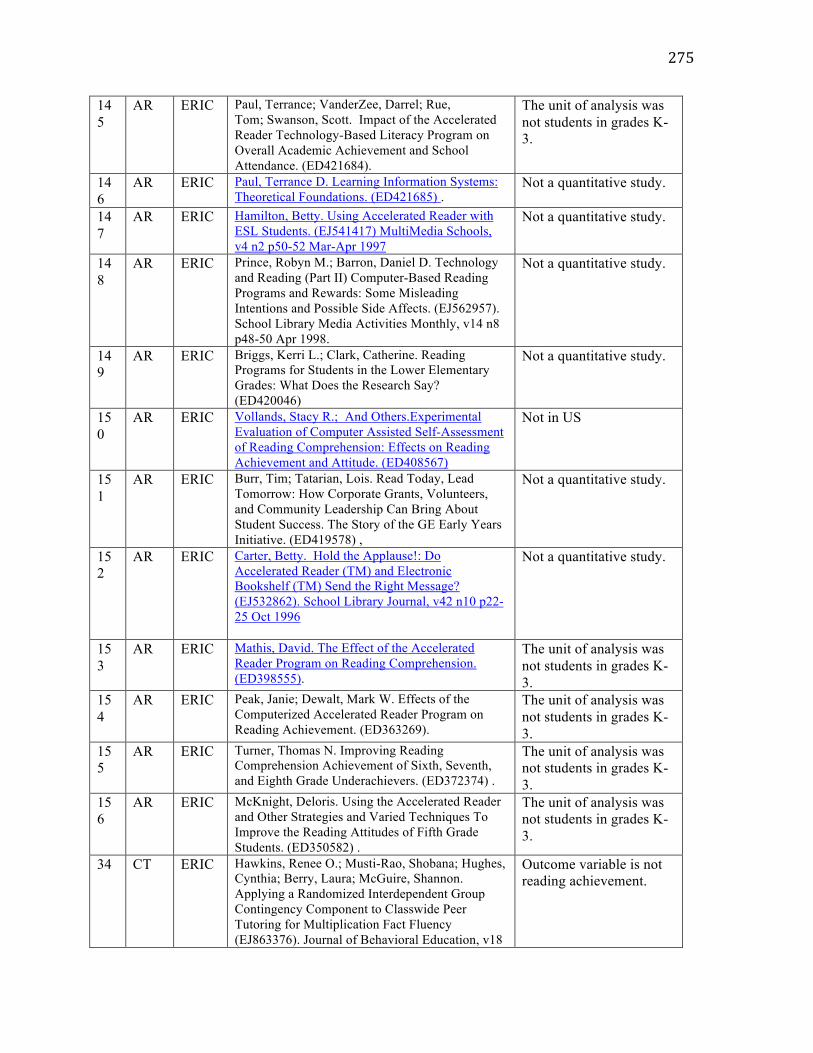
275
145
AR ERIC Paul, Terrance; VanderZee, Darrel; Rue, Tom; Swanson, Scott. Impact of the Accelerated Reader Technology-Based Literacy Program on Overall Academic Achievement and School Attendance. (ED421684).
The unit of analysis was not students in grades K-3.
146
AR ERIC Paul, Terrance D. Learning Information Systems: Theoretical Foundations. (ED421685) .
Not a quantitative study.
147
AR ERIC Hamilton, Betty. Using Accelerated Reader with ESL Students. (EJ541417) MultiMedia Schools, v4 n2 p50-52 Mar-Apr 1997
Not a quantitative study.
148
AR ERIC Prince, Robyn M.; Barron, Daniel D. Technology and Reading (Part II) Computer-Based Reading Programs and Rewards: Some Misleading Intentions and Possible Side Affects. (EJ562957). School Library Media Activities Monthly, v14 n8 p48-50 Apr 1998.
Not a quantitative study.
149
AR ERIC Briggs, Kerri L.; Clark, Catherine. Reading Programs for Students in the Lower Elementary Grades: What Does the Research Say? (ED420046)
Not a quantitative study.
150
AR ERIC Vollands, Stacy R.; And Others.Experimental Evaluation of Computer Assisted Self-Assessment of Reading Comprehension: Effects on Reading Achievement and Attitude. (ED408567)
Not in US
151
AR ERIC Burr, Tim; Tatarian, Lois. Read Today, Lead Tomorrow: How Corporate Grants, Volunteers, and Community Leadership Can Bring About Student Success. The Story of the GE Early Years Initiative. (ED419578) ,
Not a quantitative study.
152
AR ERIC Carter, Betty. Hold the Applause!: Do Accelerated Reader (TM) and Electronic Bookshelf (TM) Send the Right Message? (EJ532862). School Library Journal, v42 n10 p22-25 Oct 1996
Not a quantitative study.
153
AR ERIC Mathis, David. The Effect of the Accelerated Reader Program on Reading Comprehension. (ED398555).
The unit of analysis was not students in grades K-3.
154
AR ERIC Peak, Janie; Dewalt, Mark W. Effects of the Computerized Accelerated Reader Program on Reading Achievement. (ED363269).
The unit of analysis was not students in grades K-3.
155
AR ERIC Turner, Thomas N. Improving Reading Comprehension Achievement of Sixth, Seventh, and Eighth Grade Underachievers. (ED372374) .
The unit of analysis was not students in grades K-3.
156
AR ERIC McKnight, Deloris. Using the Accelerated Reader and Other Strategies and Varied Techniques To Improve the Reading Attitudes of Fifth Grade Students. (ED350582) .
The unit of analysis was not students in grades K-3.
34 CT ERIC Hawkins, Renee O.; Musti-Rao, Shobana; Hughes, Cynthia; Berry, Laura; McGuire, Shannon. Applying a Randomized Interdependent Group Contingency Component to Classwide Peer Tutoring for Multiplication Fact Fluency (EJ863376). Journal of Behavioral Education, v18
Outcome variable is not reading achievement.

276
n4 p300-318 Dec 2009. 35 CT ERIC Neddenriep, Christine E.; Skinner, Christopher
H.; Wallace, Monica A.; McCallum, Elizabeth. ClassWide Peer Tutoring: Two Experiments Investigating the Generalized Relationship between Increased Oral Reading Fluency and Reading Comprehension (EJ865326).
The unit of analysis was not students in grades K-3.
36 CT ERIC Ayvazo, Shiri; Ward, Phillip. Effects of Classwide Peer Tutoring on the Performance of Sixth Grade Students during a Volleyball Unit (EJ862175). Physical Educator, v66 n1 p12-22 Win 2009.
The unit of analysis was not students in grades K-3.
37 CT ERIC Bowman-Perrott, Lisa. Classwide Peer Tutoring: An Effective Strategy for Students with Emotional and Behavioral Disorders (EJ836891). Intervention in School and Clinic, v44 n5 p259-267 2009.
The unit of analysis was not students in grades K-3.
38 CT ERIC Xu, Yaoying; Gelfer, Jeffrey I.; Sileo, Nancy; Filler, John; Perkins, Peggy G. Effects of Peer Tutoring on Young Children's Social Interactions (EJ803282). Early Child Development and Care, v178 n6 p617-635 2008.
No comparison group.
39 CT ERIC Simpkins, Pamela McCrea; Mastropieri, Margo A.; Scruggs, Thomas E. Differentiated Curriculum Enhancements in Inclusive Fifth-Grade Science Classes (EJ854563). Remedial and Special Education, v30 n5 p300-308 2009.
The unit of analysis was not students in grades K-3.
40 CT ERIC Kamps, Debra M.; Greenwood, Charles; Arreaga-Mayer, Carmen; Veerkamp, Mary Baldwin; Utley, Cheryl; Tapia, Yolanda; Bowman-Perrott, Lisa; Bannister, Harriett. The Efficacy of ClassWide Peer Tutoring in Middle Schools (EJ789772).
The unit of analysis was not students in grades K-3.
41 CT ERIC Herring-Harrison, Tina J.; Gardner, Ralph; Lovelace, Temple S.Adapting Peer Tutoring for Learners Who Are Deaf or Hard of Hearing (EJ785926) Intervention in School and Clinic, v43 n2 p82-87 Nov 2007.
Not a quantitative study.
42 CT ERIC Lawson, Tracy Reilly; Trapenberg, Gabrielle. The Effects of Implementing a Classwide Peer Tutoring Model on Social Approvals and Disapprovals Emitted during Unstructured Free Time (EJ805552). Journal of Early and Intensive Behavior Intervention, v4 n2 p471-482 2007.
No comparison group.
43 CT ERIC Buzhardt, Jay; Greenwood, Charles R.; Abbott, Mary; Tapia, Yolanda. Scaling Up ClassWide Peer Tutoring: Investigating Barriers to Wide-Scale Implementation from a Distance (EJ797665). Learning Disabilities: A Contemporary Journal, v5 n2 p75-96 2007.
The unit of analysis was not students in grades K-3.
44 CT ERIC Veerkamp, Mary Baldwin; Kamps, Debra M.; Cooper, Lori. The Effects of Classwide Peer Tutoring on the Reading Achievement of Urban Middle School Students (EJ778089). Education and Treatment of Children, v30 n2 p21-51 May
The unit of analysis was not students in grades K-3.

277
2007. 45 CT ERIC McAllister, Deborah A., Ed.; Deaver, Sharon R.,
Ed. Culminating Experience Action Research Projects, Volume 10, Spring 2007 (ED500752).
The unit of analysis was not students in grades K-3.
46 CT ERIC Bowman-Perrott, Lisa J.; Greenwood, Charles R.; Tapia, Yolanda. The Efficacy of CWPT Used in Secondary Alternative School Classrooms with Small Teacher/Pupil Ratios and Students with Emotional and Behavioral Disorders (EJ778099). Education and Treatment of Children, v30 n3 p65-87 Aug 2007.
The unit of analysis was not students in grades K-3.
47 CT ERIC O'Brien, Chris. Using Collaborative Reading Groups to Accommodate Diverse Learning and Behavior Needs in the General Education Classroom (EJ840250) . Beyond Behavior, v16 n3 p7-15 Spr 2007.
Not about CWPT
48 CT ERIC Hashimoto, Kazunari; Utley, Cheryl A.; Greenwood, Charles R.; Pitchlyn, Carol L. The Effects of Modified Classwide Peer Tutoring Procedures on the Generalization of Spelling Skills of Urban Third-Grade Elementary Students (EJ797662). Learning Disabilities: A Contemporary Journal, v5 n2 p1-29 2007.
Not about CWPT implemented as intended.
49 CT ERIC Madrid, Leasher Dennis; Canas, Madeline; Ortega-Medina, Mona. Effects of Team Competition versus Team Cooperation in Classwide Peer Tutoring (EJ773775). Journal of Educational Research, v100 n3 p155-160 Jan-Feb 2007.
Not about CWPT
50 CT ERIC Hughes, Trudie A.; Fredrick, Laura D. Teaching Vocabulary with Students with Learning Disabilities Using Classwide Peer Tutoring and Constant Time Delay (EJ748125). Journal of Behavioral Education, v15 n1 p1-23 Mar 2006.
The unit of analysis was not students in grades K-3.
51 CT ERIC Abbott, Mary; Greenwood, Charles R.; Buzhardt, Jay; Tapia, Yolanda.Using Technology-Based Teacher Support Tools to Scale Up the Classwide Peer Tutoring Program (EJ721504) . Reading & Writing Quarterly, v22 n1 p47-64 Jan-Mar 2006.
Outcome variable is not reading achievement.
52 CT ERIC Maheady, Larry; Mallette, Barbara; Harper, Gregory F. Four Classwide Peer Tutoring Models: Similarities, Differences, and Implications for Research and Practice (EJ721501) . Reading & Writing Quarterly, v22 n1 p65-89 Jan-Mar 2006.
Not about CWPT
53 CT ERIC Update: Applications of Research in Music Education Yearbook. Volume 24 (ED494103)
Outcome variable is not reading achievement.
54 CT ERIC Plumer, Pamela J.; Stoner, Gary. The Relative Effects of Classwide Peer Tutoring and Peer Coaching on the Positive Social Behaviors of Children with ADHD (EJ806959). Journal of Attention Disorders, v9 n1 p290-300 2005.
No comparison group.
55 CT ERIC Buzhardt, Jay; Abbott, Mary; Greenwood, Charles; Tapia, Yolanda. Usability Testing of the ClassWide Peer Tutoring-Learning Management System (EJ729613). Journal of Special Education
The unit of analysis was not students in grades K-3.
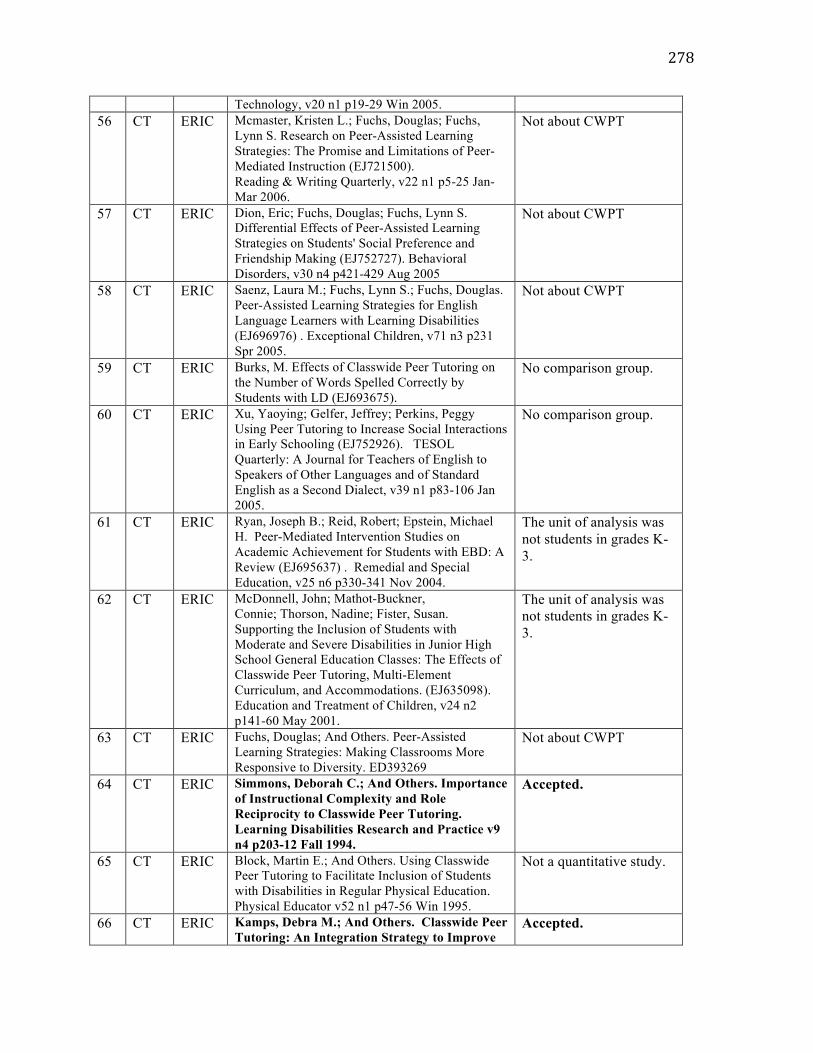
278
Technology, v20 n1 p19-29 Win 2005. 56 CT ERIC Mcmaster, Kristen L.; Fuchs, Douglas; Fuchs,
Lynn S. Research on Peer-Assisted Learning Strategies: The Promise and Limitations of Peer-Mediated Instruction (EJ721500). Reading & Writing Quarterly, v22 n1 p5-25 Jan-Mar 2006.
Not about CWPT
57 CT ERIC Dion, Eric; Fuchs, Douglas; Fuchs, Lynn S. Differential Effects of Peer-Assisted Learning Strategies on Students' Social Preference and Friendship Making (EJ752727). Behavioral Disorders, v30 n4 p421-429 Aug 2005
Not about CWPT
58 CT ERIC Saenz, Laura M.; Fuchs, Lynn S.; Fuchs, Douglas. Peer-Assisted Learning Strategies for English Language Learners with Learning Disabilities (EJ696976) . Exceptional Children, v71 n3 p231 Spr 2005.
Not about CWPT
59 CT ERIC Burks, M. Effects of Classwide Peer Tutoring on the Number of Words Spelled Correctly by Students with LD (EJ693675).
No comparison group.
60 CT ERIC Xu, Yaoying; Gelfer, Jeffrey; Perkins, Peggy Using Peer Tutoring to Increase Social Interactions in Early Schooling (EJ752926). TESOL Quarterly: A Journal for Teachers of English to Speakers of Other Languages and of Standard English as a Second Dialect, v39 n1 p83-106 Jan 2005.
No comparison group.
61 CT ERIC Ryan, Joseph B.; Reid, Robert; Epstein, Michael H. Peer-Mediated Intervention Studies on Academic Achievement for Students with EBD: A Review (EJ695637) . Remedial and Special Education, v25 n6 p330-341 Nov 2004.
The unit of analysis was not students in grades K-3.
62 CT ERIC McDonnell, John; Mathot-Buckner, Connie; Thorson, Nadine; Fister, Susan. Supporting the Inclusion of Students with Moderate and Severe Disabilities in Junior High School General Education Classes: The Effects of Classwide Peer Tutoring, Multi-Element Curriculum, and Accommodations. (EJ635098). Education and Treatment of Children, v24 n2 p141-60 May 2001.
The unit of analysis was not students in grades K-3.
63 CT ERIC Fuchs, Douglas; And Others. Peer-Assisted Learning Strategies: Making Classrooms More Responsive to Diversity. ED393269
Not about CWPT
64 CT ERIC Simmons, Deborah C.; And Others. Importance of Instructional Complexity and Role Reciprocity to Classwide Peer Tutoring. Learning Disabilities Research and Practice v9 n4 p203-12 Fall 1994.
Accepted.
65 CT ERIC Block, Martin E.; And Others. Using Classwide Peer Tutoring to Facilitate Inclusion of Students with Disabilities in Regular Physical Education. Physical Educator v52 n1 p47-56 Win 1995.
Not a quantitative study.
66 CT ERIC Kamps, Debra M.; And Others. Classwide Peer Tutoring: An Integration Strategy to Improve
Accepted.

279
Reading Skills and Promote Peer Interactions among Students with Autism and General Education Peers. Journal of Applied Behavior Analysis v27 n1 p49-61 Spr 1994.
67 CT ERIC King-Sears, Margaret E.; Bradley, Dianne F. ClassWide Peer Tutoring: Heterogeneous Instruction in General Education Classrooms. Preventing School Failure v40 n1 p29-35 Fall 1995.
No comparison group.
68 CT ERIC Maheady, Larry; And Others. Training and Implementation Requirements Associated with the Use of a Classwide Peer Tutoring System. Education and Treatment of Children v14 n3 p177-98 Aug 1991.
The unit of analysis was not students in grades K-3.
69 CT ERIC McLaughlin, T. F.; Vacha, Edward F. School Programs for At-Risk Children and Youth: A Review. Education and Treatment of Children v15 n3 p255-67 Aug 1992.
Not a quantitative study.
70 CT ERIC Warger, Cynthia L. Peer Tutoring: When Working Together Is Better Than Working Alone. Research & Resources on Special Education, Number 30. http://www.eric.ed.gov/ERICWebPortal/contentdelivery/servlet/ERICServlet?accno=ED345459.
Not a quantitative study.
71 CT ERIC Greenwood, Charles R.; And Others. Achievement, Placement, and Services: Middle School Benefits of Classwide Peer Tutoring Used at the Elementary School. School Psychology Review v22 n3 p497-516 1993.
Accepted.
72 CT ERIC Denton, Carolyn A.; Hasbrouck, Jan E. "Supported Passage Reading" from Teaching Students with Disabilities To Read. PEER Literacy Resource Brief #4. PEER Project Literacy Series. http://www.eric.ed.gov/ERICWebPortal/contentdelivery/servlet/ERICServlet?accno=ED454632.
Not a quantitative study.
73 CT ERIC Reddy, Shalini S.; Utley, Cheryl A.; Delquadri, Joseph C.; Mortweet, Susan L.; Greenwood, Charles R.; Bowman, Velma. Peer Tutoring for Health and Safety. TEACHING Exceptional Children v31 n3 p44-52 Jan-Feb 1999.
Outcome variable is not reading achievement.
74 CT ERIC Bell, Kenneth; And Others. Facilitating Mainstreaming of Students with Behavioral Disorders Using Classwide Peer Tutoring. School Psychology Review v19 n4 p564-73 1990.
Unit of analysis is not students in grades K-3.
75 CT ERIC Gensemer, Patricia. Effectiveness of Cross-Age and Peer Mentoring Programs. http://www.eric.ed.gov/ERICWebPortal/contentdelivery/servlet/ERICServlet?accno=ED438267
Not about CWPT.
76 CT ERIC Somos Todos Ayudantes y Estudiantes: A Demonstration of a Classwide Peer Tutoring Program in a Modified Spanish Class for Secondary Students Identified as Learning Disabled or Academically At-Risk. EJ503006 Education and Treatment of Children v18 n1 p33-52 Feb 1995
Unit of analysis is not students in grades K-3.
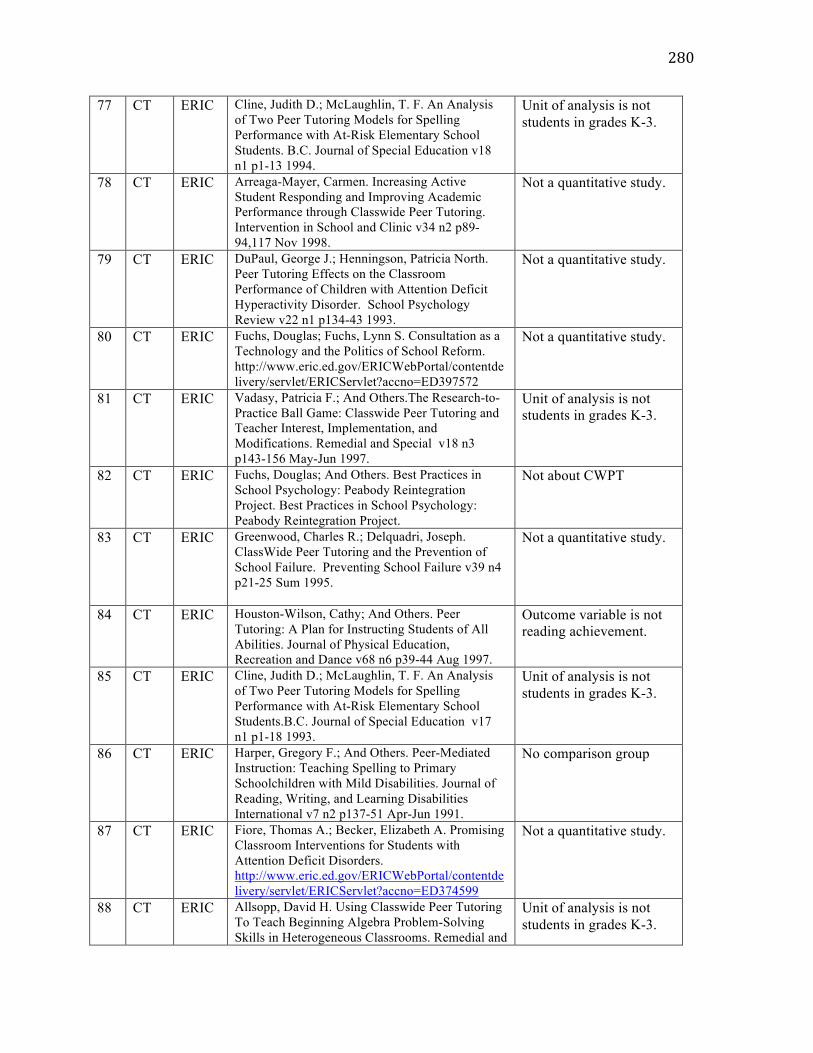
280
77 CT ERIC Cline, Judith D.; McLaughlin, T. F. An Analysis of Two Peer Tutoring Models for Spelling Performance with At-Risk Elementary School Students. B.C. Journal of Special Education v18 n1 p1-13 1994.
Unit of analysis is not students in grades K-3.
78 CT ERIC Arreaga-Mayer, Carmen. Increasing Active Student Responding and Improving Academic Performance through Classwide Peer Tutoring. Intervention in School and Clinic v34 n2 p89-94,117 Nov 1998.
Not a quantitative study.
79 CT ERIC DuPaul, George J.; Henningson, Patricia North. Peer Tutoring Effects on the Classroom Performance of Children with Attention Deficit Hyperactivity Disorder. School Psychology Review v22 n1 p134-43 1993.
Not a quantitative study.
80 CT ERIC Fuchs, Douglas; Fuchs, Lynn S. Consultation as a Technology and the Politics of School Reform. http://www.eric.ed.gov/ERICWebPortal/contentdelivery/servlet/ERICServlet?accno=ED397572
Not a quantitative study.
81 CT ERIC Vadasy, Patricia F.; And Others.The Research-to-Practice Ball Game: Classwide Peer Tutoring and Teacher Interest, Implementation, and Modifications. Remedial and Special v18 n3 p143-156 May-Jun 1997.
Unit of analysis is not students in grades K-3.
82 CT ERIC Fuchs, Douglas; And Others. Best Practices in School Psychology: Peabody Reintegration Project. Best Practices in School Psychology: Peabody Reintegration Project.
Not about CWPT
83 CT ERIC Greenwood, Charles R.; Delquadri, Joseph. ClassWide Peer Tutoring and the Prevention of School Failure. Preventing School Failure v39 n4 p21-25 Sum 1995.
Not a quantitative study.
84 CT ERIC Houston-Wilson, Cathy; And Others. Peer Tutoring: A Plan for Instructing Students of All Abilities. Journal of Physical Education, Recreation and Dance v68 n6 p39-44 Aug 1997.
Outcome variable is not reading achievement.
85 CT ERIC Cline, Judith D.; McLaughlin, T. F. An Analysis of Two Peer Tutoring Models for Spelling Performance with At-Risk Elementary School Students.B.C. Journal of Special Education v17 n1 p1-18 1993.
Unit of analysis is not students in grades K-3.
86 CT ERIC Harper, Gregory F.; And Others. Peer-Mediated Instruction: Teaching Spelling to Primary Schoolchildren with Mild Disabilities. Journal of Reading, Writing, and Learning Disabilities International v7 n2 p137-51 Apr-Jun 1991.
No comparison group
87 CT ERIC Fiore, Thomas A.; Becker, Elizabeth A. Promising Classroom Interventions for Students with Attention Deficit Disorders. http://www.eric.ed.gov/ERICWebPortal/contentdelivery/servlet/ERICServlet?accno=ED374599
Not a quantitative study.
88 CT ERIC Allsopp, David H. Using Classwide Peer Tutoring To Teach Beginning Algebra Problem-Solving Skills in Heterogeneous Classrooms. Remedial and
Unit of analysis is not students in grades K-3.
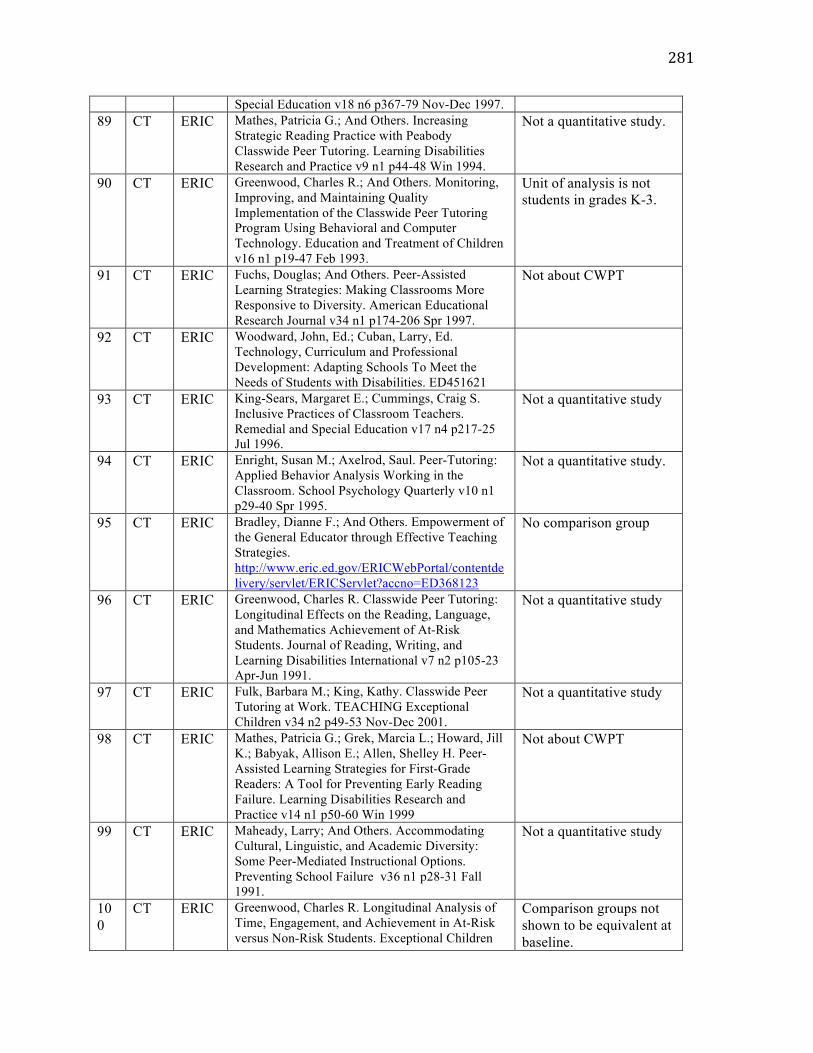
281
Special Education v18 n6 p367-79 Nov-Dec 1997. 89 CT ERIC Mathes, Patricia G.; And Others. Increasing
Strategic Reading Practice with Peabody Classwide Peer Tutoring. Learning Disabilities Research and Practice v9 n1 p44-48 Win 1994.
Not a quantitative study.
90 CT ERIC Greenwood, Charles R.; And Others. Monitoring, Improving, and Maintaining Quality Implementation of the Classwide Peer Tutoring Program Using Behavioral and Computer Technology. Education and Treatment of Children v16 n1 p19-47 Feb 1993.
Unit of analysis is not students in grades K-3.
91 CT ERIC Fuchs, Douglas; And Others. Peer-Assisted Learning Strategies: Making Classrooms More Responsive to Diversity. American Educational Research Journal v34 n1 p174-206 Spr 1997.
Not about CWPT
92 CT ERIC Woodward, John, Ed.; Cuban, Larry, Ed. Technology, Curriculum and Professional Development: Adapting Schools To Meet the Needs of Students with Disabilities. ED451621
93 CT ERIC King-Sears, Margaret E.; Cummings, Craig S. Inclusive Practices of Classroom Teachers. Remedial and Special Education v17 n4 p217-25 Jul 1996.
Not a quantitative study
94 CT ERIC Enright, Susan M.; Axelrod, Saul. Peer-Tutoring: Applied Behavior Analysis Working in the Classroom. School Psychology Quarterly v10 n1 p29-40 Spr 1995.
Not a quantitative study.
95 CT ERIC Bradley, Dianne F.; And Others. Empowerment of the General Educator through Effective Teaching Strategies. http://www.eric.ed.gov/ERICWebPortal/contentdelivery/servlet/ERICServlet?accno=ED368123
No comparison group
96 CT ERIC Greenwood, Charles R. Classwide Peer Tutoring: Longitudinal Effects on the Reading, Language, and Mathematics Achievement of At-Risk Students. Journal of Reading, Writing, and Learning Disabilities International v7 n2 p105-23 Apr-Jun 1991.
Not a quantitative study
97 CT ERIC Fulk, Barbara M.; King, Kathy. Classwide Peer Tutoring at Work. TEACHING Exceptional Children v34 n2 p49-53 Nov-Dec 2001.
Not a quantitative study
98 CT ERIC Mathes, Patricia G.; Grek, Marcia L.; Howard, Jill K.; Babyak, Allison E.; Allen, Shelley H. Peer-Assisted Learning Strategies for First-Grade Readers: A Tool for Preventing Early Reading Failure. Learning Disabilities Research and Practice v14 n1 p50-60 Win 1999
Not about CWPT
99 CT ERIC Maheady, Larry; And Others. Accommodating Cultural, Linguistic, and Academic Diversity: Some Peer-Mediated Instructional Options. Preventing School Failure v36 n1 p28-31 Fall 1991.
Not a quantitative study
100
CT ERIC Greenwood, Charles R. Longitudinal Analysis of Time, Engagement, and Achievement in At-Risk versus Non-Risk Students. Exceptional Children
Comparison groups not shown to be equivalent at baseline.
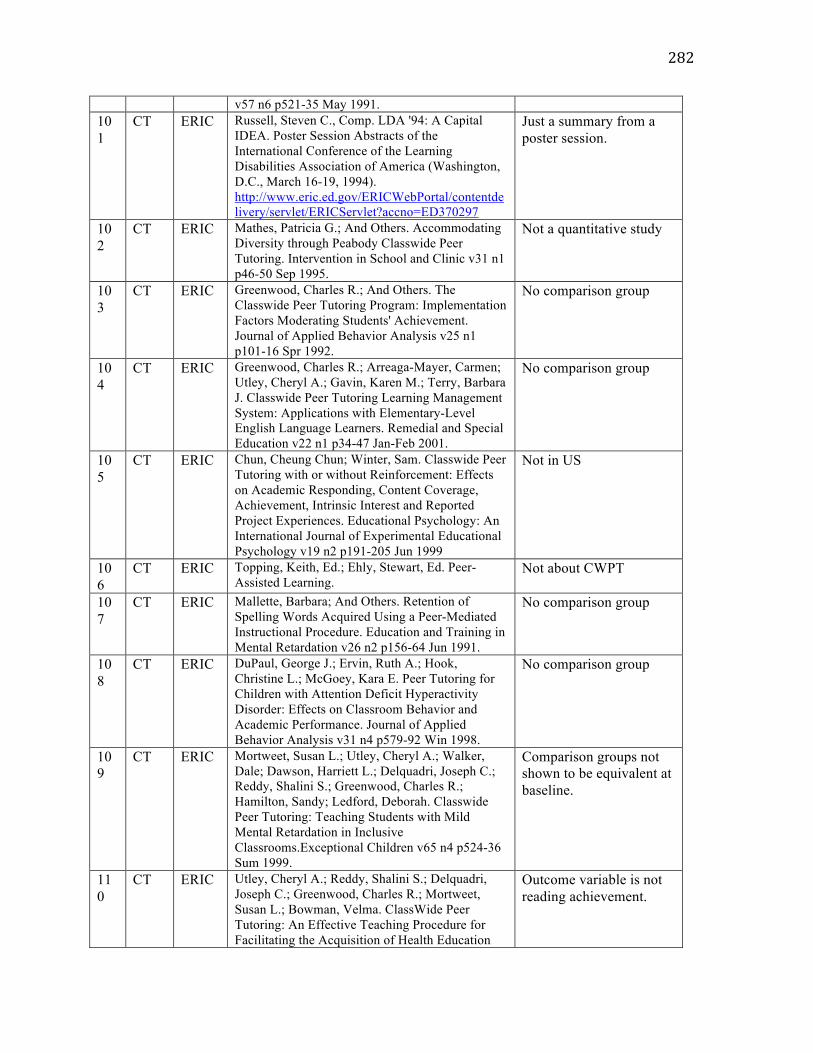
282
v57 n6 p521-35 May 1991. 101
CT ERIC Russell, Steven C., Comp. LDA '94: A Capital IDEA. Poster Session Abstracts of the International Conference of the Learning Disabilities Association of America (Washington, D.C., March 16-19, 1994). http://www.eric.ed.gov/ERICWebPortal/contentdelivery/servlet/ERICServlet?accno=ED370297
Just a summary from a poster session.
102
CT ERIC Mathes, Patricia G.; And Others. Accommodating Diversity through Peabody Classwide Peer Tutoring. Intervention in School and Clinic v31 n1 p46-50 Sep 1995.
Not a quantitative study
103
CT ERIC Greenwood, Charles R.; And Others. The Classwide Peer Tutoring Program: Implementation Factors Moderating Students' Achievement. Journal of Applied Behavior Analysis v25 n1 p101-16 Spr 1992.
No comparison group
104
CT ERIC Greenwood, Charles R.; Arreaga-Mayer, Carmen; Utley, Cheryl A.; Gavin, Karen M.; Terry, Barbara J. Classwide Peer Tutoring Learning Management System: Applications with Elementary-Level English Language Learners. Remedial and Special Education v22 n1 p34-47 Jan-Feb 2001.
No comparison group
105
CT ERIC Chun, Cheung Chun; Winter, Sam. Classwide Peer Tutoring with or without Reinforcement: Effects on Academic Responding, Content Coverage, Achievement, Intrinsic Interest and Reported Project Experiences. Educational Psychology: An International Journal of Experimental Educational Psychology v19 n2 p191-205 Jun 1999
Not in US
106
CT ERIC Topping, Keith, Ed.; Ehly, Stewart, Ed. Peer-Assisted Learning.
Not about CWPT
107
CT ERIC Mallette, Barbara; And Others. Retention of Spelling Words Acquired Using a Peer-Mediated Instructional Procedure. Education and Training in Mental Retardation v26 n2 p156-64 Jun 1991.
No comparison group
108
CT ERIC DuPaul, George J.; Ervin, Ruth A.; Hook, Christine L.; McGoey, Kara E. Peer Tutoring for Children with Attention Deficit Hyperactivity Disorder: Effects on Classroom Behavior and Academic Performance. Journal of Applied Behavior Analysis v31 n4 p579-92 Win 1998.
No comparison group
109
CT ERIC Mortweet, Susan L.; Utley, Cheryl A.; Walker, Dale; Dawson, Harriett L.; Delquadri, Joseph C.; Reddy, Shalini S.; Greenwood, Charles R.; Hamilton, Sandy; Ledford, Deborah. Classwide Peer Tutoring: Teaching Students with Mild Mental Retardation in Inclusive Classrooms.Exceptional Children v65 n4 p524-36 Sum 1999.
Comparison groups not shown to be equivalent at baseline.
110
CT ERIC Utley, Cheryl A.; Reddy, Shalini S.; Delquadri, Joseph C.; Greenwood, Charles R.; Mortweet, Susan L.; Bowman, Velma. ClassWide Peer Tutoring: An Effective Teaching Procedure for Facilitating the Acquisition of Health Education
Outcome variable is not reading achievement.
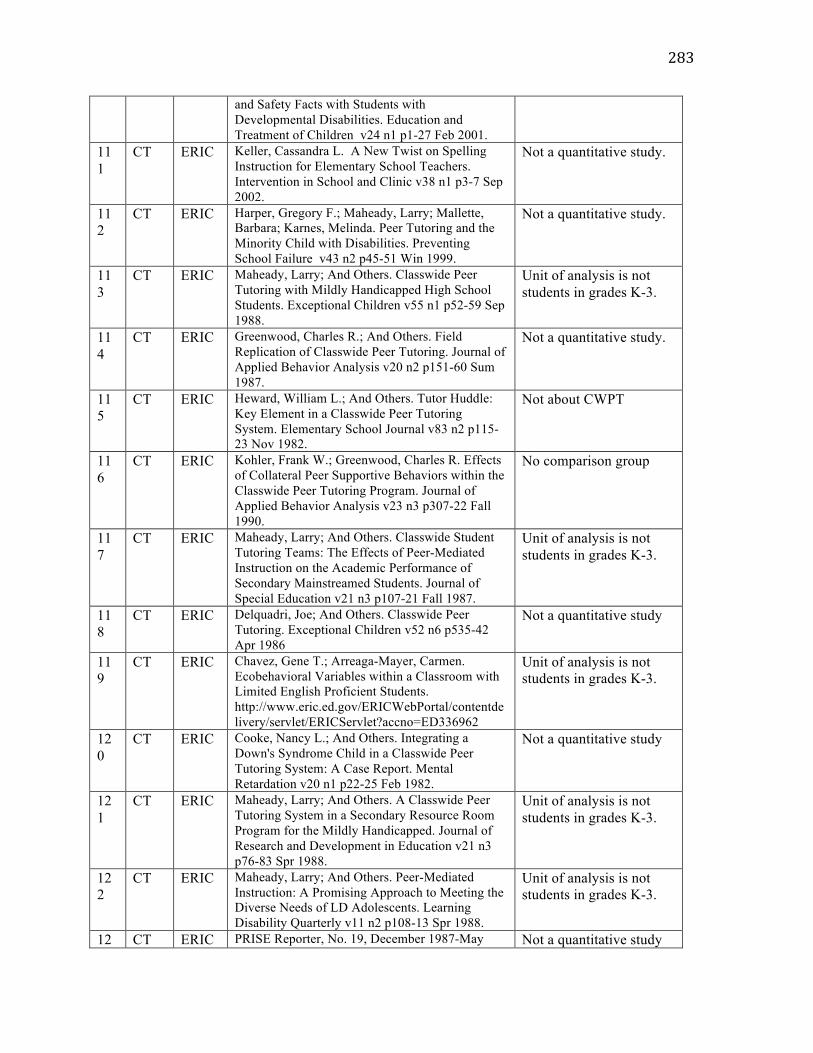
283
and Safety Facts with Students with Developmental Disabilities. Education and Treatment of Children v24 n1 p1-27 Feb 2001.
111
CT ERIC Keller, Cassandra L. A New Twist on Spelling Instruction for Elementary School Teachers. Intervention in School and Clinic v38 n1 p3-7 Sep 2002.
Not a quantitative study.
112
CT ERIC Harper, Gregory F.; Maheady, Larry; Mallette, Barbara; Karnes, Melinda. Peer Tutoring and the Minority Child with Disabilities. Preventing School Failure v43 n2 p45-51 Win 1999.
Not a quantitative study.
113
CT ERIC Maheady, Larry; And Others. Classwide Peer Tutoring with Mildly Handicapped High School Students. Exceptional Children v55 n1 p52-59 Sep 1988.
Unit of analysis is not students in grades K-3.
114
CT ERIC Greenwood, Charles R.; And Others. Field Replication of Classwide Peer Tutoring. Journal of Applied Behavior Analysis v20 n2 p151-60 Sum 1987.
Not a quantitative study.
115
CT ERIC Heward, William L.; And Others. Tutor Huddle: Key Element in a Classwide Peer Tutoring System. Elementary School Journal v83 n2 p115-23 Nov 1982.
Not about CWPT
116
CT ERIC Kohler, Frank W.; Greenwood, Charles R. Effects of Collateral Peer Supportive Behaviors within the Classwide Peer Tutoring Program. Journal of Applied Behavior Analysis v23 n3 p307-22 Fall 1990.
No comparison group
117
CT ERIC Maheady, Larry; And Others. Classwide Student Tutoring Teams: The Effects of Peer-Mediated Instruction on the Academic Performance of Secondary Mainstreamed Students. Journal of Special Education v21 n3 p107-21 Fall 1987.
Unit of analysis is not students in grades K-3.
118
CT ERIC Delquadri, Joe; And Others. Classwide Peer Tutoring. Exceptional Children v52 n6 p535-42 Apr 1986
Not a quantitative study
119
CT ERIC Chavez, Gene T.; Arreaga-Mayer, Carmen. Ecobehavioral Variables within a Classroom with Limited English Proficient Students. http://www.eric.ed.gov/ERICWebPortal/contentdelivery/servlet/ERICServlet?accno=ED336962
Unit of analysis is not students in grades K-3.
120
CT ERIC Cooke, Nancy L.; And Others. Integrating a Down's Syndrome Child in a Classwide Peer Tutoring System: A Case Report. Mental Retardation v20 n1 p22-25 Feb 1982.
Not a quantitative study
121
CT ERIC Maheady, Larry; And Others. A Classwide Peer Tutoring System in a Secondary Resource Room Program for the Mildly Handicapped. Journal of Research and Development in Education v21 n3 p76-83 Spr 1988.
Unit of analysis is not students in grades K-3.
122
CT ERIC Maheady, Larry; And Others. Peer-Mediated Instruction: A Promising Approach to Meeting the Diverse Needs of LD Adolescents. Learning Disability Quarterly v11 n2 p108-13 Spr 1988.
Unit of analysis is not students in grades K-3.
12 CT ERIC PRISE Reporter, No. 19, December 1987-May Not a quantitative study
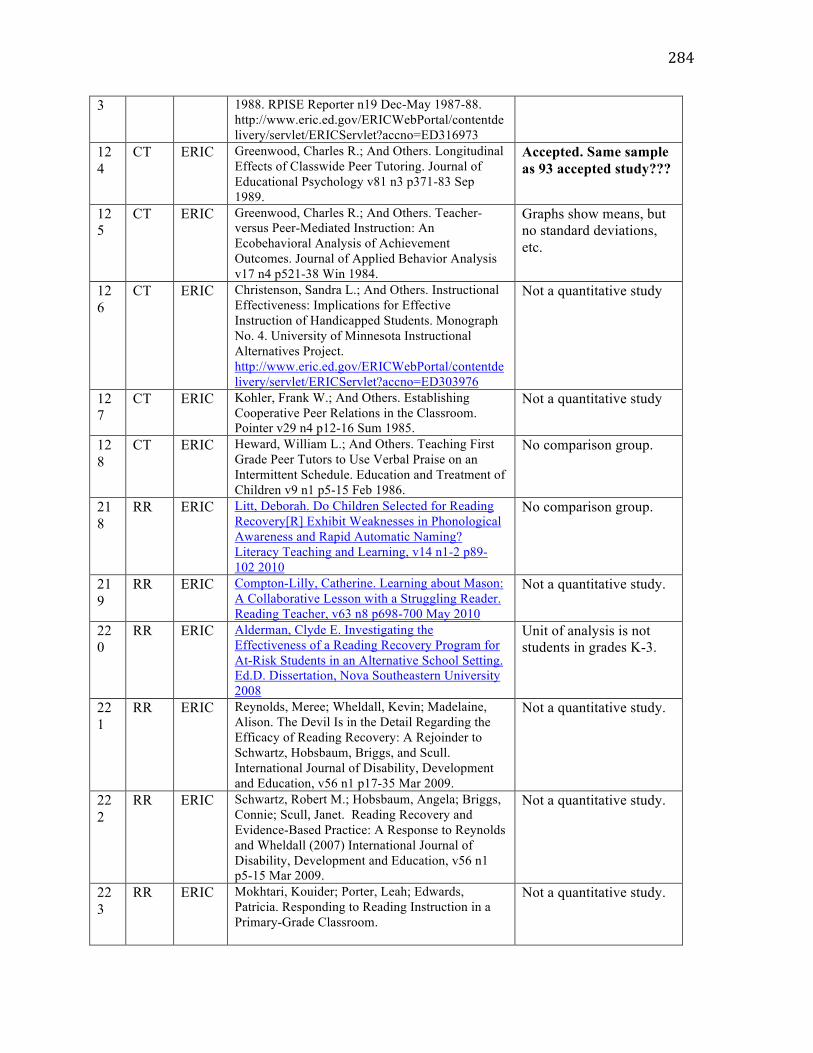
284
3 1988. RPISE Reporter n19 Dec-May 1987-88. http://www.eric.ed.gov/ERICWebPortal/contentdelivery/servlet/ERICServlet?accno=ED316973
124
CT ERIC Greenwood, Charles R.; And Others. Longitudinal Effects of Classwide Peer Tutoring. Journal of Educational Psychology v81 n3 p371-83 Sep 1989.
Accepted. Same sample as 93 accepted study???
125
CT ERIC Greenwood, Charles R.; And Others. Teacher- versus Peer-Mediated Instruction: An Ecobehavioral Analysis of Achievement Outcomes. Journal of Applied Behavior Analysis v17 n4 p521-38 Win 1984.
Graphs show means, but no standard deviations, etc.
126
CT ERIC Christenson, Sandra L.; And Others. Instructional Effectiveness: Implications for Effective Instruction of Handicapped Students. Monograph No. 4. University of Minnesota Instructional Alternatives Project. http://www.eric.ed.gov/ERICWebPortal/contentdelivery/servlet/ERICServlet?accno=ED303976
Not a quantitative study
127
CT ERIC Kohler, Frank W.; And Others. Establishing Cooperative Peer Relations in the Classroom. Pointer v29 n4 p12-16 Sum 1985.
Not a quantitative study
128
CT ERIC Heward, William L.; And Others. Teaching First Grade Peer Tutors to Use Verbal Praise on an Intermittent Schedule. Education and Treatment of Children v9 n1 p5-15 Feb 1986.
No comparison group.
218
RR ERIC Litt, Deborah. Do Children Selected for Reading Recovery[R] Exhibit Weaknesses in Phonological Awareness and Rapid Automatic Naming? Literacy Teaching and Learning, v14 n1-2 p89-102 2010
No comparison group.
219
RR ERIC Compton-Lilly, Catherine. Learning about Mason: A Collaborative Lesson with a Struggling Reader. Reading Teacher, v63 n8 p698-700 May 2010
Not a quantitative study.
220
RR ERIC Alderman, Clyde E. Investigating the Effectiveness of a Reading Recovery Program for At-Risk Students in an Alternative School Setting. Ed.D. Dissertation, Nova Southeastern University 2008
Unit of analysis is not students in grades K-3.
221
RR ERIC Reynolds, Meree; Wheldall, Kevin; Madelaine, Alison. The Devil Is in the Detail Regarding the Efficacy of Reading Recovery: A Rejoinder to Schwartz, Hobsbaum, Briggs, and Scull. International Journal of Disability, Development and Education, v56 n1 p17-35 Mar 2009.
Not a quantitative study.
222
RR ERIC Schwartz, Robert M.; Hobsbaum, Angela; Briggs, Connie; Scull, Janet. Reading Recovery and Evidence-Based Practice: A Response to Reynolds and Wheldall (2007) International Journal of Disability, Development and Education, v56 n1 p5-15 Mar 2009.
Not a quantitative study.
223
RR ERIC Mokhtari, Kouider; Porter, Leah; Edwards, Patricia. Responding to Reading Instruction in a Primary-Grade Classroom.
Not a quantitative study.
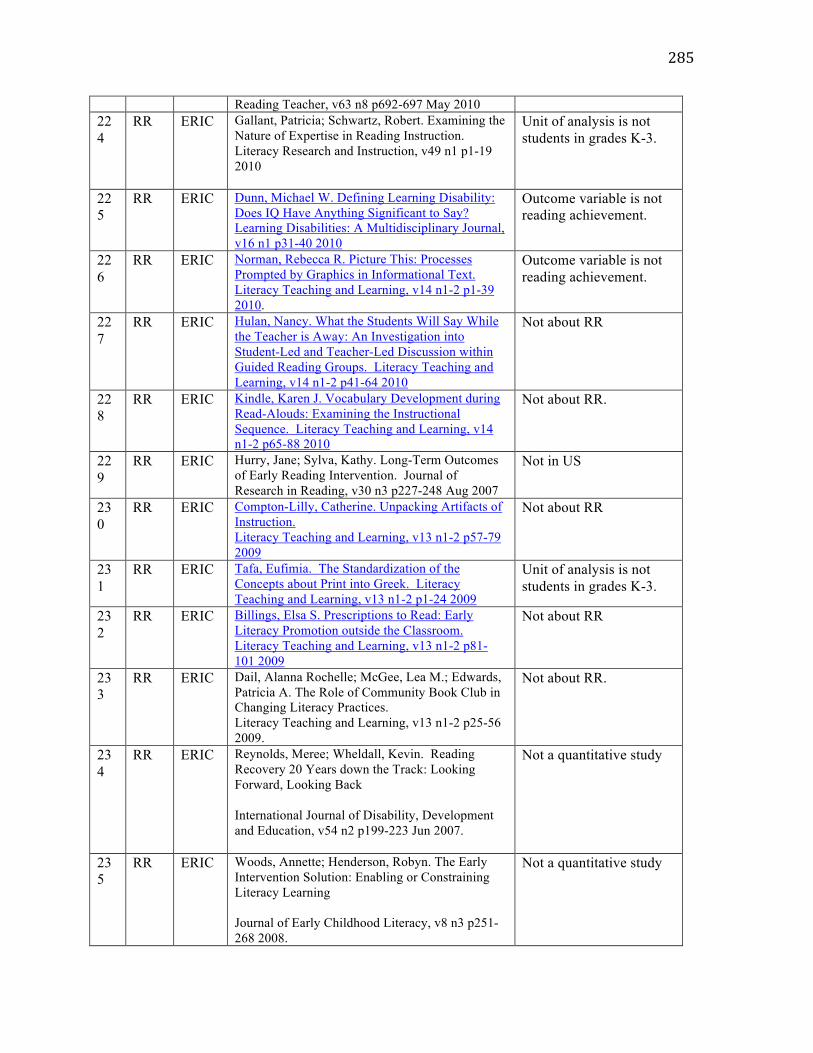
285
Reading Teacher, v63 n8 p692-697 May 2010 224
RR ERIC Gallant, Patricia; Schwartz, Robert. Examining the Nature of Expertise in Reading Instruction. Literacy Research and Instruction, v49 n1 p1-19 2010
Unit of analysis is not students in grades K-3.
225
RR ERIC Dunn, Michael W. Defining Learning Disability: Does IQ Have Anything Significant to Say? Learning Disabilities: A Multidisciplinary Journal, v16 n1 p31-40 2010
Outcome variable is not reading achievement.
226
RR ERIC Norman, Rebecca R. Picture This: Processes Prompted by Graphics in Informational Text. Literacy Teaching and Learning, v14 n1-2 p1-39 2010.
Outcome variable is not reading achievement.
227
RR ERIC Hulan, Nancy. What the Students Will Say While the Teacher is Away: An Investigation into Student-Led and Teacher-Led Discussion within Guided Reading Groups. Literacy Teaching and Learning, v14 n1-2 p41-64 2010
Not about RR
228
RR ERIC Kindle, Karen J. Vocabulary Development during Read-Alouds: Examining the Instructional Sequence. Literacy Teaching and Learning, v14 n1-2 p65-88 2010
Not about RR.
229
RR ERIC Hurry, Jane; Sylva, Kathy. Long-Term Outcomes of Early Reading Intervention. Journal of Research in Reading, v30 n3 p227-248 Aug 2007
Not in US
230
RR ERIC Compton-Lilly, Catherine. Unpacking Artifacts of Instruction. Literacy Teaching and Learning, v13 n1-2 p57-79 2009
Not about RR
231
RR ERIC Tafa, Eufimia. The Standardization of the Concepts about Print into Greek. Literacy Teaching and Learning, v13 n1-2 p1-24 2009
Unit of analysis is not students in grades K-3.
232
RR ERIC Billings, Elsa S. Prescriptions to Read: Early Literacy Promotion outside the Classroom. Literacy Teaching and Learning, v13 n1-2 p81-101 2009
Not about RR
233
RR ERIC Dail, Alanna Rochelle; McGee, Lea M.; Edwards, Patricia A. The Role of Community Book Club in Changing Literacy Practices. Literacy Teaching and Learning, v13 n1-2 p25-56 2009.
Not about RR.
234
RR ERIC Reynolds, Meree; Wheldall, Kevin. Reading Recovery 20 Years down the Track: Looking Forward, Looking Back International Journal of Disability, Development and Education, v54 n2 p199-223 Jun 2007.
Not a quantitative study
235
RR ERIC Woods, Annette; Henderson, Robyn. The Early Intervention Solution: Enabling or Constraining Literacy Learning Journal of Early Childhood Literacy, v8 n3 p251-268 2008.
Not a quantitative study
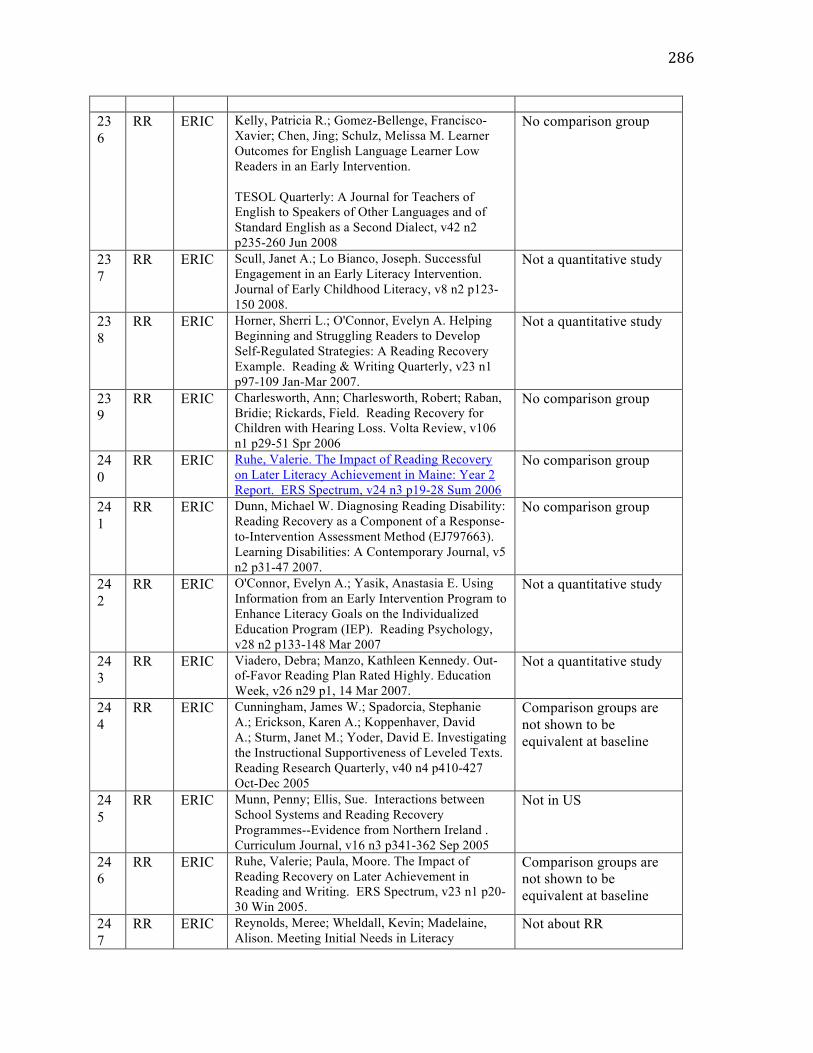
286
236
RR ERIC Kelly, Patricia R.; Gomez-Bellenge, Francisco-Xavier; Chen, Jing; Schulz, Melissa M. Learner Outcomes for English Language Learner Low Readers in an Early Intervention. TESOL Quarterly: A Journal for Teachers of English to Speakers of Other Languages and of Standard English as a Second Dialect, v42 n2 p235-260 Jun 2008
No comparison group
237
RR ERIC Scull, Janet A.; Lo Bianco, Joseph. Successful Engagement in an Early Literacy Intervention. Journal of Early Childhood Literacy, v8 n2 p123-150 2008.
Not a quantitative study
238
RR ERIC Horner, Sherri L.; O'Connor, Evelyn A. Helping Beginning and Struggling Readers to Develop Self-Regulated Strategies: A Reading Recovery Example. Reading & Writing Quarterly, v23 n1 p97-109 Jan-Mar 2007.
Not a quantitative study
239
RR ERIC Charlesworth, Ann; Charlesworth, Robert; Raban, Bridie; Rickards, Field. Reading Recovery for Children with Hearing Loss. Volta Review, v106 n1 p29-51 Spr 2006
No comparison group
240
RR ERIC Ruhe, Valerie. The Impact of Reading Recovery on Later Literacy Achievement in Maine: Year 2 Report. ERS Spectrum, v24 n3 p19-28 Sum 2006
No comparison group
241
RR ERIC Dunn, Michael W. Diagnosing Reading Disability: Reading Recovery as a Component of a Response-to-Intervention Assessment Method (EJ797663). Learning Disabilities: A Contemporary Journal, v5 n2 p31-47 2007.
No comparison group
242
RR ERIC O'Connor, Evelyn A.; Yasik, Anastasia E. Using Information from an Early Intervention Program to Enhance Literacy Goals on the Individualized Education Program (IEP). Reading Psychology, v28 n2 p133-148 Mar 2007
Not a quantitative study
243
RR ERIC Viadero, Debra; Manzo, Kathleen Kennedy. Out-of-Favor Reading Plan Rated Highly. Education Week, v26 n29 p1, 14 Mar 2007.
Not a quantitative study
244
RR ERIC Cunningham, James W.; Spadorcia, Stephanie A.; Erickson, Karen A.; Koppenhaver, David A.; Sturm, Janet M.; Yoder, David E. Investigating the Instructional Supportiveness of Leveled Texts. Reading Research Quarterly, v40 n4 p410-427 Oct-Dec 2005
Comparison groups are not shown to be equivalent at baseline
245
RR ERIC Munn, Penny; Ellis, Sue. Interactions between School Systems and Reading Recovery Programmes--Evidence from Northern Ireland . Curriculum Journal, v16 n3 p341-362 Sep 2005
Not in US
246
RR ERIC Ruhe, Valerie; Paula, Moore. The Impact of Reading Recovery on Later Achievement in Reading and Writing. ERS Spectrum, v23 n1 p20-30 Win 2005.
Comparison groups are not shown to be equivalent at baseline
247
RR ERIC Reynolds, Meree; Wheldall, Kevin; Madelaine, Alison. Meeting Initial Needs in Literacy
Not about RR
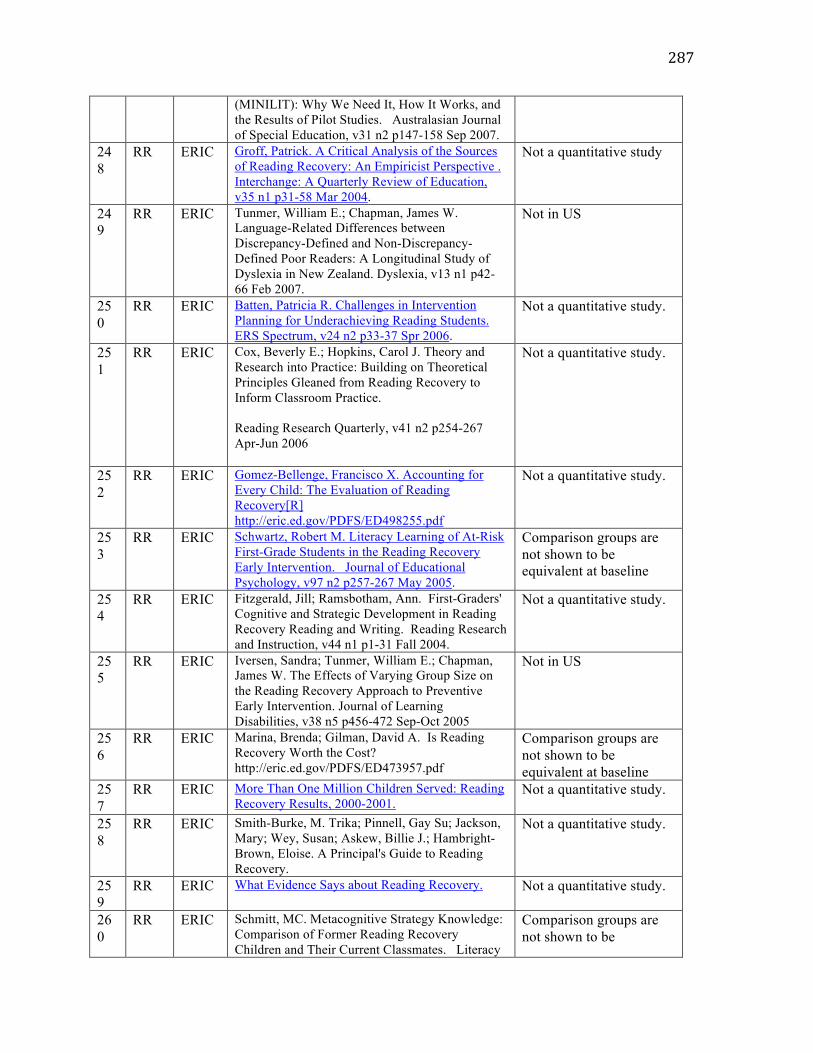
287
(MINILIT): Why We Need It, How It Works, and the Results of Pilot Studies. Australasian Journal of Special Education, v31 n2 p147-158 Sep 2007.
248
RR ERIC Groff, Patrick. A Critical Analysis of the Sources of Reading Recovery: An Empiricist Perspective . Interchange: A Quarterly Review of Education, v35 n1 p31-58 Mar 2004.
Not a quantitative study
249
RR ERIC Tunmer, William E.; Chapman, James W. Language-Related Differences between Discrepancy-Defined and Non-Discrepancy-Defined Poor Readers: A Longitudinal Study of Dyslexia in New Zealand. Dyslexia, v13 n1 p42-66 Feb 2007.
Not in US
250
RR ERIC Batten, Patricia R. Challenges in Intervention Planning for Underachieving Reading Students. ERS Spectrum, v24 n2 p33-37 Spr 2006.
Not a quantitative study.
251
RR ERIC Cox, Beverly E.; Hopkins, Carol J. Theory and Research into Practice: Building on Theoretical Principles Gleaned from Reading Recovery to Inform Classroom Practice. Reading Research Quarterly, v41 n2 p254-267 Apr-Jun 2006
Not a quantitative study.
252
RR ERIC Gomez-Bellenge, Francisco X. Accounting for Every Child: The Evaluation of Reading Recovery[R] http://eric.ed.gov/PDFS/ED498255.pdf
Not a quantitative study.
253
RR ERIC Schwartz, Robert M. Literacy Learning of At-Risk First-Grade Students in the Reading Recovery Early Intervention. Journal of Educational Psychology, v97 n2 p257-267 May 2005.
Comparison groups are not shown to be equivalent at baseline
254
RR ERIC Fitzgerald, Jill; Ramsbotham, Ann. First-Graders' Cognitive and Strategic Development in Reading Recovery Reading and Writing. Reading Research and Instruction, v44 n1 p1-31 Fall 2004.
Not a quantitative study.
255
RR ERIC Iversen, Sandra; Tunmer, William E.; Chapman, James W. The Effects of Varying Group Size on the Reading Recovery Approach to Preventive Early Intervention. Journal of Learning Disabilities, v38 n5 p456-472 Sep-Oct 2005
Not in US
256
RR ERIC Marina, Brenda; Gilman, David A. Is Reading Recovery Worth the Cost? http://eric.ed.gov/PDFS/ED473957.pdf
Comparison groups are not shown to be equivalent at baseline
257
RR ERIC More Than One Million Children Served: Reading Recovery Results, 2000-2001.
Not a quantitative study.
258
RR ERIC Smith-Burke, M. Trika; Pinnell, Gay Su; Jackson, Mary; Wey, Susan; Askew, Billie J.; Hambright-Brown, Eloise. A Principal's Guide to Reading Recovery.
Not a quantitative study.
259
RR ERIC What Evidence Says about Reading Recovery. Not a quantitative study.
260
RR ERIC Schmitt, MC. Metacognitive Strategy Knowledge: Comparison of Former Reading Recovery Children and Their Current Classmates. Literacy
Comparison groups are not shown to be

288
Teaching and Learning: An International Journal of Early Reading and Writing, v7 n1-2 2003.
equivalent at baseline
261
RR ERIC King, Caryn M.; Jonson, Kathleen; Whitehead, David; Reinken, Barbara J. Glimpses of Literacy Education in New Zealand.
Not in US
262
RR ERIC Haenn, Joseph F. A Longitudinal Evaluation of the Long-Term Effects of a Reading Recovery Program. A Longitudinal Evaluation of the Long-Term Effects of a Reading Recovery Program.
Comparison groups are not shown to be equivalent at baseline
263
RR ERIC D'Agostino, Jerome V.; Murphy, Judith A. A Meta-Analysis of Reading Recovery in United States Schools. Educational Evaluation and Policy Analysis, v26 n1 p23-38 Spr 2004.
Unit of analysis is not students in grades K-3.
264
RR ERIC Wearmouth, Janice. Addressing Individual Difficulties in Reading: Issues Relating to Reading Recovery and Pause, Prompt, Praise. Literacy, v38 n1 p3-9 Apr 2004
Not in US
265
RR ERIC Tunmer, William E.; Chapman, James W. The Reading Recovery Approach to Preventive Early Intervention: As Good As It Gets? Reading Psychology, v24 n3-4 p337-60 Oct-Dec 2003.
Not a quantitative study
266
RR ERIC Lose, Mary K. Complementary and Comprehensive: Reading Recovery and Michigan's Reading First Plan. Michigan Reading Journal, v35 n4 p43-51 Sum 2003
Not a quantitative study
267
RR ERIC Wilson-Bridgman, J. Curricular Congruence at an Implementation Level: Are Two Interventions of a District's Early Literacy Project (Improved Classroom Instruction and Reading Recovery) Working Congruently To Address the Needs of Low-Achieving Readers? http://eric.ed.gov/PDFS/ED478118.pdf
Not a quantitative study
268
RR ERIC Miles, Pamela A.; Stegle, Kathy W.; Hubbs, Karen G.; Henk, William A.; Mallette, Marla H. A Whole-Class Support Model for Early Literacy: The Anna Plan. Reading Teacher, v58 n4 p318-327 Dec 2004
Not about RR
269
RR ERIC Lysy, Daria C.; Moore, Paula F.; Bamford, Rosemary A. Maine Reading Recovery[R]: State Report & Evaluation, 1998-2000. http://eric.ed.gov/PDFS/ED458522.pdf
Comparison groups are not shown to be equivalent at baseline.
270
RR ERIC Vanhooser, Tom. A Study of Reading Recovery as an Effective Intervention for Beginning Readers. Indiana Reading Journal, v34 n3 p14-18 2002
No comparison group
271
RR ERIC King, Caryn M.; Jonson, Kathleen; Whitehead, David; Reinken, Barbara J.Glimpses of Literacy Education in New Zealand. Reading Online, v6 n9 May 2003.
Not in US
272
RR ERIC Batten, Pat. Investing Equity Funding in Early Literacy. ERS Spectrum, v22 n1 p40-45 Win 2004
?
273
RR ERIC O'Connor, Evelyn A.; Simic, Ognjen. The Effect of Reading Recovery on Special Education Referrals and Placements. Psychology in the Schools, v39 n6 p635-46 Nov 2002.
Outcome variable is not reading achievement.
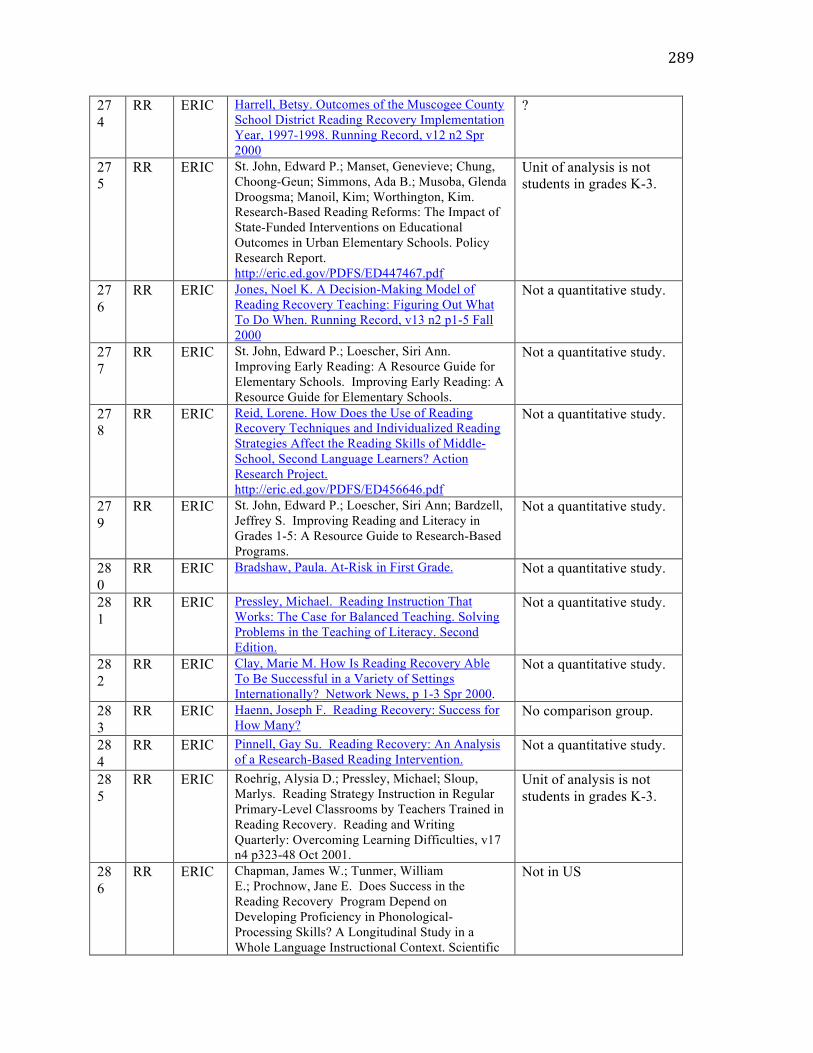
289
274
RR ERIC Harrell, Betsy. Outcomes of the Muscogee County School District Reading Recovery Implementation Year, 1997-1998. Running Record, v12 n2 Spr 2000
?
275
RR ERIC St. John, Edward P.; Manset, Genevieve; Chung, Choong-Geun; Simmons, Ada B.; Musoba, Glenda Droogsma; Manoil, Kim; Worthington, Kim. Research-Based Reading Reforms: The Impact of State-Funded Interventions on Educational Outcomes in Urban Elementary Schools. Policy Research Report. http://eric.ed.gov/PDFS/ED447467.pdf
Unit of analysis is not students in grades K-3.
276
RR ERIC Jones, Noel K. A Decision-Making Model of Reading Recovery Teaching: Figuring Out What To Do When. Running Record, v13 n2 p1-5 Fall 2000
Not a quantitative study.
277
RR ERIC St. John, Edward P.; Loescher, Siri Ann. Improving Early Reading: A Resource Guide for Elementary Schools. Improving Early Reading: A Resource Guide for Elementary Schools.
Not a quantitative study.
278
RR ERIC Reid, Lorene. How Does the Use of Reading Recovery Techniques and Individualized Reading Strategies Affect the Reading Skills of Middle-School, Second Language Learners? Action Research Project. http://eric.ed.gov/PDFS/ED456646.pdf
Not a quantitative study.
279
RR ERIC St. John, Edward P.; Loescher, Siri Ann; Bardzell, Jeffrey S. Improving Reading and Literacy in Grades 1-5: A Resource Guide to Research-Based Programs.
Not a quantitative study.
280
RR ERIC Bradshaw, Paula. At-Risk in First Grade. Not a quantitative study.
281
RR ERIC Pressley, Michael. Reading Instruction That Works: The Case for Balanced Teaching. Solving Problems in the Teaching of Literacy. Second Edition.
Not a quantitative study.
282
RR ERIC Clay, Marie M. How Is Reading Recovery Able To Be Successful in a Variety of Settings Internationally? Network News, p 1-3 Spr 2000.
Not a quantitative study.
283
RR ERIC Haenn, Joseph F. Reading Recovery: Success for How Many?
No comparison group.
284
RR ERIC Pinnell, Gay Su. Reading Recovery: An Analysis of a Research-Based Reading Intervention.
Not a quantitative study.
285
RR ERIC Roehrig, Alysia D.; Pressley, Michael; Sloup, Marlys. Reading Strategy Instruction in Regular Primary-Level Classrooms by Teachers Trained in Reading Recovery. Reading and Writing Quarterly: Overcoming Learning Difficulties, v17 n4 p323-48 Oct 2001.
Unit of analysis is not students in grades K-3.
286
RR ERIC Chapman, James W.; Tunmer, William E.; Prochnow, Jane E. Does Success in the Reading Recovery Program Depend on Developing Proficiency in Phonological-Processing Skills? A Longitudinal Study in a Whole Language Instructional Context. Scientific
Not in US
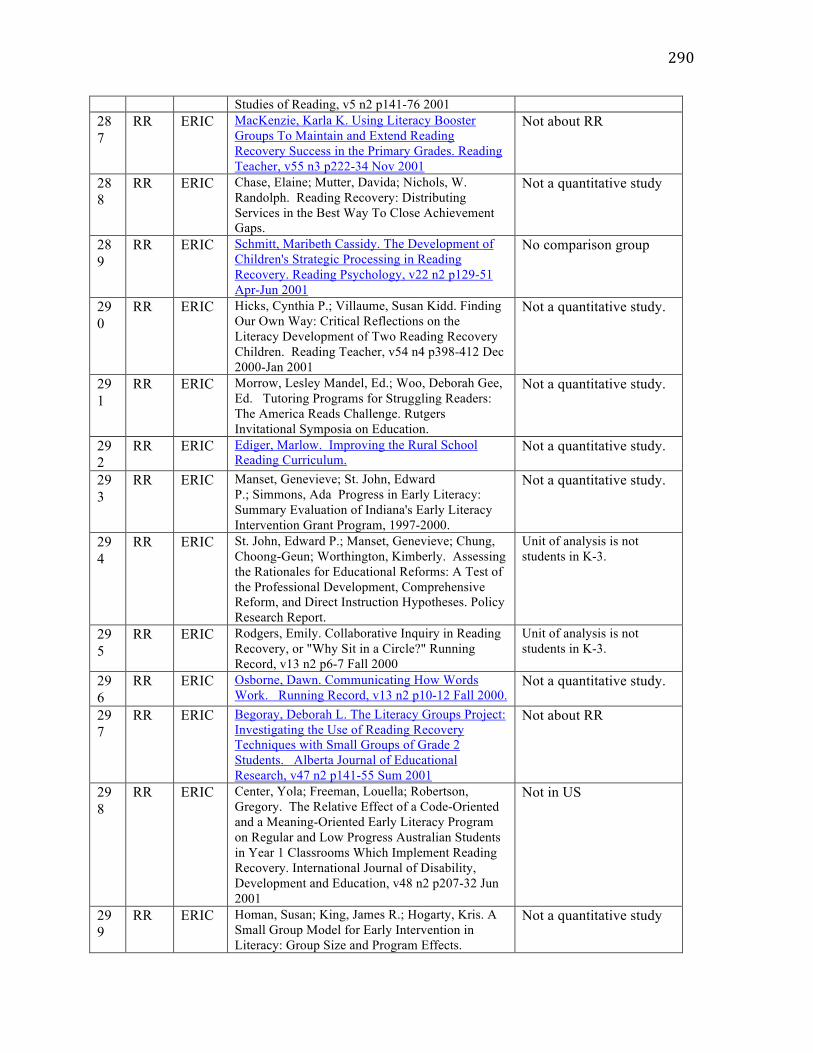
290
Studies of Reading, v5 n2 p141-76 2001 287
RR ERIC MacKenzie, Karla K. Using Literacy Booster Groups To Maintain and Extend Reading Recovery Success in the Primary Grades. Reading Teacher, v55 n3 p222-34 Nov 2001
Not about RR
288
RR ERIC Chase, Elaine; Mutter, Davida; Nichols, W. Randolph. Reading Recovery: Distributing Services in the Best Way To Close Achievement Gaps.
Not a quantitative study
289
RR ERIC Schmitt, Maribeth Cassidy. The Development of Children's Strategic Processing in Reading Recovery. Reading Psychology, v22 n2 p129-51 Apr-Jun 2001
No comparison group
290
RR ERIC Hicks, Cynthia P.; Villaume, Susan Kidd. Finding Our Own Way: Critical Reflections on the Literacy Development of Two Reading Recovery Children. Reading Teacher, v54 n4 p398-412 Dec 2000-Jan 2001
Not a quantitative study.
291
RR ERIC Morrow, Lesley Mandel, Ed.; Woo, Deborah Gee, Ed. Tutoring Programs for Struggling Readers: The America Reads Challenge. Rutgers Invitational Symposia on Education.
Not a quantitative study.
292
RR ERIC Ediger, Marlow. Improving the Rural School Reading Curriculum.
Not a quantitative study.
293
RR ERIC Manset, Genevieve; St. John, Edward P.; Simmons, Ada Progress in Early Literacy: Summary Evaluation of Indiana's Early Literacy Intervention Grant Program, 1997-2000.
Not a quantitative study.
294
RR ERIC St. John, Edward P.; Manset, Genevieve; Chung, Choong-Geun; Worthington, Kimberly. Assessing the Rationales for Educational Reforms: A Test of the Professional Development, Comprehensive Reform, and Direct Instruction Hypotheses. Policy Research Report.
Unit of analysis is not students in K-3.
295
RR ERIC Rodgers, Emily. Collaborative Inquiry in Reading Recovery, or "Why Sit in a Circle?" Running Record, v13 n2 p6-7 Fall 2000
Unit of analysis is not students in K-3.
296
RR ERIC Osborne, Dawn. Communicating How Words Work. Running Record, v13 n2 p10-12 Fall 2000.
Not a quantitative study.
297
RR ERIC Begoray, Deborah L. The Literacy Groups Project: Investigating the Use of Reading Recovery Techniques with Small Groups of Grade 2 Students. Alberta Journal of Educational Research, v47 n2 p141-55 Sum 2001
Not about RR
298
RR ERIC Center, Yola; Freeman, Louella; Robertson, Gregory. The Relative Effect of a Code-Oriented and a Meaning-Oriented Early Literacy Program on Regular and Low Progress Australian Students in Year 1 Classrooms Which Implement Reading Recovery. International Journal of Disability, Development and Education, v48 n2 p207-32 Jun 2001
Not in US
299
RR ERIC Homan, Susan; King, James R.; Hogarty, Kris. A Small Group Model for Early Intervention in Literacy: Group Size and Program Effects.
Not a quantitative study
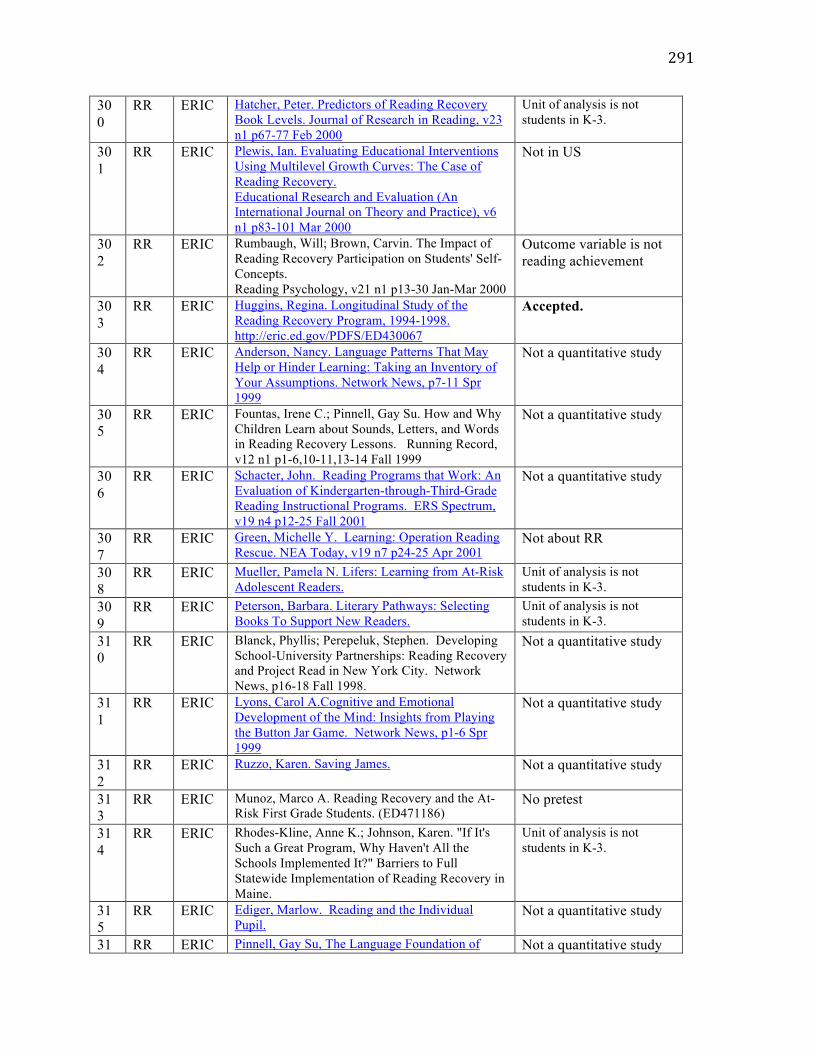
291
300
RR ERIC Hatcher, Peter. Predictors of Reading Recovery Book Levels. Journal of Research in Reading, v23 n1 p67-77 Feb 2000
Unit of analysis is not students in K-3.
301
RR ERIC Plewis, Ian. Evaluating Educational Interventions Using Multilevel Growth Curves: The Case of Reading Recovery. Educational Research and Evaluation (An International Journal on Theory and Practice), v6 n1 p83-101 Mar 2000
Not in US
302
RR ERIC Rumbaugh, Will; Brown, Carvin. The Impact of Reading Recovery Participation on Students' Self-Concepts. Reading Psychology, v21 n1 p13-30 Jan-Mar 2000
Outcome variable is not reading achievement
303
RR ERIC Huggins, Regina. Longitudinal Study of the Reading Recovery Program, 1994-1998. http://eric.ed.gov/PDFS/ED430067
Accepted.
304
RR ERIC Anderson, Nancy. Language Patterns That May Help or Hinder Learning: Taking an Inventory of Your Assumptions. Network News, p7-11 Spr 1999
Not a quantitative study
305
RR ERIC Fountas, Irene C.; Pinnell, Gay Su. How and Why Children Learn about Sounds, Letters, and Words in Reading Recovery Lessons. Running Record, v12 n1 p1-6,10-11,13-14 Fall 1999
Not a quantitative study
306
RR ERIC Schacter, John. Reading Programs that Work: An Evaluation of Kindergarten-through-Third-Grade Reading Instructional Programs. ERS Spectrum, v19 n4 p12-25 Fall 2001
Not a quantitative study
307
RR ERIC Green, Michelle Y. Learning: Operation Reading Rescue. NEA Today, v19 n7 p24-25 Apr 2001
Not about RR
308
RR ERIC Mueller, Pamela N. Lifers: Learning from At-Risk Adolescent Readers.
Unit of analysis is not students in K-3.
309
RR ERIC Peterson, Barbara. Literary Pathways: Selecting Books To Support New Readers.
Unit of analysis is not students in K-3.
310
RR ERIC Blanck, Phyllis; Perepeluk, Stephen. Developing School-University Partnerships: Reading Recovery and Project Read in New York City. Network News, p16-18 Fall 1998.
Not a quantitative study
311
RR ERIC Lyons, Carol A.Cognitive and Emotional Development of the Mind: Insights from Playing the Button Jar Game. Network News, p1-6 Spr 1999
Not a quantitative study
312
RR ERIC Ruzzo, Karen. Saving James. Not a quantitative study
313
RR ERIC Munoz, Marco A. Reading Recovery and the At-Risk First Grade Students. (ED471186)
No pretest
314
RR ERIC Rhodes-Kline, Anne K.; Johnson, Karen. "If It's Such a Great Program, Why Haven't All the Schools Implemented It?" Barriers to Full Statewide Implementation of Reading Recovery in Maine.
Unit of analysis is not students in K-3.
315
RR ERIC Ediger, Marlow. Reading and the Individual Pupil.
Not a quantitative study
31 RR ERIC Pinnell, Gay Su, The Language Foundation of Not a quantitative study
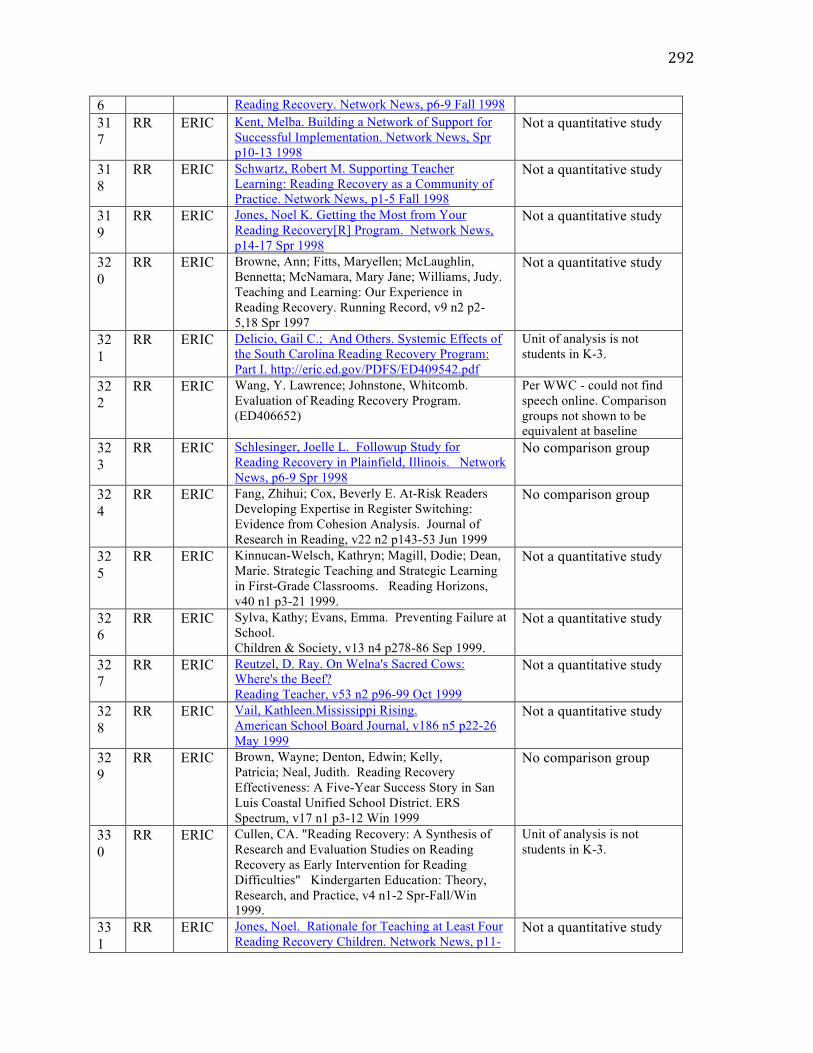
292
6 Reading Recovery. Network News, p6-9 Fall 1998 317
RR ERIC Kent, Melba. Building a Network of Support for Successful Implementation. Network News, Spr p10-13 1998
Not a quantitative study
318
RR ERIC Schwartz, Robert M. Supporting Teacher Learning: Reading Recovery as a Community of Practice. Network News, p1-5 Fall 1998
Not a quantitative study
319
RR ERIC Jones, Noel K. Getting the Most from Your Reading Recovery[R] Program. Network News, p14-17 Spr 1998
Not a quantitative study
320
RR ERIC Browne, Ann; Fitts, Maryellen; McLaughlin, Bennetta; McNamara, Mary Jane; Williams, Judy. Teaching and Learning: Our Experience in Reading Recovery. Running Record, v9 n2 p2-5,18 Spr 1997
Not a quantitative study
321
RR ERIC Delicio, Gail C.; And Others. Systemic Effects of the South Carolina Reading Recovery Program: Part I. http://eric.ed.gov/PDFS/ED409542.pdf
Unit of analysis is not students in K-3.
322
RR ERIC Wang, Y. Lawrence; Johnstone, Whitcomb. Evaluation of Reading Recovery Program. (ED406652)
Per WWC - could not find speech online. Comparison groups not shown to be equivalent at baseline
323
RR ERIC Schlesinger, Joelle L. Followup Study for Reading Recovery in Plainfield, Illinois. Network News, p6-9 Spr 1998
No comparison group
324
RR ERIC Fang, Zhihui; Cox, Beverly E. At-Risk Readers Developing Expertise in Register Switching: Evidence from Cohesion Analysis. Journal of Research in Reading, v22 n2 p143-53 Jun 1999
No comparison group
325
RR ERIC Kinnucan-Welsch, Kathryn; Magill, Dodie; Dean, Marie. Strategic Teaching and Strategic Learning in First-Grade Classrooms. Reading Horizons, v40 n1 p3-21 1999.
Not a quantitative study
326
RR ERIC Sylva, Kathy; Evans, Emma. Preventing Failure at School. Children & Society, v13 n4 p278-86 Sep 1999.
Not a quantitative study
327
RR ERIC Reutzel, D. Ray. On Welna's Sacred Cows: Where's the Beef? Reading Teacher, v53 n2 p96-99 Oct 1999
Not a quantitative study
328
RR ERIC Vail, Kathleen.Mississippi Rising. American School Board Journal, v186 n5 p22-26 May 1999
Not a quantitative study
329
RR ERIC Brown, Wayne; Denton, Edwin; Kelly, Patricia; Neal, Judith. Reading Recovery Effectiveness: A Five-Year Success Story in San Luis Coastal Unified School District. ERS Spectrum, v17 n1 p3-12 Win 1999
No comparison group
330
RR ERIC Cullen, CA. "Reading Recovery: A Synthesis of Research and Evaluation Studies on Reading Recovery as Early Intervention for Reading Difficulties" Kindergarten Education: Theory, Research, and Practice, v4 n1-2 Spr-Fall/Win 1999.
Unit of analysis is not students in K-3.
331
RR ERIC Jones, Noel. Rationale for Teaching at Least Four Reading Recovery Children. Network News, p11-
Not a quantitative study
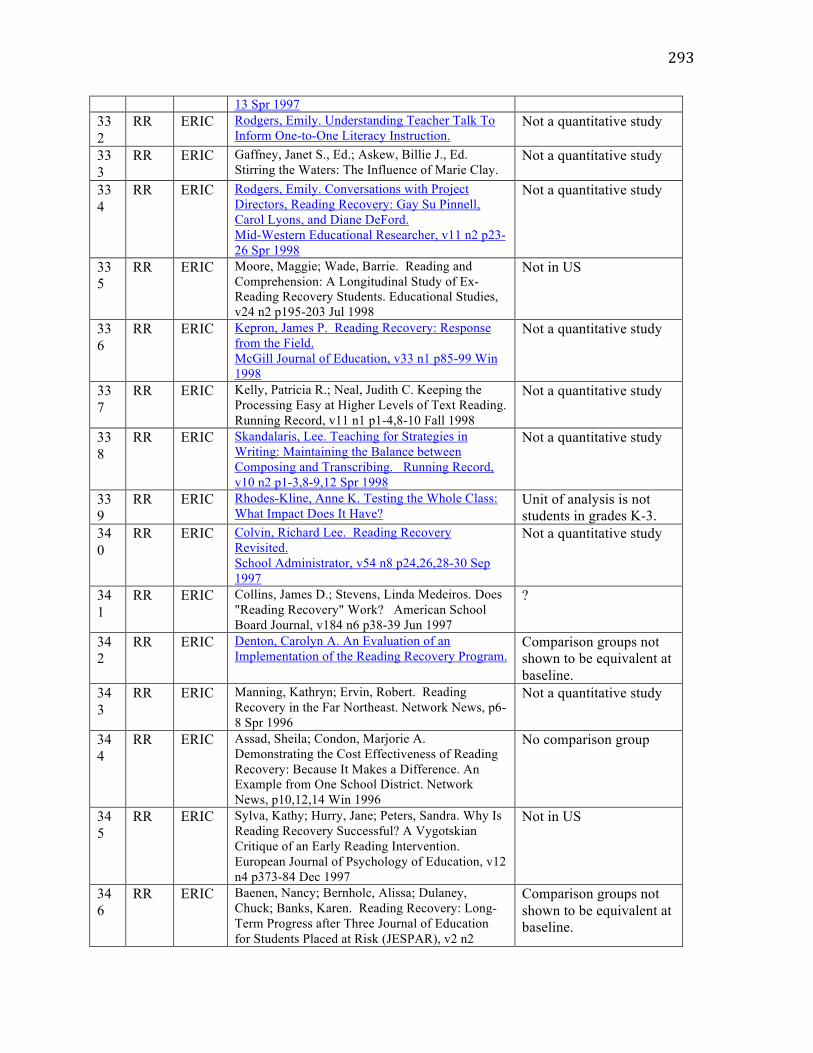
293
13 Spr 1997 332
RR ERIC Rodgers, Emily. Understanding Teacher Talk To Inform One-to-One Literacy Instruction.
Not a quantitative study
333
RR ERIC Gaffney, Janet S., Ed.; Askew, Billie J., Ed. Stirring the Waters: The Influence of Marie Clay.
Not a quantitative study
334
RR ERIC Rodgers, Emily. Conversations with Project Directors, Reading Recovery: Gay Su Pinnell, Carol Lyons, and Diane DeFord. Mid-Western Educational Researcher, v11 n2 p23-26 Spr 1998
Not a quantitative study
335
RR ERIC Moore, Maggie; Wade, Barrie. Reading and Comprehension: A Longitudinal Study of Ex-Reading Recovery Students. Educational Studies, v24 n2 p195-203 Jul 1998
Not in US
336
RR ERIC Kepron, James P. Reading Recovery: Response from the Field. McGill Journal of Education, v33 n1 p85-99 Win 1998
Not a quantitative study
337
RR ERIC Kelly, Patricia R.; Neal, Judith C. Keeping the Processing Easy at Higher Levels of Text Reading. Running Record, v11 n1 p1-4,8-10 Fall 1998
Not a quantitative study
338
RR ERIC Skandalaris, Lee. Teaching for Strategies in Writing: Maintaining the Balance between Composing and Transcribing. Running Record, v10 n2 p1-3,8-9,12 Spr 1998
Not a quantitative study
339
RR ERIC Rhodes-Kline, Anne K. Testing the Whole Class: What Impact Does It Have?
Unit of analysis is not students in grades K-3.
340
RR ERIC Colvin, Richard Lee. Reading Recovery Revisited. School Administrator, v54 n8 p24,26,28-30 Sep 1997
Not a quantitative study
341
RR ERIC Collins, James D.; Stevens, Linda Medeiros. Does "Reading Recovery" Work? American School Board Journal, v184 n6 p38-39 Jun 1997
?
342
RR ERIC Denton, Carolyn A. An Evaluation of an Implementation of the Reading Recovery Program.
Comparison groups not shown to be equivalent at baseline.
343
RR ERIC Manning, Kathryn; Ervin, Robert. Reading Recovery in the Far Northeast. Network News, p6-8 Spr 1996
Not a quantitative study
344
RR ERIC Assad, Sheila; Condon, Marjorie A. Demonstrating the Cost Effectiveness of Reading Recovery: Because It Makes a Difference. An Example from One School District. Network News, p10,12,14 Win 1996
No comparison group
345
RR ERIC Sylva, Kathy; Hurry, Jane; Peters, Sandra. Why Is Reading Recovery Successful? A Vygotskian Critique of an Early Reading Intervention. European Journal of Psychology of Education, v12 n4 p373-84 Dec 1997
Not in US
346
RR ERIC Baenen, Nancy; Bernholc, Alissa; Dulaney, Chuck; Banks, Karen. Reading Recovery: Long-Term Progress after Three Journal of Education for Students Placed at Risk (JESPAR), v2 n2
Comparison groups not shown to be equivalent at baseline.
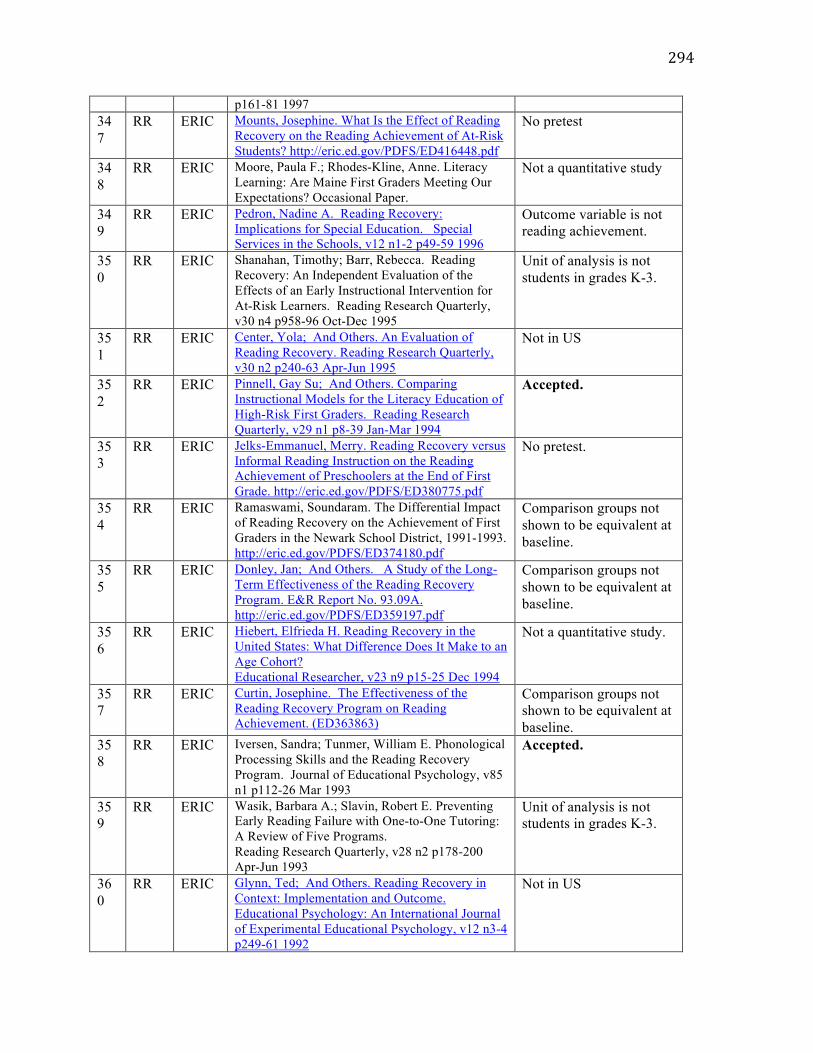
294
p161-81 1997 347
RR ERIC Mounts, Josephine. What Is the Effect of Reading Recovery on the Reading Achievement of At-Risk Students? http://eric.ed.gov/PDFS/ED416448.pdf
No pretest
348
RR ERIC Moore, Paula F.; Rhodes-Kline, Anne. Literacy Learning: Are Maine First Graders Meeting Our Expectations? Occasional Paper.
Not a quantitative study
349
RR ERIC Pedron, Nadine A. Reading Recovery: Implications for Special Education. Special Services in the Schools, v12 n1-2 p49-59 1996
Outcome variable is not reading achievement.
350
RR ERIC Shanahan, Timothy; Barr, Rebecca. Reading Recovery: An Independent Evaluation of the Effects of an Early Instructional Intervention for At-Risk Learners. Reading Research Quarterly, v30 n4 p958-96 Oct-Dec 1995
Unit of analysis is not students in grades K-3.
351
RR ERIC Center, Yola; And Others. An Evaluation of Reading Recovery. Reading Research Quarterly, v30 n2 p240-63 Apr-Jun 1995
Not in US
352
RR ERIC Pinnell, Gay Su; And Others. Comparing Instructional Models for the Literacy Education of High-Risk First Graders. Reading Research Quarterly, v29 n1 p8-39 Jan-Mar 1994
Accepted.
353
RR ERIC Jelks-Emmanuel, Merry. Reading Recovery versus Informal Reading Instruction on the Reading Achievement of Preschoolers at the End of First Grade. http://eric.ed.gov/PDFS/ED380775.pdf
No pretest.
354
RR ERIC Ramaswami, Soundaram. The Differential Impact of Reading Recovery on the Achievement of First Graders in the Newark School District, 1991-1993. http://eric.ed.gov/PDFS/ED374180.pdf
Comparison groups not shown to be equivalent at baseline.
355
RR ERIC Donley, Jan; And Others. A Study of the Long-Term Effectiveness of the Reading Recovery Program. E&R Report No. 93.09A. http://eric.ed.gov/PDFS/ED359197.pdf
Comparison groups not shown to be equivalent at baseline.
356
RR ERIC Hiebert, Elfrieda H. Reading Recovery in the United States: What Difference Does It Make to an Age Cohort? Educational Researcher, v23 n9 p15-25 Dec 1994
Not a quantitative study.
357
RR ERIC Curtin, Josephine. The Effectiveness of the Reading Recovery Program on Reading Achievement. (ED363863)
Comparison groups not shown to be equivalent at baseline.
358
RR ERIC Iversen, Sandra; Tunmer, William E. Phonological Processing Skills and the Reading Recovery Program. Journal of Educational Psychology, v85 n1 p112-26 Mar 1993
Accepted.
359
RR ERIC Wasik, Barbara A.; Slavin, Robert E. Preventing Early Reading Failure with One-to-One Tutoring: A Review of Five Programs. Reading Research Quarterly, v28 n2 p178-200 Apr-Jun 1993
Unit of analysis is not students in grades K-3.
360
RR ERIC Glynn, Ted; And Others. Reading Recovery in Context: Implementation and Outcome. Educational Psychology: An International Journal of Experimental Educational Psychology, v12 n3-4 p249-61 1992
Not in US
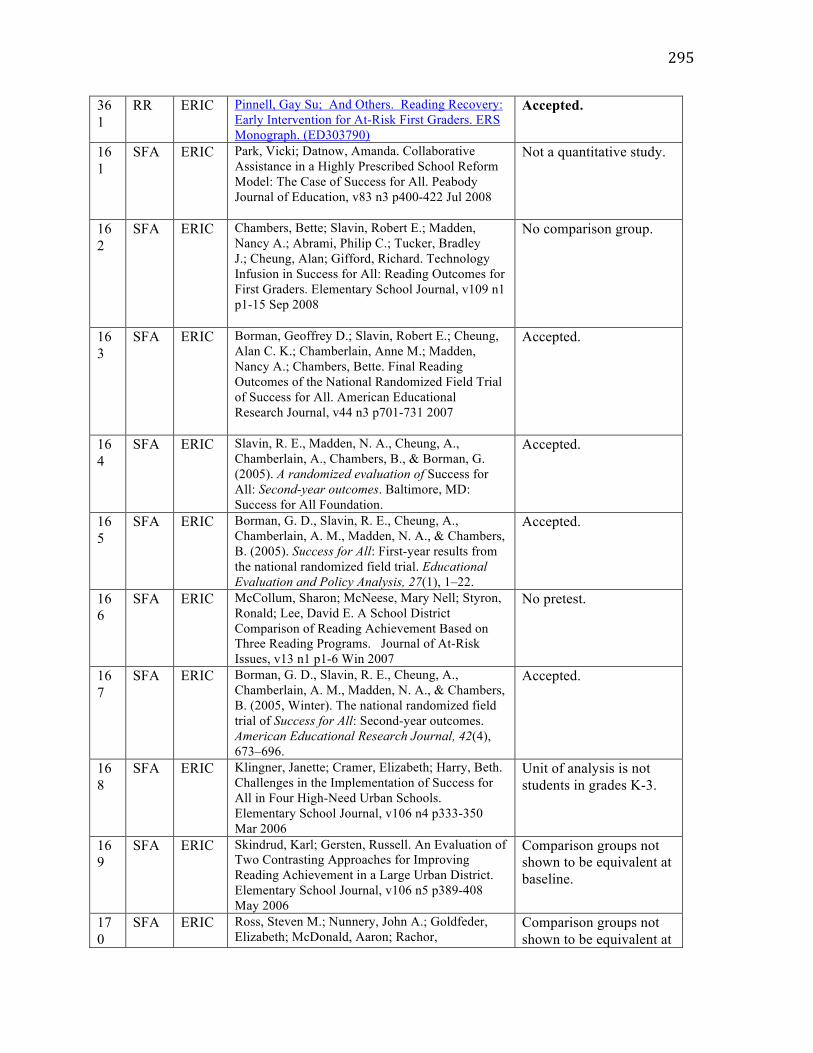
295
361
RR ERIC Pinnell, Gay Su; And Others. Reading Recovery: Early Intervention for At-Risk First Graders. ERS Monograph. (ED303790)
Accepted.
161
SFA ERIC Park, Vicki; Datnow, Amanda. Collaborative Assistance in a Highly Prescribed School Reform Model: The Case of Success for All. Peabody Journal of Education, v83 n3 p400-422 Jul 2008
Not a quantitative study.
162
SFA ERIC Chambers, Bette; Slavin, Robert E.; Madden, Nancy A.; Abrami, Philip C.; Tucker, Bradley J.; Cheung, Alan; Gifford, Richard. Technology Infusion in Success for All: Reading Outcomes for First Graders. Elementary School Journal, v109 n1 p1-15 Sep 2008
No comparison group.
163
SFA ERIC Borman, Geoffrey D.; Slavin, Robert E.; Cheung, Alan C. K.; Chamberlain, Anne M.; Madden, Nancy A.; Chambers, Bette. Final Reading Outcomes of the National Randomized Field Trial of Success for All. American Educational Research Journal, v44 n3 p701-731 2007
Accepted.
164
SFA ERIC Slavin, R. E., Madden, N. A., Cheung, A., Chamberlain, A., Chambers, B., & Borman, G. (2005). A randomized evaluation of Success for All: Second-year outcomes. Baltimore, MD: Success for All Foundation.
Accepted.
165
SFA ERIC Borman, G. D., Slavin, R. E., Cheung, A., Chamberlain, A. M., Madden, N. A., & Chambers, B. (2005). Success for All: First-year results from the national randomized field trial. Educational Evaluation and Policy Analysis, 27(1), 1–22.
Accepted.
166
SFA ERIC McCollum, Sharon; McNeese, Mary Nell; Styron, Ronald; Lee, David E. A School District Comparison of Reading Achievement Based on Three Reading Programs. Journal of At-Risk Issues, v13 n1 p1-6 Win 2007
No pretest.
167
SFA ERIC Borman, G. D., Slavin, R. E., Cheung, A., Chamberlain, A. M., Madden, N. A., & Chambers, B. (2005, Winter). The national randomized field trial of Success for All: Second-year outcomes. American Educational Research Journal, 42(4), 673–696.
Accepted.
168
SFA ERIC Klingner, Janette; Cramer, Elizabeth; Harry, Beth. Challenges in the Implementation of Success for All in Four High-Need Urban Schools. Elementary School Journal, v106 n4 p333-350 Mar 2006
Unit of analysis is not students in grades K-3.
169
SFA ERIC Skindrud, Karl; Gersten, Russell. An Evaluation of Two Contrasting Approaches for Improving Reading Achievement in a Large Urban District. Elementary School Journal, v106 n5 p389-408 May 2006
Comparison groups not shown to be equivalent at baseline.
170
SFA ERIC Ross, Steven M.; Nunnery, John A.; Goldfeder, Elizabeth; McDonald, Aaron; Rachor,
Comparison groups not shown to be equivalent at

296
Robert; Hornbeck, Matthew; Fleischman, Steve. Using School Reform Models to Improve Reading Achievement: A Longitudinal Study of Direct Instruction and Success for All in an Urban District. Journal of Education for Students Placed at Risk (JESPAR), v9 n4 p357-388 Oct 2004
baseline.
171
SFA ERIC Munoz, Marco A.; Dossett, Dena H. Educating Students Placed At Risk: Evaluating the Impact of Success for All in Urban Settings. Journal of Education for Students Placed at Risk (JESPAR), v9 n3 p261-277 Jul 2004 p=0.035
Comparison groups not shown to be equivalent at baseline.
172
SFA ERIC Hurley, Eric A.; Chamberlain, Anne; Slavin, Robert E.; Madden, Nancy A. Effects of Success for All on TAAS Reading: A Texas Statewide Evaluation. Report No. 51. (ED450173)
Unit of analysis is not students in grades K-3.
173
SFA ERIC Borman, Geoffrey D.; Hewes, Gina M. The Long-Term Effects and Cost-Effectiveness of Success for All. Educational Evaluation and Policy Analysis, v24 n4 p243-66 Win 2002
Comparison groups not shown to be equivalent at baseline.
174
SFA ERIC Slavin, Robert E.; Madden, Nancy A. Reducing the Gap: Success for All and the Achievement of African-American and Latino Students. http://eric.ed.gov/PDFS/ED455079.pdf
Unit of analysis is not students in grades K-3.
175
SFA ERIC Borman, Geoffrey D.; Rachuba, Laura; Datnow, Amanda; Alberg, Marty; Mac Iver, Martha; Stringfield, Sam; Ross, Steve. Four Models of School Improvement: Successes and Challenges in Reforming Low-Performing, High-Poverty Title I Schools. Report No. 48. (ED447238)
Scores for grades 3-5 are not disaggregated.
176
SFA ERIC Slavin, Robert E.; Madden, Nancy A. Success for All/Exito Para Todos. Effects on the Reading Achievement of Students Acquiring English. Report No. 19. (ED423327)
Unit of analysis is not students in grades K-3.
177
SFA ERIC Hopkins, David; Youngman, Mick; Harris, Alma; Wordsworth, Judith. Evaluation of the Initial Effects and Implementation of Success for All in England. Journal of Research in Reading, v22 n3 p257-70 Oct 1999
Not in US
178
SFA ERIC Ross, Stephen M.; Smith, Lana J.; Casey, Jason P."Bridging the Gap": The Effects of the Success for All Program on Elementary School Reading Achievement as a Function of Student Ethnicity and Ability Level. School Effectiveness and School Improvement, v10 n2 p129-50 Jun 1999
Comparison groups not shown to be equivalent at baseline.
179
SFA ERIC Sundberg, Barbara J.; Stayrook, Nick. "Success for All": An Evaluation of the Title I Program at Four Elementary Schools, 1995-96 through 1997-1998.
No comparison group
180
SFA ERIC Cooper, Robert. Socio-Cultural and Within-School Factors That Affect the Quality of Implementation of School-Wide Programs. Report No. 28.
Outcome variable is not reading achievement.
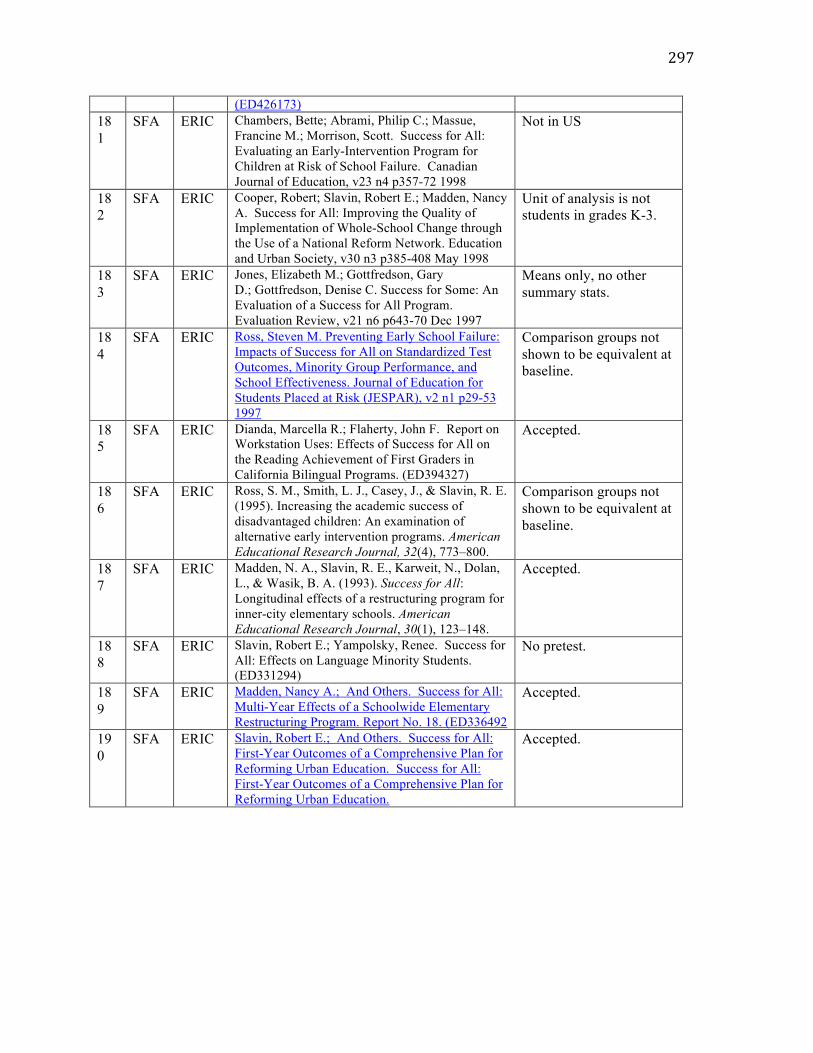
297
(ED426173) 181
SFA ERIC Chambers, Bette; Abrami, Philip C.; Massue, Francine M.; Morrison, Scott. Success for All: Evaluating an Early-Intervention Program for Children at Risk of School Failure. Canadian Journal of Education, v23 n4 p357-72 1998
Not in US
182
SFA ERIC Cooper, Robert; Slavin, Robert E.; Madden, Nancy A. Success for All: Improving the Quality of Implementation of Whole-School Change through the Use of a National Reform Network. Education and Urban Society, v30 n3 p385-408 May 1998
Unit of analysis is not students in grades K-3.
183
SFA ERIC Jones, Elizabeth M.; Gottfredson, Gary D.; Gottfredson, Denise C. Success for Some: An Evaluation of a Success for All Program. Evaluation Review, v21 n6 p643-70 Dec 1997
Means only, no other summary stats.
184
SFA ERIC Ross, Steven M. Preventing Early School Failure: Impacts of Success for All on Standardized Test Outcomes, Minority Group Performance, and School Effectiveness. Journal of Education for Students Placed at Risk (JESPAR), v2 n1 p29-53 1997
Comparison groups not shown to be equivalent at baseline.
185
SFA ERIC Dianda, Marcella R.; Flaherty, John F. Report on Workstation Uses: Effects of Success for All on the Reading Achievement of First Graders in California Bilingual Programs. (ED394327)
Accepted.
186
SFA ERIC Ross, S. M., Smith, L. J., Casey, J., & Slavin, R. E. (1995). Increasing the academic success of disadvantaged children: An examination of alternative early intervention programs. American Educational Research Journal, 32(4), 773–800.
Comparison groups not shown to be equivalent at baseline.
187
SFA ERIC Madden, N. A., Slavin, R. E., Karweit, N., Dolan, L., & Wasik, B. A. (1993). Success for All: Longitudinal effects of a restructuring program for inner-city elementary schools. American Educational Research Journal, 30(1), 123–148.
Accepted.
188
SFA ERIC Slavin, Robert E.; Yampolsky, Renee. Success for All: Effects on Language Minority Students. (ED331294)
No pretest.
189
SFA ERIC Madden, Nancy A.; And Others. Success for All: Multi-Year Effects of a Schoolwide Elementary Restructuring Program. Report No. 18. (ED336492
Accepted.
190
SFA ERIC Slavin, Robert E.; And Others. Success for All: First-Year Outcomes of a Comprehensive Plan for Reforming Urban Education. Success for All: First-Year Outcomes of a Comprehensive Plan for Reforming Urban Education.
Accepted.

298
APPENDIX II: TEXT OF LITERACY SPECIALIST SURVEY ADMINISTERED TO MEMBERSHIP OF MASSACHUSETTS READING
ASSOCIATION, 2010
Page 1 Dear Education Professional, I am undertaking research on the effectiveness of early reading programs using cost-effectiveness analysis in conjunction with Professor Henry M. Levin at Teachers College, Columbia University. This brief survey asks about components of effective, balanced literacy instruction for beginning readers (grades K-3). As a member of the Massachusetts Reading Association whose area of interest and/or expertise is literacy, we would like to know more about the factors that you consider critical to providing effective and balanced reading instruction to beginning readers – in terms of both inputs and outcomes. Success in achieving some literacy outcomes may have greater value in creating successful readers or may represent a higher-order literacy skill that is more difficult to teach. The survey should take no more than 10 minutes to complete. Responses will be collected anonymously, and will only be reported in aggregate form. Your participation is greatly appreciated! Sincerely, Jessica Simon Doctoral Candidate, Economics and Education Teachers College, Columbia University [email protected] Page 2 INFORMED CONSENT DESCRIPTION OF THE RESEARCH: You are invited to participate in a survey about the components of effective reading instruction and the relative importance of domains of literacy. Research will be conducted by a doctoral candidate at Teachers College, Columbia University. Research will be conducted at the researcher’s home in MA. RISKS AND BENEFITS: The research has the same amount of risk you may encounter answering any other anonymous Web-based survey. Individual responses will not be reported; only aggregate results will be shared. Data will not be saved or used in any way that would identify you individually. Aggregate responses to the survey will help the MRA to learn more about how their membership views different components of effective reading instruction. Weights generated by this study will be used to determine cost-effectiveness ratios of early literacy interventions; your participation will allow a better understanding of how experts view reading outcomes, and how to weight studies properly based on those outcomes. If you choose not to respond to the study, you can ignore the e-mail invitation or ask to be removed from our list so that you do not receive further
299
invitations to participate. PAYMENTS: There will be no payment for your participation. DATA STORAGE TO PROTECT CONFIDENTIALITY: The survey will be administered via Survey Monkey. The researcher will not collect e-mail addresses or other identifying information (such as name, school/university affiliation, etc.). Any identifying information you provide will be removed from the data file. Data will be downloaded to a password protected computer. If possible, the data file will be password protected as well. TIME INVOLVEMENT: Your participation will take approximately ten (10) minutes. HOW WILL RESULTS BE USED: Responses will be used to weight outcome measures used in different studies, and compare the weights to the current, unweighted scenario. Aggregate results may be used for conference presentations, research papers, or other educational purposes. Answers to all of the questions will be reported to the MRA in written and oral form. Individual allocations will never be reported; only aggregate data will be shared or presented. PARTICIPANT'S RIGHTS Principal Investigator: Jessica Simon Research Title: A Cost-Effectiveness Analysis of Early Literacy Interventions • I have read the Research Description. I have had the opportunity to ask questions about the purposes and procedures regarding this study. • My participation in research is voluntary. I may refuse to participate or withdraw from participation at any time. • The researcher may withdraw me from the research at her professional discretion. • If, during the course of the study, significant new information that has been developed becomes available which may relate to my willingness to continue to participate, the investigator will provide this information to me. • Any information derived from the research project that personally identifies me will not be voluntarily released or disclosed without my separate consent, except as specifically required by law. • If at any time I have any questions regarding the research or my participation, I can contact the investigator, who will answer my questions. The investigator's e-mail address is [email protected]. • If at any time I have comments or concerns regarding the conduct of the or questions about my rights as a research subject, I should contact the Teachers College, Columbia University Institutional Review Board /IRB. The phone number for the IRB is (212) 678-4105. Or, I can write to the IRB at Teachers College, Columbia University, 525 W. 120th Street, New York, NY, 10027, Box 151. • I can receive a hard copy of the Research Description and this Participant's Rights document by requesting it from the investigator via e-mail. • By clicking “next,” I agree to participate in this study.

300
Page 3
1. Using a scale of 1 to 5, where 1 is “not at all important” and 5 is “very important,” please indicate how important each of the following elements are for balanced literacy instruction. The last column asks you to indicate if you think a component is one of the MOST important components. Please indicate up to three components that are MOST important.
Not At All Important
(1) (2) (3) (4)
Very Important
(5)
One of Top Three
Importance (6)
Answering questions about what was read
Thinking of questions about what was read
Summarizing what was read
Explicit phonics instruction
Intrinsic Motivation
Extrinsic Motivation (e.g., prizes/incentives)
Oral language development
Guided oral reading
Sustained silent (independent) reading
Teacher characteristics (communication skills, years of experience)
Vocabulary instruction
Writing instruction
Other (please specify)
301
2. Of the three components you designated as MOST important, please explain why you believe they are the three MOST important elements for effective literacy instruction.
Page 4
3. The National Reading Panel (2000) conducted a systematic review of existing research and concluded that there are five components, or pillars, of effective literacy instruction: phonemic awareness, phonics and concepts about print, fluency, vocabulary, and comprehension. These components have been instrumental in Reading First legislation and other public initiatives. How would you weight these components in terms of relative importance in creating a SUCCESSFUL BEGINNING (i.e., K-3) reader? Please allocate 100 points amongst all five components. For example, if all five components should be regarded equally, you could allocate your points this way: 20 – Phonemic Awareness 20 – Phonics 20 – Fluency 20 – Vocabulary 20 – Comprehension Please allocate 100 points among the National Reading Panel’s five components of reading instruction in terms of creating a SUCCESSFUL BEGINNING (K-3) reader:
Phonemic Awareness Phonics
Fluency Vocabulary
Comprehension Page 5
4. How would you weight these components in terms of relative importance for a STRUGGLING BEGINNING (K-3) reader? Please allocate 100 points amongst all five components. For example, if all five components should be regarded equally, you could allocate your points this way: 20 – Phonemic Awareness 20 – Phonics 20 – Fluency 20 – Vocabulary 20 – Comprehension
302
Please allocate 100 points among the National Reading Panel’s five components of reading instruction in for a STRUGGLING BEGINNING(K-3) reader:
Phonemic Awareness
Phonics Fluency
Vocabulary Comprehension Page 6
5. Other research (see e.g., Pressley (2001), Allington (2004)) suggests that motivation is a sixth critical component of effective reading instruction. How would the addition of motivation change the allocation of points for K-3 readers? Please remember to allocate 100 points amongst all six components.
Phonemic Awareness
Phonics Fluency
Vocabulary Comprehension
Motivation Page 7 6. If any other outcomes should have been included in the National Reading Panel’s list, please list them. Page 8 7. What is your primary role?
Professor
Administrator
Elementary teacher (Grades K-3)
Elementary teacher (Grades 4-6)
Secondary teacher
Reading teacher/Literacy specialist
Other (Please specify)
303
Page 9 8. Please share any comments or feedback here. The investigator wishes to acknowledge the Massachusetts Reading Association (MRA). I am greatly appreciative for all feedback and suggestions from the board of the MRA. I take full responsibility for the survey and all work done to create and analyze it; all errors or omissions are my own. Please click DONE to submit the survey. Thank you!
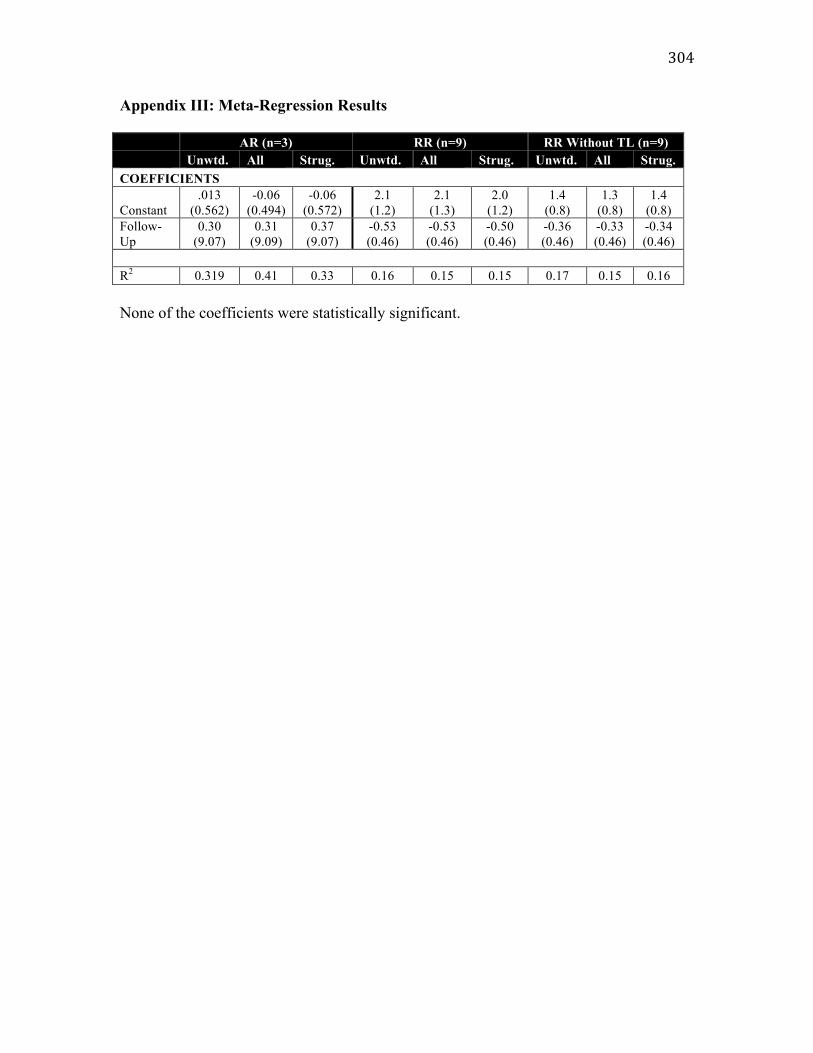
304
Appendix III: Meta-Regression Results AR (n=3) RR (n=9) RR Without TL (n=9) Unwtd. All Strug. Unwtd. All Strug. Unwtd. All Strug. COEFFICIENTS Constant
.013 (0.562)
-0.06 (0.494)
-0.06 (0.572)
2.1 (1.2)
2.1 (1.3)
2.0 (1.2)
1.4 (0.8)
1.3 (0.8)
1.4 (0.8)
Follow-Up
0.30 (9.07)
0.31 (9.09)
0.37 (9.07)
-0.53 (0.46)
-0.53 (0.46)
-0.50 (0.46)
-0.36 (0.46)
-0.33 (0.46)
-0.34 (0.46)
R2 0.319 0.41 0.33 0.16 0.15 0.15 0.17 0.15 0.16 None of the coefficients were statistically significant.
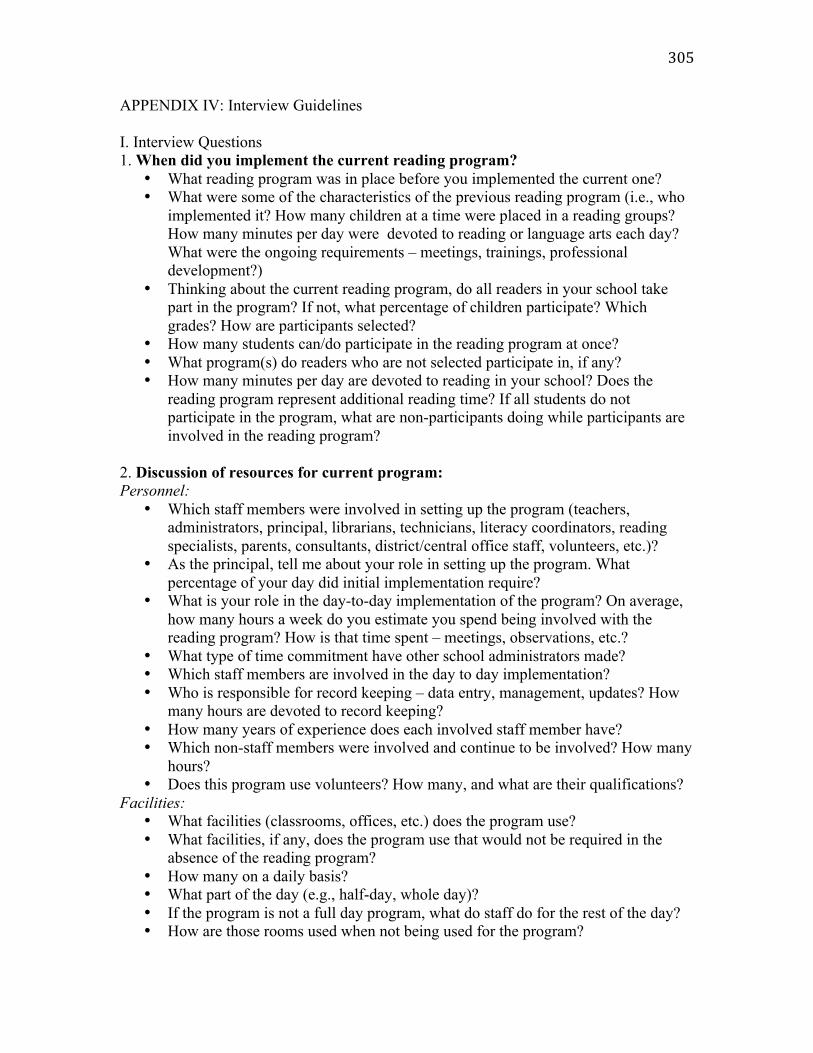
305
APPENDIX IV: Interview Guidelines I. Interview Questions 1. When did you implement the current reading program?
• What reading program was in place before you implemented the current one? • What were some of the characteristics of the previous reading program (i.e., who
implemented it? How many children at a time were placed in a reading groups? How many minutes per day were devoted to reading or language arts each day? What were the ongoing requirements – meetings, trainings, professional development?)
• Thinking about the current reading program, do all readers in your school take part in the program? If not, what percentage of children participate? Which grades? How are participants selected?
• How many students can/do participate in the reading program at once? • What program(s) do readers who are not selected participate in, if any? • How many minutes per day are devoted to reading in your school? Does the
reading program represent additional reading time? If all students do not participate in the program, what are non-participants doing while participants are involved in the reading program?
2. Discussion of resources for current program: Personnel:
• Which staff members were involved in setting up the program (teachers, administrators, principal, librarians, technicians, literacy coordinators, reading specialists, parents, consultants, district/central office staff, volunteers, etc.)?
• As the principal, tell me about your role in setting up the program. What percentage of your day did initial implementation require?
• What is your role in the day-to-day implementation of the program? On average, how many hours a week do you estimate you spend being involved with the reading program? How is that time spent – meetings, observations, etc.?
• What type of time commitment have other school administrators made? • Which staff members are involved in the day to day implementation? • Who is responsible for record keeping – data entry, management, updates? How
many hours are devoted to record keeping? • How many years of experience does each involved staff member have? • Which non-staff members were involved and continue to be involved? How many
hours? • Does this program use volunteers? How many, and what are their qualifications?
Facilities: • What facilities (classrooms, offices, etc.) does the program use? • What facilities, if any, does the program use that would not be required in the
absence of the reading program? • How many on a daily basis? • What part of the day (e.g., half-day, whole day)? • If the program is not a full day program, what do staff do for the rest of the day? • How are those rooms used when not being used for the program?
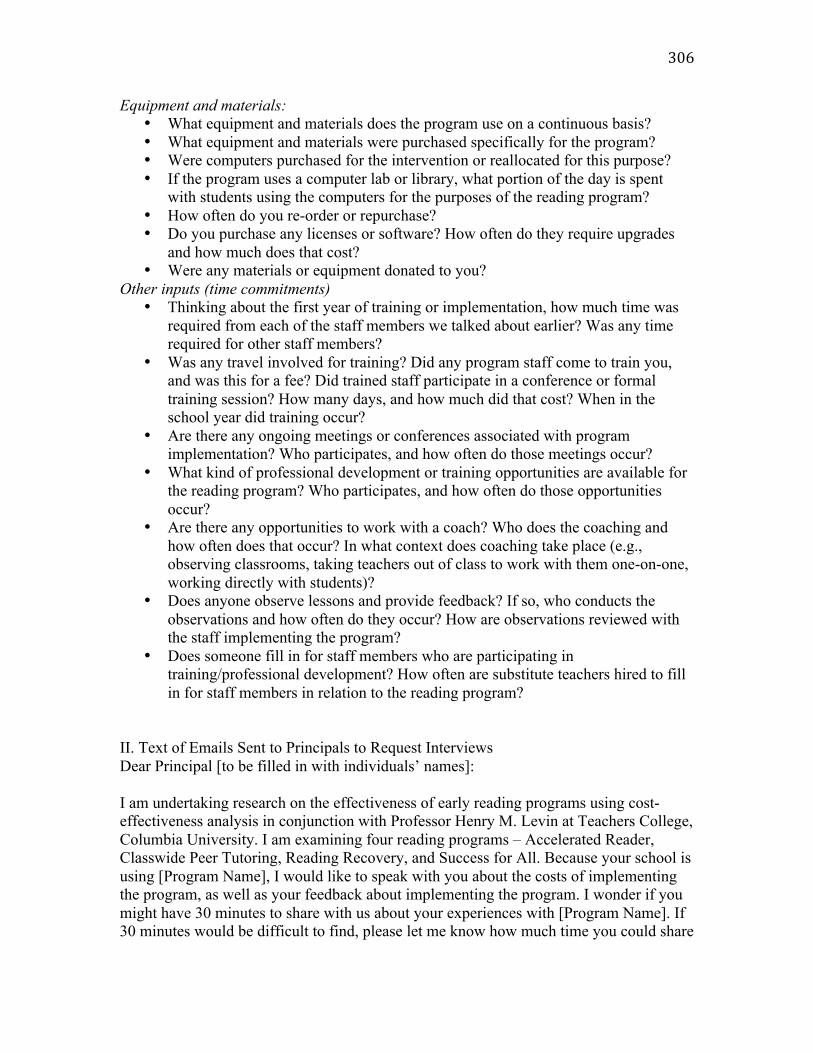
306
Equipment and materials: • What equipment and materials does the program use on a continuous basis? • What equipment and materials were purchased specifically for the program? • Were computers purchased for the intervention or reallocated for this purpose? • If the program uses a computer lab or library, what portion of the day is spent
with students using the computers for the purposes of the reading program? • How often do you re-order or repurchase? • Do you purchase any licenses or software? How often do they require upgrades
and how much does that cost? • Were any materials or equipment donated to you?
Other inputs (time commitments) • Thinking about the first year of training or implementation, how much time was
required from each of the staff members we talked about earlier? Was any time required for other staff members?
• Was any travel involved for training? Did any program staff come to train you, and was this for a fee? Did trained staff participate in a conference or formal training session? How many days, and how much did that cost? When in the school year did training occur?
• Are there any ongoing meetings or conferences associated with program implementation? Who participates, and how often do those meetings occur?
• What kind of professional development or training opportunities are available for the reading program? Who participates, and how often do those opportunities occur?
• Are there any opportunities to work with a coach? Who does the coaching and how often does that occur? In what context does coaching take place (e.g., observing classrooms, taking teachers out of class to work with them one-on-one, working directly with students)?
• Does anyone observe lessons and provide feedback? If so, who conducts the observations and how often do they occur? How are observations reviewed with the staff implementing the program?
• Does someone fill in for staff members who are participating in training/professional development? How often are substitute teachers hired to fill in for staff members in relation to the reading program?
II. Text of Emails Sent to Principals to Request Interviews Dear Principal [to be filled in with individuals’ names]: I am undertaking research on the effectiveness of early reading programs using cost-effectiveness analysis in conjunction with Professor Henry M. Levin at Teachers College, Columbia University. I am examining four reading programs – Accelerated Reader, Classwide Peer Tutoring, Reading Recovery, and Success for All. Because your school is using [Program Name], I would like to speak with you about the costs of implementing the program, as well as your feedback about implementing the program. I wonder if you might have 30 minutes to share with us about your experiences with [Program Name]. If 30 minutes would be difficult to find, please let me know how much time you could share

307
and I will gladly amend my questions to suit your schedule. After preparing an initial list of resources needed for your reading program, I asked staff from [Program Name] to review our list and make corrections. I was wondering if you might take a minute to peruse the attached list, perhaps prior to our call. While reviewing it, I hope you can consider the following questions: how well does the list of resources represent the ones that you used in your school for the reading intervention? What kind of reallocation or redistribution of staff or other resources was necessary? What costs, if any, were excluded from the list? Also, if you have your own budget for the program that you would be willing to share with me (in written or verbal form), please let me know. Any information you can disclose would be invaluable in learning more about how principals like you implement reading programs. If you would be able to take some time to talk with me about your experiences with [Program Name], I would be glad to schedule a call at your convenience. Might any of the following times work for you? [Times] Thank you for considering this request. I look forward to hearing from you soon. Sincerely, Jessica Simon Doctoral Candidate, Economics and Education Teachers College, Columbia University [email protected]
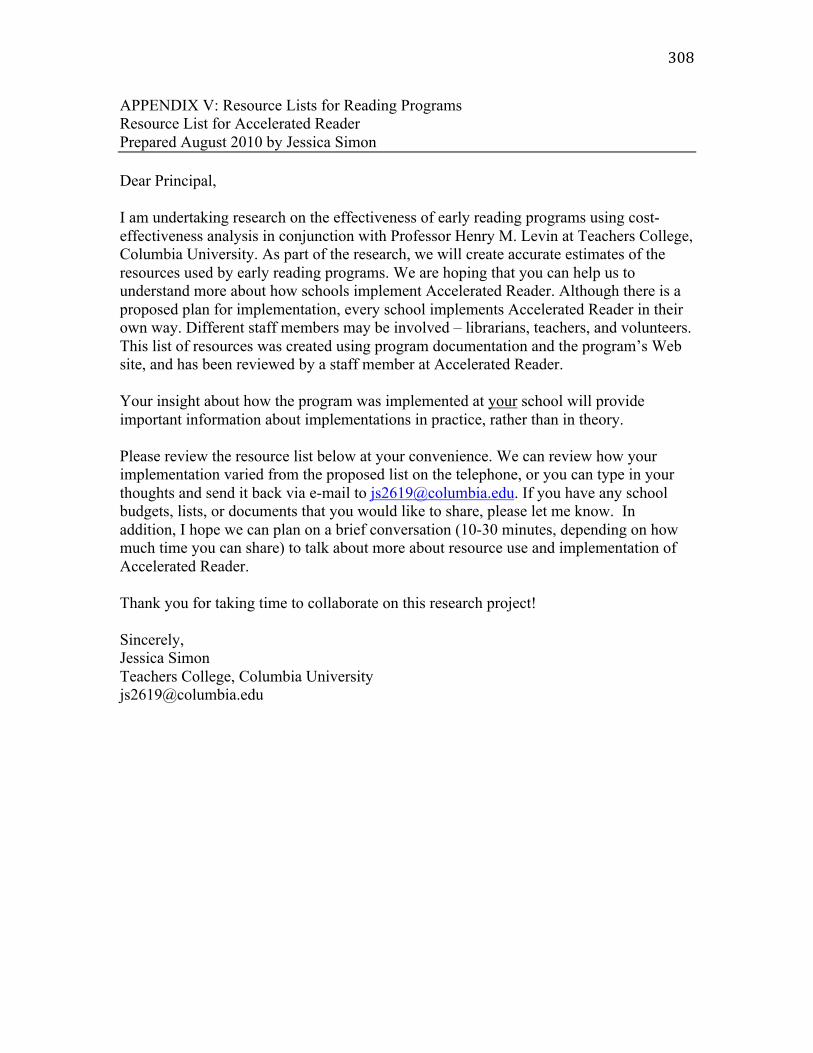
308
APPENDIX V: Resource Lists for Reading Programs Resource List for Accelerated Reader Prepared August 2010 by Jessica Simon Dear Principal, I am undertaking research on the effectiveness of early reading programs using cost-effectiveness analysis in conjunction with Professor Henry M. Levin at Teachers College, Columbia University. As part of the research, we will create accurate estimates of the resources used by early reading programs. We are hoping that you can help us to understand more about how schools implement Accelerated Reader. Although there is a proposed plan for implementation, every school implements Accelerated Reader in their own way. Different staff members may be involved – librarians, teachers, and volunteers. This list of resources was created using program documentation and the program’s Web site, and has been reviewed by a staff member at Accelerated Reader. Your insight about how the program was implemented at your school will provide important information about implementations in practice, rather than in theory. Please review the resource list below at your convenience. We can review how your implementation varied from the proposed list on the telephone, or you can type in your thoughts and send it back via e-mail to [email protected]. If you have any school budgets, lists, or documents that you would like to share, please let me know. In addition, I hope we can plan on a brief conversation (10-30 minutes, depending on how much time you can share) to talk about more about resource use and implementation of Accelerated Reader. Thank you for taking time to collaborate on this research project! Sincerely, Jessica Simon Teachers College, Columbia University [email protected]
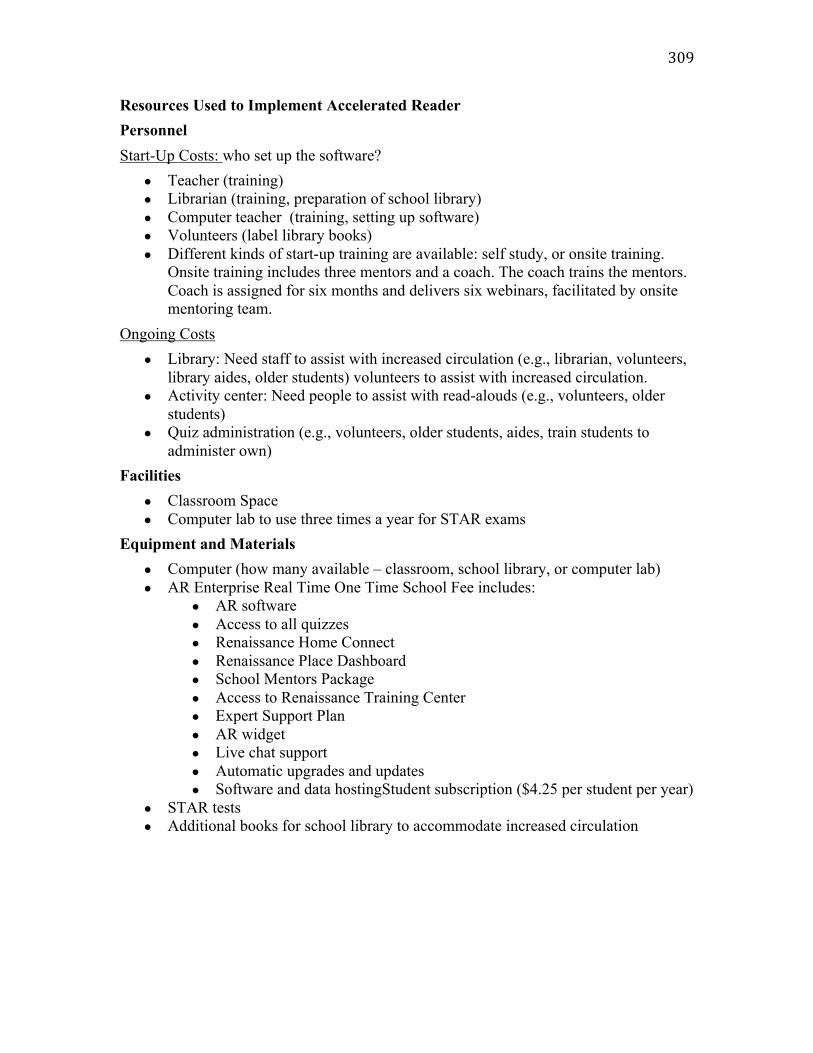
309
Resources Used to Implement Accelerated Reader Personnel Start-Up Costs: who set up the software? ● Teacher (training) ● Librarian (training, preparation of school library) ● Computer teacher (training, setting up software) ● Volunteers (label library books) ● Different kinds of start-up training are available: self study, or onsite training.
Onsite training includes three mentors and a coach. The coach trains the mentors. Coach is assigned for six months and delivers six webinars, facilitated by onsite mentoring team.
Ongoing Costs ● Library: Need staff to assist with increased circulation (e.g., librarian, volunteers,
library aides, older students) volunteers to assist with increased circulation. ● Activity center: Need people to assist with read-alouds (e.g., volunteers, older
students) ● Quiz administration (e.g., volunteers, older students, aides, train students to
administer own) Facilities ● Classroom Space ● Computer lab to use three times a year for STAR exams
Equipment and Materials ● Computer (how many available – classroom, school library, or computer lab) ● AR Enterprise Real Time One Time School Fee includes:
● AR software ● Access to all quizzes ● Renaissance Home Connect ● Renaissance Place Dashboard ● School Mentors Package ● Access to Renaissance Training Center ● Expert Support Plan ● AR widget ● Live chat support ● Automatic upgrades and updates ● Software and data hostingStudent subscription ($4.25 per student per year)
● STAR tests ● Additional books for school library to accommodate increased circulation

310
Resource List for Classwide Peer Tutoring Prepared August 2010 by Jessica Simon Although there is a proposed plan for implementation, every school implements Classwide Peer Tutoring in their own way. This list of resources was created using program documentation and the program’s Web site, and has been reviewed by a staff member at Classwide Peer Tutoring. Your insight about how the program was implemented at your school will provide important information about implementations in practice, rather than in theory. Please review the resource list below at your convenience. We can review how your implementation varied from the proposed list on the telephone, or you can type in your thoughts and send it back via e-mail to [email protected]. If you have any school budgets, lists, or documents that you would like to share, please let me know. Personnel ● Trainers (two?, for training) ● Substitute teachers for classroom teachers participating in training ● Teachers: participation in training, supervising tutoring 3-5 hours per week ● Administrators/School Leaders: participation in training ● Other meetings
Facilities ● Classroom Space – training; tutoring sessions in respective classrooms
Equipment and Materials ● Manual and four laminated charts ● Learning Management System software
Flash card generator and manual (preschool, kindergarten and first grade only – for pre-readers)
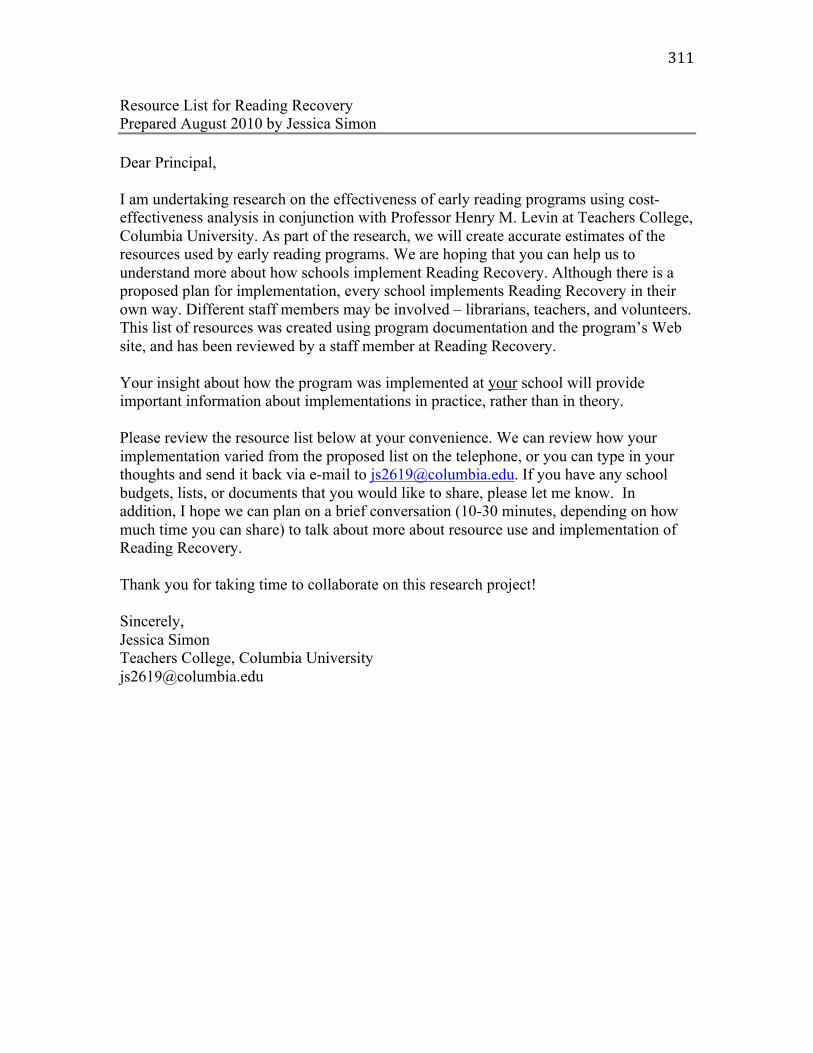
311
Resource List for Reading Recovery Prepared August 2010 by Jessica Simon Dear Principal, I am undertaking research on the effectiveness of early reading programs using cost-effectiveness analysis in conjunction with Professor Henry M. Levin at Teachers College, Columbia University. As part of the research, we will create accurate estimates of the resources used by early reading programs. We are hoping that you can help us to understand more about how schools implement Reading Recovery. Although there is a proposed plan for implementation, every school implements Reading Recovery in their own way. Different staff members may be involved – librarians, teachers, and volunteers. This list of resources was created using program documentation and the program’s Web site, and has been reviewed by a staff member at Reading Recovery. Your insight about how the program was implemented at your school will provide important information about implementations in practice, rather than in theory. Please review the resource list below at your convenience. We can review how your implementation varied from the proposed list on the telephone, or you can type in your thoughts and send it back via e-mail to [email protected]. If you have any school budgets, lists, or documents that you would like to share, please let me know. In addition, I hope we can plan on a brief conversation (10-30 minutes, depending on how much time you can share) to talk about more about resource use and implementation of Reading Recovery. Thank you for taking time to collaborate on this research project! Sincerely, Jessica Simon Teachers College, Columbia University [email protected]
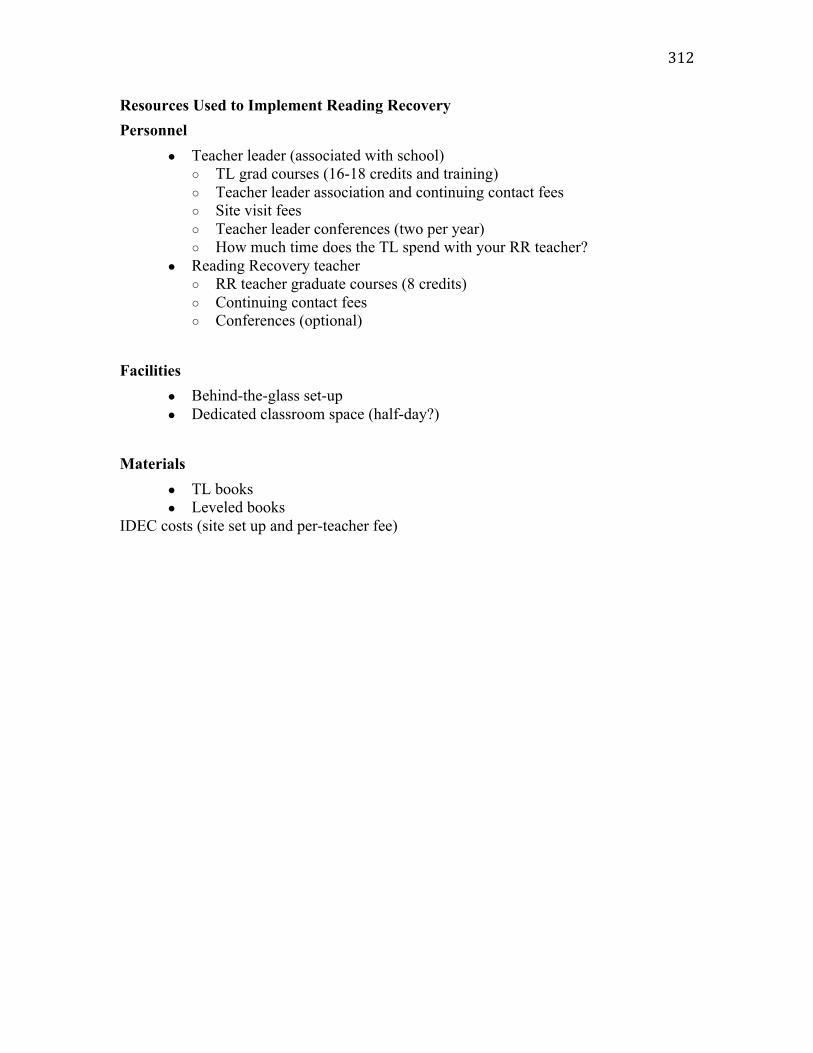
312
Resources Used to Implement Reading Recovery Personnel
● Teacher leader (associated with school) ○ TL grad courses (16-18 credits and training) ○ Teacher leader association and continuing contact fees ○ Site visit fees ○ Teacher leader conferences (two per year) ○ How much time does the TL spend with your RR teacher?
● Reading Recovery teacher ○ RR teacher graduate courses (8 credits) ○ Continuing contact fees ○ Conferences (optional)
Facilities
● Behind-the-glass set-up ● Dedicated classroom space (half-day?)
Materials
● TL books ● Leveled books
IDEC costs (site set up and per-teacher fee)
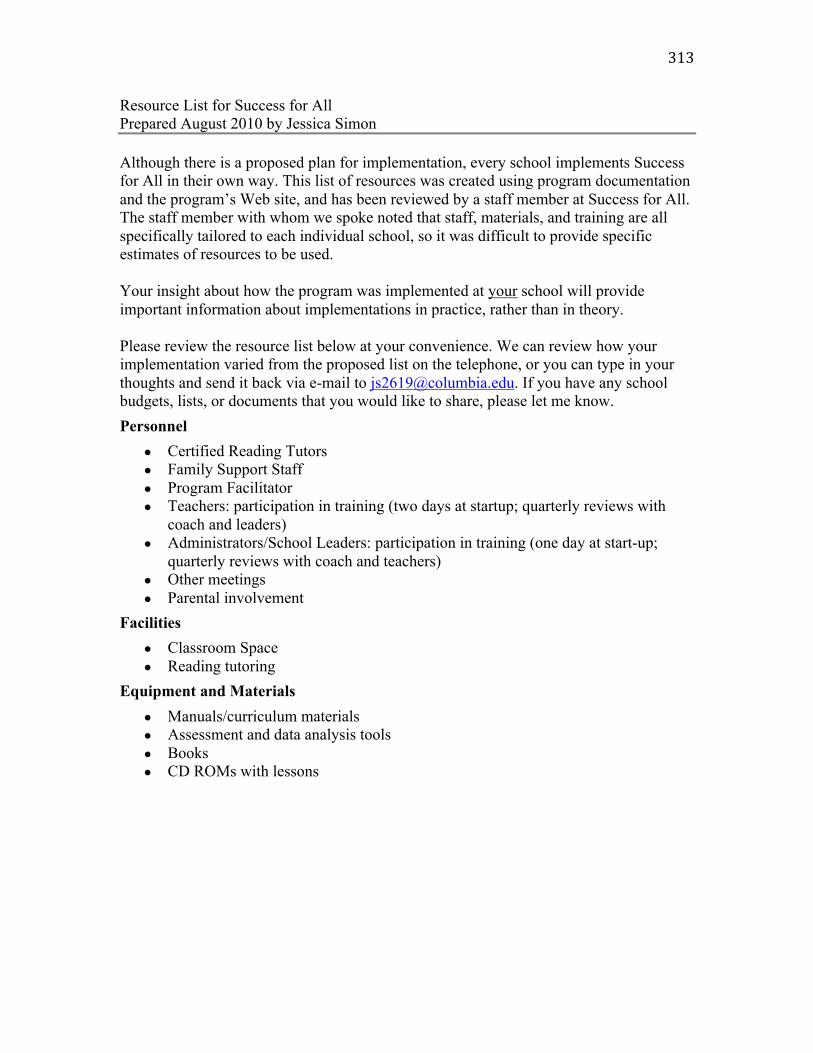
313
Resource List for Success for All Prepared August 2010 by Jessica Simon Although there is a proposed plan for implementation, every school implements Success for All in their own way. This list of resources was created using program documentation and the program’s Web site, and has been reviewed by a staff member at Success for All. The staff member with whom we spoke noted that staff, materials, and training are all specifically tailored to each individual school, so it was difficult to provide specific estimates of resources to be used. Your insight about how the program was implemented at your school will provide important information about implementations in practice, rather than in theory. Please review the resource list below at your convenience. We can review how your implementation varied from the proposed list on the telephone, or you can type in your thoughts and send it back via e-mail to [email protected]. If you have any school budgets, lists, or documents that you would like to share, please let me know. Personnel ● Certified Reading Tutors ● Family Support Staff ● Program Facilitator ● Teachers: participation in training (two days at startup; quarterly reviews with
coach and leaders) ● Administrators/School Leaders: participation in training (one day at start-up;
quarterly reviews with coach and teachers) ● Other meetings ● Parental involvement
Facilities ● Classroom Space ● Reading tutoring
Equipment and Materials ● Manuals/curriculum materials ● Assessment and data analysis tools ● Books ● CD ROMs with lessons
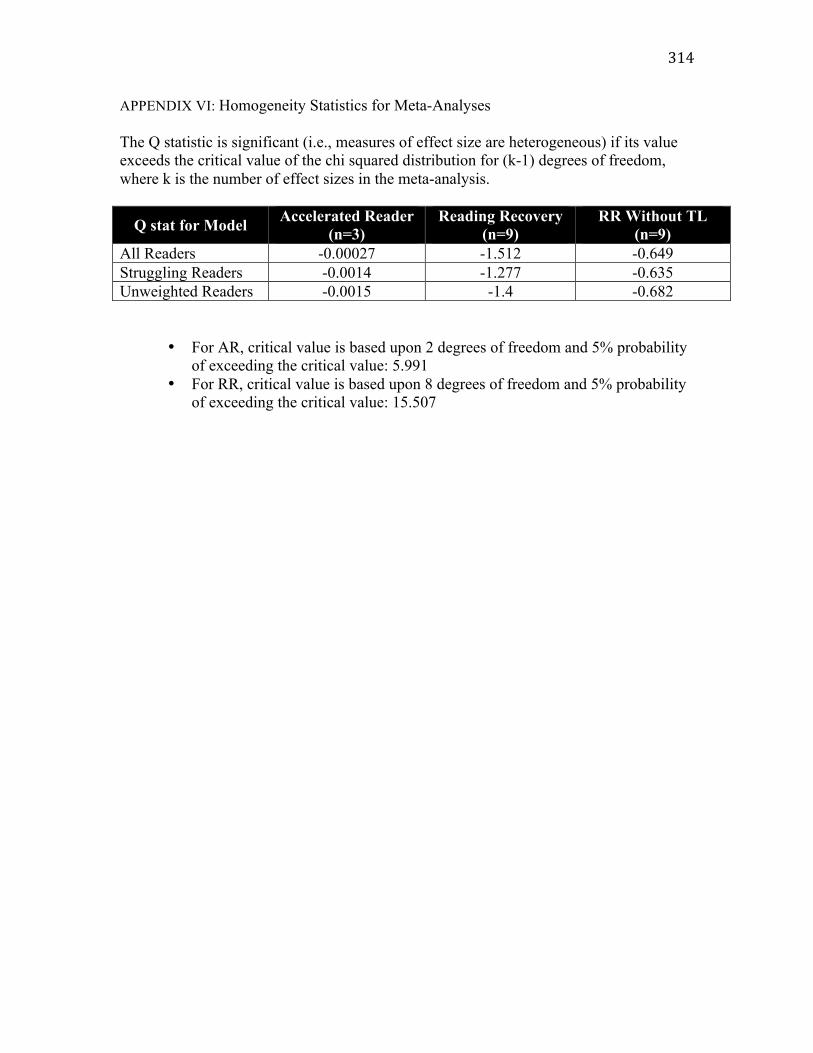
314
APPENDIX VI: Homogeneity Statistics for Meta-Analyses The Q statistic is significant (i.e., measures of effect size are heterogeneous) if its value exceeds the critical value of the chi squared distribution for (k-1) degrees of freedom, where k is the number of effect sizes in the meta-analysis.
Q stat for Model Accelerated Reader (n=3)
Reading Recovery (n=9)
RR Without TL (n=9)
All Readers -0.00027 -1.512 -0.649 Struggling Readers -0.0014 -1.277 -0.635 Unweighted Readers -0.0015 -1.4 -0.682
• For AR, critical value is based upon 2 degrees of freedom and 5% probability of exceeding the critical value: 5.991
• For RR, critical value is based upon 8 degrees of freedom and 5% probability of exceeding the critical value: 15.507
![Ana DUMITRAN, Zugravul Simon Bălgradeanul la Sebeş [Painter Simon Bălgradeanul from Sebeş]](https://img.pdfslide.net/doc/110x75/63152a3585333559270d03dd/ana-dumitran-zugravul-simon-balgradeanul-la-sebes-painter-simon-balgradeanul.jpg)


