Embed Size (px)
Citation preview
Image from Dundas, et al.Science vol. 359, pp. 199–201 (2018)
Simulated Water Well Performance on Mars
Stephen Hoffman, Ph.D.Aerospace Corp.
Alida AndrewsAerospace Corp.
Kevin WattsNASA/Johnson Space Center
Introduction
• Previous work by the authors addressed a pair of questions posed during studies of the
Evolvable Mars Campaign (EMC): what are the implications of “unlimited” water on a human
Mars mission and how would these quantities of water be acquired?
• That initial work documented findings associated with the following:
– The sources of water observed on Mars will be described
– Uses for locally obtained water are identified and estimated quantities needed for each of
these uses are presented
– Methods for accessing local sources of Martian water are reviewed
– Results from a simulation to estimate time and power required for one method – the
Rodriguez Well
• Rodriguez Well simulations were based on terrestrial environmental conditions, recognizing
that Mars environmental conditions needed to be applied.
• Several parameters needed to properly implement the Rodriguez Well simulation were not
adequately understood to allow for code modification; experimental data was needed
• This presentation describes progress since the previous presentation of results:
– Recent discoveries on Mars reinforcing the type and quantities of water ice potentially
accessible by human crews
– Estimates of the type of dedicated equipment needed to access this ice on Mars
– Identification of specific changes needed in the Rodriguez Well simulation code and
preliminary results of the Well performance that will result
– Description of the experiments that will be conducted to generate the Mars-specific
parameters needed for simulation modification
2
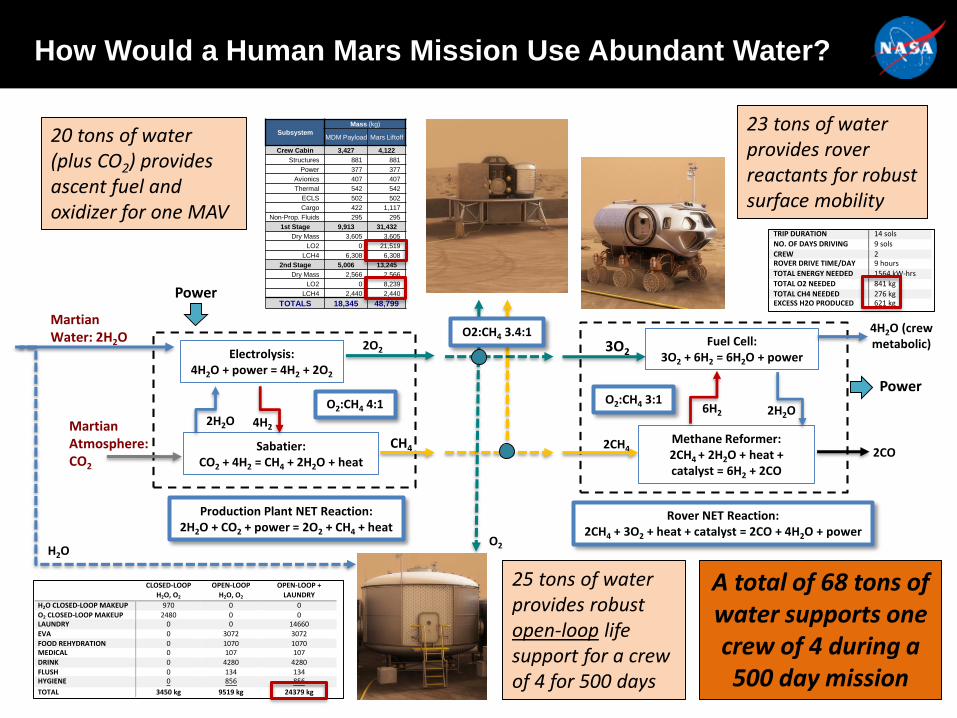
TRIPDURATION 14sols
NO.OFDAYSDRIVING 9sols
CREW 2ROVERDRIVETIME/DAY 9hours
TOTALENERGYNEEDED 1564kW-hrs
TOTALO2NEEDED 841kg
TOTALCH4NEEDED 276kgEXCESSH2OPRODUCED 621kg
Electrolysis:4H2O + power = 4H2 + 2O2
Sabatier:CO2 + 4H2 = CH4 + 2H2O + heat
Production Plant NET Reaction:2H2O + CO2 + power = 2O2 + CH4 + heat
4H22H2O
Martian Water: 2H2O
2O2
CH4
Martian Atmosphere: CO2
Methane Reformer:2CH4 + 2H2O + heat + catalyst = 6H2 + 2CO
Fuel Cell:3O2 + 6H2 = 6H2O + power
6H2 2H2O
2CH4 2CO
3O2
Power
4H2O (crew metabolic)
Rover NET Reaction:2CH4 + 3O2 + heat + catalyst = 2CO + 4H2O + power
O2:CH4 3.4:1
Subsystem
Mass (kg)
MDM Payload Mars Liftoff
Crew Cabin 3,427 4,122
Structures 881 881
Power 377 377
Avionics 407 407
Thermal 542 542
ECLS 502 502
Cargo 422 1,117
Non-Prop. Fluids 295 295
1st Stage 9,913 31,432
Dry Mass 3,605 3,605
LO2 0 21,519
LCH4 6,308 6,308
2nd Stage 5,006 13,245
Dry Mass 2,566 2,566
LO2 0 8,239
LCH4 2,440 2,440
TOTALS 18,345 48,799
O2:CH4 3:1O2:CH4 4:1
H2OO2
Power
CLOSED-LOOPH2O,O2
OPEN-LOOPH2O,O2
OPEN-LOOP+LAUNDRY
H2OCLOSED-LOOPMAKEUP 970 0 0
O2CLOSED-LOOPMAKEUP 2480 0 0LAUNDRY 0 0 14660EVA 0 3072 3072
FOODREHYDRATION 0 1070 1070MEDICAL 0 107 107
DRINK 0 4280 4280FLUSH 0 134 134HYGIENE 0 856 856
TOTAL 3450kg 9519kg 24379kg
How Would a Human Mars Mission Use Abundant Water?
20 tons of water (plus CO2) provides ascent fuel and oxidizer for one MAV
25 tons of water provides robust open-loop life support for a crew of 4 for 500 days
23 tons of water provides rover reactants for robust surface mobility
A total of 68 tons of water supports one crew of 4 during a 500 day mission
v ------------------1
I L-----------------1
I I I
•
·---~-----------1-1·
r1 !¢ I
..
------------------~
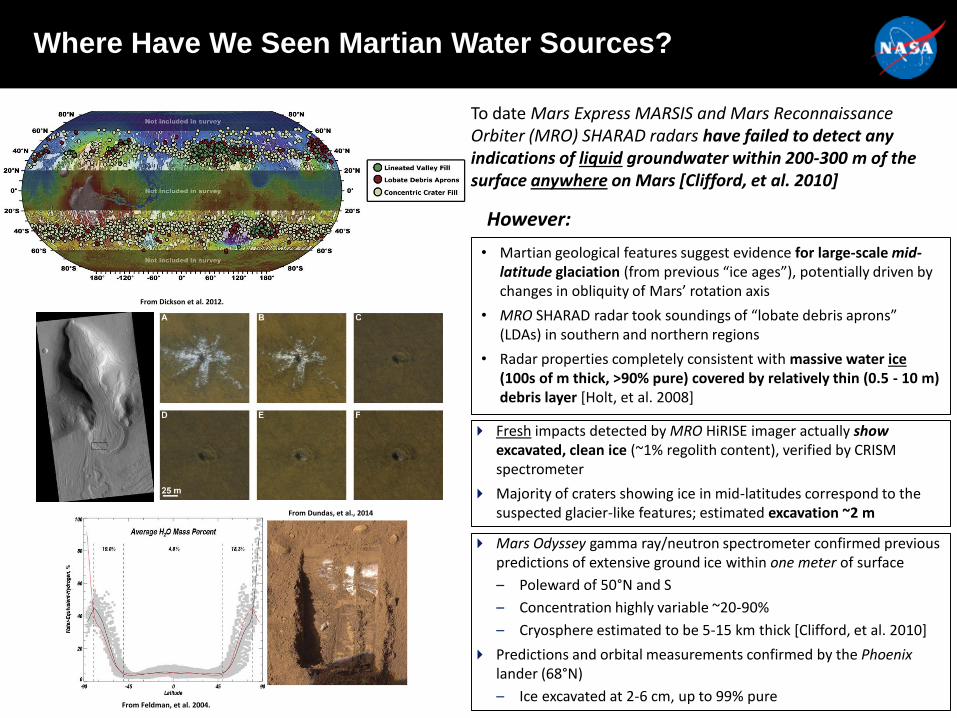
Where Have We Seen Martian Water Sources?
• Martian geological features suggest evidence for large-scale mid-latitude glaciation (from previous “ice ages”), potentially driven by changes in obliquity of Mars’ rotation axis
• MRO SHARAD radar took soundings of “lobate debris aprons” (LDAs) in southern and northern regions
• Radar properties completely consistent with massive water ice(100s of m thick, >90% pure) covered by relatively thin (0.5 - 10 m) debris layer [Holt, et al. 2008]
From Dickson et al. 2012.
From Dundas, et al., 2014
Fresh impacts detected by MRO HiRISE imager actually showexcavated, clean ice (~1% regolith content), verified by CRISM spectrometer
Majority of craters showing ice in mid-latitudes correspond to the suspected glacier-like features; estimated excavation ~2 m
Mars Odyssey gamma ray/neutron spectrometer confirmed previous predictions of extensive ground ice within one meter of surface
– Poleward of 50°N and S
– Concentration highly variable ~20-90%
– Cryosphere estimated to be 5-15 km thick [Clifford, et al. 2010]
Predictions and orbital measurements confirmed by the Phoenix lander (68°N)
– Ice excavated at 2-6 cm, up to 99% pureFrom Feldman, et al. 2004.
To date Mars Express MARSIS and Mars Reconnaissance Orbiter (MRO) SHARAD radars have failed to detect any indications of liquid groundwater within 200-300 m of the surface anywhere on Mars [Clifford, et al. 2010]
However:
1 so· -120· -60"
Average H,O Mass Percent
'·"'
o·
2o·s
• Lineated Valley Fill
• Lobate Debris Aprons
0 Concentric Crater Fill
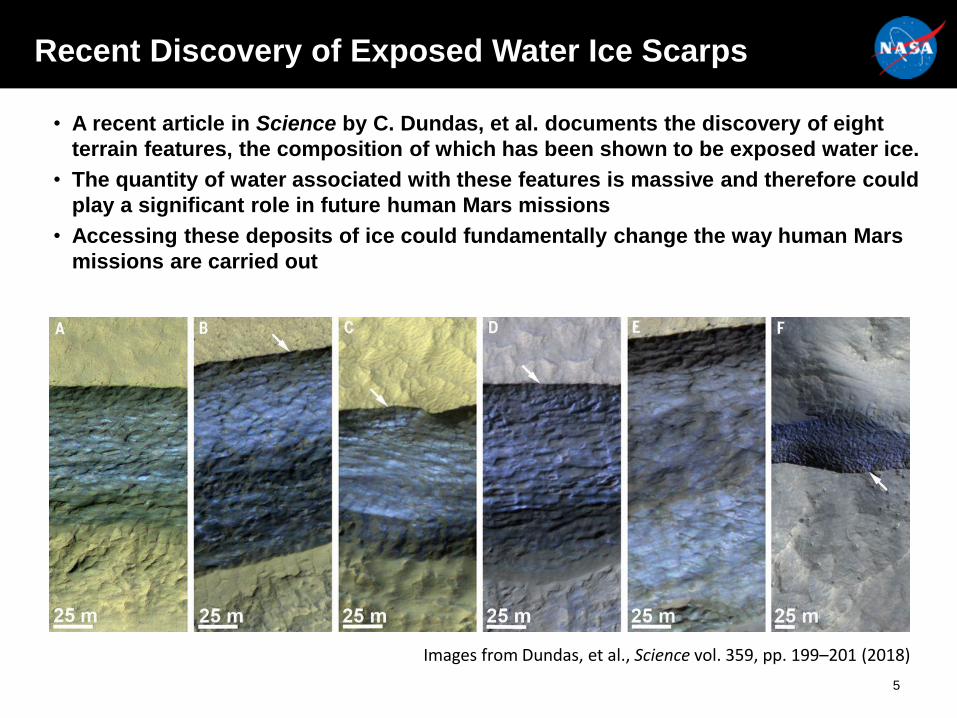
Recent Discovery of Exposed Water Ice Scarps
• A recent article in Science by C. Dundas, et al. documents the discovery of eight
terrain features, the composition of which has been shown to be exposed water ice.
• The quantity of water associated with these features is massive and therefore could
play a significant role in future human Mars missions
• Accessing these deposits of ice could fundamentally change the way human Mars
missions are carried out
5
Images from Dundas, et al., Science vol. 359, pp. 199–201 (2018)
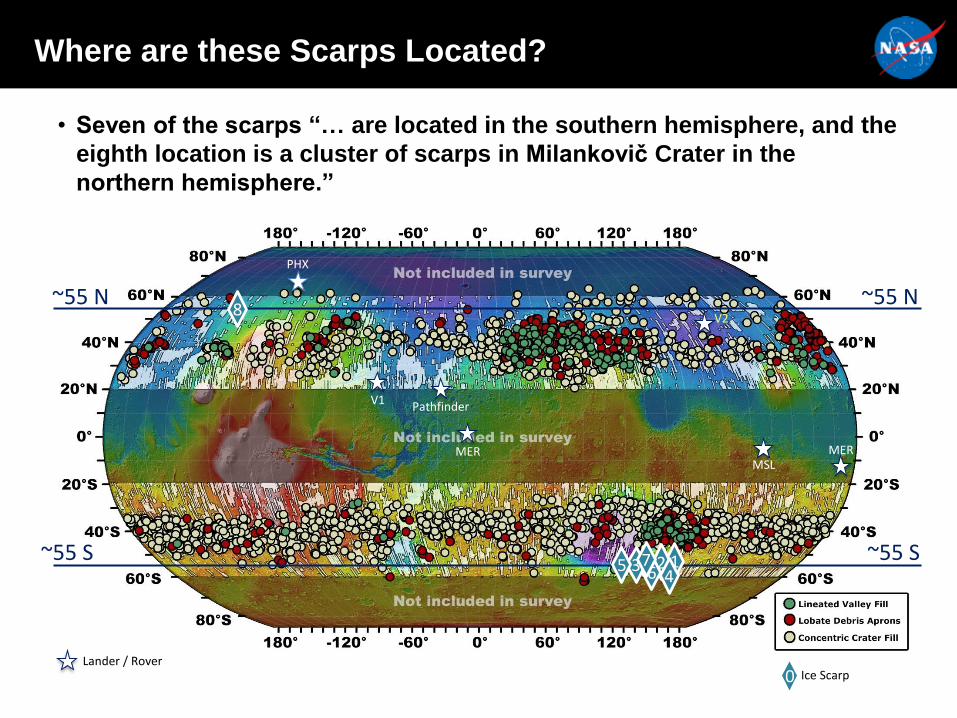
Where are these Scarps Located?
• Seven of the scarps “… are located in the southern hemisphere, and the
eighth location is a cluster of scarps in Milankovič Crater in the
northern hemisphere.”
1234
5 67
8~55 N
~55 S
0 Ice Scarp
~55 N
~55 S
PHX
V1
V2
Pathfinder
MERMERMSL
Lander / Rover
180° -120° -60° oo 60° 120° 180°
oo oo
20°s
Lineated Valley Fill
180° -120° -60° oo 60° 120° 180° 0 Concentric Crater Fill
* •
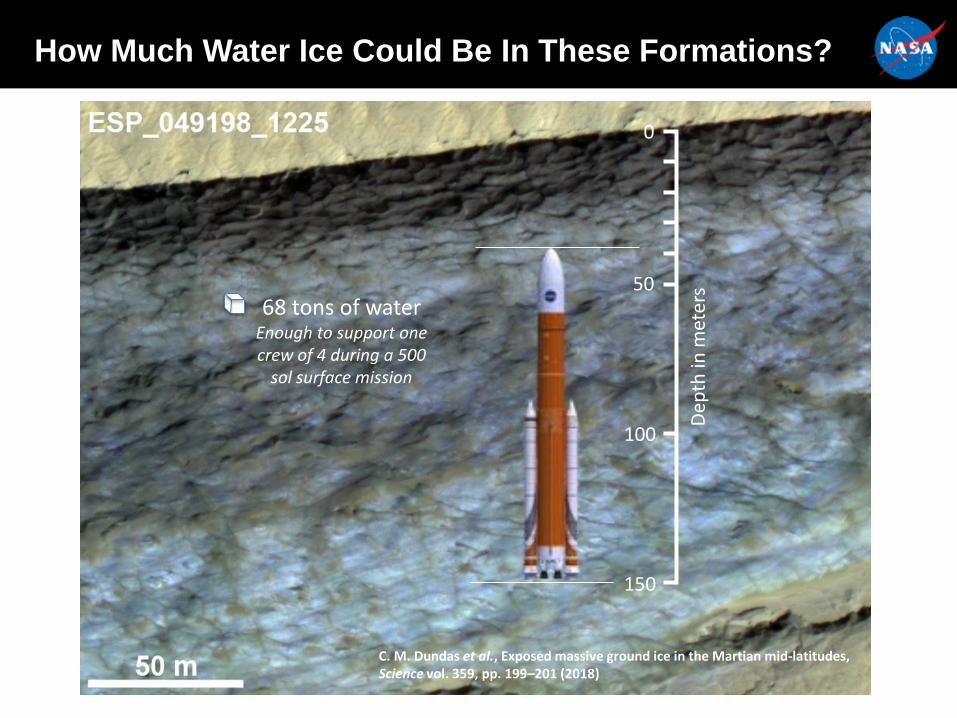
C. M. Dundas et al., Exposed massive ground ice in the Martian mid-latitudes, Science vol. 359, pp. 199–201 (2018)
0
50
150
100
How Much Water Ice Could Be In These Formations?
Dep
th in
met
ers
68 tons of waterEnough to support one crew of 4 during a 500
sol surface mission
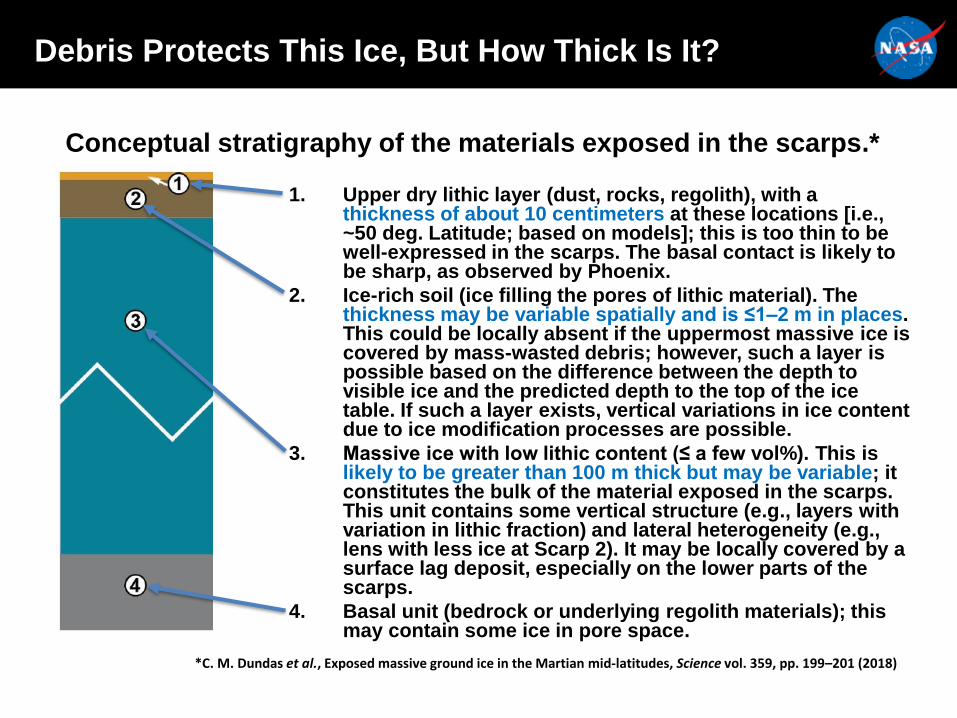
Debris Protects This Ice, But How Thick Is It?
1. Upper dry lithic layer (dust, rocks, regolith), with a thickness of about 10 centimeters at these locations [i.e., ~50 deg. Latitude; based on models]; this is too thin to be well-expressed in the scarps. The basal contact is likely to be sharp, as observed by Phoenix.
2. Ice-rich soil (ice filling the pores of lithic material). The thickness may be variable spatially and is ≤1–2 m in places. This could be locally absent if the uppermost massive ice is covered by mass-wasted debris; however, such a layer is possible based on the difference between the depth to visible ice and the predicted depth to the top of the ice table. If such a layer exists, vertical variations in ice content due to ice modification processes are possible.
3. Massive ice with low lithic content (≤ a few vol%). This is likely to be greater than 100 m thick but may be variable; it constitutes the bulk of the material exposed in the scarps. This unit contains some vertical structure (e.g., layers with variation in lithic fraction) and lateral heterogeneity (e.g., lens with less ice at Scarp 2). It may be locally covered by a surface lag deposit, especially on the lower parts of the scarps.
4. Basal unit (bedrock or underlying regolith materials); this may contain some ice in pore space.
*C. M. Dundas et al., Exposed massive ground ice in the Martian mid-latitudes, Science vol. 359, pp. 199–201 (2018)
Conceptual stratigraphy of the materials exposed in the scarps.*
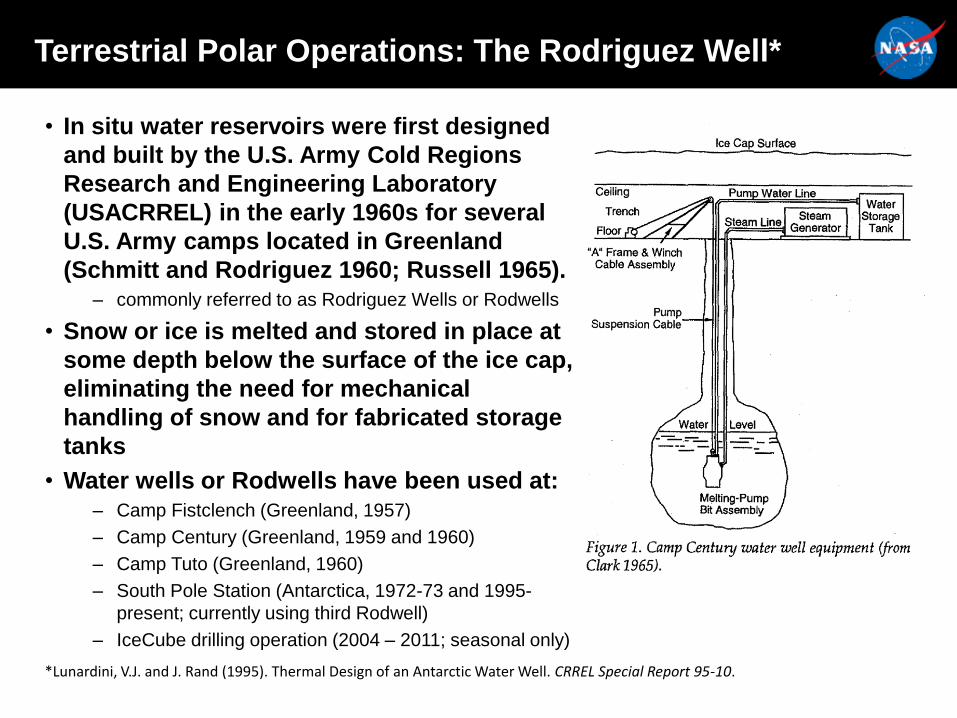
Terrestrial Polar Operations: The Rodriguez Well*
• In situ water reservoirs were first designed
and built by the U.S. Army Cold Regions
Research and Engineering Laboratory
(USACRREL) in the early 1960s for several
U.S. Army camps located in Greenland
(Schmitt and Rodriguez 1960; Russell 1965).– commonly referred to as Rodriguez Wells or Rodwells
• Snow or ice is melted and stored in place at
some depth below the surface of the ice cap,
eliminating the need for mechanical
handling of snow and for fabricated storage
tanks
• Water wells or Rodwells have been used at:– Camp Fistclench (Greenland, 1957)
– Camp Century (Greenland, 1959 and 1960)
– Camp Tuto (Greenland, 1960)
– South Pole Station (Antarctica, 1972-73 and 1995-
present; currently using third Rodwell)
– IceCube drilling operation (2004 – 2011; seasonal only)
*Lunardini, V.J. and J. Rand (1995). Thermal Design of an Antarctic Water Well. CRREL Special Report 95-10.
Floor
"A" Frame & Winch Cable Assembly
Pump Suspension Cable
Ice Cap Surface
Melting-Pump Bit Assembly
Figure 1. Camp Century water well equipment (from Clark 1965).
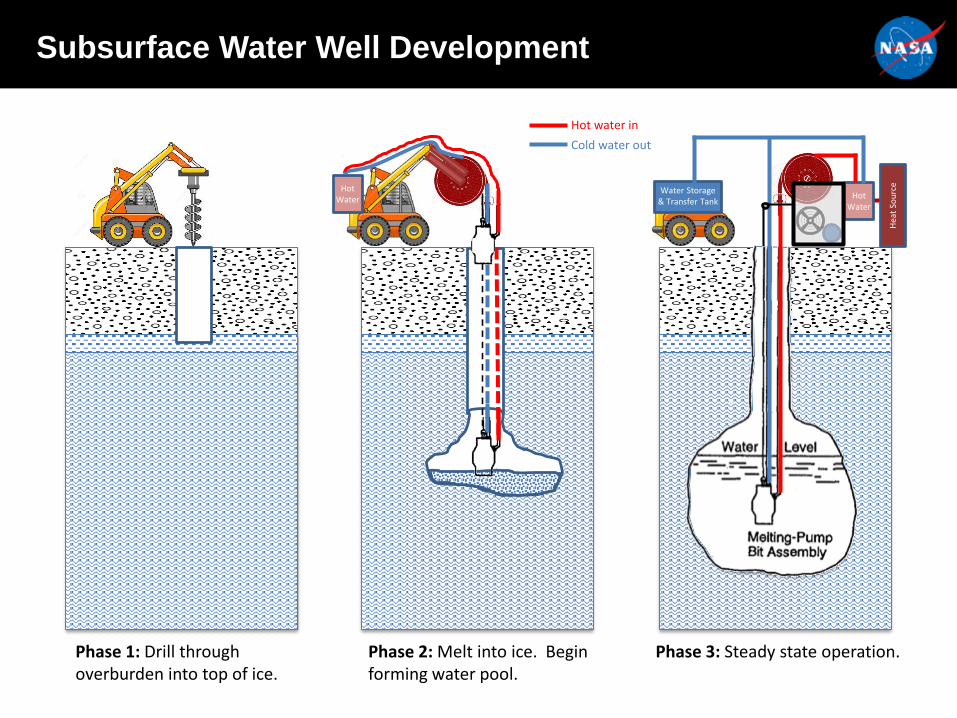
Subsurface Water Well Development
HotWater
Hot water in
Cold water out
Phase 1: Drill through overburden into top of ice.
Phase 2: Melt into ice. Begin forming water pool.
Phase 3: Steady state operation.
Water Storage & Transfer Tank
HotWater
Hea
t So
urc
e
-
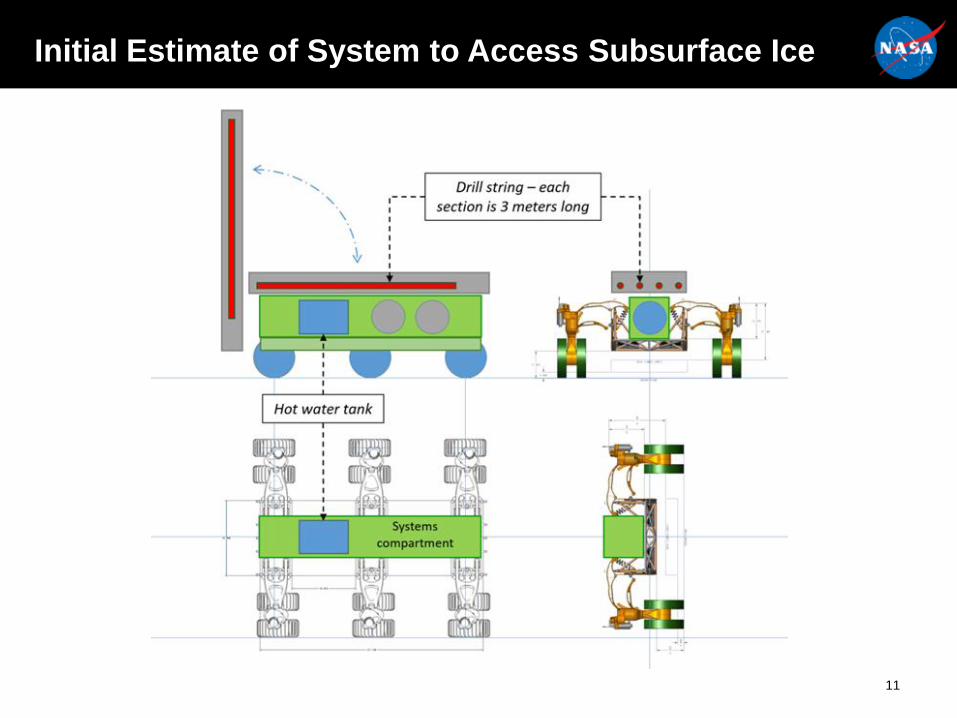
Initial Estimate of System to Access Subsurface Ice
11
,- -- -I
\
~
Hot wa'.er tank
l
Drill string - each section is 3 meters Jong -- - '
I I
''
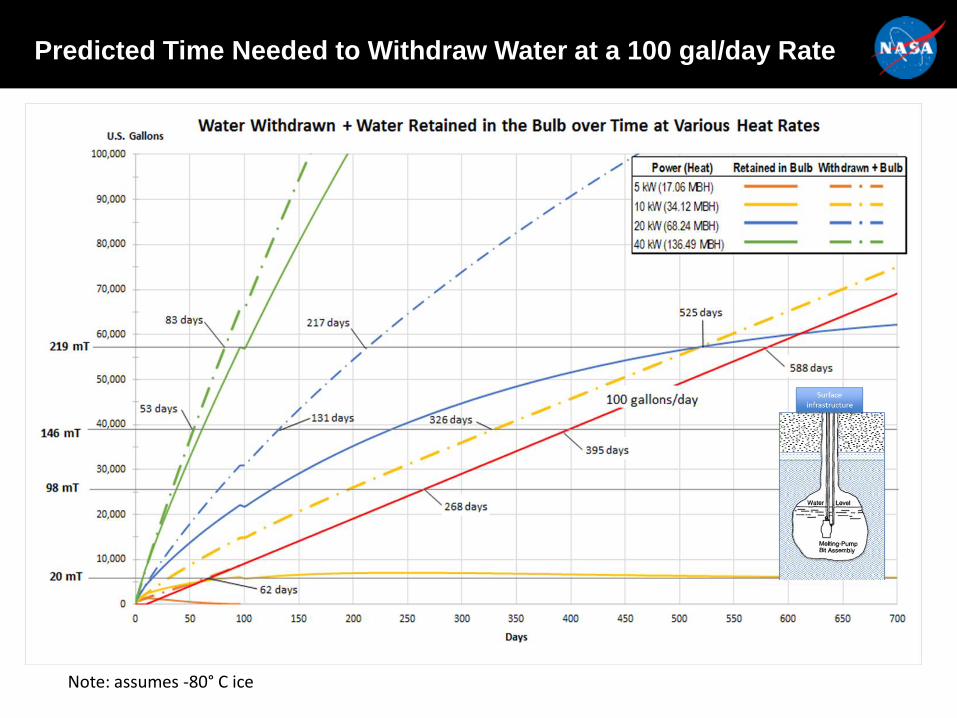
Predicted Time Needed to Withdraw Water at a 100 gal/day Rate
Note: assumes -80° C ice
U.S. Gallons Water Withdrawn + Water Retained in the Bulb over Time at Various Heat Rates
100,000
I / Retained in Bulb 'Mthdrawn + Bulb /
90,000
I /
/ 10 -·-/ 20 -·-
80,000 I / 40 -·-/
/ 70,000 /
/ 217 days /
60,000 / 219 mT /
S0,000 / /
40000 146 mT
/ 30,000
98 ml
20,000
10,000
20 ml
0
0 so 100 lSO 200 250 300 350 400 so soo sso 600 650 700
Days
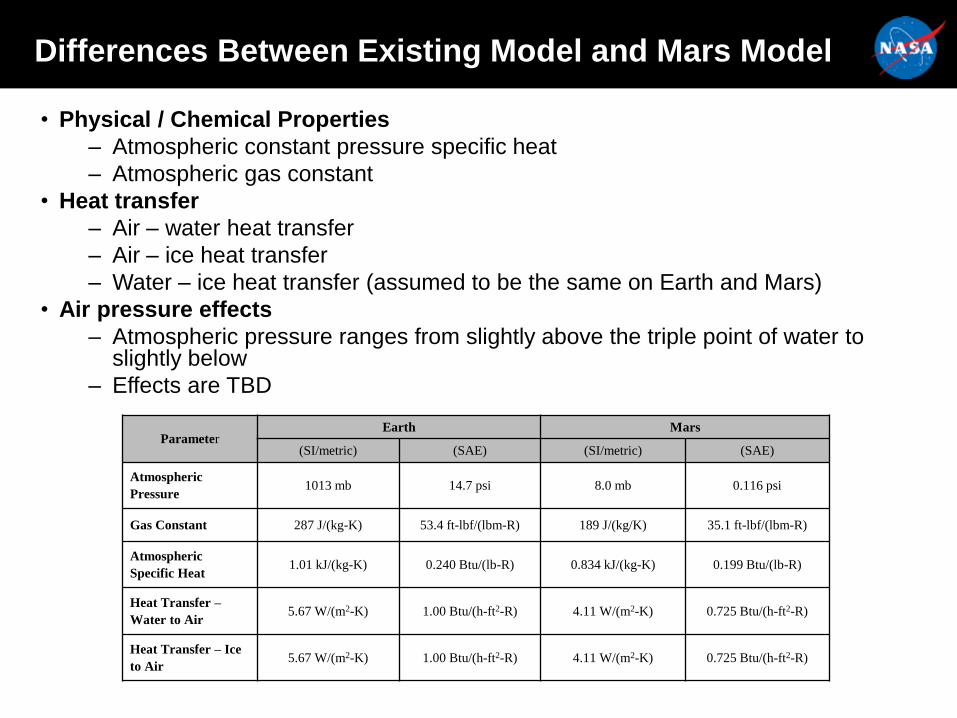
Differences Between Existing Model and Mars Model
• Physical / Chemical Properties
– Atmospheric constant pressure specific heat
– Atmospheric gas constant
• Heat transfer
– Air – water heat transfer
– Air – ice heat transfer
– Water – ice heat transfer (assumed to be the same on Earth and Mars)
• Air pressure effects
– Atmospheric pressure ranges from slightly above the triple point of water to slightly below
– Effects are TBD
ParameterEarth Mars
(SI/metric) (SAE) (SI/metric) (SAE)
Atmospheric
Pressure1013 mb 14.7 psi 8.0 mb 0.116 psi
Gas Constant 287 J/(kg-K) 53.4 ft-lbf/(lbm-R) 189 J/(kg/K) 35.1 ft-lbf/(lbm-R)
Atmospheric
Specific Heat1.01 kJ/(kg-K) 0.240 Btu/(lb-R) 0.834 kJ/(kg-K) 0.199 Btu/(lb-R)
Heat Transfer –
Water to Air5.67 W/(m2-K) 1.00 Btu/(h-ft2-R) 4.11 W/(m2-K) 0.725 Btu/(h-ft2-R)
Heat Transfer – Ice
to Air5.67 W/(m2-K) 1.00 Btu/(h-ft2-R) 4.11 W/(m2-K) 0.725 Btu/(h-ft2-R)
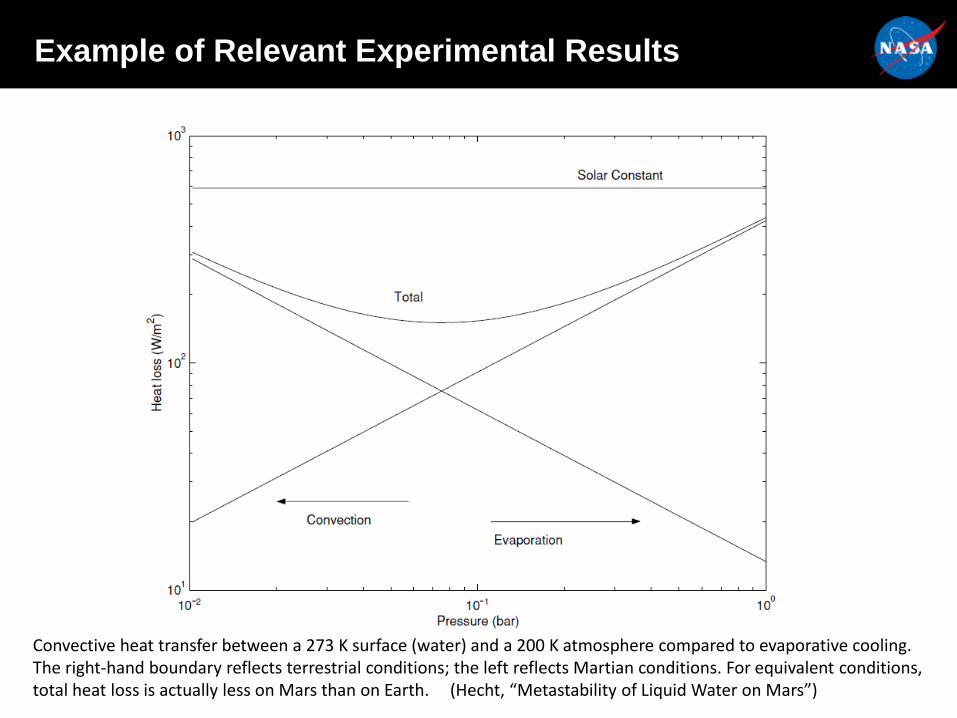
Convective heat transfer between a 273 K surface (water) and a 200 K atmosphere compared to evaporative cooling. The right-hand boundary reflects terrestrial conditions; the left reflects Martian conditions. For equivalent conditions, total heat loss is actually less on Mars than on Earth. (Hecht, “Metastability of Liquid Water on Mars”)
Example of Relevant Experimental Results
co Q)
I
103 ------------------------------------
Solar Constant
Total
Convection
Evaporation
10, ~----~--~-~-~-~~~~~----~--~-~-~-~~~~ 10-2 10-1
Pressure (bar)
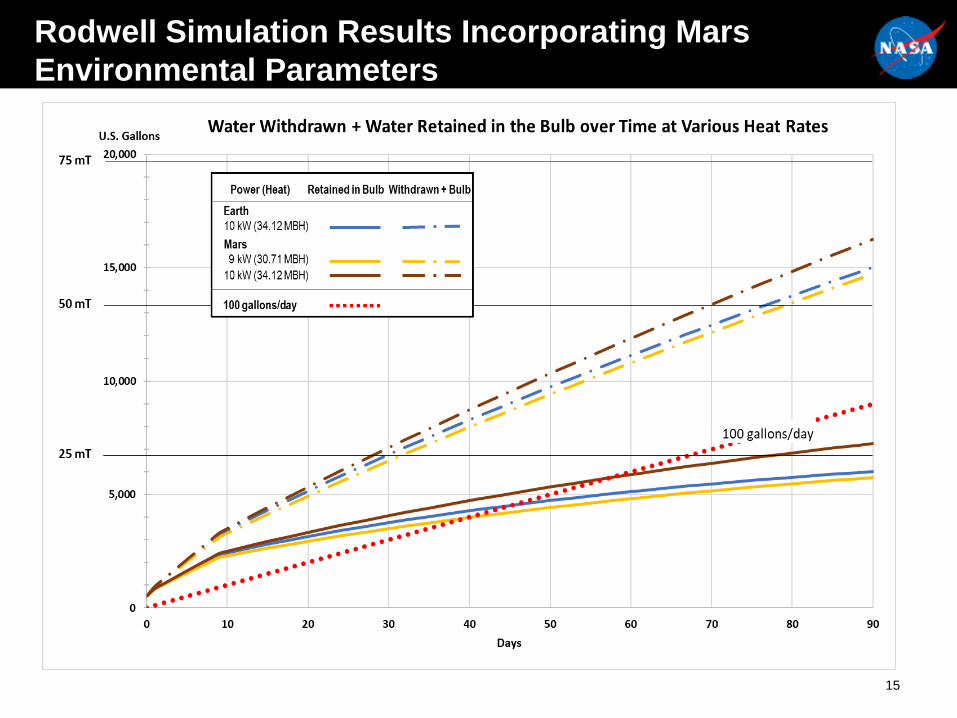
Rodwell Simulation Results Incorporating Mars
Environmental Parameters
15
75ml
SOmT
25ml
U.S. Gallons
20,000
15,000
10,000
5,000
Water Withdrawn + Water Retained in the Bulb over Time at Various Heat Rates
Power (Heat) Retained in Bulb Withdrawn+ Bulb
Earth 10kW(34.12MBH) --- - • -Mars 9 kW (30.71 MBH)
10 kW (34.12MBH)
100 gallons/day _.,,,,,,· _-:::,, · . / . -:::,,
/ ~ . .,,,,,,· ~ · . . ~ ·. :;;;..,-
/ . ::;;.,, . ~ . / . :;;;..,-. -:::,,
~ · .
.. ~ . \ ~ .
,ti, .
.- ·. :::---~ . ·. :::---
••••••• •••••••••
••
••••••• ••
•••••
100 gallons/day . --••
•• •••••
0 _._._..c.,_ ___ ,__ ___ ___. ____ __._ ____ __._ ____ _._ ____ _.__ ____ _.__ ____ ,__ ___ __,
0 10 20 30 40 50 60 70 80 90
Days
~ 24 in
~ 24 in
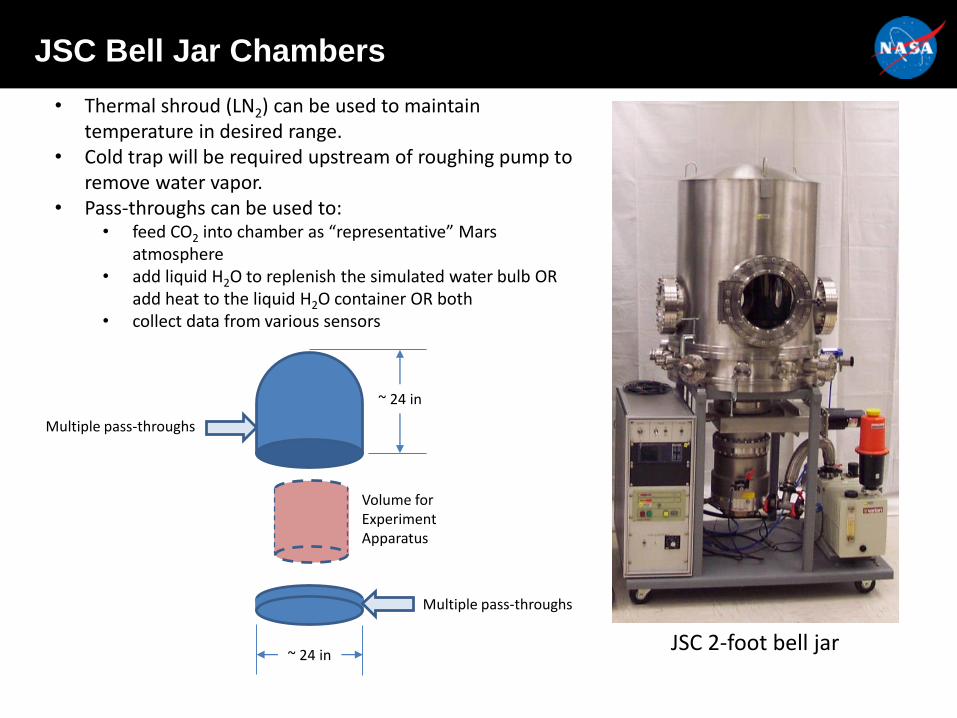
• Thermal shroud (LN2) can be used to maintain temperature in desired range.
• Cold trap will be required upstream of roughing pump to remove water vapor.
• Pass-throughs can be used to: • feed CO2 into chamber as “representative” Mars
atmosphere• add liquid H2O to replenish the simulated water bulb OR
add heat to the liquid H2O container OR both• collect data from various sensors
Multiple pass-throughs
Multiple pass-throughs
Volume for Experiment Apparatus
JSC 2-foot bell jar
JSC Bell Jar Chambers
---
r _l_
Summary
• Work continues to understand water resources available on Mars and
means to access them for human missions.
• New discoveries of exposed ice scarps help confirm previous radar
indications as well as characterize the vertical profile of some ice
deposits
• Based on this improved knowledge, initial estimates have been made
regarding equipment needed to access ice deposits
• Improvements to Rodriguez Well simulations are underway
– Experiments are being designed to determine parameters under Mars
surface environmental conditions
– Experimental data from similar experiments is being used to understand
simulation trends – results are favorable
• Next steps include completion of experimental tasks and improving
Rodwell simulation with experiment results
17

backup
18
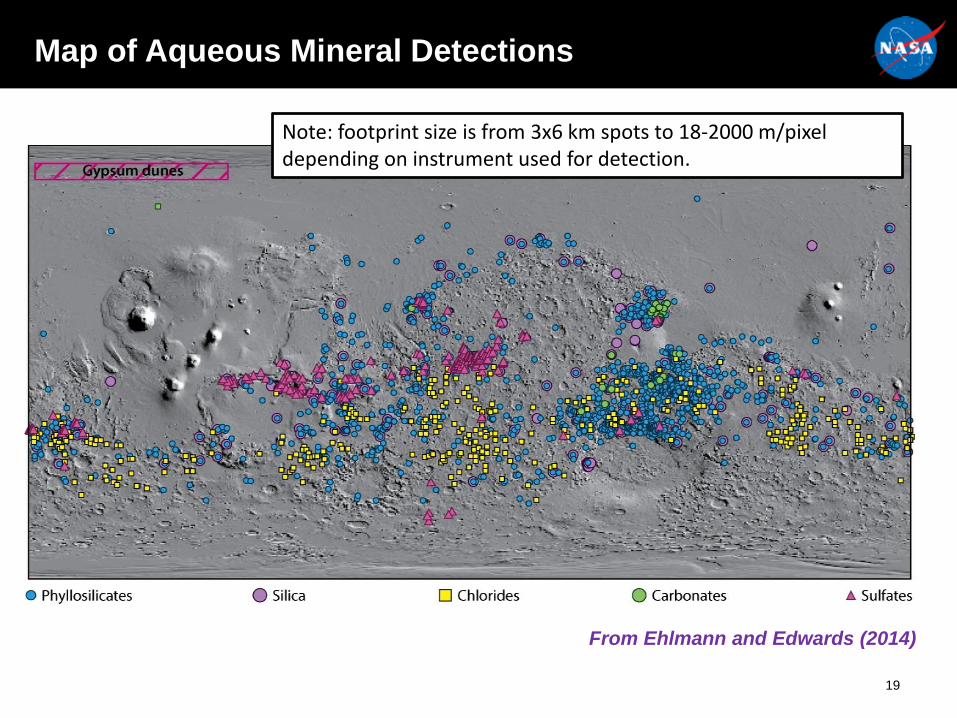
Map of Aqueous Mineral Detections
19
Note: footprint size is from 3x6 km spots to 18-2000 m/pixel depending on instrument used for detection.
From Ehlmann and Edwards (2014)
O Phyllosilicates • Chlorides
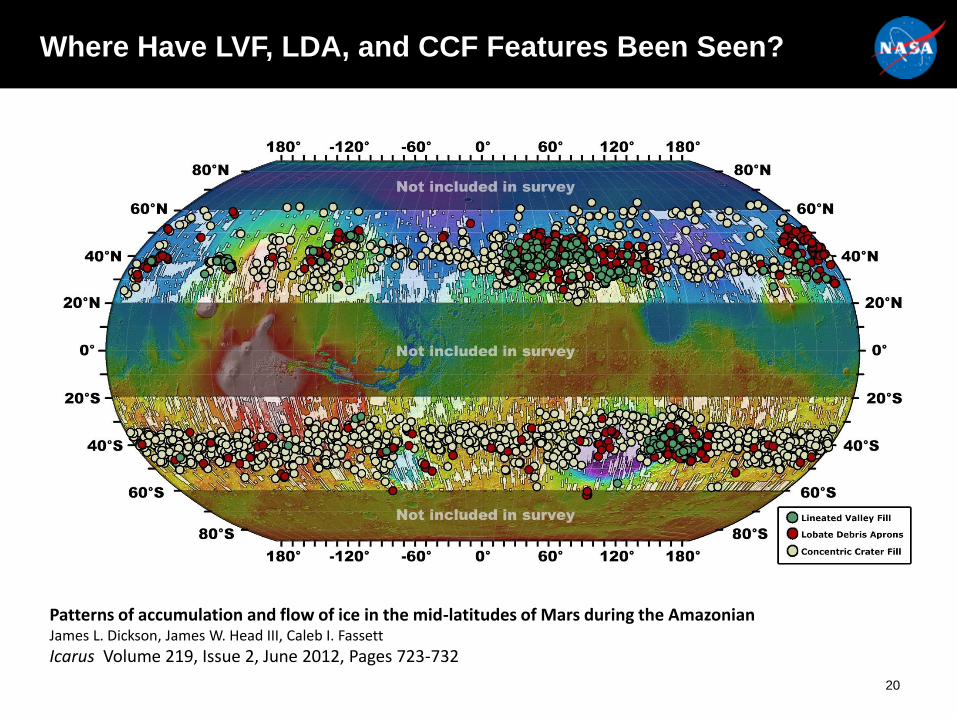
Where Have LVF, LDA, and CCF Features Been Seen?
20
Patterns of accumulation and flow of ice in the mid-latitudes of Mars during the AmazonianJames L. Dickson, James W. Head III, Caleb I. Fassett
Icarus Volume 219, Issue 2, June 2012, Pages 723-732
180° -120° -60° oo 60° 120° 180°
Not included in survey
oo oo
20°s
Not included in survey Lineated Valley Fill
180° -120° -60° oo 60° 120° 180° 0 Concentric Crater Fill
C. M. Dundas et al., Exposed massive ground ice in the Martian mid-latitudes, Science vol. 359, pp. 199–201 (2018)
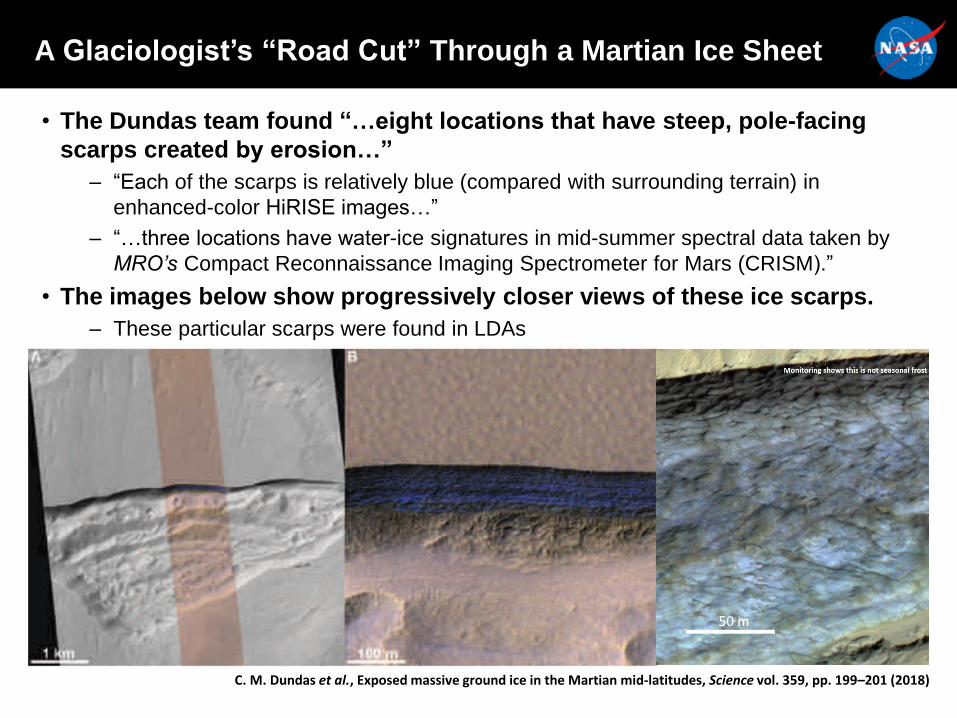
A Glaciologist’s “Road Cut” Through a Martian Ice Sheet
• The Dundas team found “…eight locations that have steep, pole-facing
scarps created by erosion…”
– “Each of the scarps is relatively blue (compared with surrounding terrain) in
enhanced-color HiRISE images…”
– “…three locations have water-ice signatures in mid-summer spectral data taken by
MRO’s Compact Reconnaissance Imaging Spectrometer for Mars (CRISM).”
• The images below show progressively closer views of these ice scarps.
– These particular scarps were found in LDAs
Which of These Water Sources Does the Dundas
Discovery Help Confirm?
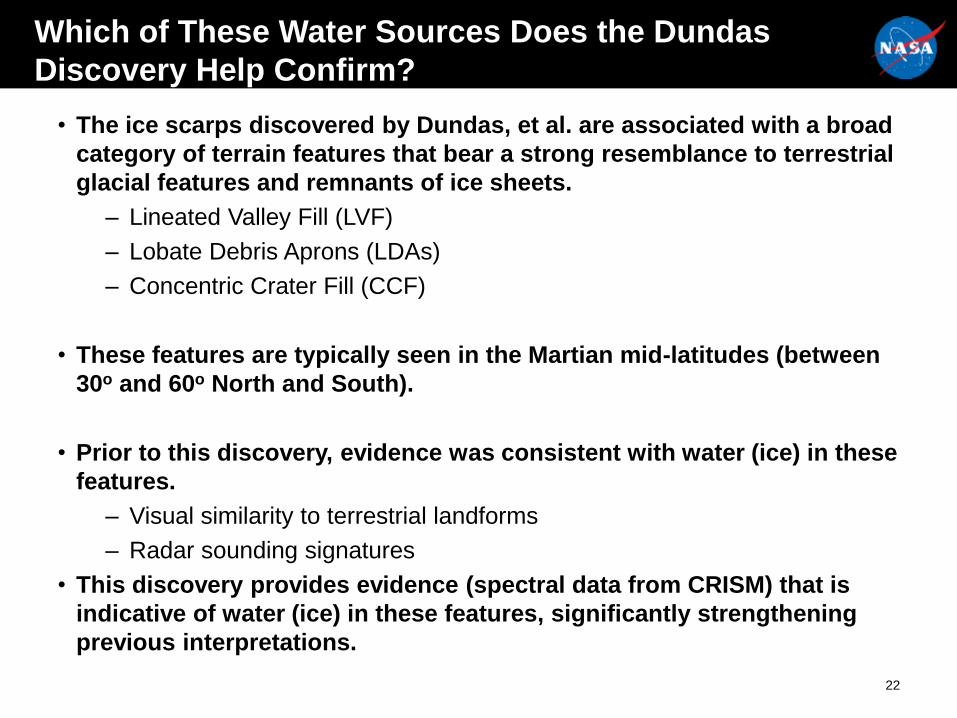
• The ice scarps discovered by Dundas, et al. are associated with a broad
category of terrain features that bear a strong resemblance to terrestrial
glacial features and remnants of ice sheets.
– Lineated Valley Fill (LVF)
– Lobate Debris Aprons (LDAs)
– Concentric Crater Fill (CCF)
• These features are typically seen in the Martian mid-latitudes (between
30o and 60o North and South).
• Prior to this discovery, evidence was consistent with water (ice) in these
features.
– Visual similarity to terrestrial landforms
– Radar sounding signatures
• This discovery provides evidence (spectral data from CRISM) that is
indicative of water (ice) in these features, significantly strengthening
previous interpretations.
22
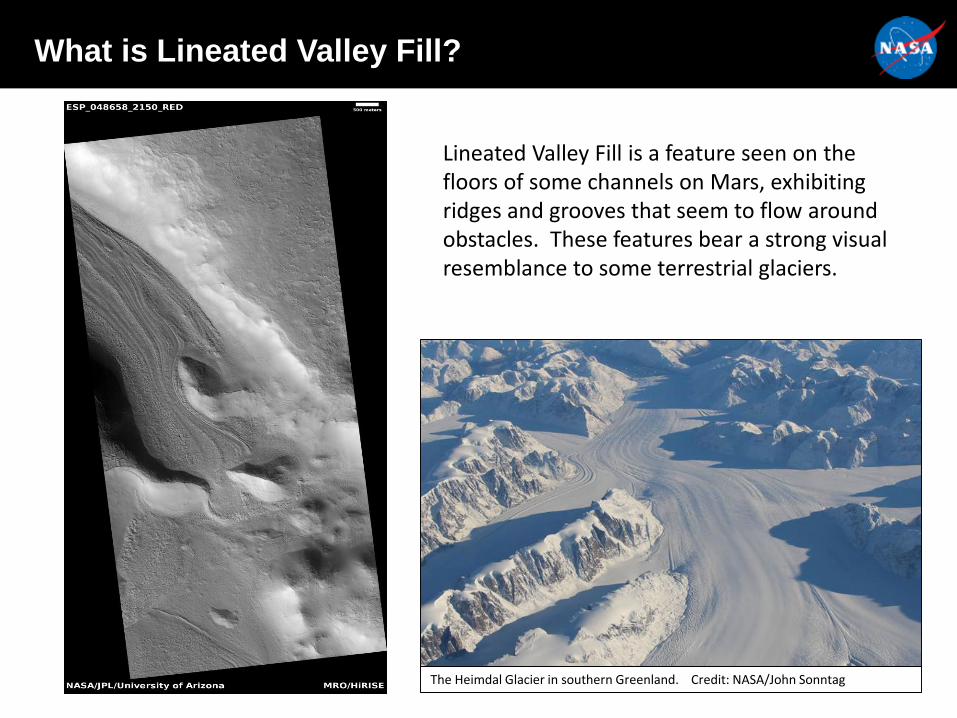
What is Lineated Valley Fill?
Lineated Valley Fill is a feature seen on the floors of some channels on Mars, exhibiting ridges and grooves that seem to flow around obstacles. These features bear a strong visual resemblance to some terrestrial glaciers.
The Heimdal Glacier in southern Greenland. Credit: NASA/John SonntagNASA/JP · of Arizona L/Univers,ty MRO/HiRISE
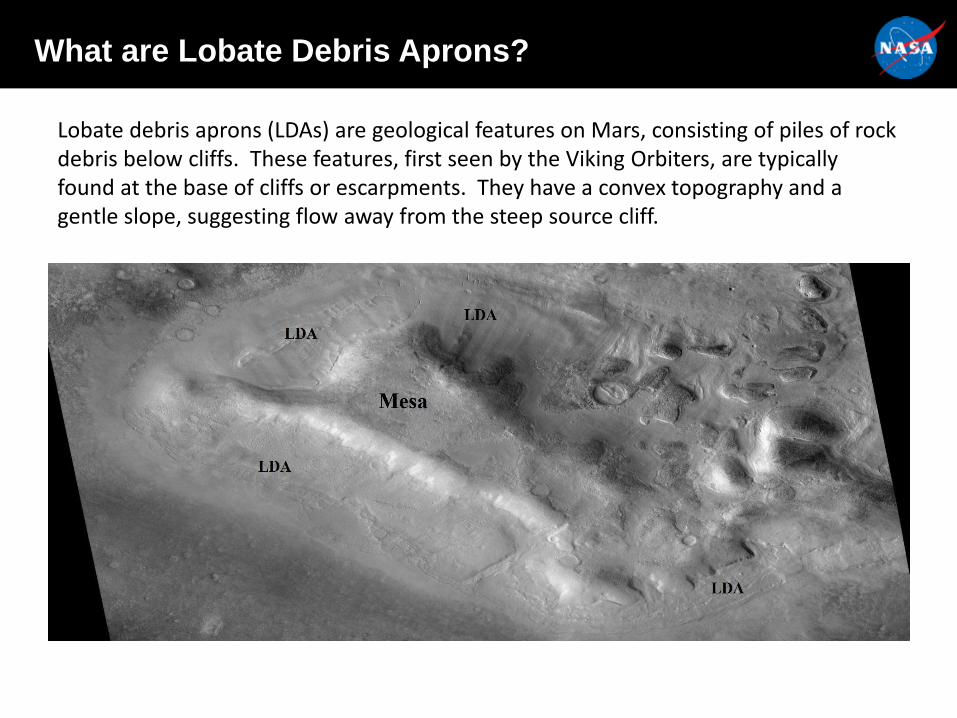
What are Lobate Debris Aprons?
Lobate debris aprons (LDAs) are geological features on Mars, consisting of piles of rock debris below cliffs. These features, first seen by the Viking Orbiters, are typically found at the base of cliffs or escarpments. They have a convex topography and a gentle slope, suggesting flow away from the steep source cliff.
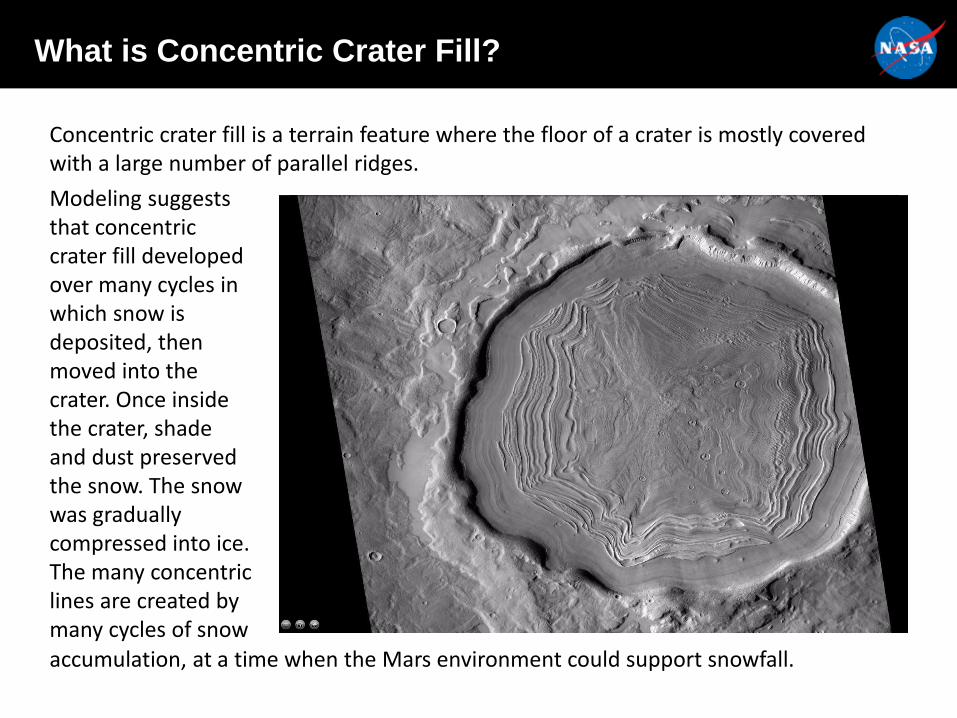
accumulation, at a time when the Mars environment could support snowfall.
What is Concentric Crater Fill?
Concentric crater fill is a terrain feature where the floor of a crater is mostly covered with a large number of parallel ridges.
Modeling suggests that concentric crater fill developed over many cycles in which snow is deposited, then moved into the crater. Once inside the crater, shade and dust preserved the snow. The snow was gradually compressed into ice. The many concentric lines are created by many cycles of snow
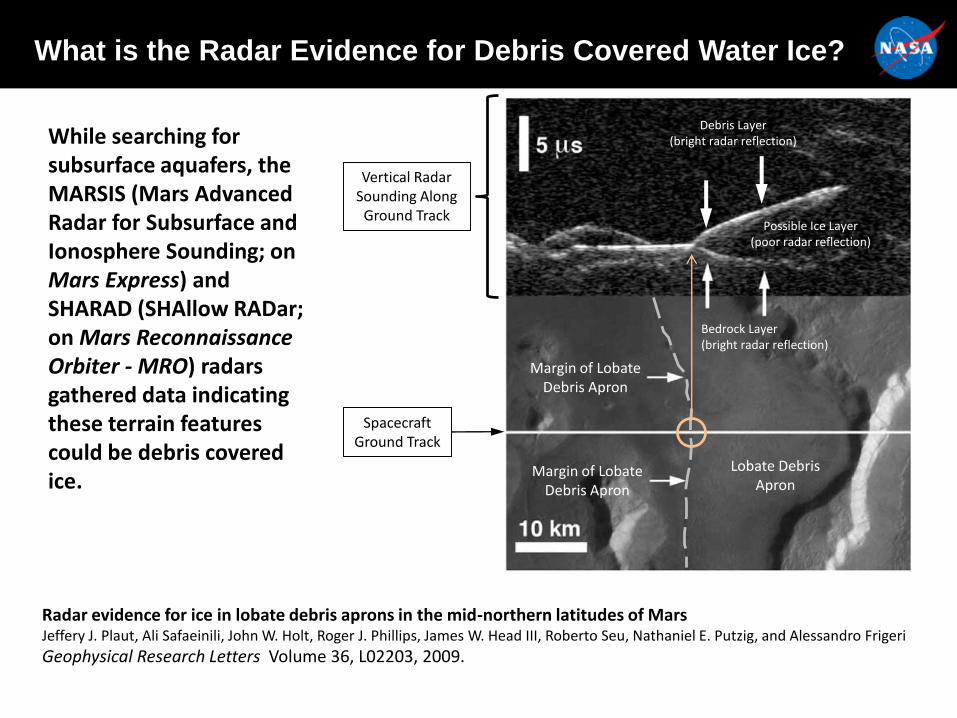
Radar evidence for ice in lobate debris aprons in the mid-northern latitudes of MarsJeffery J. Plaut, Ali Safaeinili, John W. Holt, Roger J. Phillips, James W. Head III, Roberto Seu, Nathaniel E. Putzig, and Alessandro Frigeri
Geophysical Research Letters Volume 36, L02203, 2009.
Spacecraft Ground Track
Vertical Radar Sounding Along
Ground Track
Margin of Lobate Debris Apron
Debris Layer(bright radar reflection)
Bedrock Layer(bright radar reflection)
Possible Ice Layer(poor radar reflection)
While searching for subsurface aquafers, the MARSIS (Mars Advanced Radar for Subsurface and Ionosphere Sounding; on Mars Express) and SHARAD (SHAllow RADar; on Mars Reconnaissance Orbiter - MRO) radars gathered data indicating these terrain features could be debris covered ice.
What is the Radar Evidence for Debris Covered Water Ice?
Margin of Lobate Debris Apron
Lobate Debris Apron
Why Is This Discovery Important?
• One facet of NASA’s current Mars Exploration Program is a search for the
locations and quantities of water in various forms.
– Subsurface liquid water aquafers
– Surface and subsurface water ice
– Hydrated minerals
• This discovery by Dundas, et al. confirms that one suspected type of subsurface
water deposit is in fact water (ice) and reveals it to be almost pure water.
• The location of deposits similar to those examined by Dundas, et al. span all
longitudes and are at latitudes compatible with human missions.
• Access to massive quantities of water could change surface mission concepts of
operation and drive site selection
• Availability of massive quantities of water could enable or change current
assumptions for:
– Propellant manufacturing
– Radiation protection
– “Relaxed” requirements for closed loop ECLSS
– Crop growth
– Improved crew amenities, such as more frequent showers and laundry
27
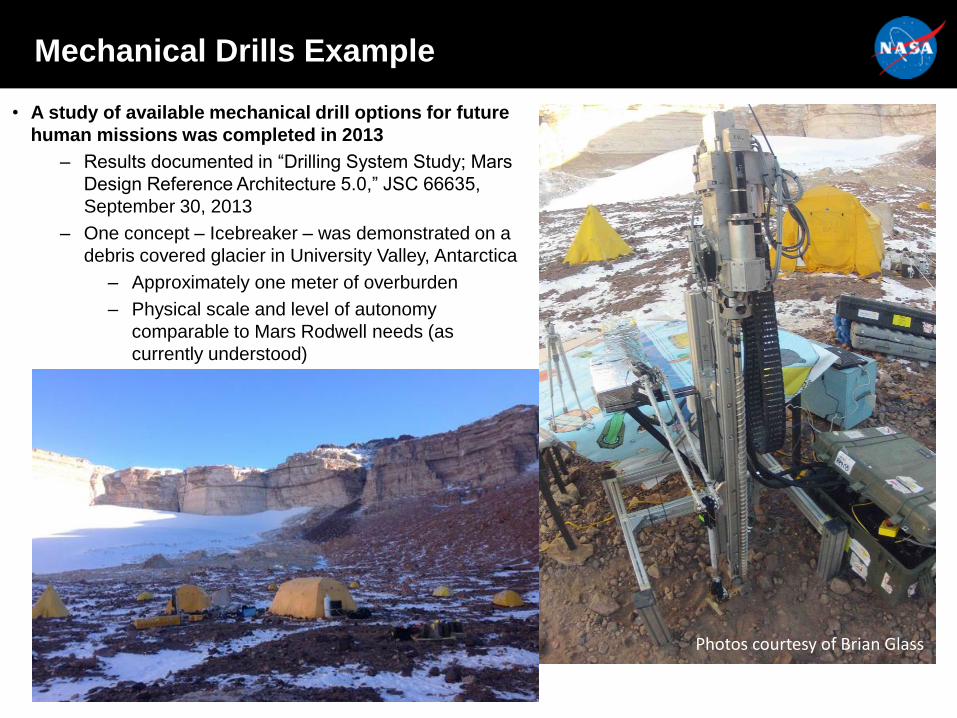
Mechanical Drills Example
Photos courtesy of Brian Glass
• A study of available mechanical drill options for future
human missions was completed in 2013
– Results documented in “Drilling System Study; Mars
Design Reference Architecture 5.0,” JSC 66635,
September 30, 2013
– One concept – Icebreaker – was demonstrated on a
debris covered glacier in University Valley, Antarctica
– Approximately one meter of overburden
– Physical scale and level of autonomy
comparable to Mars Rodwell needs (as
currently understood)
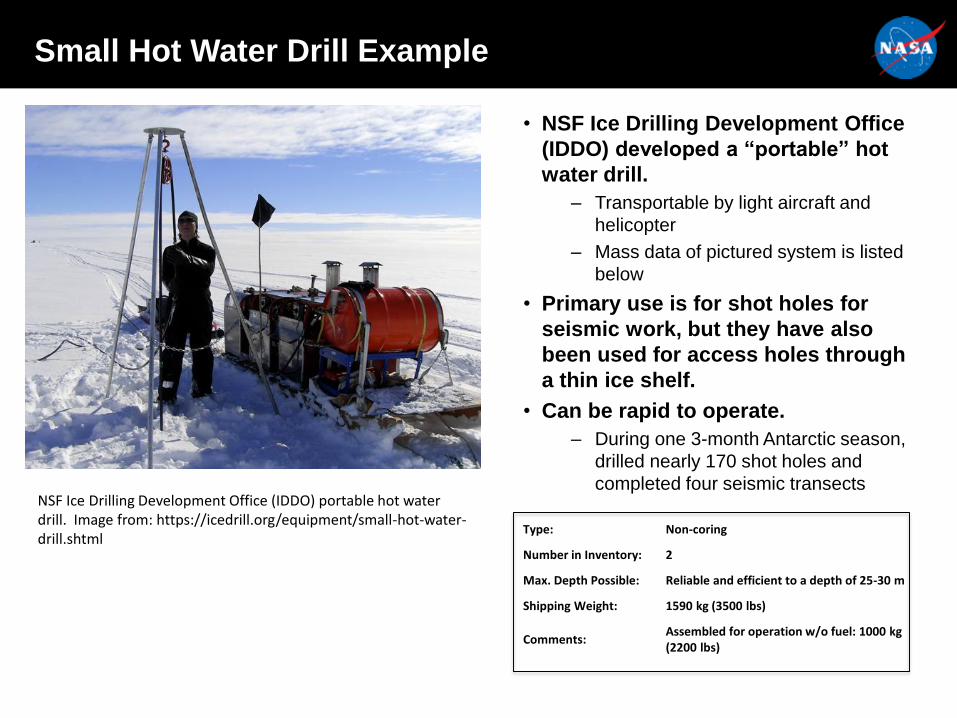
Small Hot Water Drill Example
• NSF Ice Drilling Development Office
(IDDO) developed a “portable” hot
water drill.
– Transportable by light aircraft and
helicopter
– Mass data of pictured system is listed
below
• Primary use is for shot holes for
seismic work, but they have also
been used for access holes through
a thin ice shelf.
• Can be rapid to operate.
– During one 3-month Antarctic season,
drilled nearly 170 shot holes and
completed four seismic transectsNSF Ice Drilling Development Office (IDDO) portable hot water drill. Image from: https://icedrill.org/equipment/small-hot-water-drill.shtml
Type: Non-coring
Number in Inventory: 2
Max. Depth Possible: Reliable and efficient to a depth of 25-30 m
Shipping Weight: 1590 kg (3500 lbs)
Comments:Assembled for operation w/o fuel: 1000 kg (2200 lbs)
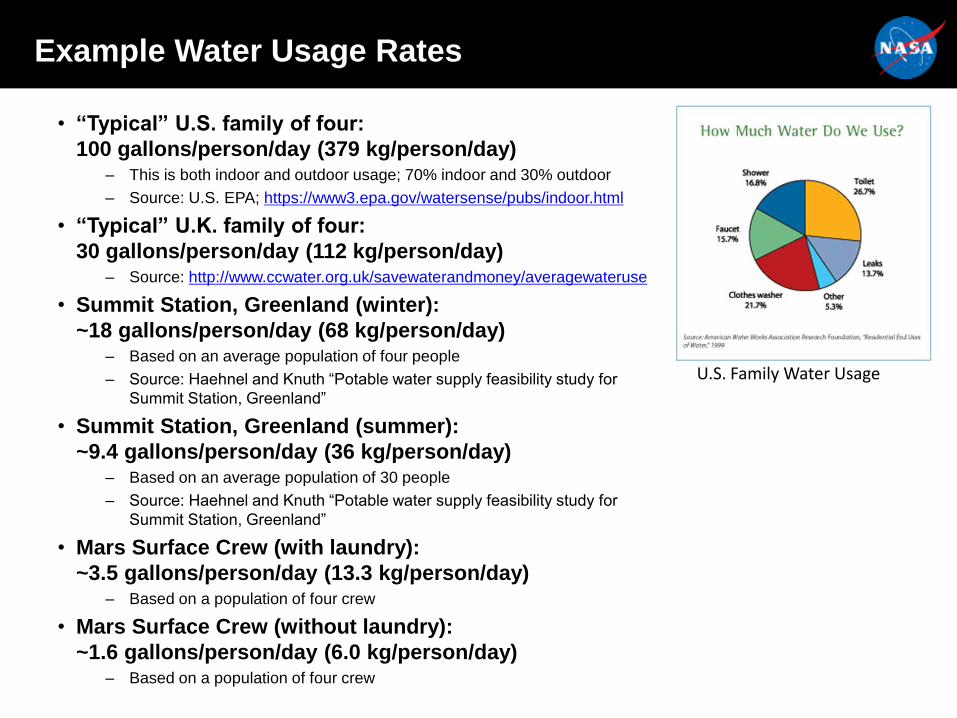
Example Water Usage Rates
• “Typical” U.S. family of four:
100 gallons/person/day (379 kg/person/day)– This is both indoor and outdoor usage; 70% indoor and 30% outdoor
– Source: U.S. EPA; https://www3.epa.gov/watersense/pubs/indoor.html
• “Typical” U.K. family of four:
30 gallons/person/day (112 kg/person/day)– Source: http://www.ccwater.org.uk/savewaterandmoney/averagewateruse
• Summit Station, Greenland (winter):
~18 gallons/person/day (68 kg/person/day)– Based on an average population of four people
– Source: Haehnel and Knuth “Potable water supply feasibility study for
Summit Station, Greenland”
• Summit Station, Greenland (summer):
~9.4 gallons/person/day (36 kg/person/day)– Based on an average population of 30 people
– Source: Haehnel and Knuth “Potable water supply feasibility study for
Summit Station, Greenland”
• Mars Surface Crew (with laundry):
~3.5 gallons/person/day (13.3 kg/person/day)– Based on a population of four crew
• Mars Surface Crew (without laundry):
~1.6 gallons/person/day (6.0 kg/person/day)– Based on a population of four crew
U.S. Family Water Usage
Observations from the 100 gal/day Withdrawal Case
• The power values on the previous chart are ONLY for melting ice and
maintaining a liquid pool of water in the subsurface cavity; additional
power will be needed to pump water out of this cavity and to run other
surface infrastructure elements.
• The withdrawal rate and input power are highly coupled
– A different withdrawal rate will result in a different shape to these results
• For this 100 gal/day withdrawal rate
– For power levels above approximately 10 kW, liquid water is being created at a
much faster rate than it is being withdrawn, resulting in very large subsurface water
pools that will not be used
– A power level of approximately 10 kW generates liquid water at about the rate at
which it is being withdrawn
• The water pool remains at approximately a constant volume
• The water pool will gradually sink to lower levels, which will drive the amount of power
needed to pump water from these deeper levels
– For power levels below approximately 10 kW, water is being withdrawn faster than
it is being melted and the well eventually “collapses”
• At a power level of approximately 5 kW, the 20 mT projected need for a single crew’s MAV
could be withdrawn before the well “collapses” but little additional water would be made


