Embed Size (px)
Citation preview

Singapore Telecommunications Limited
And Subsidiary Companies
MANAGEMENT DISCUSSION AND ANALYSIS OF FINANCIAL CONDITION, RESULTS OF OPERATIONS
AND CASH FLOWS FOR THE FIRST QUARTER
ENDED 30 JUNE 2018
With effect from 1 April 2018, the Group has adopted all applicable new and revised Singapore Financial Reporting Standards (International) (“SFRS(I)”) and has applied them retrospectively. Accordingly, the comparatives have been restated to take into account adjustments relating to SFRS(I) 1, First-time Adoption of SFRS(I), SFRS(I) 15, Revenue from Contracts with Customers and SFRS(I) 9, Financial Instruments. The financial statements for the quarter ended, and as at, 30 June 2018 are unaudited. Numbers in all tables may not exactly add due to rounding. For all pages, "@" denotes more than +/- 500%, "*" denotes less than +/- S$0.5 million or A$0.5 million and “**” denotes less than +/- 0.05%, unless otherwise indicated. For all tables, a negative sign for year-on-year change denotes a decrease in operating revenue, expense, gain or loss.

Singapore Telecommunications Ltd And Subsidiary Companies
Table Of Contents
Section 1 : Group Pg
Financial Highlights………………….………………………………………………………………………………………..1
Group Summary Income Statement……...……………………………………………………………………………………………..3
Business Segments……………………………………………………………………………………..4
Review Of Group Operating Performance……………………………………………………………...……………….5
Sequential Quarterly Results………………………………………………………………………………….6
Outlook For The Financial Year Ending 31 March 2019………………………………………………………………………………….7
Operating Revenue……………………………………………………………………………………………………..8
Operating Expenses……………………………………………………………………………………………9
Staff Costs……………………………………………………………………………………………. 10
Net Finance Expense………………………………………………………………………………………….11
Exceptional Items………………………………………………………………………………………………12
Tax Expense………………………………………………………………………………………………………13
Summary Statements Of Financial Position………………………………………………………………….14
Liquidity And Gearing……………………………………………………………………………………………15
Cash Flow And Capital Expenditure……………………………………………………………………………16
Section 2 : Group Consumer
Financial Highlights……………………………………………………………………………………………………………………18
Group Consumer Summary Income Statement …..……………………………………………………………………………………………………………..19
Operating Highlights…….……….……………………………………………………………………20
Singapore Consumer Summary Income Statement………...………………………………………………………………………………..21
Australia Consumer Summary Income Statement….………..……………………………………………………………………………………24
Section 3 : Group Enterprise
Financial Highlights……………………………………………………………………………………………………………………28
Group Enterprise Summary Income Statement…..……………………………………………………………………………………………………………..29
Operating Highlights……..………...……………………………………………………………….. 30
Singapore Enterprise Summary Income Statement………..………………………………………………………………………………..32
Australia Enterprise Summary Income Statement………….…………………………………………………………………………………33
Section 4 : Group Digital Life
Financial Highlights……………………………………………………………………………………………………………………34
Group Digital Life Summary Income Statement…………...…………………………………………………………………………………..35
Operating Highlights………..…..…………………………………………………………………… 36

Singapore Telecommunications Ltd And Subsidiary Companies
Table Of Contents (continued)
Section 5 : Associates/ Joint Ventures Pg
Financial Highlights……………………………………………………………………………………………………………..38
Share Of Results Of Associates/ Joint Ventures………………………………………………………………………………………………………………………..39
Proforma Information…………………………………………………………………………………………………………….47
Other Information…………………………………………………………………………………………………………….49
Cash Dividends/ Distributions From Associates/ Joint Ventures…………………………………………………………………………………..50
Key Operational Data……………………………………………………………………………………………………………51
Section 6 : Product Information
Singapore Mobile (Product View)…………………..………………………………………………………………………………52
Australia Mobile (Product View)…………………………………………………………………………………………….53
Singtel TV (Product View)……………………………………………………………………………….54
Singapore Consumer Home……………………………………………………………………………….54
Other Products………………………………………………………………………………………..55
Section 7 : Glossary………………………………………………………………………………………………..57
Appendix 1 : Group Summary Income Statements
Appendix 2 : Group Statements Of Financial Position
Appendix 3 : Cash Flow Statements of Singapore And Optus
Appendix 4 : Optus Financials In Australian Dollars
Appendix 5 : Currency Risk Management & Other Matters
Appendix 6 : Outlook For The Current Financial Year Ending 31 March 2019
Appendix 7 : Restatement Of FY 2018 Comparatives

Singapore Telecommunications Ltd And Subsidiary Companies Page 1
SECTION 1 : GROUP
FINANCIAL HIGHLIGHTS
FOR THE FIRST QUARTER ENDED 30 JUNE 2018
Operating revenue was stable and EBITDA declined 2.7%.
The associates’ post-tax profit contributions fell 26% mainly on lower
profits at Telkomsel and Airtel, as well as lower contribution from NetLink NBN Trust following Singtel’s reduction in its economic interest.
Underlying net profit fell 19%.
Including exceptional gains compared to a loss in the corresponding quarter, net profit declined 6.6%.
In constant currency terms1, underlying net profit fell 17% and net profit declined 3.7%.
Free cash flow grew a strong 13% due to timing of receipt of dividend from Telkomsel and lower capital expenditure partially offset by working capital movements.
1 Assuming constant exchange rates for the Australian Dollar, United States Dollar and/or regional currencies
(Indian Rupee, Indonesian Rupiah, Philippine Peso and Thai Baht) from the corresponding quarter ended 30 June 2017.

Singapore Telecommunications Ltd And Subsidiary Companies Page 2
SECTION 1 : GROUP
Operating revenue 4,134 4,156 -0.5
(exclude NBN migration revenues) 4,109 4,113 -0.1
EBITDA 1,207 1,240 -2.7
(exclude NBN migration revenues) 1,182 1,198 -1.3
- EBITDA margin 29.2% 29.8%
Share of associates' pre-tax profits 416 730 -43.0
EBITDA and share of associates'
pre-tax profits 1,623 1,970 -17.6
EBIT 1,069 1,421 -24.8
(exclude share of associates' pre-tax profits) 653 691 -5.5
Underlying net profit 733 909 -19.3
(exclude Airtel and BTL) (2)
714 873 -18.2
Exceptional items (post-tax) 98 (19) nm
Net profit 832 890 -6.6
(exclude Airtel and BTL) (2)
796 855 -6.9
Free cash flow 1,466 1,294 13.3
Underlying earnings per share (S cents) 4.49 5.57 -19.4
Basic earnings per share (S cents) 5.09 5.45 -6.6
30 Jun
2018
S$ m
Total assets 47,775 48,487 49,324
Shareholders' funds 30,420 29,706 28,855
Net debt (3)
8,473 9,877 10,600
Net debt gearing ratio (4)
21.8% 25.0% 26.9%
Net debt to EBITDA and share of associates' pre-tax profits (5)
1.31X 1.32X 1.34X
Interest cover:
- EBITDA and share of associates' pre-tax profits/ net interest expense (6)
18.0X 20.1X 21.7X
Restated (1)
30 Jun
As at
%
2017
S$ m
Restated (1)
31 Mar
S$ m
2018
S$ m
2018
S$ m
Quarter
Restated (1)
2017
30 Jun
Chge
YOY
Notes:
(1) The Group has adopted all applicable new and revised Singapore Financial Reporting Standards (International) (“SFRS(I)”) which became effective from 1 April 2018 and has applied them retrospectively. Accordingly, comparatives have been restated to take into account adjustments relating to SFRS(I) 1, First-time Adoption of SFRS(I), SFRS(I) 15, Revenue from Contracts with Customers and SFRS(I) 9, Financial Instruments. See Appendix 7 for details.
(2) The profits were adjusted to exclude the results of Airtel and its shareholder, Bharti Telecom Limited (“BTL”).
(3) Net debt is defined as gross debt less cash and bank balances adjusted for related hedging balances.
(4) Net debt gearing ratio is defined as the ratio of net debt to net capitalisation. Net capitalisation is the aggregate of net debt, shareholders’ funds and minority interests.
(5) Net debt to EBITDA and share of associates’ pre-tax profits is calculated on an annualised basis.
(6) Net interest expense refers to interest expense less interest income.

Singapore Telecommunications Ltd And Subsidiary Companies Page 3
SECTION 1 : GROUP
GROUP SUMMARY INCOME STATEMENT For The First Quarter Ended 30 June 2018
Operating revenue 4,134 4,156 -0.5
Operating expenses (2,992) (2,988) 0.1
1,142 1,168 -2.2
Other income 65 73 -10.3
EBITDA 1,207 1,240 -2.7
- EBITDA margin 29.2% 29.8%
Share of associates' pre-tax profits 416 730 -43.0
EBITDA and share of associates' pre-tax profits 1,623 1,970 -17.6
Depreciation (481) (476) 0.9
Amortisation of intangibles (73) (73) 0.1
(554) (549) 0.8
1,069 1,421 -24.8
Net finance expense
- net interest expense (90) (91) -0.3
- other finance income 20 5 320.8
(70) (86) -18.3
Profit before exceptional items and tax 999 1,335 -25.2
Taxation (271) (432) -37.2
Profit after tax 728 903 -19.4
Minority interests 5 6 -3.6
Underlying net profit 733 909 -19.3
98 (19) nm
Net profit 832 890 -6.6
Depreciation as % of operating revenue 12% 11%
Restated
2017
S$ m
YOY
Chge
%
Quarter
30 Jun
2018
EBIT
Exceptional items (post-tax)
S$ m
Unless otherwise stated, the presentation of income statements in this document is consistent with prior periods. For income statements presented in accordance with SFRS(I) 1-1, Presentation of Financial Statements, please refer to “SGX Appendix 7.2 Announcement”.

Singapore Telecommunications Ltd And Subsidiary Companies Page 4
SECTION 1 : GROUP
BUSINESS SEGMENTS
The Group is organised by three business segments, Group Consumer, Group Enterprise and Group Digital Life, to better serve the evolving needs of its customers and to capture growth opportunities globally.
Group Consumer comprises the consumer businesses across Singapore and Australia, as well as the Group’s investments, mainly, AIS and Intouch in Thailand, Airtel in India, Africa and Sri Lanka, Globe in the Philippines, and Telkomsel in Indonesia. It focuses on driving greater value and performance from the core carriage business including mobile, pay TV, fixed broadband and voice, as well as equipment sales.
Group Enterprise comprises the business groups across Singapore, Australia, U.S.A., Europe and the region, and focuses on growing the Group’s position in the enterprise markets. Key services include mobile, equipment sales, fixed voice and data, managed services, cloud computing, cyber security, IT services and professional consulting.
Group Digital Life (“GDL”) focuses on using the latest Internet technologies and assets of the Group operating companies to develop new revenue and growth engines by entering adjacent businesses where it has a competitive advantage. It focuses on three key businesses in digital life – digital marketing, regional premium OTT video and advanced analytics and intelligence capabilities, in addition to strengthening its role as Singtel’s digital innovation engine through Innov8.
Corporate comprises the costs of Group functions not allocated to the business segments.
The following table shows the operating performance of the three business segments:
Based on post elimination basis
Operating revenue
Group Consumer 2,356 2,313 1.9
Group Enterprise 1,519 1,569 -3.2
Core Business 3,875 3,882 -0.2
Group Digital Life 259 273 -5.4
Group 4,134 4,156 -0.5
EBITDA
Group Consumer 794 804 -1.2
Group Enterprise 449 482 -6.8
Core Business 1,243 1,285 -3.3
Group Digital Life (23) (24) -0.4
Corporate (13) (21) -40.7
Group 1,207 1,240 -2.7
EBIT (exclude share of associates' pre-tax profits)
Group Consumer 404 426 -5.1
Group Enterprise 299 333 -10.4
Core Business 703 759 -7.4
Group Digital Life (36) (46) -21.3
Corporate (13) (22) -38.7
Group 653 691 -5.5
%
Quarter
30 June
YOY
20172018 Chge
Restated
S$ m S$ m

Singapore Telecommunications Ltd And Subsidiary Companies Page 5
SECTION 1 : GROUP
REVIEW OF GROUP OPERATING PERFORMANCE For The First Quarter Ended 30 June 2018 The Group delivered resilient core results with strong performance in Australia Consumer mitigating the declines in traditional carriage business. Telkomsel and Airtel continued to face headwinds in Indonesia and India on intense price competition. Operating revenue was stable and would have grown 1.7% in constant currency terms with higher equipment sales. EBITDA declined 2.7% but was stable in constant currency terms. Group Consumer contributed 57% (Q1 FY2018: 56%) and 66% (Q1 FY2018: 65%) to the Group’s operating revenue and EBITDA respectively. Operating revenue grew 1.9% while EBITDA declined 1.2%. In constant currency terms, operating revenue and EBITDA would have increased by 4.6% and 1.5% respectively. Singapore Consumer recorded a resilient performance in the quarter. Operating revenue was up 1.7% on increases in equipment sales and Consumer Home services, boosted by pay TV revenue contribution from 2018 FIFA World Cup in June, partly offset by decline in Mobile service revenue. EBITDA, however, declined by 2.6% with cessation of sub-licensing of TV content rights revenue. In Australia, operating revenue and EBITDA grew by 5.4% and 2.8% respectively. Excluding NBN migration revenues, operating revenue rose 6.6% and EBITDA increased 6.2% due to strong mobile customer growth. Group Enterprise contributed 37% (Q1 FY2018: 38%) and 37% (Q1 FY2018: 39%) to the Group’s operating revenue and EBITDA respectively. Operating revenue fell 3.2%, impacted by the lumpy nature of major infrastructure projects and continued declines in traditional legacy services. In Australia, Optus Business recorded growth in the ICT business and mobile partially offset by lower voice. With continued investments in capabilities and products, EBITDA fell 6.8%. GDL contributed 6% to the Group’s operating revenue, down from 7% in the same quarter last year. Operating revenue for the quarter declined 5.4% (1.3% in constant currency terms) due to the timing of marketing spend by certain Amobee’s customers partially offset by higher revenue from HOOQ on continued ramp up of its business. Amobee grew its Agency Trading Desk business, doubling revenue from last corresponding quarter. EBITDA for both GDL and Amobee remained stable with lower operating expenses. Depreciation and amortisation charges were stable but would have increased 3.5% in constant currency terms due mainly to higher investments in mobile infrastructure network, spectrum and a new billing system. EBIT (before share of results of associates) fell 5.5% to S$653 million. The Group and its regional associates continued to record strong customer growth. The combined mobile customer base reached 735 million as at 30 June 2018, up significantly by 29 million or 4.2% from a quarter ago due to growth in India. The associates’ post-tax underlying profit contributions declined 26%. If the regional currencies had remained stable, the associates’ post-tax underlying profit contributions would have declined by 21% due to lower profits at Telkomsel and Airtel as well as decline in contribution from NetLink NBN Trust following the reduction in economic interest. The decline was partly mitigated by higher profits at Globe, AIS and Intouch. Despite fierce competitive conditions in Indonesia and India, Telkomsel and Airtel have gained market shares in the quarter.

Singapore Telecommunications Ltd And Subsidiary Companies Page 6
SECTION 1 : GROUP
Net finance expense decreased 18% due mainly to foreign exchange gains compared to losses in the last corresponding quarter and higher dividend received from Southern Cross. The Group’s tax expense fell 37% on lower earnings and the recognition of deferred tax credits in Nigeria by Airtel partly offset by higher dividend withholding taxes. Consequently, underlying net profit declined by 19% (17% in constant currency terms). The net exceptional gain (post-tax) of S$98 million (Q1 FY2018: S$19 million of net loss) in the quarter comprised mainly of a gain on disposal of a property in Singapore and the Group’s share of Airtel’s net exceptional gains partially offset by staff restructuring costs. With an exceptional gain compared to a loss in the corresponding quarter, net profit declined 6.6%. In constant currency terms, the decline was 3.7%. The Group continued to deliver substantial free cash flow, which rose 13% to S$1.47 billion this quarter mainly on the timing of receipt of dividend from Telkomsel and lower capital expenditure partly offset by working capital movements.
The Group continued to maintain a healthy capital structure. As at 30 June 2018, net debt gearing ratio was 21.8%, down from 25.0% a quarter ago following a net repayment of borrowings. The Group has successfully diversified its earnings base through its expansion and investments in overseas markets. Hence, the Group is exposed to currency movements. On a proportionate basis if the associates are consolidated line-by-line, operations outside Singapore accounted for three-quarters of both the Group’s proportionate revenue and EBITDA.

Singapore Telecommunications Ltd And Subsidiary Companies Page 7
SECTION 1 : GROUP
SEQUENTIAL QUARTERLY RESULTS
Results for the current quarter compared to the preceding quarter ended 31 March 2018 were as follows:
Restated
30 June 31 Mar
2018 2018
S$ m S$ m
Operating revenue 4,134 4,262 -3.0
EBITDA 1,207 1,230 -1.9
- margin 29.2% 28.9%
Share of associates' pre-tax profits 416 519 -19.9
EBIT 1,069 1,188 -10.0
Underlying net profit 733 821 -10.7
Exceptional items (post-tax) 98 (51) nm
Net profit 832 770 8.0
Free cash flow 1,466 800 83.3
%
Quarter
QOQ
Chge
Operating revenue declined from the preceding quarter mainly due to a weaker Australian Dollar and seasonally higher ICT revenue recorded in the March quarter, partly offset by higher revenue from Amobee.
Underlying net profit fell on lower associates’ earnings and higher withholding taxes from associates’ dividends this quarter. Free cash flow rose on higher dividends from associates and lower capital expenditure, partly offset by working capital movements.
OUTLOOK FOR THE CURRENT FINANCIAL YEAR ENDING 31 MARCH 2019 The Group affirms the guidance previously issued in May 2018. Please refer to Appendix 6 for further details on the outlook for the current financial year.

Singapore Telecommunications Ltd And Subsidiary Companies Page 8
SECTION 1 : GROUP
OPERATING REVENUE
By Products and Services
Mobile service (includes international call revenue) 1,392 1,424 -2.2
Data and Internet 824 837 -1.5
Cyber security 114 117 -3.0
Other services 426 456 -6.7
Managed services 539 573 -5.9
Business solutions 140 132 5.8
Infocomm Technology ("ICT") 679 706 -3.7
Sale of equipment 581 511 13.7
Digital businesses (1)
271 282 -3.8
Fixed voice 246 283 -13.0
Pay television 104 93 12.1
Others 35 20 77.3
Total 4,134 4,156 -0.5
Operating revenue 4,134 4,156 -0.5
Associates' proportionate revenue (2)
3,282 3,632 -9.6
Group's proportionate revenue 7,416 7,788 -4.8
2018 Chge
S$ m %
2017
S$ m
YOY
Quarter
30 Jun
Restated
Notes:
(1) Include revenues from Amobee, HOOQ, DataSpark. (2) Proportionate share of revenue of associates is based on operating revenue of the associate multiplied by
Singtel’s effective ownership interest.
Restated
Operating Revenue Mix 2018 2017
% %
Mobile service 33.7 34.3
Data and Internet 19.9 20.1
Cyber security 2.7 2.8
Other services 10.3 11.0
Managed services 13.0 13.8
Business solutions 3.4 3.2
ICT 16.4 17.0
Sale of equipment 14.1 12.3
Digital businesses 6.6 6.8
Fixed voice 6.0 6.8
Pay television 2.5 2.2
Others 0.8 0.5
Total 100.0 100.0
Quarter
30 Jun
Operating revenue was stable and would have increased 1.7% in constant currency terms. Mobile service revenue declined 2.2% mainly from Singapore. It would have been stable in constant currency terms. The growth in data was offset by lower voice usage due to voice to data substitution.

Singapore Telecommunications Ltd And Subsidiary Companies Page 9
SECTION 1 : GROUP
Data and Internet revenue decreased 1.5% due mainly to decline in NBN migration revenues from the temporary suspension of migrating customers to NBN’s HFC access network in Australia, the slowdown in the maritime industry and price erosion. Revenue from ICT fell 3.7% on completion of a major infrastructure project last year as well as decline in Trustwave’s legacy payment card industry (PCI) data security business which is facing commoditisation. Equipment sales grew 14% due mainly to higher volume of handset sales on continued demand for higher value smartphones. Revenue from Digital Businesses declined 3.8% due to a weaker US Dollar, and would be stable in constant currency terms.
Including the proportionate share of operating revenue from the associates, the Group’s enlarged revenue declined 4.8% mainly on lower revenues at Airtel and Telkomsel.
OPERATING EXPENSES (Before Depreciation and Amortisation)
Cost of sales (1)
1,253 1,195 4.9
Staff costs 680 689 -1.4
Selling & administrative 599 614 -2.3
Traffic expenses 392 393 -0.4
Repair & maintenance 86 93 -7.8
Others (17) 3 nm
Total 2,992 2,988 0.1
Restated
As a percentage of operating revenue 2018 2017
%
Cost of sales (1)
30.3% 28.8%
Staff costs 16.4% 16.6%
Selling & administrative 14.5% 14.8%
Traffic expenses 9.5% 9.5%
Repair & maintenance 2.1% 2.2%
Others -0.4% 0.1%
Total 72.4% 72.0%
%
%
Quarter
30 Jun
Quarter
30 Jun
Chge2018
S$ m
Restated
2017
S$ m
YOY
Note:
(1) Cost of sales include cost of goods sold and service costs such as costs of content and programming.
Total operating expenses were stable and would have increased 2.5% in constant currency terms.

Singapore Telecommunications Ltd And Subsidiary Companies Page 10
SECTION 1 : GROUP
The increase in Cost of Sales was mainly due to growth in volume of equipment sales and higher content costs partially offset by lower ICT sales.
STAFF COSTS
Staff costs
Optus 277 273 1.6
Singtel and other subsidiaries 402 417 -3.4
Group 680 689 -1.4
%
Quarter
30 Jun
Chge2018
S$ m
Restated
2017
S$m
YOY
Average number of staff
Optus 8,370 8,526 8,579 -2.4
Singtel and other subsidiaries 16,737 17,045 17,070 -2.0
Group (1) 25,107 25,571 25,649 -2.1
Headcount as at end of period
Optus 8,146 8,515 8,475 -3.9
Singtel and other subsidiaries 16,611 16,953 17,325 -4.1
Group (1) 24,757 25,468 25,800 -4.0
YOY
Chge
Quarter
30 Jun 31 Mar 30 Jun
%2018 2018 2017
Note:
(1) Headcount for staff deployed in capital projects are included in the table above, though the related staff costs are capitalised as part of the cost of property, plant and equipment.
Staff costs declined 1.4% and would have been stable in constant currency terms. As at 30 June 2018, Group headcount declined from a year ago on cost management.
Singapore Telecommunications Ltd And Subsidiary Companies Page 11
SECTION 1 : GROUP
NET FINANCE EXPENSE
Net interest expense
- Interest expense (91) (97) -5.6
- Interest income 2 2 5.9
(89) (95) -5.8
- Net interest (expense)/ income
NetLink Trust (1)
(1) 4 nm
(90) (91) -0.3
Other finance income
- Dividend income from Southern Cross 13 6 136.4
- Investment income (2)
* 1 nm
- Other foreign exchange gain/ (loss) 6 (2) nm
- Net fair value gain (3)
1 1 28.6
20 5 320.8
Net finance expense (70) (86) -18.3
Chge
%
Quarter
30 Jun
2018
S$ m
Restated
2017
S$ m
YOY
Notes:
(1) Comprise interest earned on the unitholder’s loan to NetLink Trust (fully repaid in July 2017), net of the finance lease expenses on the exchange buildings leased from NetLink Trust.
(2) Comprise mainly dividend income from Fair Value through Other Comprehensive Income investments.
(3) Comprise mainly adjustments for hedging instruments and other financial instruments including options measured at fair values under SFRS(I) 9, Financial Instruments.
“*” denotes less than +/- S$0.5 million.
Interest expense decreased 5.6% on lower average borrowings from the last corresponding quarter, partly offset by higher average interest rates. Interest income from NetLink Trust ceased on repayment of unitholder loan by NetLink Trust in July 2017. Consequently, interest expense from NetLink Trust was S$1 million compared to net interest income of S$4 million in the last corresponding quarter. Other foreign exchange gain arose mainly from revaluation gain of fixed deposits on appreciation of the US Dollar in the quarter.
Singapore Telecommunications Ltd And Subsidiary Companies Page 12
SECTION 1 : GROUP
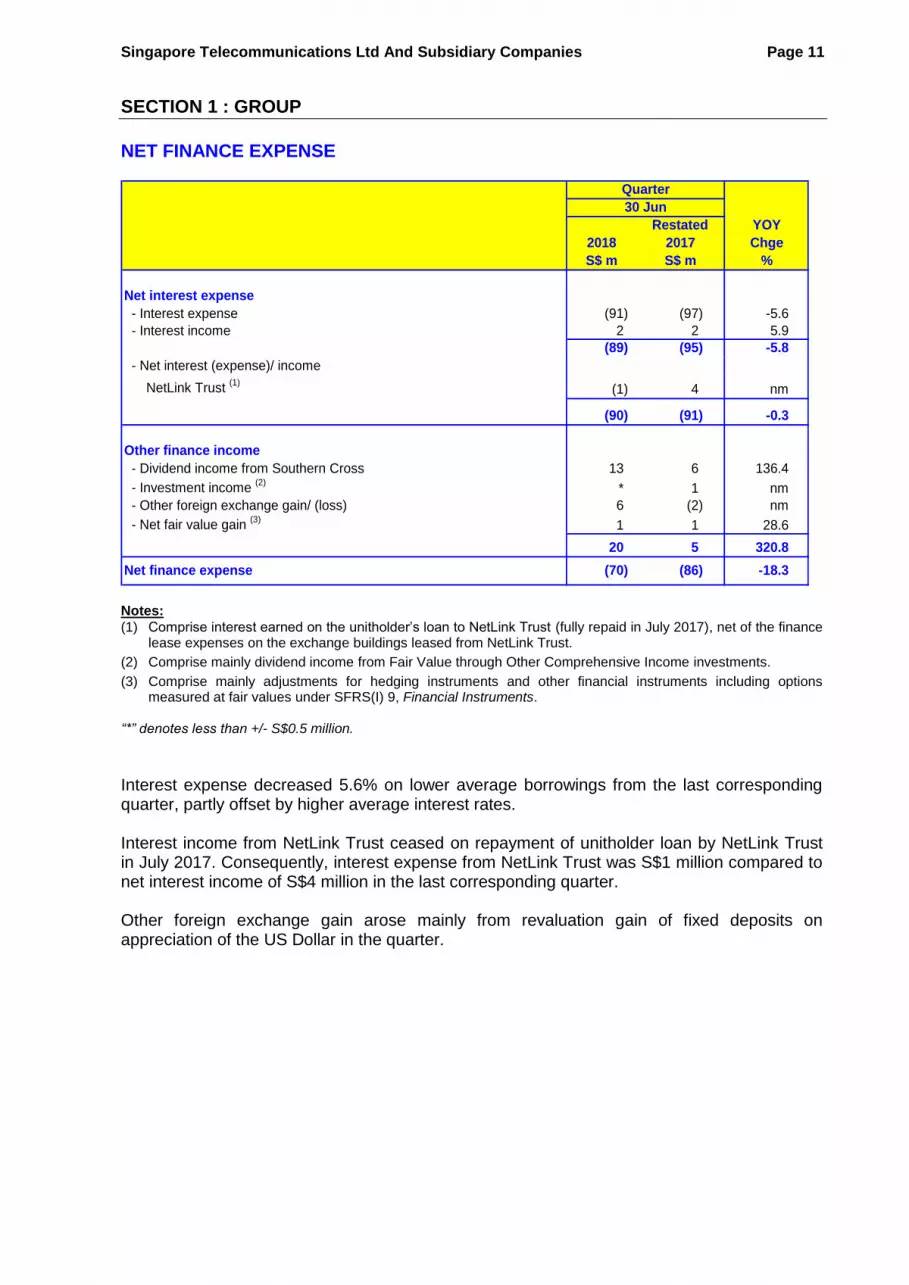
EXCEPTIONAL ITEMS (POST-TAX) (1)
Gain on sale of property 106 - nm
Staff restructuring costs (29) (26) 11.1
Group exceptional items 77 (26) nm
Share of Airtel's one-off net gains (pre-tax) 10 - nm
Share of associates' exceptional items 10 - nm
Group net exceptional gains/(losses) (pre-tax) 87 (26) nm
Exceptional tax
Share of tax credit on associates' exceptional items 7 - nm
Other tax credit 5 7 -31.1
12 7 59.5
Group net exceptional gains/ (losses) (post-tax) 98 (19) nm
Chge
%
Quarter
30 Jun
2018
S$ m
Restated
2017
S$ m
YOY
Note:
(1) Exceptional items are material non-recurring items for which separate disclosure is considered necessary to avoid distortion of reported results of performance.
The Group’s exceptional gains in the quarter comprised a gain on disposal of a property in Singapore partially offset by staff restructuring costs. The gains also included the Group’s share of Airtel’s exceptional net gain (post-tax) of S$17 million from recognition of a negative goodwill2 arising from business combinations partially offset by network re-farming and upgrading costs in the quarter.
2 Under Singapore Financial Reporting Standards (International), negative goodwill or bargain purchase gain is
required to be recognised in income statement. Under Indian Accounting Standards, Airtel has recognised this gain in equity.

Singapore Telecommunications Ltd And Subsidiary Companies Page 13
SECTION 1 : GROUP
TAX EXPENSE
Income tax expense
Optus 73 80 -8.3
Singtel and other subsidiaries 64 59 8.5
Total (a) 137 139 -1.2
Share of associates' tax expense (b) 32 214 -85.0
Withholding and dividend distribution taxes on associates' dividend income (1)
102 79 29.1
Total 271 432 -37.2
Profit before exceptional items and tax 999 1,335 -25.2
Exclude:
Share of associates' pre-tax profits (416) (730) -43.0
Adjusted pre-tax profit (c) 583 605 -3.7
Effective tax rate of Singtel and subsidiaries (a)/(c) 23.5% 22.9%
Share of associates' pre-tax profits (d) 416 730 -43.0
Effective tax rate of associates (b)/(d) 7.7% 29.4%
Chge
%
Quarter
30 Jun
2018
S$ m
Restated
2017
S$ m
YOY
Note:
(1) Withholding and Indian dividend distribution taxes are deducted at source when dividends are remitted by the overseas associates. For accounting purposes, the dividend income and related withholding or dividend distribution taxes are accrued when declared by the associates. Dividend income has no impact on the income statement of the Group as they are eliminated at Group. The cash inflows upon the receipt of dividend are shown in Section 5.
The Group’s tax expense decreased on lower earnings and recognition of deferred tax credits in Nigeria by Airtel partly offset by higher dividend withholding taxes.

Singapore Telecommunications Ltd And Subsidiary Companies Page 14
SECTION 1 : GROUP
SUMMARY STATEMENTS OF FINANCIAL POSITION
Current assets (excluding cash) 6,209 6,238 7,367
Cash and bank balances 625 525 632
Non-current assets 40,941 41,724 41,325
Total assets 47,775 48,487 49,324
Current liabilities 7,696 8,429 7,905
Non-current liabilities 9,664 10,377 12,570
Total liabilities 17,360 18,806 20,475
Net assets 30,415 29,681 28,849
Share capital 4,127 4,127 4,127
Retained earnings 28,067 27,235 25,953
Currency translation reserve (loss) (1,413) (1,280) (227)
Other reserves (361) (376) (999)
Equity attributable to shareholders 30,420 29,706 28,855
Minority interests and other reserve (5) (26) (5)
30,415 29,681 28,849
As at
30 Jun
2018
S$ m
Restated
31 Mar
2018
S$ m
Restated
30 Jun
2017
S$ m
The Group continued to be in a strong financial position as at 30 June 2018. It is rated A1 by Moody’s and A+ by S&P Global Ratings. Singtel’s ratings continued to be strong among its peers in the global telecommunications industry. The currency translation reserve (loss) in equity increased by S$133 million from a quarter ago mainly due to recognition of translation losses on net assets of Airtel and AIS/ Intouch on depreciation in the Indian Rupee and Thai Baht respectively.

Singapore Telecommunications Ltd And Subsidiary Companies Page 15
SECTION 1 : GROUP
LIQUIDITY AND GEARING
Gross debt
Current debt 1,286 1,824 1,739
Non-current debt 8,029 8,668 9,768
Gross debt as reported in statement of financial position 9,315 10,491 11,507
Related net hedging asset (1) (217) (90) (275)
Hedged gross debt 9,098 10,402 11,232
Less : Cash and bank balances (625) (525) (632)
Net debt 8,473 9,877 10,600
Gross debt gearing ratio (2) 23.0% 26.0% 28.0%
Net debt gearing ratio 21.8% 25.0% 26.9%
As at
30 Jun
2018
S$ m
31 Mar
Restated
2018
S$ m
Restated
30 Jun
2017
S$ m
Notes:
(1) The net hedging asset relates to the fair values of cross currency and interest rate swaps.
(2) Gross debt gearing ratio refers to the ratio of gross debt to gross capitalisation. Gross capitalisation is the aggregate of gross debt, shareholders’ funds and minority interests.
Net debt decreased by S$1.40 billion from a quarter ago to S$8.47 billion as at 30 June 2018 mainly due to net repayment of borrowings. Consequently, net debt gearing ratio decreased to 21.8% from 25.0% a quarter ago.

Singapore Telecommunications Ltd And Subsidiary Companies Page 16
SECTION 1 : GROUP
CASH FLOW AND CAPITAL EXPENDITURE
Net cash inflow from operating activities
Profit before exceptional items and tax 999 1,335 1,101 -25.2
Non-cash items 183 (114) 106 nm
Operating cash flow before working capital changes 1,182 1,221 1,207 -3.2
Changes in operating assets and liabilities (260) (129) 195 101.5
923 1,092 1,402 -15.5
Cash paid to employees under performance share plans * (1) * nm
Tax paid on operating activities (58) (71) (89) -18.1
Operating cash flow before dividends from associates 865 1,021 1,313 -15.3
Dividends/ Distributions received from associates 1,182 961 96 23.0
Withholding tax paid on dividends received (116) (96) (6) 20.3
1,931 1,886 1,403 2.4
Net cash outflow for investing activities
Accrued capital expenditure (375) (341) (952) 10.0
Changes in creditors' balances (90) (251) 348 -64.2
Cash capital expenditure (465) (592) (603) -21.4
Investment in associates - - (539) -
Deferred proceeds from disposal of an associate 4 - 7 nm
Payment for purchase of spectrum (35) (934) - -96.3
Payment for purchase of other intangibles (21) (43) (33) -51.6
Payment for purchase of subsidiaries, net of cash acquired - (340) - nm
Investment in venture investments (9) (25) (9) -64.8
Proceeds from disposal of venture investments 3 1 38 115.4
Proceeds from disposal of property, plant and equipment 118 4 * @
Withholding tax paid on interest received on inter-company loans - - (12) -
Payment for acquisition of non-controlling interests (16) - - nm
Others 2 2 3 -25.0
(419) (1,928) (1,149) -78.3
Net cash (outflow)/ inflow for financing activities
Net (decrease)/ increase in borrowings (1,320) 280 1,113 nm
Settlement of swap for bonds repaid 3 - - nm
Net interest paid on borrowings and swaps (96) (121) (86) -20.6
Interim dividend paid to shareholders - - (1,110) -
Special dividend paid to shareholders - - (490) -
Purchase of performance shares (7) (10) (6) -32.4**
(1,420) 149 (579) nm
Net increase/ (decrease) in cash and cash equivalents 92 107 (324) -13.8
Exchange effects on cash and cash equivalents 7 (9) 8 nm
Group cash and cash equivalents at beginning 525 534 841 -1.7
Group cash and cash equivalents at end 625 632 525 -1.2
Group free cash flow
Singapore 268 305 343 -12.1
Optus 131 123 367 6.7
Group free cash flow (before associates' dividends/ distributions) 400 428 709 -6.7
Dividends/ Distributions received from associates (net of withholding tax) 1,067 865 91 23.3
Group free cash flow 1,466 1,294 800 13.3
Optus free cash flow (in A$) 130 120 357 8.2
Cash capex to operating revenue 11% 14% 14%
YOY
Chge
%
Quarter
30 Jun
2018
S$ m
Restated
30 Jun
2017
S$ m
Restated
31 Mar
2018
S$ m
“*” denotes less than +/- S$0.5 million and “@” denotes more than +/- 500%.

Singapore Telecommunications Ltd And Subsidiary Companies Page 17
SECTION 1 : GROUP
Net cash inflow from operating activities (before associates’ dividend receipts) for the quarter declined 15% to S$865 million due mainly to working capital movements. Dividends from the associates increased mainly attributable to timing of dividend received from Telkomsel partly offset by a 9% depreciation of the Indonesian Rupiah against the Singapore Dollar. Consequently, total cash flow from operations grew 2.4% to S$1.93 billion. Net cash outflow for investing activities was S$419 million. In the quarter, the Group received S$118 million from disposal of a property in Singapore. Capital expenditure comprised S$188 million for Singapore and S$277 million (A$274 million) for Australia. In Singapore, major capital investments in the quarter included S$55 million for fixed and data infrastructure, S$49 million for ICT investments, S$45 million for mobile network and S$22 million for information systems. In Australia, capital investments in mobile network, and fixed and other core infrastructure were A$135 million and A$139 million respectively. With higher dividends received from associates and lower capital expenditure, partially offset by working capital movements, the Group’s free cash flow grew 13% to S$1.47 billion. Net cash financing outflow of S$1.42 billion in the quarter mainly comprised of S$1.32 billion in net repayment of borrowings and S$96 million in interest payments. Overall cash balance increased S$100 million from a quarter ago and the cash balance was S$625 million as at 30 June 2018.

Singapore Telecommunications Ltd And Subsidiary Companies Page 18
SECTION 2 : GROUP CONSUMER
GROUP CONSUMER
MANAGEMENT DISCUSSION AND ANALYSIS
Group Consumer comprises the consumer businesses across Singapore and Australia, as well as the regional associates in the emerging markets. The results shown in this section are for the consumer businesses across Singapore and Australia only. The results of the regional associates are discussed in Section 5.
FINANCIAL HIGHLIGHTS
FOR THE FIRST QUARTER ENDED 30 JUNE 2018
Operating revenue increased 1.9% while EBITDA and EBIT declined
1.2% and 5.1% respectively.
In constant currency terms3, operating revenue and EBITDA rose 4.6% and 1.5% respectively, while EBIT decreased 2.8%.
3 Assuming constant exchange rates for the Australian Dollar from the corresponding quarter ended 30 June
2017.

Singapore Telecommunications Ltd And Subsidiary Companies Page 19
SECTION 2 : GROUP CONSUMER
GROUP CONSUMER SUMMARY INCOME STATEMENT For The First Quarter Ended 30 June 2018
Operating revenue 2,356 2,313 1.9
Operating expenses (1,602) (1,575) 1.7
754 738 2.1
Other income 40 65 -38.2
EBITDA 794 804 -1.2
- margin 33.7% 34.7%
Depreciation & amortisation (390) (378) 3.2
404 426 -5.1
NBN migration revenues 25 43 -42.9
Exclude NBN migration revenues
Operating revenue 2,332 2,270 2.7
EBITDA 770 761 1.2
EBIT 380 383 -0.8
2018
S$ m
30 Jun
Quarter
Restated
2017
S$ m
%
EBIT
YOY
Chge
Selling & administrativeCost of sales (2)
637 580 9.8
Selling & administrativeSelling & administrative 420 439 -4.4
Cost of salesTraffic expenses 266 260 2.3
Staff costsStaff costs 243 234 4.0
Selling & administrativeRepair & maintenance 42 51 -18.6
OthersOthers (5) 12 nm
Operating expensesOperating expenses 1,602 1,575 1.7
S$ m
YOY
%
Quarter
Chge2018
S$ m
Restated
2017
30 Jun
Notes:
(1) The above figures include the costs of International Group division which have responsibility over the regional associates.
(2) Cost of sales include costs of content and programming.

Singapore Telecommunications Ltd And Subsidiary Companies Page 20
SECTION 2 : GROUP CONSUMER
GROUP CONSUMER OPERATING HIGHLIGHTS For The First Quarter Ended 30 June 2018
Group Consumer recorded revenue growth of 1.9% while EBITDA declined 1.2% due to a weaker Australian Dollar which depreciated 3% against the Singapore Dollar from the same quarter last year. In constant currency terms, operating revenue and EBITDA would have increased by 4.6% and 1.5% respectively. The decline in voice due to continued data substitution and lower NBN migration revenues in Australia following NBN’s temporary suspension of new orders on its HFC access network was offset by higher equipment sales. Excluding NBN migration revenues in Australia, Group Consumer’s operating revenue would have increased 2.7% (5.5% in constant currency terms) and EBITDA would have grown 1.2% (3.9% in constant currency terms). EBIT fell 2.8% in constant currency terms after including higher depreciation and amortisation charges from investments in mobile infrastructure network, spectrum and new billing system.
SEQUENTIAL QUARTERLY RESULTS Results for the current quarter compared to the preceding quarter ended 31 March 2018 were as follows:
Restated
30 Jun 31 Mar
2018 2018
S$ m S$ m
Operating revenue 2,356 2,380 -1.0
Operating expenses (1,602) (1,607) -0.3
EBITDA 794 812 -2.1
- margin 33.7% 34.1%
404 416 -2.8
NBN migration revenue 25 18 39.2
Exclude NBN migration revenue
Operating revenue 2,332 2,362 -1.3
EBITDA 770 794 -3.0
EBIT 380 398 -4.7
EBIT
Quarter
QOQ
Chge
%
Compared to the preceding quarter, operating revenue was lower due to a weaker Australian Dollar. EBITDA declined mainly from Australia.
Singapore Telecommunications Ltd And Subsidiary Companies Page 21
SECTION 2 : GROUP CONSUMER
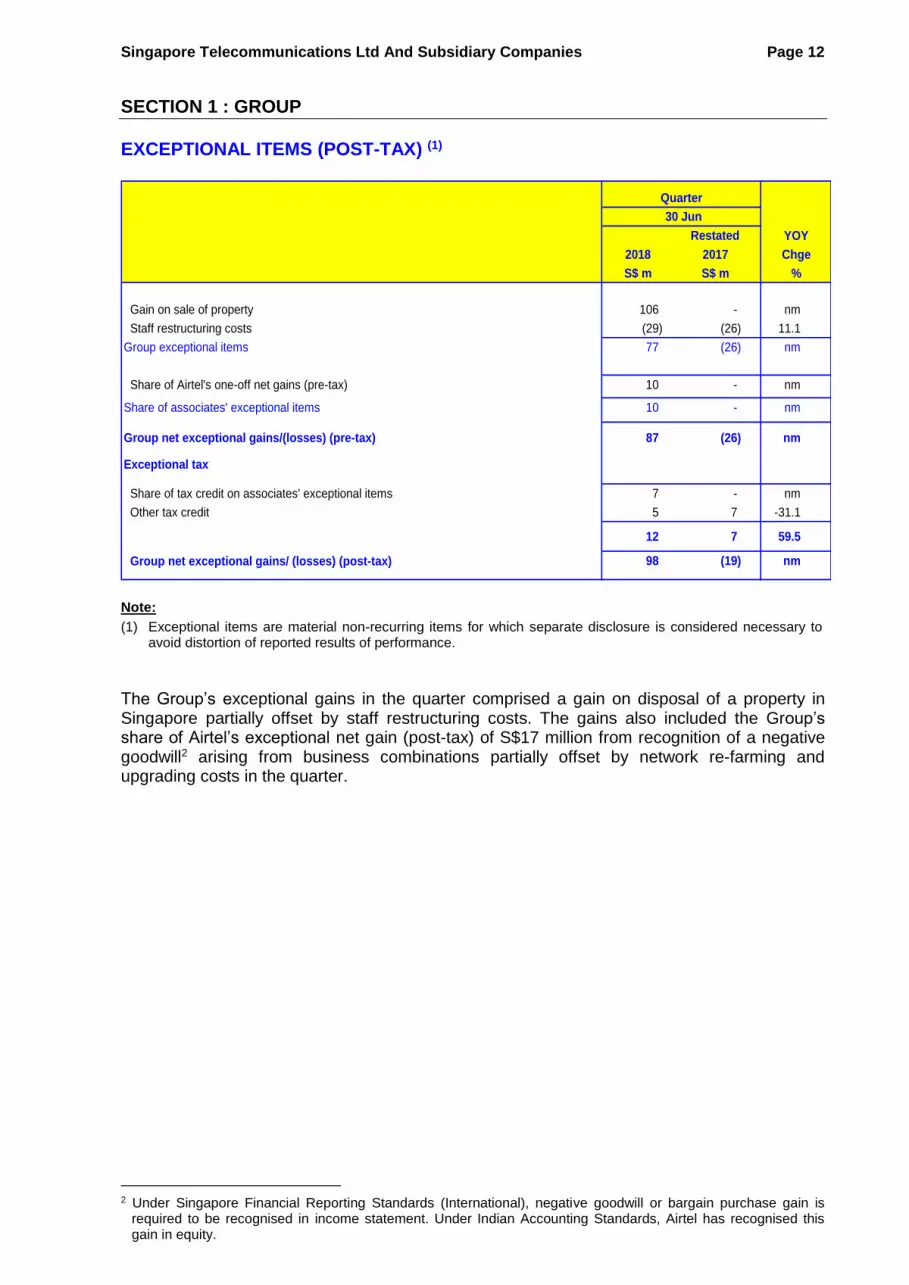
SINGAPORE CONSUMER SUMMARY INCOME STATEMENT For The First Quarter Ended 30 June 2018
Operating revenue 547 538 1.7
Operating expenses (360) (346) 3.9
187 191 -2.3
Other income (1)
6 7 -11.6
EBITDA 193 198 -2.6
- margin 35.3% 36.8%
Depreciation & amortisation (62) (57) 9.3
131 141 -7.4
2018
S$ m
Restated
2017
S$ m
Chge
%
YOY
EBIT
30 Jun
Quarter
Mobile service 265 276 -3.8
Sale of equipment 105 100 5.5
Residential Pay TV 65 58 13.6
Fixed broadband 59 57 4.4
Fixed voice 33 33 -2.4
Others (2)
19 15 31.5
Operating revenue 547 538 1.7
Cost of sales 170 150 13.2
Selling & administrative 74 75 -1.2
Staff costs 57 60 -4.2
Traffic expenses 52 55 -4.2
Repair & maintenance 13 12 5.9
Others (6) (5) 32.6
Operating expenses 360 346 3.9
YOY
Chge
%
Quarter
30 Jun
2018
S$ m
Restated
2017
S$ m
Notes:
(1) ‘Other income’ include trade foreign currency exchange differences, rental income, gain/loss on disposal of scrap copper and property, plant and equipment, and other miscellaneous recoveries. The net trade foreign exchange gain amounted to S$0.1 million (Q1 FY2018: S$0.1 million of loss) for the quarter.
(2) ‘Other revenue’ include digital services and revenues from mobile network cabling works and projects.
(3) Comparatives have been restated to be consistent with the current periods.

Singapore Telecommunications Ltd And Subsidiary Companies Page 22
SECTION 2 : GROUP CONSUMER
SINGAPORE CONSUMER OPERATING PERFORMANCE For The First Quarter Ended 30 June 2018 Singapore Consumer recorded a resilient performance in the quarter. Mobile data recorded strong growth for the quarter on higher subscription of both data add-on plans and data roaming plans. Voice usage (IDD, local and roaming), however, continued to decline due to voice to data substitution. Consequently, mobile service revenue declined by 3.8%. Including equipment sales, total mobile revenue declined by 1.3%. The postpaid customer base grew by over 16,0004 from a quarter ago, mainly from SIM-only and Mobile Share plans. Prepaid ARPU for Singapore Consumer grew this quarter on higher data add-ons from strong adoption of content and app bundles, despite the decline in voice and IDD usage. During the quarter, Singtel expanded its suite of new services to cater to the needs of mobile customers. Singapore’s first mobile handset leasing plan for premium handsets allows customers to sign up for SIM-only plans with an option to lease a handset at an affordable monthly rate. Singtel also introduced the Combo XO (or cross-over) plan, an affordable postpaid mobile plan that offers customers large data allowance with handset discounts. To further complement Singtel’s wide range of content offerings, Singtel collaborated with Apple Music on an exclusive basis to offer customers data-free music streaming from a catalogue of more than 45 million songs. Consumer Home Services which comprise fixed broadband, residential pay TV and voice revenues grew by 7.0%, boosted by pay TV revenue contribution from 2018 FIFA World Cup in June, with another month of contribution in July. Broadband revenue was up 4.4% with higher value added services and increased premium equipment bundling such as Samsung Connect Home and Wifi Mesh. The 2 Gbps home fibre plan, launched in November 2017, remained popular with good sign ups in the quarter. Excluding World Cup, the number of customers who signed up for ‘on-the-go’ services, namely the Cast OTT and Singtel TV Go companion apps, grew by 10,000 in the quarter to 109,000 as at 30 June 2018. Excluding Cost of sales which increased due to higher Equipment sales and TV content costs, operating expenses fell 3.3%. This was contributed by lower selling and administrative expenses and lower staff costs while traffic expenses fell from lower outpayments. Consequently, EBITDA declined 2.6%. EBIT declined 7.4% after including depreciation and amortisation charges which rose on investments in mobile infrastructure network, spectrum and a new billing system. Singtel was named the Asia’s Best Mobile Carrier at the recent Telecom Asia Awards 2018, a recognition of its commitment to provide customers robust connectivity, innovative mobile data options and enriched digital content. It was also recognised for providing the Most Innovative Approach to customer experience.
4 Based on total product view (i.e. included Enterprise mobile).

Singapore Telecommunications Ltd And Subsidiary Companies Page 23
SECTION 2 : GROUP CONSUMER
SEQUENTIAL QUARTERLY RESULTS Results for the current quarter compared to the preceding quarter ended 31 March 2018 were as follows:
Operating revenue 547 535 2.2
Operating expenses (360) (379) -5.0
EBITDA 193 160 20.5
- margin 35.3% 29.9%
131 97 34.9
Chge
%
Quarter
QOQ30 Jun
2018
S$ m
Restated
31 Mar
2018
S$ m
EBIT
EBITDA grew on higher operating revenue from seasonally higher mobile roaming revenue in the June quarter. Operating expenses were lower in the current quarter from lower selling and administrative expenses.
Singapore Telecommunications Ltd And Subsidiary Companies Page 24
SECTION 2: GROUP CONSUMER
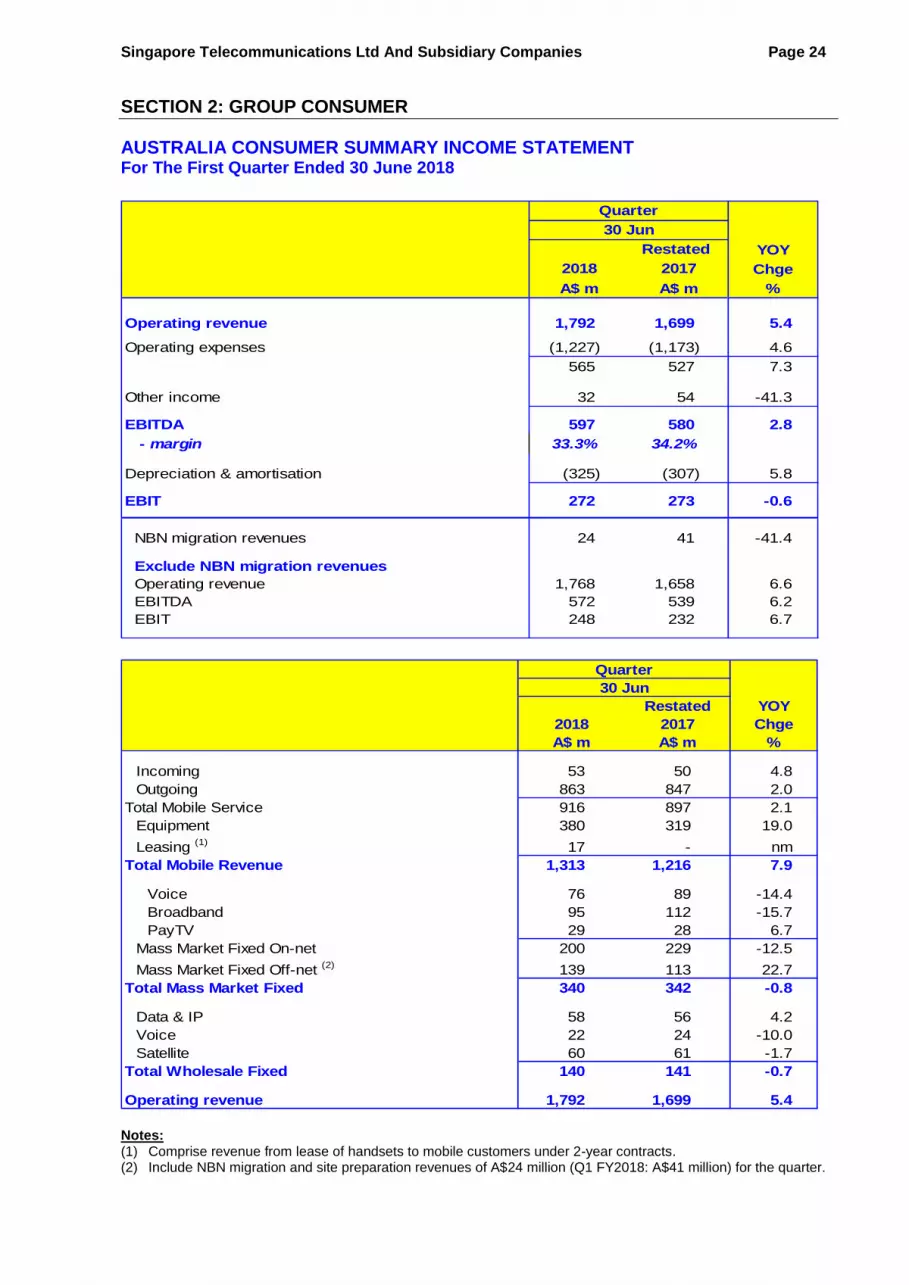
AUSTRALIA CONSUMER SUMMARY INCOME STATEMENT For The First Quarter Ended 30 June 2018
Operating revenue 1,792 1,699 5.4
Operating expenses (1,227) (1,173) 4.6
565 527 7.3
Other income 32 54 -41.3
EBITDA 597 580 2.8
- margin 33.3% 34.2%
Depreciation & amortisation (325) (307) 5.8
EBIT 272 273 -0.6
NBN migration revenues 24 41 -41.4
Exclude NBN migration revenues
Operating revenue 1,768 1,658 6.6
EBITDA 572 539 6.2
EBIT 248 232 6.7
Chge
%
YOY
Quarter
30 Jun
2018
A$ m
Restated
2017
A$ m
Incoming 53 50 4.8
Outgoing 863 847 2.0
Total Mobile Service 916 897 2.1
Equipment 380 319 19.0
Leasing (1)
17 - nm
Total Mobile Revenue 1,313 1,216 7.9
Voice 76 89 -14.4
Broadband 95 112 -15.7
PayTV 29 28 6.7
Mass Market Fixed On-net 200 229 -12.5
Mass Market Fixed Off-net (2)
139 113 22.7
Total Mass Market Fixed 340 342 -0.8
Data & IP 58 56 4.2
Voice 22 24 -10.0
Satellite 60 61 -1.7
Total Wholesale Fixed 140 141 -0.7
Operating revenue 1,792 1,699 5.4
A$ m A$ m %
YOYRestated
Quarter
30 Jun
2018 2017 Chge
Notes:
(1) Comprise revenue from lease of handsets to mobile customers under 2-year contracts. (2) Include NBN migration and site preparation revenues of A$24 million (Q1 FY2018: A$41 million) for the quarter.

Singapore Telecommunications Ltd And Subsidiary Companies Page 25
SECTION 2 : GROUP CONSUMER
Cost of sales 463 411 12.5
Selling & administrative 340 347 -2.1
Traffic expenses 211 196 7.6
Staff costs 183 165 10.9
Repair & maintenance 29 37 -22.9
Others 1 16 -91.2
Operating expenses 1,227 1,173 4.6
A$ m A$ m %
Quarter
30 Jun
2018 2017 Chge
YOYRestated
AUSTRALIA CONSUMER OPERATING PERFORMANCE For The First Quarter Ended 30 June 2018 Optus Consumer reported strong growth in operating revenue of A$93 million or 5.4% this quarter. The growth was driven by Mobile while Fixed revenues remained flat due to NBN’s temporary suspension of migrating customers to the NBN’s HFC network. Excluding NBN migration and site preparation revenues, operating revenue increased 6.6%. Mobile revenue grew a strong 7.9% in the quarter primarily from customer growth and higher equipment sales. Mobile service revenue increased 2.1% on customer growth partially offset by lower ARPU. Blended mobile and postpaid handset ARPU declined 2% and 3% respectively, impacted by the increasing mix of SIM-only plans and data price competition. Mobile customer growth continued with the addition of 60,000 new services this quarter. The postpaid handset customer base grew by 30,0005, with branded handset customer base increasing by 45,000. Prepaid handset and mobile broadband customer base grew by 19,000 and 11,000 respectively. Continued investments in networks, technology and content have allowed the Australia Consumer business to differentiate and grow. As at 30 June 2018, Optus’ 4G network population coverage was 96.9% in Australia, with 6,895 sites upgraded to 4G of which almost 5,800 have been upgraded to 700MHz spectrum. Football continues to be a key pillar of the Australia Consumer business’ content strategy and Optus Sport aspires to be the home of elite international football in Australia. In addition to the Premier League, Optus had signed exclusive broadcast rights for all European International football until 2022, including rights to Euro 2020 and qualifiers, UEFA Nations League and UEFA 2022 World Cup Qualifiers. In this quarter, customer satisfaction improved with the Australia Consumer’s NPS score rising from +10 to +12 and Optus was voted as the most digitalised of the leading ANZ telcos6. An Innovation Hub was also launched to connect the SMBs and startups with technology solutions.
5 Including Enterprise customers, Optus’ total postpaid handset customer base grew 31,000. 6 Digital eXperience Index (DXi) Report by Analysys Mason. Analysys Mason is a consulting and research specialist
in telecoms, media and technology.

Singapore Telecommunications Ltd And Subsidiary Companies Page 26
SECTION 2 : GROUP CONSUMER
In Mass Market Fixed, operating revenue was stable due to the temporary suspension of NBN’s HFC connections. Excluding NBN migration revenues, Mass Market Fixed revenue increased 4.8% mainly driven by NBN customer growth of 204,000 from a year ago. Wholesale Fixed revenue was stable as growth in Data & IP partially offset the decline in Satellite and voice revenues. Total operating expenses were higher driven by a shift in revenue mix to NBN and equipment sales which have resulted in higher traffic expenses and cost of sales. Excluding traffic and cost of sales, total operating expenses would have declined 2.3%. With improved revenue, EBITDA increased by 2.8% while EBIT was stable. Excluding NBN migration revenues, EBITDA and EBIT increased 6.2% and 6.7% respectively.

Singapore Telecommunications Ltd And Subsidiary Companies Page 27
SECTION 2 : GROUP CONSUMER
SEQUENTIAL QUARTERLY RESULTS Results for the current quarter compared to the preceding quarter ended 31 March 2018 were as follows:
Operating revenue 1,792 1,780 0.7
Operating expenses (1,227) (1,178) 4.2
EBITDA 597 635 -6.0
- margin 33.3% 35.7%
EBIT 272 314 -13.5
NBN migration revenues 24 17 41.8
Exclude NBN migration revenues
Operating revenue 1,768 1,763 0.3
EBITDA 572 618 -7.4
EBIT 248 297 -16.7
Quarter
QOQ
Chge
%
Restated
30 Jun
2018
A$ m
31 Mar
2018
A$ m
Against the preceding quarter, EBITDA declined due to higher NBN access costs and seasonality of expenses. EBIT was lower due to higher depreciation and amortisation charges.

Singapore Telecommunications Ltd And Subsidiary Companies Page 28
SECTION 3 : GROUP ENTERPRISE
GROUP ENTERPRISE
MANAGEMENT DISCUSSION AND ANALYSIS
Group Enterprise provides comprehensive and integrated ICT solutions to enterprise customers in Singapore, Australia, U.S.A., Europe and the region, covering mobile, equipment sales, fixed voice and data, managed services, cloud computing, cyber security, IT services and professional consulting. In this section, “Singapore” refers to all geographies that Singtel has operations other than Australia.
FINANCIAL HIGHLIGHTS
FOR THE FIRST QUARTER ENDED 30 JUNE 2018
Operating revenue at S$1.52 billion – down 3.2%.
EBITDA at S$449 million – down 6.8%.
EBIT at S$299 million – down 10%.
In constant currency terms7, operating revenue, EBITDA and EBIT declined 2.1%, 6.6% and 11% respectively.
7 Assuming constant exchange rates for the Australian Dollar and United States Dollar from the corresponding
quarter ended 30 June 2017.

Singapore Telecommunications Ltd And Subsidiary Companies Page 29
SECTION 3 : GROUP ENTERPRISE
GROUP ENTERPRISE SUMMARY INCOME STATEMENT For The First Quarter Ended 30 June 2018
Operating revenue 1,519 1,569 -3.2
Operating expenses (1,095) (1,095) **
424 474 -10.5
Other income Other income (1)
24 7 227.0
EBITDA 449 482 -6.8
- margin 29.5% 30.7%
Depreciation & amortisation (150) (148) 1.1
EBIT 299 333 -10.4
Global Cyber Security business
Managed Security and Technology Services 97 94 3.5
Payment Card Industry Compliance 16 23 -29.4
Operating revenue 114 117 -3.0
EBITDA (15) (8) 76.2
EBIT (27) (21) 29.0
2018 2017 Chge
S$ m S$ m %
Restated YOY
Quarter
30 Jun
Restated
Cyber security 114 117 -3.0
Other services(2)
426 456 -6.7
Managed services 539 573 -5.9
Business solutions(3)
140 132 5.8
ICT 679 706 -3.7
Data and Internet (4)
405 422 -3.9
Mobile service 202 210 -3.9
Fixed voice 124 137 -9.4
Sale of equipment 91 78 17.3
Others(5)
18 17 2.9
Operating revenue 1,519 1,569 -3.2
ICT as % of total 44.7% 45.0%
YOY
Quarter
30 Jun
2018 2017 Chge
S$ m S$ m %
“**” denotes less than +/-0.05%.

Singapore Telecommunications Ltd And Subsidiary Companies Page 30
SECTION 3 : GROUP ENTERPRISE
Notes:
(1) ‘Other income’ include trade foreign exchange differences, rental income, gain/loss on disposal of property, plant and equipment, and other recoveries. The net trade foreign exchange gain amounted to S$0.3 million (Q1 FY2018: S$3 million of loss) for the quarter.
(2) Include facility management, managed and network services, and value-added reselling and services.
(3) Include applications management services and outsourcing, system integration and business process outsourcing and communication engineering services.
(4) Include local leased circuits, international leased circuits, fixed broadband, Singtel Internet exchange and satellite.
(5) ‘Other revenue’ include TV and digital business revenues.
Staff costsCost of sales 413 403 2.5
Cost of salesStaff costs 368 383 -3.9
Selling & administrativeSelling & administrative 153 146 4.6
Traffic expensesTraffic expenses 127 134 -5.2
Repairs, maintenance and others 34 29 17.9
Operating expensesOperating expenses 1,095 1,095 **
2018 2017 Chge
S$ m S$ m %
YOY
Quarter
30 Jun
Restated
“**” denotes less than +/-0.05%.
GROUP ENTERPRISE OPERATING HIGHLIGHTS For the First Quarter Ended 30 June 2018 Singapore contributed 74% (Q1 FY2018: 76%) and 87% (Q1 FY2018: 86%) to Group Enterprise’s operating revenue and EBITDA respectively. Group Enterprise’s operating revenue fell 3.2% on completion of a large infrastructure project last year and continued declines in traditional legacy services, especially voice. In constant currency terms, operating revenue would have declined 2.1%. Cyber security revenue was stable in constant currency terms. The cyber security business in the Asia Pacific region maintained its momentum and achieved strong double-digit growth. However, overall cyber security revenue was impacted by lower sales in the United States due to commoditisation in the traditional payment card industry (PCI) compliance business and price competition.
Operating expenses were stable. The increase in Cost of Sales was mainly from the Australian ICT business with an increased mix of project related equipment sales as well as one-off write back of accruals in the last corresponding quarter. Staff costs fell from reduction in average headcount as well as lower staff incentive accruals. Selling and administrative expenses were up from increased property security expenses, higher utility rates, and marketing expenses associated with the Commonwealth Games in Australia. Traffic expenses fell on lower call and roaming traffic and unit cost. Repairs, maintenance and others increased with investments in network resiliency and security.

Singapore Telecommunications Ltd And Subsidiary Companies Page 31
SECTION 3 : GROUP ENTERPRISE
Other income was boosted by gains on disposal of property, plant and equipment this quarter. With lower operating revenue, EBITDA and EBIT declined 6.8% and 10% respectively.
During the quarter, Singtel continued to be recognised by IDC as a leading next-generation telecom service provider and managed security service provider in the Asia Pacific with strengthening capabilities on cloud and cyber security services portfolio8. Singtel received several awards from Asia Communication Awards for demonstrating outstanding performance and innovation - ‘Best Enterprise Service (Singtel Software-Defined Hybrid Network)’, ‘Cyber Safe Award (Singtel Managed Security Services)’, as well as ‘NFV Innovation Award (Singtel Network Functions Virtualisation Service)’. In this quarter, Singtel also showcased its innovation and capabilities in various events such as IoT Asia 2018 and NCS TechConnect 2018, with services and products enabling enterprises to improve operational efficiencies in a new digital environment. At the recent prestigious Telecom Asia Awards 2018, Singtel won the Best Cloud-Based Service award for providing a comprehensive suite of services for public, private and hybrid cloud platforms to help enterprises move their business applications and database into the cloud with ease. By combining cloud services with its cyber security solutions, data centres and managed services, Singtel enables enterprises to accelerate their digital transformation.
SEQUENTIAL QUARTERLY RESULTS Results for the current quarter compared to the preceding quarter ended 31 March 2018 were as follows:
Operating revenue 1,519 1,677 -9.4
Operating expenses 1,095 1,244 -12.0
EBITDA 449 449 **
- margin 29.5% 26.8%
EBIT 299 297 0.6
Quarter
31 Mar QOQ
2018 2018 Chge
S$ m S$ m %
Restated
30 Jun
“**” denotes less than +/-0.05%.
Operating revenue declined due mainly to seasonally higher ICT revenue recorded in the March quarter. EBITDA and EBIT, however, were stable from higher other income.
8 IDC MarketScape AsiaPacific Next-Generation Telcos Telecom Services 2018 Vendor Assessment and IDC
MarketScape AsiaPacific Managed Security Services 2018 Vendor Assessment.

Singapore Telecommunications Ltd And Subsidiary Companies Page 32
SECTION 3 : GROUP ENTERPRISE
SINGAPORE ENTERPRISE
Managed services (1)
365 420 -13.0
Business solutions (2)
140 132 5.8
ICT 505 552 -8.5
Data and Internet (3)
326 339 -3.7
Mobile service 156 162 -3.8
Sale of equipment 64 58 11.2
Fixed voice 59 62 -3.9
Others (4)
18 17 2.9
Operating revenue 1,129 1,190 -5.1
EBITDA 389 414 -6.0
- margin 34.4% 34.8%
Restated YOY
2018 2017 Chge
S$ m S$ m %
Quarter
30 Jun
Notes:
(1) Include cyber security, facility management, managed and network services, and value-added reselling and services.
(2) Include applications management services and outsourcing, system integration and business process outsourcing and communication engineering services.
(3) Include local leased circuits, international leased circuits, fixed broadband, Singtel Internet exchange and satellite.
(4) ‘Other revenue’ include TV and digital business revenues.
Operating revenue was down 5.1% this quarter from lower ICT and traditional legacy services, while EBITDA declined 6.0% with continued investments in digital and cyber security capabilities and product development. ICT revenue fell as revenue from Business solutions and Managed services was impacted by completion of a major infrastructure project as well as decline in Trustwave’s legacy payment card industry (PCI) data security business which is facing commoditisation. NCS’ order book remained stable at S$2.9 billion as at 30 June 2018. Data and Internet revenue declined 3.7% from the slowdown in the maritime industry and price erosion. Mobile service revenue fell 3.8% due to lower international and roaming call usage partly offset by continued growth in mobile data. Including equipment sales, total mobile revenue would have been stable. Fixed voice revenue fell 3.9% on lower call usage on continued mobile data substitution. The impact of the decline was partially mitigated by lower outpayment costs.

Singapore Telecommunications Ltd And Subsidiary Companies Page 33
SECTION 3 : GROUP ENTERPRISE
AUSTRALIA ENTERPRISE
ICT and Managed Services 173 147 17.6
Data and IP 78 79 -1.5
Mobile (1)
72 65 11.0
Voice 64 71 -10.8
Operating revenue (2)
386 362 6.6
EBITDA 59 65 -8.9
- margin 15.4% 18.0%
A$ m A$ m %
Quarter
30 Jun
2018 2017 Chge
YOYRestated
Notes:
(1) Include mobile service revenue and sale of equipment revenue. (2) Exclude small and medium business segment which is reported under ‘Australia Consumer’.
Operating revenue increased 6.6% driven by growth in ICT services and Mobile, partially offset by decline in traditional voice services. EBITDA, however, declined 8.9% due to intensifying price competition and higher mix of lower-margin ICT services. ICT and Managed Services revenue grew 18% attributable to continued growth in Cyber security, Cloud and Unified Communications revenues. Voice revenue fell 11%. The decrease was due to price erosion and declines in switched voice as businesses migrated to lower cost IP-based voice solutions. With expanding network coverage, Optus Business continued to connect more enterprise mobile customers. Mobile revenue increased 11% due to increased equipment sales and higher mobile applications revenue from an enlarged customer base. During the quarter, Optus Business continued to grow its suite of ICT products and services with long term customers such as the Australian Tax Office and the Department of Home Affairs. It also continued to acquire new customer mobile fleets, including NSW Uniting Care and the Queensland Ambulance Service.

Singapore Telecommunications Ltd And Subsidiary Companies Page 34
SECTION 4 : GROUP DIGITAL LIFE
GROUP DIGITAL LIFE
MANAGEMENT DISCUSSION AND ANALYSIS
Group Digital Life (“GDL”) focuses on using the latest Internet technologies and assets of the Group’s operating companies to develop new revenue and growth engines by entering into adjacent businesses where it has a competitive advantage. GDL has three key businesses – digital marketing (Amobee), regional premium OTT video (HOOQ) and advanced analytics and intelligence capabilities (DataSpark), and it also serves as Singtel’s digital innovation engine through Innov8.
FINANCIAL HIGHLIGHTS
FOR THE FIRST QUARTER ENDED 30 JUNE 2018
Operating revenue fell 5.4% and negative EBITDA was stable.
Negative EBIT reduced by 21% with lower amortisation charges on intangibles.
In constant currency terms9, operating revenue declined 1.3%, negative
EBITDA increased 3.4% while negative EBIT was lower by 18%.
9 Assuming constant exchange rates for the United States Dollar from the corresponding quarter ended 30
June 2017.

Singapore Telecommunications Ltd And Subsidiary Companies Page 35
SECTION 4 : GROUP DIGITAL LIFE
GROUP DIGITAL LIFE SUMMARY INCOME STATEMENT For The First Quarter Ended 30 June 2018
2018 2017
S$ m S$ m
Digital (1)
269 290 -7.1
Others (2)
7 3 115.1
Operating revenue 277 294 -5.7
Intercompany eliminations (18) (20) -10.1
Operating revenue 259 273 -5.4
Operating expenses (283) (296) -4.5
(24) (23) 6.6
Other gain/(loss) 1 (1) nm
EBITDA (23) (24) -0.4
Depreciation (6) (8) -27.4
Amortisation of intangibles (7) (14) -52.1
(13) (23) -42.9
(36) (46) -21.3
Operating revenue 269 290 -7.1
Intercompany eliminations (18) (20) -9.7
Operating revenue 252 271 -6.9
EBITDA * * nm
(9) (16) -42.3
Quarter
30 Jun
Amobee group
YOY
Chge
EBIT
%
EBIT
Notes:
(1) Mainly digital marketing (which includes digital advertising) revenue from Amobee group.
(2) Other revenues mainly comprise revenues from HOOQ and DataSpark.
*A negative sign for year-on-year change in EBITDA and EBIT denotes decrease in losses.
“*” denotes less than +/-S$0.5 million.

Singapore Telecommunications Ltd And Subsidiary Companies Page 36
SECTION 4 : GROUP DIGITAL LIFE
2018 2017
S$ m S$ m
Cost of sales 203 212 -4.3
Staff costs 55 57 -4.0
Selling & administrative 22 24 -8.8
Others 4 3 11.8
Operating expenses 283 296 -4.5
Chge
Quarter
30 June YOY
%
GROUP DIGITAL LIFE OPERATING HIGHLIGHTS For The First Quarter Ended 30 June 2018 Operating revenue of GDL was impacted by a weaker US Dollar from the same quarter last year. Consequently, operating revenue declined 5.4% (1.3% in constant currency terms). Operating revenue from Amobee declined 3.1% in constant currency terms due mainly to the timing of marketing spend by certain Amobee’s customers. Its Agency Trading Desk business doubled from the same quarter last year. The decline was partly offset by higher revenue from HOOQ on continued ramp up of its business. Despite lower revenue, negative EBITDA was stable at S$23 million. After accounting for depreciation and amortisation of acquired intangibles for Amobee group, negative EBIT fell by 21% to S$36 million. In July 2018, Amobee acquired the assets of Videology in a court-supervised auction. With the acquisition, Amobee will expand its omni-channel suite to include linear and advanced TV. Amobee continued to showcase its marketing technology excellence in the quarter. It partnered with Oracle Data Cloud and launched the Amobee Sales Accelerator solution for the Consumer Packaged Goods (CPG) brands in the United States. This solution significantly reduces the waiting time for offline purchasing data and allows the brands to know the impact of their online advertising campaigns on in-store sales in ten weeks. Additionally, it helps customers to optimise campaigns in mid-flight by providing faster and more comprehensive data such as product preferences and store locations. Amobee continued to gain industry recognition for its excellence in digital marketing. It received two award wins for its work with Southwest Airlines for ‘Most Effective Online Brand Awareness Campaign’ and ‘Most Effective Use of Video’ from the Dallas-Fort Worth Interactive Marketing Association. The campaign has helped Southwest Airlines to amplify their “Every Seat Has A Story” messaging by utilising Amobee’s proprietary Brand Intelligence technology. This technology monitored daily topics such as flights, hotels and destinations and enabled Southwest Airlines to take advantage of the travel and competitive brand conversations to place ads across various social media platforms. Amobee won two Internet Advertising Competition awards during the quarter - ‘Best Advertising Rich Media Online Campaign, Best Computer: Hardware Rich Media Online Campaign’ in partnership with Intel and Optimum Media Direction, and ‘Best Advertising Website, Best Automobile Website’ in partnership with Honda and Rubin Postaer and Associates.

Singapore Telecommunications Ltd And Subsidiary Companies Page 37
SECTION 4 : GROUP DIGITAL LIFE
In the quarter, HOOQ launched its free-to-air LIVE TV offering to the Indonesian market. With this, mobile users across iOS and Android can access their favourite local TV shows from 9 free-to-air streaming channels on the HOOQ application or through their mobile web browsers.
SEQUENTIAL QUARTERLY RESULTS Results for the current quarter compared to the preceding quarter ended 31 March 2018 were as follows:
Operating revenue (before intercompany eliminations) 277 227 22.1
Intercompany eliminations (18) (22) -15.9
Operating revenue 259 205 26.1
Operating expenses (283) (207) 36.5
EBITDA (23) * nm
EBIT (36) (14) 168.9
Quarter
QOQ
Chge
%
31 Mar
2018
S$ m
30 Jun
2018
S$ m
“*” denotes less than S$0.5 million.
Operating revenue grew on higher revenue from Amobee. However, EBITDA losses were recorded this quarter as the results in the preceding quarter were lifted by content costs credits and government grants not repeated this quarter.

Singapore Telecommunications Ltd And Subsidiary Companies Page 38
SECTION 5: ASSOCIATES / JOINT VENTURES
FINANCIAL HIGHLIGHTS FOR THE FIRST QUARTER ENDED 30 JUNE 2018
The contributions from the associates were negatively impacted by currency movements.
Pre-tax and post-tax underlying profit10 contributions from associates fell 43% and 26% respectively on lower profits at Telkomsel and Airtel as well as lower contribution from NetLink NBN Trust on Singtel’s reduction of economic interest.
If the regional currencies had remained stable from last corresponding quarter, the pre-tax and post-tax underlying profit10 contributions from associates would have declined by 40% and 21% respectively.
The Group’s combined mobile customer base11 was up significantly by 29 million or 4.2% in the quarter to 735 million on growth in India.
10 Exclude one-off items of the associates classified as exceptional items of the Group.
11 Combined mobile customer base here refers to the total number of mobile customers in Singtel, Optus and the regional associates.

Singapore Telecommunications Ltd And Subsidiary Companies Page 39
SECTION 5 : ASSOCIATES/ JOINT VENTURES
Pre-tax profit contribution (1)
2018 2017 Chge
S$ m S$ m
Regional associates
Telkomsel
- operating results 236 383 -38.4
- fair value gain 2 * nm
237 383 -38.0
AIS
- operating results 93 82 13.1
- fair value gain 1 * nm
94 82 14.1
Bharti Telecom ("BTL")/ Bharti Airtel ("Airtel")
Airtel (2)
- operating results (India and South Asia) (3)
43 198 -78.3
- operating results (Africa) (3)78 43 80.4
- operating results (Others) (8) (2) 387.5
- net finance costs (164) (141) 16.5
- fair value loss (2) (1) 128.6
(52) 98 nm
BTL (4)(11) 5 nm
(63) 103 nm
Globe
- operating results 94 80 16.9
- fair value gain 1 1 12.5
95 81 16.8
Intouch (5)
- operating results 35 30 15.8
- fair value gain 1 * nm
- amortisation of acquired intangibles (7) (6) 11.3
28 24 18.5
391 673 -42.0
Other Singtel associates
NetLink NBN Trust/ NetLink Trust ("NLT") (6) 13 45 -72.4
Other associates (7)13 15 -15.7
Singtel share of ordinary results (pre-tax) 416 734 -43.3
Optus share of ordinary results (pre-tax) * * nm
Group share of ordinary results (pre-tax) 416 734 -43.3
Exceptional items ("EI")
Singtel share of one-off items - (4) nm
Group share of EI - (4) nm
Singtel share of pre-tax profit (2) 416 730 -43.0
Optus share of pre-tax profit * * nm
Group share of pre-tax profit (2) 416 730 -43.0
(excluding Airtel and BTL) 479 631 -24.0
Group share of taxes (2) 32 214 -85.0
Effective tax rate 7.7% 29.4%
Quarter
30 Jun YOY
%

Singapore Telecommunications Ltd And Subsidiary Companies Page 40
SECTION 5 : ASSOCIATES/ JOINT VENTURES
Post-tax profit contribution (1)
S$ m % (8) S$ m % (8)
Regional associates
Telkomsel 177 24 286 31 -38.0
AIS 78 11 68 8 14.2
Airtel (2)
- ordinary results (India and South Asia) (3)(49) 59 nm
- ordinary results (Africa) (3)35 (24) nm
- ordinary results (Others) (8) (2) 387.5
(22) 33 nm
- exceptional items 52 (3) nm
30 30 -1.0
BTL (4)(11) 5 nm
19 3 35 4 -46.5
Globe 65 9 57 6 15.0
Intouch (5)
- ordinary results 29 24 18.4
- amortisation of acquired intangibles (6) (5) 12.2
23 3 20 2 20.0
363 49 465 51 -22.1
Other Singtel associates
NLT (6)12 2 38 4 -68.9
Other associates (7)10 1 12 1 -23.4
Singtel share of post-tax profit (2) 384 52 515 57 -25.5
Optus share of post-tax profit * ** * ** nm
Group share of post-tax profit (2) 384 52 515 57 -25.5
(excluding Airtel and BTL) 365 480 -24.0
%
2017
Quarter
30 Jun
2018
YOY
Chge
Post-tax profit contribution
(in constant currency) (9)
2018 2017
S$ m S$ m
Regional associates
- operating results 418 679 -38.5
- fair value gain 2 * nm
- amortisation of acquired intangibles (7) (6) 8.1
413 673 -38.6
Other associates 25 61 -58.2
Group share of ordinary results 439 734 -40.2
Group share of exceptional items - (4) nm
Group share of pre-tax profit 439 730 -39.9
Group share of tax expense (34) (214) -84.4
Group share of post-tax profit 405 515 -21.4
Excluding Airtel and BTL
Group share of pre-tax profit 508 631 -19.5
Group share of tax expense (122) (150) -18.8
Group share of post-tax profit 385 480 -19.7
%
Quarter
30 Jun YOY
Chge

Singapore Telecommunications Ltd And Subsidiary Companies Page 41
SECTION 5 : ASSOCIATES/ JOINT VENTURES
Notes:
(1) The accounts of the associates are prepared based on local GAAP. Where applicable and material, the accounting policies of the associates have been restated for compliance with the Group’s accounting policies.
(2) Share of results excluded the Group’s share of the associates’ one-off items which have been classified as exceptional items of the Group.
(3) With effect from 1 April 2018, borrowings for acquisition of Africa operations and its associated finance costs previously included under ‘India and South Asia’ have been included under ‘Africa’. Comparatives have accordingly been restated.
(4) As at 30 June 2018, Bharti Telecom Limited (“BTL”) holds 50.1% equity interest in Airtel. In BTL’s standalone
books, the amount mainly comprised interest charges on higher debt arising from acquisition of additional equity interest in Airtel.
(5) Intouch, which Singtel acquired an equity interest of 21.0% in November 2016, has an equity interest of 40.5% in AIS.
(6) Singtel ceased to own units in NetLink Trust following the sale to NetLink NBN Trust in July 2017 but continues to have an interest of 24.79% in NetLink NBN Trust, the holding company of NetLink Trust. The share of results included Singtel’s amortisation of deferred gain of S$5 million (Q1 FY2018: S$17 million) for the quarter on assets transferred to NetLink Trust in prior years, but excluded fair value adjustments recorded by NetLink NBN Trust in respect of its acquisition of units in NetLink Trust.
(7) Include the share of results of Singapore Post Limited.
(8) Shows the post-tax underlying profit contribution of the associates to the Group’s underlying net profit.
(9) Assuming constant exchange rates for the regional currencies (Indian Rupee, Indonesian Rupiah, Philippine Peso and Thai Baht) from the corresponding quarter ended 30 June 2017.
“*” denotes less than +/- S$0.5 million and “**” denotes less than +/- 0.05%.
The regional associates continued to ride the growth in data as the leading operators in their respective markets. However, profit contributions from the associates in this quarter were negatively impacted by adverse currency movements and lower contributions from Telkomsel and Airtel in the key markets of Indonesia and India respectively. Contribution from NetLink Trust was also lower on Singtel’s reduction of economic interest. Pre-tax and post-tax underlying profit contributions from the associates fell 43% and 26% respectively. If the regional currencies had remained stable from last corresponding quarter, the associates’ pre-tax and post-tax underlying profit contributions would have declined by 40% and 21% respectively. Consequently, the associates’ underlying profit contributed 52% to the Group’s underlying net profit, down 5 percentage points from the same quarter last year. Telkomsel reported lower revenue due to the steep decline in voice and SMS revenues and slower data growth from intense data pricing competition coupled with higher operating costs. The depreciation of the Indonesian Rupiah by 9% further reduced its profit contribution. Its market share, however, continued to grow despite stiff competition. Airtel recorded weaker revenue and earnings adversely impacted by the lower domestic and international mobile termination rates and continued disruptive price competition in India, partially mitigated by improved performance in Africa. AIS recorded double-digit earnings growth driven by higher revenue and reduction in marketing spend and regulatory fees. Globe reported double-digit earnings growth on the back of higher revenue and lower interconnect usage, partly offset by higher marketing expenses and increased depreciation charges and finance costs. Its profit contribution to the Group was, however, impacted by the 10% depreciation of the Philippine Peso.

Singapore Telecommunications Ltd And Subsidiary Companies Page 42
SECTION 5 : ASSOCIATES/ JOINT VENTURES
PT Telekomunikasi Selular (“Telkomsel”) Telkomsel is the leading operator of cellular telecommunications services in Indonesia with 175,700 radio base stations (of which 71% are 3G/4G base transceiver stations) providing nationwide coverage. Telkomsel continued to expand its network with a focus on growing data and digital services. In the quarter, Telkomsel added approximately 8,000 4G radio base stations. Operating revenue for the quarter declined 12% year-on-year due mainly to the sharp 23% decline in voice and SMS revenues on increased popularity of OTT applications and higher smartphone penetration. While growth in data continued to be robust, revenue increase for data and digital services has slowed to 11% from intense data pricing competition amid the mandatory exercise to register prepaid SIM cards. EBITDA declined 27% on lower revenue, higher operation and maintenance costs from accelerated deployment of 4G network, increased frequency fees for 2300 MHz spectrum acquired in October 2017 and higher cost of services. Telkomsel’s pre-tax profit declined 32% in Indonesian Rupiah terms. The Group’s share of Telkomsel’s pre-tax profit fell 38% after accounting for a 9% depreciation of the Indonesian Rupiah against the Singapore Dollar. On a post-tax basis, Telkomsel’s profit contribution for the quarter declined a steep 38% and constituted 24% of the Group’s underlying net profit, down from 31% in the same corresponding quarter. Compared to the preceding quarter, operating revenue fell 5% due to the accelerated decline in legacy revenue partially offset by data revenue growth. Consequently, EBITDA declined 14% after accounting for increases in both operation and maintenance costs, and general and administrative expenses on seasonality. Telkomsel’s total mobile customer base fell 15 million in the quarter due to terminations of non-registered SIMs on completion of the registration exercise. In the preceding quarter, the net decline was 3.6 million. Its market share, however, continued to improve. The total mobile customer base as at 30 June 2018 was stable from a year ago at 178 million, including 135 million of data customers.
Advanced Info Service (“AIS”) AIS, the largest mobile communications operator in Thailand, is listed on the Stock Exchange of Thailand. It provides mobile services on 2G, 3G and 4G networks. AIS continues to maintain its mobile market leadership position and is the largest network coverage operator in Thailand. AIS registered double-digit growth in both EBITDA and net profit this quarter led by higher operating revenue and cost management. In the current quarter, AIS’ service revenue (excluding interconnect and equipment rental) rose 4% on increases in both data revenue (mainly from mobile postpaid segment) and fixed broadband revenue, as well as inclusion of full quarter results of CS Loxinfo acquired in January 2018.

Singapore Telecommunications Ltd And Subsidiary Companies Page 43
SECTION 5 : ASSOCIATES/ JOINT VENTURES
EBITDA grew strongly by 11% on the back of service revenue growth and lower operating expenses on reduction in both regulatory costs and marketing spend with reduced subsidies. Despite higher depreciation charges from network investments, AIS’ pre-tax profit grew 11% in Thai Baht terms. The Group’s share of AIS’ pre-tax profit, however, grew by 14% to S$94 million, lifted by 3% appreciation of the Thai Baht against the Singapore Dollar. On a post-tax basis, AIS’ profit contribution for the quarter rose 14% to S$78 million and contributed 11% to the Group’s underlying net profit, up 3 percentage points from the last corresponding quarter. Against the preceding quarter, EBITDA was stable as growth in service revenue (excluding interconnect and equipment rental) was offset by higher network costs. AIS continued to focus on the acquisition and retention of quality customers in its postpaid segment. As at 30 June 2018, its mobile customer base remained stable at 40 million from a quarter ago, as well as a year ago. The number of postpaid customers, however, increased by 0.8 million or 12% from a year ago as AIS pushed for migration from prepaid to postpaid. As announced recently, the 900 MHz and 1800 MHz license auctions are scheduled to be held in August 2018.
Airtel Group Airtel is listed on the Indian Stock Exchanges - National Stock Exchange and the Bombay Stock Exchange. It is a leading integrated telecommunications company with operations in 16 countries across Asia and Africa, offering telecom services under wireless and fixed line technology, national and international long distance connectivity, digital TV and integrated telecom solutions to its enterprise customers. Airtel also owns telecom tower infrastructure through its subsidiary and joint venture companies. Airtel has voluntarily reported consolidated financial statements based on IFRS in the Indian Stock Exchanges since April 2010. With effect from 1 April 2016, Airtel adopted Indian Accounting Standards as required by the local authorities. Consequently, Airtel ceased to report consolidated financial statements based on IFRS in the Indian Stock Exchanges. The consolidated financial statements of Airtel used for equity accounting by Singtel continued to be based on IFRS. India and Sri Lanka (“India and South Asia”) In India, Airtel completed the acquisition of Telenor following all regulatory and statutory approvals on 14 May 2018. Airtel has integrated Telenor’s operations across circles and added 43.4 MHz spectrum to its portfolio. During the quarter, Airtel continued to be adversely impacted by the mandatory reduction in domestic mobile termination rates from October 2017 and international mobile termination rates from February 2018. Its performance was further aggravated by competitive pricing in the industry led by a new operator intent on aggressive market share expansion.

Singapore Telecommunications Ltd And Subsidiary Companies Page 44
SECTION 5 : ASSOCIATES/ JOINT VENTURES
Operating revenue in India, including the contribution of Telenor, fell 13% primarily led by a drop of 19% in mobile revenue partly mitigated by growth in other segments. With continued rise in penetration of bundled offers which offered unlimited voice calls and more generous data allowance, voice usage grew a robust 62% while data volume rose steeply by more than 4 times. The higher usage, however, could not offset the impact of the reduction in mobile termination rates and severe price erosion. Hence, mobile ARPU declined by a steep 32% to Rs.105 this quarter. With lower operating revenue, EBITDA correspondingly declined 24%. After accounting for higher depreciation and amortisation charges, the Group’s share of pre-tax operating profit (before finance costs and fair value adjustments) from India and South Asia fell 76% in Indian Rupee terms. Pre-tax operating profit contribution fell 78% to S$43 million as the Indian Rupee depreciated 8% against the Singapore Dollar. Compared to the preceding quarter, Airtel’s revenue from its India and South Asia operations was stable while EBITDA declined 6% on margin pressures. Despite a fierce competitive market, mobile churn remained low and Airtel’s mobile customer base continued to grow. It added a record 40.4 million of mobile customers in India after acquiring 28 million of customers from Telenor India, compared to 14.1 million added in the preceding quarter. As at 30 June 2018, Airtel continued to be the leading telco operator in India with 345 million of mobile customers, an increase of 64 million or 23% from a year ago. The number of data customers increased by 8.7 million this quarter, bringing the total number of data customers to 95 million as at 30 June 2018, up 52% from a year ago. The data customer base represented 28% of Airtel’s total mobile customer base in India, up from 22% a year ago. The proposed merger of Bharti Infratel Limited and Indus Towers Limited has been approved by the Competition Commission of India (CCI) and SEBI. The completion is still subject to other regulatory approvals and closing conditions. Africa As at 30 June 2018, ‘Airtel Money’ and 3G services were available across all the 14 African countries12 that Airtel has presence in, while 4G services were available in 9 African countries. Airtel Africa continued to report strong growth momentum this quarter. In constant US Dollar terms, Africa’s operating revenue grew 9% and EBITDA was up 43%. Excluding the divested operations, operating revenue in the 14 African countries12 grew double-digit at 14% due to continued strong growth in data and increased penetration of Airtel Money. EBITDA was up a significant 45% on continued strong cost control initiatives and efficiency gains. Its margin rose to another record high of 36.4% this quarter. In reported US Dollar terms, operating revenue and EBITDA grew 4% and 36% respectively. Compared to the preceding quarter and excluding the divested operations, Airtel Africa’s revenue and EBITDA grew 3% and 4% respectively in constant currency terms.
12 Namely Nigeria, Chad, Congo B, DRC, Gabon, Madagascar, Niger, Kenya, Malawi, Seychelles, Tanzania,
Uganda, Zambia and Rwanda.

Singapore Telecommunications Ltd And Subsidiary Companies Page 45
SECTION 5 : ASSOCIATES/ JOINT VENTURES
With lower depreciation charges, the Group’s share of Airtel Africa’s pre-tax operating profit (before finance costs and fair value adjustments) grew 80% to S$78 million. Airtel Africa added 1.9 million mobile customers in the quarter. This was lower than 5.1 million added in the preceding quarter due to the acquisition of Tigo Rwanda in January 2018. As at 30 June 2018, the mobile customer base stood at 91 million, an increase of 11.2 million13 or 14% from a year ago. The number of data customers was 26 million, representing 29% of total mobile customer base, up from 24% a year ago. Airtel Group excluding Bharti Telecom Ltd (“BTL”)’s standalone results At the consolidated level, Airtel’s operating revenue, EBITDA and EBIT declined 9%, 13% and 44% respectively. With higher net finance costs (mainly on lower investment income and higher interest and finance charges), the Group’s share of pre-tax ordinary loss from Airtel was S$52 million compared to a pre-tax ordinary profit of S$98 million in the same quarter last year. With lower income tax from decline in profits and recognition of deferred tax credits in Nigeria, the Group’s share of Airtel’s results turned positive at S$30 million, stable from the comparative quarter. Airtel recorded some one-off items this quarter which have been classified as exceptional items of the Group (see page 12). The exceptional items comprised mainly recognition of a negative goodwill14 arising from business combinations as well as network re-farming and upgrading costs in the quarter. Including the mobile customers across operations in 16 countries covering India, Sri Lanka and Africa, Airtel’s total mobile customer base across all geographies grew 75 million or 21% from a year ago to 438 million as at 30 June 2018. Airtel Group combined with BTL
The Group’s share of BTL’s net loss of S$11 million comprised mainly net finance expense. When combined, the Group’s share of post-tax profit of Airtel Group and BTL amounted to S$19 million, compared to a post-tax profit contribution of S$35 million in the same quarter last year.
13 Adjusting for the divestment of operations in Ghana and acquisition of Tigo Rwanda, the number of mobile
subscribers grew 14.3 million from a year ago. 14 Under Singapore Financial Reporting Standards (International), negative goodwill or bargain purchase gain is
required to be recognised in income statement. Under Indian Accounting Standards, Airtel has recognised this gain in equity.

Singapore Telecommunications Ltd And Subsidiary Companies Page 46
SECTION 5 : ASSOCIATES/ JOINT VENTURES
Globe Telecom, Inc (“Globe”) Globe is listed on the Philippine Stock Exchange. Globe’s service revenue grew by 9% mainly driven by strong growth in mobile data related services as demand for internet and data connectivity continued to grow. Operating expenses remained stable as higher marketing expenses were offset by lower interconnect traffic usage. Consequently, Globe registered a double-digit growth in EBITDA of 20%. After including higher depreciation charges and finance costs from its network infrastructure investments, Globe’s pre-tax profit grew 25% in Philippine Peso terms. However, the Group’s share of Globe’s pre-tax profit contribution increased 17% to S$95 million due to a steep 10% depreciation of the Philippine Peso from the last corresponding quarter. On a post-tax basis, Globe contributed S$65 million or 9% of the Group’s underlying net profit, up 3 percentage points from the comparative quarter. Against the preceding quarter, Globe’s EBITDA grew 7% on service revenue growth of 3% while operating expenses were stable. As at 30 June 2018, Globe’s total mobile customer base expanded by 1.9 million to 65 million, as compared to 2.6 million added in the preceding quarter. Compared to a year ago, its mobile customer base grew 5.4 million or 9.1%.
Intouch Holdings (“Intouch”) Intouch is listed on the Stock Exchange of Thailand, and has investments in telecommunications via its 40.5% equity interest in AIS, as well as in satellite, internet, and media and advertising businesses.
The Group’s share of Intouch’s net profit for the quarter grew 18% to S$29 million on higher contribution from AIS. After including amortisation of acquired intangibles of S$6 million (Q1
FY2018: S$5 million), Intouch’s post-tax contribution rose 20% to S$23 million which constituted 3% (Q1 FY2018: 2%) of the Group’s underlying net profit. Against the preceding quarter, net profit was lower despite improved earnings at the satellite business as the net profit in the March quarter was boosted by a disposal gain on sale of an investment.

Singapore Telecommunications Ltd And Subsidiary Companies Page 47
SECTION 5 : ASSOCIATES/ JOINT VENTURES
PROFORMA INFORMATION
The following tables show unaudited proforma proportionate financial information which has been derived from the Income Statements of the Group prepared on a statutory basis. Proportionate presentation is not required by Singapore Financial Reporting Standards (International) (“SFRS(I)”) and is not intended to replace the financial statements prepared in accordance with SFRS(I). However, since the associates are not consolidated on a line-by-line basis, proportionate information is provided as supplemental data to facilitate a better appreciation of the relative contribution from the Group’s operations in Australia, Singapore and other regional markets.
Restated
Proportionate operating revenue
Group operating revenue
Optus 2,200 2,155 2.1
Singapore 1,553 1,582 -1.8
Other overseas subsidiaries (incl. Amobee & Trustwave) 382 419 -8.9
4,134 4,156 -0.5
Regional associates 3,142 3,428 -8.4
Singapore associates (1)
130 192 -32.4
Other overseas associates 11 12 -10.0
3,282 3,632 -9.6
Enlarged revenue 7,416 7,788 -4.8
% of overseas revenue to enlarged revenue 77% 77%
Proportionate share of operating revenue of associates
Chge
%
2018
S$ m
2017
S$ m
Quarter
30 Jun YOY
Note:
(1) Contribution impacted by the reduction in Singtel’s economic interest in NetLink NBN Trust.
Overseas revenue contributed 77% (Q1 FY2018: 77%) to the Group’s enlarged revenue, with lower contributions mainly from Airtel, Telkomsel and NetLink NBN Trust.

Singapore Telecommunications Ltd And Subsidiary Companies Page 48
SECTION 5 : ASSOCIATES/ JOINT VENTURES
Proportionate EBITDA 2018
S$ m
Group EBITDA
Optus 663 675 -1.8
Singapore 615 641 -4.0
Other overseas subsidiaries (incl. Amobee & Trustwave) (71) (75) -5.8
1,207 1,240 -2.7
Regional associates 1,319 1,524 -13.5
Singapore associates (2)
29 80 -64.1
Other overseas associates 13 10 31.7
1,361 1,614 -15.7
Total proportionate EBITDA (1)
2,568 2,855 -10.1
Overseas proportionate EBITDA as a % to total proportionate EBITDA 75% 75%
Contributions to total proportionate EBITDA
Regional associates 51% 53%
Australia 26% 24%
Singapore 25% 25%
Others -2% -2%
100% 100%
Quarter
30 Jun YOY
Restated
2017
S$ m
Proportionate share of associates' EBITDA (1)
Chge
%
Notes:
(1) Proportionate share of associates’ EBITDA represents the Group’s effective interests in the respective entities’ EBITDA. As such, proportionate EBITDA does not represent EBITDA available to the Group.
(2) Contribution impacted by the reduction in Singtel’s economic interest in NetLink NBN Trust.
Through its investments in key market overseas, the Group has diversified its earnings base. Overseas operations contributed 75% (Q1 FY2018: 75%) to the Group’s total proportionate EBITDA.

Singapore Telecommunications Ltd And Subsidiary Companies Page 49
SECTION 5 : ASSOCIATES/ JOINT VENTURES
Number of mobile customers (000s) 30 Jun 31 Mar 30 Jun 30 Jun 31 Mar 30 Jun
2018 2018 2017 2018 2018 2017
Singtel 4,081 4,085 4,128 4,081 4,085 4,128
Optus 10,172 10,106 9,765 10,172 10,106 9,765
14,253 14,191 13,893 14,253 14,191 13,893
Regional Associates
Airtel
- India 344,564 304,192 280,647 136,137 120,186 102,324
- Africa 91,193 89,262 80,039 36,030 35,267 29,182
- South Asia 2,283 2,268 1,990 903 897 726
438,040 395,722 362,676 173,070 156,350 132,232
Telkomsel 177,888 192,752 178,001 62,261 67,463 62,300
AIS 40,095 40,050 40,474 9,350 9,340 9,438
Intouch's share of AIS NM NM NM 3,406 3,400 3,438
Globe 65,142 63,263 59,722 30,675 29,816 28,147
721,165 691,787 640,873 278,762 266,369 235,555
Group 735,418 705,978 654,766 293,015 280,560 249,448
Total Number Proportionate Share (1)
Note:
(1) Proportionate share of mobile customers represents the total number of mobile customers of an associate multiplied by the Group’s effective percentage ownership in the associate at the respective dates.
“NM” denotes not meaningful.
The Group’s combined mobile customer base was 735 million as at 30 June 2018, up significantly by 29 million or 4.2% from a quarter ago on strong growth in India. Compared to a year ago, the combined mobile customer base rose 81 million or 12%.
OTHER INFORMATION Asia Pacific is the world’s fastest growing region in terms of eSports audience with number expected to climb to 290 million by 2021 from 167 million in 201715. eSports is becoming mainstream and is included in 2018 Asian Games as a demonstration sport. It is also being considered as a potential medal event in the 2024 Olympics. On 10 July 2018, Singtel Group announced its entrance into eSports with the launch of its inaugural PVP eSports Championship, a multi-title and regional league to be held in Singapore in October 2018. The league will be set up with leading eSports industry players such as Razer, Blizzard, Garena and the Mineski Group through MET. The PVP eSports Championship signals Singtel’s ambition to foster a vibrant eSports ecosystem and community together with Optus and the regional associates by leveraging on the Group’s combined mobile customer base, telco assets and partnerships.
15 Source: Newzoo 2018

Singapore Telecommunications Ltd And Subsidiary Companies Page 50
SECTION 5 : ASSOCIATES/ JOINT VENTURES
CASH DIVIDENDS/ DISTRIBUTIONS FROM ASSOCIATES/ JOINT VENTURES (1)
2018 2017
S$ m S$ m
Telkomsel (2)
- final dividend FY 2017 / 2016 954 724 31.8
AIS (3)
- final dividend FY 2017 / 2016 102 119 -13.8
Globe (4)
- quarterly dividend FY 2017/ FY 2016 36 40 -10.0
Intouch (5)
- interim dividend FY 2018 5 - nm
- final dividend FY 2017/ FY 2016 35 44 -19.0
41 44 -6.9
Regional associates 1,133 926 22.3
Other associates
NetLink NBN Trust/ NetLink Trust (6)
31 25 25.2
Southern Cross (7)
10 6 89.1
Others 7 5 64.4
49 35 40.3
Total 1,182 961 23.0
Chge
%
Quarter
30 Jun YOY
Notes:
(1) The cash dividends/distributions received from overseas associates and joint ventures as stated here are before related tax payments.
(2) Telkomsel declared a full year ordinary dividend of 95% on net profit for FY2017 (FY2016: 95%).
(3) For FY2017, AIS revised its dividend policy to payment of dividend at a minimum of 70% on net profit. AIS declared a full year dividend of 70% on net profit for FY2017 (FY2016: 98%). Dividends are paid twice a year, with an interim dividend distributed from its first half year results and a final dividend distributed from its second half year results. The Group received its share of final dividend for FY2017 of S$102 million in April 2018. AIS will pay its interim dividend for FY2018 of THB 3.78 per share in August 2018. The Group’s share of this dividend is approximately S$109 million.
(4) Globe paid its second quarterly dividend of PHP 22.75 per common share for FY2017 in June 2018. The Group’s share of this dividend was S$36 million. Globe will pay its next quarterly dividend of PHP 22.75 per common share in September 2018, the Group’s share of this dividend is approximately S$36 million.
(5) Intouch’s policy is to pass through dividends received from its associates and subsidiaries after the deduction of operating expenses, subject to its financial needs or unless the payment of dividends would materially affect its operations. The Group received its share of final dividend for FY2017 and interim dividend for FY2018 in April 2018. Intouch will pay its next interim dividend of THB 1.35 per share for FY2018 in August 2018. The Group’s share of this dividend is approximately S$38 million.
(6) NetLink NBN Trust’s policy is to distribute 100% of its cash available for distribution (CAFD), which includes distributions from its wholly-owned subsidiary NetLink Trust (“NLT”). NLT’s distribution policy is to distribute
at least 90% of its distributable income to NetLink NBN Tust after setting aside reserves and provisions for, amongst others, future capital expenditure, debt repayment and working capital as may be required. Distributions by NetLink NBN Trust will be made on a semi-annual basis determined for the six month period ending September and March. The Group received its share of distribution of S$31 million in June 2018.
(7) Southern Cross Cables Holdings Limited, part of the Southern Cross consortium, does not have a fixed dividend policy.

Singapore Telecommunications Ltd And Subsidiary Companies Page 51
SECTION 5 : ASSOCIATES/ JOINT VENTURES
(8) Airtel does not have a fixed dividend policy. Airtel declared a final dividend of Rs 2.5 per share for FY2018.
The Group will be receiving its share of the final dividend from its direct stake of 15.01% of approximately S$30 million in September 2018 quarter.
The total dividends from the associates increased 23% to S$1.18 billion due to timing of dividend received from Telkomsel partly offset by a 9% depreciation of the Indonesian Rupiah against the Singapore Dollar.
KEY OPERATIONAL DATA
AIS Intouch Globe
Singtel's investment:
Year of initial investment 2000 2001 1999 2016 1993
Effective economic interest (%) 39.5% 35.0% 23.3% (2)
21.0% 47.1% (3)
Investment to date S$4.33 bil S$1.93 bil S$1.20 bil S$1.59 bil S$1.02 bil
Closing market share price (4)
INR 381 NA THB 185 (5)
THB 53 (5)
PHP 1,540
Market capitalisation
- Total S$30.40 bil NA S$22.63 bil S$7.02 bil S$5.23 bil
- Singtel holding S$12.01 bil NA S$5.28 bil S$1.47 bil S$2.46 bil
Operational Performance :
Mobile penetration rate (6)
87% 133% 135% NM 116%
Market share, 30 June 2018 (6)
30.5% 50.1% 44.8% NM 52.1%
Market share, 31 March 2018 (7)
25.7% 48.5% 44.8% NM 52.1%
Market position (8)
#1 #1 #1 NM #1
Mobile customers ('000)
- Aggregate 438,040 177,888 40,095 NM 65,142
- Proportionate 173,070 62,261 9,350 3,404 30,675
Growth in mobile customers (%) (9)
21% ** -0.9% NM 9.1%
Credit ratings
- Sovereign (Moody's/ S&P Global) Baa2/BBB- Baa2/BBB- Baa1/BBB+ Baa1/BBB+ Baa2/BBB
- Company (Moody's/ S&P Global) Baa3/BBB- Baa1/BBB NA/BBB+ NA NA
TelkomselAirtel (1)
Notes:
(1) The mobile penetration rate, market share and market position pertain to India market only.
(2) Based on direct equity interest only.
(3) Singtel has 21.5% interest in Globe’s voting shares.
(4) Based on closing market price in local currency as of 30 June 2018.
(5) Based on local market price quoted on the Stock Exchange of Thailand.
(6) Based on actual data or latest data available as of 30 June 2018.
(7) Based on actual data.
(8) Based on number of mobile customers and based on actual data or latest data available as of 30 June 2018.
(9) Compared against 30 June 2017 and based on aggregate number of mobile customers.
NA denotes not applicable, NM denotes not meaningful and “**” denotes less than +/- 0.05%.
Please refer to Appendix 5 for the currency rate movements of the regional associates.

Singapore Telecommunications Ltd And Subsidiary Companies Page 52
SECTION 6 : PRODUCT INFORMATION
SINGAPORE MOBILE (PRODUCT VIEW)
30 Jun
2018
Mobile service revenue (S$'M) (1)
421 409 438 -3.8
Number of mobile subscribers (000s)
Prepaid 1,616 1,636 1,714 -5.7
Postpaid 2,465 2,449 2,414 2.1
Total 4,081 4,085 4,128 -1.1
Number of 4G mobile subscribers (000s) 2,905 2,869 2,667 8.9
Average revenue per subscriber per
month (2)(3)
(S$ per month)
Prepaid 18 18 18 0.8
Postpaid 46 45 49 -5.3
Blended 35 34 36 -2.4
Postpaid (pre SFRS(I) 15 basis) 62 61 65 -3.6
Data services as % of ARPU
- total data (4)
64% 62% 59%
- non-SMS data 57% 55% 52%
Postpaid external churn per month (5)
0.9% 0.8% 0.8%
Singapore mobile penetration rate (6)
149% 149% 151%
Market share (6)
Prepaid 51.7% 50.5% 50.5%
Postpaid 47.6% 47.8% 47.7%
Overall 49.2% 48.9% 48.8%
Restated
31 Mar
2018
Chge
%
Quarter
YOYRestated
30 Jun
2017
Notes:
(1) This is determined net of bill rebates and prepaid sales discount, and includes mobile revenue earned from international telephone calls and broadband bundles.
(2) Based on average number of subscribers, calculated as the simple average of opening and closing number of subscribers.
(3) ARPU includes revenue earned from international telephone calls. For prepaid, ARPU is computed net of sales discounts.
(4) Includes revenue from SMS, *SEND, MMS and other data services.
(5) Calculated by expressing the number of postpaid subscribers who deactivate or disconnect their service (both voluntary and the Company’s initiated churn) as a percentage of average number of subscribers.
(6) The market share data as at 30 June 2018 was based on Telco operators’ published results. The other market statistics were based on IMDA’s latest available published statistics as of 31 May 2018.

Singapore Telecommunications Ltd And Subsidiary Companies Page 53
SECTION 6 : PRODUCT INFORMATION
AUSTRALIA MOBILE (PRODUCT VIEW)
Optus' mobile revenue (A$'M) (1)
1,386 1,383 1,282 8.1
Optus' mobile service revenue (A$'M) 963 959 944 2.0
Optus' mobile outgoing service revenue (A$M) 909 907 892 1.9
Number of mobile subscribers (000s)
Prepaid Handset 3,724 3,705 3,725 **
Postpaid Handset 5,335 5,304 5,001 6.7
Mobile Broadband (2)
1,113 1,097 1,039 7.2
Total 10,172 10,106 9,765 4.2
Number of 4G mobile subscribers (000s) (3)
6,363 6,332 5,880 8.2
Mobile penetration rate (4)
ND ND ND
ARPU per month (A$) (5)
Prepaid Handset 19 20 20 -6.2
Postpaid Handset 42 43 44 -2.6
Mobile Broadband (2)
22 21 21 3.9
Blended 32 32 32 -2.0
Postpaid Handset (pre SFRS(I) 15 basis) 58 59 59 -1.0
Data revenue as a % of service revenue
- total data 79% 80% 80%
- non-SMS data 71% 71% 71%
Market share (4)
ND ND ND
Retail postpaid churn rate per month (6)
1.5% 1.5% 1.4%
Chge
%
YOY
Quarter
30 Jun
2018
Restated
31 Mar
2018
Restated
30 Jun
2017
Notes:
(1) This comprises mobile service revenue (both outgoing and incoming), sales of equipment and handset leasing in Optus.
(2) Defined as data-only SIMs and include customers on both prepaid and postpaid plans. Postpaid plans incur a monthly subscription fee.
(3) Defined as 4G handsets on the Optus network. (4) Penetration and revenue market share are estimated by Optus based on published data. (5) Based on average number of customers, calculated as the simple average of opening and closing number
of customers. Excludes equipment revenue. (6) Churn calculation includes subscriber churn from Optus, Virgin Mobile and other Optus subsidiaries’
subscribers but excludes customers transferring from postpaid to prepaid. “ND” denotes not disclosed and “**” denotes less than +/- 0.05%.

Singapore Telecommunications Ltd And Subsidiary Companies Page 54
SECTION 6 : PRODUCT INFORMATION
Singtel TV (PRODUCT VIEW)
Singtel TV revenue (1) (S$'M) 72 56 63 15.3
Average revenue per residential TV customer
per month (1) (S$ per month) 44 41 41 6.8
Number of residential TV customers (000s) 387 395 404 -4.4
31 Mar
2018
30 Jun
2017
Quarter YOY
Chge
%
30 Jun
2018
Note:
(1) Excluding 2018 FIFA World Cup revenue, Singtel TV revenue would be S$55 million and ARPU would be S$41 for the current quarter.
SINGAPORE CONSUMER HOME
30 Jun
2018
Singapore Consumer home revenue (S$'M) (1)(2)
149 133 139 7.0
Number of households on triple/ quad
play services (000s) (3)
507 509 504 0.6
Quarter YOY
Chge
%
31 Mar
2018
30 Jun
2017
Notes:
(1) This comprises fixed broadband, fixed voice and Singtel TV in the residential segment only and does not include mobile.
(2) Excluding 2018 FIFA World Cup revenue, Consumer home revenue would be S$135 million.
(3) Total number of residential households who subscribed to 3 or 4 unique services comprising fixed broadband, Singtel TV, fixed voice and mobile.

Singapore Telecommunications Ltd And Subsidiary Companies Page 55
SECTION 6 : PRODUCT INFORMATION
OTHER PRODUCTS
Singapore
2018
Internet
Number of fixed broadband lines (000s) (1)
621 619 613 1.4
Singapore fixed broadband penetration rate (2)
95% 95% 94%
Fixed broadband market share (3)(4)
42.0% 42.0% 42.1%
Number of fibre broadband lines (000s) 606 599 570 6.2
Fibre broadband market share (4)
46.8% 47.1% 47.5%
International Telephone (for both fixed and mobile calls)
International telephone outgoing minutes
(m mins) (excl Malaysia) 527 496 590 -10.6
Average collection rate
- net basis (S$/ min) (excl Malaysia) 0.086 0.092 0.091 -5.5
National Telephone
Fixed working lines (000s) (5)
Residential 764 769 780 -2.1
Business 632 645 672 -6.0
Total 1,396 1,414 1,452 -3.9
Singapore fixed line penetration rate (6)
35.5% 35.5% 35.6%
Singapore fixed working lines ('000s) (6)
1,993 1,992 2,000
Fixed line market share (6)
70.0% 71.0% 72.6%
Quarter YOY
30 Jun
2018
31 Mar 30 Jun
2017
Chge
%
Notes:
(1) Include ADSL and fibre lines.
(2) Total estimated ADSL, cable and fibre lines divided by total number of households (Source: IMDA). The market penetration rate as at 30 Jun 2018 was based on IMDA’s latest available published statistics as of 31 May 2018.
(3) Based on total Singtel ADSL and fibre lines divided by total ADSL, cable and fibre lines in the population.
(4) The market share data as at 30 June 2018 was based on management’s estimates.
(5) Fixed working lines refer to Direct Exchange Lines (DEL) and Home Digital Lines.
(6) The market share data as at 30 June 2018 was based on management’s estimates. The other market statistics as at 30 June 2018 were based on IMDA’s latest available published statistics as of 31 March 2018.

Singapore Telecommunications Ltd And Subsidiary Companies Page 56
SECTION 6 : PRODUCT INFORMATION
Australia
Enterprise Fixed
Business voice minutes (m min) 1,275 1,287 1,250 2.0
Wholesale Fixed
Wholesale domestic voice minutes (m min) 920 923 1,011 -9.1
Mass Market Fixed
On-net ARPU (A$) (1)
Voice (2)
30 30 33 -8.8
Broadband (2)(3)
56 56 56 0.4
Telephony customers ('000)
HFC (4)
402 402 441 -8.9
ULL (5)
310 327 379 -18.1
On-net 713 729 820 -13.1
Resale 39 43 60 -34.9
NBN 488 456 277 75.8
Off-net 527 499 338 56.1
TV customers (000s) 513 491 457 12.2
HFC bundling rate (6)
100% 100% 98%
HFC penetration 29% 29% 32%
Broadband customers (000s)
On-net
HFC broadband 395 396 433 -8.7
ULL broadband (5)
322 339 396 -18.8
Business grade broadband 24 24 25 -4.4
741 759 855 -13.3
Off-net
Broadband 25 32 41 -38.3
NBN 483 453 279 73.2
Total Broadband customers 1,249 1,245 1,174 6.4
Quarter YOY
Chge
%
30 Jun
2018
31 Mar
2018
30 Jun
2017
Notes:
(1) Per month, based on average number of HFC and ULL customers. (2) Comparatives have been restated to be consistent with the current quarter.
(3) Includes Optus TV with Fetch.
(4) Includes all customers who take local telephony over the HFC network, and customers who take one or more of pay TV or cable internet services over the HFC network.
(5) Include wholesale ULL subscribers.
(6) Based on customers who are receiving a ‘bundled benefit’ from taking a package of products (local telephony plus at least one of broadband, dial-up internet or pay TV).

Singapore Telecommunications Ltd And Subsidiary Companies Page 57
SECTION 7 : GLOSSARY
“ACCC” “ADSL”
Australian Competition And Consumer Commission. Asymmetric digital subscriber line.
“ARPU” Average revenue per user.
“Associate” “ATO”
Refers to an associate and/or a joint venture company under Singapore Financial Reporting Standards (International). Australian Taxation Office.
“EI” Exceptional items, which refer to items of income or expense within profit or loss from ordinary activities
that are of such size, nature or incidence that their separate disclosure is considered necessary to explain the performance for the financial period.
“EBIT” Earnings before interest and tax.
“EBITDA”
Earnings before interest, tax, depreciation and amortisation, and does not include the share of pre-tax results of associates.
“EBITDA margin” Ratio of EBITDA over operating revenue. “EPS”
Earnings per share.
“SFRS(I)”
Singapore Financial Reporting Standards (International).
“Free Cash Flow”
Free cash flow refers to cash flow from operating activities less cash capital expenditure.
“ICT” “IoT”
Infocomm Technology. Internet of Things.
“IMDA” Info-communications Media Development Authority of Singapore. “IP VPN” Internet Protocol Virtual Private Network. “MOU” Minutes of use per subscriber.
“NM” Not meaningful.
“NPS” Net Promoter Score. This is a widely used metric to measure customer experience by scoring the
willingness of customers to recommend a brand following an interaction with the company.
“Optus” Singtel Optus Pty Limited, Singtel’s wholly-owned subsidiary, and its subsidiaries.
“OTT” “Regional associates”
Over-the-top. Comprises Airtel, AIS, Intouch, Telkomsel and Globe.
“SMS” “SME”
Short message service. Small and medium-sized enterprises.
“STAI” Singapore Telecom Australia Investments Pty Limited, which has 100% equity interest in Optus. “Singapore” The term refers to the Group’s operations excluding Optus and the associates and includes the overseas
operations of Singtel including Amobee and Trustwave.
“Underlying net profit”
Defined as net profit before exceptional items.

Singapore Telecommunications Ltd And Subsidiary Companies Appendix 1 Page 1 of 3
GROUP SUMMARY INCOME STATEMENTS For The First Quarter Ended 30 June 2018
Operating revenue 1,934 - - 1,934 2,200 4,134 4,156 -0.5
Operating expenses (1,418) - - (1,418) (1,574) (2,992) (2,988) 0.1
517 - - 517 625 1,142 1,168 -2.2
Other income 28 - - 28 38 65 73 -10.3
EBITDA 544 - - 544 663 1,207 1,240 -2.7
- EBITDA margin 28.1% - - 28.1% 30.1% 29.2% 29.8%
Share of associates'
pre-tax profits
Regional associates - 391 - 391 - 391 673 -42.0
Other associates - 25 - 25 * 25 61 -58.2
- ordinary operations - 416 - 416 * 416 734 -43.3
- exceptional items - - - - - - (4) nm
- 416 - 416 * 416 730 -43.0
EBITDA and share of
associates' pre-tax profits 544 416 - 960 663 1,623 1,970 -17.6
Depreciation & amortisation (180) - - (180) (374) (554) (549) 0.8
EBIT 364 416 - 780 289 1,069 1,421 -24.8
Net finance expense
- net interest expense (41) - - (41) (49) (90) (91) -0.3
- other finance income 7 - 13 20 1 20 5 320.8
(35) - 13 (22) (49) (70) (86) -18.3
Profit before EI and tax 330 416 13 759 240 999 1,335 -25.2
Taxation
- current and deferred taxes (64) - - (64) (73) (137) (139) -1.2
- share of taxes of associates - (32) - (32) - (32) (214) -85.0
- withholding taxes (1)
- - (102) (102) - (102) (79) 29.1
(64) (32) (102) (198) (73) (271) (432) -37.2
Profit/ (Loss) after tax 266 384 (89) 561 167 728 903 -19.4
Minority interests 5 - - 5 - 5 6 -3.6
Underlying net profit/ (loss) 271 384 (89) 566 167 733 909 -19.3
(exclude Airtel and BTL)(2)
271 365 (89) 547 167 714 873 -18.2
Exceptional items (post-tax) 93 17 - 110 (12) 98 (19) nm
Net profit/ (loss) 364 401 (89) 676 156 832 890 -6.6
(exclude Airtel and BTL)(2)
364 365 (89) 640 156 796 855 -6.9
2018 2017
Optus
S$ m
Group
S$ m
Restated
Group
S$ m
Asso/JV
S$ m
Corp
S$ m
Singtel
S$ m %
Chge
Quarter
30 Jun
20182018
YOY
Singapore
S$ m
Notes: (1) These are withholding and dividend distribution taxes deducted at source when dividends are remitted by the
overseas associates. For accounting purpose, the dividend income and related withholding and dividend distribution taxes are accrued when declared by the associates. Dividend income has no impact on the income statement of the Group as they are eliminated at Group. The cash inflows upon the receipt of dividend are shown in Section 5.
(2) The profits were adjusted to exclude results of Airtel and BTL.
“*” denotes less than +/- S$0.5 million

Singapore Telecommunications Ltd And Subsidiary Companies Appendix 1 Page 2 of 3
GROUP SUMMARY INCOME STATEMENTS For The First Quarter Ended 30 June 2018
Operating revenue 4,134 -0.5 1.7
Operating expenses (2,992) 0.1 2.5
1,142 -2.2 -0.5
Other income 65 -10.3 -8.4
EBITDA 1,207 -2.7 -0.9
-EBITDA margin 29.2%
Share of associates' pre-tax profits
- Telkomsel 237 -38.0 -32.0
- Airtel (63) nm nm
- AIS 94 14.1 10.9
- Globe 95 16.8 28.3
- Intouch 28 18.5 14.8
Regional associates 391 -42.0 -38.6
Other associates 25 -58.2 -58.2
- ordinary operations 416 -43.3 -40.2
- exceptional items - nm nm
416 -43.0 -39.9
EBITDA and share of associates' 1,623 -17.6 -15.4
pre-tax profits
Depreciation & amortisation (554) 0.8 3.5
1,069 -24.8 -22.6
Net finance expense (70) -18.3 -16.1
Profit before EI and tax 999 -25.2 -23.1
Taxation (271) -37.2 -36.3
Profit after tax 728 -19.4 -16.7
Minority interests 5 -3.6 3.6
Underlying net profit 733 -19.3 -16.6
(exclude Airtel and BTL) (2)
714 -18.2 -15.5
EI (post-tax) 98 nm nm
Net profit 832 -6.6 -3.7
(exclude Airtel and BTL) (2)
796 -6.9 -4.2
currency (1)
%
constant 2018
%
Quarter
30 Jun Change
YOY
Change in
EBIT
S$ m
Notes:
(1) Assuming constant exchange rates for the Australian Dollar, United States Dollar and/or regional currencies (Indian Rupee, Indonesian Rupiah, Philippine Peso and Thai Baht) from the corresponding quarter ended 30 June 2017.
(2) The profits were adjusted to exclude results of Airtel and BTL.
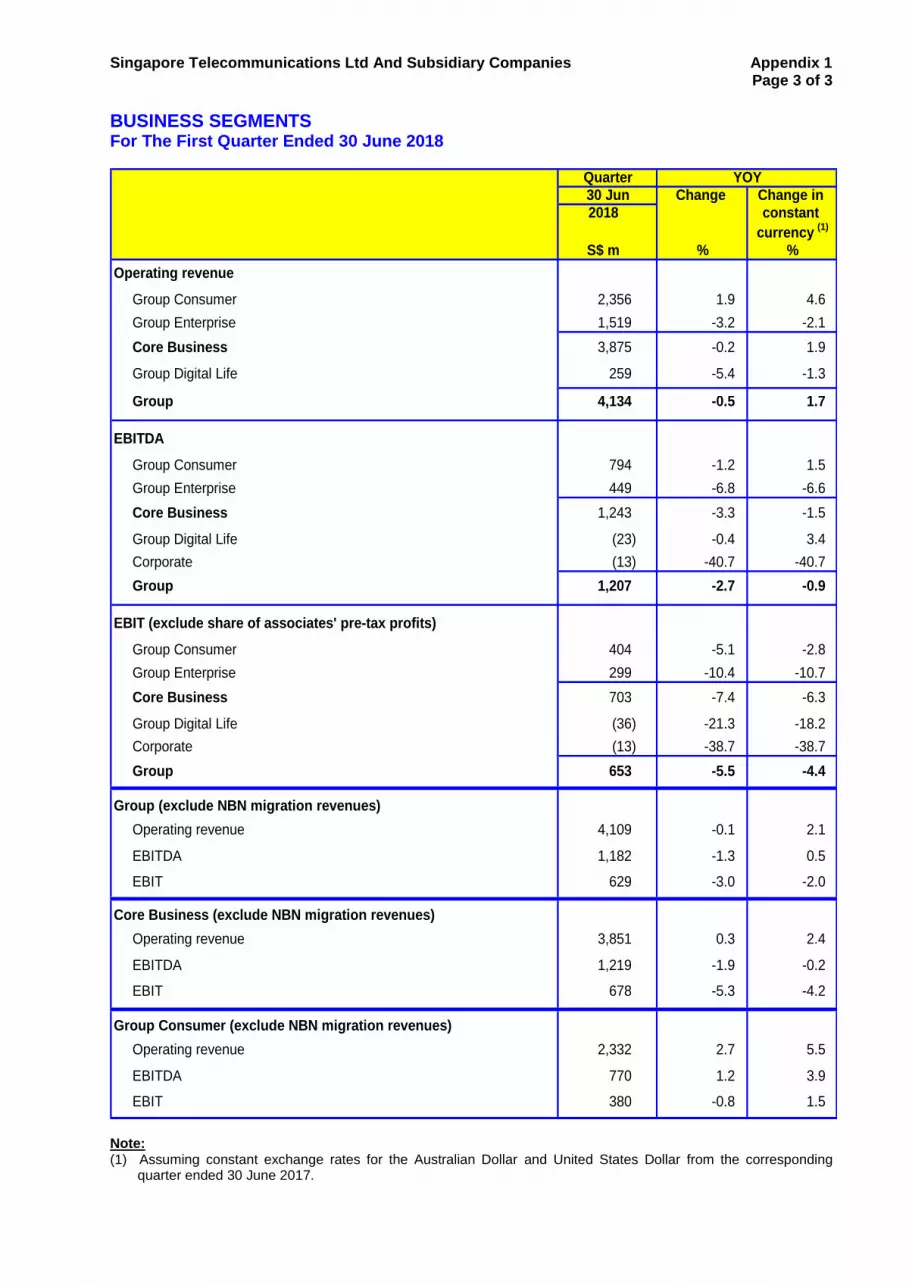
Singapore Telecommunications Ltd And Subsidiary Companies Appendix 1 Page 3 of 3
BUSINESS SEGMENTS For The First Quarter Ended 30 June 2018
Operating revenue
Group Consumer 2,356 1.9 4.6
Group Enterprise 1,519 -3.2 -2.1
Core Business 3,875 -0.2 1.9
Group Digital Life 259 -5.4 -1.3
Group 4,134 -0.5 1.7
EBITDA
Group Consumer 794 -1.2 1.5
Group Enterprise 449 -6.8 -6.6
Core Business 1,243 -3.3 -1.5
Group Digital Life (23) -0.4 3.4
Corporate (13) -40.7 -40.7 Group 1,207 -2.7 -0.9
EBIT (exclude share of associates' pre-tax profits)
Group Consumer 404 -5.1 -2.8
Group Enterprise 299 -10.4 -10.7
Core Business 703 -7.4 -6.3
Group Digital Life (36) -21.3 -18.2
Corporate (13) -38.7 -38.7
Group 653 -5.5 -4.4
Group (exclude NBN migration revenues)
Operating revenue 4,109 -0.1 2.1
EBITDA 1,182 -1.3 0.5
EBIT 629 -3.0 -2.0
Core Business (exclude NBN migration revenues)
Operating revenue 3,851 0.3 2.4
EBITDA 1,219 -1.9 -0.2
EBIT 678 -5.3 -4.2
Group Consumer (exclude NBN migration revenues)
Operating revenue 2,332 2.7 5.5
EBITDA 770 1.2 3.9
EBIT 380 -0.8 1.5
YOY
Change in Change
Quarter
30 Jun
2018
S$ m
currency (1)
%%
constant
Note:
(1) Assuming constant exchange rates for the Australian Dollar and United States Dollar from the corresponding quarter ended 30 June 2017.

Singapore Telecommunications Limited And Subsidiary Companies Appendix 2
Page 1 of 1
GROUP STATEMENTS OF FINANCIAL POSITION
Restated Restated30 Jun 2018 31 Mar 2018 30 Jun 2017S$ million S$ million S$ million
Current assetsCash and cash equivalents 625 525 632 Trade and other receivables 5,757 5,818 5,765 Inventories 403 397 401 Derivative financial instruments 48 23 101 Loan to an associate - - 1,101 6,833 6,763 7,999
Non-current assetsProperty, plant and equipment 11,314 11,454 11,244 Intangible assets 14,048 13,969 14,334 Associates 1,990 2,001 1,962 Joint ventures 11,967 12,755 11,809 Fair value through other comprehensive
income ("FVOCI") investments 218 198 222 Deferred tax assets 365 353 644 Derivative financial instruments 437 407 477 Other non-current receivables 602 588 632
40,941 41,724 41,325
Total assets 47,775 48,487 49,324
Current liabilitiesTrade and other payables 5,086 5,371 4,832 Advance billings 786 794 873 Current tax liabilities 462 351 374 Borrowings (unsecured) 1,268 1,801 1,682 Borrowings (secured) 18 23 57 Derivative financial instruments 55 69 18
Net deferred gain (1) 20 20 69
7,696 8,429 7,905
Non-current liabilitiesBorrowings (unsecured) 7,949 8,586 9,530 Borrowings (secured) 80 82 238 Derivative financial instruments 229 295 315 Advance billings 233 225 241
Net deferred gain (1) 376 358 1,323
Deferred tax liabilities 513 536 595 Other non-current liabilities 285 295 328
9,664 10,377 12,570
Total liabilities 17,360 18,806 20,475
Net assets 30,415 29,681 28,849
Share capital and reservesShare capital 4,127 4,127 4,127 Reserves 26,293 25,579 24,727 Equity attributable to shareholders of the Company 30,420 29,706 28,855 Minority interests and other reserve (5) (26) (5)
Total equity 30,415 29,681 28,849
Note:
(1) This relates to deferred gain on transfer of certain assets to NetLink Trust.
As at

Singapore Telecommunications Ltd And Subsidiary Companies Appendix 3 Page 1 of 2
SINGAPORE CASH FLOW STATEMENT For The First Quarter Ended 30 June 2018
Restated Restated
30 Jun 30 Jun 31 Mar
2018 2017 2018
S$ m S$ m S$ m
Net cash inflow from operating activities
Profit before exceptional items and tax 330 336 272 -1.9
Non-cash items 204 232 207 -11.9
Operating cash flow before working capital changes 534 568 479 -6.0
Changes in operating assets and liabilities (75) (106) 137 -29.1
459 462 615 -0.7
Cash paid to employees under performance share plans * (1) * nm
Tax paid on operating activities (2) (3) (31) -14.3
Operating cash flow 456 459 584 -0.5
Net cash outflow for investing activities Accrued capital expenditure (101) (60) (380) 69.8Changes in creditors' balances (87) (94) 138 -7.3Cash capital expenditure (188) (153) (242) 22.8
Net repayment of loan to Optus from STAI (1)
- - (137) -
Dividend received by STAI from Optus (1)
- - 633 -
Withholding tax paid on interest received on inter-company loans - - (12) -
Payment for purchase of subsidiaries, net of cash acquired - (340) - nm
Payment for acquisition of non-controlling interests (16) - - nmInvestment in associates - - (539) - Investment in venture investments (9) (25) (9) -64.8
Proceeds from disposal of venture investments 3 1 38 115.4
Proceeds from disposal of property, plant and equipment 118 4 * @
Deferred proceeds from disposal of an associate 4 - 7 nm
Payment for purchase of spectrum - (188) - nm
Payment for purchase of other intangibles (8) (14) (18) -44.8Others * 2 (9) nm
(96) (714) (286) -86.6
Net cash outflow for financing activities
Net (decrease)/ increase in borrowings (1,279) (403) 1,005 217.8Net interest paid on borrowings and swaps (46) (65) (41) -28.9Settlement of swap for bonds repaid 3 - - nmInterim dividend paid to shareholders - - (1,110) - Special dividend paid to shareholders - - (490) - Purchase of performance shares (2) (4) (6) -54.1
(1,324) (471) (642) 181.0
Net decrease in cash balance from Singapore (964) (727) (344) 32.5
Net decrease in cash balance from Singapore (964) (727) (344) 32.5
Dividends/ Distributions received from associates 1,182 961 96 23.0Withholding tax paid (116) (96) (6) 20.3Net dividends/ distributions received from associates 1,067 865 91 23.3
Net increase/ (decrease) in cash and cash equivalents 103 138 (253) -25.5
Singtel cash and cash equivalents at beginning 406 397 664 2.4Exchange effects on cash and cash equivalents 7 (8) (5) nmSingtel cash and cash equivalents at end 516 527 406 -2.0
Singapore free cash flow 268 305 343 -12.1
Free cash flow from associates' dividends/ distributions 1,067 865 91 23.3
Cash capex to operating revenue 10% 8% 12%
%
Quarter
YOY
Chge
Note:
(1) The intercompany amounts are eliminated at the Group level.
“*” denotes less than +/- S$0.5 million and "@" denotes more than +/- 500%.

Singapore Telecommunications Ltd And Subsidiary Companies Appendix 3 Page 2 of 2
OPTUS CASH FLOW STATEMENT For The First Quarter Ended 30 June 2018
Restated Restated
30 Jun 30 Jun 31 Mar
2018 2017 2018
A$ m A$ m A$ m
Net cash inflow from operating activities
Profit before exceptional items and tax 238 252 296 -5.8
Non-cash items 404 372 406 8.7
Operating cashflow before working capital changes 642 624 702 2.9
Changes in operating assets and liabilities (183) (20) 60 @
Tax paid (55) (65) (56) -15.3
Operating cash flow 404 539 706 -25.1
Net cash outflow for investing activities
Accrued capital expenditure (271) (271) (555) **
Changes in creditors' balances (3) (148) 206 -97.7
Cash capital expenditure (274) (419) (349) -34.6
Loan to STAI (1)
- - (121) -
Repayment of loan by STAI (1)
- - 250 -
Payment for purchase of spectrum (34) (712) - -95.2
Payment for purchase of other intangibles (13) (28) (15) -53.8
Others 1 * 1 nm
(321) (1,158) (233) -72.3
Net cash (outflow for)/ inflow from financing activities
Net (decrease)/ increase in borrowings (40) 650 110 nm
Dividend paid to STAI (1)
- - (600) -
Net interest paid on borrowings and swaps (49) (54) (44) -7.7
Purchase of Singtel shares (5) (6) - -17.8
Others 1 - 10 nm
(94) 590 (524) nm
Net decrease in cash balance from Optus (10) (29) (52) -64.3
Net decrease in cash and cash equivalents (10) (29) (52) -64.3
Optus cash and cash equivalents at beginning 118 128 170 -8.1
Optus cash and cash equivalents at end 108 100 118 8.1
Optus free cash flow 130 120 357 8.2
Cash capex to operating revenue 13% 20% 16%
Chge
%
Quarter
YOY
Note: (1) The intercompany amounts are eliminated at the Group level.
“*” denotes less than +/- A$0.5 million and "**" denotes less than +/- 0.05%.

Singapore Telecommunications Ltd And Subsidiary Companies Appendix 4 Page 1 of 1
OPTUS FINANCIALS IN AUSTRALIAN DOLLARS
30 Jun
Restated
2018 2017
A$ m A$ m
Operating revenue 2,178 2,062 5.7
Operating expenses (1,559) (1,471) 6.0
Other income 37 55 -33.0
EBITDA 656 646 1.6
- margin 30.1% 31.3%
Share of results of joint ventures * * nm
EBITDA and share of results of joint ventures 656 646 1.6
Depreciation & amortisation (370) (349) 6.3
EBIT 286 297 -3.8
Net finance expense (48) (45) 7.3
Profit before exceptional items and tax 238 252 -5.8
Taxation (72) (76) -5.4
Underlying net profit 166 176 -5.9
Exceptional items (post-tax) (12) (16) -29.4
Net profit 154 160 -3.5
%
Quarter
Chge
YOY
“*” denotes less than +/- A$0.5 million.
Optus’ contribution to certain Group items in the statement of financial position were –
Restated Restated
30 Jun 31 Mar 30 Jun
2018 2018 2017
A$ m A$ m A$ m
Property, plant and equipment (net) 7,793 7,876 7,486
Gross debt
Current debt 575 925 550
Non-current debt 3,767 3,449 3,745
Gross debt as reported in the statement of financial position 4,342 4,374 4,295
Related net hedging assets (275) (251) (159)
4,067 4,123 4,135
Less: Cash and bank balances (108) (118) (100)
Net debt 3,959 4,005 4,036
As at

Singapore Telecommunications Ltd And Subsidiary Companies Appendix 5 Page 1 of 2
CURRENCY RISK MANAGEMENT & OTHER MATTERS The Group maintains a policy to substantially hedge all known foreign currency exposures related to commercial commitments or transactions. These commitments or transactions include payment of operating expenses, traffic settlement, capital expenditure, interest and debt. Translation risks of foreign currency EBITDA and net investments are not hedged unless approved by the Finance and Investment Committee. The Group has borrowings denominated in foreign currencies that have primarily been hedged into the functional currency of the respective borrowing entities using cross currency swaps in order to reduce the foreign currency exposure on these borrowings. As the hedges are perfect, any change in the fair value of the cross currency swaps has minimal impact on profit and equity. Financial instruments such as foreign currency forward contracts and cross currency swaps are used only to hedge underlying commercial exposures and are not held or sold for speculative purposes. All hedging transactions are reviewed regularly.
CREDIT RATINGS
Singtel Optus
S&P Global Ratings A+ (stable) A (stable)
Moody's Investors Service A1 (stable) A2 (stable)

Singapore Telecommunications Ltd And Subsidiary Companies Appendix 5 Page 2 of 2
MAJOR CURRENCY AVERAGE EXCHANGE RATES
1 Australian Dollar buys: Q1 Q2 Q3 Q4 Full Year
Derived weighted average exchange rate (1)
for:
Operating revenue
SGD
FY2019 1.0099
FY2018 1.0455 1.0744 1.0403 1.0364 1.0489
Change (last corresponding period) -3.4%
Underlying net profit
SGD
FY2019 1.0103
FY2018 1.0453 1.0736 1.0386 1.0346 1.0466
Change (last corresponding period) -3.3%
1 United States Dollar buys: Q1 Q2 Q3 Q4 Full Year
Derived weighted average exchange rate (2)
for:
Operating revenue
SGD
FY2019 1.3346
FY2018 1.3919 1.3615 1.3560 1.3070 1.3565
Change (last corresponding period) -4.1%
Notes:
(1) The monthly income statement of Optus is translated from Australian Dollar to Singapore Dollar based on the average exchange rate for the month. These rates represent the derived weighted average exchange rates for the Australian Dollar for the period to date.
(2) The income statements of Trustwave, Amobee and HOOQ are translated from United States Dollar to Singapore Dollar based on these derived weighted average exchanges rates for the period to date.
1 Singapore Dollar buys: Q1 Q2 Q3 Q4 Full Year
Rupiah
FY2019 10,417
FY2018 9,554 9,770 10,003 10,309 9,901
Change (last corresponding period) 9.0%
Indian Rupee
FY2019 50.3
FY2018 46.4 47.3 47.6 48.8 47.6
Change (last corresponding period) 8.4%
Baht
FY2019 23.9
FY2018 24.6 24.5 24.3 23.9 24.3
Change (last corresponding period) -2.8%
Peso
FY2019 39.4
FY2018 35.8 37.3 37.6 39.1 37.5
Change (last corresponding period) 10.1%
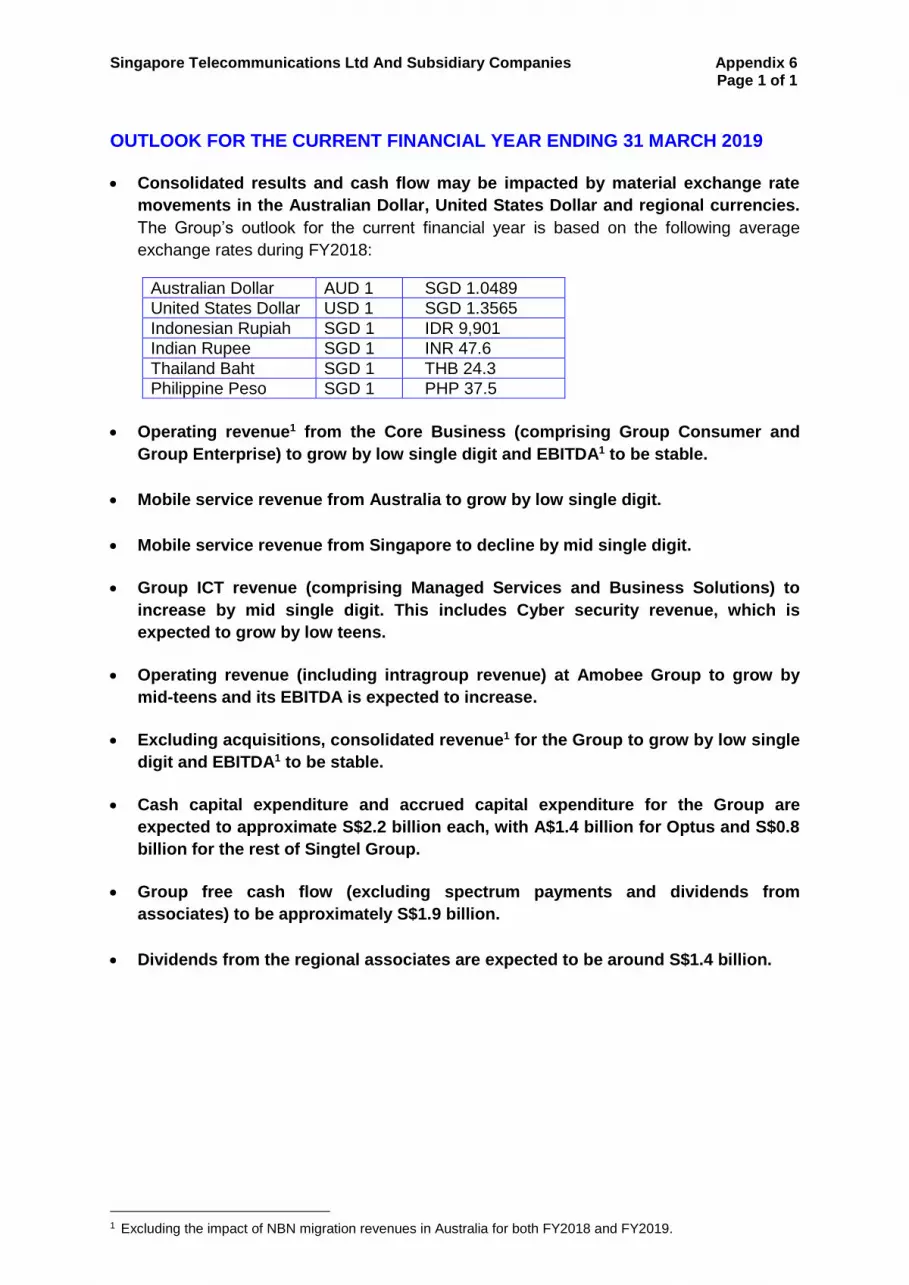
Singapore Telecommunications Ltd And Subsidiary Companies Appendix 6 Page 1 of 1
OUTLOOK FOR THE CURRENT FINANCIAL YEAR ENDING 31 MARCH 2019 Consolidated results and cash flow may be impacted by material exchange rate
movements in the Australian Dollar, United States Dollar and regional currencies.
The Group’s outlook for the current financial year is based on the following average
exchange rates during FY2018:
Australian Dollar AUD 1 SGD 1.0489
United States Dollar USD 1 SGD 1.3565
Indonesian Rupiah SGD 1 IDR 9,901
Indian Rupee SGD 1 INR 47.6
Thailand Baht SGD 1 THB 24.3
Philippine Peso SGD 1 PHP 37.5
Operating revenue1 from the Core Business (comprising Group Consumer and
Group Enterprise) to grow by low single digit and EBITDA1 to be stable.
Mobile service revenue from Australia to grow by low single digit.
Mobile service revenue from Singapore to decline by mid single digit.
Group ICT revenue (comprising Managed Services and Business Solutions) to
increase by mid single digit. This includes Cyber security revenue, which is
expected to grow by low teens.
Operating revenue (including intragroup revenue) at Amobee Group to grow by
mid-teens and its EBITDA is expected to increase.
Excluding acquisitions, consolidated revenue1 for the Group to grow by low single
digit and EBITDA1 to be stable.
Cash capital expenditure and accrued capital expenditure for the Group are
expected to approximate S$2.2 billion each, with A$1.4 billion for Optus and S$0.8
billion for the rest of Singtel Group.
Group free cash flow (excluding spectrum payments and dividends from
associates) to be approximately S$1.9 billion.
Dividends from the regional associates are expected to be around S$1.4 billion.
1 Excluding the impact of NBN migration revenues in Australia for both FY2018 and FY2019.

Singapore Telecommunications Ltd And Subsidiary Companies Appendix 7 Page 1 of 7
RESTATEMENT OF FY 2018 COMPARATIVES For this quarter, the Group has adopted all applicable new and revised Singapore Financial Reporting Standards (International) (“SFRS(I)”) which became effective from 1 April 2018. SFRS(I) are identical to the International Financial Reporting Standards (IFRS) as issued by the International Accounting Standards Board (IASB). The new accounting framework and standards have been retrospectively applied to the financial statements for the previous financial year ended 31 March 2018 and the opening statement of financial position as at 1 April 2017. The application of the new and revised standards has no material effect on the financial statements, except as described below: SFRS(I) 1, First-time Adoption of SFRS(I) The Group has made the following adjustments to the opening statement of financial position as at 1 April 2017 arising from the transition options: (a) The cumulative currency translation loss of the Group has been transferred to retained
earnings. (b) Fair value has been used as the ‘deemed cost’ for certain property, plant and equipment. SFRS(I) 15, Revenue from Contracts with Customers SFRS(I) 15 establishes a single comprehensive model of accounting for revenue arising from contracts with customers. The standard requires companies to apportion revenue earned from contracts to performance obligations based on a five-step model on a relative standalone selling price basis. It also introduces new contract cost guidance and requires certain additional disclosures. The adoption of SFRS(I) 15 resulted in the following key effects at the consolidated level: (a) An increase in revenue allocated to sales of equipment, which are fair valued at
standalone selling price, and a reduction in mobile service revenue over the customer contract period.
(b) An increase in cost of sales and a reduction in mobile customer acquisition costs.
(c) Commission paid to dealers and own sales force are capitalised and amortised as
operating expenses over the customer contract term in the income statement. Capitalised contract costs are classified under non-currrent assets as the economic benefits from these assets are expected to be longer than 12 months.
(d) An increase in contract assets, comprising mainly unbilled equipment receivables
arising from upfront recognition of revenue from sales of equipment. Contract assets are classified in ‘Trade and other receivables’ under current assets as they are expected to be realised in the normal operating cycle.
(e) An increase in contract liabilities, comprising mainly deferred revenue in respect of
mobile price plan discount vouchers given. Contract liabilities are classified in ‘Trade and other payables’ under current liabilities.

Singapore Telecommunications Ltd And Subsidiary Companies Appendix 7 Page 2 of 7
SFRS(I) 9, Financial Instruments
SFRS(I) 9 introduces new requirements for classification and measurement of financial assets and financial liabilities, general hedge accounting and impairment requirements for financial assets. Equity investments previously accounted as ‘Available-For-Sale’ (AFS) investments are accounted as ‘Fair Value through Other Comprehensive Income’ (FVOCI) investments. Lifetime expected credit losses are recognised for receivables and contract assets.
Following the adoption of the new accounting framework and standards, the quarterly income statements for FY 2018 have been restated as follow - GROUP
S$ m
Operating revenue 4,156 4,268 4,583 4,262 17,268
Operating expenses (2,988) (3,066) (3,333) (3,089) (12,476)
Other income 73 47 81 58 259
EBITDA 1,240 1,249 1,331 1,230 5,051
- margin 29.8% 29.3% 29.0% 28.9% 29.2%
Share of associates' pre-tax profits 730 659 553 519 2,461
EBITDA and share of associates'
pre-tax profits 1,970 1,908 1,884 1,750 7,511
Depreciation & amortisation (549) (576) (563) (562) (2,250)
EBIT 1,421 1,331 1,321 1,188 5,261
Net finance expense (86) (91) (81) (87) (345)
Profit before exceptional items
and tax 1,335 1,240 1,240 1,101 4,917
Taxation (432) (332) (299) (282) (1,344)
Profit after tax 903 909 942 819 3,572
Minority interests 6 6 8 2 21
Underlying net profit 909 915 950 821 3,593
Exceptional items (post-tax) (19) 1,940 10 (51) 1,880
Net profit 890 2,854 959 770 5,473
31 Mar 201831 Mar 2018
S$ m
Quarter
30 Jun 2017 30 Sep 2017 31 Dec 2017
S$ m S$ m S$ m
Year
OPERATING REVENUE
S$ m
Mobile service 1,424 1,465 1,450 1,398 5,737
Data and Internet 837 876 889 834 3,436
ICT 706 784 709 810 3,008
Sale of equipment 511 454 822 627 2,415
Digital businesses 282 285 332 214 1,113
Fixed voice 283 283 262 256 1,084
Pay television 93 98 90 88 369
Others 20 24 28 34 106
Total 4,156 4,268 4,583 4,262 17,268
31 Mar 201831 Mar 2018
S$ m
Quarter
30 Jun 2017 30 Sep 2017 31 Dec 2017
S$ m S$ m S$ m
Year

Singapore Telecommunications Ltd And Subsidiary Companies Appendix 7 Page 3 of 7
OPERATING EXPENSES
S$ m
Cost of sales 1,195 1,216 1,520 1,335 5,267
Staff costs 689 703 677 669 2,738
Selling & administrative 614 637 621 583 2,455
Traffic expenses 393 405 411 406 1,616
Repair & maintenance 93 94 97 84 368
Others 3 11 7 12 33
Total 2,988 3,066 3,333 3,089 12,476
31 Mar 201831 Mar 2018
S$ m
Quarter
30 Jun 2017 30 Sep 2017 31 Dec 2017
S$ m S$ m S$ m
Year
SINGAPORE CONSUMER
S$ m
Operating revenue 538 530 634 535 2,236
Operating expenses (346) (339) (435) (379) (1,499)
Other income 7 4 2 4 17
EBITDA 198 195 201 160 753
- margin 36.8% 36.7% 31.7% 29.9% 33.7%
Depreciation & amortisation (57) (59) (62) (63) (241)
EBIT 141 136 139 97 513
31 Mar 201831 Mar 2018
S$ m
Quarter
30 Jun 2017 30 Sep 2017 31 Dec 2017
S$ m S$ m S$ m
Year
OPERATING REVENUE
S$ m
Mobile service 276 273 273 254 1,075
Sale of equipment 100 93 203 123 519
Fixed broadband 57 58 58 58 230
Residential Pay TV 58 59 52 51 219
Fixed voice 33 34 33 33 133
Others 15 14 15 16 60
Total 538 530 634 535 2,236
Year
31 Mar 201831 Mar 2018
S$ m
Quarter
30 Jun 2017 30 Sep 2017 31 Dec 2017
S$ m S$ m S$ m
OPERATING EXPENSES
S$ m
Cost of sales 150 142 240 174 705
Selling & administrative 75 79 81 87 322
Staff costs 60 61 54 58 233
Traffic expenses 55 51 52 51 208
Repair & maintenance 12 14 14 16 55
Others (5) (7) (5) (7) (23)
Total 346 339 435 379 1,499
31 Mar 201831 Mar 2018
S$ m
Quarter
30 Jun 2017 30 Sep 2017 31 Dec 2017
S$ m S$ m S$ m
Year

Singapore Telecommunications Ltd And Subsidiary Companies Appendix 7 Page 4 of 7
AUSTRALIA CONSUMER
A$ m
Operating revenue 1,699 1,694 1,955 1,780 7,128
Operating expenses (1,173) (1,139) (1,348) (1,178) (4,837)
Other income 54 28 64 33 179
EBITDA 580 584 671 635 2,470
- margin 34.2% 34.5% 34.3% 35.7% 34.7%
Depreciation & amortisation (307) (320) (319) (321) (1,267)
EBIT 273 264 351 315 1,203
31 Mar 201831 Mar 2018
A$ m
Quarter
30 Jun 2017 30 Sep 2017 31 Dec 2017
A$ m A$ m A$ m
Year
OPERATING REVENUE
A$ m
Incoming 51 52 54 50 207
Outgoing 847 862 875 859 3,444
Total Mobile Service 897 914 930 910 3,650
Equipment 319 270 484 389 1,462
Leasing revenue - 4 8 12 24
Total Mobile Revenue 1,216 1,187 1,421 1,311 5,136
Voice 89 84 80 77 331
Broadband 112 107 100 95 414
Pay TV 28 29 30 29 116
Mass Market Fixed On-net 229 220 210 202 861
Mass Market Fixed Off-net 113 142 180 127 561
Total Mass Market Fixed 342 362 389 329 1,422
Data & IP 56 55 59 59 229
Voice 25 26 25 24 98
Satellite 61 65 61 58 244
Total Wholesale Fixed 141 145 145 140 571
Total 1,699 1,694 1,955 1,780 7,128
31 Mar 2018
A$ m
Quarter
30 Jun 2017 30 Sep 2017 31 Dec 2017
A$ m A$ m A$ m
Year
31 Mar 2018
OPERATING EXPENSES
A$ m
Cost of sales 411 370 568 467 1,816
Selling & administrative 347 346 334 288 1,315
Traffic expenses 196 203 218 218 835
Staff costs 165 164 171 163 663
Repair & maintenance 37 39 41 26 144
Others 16 17 17 15 65
Total 1,173 1,139 1,348 1,178 4,837
31 Mar 201831 Mar 2018
A$ m
Quarter
30 Jun 2017 30 Sep 2017 31 Dec 2017
A$ m A$ m A$ m
Year

Singapore Telecommunications Ltd And Subsidiary Companies Appendix 7 Page 5 of 7
GROUP ENTERPRISE
S$ m
Operating revenue 1,569 1,640 1,591 1,677 6,477
Operating expenses (1,095) (1,188) (1,131) (1,244) (4,658)
Other income 7 11 10 17 45
EBITDA 482 462 471 449 1,863
- margin 30.7% 28.2% 29.6% 26.8% 28.8%
Depreciation & amortisation (148) (154) (154) (152) (608)
EBIT 333 308 317 297 1,256
31 Mar 201831 Mar 2018
S$ m
Quarter
30 Jun 2017 30 Sep 2017 31 Dec 2017
S$ m S$ m S$ m
Year
OPERATING REVENUE
S$ m
ICT 706 784 709 810 3,008
Data & Internet 422 420 413 420 1,674
Mobile service 210 210 209 201 831
Fixed voice 137 139 127 128 530
Sale of equipment 78 70 115 99 362
Others 17 18 18 19 72
Total 1,569 1,640 1,591 1,677 6,477
Year
31 Mar 201831 Mar 2018
S$ m
Quarter
30 Jun 2017 30 Sep 2017 31 Dec 2017
S$ m S$ m S$ m
OPERATING EXPENSES
S$ m
Cost of sales 403 467 441 534 1,846
Staff costs 383 393 370 369 1,514
Selling & administrative 146 155 157 170 628
Traffic expenses 134 136 133 129 532
Repair, maintenance and others 29 37 30 42 138
Total 1,095 1,188 1,131 1,244 4,658
31 Mar 201831 Mar 2018
S$ m
Quarter
30 Jun 2017 30 Sep 2017 31 Dec 2017
S$ m S$ m S$ m
Year

Singapore Telecommunications Ltd And Subsidiary Companies Appendix 7 Page 6 of 7
SINGAPORE ENTERPRISE
S$ m
ICT 552 590 552 651 2,345
Data and Internet 339 337 332 338 1,346
Mobile service 162 161 164 155 641
Fixed voice 62 62 59 56 239
Sale of equipment 58 50 93 75 276
Others 17 18 18 19 72
Total 1,190 1,219 1,217 1,293 4,919
EBITDA 414 396 412 376 1,598
- margin 34.8% 32.5% 33.8% 29.1% 32.5%
31 Mar 201831 Mar 2018
S$ m
Quarter
30 Jun 2017 30 Sep 2017 31 Dec 2017
S$ m S$ m S$ m
Year
AUSTRALIA ENTERPRISE
A$ m
ICT 147 180 151 153 631
Data and Internet 79 77 77 80 312
Mobile service 46 45 44 45 181
Fixed voice 72 72 66 69 278
Sale of equipment 19 18 22 23 82
Total 362 392 360 370 1,484
EBITDA 65 62 57 70 254
- margin 18.0% 15.8% 15.8% 19.0% 17.1%
31 Mar 201831 Mar 2018
A$ m
Quarter
30 Jun 2017 30 Sep 2017 31 Dec 2017
A$ m A$ m A$ m
Year

Singapore Telecommunications Ltd And Subsidiary Companies Appendix 7 Page 7 of 7
SINGTEL
S$ m
Operating revenue 2,001 2,026 2,175 2,033 8,235
Operating expenses (1,450) (1,486) (1,613) (1,556) (6,105)
Other income 15 15 12 22 64
EBITDA 566 555 575 499 2,194
- margin 28.3% 27.4% 26.4% 24.6% 26.6%
Share of associates' pre-tax profits 730 659 552 519 2,461
EBITDA and share of associates'
pre-tax profits 1,295 1,214 1,127 1,019 4,655
Depreciation & amortisation (185) (187) (187) (185) (743)
EBIT 1,110 1,027 941 834 3,912
Net finance expense (39) (41) (31) (40) (151)
Profit before exceptional items
and tax 1,071 986 910 794 3,761
Taxation (352) (255) (208) (189) (1,003)
Profit after tax 719 732 702 605 2,758
Minority interests 6 6 8 2 21
Underlying net profit 725 738 710 607 2,779
Exceptional items (post-tax) (2) 1,940 (14) (48) 1,876
Net profit 723 2,677 696 559 4,655
31 Mar 201831 Mar 2018
S$ m
Quarter
30 Jun 2017 30 Sep 2017 31 Dec 2017
S$ m S$ m S$ m
Year
OPTUS
A$ m
Operating revenue 2,062 2,087 2,315 2,149 8,612
Operating expenses (1,471) (1,471) (1,654) (1,479) (6,075)
Other income 55 30 66 35 187
EBITDA 646 646 727 705 2,724
- margin 31.3% 31.0% 31.4% 32.8% 31.6%
Share of results of joint ventures * * * * *
EBITDA and share of results
of joint ventures 646 646 728 705 2,724
Depreciation & amortisation (349) (363) (362) (363) (1,436)
EBIT 297 284 366 342 1,288
Net finance expense (45) (47) (48) (46) (185)
Profit before exceptional items
and tax 252 237 318 296 1,103
Taxation (76) (72) (88) (90) (325)
Underlying net profit 176 165 231 207 778
Exceptional items (post-tax) (16) - 23 (3) 4
Net profit 160 165 254 204 782
31 Mar 201831 Mar 2018
A$ m
Quarter
30 Jun 2017 30 Sep 2017 31 Dec 2017
A$ m A$ m A$ m
Year