Embed Size (px)
Citation preview

Six-for-16
Regional Research
SEE PAGE 246 FOR IMPORTANT DISCLOSURES AND ANALYST CERTIFICATIONS Co. Reg No: 198700034E MICA (P) : 099/03/2012

January 3, 2016 2
Six-for-16
Six-for-16 is Maybank Kim Eng’s first consolidated Year Ahead product. We hope to introduce many more thoughtful and incisive reports through the year as we continue to build and invest in our team. What is distinctive about our Six-for-16 is a collection of “detachable” Tear-Sheets for the companies we are recommending. These carry our perception of the companies’ value proposition, their most essential financial metrics, share-price drivers and swing factors that instigate share prices both up and down. Over time, all our reports should carry such tear sheets, which seek to provide all-you-need-to-know insights into a company on a handy sheet of paper.
January 3, 2016 3
Six-for-16
HONG KONG Passive Aggressive ........................................................ 7 INDIA Cherry Picks for a Challenging Year .................................... 24 INDONESIA Indonesia Rising ......................................................... 39 MALAYSIA Externally Induced Volatility ............................................ 65 PHILIPPINES Smooth Transitioning .................................................... 86 SINGAPORE Looking for Undulations in the Flatlands ............................. 104 THAILAND Cautiously Optimistic ................................................. 133 VIETNAM Improving Competitive Landscape .................................... 161 ECONOMICS Data-Dependent, Event-Driven… Still ................................. 182 FOREIGN EXCHANGE Juggling Policy Divergence, RMB Adjustments and Trade Downshift .................................................. 199 EQUITY STRATEGY Seeing The Shrink ...................................................... 224

January 3, 2016 4
Six-for-16
Six-for-16: Overview
Six-for-16 is an eclectic collection of important themes and stock recommendations that our regional research teams have curated, believing that these will fuel or feature in Asian stock markets in 2016. The “six” denotes up to six stock recommendations per country in the year 2016, hence “16”. Our Chief Economist Suhaimi Ilias, Head of FX Research Saktiandi Supaat and Regional Strategist, Willie Chan, also share their thoughts on the macroeconomic landscape on pages 180 to 242.
Our market outlook is one of stoic optimism
Asian equity markets would be carrying into 2016 their baggage of five years of underperformance. A price still has to be paid for the deadweights of the preceding years, when economies were wrecked by excesses and companies were ill-prepared for disruptive technologies and failed to respond dynamically. Lured by oil prices in excess of USD100/barrel, massive debt and equity were poured into E&P and energy subsectors. Such investments are now being held to account. With few lending opportunities in other sectors, banks’ direct/indirect exposure to these sectors is not small. Debt refinancing, delivery deferments and legal posturing have started, but this should be early days. 2016 is likely to shed more.
Our strategist, Willie Chan, has a more optimistic view than he had a year ago. He argues for a bottoming process for Asian markets in absolute terms and relative to global equities, albeit volatile. He finds the data consistent with recessionary environments in many countries but with valuations near lows, he suggests being opportunistic and adding risk to portfolios this year. He also shows rising risk aversion in the US investment-grade corporate bond market, which suggests the Fed may not be all that hawkish on rate hikes and therefore, USD appreciation may not be all that dramatic.
Our country research teams are hopeful too, believing that without black-swan events, their economies are slowly on the mend. Cushioned by momentum in their domestic economies, India, the Philippines and Vietnam expect to be relatively unscathed. Our teams in Singapore, Hong Kong and China believe that with their much bigger exposure to exports, their countries could be staring at heightened risks and uncertainties.
Two common themes from the various country reports
Firstly, almost all markets are looking to their government for shelter and relief amid trifling revenue growth. Having attained currency stability in the last three months despite US interest-rate hikes, our Indonesia, Thailand and India colleagues even believe that their central banks are in a position to cut rates in 2016 or lower reserve requirements. This is supported by Head of FX Research Saktiandi who believes that the Fed may not be overly hawkish. Inflation remains low while capital flight does not seem a mortal threat. Domestic currencies may even strengthen against the USD, having swung to their worse extreme in Malaysia and to a lesser extent, Indonesia, in 2015.

January 3, 2016 5
Six-for-16
Against weak earnings and slow exports, governments are expected to work on increasing disposable income for lower-income households. Cash transfers (Thailand) and wage reforms (Indonesia) may be on the agenda. Cost reliefs and economic restructuring (Singapore) are some longer-term measures. Other recourse includes the unleashing of long-withheld infrastructure spending, possibly in China, India, Malaysia, Indonesia, Thailand and Vietnam. All are obviously premised on governments’ fiscal ability to pump-prime. Fortunately for the region, fiscal finances are at their strongest and most stable in a long time: Our economist, Suhaimi, believes that majority of Asian economies have room to engage in fiscal spending, with perhaps the exception of India and Vietnam. As such, faith in governments may not be misplaced. And assuming mild global headwinds, slightly better equity markets may be envisaged for Asia in 2016.
Secondly, the consumer should make a comeback. After years of pent-up demand, spending on non-discretionary products and services appears to be rising. This should continue, especially on the back of higher disposable income as governments implement or raise minimum wages. Thailand, Indonesia and the Philippines (amid election spending) expect expenditure on cars, electronics, property, cigarettes, personal care and healthcare among others to rise. China’s relaxation of its one-child policy should also bolster spending on maternity/baby products. Malaysia’s consumer sentiment and spending are expected to improve from mid-2016, six quarters after GST implementation, aided by tapering MYR weakness.
In developed Asia, consumer demand has graduated from goods to services. Demand for travel, medical, wealth-management and education services has been vigorous. Although the 2015 economic retracement has taken out some wind, the trends are intact, we believe. We reckon a rebound of this sector, when economies recover, could outpace others. A nascent e-commerce sector has also created significant spillovers, not exclusive to logistics services. Same-day delivery has almost become a norm; this was alien to the consumer a year or two ago. In developing Asia, service consumption is just about to take off. India expects burgeoning demand for leisure & recreation, education and telco services, among others.
Best ideas from each market
Consistent with the themes emanating from each country, our best picks are: Goodbaby for China; Inox Wind for India; Bank Rakyat Indo for Indonesia; Tenaga for Malaysia; SM Prime for the Philippines; Jumbo for Singapore; Home Product Center for Thailand; and Vinamilk for Vietnam.
2015 was a year when returns from all asset classes either dwindled or turned negative. While that could persist in 2016, in some countries like Singapore, cash accumulation is at an all-time high. The monies will have to find their way into some asset class, be it equity, property or fixed income. Anticipating their directional is where we believe the opportunities will be. As Gregory Yap wrote in his Six-for-16 for Singapore, amid the flatlands, we attempt to find undulations. And as Willie would say: “risk on, judiciously”.

January 3, 2016 6
Six-for-16
This page has been left blank intentionally


January 3, 2016
STRA
TEG
Y Ch
ina/
HK
China’s Six-for-16
Passive Aggressive
Our game plan for 2016: passive aggressive Few would disagree the Chinese economy is at a very important juncture. The economy is undergoing structural transformation, ridden by excess industrial capacity. The government is hoping consumption, investment and technology innovation can pull it out of the current slump. We don’t know the outcome but that doesn’t mean we can’t generate alpha in a directionless market. And here is our playbook for 2016.
12 months: profit matters in the long run Growth is rare in the current environment; e-commerce is one of the few sectors that can deliver momentum, and investors should stay invested in this space. However, contrary to the Street, we believe profit and cash flow in the e-commerce sector will become more important in the coming years, as top-line momentum will normalize along with its scale. Alibaba’s (BUY, BABA US) asset-lite model will have further reach in China and generate superior margins and cash flow over JD.com (SELL, JD US) and VIP (HOLD, VIP).
6 months: a bet on the house To drag the country out of the hole, the Chinese government will continue its monetary easing and fiscal investment scheme. As further CNY weakness is almost certain, we believe Goodbaby (BUY, 1086 HK) is a key beneficiary as its revenue is USD and EUR dominated, CNY weakness will boost bottom line. With the recently announced auto subsidies for 1.6 litre engine cars, Geely (BUY, 175 HK) is likely to see strong sales volumes in the coming months.
3 months: blood on the street In the long run, the world could be filled with autonomous driverless vehicles fuelled by solar cells or electricity; however, between then and 2016, we believe there is still a need for oil. With Brent crude trading at below USD40/BBL and almost half of the global production is generating negative cash flow, the market is poised for a technical bounce. Long the Chinese oil sector for a trade. CNOOC (BUY, 883 HK), Sinopec (BUY, 386 HK) and PetroChina (HOLD, 857 HK).
Analyst
Howard Wong
(852) 2268 0648

January 3, 2016 9
China’s Six-for-16
1. Profit matters in the long run, even for e-commerce – prefer Alibaba (BUY)
We recently initiated coverage on the China Internet sector with a NEUTRAL view, and with an emphasis on stock picking, as we rate only Alibaba as a BUY (TP USD109). We have a SELL on JD.com (TP 23.50) and HOLD on Vipshop (TP USD16.5). Our stock calls are contrarian as the Street has strong buys on all three names. We believe our BUY on Alibaba is also out of consensus because our target price is at a 14% premium to the consensus target, and even though 88% of the Street has a buy on the stock, most prefer JD.com over Alibaba. We recommend a sector neutral positioning by longing Alibaba, funded by JD.com.
These three companies make up nearly 90% of China’s online shopping GMV (gross merchandise value) market share, and we expect the market to continue to grow at a solid 23% 3-year CAGR, which is a far cry from the 50% CAGR the industry enjoyed over the past three years. For this reason, we believe investors will increasingly focus on companies’ ability to monetize on growth going forward.
We derived our view on the e-commerce sector and the three key online shopping platforms by examining three key evaluation criteria:
1.1 Business model matters! Which company has the business model that will allow it to target all of China as an addressable market – both urban and rural? We believe Alibaba’s asset-lite model makes it the platform for all people for everyday needs. This is the platform with the best chance for sustainable long-term growth, in our view. Added to this, the ultimate winner needs to continue to invest and cultivate innovative ways to serve the population. We think Alibaba is doing that on a much larger scale compared to JD and Vipshop. However, the value of Alibaba’s investments is already reflected in the share price, in our view
1.2 Margins matter! Companies with secular growth are sexy, but the market has already rewarded them for such growth. When growth slows, these companies lose their appeal and only those companies that can demonstrate long-term profitability and FCF generation will be rewarded. We believe only the asset-lite model provides a company with a chance for sustainable long-term profit and FCF growth as asset-heavy models require continued heavy investment in warehouses, logistics, and delivery, while a giant labour force also weakens operating leverage.
1.3 Valuations matter! We believe DCF is the most appropriate method for valuing the Chinese e-commerce companies because JD is not profitable for the foreseeable future, and the sustainability of Vipshop’s profitability over the long term remains questionable. The Street is resorting to P/Rev or P/Gross Profit, some even Value/GMV in the case of JD.com. We believe such multiples are less useful as it is difficult to make an apples-to-apples comparison. Based on our DCF analysis, we believe Alibaba offers the largest upside. The biggest risk to DCF for the e-commerce stocks are the large contributions to overall value from the terminal value (TV), which could pose a risk. In our target prices, JD has the greatest risk with TV making up 73% of the overall equity value, Alibaba is next, and Vipshop the least.
Fig 1: Online shopping GMV and consumption growth rate YoY
Source: iResearch, Euromonitor, Maybank Kim Eng
January 3, 2016 10
China’s Six-for-16
2. A bet on the house
Few would disagree the Chinese economy is at a very important juncture. The final outcome is still unknown but we have no doubt the Chinese government will try every tool at its disposal before it gives up. And we recommend investors to build their portfolios in sync with these policy incentives.
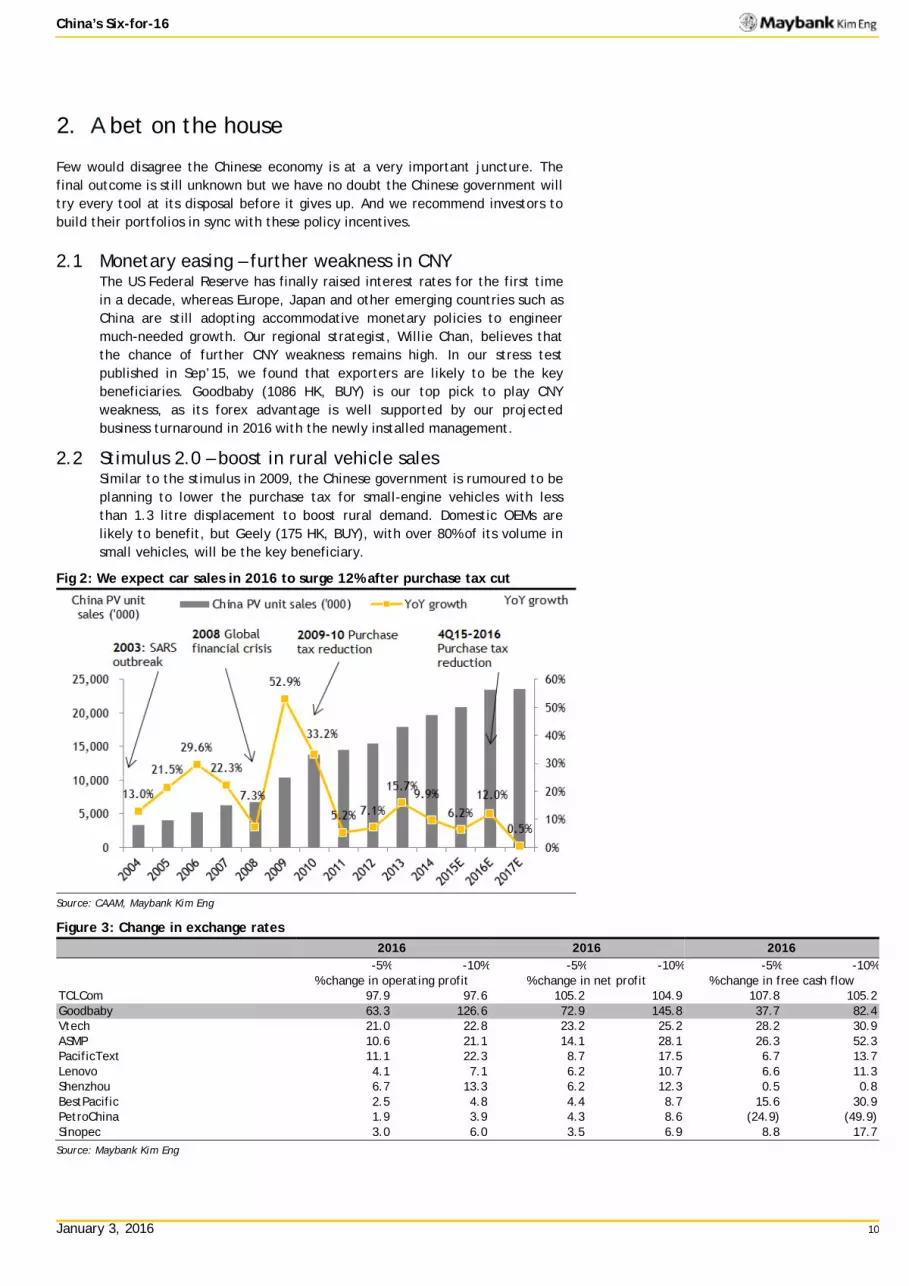
2.1 Monetary easing – further weakness in CNY The US Federal Reserve has finally raised interest rates for the first time in a decade, whereas Europe, Japan and other emerging countries such as China are still adopting accommodative monetary policies to engineer much-needed growth. Our regional strategist, Willie Chan, believes that the chance of further CNY weakness remains high. In our stress test published in Sep’15, we found that exporters are likely to be the key beneficiaries. Goodbaby (1086 HK, BUY) is our top pick to play CNY weakness, as its forex advantage is well supported by our projected business turnaround in 2016 with the newly installed management.
2.2 Stimulus 2.0 – boost in rural vehicle sales Similar to the stimulus in 2009, the Chinese government is rumoured to be planning to lower the purchase tax for small-engine vehicles with less than 1.3 litre displacement to boost rural demand. Domestic OEMs are likely to benefit, but Geely (175 HK, BUY), with over 80% of its volume in small vehicles, will be the key beneficiary.
Fig 2: We expect car sales in 2016 to surge 12% after purchase tax cut
Source: CAAM, Maybank Kim Eng
Figure 3: Change in exchange rates
2016 2016 2016
-5% -10% -5% -10% -5% -10% % change in operating profit % change in net profit % change in free cash flow TCLCom 97.9 97.6 105.2 104.9 107.8 105.2 Goodbaby 63.3 126.6 72.9 145.8 37.7 82.4 Vtech 21.0 22.8 23.2 25.2 28.2 30.9 ASMP 10.6 21.1 14.1 28.1 26.3 52.3 PacificText 11.1 22.3 8.7 17.5 6.7 13.7 Lenovo 4.1 7.1 6.2 10.7 6.6 11.3 Shenzhou 6.7 13.3 6.2 12.3 0.5 0.8 BestPacific 2.5 4.8 4.4 8.7 15.6 30.9 PetroChina 1.9 3.9 4.3 8.6 (24.9) (49.9) Sinopec 3.0 6.0 3.5 6.9 8.8 17.7
Source: Maybank Kim Eng

January 3, 2016 11
China’s Six-for-16
3. Blood on the street
Crude oil benchmarks are trading at below GFC lows as we draft this thesis; we believe nearly half of the global oil production has difficulty generating positive cash flow at current price levels. Without a catalyst in sight, investors have cleared out their exposure in the Chinese energy sector. Despite the dire sight, we believe a technical rebound is around the corner, and investors can gain exposure through the upstream names such as CNOOC and PetroChina.
3.2 Darkness before dawn Cyclicality of the commodity industry is mostly caused by supply rather than demand; due to the scale and time lag, incremental supply normally hits the market while demand is weak, and the oil market is no exception. From the charts below, we can identify that nearly half of the world’s oil production are generating negative cash flow at current crude prices. As a result, we have witnessed a drastic reduction in development and exploration capex, particularly on the greenfield projects. Despite the near-term pessmisim, the dearth of investment will eventually lead to tightness in supply.
3.3 Squeeze is around the corner Due to its downstream exposure, Asian-dedicated funds have been using Sinopec to maintain their exposure to the Chinese sectors. From its recent underperformance against its peer, despite weaker crude prices, we believe investors have nearly closed out their exposure in this space. Any technical bounce will create a squeeze, and we believe the best way to gain exposure is via upstream names such as CNOOC and Petrochina.
Fig 4: Global oil production cost curve (USD/BBL) Fig 5: OPEC: Breakeven price for fiscal budget* (USD/BBL)
Source: EIA, DOE, IEA, BP, Worldbank, Bloomberg, Rystad Energy, Maybank Source: EIA, DOE, IEA, BP, Worldbank, Bloomberg, Rystad Energy, Maybank *Based
on 2014 fiscal budget, 2015 budget numbers will be higher, in particularly in Saudi Arabia, as the country is engaging in conflicts with Yemen.
Fig 6: PetroChina PB Band
Source: Maybank Kim Eng
Fig 7: CNOOC PB Band
Source: Maybank Kim Eng

January 3, 2016
Inte
rnet
Ch
ina/
HK
Alibaba’s Revenue Mix (2015E)
Source: Company data, Maybank Kim Eng
Mitchell Kim [email protected] (852) 2268 0634
Jeffrey Kwong [email protected] (852) 2268 0635
Alibaba Group (BABA US)
Digging for treasures
BUY; prefer BABA over JD.com Alibaba, China’s dominant online shopping platform, is the best positioned among peers for long-term growth due to its high-margin asset-lite model, and the army of 386m buyers. The company has invested nearly USD25b to further expand its platform in the areas of O2O (online to offline), travel, video, healthcare and more. We believe potential upside of the associates has not been priced in. Our BUY call is out of consensus, as the market favours its competitor JD.com (SELL TP USD23.5). Alibaba has underperformed the broader market indices as well as JD.com, in 2015, providing an attractive pair trade opportunity.
Superior asset-lite model With no pricing and inventory risk, and a relatively leaner workforce, we believe Alibaba could maintain its market leadership even as consumption growth accelerates in rural areas. For this reason, Alibaba will enjoy sustainable long-term top and bottom-line growth, in our view. Alibaba has the highest gross merchandise value (GMV) and revenue per employee among its competitors.
Don’t be fooled, Alibaba is no eBay Amazon was able to overtake eBay because eBay did not have the dominant scale Alibaba has, and eBay was not able to offer reliable shipping options. Alibaba’s sellers can ship through Alibaba’s logistics partner, Cainiao, who delivers the purchased items in 3 days, on average.
Associate investments not in the price We value Alibaba’s online shopping business at USD95 per ADR, representing 13% upside from the current level on its own, and the company’s investment holdings at USD14 per ADR, currently mostly valued on their equity value. There is substantial upside if the value of such assets, such as Alipay and Kaudi Didi, are unlocked.
Share Price USD 81.27
12m Price Target USD 109.00 (+34%)
Previous Price Target USD 109.00
BUY
Price Performance
70
80
90
100
110
120
130
140
50
60
70
80
90
100
110
120
Sep-14 Nov-14 Jan-15 Mar-15 May-15 Jul-15 Sep-15 Nov-15
Alibaba - (LHS, USD) Alibaba / Hang Seng Index - (RHS, %)
-1M -3M -12MAbsolute (%) (3) 38 (22)
Relative to index (%) (1) 31 (16)
Source: FactSet
FYE Mar (CNY m) FY14A FY15A FY16E FY17E FY18E
Revenue 52,504 76,204 101,112 136,985 176,094EBITDA 26,574 27,550 36,827 50,972 66,014Core net profit 28,274 34,981 45,570 59,447 74,404Core FDEPS (CNY) 12.12 13.99 18.05 23.31 28.89Core FDEPS growth(%) 108.8 15.4 29.0 29.2 23.9Net DPS (CNY) 0.00 0.00 0.00 0.00 0.00Core FD P/E (x) 43.5 37.7 29.2 22.6 18.3P/BV (x) 28.9 8.4 5.7 4.6 3.7Net dividend yield (%) 0.0 0.0 0.0 0.0 0.0ROAE (%) 112.5 37.6 24.1 22.8 22.9ROAA (%) 32.3 19.1 15.0 15.3 15.9EV/EBITDA (x) na 42.2 34.9 24.4 17.9Net debt/equity (%) 20.2 net cash net cash net cash net cashConsensus net profit - - 69,073 36,922 52,706MKE vs. Consensus (%) - - 1.5 10.3 2.8
Company description
Statistics 52w high/low (USD) 3m avg turnover (USDm) Free float (%) Issued shares (m) Market capitalisation
Major shareholders: 2.1% 1.7% 1.2%
2,327
1,460.0
Alibaba is the largest ecommerce company in China, with marketplaces in retail and wholesale, as well as cloud computing and other services.
Temasek Holdings Pte Ltd. Baillie Gifford & Co. Silver Lake Management Co. LLC
105.03/57.39
98.3
USD189.1B USD189.1B

January 3, 2016 13
Alibaba Group
Value Proposition
§ Dominant e-commerce company in China is the best way to capture the strong consumption growth and the rise of SMEs.
§ Its dominant scale and asset-lite business model allows the company to enjoy a sustainable long term growth and broadly maintain market leadership.
§ Estimated to generate FCF yield of 10-15% in the outer years thanks to its high-margin and low capex requirement.
§ The company is investing significantly in the future businesses to broaden its platform. Unlocking the value of such assets could provide further upside.
Operating profit to reaccelerate in FY16E
Source: iResearch, Maybank Kim Eng
Price Drivers
Historical share price trend
Source: Company, Maybank Kim Eng
1. Post-IPO, investors took some chips off the table selling into stronger-than-expected 3Q15 results.
2. Concerns over allegation of Taobao selling counterfeit goods created an overhang as well as continuing decline of monetization rate.
3. Solid GMV growth at JD prompted investors to switch to JD on concern that JD wins market shares from Alibaba like Amazon did over eBay. BABA shares completely ignored throughout China liquidity run.
4. Weak revenue growth in 2Q15 (1QFY16) led market concerns.
5. BABA outperformed the rebounding market as 3Q15 monetization rate grew YoY for the first time since 2Q14.
Financial Metrics
§ To assess revenue growth, investors need to focus on GMV (gross sales) and monetization rate.
§ Monetization rate shows how much revenue is generated from sales transacted on the platforms.
§ Operating margin: any sign of margin increase with costs containment could be a catalyst for the stock.
§ ROA in the long term to improve from 9% in FY16e to 12.8% by FY20e.
Operating margin and blended monetization rate
Source: Company
Swing Factors
Upside
§ Better than expected monetization rate (PC to stabilize quicker / mobile monetization to improve).
§ Higher margins as associates improve their margins. § Listing of key associates or assets in 2016, eg, Alipay and
Didi Kaudi.
Downside
§ Loss of major global brand to JD.com due to counterfeit concerns and/or unexpected regulatory update proposed by the government.
§ Slower buyer growth or decline in GMV per buyer as competition intensifies or monetization rate declines.
§ Losses from new investments and associates drag down margins.
114.4% 131.8%
(7.2%)
30.3% 44.4%
29.3%
-40%
10%
60%
110%
160%
0
10,000
20,000
30,000
40,000
50,000
60,000
FY12 FY13 FY14 FY15 FY16E FY17E FY18E
(CNY m) Operating Profit, GAAP % yoy
60
70
80
90
100
110
120
130
50
60
70
80
90
100
110
120
Sep-14 Dec-14 Mar-15 Jun-15 Sep-15
Alibaba - (LHS, USD) Alibaba / MSCI AC Asia ex JP - (RHS, %)
2.0%
2.2%
2.4%
2.6%
2.8%
3.0%
30%
35%
40%
45%
50%
55%
FY12 FY13 FY14 FY15 FY16E FY17E FY18E
EBIT, non-GAAP (LHS) Monetization rate (RHS)
1
2
3
5
4

January 3, 2016
Inte
rnet
Ch
ina/
HK
JD Revenue Mix
Source: Maybank Kim Eng
Mitchell Kim [email protected] (852) 2268 0634
Jeffrey Kwong [email protected] (852) 2268 0635
JD.com, Inc (JD US)
Beauty is only skin deep
Long Alibaba, short JD.com We have the only SELL on the street. We believe the market is overestimating the company’s ability to generate profit in the next two years. We believe the company’s asset heavy model, similar to Amazon’s, limits its ability to turn profitable without sacrificing top line growth. We recommend a pair trade of long Alibaba and short JD (DCF TP USD23.5). Our call is non-consensus.
We prefer asset-lite business model JD’s asset heavy business model requires continuous investments in fulfilment to execute its model. JD is currently capable of delivering 2.5 m packages per day using 36K fulfilment staff. Alibaba is capable of delivering 25 m per day, and its affiliates have 1.4 million fulfilment staff. Already Alibaba generates CNY89m GMV per employeevs. JD’s CNY21m. To grab a larger share of China’s consumption, the company has to target the underpenetrated lower tier counties and towns. This means lower density, higher costs. In our opinion, costs will have to rise.
Profit still years away Consensus believes scale automatically leads to margin expansion because of pricing power and productivity gains. Amazon’s history tells us this is not the case. For 10 years, its gross margins have been flat, and when margins expanded due to contributions from its cloud business and Kindle, operating margins fell. Consensus is building in gross and operating margin expansion every year to perpetuity. This certainly did not happen for Amazon of US.
Competition is intensifying Competition is brewing. Alibaba has made a strategic investment in Suning, the largest 3C retailer, to go after JD’s core strength in the 3C segment. Suning was the third highest seller on Alibaba’s Singles’ Day. If competition intensifies, the gross margin expansion the market is anticipating may be further delayed.
Share Price USD 32.27
12m Price Target USD 23.50 (-27%)
Previous Price Target USD 23.50
SELL
Company description
Statistics52w high/low (USD)3m avg turnover (USDm)Free float (%)Issued shares (m)Market capitalisation
Major shareholders:12.3%5.2%3.9%
1,115
331.2
JD.com, Inc. is the second largest B2C onlineshopping platform in China. The company offersdirect sales and marketplace with focus on 3Cproducts.
Hillhouse Capital Management Ltd. (Hong Tiger Global Management LLC Lone Pine Capital LLC
37.95/22.81
98.5
USD36.0BUSD36.0B
Price Performance
90
100
110
120
130
140
150
160
170
180
20.0
22.0
24.0
26.0
28.0
30.0
32.0
34.0
36.0
38.0
May-14 Aug-14 Nov-14 Feb-15 May-15 Aug-15 Nov-15
JD.com, Inc - (LHS, USD) JD.com, Inc / Hang Seng Index - (RHS, %)
-1M -3M -12MAbsolute (%) 2 22 39
Relative to index (%) 5 16 50
Source: FactSet
FYE Dec (CNY m) FY13A FY14A FY15E FY16E FY17E
Revenue 69,340 115,002 178,367 252,003 330,460EBITDA (286) (4,151) (1,153) (1,644) 441Core net profit 224 363 (954) (1,899) (266)Core EPS (CNY) 0.26 0.30 (0.70) (1.32) (0.18)Core EPS growth (%) nm 13.4 nm nm nmNet DPS (CNY) 0.00 0.00 0.00 0.00 0.00Core P/E (x) 788.4 694.9 (298.5) (157.5) (1,163.4)P/BV (x) 19.1 6.7 8.0 9.1 9.8Net dividend yield (%) 0.0 0.0 0.0 0.0 0.0ROAE (%) 2.9 1.6 (2.6) (5.6) (0.8)ROAA (%) 1.0 0.8 (1.3) (2.1) (0.3)EV/EBITDA (x) na nm nm nm nmNet debt/equity (%) net cash net cash net cash net cash net cashConsensus net profit - - (2,379) (583) 2,557MKE vs. Consensus (%) - - (22.4) (633.4) (221.1)
75.4%
17.1%
7.5%
1P - 3C products
1P - Generalmerchandise
Services and others

January 3, 2016 15
JD.com, Inc
Value Proposition
§ The second largest B2C online shopping platform in China, with sales estimated to grow at a 32% CAGR for next three years, a downshift from the 60% CAGR the last three.
§ In spite of high top line growth, turning profitable will remain a challenge due to the company’s asset heavy model.
§ Competition is brewing for JD as Alibaba will look to chip away at JD’s core strength—3C products, through investment in Suning. JD’s market share and/or gross margins could come under competitive pressure.
China Online B2C Online Shopping Market Share, 1H15
Source: Company, CECRC
Price Drivers
Historical share price trend
Source: Company, Maybank Kim Eng
1. Post IPO peak reached after solid 2Q15 results but falls
with the market thereafter. 2. Solid 4Q14 supported by seasonal sales surge lifts stock.
China liquidity rally enhanced stock sentiment. 3. Concerns on China economy raise consumption risk
pressures stock after reaching the historical peak. 4. Improving sentiment on MSCI China Index inclusion and
better outlook for 4Q15.
Financial Metrics
§ Low gross margin at ~13% and high operating costs keep profits possible only in the long term. Operating margin remains challenged because of its asset heavy business model.
§ To reach our consensus low target price, GM needs to rise from 13% in 2015F to 18.4% in the outer years.
§ Generates low FCF yield 3-4% in the long term because of heavy investment requirement.
High Operating Costs Further Delay Profitability
Source: Company, Maybank Kim Eng
Swing Factors
Upside
§ Better than expected sales mix towards general merchandise and other non-3C products, driving gross margin to above 14% in 2016
§ Recovery in top line growth if the market gains more market share from offline companies and relative to Alibaba.
§ Cooperation with Tencent – if JD benefits from surge in traffic from Wechat as Moments gains higher popularity, or if Tencent is able to direct more of its users to JD’s platforms.
Downside
§ Gross margin could come below market expectation given the macro headwinds and competition intensifying. Direct sales margin fell in 3Q15. Further softening in 4Q15 could apply downward pressure.
§ Significant increase in operating costs further delaying profit turnaround due to penetration of lower tier markets.
§ Lower GMV per incremental buyer poses pressure on top line growth.
(7%)
(6%)
(5%)
(4%)
(3%)
(2%)
(1%)
0%
0
50
100
150
200
250
300
350
400
450
FY10 FY11 FY12 FY13 FY14 FY15E FY16E FY17E FY18E
(CNY b) Total net revenues Operating Margin (GAAP)
90100110120130140150160170180
20.022.024.026.028.030.032.034.036.038.0
May-14 Aug-14 Nov-14 Feb-15 May-15 Aug-15 Nov-15
JD.com, Inc - (LHS, USD)
JD.com, Inc / MSCI AC Asia ex JP - (RHS, %)
0%
1%
2%
3%
4%
5%
6%
7%
8%
9%
FY11 FY12 FY13 FY14 FY15E FY16E FY17E FY18E
Fulfillment Marketing Technology G&A
1
2
3
4

January 3, 2016
Cons
umer
Ch
ina/
HK
Goodbaby Intl’-1H15 sales breakdown
Source: company data Maybank Kim Eng
Jacqueline Ko, CFA [email protected] (852) 2268 0633
Goodbaby International (1086 HK)
Strong overseas + steady China = 15% FCF yield in FY16F
BUY on weakness; growth on track Maintain BUY, TP (pegged to 18x FY16F P/E) and EPS after call update. We see growth on track, highlighted by strong overseas and steady China sales. We believe its recent share-price weakness could be due to profit-taking and general unease that Chairman Mr Song may shift his focus to upcoming listed sister company, Goodbaby China (e-commerce & retail focus), possibly with a larger shareholding there than in Goodbaby Intl’.
Robust overseas sales led by previous M&As We expect previously-acquired Europe-based CYBEX and US-based Evenflo to continue to lead robust sales growth in 2H15, with new products and market-expansion efforts in 1H15. To recap, CYBEX/Evenflo sales grew 60%/17% YoY in 1H15. We see improving profitability for both on the back of positive operating leverage. CYBEX enjoys EBIT margins of 14-15%; Evenflo has been operating above breakeven levels. In Sep 2015, CYBEX raised its ASPs by 5% amid EUR weakness. Recall that 70% of CYBEX’s orders are EUR-denominated. Still, volume was unaffected.
Dorel’s order cuts in line; stabilised losses at Urbini The pace of order cuts in 2H by key client, Dorel, should mirror 1H15’s ie full-year orders should drop USD70-80m YoY. That said, Dorel’s sales contributions are down to 8-9% from 20%+ in the past. As for Urbini, its sales track expectations of USD30-35m for FY15, though opex is high as it is still in the early brand-building stage and has yet to reach economies of scale. Even then, we believe losses will not exceed FY14’s USD5m. We anticipate breakeven for Urbini in FY16 on estimated sales of USD50m+.
Steady PRC sales; lifted by e-commerce Sales growth slowed moderately in 3Q15 from 1H15. YTD, 30%+ YoY e-commerce sales growth has helped to offset offline weakness. Online makes up 32% of PRC sales while 70% of its offerings do not overlap with offline. Core brand Goodbaby outperforms its China growth, helping to take up the slack from its low-mid-tier brand, Happy Dino (42% of sales), amid strong competition. Overall, rising car-seat sales are lifting GPMs.
Share Price HKD 2.82
12m Price Target HKD 4.50 (+60%)
Previous Price Target HKD 4.50
BUY
Price Performance
40
60
80
100
120
140
160
2.00
2.50
3.00
3.50
4.00
4.50
5.00
Jan-14 Apr-14 Jul-14 Oct-14 Jan-15 Apr-15 Jul-15 Oct-15
Goodbaby - (LHS, HKD) Goodbaby / Hang Seng Index - (RHS, %)
-1M -3M -12MAbsolute (%) (7) (18) 4
Relative to index (%) (5) (22) 13
Source: FactSet
Company description
Statistics 52w high/low (HKD) 3m avg turnover (USDm) Free float (%) Issued shares (m) Market capitalisation
Major shareholders: 23.4% 10.6% 9.0%
1,109
0.7
Goodbaby International is engaged in manufacturing and distribution of strollers, car safety seats and other juvenile durables.
Pacific United Developments Ltd. Pioneer Investment Management Ltd. FIL Investment Management
3.80/2.11
72.0
HKD3.1B USD40M
FYE Dec (HKD m) FY13A FY14A FY15E FY16E FY17E Revenue 4,189 6,116 7,422 8,264 9,274 EBITDA 302 302 515 681 817 Core net profit 171 113 174 279 362 Core EPS (HKD) 0.17 0.10 0.16 0.25 0.33 Core EPS growth (%) (5.9) (39.2) 52.3 60.4 29.7 Net DPS (HKD) 0.05 0.00 0.05 0.08 0.10 Core P/E (x) 16.65 27.2 17.9 11.1 8.6 P/BV (x) 1.5 1.3 1.3 1.2 1.1 Net dividend yield (%) 1.9 0.0 1.7 2.7 3.5 ROAE (%) 9.2 5.4 7.4 11.1 13.2 ROAA (%) 5.1 2.3 2.6 4.0 4.9 EV/EBITDA (x) 13.9 15.9 9.5 6.6 5.2 Net debt/equity (%) net cash 79.4 71.9 51.5 38.7 Consensus net profit - - 174 274 350 MKE vs. Consensus (%) - - 0.0 1.9 3.5

January 3, 2016 17
Goodbaby International
Value Proposition
§ A leading juvenile-durables manufacturer. Transitioning from a manufacturer to a global juvenile branded operator after two M&As in 2014.
§ Could be re-rated following changes in sales strategies and a more international talent team. We forecast ROE rebounds from trough in FY14 on net-margin uptrend.
§ Strengthening fundamentals, global market share gain and favourable macro factors (CNY weakness, policy) should accelerate NPAT growth ie 61%/30% YoY growth in FY16/17F.
Goodbaby Intl’s Dupont analysis(FY10-FY17F)
Source: Company, Maybank Kim Eng estimates
Price Drivers
Historical share price trend
Source: Factset, Maybank Kim Eng
1. Share price corrected on worries over wage hikes, labour shortages, CNY appreciation and raw-material cost pressure. Company reported YoY profit declined in 1H11.
2. FY11 results missed guidance. 3. Share price spiked on CYBEX acquisition announcement. 4. GB announced better-than-expected improvements for
acquired brands, with Evenflo breaking even ahead of plan. CYBEX reported over 60% YoY sales growth in 1H14.
5. In late Sep’15, company released positive outlook at its PRC reverse roadshow. In Oct’15, PRC government allowed two children for all couples.
Financial Metrics
§ Sales volume growth and mix changes are key drivers of profitability, as existing margins are extremely thin. Higher utilisation rates should lower its fixed-cost.
§ Structural ROE improvements are mainly attributable to higher net margin and steadily improving return on assets.
§ Rationalisation of cost ratios amid M&A integration should be one of its key growth drivers from FY16F onwards.
§ We expect net margins to almost double in FY15-17F. Net-margin improvements could drive FCF yield to over 15% in FY16 and almost 12% in FY17.
FCF and FCF yields in FY16-17F
Source: Company, Maybank Kim Eng estimates
Swing Factors
Upside § Global sales network drives economies of scale and
diversifies single-market risks. Better-than-expected integration helps boost margins.
§ CNY weakness favourable as sales mainly from exports (est. 60% USD-denominated) while production is in China.
§ Has strategically improved both its industrial orders and branded-sales profitability by enhancing value-added functions as well as optimising mix.
§ Less-than-expected order cuts by Dorel could surprise market on the upside. Order cuts from Dorel overhang in last 1-2 years. Sales contributions from Dorel down to 8%.
Downside § Failure to integrate newly-acquired brands with existing
platform could jeopardise sales. OEM/ODM customers may see conflicts of interest and cut orders.
§ Fast-growing e-commerce shopping trend may challenge local market competitive landscape. GB’s low-mid-tier brand Happy Dino seeing more competition.
§ Forex, raw-material cost volatility and labour shortages are risks to earnings.
30405060708090100110120130
1.502.002.503.003.504.004.505.005.506.006.50
Dec-10 Dec-11 Dec-12 Dec-13 Dec-14
Goodbaby - (LHS, HKD) Goodbaby / MSCI AC Asia ex JP - (RHS, %)
1
2
3 5
4

January 3, 2016
Oil
& G
as
Chin
a/H
K
Ka Leong Lo [email protected] (852) 2268 0630
Benjamin Ho [email protected] (852) 2268 0632
Geely Automobile (175 HK)
Stepping up the green strategy
Unveiling the ‘Blue Geely Initiative’ Geely unveiled its new energy vehicle strategy in Nov 15. It has a strong product pipeline and it expects new energy vehicles (NEVs) to account for 90% of its sales by 2020. In the near term (2016-17), sales and earnings will be driven not only by favourable government policies for domestic brands and small cars, but also by a series of new SUV models. The first new SUV (NL-3) will debut in early 2016 after the success of the GC9. Maintain BUY. TP HKD4.3 is based on a target PER of 10.3x.
Seeking 90% of new energy vehicle sales Geely targets pure electric and hybrid vehicles to make up 90% of its total shipments by 2020. After the recent debut of its Emgrand EC7 electric vehicle (EV), Geely will launch various pure electric and hybrid models based on three production platforms jointly developed with Volvo. By 2018-20, technology upgrade will give the future Emgrand models a driving distance of 400-500km on one battery charge, up from 330km for the current model. Emgrand EV is now priced at CNY100-150k after government subsidies (comparable to similar internal combustion engine vehicles). Geely will also introduce plug-in Hybrid EV based on the CMA platform with a turbocharged 1.5L engine, at prices similar to ICE models.
Product pipeline Although Geely will phase out the traditional ICE vehicles over the long term, it will maintain its competitiveness in this area. Sales of its new B-segment sedan GC9 reached a new high of 5,427 units in Nov 15, which will support its profit mix and hence margin improvement. Geely will launch another SUV model in early 2016 built under the same platform and designed by Peter Horbury who was previously executive design director at Ford and Volvo. The new SUV pipeline will help Geely regain market share in the robust Chinese SUV market. Overall we expect to see 4-5 new models in 2016.
Valuation The stock is trading at 10.1x FY16F PER, in line with its three-year average of 10.6x but a premium to the sector average of 8-9x. This is justified as sales and earnings in the coming two years will be driven not only by favourable government policies but also by its investment/preparation in the platform design and new energy strategy.
Share Price HKD 4.13
12m Price Target HKD 4.30 (+4%)
Previous Price Target HKD 4.30
BUY
Company description
Statistics52w high/low (HKD)3m avg turnover (USDm)Free float (%)Issued shares (m)Market capitalisation
Major shareholders:42.6%3.0%2.3%
8,801
29.8
Geely Automobile is engaged in the development,manufacturing and sales of passenger vehicles. Itsells most of its products in the China.
Zhejiang Geely Holdings Group Co. Ltd. JPMorgan Asset Management (UK) Ltd. JPMorgan Investment Management, Inc.
4.67/2.44
57.0
HKD36.3BUSD4.7B
Price Performance
60
80
100
120
140
160
180
2.00
2.50
3.00
3.50
4.00
4.50
5.00
Jan-14 Apr-14 Jul-14 Oct-14 Jan-15 Apr-15 Jul-15 Oct-15
Geely Automobile - (LHS, HKD) Geely Automobile / Hang Seng Index - (RHS, %)
-1M -3M -12MAbsolute (%) 1 12 67
Relative to index (%) 3 6 80
Source: FactSet
FYE Dec (CNY m) FY13A FY14A FY15E FY16E FY17E
Revenue 28,708 21,738 28,962 35,619 40,950EBITDA 2,935 1,753 2,740 3,281 3,517Core net profit 2,663 1,431 2,539 2,959 3,092Core EPS (CNY) 0.37 0.16 0.29 0.34 0.35Core EPS growth (%) 30.5 (56.4) 77.5 16.6 4.5Net DPS (CNY) 0.04 0.02 0.03 0.04 0.04Core P/E (x) 9.3 21.3 12.0 10.3 9.8P/BV (x) 1.8 1.8 1.6 1.4 1.2Net dividend yield (%) 1.1 0.6 1.0 1.2 1.2ROAE (%) 18.4 8.6 13.8 14.2 13.2ROAA (%) 8.2 4.0 6.6 6.9 6.4EV/EBITDA (x) 5.6 7.3 7.9 6.4 5.2Net debt/equity (%) net cash net cash net cash net cash net cashConsensus net profit - - 2,542 3,326 3,734MKE vs. Consensus (%) - - (0.1) (11.0) (17.2)

January 3, 2016 19
Geely Automobile
Value Proposition
§ Geely is one of the largest privately owned auto companies in China. Has technology collaboration with Volvo Cars as both share the same parent, Zhejiang Geely.
§ To continue to focus on upgrading and expanding its small car portfolio and will introduce a new production platform (Compact Modular Architecture) with Volvo in 2016-17.
§ JV with US-listed Kandi Technologies to develop mini-EVs. Geely’s EV sales topped China’s NEV market in Nov 15.
§ As part of the Geely Blue initiatives, the company targets to achieve 90% of sales from EVs by 2020.
Geely is the 2rd largest privately owned automaker in China
Source: CAAM and Company
Price Drivers
Share price chart
Source: Company, Maybank Kim Eng
1. Geely’s unit sales fell 5.2% YoY in 2H11 after the auto stimulus programme expired.
2. Geely’s FY12 unit sales beat guidance by 5%. 3. Unit sales fell 29% in 1H14 due to company restructuring.
Also, exports slumped due to political and social instability in the Middle East and Eastern Europe.
4. One-off FX loss of CNY648m (45% of FY14 net profit) due to abrupt depreciation of Russian Rouble.
5. Geely’s sales rebounded in 3Q15 on strong sales of new model GC9 and purchase tax cut on small cars.
Financial Metrics
§ Sales recovered in 2015 after brand and network consolidation in 2014. Forecast sales to grow by 27%/17% in 2015/16 following cut in purchase tax for small cars.
§ Strong vehicle line up ahead. § High utilization rate and steady ASP improvement (via
product mix shift) kept gross margin at 18% amid fierce market competition.
§ Geely has a healthy balance sheet. It consistently generates FCF with net cash on hand since 2012.
Geely’s unit sales to grow at 16.9% CAGR over 2014-17E
Source: Company
Swing Factors
Upside
§ Continues to upgrade portfolio including introducing more SUVs. This would continue to drive sales.
§ A significant technology upgrade on its production and model pipeline after introduction of the CMA platform in 2016-17.
§ Geely targets 90% of sales from NEVs by 2020. Strong NEV sales would be another key catalyst for the stock.
Downside
§ Failure to rollout the CMA platform (jointly developed with Volvo) in 2017 will delay the product pipeline.
§ Sales contract more than expected in 2017 after the expiration of purchase tax cut at end-2017.
§ Margins may face short-term pressure in 2016 amid new models and CMA platform being ramped up.
SAIC, 22.9%
Changan, 14.7%
Dongfeng, 9.0% Great Wall,
8.7% BAIC, 7.0%
Geely, 6.2%
Chery, 5.7%
BYD, 5.1%
JAC, 4.0% FAW, 3.8%
Others, 13.0%
China passenger vehicle (Jan-Oct 15) makers by market share
20406080100120140160180200220
10.015.020.025.030.035.040.045.050.055.060.0
Dec-10 Dec-11 Dec-12 Dec-13 Dec-14
BYD Company - (LHS, HKD)
BYD Company / MSCI AC Asia ex JP - (RHS, %)
483 549 416 529 619 665
78.9% 84.9%
64.4%
82.0% 86.0% 83.6%
0%
20%
40%
60%
80%
100%
0
200
400
600
800
1,000
Unit sales utilization
Units ('000) Utilization Geely utilization remains at 80%+
1 2
3 5
4

January 3, 2016
Oil
& G
as
Chin
a/H
K
Howard Wong [email protected] (852) 2268 0648
Jessie Li [email protected] (852) 2268 0642
CNOOC (883 HK)
The best of its kind: Reiterate BUY
Reiterate BUY CNOOC offers the purest upstream exposure in the Chinese oil & gas sector. Over the past few quarters, the company has demonstrated its superiority in terms of cost and capex management, therefore despite the near-term oil weakness, CNOOC has outperformed its peer. And we believe this is still the best counter to capture our expected technical rebound in the oil market.
Darkness before dawn Global crude benchmarks are trading at below their GFC lows, and we believe nearly half of the global oil production fails to generate positive cash flows. Despite the near-term pessimism, we believe the drastic reduction in development and exploration capex will curb mid-term oil production, thus current valuations offer great long-term investment opportunities.
Technical rebound around the corner Despite its defensive nature, Sinopec has underperformed CNOOC and PetroChina on the back of near-term oil weakness. We believe this shows that Asian-dedicated funds have already cleared out their exposure in the Chinese oil & gas sector and hence a technical rebound will trigger a squeeze; CNOOC offers one of the best exposure, in our view.
Target price based on 15x normalized earnings We adopted 2017 forecasts as normalized earnings, based on the assumption that crude prices, the key earnings driver, should return to a long-term mid-cycle equilibrium. For consistency, we have applied 15x PER to the normalized earnings across the sector, which is in line with the global peers, ex-Russia.
Share Price HKD 8.07
12m Price Target HKD 11.34 (+41%)
Previous Price Target HKD 11.34
BUY
Company description
Statistics52w high/low (HKD)3m avg turnover (USDm)Free float (%)Issued shares (m)Market capitalisation
Major shareholders:64.4%1.1%1.0%
44,647
86.7
CNOOC engages in upstream operating activities ofthe conventional oil and gas, shale oil and gas, oilsands and other unconventional O&G business.
China State-Owned Assets Supervision & A The Vanguard Group, Inc. BlackRock Fund Advisors
13.42/7.44
35.6
HKD360.3BUSD46.5B
Price Performance
55
65
75
85
95
105
115
125
135
145
7.0
8.0
9.0
10.0
11.0
12.0
13.0
14.0
15.0
16.0
Jan-14 Apr-14 Jul-14 Oct-14 Jan-15 Apr-15 Jul-15 Oct-15
CNOOC - (LHS, HKD) CNOOC / Hang Seng Index - (RHS, %)
-1M -3M -12MAbsolute (%) (9) 2 (23)
Relative to index (%) (7) (3) (17)
Source: FactSet
FYE Dec (CNY m) FY13A FY14A FY15E FY16E FY17E
Revenue 285,857 274,634 195,449 198,285 224,908EBITDA 134,959 139,201 96,322 97,428 115,425Core net profit 56,461 60,199 19,410 16,442 27,616Core FDEPS (CNY) 1.26 1.35 0.43 0.37 0.62Core FDEPS growth(%) (11.3) 6.7 (67.8) (15.3) 68.0Net DPS (CNY) 0.45 0.32 0.32 0.28 0.31Core FD P/E (x) 5.4 5.0 15.6 18.4 11.0P/BV (x) 0.9 0.8 0.8 0.8 0.8Net dividend yield (%) 6.7 4.7 4.8 4.1 4.6ROAE (%) 17.3 16.7 5.1 4.3 7.0ROAA (%) 10.5 9.4 3.0 2.6 4.4EV/EBITDA (x) 4.0 3.0 3.9 4.1 3.2Net debt/equity (%) 11.8 11.8 19.9 25.3 16.3Consensus net profit - - 20,715 24,030 35,320MKE vs. Consensus (%) - - (6.3) (31.6) (21.8)

January 3, 2016 21
CNOOC
Value Proposition
§ CNOOC is the largest offshore exploration & production company in China, with daily production > 1.3M BOE; but smallest among the 3 state producers.
§ Like others, CNOOC is going through a very challenging macro environment, but it has displayed superb cost and capex management.
§ Superior cash flow management should allow CNOOC to benefit from the upcoming industry consolidation and expand its assets base.
§ Return of Mr. Yang Hua as chairman of board and Non-Executive Director is also a positive.
§ We expect CNOOC to generate excess return on capital under normalized earnings scenario.
Lifting cost vs. CAPEX
Source: Maybank Kim Eng
Price Drivers
Historical share price trend
Source: Company, Maybank Kim Eng
1. CNOOC experienced a major well spill in Bohai bay,
management shuffle followed. 2. De-rating continued due to slippage of project
execution, underperformed its country benchmark and peer between 2012 and 2013.
3. Share price rebounded in 1H14 as company target to 15% volume, but rolled over with crude oil prices in 2H14.
4. Spike in 2Q15 was largely liquidity driven, share price faded again in 2H15 as oil dived below USD40/BBL.
5. Despite horrific absolute share price performance, CNOOC being an E&P outperformed its integrated peer due to superior cost and cash flow management.
Financial Metrics
§ The one key element that separates CNOOC from its peer is cash flow management; this is very well displayed in our free cash flow projection.
§ With crude price halved, CNOOC should still have been able to generate positive FCF in 2015 and should be largely neutral in 2016, before rebounding in 2017.
§ Strong balance sheet will allow CNOOC to be a beneficiary in the upcoming industry consolidation.
§ Against near-term pessimism, drastic reduction in E&P capex could curb mid-term oil production. CNOOC is best positioned for expected technical rebound in oil prices.
Free Cash Flow
(CNYm) 2014A 2015E 2016E 2017E Brent (USD/BBL) 99.45 55.00 52.50 60.00
PBT 82,513 27,795 23,545 39,546
DD&A 57,248 68,527 73,883 75,879
Others (29,253) (16,924) (27,816) (1,338)
Op.Cash flow 110,508 79,398 69,612 114,087
CAPEX (95,673) (70,000) (70,000) (72,500)
Free Cash flow 14,835 9,398 (388) 41,587
Source: Maybank Kim Eng
Swing Factors
Upside
§ Rebound in crude oil prices will the most dominant near-term stock driver.
§ Disposal of high cost & poor performing assets will serve as another potential positive.
§ Though unlikely in our view, but the rumour of potential acquisition by other state peer has caused spikes.
Downside
§ Further weakness in oil price will hurt absolute share performance.
§ Production mishap or well incident will cause adverse reaction.
§ Acquisition of non-core asset from parent will not be well received particularly at this point of industry cycle.
50,000
60,000
70,000
80,000
90,000
100,000
9.0
9.5
10.0
10.5
11.0
11.5
12.0
2014A 2015E 2016E
Lifting Cost (USD/BBL) Lifting Cost (USD/BBL)
CAPEX (RHS) CNYm
70
90
110
130
150
170
190
2.0
7.0
12.0
17.0
22.0
Jan 09 Jan 10 Jan 11 Jan 12 Jan 13 Jan 14 Jan 15 Jan 16
HKD CNOOC (LHS) CNOOC / MSCI China
1
2 3
5
4

January 3, 2016
Oil
& G
as
Chin
a/H
K
Howard Wong [email protected] (852) 2268 0648
Jessie Li [email protected] (852) 2268 0642
PetroChina (857 HK)
Negatives in the price: Upgrade to HOLD
Upgrade to HOLD, TP represents only 6% downside PetroChina is suffering from low crude prices, as the upstream segment is likely to report losses for 4Q15, on top of the potential assets write- down due to lower crude prices. However, we believe most of the negatives are already in the price, and therefore upgrade to HOLD.
W2E pipeline spin remains key catalyst The plan to spin-off its trunk pipeline has been announced since 2014, however, little details and execution plan have been disclosed. We believe this is still a key catalyst for PetroChina, as well as development of the natural gas industry in China. And since cash flow has dwindled under low crude prices, the exceptional gain will provide a relief.
High-beta play for the upcoming squeeze Half of the oil producers are struggling to generate positive cash flow, and we believe Asian-dedicated funds have significantly underweight the sector, and any technical rebound in the oil industry will trigger a squeeze in the China oil & gas sector. As PetroChina has duo leverage from oil and natural gas operations, we believe it can offer investors great trading opportunities.
Target price based on 15x normalized earnings We adopted 2017 forecasts as normalized earnings, based on the assumption that crude price, the key earnings driver, should return to a long-term mid-cycle equilibrium. For consistency, we have applied 15x PER to the normalized earnings across the sector, which is in line with the global peers, ex-Russia.
Share Price HKD 5.08
12m Price Target HKD 4.80 (-6%)
Previous Price Target HKD 4.80
HOLD
Statistics52w high/low (HKD)3m avg turnover (USDm)Free float (%)Issued shares (m)Market capitalisation
Major shareholders:7.9%4.4%3.7%
183,021
70.5
Aberdeen Asset Management (Asia) Ltd. Templeton Asset Management Ltd. (Hong Ko Aberdeen Asset Managers Ltd.
10.64/5.02
13.2
HKD929.7BUSD120.0B
Price Performance
60
70
80
90
100
110
120
130
5.0
6.0
7.0
8.0
9.0
10.0
11.0
12.0
Jan-14 Apr-14 Jul-14 Oct-14 Jan-15 Apr-15 Jul-15 Oct-15
PetroChina - (LHS, HKD) PetroChina / Hang Seng Index - (RHS, %)
-1M -3M -12MAbsolute (%) (10) (5) (41)
Relative to index (%) (8) (10) (36)
Source: FactSet
FYE Dec (CNY m) FY13A FY14A FY15E FY16E FY17E
Revenue 2,258,124 2,282,962 1,532,090 1,534,240 1,787,260EBITDA 352,007 347,296 253,672 244,159 297,723Core net profit 129,599 107,172 33,618 19,616 48,137Core EPS (CNY) 0.71 0.59 0.18 0.11 0.26Core EPS growth (%) 12.4 (17.3) (68.6) (41.6) 145.4Net DPS (CNY) 0.32 0.10 0.08 0.05 0.12Core P/E (x) 6.0 7.3 23.2 39.7 16.2P/BV (x) 0.7 0.7 0.7 0.6 0.6Net dividend yield (%) 7.5 2.3 1.9 1.1 2.8ROAE (%) 11.8 9.3 2.8 1.6 4.0ROAA (%) 5.7 4.5 1.4 0.8 1.9EV/EBITDA (x) 5.3 5.6 6.3 6.9 5.9Net debt/equity (%) 38.7 39.4 50.2 56.9 62.9Consensus net profit - - 46,446 52,950 90,409MKE vs. Consensus (%) - - (27.6) (63.0) (46.8)

January 3, 2016 23
Petrochina
Value Proposition
§ PetroChina is the largest integrated oil and gas company in China with daily production of ~4.0M BOE; the company is also the largest natural gas distributor in China.
§ Like others, PetroChina is going through a very challenging macro environment, as most of its onshore oil assets are mature, and opex is high with limited flexibility.
§ State Council proposal to restructure all pipeline assets, which includes PetroChina’s W2E pipeline; the disposal will be a catalyst and a boost to its tight cash flow.
§ Its downstream assets are not as competitive as Sinopec’s, a drag to its return profile, thus we expect it to only cover cost on capital under normalized earnings scenario.
Breakdown of Profit/(Loss) by segment – in CNY mil
Source: Company o
Price Drivers
Historical share price trend
Source: Company, Maybank Kim Eng
1. PetroChina has been a benchmark performer post GFC,
hovering along with crude prices. 2. Natural gas industry reform plan and potential spin-off of
West-2-East pipeline assets fuelled re-rating in 1H14. 3. Share price pulled back along with crude price, weakness
continued after OPEC refused to cut production in Nov 14.
4. Spike in 2Q15 was largely liquidity driven, share price faded again in 2H15 as oil dived below USD40/BBL.
5. Valuation surpassed GFC low, as concerns of poor earnings and asset write off continues to suppress stock.
Financial Metrics
§ PetroChina is entering a rough patch, with low crude prices, high variable upstream cost and marginal downstream assets, cash flow dwindling.
§ Fortunately, PetorChina’s gearing is still below global industry average, plus its sovereign status credit rating, room for bank and bond financing is still abundant.
§ As earnings and cash flow are already extremely depressed, PetroChina will offer the highest leverage to any technical rebound in oil prices.
Free cash flow
(CNYm) 2014A 2015E 2016E 2017E
Brent (USD/BBL) 99.45 55.00 52.50 60.00
PBT 178,482 72,732 59,267 106,369
DD&A 177,463 187,638 191,938 199,608
Others 532 (74,960) (4,080) (10,883)
Op.Cash flow 356,477 185,411 247,125 295,094
CAPEX (291,729) (262,556) (275,684) (303,252)
Free Cash flow 64,748 (77,145) (28,559) (8,158)
Source: Company
Swing Factors
Upside
§ Rebound in crude oil prices will be the most dominant near-term stock driver.
§ Disposal of West-2-East trunk pipeline assets will be a catalyst.
§ A less than expected reduction in natural gas prices will serve as a potential positive.
Downside
§ Further weakness in oil price will hurt absolute share price performance.
§ Production mishap or well incident will have adverse reaction.
§ Acquisition of non-core asset from parent will not be well received particularly at this point of industry cycle.
-50,000
0
50,000
100,000
150,000
200,000
250,000
2014 2015 2016 2017
E&P Refining & Chemicals Marketing Natural Gas & Pipeline
60
70
80
90
100
110
120
4
6
8
10
12
14
Jan 09 Jan 10 Jan 11 Jan 12 Jan 13 Jan 14 Jan 15 Jan 16
HKD PetroChina (LHS) PetroChina / MSCI China
1
2
3
5
4


January 3, 2016
STRA
TEG
Y In
dia
India’s Three-for-16
Cherry Picks for a Challenging Year
Three themes – wind energy, cinema and digital We are overweight on each of these themes because of: a) scalability of demand; b) significant entry barriers; and c) reasonable valuations. Rising footfalls into cinema theatres, coupled with increased spending on F&B and sponsorships, make cinema chains a multi-year cash-generating machine. We like the wind energy theme because the capacity of wind turbines in India is widely estimated to rise 3x in five years. We expect digital technologies such as cloud, big data, analytics and mobility to drive a paradigm shift for Indian software companies. Some of them are at an inflection stage to gain from large, multi-year deals to deploy digital technologies for global corporations.
Multiplex cinema to boom; India is under screened India makes 1200 movies in a year despite which its annual box-office collection is a meagre USD2b (1/5th of US and 1/3rd of China). This is due to its old cinemas with poor infrastructure, and outdated sound and picture projection. However, this is changing due to emergence of multiplexes that offer a better experience. The footfalls into multiplexes are rising and so are ticket prices and F&B, creating a large business opportunity for the organized multiplex chains. We like INOL, the second largest multiplex chain in the country with 8% of box-office. We expect it to increase earnings by 115% pa for the next three years. The stock is trading at an EBITDA of 10x FY17F, a 9% discount to market leader PVR.
Wind energy – Indian market to triple in five years The catalyst for wind turbine demand in India is the friendly policies of the government and private sector recognition of wind power as an attractive asset class for investment. The government is targeting wind power installation of 5-6 GW pa over the next five years vs current total installed capacity of 2 GW. This is being driven by state and central government tax incentives, lesser gestation in setting up wind turbine vs conventional power plants and attractive ROI of 14% even if no incentives are taken into account. INXW is our top pick in the wind energy sector due to its rising market share, stronger financials vs peers and execution track record. Our TP of INR538 implies 49% upside.
Digital - the next inflection point for Indian software Indian software companies are embracing digital rapidly, which now accounts for 10-30% of their revenue and growing at 25% pa. We expect inflection in this over the next two years, driven by engagements with large independent software vendors, transformational deals and re-skilling of employees. Within our coverage Infosys and Persistent stand out due to their clear strategy on digital and rising engagements.
Anubhav Gupta (91) 6623 2605 [email protected] Neerav Dalal (91) 6623 2606 [email protected] Vikram Ramalingam (91) 6623 2609 [email protected]
Analysts Jigar Shah (91) 6623 2632 [email protected]
FY16F FY17F FY16F FY17FINOX Leisure Ltd INOL 341 236 331 40% BUY 32.7 18.8 3.0 2.6INOX Wind Ltd INXW 1141 344 535 56% BUY 14.4 11.6 4.0 3.0Infosys INFO 36150 1053 1300 23% BUY 17.8 15.5 3.9 3.4Persistent PSYS 802 670 770 15% BUY 17.6 14.0 3.4 2.9
P/E (x) P/B(x)Company
Bloom Ticker
Mcap (USDm) Reco
TP (INR)
CMP (INR) Upside(%)
538 49%

January 3, 2016 26
India’s Three-for-16
1. Inox Leisure Ltd.
1.1 Attractive valuation; re-rating imminent BUY with TP of INR331. We believe INOL’s rising ROE, healthy net D/E of 0.3x, growing contribution from in-cinema advertising, and high spending on F&B justify a re-rating. INOL is trading at 7.5x EBITDA of our FY17 forecast, 17% below its peers. We value the stock at 10x EBITDA, a 9% discount to market leader PVRL (EV/EBITDA of 11x).
1.2 Surge in footfall led by successful movies Following a weak FY15, the Indian film industry is showing considerable improvement in FY16. In 1H16, the industry recorded the best-ever box-office performance with footfall increasing 33% YoY to 29m. The unprecedented success of ‘Baahubali’ and ‘Bajrangi Bhaijaan,’ which grossed INR4.6b and INR6b respectively, has helped fuel this improvement. Given the impressive pipeline of movies from the Indian film industry, including regional and Hollywood films for FY16 and FY17, we expect more blockbusters that will boost footfall in multiplexes. We forecast INOL’s footfall to improve to 68m in FY17 from 41m in FY15.
1.3 Second-largest multiplex chain in India INOL operates 402 screens across 17 states and 55 cities in India. It accounts for 8% of domestic box-office collections in the industry. However, with only nine screens per million people vs 25 in China, India is highly ‘under-screened’. We forecast the company will increase its screen count to 512 by FY18 by adding 63 screens in FY16, 40 screens in FY17 and 37 screens in FY18.
1.4 Catalysts: ancillary income and margin uptick Contribution of ancillary income sources such as F&B and advertising to total income increased from 21% in FY11 to 27% in FY15. We forecast this contribution to rise to 29% of income in FY17. We forecast INOL’s EBITDA margin to rise by 377bps to almost 17% in FY17 from 13% in FY15, supported by: a) 42% increase in advertising in FY16 and FY17 each; and b) increase in F&B income of 60% in FY16 and 25% in FY17.

January 3, 2016 27
India’s Three-for-16
2. Inox Wind Ltd
2.1 Best play on wind energy boom Maintain BUY on this leading wind turbine generator producer with a TP of INR538. We forecast INXW's market share to rise to 30% in FY18 from 25% currently, supported by rising backlog, new products, and increased capacity. India's wind energy market should rise at a 20% CAGR for the next five years due to government initiatives, restoration of fiscal incentives, and entry of large investors due to the attractive ROI (14% project IRR ex-incentives). Also, the shares are trading at a 37% discount to the global average PER.
2.2 Bullish on gov’t thrust, INXW execution abilities The government targets to almost treble India’s wind power capacity to 60GW by 2022. This will increase annual market size to 5-6GW from 2.3GW currently. Attractiveness of the wind power market has increased due to the entry of large organised investors and increased efficiencies offered by new turbines. INXW is the leading supplier of wind turbines in India because of its turnkey abilities, integrated manufacturing facilities, healthy balance sheet, and access to wind sites in seven states.
2.3 Net profit growth to average 57% YoY through FY18 We forecast average EPS growth of 57% YoY in FY16-18 for INOX, supported by a rising backlog and margin expansion from operating leverage. Backlog of 1,202 MW provides strong revenue visibility through FY18.
2.4 Attractive valuations makes compelling BUY INXW's PER of 11.7x FY17F is at a significant discount to its peers – Gamesa (21x), Vestas (20x), and Nordex (22x). This is unjustified given strong EPS growth, solid FCF of INR3.8b, and 29% ROE in FY16-18. Also, we forecast INXW's balance sheet will be net cash by FY18. In the past investors were concerned about the sector’s growth potential during FY12-15, but recent government initiatives should allay concerns, leading to a rerating of INXW. Our TP of INR538 is based on 18x FY17F PER (in line with the global average).

January 3, 2016 28
India’s Three-for-16
3. Overweight on Indian IT sector
3.1 Digital technologies to account for 80% of new spends Industry reports suggest that by 2020 spending towards digital technologies will account for 35% of the total IT spending by enterprises, up from 10% in 2014. The digital spending will be funded partly from savings in the traditional maintenance spending and partly new spending. It is expected to account for 80% of the incremental IT spending, reaching USD1.2t by 2020 from USD275b for 2014, growing at more than 25% pa.
3.2 Digital could add 300-400bps to revenue growth Currently about 12-37% of revenue for various Indian IT companies comes from digital technologies. We strongly believe Indian IT companies are gearing up well for digital through re-skilling employees, developing products and platforms, and filling gaps in offerings through acquisitions. We believe digital has the potential to add 300-400bps to the industry growth in a steady state. As digital services are premium priced and as automation levers start kicking in we expect margins can improve by 100-200bps.
3.3 FY17 to witness faster growth 1HFY16 showed a marked improvement in revenue performance vs a weaker-than-expected 2HFY15, driven by a rebound in banking, financial services and insurance (BFSI) and healthcare verticals. Going forward, we believe 3Q will be seasonally weak due to fewer working days and higher furloughs impacting volume growth. We expect growth rates to recover in 4Q and a faster revenue increase in FY17, backed by: a) finalization of IT budgets for CY16; b) pick up in digital spending; and c) further large deal wins. We forecast FY17 revenue growth for our coverage universe to improve to 12% from 8% in FY16F.
3.4 Base growth rates to sustain at 12-14% We expect BFSI to contribute close to 35% of growth for the sector, driven by cost pressure, simplification, digitalization and governance, and risk and compliance, followed by manufacturing of 25%, driven by new technologies of Internet of Things, analytics and 3D printing, and engineering and R&D, and retail at 15% driven by omni-channel, analytics, digital marketing, and ERP rollouts. The other sectors like healthcare and energy & utilities, and telecom will contribute the remaining 25% of the growth. We do not find any reason to believe why the revenue growth for the sector will not sustain at 12-14% on a constant currency basis.
3.5 Risks: Visa restrictions & currency volatility Temporary work visas in the US (H-1B and L1) form an integral part of the business model of IT services companies in India. A couple of bills have been introduced in the US Senate recently restricting the use of visas as well as reducing the number of visas allotted. As the US elections near, we expect the noise against outsourcing to intensify. However, technology-related unemployment in the US remains at less than 4% and none of the restriction bills have been cleared.
The strengthening of USD against other currencies like Eur/USD/AUD has an adverse impact. On average, 20-35% of revenue is non-USD, which is impacted by cross currency headwinds. Though companies have hedges to partially minimise the impact, the impact will continue.

January 3, 2016 29
India’s Three-for-16
3.6 Current valuations attractive We expect the sector to trade at 17-18x PER as its long-term average multiple. We believe the current multiple of 15x looks attractive considering: a) the scope for upgrade from digital; and b) strong balance sheet and return ratios. We see strong cash flow generation (80%+ OCF/NP), and high return ratios (20%+ ROI) We expect return ratios to sustain as companies effectively allocate capital towards acquisitions and dividends. We see scope for upgrades to our forecasts from faster-than-expected growth in digital services, possible acquisitions, and further weakening of USD vs. INR.
3.7 Prefer INFO and PSYS We prefer INFO due to its clear strategy towards digital enablement through training, acquisitions and strong consulting practice and PSYS, which is ahead of the curve with more than 50% of its revenue coming from new technologies. Overall, we believe 2016-17 will be transition years for a bigger push in from 2018 onwards. We also like TECHM (PER of 14x FY17F) and KPIT (PER of 11x FY17F) due attractive valuations.

January 3, 2016
Indu
stri
als
Indi
a
Anubhav Gupta [email protected] (91) 22 6623 2605
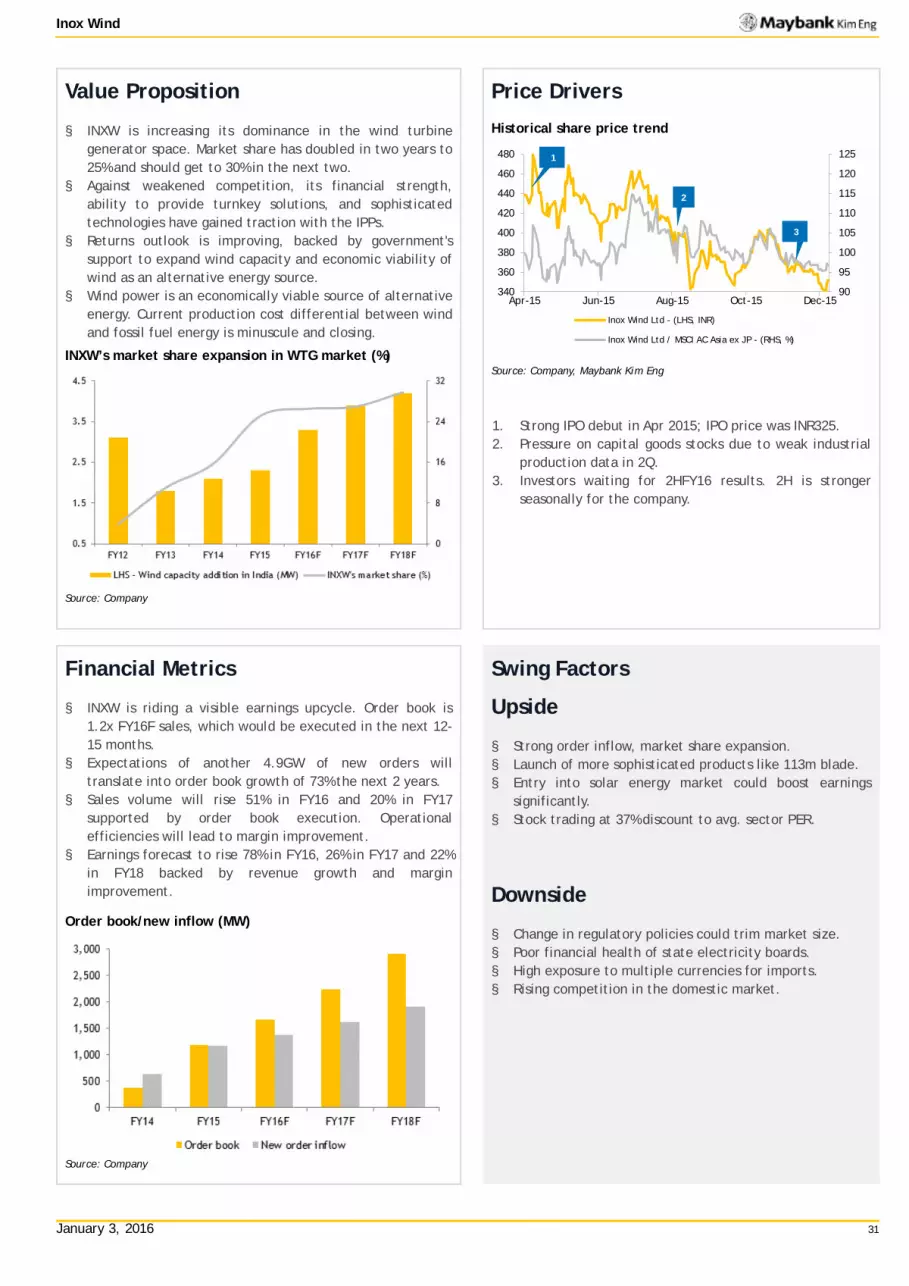
Inox Wind (INXW IN)
Powerful winds…
Best play on wind energy boom Initiate BUY on this leading wind turbine generator producer with TP of INR538. We forecast that INXW's market share will rise to 30% in FY18 from current 25%, supported by rising backlog, new products, and increased capacity. India's wind energy market should rise at a 20% CAGR for the next 5 years due to government initiatives, restoration of fiscal incentives, and entry of large investors due to the attractive return on investment (14% project IRR ex-incentives). We forecast net profit growth to average 57% YoY during FY16-18 for INOX supported by a rising backlog, and margin expansion from operating leverage. Also, the shares are trading at a 37% discount to the global avg. PER.
Bullish on gov’t thrust, INXW execution abilities The government targets to almost treble India’s wind power capacity to 60GW by 2022. This will increase annual market size to 4-5GW from current 2.3GW. Attractiveness of the wind power market has increased due to the entry of large organized investors and increased efficiencies offered by new turbines. INXW is the leading supplier of wind turbines in India because of its turnkey abilities, integrated manufacturing facilities, healthy balance sheet, and access to wind sites in seven states.
Net profit growth to average 57% YoY through FY18 We forecast avg. EPS growth of 57% YoY in FY16-18 for INOX supported by a rising backlog and margin expansion from oper. leverage. Backlog of 1,202 MW provides strong revenue visibility through FY18.
Attractive valuation makes compelling BUY INXW's PER of 11.7x FY17F is at significant discount to its peers - Gamesa (21x), Vestas (20x), and Nordex (22x). This is unjustified given strong EPS growth, solid FCF of INR3.8b, and 29% ROE in FY16-18. Also, we forecast INXW's balance sheet will be net cash by FY18. In the past investors were concerned over the sector’s growth potential during FY12-15, but recent gov’t initiatives should allay concerns, leading to a rerating of INXW. We initiate with TP of INR538, based on a PER of 18x FY17F (in line with global avg).
Share Price INR 360
12m Price Target INR 538 (+49%)
BUY
Price Performance
85
90
95
100
105
110
115
120
340
360
380
400
420
440
460
480
Apr-15 Jun-15 Aug-15 Oct-15 Dec-15
Inox Wind - (LHS, INR) Inox Wind / BSE SENSEX 30 Index - (RHS, %)
-1M -3M -12MAbsolute (%) (1) 0 na
Relative to index (%) (1) 1 na
Source: FactSet
FYE Mar (INR m) FY14A FY15A FY16E FY17E FY18E
Revenue 15,668 27,099 48,921 58,493 69,095EBITDA 1,763 4,259 7,742 9,360 11,259Core net profit 1,323 2,964 5,281 6,631 8,070Core EPS (INR) 7 13 24 30 36Core EPS growth (%) (82.4) 102.0 78.2 25.6 21.7Net DPS (INR) 0 0 0 0 0Core P/E (x) 54.4 26.9 15.1 12.0 9.9P/BV (x) 16.8 5.7 4.2 3.1 2.4Net dividend yield (%) 0.0 0.0 0.0 0.0 0.0ROAE (%) 36.6 32.6 31.9 29.5 27.0ROAA (%) 10.9 12.6 14.3 14.4 14.4EV/EBITDA (x) na na 10.6 8.6 6.9Net debt/equity (%) 100.8 9.7 12.3 1.6 net cashConsensus net profit - - 4,960 6,316 7,958MKE vs. Consensus (%) - - 6.5 5.0 1.4
Company description
Statistics 52w high/low (INR) 3m avg turnover (USDm) Free float (%) Issued shares (m) Market capitalisation
Major shareholders: 63.1% 1.8% 1.0%
222
1.1
Inox Wind makes WTG & equipment. It provides turnkey solutions for wind projects - Land Sourcing, Installation & commissioning of wind power
Gujarat Fluorochemicals Ltd. Reliance Equity Opportunities Fund. Goldman Sachs India Fund.
480/325
14.4
INR78.1B USD1.2B
January 3, 2016 31
Inox Wind
Value Proposition
§ INXW is increasing its dominance in the wind turbine generator space. Market share has doubled in two years to 25% and should get to 30% in the next two.
§ Against weakened competition, its financial strength, ability to provide turnkey solutions, and sophisticated technologies have gained traction with the IPPs.
§ Returns outlook is improving, backed by government's support to expand wind capacity and economic viability of wind as an alternative energy source.
§ Wind power is an economically viable source of alternative energy. Current production cost differential between wind and fossil fuel energy is minuscule and closing.
INXW’s market share expansion in WTG market (%)
Source: Company
Price Drivers
Historical share price trend
Source: Company, Maybank Kim Eng
1. Strong IPO debut in Apr 2015; IPO price was INR325. 2. Pressure on capital goods stocks due to weak industrial
production data in 2Q. 3. Investors waiting for 2HFY16 results. 2H is stronger
seasonally for the company.
Financial Metrics
§ INXW is riding a visible earnings upcycle. Order book is 1.2x FY16F sales, which would be executed in the next 12-15 months.
§ Expectations of another 4.9GW of new orders will translate into order book growth of 73% the next 2 years.
§ Sales volume will rise 51% in FY16 and 20% in FY17 supported by order book execution. Operational efficiencies will lead to margin improvement.
§ Earnings forecast to rise 78% in FY16, 26% in FY17 and 22% in FY18 backed by revenue growth and margin improvement.
Order book/new inflow (MW)
Source: Company
Swing Factors
Upside
§ Strong order inflow, market share expansion. § Launch of more sophisticated products like 113m blade. § Entry into solar energy market could boost earnings
significantly. § Stock trading at 37% discount to avg. sector PER.
Downside
§ Change in regulatory policies could trim market size. § Poor financial health of state electricity boards. § High exposure to multiple currencies for imports. § Rising competition in the domestic market.
90
95
100
105
110
115
120
125
340
360
380
400
420
440
460
480
Apr-15 Jun-15 Aug-15 Oct-15 Dec-15
Inox Wind Ltd - (LHS, INR)
Inox Wind Ltd / MSCI AC Asia ex JP - (RHS, %)
1
2
3

January 3, 2016
Cons
umer
Dis
c.
Indi
a
Jigar Shah [email protected] (91) 22 6623 2632 32
Vikram Ramalingam [email protected] (91) 22 6623 2609
Inox Leisure (INOL IN)
Exhibiting success
Attractive valuation; rerating imminent Initiate at BUY with PT of INR331. We believe INOL’s rising ROE, healthy net D/E of 0.3x, growing contribution from in-cinema advertising, and high spending on food and beverages (F&B) justify a re-rating. INOL trades at an EBITDA multiple of 7.5x for our FY17 forecasts, 17% below its peers. We value the stock at EBITDA multiple of 10x at 9% discount to market leader PVRL (EV/EBITDA of 11x).
Surge in footfall led by successful movies Following a weak FY15, the Indian film industry is showing considerable improvement in FY16. In 1HFY16, the industry recorded the best ever box-office performance with footfall increasing 33% YoY to 29m. The unprecedented success of ‘Baahubali’ and ‘Bajrangi Bhaijaan,’ which grossed INR4.6b and INR6b respectively, has helped fuel this improvement. Given the impressive pipeline of movies from the Indian film industry (see pg. 34), including regional and Hollywood films for FY16 and FY17, we expect more blockbusters that will boost footfall in multiplexes. We forecast INOL’s footfall will improve to 68m in FY17 from 41m in FY15.
Second-largest multiplex chain in India INOL operates 402 screens across 17 states and 55 cities in India. It accounts for 8% of domestic box office collections in the industry. However, with only nine screens per million people vs. 25 in China, India is highly under-screened. We forecast the company will increase its screen count to 512 by FY18 by adding 63 screens in FY16, 40 screens in FY17 and 37 screens in FY18.
Catalysts: ancillary income and margin uptick Contribution of ancillary income sources such as F&B and advertising to total income increased from 21% in FY11 to 27% in FY15. We forecast this contribution will rise to 29% of income in FY17. We forecast INOL will increase its EBITDA margin by 377bp to 17% in FY17 from 13% in FY15, supported by a) 42% increase in advertising in FY16 and FY17 each and b) increase in F&B income of 60% in FY16 and 25% in FY17.
Share Price INR 239
12m Price Target INR 331 (+38%)
BUY
Price Performance
60
80
100
120
140
160
180
200
220
240
260
80
100
120
140
160
180
200
220
240
260
280
Jan-14 Apr-14 Jul-14 Oct-14 Jan-15 Apr-15 Jul-15 Oct-15
Inox Leisure - (LHS, INR) Inox Leisure / BSE SENSEX 30 Index - (RHS, %)
-1M -3M -12MAbsolute (%) (3) 1 33
Relative to index (%) (3) 1 40
Source: FactSet
FYE Mar (INR m) FY14A FY15A FY16E FY17E FY18E
Revenue 8,688 10,168 15,349 18,643 21,503EBITDA 1,309 1,310 2,214 3,106 3,686Core net profit 369 200 693 1,209 1,509Core EPS (INR) 4 2 7 13 16Core EPS growth (%) 100.2 (45.8) 245.9 74.3 24.8Net DPS (INR) 0 0 0 0 0Core P/E (x) 62.2 114.6 33.1 19.0 15.2P/BV (x) 5.9 3.4 3.1 2.7 2.3Net dividend yield (%) 0.0 0.0 0.0 0.0 0.0ROAE (%) 10.3 3.8 9.8 15.0 16.0ROAA (%) 4.4 2.0 5.8 9.1 10.3EV/EBITDA (x) 10.1 14.1 11.3 7.7 6.0Net debt/equity (%) 57.0 32.7 28.5 10.7 net cashConsensus net profit - - 743 1,023 1,367MKE vs. Consensus (%) - - (6.7) 18.2 10.4
Gross box office (GBO) 69%
Food and Beverages
(F&B) 20%
Advertising 6%
Other revenue
5%
Revenue mix in 1HFY16
Company description
Statistics 52w high/low (INR) 3m avg turnover (USDm) Free float (%) Issued shares (m) Market capitalisation
Major shareholders: 48.1% 4.7% 4.5%
96
1.3
Inox Leisure Ltd. is engaged in the business of operating and managing multiplexes and cinema theatres in India.
Gujarat Fluorochemicals Ltd. Kuwait Investment Authority Inox Benefit Trust
269/146
41.1
INR22.7B USD340M
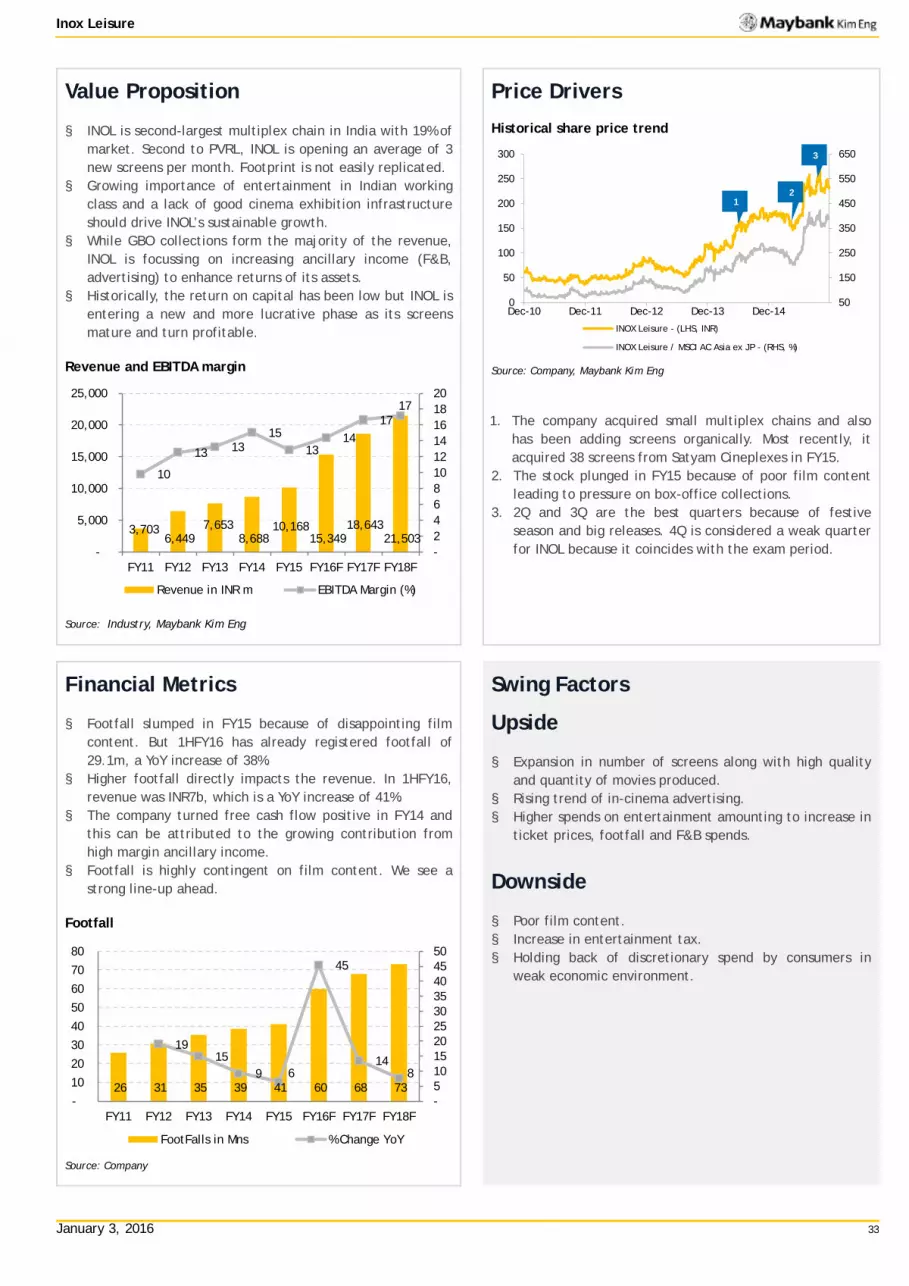
January 3, 2016 33
Inox Leisure
Value Proposition
§ INOL is second-largest multiplex chain in India with 19% of market. Second to PVRL, INOL is opening an average of 3 new screens per month. Footprint is not easily replicated.
§ Growing importance of entertainment in Indian working class and a lack of good cinema exhibition infrastructure should drive INOL’s sustainable growth.
§ While GBO collections form the majority of the revenue, INOL is focussing on increasing ancillary income (F&B, advertising) to enhance returns of its assets.
§ Historically, the return on capital has been low but INOL is entering a new and more lucrative phase as its screens mature and turn profitable.
Revenue and EBITDA margin
Source: Industry, Maybank Kim Eng
Price Drivers
Historical share price trend
Source: Company, Maybank Kim Eng
1. The company acquired small multiplex chains and also
has been adding screens organically. Most recently, it acquired 38 screens from Satyam Cineplexes in FY15.
2. The stock plunged in FY15 because of poor film content leading to pressure on box-office collections.
3. 2Q and 3Q are the best quarters because of festive season and big releases. 4Q is considered a weak quarter for INOL because it coincides with the exam period.
Financial Metrics
§ Footfall slumped in FY15 because of disappointing film content. But 1HFY16 has already registered footfall of 29.1m, a YoY increase of 38%.
§ Higher footfall directly impacts the revenue. In 1HFY16, revenue was INR7b, which is a YoY increase of 41%.
§ The company turned free cash flow positive in FY14 and this can be attributed to the growing contribution from high margin ancillary income.
§ Footfall is highly contingent on film content. We see a strong line-up ahead.
Footfall
Source: Company
Swing Factors
Upside
§ Expansion in number of screens along with high quality and quantity of movies produced.
§ Rising trend of in-cinema advertising. § Higher spends on entertainment amounting to increase in
ticket prices, footfall and F&B spends.
Downside
§ Poor film content. § Increase in entertainment tax. § Holding back of discretionary spend by consumers in
weak economic environment.
3,703 6,449
7,653 8,688
10,168 15,349
18,643 21,503
10
13 13 15
13 14
17 17
- 2 4 6 8 10 12 14 16 18 20
-
5,000
10,000
15,000
20,000
25,000
FY11 FY12 FY13 FY14 FY15 FY16F FY17F FY18F
Revenue in INR m EBITDA Margin (%)
50
150
250
350
450
550
650
0
50
100
150
200
250
300
Dec-10 Dec-11 Dec-12 Dec-13 Dec-14
INOX Leisure - (LHS, INR)
INOX Leisure / MSCI AC Asia ex JP - (RHS, %)
26 31 35 39 41 60 68 73
19 15
9 6
45
14 8
- 5 10 15 20 25 30 35 40 45 50
-
10
20
30
40
50
60
70
80
FY11 FY12 FY13 FY14 FY15 FY16F FY17F FY18F
FootFalls in Mns % Change YoY
1 2
3

January 3, 2016
Tech
nolo
gy
Indi
a
One year forward PER chart
Source: KESI, Bloomberg
Neerav Dalal [email protected] (91) 22 6623 2606
Infosys (INFO IN)
Back with rigour
Reiterate BUY on improving business outlook We believe INFO is taking positive steps that should help it to outperform peers, such as large deal wins and acquisitions. Near-term, we forecast the company to match industry growth in 4Q. Key catalysts are large deal wins M&A supported by cash of USD4.8b, and consulting business driving digital services and platforms. We maintain BUY with a revised TP of INR1,350 by upgrading multiple to 20x FY17F EPS, which is inline with its five year average PER of 20x.
Revenue momentum picking up INFO has outperformed peers in 1HFY16 with QoQ revenue growth of 6.2% (over 2HFY15) vs. the 3.2% average of Indian large cap peers and 3.9% for the Industry. Although 3Q will be seasonally weak, we expect the underlying growth momentum to continue. INFO is witnessing multiple levers playing out, such as growth in top clients and increase in revenue per client, and large deal wins (USD2.3b in LTM).
Better placed to gain from discretionary spending INFO leads its Indian peers in the consulting space by offering clients ways to save on maintenance spending so they can invest more in discretionary/digital/SMAC. In the upcoming budget cycle, we believe discretionary spending will increase as clients look at adopting newer technologies. With a very strong consulting practice, INFO is well placed to gain from the uptick in discretionary spending. INFO has enabled the product play with its Edge suite of offerings, digital enabled Finacle, automation through the launch of platforms (IIP, IAP), and acquisitions. We believe all this bodes well and should set the stage for consistent growth.
Attractive valuations We believe INFO's transformation is picking up pace. We forecast a revenue CAGR of 11.2% over FY15-18F vs. 7.6% over FY12-15F, and EBIT margin steadily improving by 80bps to 26.8%. At 15x FY17F EPS, we believe INFO is attractively priced. We maintain BUY with TP of INR1,350 at 20x FY17F EPS, inline with its five year average PER of 20x.
Share Price INR 1,103
12m Price Target INR 1,350 (+22%)
Previous Price Target INR 1,300
BUY
Price Performance
40
50
60
70
80
90
100
110
500
600
700
800
900
1,000
1,100
1,200
Jan-14 Apr-14 Jul-14 Oct-14 Jan-15 Apr-15 Jul-15 Oct-15
Infosys - (LHS, INR) Infosys / BSE SENSEX 30 Index - (RHS, %)
-1M -3M -12MAbsolute (%) 2 (6) 12
Relative to index (%) 2 (6) 17
Source: FactSet
FYE Mar (INR m) FY14A FY15A FY16E FY17E FY18E
Revenue 501,330 533,190 611,490 679,863 765,704EBITDA 136,340 149,000 170,703 196,509 222,818Core net profit 108,668 123,290 134,548 155,158 176,873Core EPS (INR) 48 54 59 68 77Core EPS growth (%) 15.3 12.9 9.1 15.3 14.0Net DPS (INR) 16 22 24 27 31Core P/E (x) 23.2 20.6 18.8 16.3 14.3P/BV (x) 5.3 4.6 4.1 3.6 3.2Net dividend yield (%) 1.4 2.0 2.2 2.4 2.8ROAE (%) 24.9 24.1 23.2 23.6 23.7ROAA (%) 21.1 20.0 19.1 19.4 19.6EV/EBITDA (x) 11.5 14.9 12.7 10.7 9.1Net debt/equity (%) net cash net cash net cash net cash net cashConsensus net profit - - 131,991 149,343 170,383MKE vs. Consensus (%) - - 1.9 3.9 3.8
Company description
Statistics 52w high/low (INR) 3m avg turnover (USDm) Free float (%) Issued shares (m) Market capitalisation
Major shareholders: 5.5% 2.6% 2.4%
2,297
57.2
Infosys Ltd, founded by seven technocrats, is a consulting, technology & outsourcing company. It is second largest India listed IT services company.
Life Insurance Corp. of India OppenheimerFunds, Inc. Abu Dhabi Investment Authority
1,181/937
86.8
INR2,533.9B USD38.3B

January 3, 2016 35
Infosys
Value Proposition
§ INFO is the 2nd largest Indian IT company with strong competencies in consulting, and a formidable presence in banking, manufacturing, and retail industries.
§ To overcome the industry’s shift away from a pure cost arbitrage model, INFO will focus more on consulting, and products & platforms to capture a larger share of rising IT discretionary spending.
§ INFO’s strategy of targeting large deals and focus on client mining will enable stable growth in traditional services, which still account for 62% of revenue.
INFO’s revenue growth outlook vs peers
Source: Company
Price Drivers
Historical share price trend
Source: Company, Maybank Kim Eng
1. INFO launches Infosys 3.0 strategy ahead of schedule,
focusing on new technologies. 2. Mr Narayana Murthy returns as Executive Chairman post
failure of INFO’s 3.0 strategy. 3. Mr Vishal Sikka appointed as CEO; Mr Narayana Murthy
steps down as Executive Chairman. 4. INFO reports strongest QoQ growth amongst large cap IT
companies for 1QFY16. 5. Management disclosed that seasonal weakness in 3Q15
was more serious than earlier anticipated.
Financial Metrics
§ We forecast USD revenue growth of 11.2% over FY15-18F vs. 7.2% for FY12-15 driven by client mining and large deal signings.
§ We forecast EBIT margin to improve steadily to 26.8% for FY18F vs. 25.9% in FY15 backed by the adoption of automation, a bigger share of high margin consulting practice, and improvement in employee utilization.
§ Return ratios to remain strong with high ROE/ROCE/ROIC of 24%/33%/46% buffering high valuation multiple.
§ OCF/Net profit of more than 100% and OCF/EBITDA of 70%. Improving large deal wins TCV
Source: Company, KESI
Swing Factors
Upside
§ Consistent outperformance on QoQ revenue growth with margin stability/improvement.
§ Continuous announcement of large deals. INFO is targeting quarterly large deal win total contract value (TCV) of USD1.5-2b vs. its current quarterly run-rate of USD0.6-1.0b.
§ Acquisitions that add value or are earnings accretive.
Downside
§ Slowdown in consulting demand and large deal wins. § Key management level exits. § Loss of key clients, market share loss in client spends.
-4.0%
-2.0%
0.0%
2.0%
4.0%
6.0%
8.0%
1QFY15 2QFY15 3QFY15 4QFY15 1QFY16 2QFY16
INFO TCS+HCLT+WPRO
60
80
100
120
140
160
180
200
500
600
700
800
900
1,000
1,100
1,200
Dec-10 Dec-11 Dec-12 Dec-13 Dec-14
Infosys - (LHS, INR) Infosys / MSCI AC Asia ex JP - (RHS, %)
0
200
400
600
800
1000
1200
2Q15
3Q15
4Q15
1Q16
2Q16
Large deal win TCV (USDm)
1 2
3
5 4

January 3, 2016
Tech
nolo
gy
Indi
a
Persistent Systems (PSYS IN)
Niche play
Niche play on Indian IT We maintain Buy with TP of INR770 equal to 16x FY17F EPS driven by upside potential from digital/SMAC and 16% earnings CAGR. Earnings powered by 25-30% increase in enterprise business, supported by growth returning in IP business. Quarterly volatility aside, margins are bottoming out, and we expect digital transformation and IP led business to be the key long term catalysts.
Enterprise business powering ahead Currently the enterprise business is overshadowed by the weakness in the IP-led and ISV business. We expect PSYS to get back to a sustainable growth path from: a) increasing momentum in the digital transformation led enterprise business; b) Aepona Holdings acquisition in IOT space, and launch of new version of IPs driving IP-led business back to growth; and c) ISV business decline to cease on integration of RGen Solutions acquisition, and traction in business from start-ups.
EBIT margins have bottomed out Lack of growth, higher onsite revenue share, and higher S&M spends have led to an EBIT margin decline. Underpinned by faster revenue growth, an uptick in IP-led business, a weak INR and better utilization, we expect margins to improve. We forecast EBIT margin improvement from 14.4% to 15.4% for 4QFY16 and 16.6% for 4QFY17.
Maintain Buy on attractive valuation With more than 55% of revenue coming from SMAC areas, we remain confident on PSYS' long term growth prospects. However, we do expect quarterly volatility in performance to continue due to the project led nature of the business. We strongly believe that the current valuation does not factor in the potential upside from the growth initiatives already in place. We maintain Buy with TP of INR770 at 16x FY17F based on a 33% premium to its historical PER of 12x justified by forecast profit recovery.
One year forward PER chart
Source: KESI, Bloomberg
Neerav Dalal [email protected] (91) 22 6623 2606
Share Price INR 649
12m Price Target INR 770 (+19%)
Previous Price Target INR 770
BUY
FYE Mar (INR m) FY14A FY15A FY16E FY17E FY18E
Revenue 16,692 18,913 22,234 26,661 31,475EBITDA 4,303 3,906 4,302 5,328 6,429Core net profit 2,493 2,906 3,033 3,803 4,508Core EPS (INR) 31 36 38 48 56Core EPS growth (%) 32.9 16.6 4.3 25.4 18.5Net DPS (INR) 12 10 12 14 17Core P/E (x) 20.8 17.9 17.1 13.6 11.5P/BV (x) 4.2 3.7 3.3 2.8 2.4Net dividend yield (%) 1.8 1.5 1.8 2.2 2.6ROAE (%) 22.3 22.1 20.2 22.2 22.7ROAA (%) 17.7 17.5 15.9 17.3 17.7EV/EBITDA (x) 8.6 12.7 10.0 7.6 5.9Net debt/equity (%) net cash net cash net cash net cash net cashConsensus net profit - - 3,020 3,532 4,007MKE vs. Consensus (%) - - 0.4 7.7 12.5
Company description
Statistics52w high/low (INR)3m avg turnover (USDm)Free float (%)Issued shares (m)Market capitalisation
Major shareholders:28.5%9.1%5.5%
80
0.7
Persistent Systems, is a niche IT company, focused ondeveloping solutions in new technologies: CloudComputing, Mobility, Analytics & Collaboration.
DESHPANDE ANAND SURESH DESHPANDE SURESH PURUSHOTTAM Pspl Esop Management Trust
940/467
47.3
INR51.9BUSD784M
Price Performance
60
70
80
90
100
110
120
130
140
150
160
450
500
550
600
650
700
750
800
850
900
950
Jan-14 Apr-14 Jul-14 Oct-14 Jan-15 Apr-15 Jul-15 Oct-15
Persistent Systems - (LHS, INR)
Persistent Systems / BSE SENSEX 30 Index - (RHS, %)
-1M -3M -12MAbsolute (%) (3) 0 (25)
Relative to index (%) (3) 1 (21)
Source: FactSet

January 3, 2016 37
Persistent Systems
Value Proposition
§ PSYS started as a contract software developer for IBM and Microsoft and has since transformed into an enterprise focused services and solutions provider with a niche in the social, mobile, analytics and cloud (SMAC) segments.
§ As outsourcing spend patterns shift from pure labor arbitrage towards cloud solutions, we expect SMAC/digital spends to grow at 25%+ p.a. vs. flat growth for traditional services.
§ PSYS’ strength in SMAC space and IP-led strategy positions it to grow faster than the industry average.
Digital technologies to drive IT spends (USDb)
Source: Industry, KESI
Price Drivers
Historical share price trend
Source: Company, Maybank Kim Eng
1. Price surge backed by 32% average pa earnings growth in
FY13-14. 2. PER re-rating from 12x to 20x on expectations of faster
revenue growth. 3. PER de-rating due to lack of earnings growth; delay in
acquisitions and weakness in top clients leading to downgrade of earnings and PER multiples.
Financial Metrics
§ We forecast a 17% CAGR over FY15-18F faster than the industry average driven by 30% growth in the enterprise business and 16% growth in the IP-led business. Share of enterprise and IP-led businesses to grow to 50% by FY18 from 41% for FY15.
§ Forecast EBIT margins to improve to 16.1% for FY18F from 14.4% in 2QFY16 driven by better realization from higher margin digital services and IP-led businesses.
§ Forecast earnings CAGR of 16% over FY15-18F. § Healthy return ratios - ROE of 22% and ROCE of 34% and
healthy cash flow generation with OCF/Net profit of 120%+ and 85%+ OCF/EBITDA.
Enterprise + IP-led businesses revenue share and growth
Source: Company, KESI
Swing Factors
Upside
§ Consistent revenue growth (USD terms) of 15-20% on YoY basis.
§ Announcement of acquisitions that will drive the IP-led strategy and in turn revenue growth.
§ PBT margin improvement backed by non-linear growth and improvement in employee utilization leading to margins of above 20% vs. current 18-20%.
Downside
§ Weakness persisting in the ISV business that currently contributes 59% of FY15 revenue.
§ Sluggishness in enterprise business performance, which is the key growth driver.
§ Pressure on margins due to increase in competition and weak revenue growth leading to PBT margins lower than 18%.
90% 65%
10%35%
2014 2020E
Traditional technologies Digital technologies
2,750
3,440-3,500
50100150200250300350400450500
100200300400500600700800900
1,000
Dec-10 Dec-11 Dec-12 Dec-13 Dec-14
Persistent Systems - (LHS, INR)
Persistent Systems / MSCI AC Asia ex JP - (RHS, %)
5%
10%
15%
20%
25%
30%
40%
42%
44%
46%
48%
50%
FY15 FY16F FY17F FY18F
Share of revenue Growth [RHS]
1
2
3

This page has been left blank intentionally

January 3, 2016 39
Persistent Systems

January 3, 2016
Stra
tegy
In
done
sia
Indonesia’s Six-for-16
Indonesia Rising
More constructive on the market We turn more positive on the market as we believe the market has bottomed out, and expect the economy and corporate earnings to gradually recover. The rupiah has been stabilising as well and we do not expect any significant downside risk. Monetary policy easing, tax amnesty and improvement in FDI and infrastructure spending will be the market’s main focus.
Monetary policy easing Following a 50bps cut in the reserve requirement in the monthly meeting in Nov’15, we think Bank Indonesia (BI) will start lowering its benchmark rate in 1Q16, given the high real interest rates and lower external risks. A total 50bps cut is possible in 2016, in our view. ASII and BBI would be the main beneficiaries from the rate cut.
Wage reform: a new key initiative We welcome the government’s new formula for adjusting the minimum wage, which will be based on national inflation and GDP growth. The new scheme will be positive for the investment climate as it will reduce foreign investors’ concerns about labour conditions in Indonesia, which have been building up for the past five years. A higher minimum wage will help maintain the purchasing power of low-income earners. GGRM, LPCK and TLKM should be the main beneficiaries of the new regulation.
Infrastructure focus The government remains committed to infrastructure, as demonstrated by the 8.3% YoY increase in the 2016 infrastructure budget. The budget accounts for 15% of the total 2016 budget, the highest on record, and over 2% of GDP. We like WSKT in the infrastructure sector due to: 1) its strong capital structure; 2) soaring order book; and 3) expansion into toll-road projects.
Analysts Isnaputra Iskandar, CFA (62) 21 25571129 [email protected]

January 3, 2016 41
Indonesia’s Six-for-16
1. Monetary policy easing
1.1 GDP growth stabilising The economy grew 4.73% YoY in 3Q15, below the government’s estimate of 4.85% but slightly above 1Q15’s +4.71% and 2Q15’s +4.67%. The slight improvement is attributed to rising government spending and investments. Government spending grew 6.56% YoY in 3Q15, beating 2Q15’s 2.13% YoY. The increase was felt in domestic cement sales, which started to grow MoM in Aug’15. Investments grew 4.62% YoY in 3Q15, also higher than 2Q15’s 3.69%. Although 3Q15 FDI was still down 0.8% YoY, it was up 0.4% QoQ. Another GDP component, non-profit institutions serving households, grew 4.62% YoY, an improvement over 2Q15’s 3.69%.
The same cannot be said about household consumption, exports and imports. Household consumption grew 4.96% YoY in 3Q15, slowing slightly from 2Q15’s 4.97%. The slowdown was felt in domestic car and motorcycle sales, which fell 17.7% and 11.0% YoY respectively in 3Q15. Exports declined by another 0.69% YoY in 3Q15 (2Q15: -0.09% YoY), following persistently lower commodity prices. Imports fell 6.11% YoY (2Q15: -6.98% YoY) as the domestic economy slowed and the rupiah weakened.
Fig 1: GDP stabilised in 3Q15
Source: Bloomberg
Fig 2: 3Q15 GDP breakdown
Source: BPS
Fig 3: Domestic cement sales have started to rebound
Source: Bloomberg & Maybank KE
Fig 4: Domestic 4W sales have started to pick up
Source: Bloomberg & Maybank KE
0.00%
1.00%
2.00%
3.00%
4.00%
5.00%
6.00%
7.00%
1Q11
2Q11
3Q11
4Q11
1Q12
2Q12
3Q12
4Q12
1Q13
2Q13
3Q13
4Q13
1Q14
2Q14
3Q14
4Q14
1Q15
2Q15
3Q15
Household consumption,
55%
Non-profit institutions
serving household, 1%
Investments, 33%
Government spending, 10%
Exports, 21%
Imports, -20%
0.00
1.00
2.00
3.00
4.00
5.00
6.00
7.00
Jan-
05
Aug-
05
Mar
-06
Oct
-06
May
-07
Dec
-07
Jul-
08
Feb-
09
Sep-
09
Apr-
10
Nov
-10
Jun-
11
Jan-
12
Aug-
12
Mar
-13
Oct
-13
May
-14
Dec
-14
Jul-
15
Mn tonnes
Monthly sales 12-month MA
0
20,000
40,000
60,000
80,000
100,000
120,000
Jan0
3
Sep0
3
May
04
Jan0
5
Sep0
5
May
06
Jan0
7
Sep0
7
May
08
Jan0
9
Sep0
9
May
10
Jan1
1
Sep1
1
May
12
Jan1
3
Sep1
3
May
14
Jan1
5
Sep1
5Units
Monthly sales 12-month MA
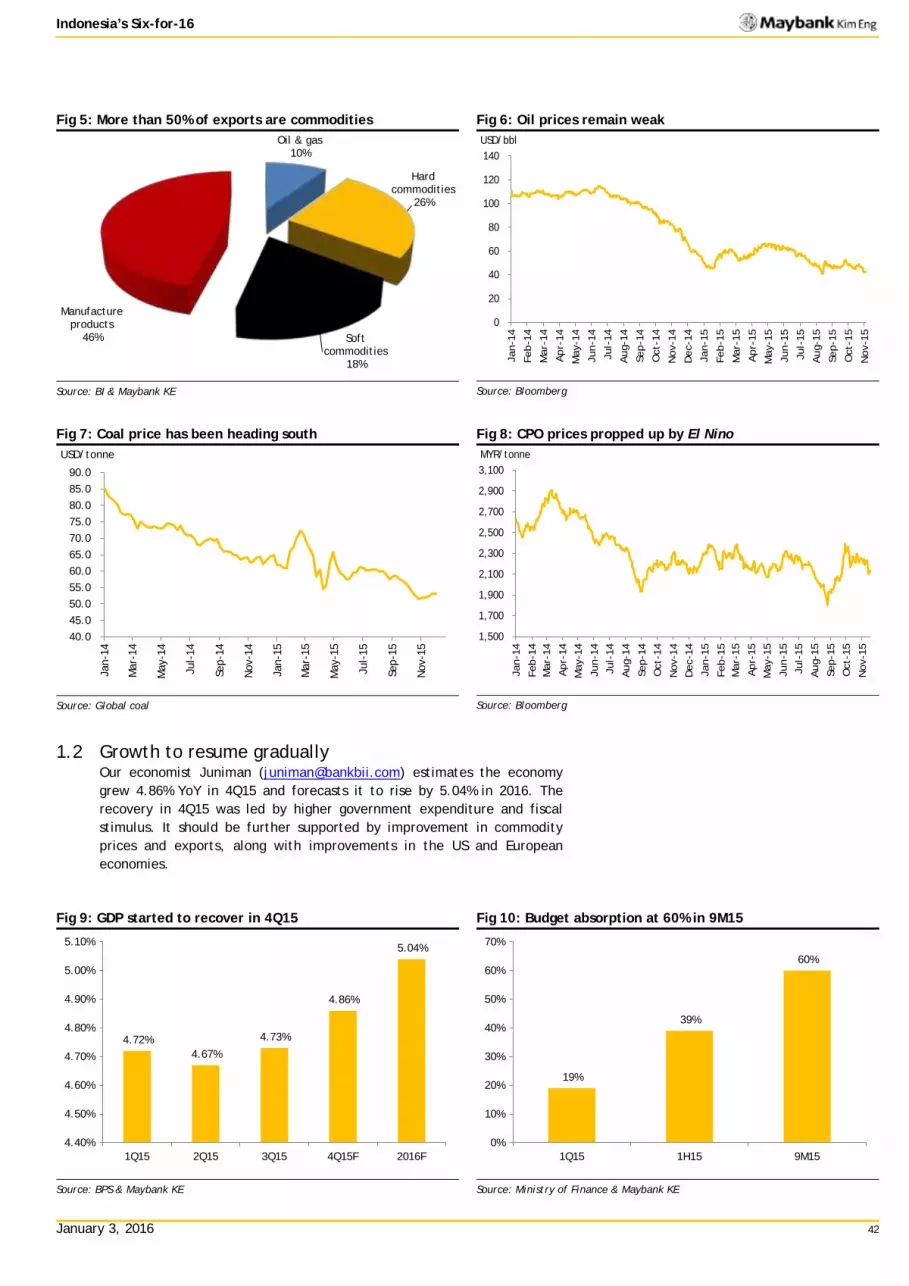
January 3, 2016 42
Indonesia’s Six-for-16
Fig 5: More than 50% of exports are commodities
Source: BI & Maybank KE
Fig 6: Oil prices remain weak
Source: Bloomberg
Fig 7: Coal price has been heading south
Source: Global coal
Fig 8: CPO prices propped up by El Nino
Source: Bloomberg
1.2 Growth to resume gradually Our economist Juniman ([email protected]) estimates the economy grew 4.86% YoY in 4Q15 and forecasts it to rise by 5.04% in 2016. The recovery in 4Q15 was led by higher government expenditure and fiscal stimulus. It should be further supported by improvement in commodity prices and exports, along with improvements in the US and European economies.
Fig 9: GDP started to recover in 4Q15
Source: BPS & Maybank KE
Fig 10: Budget absorption at 60% in 9M15
Source: Ministry of Finance & Maybank KE
Oil & gas10%
Hard commodities
26%
Soft commodities
18%
Manufacture products
46%0
20
40
60
80
100
120
140
Jan-
14
Feb-1
4
Mar
-14
Apr-
14
May
-14
Jun-1
4
Jul-
14
Aug-
14
Sep-1
4
Oct
-14
Nov
-14
Dec-
14
Jan-
15
Feb-1
5
Mar
-15
Apr-
15
May
-15
Jun-1
5
Jul-
15
Aug-
15
Sep-1
5
Oct
-15
Nov
-15
USD/bbl
40.045.050.055.060.065.070.075.080.085.090.0
Jan-
14
Mar
-14
May
-14
Jul-
14
Sep-
14
Nov
-14
Jan-
15
Mar
-15
May
-15
Jul-
15
Sep-
15
Nov
-15
USD/tonne
1,500
1,700
1,900
2,100
2,300
2,500
2,700
2,900
3,100
Jan-
14
Feb-1
4M
ar-1
4
Apr-
14
May
-14
Jun-1
4
Jul-
14
Aug-
14
Sep-1
4
Oct
-14
Nov
-14
Dec-
14
Jan-
15
Feb-1
5M
ar-1
5
Apr-
15
May
-15
Jun-1
5
Jul-
15
Aug-
15
Sep-1
5
Oct
-15
Nov
-15
MYR/tonne
4.72%4.67%
4.73%
4.86%
5.04%
4.40%
4.50%
4.60%
4.70%
4.80%
4.90%
5.00%
5.10%
1Q15 2Q15 3Q15 4Q15F 2016F
19%
39%
60%
0%
10%
20%
30%
40%
50%
60%
70%
1Q15 1H15 9M15

January 3, 2016 43
Indonesia’s Six-for-16
1.3 A more stable rupiah The rupiah has stabilised since the beginning of Oct-15. It does not appear at risk of being tossed and turned by the Fed’s rate hike in Dec’15. Its stability is helped, among other things, by an improving current account deficit to 1.9% of GDP in 3Q15, down from 2Q15’s -2.0% and 3Q14’s -3.0%. BI estimates the current account deficit ended the year at 2% of GDP.
Fig 11: Volatility is back to pre-Oct’15 levels
Source: Bloomberg & Maybank KE
Fig 12: A more stable rupiah
Source: Bloomberg
Fig 13: A trade surplus helps…
Source: Bloomberg
Fig 14:…as is a lower current account deficit
Source: Bloomberg
Fig 15: Foreign ownership remains high in bond markets
Source: Bloomberg & Maybank KE
Fig 16: Foreign flows into equity markets
Source: Bloomberg
0.0%
0.2%
0.4%
0.6%
0.8%
1.0%
1.2%
1.4%
1.6%
1.8%
2.0%
Jan-
15
Feb-
15
Mar
-15
Apr-
15
May
-15
Jun-
15
Jul-
15
Aug-
15
Sep-
15
Oct
-15
Nov
-15
Dec
-15
11,000
11,500
12,000
12,500
13,000
13,500
14,000
14,500
15,000
Jan-
15
Feb-
15
Mar
-15
Apr-
15
May
-15
Jun-
15
Jul-
15
Aug-
15
Sep-
15
Oct
-15
Nov
-15
Dec
-15
IDR/USD

January 3, 2016 44
Indonesia’s Six-for-16
1.4 Low inflation + stable rupiah = lower interest rate? On a YoY basis, inflation has been on a downward trend. It was 6.25% in Oct’15 and it eased to 4.89% in Nov’15, which was mainly due to the high base effect (the government raised fuel prices in Nov’14). As we expect MoM inflation in Dec was only ~0.5%, YoY inflation will be slightly below 3%, which is in line with BI’s estimate.
With the BI rate at 7.5% and YoY inflation of 4.9% in Nov’15, the real benchmark rate was 2.5%. If inflation ends the year at 3.0%, the real rate could reach 4.5%.
However, such a high rate may not be sustainable. Monthly real rates in the past six years averaged only 1.0%. Although there were times when the rate breached 3.0%, as in Mar 2000 and Aug 2014, its high levels were not sustainable, lasting, in fact, only one month.
The direction of inflation is more important for BI, in our view, than prevailing inflation. Having said that, we think there is upside to our internal forecast of no rate cut. We think BI might act in 1Q16.
There might be some concerns that rupiah volatility could be an obstacle for the rate cut, especially with the Fed’s rate hike in Dec’15. The rate hike has been positive for the currency and equity markets as it has removed an overhang, and this is shown by appreciation of the currency post the hike. On top of that, the latest data suggests that rupiah volatility (based on 5-day moving average) has declined significantly over the past few weeks and we expect volatility to stabilize, if not decline.
Fig 17: CPI & MoM inflation
Source: Bloomberg
Fig 18: Real rates could be higher
Source: Bloomberg & Maybank KE
At its last monthly meeting in Nov’15, the BI kept its benchmark rate at 7.5% but lowered its reserve requirement by 0.5% to 7.5%. We took this to suggest: 1) policy prudence, in view of a looming Fed rate hike in the near term; and 2) its understanding of the need for monetary easing to stimulate the economy.
A lower benchmark rate in Indonesia should be positive for ASII, banks and property companies, at least sentiment-wise.
· ASII should benefit as 60-70% of its 2Ws and 4Ws are sold through credit. Lower rates are not only good for its automotive division but also financial services. Note for 9M15, earnings from its automotive and financial services divisions accounted for ~70% of ASII’s profit.
· Banks’ costs of funds could drop and NIMs temporarily improve, from a time lag in adjusting lending rates. Among the big banks, BBRI has the
-1.0%
-0.5%
0.0%
0.5%
1.0%
1.5%
2.0%
2.5%
3.0%
3.5%
0.0
20.0
40.0
60.0
80.0
100.0
120.0
140.0
Jan-
10
May
-10
Sep-
10
Jan-
11
May
-11
Sep-
11
Jan-
12
May
-12
Sep-
12
Jan-
13
May
-13
Sep-
13
Jan-
14
May
-14
Sep-
14
Jan-
15
May
-15
Sep-
15
CPI (LHS) MoM inflation (RHS)
-2.0%
0.0%
2.0%
4.0%
6.0%
8.0%
10.0%
Jan-
10
May
-10
Sep-
10
Jan-
11
May
-11
Sep-
11
Jan-
12
May
-12
Sep-
12
Jan-
13
May
-13
Sep-
13
Jan-
14
May
-14
Sep-
14
Jan-
15
May
-15
Sep-
15YoY inflation Real benchmark rate Nominal benchmark rate

January 3, 2016 45
Indonesia’s Six-for-16
most time deposits in its customer deposits, followed by BBNI, BMRI and BBCA.
· Property developers tend to benefit as mortgages account for a chunk of their sales, except for SMRA. BSDE has the highest exposure of 40%, followed by BKSL (36%), CTRA (35%), LPKR (21%), ASRI (21%) and SMRA (5%).
Fig 19: Time deposits to total deposits
Source: Companies & Maybank KE
Fig 20: Customers’ payment methods for their properties
Company Mortgage Cash installments Full cash
ASRI 21% 54% 25% BKSL 36% 51% 13% BSDE 40% 50% 10% CTRA 35% 57% 8% LPKR 21% 59% 20% SMRA 6% 80% 14%
Source: Companies & Maybank KE
45%
40%37%
25%
0%
5%
10%
15%
20%
25%
30%
35%
40%
45%
50%
BBRI BBNI BMRI BBCA

January 3, 2016 46
Indonesia’s Six-for-16
2. Labour-wage reform: a new key initiative
2.1 Stable FDI FDI has been relatively flat at USD6-7b for the past 15 quarters. There are two key reasons for the flat growth: 1) the long process involved in applying for investment licences; and 2) uncertainties in the labour situation in Indonesia, especially in terms of the increase in annual minimum wage. Indonesia was ranked 109th in the World Bank Doing Business 2016 ranking, below Malaysia (18th), Thailand (49th), Vietnam (90th) and the Philippines (103rd).
Obtaining the necessary licences for investing in Indonesia has been a classic problem for years. The problems range from the types of licences required, to the time needed to obtain such licences. These problems are in addition to other challenges, such as lack of the necessary infrastructure (eg roads and ports etc).
Labour issues have been another major problem since 2010. From 2009-15 the average national minimum wage had increased by a 38.1% CAGR, way above average inflation of ~6%. The problem has become more complicated because of the increasing strength of labour unions.
Fig 21: Stable FDI in the past 19 quarters
Source: Bloomberg & Maybank KE
Fig 22: Average minimum wage up 38.1% CAGR in 2009-15
Source: Ministry of Manpower & Maybank KE
2.2 The stimulus The government launched several stimulus measures in 2015. Government investment as a component makes up 30-35% of GDP. One initiative taken by the government is to expedite the approval time for investment licences to three hours for those who invest in industrial zones. While we welcome this measure, it remains to be seen whether the initiative will be effectively implemented.
Another initiative by the government is to change the mechanism for adjusting the minimum wage. Currently, the minimum wage is determined by negotiations between the government, companies and labour unions. However, this approach has become ineffective in recent years, as labour unions would simply strike if their demands are not met. Effective 1st Jan’16, annual minimum wage increase will be based on national GDP and national inflation. On top of that, review of components of standard of living will be done only once in five years, much less than the current practise of almost every year.
0
200
400
600
800
1,000
1,200
1,400
1,600
1,800
2009 2010 2011 2012 2013 2014
IDR/month

January 3, 2016 47
Indonesia’s Six-for-16
Fig 23: Economic stimulus No Economic stimulus Potential impact and stock (s) affected 1 Simplification of investment processes (including tax holidays and tax
incentives) in Indonesia. There are also incentives for special economic zones.
Positive for Indonesia's investment competitiveness in the long term.
2 Lower income tax rate for exporters who deposit their money in Indonesia.
Positive for the currency as the policy will add dollar supply in domestic market. Mining companies such as ADRO, ANTM, INCO, ITMG and PTBA could be the biggest beneficiaries.
3 Lower retail energy prices (LPG, subsidized diesel and Pertalite). Positive for inflation and purchasing power, especially that of low-income earners. Companies that target the mass market, such as RALS, INDF, GGRM, will benefit.
4 Lower non-subsidized diesel prices Coal companies (ADRO & ITMG) will be big beneficiaries of lower diesel prices. PTBA will also benefit but not as much as ADRO and ITMG.
5 Cuts in electricity prices and incentives for consumption during certain periods.
Positive for SMGR, INTP and INDF.
6 Lower jet fuel prices More competitive domestic jet fuel prices. GIAA will be a big beneficiary as ~35-40% of cost is fuel related.
7 Lower upstream gas prices, which is done through distribution efficiencies and lowering of government’s revenue share.
Positive for PGAS as it will remove overhang on the potential cut of its distribution by the government.
8 Adjusting minimum wage based on inflation and economic growth. Positive as it will: 1) reduce uncertainty in the investment climate; and 2) give better assurance to corporates in terms of expected wage-cost increases. Companies that will benefit from the policy include those with a high proportion of labour costs to total costs, such as AALI, LPPF, MAPI, KLBF and RALS. Industrial-land companies, such as DMAS and BEST will also be beneficiaries.
9 Lower income tax for asset revaluation if it is done until end of 2016. The normal tax rate is 10%, but it can be lowered to 3% (if done until end of 2015), 4% (if done in 1H16) and 6% (if done in 2H16).
Positive, especially for companies that are highly geared, such as Bakrie-related companies, BUMI, VIVA. Telcos, especially TLKM, and also ISAT and EXCL that have high levels of debts could be potential candidates for asset revaluation.
10 Removal of double taxation for REITs issued in Indonesia. More REIT listings in Indonesia with SMRA, PWON and LPKR being potential candidates.
Source: Maybank
2.3 The impact The change in the mechanism for adjusting the minimum wage is positive for the investment climate. While the percentage of the annual adjustment will still be higher than inflation, this mechanism should give some level of certainty to investors in terms of annual cost increases that they will face. We believe LPCK will be a beneficiary of this policy.
The new regulation will also help the low-income earners across Indonesia (i.e. the mass market) to maintain their purchasing power. The annual increase will be less than previous years’ but the mechanism will be consistent each year. In addition to that, the annual increase will be felt across Indonesia, not only in certain areas/provinces, as the parametres used (GDP and inflation) will be national parametres. Companies that sell to mass markets, such as ICBP, INDF, GGRM, RALS, TELE and TLKM, will be beneficiaries, we believe.

January 3, 2016 48
Indonesia’s Six-for-16
3. Infrastructure focus
3.1 2016 budget: unwavering commitment to infrastructure The 2016 state budget is not much different from 2015’s in its size, sources of income, budget allocations and budget deficit. The 2016 budget is IDR2,096t, up 5.6% YoY. The revenue target is IDR1,823t, up 3.5% YoY. Some 84.9% of this will come from taxes and customs duties. The budget deficit has been set at IDR273t, or 2.2% of GDP.
The government continues to allocate money to core productive sectors. Its infrastructure budget is IDR314t, up 8.0% YoY, forming 15.0% of its total budget (the highest in history) and higher than 2.0% of GDP. The budget for subsidies continues to slide, down 13.1% YoY to IDR201t.
Fig 24: 2016 budget not much different from 2015 2015 (APBNP) 2016 (APBN) Change ASSUMPTIONS GDP growth 5.7% 5.3% -0.4% Exchange rate, IDR/USD 12,500 13,900 11.2% Inflation 5.0% 4.7% -0.3% SPN 3-month rate 6.2% 5.5% -0.7% Oil price, USD/barrel 60 50 -16.7% Oil lifting, 000 bpd 825 830 0.6% Gas lifting, 000 boepd 1,221 1,155 -5.4% STATE BUDGET, IDR t A. REVENUES 1,762 1,823 3.5% I. Domestic revenues 1,758 1,821 3.5% I.1. Tax & custom 1,489 1,547 3.9% I.1. Non tax & custom 269 274 1.8% II. Grants 3 2 -39.4% B. EXPENDITURES 1,984 2,096 5.6% I. Central government 1,320 1,326 0.4% I.1. K/L 796 784 -1.4% I.1. Non K/L 524 541 3.3% I.1.a. Subsidiies 232 201 -13.1% I.1.b. Interest payments 156 183 17.8% I.1.c. Others 137 157 14.7% II. Tranfer to regions & village funds 665 770 15.9% C. SURPLUS (DEFICIT) 223 273 22.7% Deficit to GDP 1.9% 2.2% 0.3%
Source: Ministry of Finance & Maybank KE
Fig 25: Infrastructure budget remains high…
Source: Ministry of Finance & Maybank KE
Fig 26:…at over 2% of GDP
Source: Maybank
7.6%8.7%
9.8% 9.4% 9.5%
14.6% 15.0%
0
50
100
150
200
250
300
350
0.0%
2.0%
4.0%
6.0%
8.0%
10.0%
12.0%
14.0%
16.0%
2010 2011 2012 2013 2014 2015F 2016F
Infrastructure budget, IDR t
Infra budget/total budget
1.3%1.5%
1.7% 1.6% 1.7%
2.5% 2.4%
0.0%
0.5%
1.0%
1.5%
2.0%
2.5%
3.0%
2010 2011 2012 2013 2014 2015F 2016F
Infra budget / GDP

January 3, 2016 49
Indonesia’s Six-for-16
Fig 27: Breakdown of 2015 infrastructure budget
Source: Ministry of Finance & Maybank KE
Fig 28: Breakdown of 2016 infrastructure budget
Source: Ministry of Finance & Maybank KE
3.2 Realistic or not? Given the low achievements this year, is the 2016 budget realistic? Actual 2015 revenue from taxes and customs might be only 80-85% of the 2015 target of IDR1,758t. Without expenditure cuts of at least 7%, we believe the deficit could top 2.5% of GDP this year.
The government has launched or will be launching stimulus measures aimed at meeting its 2016 budget target and stimulating the economy in general. Initiatives include, among other things: 1) a tax amnesty, with the supporting law to be finalised beginning of 2016; 2) a lower tax for asset revaluation; 3) potential cuts in income tax for individuals; and 4) pre-funding of infrastructure projects, which should be positive to stimulate the economy and accelerate economic recovery.
On tax revenues from the tax amnesty and asset revaluation, the government targets IDR60t and IDR10t, respectively. The figure suggests 2.2% and 0.4% of GDP in our estimate. Our conversations with a couple of state-owned listed companies suggest that they are interested in participating in the asset revaluation programme, enticed by its lower tax rates. Meanwhile, the effectiveness of the tax amnesty will partly depend on government guarantees that the assets brought into Indonesia will not be exposed to future lawsuits, in our view.
3.3 Major projects Below are lists of major infrastructure projects (power plants, sea ports, airports and toll roads) in Indonesia. The breakdown of the projects is taken from Maybank KE reports “Indonesia Construction: Busy Days Ahead” dated May 4th, 2015 by our infrastructure analyst, Pandu Anugrah ([email protected]).
3.3.1 Power plants The government has set an ambitious target to build 35,000MW of power plants by 2020 from around 50GW currently. This is in line with the government’s plan to raise the electrification ratio to more than 90% by 2019 from around 82% currently.
The government recently announced its road map in which 38% (13.7GW) of total new capacity will be built by state-owned electricity company Perusahaan Listrik Negara (PLN), while the remaining 22-25GW will be done through the IPP scheme. Recent response from private investors has been very positive, as commitments from private investors, particularly from Japan, have reached around 15GW out of the total 25GW offered through the PPP scheme. Total estimated capital outlay for the 35GW power plant would be IDR700t.
Public works45%
Transportation24%
Agriculture4%
Energy & Mineral
Resources3%
Special allocation funds
12%
SOE's capital injections
12%
Public works32%
Transportation15%
Agriculture2%
Energy & Mineral
Resources1%
Special allocation funds
18%
SOE's capital injections
13%
Others19%

January 3, 2016 50
Indonesia’s Six-for-16
Fig 29: Electrification ratio for Asian developing countries
Source: PLN
Fig 30: Development of Indonesia’s electrification ratio
Source: PLN
3.3.2 Sea ports While the concept of a sea toll road has existed since the previous government, President Jokowi has made sea port development a high priority under its infrastructure programme over the next five years to improve logistics costs. Total capital outlay for the sea toll road project is estimated to reach close to IDR700t (USD56b) which includes vessel purchases and small boats. In Mar 2015, during Jokowi’s visit to Japan and China, Jokowi offered sea port projects to investors, but so far only China has expressed interest. Note that state-owned operator Pelindo will be highly involved in the seaport development as well.
Out of the total 24 new port projects in the pipeline, four main seaports are currently under construction and are set to operate at full capacity in 2018. These ports are Kuala Tanjung (North Sumatra), New Tanjung Priok (Jakarta), Teluk Lamong (Surabaya, East Java), and New Makassar (South Sulawesi), with total investment requirement of IDR55.6t. Teluk Lamong will complement Tanjung Perak, which is located very close to each other. On the most eastern part of Indonesia, the government is currently conducting a feasibility study on Sorong Port Papua. Completion of Sorong would allow better access for shipment of goods from the west to the eastern part of Indonesia on a regular basis. This should help to improve Indonesia’s high logistics costs.
Fig 31: 24 new seaports (sea toll roads)
Source: Pelindo

January 3, 2016 51
Indonesia’s Six-for-16
3.3.3 Airports At this juncture, most of the airport projects consist of facility upgrades such as airport expansion, runway extension, and new aprons. The project closest to completion in the airport segment is the Soekarno – Hatta new Terminal 3 with total investment cost of IDR5t and ready for commencement in 2015.
For greenfield projects, the government is currently at an early stage of developing new airports in several main cities within Java Island, such as Semarang, Yogyakarta and Bandung. Hurdles remain on permit and design approval. While it may take time for ground breaking, we believe it is only a matter of time. Recently, the Ministry of Transportation announced plans to build new airports in 19 locations. In terms of size, they may not be as big as the airports planned in big cities, but would undoubtedly help to ease capacity congestion.
3.3.4 Toll roads Growth in new toll road length has been at a snail pace over the past 10 years. On top of the classic hurdle of land acquisition, difficulty in securing financing on several sections has resulted in significant delays. Several policies have been modified over the past few years, particularly on the land acquisition process, but execution continued to face hurdles.
Over the past seven years, we only witnessed 144km of new toll road completion, translating to average annual growth of only 5%. Going forward, we expect faster progress on new toll road development, particularly for concessions in Java and Sumatra. Total project value from the toll road segment is significant at an estimated IDR624t.
Fig 32: Domestic toll-road length
Source: BPJT, JSMR & Maybank KE
Fig 33: Toll road projects in the pipeline
Source: BPJT & Maybank KE
January 3, 2016
Cons
umer
Dis
c.
Indo
nesi
a
Isnaputra Iskandar, CFA [email protected] (62) 21 2557 1129
Stephanie Boenawan [email protected] (62) 21 2557 1214
Astra International (ASII IJ)
A Comeback Tour
Maintain BUY; TP IDR7,500 We continue to like ASII as we believe the share price has priced in the weak automotive demand as suggested by ~25% decline in the share price since its peak in March. Our SOTP-driven target price of IDR7,500 suggests 16.0x 2016 PER, in line with three-year mean of 15.8x. Catalysts to the share price might include monetary easing, gradual automotive-volume improvements and new product launches.
Automotive sales have bottomed Domestic 4W and 2W volume sales bottomed out in June-July; they have since improved gradually. We expect a demand recovery along with gradual improvements in the economy, potential interest-rate cuts and new products lined up. We forecast 12% demand growth for both 4W and 2W in 2016, and expect ASII to maintain 50% and 68% respective market shares.
17% FY16-17 EPS growth We forecast earnings growth of 17.1% and 17.4% for 2016-17, led by its automotive, financing and plantation units. On top of higher auto volume and margins, we are anticipating higher CPO prices and IDR stability.
Financial services: Stronger comeback A strong database and control over distribution channels should help its financial-service arm contain its NPL ratio at the 0.05% level in FY16-17, while recent LTV regulations and higher used-car prices are expected to bump up financing volume. Total assets are expected to grow at a 17.9% 3-year CAGR on the back of lower down payments and financing rates.
Share Price IDR 6,000
12m Price Target IDR 7,500 (+25%)
Previous Price Target IDR 7,500
BUY
Company description
Statistics52w high/low (IDR)3m avg turnover (USDm)Free float (%)Issued shares (m)Market capitalisation
Major shareholders:50.1%
40,484
16.9
Astra International is a conglomerate with businessinterest in automotive, finacial services, heavyequipments, contract mining, palm oil, and others.
Jardine Cycle & Carriage
8,575/5,125
49.9
IDR242.9TUSD17.6B
Price Performance
75
80
85
90
95
100
105
110
115
5,000
5,500
6,000
6,500
7,000
7,500
8,000
8,500
Jan-14 Apr-14 Jul-14 Oct-14 Jan-15 Apr-15 Jul-15 Oct-15
Astra Int'l - (LHS, IDR) Astra Int'l / Jakarta Composite Index - (RHS, %)
-1M -3M -12MAbsolute (%) 1 15 (19)
Relative to index (%) (2) 6 (8)
Source: FactSet
FYE Dec (IDR b) FY13A FY14A FY15E FY16E FY17E
Revenue 193,880 201,701 180,269 204,067 228,044EBITDA 25,690 28,811 25,310 26,859 27,879Core net profit 19,417 19,181 16,168 18,930 22,220Core EPS (IDR) 480 474 399 468 549Core EPS growth (%) (0.0) (1.2) (15.7) 17.1 17.4Net DPS (IDR) 184 184 153 179 210Core P/E (x) 12.5 12.7 15.0 12.8 10.9P/BV (x) 2.9 2.5 2.3 2.1 1.9Net dividend yield (%) 3.1 3.1 2.5 3.0 3.5ROAE (%) 25.0 21.4 16.2 17.3 18.4ROAA (%) 9.8 8.5 7.0 8.1 9.0EV/EBITDA (x) 13.2 12.8 11.9 11.4 11.1Net debt/equity (%) 49.5 45.4 31.9 30.6 27.8Consensus net profit - - 16,711 19,032 21,523MKE vs. Consensus (%) - - (3.2) (0.5) 3.2

January 3, 2016 53
Astra International
Value Proposition
§ Astra owns the passenger distributorships of Toyota and Daihatsu, the largest auto franchises in Indonesia with extensive distribution chains.
§ Astra has aggregated ~50% market share for auto market. § The heavy equipment division has strong presence in both
heavy equipment and contract mining markets. § Financial services division, whose objective is to
complement and support the auto business, has ~18% and ~22% shares in the 2W and 4W markets.
§ The entire value chain erects formidable entry barriers and enhances pricing power that enables Astra to post ROE above cost of equity.
Astra’s consistent market share of above 50% in automotive
Source: Company & Maybank KE
Price Drivers
Historical share price trend
Source: Company, Maybank Kim Eng
1. Avanza (the highest selling product) new model was
launched. 2. ASII launched low-cost cars under Toyota and Daihatsu
brands. 3. Automotive demand declined due to weakening currency
and intensifying competition. 4. 4W demand and distribution margin have started to pick
up.
Financial Metrics
§ Profitability to recover going forward at 17.4% CAGR (2015-17) on strong auto and financial services divisions. Monetary easing and product launches will be key drivers.
§ Auto-related segments to continue to be main earnings drivers (~70% of earnings). Heavy equipment and plantation units anaemic as commodity prices remain lacklustre.
§ Maintaining a robust balance sheet with continuously lower debt/capital ratio in the next 3 years at ~31.5%, while sustaining a stable dividend payout ratio of 45%.
4W sales vs. benchmark rate
Source: Gaikindo & Bloomberg
Swing Factors
Upside
§ Toyota becomes more aggressive in new product launch. § Strong rebounds in coal and CPO prices which would be
positive for heavy equipment and plantation divisions. § Successful diversification in infrastructure which could
offset declining earnings contribution from heavy equipment and plantation units.
Downside
§ Increasing competition in the oversupplied automotive sector, leading to margin compression.
§ Diversification into infrastructure takes a lot of capital and longer payback period.
§ Continued decline in commodity prices.
1
2
3
4

January 3, 2016
Bank
s In
done
sia
Rahmi Marina [email protected] (62) 21 2557 1128
Bank Rakyat Indonesia (BBRI IJ)
Low NPLs, High ROEs; Top BUY
BUY for attractive ROE We expect the banking sector to grow along with the economy. Our top BUY is BBRI for its strong consumer lending business with PT at IDR13,000 (12.3x FY16 P/E, 2.4x P/BV), implying 20% upside potential from current price. Based on our estimate, BBRI should be able to endure a prolonged period of high credit cost while maintaining an attractive 21% ROE next year.
Strong growth in consumer lending Of its three business segments, consumer lending generates the highest yields vs corporates and SMEs. BBRI has a 15% consumer market share, the largest in the country. We estimate this segment of its business will grow 15% YoY next year, underpinning a 12% YoY expansion in its loan book. The bank should also benefit from government-related infrastructure projects next year in addition to its big trading portfolio.
Growth in retail savings to keep NIMs high Not only does consumer lending generate high yields for BBRI, it provides a huge base of cheap retail savings, mostly from the micro sub-segment. This is a feature unique to BBRI that allows the bank to stay ahead of the others in their expansion into this lucrative segment. With little pricing competition from the big players, we expect BBRI to maintain its NIMs close to 8% in 2016.
Low NPLs support attractive ROEs Most importantly, BBRI’s consumer segment forms 50% of its portfolio. It has the lowest NPL ratio of 1.5%. This and its 150% NPL coverage should keep the bank’s total bad-debt ratio below 2.5%. With this, we expect its fat NIMs to translate into an attractive 21% ROE for 2016.
Share Price IDR 11,425
12m Price Target IDR 13,000 (+14%)
Previous Price Target IDR 13,000
BUY
Statistics52w high/low (IDR)3m avg turnover (USDm)Free float (%)Issued shares (m)Market capitalisation
Major shareholders:57.0%
nana
24,669
19.5
Government of Indonesia na na
13,275/8,300
43.0
IDR281.8TUSD20.4B
Price Performance
90
100
110
120
130
140
150
160
7,000
8,000
9,000
10,000
11,000
12,000
13,000
14,000
Jan-14 Apr-14 Jul-14 Oct-14 Jan-15 Apr-15 Jul-15 Oct-15
Bank Rakyat Indonesia - (LHS, IDR)
Bank Rakyat Indonesia / Jakarta Composite Index - (RHS, %)
-1M -3M -12MAbsolute (%) 6 32 (2)
Relative to index (%) 3 21 12
Source: FactSet
FYE Dec (IDR b) FY13A FY14A FY15E FY16E FY17E
Operating income 52,661 60,789 67,895 73,653 80,306Pre-provision profit 30,069 34,084 38,553 41,390 44,829Core net profit 21,344 24,242 24,687 26,086 27,860Core EPS (IDR) 865 983 1,001 1,057 1,129Core EPS growth (%) 14.3 13.6 1.8 5.7 6.8Net DPS (IDR) 234 265 270 286 305Core P/E (x) 13.2 11.6 11.4 10.8 10.1P/BV (x) 3.6 2.9 2.5 2.1 1.8Net dividend yield (%) 2.0 2.3 2.4 2.5 2.7Book value (IDR) 3,209 3,955 4,655 5,395 6,186ROAE (%) 29.7 27.4 23.2 21.0 19.5ROAA (%) 3.6 3.4 3.0 3.0 2.9Consensus net profit - - 24,295 26,815 29,102MKE vs. Consensus (%) - - 1.6 (2.7) (4.3)

January 3, 2016 55
Bank Rakyat Indonesia
Value Proposition
§ BBRI possesses one of Indonesia’s best consumer franchises. Being government-owned, the bank is also in a good position to fund government-related projects.
§ Consumer is 50% of the book. BBRI has 15% consumer market share. The low consumer delinquency and high CASA allow the bank to translate its higher NIMs into 20% sustainable ROE, one of the highest in Asia.
§ The expertise required to successfully expand BBRI’s type of consumer lending is a barrier for new entrants. We see no close competitor in the medium term.
Indonesia banks ROE vs. CAR comparison
Source: Company
Price Drivers
Historical share price trend
Source: Company, Maybank Kim Eng
1. 2Q12 results showed a significant improvement in loan
quality, with NPL dropping to below 2%. 2. Weakening IDR led to NPL concern. 3. NIM recovery as BBRI passes on the rising BI rate to
borrowers. 4. Weak 1Q15 earnings due to high CoF, followed by NPL
concern on rapid IDR depreciation. 5. 50bp cut in BI’s primary reserve requirement taken as a
signal of lower benchmark rate in the future.
Financial Metrics
§ We expect BBRI’s leading position in consumer lending to keep NIM above 7.5% vs. the sector’s average of 4.5%.
§ Efficiency is expected to improve following the launch of BBRI’s satellite in 2H16.
§ NPL should stay below 3% on improvement in credit origination standard. Lower exposure to more vulnerable corporate and SME segments.
§ These metrics and BBRI’s prudential coverage allow the bank to maintain higher ROE compared to peers.
Indonesia banks NIM & NPL comparison
Source: Company
Swing Factors
Upside
§ BI rate cut will lead to lower CoF. As most of BBRI’s loan portfolio is in fixed rates, the bank should be able to maintain higher NIM longer than peers.
§ Acceleration in corporate and SME loan demand, driven by stable currency.
§ Better-than-expected NPL.
Downside
§ Government intervention in KUR lending rate to a level that the subsidized loans cannibalize BBRI’s micro credit product.
§ Lower-than-expected credit demand from the corporate segment due to a prolonged weakening in the economy.
§ Higher-than-expected CoC on deteriorating asset quality.
80100120140160180200220240260280
4,0005,0006,0007,0008,0009,000
10,00011,00012,00013,00014,000
Dec-10 Dec-11 Dec-12 Dec-13 Dec-14
Bank Rakyat Indonesia - (LHS, IDR)
Bank Rakyat Indonesia / MSCI AC Asia ex JP - (RHS, %)
1
2
3
5
4

January 3, 2016
Bank
s In
done
sia
Janni Asman [email protected] (62) 21 2953 0784
Gudang Garam (GGRM IJ)
Solid pricing power
Maintain BUY with TP of IDR60,000 Reiterate BUY with TP of IDR60,000 (18x PER FY16F) on the back of potential benefits from industry growth and shift in consumer preference. GGRM’s valuation also appears undemanding at ~60% discount to peer HMSP’s 36x PER (based on Bloomberg consensus).
Tax hike to be passed on to consumers We expect GGRM to continue to raise ASP towards the end of the year to partially pass on the excise tax increase next year. We estimate ASP increase of 10-12% YoY pa over 2015-16F, which should lead to stable EBIT margins over the period. Lower clove prices (-33% YoY) are expected to lend some support to profitability at the gross margin level but we also see competition stiffening, which may lead to higher A&P spending.
Volume recovery expected Relatively more stable macroeconomic conditions along with easing pressure on the IDR and milder inflation are expected to lead to improved affordability and drive cigarette volume growth recovery. We estimate GGRM’s volumes declined (-5.2% YoY) in FY15F, followed by a slight recovery (+0.2% YoY) next year. Consumers’ shift in preference from hand-rolled to machine-rolled cigarettes is likely to continue in the longer run and this will benefit companies with greater exposure to machine-rolled cigarettes, such as GGRM (~85-90% volume).
Turn to positive free cash flow We believe GGRM’s capex cycle has ended and the company will turn positive free cash flow from 2015F. The debt level by end-FY15F is likely to remain high due to the timing of working capital debt. After the regulation change in 2015, companies are required to settle their tax receivables by Dec (vs 2 months credit term allowed previously). But over the longer run, we still see continuous decline in its leverage.
Share Price IDR 55,000
12m Price Target IDR 60,000 (+9%)
Previous Price Target IDR 60,000
BUY
Statistics52w high/low (IDR)3m avg turnover (USDm)Free float (%)Issued shares (m)Market capitalisation
Major shareholders:69.3%6.3%
1,924
4.4
PT Suryaduta Investama PT Suryamitra Kusuma
63,700/40,500
24.5
IDR105.8TUSD7.7B
Price Performance
85
95
105
115
125
135
40,000
45,000
50,000
55,000
60,000
65,000
Jan-14 Apr-14 Jul-14 Oct-14 Jan-15 Apr-15 Jul-15 Oct-15
Gudang Garam - (LHS, IDR) Gudang Garam / Jakarta Composite Index - (RHS, %)
-1M -3M -12MAbsolute (%) 12 31 (9)
Relative to index (%) 9 20 3
Source: FactSet
FYE Dec (IDR b) FY13A FY14A FY15E FY16E FY17E
Revenue 55,437 65,186 68,981 75,935 84,091EBITDA 7,758 10,018 10,779 11,854 12,891Core net profit 4,329 5,369 5,529 6,334 7,180Core EPS (IDR) 2,250 2,790 2,873 3,292 3,731Core EPS growth (%) 7.8 24.0 3.0 14.6 13.4Net DPS (IDR) 680 850 850 935 1,020Core P/E (x) 24.4 19.7 19.1 16.7 14.7P/BV (x) 3.6 3.2 2.9 2.6 2.3Net dividend yield (%) 1.2 1.5 1.5 1.7 1.9ROAE (%) 15.5 17.2 15.8 16.3 16.5ROAA (%) 9.4 9.9 9.3 10.1 10.7EV/EBITDA (x) 11.9 13.3 11.3 10.2 9.3Net debt/equity (%) 39.6 50.0 42.4 35.3 29.7Consensus net profit - - 5,435 6,023 6,809MKE vs. Consensus (%) - - 1.7 5.2 5.4
January 3, 2016 57
Gudang Garam
Value Proposition
§ For Indonesia’s 24%-market share cigarette producer, long term business sustainability is about cultivating customer loyalty and reaching to pass through higher excise duty into ASP.
§ Relative price inelasticity helps revenue accretion even as the addressable market experiences slow expansion.
§ The clove cigarette blends are unique and cultivates its product differentiation and customer following.
§ GGRM’s return on capital now is also running above its cost of capital (WACC at 11%). Widening net margins are primarily responsible for positive ROE trend.
GGRM ROE
Source: Company, Maybank KE
Price Drivers
Historical share price trend
Source: Company, Maybank Kim Eng
1. GGRM underwent a restructuring that improve
profitability. Earnings CAGR at 38% over 2008-2011. 2. Margin pressure on higher clove price (+200-250% YoY in
2011). Earnings dropped 18% YoY in 2012. 3. Change in packaging triggered rumour of change in
flavour, resulting in volume decline of -7-10% YoY for one of the major product.
4. New product launching drove a stronger volume growth. 5. Weak performance due to economic slowdown and
underperformance of its new product.
Financial Metrics
§ Excise tax hike is likely to be more than fully passed on to consumers. Margins will likely be stable/wider, assuming raw material prices remain benign.
§ Our 10% revenue CAGR over 2015-18F mainly assumes slow 1.4% volume growth but 8.2% ASP hike.
§ A&P spending to revenue is likely to increase to on the rising competition as most major cigarette players are trying to gain traction in machine rolled segment.
§ Capex cycle has ended so GGRM should be FCF positive from 2015F.
GGRM’s pricing power allows sustainable margin
Source: Company, Maybank KE * Tax increase refer to aggregate excise tax, VAT, and cigarette tax.
Swing Factors
Upside
§ If new product managed to gain traction among consumers.
§ If raw material price fall further along with bumper harvest.
§ More restriction in A&P which may lead to faster than expected industry consolidation and lower opex.
Downside
§ If the government increase the tax rate higher than estimates.
§ Higher health awareness that lead to decline in number of smokers.
§ If there’s change in consumer preference, such as shift back to hand-rolled cigarettes.
0%
5%
10%
15%
20%
25%
06 07 08 09 10 11 12 13 14 15F 16F 17F 18F
WACC 11%
80
100
120
140
160
180
200
220
240
30,000
35,000
40,000
45,000
50,000
55,000
60,000
65,000
70,000
Jan-11 Jan-12 Jan-13 Jan-14 Jan-15
Gudang Garam - (LHS, IDR)
Gudang Garam / MSCI AC Asia ex JP - (RHS, %)
0%
5%
10%
15%
20%
25%
30%
0102030405060708090
100
06 07 08 09 10 11 12 13 14 15F 16F 17F 18F
(% GPM) IDR per stick
ASP hikeTax increase*Gross margin
1
2
3
5
4
January 3, 2016
Real
Est
ate
Indo
nesi
a
Aurellia Setiabudi [email protected] (62) 21 2953 0785
Lippo Cikarang (LPCK IJ)
Finishing strong amid slowdown in industry
Successful launch of fifth apartment tower On 5 Dec 2015, Lippo Cikarang successfully launched Glendale Park, the fifth apartment tower in the Orange County (OC) project where 556 units were fully sold out with proceeds of IDR530b. With this, we estimate LPCK’s YTD presales to be around IDR2,500b, achieving our FY15 presales target. Management targets FY15 presales of IDR3,000b. Glendale Park will be the last launch for 2015.
Ample land bank to sustain growth We estimate LPCK will have a land bank of 615ha at the end of FY15, comprising residential land, industrial land and its OC project. OC occupies 280ha, which will be sufficient for over 20 years of development. LPCK has also formed a 51:49 JV in Delta Silicon 8, an industrial estate, with 100ha of net land bank. We believe all this can sustain its long-term growth.
Expect product mix to change With the success of OC, we expect the company to focus on high-rise properties to maximise the efficiency of its land bank. However, we expect its margins to be slightly diluted as non-industrial land properties have lower margins. There is minimal cost of sales for selling industrial land. We expect net margin to be 40% in FY17, down from 49% in FY15.
Valuation and risks We maintain BUY with TP of IDR11,000, which implies 51% discount to RNAV. Lippo Cikarang is our Top Buy for the Indonesian property sector. The company is currently undervalued, trading at only 5.0x PER 2016 and 1.1x P/BV 2016. We expect catalysts from more successful launches and strong FDI inflow in 2016. Risks to our call include a delay in economic growth recovery, weak FDI inflow, regulatory risks and interest-rate hike.
Share Price IDR 7,250
12m Price Target IDR 11,000 (+52%)
Previous Price Target IDR 11,000
BUY
Price Performance
100
120
140
160
180
200
220
240
260
280
4,000
5,000
6,000
7,000
8,000
9,000
10,000
11,000
12,000
13,000
Jan-14 Apr-14 Jul-14 Oct-14 Jan-15 Apr-15 Jul-15 Oct-15
Lippo Cikarang - (LHS, IDR) Lippo Cikarang / Jakarta Composite Index - (RHS, %)
-1M -3M -12MAbsolute (%) (1) 9 (30)
Relative to index (%) (4) (0) (21)
Source: FactSet
FYE Dec (IDR b) FY13A FY14A FY15E FY16E FY17E
Revenue 1,327 1,792 1,946 2,246 2,508EBITDA 641 925 996 1,066 1,088Core net profit 591 836 968 995 1,015Core EPS (IDR) 849 1,201 1,391 1,429 1,458Core EPS growth (%) 45.2 41.5 15.8 2.7 2.0Net DPS (IDR) 0 0 0 0 0Core P/E (x) 8.5 6.0 5.2 5.1 5.0P/BV (x) 2.8 1.9 1.4 1.1 0.9Net dividend yield (%) 0.0 0.0 0.0 0.0 0.0ROAE (%) 38.8 37.3 30.8 24.1 19.8ROAA (%) 17.7 20.5 19.8 16.2 13.7EV/EBITDA (x) 4.8 7.6 4.5 3.8 3.6Net debt/equity (%) net cash net cash net cash net cash net cashConsensus net profit - - 950 994 1,121MKE vs. Consensus (%) - - 1.9 0.0 (9.5)
Company description
Statistics 52w high/low (IDR) 3m avg turnover (USDm) Free float (%) Issued shares (m) Market capitalisation
Major shareholders: 42.2%
696
0.4
PT Lippo Cikarang engages in the industrial estate & real estate businesses.
Kemuning Setiatama
12,250/6,250
57.8
IDR5.0T USD366M

January 3, 2016 59
Lippo Cikarang
Value Proposition
§ Leading mixed-use and industrial estate developer, Lippo Cikarang, sits on 3,261 ha of low cost, strategic land bank in the most prime industrial area in Cikarang, West Java.
§ Tapping on parent company’s strong expertise in township development, LPCK offers apartment for expatriates in the industrial estate, a successful and unique product.
§ Selling residential, commercial and industrial properties spreads the revenue risk over a larger product base, achieving a steadier and sturdier business model.
§ FCF yield ~13-18% in FY15-17. Annual presales contribution by property type
Source: Company data, Maybank KE
Price Drivers
Historical share price trend
Source: Company, Maybank Kim Eng
1. Presales doubled in 2011 from strong sales of industrial
land driven by strong FDI inflow. 2. LPCK expected to have another strong presales growth in
2012. 3. First successful launching of new mega project called
Orange County. 4. Government finally removes the overhang on property
tax regulation and introduces economic stimulus to promote industrialisation.
Financial Metrics
§ Annual presales bookings will be crucial for Lippo Cikarang as it will set the pace of its earnings momentum in the forward years.
§ We forecast presales growth of 17% and 10% in FY16F-17F, lifted by robust demand from sales of apartments.
§ Due to subdued presales growth in 2012-2014, earnings growth in FY15F-17F will be at slower pace at 4%-10% and expect stronger earnings growth in the future.
Annual presales of Lippo Cikarang
Source: Company data, Maybank KE
Swing Factors
Upside
§ Strong future presales take up for its condominiums. § Strong FDI inflow triggering purchase of industrial land. § Promotion of industrialisation and simplification for doing
business by foreign enterprise in the country.
Downside
§ Restriction on size of industrial estates by the Government which will limit expansions.
§ Restriction on number of foreign workers in Indonesia. § More industries listed as negative list investments,
limiting the number of industries which can be foreign- owned in Indonesia.
31% 39%
68%
34%19% 18% 18%
0%0%
0%
20%67% 63% 63%
0%
6%
9%
7%
3%2% 2%
69% 55% 23% 39% 12% 17% 17%
0%
10%
20%
30%
40%
50%
60%
70%
80%
90%
100%
2011 2012 2013 2014 2015F 2016F 2017F
(IDR bn) Industrial Commercial High-rise Residential
0
500
1,000
1,500
2,000
2,500
3,000
3,500
0
2,000
4,000
6,000
8,000
10,000
12,000
14,000
Dec-10 Dec-11 Dec-12 Dec-13 Dec-14
Lippo Cikarang - (LHS, IDR)
Lippo Cikarang / MSCI AC Asia ex JP - (RHS, %)
1,301
2,061
1,698 1,891
2,579 3,005
3,300
-
500
1,000
1,500
2,000
2,500
3,000
3,500
2011 2012 2013 2014 2015F 2016F 2017F
(IDR bn)
1 2
3 4

January 3, 2016
Tele
com
mun
icat
ions
In
done
sia
Pandu Anugrah [email protected] (62) 21 2557 1137
Emanuella Clarissa [email protected] (62) 21 2557 1135
Telekomunikasi Indonesia (TLKM IJ)
Best positioned
BUY with TP of IDR3,500 Benign competition has allowed TLKM to follow the sector in raising tariffs, particularly for voice and data, where growth continues. Room for further price adjustments remains ample for data, particularly as TLKM’s tariffs are the lowest among operators in Asia. Additional growth could come from data as the outlook remains promising given continued deployment of 3G and the early stage of 4G LTE. TLKM is the best positioned, as it has the lowest net debt among peers, ensuring rapid capex to help sustain its No. 1 position. TP of IDR3,500 using DCF-based valuation.
Easing competition leads to price rationalization Fierce competition has gradually abated and room to increase data prices remains ample. All the key indicators suggest this growth will persist, which would help TLKM to continue to achieve double-digit revenue expansion (12% p.a) and the country’s highest EBITDA margin.
Data traffic to continue to surge Strong data consumption will remain the main underpinning growth factor for TLKM, as we expect data traffic growth of 49% CAGR in FY16-2017F. TLKM has the widest network coverage and consistent network rollouts in Indonesia. This will continue to support its leading position, particularly as it has the lowest gearing. While higher smartphone penetration will continue to spur rollout in 3G network, early stage deployment of 4G BTS suggests more upside for data payload.
Lowest net gearing for swift expansion A strong capital structure will continue to underpin TLKM’s ability to stay ahead of competitors. The upcoming completion of re-farming (i.e. government reallocation of spectrum) would require spending if 4G handset penetration turns out to be faster than expected. TLKM’s marginal net gearing (only 1.5% in 9M15 vs. 170% sector) suggests it has the ability to fund network expansion the quickest among its competitors.
Share Price IDR 3,105
12m Price Target IDR 3,500 (+13%)
Previous Price Target IDR 3,500
BUY
Statistics52w high/low (IDR)3m avg turnover (USDm)Free float (%)Issued shares (m)Market capitalisation
Major shareholders:52.6%
100,800
15.9
Government
3,135/2,600
47.4
IDR313.0TUSD22.7B
Price Performance
90
100
110
120
130
140
150
2,000
2,200
2,400
2,600
2,800
3,000
3,200
Jan-14 Apr-14 Jul-14 Oct-14 Jan-15 Apr-15 Jul-15 Oct-15
Telkom - (LHS, IDR) Telkom / Jakarta Composite Index - (RHS, %)
-1M -3M -12MAbsolute (%) 6 17 8
Relative to index (%) 3 8 23
Source: FactSet
FYE Dec (IDR b) FY13A FY14A FY15E FY16E FY17E
Revenue 82,967 89,696 100,714 112,736 126,077EBITDA 41,086 44,965 49,732 56,369 63,130Core net profit 14,205 14,638 15,384 17,280 19,796Core EPS (IDR) 141 145 153 171 196Core EPS growth (%) 10.5 3.0 5.1 12.3 14.6Net DPS (IDR) 83 99 87 92 103Core P/E (x) 22.0 21.4 20.3 18.1 15.8P/BV (x) 5.2 4.6 4.2 3.8 3.4Net dividend yield (%) 2.7 3.2 2.8 2.9 3.3ROAE (%) 25.3 22.8 21.6 22.0 22.7ROAA (%) 11.9 10.9 10.2 10.3 10.7EV/EBITDA (x) 5.7 7.0 6.8 6.1 5.4Net debt/equity (%) 1.0 8.5 7.7 7.6 3.3Consensus net profit - - 16,168 18,258 20,468MKE vs. Consensus (%) - - (4.9) (5.4) (3.3)

January 3, 2016 61
Telekomunikasi Indonesia
Value Proposition
§ Supported by the widest and most superior network coverage in Indonesia, TLKM dominates both fixed-line and mobile with subscriber market share of more than 50%.
§ Captures high-value subscribers vs. competitors’ low to mid-end subscribers. TLKM’s return profile may improve further as it is best positioned to capture 4G opportunity.
§ Sustainable ROE above 20%, the highest in the sector. Diversified income streams with additional growth trajectory from broadband and digital.
§ Strong capital structure enables consistent capex deployment to further extend its lead from the competition.
Market share based on number of subscribers
Source: Company
Price Drivers
Historical share price trend
Source: Company, Maybank Kim Eng
1. Benign competition with growth saturation concern on
legacy business resulted in flat share price movement. 2. Early adoption of smartphones, underpinning growth in
data cellular. 3. Share swap announcement on TLKM’s tower business with
TBIG. While the deal was recently cancelled, TLKM is planning alternative strategy to unlock its tower business.
4. Data cellular continued to show robust growth.
Financial Metrics
§ Data is key driver for TLKM to rebalance growth saturation in legacy business of voice and SMS.
§ Moderation in competition should see data upside from firmer pricing, improving growth and profitability profile.
§ ARPU improvement to IDR45k was followed by strong revenue growth of 21% YoY in 3Q15, suggesting a healthy competitive environment.
§ Our EBITDA margin recovery assumption in 2016 (to 50% from 49% in 2015) is a result of higher price adoption in voice and data.
Data traffic growth
Source: Company
Swing Factors
Upside
§ Higher and faster-than-expected pace of increase in data price.
§ Further increase in voice tariff to negate the impact of growth saturation in traffic.
§ Announcement of new strategy to unlock its tower division of Mitratel, which could be implemented through different scenarios such as divestment or IPO.
§ Potential winning on 10MHz spectrum auction on 2100MHz frequency.
Downside
§ Competition heats up again, particularly in data. § Faster-than-expected adoption of data voice apps, as this
could potentially result in a swift growth deceleration in legacy business of voice.
§ Policy implementation on tower sharing and lower interconnection fee.
51% 56% 53% 52% 55% 52% 53% 56%
29% 23% 25% 25% 25% 24% 24% 26%
20% 22% 23% 23% 20% 24% 23% 18%
0%
10%
20%
30%
40%
50%
60%
70%
80%
90%
100%
2008 2009 2010 2011 2012 2013 2014 2015YTDEXCL ISAT TLKM
80100120140160180200220240260
1,2001,4001,6001,8002,0002,2002,4002,6002,8003,000
Dec-10 Dec-11 Dec-12 Dec-13 Dec-14
Telkom - (LHS, IDR) Telkom / MSCI AC Asia ex JP - (RHS, %)
0%
20%
40%
60%
80%
100%
120%
140%
160%
0
20
40
60
80
100
120
140
160Pb
Data traffic (Pb) Data traffic growth YoY
1
2
3
4

January 3, 2016
Cons
truc
tion
In
done
sia
Pandu Anugrah [email protected] (62) 21 2557 1137
Waskita Karya (WSKT IJ)
Raising the bar
Top sector pick; BUY with TP of IDR2,200 Recent decision to enter the toll-road industry should support estimated net-profit growth of 48% YoY in FY16 (EPS +19% YoY on rights issue), potentially the strongest in the sector. WSKT is our top pick in the sector with catalysts expected from: i) backlog growth of 74% YoY; ii) early-stage expansion into higher-margin businesses; and iii) recurring income from toll-road subsidiary. Our TP is based on 25x 2016 P/E, in line with the sector.
Evolving into toll-road operator WSKT’s latest acquisition of the 54km Ciawi – Sukabumi has turned it into the second-largest toll-road operator. New concessions in the pipeline total 204km; toll roads in operation total 35km. Its diversification to toll roads should result not only in revenue from construction work but also recurring income, longer term. This could improve margins, as toll roads have typical gross margins of 20-25% vs 10-12% for general construction.
Strong backlog to support growth Order wins are close to IDR30t (+33% YoY) in 2015, the strongest in the sector. This should translate into a backlog of IDR32t (+74% YoY), more than enough to support double-digit earnings growth, in our estimation. WSKT’s new-order momentum is underpinned by its participation in infrastructure projects.
Strong funding access Net cash of IDR4t estimated for 2015 should be supportive of expansion. Further funding could come from any bond issuance and its bank-loan facilities.
Share Price IDR 1,670
12m Price Target IDR 2,200 (+32%)
Previous Price Target IDR 2,200
BUY
Statistics52w high/low (IDR)3m avg turnover (USDm)Free float (%)Issued shares (m)Market capitalisation
Major shareholders:71.0%
13,572
3.7
Government of Indonesia
1,870/1,360
29.0
IDR22.7TUSD1.6B
Price Performance
100
150
200
250
300
350
400
450
500
550
200
400
600
800
1,000
1,200
1,400
1,600
1,800
2,000
Jan-14 Apr-14 Jul-14 Oct-14 Jan-15 Apr-15 Jul-15 Oct-15
Waskita Karya - (LHS, IDR) Waskita Karya / Jakarta Composite Index - (RHS, %)
-1M -3M -12MAbsolute (%) 4 8 17
Relative to index (%) 1 (1) 33
Source: FactSet
FYE Dec (IDR b) FY13A FY14A FY15E FY16E FY17E
Revenue 9,687 10,287 14,711 20,454 26,402EBITDA 724 913 1,294 1,971 2,689Core net profit 368 501 799 1,181 1,434Core EPS (IDR) 38 52 73 87 106Core EPS growth (%) 44.9 36.2 40.9 19.9 21.5Net DPS (IDR) 2 11 9 12 17Core P/E (x) 44.1 32.4 23.0 19.2 15.8P/BV (x) 6.8 5.7 2.1 2.3 2.0Net dividend yield (%) 0.1 0.7 0.5 0.7 1.0ROAE (%) 16.8 19.2 13.7 12.6 13.7ROAA (%) 4.3 4.7 4.8 5.2 5.2EV/EBITDA (x) 6.0 16.9 11.0 10.9 8.4Net debt/equity (%) 20.1 51.5 net cash net cash 0.2Consensus net profit - - 751 1,043 1,296MKE vs. Consensus (%) - - 6.5 13.2 10.7

January 3, 2016 63
Waskita Karya
Value Proposition
§ Pure construction play, with >90% revenue from general construction, highest in the sector.
§ Highest exposure to government-related projects with 60% market share in toll road construction work, mainly due to long-term strategy of investment participation in toll road concession.
§ Recent forays as toll road operator should provide stable recurring income and transforming risk-return profile, providing room for earnings growth acceleration.
Revenue contribution from construction
Source: Company
Price Drivers
Historical share price trend
Source: Company, Maybank Kim Eng
1. Concern on higher raw material prices from the
weakening IDR. 2. Concern of higher raw material costs was overdone, as
contractor is well-equipped to pass on the higher cost. 3. Positive hopes on the structural reform of infrastructure
outlook given removal of fuel subsidy. 4. Rights issue completion with exercise price of IDR1,450. 5. Share price range-bound on awaiting full impact from
WSKT’s recent strong contract winning to earnings.
Financial Metrics
§ Backlog project and order book to revenue provide indications about forward earnings. WSKT’s order book to revenue will sustain at more than 3x over the period of 2016F-2017F, 2nd highest in the sector.
§ Construction margins, typically razor thin, should improve as WSKT recently turned toll road operator as well.
§ WSKT has the strongest capital structure, more than adequate to take up sizeable projects ahead without sacrificing net margin.
Order book to revenue
Source: Company
Swing Factors
Upside
§ Faster than expected capacity expansion higher margin business profile of pre-cast segment.
§ Further significant job winning in 2016. § Indicative announcement of further government capital
injection.
Downside
§ Higher than expected loan withdrawal which would result in higher interest expense and potential erode thin razor net margin profile of contractor.
§ Margin erosion from further significant swing in IDR currency.
§ Lower than expected traffic volume on its toll road portfolios.
0102030405060708090
100
2011 2012 2013 2014 2015F 2016F
%
ADHI WIKA PTPP WSKT
50100150200250300350400450500
200400600800
1,0001,2001,4001,6001,8002,000
Dec-12 Jun-13 Dec-13 Jun-14 Dec-14 Jun-15
Waskita Karya - (LHS, IDR)
Waskita Karya / MSCI AC Asia ex JP - (RHS, %)
-
0.5
1.0
1.5
2.0
2.5
3.0
3.5
4.0
2009 2010 2011 2012 2013 2014 2015
(x)
WIKA PTPP ADHI WSKT
1 2
3
5 4

This page has been left blank intentionally

January 3, 2016 65
Waskita Karya

January 3, 2016
STRA
TEG
Y M
alay
sia
Stock Bloomberg Mkt Cap Rating Price TP Upside PER (x) P/BV (x) Dividend Yield (%) Code (USD m) (MYR) (MYR) (%) CY15E CY16E CY15E CY16E CY15E CY16E
Tenaga Nasional TNB MK 17435.8 Buy 13.26 16.00 20.7 9.0 9.1 1.5 1.4 2.5 3.1 Genting Bhd GENT MK 6401.5 Buy 7.34 9.05 23.3 17.4 14.8 1.0 0.9 0.4 0.5 Gamuda GAM MK 2623.4 Buy 4.68 6.00 28.2 14.5 16.5 1.6 1.7 2.7 2.6 Top Glove TOPG MK 1992.5 Buy 13.62 16.60 21.9 23.7 20.9 5.0 4.5 1.9 2.4 Inari Amertron INRI MK 838.5 Buy 4.78 5.35 11.9 17.8 16.4 5.6 4.9 2.2 2.4 Media Chinese International MCIL MK 235.9 Buy 0.60 0.73 21.7 6.7 7.3 1.2 1.1 6.5 6.7 Source: Maybank KE
Malaysia’s Six-for-16
Externally Induced Volatility
Externally induced volatilities We expect volatility to persist, largely externally induced; headwinds are US’ monetary policy normalisation, China’s structural slowdown, and the impact to EMs. A wild card for Malaysia is crude oil price. Our end-2016 KLCI target is 1,800 (+6.3% upside), tagging to mean valuations (implying 15.6x 2017 PER). We continue to advocate a defensive core equity portfolio with value and thematic stocks for the outperformance.
Pressure points Crude oil price has fallen to USD35/bbl (Brent) and this represents a new pressure point. We expect real GDP growth to ease to 4.5% (2015E: 4.9%) on slower domestic demand due to moderating consumer spending and private investment, cushioned by public investment rebound. We expect inflation to pick up to 3.0-3.5% (2015E: 2.2%) and the USDMYR to move within the 3.95-4.15 range and average 4.11 amid dissipation of internal political risks, countered by the external headwinds and fluid crude oil price situation. Slower growth, rising inflation and soft MYR will render the OPR “immobile” at 3.25%. For the corporates, we forecast 7.5% core earnings growth for the KLCI in 2016, 7.7% in 2017. Earnings risk remains on the downside; pressure points are at the banks, consumer, plantation.
Positives and key thematics The Trans-Pacific Partnership could be a game-changer for Malaysia as it will strengthen Malaysia’s niches and open up more engines of long term growth. Malaysia is also a strategic beneficiary of China’s One Belt One Road initiative. Investors should raise their holdings in stocks which are beneficiaries – largely in the export sectors, construction – over time. For 2016, we outline three key thematics: (i) substantial construction awards relating to infrastructure, government land developments, (ii) continued weakness in the MYR, and (iii) Shariah investing.
Malaysia’s top six Our top value BUY picks for 2016 are Tenaga (which has strong re-rating potential with the overhang on M&A now cleared), GENT (deep in value), and MCIL (significantly undervalued). Within the thematics, our top picks are Gamuda (a key beneficiary of major infra works), Top Glove (new bellwether in the glove sector), Inari (proxy to Avago’s bright prospects).
(Please refer to our macro and strategy write-up entitled, “2016 Outlook & Lookouts” dated 14 Dec 2015 for more details)
Analyst Wong Chew Hann (603) 2297 8686 [email protected]

January 3, 2016 67
Malaysia’s Six-for-16
1. Idea 1: Action packed year for construction
1.1 Record infrastructure job awards
2015 has been an eventful year with four project delivery partners named for four major projects worth a total MYR80b – KVMRT2, KVLRT 3, Penang Transport Master Plan, Pan Borneo Sarawak Highway. Into 2016, we expect an action packed year based on our estimate of MYR83b worth of infra jobs to be awarded, which will be a record high after MYR46b in 2012. This would offset slower property-related construction jobs due to the soft property market. Beyond 2016, the KL-SG HSR and KVMRT 3 are the major infrastructure projects to sustain construction jobs momentum.
1.2 Watch out for the China factor
Malaysia is a strategic beneficiary of China’s One Belt One Road initiative. Chinese contractors have expressed interest in the rail projects, specifically, the Gemas-JB double track rail and KL-SG HSR. Malaysian contractors could partner them in bidding for the projects. With the Chinese’s ability to offer attractive financing packages, this would raise their chances of winning the projects while at the same time, it would allay concerns on project funding. The Chinese has also invested in Kuantan, Iskandar Malaysia and stated their interests in Bandar Malaysia and Melaka Gateway, which would further drive construction activities.
1.3 Local content to stay; costs remain favourable
With growing foreign investments, foreign contractors’ participation has also risen. We believe the local content requirement for major infrastructure projects would still be preserved. The Trans-Pacific Partnership Agreement (TPPA), that mandates the liberalisation of government procurement of construction services to TPPA countries, would have a neutral impact as the key infrastructure projects could be exempted. Elsewhere, building material costs remain favourable to contractors with the domestic cement industry in overcapacity and continuous dumping activities in the long steel sector.
1.4 Positive on construction; stock picks
We are positive on the construction sector. We prefer players with niche expertise and strong track records, as they would be the key beneficiaries of the slew of job awards in 2016. Our sector Top BUY is Gamuda, while SCG is our preferred mid-cap pick. We continue to like IJM due to its substantial order book and priced assets.

January 3, 2016 68
Malaysia’s Six-for-16
Summary of upcoming projects in Malaysia
Value (MYR b)
Public transportation
KVMRT line 2 (52.2km) 28.0 PDP awarded. Tenders have started, awards in mid-2016. Works expected to start in 2H16.
KVLRT 3 (Bandar Utama-Shah Alam-Klang, 36.0km) 9.0 PDP awarded. Tenders have started, awards in mid-2016. Works expected to start in 2H16.
Electrified double track rail (Gemas-JB) 7.1 Tender is ongoing.
KL-Spore High Speed Rail (400km) 40.0 RFI ongoing. Works to be awarded in 2017 and construction to start in 2018.
Penang Integrated Transportation Plan (includes LRT and highways)
27.0 PDP awarded. Tenders to start in end-2016 and works to start in 2017.
KL-Klang BRT line 1.0 Construction to start in 2016 and complete in 2018.
KVMRT line 3 NA Pending.
Johor LRT 1.2 Pending.
ERL extension to Melaka 8.0 Pending.
Monorail extension 3.0 Pending.
Freight Relief line (Serendah - Port Klang - Seremban) 3.0 Pending.
East Coast Railway 30.0 Pending.
Other infrastructure
West Coast Expressway (WCE) – 276km (remaining) 2.2 MYR2.8b was awarded to IJMC.
Pan-Borneo Highway – 1,663km (936km in Sarawak, 727km in Sabah)
27.0 Sarawak portion’s PDP awarded. Tenders to start soon. Sabah’s portion PDP still not awarded yet.
Damansara-Shah Alam Highway (DASH) - 47km 4.2 Tender is ongoing.
Sungai Besi-Ulu Klang Expressway (SUKE) - 59km 5.3 Tender is ongoing.
Jalan Tun Razak traffic dispersal project 0.9 Announced in National Budget 2016.
RAPID, Pengerang NA Tendering for sub-contracts ongoing.
Baram and Balleh hydro power plants, Samalaju combined cycle power plant
NA Feasibility studies ongoing.
Major property developments GDV
KL118 Tower (Warisan Merdeka) 6.0 Samsung-UEM won the MYR2.1b superstructure works.
Bukit Bintang City Centre (BBCC) 8.7 EPF, Uda Land and Eco World to jointly develop the land. Construction to start soon.
Tun Razak Exchange (TRX) 27.0 Signed agreement with Lend Lease to develop mixed commercial development, Indonesia’s Mulia Group to develop the Signature Tower, LTH for a residential plot, Veolia Water Technologies to provide water recycling and treatment plant and Affin Bank for commercial development. Tenders for infrastructure works are ongoing.
Kwasa Damansara Township 50.0 Land tenders have been progressing. First package of infrastructure works was awarded recently and more packages would be awarded.
Bandar Malaysia 20.0 Tender for property development partner ongoing.
Cyber City Center, Cyberjaya 11.0 Announced in National Budget 2016.
KLIA Aeropolis 7.0 Announced in National Budget 2016.
Malaysian Vision Valley 5.0 Announced in National Budget 2016.
Sepang International City 48.0 GuocoLand's project.
Malacca Gateway 43.0 Investments from China to develop a mixed development with the largest private marina.
Source: Various, compiled by Maybank KE

January 3, 2016 69
Malaysia’s Six-for-16
New contracts reported to CIDB, MYR69.5b in 9M14 Government versus private sector jobs award
Source: CIDB (Construction Industry Development Board) Source: CIDB
Category of new contracts 9M15 Category of new contracts 2007-2014
Source: CIDB Source: CIDB
Construction Sector
Stock Rec Share price Mkt Cap TP PER (x) PBV (x) ROE (%)
Net dividend yield (%)
(MYR) (MYR m) (MYR) CY15E CY16E CY17E CY15E CY16E CY15E CY16E CY16E Cahya Mata Sarawak Buy 5.10 5479.3 5.35 22.3 18.1 17.2 2.7 2.4 11.9 13.5 2.2 Eversendai Corp Buy 0.78 599.9 1.00 10.6 9.3 9.2 0.6 0.6 5.9 6.4 2.2 Gamuda Buy 4.68 11259.7 6.00 16.5 16.6 15.8 1.8 1.7 10.6 10.4 2.6 Hock Seng Lee Buy 1.92 1163.9 2.15 13.7 11.3 10.9 1.6 1.5 11.9 13.1 1.7 IJM Corporation Buy 3.37 12046.2 3.70 18.8 17.6 15.3 1.3 1.3 7.0 7.4 2.2 Kimlun Bhd Hold 1.40 420.8 1.20 8.6 11.6 11.1 1.0 0.9 11.2 7.9 2.3 Lingkaran Trans Kota Hold 5.00 2610.3 4.90 15.7 10.8 9.7 4.4 3.5 27.9 32.9 4.0 Sunway Construction Group Buy 1.37 1771.3 1.50 14.6 12.3 11.9 4.9 3.9 33.3 31.5 2.8 WCT Holdings Buy 1.63 1957.3 2.30 19.1 14.5 13.3 0.8 0.8 4.3 5.9 3.8
Source: Maybank Kim Eng
51 48 45 53 55 60
94 85 7491 99
128131157
70
0
2
4
6
8
10
0
50
100
150
200
2001
2002
2003
2004
2005
2006
2007
2008
2009
2010
2011
2012
2013
2014
9M15
(no. '000)(MYR b)New contract value (LHS) No. of contracts (RHS)
0.0%
10.0%
20.0%
30.0%
40.0%
50.0%
60.0%
0.0
50.0
100.0
150.0
2001
2002
2003
2004
2005
2006
2007
2008
2009
2010
2011
2012
2013
2014
9M15
(MYR b) Govt (LHS) Private (LHS)
Infrastructure
18%
Residential42%
Non-residential
36%
Social amenities
4%Infrastructu
re29%
Residential25%
Non-residential
36%
Social amenities
10%

January 3, 2016 70
Malaysia’s Six-for-16
2. Idea 2: Continued weakness in the MYR
2.1 To remain volatile
After retracing about 26% against the USD since Aug 2014, we expect the MYR to average 4.11 per USD in 2016, a further weakening from the average 3.91 in 2015. On a quarterly basis, our FX Research team sees a temporary strengthening in MYR versus USD to 3.95 at end 1Q16 primarily on dissipating internal political risks and expected repatriations by GLCs/ GLICs in response to Aug 2015’s policy announcement encouraging them to bring back overseas investment income. However, further US interest rate hikes post the Dec 2015 lift-off will reassert its impact in the subsequent three quarters of 2016, to result in the USDMYR moving to the 4.10-4.15 range. The fluid crude oil price situation could rekindle concerns on fiscal and current account balances, impacting the MYR.
2.2 Export-related sectors to do well
The continued weakness in the MYR will mean that export-related sectors like glove, semiconductor, petrochemical, etc, will continue to do well in earnings, while the domestic net importers like automotive, consumer, etc, will continue to see margins under pressure. For the consumer related sectors, it would be compounded by subdued consumer sentiment and spending which we expect to last into mid-2016, at least. Also, companies with high USD debt will continue to see volatile forex gains/ losses (although at a lesser extent than in 2015) at each financial quarter end. Big cap PLCs affected in 2015 were IOI, AirAsia, Tenaga, PGas, Astro.
2.3 Playing to the tune
We are positive on the glove, semiconductor and petrochemical sectors, which are net USD beneficiaries. For the glove makers, almost all of their sales receipts are USD-denominated while 30-50% of their production costs are in USD (our forecasts impute an average 4.10 USDMYR). As for semiconductor, 90%/65%/85% of Inari/Globetronics/Vitrox’s revenues are in USD compared to 70%/70%/30% of their COGS (our base assumption is an average 4.10 USDMYR). As for petrochemical or specifically PCHEM, all of its revenue are USD-denominated, while c.70% of costs are USD linked.
2.4 Stock picks
Our top BUY pick in the glove sector is Top Glove, while our top BUY in semiconductor is Inari. Besides being net beneficiaries of a weaker MYR against the USD, Top Glove is also the new bellwether in the glove sector while Inari offers an exposure to Avago’s growth prospects. PCHEM, a BUY, also offers organic growth coming from a new plant commissioning in 2Q16. Our other BUYs in this thematic are Kossan, Globetronics, Vitrox.

January 3, 2016 71
Malaysia’s Six-for-16
MYRUSD has weakened for the 3rd year
Source: Bloomberg, Maybank KE (chart)
USD denominated debts of Malaysia PLCs
Source: Maybank KE (computation)
USD net beneficiaries
Stock Rec Share price Mkt Cap TP PER (x) PBV (x) ROE (%)
Net dividend yield (%)
(MYR) (MYR m) (MYR) CY15E CY16E CY17E CY15E CY16E CY15E CY16E CY16E Top Glove Buy 13.62 8551.7 16.60 26.4 20.9 20.5 5.0 4.5 19.1 21.5 2.4 Kossan Rubber Industries Buy 9.17 5863.9 10.20 28.3 25.5 22.6 6.2 5.4 22.0 21.3 1.6 Hartalega Hold 5.91 9697.5 4.80 36.7 30.9 27.1 6.8 6.0 18.4 19.5 1.5 Inari Amertron Buy 4.78 3599.0 5.35 19.9 16.7 15.1 6.0 4.9 29.9 29.4 2.4 Globetronics Technology Buy 6.57 1851.1 7.35 24.1 15.2 13.9 6.3 6.1 26.1 39.9 5.9 ViTrox Corp Buy 3.49 814.6 3.80 15.8 12.4 12.2 3.9 3.2 24.5 25.6 2.3 Petronas Chemicals Buy 7.24 57920.0 7.80 20.6 16.5 17.3 2.3 2.2 11.3 13.1 3.0
Source: Maybank Kim Eng
0.220
0.240
0.260
0.280
0.300
0.320
0.340
Jan-12 Jul-12 Jan-13 Jul-13 Jan-14 Jul-14 Jan-15 Jul-15
MYRUSD Curncy
Year average
82%87%
100%
51%
83%74%
43%28%
85%
29%
44%
26%
44%
7% 6%
27%
99%
19%9%
0%0%
15%
30%
45%
60%
75%
90%
105%
-
2,000
4,000
6,000
8,000
10,000
12,000
14,000
SAKP
AirA
siaMI
SCSi
me IOIC
BAB
Axiat
aGE
NTUM
WH
Maxis
Sunw
ayTe
lekom
Astro TNB
YTLP
IJMC
AirA
sia X
FGV
IHH
SPSB
USD debt (MYRm) (LHS) % of total debt (RHS)

January 3, 2016 72
Malaysia’s Six-for-16
3. Idea 3: Shariah investing
3.1 Moves to a higher level
The Employees Provident Fund Bill (Amendment) 2015 was passed by the House of Representatives on 22 Oct 2015, which among others, provides for election by members for their accounts to be managed according to Shariah. We expect the Bill to be gazetted by mid-2016 after approval by the Senate and royal assent by His Majesty The King. We estimate that members’ election could happen from mid-2016, and Shariah investing (for those who elect for it) could start in early-2017.
3.2 Largest Shariah fund ever
EPF’s extension into a dedicated Shariah fund was announced by Prime Minister Najib on 23 Apr 2015; it “will create the largest Shariah fund of its kind in the world”. This is a significant development, considering that: (i) the size of EPF’s investment assets is huge at MYR667.6b as at Sep 2015, (ii) just more than 40% of EPF’s asset are Shariah compliant, (iii) about 60% of EPF’s members are Malay Muslim (source for (ii), (iii) is the Sundaily, 27 Apr 2015). The impact on the Malaysia capital market can be better gauged when the total asset value of members electing for Shariah investing is known, after the members’ election, expected in 2H16.
3.3 Higher re-rating potential
The number of Shariah compliant stocks listed on Bursa Securities stood at 667 (74%) as at end-Nov 2015, out of the total 901 listed. We reiterate our view that Shariah stocks have a higher re-rating potential over the longer term as Shariah investing gains prominence. We have highlighted this re-rating potential since 2013, during the run up to the Securities Commission’s new Shariah screening methodology to better reflect international practices.
3.4 Stock picks
The following sectors under our research coverage are now fully/almost fully Shariah compliant: (i) automotive (ex- Tan Chong), (ii) construction (ex- Eversendai), (iii) glove producers, (iv) oil & gas (ex- Perdana), (v) plantation, (vi) semi-conductor, (vii) property developer, (viii) telco, (ix) non-air transportation and (x) utilities (ex- YTLP). Our top BUY pick for Shariah investing is BIMB, being one of only two Shariah stocks in the financial sector, the other being its 60%-subsidiary, Syarikat Takaful. Tenaga, our top big-cap BUY for the market, is also Shariah compliant.

January 3, 2016 73
Malaysia’s Six-for-16
EPF: Total investments of MYR667.6b as at Sep 2015 EPF: Of total of MYR667.6b, 27% were overseas investments
Source: Employees Provident Fund, Maybank KE Source: Employees Provident Fund, Maybank KE
Shariah stocks in our BUY list
Stock Rec Share price Mkt Cap TP PER (x) PBV (x) ROE (%)
Net dividend yield (%)
(MYR) (MYR m) (MYR) CY15E CY16E CY17E CY15E CY16E CY15E CY16E CY16E Financials BIMB Holdings Buy 3.74 5767.9 4.50 10.9 10.7 10.4 1.7 1.5 15.2 14.2 3.3 Auto Berjaya Auto Buy 2.14 2444.8 2.85 11.0 9.4 8.1 4.5 3.6 40.6 38.3 5.3 Construction Gamuda Buy 4.68 11259.7 6.00 16.5 16.6 15.8 1.8 1.7 10.6 10.4 2.6 Hock Seng Lee Buy 1.92 1163.9 2.15 13.7 11.3 10.9 1.6 1.5 11.9 13.1 1.7 IJM Corporation Buy 3.37 12046.2 3.70 18.8 17.6 15.3 1.3 1.3 7.0 7.4 2.2 WCT Holdings Buy 1.63 1957.3 2.30 19.1 14.5 13.3 0.8 0.8 4.3 5.9 3.8 Cahya Mata Sarawak Buy 5.10 5479.3 5.35 22.3 18.1 17.2 2.7 2.4 11.9 13.5 2.2 Sunway Construction Group Buy 1.37 1771.3 1.50 14.6 12.3 11.9 4.9 3.9 33.3 31.5 2.8 Glove producers Top Glove Buy 13.62 8551.7 16.60 26.4 20.9 20.5 5.0 4.5 19.1 21.5 2.4 Kossan Rubber Industries Buy 9.17 5863.9 10.20 28.3 25.5 22.6 6.2 5.4 22.0 21.3 1.6 Media Media Chinese International Buy 0.60 1012.3 0.73 7.5 7.5 6.8 1.2 1.1 16.0 14.3 6.7 Oil & Gas Dialog Group Buy 1.54 8001.1 1.90 29.7 28.3 26.4 3.7 3.4 12.5 12.2 1.4 Icon Offshore Buy 0.43 506.2 0.42 33.7 16.6 12.5 0.5 0.5 1.4 2.7 0.0 Bumi Armada Buy 1.04 6100.9 1.20 30.3 27.2 7.6 1.0 0.9 3.2 3.4 0.0 Yinson Holdings Buy 2.90 3169.1 4.35 16.8 16.3 13.8 1.9 1.7 11.1 10.4 0.7 KNM Group Buy 0.51 1099.6 0.80 18.0 8.6 6.5 0.4 0.4 2.1 4.7 0.0 Plantation Boustead Plantations Buy 1.43 2288.0 1.56 58.3 33.3 26.0 1.0 1.0 1.7 2.9 2.4 Sarawak Oil Palms Buy 4.45 1962.3 5.23 28.9 12.8 9.0 1.4 1.3 4.9 10.1 0.9 Ta Ann Buy 5.00 1853.7 6.90 11.2 11.0 10.0 1.6 1.5 14.4 13.6 4.1 Semiconductor Inari Amertron Buy 4.78 3599.0 5.35 19.9 16.7 15.1 6.0 4.9 29.9 29.4 2.4 ViTrox Corp Buy 3.49 814.6 3.80 15.8 12.4 12.2 3.9 3.2 24.5 25.6 2.3 Globetronics Technology Buy 6.57 1851.1 7.35 24.1 15.2 13.9 6.3 6.1 26.1 39.9 5.9 Petrochemical Petronas Chemicals Buy 7.24 57920.0 7.80 20.6 16.5 17.3 2.3 2.2 11.3 13.1 3.0 Property & REIT SP Setia Buy 3.15 8279.3 3.86 12.7 17.8 8.6 1.1 0.9 11.9 7.1 3.4 Eco World Development Buy 1.47 3475.5 1.68 50.8 29.6 16.2 1.1 1.1 1.7 3.8 0.3 Al-Salam REIT Buy 0.91 524.9 1.07 nm 0.9 0.5 0.9 0.9 5.5 6.0 5.8 KLCCP Stapled Group Buy 7.05 12727.6 7.80 17.9 17.4 17.3 1.2 1.4 6.4 8.0 5.3 Logistic Westports Holdings Buy 4.11 14015.1 4.80 27.4 23.4 21.4 7.4 6.9 27.0 29.4 3.2 Harbour-Link Group Buy 2.94 535.1 3.65 10.0 9.3 9.6 1.8 1.6 18.3 17.5 2.1 MISC Bhd Buy 9.37 41825.7 10.10 17.0 17.5 18.1 1.4 1.4 8.4 7.8 2.1 Utility Tenaga Nasional Buy 13.26 74834.3 16.00 10.1 9.1 8.8 1.5 1.4 15.1 15.0 3.1 Gas Malaysia Buy 2.36 3030.2 2.70 24.6 23.9 23.7 3.0 3.0 12.2 12.5 4.2 Malakoff Corporation Buy 1.62 8100.0 1.95 18.0 13.8 14.7 1.4 1.3 7.6 9.7 5.1
Source: Maybank Kim Eng
MGS & equiv26.6%Loans & bonds
24.8%
Equities42.8%
Money mkt instrumts
2.8%Real estate &
infra3.1%
0
100,000
200,000
300,000
400,000
500,000
600,000
700,000
800,000
2012 2013 2014 9M15MYR m
Overseas Domestic

January 3, 2016
Uti
litie
s M
alay
sia
Tan Chi Wei, CFA [email protected] (603) 2297 8690
Tenaga Nasional (TNB MK)
Overhang removed
Investment case: Compellingly valued With the overhang pertaining to potential M&A/bailout having now cleared, investors’ attention will likely return to Tenaga’s earnings, which have remained at very healthy levels. Valuations (at c.9x forward PER) are compelling, and allow for ample leeway for a possible MYR2b tax charge. Our MYR16.00 TP is derived from DCF, and implies a mere 12.5x FY16 PER. Tenaga is our top big-cap pick for the market.
Catalysts: Delivery of healthy earnings Tenaga’s base-level earnings are likely to trend higher from an improvement in its reference generation mix (a higher proportion of coal-generation which lowers overall unit cost). The market will likely focus on Tenaga’s earnings delivery in the upcoming quarters, beginning with 1QFY16 results which should be released at end-Jan 2016.
Valuations: At a discount to the market Tenaga presently trades at a steep discount to the market on PER, with minimal earnings risk as both coal and LNG prices are presently below reference. Our MYR16.00 TP is derived using DCF, assuming a 7.5% WACC and 1% long-term growth, and implies a mere 12.5x FY16 PER. Tenaga is presently appealing a c.MYR2b tax charge, but we note this represents less than 3% of Tenaga’s current market cap.
Risks: A non-functional pass-through mechanism Tenaga is not meant to take on fuel price risk under the IBR. The key risk with Tenaga thus centres on the pass-through mechanism hypothetically not functioning, particularly during an environment of rising fuel prices. Rising coal prices would likely raise initial doubts over the effectiveness of the pass-through mechanism. Meanwhile, Tenaga making a provision for its c.MYR2b tax charge could also potentially dampen sentiment.
Share Price MYR 13.26
12m Price Target MYR 16.00 (+21%)
Previous Price Target MYR 16.00
BUY
Company description
StatisticsShariah status52w high/low (MYR)3m avg turnover (USDm)Free float (%)Issued shares (m)Market capitalisation
Major shareholders:32.4%13.8%11.6%
5,644
35.7
Tenaga Nasional engages in the generation,transmission, distribution and sale of electricity andthe provision of other related services.
Yes
Khazanah Nasional Bhd Employees Provident Fund Permodalan Nasional Bhd
15.10/10.36
99.6
MYR74.8BUSD17.4B
Price Performance
95
100
105
110
115
120
125
130
135
140
145
150
10.0
10.5
11.0
11.5
12.0
12.5
13.0
13.5
14.0
14.5
15.0
15.5
Dec-13 Mar-14 Jun-14 Sep-14 Dec-14 Mar-15 Jun-15 Sep-15
Tenaga Nasional - (LHS, MYR)
Tenaga Nasional / Kuala Lumpur Composite Index - (RHS, %)
-1M -3M -12MAbsolute (%) (1) 10 (5)
Relative to index (%) (2) 6 (1)
Source: FactSet
FYE Aug (MYR m) FY14A FY15A FY16E FY17E FY18E
Revenue 42,792 43,287 46,735 48,120 49,546EBITDA 11,704 13,922 15,812 16,247 16,677Core net profit 5,428 7,051 8,156 8,446 8,753Core EPS (sen) 96.2 124.9 144.5 149.7 155.1Core EPS growth (%) 33.6 29.9 15.7 3.6 3.6Net DPS (sen) 29.0 29.0 39.4 43.4 49.5Core P/E (x) 13.8 10.6 9.2 8.9 8.5P/BV (x) 1.7 1.6 1.4 1.3 1.1Net dividend yield (%) 2.2 2.2 3.0 3.3 3.7ROAE (%) 13.9 15.6 16.3 15.0 14.1ROAA (%) 5.2 6.2 6.8 6.7 6.6EV/EBITDA (x) 7.2 5.7 5.6 5.4 5.0Net debt/equity (%) 31.7 33.4 26.6 20.6 13.6Consensus net profit - - 6,965 7,067 7,198MKE vs. Consensus (%) - - 17.1 19.5 21.6

January 3, 2016 75
Tenaga Nasional
Value Proposition
§ Vertically integrated national electricity utility operating across generation (c.50% share of capacity), transmission (monopoly) and distribution (monopoly).
§ The industry is highly-regulated and tariff changes require Cabinet approval; this has resulted in the occasional negative EVA for Tenaga in the past.
§ Recent regulatory reforms (implementation of IBR) have enhanced and stabilised returns. Improved risk-return profile has seemingly not been fully priced-in.
§ The generation segment is open to new entrants, but high capital requirements coupled with diminishing returns mean Tenaga will likely retain a dominant position.
Net profit and ROIC
Source: Company, Maybank KE
Price Drivers
Historical share price
Source: Company, Maybank Kim Eng
1. The Government will compensate Tenaga for the use of
high-cost alternative fuels, both retrospectively (FY11) and going forward.
2. The 14.9% tariff hike from the implementation of IBR (the new tariff framework) was significantly accretive to Tenaga’s earnings.
3. Tenaga was reporting supernormal profits as coal prices stayed low.
4. Concerns arose over Tenaga potentially overpaying for selected domestic generation assets.
5. Bailout concerns eventually dissipated as the assets in question were eventually sold to a foreign party.
Financial Metrics
§ Share price has tended to track earnings – Tenaga’s key earnings drivers are tariffs and fuel mix.
§ With the IBR now in place, a review in base tariff will only occur in 2018 at the earliest, although there could be slight shifts from minor movements in demand mix.
§ The more pertinent driver is thus the generation mix, where a shift towards coal (currently the cheapest fuel source) will lower overall unit generation cost.
§ Peninsular Malaysia’s incoming capacity is presently skewed towards coal. Every 1ppt increase in % coal generation could boost net profit by c.4%.
Peninsular Malaysia’s generation mix
Source: Company, Maybank KE
Swing Factors
Upside
§ The fuel cost pass-through mechanism becomes fully automatic, with tariffs no longer subject to Cabinet approval.
§ A review of Tenaga’s dividend policy to allow for higher absolute payouts.
§ The resolution of a MYR2b tax dispute in Tenaga’s favour.
Downside
§ Evidence that the fuel cost pass-through mechanism is no longer functional.
§ A spike in coal prices, which would likely introduce doubts over the effectiveness of the pass-through mechanism.
§ Adverse regulatory developments, such as the introduction of windfall taxes.
0%2%4%6%8%10%12%14%16%
012345678
FY10 FY11 FY12 FY13 FY14 FY15 FY16F FY17F FY18F
(MYR b) Net profit ROICIBR begins
80
120
160
200
240
280
320
4.0
6.0
8.0
10.0
12.0
14.0
16.0
Dec-10 Dec-11 Dec-12 Dec-13 Dec-14
Tenaga Nasional - (LHS, MYR)
Tenaga Nasional / MSCI AC Asia ex JP - (RHS, %)
45% 41% 41% 39% 38% 37%
3% 14% 9% 10% 10% 9%
44% 40% 46% 46% 47% 49%
4% 2% 1% 1% 0% 0%4% 4% 4% 5% 5% 4%
0%10%20%30%40%50%60%70%80%90%
100%
FY13 FY14 FY15 FY16F FY17F FY18F
Subsidised gas LNG-sourced gas Coal Oil & distillates Hydro
1
2
3 5
4

January 3, 2016
Gam
ing
Mal
aysi
a
Yin Shao Yang [email protected] (603) 2297 8916
Genting Bhd (GENT MK)
Still has plenty of upside potential
Investment case: Apt time to own this blue-chip 2015 was probably one of GENT’s worst years but to be fair, many of the factors behind the earnings decline (e.g. low VIP hold rate and bad debts) were not structural and we expect them to normalise in 2016. Furthermore, Resorts World Genting (RWG) will undergo capacity expansion in 4Q16 and the Banten independent power plant (IPP) will commence earnings contributions in 2017. With GENT trading at a steep 35% discount to our SOP/sh, we believe that its risk-reward profile is stacked towards reward. Maintain BUY call and MYR9.05 SOP-based TP.
Catalysts: Normal VIP hold rates, GITP, Banten IPP 2015 was marred by low VIP hold rate at Genting UK coupled with low VIP hold rate and bad debts at Resorts World Sentosa. That said, these declines were not structural and we expect them to normalize in 2016. Furthermore, RWG will also expand its capacity in 4Q16 under the Genting Integrated Tourism Plan (GITP). To boot, we expect Banten IPP to boost 2017 core net profit by MYR300m-MYR350m. Construction of the Banten IPP is expected to be completed by 4Q16.
Valuation: Trading at >-1SD discount to LT mean GENT is trading at 35% discount to our SOP/sh valuation, which is more than -1SD to its long-term mean (since 2000) of 21% discount to SOP/sh. We gather that the wide discount was due to the aforementioned low VIP hold rates and bad debts. Again, we expect them to normalize in 2016 and the steep discount to SOP/sh valuation to narrow as a result. As it is, GENT is already cheaper than its major subsidiaries (49%-owned GENM is trading at >15x PER while 53%-owned GENS is trading at >20x PERs).
Risks: Exposure to China via Genting Singapore (i) Prolonged slowdown in the Chinese economy causing GENS and therefore, GENT earnings outlook to remain suppressed; (ii) Construction delays and cost overruns for its GITP projects; (iii) Further slowdown in Malaysian consumer sentiment causing GENM visitor arrivals growth to remain suppressed; (iv) Additional gaming taxes, although we view this as unlikely given the GST that has been implemented since 1 Apr 2015.
Share Price MYR 7.34
12m Price Target MYR 9.05 (+23%)
Previous Price Target MYR 9.05
BUY
Price Performance
75
80
85
90
95
100
105
110
115
6.5
7.0
7.5
8.0
8.5
9.0
9.5
10.0
10.5
Dec-13 Mar-14 Jun-14 Sep-14 Dec-14 Mar-15 Jun-15 Sep-15
Genting Bhd - (LHS, MYR)
Genting Bhd / Kuala Lumpur Composite Index - (RHS, %)
-1M -3M -12MAbsolute (%) 2 1 (18)
Relative to index (%) 1 (3) (14)
Source: FactSet
FYE Dec (MYR m) FY13A FY14A FY15E FY16E FY17E
Revenue 17,112 18,216 18,260 19,322 21,836EBITDA 6,116 6,628 5,650 6,747 8,482Core net profit 1,681 1,777 1,428 1,849 2,770Core FDEPS (sen) 45.5 46.2 35.3 44.8 65.4Core FDEPS growth(%) (27.2) 1.5 (23.5) 26.7 46.1Net DPS (sen) 37.5 4.0 3.1 3.9 5.7Core FD P/E (x) 16.1 15.9 20.8 16.4 11.2P/BV (x) 1.1 1.0 1.0 0.9 0.9Net dividend yield (%) 5.1 0.5 0.4 0.5 0.8ROAE (%) 7.2 6.8 5.2 6.4 9.0ROAA (%) 2.5 2.5 1.9 2.4 3.6EV/EBITDA (x) 8.5 7.3 7.8 6.9 5.3Net debt/equity (%) net cash net cash net cash net cash net cashConsensus net profit - - 1,662 1,934 2,162MKE vs. Consensus (%) - - (32.4) (4.4) 28.1
Company description
Statistics 52w high/low (MYR) 3m avg turnover (USDm) Free float (%) Issued shares (m) Market capitalisation
Major shareholders: 36.4% 7.0% 3.5%
3,743
6.7
Genting Bhd. is an investment holding and management company, which engages in the leisure and hospitality, oil palm plantations, property development, biotechnology, and oil and gas.
LIM FAMILY OppenheimerFunds, Inc. Summit International Investments, Inc.
9.30/6.60
59.1
MYR27.5B USD6.4B

January 3, 2016 77
Genting Bhd
Value Proposition
§ Largest casino conglomerate in South East Asia with interests in power, plantations, property and oil & gas.
§ Via 49%-owned Genting Malaysia (GENM) and 53%-owned Genting Singapore (GENS), operate Resorts World Genting (RWG) and Resorts World Sentosa (RWS).
§ ROEs have fallen from >10% pre-2012 to ~5% in 2015 due to RWS being pressured by the weak Chinese economy.
§ That said, valuations are attractive at -35% to SOP/sh or more than 1SD below its post-2000 mean of -21%.
§ We expect better performance from major subsidiaries to drive reversion to mean discount to SOP/sh.
§ GENM expanding RWG via Genting Integrated Tourism Plan (GITP). RWG is Malaysian centric and especially resilient.
Historical (discount)/premium to SOP/sh
Source: Company, Maybank KE, Bloomberg
Price Drivers
Historical share price trend
Source: Company, Maybank Kim Eng
1. GENS’ 2Q11 EBITDA fell 35% QoQ as VIP volume fell 13% QoQ and VIP hold rate fell 30% QoQ.
2. CRA issued two junket licenses to GENS but they did not positively impact VIP volumes.
3. Disposed of Genting Sanyen and entered into 25-year PPA with PT PLN for a 660MW coal-fired Banten IPP.
4. Announced 50sen special DPS and offered 1 warrant at MYR1.50 for every 4 existing shares.
5. Foreign fund outflows driven by the weak MYR pressured GENT’s share price due to its high foreign shareholding.
6. GENS reported 2Q16 net loss due to derivative and foreign exchange losses.
Financial Metrics
§ Key financial metric is EBITDA. Most casino operators are valued on EV/EBITDA basis.
§ Forecast FY15E EBITDA to fall 15% YoY on poor VIP hold rates at GENUK and RWS; and record bad debts at RWS.
§ Forecast FY16E EBITDA to recover to MYR6.7b on normalising VIP hold rate and bad debts.
§ Forecast FY17E EBITDA to grow strongly on (i) maiden contributions from Banten power plant (ii) additional capacity from the GITP (iii) less bad debts at RWS.
§ Due to the aforementioned, we estimate that the FY17E ROE will return to ~9%.
EBITDA (MYRm)
Source: Company, Maybank KE
Swing Factors
Upside
§ VIP volume and hold rate – tend to be volatile especially at GENS and can greatly influence GENT’s earnings.
§ VIP: mass market mix – tilt towards mass market will expand margins due to less commissions and rebates.
§ Higher visitor arrivals to RWG – the purpose of the GITP is to attract more high margin mass market gamblers.
§ USDMYR exchange rate – most of GENT’s financial assets are denominated in USD.
Downside
§ VIP volume and hold rate – tend to be volatile especially at GENS and can greatly influence GENT’s earnings.
§ Bad debts – Chinese account for 33-50% of GENS VIP volume but gambling debts are not enforceable in China.
§ CPO and oil prices – plantations and oil & gas account for <10% of group EBITDA but low CPO and oil prices can negatively impact earnings nonetheless.
§ Regional expansion – new jurisdictions often require high capex commitments without guaranteeing returns.
60
80
100
120
140
160
180
6.0
7.0
8.0
9.0
10.0
11.0
12.0
Dec-10 Dec-11 Dec-12 Dec-13 Dec-14
Genting Bhd - (LHS, MYR)
Genting Bhd / MSCI AC Asia ex JP - (RHS, %)
6,116.4 6,627.5
5,649.6
6,746.8
8,481.6
0.0
1,000.0
2,000.0
3,000.0
4,000.0
5,000.0
6,000.0
7,000.0
8,000.0
9,000.0
FY13A FY14A FY15E FY16E FY17E
1
2
3
6
4
5
-50.0%
-40.0%
-30.0%
-20.0%
-10.0%
0.0%
10.0%
20.0%
Dec
-97
Dec
-98
Dec
-99
Dec
-00
Dec
-01
Dec
-02
Dec
-03
Dec
-04
Dec
-05
Dec
-06
Dec
-07
Dec
-08
Dec
-09
Dec
-10
Dec
-11
Dec
-12
Dec
-13
Dec
-14
Dec
-15
Mean: -21.4%
+1 SD: -9.9%
-1 SD: -32.9%

January 3, 2016
Cons
truc
tion
M
alay
sia
Chai Li Shin, CFA [email protected] (603) 2297 8684
Gamuda (GAM MK)
Proven track record
Investment case: Best proxy to infrastructure play Gamuda remains the best proxy to infrastructure play in Malaysia. 2016 would be a record year in terms of construction job wins which could lift its outstanding order book to another record high. We value Gamuda on SOP deriving MYR6.00 TP. The stock is our top BUY pick in the construction/infrastructure sector.
Catalysts: Major wins to lift order book to new highs 2015 has been a meaningful year for Gamuda having clinched two out of the four project delivery partner (PDP) roles in the country. 2016 will see these being realised into job wins. Given the positive outcome of the two PDP wins, we think Gamuda is set to bag the MYR6b KVMRT 2 tunnel package and MYR4.5b Penang Transport Master Plan’s LRT works which will lift its order book to ~MYR10.5b (versus MYR800m at end-Oct 2015). Other potential wins are the KVLRT 3, Pan Borneo Sarawak Highway and Gemas-JB double track rail sub-packages which would add on MYR1-2b each and raise its orderbook. Elsewhere, conclusion of SPLASH’s water deal would see MYR2.8b cash added onto Gamuda’s coffers.
Valuation: Substantial discount Share price has retraced 8% in 2015 largely due to broad-based foreign selling. As at end-Nov 2015, Gamuda’s foreign shareholding has fallen 26-ppts to 22% (which is the lowest ever since the AFC) from a high of 48% in May 2013. We value the stock on SOP, with the construction business on PER, property development on RNAV and concessions on DCF. Our SOP-TP implies 21x 2016 PER, undemanding considering its rich assets and strong long-term proposition.
Risks: Dependent on major job wins An unexpected deferment in the take-off of the major projects due to funds availability or failure in obtaining the necessary approvals.
Share Price MYR 4.40
12m Price Target MYR 6.00 (+36%)
Previous Price Target MYR 6.00
BUY
Company description
StatisticsShariah status52w high/low (MYR)3m avg turnover (USDm)Free float (%)Issued shares (m)Market capitalisation
Major shareholders:11.2%7.8%5.4%
2,406
3.7
Gamuda Bhd engages in engineering and construction,property development and water and expresswayconcessions.
Yes
Employees Provident Fund Massachusetts Mutual Life Insurance Co. Lembaga Tabung Haji
5.35/3.85
87.6
MYR10.6BUSD2.5B
Price Performance
90
95
100
105
110
115
120
125
130
3.80
4.00
4.20
4.40
4.60
4.80
5.00
5.20
5.40
Dec-13 Mar-14 Jun-14 Sep-14 Dec-14 Mar-15 Jun-15 Sep-15
Gamuda - (LHS, MYR) Gamuda / Kuala Lumpur Composite Index - (RHS, %)
-1M -3M -12MAbsolute (%) 0 (7) (9)
Relative to index (%) 0 (6) (7)
Source: FactSet
FYE Jul (MYR m) FY14A FY15A FY16E FY17E FY18E
Revenue 4,636 2,400 2,588 3,117 3,413EBITDA 775 638 770 828 877Core net profit 712 682 664 701 728Core EPS (sen) 31.0 28.9 27.6 29.1 30.3Core EPS growth (%) 4.9 (6.6) (4.6) 5.6 3.9Net DPS (sen) 12.0 12.0 12.0 12.0 12.0Core P/E (x) 14.2 15.2 15.9 15.1 14.5P/BV (x) 1.8 1.6 1.7 1.6 1.5Net dividend yield (%) 2.7 2.7 2.7 2.7 2.7ROAE (%) 13.8 11.6 10.5 10.7 10.5ROAA (%) 7.6 5.8 4.9 4.9 4.8EV/EBITDA (x) 17.2 22.7 18.4 17.3 16.2Net debt/equity (%) 30.1 43.7 49.8 47.5 42.2Consensus net profit - - 637 717 763MKE vs. Consensus (%) - - 4.2 (2.2) (4.6)

January 3, 2016 79
Gamuda
Value Proposition
§ Leading infrastructure construction player who has carved niche expertise in highly technical tunnelling works.
§ It has also built a strong track record in managing major infrastructure projects as the Project Delivery Partner (PDP) for KVMRT 1.
§ With these capabilities, Gamuda is well positioned in the construction upcycle to clinch key infrastructure projects and gain above industry average construction margins.
§ It has also accumulated strategic property landbank in the Klang Valley that would benefit from the upcoming rails and highways.
Construction division pretax profit and margins
Source: Company
Price Drivers
Share price performance
Source: Company, Maybank Kim Eng
1. Signed KVMRT 1 PDP agreement. 2. Approval for KVMRT 2 from federal government was
delayed. 3. Growing concern on the invocation of Section 114 of
Water Services Industry Act 2006 that could force Gamuda to sell its water assets.
4. S114 invocation was deferred. 5. Clinched KVMRT 2 PDP. 6. Foreign shareholding fell to its lowest ever level at 22%.
Financial Metrics
§ Expect Gamuda to be key beneficiary of the infrastructure projects including rails and highways in FY16.
§ With its experience in KVMRT 1, it is in a strong position to clinch the MYR6b tunnelling works from KVMRT 2.
§ Other potential job wins include KVLRT 3 (~MYR1b), Gemas-JB double track rail and Pan Borneo Highway (~MYR1-2b).
§ Latest MYR800m order book is at its 10-year low as its single major job, KVMRT 1, is close to completion.
§ The potential job wins would lead to significant replenishment to its orderbook. We only imputed the MYR6b tunnelling job in our earnings forecasts.
§ Meanwhile, growing property sales and its stable concession earnings would support its earnings growth.
Outstanding construction orderbook
Source: Company, Maybank Kim Eng
Swing Factors
Upside
§ Obtain approval for its next key mega project – Penang Transport Master Plan from federal government.
§ Higher-than-expected construction job wins from KVLRT 3, Pan Borneo Highway and Gemas-JB double track rail as we only factored in KVMRT 2 in our earnings forecasts.
§ Recovery in local property sales or stronger-than-expected overseas property sales.
Downside
§ Delay in implementation of the key infrastructure projects.
§ Water assets under SPLASH being sold significantly below its NAV.
0%
2%
4%
6%
8%
10%
12%
14%
0
50
100
150
200
250
FY10 FY11 FY12 FY13 FY14 FY15
PBT MYR m PBT margin %
80
90
100
110
120
130
140
2.50
3.00
3.50
4.00
4.50
5.00
5.50
Dec-10 Dec-11 Dec-12 Dec-13 Dec-14
Gamuda - (LHS, MYR) Gamuda / MSCI AC Asia ex JP - (RHS, %)
0.0
1.0
2.0
3.0
4.0
5.0
6.0
7.0
0
1000
2000
3000
4000
5000
6000
7000
FY10 FY11 FY12 FY13 FY14 FY15 FY16F
Orderbook (MYR m) Orderbook/sales (x)
1
2
3 4
5
6
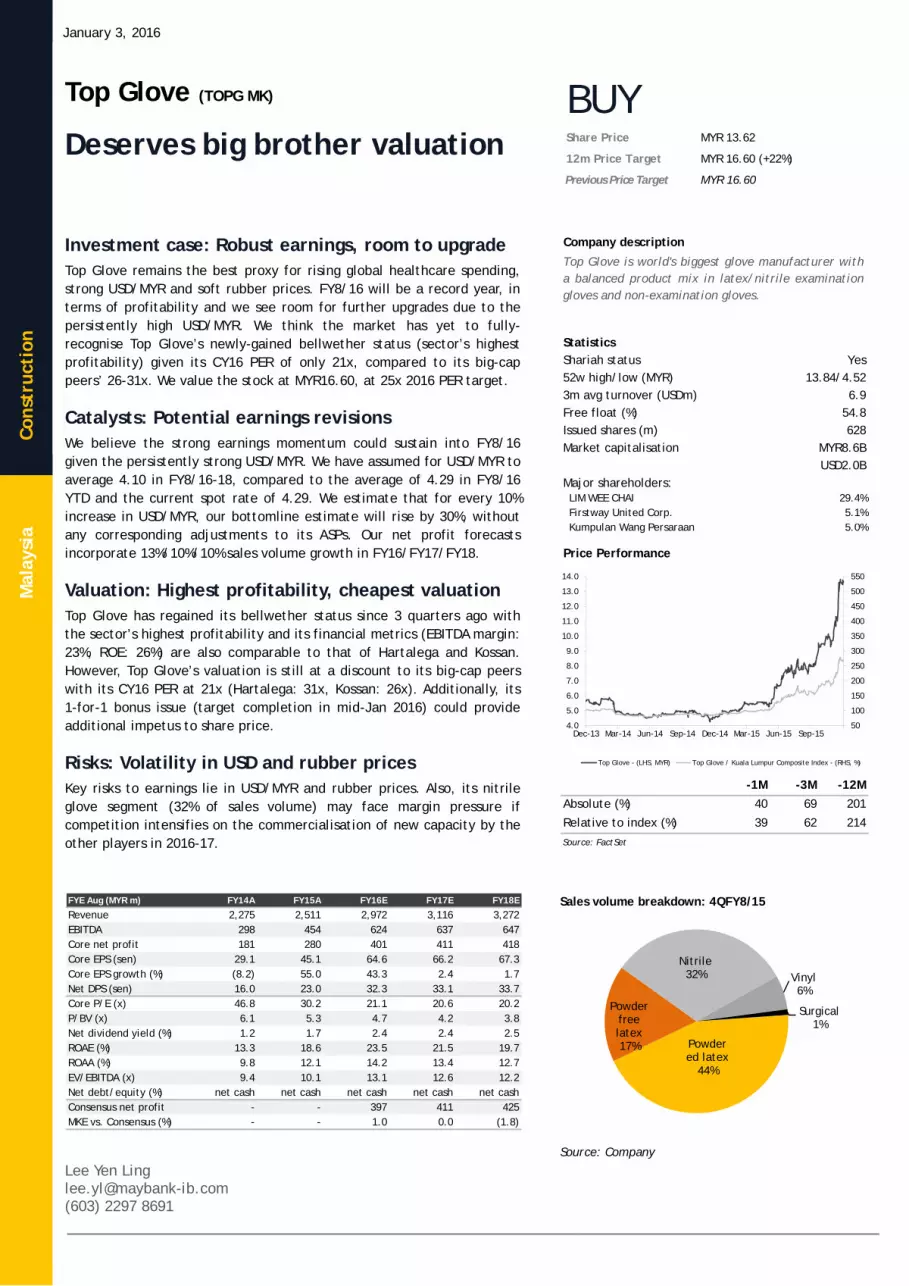
January 3, 2016
Cons
truc
tion
M
alay
sia
Sales volume breakdown: 4QFY8/15
Source: Company
Lee Yen Ling [email protected] (603) 2297 8691
Top Glove (TOPG MK)
Deserves big brother valuation
Investment case: Robust earnings, room to upgrade Top Glove remains the best proxy for rising global healthcare spending, strong USD/MYR and soft rubber prices. FY8/16 will be a record year, in terms of profitability and we see room for further upgrades due to the persistently high USD/MYR. We think the market has yet to fully-recognise Top Glove’s newly-gained bellwether status (sector’s highest profitability) given its CY16 PER of only 21x, compared to its big-cap peers’ 26-31x. We value the stock at MYR16.60, at 25x 2016 PER target.
Catalysts: Potential earnings revisions We believe the strong earnings momentum could sustain into FY8/16 given the persistently strong USD/MYR. We have assumed for USD/MYR to average 4.10 in FY8/16-18, compared to the average of 4.29 in FY8/16 YTD and the current spot rate of 4.29. We estimate that for every 10% increase in USD/MYR, our bottomline estimate will rise by 30%, without any corresponding adjustments to its ASPs. Our net profit forecasts incorporate 13%/10%/10% sales volume growth in FY16/FY17/FY18.
Valuation: Highest profitability, cheapest valuation Top Glove has regained its bellwether status since 3 quarters ago with the sector’s highest profitability and its financial metrics (EBITDA margin: 23%, ROE: 26%) are also comparable to that of Hartalega and Kossan. However, Top Glove’s valuation is still at a discount to its big-cap peers with its CY16 PER at 21x (Hartalega: 31x, Kossan: 26x). Additionally, its 1-for-1 bonus issue (target completion in mid-Jan 2016) could provide additional impetus to share price.
Risks: Volatility in USD and rubber prices Key risks to earnings lie in USD/MYR and rubber prices. Also, its nitrile glove segment (32% of sales volume) may face margin pressure if competition intensifies on the commercialisation of new capacity by the other players in 2016-17.
Share Price MYR 13.62
12m Price Target MYR 16.60 (+22%)
Previous Price Target MYR 16.60
BUY
Company description
StatisticsShariah status52w high/low (MYR)3m avg turnover (USDm)Free float (%)Issued shares (m)Market capitalisation
Major shareholders:29.4%5.1%5.0%
628
6.9
Top Glove is world's biggest glove manufacturer witha balanced product mix in latex/nitrile examinationgloves and non-examination gloves.
Yes
LIM WEE CHAI Firstway United Corp. Kumpulan Wang Persaraan
13.84/4.52
54.8
MYR8.6BUSD2.0B
Price Performance
50
100
150
200
250
300
350
400
450
500
550
4.0
5.0
6.0
7.0
8.0
9.0
10.0
11.0
12.0
13.0
14.0
Dec-13 Mar-14 Jun-14 Sep-14 Dec-14 Mar-15 Jun-15 Sep-15
Top Glove - (LHS, MYR) Top Glove / Kuala Lumpur Composite Index - (RHS, %)
-1M -3M -12MAbsolute (%) 40 69 201
Relative to index (%) 39 62 214
Source: FactSet
FYE Aug (MYR m) FY14A FY15A FY16E FY17E FY18E
Revenue 2,275 2,511 2,972 3,116 3,272EBITDA 298 454 624 637 647Core net profit 181 280 401 411 418Core EPS (sen) 29.1 45.1 64.6 66.2 67.3Core EPS growth (%) (8.2) 55.0 43.3 2.4 1.7Net DPS (sen) 16.0 23.0 32.3 33.1 33.7Core P/E (x) 46.8 30.2 21.1 20.6 20.2P/BV (x) 6.1 5.3 4.7 4.2 3.8Net dividend yield (%) 1.2 1.7 2.4 2.4 2.5ROAE (%) 13.3 18.6 23.5 21.5 19.7ROAA (%) 9.8 12.1 14.2 13.4 12.7EV/EBITDA (x) 9.4 10.1 13.1 12.6 12.2Net debt/equity (%) net cash net cash net cash net cash net cashConsensus net profit - - 397 411 425MKE vs. Consensus (%) - - 1.0 0.0 (1.8)
Powdered latex
44%
Powder free latex 17%
Nitrile 32% Vinyl
6%
Surgical 1%

January 3, 2016 81
Top Glove
Value Proposition
§ World’s largest glove manufacturer (global market share: c.18%) and still riding on global growth cycle (5-6% pa). Beneficiary of strong USD/MYR and soft commodity prices.
§ High barriers to entry for medical gloves which necessitate stringent compliance with regulatory requirement. Scale of business makes ASPs highly competitive.
§ High cash generating capability; annual operating cashflow of MYR450-500m against MYR200m capex. Headroom for dividends; growing cash reserves for M&A opportunities.
§ Sales volume growth (4-year CAGR: 8%) could accelerate on the exit of smaller glove players.
Expands capacity to capture new demand growth
Source: Company, Maybank KE
Price Drivers
Historical share price
Source: Company, Maybank Kim Eng
1. Earnings halved in FY11 following the collapse of H1N1-
fuelled demand for latex gloves and high rubber prices. 2. Earnings recovered partially in FY12 on the normalisation
of demand and lower rubber prices. 3. Staged strong earnings growth in FY15 on high USD/MYR,
low rubber prices and limited competition in latex gloves segment.
Financial Metrics
§ Largest profit base. EBITDA margins of 18-21% amongst the widest in the sector.
§ Anticipates high earnings on persistently high USD/MYR and low rubber prices. Our forward assumptions are 4.10 for USD/MYR and MYR3.90/kg for latex price.
§ Every 10% increase in USD/MYR and latex price will have 30% positive impact and 5% adverse impact on our FY8/16 bottomline respectively, assuming no corresponding adjustments to ASPs.
Rubber prices and USD/MYR trends
Source: Bloomberg, Maybank KE
Swing Factors
Upside
§ Changes in the lenient regulatory requirements in developing markets which could accelerate global glove demand growth.
§ Lower-than-expected rubber prices and stronger-than-expected USD/MYR rates.
§ Greater-than-expected direct government tender orders under TPPA.
Downside
§ Sharp fall in USD/MYR. § Substantial rise in rubber prices. § Intensive competition in nitrile glove segment.
0
50
100
150
200
250
300
0
10
20
30
40
50
60
FY11 FY12 FY13 FY14 FY15 FY16F FY17F
b pieces b pieces
Global glove demand: b pieces (RHS)Capacity year-end: b pieces (LHS)Sales volume: b pieces (LHS)
80100120140160180200220240260280300
3.04.05.06.07.08.09.0
10.011.012.013.014.0
Dec-10 Dec-11 Dec-12 Dec-13 Dec-14
Top Glove - (LHS, MYR) Top Glove / MSCI AC Asia ex JP - (RHS, %)
0.00
1.00
2.00
3.00
4.00
5.00
6.00
0
2
4
6
8
10
12
Jan-
11
May
-11
Sep-
11
Jan-
12
May
-12
Sep-
12
Jan-
13
May
-13
Sep-
13
Jan-
14
May
-14
Sep-
14
Jan-
15
May
-15
Sep-
15
USD/MYR MYR/kg
Latex: MYR/kg (LHS) NBR: MYR/kg (LHS)USD/MYR (RHS)
1
2
3

January 3, 2016
Tech
nolo
gy
Mal
aysi
a
Ivan Yap [email protected] (603) 2297 8612
Inari Amertron (INRI MK)
SEA’s biggest testing house
Investment case: Proxy to Avago’s growth Inari is a key Electronic Manufacturing Services (EMS) provider to US-listed Avago Technologies (AVGO US, Not Rated) with core competencies in the testing and packaging of radio-frequency (RF) chips and fibre-optic transceivers. Riding on Avago’s success as a key OEM supplier to Tier-1 mobile device brands such as Apple, Samsung and LG, Inari’s growth momentum will be driven by (i) demand for smart devices and (ii) higher RF dollar content in mobile devices to power the rising adoption of faster cellular networks as the world moves from 3G to LTE/LTE to LTE-A.
Catalysts Installed-base of 3G, LTE and LTE-Advance networks is still low
globally. As dollar content rises (Avago expects a ~+20% CAGR in RF dollar content over the next few years) on higher adoption of faster network, ASPs for Inari’s RF division should see upside.
Higher plant utilisation as wafer shipment from Avago gradually rises as the latter’s new wafer fab facility optimises production.
Potential new contract award from Broadcom (concluding merger with Avago in 1Q16), Osram (EUR3b investment in Kulim by 2020).
90%/70% of Inari’s revenue/COGS is denominated in USD. The weak MYR against USD is beneficial to Inari as our sensitivity analysis suggests that for every 1% change in our base of USD1/MYR4.10, Inari’s bottomline will be impacted by 2% p.a., ceteris paribus.
Valuation: Undemanding Valuations are undemanding at 15.2x CY17 PER with a PEG of just 0.68x. We see potential upside to earnings from (i) higher ASPs from the RF division (we conservatively project a 3% decline p.a.), (ii) potential new contract wins and (iii) weaker MYR against USD.
Risks: Single customer, demand Two key risks are: (i) single customer risk, with 85% of Inari’s revenue derived from Avago, (ii) lower-than-expected demand for smart devices.
Share Price MYR 4.78
12m Price Target MYR 5.35 (+12%)
Previous Price Target MYR 4.60
BUY
Company description
StatisticsShariah status52w high/low (MYR)3m avg turnover (USDm)Free float (%)Issued shares (m)Market capitalisation
Major shareholders:26.9%7.3%5.1%
753
3.6
Inari Amertron is the biggest semiconductor player inM’sia and one of Avago’s top EMS providers in thethriving wireless division.
Yes
Insas Bhd. Kumpulan Wang Persaraan Norges Bank Investment Management
4.78/2.27
65.0
MYR3.6BUSD839M
Price Performance
50
100
150
200
250
300
350
400
450
1.00
1.50
2.00
2.50
3.00
3.50
4.00
4.50
5.00
Dec-13 Mar-14 Jun-14 Sep-14 Dec-14 Mar-15 Jun-15 Sep-15
Inari Amertron - (LHS, MYR)
Inari Amertron / Kuala Lumpur Composite Index - (RHS, %)
-1M -3M -12MAbsolute (%) 13 41 100
Relative to index (%) 12 35 108
Source: FactSet
FYE Jun (MYR m) FY14A FY15A FY16E FY17E FY18E
Revenue 794 933 1,345 1,398 1,505EBITDA 135 187 259 291 328Core net profit 103 152 207 221 250Core EPS (sen) 14.1 20.3 27.7 29.6 33.5Core EPS growth (%) 137.7 44.1 36.3 7.0 13.2Net DPS (sen) 6.8 8.9 11.1 11.8 13.4Core P/E (x) 33.9 23.6 17.3 16.1 14.3P/BV (x) 13.5 6.6 5.4 4.5 3.8Net dividend yield (%) 1.4 1.9 2.3 2.5 2.8ROAE (%) 49.4 38.1 34.5 30.4 28.8ROAA (%) 23.6 22.7 22.3 20.3 20.1EV/EBITDA (x) 15.7 11.9 13.2 11.5 9.7Net debt/equity (%) 6.7 net cash net cash net cash net cashConsensus net profit - - 197 235 253MKE vs. Consensus (%) - - 4.7 (5.9) (1.1)

January 3, 2016 83
Inari Amertron
Value Proposition
§ Inari is the biggest semiconductor player in M’sia. One of Avago’s top EMS providers in the thriving wireless division. Owns >650 units of test handlers, the largest in SEA.
§ Cost competitiveness and manufacturing efficiency from economies of scale power Inari as Avago’s key EMS vendor.
§ Largely cash generative with sustainable ROE of ~30%. More upside potential as Avago group continues to outsource more of its manufacturing processes.
§ Returns hinge on Avago’s orders which have good visibility. Avago enjoys tailwind from network transition (3G to LTE) and growing data server farms to power IoTs.
§ USD/MYR forex fluctuations largely dictate margins. High single customer exposure is another risk.
FCF vs ROAE
Source: Company
Price Drivers
Historical share price
Source: Company, Maybank Kim Eng
1. First official coverage by a local research house. 2. 62% QoQ jump in FY6/14 earnings from larger
outsourcing by Avago and first time consolidation of Amertron.
3. Inari announced 1-for-8 rights issue to expand its operation on higher orders from Avago.
4. Stronger USD against MYR improved profit outlook. 5. Amid slow global semiconductor sales, Avago announced
(i) stronger results (due to higher RF content) and (ii) upbeat outlook wireless division (~20% in RF content).
Financial Metrics
§ Volume growth and ASPs for RF products (premised on introduction of faster cellular network) and stable USD/MYR are key to Inari’s earnings.
§ EBIT margin can widen as higher orders and potential new job wins optimise utilisation of Inari’s plants in Malaysia, the Philippines and China.
§ Visible quarterly growth as wafer shipment from Avago is projected to be up. Expect higher utilisation to meet Avago’s demand and new clients in RF related products.
Quarterly net profits and margins trend
Source: Company
Swing Factors
Upside
§ Forex: MYR’s further weakness against USD – positive revenue impact. 1% change in our base assumption of USD1/MYR4.10 for FY16-17 will impact earnings by 2%.
§ Further outsourcing from Avago post-merger with Broadcom, to conclude in 1QCY16.
§ Faster-than-expected adoption of LTE-A (from LTE) would improve earnings visibility for Avago and Inari.
§ Potential new contract wins from Osram which has earmarked EUR3b investment in Kulim (~60km away from Inari’s plants in Penang) by 2020.
Downside
§ Drastic fall in global Tier-1 smartphone shipment will hamper orders for Avago’s premium RF products and weaken Inari’s earnings visibility.
§ Failure to renew pioneer status by end-2017 would see lower profitability on higher tax charges.
§ Single customer risk; >80% of Inari’s group revenue derived from Avago. In the event where Inari fails to deliver to Avago, Inari may see its partnership revoked.
34.4%
49.4%
38.1% 34.5%
30.4% 28.8%
0.0%
10.0%
20.0%
30.0%
40.0%
50.0%
60.0%
0
50
100
150
200
250
300
FY13
FY14
FY15
FY16
FY17
FY18
FCF (LHS) ROAE (RHS)MYR m
02004006008001,0001,2001,4001,6001,8002,000
0.000.501.001.502.002.503.003.504.004.505.00
Jul-11 Feb-12 Sep-12 Apr-13 Nov-13 Jun-14 Jan-15 Aug-15
Inari Amertron - (LHS, MYR)
Inari Amertron / MSCI AC Asia ex JP - (RHS, %)
4.3 5.4 7.5 9.0 12.4
13.1 21.0
24.4 27.0
32.9 34.2
40.9 38.6
40.9 45.8
0%
5%
10%
15%
20%
25%
0.0
10.0
20.0
30.0
40.0
50.0
3Q12
4Q12
1Q13
2Q13
3Q13
4Q13
1Q14
2Q14
3Q14
4Q14
1Q15
2Q15
3Q15
4Q15
1Q16
Core net profit (LHS)Net profit margin % (RHS)MYR m
1
2
3 4
5

January 3, 2016
Serv
ices
M
alay
sia
Yin Shao Yang [email protected] (603) 2297 8916
Jade Tam [email protected] (603) 2297 8687
Media Chinese International (MCIL MK)
Too cheap for earnings resilience
Investment case: Ability to manage costs effectively MCIL is our top BUY pick in the media sector for 2016. Our TP of MYR0.73 is pegged to 1.3x end-CY16 P/BV. Going into CY16 or FY3/17, we expect the Summer Olympics and UEFA Euro Cup to boost adex sentiment. Furthermore, MCIL has saved a lot by cutting its newsprint consumption significantly to ~120k tonnes p.a. currently. Valuations are very low at <8x CY16 PER and <4x CY16 EV/EBITDA. While we wait for a topline turnaround, MCIL offers attractive dividend yields of >7%.
Catalysts: Sporting events to aid adex Moving into 2QCY16 or 1QFY3/17, we expect the Summer Olympics and UEFA Euro Cup, which are traditionally adex friendly, to boost adex sentiment. From then on, we expect adex to revert to growth after more than two years of YoY contractions. Our CY16 or FY3/17 sector-wide adex growth forecast is 5% YoY. Elsewhere, MCIL’s cash position is expected to turn positive by end-FY3/16 giving it the ability to sustain its DPR of 50% and dividend yields of at least 7%.
Valuation: Cheap with attractive yields to boot Our TP of MYR0.73 is pegged to 1.3x end-CY16 P/BV. Despite delivering great 2QFY3/16 results and raising its DPR to 50% from 40%, valuations are still undemanding at <8x CY16 PER and <4x CY16 EV/EBITDA. Dividend yields are also attractive at >7%. Compared to other media companies under our coverage, MCIL has a more resilient earnings base due to its ability to cut its newsprint consumption significantly from ~150k tonnes in FY3/14 to ~120k tonnes p.a. currently.
Risks: Dependent on MYR/USD exchange rate Downside risk could stem from higher-than-expected newsprint cost, dependent on the MYR/USD exchange and larger annualized newsprint consumption. Our forecasts currently impute average newsprint price of ~USD500/tonne and ~120k tonnes newsprint consumption in CY16 or FY3/17. Earnings might also underperform if adex growth deteriorates more than expected. We currently forecast adex growth of -12% YoY for FY3/16 and +5% YoY for FY3/17.
Share Price MYR 0.60
12m Price Target MYR 0.73 (+22%)
Previous Price Target MYR 0.73
BUY
Price Performance
60
65
70
75
80
85
90
95
100
105
110
0.50
0.55
0.60
0.65
0.70
0.75
0.80
0.85
0.90
0.95
1.00
Dec-13 Mar-14 Jun-14 Sep-14 Dec-14 Mar-15 Jun-15 Sep-15
Media Chinese Int'l - (LHS, MYR)
Media Chinese Int'l / Kuala Lumpur Composite Index - (RHS, %)
-1M -3M -12MAbsolute (%) (3) 14 (14)
Relative to index (%) (4) 9 (11)
Source: FactSet
FYE Mar (MYR m) FY14A FY15A FY16E FY17E FY18E
Revenue 1,531 1,589 1,450 1,511 1,538EBITDA 287 268 244 249 262Core net profit 158 144 132 137 152Core EPS (sen) 9.3 8.6 7.8 8.1 9.0Core EPS growth (%) (8.2) (8.3) (8.9) 4.1 11.0Net DPS (sen) 4.7 3.4 3.9 4.1 4.5Core P/E (x) 6.4 7.0 7.7 7.4 6.7P/BV (x) 1.4 1.3 1.2 1.0 1.0Net dividend yield (%) 7.8 5.7 6.5 6.8 7.5ROAE (%) 23.3 19.4 16.0 14.9 15.0ROAA (%) 10.5 9.4 8.1 8.4 9.3EV/EBITDA (x) 6.0 4.5 4.0 3.5 3.1Net debt/equity (%) 21.9 5.9 net cash net cash net cashConsensus net profit - - 123 131 137MKE vs. Consensus (%) - - 6.6 4.1 11.0
Company description
Statistics Shariah status 52w high/low (MYR) 3m avg turnover (USDm) Free float (%) Issued shares (m) Market capitalisation
Major shareholders: 19.3% 15.0% 9.2%
1,687
0.1
MCIL publishes Chinese newspapers and magazines in South East Asia, Greater China and North America and offers travel and travel related services.
Yes
Progresif Growth Sdn. Bhd. Conch Co Ltd TIONG HIEW KING
0.75/0.51
31.6
MYR1.0B USD236M

January 3, 2016 85
Media Chinese International
Value Proposition
§ MCIL has >95% market share of Malaysia’s Chinese newspaper circulation. Market is mature but dominance is likely to be challenged. Listed on Bursa and HKSE.
§ Classifieds, a more defensive revenue source, account for roughly 50% of total adex revenue. Improved cost management should provide some cushion for net profit.
§ MCIL’s digital platforms, e-commerce website, Logon and news portal, Pocketimes, aim to capture digital savvy consumers. But digital revenue has been minimal.
§ Unless MCIL reinvents itself or digital media initiatives start to show results, long term business franchise may be under threat.
Total circulation of Chinese newspapers in Malaysia
Source: Audit Bureau of Circulations Malaysia
Price Drivers
Historical share price trend
Source: Company, Maybank Kim Eng
1. Proposed special dividend via a capital reduction of
MYR0.41/share. 2. MH370 and MH17 aviation disasters caused significant ad
revenue loss throughout 2014 as advertisers cancelled/postponed ad campaigns.
3. Re-rated since its strong 1QFY3/16 results.
Financial Metrics
§ Ad spend and lower newsprint cost/tonne in MYR terms are critical elements of MCIL’s earnings.
§ Poor adex sentiment and shrinking circulation contribute to weakness in revenue.
§ Conservatively expect FY16 newsprint consumption of ~120k tonnes, down 13% YoY. But volume newsprint savings may be offset by strength in USD/MYR.
§ We expect net earnings to remain suppressed in CY16 but return to growth from CY17 onwards as consumer sentiment improves in Malaysia.
§ We expect MCIL to turn net cash by FY3/16, sustaining its attractive dividend yields of >6%.
Net profit margin vs USD/MYR
Source: Company, Maybank Kim Eng
Swing Factors
Upside
§ Reduced newsprint cost per metric tonne in MYR terms. § Lower newsprint consumption. MCIL consumes the largest
amount of newsprint amongst its peers. § Quicker than expected recovery in adex sentiment. § Higher dividend payout ratio (DPR). Current DPR is 50%. § Better ability to monetise digital media through e-paper
subscriptions, online video portal (Pocketimes) and e-commerce website (Logon).
Downside
§ Further weakness in MYR against USD will increase newsprint cost in MYR terms.
§ Poor consumer sentiment leading to subdued adex growth.
§ Increased migration of readership from hardcopy newspapers to digital news platforms negatively impacting circulation revenue.
- 100,000 200,000 300,000 400,000 500,000 600,000 700,000 800,000 900,000
1,000,000
1H12 2H12 1H13 2H13 1H14 2H14 1H15
6080100120140160180200220240
0.500.600.700.800.901.001.101.201.301.40
Dec-10 Dec-11 Dec-12 Dec-13 Dec-14
Media Chinese Int'l - (LHS, MYR)
Media Chinese Int'l / MSCI AC Asia ex JP - (RHS, %)
0.000.501.001.502.002.503.003.504.004.50
0%2%4%6%8%
10%12%14%16%
Mar
-10
Mar
-11
Mar
-12
Mar
-13
Mar
-14
Mar
-15
Mar
-16
Mar
-17
Mar
-18
Net Profit Margin (LHS) USD/MYR forex (RHS)
1 2
3


January 3, 2016
STRA
TEG
Y Ph
ilipp
ines
Philippines’s Six-for-16
Smooth Transitioning
2016 polls another step in a strengthening economy This year will be eventful with national and local elections set for 9 May 2016. The race to succeed President Benigno Aquino III is a five-way contest. All candidates profess to strengthen economic reforms, improve infrastructure, reduce criminality, and address the Mindanao issue. We believe policies that have led to improving economic fundamentals over the years will be maintained. What will differentiate each candidate is the focus and speed of implementing their programs. As the government transition occurs, the central bank is likely to gradually tighten monetary policy, since economic growth remains healthy. Indeed, this is spurring corporate investments. As a result, the equity market may be buoyant in 1H16, but give back gains in 2H16. Even as we are NEUTRAL, we see counters that may benefit in the run-up to and after the May polls in the consumer, media and infrastructure sectors.
Lengthy track records aid in policy continuity Four of the five presidential candidates have long political records. Mar Roxas not only is in Aquino’s cabinet, but served three administrations and was in Congress. Jejomar Binay is the sitting vice president, and was Makati City mayor for 21 years. Miriam Santiago was a trial court judge, served in the first Aquino administration, and is a three-term senator. Rodrigo Duterte has been Davao City mayor for 22 years and spent one term in Congress. Senator Grace Poe was elected in 2013 and chaired the Movie and Television Review and Classification Board for two years. We believe such backgrounds lend a high probability to policy continuity.
Basic consumer and media plays proven winners Thousands of candidates are vying for positions. Spending on campaign ads and distribution of freebies as they tour the country should lift sales for firms, such as ABS, JFC, and SMPH. Recently listed CNPF is also likely to benefit.
Longer shots are value infrastructure plays Infrastructure inadequacy is a hot-button issue. Examples include horrendous road congestion and slow internet speeds. Part of the solution rests on resolving regulatory hurdles. If contractual obligations are honoured and consumer welfare prioritized, MPI and PLDT could recover.
Luz Lorenzo(63) 2 849 [email protected]
Michael Bengson(63) 2 849 [email protected]
Lovell Sarreal(63) 2 849 [email protected]
Rommel Rodrigo(63) 2 849 8839 [email protected]
Jaclyn Jimenez(63) 2 849 [email protected]
Stock Bloomberg Code Mkt cap Rating Price TP Upside P/E (x) P/E (x) P/B (x) P/B (x) Div yld (%) Div yld (%)
(USDm) (PHP) (PHP) (%) 15E 16E 15E 16E 15E 16E
CNPF CNPF PM EQUITY 782 BUY 16.48 20.00 21.4 19.5 15.7 3.8 3.2 1.2 1.5
ABS-CBN ABS PM EQUITY 1,120 BUY 61.90 80.00 29.2 19.2 13.8 1.9 1.7 1.5 1.7
JFC JFC PM EQUITY 4,982 BUY 219.00 250.00 14.2 43.2 36.3 7.6 6.7 0.8 0.9
SMPH SMPH PM EQUITY 13,328 BUY 21.70 27.20 25.3 27.1 23.7 2.9 2.7 1.0 1.2
MPI MPI PM EQUITY 3,084 BUY 5.20 6.70 28.8 16.7 17.2 1.3 1.2 0.7 0.7
PLDT TEL PM EQUITY 9,466 BUY 2060.00 2400.00 16.5 13.0 12.6 3.4 3.6 7.4 5.8
Analysts

January 3, 2016 88
Philippines’s Six-for-16
1. Initiating coverage on CNPF: A rare catch
1.1 BUY – Attractive valuation and prospects Century Pacific Food Inc (CNPF) is the largest food canner in the Philippines, deriving revenues from its branded consumer food products, such as canned fish, canned meat, milk, and food mixes. We like CNPF due to its: 1) superior ROE relative to peers; 2) market leadership; and 3) EPS growth prospects, which we forecast at 19.7% CAGR in FY14-17E.
In Oct 2015, CNPF acquired Century Pacific Agricultural Ventures Inc (CPAVI), a high-margin non-branded business in the faster-growing health-and-wellness segment. We expect the acquisition to be 8% EPS-accretive in FY16. CNPF is also deepening its footprint in the dairy business with more product launches, improving its cost structure as facilities investment come on stream, and may gain from election-related spending.
We initiate coverage of CNPF with a BUY rating and PHP20 TP based on 19x 2016F P/E, the average valuation of the Philippine consumer sector.
1.2 Strong core business with forays into diversification We expect CNPF’s primary branded businesses to provide long-run stability in earnings and cash flows. Through its track record of capitalising on emerging market trends and continuous innovation of products, the company should be able to solidify its dominance of the domestic canned and preserved food industry.
Faster growth can be expected from emerging segments, such as dairy and its recently acquired coconut business, CPAVI. CNPF aims to expand in dairy with its recent launch of Birch Tree Fortified Milk. CPAVI is already profitable with a focus on the production of higher-value products, such as coconut water and virgin coconut oil. Global demand is growing for both due to their health benefits. We expect the acquisition to provide synergies to CNPF, given its expertise in the private label export business, and track record in managing relationships with both foreign customers and regulators.
1.3 Financial strength supports expansion Even after CNPF’s PHP4.5b CPAVI acquisition, 50% of which was debt-funded, we expect CNPF will end 2016 in a net cash position. This allows for financial flexibility in undertaking potential major acquisitions or investments that could complement current operations. We forecast stable cash flows and minimal capital expenditure needs for the next few years, supported by its recent expansion (including completion of a new tin can facility). CNPF may acquire brands competing with its existing businesses to solidify its market positioning. It may also look into entering shelf-stable categories it is currently not present in to further diversify its branded portfolio. One possibility is frozen products, particularly frozen meat, as parent CPGI is handling the operations of Swift’s frozen meat products.

January 3, 2016 89
Philippines’s Six-for-16
2. Winning plays in an election year
2.1 ABS-CBN – Political ads and new initiatives During election years ABS-CBN Corp (ABS/ABSP) gets a significant share of political ad spending by candidates. At the same time, regular advertisers take advantage of stronger consumption and accelerate their ad spending. Since 1998, ABS’s airtime revenue growth has averaged 20% during election years compared with 6% in non-election years.
The share price has appreciated an average of 43% YoY during election years since 2001, while dropping 5% on average in non-election years. Valuation-wise, the stock has climbed as high as 2SD above its nine-year average forward PER during election seasons, and reached a high of 33x PER in the previous presidential elections.
Supported by the ramp-up of operations in its other initiatives, such as Kidzania Manila and digital TV via TVplus, we expect FY16E consolidated revenues to increase 11% to PHP42.4b, and earnings 39% to PHP3.8b. Our PHP80 TP is based on 17.8x FY16E PER, above ABSP’s nine-year average forward PER of 15.8x.
2.2 JFC – Pulling ahead with top/bottom line growth As the largest restaurant chain in the country, JFC will be a winner regardless of the outcome of the 2016 elections. The simple average of JFC’s share price appreciation from 1994 to 2014 is 20% YoY. The average was 10% during non-election years, but a much higher 40% in election years. We don’t think there is any reason 2016 will be different, which should again provide a strong upside catalyst for the shares.
Estimated same-store-sales growth (SSSG) of flagship Jollibee brand was stronger in four of five election years since 2000 vs. the preceding year’s level. We expect healthy SSSG of 6-9% in 2016E and forecast earnings to rise 19%, supported by stronger sales growth and better margins. We raise our target price by 16% to PHP250 or 41x PER. This is at a 10% discount to JFC’s peak valuation achieved in Jan-Feb 2015.
2.3 SMPH – Campaign spending benefits top mall operator SMPH, the top mall operator in the Philippines by a wide margin, is a big beneficiary of rapid growth in consumer spending during normal years, and especially so in election years when SSSG jumps. In addition, it is now reaping synergies from other recurring incomes, such as from office and hotels/leisure, while the residential business is recovering well. We forecast a three-year net profit CAGR of 17% in 2014-2017F driven by mall operations and new real estate developments.
SMPH remains dominant in the market by building four to five new malls per year that we estimate will increase retail GLA by a 13% CAGR in 2014-2017F, underpinning a 17% CAGR in net profit over the same period. Our TP of PHP27.20 is at roughly a 10% discount to our estimated NAV of PHP29.80/sh because of its leadership in mall operations. Malls contribute 71% of NAV.
Potential upside could come from proposed major Metro Manila reclamation projects, the new consortium to develop properties in the Ortigas CBD, and asset injections, such as office buildings of the Net Quad group now owned by the Sy family holding company.

January 3, 2016 90
Philippines’s Six-for-16
3. Issues holding back infra development
3.1 Public spending less than target, PPP program delayed Infrastructure inadequacy is a hot-button issue and the most egregious example is road congestion where motorists can be tied up for hours in traffic. There are many reasons why infrastructure improvement has lagged, but slow government spending is certainly one. The aim was to raise public infrastructure spending to 5% of GDP by 2016 from 1.8% in 2010, and to keep the overall budget deficit at 2%. This has not been the case. In 2014, infrastructure spending was only 2.2% of GDP and was 2.5% as of 9M15. The 2% budget deficit target was met only in 2011.
The Aquino government had an ambitious PPP program with a list of 54 projects when the program was announced in 2010. To-date 12 have been bid out as of end-2015, with only the first project awarded in 2011 completed in Jul 2015 (the four-km Manila-Cavite Expressway).
PPP projects, both prospective and those awarded, have been wrecked by controversy. Some of the more prominent examples are contractually agreed toll road rate hikes that have not been given when scheduled, water concession agreements being reinterpreted, and government deliverables on a hospital construction project unduly delayed to the extent that the private-sector proponent returned the project to the government.
3.2 New administration may go for quick wins These delays and controversies are some of the issues being raised by presidential candidates opposing the ruling Liberal Party. Of course, the promise is they will do better. It is possible that to make a positive and quick impact, whoever is elected president will act on some of these issues immediately, especially those not complex, such as toll road tariff increases. Another could be the reallocation of frequency for telecoms companies, which will not only improve internet speeds, but also raise potentially significant revenues for the government.
3.3 MPI – Overdue rate hikes after May elections? MPI could have been a stock market darling because it provides direct exposure to Philippine infrastructure, with stakes in water and electricity distribution, railways, toll roads, and hospitals. However, uncertainty on the timing of rate hikes led to the share price trading at a substantial discount to NAV.
MPI was due contractually inflation-linked rate hikes on toll roads it operates in 2012 and 2014, but these were not given by the regulator. Still, MPI has been able to report decent earnings due to strong volume trends. It is possible that there will be no immediate improvement after the May elections, but we have already factored that in by assuming a toll hike sometime in 2017. Two scenarios involving earlier adjustments show incremental earnings and NAV upgrades. Our forecasts yield a TP of PHP6.70, a 20% discount to our estimated NAV of PHP8.40, in line with the conglomerate average. Maintain BUY.
January 3, 2016 91
Philippines’s Six-for-16
3.4 PLDT – Oversold and with 5.8% dividend yield PLDT’s share price is at a four-year low, weighed down by concerns over its ability to retain market share and Telstra’s possible entry via a JV with San Miguel Corp. Given that steps have been taken to reverse the market share slide, while no deal has been signed by Telstra yet, the ~30% correction YTD looks excessive. Even if the SMC-Telstra JV materializes, we see little impact to PLDT’s FY16 profit. But earnings may be helped by election related spending in 2016 that could lift revenues.
PLDT has applied with the National Telecommunications Commission for equitable allocation of the 700MHz frequency now assigned to SMC and affiliates. The frequency is attractive for cost-efficient mobile internet access. It could be a key factor in whether or not the SMC-Telstra JV proceeds. The NTC takes time in resolving issues, and this one is likely to be taken up by officials appointed after the May 2016 elections.
With 17% share price upside to our DCF-based TP of PHP2,400 and the highest dividend yield of 5.8% among PSEi constituents, we maintain BUY.

January 3, 2016
Cons
umer
Sta
ples
Ph
ilipp
ines
12-month forward P/E band; share price has not fully factored in CPAVI acquisition
Jaclyn Jimenez [email protected] (63) 2 849 8842
Lovell Sarreal [email protected] (63) 2 849 8841
Century Pacific Food Inc (CNPF PM)
A Rare Catch
Initiate with BUY on largest canner in Philippines We initiate coverage of CNPF with a BUY rating and PHP20 TP, based on 19x 2016F P/E, the average valuation of the Philippine consumer sector. CNPF is the largest food canner in the Philippines, deriving revenues from its branded consumer food products, such as canned fish, canned meat, milk, and food mixes. We like CNPF owing to its: 1) superior ROE relative to peers; 2) market leadership; and 3) EPS growth prospects we forecast at a 19.7% CAGR during FY14-17E.
Entering new categories for growth We expect CNPF’s core branded businesses, canned fish and meat, to underpin its long-run earnings and cash flows. Faster growth can be expected from emerging segments, such as dairy and its recently acquired coconut business, CPAVI. CNPF aims to expand dairy with its recent launch of Birch Tree Fortified Milk. We see opportunities for synergies with CPAVI and breakthrough into faster-growing health-and-wellness segments.
Healthy balance sheet to support expansion Even after its PHP4.5b coconut acquisition, we believe debt ratios could remain healthy in FY15 and beyond (net cash from FY16E). This would give CNPF the financial flexibility for future acquisitions. Stable operating cash flows and reasonable capex needs in the next few years after its recent expansion should bolster this flexibility. CNPF may acquire brands that compete with its existing businesses to solidify its market positioning or may penetrate other shelf-stable categories to diversify its branded portfolio.
Catalysts: acquisitions, election boost, margins We see short-term catalysts from its: 1) CPAVI acquisition that should add 8% to FY16E EPS; 2) increasing traction in powdered milk; 3) a potential election boost to consumption; and 4) an improving cost structure through economies of scale and backward integration.
Share Price PHP 16.48
12m Price Target PHP 20.00 (+21%)
BUY
Company description
Statistics52w high/low (PHP)3m avg turnover (USDm)Free float (%)Issued shares (m)Market capitalisation
Major shareholders:73.7%10.4%1.6%
2,360
0.2
CNPF is primarily engaged in the manufacture anddistribution of branded consumer foods such ascanned fish, canned meat and dairy products.
Century Pacific Group Inc Arran Investment Pte Ltd JP Morgan Chase and Co
20.55/16.20
15.8
PHP38.9BUSD827M
Price Performance
95
100
105
110
115
120
125
130
14.0
15.0
16.0
17.0
18.0
19.0
20.0
21.0
May-14 Aug-14 Nov-14 Feb-15 May-15 Aug-15 Nov-15
Century Pacific Food Inc - (LHS, PHP)
Century Pacific Food Inc / PSEi Philippine SE Index - (RHS, %)
-1M -3M -12MAbsolute (%) (5) 0 1
Relative to index (%) (4) (0) 5
Source: FactSet
FYE Dec (PHP m) FY13A FY14A FY15E FY16E FY17E
Revenue 19,023 20,439 23,085 28,388 32,020EBITDA 1,104 2,255 2,683 3,636 4,209Core net profit 744 1,592 1,885 2,481 2,883Core EPS (PHP) 0.50 0.71 0.85 1.05 1.22Core EPS growth (%) na 43.8 18.5 24.4 16.2Net DPS (PHP) 0.00 0.00 0.20 0.24 0.32Core P/E (x) 33.2 23.1 19.5 15.7 13.5P/BV (x) 8.7 5.6 3.8 3.2 2.7Net dividend yield (%) 0.0 0.0 1.2 1.5 1.9ROAE (%) na 33.8 22.4 22.2 21.8ROAA (%) na 16.5 13.0 12.9 13.0EV/EBITDA (x) na 15.6 13.9 10.6 8.8Net debt/equity (%) 67.4 net cash 6.0 net cash net cashConsensus net profit - - 1,943 2,214 2,503MKE vs. Consensus (%) - - (3.0) 12.1 15.2
May-14 Nov-14 May-15 Nov-15
(x)
16.4
18.0
19.6
21.2
22.8
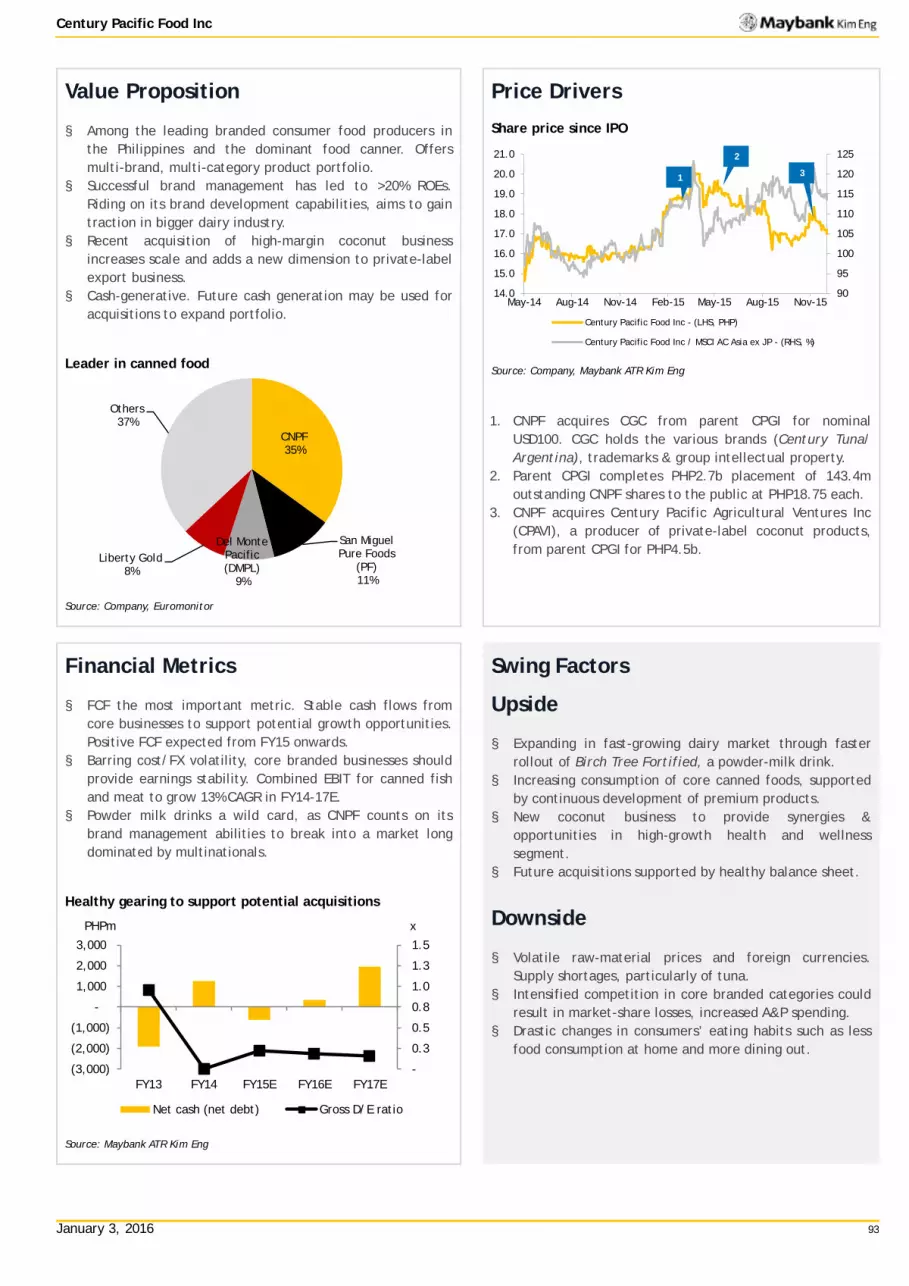
January 3, 2016 93
Century Pacific Food Inc
Value Proposition
§ Among the leading branded consumer food producers in the Philippines and the dominant food canner. Offers multi-brand, multi-category product portfolio.
§ Successful brand management has led to >20% ROEs. Riding on its brand development capabilities, aims to gain traction in bigger dairy industry.
§ Recent acquisition of high-margin coconut business increases scale and adds a new dimension to private-label export business.
§ Cash-generative. Future cash generation may be used for acquisitions to expand portfolio.
Leader in canned food
Source: Company, Euromonitor
Price Drivers
Share price since IPO
Source: Company, Maybank ATR Kim Eng
1. CNPF acquires CGC from parent CPGI for nominal
USD100. CGC holds the various brands (Century Tuna/ Argentina), trademarks & group intellectual property.
2. Parent CPGI completes PHP2.7b placement of 143.4m outstanding CNPF shares to the public at PHP18.75 each.
3. CNPF acquires Century Pacific Agricultural Ventures Inc (CPAVI), a producer of private-label coconut products, from parent CPGI for PHP4.5b.
Financial Metrics
§ FCF the most important metric. Stable cash flows from core businesses to support potential growth opportunities. Positive FCF expected from FY15 onwards.
§ Barring cost/FX volatility, core branded businesses should provide earnings stability. Combined EBIT for canned fish and meat to grow 13% CAGR in FY14-17E.
§ Powder milk drinks a wild card, as CNPF counts on its brand management abilities to break into a market long dominated by multinationals.
Healthy gearing to support potential acquisitions
Source: Maybank ATR Kim Eng
Swing Factors
Upside
§ Expanding in fast-growing dairy market through faster rollout of Birch Tree Fortified, a powder-milk drink.
§ Increasing consumption of core canned foods, supported by continuous development of premium products.
§ New coconut business to provide synergies & opportunities in high-growth health and wellness segment.
§ Future acquisitions supported by healthy balance sheet.
Downside
§ Volatile raw-material prices and foreign currencies. Supply shortages, particularly of tuna.
§ Intensified competition in core branded categories could result in market-share losses, increased A&P spending.
§ Drastic changes in consumers’ eating habits such as less food consumption at home and more dining out.
CNPF 35%
San Miguel Pure Foods
(PF) 11%
Del Monte Pacific (DMPL)
9%
Liberty Gold 8%
Others 37%
90
95
100
105
110
115
120
125
14.0
15.0
16.0
17.0
18.0
19.0
20.0
21.0
May-14 Aug-14 Nov-14 Feb-15 May-15 Aug-15 Nov-15
Century Pacific Food Inc - (LHS, PHP)
Century Pacific Food Inc / MSCI AC Asia ex JP - (RHS, %)
-
0.3
0.5
0.8
1.0
1.3
1.5
(3,000)
(2,000)
(1,000)
-
1,000
2,000
3,000
FY13 FY14 FY15E FY16E FY17E
x PHPm
Net cash (net debt) Gross D/E ratio
1
2
3

January 3, 2016
Broa
dcas
ting
Ph
ilipp
ines
ABSP’s historical share price change YoY
Note:Annual share price as of end-June
Jaclyn Jimenez [email protected] (63) 2 849 8842
Lovell Sarreal [email protected] (63) 2 849 8841
ABS-CBN (ABS PM)
Winning bet in FY16
FY16 a banner year for ABS Maintain BUY on ABS-CBN Corp (ABS/ABSP), the leader in the Philippine broadcasting industry in terms of nationwide audience share, revenues and earnings. We expect FY16E net income to jump 39% to PHP3.8b, boosted by election-related spending, accelerated regular ad growth, and ramp-up of new initiatives. Our PHP80 TP is based on 17.8x FY16E PER, above ABSP’s nine-year average forward PER of 15.8x.
Election spend boosts airtime revenues… With television still the preferred medium for content-viewing by the majority of Filipinos, media companies, such as ABS are winners during election years, obtaining a significant share of political ad spending by candidates. At the same time, regular advertisers, such as fast-moving consumer goods companies take advantage of stronger consumption and accelerate their ad spending. Since 1998, ABS’s airtime revenue growth has averaged 20% during election years, while posting average growth of 6% in non-election years. For FY16E, we forecast airtime revenues will rise 16.5% to PHP23.7b, with political ads totalling PHP2.7b. Regular airtime revenue growth may accelerate to 8% in FY16E from the estimated 4% increase in FY15E.
…and stock price usually surges ABS’s strong fundamentals have also translated to stock price outperformance during election years, beginning in 2001 (43% YoY appreciation vs. 5% avg. drop in non-election years.) Valuation-wise, the stock has climbed as high as 2SD above its nine-year average forward PER during election seasons, reaching a high of 33x PER in the previous presidential elections.
39% earnings growth in FY16E Supported by the ramp-up of operations in its other initiatives, such as Kidzania Manila and digital TV via TVPlus, we expect consolidated revenues to increase 11% to PHP42.4b, and earnings 39% to PHP3.8b. Incremental costs incurred in the coverage of elections are likely to be minimal. Hence, we believe a huge portion of election-related revenues will flow directly through to profits.
Share Price PHP 61.90
12m Price Target PHP 80.00 (+29%)
Previous Price Target PHP 80.00
BUY
Company description
Statistics52w high/low (PHP)3m avg turnover (USDm)Free float (%)Issued shares (m)Market capitalisation
Major shareholders:56.5%38.7%0.5%
851
0.0
Primarily involved in television and radiobroadcasting as well as in the production oftelevision and radio programming for domestic andinternational audiences and other related businesses.
Lopez Inc ABS-CBN Holdings Corp RBS Luxembourg
67.80/46.30
43.2
PHP52.7BUSD1.1B
Price Performance
80
100
120
140
160
180
200
220
240
260
25.0
30.0
35.0
40.0
45.0
50.0
55.0
60.0
65.0
70.0
Jan-14 Apr-14 Jul-14 Oct-14 Jan-15 Apr-15 Jul-15 Oct-15
ABS-CBN - (LHS, PHP) ABS-CBN / PSEi Philippine SE Index - (RHS, %)
-1M -3M -12MAbsolute (%) (4) 3 33
Relative to index (%) (2) 2 38
Source: FactSet
FYE Dec (PHP m) FY13A FY14A FY15E FY16E FY17E
Revenue 33,378 33,544 38,278 42,414 40,086EBITDA 7,352 7,566 8,815 10,868 10,215Core net profit 2,142 2,383 2,770 3,847 3,071Core EPS (PHP) 2.50 2.78 3.23 4.49 3.58Core EPS growth (%) 20.9 11.2 16.2 38.9 (20.2)Net DPS (PHP) 0.35 0.58 0.90 1.05 1.45Core P/E (x) 24.8 22.3 19.2 13.8 17.3P/BV (x) 2.2 2.1 1.9 1.7 1.6Net dividend yield (%) 0.6 0.9 1.5 1.7 2.3ROAE (%) 10.3 9.6 10.5 13.3 9.8ROAA (%) 3.9 3.8 4.1 5.6 4.4EV/EBITDA (x) 4.6 6.5 7.3 6.0 6.1Net debt/equity (%) 17.9 28.7 36.3 34.1 23.2Consensus net profit - - 2,774 3,799 2,982MKE vs. Consensus (%) - - 0.0 1.4 3.1
(25.2)(43.8)
(18.9)
23.3
(53.3)
40.5
116.9
(40.6)
14.5
86.2
2.5
(10.8)
12.4
(7.8)
63.5
-
10.00
20.00
30.00
40.00
50.00
60.00
70.00
(75.0)
(25.0)
25.0
75.0
125.0
175.0
PHP% YoY Price Change YoY (%) Last Price (PHP)
Average change YoY 10.6%Average change during election years 42.7%Average change during non-election years -5.4%

January 3, 2016 95
ABS-CBN
Value Proposition
§ ABS demonstrates sustained leadership in Philippines’s nationwide TV household audience share.
§ Its movies and free-to-air/cable content exhibit deep understanding of the Filipino masses. Home-grown talent development is another of ABS’s strengths.
§ Expanding various platforms to monetize content on mobile, pay TV, theme parks and sound stages.
§ Below-average ROA of <6% as new initiatives, pay TV continue to be in ramp-up mode. Expect returns to improve once new initiatives turn profitable.
Dominance in nationwide total day audience share (%)
Source: Kantar, Maybank ATR Kim Eng
Price Drivers
Historical share price trend
Source: Company, Maybank Kim Eng
1. From a 7.6% drop in 1H12 profits, ABS earnings increased
>50% in 3Q12 owing to higher TV ratings, and cable revenues.
2. Investors took profits after the company announced a 68% YoY increase in 1Q13 earnings, boosted by election-related airtime revenues.
3. The board approves share buyback program of ABS and ABSP shares of up to PHP500m.
4. Cost management initiatives bear fruit as 9M14 opex remained flattish, helped by reduced production costs.
5. ABS pioneers the switch to digital TV with the launch of TVplus. It also aims to improve audience share in areas with poor ABS analog reception.
Financial Metrics
§ Asset turnover is ABS’s key financial metric to monitor as this is a high operating leverage business. Earnings are highly sensitive to efficiency of asset utilization.
§ Revenue tracks economic cycles, but enjoys an election boost every three years. The long-term trend should be more stable as revenue sources are diversified.
§ High degree of operating leverage to lead to earnings volatility. Profit growth in FY15/16E is 16/39%.
§ Asset turnover remains steady at 0.6x during forecast period. Steady growth in TV and studio operations lift non-core businesses, which are still in investment mode.
FY16 revenues boosted by elections; asset T/O steady
Source: Maybank ATR Kim Eng
Swing Factors
Upside
§ Higher airtime revenues. Multinational advertisers could allocate more ad budget to their Philippine operations to take advantage of a sustained healthy economy.
§ Higher TV household ratings, helped by digital TV rollout could also translate to higher airtime revenues, based on new price scheme with advertisers.
§ Production cost savings upon completion of sound stages. § Turnaround of new initiatives — improving visitor
attendance for Kidzania and an increasing number of TVPlus digital boxes sold.
Downside
§ Potential lower TV household rating that could result in market share grab by closest competitor in core free-to-air segment.
§ Lower-than expected subscriber take-up could lead to sustained losses on ABS-CBN Mobile.
§ Intensifying competition in pay TV spurred by new technologies.
42 42 44 42 44 45
31 33 34 35 35 34
12 11 9 9 7 7
2012 2013 2014 1Q15 2Q15 3Q15
ABS-CBN GMA7 TV-5
60
70
80
90
100
110
120
130
140
150
160
20.0
25.0
30.0
35.0
40.0
45.0
50.0
55.0
60.0
65.0
70.0
Dec-10 Dec-11 Dec-12 Dec-13 Dec-14 Dec-15
ABS-CBN - (LHS, PHP) ABS-CBN / MSCI AC Asia ex JP - (RHS, %)
0.6 0.5
0.6 0.6
0.6
-
0.1
0.2
0.3
0.4
0.5
0.6
0.7
30,000
32,000
34,000
36,000
38,000
40,000
42,000
44,000
FY13 FY14 FY15E FY16E FY17ERevenue (PHPm) Asset turnover (x)
3
5
2 4
1

January 3, 2016
Cons
umer
Sta
ples
Ph
ilipp
ines
JFC’s YoY share price appreciation
Note: 1995, 1998, 2001, 2004, 2007, 2010 and 2013 were election years
Lovell Sarreal [email protected] (63) 2 849 8841
Jollibee Foods (JFC PM)
Pulling ahead with top/bottom line growth
JFC wins with higher share price and stronger sales Regardless of the outcome of the 2016 presidential elections, we believe JFC will be a winner. As the largest restaurant chain in the country, it benefits from healthy consumption that likely will be boosted by election-related spending. We expect 2016F earnings to increase 19% supported by stronger sales growth and better margins. We raise our target price 16% to PHP250 or 41x PER.
Share price goes up faster during election years The simple average of JFC’s share price appreciation from 1994 to 2014 is 20% YoY. It has averaged 10% during non-election years, but a much higher 40% in election years. We don’t think there is any reason 2016 will be different, which should again provide a strong upside catalyst for the shares.
Support comes mainly from stronger sales As the country’s largest restaurant chain operator with 2,393 local stores out of a 3,023-total store network worldwide as of end-Sep 2015, JFC should be among the main beneficiaries of this year’s elections. We expect stronger consumption to be boosted by election-related spending. Based on historical performance, our estimated same-store-sales growth (SSSG) of flagship Jollibee brand was stronger in four of five election years since 2000 vs. the preceding year’s level. Already, JFC’s SSSG has started to strengthen from 4% in 1H15 to 7.6% in 3Q15, and this has been sustained in 4Q15 based on indications. We expect healthy SSSG of 6-7% in 2016F. We also expect faster 28% EBIT growth due to better margins as costs and expenses normalize after raw materials and IT-related costs rose sharply since 2014.
TP raised 16% to PHP250, maintain BUY We raise our target price 16% to PHP250 based on 41x PER. This is a 10% discount to JFC’s peak valuation achieved in Jan-Feb 2015. Taking into account that 2016 is an election year, JFC’s historical price trends, and expectations of healthy sales and earnings growth, we believe the share price can exceed our previous DCF-based TP of PHP215. Maintain BUY with potential share price upside of 14%.
Share Price PHP 219.00
12m Price Target PHP 250.00 (+14%)
Previous Price Target PHP 215.00
BUY
Company description
Statistics52w high/low (PHP)3m avg turnover (USDm)Free float (%)Issued shares (m)Market capitalisation
Major shareholders:25.6%12.0%5.1%
1,052
3.5
Engaged in the development, operation, andfranchising of quick-service restaurants in thePhilippines and worldwide
Hyper Dynamic Corp. Honeysea Corp. Winall Holding Corp
235.80/180.00
38.1
PHP230.5BUSD4.9B
Price Performance
85
90
95
100
105
110
115
120
125
130
150
160
170
180
190
200
210
220
230
240
Jan-14 Apr-14 Jul-14 Oct-14 Jan-15 Apr-15 Jul-15 Oct-15
Jollibee Foods - (LHS, PHP) Jollibee Foods / PSEi Philippine SE Index - (RHS, %)
-1M -3M -12MAbsolute (%) 6 14 2
Relative to index (%) 7 13 6
Source: FactSet
FYE Dec (PHP m) FY13A FY14A FY15E FY16E FY17E
Revenue 80,283 90,671 100,650 114,105 128,707EBITDA 9,004 9,323 10,052 12,278 14,204Core net profit 4,672 5,362 5,405 6,435 7,621Core EPS (PHP) 4.44 5.03 5.07 6.03 7.14Core EPS growth (%) 24.7 13.3 0.8 19.1 18.4Net DPS (PHP) 3.07 1.46 1.69 2.01 2.38Core P/E (x) 49.4 43.6 43.2 36.3 30.7P/BV (x) 10.2 8.6 7.6 6.7 5.8Net dividend yield (%) 1.4 0.7 0.8 0.9 1.1ROAE (%) 21.5 21.6 18.6 19.5 20.3ROAA (%) 10.6 10.7 9.6 10.6 11.4EV/EBITDA (x) 19.7 24.6 22.8 18.6 15.8Net debt/equity (%) net cash net cash net cash net cash net cashConsensus net profit - - 5,617 6,606 7,832MKE vs. Consensus (%) - - (3.8) (2.6) (2.7)
(7.8)
61.4
93.7
(39.1)
(10.4)
8.3
(40.3)
26.3
49.0
-
56.2
42.1
3.7
23.8
(20.2)
32.5
61.6
1.7 12.8
69.7
24.2
(3.6)
-
50.00
100.00
150.00
200.00
250.00
(75.0)
(55.0)
(35.0)
(15.0)
5.0
25.0
45.0
65.0
85.0
105.0
1994
1995
1996
1997
1998
1999
2000
2001
2002
2003
2004
2005
2006
2007
2008
2009
2010
2011
2012
2013
2014
2015
PHP% YoY Price Change YoY (%) Last Price (PHP)
Average change YoY 20.3%Average change during election years 41.2%Average change during non-election years 10.5%

January 3, 2016 97
Jollibee Foods
Value Proposition
§ Through multiple brands, JFC is the biggest restaurant chain operator with 2,393 stores in the Philippines and 630 outlets overseas.
§ Jollibee is an iconic Filipino brand that connects with Filipinos all over the world.
§ JFC has the distinction of beating global QSRs in its home market, including McDonalds and KFC..
§ Initiatives to raise international contribution to 50% of sales (20% currently) will enhance risk-return profile.
§ Value creation highlighted by 13% earnings CAGR from 2004-2014, while ROE averaged 19%.
Domestic store network market share as of end-1H15
Source: JFC
Price Drivers
Historical share price trend
Source: Company, Maybank ATR Kim Eng
1. Started the 2013 election year with robust interim
results. 1Q13 net income grew 33% YoY driven by strong sales and better margins.
2. In Feb 2014, the company disclosed a 24.5% jump in 2013 net income. Robust sales were sustained as evident by 8-9% SSSG. But 4Q15 saw raw material costs increasing.
3. Formed JV in Dec 2014 to open and operate Dunkin Donuts stores in certain territories in China.
4. 4Q14 EBIT declined 14% and only +3.5% for 2014, dampened by higher raw material costs and jump in IT-related expenses.
5. Announced in October the acquisition of an initial 40% stake in US-based Smash Burger for USD339m.
Financial Metrics § Same-store sales growth is an important metric as it
affects turnover and operating leverage. § Estimated SSSG of flagship Jollibee brand normally
strengthens in an election year. § Potential for ROE, already among the highest in listed
Philippines, to expand with increasing scale especially from overseas operations. Expected profit growth of 19% in 2016F to be driven by stronger sales and better margins.
§ Operating cash flow expected at PHP11.1b vs PHP6.7b capex mainly from stores and central kitchen expansion.
Jollibee’s SSSG accelerates during election year
Source: Company and Maybank ATR Kim Eng estimates
Swing Factors
Upside
§ Higher than 6-7% SSSG would enjoy benefits of better operating leverage
§ Faster depletion of high costing raw materials could result in higher margins.
§ Early turnaround of 50%-owned Vietnam JV for Highlands Coffee and Pho 24
§ New acquisition that is value-and earnings-accretive.
Downside
§ Weak consumption in spite of the presidential elections adversely affecting JFC’s sales.
§ Sharp jump in commodity prices, especially for beef and chicken, JFC’s two biggest raw materials.
§ Unexpected supply chain or logistics issues that can adversely affect sales and/or increase costs and expenses.
§ Higher-than-normal store closures. In 2012, JFC closed 101 non-performing stores in the Philippines and overseas and recognized a one-time PHP369m hit.
JFC brands (2,374)
59%
McDonalds 11%
Wendy's 1%
KFC 6%
Chic boy 1%
Shakey's 4%
Pizza Hut 4%
Yellow Cab 3%
Goldilocks 11%
60100140180220260300340380420
6080
100120140160180200220240
Dec-10 Dec-11 Dec-12 Dec-13 Dec-14
Jollibee Foods - (LHS, PHP)
Jollibee Foods / MSCI AC Asia ex JP - (RHS, %)
(2.0) -
2.0 4.0 6.0 8.0
10.0 12.0 14.0 16.0 18.0
2000
2001
2002
2003
2004
2005
2006
2007
2008
2009
2010
2011
2012
2013
2014
(%)
Jollibee domestic est. store sales growth
2
1
3 5
4

January 3, 2016
Real
Est
ate
Phili
ppin
es
Rommel Rodrigo [email protected] (63) 2 849 8839
SM Prime Holdings (SMPH PM)
Campaign spending benefits top mall operator
Reiterate BUY, top pick in the property space Reiterate BUY rating on SMPH, the top mall operator in the Philippines by a wide margin. It is a big beneficiary of rapid growth in consumer spending during normal years, and especially so in election years. In addition, it is now reaping synergies from other recurring incomes, such as office and hotels/leisure, while the residential business is recovering well. We forecast a three-year net profit CAGR of 17% in 2014-2017F driven by mall operations and new real estate developments. NAV of PHP29/sh does not include upside from reclamation projects and development of the Ortigas properties.
Retailing strength more evident in election years As the top Philippine mall operator, SMPH accounts for 65% of the sector GLA under our coverage, and is also the second biggest landlord retailer in ASEAN. SMPH remains market dominant by building four to five new malls per year that we estimate will increase retail GLA by a 13% CAGR in 2014-2017F, underpinning a 17% CAGR in net profit over the same period. SMPH experiences spikes in same-store sales growth (SSSG) coinciding with election years, likely due to election-related spending from thousands of political candidates giving away basic goods and other freebies during the campaign season.
Recovery in residential and new mega projects The residential business has been successfully turned around with quarterly take-up growing at double digit rates YoY since 2Q13. We expect office GLA to more than double to 322k sqm by 2017 and hotel room count to reach 2,268 from 1,015 in 2014.
Further upside from other ventures Our TP of PHP27.20 is at about a 10% discount to estimated NAV of PHP29.80/sh because of its mall leadership. Malls contribute 71% of NAV. Potential upside could come from proposed major Metro Manila reclamation projects, the new consortium to develop properties in the Ortigas CBD, and asset injections, such as office buildings of the Net Quad group now owned by the Sy family holding company.
Share Price PHP 21.70
12m Price Target PHP 27.20 (+25%)
Previous Price Target PHP 27.20
BUY
Company description
Statistics52w high/low (PHP)3m avg turnover (USDm)Free float (%)Issued shares (m)Market capitalisation
Major shareholders:50.9%4.4%2.8%
28,879
6.2
SM Prime Holdings, Inc. operates malls, residentialprojects, offices and hotels
SM Investments Corp. SY HENRY SR OppenheimerFunds, Inc.
22.95/16.78
22.8
PHP626.7BUSD13.3B
Price Performance
85
95
105
115
125
135
145
155
165
175
14.0
15.0
16.0
17.0
18.0
19.0
20.0
21.0
22.0
23.0
Jan-14 Apr-14 Jul-14 Oct-14 Jan-15 Apr-15 Jul-15 Oct-15
SM Prime Holdings - (LHS, PHP)
SM Prime Holdings / PSEi Philippine SE Index - (RHS, %)
-1M -3M -12MAbsolute (%) (3) 5 27
Relative to index (%) (1) 4 32
Source: FactSet
FYE Dec (PHP m) FY13A FY14A FY15E FY16E FY17E
Revenue 59,794 66,240 75,111 81,531 92,585EBITDA 30,117 34,266 40,013 44,887 50,415Core net profit 17,551 19,035 23,136 26,446 30,435Core EPS (PHP) 0.63 0.66 0.80 0.92 1.05Core EPS growth (%) 8.3 4.3 21.5 14.3 15.1Net DPS (PHP) 0.18 0.19 0.22 0.26 0.30Core P/E (x) 34.3 32.9 27.1 23.7 20.6P/BV (x) 3.7 3.1 2.9 2.7 2.4Net dividend yield (%) 0.8 0.9 1.0 1.2 1.4ROAE (%) 11.3 10.5 11.2 11.7 12.4ROAA (%) 5.7 5.3 5.6 5.7 6.0EV/EBITDA (x) 16.2 17.2 18.6 17.1 15.5Net debt/equity (%) 47.9 47.2 53.2 58.4 57.4Consensus net profit - - 22,450 25,362 29,118MKE vs. Consensus (%) - - 3.1 4.3 4.5

January 3, 2016 99
SM Prime Holdings
0
5
10
15
20
01-Dec-05 01-Dec-08 01-Dec-11 01-Dec-14
(%)
WACC ROIC
Value Proposition
§ SMPH is the market leader in mall space by a wide margin, with 5.6m sqm GLA. It accounts for 65%/62% of total property sector retail GLA/revenues.
§ Sustaining leadership position. Expanding its mall GLA at 13% CAGR to 7.5m sqm in 2017F.
§ Lowest risk in our coverage universe. Recurring income is 82% of EBITDA. Possesses pricing power by virtue of its dominant position.
§ Cost of capital may edge slightly with US rate hikes. WACC has been trending lower since 2008, but so has ROIC.
SMPH’s WACC and ROIC (2005-2015)
Source: Factset
Price Drivers
Historical share price trend
Source: Factset
1. SMPH raises PHP5b in debt for mall expansions. 2. Shares correct after SMPH announces merger with SMDC. 3. Regulators approve merger. 4. SMPH clarifies unsold inventory figures of residential unit
SMDC, most of which are not ready for occupancy. 5. SM opens SM Seaside Cebu, SM’s largest mall outside
Luzon.
Financial Metrics
§ We forecast EBITDA margin to normalise to 55% from 50% because of the strong recurring components.
§ Same-store sales surge during election years. Similarly, SMPH’s share price appreciates during election years based on historical data.
§ Healthy balance sheet with 55% net gearing below peer average.
§ Our RNAV per share of PHP29.80 and target price of PHP27.20 takes into account the mall expansion and modest residential sales.
Estimated same-store-sales growth (red are election years)
Source: Maybank ATR KE estimates
Swing Factors
Upside
§ Additional mall pipeline, higher-than-expected variable lease rates.
§ Further details on the Ortigas joint venture with Ayala Land Inc.
§ Updates on the reclamation projects. § Favourable results from the Swiss challenge of the
Bonifacio South Property. § Sustained high growth in sales take-up.
Downside
§ Delays in project completions, especially large malls § Unexpected build-up in residential inventory from slower
reservation sales. § Sudden weakening in same-store-sales growth.
80
120
160
200
240
280
320
360
400
8.0
10.0
12.0
14.0
16.0
18.0
20.0
22.0
24.0
Dec-10 Dec-11 Dec-12 Dec-13 Dec-14
SM Prime Holdings - (LHS, PHP)
SM Prime Holdings / MSCI AC Asia ex JP - (RHS, %)
1
2
3
5
4
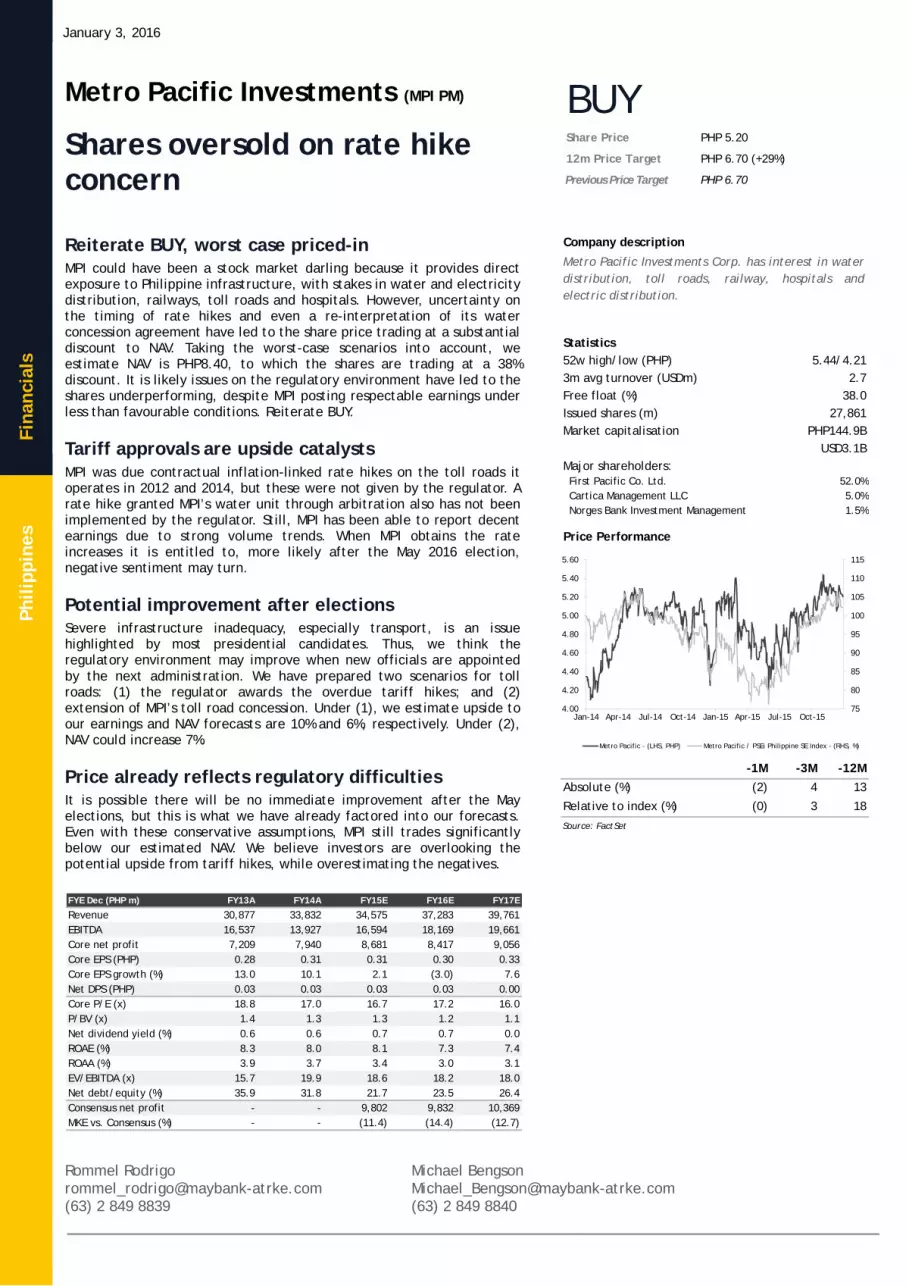
January 3, 2016
Fina
ncia
ls
Phili
ppin
es
Rommel Rodrigo [email protected] (63) 2 849 8839
Michael Bengson [email protected] (63) 2 849 8840
Metro Pacific Investments (MPI PM)
Shares oversold on rate hike concern
Reiterate BUY, worst case priced-in MPI could have been a stock market darling because it provides direct exposure to Philippine infrastructure, with stakes in water and electricity distribution, railways, toll roads and hospitals. However, uncertainty on the timing of rate hikes and even a re-interpretation of its water concession agreement have led to the share price trading at a substantial discount to NAV. Taking the worst-case scenarios into account, we estimate NAV is PHP8.40, to which the shares are trading at a 38% discount. It is likely issues on the regulatory environment have led to the shares underperforming, despite MPI posting respectable earnings under less than favourable conditions. Reiterate BUY.
Tariff approvals are upside catalysts MPI was due contractual inflation-linked rate hikes on the toll roads it operates in 2012 and 2014, but these were not given by the regulator. A rate hike granted MPI’s water unit through arbitration also has not been implemented by the regulator. Still, MPI has been able to report decent earnings due to strong volume trends. When MPI obtains the rate increases it is entitled to, more likely after the May 2016 election, negative sentiment may turn.
Potential improvement after elections Severe infrastructure inadequacy, especially transport, is an issue highlighted by most presidential candidates. Thus, we think the regulatory environment may improve when new officials are appointed by the next administration. We have prepared two scenarios for toll roads: (1) the regulator awards the overdue tariff hikes; and (2) extension of MPI’s toll road concession. Under (1), we estimate upside to our earnings and NAV forecasts are 10% and 6%, respectively. Under (2), NAV could increase 7%.
Price already reflects regulatory difficulties It is possible there will be no immediate improvement after the May elections, but this is what we have already factored into our forecasts. Even with these conservative assumptions, MPI still trades significantly below our estimated NAV. We believe investors are overlooking the potential upside from tariff hikes, while overestimating the negatives.
Share Price PHP 5.20
12m Price Target PHP 6.70 (+29%)
Previous Price Target PHP 6.70
BUY
Company description
Statistics52w high/low (PHP)3m avg turnover (USDm)Free float (%)Issued shares (m)Market capitalisation
Major shareholders:52.0%5.0%1.5%
27,861
2.7
Metro Pacific Investments Corp. has interest in waterdistribution, toll roads, railway, hospitals andelectric distribution.
First Pacific Co. Ltd. Cartica Management LLC Norges Bank Investment Management
5.44/4.21
38.0
PHP144.9BUSD3.1B
Price Performance
75
80
85
90
95
100
105
110
115
4.00
4.20
4.40
4.60
4.80
5.00
5.20
5.40
5.60
Jan-14 Apr-14 Jul-14 Oct-14 Jan-15 Apr-15 Jul-15 Oct-15
Metro Pacific - (LHS, PHP) Metro Pacific / PSEi Philippine SE Index - (RHS, %)
-1M -3M -12MAbsolute (%) (2) 4 13
Relative to index (%) (0) 3 18
Source: FactSet
FYE Dec (PHP m) FY13A FY14A FY15E FY16E FY17E
Revenue 30,877 33,832 34,575 37,283 39,761EBITDA 16,537 13,927 16,594 18,169 19,661Core net profit 7,209 7,940 8,681 8,417 9,056Core EPS (PHP) 0.28 0.31 0.31 0.30 0.33Core EPS growth (%) 13.0 10.1 2.1 (3.0) 7.6Net DPS (PHP) 0.03 0.03 0.03 0.03 0.00Core P/E (x) 18.8 17.0 16.7 17.2 16.0P/BV (x) 1.4 1.3 1.3 1.2 1.1Net dividend yield (%) 0.6 0.6 0.7 0.7 0.0ROAE (%) 8.3 8.0 8.1 7.3 7.4ROAA (%) 3.9 3.7 3.4 3.0 3.1EV/EBITDA (x) 15.7 19.9 18.6 18.2 18.0Net debt/equity (%) 35.9 31.8 21.7 23.5 26.4Consensus net profit - - 9,802 9,832 10,369MKE vs. Consensus (%) - - (11.4) (14.4) (12.7)

January 3, 2016 101
Metro Pacific Investments
Value Proposition
§ MPI owns stakes in water and power utilities, railways, toll roads and hospitals. Derives ~92% of operating income from regulated businesses with high EBITDA margin.
§ Core business segments are defensive and generate stable cash flows. But failure to secure rate increases has stalled growth and returns.
§ Superior management quality can be demonstrated by value creation in numerous acquisitions.
§ MPI enhanced operating efficiency and earnings quality to foster value creation. EBITDA margins improved to 57% in 2014 from 16% in 2008.
§ ROIC has improved over the WACC since 2014 because of higher EBITDA margins and improved sales volume.
ROIC vs WACC
Source: Bloomberg
Price Drivers
Historical share price trend
Source: Company, Factset
1. MPI announced partial sale of stake in Maynilad Water
Services Inc. to Marubeni Corp. 2. Maynilad submitted a business plan for rate rebasing,
asking for PHP8.58/m3 increase in water rates. 3. MWSS-RO denied Maynilad’s petition and ordered a
PHP1.46/m3 cut in rates. 4. MPI received favourable decision on arbitration case. 5. MPI-Ayla Corp consortium took over LRT 1 operations.
Financial Metrics
§ The inability to get tariff increases has depressed returns. EBITDA margin of ~54% is high relative to other conglomerates, but high operating leverage weighs on ROIC.
§ We expect tariff increases in toll roads and water or an extension of the concession period when a new administration is in place. Low net debt-equity and steady dividend streams from subsidiaries to the parent implies more capacity to take on debt for project expansions. A key ratio to monitor is net debt to EBITDA of subsidiaries, which shows it takes only 1-3 years for MPI’s subsidiaries annual cash flows to pay-off debts for each unit.
Net debt to EBITDA ratio of MPI’s units
Source: Company Data
Swing Factors
Upside
§ Grant of tariff increase in water or toll roads. § If the regulator awards the tariff hike for toll roads, our
estimates will increase for NAV/PS by 6% and earnings by 10%.
§ If the regulator decides to extend the concession, we forecast NAV will increase by 7% and earnings will be the same.
§ New project wins for the conglomerate, like bulk water supply, will be NAV-accretive.
Downside
§ Further delays in tariff hikes will hamper earnings growth and capital structure.
§ Decline in EBITDA/EBIT margins due to lower tariffs. § Unfavourable regulatory ruling in other concessions will
depress our NAV estimate.
80
100
120
140
160
180
200
220
240
2.50
3.00
3.50
4.00
4.50
5.00
5.50
6.00
6.50
Dec-10 Dec-11 Dec-12 Dec-13 Dec-14Metro Pacific - (LHS, PHP)
Metro Pacific / MSCI AC Asia ex JP - (RHS, %)
1
2
3 5 4

January 3, 2016
Tele
com
mun
icat
ions
Ph
ilipp
ines
Michael Bengson [email protected] (63) 2 849 8840
Philippine Long Distance Tel (TEL PM)
Shares oversold, plus 5.8% div. yield
30% correction excessive, valuations attractive PLDT’s share price is at a four-year low, weighed down by concerns over its ability to retain market share and Telstra’s possible entry via a JV with San Miguel Corp. Given that steps have been taken to reverse the market share slide, while no deal has been signed by Telstra, the ~30% correction YTD looks excessive. Even if the SMC-Telstra JV materializes, we see little impact to PLDT’s FY16 profit. But earnings may be helped by election-related spending in 2016, which could lift revenues. With 17% share price upside to our DCF-based TP of PHP2,400 and the highest dividend yield of 5.8% among PSEi index constituents, maintain BUY.
Measures to stem market share decline PLDT is increasing spending to update the network. Also, there have been management changes, and continuing marketing efforts to better differentiate each mobile brand. Results are not yet visible, but these steps to stem the market share decline will likely be positive longer-term.
Little impact from new entrant in FY16 If the SMC-Telstra JV pushes through and launches its service offering next year, we believe the impact to PLDT’s profit will be minimal in FY16. The threat to incumbents is over the long-term as a new entrant cannot put up base stations and invest in its core network and backhaul overnight. There are other significant challenges: (1) there is no tower sharing in the Philippines; (2) interconnection costs are high; and (3) ARPUs in the Philippines are much lower than in developed countries.
Regulatory issue needs to be resolved PLDT has applied with the National Telecommunications Commission for equitable allocation of the 700MHz frequency now assigned to SMC and affiliates. The frequency is attractive for cost-efficient mobile internet access. It could be a key factor in whether or not the SMC-Telstra JV proceeds. The NTC takes time in resolving issues, and this one is likely to be taken up by officials appointed after the May 2016 elections.
Share Price PHP 2,060.00
12m Price Target PHP 2,400.00 (+17%)
Previous Price Target PHP 2,400.00
BUY
Statistics52w high/low (PHP)3m avg turnover (USDm)Free float (%)Issued shares (m)Market capitalisation
Major shareholders:14.5%12.1%10.0%
216
6.3
NTT DoCoMo, Inc. Philippine Telecommunications Investment Metro Pacific Co. Ltd.
3,200.00/1,964.00
45.9
PHP445.1BUSD9.5B
Price Performance
60
70
80
90
100
110
120
130
140
150
1,800
2,000
2,200
2,400
2,600
2,800
3,000
3,200
3,400
3,600
Jan-14 Apr-14 Jul-14 Oct-14 Jan-15 Apr-15 Jul-15 Oct-15
PLDT - (LHS, PHP) PLDT / PSEi Philippine SE Index - (RHS, %)
-1M -3M -12MAbsolute (%) (4) (6) (29)
Relative to index (%) (2) (6) (26)
Source: FactSet
FYE Dec (PHP m) FY13A FY14A FY15E FY16E FY17E
Revenue 168,331 170,962 175,280 179,836 185,275EBITDA 74,140 73,033 73,617 75,026 76,195Core net profit 38,684 37,410 34,365 35,247 33,884Core EPS (PHP) 179.05 173.16 159.06 163.15 156.84Core EPS growth (%) 4.7 (3.3) (8.1) 2.6 (3.9)Net DPS (PHP) 175.00 185.00 152.00 119.00 119.00Core P/E (x) 11.5 11.9 13.0 12.6 13.1P/BV (x) 3.2 3.3 3.4 3.3 3.2Net dividend yield (%) 8.5 9.0 7.4 5.8 5.8ROAE (%) 27.4 27.6 26.0 26.6 24.9ROAA (%) 9.6 9.0 7.9 8.0 7.6EV/EBITDA (x) 8.8 10.0 7.4 7.3 7.1Net debt/equity (%) 52.6 77.0 77.4 74.5 70.5Consensus net profit - - 34,383 33,265 33,382MKE vs. Consensus (%) - - (8.3) (2.8) (7.3)

January 3, 2016 103
Philippine Long Distance Telephone
Value Proposition § PLDT is the larger player in a currently duopolistic
Philippine telco market. Its business is non-cyclical, high-FCF generative, and generates a high return on capital.
§ Flat/stable cash flow cushioned by robust data revenue (~35% smart phone penetration), offsetting declining ILD & NLD revenues.
§ But risks have spiked. Potential new entrant, a JV between Telstra and San Miguel, may threaten market share, growth, and potential returns.
§ Such developments have put PLDT on the defensive. Yet, we believe this has been priced-in and valuations have turned attractive in light of the 30% y-t-d drop in price. Election-related spending may provide a marginal boost to profit in 1H15. In previous elections, campaigning was done through SMS and prepaid load was given away.
Market share – total mobile subscribers
Source: Company
Price Drivers
Historical share price trend
Source: Company, Maybank Kim Eng
1. Announces acquisition of Digitel. 2. Acquires minority stake in Rocket Internet for EUR333m. 3. Cuts pay-out ratio to 90% from over 100%, also reduces
core net income guidance to PHP37b, and increases 2015 capex guidance to PHP39b.
4. Telstra confirms discussion with SMC for a wireless joint venture.
Financial Metrics
§ Data growth should steady EBITDA margin at 41-42% and FCF yield stay relatively high at ~7% in 2016-17 in spite of higher capex assumptions.
§ DCF valuation is PHP2,400/sh, which already assumes higher capex for 2016-17. The stock trades below its 10-year average P/E.
§ Dividend yield at 5.8% is the highest in the market. § We see minimal impact on FY16 profit from a new entrant
given the length of time and high cost required to build out base stations and backhaul in the Philippines.
P/E band
Source: Company
Swing Factors
Upside
§ SMC-Telstra JV does not push through. § National Telecommunications Commission and judiciary
support more equitable distribution of 700 MHz frequency.
§ Election-related spending boosts revenue.
Downside
§ A credible third player disrupts the market. § Reallocation of 700 MHz frequency is not implemented. § Market share continues decline in spite of measures to
reverse such trend.
63.4% 61.7% 61.7% 61.3% 60.2% 58.7% 57.2%
36.6% 38.3% 38.3% 38.7% 39.8% 41.3% 42.8%
0.0%
10.0%
20.0%
30.0%
40.0%
50.0%
60.0%
70.0%
1Q14 2Q14 3Q14 4Q14 1Q15 2Q15 3Q15
PLDT Globe Telecom
8090100110120130140150160170
1,8002,0002,2002,4002,6002,8003,0003,2003,4003,600
Dec-10 Dec-11 Dec-12 Dec-13 Dec-14
PLDT - (LHS, PHP) PLDT / MSCI AC Asia ex JP - (RHS, %)
0
5
10
15
20
25
PE
Mean
-2SD
-1SD
+1SD
+2SD
(X)
1
2
4
3


January 3, 2016
STRA
TEG
Y Si
ngap
ore
Stock Bloomberg Mkt cap Rating Price TP Upside P/E (x) P/B (x) Dividend yld (%)
Code (USD'm) (LC) (LC) (%) 15E 16E 15E 16E 15E 16E Cordlife CLGL SP 272 BUY 1.45 1.72 19 46.5 41.3 1.6 1.6 10.6 1.6 Jumbo JUMBO SP 190 BUY 0.43 0.58 36 18.0 16.2 6.2 4.9 1.7 1.8 POSH POSH SP 392 BUY 0.3 0.47 57 (12.5) 6.0 0.3 0.3 0.0 5.0 Raffles Medical RFMD SP 1,700 BUY 4.18 5.22 25 36.4 33.1 4.3 3.9 1.5 1.6 SembCorp Marine SMM SP 2,600 SELL 1.77 1.53 -14 16.4 11.4 1.2 1.1 2.3 4.5 Venture VMS SP 1,600 BUY 8.16 10.70 31 14.2 12.9 1.2 1.2 6.2 6.8
Singapore’s Six-for-16
Looking for Undulations in the Flatlands
Looking for undulations in the flatlands Singapore could face an old conundrum in 2016. Domestic growth has hit a wall. Many attempts have been made to beat this: remaking the landscape with glitzy casinos; intoning the productivity mantra; participation in AEC and TPP, the region’s latest cracks at economic cooperation. The “Committee on the Future Economy” spearheaded by the new Finance Minister is studying longer-term solutions and its report should be out sometime in late 2016/early 2017. Meanwhile, while we can’t reform the flatlands, we can attempt to look for undulations that could provide investor interest. Our three ideas for 2016 are:
Breaking out with Brand Singapore Singapore companies need a hinterland and to do things not just better but uniquely. Their advantage is they have brands that are highly regarded in the region for providing good, clean deals. We propose two companies – one in F&B and the other in healthcare - that are breaking out of familiar grounds, riding powerful brands honed and refined in the most open economy of all: Jumbo Group (JUMBO SP, BUY, TP SGD0.58) and Raffles Medical (RFMD SP, BUY, TP SGD5.22).
More M&As expected After identifying the offshore industry as a major Achilles heel in our Unmasking Singapore stress tests last year, subsequent debt renegotiations and loss provisions drive home the point. For 2016, we see M&As accelerating in the oil service industry, where some stocks are so devalued that owners may just decide to privatise. Think PACC Offshore (POSH SP, BUY, TP SGD0.47) and Sembcorp Marine (SMM SP, SELL, TP SGD1.53). Also, we have identified possible M&As in property & REITs, where depressed asset values could precipitate more value-unlocking. Finally, we identify Cordlife (CLGL SP, BUY, TP SGD1.72) as a potential takeover candidate in healthcare.
When extremes meet: SGD1.60/USD + 4 rate hikes The only sector that wholly benefited from USD strength and the bogeyman of higher interest rates in 2015 was manufacturing. But what if these two gather steam in 2016, instead of petering out? As the pain intensifies for companies, we would expect more aid from the government in Budget 2016. The only sector that could emerge a winner on all counts is still manufacturing, in our view. Hence, our top pick of Venture Corp (VMS SP, BUY, TP SGD10.70). That said, we caution that everything is better in moderation; excessive USD strength could hurt end-demand, affecting topline growth.
Analysts Singapore Research Team
Derrick Heng (65) 6231 5843 [email protected] Gregory Yap (65) 6231 5848 [email protected] John Cheong (65) 6231 5845 [email protected] Joshua Tan (65) 6231 5850 [email protected] Ng Li Hiang (65) 6231 5840 [email protected] Yeak Chee Keong (65) 6231 5842 [email protected]

January 3, 2016 106
Singapore’s Six-for-16
1. Setting the tone
1.1 External, domestic risks rising In 2016, Singapore could face a cocktail of risks, from China’s slowdown and oil-price weakness to further Fed-rate hikes which could dampen global demand. The government thinks the economy would grow just 1-3%. As 2015 GDP growth is expected to be “close to 2%”, it appears to be hedging its bets by providing an equal buffer around this midpoint.
Domestically, cost escalations continue to haunt corporates as the economy relies less and less on low-wage foreign workers, turning instead to an emphasis on productivity gains. Higher interest rates could worsen a slowing property market. Singapore may have escaped a technical recession in 3Q15 but the odds of one as we head into 2016 are growing. In other words, we are expecting more of the same issues in 2016; things may get worse before they get better.
1.2 Small comforts To be sure, lower energy prices would help. So would a less restrictive monetary policy and expansionary budget. A stronger US economy should also support exports and counteract part of the soft demand from Singapore’s other trading partners. Before that, US demand for Singapore’s output has to pick up. So far, it has not.
Still, all this merely kicks the can down the road and does not provide long-term solutions.
1.3 Government trying to find more rabbits in the hat The government is, as usual, on its toes and has set up a new economic review committee, its third in 12 years, to nail down long-term solutions. The past two committees were the Economic Review Committee (ERC) in 2001 and the Economic Strategies Committee (ESC) in 2009. In 2001, in the aftermath of the US tech-bubble burst and rising competition from other Asian economies, the ERC focused on economic restructuring to boost growth and cost-cutting to stay competitive. In 2009, amid slower growth after the 2007-2008 global financial crisis, the ESC recommended a shift to productivity-driven growth.
The latest Committee on the Future Economy (CFE) will study and recommend how Singapore can climb the ladder from value-addition to value-creation. It is headed by the new Finance Minister, Heng Swee Kiat, and co-Minister for Trade and Industry (Industry), S Iswaran, with Acting Minister for Education (Higher Education and Skills) Ong Ye Kung, National Development Minister Lawrence Wong and NTUC secretary-general and Minister in the Prime Minister's Office Chan Chun Sing also on the committee.
1.4 For 2016, we look for undulations in the flatlands We believe the CFE has its work cut out for it. The economy has matured, with growth plateauing. The committee aims to submit its report by the end of 2016. Its findings and recommendations would be highly anticipated by the market and surely find their way into government policies in the next few years. In the interim, while we may not be able to reform a flat landscape, we believe the following themes could rise in prominence in 2016.

January 3, 2016 107
Singapore’s Six-for-16
§ One, help companies find bigger MARKETS. Minister Heng has framed Singapore’s economic challenges in terms of jobs, companies, resources, technology and markets. In his own words, the future of markets is important because “if we transcend the Singapore market, we achieve scale”. Hence, we look out for companies that are successfully exporting their brands to bigger markets. We pick Jumbo Group and Raffles Medical as two companies that are likely to gain overseas traction in future.
§ Two, help COMPANIES adapt to new realities. According to the minister, the future of companies is also being affected by the rise of disruptive business models and competition from abroad. To stay competitive, Singapore companies need to explore "cooperative platforms" across entire clusters of companies in order to maximise capabilities. For 2016, we would anticipate more-than-usual corporate restructuring, privatisations or takeovers. Such events are always on-going but given the challenges ahead, 2016 could see a big bump-up. We think these could be found in the property and healthcare sectors, but especially offshore & marine which we first flagged in our Unmasking Singapore stress tests last year. We identify PACC Offshore, Sembcorp Marine and Cordlife as the biggest privatisation prospects.
§ Three, give more RESOURCES. Amid rising economic challenges, SGD is likely to weaken further. Our economists’ forecast is SGD1.47/USD ie up about 5%. Accustomed to scenario-testing as analysts, we think it is equally relevant to ask “what-if”: what if SGD weakens beyond current expectations, say 10% to SGD1.60? This is not inconceivable. If so, Singapore companies could be disadvantaged and Budget 2016 may have to include more aid for them, even if only pre-emptive. In such a scenario, the only sector that should emerge a winner on all fronts should, again, be manufacturing. Hence, our top pick of Venture Corp.

January 3, 2016 108
Singapore’s Six-for-16
2. Breaking out with Brand Singapore
2.1 Going global to circumvent Singapore conundrum Breaking into new hinterlands has always been the holy grail of Singapore companies stuck with a tiny domestic market. We can think of two brands that struck out earlier than most, by now truly global: Singapore Airlines and Banyan Tree. Big property developers followed suit, such as CapitaLand which moved quickly into China. Just as there is a Raffles City shopping mall in Singapore, there are now eight Raffles City malls in China. A third wave is being led by consumer companies such as OSIM, BreadTalk, Raoul by FJ Benjamin and Thai Express, until today.
2.2 No scarcity of capital, just too much hubris Going global or even regional is no stroll in the park. Several high-profile Chinese brands have hit road bumps in their internationalisation efforts. Sportswear group, Li Ning, failed in the US as it tried to run before it could walk. Xiaomi, best-known for its cheap smartphones in China, has not really made a dent overseas, apart from India and Africa. Even Alibaba, which got extensive global media coverage during its IPO in 2014, is still seen by the world more as a stock to trade in than trade with. Their biggest problem, as we see it, is not capital, but underestimation of overseas operating and regulatory risks. Difficulties in managing overseas expansion or integrating acquisitions are hurdles which companies lacking in experience or discipline tend to trip over.
2.3 Slow-and-steady wins the race We believe Singapore companies have a higher probability of success. While critics have been quick to accuse Singapore companies of being slow in deal-making out of fear of breaking rules, we believe that their systems and practices actually serve them well, especially in vast markets such as China. They can usually move fast whenever they feel the need to. How they stack up against international best practices in building brands or expanding overseas is summarised below.
Fig 1: International best practices in going global Key challenges International best practices Brand vision & strategy Clear visions and mandates Defined strategies for value creation Aligned stakeholder and management interests Management capabilities Able to inspire and explain visions Understand own brand value and financial strength Mindful of regulatory and governmental considerations in overseas deals Clear decision-making process and communications (external and internal) Use of external resources and research Understand own skills and limitations
Select advisors & consultants with relevant experience and the ability to work closely as a team
Source: KPMG, OgilvyPR, Fleishman Hillard, Burson-Marsteller

January 3, 2016 109
Singapore’s Six-for-16
2.4 Two Singapore companies that stack up We propose two companies – one in F&B and the other in healthcare - that are doing just that: Jumbo Group and Raffles Medical. Both are expanding in China. Both are harnessing their powerful brands created and refined in Singapore, arguably the most open economy in the world. Despite their shortcomings, Singapore companies’ most powerful weapon is the respect they command in the region for providing good, clean deals.
Fig 2: How Jumbo and Raffles Medical stack up against international best practices
Best practices How Jumbo stacks up How Raffles Medical stacks up Clear brand vision & mandates Tagline of "Bonding people through food" runs alongside vision
of being "the leading innovative F&B group advocating
Singapore food culture".
Executive Chairman and Founder Dr Loo Choon Yong has a
philosophy of "patients come first, profits come later". This has
served both patients and shareholders well and generated more
than 20 years of consistent revenue & profit growth.
Well-defined strategies for value
creation
CEO Ang Kiam Lim, also the primary founder's son, works with
professional management to execute local and overseas
expansion with ROI as key benchmark.
Has a long-term double-digit growth target, supported by local
and increasingly, overseas expansion. Another target is to have
>50% of profits coming from overseas. We expect maiden
contributions from its hospital venture in Shanghai, China in
mid-2018.
Stakeholder and management
interests aligned
Three of six directors on its board are independent, with over
60% of outstanding shares owned by founders and related
parties.
Five out of eight directors on its board are independent, with
over 50% of outstanding shares owned by the founder and
related parties.
Management able to inspire and
explain vision, understands
brand value and financial
strength
Founded by family and friends who love eating, especially
seafood. But restaurant business is dependent on
professionals, such as chefs and operational people. Recently
roped in a CFO to raise standards in finance functions.
Founded in 1976 by Dr Loo and Dr Alfred Loh with just two
clinics, Raffles Medical has grown into a multi-disciplinary
private tertiary hospital with more than 80 private clinics in
Singapore. It serves over 2m patients annually and more than
6,500 corporate clients. Assisted by a professional management
team, Dr Loo remains actively involved in management,
spearheading strategic expansion.
Major partnerships in restaurant sites, ie landlords such as
National Parks Board in Singapore, Capitaland Mall Asia and
Sun Hung Kai in China. Management service agreements with
Japanese and Singapore partners for Singapore Seafood
Republic and Yoshimaru Ramen, as well as Breadtalk in China
seafood ventures.
Intends to operate new Shanghai hospital under its own brand
and operating model. Rebranding all 10 clinics to Raffles Medical
brand after acquiring International SOS MC Holdings.
Mindful of regulatory and
governmental considerations in
overseas deals
Fully aware. Fully aware. Studied the Chinese market for more than three
decades before venturing in and took more than two years from
signing of MOU to obtaining all the approvals for its Shanghai
hospital.
Clear decision-making process
and communications
Clear allocation of roles. Clear allocation of roles.
Use of external resources and
research
Receptive. In 2006, a food technology consultant was brought
in to ensure that its famed chilli crab dish could be replicated
overseas “without losing its flavour and texture” before they
expanded overseas.
Receptive. Keen to partner reliable partners for its China
venture. It partnered a Chinese government-linked company,
Shanghai Lujiazui Group, for its first hospital in Shanghai.
Source: Maybank Kim Eng
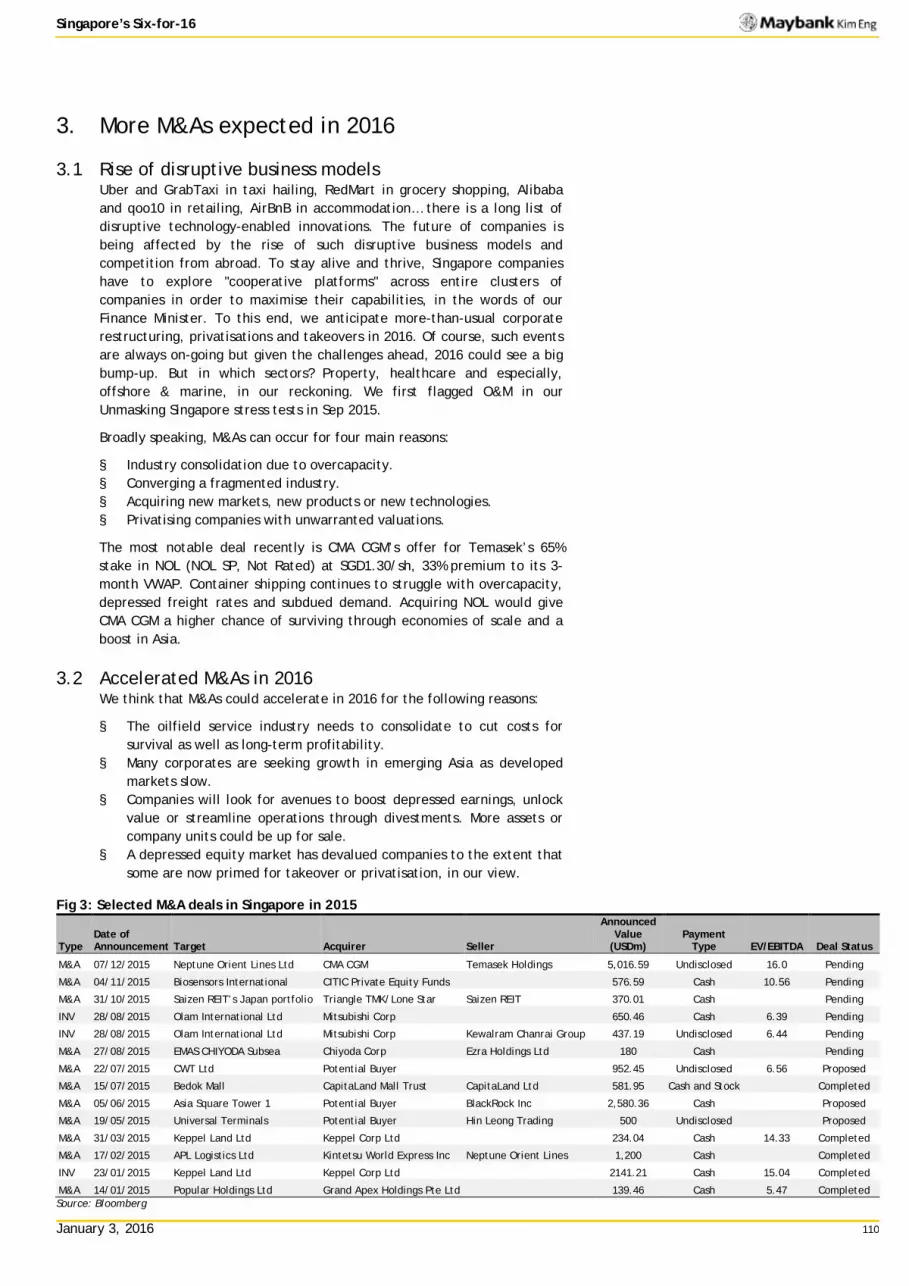
January 3, 2016 110
Singapore’s Six-for-16
3. More M&As expected in 2016
3.1 Rise of disruptive business models Uber and GrabTaxi in taxi hailing, RedMart in grocery shopping, Alibaba and qoo10 in retailing, AirBnB in accommodation… there is a long list of disruptive technology-enabled innovations. The future of companies is being affected by the rise of such disruptive business models and competition from abroad. To stay alive and thrive, Singapore companies have to explore "cooperative platforms" across entire clusters of companies in order to maximise their capabilities, in the words of our Finance Minister. To this end, we anticipate more-than-usual corporate restructuring, privatisations and takeovers in 2016. Of course, such events are always on-going but given the challenges ahead, 2016 could see a big bump-up. But in which sectors? Property, healthcare and especially, offshore & marine, in our reckoning. We first flagged O&M in our Unmasking Singapore stress tests in Sep 2015.
Broadly speaking, M&As can occur for four main reasons:
§ Industry consolidation due to overcapacity. § Converging a fragmented industry. § Acquiring new markets, new products or new technologies. § Privatising companies with unwarranted valuations.
The most notable deal recently is CMA CGM’s offer for Temasek’s 65% stake in NOL (NOL SP, Not Rated) at SGD1.30/sh, 33% premium to its 3-month VWAP. Container shipping continues to struggle with overcapacity, depressed freight rates and subdued demand. Acquiring NOL would give CMA CGM a higher chance of surviving through economies of scale and a boost in Asia.
3.2 Accelerated M&As in 2016 We think that M&As could accelerate in 2016 for the following reasons:
§ The oilfield service industry needs to consolidate to cut costs for survival as well as long-term profitability.
§ Many corporates are seeking growth in emerging Asia as developed markets slow.
§ Companies will look for avenues to boost depressed earnings, unlock value or streamline operations through divestments. More assets or company units could be up for sale.
§ A depressed equity market has devalued companies to the extent that some are now primed for takeover or privatisation, in our view.
Fig 3: Selected M&A deals in Singapore in 2015
Type
Date of Announcement Target Acquirer Seller
Announced Value
(USDm) Payment
Type EV/EBITDA Deal Status
M&A 07/12/2015 Neptune Orient Lines Ltd CMA CGM Temasek Holdings 5,016.59 Undisclosed 16.0 Pending
M&A 04/11/2015 Biosensors International CITIC Private Equity Funds 576.59 Cash 10.56 Pending
M&A 31/10/2015 Saizen REIT’s Japan portfolio Triangle TMK/Lone Star Saizen REIT 370.01 Cash Pending
INV 28/08/2015 Olam International Ltd Mitsubishi Corp 650.46 Cash 6.39 Pending
INV 28/08/2015 Olam International Ltd Mitsubishi Corp Kewalram Chanrai Group 437.19 Undisclosed 6.44 Pending
M&A 27/08/2015 EMAS CHIYODA Subsea Chiyoda Corp Ezra Holdings Ltd 180 Cash
Pending
M&A 22/07/2015 CWT Ltd Potential Buyer 952.45 Undisclosed 6.56 Proposed
M&A 15/07/2015 Bedok Mall CapitaLand Mall Trust CapitaLand Ltd 581.95 Cash and Stock
Completed
M&A 05/06/2015 Asia Square Tower 1 Potential Buyer BlackRock Inc 2,580.36 Cash
Proposed
M&A 19/05/2015 Universal Terminals Potential Buyer Hin Leong Trading 500 Undisclosed
Proposed
M&A 31/03/2015 Keppel Land Ltd Keppel Corp Ltd 234.04 Cash 14.33 Completed
M&A 17/02/2015 APL Logistics Ltd Kintetsu World Express Inc Neptune Orient Lines 1,200 Cash
Completed
INV 23/01/2015 Keppel Land Ltd Keppel Corp Ltd 2141.21 Cash 15.04 Completed
M&A 14/01/2015 Popular Holdings Ltd Grand Apex Holdings Pte Ltd 139.46 Cash 5.47 Completed Source: Bloomberg

January 3, 2016 111
Singapore’s Six-for-16
3.3 Sectors most likely to see M&As
1. Oilfield service sector needs to consolidate § Clearly, oilfield services share similarities with the shipping sector
and a consolidation wave is expected.
§ Offshore shipyards are reeling under order droughts while asset owners are suffering from low asset utilisation and 15-30% charter-rate cuts.
§ Many small players are over-leveraged due to prior debt-funded expansion. They face the threat of bankruptcy if the downturn is extended.
§ The industry needs to cut costs and reduce capacity for long-term profitability.
Globally, consolidation has been set in motion by two potential mega-mergers: the USD35b Halliburton-Baker Hughes deal and USD15b Schlumberger-Cameron merger. The offers were made at c.56% premiums. In Singapore, there could be more targets than acquirers as most players are small and highly leveraged.
2. Undervalued property assets may attract buyers or motivate divestments Property stocks are trading at 20-40% discounts to their RNAV, pricing in the risk of further price falls. We think that developers may look for ways to generate shareholder returns through asset disposals in 2016. Depressed valuations are also likely to attract buyers. We see opportunities in:
§ City Developments. Stock trades at a c.40% discount to our RNAV estimate of SGD12.72. Company could unlock the value of its assets conservatively held at depreciated costs. In Dec 2014, it booked a gain of SGD331m by injecting its Sentosa assets into Profit Participation Securities (PPS). One year later, in Dec 2015, it established its second PPS to unlock SGD1.1b of Sentosa asset value for shareholders. We expect the company to continue with its quest and expect the market to take any progress positively. Since then, it has been on the lookout for similar deals. According to The Business Times in Aug 2015, CDL was exploring opportunities to monetise its industrial properties. We expect the market to take any progress positively, as it would likely book handsome gains on assets conservatively held at cost.
§ Ho Bee. The Metropolis, Ho Bee’s office building in Buona Vista, is worth SGD1.58b, in our estimation. Unlike prime office assets that face an impending supply glut, we believe The Metropolis could benefit from: 1) further office decentralisation; and 2) Jurong’s development into the next major commercial centre. (Buona Vista is only three MRT stations away from Jurong).

January 3, 2016 112
Singapore’s Six-for-16
3. REITs may be ready for value-unlocking On 31 Oct 2015, Saizen REIT (SZREIT SP, Not Rated) proposed the sale of its entire property portfolio at a 3.4% premium to valuation, implying a net offer price of SGD1.17 vs NAV of SGD1.14. This represented a 36.9% premium to its pre-announcement trading price of 85.5 Scts. The move could signal that smaller SREITs - Saizen’s market cap before its announcement was c.SGD250m - trading at steep discounts to NAV or peers may be ready to unlock shareholder value. We see potential in the following:
§ Among industrial REITs, there are six REITs with <SGD1b in market cap and three above SGD2.5b. Those below SGD1b trade at 8.2-10% historical yields and 0.69-0.94 P/BVs. These compare with larger peers’ 6.2-7.4% yields and 0.99-1.15 P/BVs. Their valuation gap underscores the importance of scale in achieving fairer valuations.
§ Small industrial SREITs with weak sponsors and therefore a limited growth pipeline could trade at permanent discounts. Asset sales might represent their best hope of accruing value to shareholders. Sabana REIT (SSREIT SP, Not Rated) could do just that. Its NAV is SGD1.06 per unit and it trades at 0.68x P/BV and 9.8% indicative yields on an annualised 3Q15 DPU of 1.77 SGD cts.
§ We estimate that the market is ascribing 21%/19%/18% discounts to the underlying asset values of Keppel REIT (KREIT SP, HOLD, TP SGD0.90), CapitaLand Commercial Trust (CCT SP, HOLD, TP SGD1.25) and Suntec REIT (SUN SP, SELL, TP SGD1.33), at their current valuations of 0.68x/0.75x/0.73x P/BV. Given impending weakness expected for prime office rents, we think REITs may be range-bound in the near term. This could make them attractive to longer-term investors interested in their underlying assets.
4. Banks seeking new growth avenues We do not think any big M&A deals will be on the plate for Singapore banks. However, we do not discount the occasional acquisition of smaller Asian assets, especially private banking assets, from European banks which have been winding down their exposures in Asia in recent years to focus back to Europe. All of them are also interested in expanding their footprint in Indonesia. If the regulatory environment is relaxed, Singapore banks are likely to become active in Indonesia.
DBS is currently in talks to acquire RBS's India unit, which appears to be non-material (no details but sources say it could fetch USD200m). Since its successful acquisition of Societe Generale’s Asian private banking business in 2014 and an unsuccessful attempt to acquire RBS Coutts’s Asian operations early this year, DBS has been actively looking into building its wealth management business. Recently, there was speculation that it is a potential bidder for Barclays' Asian private wealth business, valued at about USD600m.
5. Situational: takeover still likely for Cordlife Healthcare service provider Cordlife, in our opinion, is a perfect candidate for takeover. Its shareholding register is fragmented, with no single shareholder owning more than 11%. It is cash-rich, with net cash of 32 SGD cts or c.32% of its market cap, even after paying a generous special dividend of 13 SGD cts from the sale of its valuable stake in CCBC.
The two biggest cord blood bank operators in China – China Cord Blood Corporation (CCBC) and Zhongyuan Union Cell - already own 9.8% and 7.0% of Cordlife respectively. Kunlum is its third-largest Chinese shareholder to

January 3, 2016 113
Singapore’s Six-for-16
emerge recently and it did so aggressively. It bought 33m shares or a 12.8% stake in a mere one day, at a 20% average premium to Cordlife’s market price or SGD1.70. It has since built up its stake to 41.7m or 16.1%. And this was after the payment of its special dividend!
The burning question is, why are the Chinese jostling for a position in Cordlife?
We believe Cordlife is valuable to Chinese cord blood bank operators such as Zhongyuan Union Cell and CCBC or even healthcare players interested in this space regionally. Cordlife has technologies and standards that are globally-recognised as well as markets in the rest of Asia that we believe Chinese players are eyeing to hedge their bets on their home market. While Cordlife operates and competes in open Asian markets, the advantage of the Chinese is only tenuously secured by licensing, a regime that can change overnight.
We think they realise this risk and Cordlife, being the biggest Asian player, is a prime candidate to hedge this risk.
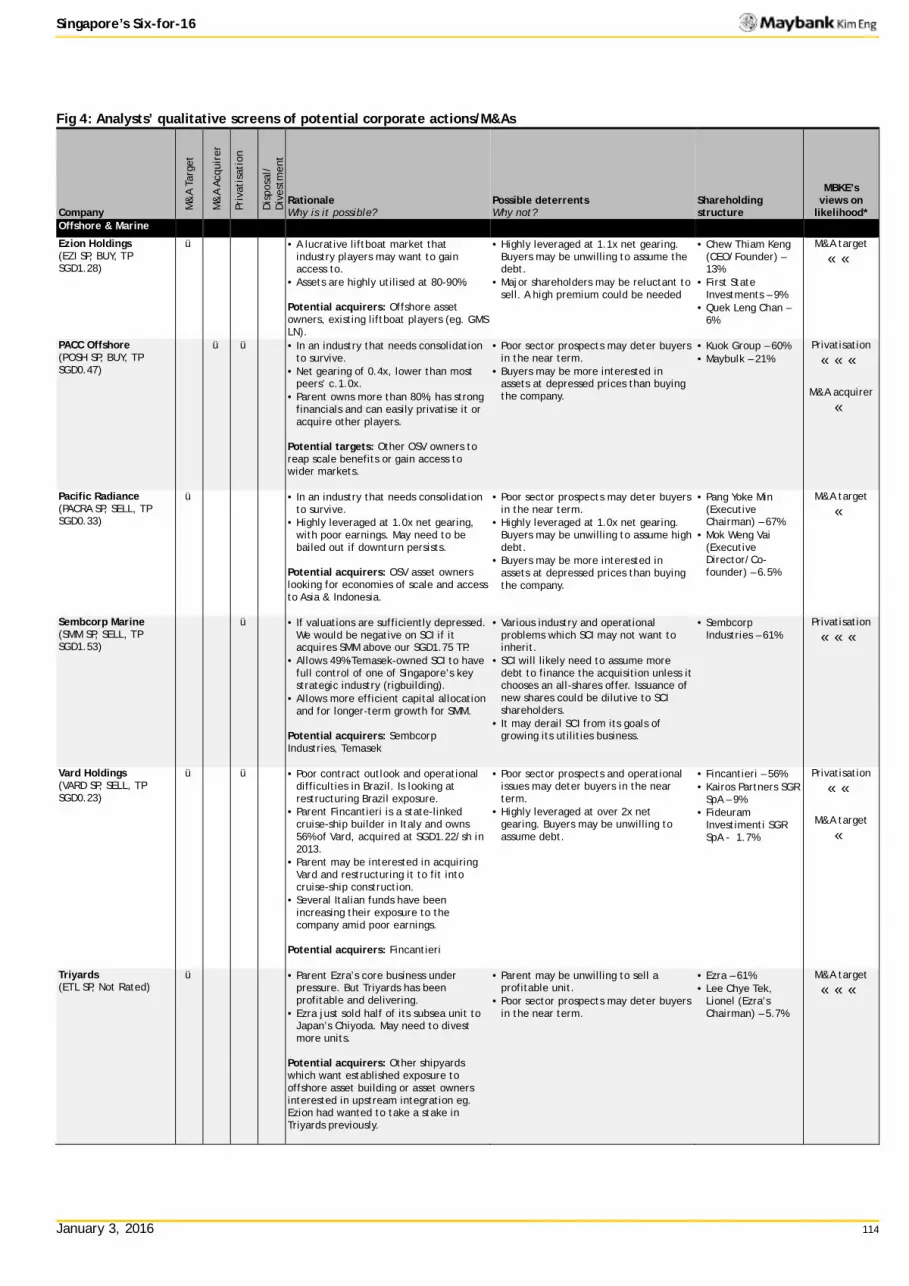
January 3, 2016 114
Singapore’s Six-for-16
Fig 4: Analysts’ qualitative screens of potential corporate actions/M&As
Company M&
A Ta
rget
M&
A Ac
quir
er
Priv
atis
atio
n
Dis
posa
l/
Div
estm
ent
Rationale Why is it possible?
Possible deterrents Why not?
Shareholding structure
MBKE’s views on
likelihood* Offshore & Marine Ezion Holdings (EZI SP, BUY, TP SGD1.28)
ü · A lucrative liftboat market that industry players may want to gain access to.
· Assets are highly utilised at 80-90%.
Potential acquirers: Offshore asset owners, existing liftboat players (eg. GMS LN).
· Highly leveraged at 1.1x net gearing. Buyers may be unwilling to assume the debt.
· Major shareholders may be reluctant to sell. A high premium could be needed
· Chew Thiam Keng (CEO/Founder) – 13%
· First State Investments – 9%
· Quek Leng Chan – 6%
M&A target
««
PACC Offshore (POSH SP, BUY, TP SGD0.47)
ü ü · In an industry that needs consolidation to survive.
· Net gearing of 0.4x, lower than most peers’ c.1.0x.
· Parent owns more than 80%, has strong financials and can easily privatise it or acquire other players.
Potential targets: Other OSV owners to reap scale benefits or gain access to wider markets.
· Poor sector prospects may deter buyers in the near term.
· Buyers may be more interested in assets at depressed prices than buying the company.
· Kuok Group – 60% · Maybulk – 21%
Privatisation
«««
M&A acquirer
«
Pacific Radiance (PACRA SP, SELL, TP SGD0.33)
ü · In an industry that needs consolidation to survive.
· Highly leveraged at 1.0x net gearing, with poor earnings. May need to be bailed out if downturn persists.
Potential acquirers: OSV asset owners looking for economies of scale and access to Asia & Indonesia.
· Poor sector prospects may deter buyers in the near term.
· Highly leveraged at 1.0x net gearing. Buyers may be unwilling to assume high debt.
· Buyers may be more interested in assets at depressed prices than buying the company.
· Pang Yoke Min (Executive Chairman) – 67%
· Mok Weng Vai (Executive Director/Co-founder) – 6.5%
M&A target
«
Sembcorp Marine (SMM SP, SELL, TP SGD1.53)
ü · If valuations are sufficiently depressed. We would be negative on SCI if it acquires SMM above our SGD1.75 TP.
· Allows 49%-Temasek-owned SCI to have full control of one of Singapore’s key strategic industry (rigbuilding).
· Allows more efficient capital allocation and for longer-term growth for SMM.
Potential acquirers: Sembcorp Industries, Temasek
· Various industry and operational problems which SCI may not want to inherit.
· SCI will likely need to assume more debt to finance the acquisition unless it chooses an all-shares offer. Issuance of new shares could be dilutive to SCI shareholders.
· It may derail SCI from its goals of growing its utilities business.
· Sembcorp Industries – 61%
Privatisation
«««
Vard Holdings (VARD SP, SELL, TP SGD0.23)
ü ü · Poor contract outlook and operational difficulties in Brazil. Is looking at restructuring Brazil exposure.
· Parent Fincantieri is a state-linked cruise-ship builder in Italy and owns 56% of Vard, acquired at SGD1.22/sh in 2013.
· Parent may be interested in acquiring Vard and restructuring it to fit into cruise-ship construction.
· Several Italian funds have been increasing their exposure to the company amid poor earnings.
Potential acquirers: Fincantieri
· Poor sector prospects and operational issues may deter buyers in the near term.
· Highly leveraged at over 2x net gearing. Buyers may be unwilling to assume debt.
· Fincantieri – 56% · Kairos Partners SGR
SpA – 9% · Fideuram
Investimenti SGR SpA - 1.7%
Privatisation
««
M&A target
«
Triyards (ETL SP, Not Rated)
ü · Parent Ezra’s core business under pressure. But Triyards has been profitable and delivering.
· Ezra just sold half of its subsea unit to Japan’s Chiyoda. May need to divest more units.
Potential acquirers: Other shipyards which want established exposure to offshore asset building or asset owners interested in upstream integration eg. Ezion had wanted to take a stake in Triyards previously.
· Parent may be unwilling to sell a profitable unit.
· Poor sector prospects may deter buyers in the near term.
· Ezra – 61% · Lee Chye Tek,
Lionel (Ezra’s Chairman) – 5.7%
M&A target
«««
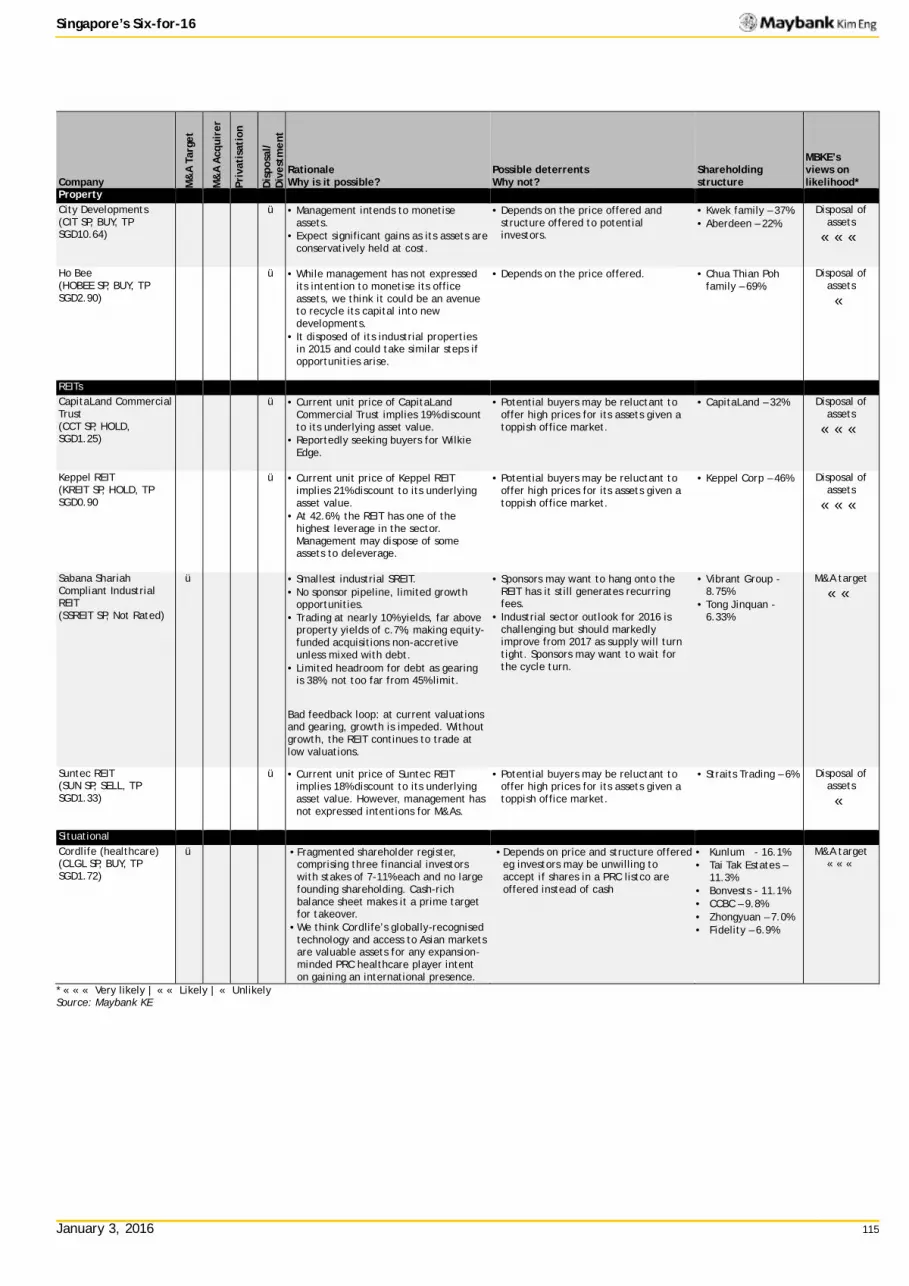
January 3, 2016 115
Singapore’s Six-for-16
Company M&
A Ta
rget
M&
A A
cqui
rer
Priv
atis
atio
n
Dis
posa
l/
Div
estm
ent
Rationale Why is it possible?
Possible deterrents Why not?
Shareholding structure
MBKE’s views on likelihood*
Property City Developments (CIT SP, BUY, TP SGD10.64)
ü · Management intends to monetise assets.
· Expect significant gains as its assets are conservatively held at cost.
· Depends on the price offered and structure offered to potential investors.
· Kwek family – 37%. · Aberdeen – 22%.
Disposal of assets
«««
Ho Bee (HOBEE SP, BUY, TP SGD2.90)
ü · While management has not expressed its intention to monetise its office assets, we think it could be an avenue to recycle its capital into new developments.
· It disposed of its industrial properties in 2015 and could take similar steps if opportunities arise.
· Depends on the price offered. · Chua Thian Poh family – 69%.
Disposal of assets
«
REITs CapitaLand Commercial Trust (CCT SP, HOLD, SGD1.25)
ü · Current unit price of CapitaLand Commercial Trust implies 19% discount to its underlying asset value.
· Reportedly seeking buyers for Wilkie Edge.
· Potential buyers may be reluctant to offer high prices for its assets given a toppish office market.
· CapitaLand – 32%
Disposal of assets
«««
Keppel REIT (KREIT SP, HOLD, TP SGD0.90
ü · Current unit price of Keppel REIT implies 21% discount to its underlying asset value.
· At 42.6%, the REIT has one of the highest leverage in the sector. Management may dispose of some assets to deleverage.
· Potential buyers may be reluctant to offer high prices for its assets given a toppish office market.
· Keppel Corp – 46%
Disposal of assets
«««
Sabana Shariah Compliant Industrial REIT (SSREIT SP, Not Rated)
ü · Smallest industrial SREIT. · No sponsor pipeline, limited growth
opportunities. · Trading at nearly 10% yields, far above
property yields of c.7%, making equity-funded acquisitions non-accretive unless mixed with debt.
· Limited headroom for debt as gearing is 38%, not too far from 45% limit.
Bad feedback loop: at current valuations and gearing, growth is impeded. Without growth, the REIT continues to trade at low valuations.
· Sponsors may want to hang onto the REIT has it still generates recurring fees.
· Industrial sector outlook for 2016 is challenging but should markedly improve from 2017 as supply will turn tight. Sponsors may want to wait for the cycle turn.
· Vibrant Group - 8.75%
· Tong Jinquan - 6.33%
M&A target
««
Suntec REIT (SUN SP, SELL, TP SGD1.33)
ü · Current unit price of Suntec REIT implies 18% discount to its underlying asset value. However, management has not expressed intentions for M&As.
· Potential buyers may be reluctant to offer high prices for its assets given a toppish office market.
· Straits Trading – 6%
Disposal of assets
«
Situational Cordlife (healthcare) (CLGL SP, BUY, TP SGD1.72)
ü · Fragmented shareholder register, comprising three financial investors with stakes of 7-11% each and no large founding shareholding. Cash-rich balance sheet makes it a prime target for takeover.
· We think Cordlife’s globally-recognised technology and access to Asian markets are valuable assets for any expansion-minded PRC healthcare player intent on gaining an international presence.
· Depends on price and structure offered eg investors may be unwilling to accept if shares in a PRC listco are offered instead of cash
· Kunlum - 16.1% · Tai Tak Estates –
11.3% · Bonvests - 11.1% · CCBC – 9.8% · Zhongyuan – 7.0% · Fidelity – 6.9%
M&A target «««
* ««« Very likely | «« Likely | « Unlikely Source: Maybank KE

January 3, 2016 116
Singapore’s Six-for-16
3.4 Our highest-conviction M&A bets
1. PACC Offshore (POSH SP, BUY, TP SGD0.47). We see POSH as a strong privatisation candidate.
§ The stock was listed in Apr 2014 at SGD1.15/share, raising SGD290m. Share price has been down since, partly due to missed earnings and the oil-price downturn.
§ Trading liquidity is low and we see no need for tapping equity markets as parent Kuok Group is financially strong.
§ Kuok Group owns 81% of the company. Based on our estimates, it will need less than SGD150m to buy up PACC’s remaining shares even at a 30% premium to its current price of SGD0.33.
§ Furthermore, company has been buying back its shares in 52 of the 104 trading sessions from 11 Aug 2015 to 30 Dec 2015. A total of 7.2m or 4% have been snapped up.
2. Sembcorp Marine (SMM SP, SELL, TP 1.53). SMM is facing its greatest set of challenges in this industry downturn. We think that if conditions deteriorate further, SMM may require additional funding to sustain its operations. We see a possible privatisation by its 61%-owned parent, Sembcorp Industries or even Temasek Holdings. The rationale to do this could be because:
§ Instead of injecting capital into SMM through a rights issue, privatisation allows SCI to take full-control, and allocate capital more efficiently.
§ SCI could use its balance sheet to support SMM’s working capital needs and finance construction activities until the industry turns around for SMM to monetise the assets.
§ Rigbuilding is a key strategic industry for Singapore. SCI’s majority shareholder Temasek Holdings may have strong long-term strategic plans for the company. A Temasek-led privatisation will also relieve SCI of the additional strain that it may have to carry if it were to undertake the privatisation.
3. Cordlife (CLGL SP, BUY, TP SGD1.72). We see mother-and-child healthcare services provider Cordlife as a potential takeover target.
§ The chess game on Cordlife is not over. Its valuable stake in CCBC has been sold for remarkable returns and the generous special dividend we were expecting has been paid. But two aggressive Chinese parties have emerged in recent months with 7% (Zhongyuan Union Cell) and 16% stakes (Kunlum). Both were willing to pay premiums to market prices.
§ We think Cordlife’s globally-recognised technology and Asian markets are valuable for any expansion-minded Chinese healthcare player intent on climbing onto the international stage.
§ Cordlife’s fragmented shareholdings - three financial investors with stakes of 7-11% each and no large founding shareholder - and cash-rich balance sheet make it a prime target for a takeover, in our view.

January 3, 2016 117
Singapore’s Six-for-16
4. When extremes meet: SGD1.60/USD + 4 rate hikes
Now that the Fed has started raising rates and is signalling four more in 2016, SGD could weaken further against USD. Maybank’s Global FX team is forecasting two more rate hikes and SGD1.47/USD by 4Q16. Consensus forecasts seem to agree with our FX team’s forecasts, thus there is a possibility of the market being surprised by a more hawkish Fed. Unwinding effects from seven years of easy monetary policy as capital leaves low-yielding asset classes such as bonds and real estate are unpredictable. Headwinds against the Singapore economy could spiral.
Historically, Singapore stocks have an uneasy relationship with USD strength. In the last 20 years, the inverse relationship has been tight. During previous bouts of USD strength in the magnitude of 9-25% - Asian financial crisis, dot-com bust, global financial crisis and eurozone crisis - the STI gave up 29-55%. On average, a 1% appreciation of the USD is accompanied by a -2.9% move for the STI. In this cycle, both have moved in greater lockstep: USD has appreciated 14% against the SGD while STI has fallen 14%. Going by their tight inverse correlation, investors may do well to position defensively for 2016.
Fig 5: STI’s inverse relationship with strong USD
Source: Maybank Kim Eng
Fig 6: 1% gain in USD/SGD is historically associated with a 2.9% fall in the STI
USD/SGD STI
1% chg USD implies % chg
STI
Previous USD strengthening cycles:
2Q96-3Q98: Asian Financial Crisis 25% -55% -2.2%
1Q00-3Q01: Dot-com bust, 9/11 9% -29% -3.3%
2Q08-1Q09: Global Financial Crisis 11% -47% -4.3%
2Q11-4Q11: Growth risks, EZ crisis 9% -17% -1.9%
Avg: 13% -37% -2.9%
Current USD strengthening cycle 3Q14-now: Fed normalisation, weak Asia
relative to USA 14% -14% -1.0%
Source: Maybank Kim Eng
1.2
1.3
1.4
1.5
1.6
1.7
1.8
1.9
2.0
8001,0001,2001,4001,6001,8002,0002,2002,4002,6002,8003,0003,2003,4003,6003,800
Jan-95
Jan-96
Jan-97
Jan-98
Jan-99
Jan-00
Jan-01
Jan-02
Jan-03
Jan-04
Jan-05
Jan-06
Jan-07
Jan-08
Jan-09
Jan-10
Jan-11
Jan-12
Jan-13
Jan-14
Jan-15
Jan-16
STI Asian Dollar Index (inverse) USD:SGD(Index) (SGD)

January 3, 2016 118
Singapore’s Six-for-16
With a challenging year ahead, we think Budget 2016 should be supportive of companies, especially since it will be Mr Heng Swee Kiat’s first Budget as Finance Minister. We would not be surprised if he includes a comprehensive package of reliefs for companies to tide them over.
Sectors under coverage which stand to benefit from a strong USD and higher rates include oil services, property developers and manufacturers. Manufacturers may be best able to ride USD strength. Stocks include Venture, Innovalues, ST Engineering, SIAEC, Riverstone, and UG Healthcare. Sectors under coverage that could be hurt by USD strength are retail REITs as regional currency depreciation would affect demand. Consumer stocks with regional operations could also fall victim to translational losses.
The only sector that we think could emerge a winner on all fronts is manufacturing. Hence, our top pick is Venture Corp. Venture’s revenue is entirely in USD and it has no USD debt. Oil service companies and property developers are expected to benefit as well, up to a certain extent. Investors may still angst over high gearing while excessive rate hikes would dampen demand for property.
4.1 Sector comments
· Banks
Singapore banks are naturally hedged to USD as their USD book is funded with USD liabilities. From a translational perspective, a strong USD will boost earnings for all three. DBS (DBS SP, SELL, TP SGD16.05) and OCBC (OCBC SP, SELL, TP SGD8.65) have larger USD and HKD exposure as both currencies together form 44% and 38% of their total loan book respectively. Strength in the MYR, which was unusually weak in 2015, would also positively impact OCBC and UOB (UOB SP, HOLD, TP SGD21).
While banks can benefit from interest rate hikes, the impact on NIM is modest. We estimate that for every 50 bps increase in SIBOR, customer margins will rise by 4.6 to 7.2bps. Higher margins may be offset by higher cost of funding and credit costs. Asset quality may deteriorate further as borrowing burden increases.
§ Consumer
Consumer companies with large exposure to countries such as Malaysia with depreciating currencies against USD will be hurt by currency translation. In our universe, these include Super Group (SUPER SP, BUY, TP SGD1.42) and OSIM International (OSIM SP, HOLD, TP SGD1.49). Their exposure to countries with depreciating currencies is significant at more than 20% of revenue. The exception is Courts (COURTS SP, BUY, TP SGD0.44). Although Malaysia accounts for 35% of its revenue, it has been able to counteract MYR weakness with its successful credit campaign and focus on fast-moving products such as digital wearable devices.
§ Developers Interest-rate hikes would give the Singapore government more leeway to review property-cooling measures. While rate hikes are a demand dampener, a roll-back of policy measures should be the overarching theme for the sector in 2016. RNAV discounts could narrow and stocks could be re-rated. We stay positive and see Wing Tai (WINGT SP, BUY, TP SGD2.25) and City Developments (CIT SP, BUY, TP SGD10.64) as the best proxies for a possible roll-back of cooling measures. OUE (OUE SP, HOLD, TP SGD1.92) could also profit from revaluation of its office building in the US Bank Tower at 15% of GAV.
January 3, 2016 119
Singapore’s Six-for-16
§ Manufacturers
Innovalues (IP SP, BUY, TP SGD1.02) and Venture Corporation (VMS SP, BUY, TP SGD10.70) should be winners of: 1) overwhelmingly large revenue exposure of 90-100%; and 2) lower operating costs as their factories are in countries with depreciating currencies against USD. USD-denominated borrowings are also minimal. Innovalues even adopts a forex-volatility-sharing revenue formula whereby for every 3% change in USD against SGD, half of the delta will be shared with its customers. While this reduces its gain or pain in both directions, Innovalues still comes out a net winner of USD appreciation. On the flip side, an appreciating USD could weaken sales for their American customers as it makes their products less competitive globally. This renders USD strength a double-edged sword.
Riverstone (RSTON SP, BUY, TP SGD2.60) and UG Healthcare (UGHC SP, BUY, TP SGD0.41) are beneficiaries on account of their 70-100% revenue exposure to USD while costs are denominated in MYR. Positives could be wiped out by their USD-denominated raw-material costs. We estimate that every 10% increase in USD/MYR will lift Riverstone’s and UG’s earnings by 3-6% and 1-2%, respectively.
§ Industrials
ST Engineering (STE SP, BUY, TP SGD3.60) and SIA Engineering (SIE SP, HOLD, TP SGD3.61) are beneficiaries due to their USD revenue and local-currency costs. Positives for ST Engineering, however, are erased by its USD-denominated borrowings.
§ Offshore & Marine
USD strength is typically mildly positive for oil service providers as contracts are usually in USD. Exceptions are companies with high net USD debt that is unmatched by cash and receivables. However, we believe that lower-for-longer oil prices, pricing and asset utilisation pressure will weigh more heavily on the sector, negating any gains from USD strength.
§ REITs
As the USD appreciates against the SGD, the SGD is also appreciating against the IDR, MYR, AUD, and EUR. These are the currencies of four of Singapore’s top five sources of in-bound tourism. Their depreciation does not augur well for retail SREITs as it would discourage tourist arrivals and encourage locals to shop abroad. We have SELLs on retail REITs CapitaLand Mall Trust (CT SP, TP SGD1.66), Frasers Centrepoint Trust (FCT SP, TP SGD1.63), and Mapletree Commercial Trust (MCT SP, TP SGD1.11).
At the same time, rising interest rates will increase interest costs, especially for Keppel REIT (KREIT SP, HOLD, TP SGD0.90). It has the highest leverage among our REITs, at 42.6%. While interest-rate hikes could jack up their borrowing costs, 72% of their borrowings have been hedged through fixed rates.

January 3, 2016
Hea
lthc
are
Sing
apor
e
John Cheong, CFA [email protected] (65) 6231 5845
Gregory Yap [email protected] (65) 6231 5848
Cordlife Group (CLGL SP)
No Shortage of Suitors
Still believing in a takeover We believe control of Cordlife will provide value to Chinese buyers hoping to gain traction outside China and spread their China risks, through Cordlife’s globally-recognised technology and markets in Asia. Our view was reinforced recently by the entry of Kunlum as its single largest shareholder. Kunlum paid SGD1.70, a hefty premium over Cordlife’s market price and entered even after the latter paid its special dividend. We raise our TP to SGD1.72 as we raise core P/E to 41x, the low end of peers’ range of 41-46x. Even then, this is still at the low-end of our estimated takeover offer range of SGD1.62-2.09.
At least three Chinese parties now in Cordlife Two Chinese investors have emerged as big shareholders even as early investors such as China Cord Blood Corp (CCBC) keep its skin in the game. Zhongyuan Union Cell owns 7% through China Minsheng while Kunlum, the latest, owns 16.1%. Just as Minsheng is a known front for Zhongyuan, we suspect Kunlum could represent another party. Kunlum is managed by private equity fund Lighthouse Capital. CCBC and Zhongyuan are the two biggest cord blood bank operators in China.
No intention for GO… yet Kunlum has told Cordlife that it currently does not have intentions to make a GO. This is probably true, as we believe it is the ultimate buyer behind the purchase that should harbour such an intention. To go from a zero shareholding to the single largest in such a short time seems to suggest a thought-out end-game. In the meantime, we estimate free float has dwindled from 62% to 29% and downside is limited, in our view.
Opens doors to Asia, hedges risks In our view, control of Cordlife offers instant access to Asian markets to any Chinese buyer. Cordlife is a top player in Asia, already honed and refined in the toughest market of all. It can offer internationally-recognised technology and market access to the most important markets in Asia. In addition, Chinese players will be able to hedge their risks in China where their advantage stems from a malleable licensing policy.
Share Price SGD 1.45
12m Price Target SGD 1.72 (+19%)
Previous Price Target SGD 1.54
BUY
Company description
Statistics52w high/low (SGD)3m avg turnover (USDm)Free float (%)Issued shares (m)Market capitalisation
Major shareholders:16.1%11.3%11.1%
267
1.5
Cordlife operates stem cell banks withcryopreservation facilities in Singapore, HK, India,Indonesia, Philippines & Malaysia.
Kunlum Investment Holding Ltd. Tai Tak Estates Sdn. Bhd. Bonvests Holdings Ltd.
1.46/0.89
62.0
SGD386.3MUSD273M
Price Performance
60
80
100
120
140
160
180
200
0.80
0.90
1.00
1.10
1.20
1.30
1.40
1.50
Dec-13 Mar-14 Jun-14 Sep-14 Dec-14 Mar-15 Jun-15 Sep-15
Cordlife Group - (LHS, SGD) Cordlife Group / Straits Times Index - (RHS, %)
-1M -3M -12MAbsolute (%) 11 14 61
Relative to index (%) 10 10 87
Source: FactSet
FYE Jun (SGD m) FY14A FY15A FY16E FY17E FY18E
Revenue 49 58 64 71 80EBITDA 11 8 12 13 15Core net profit 8 7 8 9 10Core EPS (cts) 3.1 2.8 3.1 3.5 4.0Core EPS growth (%) 7.9 (9.4) 9.5 12.4 15.1Net DPS (cts) 2.0 2.0 15.2 2.3 2.4Core P/E (x) 46.3 51.1 46.6 41.5 36.1P/BV (x) 2.7 2.3 1.7 1.6 1.6Net dividend yield (%) 1.4 1.4 10.5 1.6 1.7ROAE (%) 7.5 4.8 4.1 4.0 4.5ROAA (%) 5.3 2.8 2.6 3.1 3.5EV/EBITDA (x) 25.0 51.6 26.2 23.8 20.3Net debt/equity (%) net cash 61.4 net cash net cash net cashConsensus net profit - - 8 9 10MKE vs. Consensus (%) - - 0.4 0.3 (0.1)
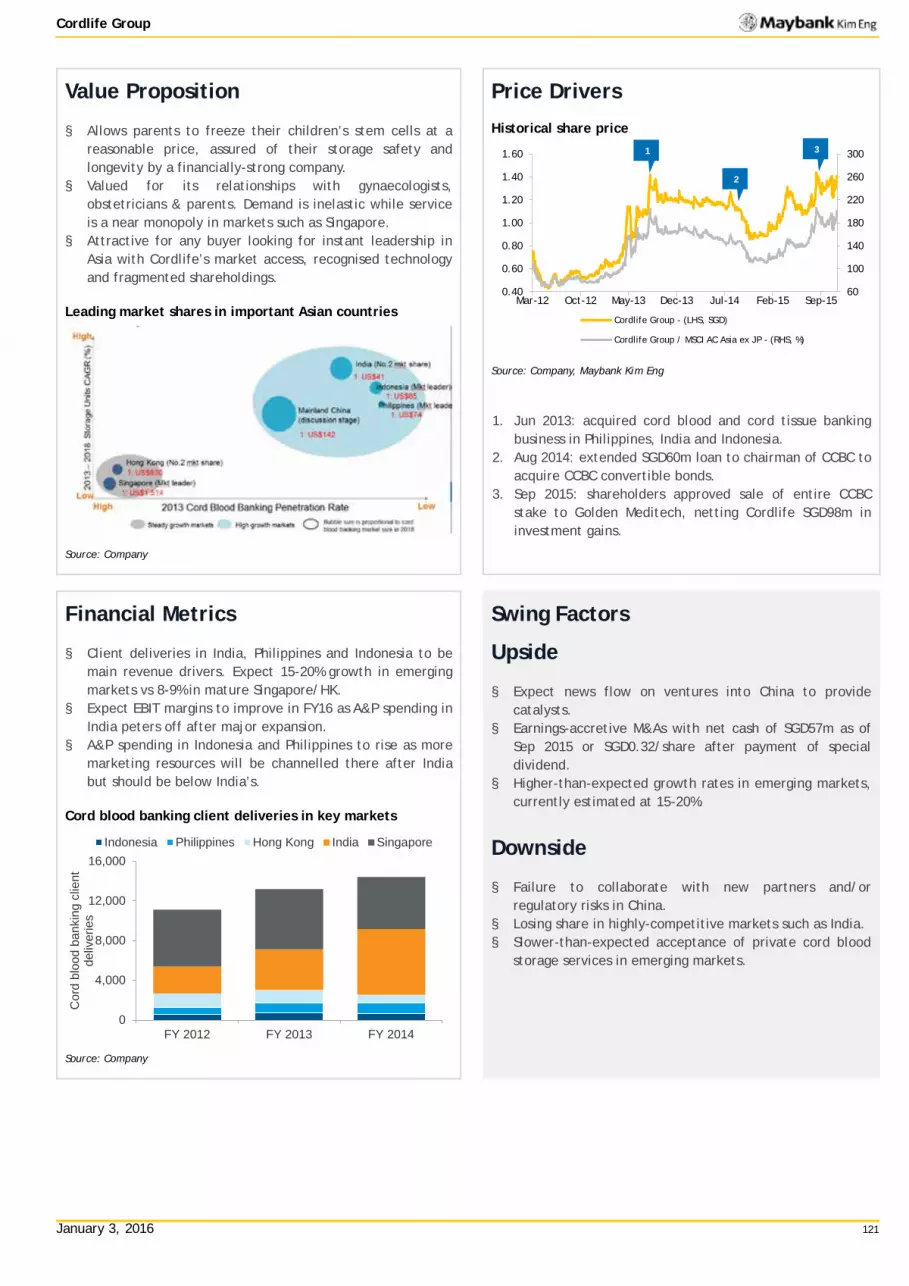
January 3, 2016 121
Cordlife Group
Value Proposition
§ Allows parents to freeze their children’s stem cells at a reasonable price, assured of their storage safety and longevity by a financially-strong company.
§ Valued for its relationships with gynaecologists, obstetricians & parents. Demand is inelastic while service is a near monopoly in markets such as Singapore.
§ Attractive for any buyer looking for instant leadership in Asia with Cordlife’s market access, recognised technology and fragmented shareholdings.
Leading market shares in important Asian countries
Source: Company
Price Drivers
Historical share price
Source: Company, Maybank Kim Eng
1. Jun 2013: acquired cord blood and cord tissue banking
business in Philippines, India and Indonesia. 2. Aug 2014: extended SGD60m loan to chairman of CCBC to
acquire CCBC convertible bonds. 3. Sep 2015: shareholders approved sale of entire CCBC
stake to Golden Meditech, netting Cordlife SGD98m in investment gains.
Financial Metrics
§ Client deliveries in India, Philippines and Indonesia to be main revenue drivers. Expect 15-20% growth in emerging markets vs 8-9% in mature Singapore/HK.
§ Expect EBIT margins to improve in FY16 as A&P spending in India peters off after major expansion.
§ A&P spending in Indonesia and Philippines to rise as more marketing resources will be channelled there after India but should be below India’s.
Cord blood banking client deliveries in key markets
Source: Company
Swing Factors
Upside
§ Expect news flow on ventures into China to provide catalysts.
§ Earnings-accretive M&As with net cash of SGD57m as of Sep 2015 or SGD0.32/share after payment of special dividend.
§ Higher-than-expected growth rates in emerging markets, currently estimated at 15-20%.
Downside
§ Failure to collaborate with new partners and/or regulatory risks in China.
§ Losing share in highly-competitive markets such as India. § Slower-than-expected acceptance of private cord blood
storage services in emerging markets.
60
100
140
180
220
260
300
0.40
0.60
0.80
1.00
1.20
1.40
1.60
Mar-12 Oct-12 May-13 Dec-13 Jul-14 Feb-15 Sep-15
Cordlife Group - (LHS, SGD)
Cordlife Group / MSCI AC Asia ex JP - (RHS, %)
0
4,000
8,000
12,000
16,000
FY 2012 FY 2013 FY 2014
Cor
d bl
ood
bank
ing
clie
nt
deliv
erie
s
Indonesia Philippines Hong Kong India Singapore
1
2
3

January 3, 2016
Cons
umer
Sta
ples
Si
ngap
ore
Gregory Yap [email protected] (65) 6231 5848
Jumbo Group Ltd (JUMBO SP)
Give Me More Of This Crab
Initiating coverage: BUY to SGD0.58 TP Jumbo’s highly-profitable seafood restaurants and signature crab dishes are much loved in Singapore and now, being successfully exported to China where it has three outlets. With its far bigger market potential and high ROI, there is room to add one new outlet in China a year as new outlets fully recoup investments in just 1-3 years. Jumbo deserves a premium to peers for its uniquely-Singapore brand and product and first-mover advantage in China. We initiate coverage with a BUY and DCF-P/E blended TP of SGD0.58.
Bringing a uniquely Singapore dish to China Jumbo’s expansion in China is just beginning. The mainland Chinese have taken to chilli crabs in droves, and we think this expansion will provide years of double-digit growth to come. We project accelerating earnings growth of 9%/11%/20% in FY16E-18E, driving China from a 10% market now to 32% of revenue by FY18E. By our estimates, its China outlets are capable of generating ROI of 32-86% with a relatively short payback period of 1-3 years which reduces risk.
More than just crabs that can travel Jumbo has demonstrated that it can successfully replicate its seafood-restaurant business in China. But it has other dining concepts (eg hotpot, Teochew cuisine, bak kut teh) that can be exported overseas as well, not just in China but the rest of South-east Asia. Gross margins for all its brands run in the 40-60% range, and with scale, we see room for upside.
Deserving of a tasty premium We value Jumbo at SGD0.58 for c.40% potential upside. We use blended P/E and DCF valuations to capture the full value of its mid-term expansion potential. This values Jumbo at 25x FY16E, 22x FY17E and 19x FY18E EPS, a slight premium to its regional peers. Our DCF valuation of SGD0.65 is conservative, assuming a higher-than-usual 10% market return and 1.2x beta for possibly higher risks from its China expansion.
Good growth, high margins, strong cashflow: What more can you ask for?
Share Price SGD 0.43
12m Price Target SGD 0.58 (+36%)
BUY
Company description
Statistics52w high/low (SGD)3m avg turnover (USDm)Free float (%)Issued shares (m)Market capitalisation
Major shareholders:57.9%6.6%6.2%
641
3.8
F&B retailer in Singapore and China, most famous forits chilli crabs and JUMBO Seafood brand JPOTHotpot. Has five other brands in its stable.
JBO Holdings Mr Tan Gee Jian Orchid 1 Investments
na/na
24.3
SGD272.6MUSD193M
Price Performance
90
100
110
120
130
140
150
160
0.300
0.320
0.340
0.360
0.380
0.400
0.420
0.440
Nov-15 Nov-15 Nov-15 Nov-15 Dec-15 Dec-15 Dec-15 Dec-15
Jumbo Group Ltd - (LHS, SGD) Jumbo Group Ltd / Straits Times Index - (RHS, %)
-1M -3M -12MAbsolute (%) 8 na na
Relative to index (%) 6 na na
Source: FactSet
FYE Sep (SGD m) FY14A FY15A FY16E FY17E FY18E
Revenue 112 123 147 169 191EBITDA 19 18 22 25 31Core net profit 13 14 15 17 20Core EPS (cts) 2.1 2.1 2.3 2.6 3.1Core EPS growth (%) 39.8 3.0 8.6 11.1 20.5Net DPS (cts) 0.0 8.1 0.7 0.8 0.9Core P/E (x) 20.4 19.8 18.3 16.4 13.6P/BV (x) 5.8 4.8 6.3 4.9 3.9Net dividend yield (%) 0.0 19.0 1.6 1.8 2.2ROAE (%) 31.8 26.4 29.8 33.7 31.8ROAA (%) 20.8 17.8 18.5 19.2 19.0EV/EBITDA (x) na na 10.3 9.1 7.3Net debt/equity (%) net cash net cash net cash net cash net cashConsensus net profit - - na na naMKE vs. Consensus (%) - - na na na
0%
10%
20%
30%
40%
50%
60%
0
10,000
20,000
30,000
40,000
50,000
60,000
70,000
FY15 FY16E FY17E FY18E
(SGD'000)
Net cash Free cashflowCore NP growth (RHS) Gross margin (RHS)

January 3, 2016 123
Jumbo Group
Value Proposition
§ A restaurant operator whose greatest value proposition is ability to generate high demand for its business with reasonable prices and consistent taste.
§ Iconic dishes, footprint of outlets in ideal locations, strong brands and effective front- and back-end operations provide high defensible margins.
§ Branding and identity that hinge on signature seafood such as chilli crab, a national dish. Helps it stand out in crowded markets especially when expanding overseas.
§ Low-cost cash business financed by suppliers’ credit. High FCF generation supports aggressive expansion plans yet provides future dividend support for shareholders.
How Jumbo stacks up on profitability & returns
Source: FactSet estimates, Maybank Kim Eng
Price Drivers
Revenue breakdown
Source: Company data, Maybank Kim Eng estimates
Listed just in Nov 2015, trading history is too short to identify inflexion points. We believe market will focus on its opening of new outlets in China and/or introduction of new dining concepts. 1. Second China JUMBO SEAFOOD outlet opened in Raffles
City Shanghai in Aug 2015. 2. Third China outlet opening in IFC Mall in Jan 2016. 3. Fourth China outlet assumed to open in Oct 2016. 4. Fifth China outlet assumed to open in Oct 2017, fourth
JPOT outlet in Singapore assumed to open in mid-FY17
Financial Metrics
§ Revenue growth. Given two new JUMBO outlets in China, would expect to see increasingly stronger topline growth in next 3-4 quarters, unless other brands underperform.
§ EBIT & net margins. Gross margin (excluding direct costs such as food & rental) is controllable. There may be quarters of higher start-up costs where margins fall below trend, but generally expect good indirect cost management and efficient tax planning.
§ Watch for deteriorating asset & liability turns. Strong FCF generation comes from AP days far exceeding AR and stock days. Don’t be alarmed if FCF is dragged down by capex.
Strong revenue growth with stable margins expected
Source: Company data, Maybank Kim Eng estimates
Swing Factors
Upside
§ Better-than-expected Singapore and China sales, especially from new outlets.
§ Lower-than-expected food and staff costs that could lead to better-than-expected margins.
§ Expectations of higher dividends or articulation of a dividend policy.
Downside
§ Any changes in China’s food safety laws that could affect China’s import of mud crabs.
§ Shortage of critical ingredients for its signature dishes: crabs, other seafood.
§ Epidemics or health scares that can damage its reputation or cuisine eg mass food poisoning, salmonella.
(6.0)
(4.0)
(2.0)
0.0
2.0
4.0
6.0
8.0
10.0
12.0
(70.0) (60.0) (50.0) (40.0) (30.0) (20.0) (10.0) 0.0 10.0 20.0 30.0 40.0
Avg 3Y ROE
Avg 3Y Net Margin
JumboJapan Foods
ABR Holdings
Soup Restaurant
BreadTalkSakae Holdings
Auric Pacific
Tung Lok
Flagship brands:Jumbo - JUMBO SEAFOODJapan Foods - Ajisen RamenABR - Swensen's, Gloria Jean's CoffeesSoup Restaurant - SOUPBreadTalk - Din Tai Fung, Carl's JrSakae Holdings - Sakae SushiAuric Pacific - Delifrance, Food JunctionTung Lok - TungLok, Lao Beijing
12.2% 12.3% 12.2% 13.2%10.4% 10.2% 9.8% 10.4%
9%
19%
15%13%
0.0%
5.0%
10.0%
15.0%
20.0%
25.0%
FY15 FY16E FY17E FY18E
EBIT margin Net margin Revenue growth
1 2 3 4

January 3, 2016
Oil
& G
as
Sing
apor
e
Yeak Chee Keong [email protected] (65) 6231 5842
PACC Offshore Services Holdings
Better as a private company
No compelling reason to keep listing Since its listing in Apr 2014, stock has been on a downward spiral. On top of missing earnings, the oil service industry downturn has severely affected POSH’s utilisation and charter rates, bringing the latter down by 15-30%. It now trades at 0.3x P/BV and 0.6x our estimated replacement value. With strong financial backing and low trading liquidity, this downturn may just present opportunities to privatise POSH, in our view. BUY for likelihood to emerge as future winner and de-listing potential. TP drops to SGD0.47 after our EPS cut for impairment charges, still at 0.5x FY16 P/BV.
Less than SGD150m to buy up remaining shares POSH was listed in Apr 2014 at SGD1.15/share, raising SGD290m. Parent Kuok Group still owns 81% (incl. Maybulk) of the company. We estimate that it would require less than SGD150m to snap up POSH’s remaining 346m shares even at a 30% premium. In fact, POSH could be de-listed if Kuok Group brings its stake above 90%, when it would not make any more sense for investors to hold on to the outstanding 10%. The company has been buying back its shares. From 11 Aug to 30 Dec 2015, it bought back 7.2m (4%) in 52 of the 104 trading sessions. This may signal privatisation intentions, in our view.
Restructuring much needed by OSV sector Taking the company private may make it easier for the company to streamline costs and restructure its business in preparation for the next upturn. We believe that POSH has the ability to survive this downturn and emerge a winner in a new cycle as weaker players fail.
Factoring in impairment; TP falls to SGD0.47 Following POSH’s profit warning on 15 Dec 2015, we are incorporating a USD60m impairment charge in our FY15 forecasts. This may be higher if POSH decides to kitchen-sink more charges. Consequently, our FY15 net profit turns to a loss of USD31m, while TP dips from SGD0.50 to SGD0.47, still based on 0.5x FY16 P/BV.
Share Price SGD 0.30
12m Price Target SGD 0.47 (+57%)
Previous Price Target SGD 0.50
BUY
Company description
Statistics52w high/low (SGD)3m avg turnover (USDm)Free float (%)Issued shares (m)Market capitalisation
Major shareholders:59.8%21.2%0.7%
1,820
0.2
PACC Offshore Services operates a fleet of OSVs thatsupports the offshore oil and gas industry
Kuok Group Malaysian Bulk Carriers Bhd. Camsward Pte Ltd.
0.56/0.29
16.5
SGD546.0MUSD386M
Price Performance
20
30
40
50
60
70
80
90
100
110
120
0.20
0.30
0.40
0.50
0.60
0.70
0.80
0.90
1.00
1.10
1.20
Apr-14 Jul-14 Oct-14 Jan-15 Apr-15 Jul-15 Oct-15
PACC Offshore Services - (LHS, SGD)
PACC Offshore Services / Straits Times Index - (RHS, %)
-1M -3M -12MAbsolute (%) (9) (6) (46)
Relative to index (%) (10) (9) (37)
Source: FactSet
FYE Dec (USD m) FY13A FY14A FY15E FY16E FY17E
Revenue 237 234 297 365 391EBITDA 114 113 31 136 156Core net profit 73 53 (31) 66 86Core EPS (cts) 4.0 2.9 (1.7) 3.6 4.7Core EPS growth (%) 37.1 (27.4) nm nm 30.1Net DPS (cts) 0.0 1.1 0.0 1.1 1.1Core P/E (x) 5.3 7.2 (12.3) 5.9 4.5P/BV (x) 0.4 0.3 0.3 0.3 0.3Net dividend yield (%) 0.0 5.1 0.0 5.1 5.1ROAE (%) 9.6 5.1 (2.6) 5.5 6.8ROAA (%) 4.6 2.9 (1.7) 3.5 4.4EV/EBITDA (x) na 11.5 30.6 6.8 5.6Net debt/equity (%) 92.2 45.2 47.8 44.4 38.2Consensus net profit - - 31 61 60MKE vs. Consensus (%) - - (202.1) 8.3 41.4

January 3, 2016 125
PACC Offshore Services Holdings
Value Proposition
§ Established Asia-based OSV operator with long-term relationships with global strategic charterers.
§ 80% owned by Kuok Group, POSH has access to capital. No concerns of financial stress like other players. Should survive downturn and emerge as future winner.
§ Access to parent’s affiliated shipyards allows for quick turnaround, quality vessels at reasonable prices, cost advantages and flexibility in deferring deliveries in downturn.
§ Economies of scale from diverse fleet of more than 100 vessels, including JVs.
§ Preferential demand for its young fleet averaging 6-7 years.
POSH is one of the largest Asia-based OSV operators
Source: Company, various, as at Dec 2013
Price Drivers
Historical price chart
Source: Company, Maybank Kim Eng
1. Listed at SGD1.15/share in Apr 2014 2. Company guided that market’s forward EPS expectations
were too high 3. Mexico JV reported further losses due to unsettled
operational hiccups 4. Oil-price downturn pressurised asset utilisation and
charter rates, leading to earnings disappointments. 5. Short-term oil-price rebound towards USD60/bbl which
fizzled out subsequently.
Financial Metrics
§ Less concerned about balance sheet and cashflows due to strong parentage.
§ Charter rates and asset utilisation are most important operational metrics. Charter rates have dipped 15-20% from peak as clients ask for discounts to weather the downturn.
§ New offshore accommodation assets could help to cushion OSV weakness.
§ Expect sustainable recovery only in FY17E. Should emerge stronger with higher market share as weaker players are weeded out.
Key operating metrics for wholly-owned vessels FYE Dec FY15E FY16E FY17E OSV No. of vessels 27 29 29 Average charter rates (USD/day) 15,326 15,851 16,393 Average utilisation (%) 70% 72% 76% T&I No. of vessels 35 37 37 Average charter rates (USD/day) 5,453 5,448 5,466 Average utilisation (%) 47% 53% 56% Offshore Accommodation No. of vessels 8 9 9 Average charter rates (USD/day) 48,147 53,481 54,123 Average utilisation (%) 72% 80% 85% Harbour services & emergency response No. of vessels 16 16 16 Average charter rates (USD/day) 10,000 10,000 10,000 Average utilisation (%) 50% 50% 56%
Source: Company
Swing Factors
Upside
§ Privatisation by parent, Kuok Group, due to depressed valuations.
§ Securing firm charters for its two SSAVs at rates above USD150k/day.
§ Turns around losses for its 11 Mexico JV vessels which have now been transferred to its full ownership.
§ Margin surprise from better-than-expected cost cutting. § Demand recovery from an oil-price rebound, accelerated
sector consolidation or bankruptcy of peers.
Downside
§ Fails to secure charter for newbuild SSAV Arcadia by Apr 2016 and renew charter for SSAV Xanadu due in Dec 2016.
§ Utilisation and charter rates deteriorate further or clients back out of committed contracts.
§ Weak and desperate players undercut on pricing to survive, further destroying industry profitability and extending downturn.
458
328
189 130 112 101 75 62 61 59 50 45 42 35
0
100
200
300
400
500
Bour
bon
Tide
wat
er
Seac
or
Paci
fic
Radi
ance
POSH
Swir
e
CO
SL
Swib
er
Hor
nbec
k
Fars
tad
Sols
tad
Bum
i Ar
mad
a
Ezra
MM
ATidewater POSH
Avg Fleet Age 7.5 9.5 12.0 11.5 3.3 6.5 7.5 8.0 4.0 10.0 7.5 12.0 6.5 4.5
Non-Asia-based operator Asia-based operator
2030405060708090100110120
0.200.300.400.500.600.700.800.901.001.101.20
Apr-14 Jul-14 Oct-14 Jan-15 Apr-15 Jul-15 Oct-15
PACC Offshore Services - (LHS, SGD)
PACC Offshore Services / MSCI AC Asia ex JP - (RHS, %)
1
2
3
4 5

January 3, 2016
Hea
lthc
are
Sing
apor
e
Recurring profit and operating cash flow
Source: Company, Maybank KE
John Cheong, CFA [email protected] (65) 6231 5845
Raffles Medical (RFMD SP)
Exporting Uniquely Singapore Healthcare Brand
Singapore provides solid foundation… Founded in 1976 by Dr Loo and Dr Alfred Loh with two clinics in central Singapore, RFMD has grown strength to strength. Today, it operates over 80 clinics in 13 cities in five countries, serving over 2m patients annually. Dr Loo's philosophy of "patients come first, profits later" has served stakeholders well, by generating more than 20 years of consistent growth. From this foundation, RFMD has expanded overseas. In 2015, it started to construct a 400-bed Shanghai Hospital, acquired International SOS MC Holdings to gain immediate access to 10 cities in three countries, and opened a new medical centre in Osaka, Japan. It aims to generate at least half of its earnings from overseas, up from <5%. Maiden contributions from China are expected in FY18E.
…for breaking into China… RFMD is positive on China’s private healthcare industry and the value its “Raffles model” can bring. This emphasises teamwork, transparent pricing, thorough case-auditing and high-quality treatment. Management studied the Chinese market for more than three decades before venturing there. Now that it has a toehold, it is unlikely to stop at one hospital. We understand that it is in discussions with several parties for projects in Beijing and Shenzhen.
…and expansion in ASEAN… Although China will be its main focus, RFMD does not rule out fast-growing emerging ASEAN countries. It has dipped its toes in Vietnam and Cambodia through clinic acquisitions and could expand further in these countries after building up market knowledge.
…to sustain its growth We are positive on its long-term growth, especially now that it has accelerated overseas expansion. We believe its strong track record and brand will mitigate execution risks.
Share Price SGD 4.18
12m Price Target SGD 5.22 (+25%)
Previous Price Target SGD 5.22
BUY
Price Performance
90
110
130
150
170
190
2.50
3.00
3.50
4.00
4.50
5.00
Dec-13 Mar-14 Jun-14 Sep-14 Dec-14 Mar-15 Jun-15 Sep-15
Raffles Medical - (LHS, SGD) Raffles Medical / Straits Times Index - (RHS, %)
-1M -3M -12MAbsolute (%) (0) (8) 8
Relative to index (%) (1) (11) 26
Source: FactSet
FYE Dec (SGD m) FY13A FY14A FY15E FY16E FY17E
Revenue 341 375 409 451 506EBITDA 103 86 95 112 134Core net profit 61 65 68 75 86Core FDEPS (cts) 10.5 11.0 11.4 12.5 14.3Core FDEPS growth(%) 12.6 4.8 2.9 9.9 14.2Net DPS (cts) 5.0 5.5 6.0 6.5 7.0Core FD P/E (x) 39.7 37.9 36.8 33.5 29.3P/BV (x) 4.9 4.4 4.2 4.0 3.7Net dividend yield (%) 1.2 1.3 1.4 1.6 1.7ROAE (%) 14.1 12.8 12.2 12.7 13.7ROAA (%) 11.3 10.5 10.1 9.9 10.2EV/EBITDA (x) 14.1 23.6 25.0 22.4 18.6Net debt/equity (%) net cash net cash net cash 13.4 8.2Consensus net profit - - 69 78 92MKE vs. Consensus (%) - - (1.7) (3.4) (6.0)
-
20.0
40.0
60.0
80.0
100.0
120.0
(SGD m) Recurring PATMI
Op cash flow After purchase of PPE
Company description
Statistics 52w high/low (SGD) 3m avg turnover (USDm) Free float (%) Issued shares (m) Market capitalisation
Major shareholders: 49.6% 6.8% 3.3%
575
1.7
Raffles Medical Group Ltd. engages in the operation of medical clinics and other general medical services.
LOO CHOON YONG Aberdeen Asset Management (Asia) Ltd. S&D Holdings Pte Ltd.
4.99/3.84
44.7
SGD2.4B USD1.7B

January 3, 2016 127
Raffles Medical
Value Proposition
§ Provides private medical services that fill the gap between cheap-but-slow public services and fast-&-affordable private healthcare.
§ Proven operating and expansion track record of Singapore’s renowned hospital and clinics under the “Raffles Medical” brand.
§ Unique group practice model which employs all the doctors and stringent auditing process ensure greater collaboration, consistent quality and fair pricing.
Affordable pricing of Raffles Medical vs peers (2014)
Source: Singapore Ministry of Health, Maybank KE
Price Drivers
Historical share price
Source: Company, Maybank Kim Eng
1. Feb 2013: letter of intent with China Merchants Shekou
to develop a 200-bed hospital in Shenzhen. 4Q12 earnings up 14% YoY vs 7-10% in preceding three quarters.
2. Jan 2014: agreed to acquire land next to its Singapore hospital for extension. Also acquired office building in Holland Village to redevelop into a medical centre.
3. May 2015: formed JV with Shanghai LuJiaZui Group to develop a 400-bed hospital in Shanghai.
4. 3Q15 results below expectations, up only 1% YoY due to high start-up costs and softer revenue.
Financial Metrics
§ 2015/2016 earnings growth expected to be slower due to costs for Raffles Hospital’s extension in mid-2017 and Shanghai hospital in mid-2018.
§ Revenue growth of high single digits expected, on 1) opening of a new floor in Raffles Hospital, 2) opening of a new medical centre in Shaw Centre, and 3) acquisition of International SOS MC Holdings.
§ Longer-term reversion to sustainable revenue and earnings growth of 10%.
Recurring profit and operating cash flow
Source: Company, Maybank KE
Swing Factors
Upside
§ Further progress in second hospital in China, which could be in Shenzhen or other top cities. Shenzhen hospital first announced in Feb 2013.
§ Faster-than-expected breakeven for Singapore expansion. Normal breakeven is one year.
§ Medical tourism in Singapore could recover from 2015 weakness as RFMD is constantly seeking new source markets.
Downside
§ Execution risks for Shanghai hospital, its first outside Singapore.
§ Higher-than-expected start-up costs in major expansion markets such as China.
§ Structural decline of medical tourism in Singapore.
32 30 25
16 -
(18) (25)
(41)
(50) (40) (30) (20) (10) - 10 20 30 40
02468
1012141618
(%) (SGD'000) Average total surgical bill (LHS)Premium/(discount) vs Raffles (RHS)
80
120
160
200
240
280
320
2.00
2.50
3.00
3.50
4.00
4.50
5.00
Dec-10 Dec-11 Dec-12 Dec-13 Dec-14
Raffles Medical - (LHS, SGD)
Raffles Medical / MSCI AC Asia ex JP - (RHS, %)
-
20.0
40.0
60.0
80.0
100.0
120.0
(SGD m) Recurring PATMI Op cash flow After purchase of PPE
1
2
3
4

January 3, 2016
Oil
& G
as
Sing
apor
e
Yeak Chee Keong, CFA [email protected] (65) 6231 5842
Sembcorp Marine (SMM SP)
SCI to the rescue?
Greatest challenges ever SMM is arguably staring at the greatest set of challenges in its history: 1) limp rig demand; 2) rig oversupply; 3) order-cancellation and payment risks; 4) uncertainties over its SGD1b new-yard investment and USD5.6b 7-drillship contract in Brazil due to Petrobras’ corruption probes; and 5) enlarged capacity at its Tuas yard. It now trades below its GFC trough P/BV of 1.3x. Maintain SELL with TP cut to SGD1.53, now based on 1x FY16 P/BV (from 0.55x EV/backlog).
May need more financing SMM granted backend-loaded payment terms of 20:80 and even 5:95 to compete with Chinese yards prior to the downturn. Customers are now delaying deliveries or terminating contracts and SMM cannot monetise construction work it has done. Having had net cash since 1988, it turned net-debt in 2015, with 3Q15 net gearing of 0.64x. If the rig market worsens and it cannot collect due payments, it may require more financing. A rights issue cannot be ruled out.
SCI or Temasek to the rescue? But instead of injecting capital through rights, we think it may make sense for SCI to privatise SMM. Privatising would allow SCI to use its balance sheet to support SMM’s working-capital needs until an industry turnaround. Based on our analysis, SCI has the means to do so. Another possibility is Temasek’s purchase of the remaining 39% SMM stake. Temasek may want to do this if it sees rig and ship building as a strategic industry in Singapore.
Maintain Sell but privatisation possible near 1.0 P/BV We switch from EV/backlog to P/BV valuation as its backlog momentum is non-existent with the risk of write-downs. We now value SMM at 1.0x FY16 P/BV, below its GFC trough. This yields a TP of SGD1.53, down from SGD1.75 (0.55x EV/backlog). Maintain SELL. If industry conditions worsen, requiring cash calls, or its stock price drops nearer to its book value, we believe a privatisation is highly likely.
Share Price SGD 1.77
12m Price Target SGD 1.53 (-13%)
Previous Price Target SGD 1.75
SELL
Company description
Statistics52w high/low (SGD)3m avg turnover (USDm)Free float (%)Issued shares (m)Market capitalisation
Major shareholders:61.0%4.1%1.2%
2,090
3.9
Sembcorp Marine provides integrated solutions inship repair, shipbuilding, ship conversion, rig buildingand offshore engineering & construction.
Sembcorp Industries Ltd. DBS Group Holdings Ltd. APG Asset Management NV
3.29/1.66
34.0
SGD3.7BUSD2.6B
Price Performance
40
60
80
100
120
140
160
1.50
2.00
2.50
3.00
3.50
4.00
4.50
Dec-13 Mar-14 Jun-14 Sep-14 Dec-14 Mar-15 Jun-15 Sep-15
Sembcorp Marine - (LHS, SGD) Sembcorp Marine / Straits Times Index - (RHS, %)
-1M -3M -12MAbsolute (%) (14) (23) (46)
Relative to index (%) (15) (25) (37)
Source: FactSet
FYE Dec (SGD m) FY13A FY14A FY15E FY16E FY17E
Revenue 5,526 5,833 4,630 4,591 4,968EBITDA 745 822 496 601 633Core net profit 556 560 225 322 354Core EPS (cts) 26.6 26.8 10.8 15.4 16.9Core EPS growth (%) 3.2 0.8 (59.9) 43.3 10.0Net DPS (cts) 13.0 13.0 4.0 8.0 8.0Core P/E (x) 6.6 6.6 16.4 11.5 10.4P/BV (x) 1.4 1.2 1.2 1.2 1.1Net dividend yield (%) 7.4 7.4 2.3 4.5 4.5ROAE (%) 21.7 19.9 7.6 10.4 10.7ROAA (%) 8.5 7.2 2.7 3.7 4.0EV/EBITDA (x) 11.4 9.3 12.3 9.1 8.2Net debt/equity (%) net cash 22.3 75.9 49.7 38.1Consensus net profit - - 226 352 362MKE vs. Consensus (%) - - (0.6) (8.5) (2.2)

January 3, 2016 129
Sembcorp Marine
Value Proposition
§ One of the world’s leading offshore rig builders - especially jackups - and FPSO conversion specialists, known for quality, customisation and on-time deliveries.
§ Operates a major ship-repair centre thanks to Singapore’s advantageous position along major shipping routes.
§ Books higher margins than Korean and Chinese competitors due to cheap but skilled foreign labour, focus on higher-value contracts & strong execution.
§ SGD1b investment in a new shipyard in Brazil uncertain due to oil-price downturn and corruption probes involving Petrobras.
§ Value proposition may be under threat, especially if the cyclical downturn turns secular.
Jackup-rig market shares and overall EBIT margins
Source: Company
Price Drivers
Historical share price
Source: Company, Maybank Kim Eng
1. Euro-zone sovereign-debt crisis slammed equity markets.
Peak pessimism in Aug 2010. 2. Concerns over euro zone dissipated as rig orders also
built up. 3. Brent crude fell from more than USD120/bbl to under
USD90/bbl. 4. Secured USD4.0b drillship contracts from Sete Brasil in
Aug 2012, followed by a 7th unit in Nov 2012. 5. Start of current oil downturn with prices cascading more
than 60% from peak as US pumps record oil while OPEC refuses to cut supply.
Financial Metrics
§ Order wins and backlog momentum in an upcycle. Operating margins also an important measure of backlog quality.
§ In a downcycle, cashflows may be more important. Working-capital needs are high as revenue receipts tend to be backend-loaded with increased payment risks.
§ FCFs should be referenced to prior years as they may simply stem from a collection of huge backend payments when vessels are delivered.
Order wins, operating margins & cashflows
Source: Company
Swing Factors
Upside
§ Parent company Sembcorp Industries decides to privatise SMM at a premium.
§ Sete Brasil manages to secure financing to pay SMM its dues and expresses confidence that its contracts will be intact.
§ SMM manages to sell Marco Polo rig and North Atlantic drilling rigs for huge profits like when it did during GFC.
Downside
§ Sete Brasil cancels orders for seven drillships worth USD5.6b and cannot pay dues.
§ More contract cancellations requiring write-down of its SGD11.6b order book as of 3Q15.
§ Order drought or price sacrifices to secure orders in 2016.
33% 24%
22%
19% 29%
33%
29%
16%
18% 10% 9%
(20)
(10)
0
10
20
30
0%
20%
40%
60%
80%
100%
2004 2005 2006 2007 2008 2009 2010 2011 2012 2013 2014
Margin (%) Mkt share
Keppel SMMKorean ChineseOthers Keppel Op. marginSMM op. margin Samsung Op. margin
30405060708090100110120130
1.502.002.503.003.504.004.505.005.506.006.50
Dec-10 Dec-11 Dec-12 Dec-13 Dec-14
Sembcorp Marine - (LHS, SGD)
Sembcorp Marine / MSCI AC Asia ex JP - (RHS, %)
2.1 4.2 3.1
5.4 5.7
1.2 3.0 3.7 3.1 4.2 3.3 3.1 2.5 3.7
7.9
0.9
0%
5%
10%
15%
20%
25%
0.0
2.0
4.0
6.0
8.0
10.0
12.0(SGD b)
Brazil OrdersNon Brazil OrdersOp. margins (RHS)
(2.0)(1.5)(1.0)(0.5)0.00.51.01.52.0
FY04
FY05
FY06
FY07
FY08
FY09
FY10
FY11
FY12
FY13
FY14
FY15
F
FY16
F
FY17
F
Op CF FCF
1
2
3
5
4

January 3, 2016
Tech
nolo
gy
Sing
apor
e
Gregory Yap [email protected] (65) 6231 5848
Venture (VMS SP)
Net Beneficiary of USD Gains
What if USD gains 10% plus four rate hikes? We expect Venture to be a net beneficiary of a higher USD while there is zero impact from higher interest rates.
Further USD gains would be net positive on paper If USD gains 10% against SGD, we expect Venture to benefit on paper. As revenue is all in USD, it will be worth more in SGD. Direct costs such as materials at 80% of its COGS are also in USD. A 10% boost to its topline in FY16 should flow straight to its bottom line, all else being equal. The net effects will depend on currency changes in the countries where it manufactures: Malaysia and China. The impact should be minimal as local operating and factory costs are not large, at c.10% of COGS. Inflation in rentals, salaries, utility charges and transport costs among its indirect costs would also reduce its gains.
Though customer demand could be hit However, customer demand may be dampened by further USD strength as Venture’s customers are overwhelmingly American. A strong USD will affect their price competitiveness in the global marketplace and curtail consumption. We cannot capture this in our forecasts.
No impact from higher interest rates We foresee little impact from interest-rate hikes, even if they come four in a row. First, Venture has low debt and its SGD350-400m cash far outweighs short-term debt of SGD150-160m in 12-month bank borrowings. Interest income exceeds interest expense. Second, all its cash is now kept in USD, given USD’s rising strength.
Share Price SGD 8.16
12m Price Target SGD 10.70 (+31%)
Previous Price Target SGD 10.70
BUY
Company description
Statistics52w high/low (SGD)3m avg turnover (USDm)Free float (%)Issued shares (m)Market capitalisation
Major shareholders:8.9%8.0%7.0%
275
3.5
Electronic manufacturing services provider withmanufacturing facilities in Singapore, Malaysia andChina.
Aberdeen Asset Management (Asia) Ltd Sprucegrove Investment Management Ltd Wong Ngit Liong
8.65/7.65
60.3
SGD2.2BUSD1.6B
Price Performance
90
95
100
105
110
115
120
125
130
135
7.0
7.2
7.4
7.6
7.8
8.0
8.2
8.4
8.6
8.8
Dec-13 Mar-14 Jun-14 Sep-14 Dec-14 Mar-15 Jun-15 Sep-15
Venture - (LHS, SGD) Venture / Straits Times Index - (RHS, %)
-1M -3M -12MAbsolute (%) (3) (2) 4
Relative to index (%) (4) (5) 22
Source: FactSet
FYE Dec (SGD m) FY13A FY14A FY15E FY16E FY17E
Revenue 2,330 2,465 2,664 2,843 3,036EBITDA 177 192 224 243 281Core net profit 131 140 156 173 216Core EPS (cts) 47.8 50.9 57.0 62.9 78.7Core EPS growth (%) (6.1) 6.6 11.9 10.3 25.1Net DPS (cts) 50.0 50.0 50.0 55.0 55.0Core P/E (x) 17.1 16.0 14.3 13.0 10.4P/BV (x) 1.2 1.2 1.2 1.2 1.2Net dividend yield (%) 6.1 6.1 6.1 6.7 6.7ROAE (%) 7.2 7.6 8.5 9.5 11.7ROAA (%) 5.4 5.6 6.2 6.7 8.2EV/EBITDA (x) 10.6 10.1 9.3 8.6 7.4Net debt/equity (%) net cash net cash net cash net cash net cashConsensus net profit - - 154 170 185MKE vs. Consensus (%) - - 1.7 1.5 16.6

January 3, 2016 131
Venture
Value Proposition
§ EMS provider that helps OEMs bring the “right” products to market faster, not just the “cheapest”. Value-add to customers in reducing “overall” cost of product delivery, measured not just in dollars but also effort and time.
§ Able to price services to optimise return on capital, unlike many EMS companies. As such, it is an industry leader in profitability & productivity despite fierce competition.
§ New-age, high-growth segments such as Life Sciences rising over old-world, GDP-linked segments such as retail store solutions.
Industry leader in profitability and productivity
Source: FactSet
Price Drivers
Historical share price
Source: Company, Maybank Kim Eng
1. Business in 2011 was disturbed by US economic weakness
and M&As among its customers eg Hypercom and Radiant were acquired by Verifone and NCR respectively.
2. Business volume in 2012 was disturbed by further US economic weakness and M&As. Intermec, Talaris and IBM POS were acquired by Glory, Toshiba TEC and Honeywell.
3. Tide turned in 2014 when US economy improved, USD strengthened and further customer M&As turned out to be positive for Venture.
Financial Metrics
§ Revenue growth has been picking up since 2013. Expect further momentum, especially with USD remaining strong against Asian currencies.
§ Pretax margins should continue to rise as Venture extends its value-adding partnerships with more OEM customers.
§ Balance sheet and cash flow have always been strong. With capex trending down from FY15 peak, there is potential to raise already-generous dividends.
Rising profitability, cash flow ramping back up
Source: Company
Swing Factors
Upside
§ Strength in US economy, especially in segments that Venture is exposed to.
§ Continued strength in USD due to Venture’s 100% revenue exposure to this currency.
§ Faster-than-expected growth in 3D printing, a promising segment that has lagged others such as Life Sciences.
Downside
§ M&As among customers. Acquisitions of Venture’s customers by others could disrupt or discontinue orders.
§ USD strength may erode competitiveness of Venture’s customers in the global marketplace, lowering orders for Venture.
§ Increased customer demand for Venture to hold more inventory at major hubbing sites, which would tie down cash that could be used to pay more dividends.
0.0
1.0
2.0
3.0
4.0
5.0
6.0
7.0
- 2,000 4,000 6,000 8,000 10,000
Prof
itab
ility
(pre
tax
mar
gin
%)
Productivity (USD profits per worker)
Venture
PlexusBenchmark
Sanmina
Celestica
Hon Hai
FlextronicsJabil
70
75
80
85
90
95
100
105
110
6.0
6.5
7.0
7.5
8.0
8.5
9.0
9.5
10.0
Dec-10 Dec-11 Dec-12 Dec-13 Dec-14
Venture - (LHS, SGD) Venture / MSCI AC Asia ex JP - (RHS, %)
-4.0%
-2.0%
0.0%
2.0%
4.0%
6.0%
8.0%
10.0%
12.0%
14.0%
16.0%
18.0%
-30.0%
-25.0%
-20.0%
-15.0%
-10.0%
-5.0%
0.0%
5.0%
10.0%
15.0%
20.0%
FCF Yield (RHS) Revenue ChgPretax margin Dividend Yield (RHS)
1
2 3

This page has een left blank intentionally

January 3, 2016 133
Venture

January 3, 2016
Stra
tegy
Th
aila
nd
Thailand’s Six-for-16
Cautiously Optimistic
Disposable income to rise Slow economic activity, stagnant wages and an absence of wealth creation amid high debt-servicing burdens have been weighing on consumer confidence and spending in the past three years. We hold the contrarian view that disposable income will start to improve in 2016, fostered by cash stimulus, higher government spending together with tax relief schemes for lower tax brackets. Better take-home pay should flow into consumption given pent-up demand in the last three years amid low confidence. Products to highlight are white goods: electrical & electronics, machinery, and home-improvement and repair items. We see potential beneficiaries in the consumer, household & consumer-finance sectors, banks, retailers and some material companies producing products for repair. Our top picks are credit-card provider TCAP (BUY, TP THB40) and home-improvement retailer HMPRO (BUY, TP THB9.1).
Infrastructure rollout Our new Economics Team has dubbed 2016 the Year of Investment. We see renewed commitment to roll out long-delayed infrastructure projects with a pared-down list that seems more realistic, involving 20 projects and THB1.8t. Obviously, taking physical and financial capacity into account, it is not possible to execute the projects in a short period of time. However, we do expect projects worth c.THB350b to be open for bidding in 2016, at least pumping THB100b into the system during the year. We believe that not only would this boost income but also confidence in the private sector to jump-start shelved capex plans. The latter is crucial for adding on to stimulus, in our view. Contractors, sub-contractors and material companies should benefit. Big banks are also obvious beneficiaries given the financing commitments required. We recommend civil contractor CK and quasi-state bank KTB for the best exposure.
Competition to intensify Despite an improving outlook, slack capacity and high inventories carried from 2015 could keep competition high in the domestic market. In 2016, ASEAN Economic Community (AEC) integration will increase the competitive heat. In Thailand, we see the HHI ratio falling for a number of industries: property, telco, banking and leasing. Sectors with rising HHI are healthcare and retailing. Companies with weakening market power have been diversifying into other industries or countries. Favourite sectors are hotels, restaurants and retailing. Favorite destinations are Cambodia, Myanmar, Laos and Vietnam (CLMV). Thai FDI into these areas has risen nearly 10%. But even as AEC opens opportunities, it can intensify competition, at least during the transition. We pick vertically-integrated BDMS and diversified energy stock BCP as our BUYs for this exposure.
Analyst
Maria Lapiz
(66) 2257 0250

January 3, 2016 135
Thailand’s Six-for-16
Year of the Monkey: cautiously optimistic
Another credit crisis, another turf war will probably happen again in 2016. In Thailand, we have to tackle a number of issues: the move back to a democratic form of government, a new constitution & its referendum and clawing back the country’s reputation in international trade and relations. With the economy already into its third year of economic malaise, manageable leverage and forex reserves of USD178b, the eighth highest globally, there is really very little macro risk, in our view, even at the micro level. We are warming to the idea of a dynamic stock market, especially after its recent correction that has taken P/E valuations to about 12.4x. We are moving from Neutral to Positive on the market, tempering our optimism as global events could still affect the stock market. For instance, the confidence crisis in emerging markets could work its way into Thailand via outflows of higher-than-history foreign holdings of debt securities and equities. We saw this in 2015 and could see it again in 2016. It is possible, though, that the foreign exit from debt securities will find its way into equities on an improved economic outlook and a number of positive Talking Points. Maybank Kim Eng posits the view that disposable income will rise and the incremental wealth will go into consumption to feed pent-up demand. Initially, the spending could focus on mid-priced consumer goods and bite-sized home-improvement and repair items. Nothing spectacular like big-ticket purchases but there is mass here which should make the effects powerful. For this, we pick HMPRO and TCAP. The rollout of infrastructure projects could add to the uplift and revive fading confidence in the private sector. For this, we recommend CK and KTB. AEC is both a threat and an opportunity, in our view. Thai corporates are already there, ahead of their ASEAN peers. The opening of the market will expand opportunities, for sure. Unfortunately, it could also worsen competition that not all can handle. For some Thai corporates, the additional heat would add to the rivalry they face at home. We think the best exposure to AEC can be provided by diversified energy BCP and vertically-integrated BDMS.
Six for Sixteen
Source: Bloomberg as of 28 Dec 2015, MKE-ISR
YTD share-price performances Recent profitability
Closing 28 Dec 2015; Sources: Bloomberg, MKE-ISR Source: MKE-ISR
Stock Mkt cap Liquidity Price TP U/D Side ROE Beta
(USDm) (USDm) (LC) (LC) (%) 15E 16E 15E 16E 15E 15E 16E
HMPRO 2,443 3.0 6.7 9.1 35.1 25.6 23.5 4.6 4.3 18.5 2.0 2.1 1.1
TCAP 1,179 4.4 36.5 40.0 9.6 8.5 7.3 0.9 0.8 10.3 4.4 5.2 0.9
KTB 6,472 15.3 16.7 19.3 15.6 8.5 7.7 0.9 0.9 11.5 4.5 4.9 1.1
CK 1,339 5.3 28.5 33.5 17.5 37.8 33.4 2.4 2.3 6.5 1.1 1.2 1.2
BDMS 9,450 12.3 22.0 22.5 2.3 46.0 39.7 6.8 6.2 15.2 1.1 1.3 0.8
BCP 1,317 2.3 34.5 40.0 15.9 8.5 8.5 1.3 1.2 14.8 4.9 4.8 1.0
SET 13.0 12.6 1.7 1.6 10.9 4.0 3.7
P/E (x) P/B (x) Div yld (%)
NP growth 3Q%QoQ 3Q%YoY 9M%YoY
HMPRO -2.1 4.8 3.1
TCAP -2.8 12.5 8.4
KTB -36.7 -42.2 -13.7
CK -82.8 -76.4 26.4
BDMS 40.0 8.3 6.6
BCP -84.5 13.4 33.2

January 3, 2016 136
Thailand’s Six-for-16
2016 talking points
1: Higher disposable income
Slowing growth in disposable income has been behind weak consumption. An insipid economy, stagnant wages and an absence of wealth creation amid high debt servicing weigh on consumer confidence and spending.
We now take a non-consensus view that disposable income - defined as total income minus payable obligations such as interest rates and taxes - will start to improve in 2016, fostered by higher government spending, cash stimulus and tax relief schemes for lower tax brackets. Higher economic activity should translate into better take-home pay, in our opinion.
Thailand’s household disposable income is mainly made up of wages & salaries and mixed sources of income from self-employment & others. Combined, these two categories account for 80% of household income. In the past decade, although there has been a noticeable rise in income from property and other secondary sources, the ratio remains small, at around 10% for each.
Compensation and mixed sources of disposable income
Source: NESDB, MKE-ISR
We believe that take-home pay will improve in 2016 from the following:
1) After two years of freeze, the annual adjustment mechanism for the minimum wage will resume in 2016. It will revert to the old system of using varying escalation rates, depending on province and the cost of living. After sequential monthly declines this year, wages are finally climbing. We believe the pace will hasten next year.
Wages ticking up
Source: BOT, MKE-ISR
4.0
6.7
2.8
0.60.9 0.4
-0.1
0.6 0.7
-1.0
0.0
1.0
2.0
3.0
4.0
5.0
6.0
7.0
8.0
9.0
Income Payable Disposable income
THB, tn
Composition of household income (as of 2013)
Com
pens
ation
of
emplo
yees
8.3 1.1
7.2
Mixe
d inc
ome
property receivable
Secondary income
Property income payable
Tax and related expesnes
Cons
umpt
ion
Saving
Adjustments
- =
0.0%
5.0%
10.0%
15.0%
20.0%
25.0%
Jan-
12
Mar
-12
May
-12
Jul-1
2
Sep-
12
Nov-
12
Jan-
13
Mar
-13
May
-13
Jul-1
3
Sep-
13
Nov-
13
Jan-
14
Mar
-14
May
-14
Jul-1
4
Sep-
14
Nov-
14
Jan-
15
Mar
-15
May
-15
Jul-1
5
Sep-
15
%YoY Wage growth
THB300 Minimum wage increase

January 3, 2016 137
Thailand’s Six-for-16
2) With agricultural prices expected to enter their third-year low, we expect more farmers to search for alternative income. Since 2013, 3m farmers have moved out of the farm sector. An estimated 2m have entered non-farm labour: 37% in manufacturing, 20% in hospitality & food services and 9.5% in retail & wholesale trade.
Sluggish farm income for years…
Source: OAE, BOT
… has compelled farmers to seek a living elsewhere
Source: OAE, MKE-ISR
3) “Mixed income” should also benefit from the government’s stimulus measures, especially those designed to support small enterprises. Other cash-transfer measures include village-fund support, cash handouts and the promotion of small development projects.
Static payable obligations and savings ratio As absolute income increases, obligations are likely to drop, especially with programmes like farm-debt moratoriums and a planned cut in the personal income tax for lower tax brackets.
Options for tax-burden reduction proposed by the Revenue Department
I. Lowering the top tax bracket from 35%
II. Raising the THB150k exemption cap on taxable income
III. Lifting the annual deduction of expenses of 40% but not more than THB60k
IV. Changing the tax bracket structure
Source: Local news, MKE-ISR
While the amount may be small at THB20-30b, it should be meaningful enough to those in the lower tax brackets. Moreover, as the tax changes are permanent, they are likely to trigger durable changes in consumption and encourage more economic production. More importantly, as lower-income households have a high marginal propensity to consume, the multiplier effects could be high and enduring.
What of leverage? High household leverage has been a hot topic in the last two years, with high servicing burdens partly blamed for weak consumption. At first, we thought that when income starts improving, households would choose to deleverage rather than consume. We have re-considered our view for the reasons below.
Firstly, while household debt is high, it is not high enough to scare banks off. Debt has been rising still, although its delta is lower. Thailand does not have a sophisticated financial system and banks are the main source of debt. For 2016, banks are projecting fairly healthy loan growth. On expectations that the economy would grow 3% and 2.5% respectively, KBANK and SCB are eyeing loan
-30%
-20%
-10%
0%
10%
20%
30%
40%
50%
60%
70%
Jan-0
6
Jun-0
6
Nov
-06
Apr-
07
Sep-0
7
Feb-0
8
Jul-
08
Dec-
08
May
-09
Oct
-09
Mar
-10
Aug-
10
Jan-1
1
Jun-1
1
Nov
-11
Apr-
12
Sep-1
2
Feb-1
3
Jul-
13
Dec-
13
May
-14
Oct
-14
Mar
-15
Aug-
15
%YoY Farm income
20%
25%
30%
35%
40%
45%
50%
-30%
-20%
-10%
0%
10%
20%
30%
40%
50%
60%
70%
Jan-
11
Mar
-11
May
-11
Jul-
11
Sep
-11
Nov
-11
Jan-
12
Mar
-12
May
-12
Jul-
12
Sep
-12
Nov
-12
Jan-
13
Mar
-13
May
-13
Jul-
13
Sep
-13
Nov
-13
Jan-
14
Mar
-14
May
-14
Jul-
14
Sep
-14
Nov
-14
Jan-
15
Mar
-15
May
-15
Jul-
15
Sep
-15
%/laborforce%YoY
Share of non-farm employment (RHS)
Share of farm employment (RHS)
Farm income (LHS)

January 3, 2016 138
Thailand’s Six-for-16
growth of 6-7% and 4-6%. They expect better growth in retail and SME lending than in large corporate lending. We expect other banks to target similar growth.
We are eyeballing loan growth of 5.6%, up from 5.2% this year. With ample credit supply, households need not raise their savings ratios.
Household debt continues to rise but with a lower delta
Source: BOT, NESDB, MKE-ISR
Abundant liquidity eases the pressure on market rates
Source: BOT, MKE-ISR
Secondly, we do not expect interest rates to rise dramatically as excess liquidity in the system is still quite high. As of Sep 2015, all domestic commercial banks held about THB3t of liquid assets, exceeding the Bank of Thailand’s THB0.8t requirement. The THB2.2t “excess liquidity” should be able to meet the funding needs of both the private and public sectors. As we anticipate still-low interest rates and better income, household savings should rise.
An examination of the various components of household expenditure suggests that not only has its composition been the same, spending on F&B, housing/household operations, apparel and personal care still accounts for 60%.
Monthly household expenditure
Source: NSO, MKE-ISR
Since 2008, disposable income has been underwriting consumption. Savings remain largely unchanged. Given this, we turn more positive on consumption in 2016.
81%
40%
45%
50%
55%
60%
65%
70%
75%
80%
85%
4.0
5.0
6.0
7.0
8.0
9.0
10.0
11.0
12.0
1Q11
2Q11
3Q11
4Q11
1Q12
2Q12
3Q12
4Q12
1Q13
2Q13
3Q13
4Q13
1Q14
2Q14
3Q14
4Q14
1Q15
2Q15
% of GDPTHB, tn
Household debt: Level
Household debt: % of GDP (RHS)
0.8
2.2
0.0
0.5
1.0
1.5
2.0
2.5
3.0
3.5
4.0
1Q07
3Q07
1Q08
3Q08
1Q09
3Q09
1Q10
3Q10
1Q11
3Q11
1Q12
3Q12
1Q13
3Q13
1Q14
3Q14
1Q15
3Q15
THB, tn
Excess liquid assets
Required liquid assets

January 3, 2016 139
Thailand’s Six-for-16
Consumption is underwritten mainly by disposable income
Source: NESDB, MKE-ISR
Since 2009, the Thai household has not been saving more
Source: NESDB, MKE-ISR
Replacement cycle could start in 2016
Depressed consumption for nearly three years could have created pent-up demand in some segments, we believe. We are anticipating the start of a replacement cycle, first, in mid-priced products that do not need high debt financing such as electrical and electronic gadgets and home-improvement items, basically consumer white goods. This could be followed by motorcycles, before spreading to higher-ticket items like farm tractors and automobiles.
Statistics from the Office of Industrial Economics suggest that domestic sales of consumer goods have been flat since 2011, the year Thailand was devastated by floods.
Home improvement & renovation is an area where we expect pent-up demand. After growing 9% YoY in 2012, mainly due to reconstruction demand, spending has stayed mostly flat.
With 22-23m homes in Thailand and assuming incremental home-improvement/renovation spending of THB6,000 per household or THB500 per month, incremental household renovation spending could amount to THB132b. This would be another 1% of nominal GDP.
Flat domestic sales of consumer goods
Source: OAE
Home-improvement spending
Source: NESDB
Our optimism extends to automotive sales. This is bold, as 10M15 domestic auto sales contracted 14% YoY to 621,742 units. However, when we compare this to pre-2012 levels, the monthly average this year is 62K units, approaching what we can deem their natural replacement rate of 75K per month. This is equivalent to a 2.4% replacement rate on a stock of 35.5m registered units.
This image cannot currently be displayed.

January 3, 2016 140
Thailand’s Six-for-16
Monthly car sales are normalising
Source: Thailand Automotive Institute
Companies that could benefit are HMPRO, GLOBAL, DCC, SCC, KYE and SNC, in our view. Consumer-finance companies AEON, SINGER, TCAP, THANI and KTC could also cater to the small amount of financing required. Our top picks are TCAP and HMPRO.
YTD stock performances of potential beneficiaries…
Closing 28 Dec 2015; Sources: Bloomberg, MKE-ISR
…and consumer finance
2: Infrastructure pick-up The government touts 2016 as a year of investment with 20 infrastructure projects lined up worth THB1.8t. Thailand’s infrastructure plan was drafted in the early 1990s. The 1997 Asian Financial Crisis put the master plan on the back burner. It was given a makeover in 2003 when the Thaksin government prepared for its second term. At the time, its total amount was THB2.5t, for what were dubbed mega-projects. Since then, the projects have become a rallying cry for many revolving-door governments, but few have been implemented. The bigger projects are the Bangkok mass transit system and motorways.
We welcome the dynamism of the present economics team led by Dr. Somkid Jatusripitak. Infrastructure rollout, especially of projects that traverse multi-provinces, can involve rural populations and lift rural disposable income.

January 3, 2016 141
Thailand’s Six-for-16
Most investments will be on rail transport...
Source: Ministry of Transport
… funded mainly by borrowings
Source: Ministry of Transport
Financing for the 20 projects will come from: 1) the government's fiscal budget of THB84.1b or 5%; 2) borrowings of THB1,270b or 71%; and 3) PPP schemes worth THB377b or 21%. We believe there is ample domestic liquidity to underwrite the projects without funding-cost pressures. During the last auction of a 15-year government bond for capex, the coupon was 3.85%. This has since stayed flat. Since 80% of the funding will come from borrowings, we think big banks such as KTB, BBL, SCB and KBANK will benefit. In particular, quasi-state-owned KTB could be at the forefront, given its close ties to the government. BBL, with its THB2.9t assets and 79% LDR, should also be well-placed to pick up market share, especially in corporate lending. This is its core competency. The government also plans to establish a Thailand Future Fund to provide funding. This will be offered to the public in 2Q16. Its initial size of THB100b is small relative to the amount required but should provide a good start. A successful offering, tacitly implying attractive returns, could make such funds effective fund-raising vehicles for the government. As many of the 20 projects are either large and/or cover multiple provinces, we believe the contracts will be awarded on a turnkey basis. This is for ease of monitoring and qualification assessment. Large contractors STEC, CK, ITD and UNIQ are likely to benefit. We also think that sub-contractors such as CNT, NWR, SYNTEC and TRC will pick up some of the work. As the projects are implemented, cement manufacturers such as SCC, SCCC and TPIPL, and construction-material & foundation-work providers such as TASCO, PYLON, SCP and SEAFCO should form the next line of beneficiaries. The multiplier effects should filter down via subcontracting work that will require manpower and material resources in the provinces. In our opinion, the best exposure is provided by diversified contractor, CK and quasi-state-owned bank, KTB.

January 3, 2016 142
Thailand’s Six-for-16
YTD share prices of the companies that could benefit…
Closing 14 Dec 2015; Sources: Bloomberg, MKE-ISR
… and the big commercial banks
We believe the first up for bidding in 1H16 will be three motorways worth THB160.4b and three water and air transport projects worth THB55.5b. Combined, their amount is THB215.9b. We think this can be accommodated by the FY16-17 fiscal budget. The Orange Line mass transit system valued at THB110b is likely to be the next open for bidding, sometime in 3Q16.
Assuming this timeline is met, a total of THB100b could make their way into the economy in 2016, jacking up economic growth by as much as 1%. These investments would shore up disposable income and provide additional impetus for our recovery hypothesis. It could also entice the private sector to start a new capex cycle, especially in real estate.
Caveats
Because of the numerous false starts to the infrastructure programme over the years, it is prudent to flag caveats.
1) Thai governance faithfully adheres to fiscal discipline. The law stipulates a maximum ceiling of 60% for public debt to GDP. Most governments commit to 50%. As of Oct 2015, the ratio was closer to 45%. There is also a fiscal-deficit limit of 3% of GDP. In the 2014-2015 fiscal year, the ratio was over 3% most of the time due to low tax collection and economic limpness, although it managed to close the year at the ceiling. In the first month of FY15-16, the fiscal deficit was 1.6%.
2) Government agencies are increasingly unable to execute their capex plans, as can be seen in the persistent rise in the carry-over budget on a 12-month rolling basis since 2011. This could be a sign that political instability has finally affected the functioning of the government machinery. If so, the obstacle could take a much longer time to rectify. The present anti-corruption platform has created a super board in the State Enterprises Policy Commission to supervise various state enterprises. This is a major overhaul of the system that could take time to reach smooth operations.

January 3, 2016 143
Thailand’s Six-for-16
Fiscal-deficit position
Source: Budget Bureau
Carry-over budget
Source: Budget Bureau
3: Competition to worsen under AEC Amid a general view that Thailand is losing global competitiveness, we believe that listed Thai corporates are competitive in terms of manpower, market efficiency and innovation. They could be at the forefront of benefits that Thailand will enjoy after it becomes better connected with the Greater Mekong Sub-region of Cambodia, Laos, Myanmar, Vietnam (CLMV) and China’s southern province of Yunnan.
Still, with excess production capacity and high inventories going into 2016, competition could be intense, especially as players try to grab market share.
General utilisation rates – contracting Inventories – high Inventory to shipment ratios - rising
Source: OIE, MKE-ISR Source: OIE, MKE-ISR Source: OIE, MKE-ISR
A good number of Thai corporates have kept their utilisation rates high by exporting. Their favourite destination is North ASEAN. With AEC in 2016, we expect competition to intensify. And with the new players setting low performance hurdles in these frontier markets in exchange for market share, the competitive threat to Thai players could increase in both domestic and overseas markets.
Thai FDIs to CLMV
Source: BOT
Exports to CLMV
Source: BOT
507 110 318 318 245 384 402 218.116
5.8
1.1
3.1 3.02.1
3.2 3.0
1.6
0.0
1.0
2.0
3.0
4.0
5.0
6.0
7.0
0
100
200
300
400
500
600
FY20
09
FY20
10
FY20
11
FY20
12
FY20
13
FY20
14
FY20
15
1MFY
16
THBb, budget deficit % of GDP 336.9
100
150
200
250
300
350
Oct
-07
Oct
-08
Oct
-09
Oct
-10
Oct
-11
Oct
-12
Oct
-13
Oct
-14
Oct
-15
THBb
59.9
-4.8
-10
0
10
20
30
40
50
40
45
50
55
60
65
70
75
Jan-
12
Apr-
12
Jul-1
2
Oct
-12
Jan-
13
Apr-
13
Jul-1
3
Oct
-13
Jan-
14
Apr-
14
Jul-1
4
Oct
-14
Jan-
15
Apr-
15
Jul-1
5
Oct
-15
Utilization index , 2011=100 %chg, YoY
117.0
-7.6
-15
-10
-5
0
5
10
15
20
25
40
50
60
70
80
90
100
110
120
130
140
Jan-
12
Apr-
12
Jul-1
2
Oct
-12
Jan-
13
Apr-
13
Jul-1
3
Oct
-13
Jan-
14
Apr-
14
Jul-1
4
Oct
-14
Jan-
15
Apr-
15
Jul-1
5
Oct
-15
Inventory index , 2011=100 %chg, YoY
116.7
-8.6
-40
-30
-20
-10
0
10
20
30
50
60
70
80
90
100
110
120
130
140
150
Jan-
12
Ap
r-12
Jul-
12
Oct
-12
Jan-
13
Ap
r-13
Jul-
13
Oct
-13
Jan-
14
Ap
r-14
Jul-
14
Oct
-14
Jan-
15
Ap
r-15
Jul-
15
Oct
-15
Inventory to shipment ratio , 2011=100 %chg, YoY

January 3, 2016 144
Thailand’s Six-for-16
Thai businesses have also been diversifying into new lines with high growth and cash-flow potential.
In Thailand, we observe operators of hotels, restaurants, department stores and community malls expanding. The most visible example is LH, which is increasing its focus on shopping malls after the success of its Terminal 21 commercial complex. In the past year, the Singha Group – second-largest beverage player in Thailand - also sought a backdoor listing for its property arm, Singha Estates (S TB, Not Rated).
The trend is no longer limited to the big players. Recent press reports suggest that small property developers such as NUSA, PACE, SIRI and MBK are planning to launch new hotels and restaurants in 2016.
Business diversification and overseas expansion
Sector Business diversification Overseas expansion Banking In both interest and non-interest income
segments. New and differentiated products CLMV
Construction material
Expanding to retailers of home-related products, advisories of home builders and high-value-added products
ASEAN, CLMV
Energy Diversifying to renewable energy business and power plants
Regional, Global
Healthcare Penetrating hospital-related products such as saline, drug stores, laboratories, imported medical equipment
Myanmar, Cambodia, Mongolia
Ind.Estates Expanding power plants Vietnam, Myanmar
Media Diversifying to hotels and office buildings Myanmar, Cambodia, Laos
Property Expanding to hotels, retailing, renewable energy, restaurants, hospitals, department stores and community malls
ASEAN
Source: MKE-ISR
The Herfindahl-Hirschman Index (HHI) for healthcare and retailing has been rising since 2006, indicating higher business concentration. In the case of retailing, the HHI increased after CPALL’s acquisition of MAKRO.
HHI for the telco sector is starting to dip. If 4G licensing allows for a fourth private provider of mobile-phone services, it could shrink further. Banking HHI has been falling while leasing HHI is mostly flat. AEC liberalisation could trigger changes for all these industries, intensifying competition as it opens up the playing field. Even if Thai corporates are the most prepared for AEC, the opening of the market will still require adaptation that could pinch profitability initially.
HHI – Healthcare, Property, Retailer, Telcos
Source: MKE-ISR
HHI – Banking, Leasing
Source: MKE-ISR
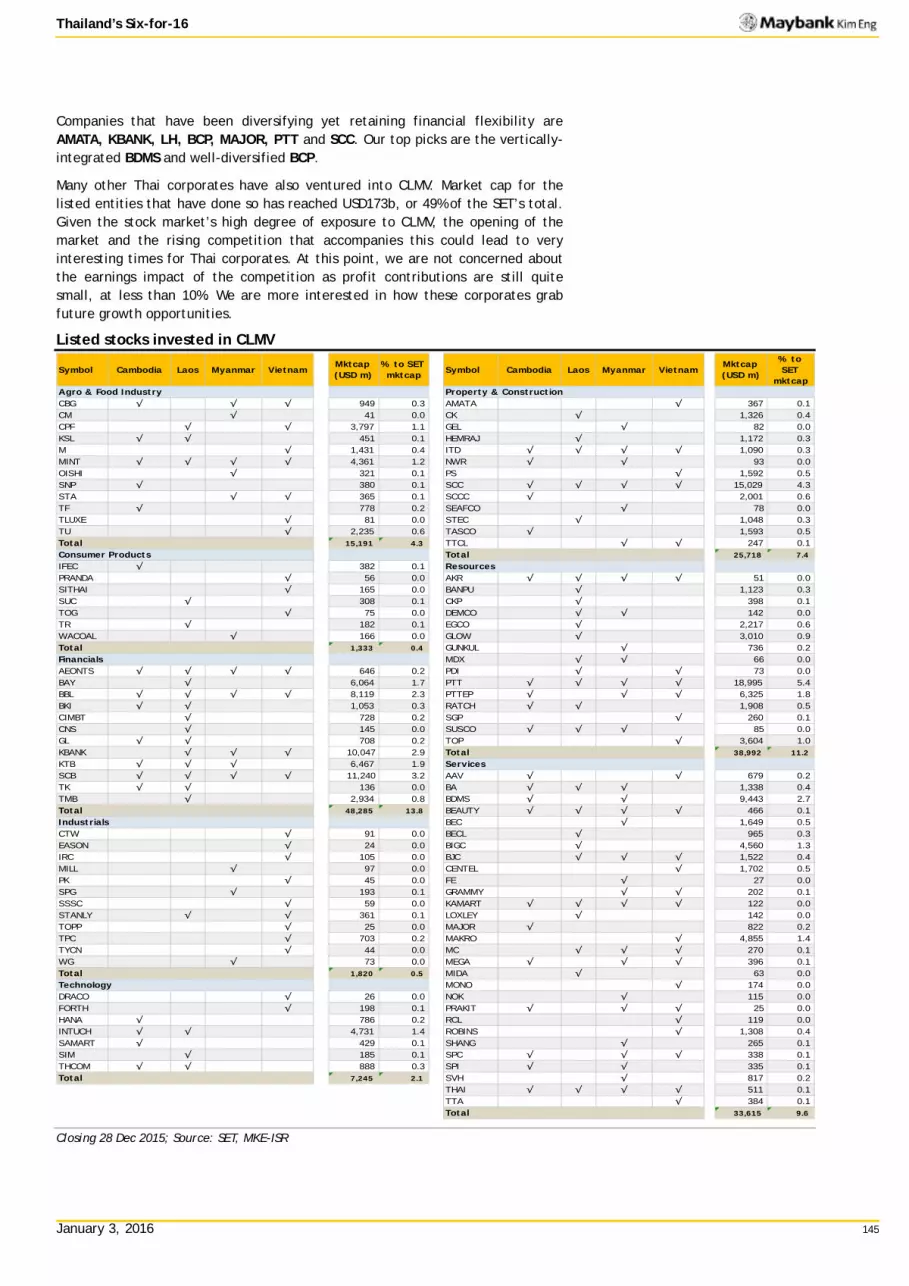
January 3, 2016 145
Thailand’s Six-for-16
Companies that have been diversifying yet retaining financial flexibility are AMATA, KBANK, LH, BCP, MAJOR, PTT and SCC. Our top picks are the vertically-integrated BDMS and well-diversified BCP.
Many other Thai corporates have also ventured into CLMV. Market cap for the listed entities that have done so has reached USD173b, or 49% of the SET’s total. Given the stock market’s high degree of exposure to CLMV, the opening of the market and the rising competition that accompanies this could lead to very interesting times for Thai corporates. At this point, we are not concerned about the earnings impact of the competition as profit contributions are still quite small, at less than 10%. We are more interested in how these corporates grab future growth opportunities.
Listed stocks invested in CLMV
Closing 28 Dec 2015; Source: SET, MKE-ISR
Symbol Cambodia Laos Myanmar VietnamMktcap (USD m)
% to SET mktcap Symbol Cambodia Laos Myanmar Vietnam
Mktcap (USD m)
% to SET
mktcap
CBG √ √ √ 949 0.3 AMATA √ 367 0.1CM √ 41 0.0 CK √ 1,326 0.4CPF √ √ 3,797 1.1 GEL √ 82 0.0KSL √ √ 451 0.1 HEMRAJ √ 1,172 0.3M √ 1,431 0.4 ITD √ √ √ √ 1,090 0.3MINT √ √ √ √ 4,361 1.2 NWR √ √ 93 0.0OISHI √ 321 0.1 PS √ 1,592 0.5SNP √ 380 0.1 SCC √ √ √ √ 15,029 4.3STA √ √ 365 0.1 SCCC √ 2,001 0.6TF √ 778 0.2 SEAFCO √ 78 0.0TLUXE √ 81 0.0 STEC √ 1,048 0.3TU √ 2,235 0.6 TASCO √ 1,593 0.5Total 15,191 4.3 TTCL √ √ 247 0.1
Total 25,718 7.4
IFEC √ 382 0.1PRANDA √ 56 0.0 AKR √ √ √ √ 51 0.0SITHAI √ 165 0.0 BANPU √ 1,123 0.3SUC √ 308 0.1 CKP √ 398 0.1TOG √ 75 0.0 DEMCO √ √ 142 0.0TR √ 182 0.1 EGCO √ 2,217 0.6WACOAL √ 166 0.0 GLOW √ 3,010 0.9Total 1,333 0.4 GUNKUL √ 736 0.2
MDX √ √ 66 0.0AEONTS √ √ √ √ 646 0.2 PDI √ √ 73 0.0BAY √ 6,064 1.7 PTT √ √ √ √ 18,995 5.4BBL √ √ √ √ 8,119 2.3 PTTEP √ √ √ 6,325 1.8BKI √ √ 1,053 0.3 RATCH √ √ 1,908 0.5CIMBT √ 728 0.2 SGP √ 260 0.1CNS √ 145 0.0 SUSCO √ √ √ 85 0.0GL √ √ 708 0.2 TOP √ 3,604 1.0KBANK √ √ √ 10,047 2.9 Total 38,992 11.2
KTB √ √ √ 6,467 1.9SCB √ √ √ √ 11,240 3.2 AAV √ √ 679 0.2TK √ √ 136 0.0 BA √ √ √ 1,338 0.4TMB √ 2,934 0.8 BDMS √ √ 9,443 2.7Total 48,285 13.8 BEAUTY √ √ √ √ 466 0.1
BEC √ 1,649 0.5CTW √ 91 0.0 BECL √ 965 0.3EASON √ 24 0.0 BIGC √ 4,560 1.3IRC √ 105 0.0 BJC √ √ √ 1,522 0.4MILL √ 97 0.0 CENTEL √ 1,702 0.5PK √ 45 0.0 FE √ 27 0.0SPG √ 193 0.1 GRAMMY √ √ 202 0.1SSSC √ 59 0.0 KAMART √ √ √ √ 122 0.0STANLY √ √ 361 0.1 LOXLEY √ 142 0.0TOPP √ 25 0.0 MAJOR √ 822 0.2TPC √ 703 0.2 MAKRO √ 4,855 1.4TYCN √ 44 0.0 MC √ √ √ 270 0.1WG √ 73 0.0 MEGA √ √ √ 396 0.1Total 1,820 0.5 MIDA √ 63 0.0
MONO √ 174 0.0DRACO √ 26 0.0 NOK √ 115 0.0FORTH √ 198 0.1 PRAKIT √ √ √ 25 0.0HANA √ 786 0.2 RCL √ 119 0.0INTUCH √ √ 4,731 1.4 ROBINS √ 1,308 0.4SAMART √ 429 0.1 SHANG √ 265 0.1SIM √ 185 0.1 SPC √ √ √ 338 0.1THCOM √ √ 888 0.3 SPI √ √ 335 0.1Total 7,245 2.1 SVH √ 817 0.2
THAI √ √ √ √ 511 0.1TTA √ 384 0.1Total 33,615 9.6
Services
Technology
Agro & Food Industry
Consumer Products
Financials
Industrials
Property & Construction
Resources

January 3, 2016 146
Thailand’s Six-for-16
Company highlights
HMPRO: Thailand’s largest home-improvement retailer with 76 HomePro stores for end-users and six Mega Home stores for construction companies and small repair contractors. Growing at a rate of 4-5 stores per year. With its high national penetration, it should be well-placed to cater to increased demand for home-improvement and repair goods. About 15% of its merchandise mix is consumer white goods. Mega Home is a new format that has been successful so far. It can be exported to CLMV. HMPRO has already exported its HomePro format to Malaysia with a store in Kuala Lumpur. TCAP: Domestic new-car sales should stabilise this year, after demand was brought forward by the first time car buyer scheme. Buyers under the scheme will be eligible to sell their cars next year; we believe that some of them will do so. Better car sales should boost the bank’s lending. Moreover, THB5b of expected tax gains thanks to its SCIB deal in 2010 should support its bottom line for the next few years. KTB: A prime beneficiary of upcoming government infrastructure investments. As the government is trying to reduce its contingent liabilities and specialised financial institutions are being transferred to the Bank of Thailand for stringent regulation, KTB should be the main conduit for public spending. This offers loan-growth upside. A deal to sell THB10b worth of land is ongoing and could be another catalyst next year. CK: A Class A contractor that has diversified to quasi-utilities: mostly concessions that cushion earnings should big civil-work contracts fail to come through. Its investments span water, hydropower, underground mass transit and expressway companies. BDMS’ 41% share of the Thai healthcare market by revenue and its national network of hospitals as well as diversification into ancillary medical businesses provide strong barriers to entry. However, we reckon this will not be enough amid a trend of medicine without frontiers where patients shop for the best services region-wide. BDMS is moving into CLMV where growth is arguably high. BCP. Most diversified downstream energy entity. Should benefit from healthy gross refinery margins (GRM), expansion into renewable capacity and retailing using its 1,000 or so petrol stations as a springboard.
Six for Sixteen
Stock Mkt cap Liquidity Price TP U/D Side ROE Beta
(USDm) (USDm) (LC) (LC) (%) 15E 16E 15E 16E 15E 15E 16E
HMPRO 2,443 3.0 6.7 9.1 35.1 25.6 23.5 4.6 4.3 18.5 2.0 2.1 1.1
TCAP 1,179 4.4 36.5 40.0 9.6 8.5 7.3 0.9 0.8 10.3 4.4 5.2 0.9
KTB 6,472 15.3 16.7 19.3 15.6 8.5 7.7 0.9 0.9 11.5 4.5 4.9 1.1
CK 1,339 5.3 28.5 33.5 17.5 37.8 33.4 2.4 2.3 6.5 1.1 1.2 1.2
BDMS 9,450 12.3 22.0 22.5 2.3 46.0 39.7 6.8 6.2 15.2 1.1 1.3 0.8
BCP 1,317 2.3 34.5 40.0 15.9 8.5 8.5 1.3 1.2 14.8 4.9 4.8 1.0
SET 13.0 12.6 1.7 1.6 10.9 4.0 3.7
P/E (x) P/B (x) Div yld (%)

January 3, 2016 147
Thailand’s Six-for-16
Performance snapshots
ROIC and EVA spread – HMPRO ROIC and EVA spread - TCAP ROIC and EVA spread - KTB
Source: Bloomberg Source: Bloomberg Source: Bloomberg
Dupont analysis - HMPRO Dupont analysis - TCAP Dupont analysis - KTB
Source: Bloomberg Source: Bloomberg Source: Bloomberg
ROIC and EVA spread - CK ROIC and EVA spread - BDMS ROIC and EVA spread - BCP
Source: Bloomberg Source: Bloomberg Source: Bloomberg
Dupont analysis - CK Dupont analysis - BDMS Dupont analysis - BCP
Source: Bloomberg Source: Bloomberg Source: Bloomberg
0.0
5.0
10.0
15.0
Dec
-05
Dec
-06
Dec
-07
Dec
-08
Dec
-09
Dec
-10
Dec
-11
Dec
-12
Dec
-13
Dec
-14
WACC ROIC(%)
0.0
2.0
4.0
6.0
8.0
Dec
-07
Aug-
08
Apr-
09
Dec
-09
Aug-
10
Apr-
11
Dec
-11
Aug-
12
Apr-
13
Dec
-13
Aug-
14
Apr-
15
WACC ROIC(%)
0.0
2.0
4.0
6.0
8.0
10.0
Mar
-07
Mar
-08
Mar
-09
Mar
-10
Mar
-11
Mar
-12
Mar
-13
Mar
-14
Mar
-15
WACC ROIC(%)
-20.0
-10.0
0.0
10.0
20.0
Mar
-07
Mar
-08
Mar
-09
Mar
-10
Mar
-11
Mar
-12
Mar
-13
Mar
-14
Mar
-15
WACC ROIC(%)
0.0
5.0
10.0
15.0
Mar
-07
Mar
-08
Mar
-09
Mar
-10
Mar
-11
Mar
-12
Mar
-13
Mar
-14
Mar
-15
WACC ROIC(%)
-5.0
0.0
5.0
10.0
15.0M
ar-0
7
Mar
-08
Mar
-09
Mar
-10
Mar
-11
Mar
-12
Mar
-13
Mar
-14
Mar
-15
WACC ROIC(%)

January 3, 2016
Mat
eria
ls
Thai
land
Maria Lapiz [email protected] (66) 2257 0250
Suttatip Peerasub [email protected] (66)-2658-6300 ext 1430
Home Product Center (HMPRO TB)
Return of SSSG
Growth years coming We take the contrarian view that a replacement cycle for consumer and home-improvement goods will start in 2016, underwritten by higher disposable income. HMPRO is the largest home-improvement retailer with a national footprint in Thailand. We see the recent dramatic uptick in wages supporting home improvement and renovation. BUY with TP at 31x FY16F P/E, its 1SD above 10-year average.
SSSG returns In the last three years when the home-improvement and repair market was sluggish, HMPRO retained its earnings resilience by opening new stores to take market share. But SSSG contracted from 1Q15 for the first time since 2007 amid slightly higher financing costs. With this, its market allure started to fade and HMPRO has underperformed the SET in the last six months. That said, we believe higher disposable income will lead to incremental spending of THB132b on home improvement/renovation in 2016. Assuming full effects in 2H16 and a 15% market share for HMPRO, its revenue growth could potentially double our forecast of 12%.
Flows to the bottom line As most costs stay the same, the bulk of incremental sales should flow directly to the bottom line. This opens room for deleverage from its current 51% and cash dividends, in our view. HMPRO already has the stores and market knowledge, with 80% sales made to the renovation industry. All it needs is to fine-tune its merchandising mix to catch coming opportunities, in our view.
Exportable format HMPRO has two formats: HomePro catering to end-users and Mega Home catering to construction companies and repair contractors. HomePro has started in Kuala Lumpur, Malaysia with one store. Mega Home is on pilot in Thailand and looks successful. CLMV is a natural market for this format, in our view.
Company description
Statistics52w high/low (THB)3m avg turnover (USDm)Free float (%)Issued shares (m)Market capitalisation
Major shareholders:26.9%17.6%4.2%
13,151
3.1
HMPRO operates home improvement retail outletsunder the name HomePro and Mega Homenationwide. HomePro format is exported starting inMalaysia.
Land & Houses Public Co., Ltd. Quality Houses Public Co. Ltd. OSATHANUGRAH NITHI
8.25/6.00
41.8
THB89.4BUSD2.5B
Price Performance
80
85
90
95
100
105
110
115
6.0
6.5
7.0
7.5
8.0
8.5
9.0
9.5
Jan-14 Apr-14 Jul-14 Oct-14 Jan-15 Apr-15 Jul-15 Oct-15
Home Product Center - (LHS, THB)
Home Product Center / Stock Exchange of Thai Index - (RHS, %)
-1M -3M -12MAbsolute (%) (3) 1 (12)
Relative to index (%) 2 6 2
Source: FactSet
FYE Dec (THB m) FY13A FY14A FY15E FY16E FY17E
Revenue 40,007 47,965 54,854 61,289 69,462EBITDA 3,065 3,638 3,895 4,290 4,793Core net profit 3,068 3,313 3,440 3,749 4,151Core EPS (THB) 0.32 0.27 0.26 0.29 0.32Core EPS growth (%) (15.6) (16.0) (2.7) 9.0 10.7Net DPS (THB) 0.34 0.28 0.13 0.14 0.16Core P/E (x) 21.3 25.3 26.0 23.9 21.5P/BV (x) 5.1 5.3 4.8 4.3 3.9Net dividend yield (%) 5.1 4.1 1.9 2.1 2.3ROAE (%) 27.1 23.3 20.0 19.1 19.0ROAA (%) 9.9 8.3 7.4 7.3 7.3EV/EBITDA (x) 21.3 25.6 24.7 23.3 21.1Net debt/equity (%) 66.6 53.7 50.3 51.1 50.4Consensus net profit - - 3,436 3,952 4,607MKE vs. Consensus (%) - - 0.1 (5.1) (9.9)
Share Price THB 6.80 12m Price Target THB 9.05 (+33%) Previous Price Target THB na
BUY

January 3, 2016 149
Home Product Center
Value Proposition
§ Thailand’s pioneer and largest HI retailer, with 76 HomePro and six Mega Home outlets. Market share is 35% among modern retailers and 17% for the entire HI market.
§ Scale and large distribution footprint are entry barriers. Horizontal (more outlets) and vertical (private brand) expansion is difficult to rival.
§ Should be able to replicate its Thai success in CLMV. Formats are exportable to ASEAN.
§ WACC spiked in 2010-13 as HMPRO was operationally and financially extended. With sluggish ROICs, EVA was negative. But 2015 EVA upturn was achieved despite contracting SSS.
SSSG higher than or on par with peers
Source: Company, Avg of ROBINS, MAKRO, BIGC, HMPRO, GLOBAL, CPALL
Price Drivers
Historical share price trend
Source: Company, Maybank Kim Eng
1. Spikes in 2010-12 due to double-digit SSSG. 2. Increased demand for home improvement and renovation
following 175-day floods in central region and Bangkok. 3. SSS started contracting in 1Q15.
Financial Metrics
§ SSSG a powerful driver. § Volume should rebound with income growth, after
shrinking for three quarters. Expect tighter margins on start-up of Mega Home and slow HI demand in provinces.
§ After increasing retail space by 2.4x in 2010-15, additions likely will be modest. Expect fading cashflow drags from new initiatives.
§ As FCF is improving on a mature portfolio and gearing declines from 51%, there is room for higher dividends.
§ With financial/cashflow stability, HMPRO could expand overseas.
FCF gradually rising, higher payouts possible
Source: Bloomberg
Swing Factors
Upside
§ Return of SSSG will expand margins. § Cash dividends will be constructive. § Mega Home breaks even this year and starts to produce
net profits in 2016. § If Mega Home tips the economies scale, margins could
expand dramatically.
Downside
§ Wrong merchandising mix delays SSS recovery and affects margins.
§ Rising competition affects its SSSG as well as margins. Main competitors are Siam Global (GLOBAL TB, HOLD, TP THB11) and Thai Watsadu (Central Group).
-15
-10
-5
0
5
10
15
1Q13 2Q13 3Q13 4Q13 1Q14 2Q14 3Q14 4Q14 1Q15 2Q15 3Q15
HMPRO GLOBAL Group average*(%)
50100150200250300350400450500
2.03.04.05.06.07.08.09.0
10.011.0
Dec-10 Dec-11 Dec-12 Dec-13 Dec-14
Home Product Center - (LHS, THB)
Home Product Center / MSCI AC Asia ex JP - (RHS, %)
(6)
(4) (2) (2) (1)
67
54 50 51 50
0
10
20
30
40
50
60
70
(7)
(5)
(3)
(1)
1
3
5
7
9
2013 2014 2015E 2016E 2017E
FCF Net D/E (RHS)(THB b) (%)
1
2 3

January 3, 2016
Bank
s Th
aila
nd
Maria Lapiz [email protected] (66) 2257 0250
Thanachart Capital (TCAP TB)
Time for Loan-Book Expansion
BUY for potential loan revival & tax shield Reiterate BUY on the stock with a higher GGM TP. After two years of loan contraction, we believe its loan book will expand next year. Tax benefits should also cushion earnings. TCAP is our top pick among the small banks.
Commercial car sales growing on rising investment While passenger car sales remain lacklustre, commercial car sales continue to improve. With improving domestic investment, we see the potential for stronger demand next year. This should be supported by economic expansion in the provinces where roads provide the main means of transport. As the biggest hire-purchase lender with 25% of its loans tied to commercial car sales, we expect TCAP to benefit. Furthermore, we think that passenger car sales will stabilise as some buyers under the first car buyer scheme will be eligible to sell their cars next year. We believe that some will do so after five years of usage.
Tax shield to support bottom line Bottom line should also be bolstered by tax gains related to TBANK’s acquisition of SCIB in 2010. TCAP classified the deal as a loss investment and has been allowed to reverse taxes paid in the past. This means that TBANK’s future revenue totalling an estimated THB23b will be tax-free. This could translate into an additional THB5b net profit for TCAP.
Top pick among small banks We reiterate TCAP as our top pick among the small banks. We believe that TCAP will dedicate all its tax benefits to strengthening its coverage and capital base. This would make it the strongest of the small banks. Our GGM TP is now THB40 (0.87x FY16 P/BV, 11.5% ROE). Following its recent correction along with the broader market, upside potential is now 20%.
Statistics52w high/low (THB)3m avg turnover (USDm)Free float (%)Issued shares (m)Market capitalisation
Major shareholders:12.7%10.2%8.8%
1,278
4.5
Thai NVDR MBK Thanachart Capital
36.75/28.50
82.0
THB46.6BUSD1.3B
Price Performance
80
90
100
110
120
130
140
28.0
30.0
32.0
34.0
36.0
38.0
40.0
Jan-14 Apr-14 Jul-14 Oct-14 Jan-15 Apr-15 Jul-15 Oct-15
Thanachart Cap - (LHS, THB)
Thanachart Cap / Stock Exchange of Thai Index - (RHS, %)
-1M -3M -12MAbsolute (%) 5 17 15
Relative to index (%) 11 22 34
Source: FactSet
FYE Dec (THB m) FY13A FY14A FY15E FY16E FY17E
Operating income 53,478 39,644 40,000 41,404 45,250Pre-provision profit 32,002 19,814 19,773 20,571 23,584Core net profit 9,231 5,120 5,490 6,421 7,809Core EPS (THB) 7.2 4.0 4.3 5.0 6.1Core EPS growth (%) 72.0 (44.5) 7.2 17.0 21.6Net DPS (THB) 1.6 1.6 1.6 1.9 2.3Core P/E (x) 5.1 9.1 8.5 7.3 6.0P/BV (x) 1.0 0.9 0.9 0.8 0.7Net dividend yield (%) 4.4 4.4 4.4 5.2 6.3Book value (THB) 37.07 40.19 42.88 46.01 49.82ROAE (%) 20.3 10.4 10.3 11.3 12.8ROAA (%) 0.9 0.5 0.5 0.6 0.7Consensus net profit - - 5,471 6,027 6,654MKE vs. Consensus (%) - - 0.4 6.5 17.4
Share Price THB 36.50 12m Price Target THB 40.00 (+10%) Previous Price Target THB 35.00
BUY

January 3, 2016 151
Thanachart Capital
Value Proposition
§ Leader in fixed-rate hire purchase, at 52% of book. Strong in financing commercial vehicles (25% of HP loans), faster-growing segment.
§ Focus on under-served markets to avoid head-on competition with universal banks. Wide network and tie-ups with dealers are entry barriers.
§ Expanding CASA base to improve NIMs and profitability. Operating costs partly inflated by investment in digital banking, which should ease.
§ Aims to lead in retail digital banking through a new IT system, especially among the younger Thais.
Largest HP lender in Thailand in 3Q15
Source: Company
Price Drivers
Historical share price trend
Source: Company, Maybank Kim Eng
1. TCAP sold bancassurance unit to Prudential, improving its
capital base. 2. Car sales plummeted following expiry of first-time car
buyer scheme. 3. Tax gains from SCIB deal in 2011 boosted bottom line.
Financial Metrics
§ Domestic car sales. November sales grew 4.6%, for the first time in more than two years. Commercial vehicle sales outpaced passenger car sales.
§ Interest rates. Expect BOT to keep rates unchanged throughout 2016. NIMs should improve but fixed-rate assets are sensitive to interest-rate changes.
§ Tax shield provided by SCIB acquisition. We assume write-backs to lift net profits by 25% pa in next few years.
§ Lower NPLs. For four years, takers of the first-car scheme have been servicing HPs and lowering loan values. These can sell their vehicles in 2016, reducing default risks.
Sales of commercial cars outpacing passenger cars
Source: Company
Swing Factors
Upside
§ Buyer for subsidiary TBANK, which could lead to a revaluation of this asset.
§ Firmer prices for used cars which could lift gains from non-performing asset sales.
§ Government measures, under serious consideration, to boost vehicle sales.
Downside
§ Slow income growth forces Thais to lean towards more-affordable used cars, slowing down new-car sales.
§ Rate hikes will hurt profitability as hire-purchase loans are primarily fixed-rate assets.
§ Car manufacturers decide to provide direct financing, affecting TCAP’s market share.
32.4
22.214.6
13.2
10.27.5
%Market share (as of 3Q15)
TCAP
BAY
SCB
TISCO
KKP
KBANK
70
90
110
130
150
170
190
20.0
25.0
30.0
35.0
40.0
45.0
50.0
Dec-10 Dec-11 Dec-12 Dec-13 Dec-14
Thanachart Cap - (LHS, THB)
Thanachart Cap / MSCI AC Asia ex JP - (RHS, %)
-19.5
7.2
-80-60-40-20
020406080
100120
Jan-
13
Apr-
13
Jul-
13
Oct
-13
Jan-
14
Apr-
14
Jul-
14
Oct
-14
Jan-
15
Apr-
15
Jul-
15
Oct
-15
%YoY
Passenger cars
Commercial cars
1 2 3

January 3, 2016
Bank
s Th
aila
nd
Maria Lapiz [email protected] (66) 2257 0250
Krung Thai Bank (KTB TB)
Get in early
Outlook brightening as catalysts await Reiterate BUY. Catalysts (bigger role in the infrastructure investment and gains from Krisadanakorn asset sales) are coming to KTB. And the recent correction provides a great opportunity to accumulate the stock.
Prime beneficiary from upcoming govt investment KTB will play a more important role in facilitating and financing the government’s upcoming infrastructure investment and stimulus spending as Specialized Financial Institutions will fall under Bank of Thailand’s regulation (although they may remain under the radar for some time yet). Moreover, the government is trying to reduce its contingent liability, as suggested by its actions to fast-tack the Private-Public Partnership scheme. Therefore, KTB should be the top destination for the government in facilitating and financing the public spending.
Hidden gems await KTB Another significant catalyst is that the bank is likely to book gains from the liquidation of Krisadanakorn’s assets in the months ahead. KTB’s CEO expects the deal to be concluded in 1Q16 and the bank could gain in excess of THB10b (about one-third of FY16F provisions and net profit). If the deal is finalized, it will substantially reduce the need for the bank to make provisions to ramp up the coverage ratio, which had been damaged by the SSI (Sahaviriya Steel Industries) bad-debt fiasco.
BUY with TP THB19.30 It is too early determine the full impact from those two catalysts to KTB’s bottom line. But we believe when more details are released into the market (expected to happen within 1H16), the stock price will react suddenly and strongly. Thus, we believe the recent correction provides a great opportunity for medium-term investment. Upgrade to BUY from HOLD. For now, we maintain our GGM-based TP at THB19.30, pegged to FY16F 1.01x P/BV at 11.9% ROE.
Share Price THB 16.70
12m Price Target THB 19.30 (+16%)
Previous Price Target THB 19.30
BUY
Statistics52w high/low (THB)3m avg turnover (USDm)Free float (%)Issued shares (m)Market capitalisation
Major shareholders:55.1%5.2%5.0%
13,976
14.7
Financial Institutions Development Fund Thai NVDR State Street Bank Europe Limited
23.90/15.20
44.9
THB233.4BUSD6.5B
Price Performance
85
90
95
100
105
110
115
120
125
130
135
15.0
16.0
17.0
18.0
19.0
20.0
21.0
22.0
23.0
24.0
25.0
Jan-14 Apr-14 Jul-14 Oct-14 Jan-15 Apr-15 Jul-15 Oct-15
Krung Thai Bank - (LHS, THB)
Krung Thai Bank / Stock Exchange of Thai Index - (RHS, %)
-1M -3M -12MAbsolute (%) (2) (1) (26)
Relative to index (%) 3 4 (14)
Source: FactSet
FYE Dec (THB m) FY13A FY14A FY15E FY16E FY17E
Operating income 91,092 93,412 107,777 111,052 116,364Pre-provision profit 51,507 49,780 59,782 58,738 59,865Core net profit 34,512 33,196 27,619 30,348 34,810Core EPS (THB) 2.5 2.4 2.0 2.2 2.5Core EPS growth (%) 25.5 (3.8) (16.8) 9.9 14.7Net DPS (THB) 0.9 0.9 0.8 0.8 0.9Core P/E (x) 6.8 7.0 8.5 7.7 6.7P/BV (x) 1.1 1.0 0.9 0.9 0.8Net dividend yield (%) 5.3 5.4 4.5 4.9 5.6Book value (THB) 14.74 16.60 17.83 19.18 20.73ROAE (%) 17.7 15.2 11.5 11.7 12.5ROAA (%) 1.4 1.3 1.0 1.0 1.1Consensus net profit - - 28,475 31,282 35,766MKE vs. Consensus (%) - - (3.0) (3.0) (2.7)

January 3, 2016 153
Krung Thai Bank
Value Proposition
§ Thailand’s biggest commercial bank by assets. State owned, KTB has natural advantage to government-related funding, which comprises 6% of lending assets.
§ Captive customers in civil servants as their salary accounts are administrated by KTB; they are a large and stable source of deposits/lending. CASA at 59% (40% for industry).
§ Widest branch network facilitates access to provincial customers. But social and policy funding might have compromised efficiency/returns.
§ ROE/ROA lower than industry average. If it can fully realize its potential, the biggest bank could be far bigger.
CASA comparison (as of Dec14)
Source: Company
Price Drivers
Historic share price trend
Source: Company, Maybank Kim Eng
1. KTB announced a 4:1 rights offer at THB12.60/share to
fund fast-growing business expansion. 2. The bank failed to deliver high expectation due to
worse-than-expected credit quality, leading to larger provisions.
3. Concern mounted on deteriorating credit quality, led by the potential SSI default.
Financial Metrics
§ All eyes on credit costs. Oversized provisions, partly for SSI bad debt, could double in 15F. NPLs should remain elevated at 4.5% in 16F, 10bps down from 15F.
§ But positive about loan expansion (5% in 16F vs. 2% in 15F), solid NIM (2.93% next year vs. 2.99% this year) and lower credit cost (1.25% in 16F vs. 1.50% in 15F).
§ Bad-debt recovery, not included in our projections, could be a positive surprise next year as KTB is negotiating to sell a plot of land held as collateral for up to THB10b.
NPL and credit cost are factor to watch
Source: Company
Swing Factors
Upside
§ Bad debt recovered from the Krisadanakorn case could exceed THB10b, equivalent to one third of 16F provisions and net profit.
§ Upside risk on loans as KTB is now the last resort for the government to fund the stimuli, including infrastructure investment, as regulation of SFIs will come under the BOT.
Downside
§ Deterioration in credit quality due to weaker-than-expected economic recovery.
§ The government decides to transfer mediocre assets from the other agencies (such as the loans of civil servants/teachers) to the bank’s book.
§ Moral suasion by the government to embark on social or populist lending that does not meet credit standards.
64%59%
54%
46%42%
34%31%
13% 13%
10%
20%
30%
40%
50%
60%
70%
KBAN
K
KTB
BAY
SCB
BBL
TMB
TCAP
TISC
O
KKP
Sector average = 40%
90
110
130
150
170
190
210
230
250
12.0
14.0
16.0
18.0
20.0
22.0
24.0
26.0
28.0
Dec-10 Dec-11 Dec-12 Dec-13 Dec-14 Dec-15
Krung Thai Bank - (LHS, THB)
Krung Thai Bank / MSCI AC Asia ex JP - (RHS, %)
6.12%
4.51%
3.89%
3.30%2.88%
4.60% 4.50% 4.40%
0.00%
0.20%
0.40%
0.60%
0.80%
1.00%
1.20%
1.40%
1.60%
2.0%
2.5%
3.0%
3.5%
4.0%
4.5%
5.0%
5.5%
6.0%
6.5%
2010
2011
2012
2013
2014
2015
F
2016
F
2017
F
%%
NPL
Credit cost (RHS)
1
2 3

January 3, 2016
Hea
lth
Care
Th
aila
nd
Sittichai Duangrattanachaya [email protected] (66) 2658 6300 ext 1393
Bangkok Dusit Medical Svcs (BDMS TB)
Winner Takes All
More to come M&As and capacity expansion across the region could intensify competition. Thailand will not escape. We prefer BDMS because of its national network, diversification into hospital-related businesses and CLMV expansion that should support margin and net-profit growth. Maintain BUY with a DCF-based TP of THB22.50 (WACC 9.5%).
National network BDMS is the largest private-hospital operator in Thailand by patient service revenue, volume and capacity. It has 40 hospitals in Thailand and two in Cambodia under six brands. Such network strength and brand diversification should result in: i) less volatile volume growth; ii) the ability to share resources; and iii) improved efficiency from consistent standards. They could also create barriers to entry and bargaining power with suppliers and patients.
Most diversified hospital BDMS is investing more in related businesses such as central laboratories, IT services, pharmaceutical and saline manufacturing, insurance, catering and patient transportation. Revenue from these sources has been growing at a 3-year CAGR of 20% with 200bp higher EBITDA margins than hospital services. These ancillary businesses should become sources of strength during times of limited growth and intense competition in the hospital business.
CLMV expansion BDMS has a hospital in Cambodia. It is scrutinising the region, notably Myanmar and Laos, for opportunities. It is running feasibility studies on rules & regulations and payment systems in these countries. In the interim, BDMS will use its hospitals in border areas to service patients from CLMV.
Share Price THB 22.30
12m Price Target THB 22.50 (+1%)
Previous Price Target THB 22.50
BUY
Statistics52w high/low (THB)3m avg turnover (USDm)Free float (%)Issued shares (m)Market capitalisation
Major shareholders:19.7%6.7%6.5%
15,491
12.6
Dr. Prasert Prasatthongosoj Wichai Thongtang Bangkok Airways Co. Ltd.
22.30/17.80
46.4
THB345.4BUSD9.6B
Price Performance
90
110
130
150
170
190
210
230
10.0
12.0
14.0
16.0
18.0
20.0
22.0
24.0
Jan-14 Apr-14 Jul-14 Oct-14 Jan-15 Apr-15 Jul-15 Oct-15
Bangkok Dusit - (LHS, THB)
Bangkok Dusit / Stock Exchange of Thai Index - (RHS, %)
-1M -3M -12MAbsolute (%) 11 19 30
Relative to index (%) 17 25 51
Source: FactSet
FYE Dec (THB m) FY13A FY14A FY15E FY16E FY17E
Revenue 49,170 54,341 59,585 66,775 74,820EBITDA 10,914 12,872 13,618 15,433 18,103Core net profit 6,261 7,394 7,404 8,594 10,281Core EPS (THB) 0.40 0.48 0.48 0.55 0.66Core EPS growth (%) (20.4) 18.1 0.1 16.1 19.6Net DPS (THB) 0.02 0.24 0.24 0.28 0.33Core P/E (x) 55.2 46.7 46.7 40.2 33.6P/BV (x) 8.5 7.4 6.8 6.2 5.6Net dividend yield (%) 0.1 1.1 1.1 1.2 1.5ROAE (%) 16.2 16.9 15.2 16.2 17.6ROAA (%) 8.6 8.7 7.8 8.5 9.4EV/EBITDA (x) 18.6 22.9 27.6 24.4 20.7Net debt/equity (%) 45.6 55.7 54.7 51.2 42.7Consensus net profit - - 7,705 8,797 10,217MKE vs. Consensus (%) - - (3.9) (2.3) 0.6

January 3, 2016 155
Bangkok Dusit Medical Services
Value Proposition
§ Largest hospital chain in Thailand with 40% share of the market by revenue.
§ With six brands under its belt, 40 hospitals in Thailand and best-in-class facilities, BDMS appeals to price-insensitive premium customers.
§ Negative spread between ROIC and WACC does not reflect potential. In 2-3 years, 14 new hospitals would graduate from gestation and potentially enhance returns.
§ Strong operating cash flows of about THB2.6b a quarter should be able to support investments. Room to borrow THB50b.
WACC, ROIC and FCF
Source: Maybank Kim Eng
Price Drivers
Historical share price trend
Source: Company, Maybank Kim Eng
1. Investments in: i) Krungdhon, Paolo and Phayathai
Hospitals; and ii) ANB Laboratory (saline manufacturer). 2. Increased stake in Bumrungrad Hospital (BH TB) to 20.3%
from 6.3%. 3. EBITDA margins slipped to 20% (-350bps YoY) in 3Q15. Net
profit dropped 23% YoY from aggressive expansion. 4. Acquisition of: i) Sanamchan and Phuket international
hospitals; and ii) Save Drug Center (drugstore). 5. Bought 44.7% of General Hospital Products (saline
manufacturer) for THB350m.
Financial Metrics
§ Operating cash flow, core EBITDA and core profit grew by 5-year CAGRs of more than 20%.
§ FY16-17 EPS to be lifted by 300 beds in new facilities and 1,200 in existing facilities, from 5,500.
§ Strong balance sheet. Interest coverage of 12.1x in 3Q15, up from 11x in 2011-2013. Net gearing of 0.5x below covenant’s 1.75x.
§ Payouts in 2010-2014 averaged 46%. Operating cash flow, net profit and gearing
Source: Maybank Kim Eng
Swing Factors
Upside
§ Faster-than-expected ramp-up of new beds. § Six M&As and two greenfield projects in the pipeline. § Rising price intensity and case-mix index.
Downside
§ Regulatory risks for drug prices and size of medical bills. § Domestic economic slowdown could reduce cash patients
from middle class (~20% of EBITDA). § Delays in expansion.
0%
2%
4%
6%
8%
10%
12%
14%
-1,500
-1,000
-500
0
500
1,000
1,500
2,000
2,500
4Q05
2Q06
4Q06
2Q07
4Q07
2Q08
4Q08
2Q09
4Q09
2Q10
4Q10
2Q11
4Q11
2Q12
4Q12
2Q13
4Q13
2Q14
4Q14
2Q15
FCF (LHS) WACC ROIC
THBm
501502503504505506507508509501,050
2.04.06.08.0
10.012.014.016.018.020.022.0
Dec-10 Dec-11 Dec-12 Dec-13 Dec-14
Bangkok Dusit - (LHS, THB)
Bangkok Dusit / MSCI AC Asia ex JP - (RHS, %)
0.0
0.2
0.4
0.6
0.8
1.0
1.2
0
500
1,000
1,500
2,000
2,500
3,000
3,500
4,000
4Q05
2Q06
4Q06
2Q07
4Q07
2Q08
4Q08
2Q09
4Q09
2Q10
4Q10
2Q11
4Q11
2Q12
4Q12
2Q13
4Q13
2Q14
4Q14
2Q15
Cash flow from operation Core profit Net D/E
THBm
1
2 3
5
4

January 3, 2016
Oil
& G
as
Thai
land
Yupapan Polpornprasert [email protected] (66) 2658 6300 ext 1395
Bangchak Petroleum (BCP TB)
Year ahead: from dirt to heat
Ready for AEC battle Rising competition after commencement of the Asean Economic Community is unlikely to pose a huge threat to BCP given its business diversification. Its refining and marketing businesses should benefit from rising oil demand due to sustainably low oil prices. Meanwhile, its long-term strategy is to focus on expanding its renewable portfolio to 500MW (from 118MW) and utilizing its existing petrol stations by leasing out more retail space. Maintain SOTP TP of THB40, with catalysts anticipated from successful diversification.
Complementing core businesses BCP is a leading refiner in Thailand with a capacity of 120KBD. Its 1,061 petrol stations also make it the second-largest oil retailer in Thailand. Sustainably low oil prices and gas-price reforms have lifted local oil demand by 6% YTD vs a 4-year average of 2%; we expect further improvements. In response to refining’s cyclicality, the company is tapping the solar business. This now accounts for over 20% of its EBITDA. We see support from renewable energy during oil’s downcycle.
Renewable business: getting ready for take off BCP intends to rely on renewable energy as one of its long-term sources of growth. It recently restructured this business in preparation for a potential IPO to fund capacity expansion to 500MW from 118MW by 2020. The Thai government is promoting power generation from renewable energy, aiming to increase such contributions from 8% to 15-20% by 2036. We see opportunities for BCP.
Oil marketing: focus on high-margin non-oil business Given fierce competition among petrol stations, BCP aims to expand into higher-margin non-oil businesses. It is offering rental space, opening retail outlets like Inthanin Coffee shops and partnering Big C to operate convenience stores at its stations.
Share Price THB 33.00
12m Price Target THB 40.00 (+21%)
Previous Price Target THB 40.00
BUY
Company description
Statistics52w high/low (THB)3m avg turnover (USDm)Free float (%)Issued shares (m)Market capitalisation
Major shareholders:14.3%10.0%15.6%
1,377
2.4
BCP runs a leading refinery and is also the second-largest petro-station operator in Thailand.Renewable energy is its new growth area
Social Security Ministry of Finance Vayupak Fund
37.25/31.00
62.7
THB45.4BUSD1.3B
Price Performance
85
95
105
115
125
135
145
155
24.0
26.0
28.0
30.0
32.0
34.0
36.0
38.0
Jan-14 Apr-14 Jul-14 Oct-14 Jan-15 Apr-15 Jul-15 Oct-15
Bangchak Petroleum - (LHS, THB)
Bangchak Petroleum / Stock Exchange of Thai Index - (RHS, %)
-1M -3M -12MAbsolute (%) (6) (4) 4
Relative to index (%) (1) 1 21
Source: FactSet
FYE Dec (THB m) FY13A FY14A FY15E FY16E FY17E
Revenue 186,490 183,016 162,156 161,857 167,659EBITDA 10,377 4,252 12,745 13,692 15,107Core net profit 5,443 (46) 5,576 5,616 6,103Core EPS (THB) 3.95 (0.03) 4.05 4.08 4.43Core EPS growth (%) 71.1 nm nm 0.7 8.7Net DPS (THB) 1.35 1.00 1.69 1.63 1.77Core P/E (x) 8.3 (983.5) 8.1 8.1 7.4P/BV (x) 1.3 1.4 1.2 1.1 1.0Net dividend yield (%) 4.1 3.0 5.1 4.9 5.4ROAE (%) 16.3 (0.1) 15.7 14.3 14.2ROAA (%) 7.5 (0.1) 6.6 5.6 5.6EV/EBITDA (x) 5.2 15.8 5.8 6.1 5.3Net debt/equity (%) 42.2 67.9 74.4 90.8 74.2Consensus net profit - - 5,803 5,888 6,103MKE vs. Consensus (%) - - 0.0 (4.6) 0.0

January 3, 2016 157
Bangchak Petroleum
Value Proposition
§ Key player in the Thai energy sector, especially in refinery and petrol stations. BCP is making a big push into renewable energy.
§ Returns from the refinery business are cyclical, contingent on GRM and dominate the return profile. Of concern is longer cycle RoIC has been lower than the WACC.
§ However, overtime, its return profile should be enhanced by upgrading of its refineries, investments in renewable energy and expansion of the retail business.
BCP's ROIC over WACC spreads vs Singapore complex GRM
Source: Bloomberg
Price Drivers
Historical price trend
Source: Company, Maybank Kim Eng
1. Flooding in Oct’11 delayed start-up of solar farm phase 1
which dampened the share price. 2. Stock rallied on anticipation of commencement of solar
farm phase 1 in Apr’12. 3. Stock rallied due to announcement of refinery upgrade
after the explosion on July ’12. Another catalyst was expectation of commencement of solar farm phase 2&3.
4. Oil price plunged and rumour that PTT would sell its stake created an overhang on the stock.
Financial Metrics
§ GRM is the key metric to watch as refinery makes up >50% of EBITDA. Expect GRM to remain strong with favourable demand-supply landscape.
§ FY16F EBITDA to rise 8% YoY. EBITDA upside potential from additional renewable capacity.
§ Total capex of up to THB90b over the next five years. 56% of total capex will be invested in new businesses. This includes renewable, E&P and biofuel.
§ Healthy financial position and on-going EBITDA generation needed to fund its aggressive investment plan.
EBITDA by business trend
Source: Company
Swing Factors
Upside
§ Required by law to keep 30 days of crude inventory. So, sudden rise in oil price would lead to stock gain. This is a non-cash item but has big impact on earnings/sentiment.
§ M&A and investment opportunities. § Successful IPO of its renewable business.
Downside
§ Plunge in crude oil price would lead to one-off stock losses and would create overhang on the stock.
§ Value-destroying acquisitions and investments that would alter its long-term business prospects.
§ Economic downturn, which would reduce oil demand and consequently pressure product prices and margins.
80
120
160
200
240
280
15.0
20.0
25.0
30.0
35.0
40.0
Dec-10 Dec-11 Dec-12 Dec-13 Dec-14
Bangchak Petroleum - (LHS, THB)
Bangchak Petroleum / MSCI AC Asia ex JP - (RHS, %)
1 2
3
4

January 3, 2016
Cons
truc
tion
Th
aila
nd
Maria Lapiz [email protected] (66) 2257 0250
CH. Karnchang (CK TB)
Best bet with cushion
Top play on the Thai Infra story On the belief that the roll-out of some infrastructure projects will be accelerated in 2016 and with investor friendly PPP framework plus new funding schemes via Infra Fund, we pick CK as our top infrastructure play. As a Tier 1 qualified civil contractor with a strong balance sheet, it can undertake sizable contracts, either on a turnkey or subcontract basis. Share prices of Contractor companies are very much news flow-driven, and in this regard we anticipate a very positive backdrop, at least in 1H16.
CK has the size CK has the resources and the balance sheet to underwrite sizable contracts. With an outstanding YE backlog of c. THB100b, spanning 3-4 years of implementation, it can accommodate more projects, extending revenue visibility to as far as five years from three years currently.
Investments also its growth avenue CK’s investments in utilities/infrastructure operating companies: Bangkok Mass Transit (BMCL), Bangkok Expressway (BECL), Thai Tap Water (TTW), CK Power (CKP) are also in an expansionary mode. In fact, the amalgamation of BMCL and BECL into BEM was designed to gain greater financial flexibility to pursue more operating/concession contracts.
Operating downside is well-supported While we believe that 2016 will be the Year of Investment for Thailand and that news flow and the new order pipeline will be positive, we cannot rule out risk of delays. That said, CK is well-cushioned to this downside given expansion plans of its subsidiaries and affiliates.
Share Price THB 29.00
12m Price Target THB 33.50 (+16%)
Previous Price Target THB 33.50
BUY
Company description
Statistics52w high/low (THB)3m avg turnover (USDm)Free float (%)Issued shares (m)Market capitalisation
Major shareholders:36.0%2.3%1.2%
1,694
5.3
CH. Karnchang is a Tier 1 civil contractor & is amongthe largest. It also has stakes in utilities/infracompanies such as BMCL, BECL, TTW, CKP.
TRIVISVAVET FAMILY Bangkok Bank Public Co. Ltd. Kasikorn Asset Management Co., Ltd.
29.50/23.60
56.8
THB49.1BUSD1.4B
Price Performance
80
100
120
140
160
180
200
220
240
260
12.0
14.0
16.0
18.0
20.0
22.0
24.0
26.0
28.0
30.0
Jan-14 Apr-14 Jul-14 Oct-14 Jan-15 Apr-15 Jul-15 Oct-15
CH. Karnchang - (LHS, THB)
CH. Karnchang / Stock Exchange of Thai Index - (RHS, %)
-1M -3M -12MAbsolute (%) 5 8 15
Relative to index (%) 10 14 34
Source: FactSet
FYE Dec (THB m) FY13A FY14A FY15E FY16E FY17E
Revenue 32,788 32,951 34,241 34,991 36,040EBITDA 3,642 3,749 4,031 4,227 4,476Core net profit 1,063 992 1,276 1,447 1,501Core EPS (THB) 0.64 0.59 0.75 0.85 0.89Core EPS growth (%) 1,732.9 (8.9) 28.6 13.4 3.7Net DPS (THB) 0.23 0.23 0.30 0.34 0.35Core P/E (x) 45.1 49.5 38.5 33.9 32.7P/BV (x) 2.9 2.6 2.5 2.3 2.2Net dividend yield (%) 0.8 0.8 1.0 1.2 1.2ROAE (%) 8.6 5.6 6.5 7.1 7.0ROAA (%) 1.7 1.3 1.6 1.8 1.8EV/EBITDA (x) 18.3 23.6 23.8 22.7 21.5Net debt/equity (%) 250.1 237.6 231.0 221.7 213.6Consensus net profit - - 2,572 1,355 1,575MKE vs. Consensus (%) - - (50.4) 6.8 (4.7)

January 3, 2016 159
CH. Karnchang
Value Proposition
§ CK is a Tier 1 civil contractor mainly involved in government contracts.
§ Thailand has not had an infra push since the 1990s, which led CK to diversify into utilities and other infrastructure related companies.
§ With higher government infrastructure spending, CK should be actively engaged. Expect a build-up of the orderbook and participation via the investment portfolio.
§ Poor history of value creation, but with investments approaching maturity, investment gains and dividends may augment construction cashflow pushing EVA spread higher.
EVA spread trending higher: healthy orderbook, investments
Source: Bloomberg
Price Drivers
Chart Header
Source: Company, Maybank Kim Eng
1. Share price appreciated in 2012 on the news that the
THB2.5 trillion Infrastructure Plan will be rolled out during the next ten years. Share price recovery into 2014 was related to the announced commitment of the Military Government to continue with infrastructure implementation plan.
2. The collapse in the share price was due to political instability that could have delayed the planned implementation.
Financial Metrics
§ Outlook on the orderbook – pipeline is the driver. This makes the stock highly news flow driven.
§ Outstanding order backlog is a secondary variable influencing the share price, but it is not a strong driver.
§ CK’s revenue generation lept to a new high post 2010, thanks to the expansion of subsidiaries and affiliates. At that time, workflow from government projects was low with average Gov’t capex to GDP at 3.6%.
§ Going forward, CK will experience a rising orderbook that should boost revenue levels as Gov’t capex to GDP ratio rises to as high as 5.7% to GDP, based on our estimates.
§ Under a benign outlook in materials prices, targeted GM at 8-10% bids are likely to be realised, allowing overall GPM to remain healthy at 10%, as per our forecast.
Baseline view: high revenues, healthy GPM
Source: MKE-ISR
Swing Factors
Upside
§ New contracts – 186 km dual tracking of the railway supported the recent share price rally.
§ Baseline expectation is that CK wins 25% of the total amount of projects put on fast track roll-out.
Downside
§ Political instability that can impair the capacity of the current government to rollout projects.
§ Major spike in raw material prices will cast a negative overhang on profitability – not our base case scenario.
(20)
(15)
(10)
(5)
0
5
10
06 07 08 09 10 11 12 13 14 15 16
EVA Spread ROIC
50
150
250
350
450
550
5.0
10.0
15.0
20.0
25.0
30.0
Jan-11 Jan-12 Jan-13 Jan-14 Jan-15
CH. Karnchang - (LHS, THB)
CH. Karnchang / MSCI AC Asia ex JP - (RHS, %)
1
2
1

This page has been left blank intentionally

January 3, 2016 161

January 3, 2016
STRA
TEG
Y Vi
etna
m
SEE PAGE X FOR IMPORTANT DISCLOSURES AND ANALYST CERTIFICATIONS
Vietnam’s Three-for-16
Improving Competitive Landscape
Sustaining stronger growth momentum Vietnam’s six-year high GDP growth of 6.88% in 2015 was undoubteldly the direct result of the ‘hard-regained’ macro stability achieved over the past three years and more importanlty, the unprecedented level of institutional reform since the opening up of the country in 1986. Reforms of SOEs, the financial sector and public spending have likewise contributed to Vietnam’s ultra-high growth. Market-wise, 2016 is likely to be another exciting year. This is due to a shortened settlement cycle, the launch of derivatives, further progress on lifting foreign ownership limits, a large pipeline of IPOs, more stringent disclosure requirements and a potential introduction of intraday trading.
New era of rising infrastructure development Despite maintaining a high ~9% infrastructure investment/GDP ratio to support rapid growth in 1995-2010, infrastructure in Vietnam is still inadequate to meet strong FDI into the country and domestic demand. Infrastructure investment in 2016-20 is estimated to double compared with that of 2011-15. We like HPG Steel (BUY, VND41,900), the largest manufacturer of steel in Vietnam. HPG has expanded its market share by 2.5x due to new capacity, ultra-modern steel plants and industry consolidation. Additional capacity from phase 3 of the complex in 2016 will help HPG to capitalize on rising demand for steel and to further increase market share.
TPP – biggest beneficiary among membership countries The World Bank estimates the Trans-Pacific Partnership (TPP) agreement could add 8% to Vietnam’s GDP and 17% to its real exports over the next 20 years. An indirect beneficiary of rising FDI and manufacturing activities is Coteccons (CTD VN, BUY, VND173,000). CTD is a well-known constructor of high-quality residential and industrial buildings. Many garment and textile companies have selected CTD as their contractors, including Texhong, Tainan Spinning, Brotex and Nameson Group etc. Textile and garment producers are also beneficiaries of the TPP, as the duty on Vietnam’s textile imports to the US will be cut to 0% from 17%.
2016 – a year of IPOs and new listings Around 400 companies have listed in Vietnam between 2011 and 2015, meeting more than 70% of the plan. 2016 could be another remarkable year as the rest will be listed. Also, importantly the government will further divest in companies it had partially sold but still maintains control or influence in. We expect 45% of VNM (VNM, BUY, VND146,500) to be sold, giving investors more opportunities to participate in one of the most successful SOEs as the company operates efficiently and has expanded strongly after being equitized.
Vietnam economy – 2016 forecasts Population (m people) 91 Nominal GPD (USDb) 200 Real GDP growth (%YoY) 6.7 CPI (%YoY) 2.0 Real retail sales (%YoY) 9.0 VND/USD (%YoY) -3.0 Current account (% of GDP) -0.3 BoP surplus (% of GDP) 3.0 Foreign reserves (USDb) 40.0 Fiscal deficit (% of GDP) 5.4
Source: MKE
Vietnam market – 2016 forecasts Market cap (USDb), year-end 58 VN-Index, year-end 670 VN-Index (% YoY) +15.7 ADTV (USDm, 2 bourses) 180 2016 P/E, year-end 13.5 2015 EPS growth (% YoY) 12.5 2016 EPS growth (% YoY) (MKE coverage)
11.8
Source: MKE, EPS growth and P/E based on top 60 companies
Institutional research (84) 8 4 555 8888 [email protected]

January 3, 2016 163
Vietnam’s Three-for-16
1. New era of infrastructure development
1.1 Why now? Vietnam’s under-developed infrastructure, both in terms of physical infrastructure and administrative procedures (or the so-called ‘soft infrastructure), has often topped the list of factors deterring private investors from further investing in the country despite lower labour costs and a relatively more stable political regime. Inadequate roads and ports, coupled by lengthy administrative procedures and ambiguous regulations have been widely cited as major problems with doing business in Vietnam.
Fig 1: Key problems cited by foreign co’s of doing business in Vietnam
% correspondents Manufacturing firms Underdeveloped infrastructure 69.2% Troublesome and complicated administrative procedures 50.0% Under-developed economic and legal systems and arbitrary legal management and application 46.2% Uncertain and unclear policy management of local governments 38.5% Troublesome and complicated tax practices 23.1% Non-manufacturing firms Under-developed infrastructure 76.9% Insufficient office space and rent increases 69.2% Under-developed economic and legal systems and arbitrary legal management and application 57.7% Troublesome and complicated administrative procedures 46.2% Uncertain and unclear policy management of local governments 42.3%
Source: Japanese External Trade Organization, 2007 Survey
Recognizing this, the government has made improving infrastructure its top priority, along with attempts to regain macro stability as the country had undergone a period of high inflation between 2008-11. Over the past three years, Vietnam has achieved the most improvement under the World Economic Forum’s competitiveness index, moving up 19 positions to 56 in the latest 2015-16 ranking out of 144 countries. About two-thirds of this was gained over the past 12 months.
Fig 2: Vietnam’s competitiveness index has improved the most
Source: WEF. The lower the score, the more competitive the country is
Despite the improved competitiveness, which has been more driven by macro stability, Vietnam’s infrastructure remains poor, ranking it only above the Philippines when compared to the so-called ASEAN-4, which also comprises of Malaysia, Thailand and Indonesia.

January 3, 2016 164
Vietnam’s Three-for-16
Fig 3: Still a long way to catch up with neibouring countries in terms of hard infrastructure
Source: WEF. The lower the score, the more competitive the country is
Vietnam appears to be more positive when it comes to the so-called ‘soft infrastructure’, which is measured by Ease of Doing business, as ranked by the World Bank. Vietnam improved to 90th position out of 185 countries and regions in World Bank Doing Business 2016 with a score of 62.1, higher than that of the Philippines (60.1) and Indonesia (58.1). This is however still below the average of 67.2 for the ASEAN-4.
Fig 4: Vietnam still lags ASEAN-4 in terms of ‘Ease of Doing Business’
Source: World Bank Doing Business 2016
1.2 Record-high infrastructure investment in 2016-20 The government has demonstrated its determination to further improve the country’s competitiveness through resolution 19/NQ-CP/2015. The resolution aims to reduce the bureaucracy for starting a business in Vietnam, simplifying the procedure for securing contruction permits,

January 3, 2016 165
Vietnam’s Three-for-16
further lowering tax payment periods and rapidly shortening the processing time for clearing exports and imports of goods. The government expects to close the gap with the ASEAN-4 in terms of ‘Ease of Doing Business’ by the end of 2016, which is also crucial to Vietnam’s sucessful transition in the context of the ASEAN Economic Community.
For hard infrastructure it is more difficult given the huge capital needed to be poured in to compete with Malaysia, Thailand and Indonesia, and in order to fully unleash Vietnam’s potential from existing as well as upcoming free trade agreements, including the Vietnam–Korea FTA (effective from 20 Dec 2015), the Vietnam–EU FTA (effective from Jan 2018) and the TPP (which was concluded on 4 Oct 2015).
According to the Ministry of Investment and Planning, total investment in infrastructure during 2000-10 was USD80b, or about 9% of GDP. It has slowed down due to the low efficiency of infrastructure projects undertaken by the public sector, and the lack of legal frameworks to encourage private investors to participate. This will change over the next five years after regulations, including a decree on public private partnerships (PPP), have been amended and major projects resume to meet economic demand.
Fig 5: High infrastructure development to meet economic growth
Source: Ministry of Investment and Planning, World Bank and others
The biggest investments will be in transportation and utilities, including new and upgraded airports, railways and ports, new refineries (Vietnam currently has only one refinery, which meets less than one-third of local demand for refined oil), and energy and power plants. Among these, power plants are the most urgent due to imminent electricity shortages as construction of most of the large thermal plants, particularly in the southern region, have been delayed over the past five years.
1.3 Public-private partnership (PPP), a new boost to infrastructure developments The Public Investment Law, the first-ever in Vietnam, was passed on 18 Jun 2014, and it became effective from 1 Jan 2015. The law is promulgated to improve the efficiency, publicity and transparency of planning and execution of public investments. It was later followed by Decree 15, calling for Public Private Partnerships (PPP) in infrastructure

January 3, 2016 166
Vietnam’s Three-for-16
projects, which took effect from 10 Apr 2015. Both regulations are central to Vietnam’s attempt to close the infrastructure gap that has been held back by rapid economic growth and further challenged when Vietnam became a ‘middle-income’ country from 2014, aka fewer soft loans from foreign governments. Out of the USD100b required for infrastructure development, only half can be met by the State budget and other forms of official development assistance. The law on public investment seeks to define the scope and approach of government-financed projects while the PPP decree aims to provide a framework enabling private companies to invest in public projects. PPP certainly is also expected to reduce the burden on the widening fiscal deficit and ultimately to improve efficiency of infrastructure projects.
Decree 15 is said to have plugged several shortfalls previous regulations failed to address, such as more investment types (Build-Transfer-Lease, Build-Lease-Transfer, Build-Operation-Transfer vs. only Build-Transfer), widened scope of projects to include telecom and technology etc., specified eligibility requirements, process, PPP contracts, transfering entirely or partially PPP projects (allowing for securization of PPP projects), use of foreign law (vs Vietnamese law only) for foreign investors, collaterals, project finalization (within 06 months vs. years that has been taken for projects used by public budget) and identified roles & responsibilities of private partners vs. the State in PPP projects.
Fig 6: Key infrastructure projects in 2016-20
Name Type USDb Long Thanh airport Airport 16 Block B - O mon Natural gas 10 Nghisơn refinery Refinery 10 Long Sơn refinery Refinery 4.5 New railway, Hanoi - Vinh Railway 10.2 New railway, Hochiminh - NhaTrang Railway 9.9 1st 5 Metrolines in Hanoi and Hochiminh Railway 3.9 CaiMep cluster deep seaport Sea port 3 LachHuyen cluster deep seaport Sea port 1.5 VungAng 2 Power 2 Hai Duong Power 2 Nam Dinh 1 Power 2 Van Phong Power 2 Vinh Tan 3 Power 2 DuyenHai 2 Power 2 Quang Tri Power 2 Dung Quat Power 2 Long Phu 2 Power 2 Sub-total 87
Source: various

January 3, 2016 167
Vietnam’s Three-for-16
2. TPP – the biggest beneficiary among membership countries
The TPP was finally concluded in early Oct ‘15 after more than five years of negotiations. The combined GDP of the TPP market is around USD28t per year, or 36% of the world’s GDP and over a quarter of world trade. Vietnam’s participation from the earlier days of the pact is in line with its determination towards global integration, wider trade openess following its already major trade liberalization efforts over the past two decades. The TPP, together with other FTAs that Vietnam has signed (such as with the EU and Korea) will further create trade diversion as Vietnam’s exports are expected to replace an increasing share of Chinese exports to the US and Japan, a trend already started even before the TPP conclusion.
Fig 7: Vietnam’s greater trade openess with major economies
Source: various
Our discussions with Baker & McKenzie (Vietnam) indicate that, on balance, the more trade agreements there are, the better for Vietnam. In other words, these trade agreements do not necessarily compete with one another. We have indeed observed unrivalled robust export performance as a result of multi FTAs and BTAs. Export growth averaged nearly 20% in 10 years leading to 2014 before slowing down amid slower global trade but still much higher than regional peers. The requirements of origin in both TPP and FTA with the EU will enhance the domestic supply chain while stimulating domestic private firms to integrate more into global value chains, further boosting value-added exports.
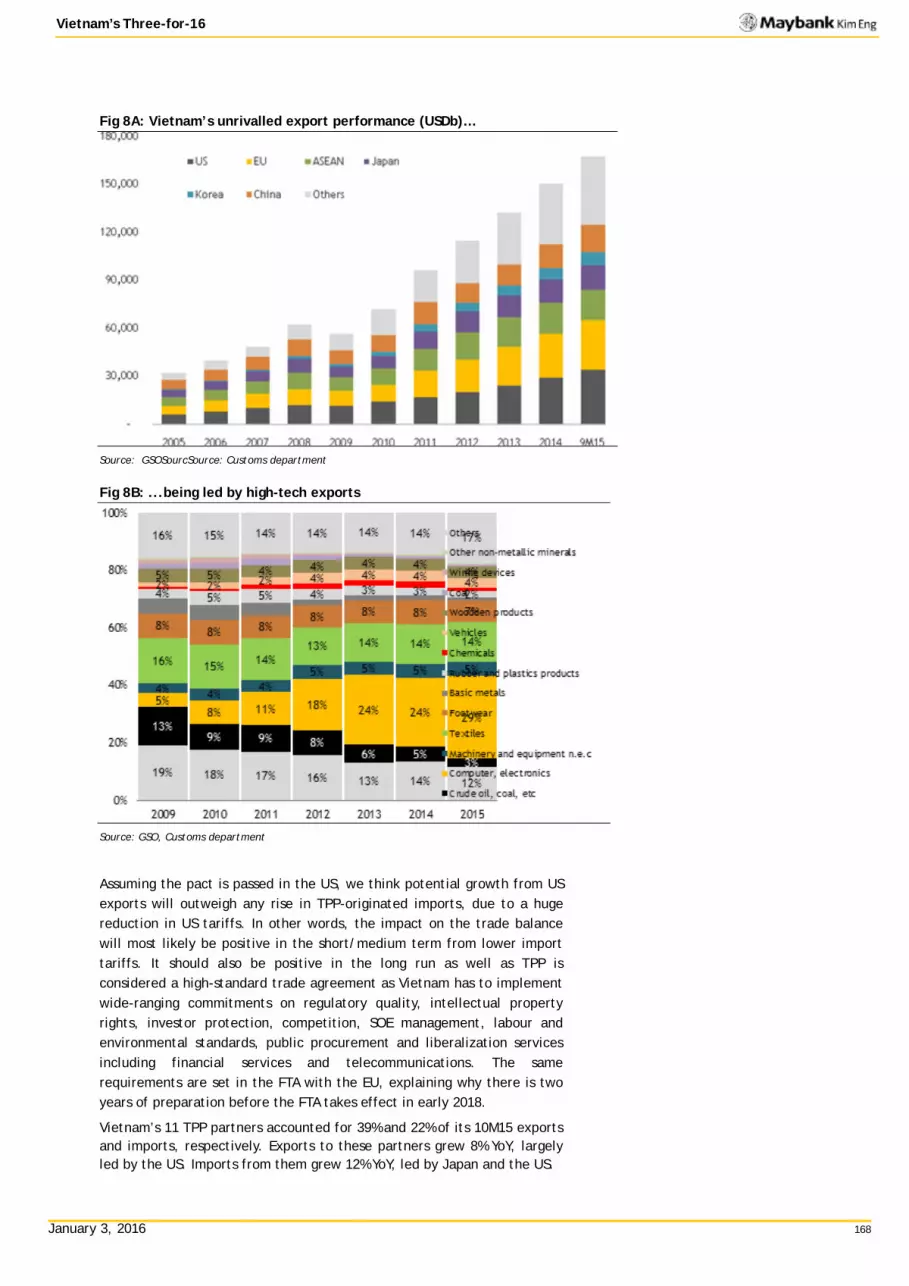
January 3, 2016 168
Vietnam’s Three-for-16
Fig 8A: Vietnam’s unrivalled export performance (USDb)…
Source: GSOSourcSource: Customs department
Fig 8B: ...being led by high-tech exports
Source: GSO, Customs department
Assuming the pact is passed in the US, we think potential growth from US exports will outweigh any rise in TPP-originated imports, due to a huge reduction in US tariffs. In other words, the impact on the trade balance will most likely be positive in the short/medium term from lower import tariffs. It should also be positive in the long run as well as TPP is considered a high-standard trade agreement as Vietnam has to implement wide-ranging commitments on regulatory quality, intellectual property rights, investor protection, competition, SOE management, labour and environmental standards, public procurement and liberalization services including financial services and telecommunications. The same requirements are set in the FTA with the EU, explaining why there is two years of preparation before the FTA takes effect in early 2018.
Vietnam’s 11 TPP partners accounted for 39% and 22% of its 10M15 exports and imports, respectively. Exports to these partners grew 8% YoY, largely led by the US. Imports from them grew 12% YoY, led by Japan and the US.

January 3, 2016 169
Vietnam’s Three-for-16
Fig 9: Vietnam's trade with TPP partners
Source: GSO, Vietnam Customs, Maybank KE
We think investors looking for potential TPP beneficiaries should focus on US-bound exporters or those providing support such as industrial-estate (KBC VN) or logistics operators (GMD VN), due to the following:
§ Vietnam’s trade surplus with the 11 TPP partners has essentially been the result of its trade surplus with the US only.
§ The US is Vietnam’s No. 1 export destination, accounting for 21% of its export value and 40% of its YoY export growth in 10M15.
§ The US is said to be the world’s most protectionist country. This should make it a primary point of focus, more so than any other country, once a “free-trade” pact such as the TPP lowers trade barriers.
§ Export growth has also been strong in other American markets such as Canada, Mexico and Chile. However, Vietnam’s export mix to these countries mirrors its mix to the US.
We do not rule out that exporters to other countries may benefit, such as the Hoa Sen Group (HSG VN). Hoa Sen faces as high as 25% tariffs in Mexico. Nevertheless, we believe that US-bound exporters will stand to benefit more over the longer term, given the size of the US market. With the US in mind, we look closely at the import tariffs imposed by the US on different countries and products, using data from the US International Trade Commission. Vietnam appears to be able to reap the most from lower trade barriers in the US.

January 3, 2016 170
Vietnam’s Three-for-16
Fig 10: US import duties paid by other TPP countries, 10M15
Source: US International Trade Commission, US Department of Commerce
We combed through 10M15 data and screened for Vietnamese export products to the US that have grown ≥5% YoY and pay average duties of ≥5%.
Fig 11: Vietnam's key exports to the US (YoY growth ≥5%, average duties ≥5%)
Product Group NAICS Code
10M15 CIF
Import (USDm)
10M15 CIF
Import
Average Effective
Duties Rate (%)
(% YoY)
Food & Kindred Products
Soybean Oil And By-Products 311222 0.02 44.40% 5.90%
Frozen Fruits, Juices And Vegetables 311411 4.67 43.90% 9.09%
Dried And Dehydrated Foods 311423 0.56 38.30% 7.58%
Seafood Products, Prepared, Canned And Packaged 311711 177.66 10.90% 5.34%
Prepared Flour Mixes And Dough 311822 0.08 23.70% 9.12%
Flavoring Extracts & Syrups 311930 0.05 58.90% 5.70%
Textiles & Fabrics
Narrow Fabrics 313221 7.45 17.70% 5.13%
Knit Fabrics And Lace 313249 4.70 13.30% 8.14%
Textile Mill Products
Curtains And Linens 31412 19.87 22.00% 6.36%
Other Household Textile Products 314129 17.58 26.50% 5.89%
Ropes, Cordage, And Twine 314991 10.59 25.90% 6.45%
All Other Miscellaneous Textile Products 314999 36.60 8.70% 6.05%
Apparel & Accessories
Hosiery And Socks 31511X 13.88 24.40% 13.01%
Men's And Boys' Apparel 31522 3231.98 14.40% 17.90%
Women's And Girls' Apparel 31523 5567.96 12.80% 18.50%
Infants' Apparel 315291 195.32 16.60% 12.43%
Hats And Cap 315991 148.81 25.20% 7.24%
Gloves & Mittens 315992 62.14 15.50% 11.69%
Leather & Allied
Products
Footwear 31621 3780.54 23.40% 12.75% Luggage 316991 584.42 5.40% 13.10%
Women's Handbags And Purses 316992 214.70 33.30% 10.96%
Personal Leather Goods (Except Women's Handbags And Purses) 316993 73.80 33.90% 6.68%
Chemicals Pesticides And Other Agricultural Chemicals 325320 1.97 4901.50% 6.14%
Inorganic Dyes And Pigments 325131 9.64 1.10% 5.77%
Others
Glass Products, Nesoi 327215 18.87 21.09% 5.49%
Ball And Roller Bearings 332991 8.37 9.40% 7.64%
Automatic Environmental Controls For Residential, Commercial, And Appliance Use 334512 1.74 783.20% 11.47%
Silverware, Platedware And Hollowware 339912 57.38 47.10% 6.79%
Costume Jewelry And Novelties 339914 30.01 56.30% 9.59%
* Products with 10M15 exports exceeding USD100m are highlighted in bold Source: US International Trade Commission, US Department of Commerce
By widening the screen to products with 2-5% duties, maintaining our ≥5% YoY growth criterion, about 30 additional product groups would be

January 3, 2016 171
Vietnam’s Three-for-16
included, including tyres (CSM VN, BUY, VND30,000), lighting fixtures (DQC VN, Not Rated), batteries (PAC VN, Not rated) and wood products (TTF VN, Not Rated and GDT VN, Not Rated).
A look at imported textiles and apparel products (NAICS 313-315) from TPP countries into the US suggests that:
§ Vietnam is the largest exporter of such products to the US among TPP countries, with 8M15 CIF imports of USD7.6b, followed by Mexico (USD3.6b), Canada (USD1.2b), Peru (USD0.4b), Malaysia (USD0.4b) and Japan (USD0.4b).
§ Mexico’s, Canada’s or Peru’s textiles and apparel do not seem poised to benefit from TPP as they are already paying fairly low tariffs of c.0.6%. For them, their US market has been growing in low single digits or even contracted.
Fig 12: US textile & apparel imports from Vietnam, Malaysia andJapan, 10M15
Product Vietnam Malaysia Japan
CIF Import
(USDm) % YoY % Duties
CIF Import
(USDm) % YoY % Duties
CIF Import
(USDm) % YoY % Duties
Text
iles
& F
abri
cs
Yarns 6.31 -52.70% 8.92% 0.0 7.79% 2.54 -11.70% 4.55% Threads 0.30 6.20% 10.92% 0.0 62.30% 9.42% 3.71 22.30% 9.29% Broadwoven fabrics 19.51 13.90% 1.64% 6.3 -7.60% 13.18% 107.14 4.70% 8.58% Narrow fabrics 7.45 17.70% 5.13% 0.7 26.60% 4.37% 34.95 -7.10% 5.21% Nonwoven fabrics 0.34 -4.00% 0.27% 3.2 388.20% 0.00% 56.05 -5.20% 0.23% Knit fabrics and lace 4.70 13.10% 9.59% 0.0 143.30% 9.98% 17.91 -0.70% 8.75% Textile and fabric finishing mill products 0.2 -7.30% 3.73% 0.16 62.70% 4.79% Coated fabrics 20.17 7.80% 3.52% 0.0 -72.40% 1.98% 134.97 7.00% 3.84%
Text
ile M
ill P
rodu
cts
Carpets & rugs 0.34 -42.90% 3.00% 1.5 234.10% 0.02% 1.24 -25.70% 5.21% Curtains and draperies 2.29 -4.00% 9.96% 9.7 43.60% 10.84% 0.22 73.30% 10.30% Other household textile products 17.58 26.50% 5.89% 0.2 5.50% 5.33% 5.91 -4.60% 6.51% Textile bags and canvas 23.14 5.20% 7.75% Textile sacks and bags 14.21 -21.20% 7.78% 0.0 180.60% 3.56% 0.20 -68.70% 7.07% Canvas and related products 19.16 39.80% 2.22% 1.7 21.90% 0.20% 0.07 6.60% 5.98% Ropes, cordage, and twine 10.59 25.90% 6.45% 1.9 -39.80% 3.74% 6.75 11.90% 6.38% Tyre cords and tyre fabrics 241.97 -0.60% 3.49% -1 11.80 -23.30% 3.55% All other miscellaneous textile products 36.60 8.70% 6.05% 3.9 -0.40% 5.41% 27.13 -1.10% 3.70%
Appa
rel
& A
cces
sori
es
Hosiery and socks 13.88 24.40% 13.01% 0.1 -35.60% 13.93% 1.92 17.10% 13.37% Men's and boys' cut and sew apparel 0.25 5.87% 0.01 5.88% Men's and boys' underwear and nightwear 404.35 14.20% 8.63% 2.8 -26.60% 11.38% 0.79 49.70% 16.54% Men's and boys' suits, coats, and overcoats 171.51 28.00% 19.34% 0.4 37.90% 14.24% 4.26 45.30% 15.49% Men's and boys' shirts (except work shirt) 1103.22 14.40% 20.85% 176.9 -4.00% 19.05% 7.25 54.20% 17.50% Men's and boys' trousers, slacks and jeans 535.60 9.40% 18.39% 65.8 49.70% 18.19% 6.36 37.80% 16.13% Men's and boys' other outerwear 1017.05 15.20% 17.90% 43.8 0.90% 23.65% 3.42 85.80% 15.23% Women's and girls' lingerie, loungewear and nightwear 323.46 10.30% 11.83% 32.0 28.60% 12.22% 0.79 5.60% 14.14% women's and girls' blouses and shirts 1570.28 5.40% 18.28% 74.4 -2.80% 19.34% 4.83 13.90% 17.28% Women's and girls' dresses 618.30 9.80% 13.85% 4.9 -26.10% 13.52% 2.68 21.30% 12.30% Women's and girls' suits, coats, tailored jackets, and skirts 604.94 2.90% 17.67% 7.8 -5.40% 16.49% 5.05 17.00% 16.35% Women's and girls' other outerwear 2450.98 22.30% 20.90% 42.6 2.00% 21.69% 5.00 -28.70% 16.59% Women's girls' and infants' cut and sew apparel 0.19 5.82% 0.02 5.79% Infants' apparel 195.32 16.60% 12.43% 7.6 -16.30% 13.83% 0.11 81.90% 12.33%
Fur and leather apparel 13.01 -21.00% 4.42% 0.0 7196.00% 5.88% 0.74 1.40% 5.50%
Hats and caps 148.81 25.20% 7.24% 0.1 36.30% 7.57% 0.53 6.80% 7.24% Gloves & mittens 62.14 15.50% 11.69% 29.4 9.10% 9.11% 1.25 56.80% 11.37% Men's and boys’ neckwear 0.90 -6.00% 13.54% 0.10 -21.20% 6.51% Other apparel accessories 69.33 37.60% 3.05% 3.1 24.70% 3.92% 4.07 -5.80% 5.21%
Source: US International Trade Commission, US Department of Commerce
§ Tariffs for remaining TPP countries are generally high in the high-value-added apparel category (e.g men’s and women’s clothing). However, their US market is very small.
This would leave Malaysia and Japan as the two most likely rivals to Vietnam when it comes to grabbing textile market share in the US. Figure 12 suggests that finished clothing could be the segment with the biggest potential for Vietnam, considering its market share, growth momentum and potential tariff cuts. Thanh Cong Textile (TCM VN, Not

January 3, 2016 172
Vietnam’s Three-for-16
Rated) is already exporting finished clothing such as T-shirts to US retailers such as Costco and JC Penney. In our view, it will likely comply with the “yarn forward” rule.
Other concerns regarding TPP While we are generally bullish on TPP and agree that the overall income gains would be the highest for Vietnam, we caution that:
§ Economic impact from TPP would be broad-based. To join TPP, Vietnam would have to liberalise and modernise many aspects of its economy, from reducing SOE dominance to upholding tighter intellectual-property standards. As such, stocks that appear to be TPP beneficiaries may not necessarily be straightforward BUYs, as Vietnam is required to level the playing field on a widespread scale.
In other words, if Vietnamese exporters enjoy freer trade, other FDI businesses will also have better access to Vietnam’s competitive cost base and compete for the same TPP opportunities. This could, for example, make it easier for foreign textile/fabric companies to access the US market, provided they comply with the yarn-forward rule. Some are already present in Vietnam such as Shenzhou, Eclat and Texhong.
§ More imports will compete with domestic production. Besides opening up its attractive labour market to FDI competition, Vietnam’s imports will increase, from consumption goods such as food to services such as banking. These will fiercely compete with domestic production. As Vietnam’s supply chain becomes more integrated into the world economy, domestic suppliers will also face increased pressure.
Distributors of TPP-originated imports such as Japanese cars may appear to be beneficiaries, as lower tariffs under the TPP will spur consumption. However, their competitive advantages may not be sustainable as entry barriers for distributors under the TPP seem low.
§ Political risks from the US are considerable. Even if it is possible for fewer than 12 members to carry on with the pact, as long as their total GDP surpasses a certain threshold, the size of the US market alone makes it the most important country for an agreement. Any unfavourable voting by Congress, which could be influenced by presidential prospects, may derail the TPP. At this stage, we understand that Donald Trump is 100% against the TPP while Hilary Clinton’s view on the pact remains fuzzy.

January 3, 2016 173
Vietnam’s Three-for-16
3. 2016 – Year of IPOs and new listings
3.1 Pick-up in equitization of SOEs Equitzation plays a vital role in the overall restructuring of the state sector as it’s well-known for low productivity, non-core investments and in many cases debt-ridden companies, which in turn contributed to high NPLs that have crushed the banking system in the past five years.
Important to note is the significant improvement in the number of IPOs in the past 2 years, in stark contrast to the preceding 5 years. While only 30% of the central government’s listing target for 2009-2013 was met at the end of the period, by the end of 2015, that target has been 70% achieved. In other words, the last 2 years saw more IPOs than the preceding 5. Further, the listing plan was arguably too ambitious as it had targeted to equitize as many as 531 SOEs between 2011 and 2015 compared with only 136 between 2007 and 2010.
Fig 13: New wave of IPOs in SOEs
Source: various
Other common complaints are that often the size of actual offerings to the public are not large enough to attract institutional investors as the State remains the dominant shareholder in many cases. In the latest IPO of Aviation Corporation of Vietnam for example, only less than 4% stake was offered to the public. The same was the case for the IPOs of Vietnam Airlines, PetroVietnam GAS and Bank for Investment and Development of Vietnam.
While this was true, we have to acknowlege that various regulations and decisions have been made to accelerate the whole process. They include subsequent sales to effectively reduce the State’s stake after the IPO, mandatory listing or guidance on divestments in cases where market prices are less than face values or book values. The latest decision 1787 dated 8 Oct 2015 to divest completely out of well-performing, much-sought-after corporates like Vinamilk, FPT telecom and FPT Corp is an important signal to the market that the government is willing to remove its influence in sectors or companies it previously considered “sensitive”. While this does not guarantee that foreign investors could participate when State Capital Investment Corporation (SCIC) sells these investments, it is an important step towards being more open to them in the future.

January 3, 2016 174
Vietnam’s Three-for-16
3.2 Tackling the bottlenecks in IPOs of SOEs The significant slowdown in IPOs between 2008-12 was attributed to less favourable market conditions both externally and domestically, but admittedly mostly due to: (1) lofty valuations, including deadlocks when market prices were below the book value or face value (for subsequent divestments of the State after the initial offerings); and (2) delayed listing after the IPO. The IPO concept in Vietnam often refers more to the State selling its stake in SOEs partially or entirely, while the actual listings on the stock exchange may follow after months or even years.
A series of regulations have been introduced to solve the problems:
§ Decree 59/2011 on equitization of SOEs.
§ Decision 704/2012 on improvement of corporate governance.
§ Decision 929/2012 on 2012-15 SOE restructuring plan including divesting completely out of non-core activities.
§ Decree 99/2012 on specifying the responsibilities of each owner (e.g. a ministry, SCIC, a local authority) in SOEs. Previously, poor performance in SOEs was sometimes not specifically addressed to any specific entities.
§ Decree 189/2013: allowing stakes to be sold to strategic investors prior or together with IPOs (previously only after and at higher prices).
§ Decree 51/2014: requirement to list on UpCOM (a tier-II stock exchange) within three months and the other main boards within 12 months, but still allows for “exceptional cases”.
§ Decision 51/2014: allowing for state divestments at below par value or BVPS (both of which were strictly not allowed before); more flexible 2nd offering pricing (e.g. lower price) if not fully subscribed in the 1st offering.
§ Document 1787/2015: state to divest completely out of previously “sensitive sectors” such as dairy, insurance, construction materials, infrastructure and real estate etc. including Vinamilk, FPT telecom, FPT Corp., and Bao Minh insurance etc.
§ Decision 40/Jun’15: Nine areas/bottlenecks to solve relating to IPOs of SOEs incl. revising Decree 59; enforcing a listing on a stock exchange (e.g. if management is found to be deliberately avoiding a listing, a forced sale to reduce state ownership to 0% or a forced bankruptcy as a last resort would be conducted).
§ Circular 180/Nov’15, effective from 1 Jan 2016, requiring mandatory listing at least on the UpCOM for ALL public companies, ie. having more than 100 shareholders.
The last regulation, Circular 180 dated Nov’15, is the most important in our view as it may totally change the dynamics of Vietnam’s equity market. If implementation is enforced properly, which has been the case so far based on our understanding from talking to various related authorities, it would mean hundreds of companies would be listed on the UpCOM. Larger companies that meet higher listing requirements of the Hochiminh or Hanoi stock exchange would likely list on the main board for a better reputation and for more market liquidity. Our back-of-the-envelop calculation indicates that another USD21b could be added to the current market capitalization of ~USD50b once the top 30 larger equitized companies are listed (see Figure 14 below) in 2016-17. Recently the over-subscribed (1.5x) IPO of Aviation Corporation of Vietnam (priced at a more reasonable 1.4x P/BV vs regional peers of 1.8x on average) is an example of more positive responses from investors (Click here for our ACV unrated note). In one of the last

January 3, 2016 175
Vietnam’s Three-for-16
announcements of the year on 25 Dec’15, Mobifone’s IPO plan will be submitted to the Prime Minister shortly after several years of delay. Mobifone is the second largest telco in Vietnam with around USD1.7b in sales, USD330m of profit and 49.35% ROE in 2015.
Fig 14: Key IPOs and new listings in 2014-17
Name Industry Date est Mcap / charter capital
Vietnam Urban and Industrial Zone Development Investment corp Industrials 2015 n/a IDICO Urban and Industrial Zone Development Co., Ltd. Industrials 2015 n/a IDICO Construction Co., Ltd. Industrials 2015 n/a Viet Bac Mining Resources 2015 n/a Vinacomin-Ship building Resources 2015 n/a Nha Trang Vaccine Company Pharmaceutical 2015 n/a Vaccine Pastuer Dalat ltd Pharmaceutical 2015 n/a Hanoi Pharmaceutical university's Pharma Company Pharmaceutical 2015 n/a Central Pharmaceutical Company 1 Ltd Pharmaceutical 2015 n/a Central Pharmaceutical company 2 Ltd Pharmaceutical 2015 n/a Central Pharmaceutical company 3 Ltd Pharmaceutical 2015 n/a Vinatea F&B Oct-15 50.0 Vilico F&B 2015 n/a Mobifone Telecom 2015 4,400 Saigon Beverage Company (Sabeco) Beer 2015-2017 3,767 Satra Group 2015-2017 3,041 Binh Son Refining and Petrochemical Refinery 2015-2017 1,647 Vietnam Airlines Airlines 2014 1,400 Vietnam Airport Corporation (AVC) Aviation Dec-15 1,430 Power Generation Corporation 1 Utilities 2015 587 Power Generation Corporation 3 Utilities 2015-2017 464 Saigon Tourist 2015-16 427.68 Power Generation Corporation 2 Utilities 2015-2017 387 Vissan Company Packed food 2015-2017 349 Vinacomin-Electricity Utilities 2015 320 Vinacomin Power Power 2015 316 Ca Mau Fertilizer Chemical 11-Dec-14 304 Viet Nam Textile Textile 22-Sep-14 298 Vietnam Southern Food Corporation F&B 2015 222 Vietnam Northern Food Corporation F&B 2015 205 Vietnam Cement Materials 2016 178 Viglacera Industrials/ Const 12-Feb-14 152 Haiphong port Port operation 14-May-14 307 Saigon airport Retailing 18-Sep-14 119 Vocarimex Cooking Oil Consumer 25-Jul-14 109 Vietnam National Coal - Mineral Industries Resources 2015 64 Vietnam Seafood (Seaprodex) F&B 12-Dec-14 59 Construction corporation 1 Construction 2015 52 Licogi Corp. Construction 2015 42 Vietnam Water Sewage and Environment Utilities 5-Mar-14 39 Building Materials Corporation No.1 Ltd Materials 2015 29 Subtotal
20,764
Source: company data, various media sources
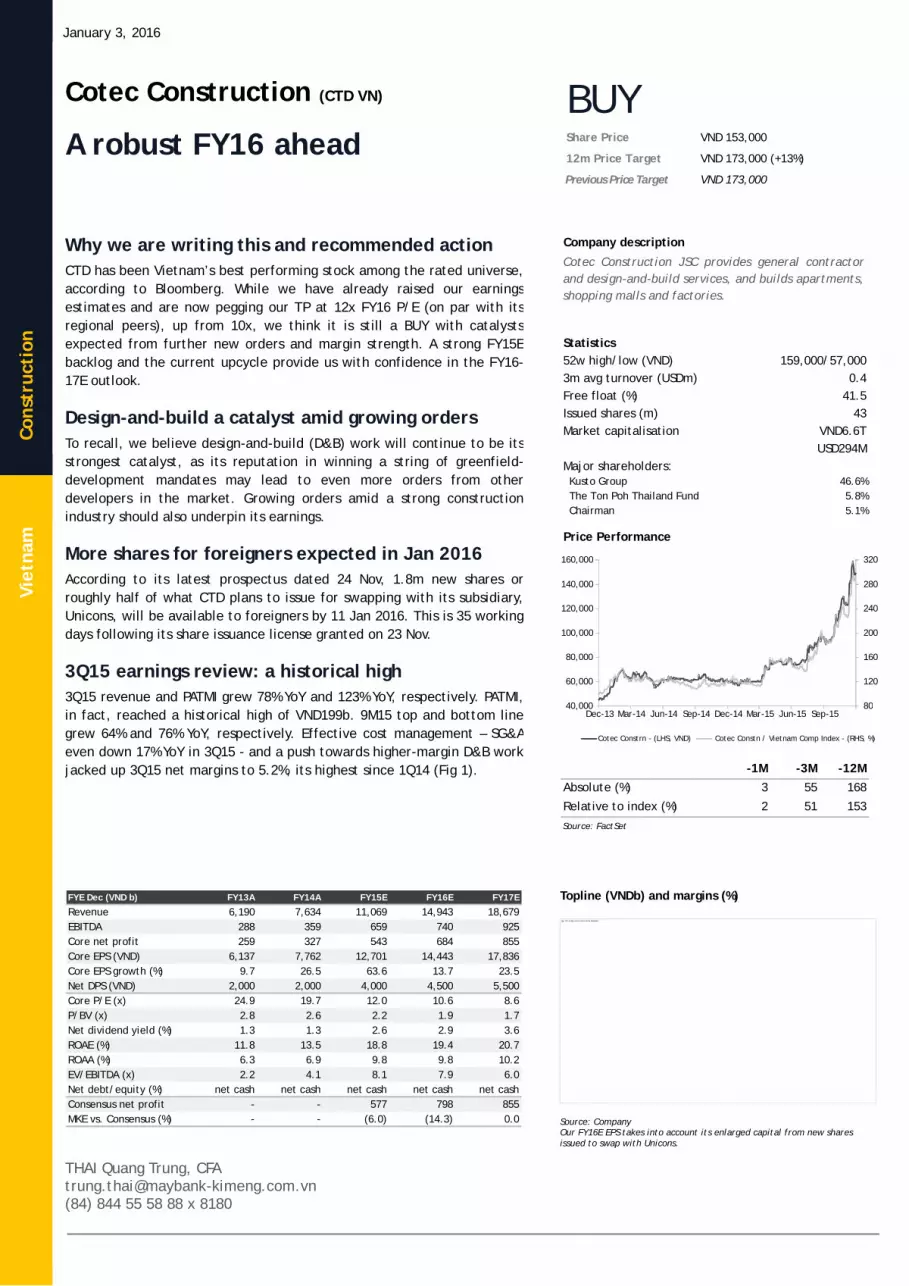
January 3, 2016
Cons
truc
tion
Vi
etna
m
Cotec Construction (CTD VN)
A robust FY16 ahead
Why we are writing this and recommended action CTD has been Vietnam’s best performing stock among the rated universe, according to Bloomberg. While we have already raised our earnings estimates and are now pegging our TP at 12x FY16 P/E (on par with its regional peers), up from 10x, we think it is still a BUY with catalysts expected from further new orders and margin strength. A strong FY15E backlog and the current upcycle provide us with confidence in the FY16-17E outlook.
Design-and-build a catalyst amid growing orders To recall, we believe design-and-build (D&B) work will continue to be its strongest catalyst, as its reputation in winning a string of greenfield-development mandates may lead to even more orders from other developers in the market. Growing orders amid a strong construction industry should also underpin its earnings.
More shares for foreigners expected in Jan 2016 According to its latest prospectus dated 24 Nov, 1.8m new shares or roughly half of what CTD plans to issue for swapping with its subsidiary, Unicons, will be available to foreigners by 11 Jan 2016. This is 35 working days following its share issuance license granted on 23 Nov.
3Q15 earnings review: a historical high 3Q15 revenue and PATMI grew 78% YoY and 123% YoY, respectively. PATMI, in fact, reached a historical high of VND199b. 9M15 top and bottom line grew 64% and 76% YoY, respectively. Effective cost management – SG&A even down 17% YoY in 3Q15 - and a push towards higher-margin D&B work jacked up 3Q15 net margins to 5.2%, its highest since 1Q14 (Fig 1).
Topline (VNDb) and margins (%)
Source: Company Our FY16E EPS takes into account its enlarged capital from new shares issued to swap with Unicons.
THAI Quang Trung, CFA [email protected] (84) 844 55 58 88 x 8180
Share Price VND 153,000
12m Price Target VND 173,000 (+13%)
Previous Price Target VND 173,000
BUY
FYE Dec (VND b) FY13A FY14A FY15E FY16E FY17E
Revenue 6,190 7,634 11,069 14,943 18,679EBITDA 288 359 659 740 925Core net profit 259 327 543 684 855Core EPS (VND) 6,137 7,762 12,701 14,443 17,836Core EPS growth (%) 9.7 26.5 63.6 13.7 23.5Net DPS (VND) 2,000 2,000 4,000 4,500 5,500Core P/E (x) 24.9 19.7 12.0 10.6 8.6P/BV (x) 2.8 2.6 2.2 1.9 1.7Net dividend yield (%) 1.3 1.3 2.6 2.9 3.6ROAE (%) 11.8 13.5 18.8 19.4 20.7ROAA (%) 6.3 6.9 9.8 9.8 10.2EV/EBITDA (x) 2.2 4.1 8.1 7.9 6.0Net debt/equity (%) net cash net cash net cash net cash net cashConsensus net profit - - 577 798 855MKE vs. Consensus (%) - - (6.0) (14.3) 0.0
Company description
Statistics52w high/low (VND)3m avg turnover (USDm)Free float (%)Issued shares (m)Market capitalisation
Major shareholders:46.6%5.8%5.1%
43
0.4
Cotec Construction JSC provides general contractorand design-and-build services, and builds apartments,shopping malls and factories.
Kusto Group The Ton Poh Thailand Fund Chairman
159,000/57,000
41.5
VND6.6TUSD294M
Price Performance
-1M -3M -12MAbsolute (%) 3 55 168
Relative to index (%) 2 51 153
Source: FactSet
This image cannot currently be displayed.
80 120 160 200 240 280 320
40,000 60,000 80,000
100,000 120,000 140,000 160,000
Dec-13 Mar-14 Jun-14 Sep-14 Dec-14 Mar-15 Jun-15 Sep-15 Cotec Constn / Vietnam Comp Index - (RHS, %) Cotec Constrn - (LHS, VND)

January 3, 2016 177
Cotec Construction
Value Proposition
§ Evolved from a subcontractor to general contractor and design-and-build (D&B) contractor.
§ Focus on quality build, securing contracts for high-quality projects from its early days. Enjoy widening margins through D&B work.
§ Difficult for local competitors to develop similar brand strength and D&B capabilities at this stage, as CTD was an early mover.
§ Stable management and a highly efficient workforce. Developers increasingly favour reliable contractors that can consistently deliver large-scale projects.
§ Beneficiary of and proxy to construction industry upcycle.
Contract value signed in FY14, delivered in FY15-16
Source: Company
Price Drivers
Historical share price trend
Source: Company, Maybank Kim Eng
1. Construction industry not favoured by the market in
2011, during a period of hyperinflation and tight credit. 2. Re-rating started in early 2014, but low liquidity and
foreign-ownership limits kept the stock range-bound. 3. Strong order-book growth and fundamentals (debt-free
and improving profitability).
Financial Metrics
§ Revenue growth the most important metric for CTD, being a growth stock. 9M15 revenue grew 64% YoY.
§ FY15E backlog estimated at VND13.5T, about twice that in FY14E. This is the basis for our FY15-17E earnings CAGR of 26%.
§ Net margins also crucial. We expect the company to ward off growing competition in the industry with its D&B focus, keeping net margins at 4.5-5.0%.
§ Receivable days, which declined from c.100 in FY13-14 to only 46 in 3Q15. Function of rigorous project cash management.
Robust revenue growth (YoY basis)
Source: Company
Swing Factors
Upside
§ Higher-than-expected margins, especially for D&B jobs. Mix of in-house and outsourced architects may keep workforce lean and bump up margins more than expected.
§ Stronger-than-expected order-book growth, from a growing residential property market. FY15 backlog is expected to be VND13.5t, nearly twice FY14’s.
§ Potentially more infrastructure jobs. CTD has forayed into infrastructure through its 35% stake in a BOT toll highway south of Hanoi, an area traditionally reserved for SOEs.
Downside
§ Cyclicality of construction industry, especially one in a frontier market.
§ Increased price competition. § Capital-intensive infrastructure work can be a risk.
Regionally, we have seen many contractors bearing losses due to poor infrastructure execution.
§ Any profit-taking on the back of CTD’s low-ish liquidity may force the stock down.
46% 50%
4%
Design and build
Condominium
Industrial
0
50
10
15
20
25
30
35
20,000
40,000
60,000
80,000
100,000
120,000
140,000
160,000
Dec-10 Dec-11 Dec-12 Dec-13 Dec-14
Cotec Construction - (LHS, VND)
Cotec Construction / MSCI AC Asia ex JP - (RHS, %)
43%
9%
30%
71% 78%
45% 35%
25%
0%
10%
20%
30%
40%
50%
60%
70%
80%
90%
3Q14 4Q14 1Q15 2Q15 3Q15 FY15E FY16E FY17E
1
2
3

January 3, 2016
Stee
l Vi
etna
m
Target price histogram using Monte Carlo Source: Maybank
THAI Quang Trung, CFA [email protected] (84) 844 55 58 88 x 8180
Hoa Phat Group (HPG VN)
Risks priced in; stay BUY
What’s our view We want to re-emphasise HPG as one of our top picks and a beneficiary to the construction upcycle in Vietnam. The stock has traded range-bound throughout 2015 as investors are concerned over the uncertainties caused by Chinese steel and the company’s foray into animal feeds. Our rigorous stress test and Monte Carlo simulation add comfort to our forecasts and suggest that growth potential outweighs risks. HPG remains our most investable idea along the construction/infrastructure theme.
What’s new Since our last report dated Aug’15, several things have changed: (1) HPG has increased capacity in some of its steel factories and expanded its industrial estates, both which largely contributed to our FY15E earnings upgrades, (2) the prospect of an influx of Chinese steel imports into Vietnam, confirmed by HPG’s chairman, has prompted us to downgrade domestic ASP even further.
Risks priced in We prudently assume FY16E ASP and EPS will drop by about 20%, following a ~18% ASP decline in FY15 YTD, to account for the impending Chinese imports and potentially further selling pressure from Taiwan-based Formosa Group. While key inputs (iron ore, coke, scrap) could fall by more than the decline in ASP, they only make up ~70% of COGS, leading to pressure on margins. Note that strong earnings frontloaded in FY15E offset the FY16 outlook, leaving our TP little changed.
Fundamentals remain strong Even if steel stocks are generally out of favour, we are fairly comfortable with HPG’s underlying FY16-17E fundamentals: 8% FCF yield on average, 10% dividend yield on average, 5x average EV/EBITDA, 7x core PER, on top of a committed and hardworking management team. Legacy businesses (furniture, refrigerators, industrial estates, etc – about 20-25% of revenue) are stable and provide downside protection.
Share Price VND 29,200
12m Price Target VND 41,900 (+43%)
Previous Price Target VND 41,900
BUY
Company description
Statistics52w high/low (VND)3m avg turnover (USDm)Free float (%)Issued shares (m)Market capitalisation
Major shareholders:32.4%10.3%7.7%
733
1.9
Hoa Phat is Vietnam's largest and most profitablesteelmaker, using integrated blast furnaces. Also runs other legacy businesses (20-25% revenue).
Chairman & family Other insiders Dragon Capital
36,000/19,467
57.2
VND21.4TUSD952M
Price Performance
70
90
110
130
150
170
190
15,000
20,000
25,000
30,000
35,000
40,000
45,000
Jan-14 Apr-14 Jul-14 Oct-14 Jan-15 Apr-15 Jul-15 Oct-15
Hoa Phat Group - (LHS, VND)
Hoa Phat Group / Vietnam Composite Index - (RHS, %)
-1M -3M -12MAbsolute (%) (4) (4) (17)
Relative to index (%) (5) (7) (22)
Source: FactSet
FYE Dec (VND b) FY13A FY14A FY15E FY16E FY17E
Revenue 18,934 25,525 26,905 29,112 32,755EBITDA 3,609 5,566 6,103 5,534 6,475Core net profit 1,760 2,759 3,704 2,987 3,552Core EPS (VND) 2,435 3,817 5,054 4,076 4,847Core EPS growth (%) 76.0 56.8 32.4 (19.4) 18.9Net DPS (VND) 1,304 1,304 3,000 2,500 3,000Core P/E (x) 12.0 7.6 5.8 7.2 6.0P/BV (x) 2.2 1.8 1.5 1.4 1.2Net dividend yield (%) 4.5 4.5 10.3 8.6 10.3ROAE (%) 20.0 25.9 28.1 19.9 21.7ROAA (%) 8.4 12.2 15.3 11.3 12.4EV/EBITDA (x) 6.2 5.4 3.9 4.8 4.0Net debt/equity (%) 53.3 35.7 15.6 30.6 24.6Consensus net profit - - 3,608 3,780 4,508MKE vs. Consensus (%) - - 4.4 (18.9) (20.7)
0%10%20%30%40%50%60%70%80%90%100%
0.0%
0.5%
1.0%
1.5%
2.0%
2.5%
3.0%
06,
000
12,0
0018
,000
24,0
0030
,000
36,0
0042
,000
48,0
0054
,000
60,0
0066
,000
72,0
0078
,000
84,0
0090
,000
96,0
00
Probability distribution (L)
Cumulative distribution (R)

January 3, 2016 179
Hoa Phat Group
Value Proposition
§ Positioned as Vietnam’s ultimate integrated steelmaker, allowing it to minimise dependence on scrap metal (which Vietnam lacks) and diversify input material sources.
§ Market leader with 22% market share, up from 9% in 2009. Improvement attributed to strong supply chain and focus on underdeveloped northern Vietnam.
§ Market dominance and upcycle of domestic construction industry support secular growth story.
§ Entry barriers include established distribution channel, 12% tariff on Chinese steel via the ASEAN-China FTA, and a cost structure fairly similar to Chinese companies.
§ Legacy businesses (furniture, industrial estates, etc ~20-25% of revenue) are stable and cushion downside.
Steel is key driver but legacy businesses protect downside
Source: Company, Maybank
Price Drivers
Price evolution
Source: Company, Maybank Kim Eng
1. Start of re-rating from FY14E PER of 6.0x due to expectations of strong steel sales.
2. BankInvest, a long-standing shareholder, sold about 4.4m shares within about three months, exerting selling pressure.
3. Selling pressure was seen by funds under VinaCapital; a new foray into animal feeds was also announced.
Financial Metrics
§ ASP is important to note, as the company’s enterprise value is highly sensitive to changes in ASP.
§ On the chart below, our analysis shows a 1% decrease in ASP over a 5-year forecast horizon lowers our TP for HPG by about 4%.
§ We estimate GPM was >20% in FY15, as ASP declines were more than offset by raw materials. GPM could compress to 17-18% due to increased pressure from competition.
§ Inventory days dropped to 120, beating our expectations and bolstering operating cash flows.
Changes in our TP given changes in key inputs…
Source: Company, Maybank
Swing Factors
Upside
§ The government is working to prevent Chinese steel dumping (e.g. specifically taxing steel alloyed with boron)
§ An upcycle in the construction and real estate industry in Vietnam may surprise on the upside
§ Expansions of legacy businesses may also boost earnings
Downside
§ ASP declines: Formosa, Chinese steel and soft outlook for commodities may depress share price (see changes in our TP given changes in key variables in the chart on the left)
§ Animal feeds business is a question mark and may slow overall business growth
§ VND devaluation may add further stress via imported materials and USD borrowings (VND3.4t as at 1H15)
95
105
115
125
135
145
155
35,000
40,000
45,000
50,000
55,000
60,000
65,000
Dec-13 Mar-14 Jun-14 Sep-14 Dec-14 Mar-15
Hoa Phat Group - (LHS, VND)
1
2
3
0%
20%
40%
60%
80%
100%
FY08 FY09 FY10 FY11 FY12 FY13 FY14 9M15
% o
f re
venu
e
Legacy businesses
Animal feeds
Apartment sales
Steel
-4.0% -3.0% -2.0% -1.0% 0.0% 1.0% 2.0%
1% decrease in coking coal price
1% decrease in iron ore price
1% decrease in scrap price
1% decrease in ASP
Throughout 5yr forecast horizon In FY15E only

January 3, 2016
Cons
umer
Sta
ples
Vi
etna
m
LE Hong Lien, ACCA [email protected] (84) 844 55 58 88 x 8181
Vinamilk (VNM VN)
Solid business in growing industry
Unrivalled market leader in dairy As largest dairy company (with approx. 50% market share) and wide range of products, VNM is ideally placed to capture the huge potential of local industry. With the rapidly changing lifestyle in Vietnam, VNM has been able to grow at 23% CAGR in sales and as high as 28% CAGR in NPAT
Dairy daily consumption expected to grow Despite rapid growth in the last decade, Vietnamese’s consumption remains low, around 16-18kg per annum per capita (vs. that of 40kg in Thailand or over 26kg in China). With the continuingly rising awareness about health benefit of milk, favourable demographics, coupled by recent regulation to abandon 2-children policy and (3) stronger pick up in domestic consumption, supported by higher disposal income, industry growth is expect to grow at double digit in at least next 5 years.
High profitability yet competition has also been more intense Vinamilk has benefited largely from the slump of global powder milk since May’14. Gross margin has been improved from around 32% in 9M15 to 38% in 4Q14 and further rose to 39.6% on average in 9M15. However VNM has also experienced more fierce competition from No. 2 and No. 3 industry competitors namely Dutch Lady and Nestle (in powder and liquid milk segment) and other local producers such as TH Milk, Da Lat Milk, Moc Chau Milk (in fresh milk) in last 3 years, resulting in higher SGA/sales. We estimate net margin to still stay at high level of 18-20% in next 5 years, which is 2x that of regional average.
Still compelling valuation VNM is trading at 17.7x 2016 PER compared with that of 23x by similar companies in the region, yet offering more superior return from higher gross margin, 2x ROE and net margin. Our TP based on DCF model is VND148,100, which is 15.7% higher than closing price on 31 Dec 2105. A catalyst in 2016 may come from uplifting foreign ownership limitation (FOL) in VNM, making it more easily for foreign institutional investors to purchase the share.
Share Price VND 126,000
12m Price Target VND 148,100 (+18%)
Previous Price Target VND 141,600
BUY
Statistics52w high/low (VND)3m avg turnover (USDm)Free float (%)Issued shares (m)Market capitalisation
Major shareholders:45.0%11.0%7.4%
1,200
5.7
State Capital Investment Corporation F&N Dairy Investments Pte Ltd Dragon Capital Markets Limited (DC)
140,000/80,000
23.4
VND153.6TUSD6.8B
Price Performance
70
80
90
100
110
120
130
140
70,000
80,000
90,000
100,000
110,000
120,000
130,000
140,000
Jan-14 Apr-14 Jul-14 Oct-14 Jan-15 Apr-15 Jul-15 Oct-15
Vinamilk - (LHS, VND) Vinamilk / Vietnam Composite Index - (RHS, %)
-1M -3M -12MAbsolute (%) 3 28 61
Relative to index (%) 2 24 52
Source: FactSet
FYE Dec (VND b) FY13A FY14A FY15E FY16E FY17E
Revenue 30,949 34,977 40,615 45,839 51,980EBITDA 8,082 7,850 10,180 10,886 11,678Core net profit 6,534 6,068 7,961 8,582 9,239Core EPS (VND) 5,444 5,056 6,626 7,151 7,699Core EPS growth (%) 12.3 (7.1) 31.1 7.9 7.7Net DPS (VND) 4,000 4,000 4,500 5,000 6,000Core P/E (x) 23.1 24.9 19.0 17.6 16.4P/BV (x) 8.6 7.7 7.1 6.7 6.4Net dividend yield (%) 3.2 3.2 3.6 4.0 4.8ROAE (%) 39.6 32.6 38.9 39.0 40.0ROAA (%) 30.7 24.9 29.3 29.4 30.2EV/EBITDA (x) 13.1 11.2 14.1 13.1 12.1Net debt/equity (%) net cash net cash net cash net cash net cashConsensus net profit - - 7,862 8,680 9,561MKE vs. Consensus (%) - - 1.3 (1.1) (3.4)

January 3, 2016 181
Vinamilk
Value Proposition
§ No. 1 national consumer brand. Leading dairy player (~50% market share). Dominant across product range: powder milk, yogurt, liquid milk and condensed milk.
§ Changing dietary habit among Vietnamese population towards higher dairy consumption secures secular growth.
§ Robust demand enables industry players to pass on higher input costs to consumers and benefit when material prices trend down, which have preserved/enhanced returns.
§ Commencement of USD23m factory in Cambodia (yogurt: 3Q15, condensed milk: 4Q15) opens more opportunities to CMLV market.
§ But may be entering phase of more mature and moderate growth. Operations are still highly cash generative. We see higher dividend payout and more attractive yields ahead.
VNM: market leader in Vietnam’s dairy industry
Source: Company
Price Drivers
Historical share price trend
Source: Company, Maybank Kim Eng
1. Commissioning of new mega factory resolving capacity constraints which limited growth in 2011-13, especially export contracts
2. Underperformance in 2014 due to earnings contraction for the first time after strong expansion in 2005-13
3. Improved gross margin in 4Q14, which continued into 2015 thanks to lower input costs
4. Expected relaxation in foreign ownership limit
Financial Metrics
§ Raw material prices and VNM. Softer raw material prices should result in further gross margin improvement in 2016. VNM imports nearly 70% of its input milk materials.
§ Success of export initiatives and positive margins. § USD370m net cash even after completion of major factory
capex requirements (totalling USD210m) that doubled liquid milk and increased powder milk capacity by 4x.
VNM’s cash rich status
Source: Company
Swing Factors
Upside
§ Progress on increasing the amount of foreign ownership allowed in listed stocks in general and VNM in particular
§ Potential positive M&A announcement to boost VNM’s future sales
§ Stronger penetration in healthy non-dairy drinks such as green tea, juice etc.
Downside
§ Price shock, aka sharp recovery of global powder milk, which VNM may not be able to pass on to end consumers completely.
§ Strong management of chair lady, Ms Mai Kieu Lien, leads to concerns regarding her successor.
§ Any event or issue that tarnishes brand/product image may cost the company a fortune.
0%
20%
40%
60%
80%
100%
120%
2008 2009 2010 2011 2012 2013
Others
Hanoi Milk
Bel, Groupe
Nestlé SA
Dutch Lady
VNM
40,000
60,000
80,000
100,000
120,000
140,000
160,000
Dec
-12
Feb-
13
Apr-
13
Jun-
13
Aug-
13
Oct
-13
Dec
-13
Feb-
14
Apr-
14
Jun-
14
Aug-
14
Oct
-14
Dec
-14
Feb-
15
Apr-
15
Jun-
15
Aug-
15
Oct
-15
Dec
-15
VNM VN (L)
-
4,000
8,000
12,000
16,000
0%
15%
30%
45%
60%Net cash (VNDb-RHS)
Net cash/equity (LHS)
1 2
3
4


January 3, 2016
ECO
NO
MIC
S Re
gion
al
2016 Outlook & Lookouts
Data-Dependent, Event-Driven … Still
World’s real GDP growth of 3.2% in 2016 is at the low end of the 3.0%-5.7% range in 2002-2014 (ex-2009 recession year), reflecting growth divergences among economies. Policy-wise, US is “normalizing” its interest rate policy; ECB and BoJ are continuing their zero-bound/negative interest rates and QEs; regional economies are making use of available policy spaces to stimulate growth via monetary and fiscal stimulus. On the currency front, the USD is expected to remain firm mainly at the expense of EUR, AUD and Asia ex-Japan currencies.
Consequently, global outlook and lookouts are still data-dependent and event-driven, feeding into continued market volatility and macro uncertainty. There are a few things to note: (i) continued “guessing game” on the post-liftoff timing and quantum of US interest rate hikes, (ii) China’s economic and currency outlook and its impact on the region given their exposure to China (mainly via trade) and their currencies’ sensitivity to CNY, (iii) capital flow overhang in EMs, which have yet to see a major reversal to the influx since 2009.
For Malaysia, the key influences to its outlook and lookout are GST, commodity prices and MYR. We expect real GDP growth to ease to 4.5% on slower domestic demand due to moderating consumer spending, private investment. Public investment will however rebound on higher development spending and GLCs-GLIFs’ capex into major infrastructure and investment projects. Growth in exports and imports will be better. But, inflation will pick up to 3.0%-3.5%. Slower growth, rising inflation, soft MYR render the OPR “immobile” at 3.25%. Our FX Research Team expects USDMYR to move within the 3.95-4.15 range and average 4.11 in 2016 amid dissipation of internal political risk which is countered by the above external issues and the fluid crude oil price situation.
We trim our end-2016 KLCI target to 1,800 (from 1,830), as we continue to tag the KLCI to, at about its mean valuation. Bottom-up, we derive 1,790. We forecast 7.5% KLCI core earnings growth in 2016, 7.7% in 2017. Earnings risk however remains on the downside; pressure points are at the banks, consumer and plantation sectors. A market re-rating should come when corporate earnings show a firmer uptrend, commodity prices recover on a sustained manner.
We continue to advocate a defensive core equity portfolio in 2016 with the thematic and value stocks to provide the outperformance. Key thematics are substantial construction awards, continued weakness in the MYR, Sarawak’s state election, a strong El Nino, Shariah investing. For longer term, investors should strengthen their holdings of stocks which will benefit from the TPPA, and China’s One Belt, One Road.
Analysts
Wong Chew Hann (Equity Strategy) (+603) 2297 8686 [email protected] Winson Phoon (Fixed Income) (+603) 2274 7176 [email protected] Lee Cheng Hooi (Regional Chartist) (+603) 2297 8694 [email protected] Malaysia Research & Economics Team (please refer to page 136 for the full list) www.maybank-keresearch.com
Suhaimi B Ilias
(603) 2297 8682

January 3, 2016 184
Economics
ECONOMICS: Divergence, data-dependent, event-driven … still Globally, persistent divergences in growth, policy and currencies. World’s real GDP growth of 3.2% in 2016 (2015E: 3.1%) is at the low end of the 3.0%-5.7% range in 2002-2014 (excluding the recession year of 2009) as it drifted lower post-GFC, reflecting divergences among economies i.e. steady growth in US and India; slow recoveries in Eurozone and Japan; slowdown in China; recessions in Brazil and Russia; mixed trends across Asian NIEs and ASEAN. Policy-wise, US is “normalizing” of its interest rate policy; ECB and BoJ are continuing with their zero-bound/negative interest rate policies and QEs; while regional economies are making use of available policy spaces to stimulate growth via monetary and fiscal stimulus. On the currency front, USD is expected to remain firm mainly at the expense of EUR, AUD and Asia ex-Japan currencies. Consequently, outlook and lookouts are still data-dependent and event-driven, feeding into continued market volatility and macro uncertainty. There are few things to take note. First is the continued “guessing game” on the post-liftoff timing and quantum of US interest rate hikes, which should remain data-dependent and event-driven amid the divergence between Fed’s guidance and market expectations, as well as the divergence between the key variables in Fed’s dual mandate of sustainable employment and price stability i.e. job market and inflation. Second, China’s economic and currency outlook remains a major lookout, especially for the regional economies and currencies given the exposure to China (mainly via trade) and their currencies’ sensitivity to CNY. Third, is the capital flow overhang in the emerging markets, which have yet to see a major reversal to the influx since 2009 given that the more sustained monthly net portfolio outflows only began in July 2015, and 2H 2015 would have marked the first half-yearly net outflows since 2H 2008. GST, commodity prices and MYR are the key influences on Malaysia’s outlook and lookout. Real GDP growth is expected to ease to 4.5% in 2016 (2015E: 4.9%) on slower domestic demand due to moderating consumer spending and private investment amid the aforementioned multiple headwinds. Government consumption is curbed by continued budget consolidation. Public investment will rebound in 2016 after the declines in 2014-2015 on higher Federal Government’s development spending and Government-linked companies’ and funds’ capex into major infrastructure and investment projects. Growth in exports and imports will be better, reflecting the double-sided MYR impact on export competitiveness and import bills, and the relatively flattish commodity prices after the plunge in 2015. Inflation will pick up to 3.0%-3.5% (2015E: 2.2%) despite the tapering GST effect as inflationary pressures will be sustained by further adjustments in subsidies and controlled prices, impact of weak MYR on imported costs, and the 11%-15% increase in Minimum Wages effective 1 July 2016. Slower growth, rising inflation and soft MYR render OPR “immobile” at 3.25%. Our FX Research Team expects USDMYR to move within 3.95-4.15 range and average 4.11 in 2016 (2015E: 3.50-4.45 range; average 3.91) amid dissipation of internal political risk which is countered by the above external issues and the fluid crude oil price situation.

January 3, 2016 185
Economics
Continued Divergence Growth Divergence 2016 global growth will remain at the low end of the pre-GFC and post-GFC range. We expect global real GDP growth to marginally improve to 3.2% in 2016 after slowing to 3.1% in 2015 (2014: 3.4%). This is at the low end of the 3.0%-5.7% range recorded in 2002-2014 (excluding the recession year of 2009), and at the same time, global growth has been drifting lower post-GFC (Fig 1). Fig 1: Annual Global GDP Growth (% chg)
Sources: IMF, Maybank KE
Reflecting divergence in growth among the major and regional economies (Fig 2). Major advanced economies are expected to maintain their growth momentum (2016E: 1.9%; 2015E: 1.9%), underpinned by steady US growth (2016E: 2.3%; 2015E: 2.4%) and sustained – albeit slow – recoveries in Eurozone (2016E: 1.7%; 2015E: 1.5%) and Japan (2016E: 1.0%; 2015E: 0.6%). In contrast, the large emerging economies are “all over the place” given the slowdown in China (2016E: 6.6%; 2015E: 6.9%), the recessions in Brazil (2016E: -1.1%; 2015E: -3.0%) and Russia (2016E: -0.5%; 2015E: -3.9%), and the expansion in India (2016E: 7.5%; 2015E: 7.4%). Meanwhile, growth are expected to be firmer in the Asian NIEs (2016E: 2.4%; 2015E: 2.1%) and the ASEAN-5 (2016E: 5.2%; 2015E: 4.7%). However, they mask the uneven growth across the regions. At one end, we have pickups in South Korea (2016E: 2.8%; 2015E: 2.5%), Indonesia (2016E: 5.0%; 2015E: 4.7%), Thailand (2016E: 4.5%; 2015E: 3.0%) and Philippines (2016E: 7.0%; 2015E: 6.0%). At the other end are slowing Malaysia (2016E: 4.5%; 2015E: 4.7%) and sub-2% Taiwan (2016E: 1.8%; 2015E: 1.3%). In between are the relatively stable Singapore (2016E: 2.0%; 2015E: 2.0%), Hong Kong (2016E: 2.3%; 2015E: 2.4%) and Vietnam (2016E: 6.5%; 2015E: 6.4%).

January 3, 2016 186
Economics
Fig 2: Global Real GDP % chg % Share of
World GDP 2014 Jan-Sep
2015 2015E 2016E
World
3.4 3.2 3.1 3.2
Major Advanced Economies 60.9% 1.8 1.8 1.9 1.9 US 22.4% 2.4 2.6 2.4 2.3 Eurozone 17.3% 0.9 1.5 1.5 1.7 Japan 6.0% (0.1) 0.4 0.6 1.0 UK 3.8% 3.0 2.3 2.4 2.2
BRIC 21.5% 5.5 4.3 4.3 4.8 Brazil 3.0% 0.1 (3.2) (3.0) (1.1) Russia 2.4% 0.6 (3.6) (3.9) (0.5) India 2.7% 7.3 7.3 7.4 7.5 China 13.4% 7.3 6.9 6.9 6.6
Asian NIEs 3.3% 3.2 2.2 2.1 2.4 South Korea 1.8% 3.3 2.5 2.5 2.8 Taiwan 0.7% 3.7 1.3 1.3 1.8 Hong Kong 0.4% 2.3 2.5 2.3 2.4 Singapore 0.4% 2.9 2.2 2.0 2.0
ASEAN-6 (incl. Singapore) 3.1% 4.5 4.5 4.6 4.9 ASEAN-5 2.7% 4.6 4.7 4.8 5.2
Indonesia 1.1% 5.0 4.7 4.7 5.0 Thailand 0.5% 0.7 2.9 3.0 4.5 Malaysia 0.4% 6.0 5.1 4.9 4.5 Philippines 0.4% 6.1 5.6 6.0 7.0 Vietnam 0.2% 6.0 6.7 * 6.7 6.5
* Full-Year Sources: IMF, Bloomberg, CEIC, Maybank-KE Policy Divergence The Fed awakens… Finally, we have the lift off in the fed funds rate (FFR) which was hiked by 25bps to 0.25%-0.50% at the final FOMC meeting of 2015. This is in line with our long-held view (since Oct 2014) that the normalization in US interest rate will begin before 2015 is over. The fed funds rate (FFR) has been kept at the record low of 0%-0.25% since Dec 2008. The Fed last hiked its benchmark interest rate between June 2004 and June 2006. Furthermore, the majority of FOMC members have actually indicated 2015 as the appropriate time for monetary policy firming since way back in Sep 2012.
Fig 3: Probability of FFR Hikes in 2016, as at 30 Dec 2015
Dates of FOMC Meetings To 0.50%-0.75% To 0.75%-1.00% To 1.00%-1.25% To 1.25%-1.50% To 1.50%-1.75%
26-27 Jan 2016 0% 0% 0% 0% 0%
15-16 Mar 2016 52% 0% 0% 0% 0%
26-27 Apr 2016 51% 8% 0% 0% 0%
14-15 June 2016 46% 27% 4% 0% 0%
26-27 July 2016 41% 31% 8% 1% 0%
20-21 Sep 2016 33% 35% 17% 4% 0%
1-2 Nov 2016 28% 34% 21% 7% 1%
13-14 Dec 2016 20% 32% 26% 12% 3%
Source: Bloomberg

January 3, 2016 187
Economics
In contrast, on 3 Dec 2015, the European Central Bank (ECB) announced a series of measures that effectively expand and extend its quantitative easing (QE). The measures were 10bps cut in its deposit rate to -0.30%; extension of the bond purchase programme to at least until Mar 2017 (vs the original timeline of at least until Sep 2016); expansion of the assets eligible for its purchases under QE to include Euro-denominated marketable instruments issued by Eurozone’s regional and local governments; and reinvestments of the principal payments on the securities purchased under QE upon maturity. The moves are to combat deflationary pressures given the latest inflation rate of 0.1% YoY in Nov 2015 and flat 2015 YTD vs ECB’s 2% target. ECB expects inflation rate to stay sub-2% in the following two years (2016E: 1.0%; 2017E: 1.6%). Fig 4: Major Central Banks’ Balance Sheets (USDb)
Source: Bloomberg
Most regional economies are making use of available policy spaces to stimulate growth. Regional economies like China, India, South Korea, Taiwan and Thailand have cut their interest rates in 2015, making use of the low or slowing inflation and deflation – hence the high positive real interest rates - to ease their monetary policies. Philippines and Vietnam have rooms to cut interest rates in view of them having the highest real interest rates but have not done so amid growth outperformance relative to regional peers. Malaysia and Indonesia are somewhat constrained by the risk of interest rate cuts adversely affecting their currencies, which are among the worst-performing globally, plus the flow through impact on inflation. Via interest rate cuts and continued accommodative monetary policy. We expect at least one more interest rate cuts in China and India within 1H 2016, while interest rates are expected to remain stable and accommodative elsewhere, including in Thailand where our Maybank Kim Eng’s Economist there sees a possible 25bps hike in 4Q 2016 which will partially reverse the 50bps cuts in 2015. Meanwhile, although Maybank Indonesia’s Economics Research does not expect any change in the policy rate, there is risk of political pressures on Bank Indonesia to cut interest rate to boost growth as monthly inflation rate decelerates.

January 3, 2016 188
Economics
Fig 5: Asia – Inflation Rates, Benchmark Interest Rates, Real Benchmark Interest Rates
Sources: Bloomberg CEIC
Fig 6: Benchmark Interest Rates (% p.a.) Country Benchmark Interest Rate 30 Dec 2015 end 1Q16 end 2Q16 end 3Q16 end 4Q16 Chg in 2015 Chg in 2016
Major
US Fed Funds Target Rate 0.25-0.50 0.25-0.50 0.50-0.75 0.75-1.00 0.75-1.25 0.25 0.50-0.75
Eurozone ECB Main Refinancing Rate 0.05 0.05 0.05 0.05 0.05 0.00 0.00
Japan BOJ Target Rate 0.10 0.10 0.10 0.10 0.10 0.00 0.00
UK BOE Bank Rate 0.50 0.50 0.75 0.75 1.00 0.00 0.50
Asia Pacific
Australia Cash Rate Target 2.00 2.00 1.75 1.75 1.75 (0.50) (0.25)
China 1-Year Lending Rate 4.35 4.10-4.35 4.10-4.35 4.10-4.35 4.10-4.35 (1.25)-(1.50) 0.00-(0.25)
India Repo Rate 6.75 6.75 6.50-6.75 6.50-6.75 6.50-6.75 (1.25) 0.00-(0.25)
Indonesia Reference Rate 7.50 7.50 7.50 7.50 7.50 (0.25) 0.00
Malaysia Overnight Policy Rate 3.25 3.25 3.25 3.25 3.25 0.00 0.00
Philippines Overnight Rate 4.00 4.00 4.00 4.00 4.00 0.00 0.00
S. Korea Target Overnight Rate 1.50 1.50 1.50 1.50 1.50 (0.50) 0.00
HK 3-Mth HIBOR 0.39 0.51 0.48 0.53 0.57 0.01 0.33
Taiwan Discount Rate 1.625 1.625 1.625 1.625 1.500 (0.25) (0.125)
Singapore 3-Mth SIBOR 1.14 1.65 1.89 2.15 2.44 0.68 1.30
Thailand Repurchase Rate 1.50 1.50 1.50 1.50 1.75 (0.50) 0.25
Vietnam Refinancing Rate 6.50 6.00-6.50 6.00-6.50 6.00-6.50 6.00-6.50 0.00 0.00-(0.50)
Sources: Bloomberg, Consensus Survey, Maybank KE Fiscal stimulus are also being deployed, mainly in terms of infrastructure spending. On the basis of budget deficits and Government debts to GDP ratios, majority of Asian economies have some room to engage in fiscal stimulus, with the notable exceptions of India and Vietnam (Fig 7). China is ramping up its fiscal spending. ASEAN economies – namely Malaysia, Indonesia, Thailand and Philippines – are boosting Government expenditure, especially the infrastructure-related spending (Figs 8-13).

January 3, 2016 189
Economics
Fig 7: Asia – Fiscal Balance & Government Debt (% of GDP, 2016E)
Sources: Bloomberg, CEIC, IMF
Fig 8: China – Fiscal Spending (% YoY) Fig 9: Malaysia: Federal Government Development
Spending (MYRm)
Source: Bloomberg Sources: CEIC, Budget 2016, 11th Malaysia Plan (2016-2020)
Fig 10: Indonesia – Government Capex (IDRtr) Fig 11: Indonesia: Domestic Cement Sales (% YoY)
Sources: Ministry of Finance, Maybank Indonesia Source: Bloomberg

January 3, 2016 190
Economics
Fig 12: Thailand – Infrastructure Capex (THBb) Fig 13: Philippines – Public Infrastructure Expenditure (PHPb)
Source: Fiscal Policy Office Source: Department of Budget & Management
Currency Divergence USD vs the Rest. The key impact of the divergence in growth and policies, especially on the monetary policy front, is the continued firm US Dollar in 2016 given the normalization in US interest rate policy and the accommodative monetary policy stance elsewhere. While the FX markets are expected to remain volatile during the course of 2016, our FX Research Team sees the USD Index on average gaining mainly at the expense of EUR, AUD and Asia ex-Japan currencies (Fig 14). Fig 14: Currencies vs USD 30 Dec 2015 End 1Q 2016 End 2Q 2016 End 3Q 2016 End 4Q-2016 Average 2015 Average 2016 DXY (Dollar Index) 98.2 101.7 101.6 99.8 98.0 96.3 99.9 Japanese Yen 120 122 124 122 120 121 122 Euro 1.09 1.04 1.04 1.06 1.08 1.11 1.06 Pounds Sterling 1.48 1.56 1.58 1.60 1.62 1.53 1.57 Australian Dollar 0.73 0.74 0.70 0.68 0.70 0.75 0.71
Renminbi 6.49 6.55 6.60 6.80 6.70 6.28 6.60 Indian Rupee 66.44 66.50 67.50 68.00 67.00 64.14 67.09 HK Dollar 7.75 7.80 7.80 7.80 7.80 7.75 7.79 Taiwan Dollar 32.94 33.30 33.40 33.40 33.50 31.77 33.31 Korean Won 1,173 1,140 1,160 1,180 1,200 1,131 1,171
Singapore Dollar 1.41 1.41 1.42 1.44 1.47 1.37 1.43 Malaysian Ringgit 4.29 3.95 4.10 4.15 4.15 3.90 4.13 Indonesian Rupiah 13.788 14,000 14,200 14,400 14,500 13,393 14,178 Thai Baht 36.01 35.50 36.00 36.50 36.50 34.25 36.10 Philippines Peso 46.97 48.00 48.00 47.80 47.80 45.53 47.71 Vietnamese Dong 22,500 22,750 23,000 23,210 23,450 21,919 22,982 Source: Maybank FX Research

January 3, 2016 191
Economics
Outlook & Lookout remain data-dependent & event-driven Growth, policy and currency divergences contributing to persistent market and currency volatilities that could affect growth prospect. There are several key factors behind this i.e. the continuing guessing game on US monetary policy; China’s economic and currency policy outlook; and emerging markets’ capital flows overhangs. Continued guessing game on post-liftoff US interest rate. Fed is guiding for an average of 100bps p.a. hikes in 2016-2018 but market is more sanguine about the pace of US interest rate increases, pricing in an average 50bps p.a. rise in 2016-2017 (Fig 15). And as per Fig 3 earlier, markets are expecting the hikes in 2016 to be most likely in Mar or Apr FOMC meetings, to be followed by either Sep or Nov FOMC meetings. We are looking at 50-75 bps hikes in FFR in 2016. Fig 15: US FFR Hikes: Fed’s Guidance, Market Expectations & Historicals
Sources: FOMC, Bloomberg
Divergence between Fed’s guidance and market expectations on FFR. On both account, this round of FFR hikes is set to be the slowest compared with historical average of +238bps p.a. (based on the last five rounds of FFR hikes). But the divergence between Fed’s guidance and market expectation on the way forward for FFR after the anticipated liftoff in Dec 2015 underscore the transmission gap between Fed’s communication and market’s interpretation i.e. either Fed is “too aggressive” or “over-estimating” or markets are “too conservative” or “under-estimating” on FFR future path. FFR hikes going forward remain data-dependent. This is amplified by the fact that the US interest rate liftoff is based on the job market data only, as per the trends the Fed’s Labour Market Condition Index that are in line with their trends during historical rate hikes. However, the other key economic indicator that matters to Fed’s monetary policy dual mandates of stable employment and prices i.e. inflation is not in sync with the levels and trends during previous FFR increases. It diverged from – and remain far below – the 2% target i.e. Fed’s preferred measure of inflation, private consumption expenditure (PCE) deflator at 0.4% YoY as of Nov 2015. In particular, further FFR hikes after the job data-driven liftoff require justification on the inflation front (Fig 16). This may be “challenging” within the context of the “low-for-longer” crude oil price environment given recent development that saw OPEC effectively suspending its 30m bpd output quota at its 4 Dec 2015 meeting, at least until the next scheduled meeting in June 2016. This indicates that the Saudi-led group of major crude oil producers will continue

January 3, 2016 192
Economics
to pump out crude oil over the suspended quota, especially with the expected additional output from Iran as the prospect of lifting the nuclear-related trade sanctions on the country brightened after the International Atomic Energy Agency (IAEA) closed its investigation into Iran’s past nuclear activities. To note, Fed expects – and is confident - that inflation rate will rise towards 2% in the medium term as “the transitory effects of declines in energy and import prices dissipate and the labor market strengthens further”. Fed’s median inflation rate forecasts are such that the PCE deflator is expected to rise from 0.4% this year to 1.6% next year, 1.9% in 2017 and reach 2% in 2018. Fig 16: US – FFR (% p.a.), Labour Market Condition Index & Private Consumption Expenditure Deflator (% YoY)
Source: Bloomberg
Fed’s monetary policy decision can be event-driven as well. Recall that the delayed liftoff also demonstrated the influence of events on Fed’s decisions, notably global financial and currency market volatilities such as the Greece debt crisis, the emerging market turmoil and the China factor during the course of 2015. These events have prompted Fed to include “international developments” as one of the factors in its risk assessment and interest rate decision as per the FOMC statements since Jan 2015. In the latest FOMC statement, the Fed indicated that “readings on financial and international developments” are still part of the risk assessment and decision making process. Further source of market and currency volatility is the “inconclusive” market impact of past FFR hikes. Our study on the market impact during past episodes of FFR hikes (Fig 17) showed mixed impact on USD while the impact on other asset classes like Asian currencies, global equity, global bond and commodity prices were mostly positive than negative. However, the downsides to the asset markets and currencies from then may be triggered by the shift in US monetary policy if it conclusively reverses the “super-cycles” in USD, commodity prices and global bond by adding to other factors like risk-aversion in emerging markets and China slowdown that have caused USD index, commodity price index and global bond index to break their 10-30 year trends (Figs 18-20).
Fig 17: Impact on Currencies, Equities, Bonds & Commodities During US Interest Rate Hikes Periods of FFR Hikes US Dollar Index Asian Currency
Index Emerging Markets Currency Index
MSCI Global Equity Index
JP Morgan Global Bond Index
Global Commodity Price Index
Mar 1988 - Feb 1989 4.9 - - 15.1 2.4 11.8
Feb 1994 - Feb 1995 (10.1) 0.7 (3.2) (4.7) 5.0 14.1
June 1999 - May 2000 6.3 0.5 (7.4) 12.6 (1.7) 4.3
June 2004 - June 2006 (4.2) 6.4 8.6 28.9 8.6 12.8
Source: Bloomberg

January 3, 2016 193
Economics
Fig 18: USD Index
Source: Bloomberg
Fig 19: Global Commodity Price Index
Source: Bloomberg
Fig 20: Global Bond Index
Source: Bloomberg
China’s economic and currency outlooks are the other major lookout. China’s economy grew by 6.9% YoY in 3Q 2015, the first sub-7% quarterly growth since 1Q 2009. The Government has accepted the reality of sub-7% growth as the “new normal” given the target annual real GDP growth of 6.5% for the 13th Five Year Plan period of 2016-2020.

January 3, 2016 194
Economics
Beginning of sub-7% growth. We expect China’s economy to grow by 6.6% in 2016 (2015E: 6.9%). The downside to China’s growth outlook is the attendant risk of leveraging. China’s current bank credit to GDP ratio already surpassed the highs for Thailand and Malaysia during the Asian Financial Crisis 1997-1998 (Fig 21). At the same time, we are seeing diminishing returns from leveraging on growth given the observed divergence between bank credit to GDP ratio and real GDP growth since 2011 (Fig 22). This in turn raised questions on the efficiency and effectiveness of resource allocation in the economy amid the policy stimulus to boost credit and growth, especially with the rising NPLs (Figs 23-24) which raise the financial imbalance and stability risks. Fig 21: East Asia: Bank Credit to GDP (%) Fig 22: China – Leverage Ratio vs GDP Growth
CH – China, SK – South Korea, SG – Singapore, MY – Malaysia, INDO – Indonesia, TH – Thailand, PHP – Philippines, VN - Vietnam Source: CEIC
Sources: Bloomberg, CEIC
Fig 23: China – Banking System’s NPLs Fig 24: China – Banking System’s NPLs
Source: Bloomberg Source: Bloomberg
Risk of weaker CNY adding to currency market headwinds. China’s aggressive monetary policy easing amid falling exports (Fig 25) in the face of appreciations in CNY’s trade-weighted effective exchange rates (Fig 26) and capital outflows (Fig 27) have resulted in renewed pressures on both onshore and offshore USDCNY in late-2015 after the surprised devaluation in early-Aug 2015 (Fig 28) . Weakening CNY can add to the headwinds facing regional currencies from the US monetary policy tightening and strengthening USD. Our FX Research team expects CNY to weaken vs USD to 6.70 by end-2016 from 6.44 as at 10 Dec 2015, and their analysis is that regional currencies like MYR, KRW, IDR, TWD and SGD together with AUD are most sensitive to changes in CNY (Fig 30).

January 3, 2016 195
Economics
Fig 25: China – Export & Import (% YoY) Fig 26: CNY Real & Nominal Effective Exchange Rates (% chg)
Source: Bloomberg Source: Bloomberg
Fig 27: China – Net Capital Flows (USDb) Fig 28: Onshore & Offshore USDCNY
Source: Bloomberg Source: Bloomberg
Fig 29: China – External Reserves (USDb) Fig 30: Impact of 1% chg in USDCNY on Major & Regional
Currencies (% chg, vs USD)
Source: Bloomberg Source: Maybank FX Research
Emerging markets’ capital flows “overhang”. Emerging markets have experienced a more sustained monthly net portfolio (equity & debt) outflows only since July 2015 up to the latest data as of Nov 2015 (Fig 31), setting 2H 2015 to be the first half-yearly net outflows since 2H 2008. Consequently, on cumulative basis, the emerging markets as a whole have yet to see a major reversal to the earlier influx since 2009 (Fig 32). Notably, the data indicated that only Malaysia has seen significant reversal in the cumulative net portfolio flows (Figs 33) as opposed to the other large and regional emerging markets (Figs 34-36). Such “overhang” represents a risk to the emerging markets in terms of liquidity and funding costs, in turn feeding onto growth, market and currency outlooks, in the event of big shift in risk appetite on the emerging markets causing disorderly market reactions and movements.

January 3, 2016 196
Economics
Fig 31: Emerging Markets – Net Portfolio Flows (USDb) Fig 32: Emerging Markets – Cumulative Net Portfolio Flows (USDb)
Source: Institute of International Finance (IIF) Source: Institute of International Finance (IIF)
Fig 33: Malaysia - Cumulative Net Portfolio Flows (USDb) Fig 34: China - Cumulative Net Portfolio Flows (USDb)
Source: Department of Statistics Source: CEIC
Fig 35: Non-Asian Large Emerging Markets – Cumulative Net Portfolio Flows (USDb)
Fig 36: Asian Emerging Markets – Cumulative Net Portfolio Flows (USDb)
Source: Institute of International Finance (IIF) Source: Institute of International Finance (IIF)
Also keeping our eyes on world trade, which has been a disappointment in 2015. World trade was a drag rather than a drive to the world economy – especially Emerging Asia (Figs 37-40). Major exporting regional economies like Japan, South Korea and Taiwan are seeing rises in their manufacturing inventories-to-sales ratios as China goes through inventory adjustments (Figs 43-45), and trends in these indicators should bear close scrutiny to seek signs of improvement in the moribund world trade. Over the medium-to-long-term, actual and prospective multilateral trade pacts like the Trans Pacific Partnership (TPP), Trans-Atlantic Trade & Investment Partnership (TTIP), Regional Comprehensive Economic Partnership (RCEP) and ASEAN Economic Community (AEC) have the potential to be the catalysts to revive world trade. To note, the last big event on world trade was China’s entry into the World Trade Organisation (WTO) in 11 Dec 2001 that integrated China with the world economy and boosted global trade and investment flows.

January 3, 2016 197
Economics
Fig 37: World Trade Growth (% YoY) Fig 38: World Trade Volume by Key Economies & Regions (2015YTD, % YoY)
Sources: CEIC, IMF Source: CEIC
Fig 39: World Exports Volume by Key Economies & Regions (2015YTD vs 2014, % YoY)
Fig 40: World Imports Volume by Key Economies & Regions (2015YTD vs 2014, % YoY)
Source: CEIC Source: CEIC
Fig 41: World Trade Value as % of Nominal Global GDP Fig 42: Contribution of World Trade Value to Nominal GDP
Growth (percentage point chg)
Sources: CEIC, IMF, Maybank KE Sources: CEIC, IMF, Maybank KE

January 3, 2016 198
Economics
Fig 43: Manufacturing Inventories-to-Shipments Ratio - Japan
Fig 44: Manufacturing Inventories-to-Shipments Ratio – South Korea, Taiwan
Source: Bloomberg Source: Bloomberg
Fig 45: China’s Industrial Inventories (% YoY) Fig 46: Baltic Dry Index
Source: Bloomberg Source: Bloomberg

January 3, 2016
FX
Regi
onal
FX Outlook & Strategy: 2016
Juggling Policy Divergence, RMB Adjustments and Trade Downshift
Divergence (Policy and Asset Prices); Global Trade downshift; and Potential yuan adjustments will be key themes in 2016.
Pace of Fed tightening is a key FX focus in 2016. In an environment of a global trade downshift, as long as growth between G7 and EM does not diverge too much and too fast, EM will be in a comfortable position. Concerns about yuan adjustments in 2016 could also continue to add to currency volatility. There is downside risk for EM if growth fails to pick up with the risk of worsening debt sustainability a possibility affecting EM FX.
Expect USD to be supported. EUR and JPY to stay soft as risk sentiments remains supported. USD/AXJs to see further upside for currencies with signs of weak domestic demand, lower fiscal capacity and potential idiosyncratic risks.
Summary Macro themes in 2016 will continue to be driven next year by a number of key factors. First the pace of the Fed tightening will be a key focus in asset price discovery process. It is likely to lead to continued FX volatility in 2016 at specific intervals. The Fed is likely to reiterate data dependency and gradual tightening rhetoric over the course of next year. Overall US macro policy base case may not be overly hawkish and softer China transitional growth should continue to retain EM growth concerns. There could be potentially downside risks for EM if growth fails to pick up and if debt sustainability concerns emerge from rates increases. The dollar should remain supported from 2Q 2016 onwards. 1Q is likely to see some weakness following expectations of additional stimulus from the ECB, seeing some mild rally in risk proxy currencies suich as AUD. Historically, the dollar tends to soften within 6 months following the first rate hike. Furthermore the next rate hike is only expected in end 2Q 2016.
Second, the extent of global trade downshift and falling global trade elasticities has an impact on the currency outlook next year. Nominal exchange rate volatility might be accentuated if extent of the “expenditure-switching effect” is small due to the falling trade elasticities. The smaller the effect of exchange rate changes on relative prices, and hence on relative demands, the larger the exchange-rate change is required to reach equilibrium. As such, we expect next year to see further exchange rate adjustments if this falling trade elasticities continue. As the markets try to normalise next year, “expenditure reflation” - first phase in the recovery from a slump before the stage of full employment and inflation is reached - requires an increase in total expenditure on goods and services. This phase of reflation, and eventual investment recovery we think will be slower this time round.
Analysts Saktiandi Supaat [email protected] (+65) 63201379 Fiona Lim [email protected] (+65) 63201374 Leslie Tang [email protected] (+65) 63201378 Christopher Wong [email protected] (+65) 63201347

January 3, 2016 200
FX Research
Third, China becoming more market determined will have impact on a portion of global currencies. The combination of capital account liberalization and weak fundamentals at the moment simply implies downside pressure for the yuan. With domestic individuals and corporates likely keener (and even encouraged) on investing in overseas assets as opposed to domestic assets, a more liberalized capital account is likely to see more outflows and concomitantly, weaker yuan.
We expect the dollar index to come in at around 98-102 range next year. Generally, affected by (1) the pace of Fed hikes; (2) US growth trajectory and (3) continued central bank monetary policy divergence moves from Japan (potentially more printing) and Eurozone (ECB further QE in 2016).
EUR is expected to face further downside pressure over the next 3 – 6 months amid further monetary easing, as ECB remains worried about subdued inflation. Beyond 6 months, we expect EUR to stabilize around 1.04 levels and gradually inch higher towards 1.08 into 2016-end, as monetary easing slows amid a pick-up in inflation off the back of oil prices stabilizing.
JPY weakness should continue in the near term as stimulus remains (though no further easing measures from the BOJ are expected) and on the imminent Fed fund rate lift-off. In 2016, the risk environment could reverse and lift the JPY higher. The slowdown in global growth and potential US political uncertainty could encourage safe-haven/flight-to-quality plays that could push the JPY higher. Target JPY to end-2015 and -2016 at around 124 and 120 respectively.
In 2016, we expect USD to remain supported and as such we are broadly bullish on the USD & GBP (but with some short term weakness for GBP). We remain negative on low yielding currencies such as the JPY and EUR. Both are expected to remain remain soft as risk sentiment continues in 2016. Risk proxies like AUD could be supported on dips, unless commodity prices decline sharply (worse case scenario).
We are cautious on Asia EM FX. As long as growth differentials between G7 and EM does not diverge too much and too fast, EM will be in a comfortable position. The downside for EM would be worsening debt sustainability arising from rates increase. If G7 growth picks up too fast and inflation rises, not translating into external demand, there will be risks for EM. Domestic demand support remains strongest for Philippines. China yuan depreciation scenario in 2016 remains a concern and may add to volatility on EM FX.
USD/AXJs should still see further upside. We remain bearish on currencies with signs of weak domestic demand, lower fiscal capacity and with uncertain sovereign credit situation as well as those with potential idiosyncratic risks in 2016.
With the December FOMC out of the way, we expect risk appetite to be supported into the turn of the year amid accommodative monetary conditions globally. ECB could be at risk of further monetary easing (if inflation refuses to pick up, due to lower oil prices for longer) while other major central banks including the BoJ, PBoC, BoC, RBA, RBNZ are also not expected to step away from their easing bias any time soon. These should support risk proxies including equities, commodity prices and AXJs (i.e. AUD, KRW, etc.). USD is expected to have a mixed profile – weaker against risk proxies but firmer against low yielding currencies such as EUR, CHF.

January 3, 2016 201
FX Research
For 2Q 2016, market expectation for Fed to tighten is expected to be re-built, leading to reduction in risk appetite and a build-up of USD long positioning against risk proxies including AXJs. Our base case assumption for Fed to next hike in 2Q 2016.
For 2H 2016, we turn more cautious on risk appetite and AXJs. Downside risks for EM include worsening debt sustainability amid rising interest rates, especially in an environment where G7 majors (US, UK) growth and inflation picks up faster than expected. These could prompt the respective central banks to adjust their forward guidance with a bias for steeper than expected pace of tightening. Bond positioning will adjust, with debt being sold off while yields rise in tandem. EM could risk a debt sell-off and see portfolio outflows, and these could pose risk to EM debt sustainability (especially if growth between G7and EM diverge). Some Strategies We Like For 2016:
1. Long Risk Proxies Post-FOMC into Turn of the Year (Tactical Trades)
Against a backdrop of supported risk appetite post-FOMC in Dec 2015 amid accommodative monetary conditions globally and Fed to reiterate gradual pace of tightening rhetoric, we expect potential relief rally in risk proxies including AUD and some AXJs (i.e. KRW). There could even be scope for USDCNH to unwind some of its recent longs, given skewed positioning. We also like to express our view via short EURAUD, given that EUR remains inversely correlated with risk assets (correlation coefficient strengthened since 6 months ago). A supported risk appetite environment should support risk assets and see EUR softer.
- Sell EUR/AUD on rallies towards 1.5380 (100 DMA) – 1.5530 (61.8% fibo retracement of Sep high to Dec low), targeting first objective at 1.4850 (200 DMA) before 1.4350 levels (Dec lows). S/L placed above 1.5820 (76.4% fibo).
- Tactically Sell 3m USDKRW NDF on rallies towards 1192, targeting a move towards first objective at 1156 (50 DMA), before 1140 (200 DMA). S/L placed above 1215 (Sep highs).
2. AXJ Relative Value Trades on Growth/ Policy Divergence
Within the Asia FX space, we see growth and monetary policy divergence, and this give rise to relative trades. In particular we favour PHP, INR and MYR over THB, IDR, SGD and CNY.
- Short CNY/INR and on rallies towards potential double-top of 10.50 (spot-ref), targeting a move towards initial target of 10.20 before 10.00 (100 DMA). SL at 10.66. Increasing growth differentials between the two giant Asian economies and positive yield differentials (positive carry in favour of INR) make this trade viable. This trade thrives on stable oil prices, low inflation and a gradual pace of Fed rate hike trajectory which would benefit the INR more than the CNY.
- Sell THB/PHP on rallies towards 1.3250 (200 DMA), targeting 1.2750 objective (Sep low). SL at 1.35. Key drivers for the trade include growth divergence and positive carry in favour of PHP.
- Sell CNY/MYR on rallies towards 0.6725 (50% fibo retracement of Oct high to low), targeting an initial move towards 0.63 (200 DMA), before 0.61 levels at end-2016. We see the cross trending lower in 2016 due

January 3, 2016 202
FX Research
to a divergence in the respective currencies outlook (weaker CNY vs. stronger MYR). MYR positivity due to combination of drivers including, slowly dissipating concerns of domestic issues, relative stability in oil prices, resilient domestic demand and these are supporting investor sentiment. CNY negativity drivers include lower growth targets, high debt and a more market determined yuan (which we expect to see further weakness).
- Buy MYR on dips vs IDR towards 50 DMA at 3210, targeting 3540 (76.4% fibo retracement of May high to Nov low). SL below 3100 (Nov low), on policy divergence (we expect BI to cut rates twice while BNM is likely to remain on hold in 2016) and relative stability in oil prices. Dissipating concerns of domestic issues should also support MYR while BI easing cycle could resume amid low inflation, sluggish growth and high borrowing costs.
- Sell SGD/MYR towards 3.10, targeting initial target at 2.90 (38.2% fibo retracement of Sep 2014 low to Oct 2015 high), before 2.8275 objective (50% fibo). SL above 3.15. We expect continued SGD weakness amid sluggish external demand and ongoing domestic re-structuring efforts to raise productivity. MYR positivity due to combination of drivers including, slowly dissipating concerns of domestic issues, relative stability in oil prices, resilient domestic demand and these are supporting investor sentiment.
3. A Measured CNH Depreciation Trade
We reiterate our 6M USDCNH call spread strategy 6.55/6.75, using a 2:1 call ratio for zero cost structure, entered on 26 Nov 2015. Our long USDCNH view is underpinned by strong USD demand, weak domestic fundamentals, capital account liberalization, tempered by intermittent PBOC intervention.
4. Re-establish USD longs vs AXJs from 2Q 2016
As expectation for Fed to tighten re-builds from 2Q, we expect this to lead to some reduction in risk appetite and a re-establishment of USD long positioning against risk proxies including AXJs. We look to buy USD vs KRW, SGD, IDR on dips.
Our Base Assumptions
Our FX outlook is based on the assumption that oil prices will remain at an average price of US$50-60/bbl for 2016. The oil outlook is positive for Asia (medium term) and should boost consumption. A prolonged period of low oil prices could worsen or improve fiscal balance of some regional economies. We assume a total of 75bps hike over the next 5 quarters (two 25 bps in end 2Q and 4Q 2016) from the start of a hike in Dec 2015.

January 3, 2016 203
FX Research
USD: Dollar View Remains Forecast 1Q 2016 2Q 2016 3Q 2016 4Q2016
USD Index 101.73 (100.75)
101.63 (98.03)
99.81 (96.73)
98.00 (96.32)
Previous Forecast in Parenthesis
Motivation: We remain mildly bullish on the 2016 dollar outlook. The DXY is currently at 100.14 (as at 30 Nov 2015 @11.30am). Firmer US data and rising expectations of the Fed rate hike in Dec 2015 have been supporting the USD. Further developments out of Eurozone with rising market expectations of an ECB easing in 1Q has led to some changes in EUR and GBP, thus affecting the DXY to some extent via the interest differential perspective. We continue to expect a gradual pace of Fed tightening in 2016 and hence should not see excessive US strength but a rather supported USD. We expect the dollar to strengthen in 1Q towards 102, before moderating in the rest of 2016 and end 2016 at around 98.00, barring no global shocks.
Oil remaining soft could be dollar positive. Global crude oil prices and commodity prices is likely to remain soft and in tight range. Limited upside in long-term interest rates, partly driven by concerns in the global macro outlook could help offset any shocks to the US real economic growth. This remains dollar positive.
Likelihood of a Fed rate hike and rising 2-year rate differentials to support USD. The trade weighted dollar should be stronger if not for the Fed’s signaling inconsistencies in between FOMC announcements and lack of 2016 policy forward guidance. In the medium term, there could still be USD trade weighted support as the 2-year rate differentials will rise further from current 0.922 levels (30 Nov 2015).
The recent US economic development supports a medium-term USD bullish view and we continue to expect the USD to strengthen across the board as the US growth gathers momentum in 2016 with pick up in the housing markets, a modest pick-up in inflation and wages and a further improvement in labor market conditions. Thus far, stronger private consumption continues to underpin the US recovery, as households benefitted from lower oil prices, steady employment growth and modest wage increases. Even as new home sales volumes reached a post crisis high in 2015 and inventories for homes available for sale have been pared back, gross fixed capital formation or investment as continued to disappoint. On a sectoral basis, US economic activity seems to have been driven more by services rather than manufacturing which has a higher import content. Our economics team sees US GDP growth likely to come in at 2.4 % this year and 2.3% in 2016.
The strong dollar has also led to the ongoing deceleration in US production and net exports. These developments suggest that the moderate recovery in the US may not generate large positive spillovers for the rest of the world including the trade oriented Asian economies. Conversely, weakening growth in emerging market economies may restrain US economic activity somewhat.
Core PCE inflation has also not risen significantly even as headline unemployment rate has fallen to 5.1%. Both CPI and core CPI will likely remain on an uptrend in 2016 close to the Fed’s 2% long-term target but weighed by lower energy prices, stronger dollar and food inflation. Other labour market developments, such as decline on labour force participation rate and muted wage growth suggest some

January 3, 2016 204
FX Research
slack still remains. Taking that into consideration any policy moves will be gradual and unlikely to derail growth.
Fiscal sustainability risk continues to weigh on the outlook which will likely be marred by political wrangling, particularly before the Nov 2016 presidential election. In the long term, an improved US economy and manufacturing sector, US shale oil and gas production may improve the US current account leading to dollar support but this is likely to be long drawn and may probably begin only in 2016/2017.
Nov 2016 US General Elections: Trump vs. Clinton Dollar Index: Next resistance at 101.80 before 109
Note: The HuffPost Model tracks 51 polls from 17 pollsters; last updated as of 8 Nov Source: Huff Post, Bloomberg, Maybank FX Research

January 3, 2016 205
FX Research
EUR: Downside Pressure to Persist; But No Free-Fall Forecast 1Q 2016 2Q 2016 3Q 2016 4Q2016
EUR/USD 1.0400 (1.0600)
1.0400 (1.0800)
1.0600 (1.1000)
1.0800 (1.1200)
Previous Forecast in Parenthesis
Motivation: Near term weakness (over the next 3 - 6 months) in the EUR, given explicit and concerted comments from ECB officials to do all it takes to achieve its mandate of getting inflation back towards 2% target, pursue price stability so as to contribute to economic growth and job creation. But we caution that EUR movements remain inversely correlated to asset price movements. Together with seasonality trends and over-stretched EUR short positioning, EUR could be exposed to upside risks towards end-2015. Looking out beyond 6 months, we expect EUR to stabilize around 1.04 levels and gradually inch higher towards 1.08 into 2016-end, as monetary easing slows amid a pick-up in inflation off the back of oil prices stabilizing.
ECB to cut deposit rate cut at the 3 Dec meeting by about 10-20bps, and further ECB “verbal intervention” - that it stands ready to unleash unorthodox monetary easing - as ECB remains worried about subdued inflation (+0.1% y/y in Oct 2015). But we do not think there is a need for ECB to rush into expending its monetary policy tools at the Dec meeting unless there is a sudden deterioration in risk sentiment (which is not our base line scenario). Looking into 1Q 2016, we see a high likelihood of ECB announcing further monetary easing via an extension of duration and expanding its asset purchase size. Persistent market expectation for ECB to act and monetary policy divergence between ECB and Fed will continue to weigh on the EUR/USD.
While downside risk on the EUR may persist, we do not envisage a free-fall scenario on a few reasons: 1) EUR moves are inversely correlated with risk assets – that means EUR like most “low yielding currencies” (i.e. JPY, CHF) will be supported if risk sentiment worsens (risk aversion flows); 2) Market remains net short EUR with “sell EUR on rally” one of the popular trade. This suggests that stretched positioning poses an upside risk should position be unwound; 3) EUR still enjoy a double surpluses in broad balance of payment (BBoP) and current account and this should in theory lead to low unemployment, higher wages, higher inflation and eventually lead to EUR strength. But right now this transmission mechanism is missing unless labor market reforms take shape.
Although economic growth has yet to recover to pre-GFC levels, there are signs (via activity data and forward indicators) that conditions could be stabilizing. Bright spot is in domestic demand, which is expected to benefit from ongoing improvement in financial conditions, weaker EUR and softer oil prices. Other concerns we may have are debt and structural unemployment remain high and could weigh on long-term growth potential.
Growing monetary policy divergence to weigh on EUR Inverse correlation between EUR and risk proxies remain intact
Source: Bloomberg, Maybank FX Research

January 3, 2016 206
FX Research
GBP: Positive Outlook and Patiently Waiting for BoE Forecast 1Q 2016 2Q 2016 3Q 2016 4Q2016
GBP/USD 1.5600 (1.5800)
1.5800 (1.6000)
1.6000 (1.6200)
1.6200 (-)
Previous Forecast in Parenthesis
Motivation: Remain positive in GBP outlook over the forecast horizon, notwithstanding some near term weakness towards 1.48-1.50 levels in the next 2-3 weeks before rebounding. Ongoing economic recovery warrants a shift in monetary policy stance at some point in 1H 2016. This will result in monetary policy divergence between BoE and other G7 majors (ECB, BoJ, RBA, RBNZ - which are expected to remain on an easing bias next year). But before that happens, we caution that GBP could face some downside pressure towards 1.48-1.50 levels amid further monetary policy divergence between Fed and BoE. Looking into 2016, downside risk to our outlook includes a slower than expected pick-up in inflation and EU referendum (over Britain’s future in EU) which could potentially take place in mid-2016 instead of 2017.
Ongoing economic recovery remains intact, supported by domestic demand and solid labor market. UK is still enjoying its longest streak of continuous growth since falling into GFC in 2008, supported by resilient domestic demand. Labor market continues to improve with unemployment rate falling to 7-year low of 5.4% while wage growth remains on an uptrend.
A shift in BoE stance from dovish to hawkish is expected in 1H 2016, and this is expected to lend strength to GBP (interest rate differentials). With market currently pricing a rate hike only sometime in late 2016 - early 2017 (we are more optimistic than consensus), this suggests that the market could be underpricing upside risks. Moreover, CFTC positioning (although this can be fickle) for GBP showed short exposure have re-emerged since Oct 2015, and this reflects a bearish bias in the currency. Taken together, this could pose further upside risks when market rebuilds expectation for BoE to tighten. That said, we believe BoE will continue to be cautious (via dovish talks) to prevent any excessive GBP strength, from derailing economic recovery efforts. As such we do not expect BoE to jump the queue ahead of Fed.
Risks to our GBP outlook are inflation stays low for longer; growth/activity data loses momentum; government borrowing blow-up risks and Brexit risks. Brexit could pose risk to UK’s growth prospects via trade, financial channels and exert downside pressure on GBP. CPI inflation remains subdued (Oct inflation at -0.1% y/y) and could pose a “delay risk” for BoE to make a shift in its monetary policy stance.
GBP short positioning and yield differential suggests upside risk in GBP is underpriced
Subdued inflation poses a ‘delay risk’ in BoE monetary policy stance
Source: Bloomberg, Maybank FX Research

January 3, 2016 207
FX Research
AUD: Volatile Range Trading Has Begun Forecast 1Q 2016 2Q 2016 3Q 2016 4Q 2016
AUD/USD 0.74 0.70 0.68 0.70
No Change from Previous Forecast
Motivation: We see intermittent spikes on fiscal and monetary boosts from China, keeping AUD in a volatile range with no directional bias for the currency. AUD has been trading in a volatile range within 0.69-0.74 since the start of Sep. The nascent signs of bottoming that we had identified at that point of time has started to play out. Growth is likely to remain sub-par with benefits of a cheaper dollar not entirely feeding through into the economy. Just as we do not expect much upsides to growth, we do not see serious deterioration in the economy as well and the current cash target rate at 2.00% will remain appropriate for the rest of 2016. Key swingers are still China’s growth prospects and commodity though much of the commodity slump has been in the price of the AUD.
Growth is below trend. The main driver of growth has been from the household consumption, underpinned by the surprisingly resilient labour market. Downside risks exist as we eye the mortgage rates which have crept higher and its impact on private consumption. Meanwhile, the 3Q CAPEX numbers reveal little positive sentiments from the corporates with lower spending projections made for the year ahead as compared to those made at this time last year. The silver lining in the cloud is the fact that projections made are still higher than those made in the previous quarter, across industries. The cheapened Australian dollar has increased visitor arrivals in Aug and Sep and lower AUD to improve export oriented corporate earnings. An improvement on those fronts, along with a possible upturn in global demand could aid in economic rebalancing towards non-mining sectors.
Sluggish Commodities – Priced In. AUD has been adjusting to the decline in the terms of trade. Much of the commodity slump has been priced in when AUD touched a low of 0.6896 in early Sep. We think the biggest part of the commodity slump (metals and coal) have priced in the drop in demand for China. Even as China stabilized, prices are likely to remain sluggish capping AUD. Expect fiscal measures and possibly more synergies in the One Belt One Road plan that could produce intermittent spikes in the AUD.
RBA To Retain Easing Bias For a Long While. Given the downside risks to growth, RBA is likely to retain an easing bias to growth for most of 2016. A key reason is the fact that we do not see immediate dangers of serious economic deterioration. Australia requires a structural improvement in the economy rather than greater monetary accommodation. Businesses lack the confidence to invest because they have not seen the demand for their goods and services. That could come as the full benefits of a cheaper AUD feeds into the real economy along with a possible improvement in global demand.
Sluggish Commodity is in the Price Private Consumption Not at Risk of Deterioration
Source: Bloomberg, CEIC, Maybank FX Research

January 3, 2016 208
FX Research
NZD: Turning More Bearish Forecast 1Q 2016 2Q 2016 3Q 2016 4Q2016
NZD/USD 0.6400 (0.5900)
0.6100 (0.6200)
0.6200 (0.6500)
0.6300 (0.6700)
Previous Forecast in Parenthesis
Motivation: We turned more bearish on the NZD, due to a combination of factors including high risk of current account deficit widening further, declining ToT amid weakening demand, moderating growth outlook, benign inflation, soft dairy prices for longer and growing divergence of monetary policy between Fed and RBNZ. As such, we revised lower our FX forecasts from 2Q to end-2016 to reflect our bias. However we raised our FX forecasts for 1Q 2016 given the recent build-up in NZD long position and RBNZ’ which saw the concomitant move in NZD spot.
Current account deficit has widened to levels not seen since 2013, and could potentially widen further from current -3.5% of GDP (as of 2Q) given the downshift in trade (NZ experienced 8 trade deficits YTD), and together with falling terms of trade (ToT), this could re-assert further downside pressure on the NZD.
NZ continues to experience a period of structurally low inflation, especially with inflation still near 15-year lows and wage inflation remains benign near 2010 levels. To make matters worse, dairy prices is still on a decline since 2014 highs and remains well below its 5-year average. Dairy prices are expected to remain low for longer until global dairy over-supply and under-demand dynamics adjust. This is unlikely to happen soon, especially with deregulation of US and EU dairy markets (which seen a flush of dairy supply) while demand remains soft as China demand has yet to recover due to rise in domestic production and build-up in inventory while sanctions in Russia also reduce demand.
Growth outlook is expected to moderate further in 2016 as rebuilding activity in Canterbury (post-2010 earthquake) peaked and sluggish dairy prices continue to weigh on exports. Recent domestic data have also disappointed – both manufacturing and services PMIs slipped and unemployment rate inched higher. The only bright spots are in services and construction sectors – which have continued to hold up amid accommodative monetary conditions, strong surge in migrant numbers and tourist arrivals.
Growing divergence in monetary policies between Fed and RBNZ will exert downside pressure on the NZD. Furthermore RBNZ remains in favour for further depreciation to support sustainable growth. With NZD position still net long, there is even bigger risk for further NZD downside.
Current account deficit expected to widen further Prices remain subdued at multi-year lows
Source: Bloomberg, Maybank FX Research

January 3, 2016 209
FX Research
JPY: Lifts From No Further BOJ Easing, Safe-Haven Plays Forecast 1Q 2016 2Q 2016 3Q 2016 4Q 2016
USD/JPY 122 (125)
124 (125)
122 (125)
120 (125)
Previous Forecast in Parenthesis
Motivation: We are positive on the JPY outlook in 2016 as we no longer expect any further additional easing measures from the BOJ. Near-term weakness in the JPY by year-end is possible as reflected in market positioning (increase in net JPY-shorts) in anticipation of the Fed lift-off in Dec. This should encourage further fund outflow in search of higher returns, which could prove transitory as China-led global growth and US political risks weigh on the pair. The riskier global environment in 2016 could lead to a flight to quality/safe-haven plays that could weigh on the USD/JPY.
No additional BOJ easing measures are expected in 2016, given the optimistic outlook for the economy as well as the extension of the timing of hitting the 2% inflation target to the latter half of FY 2016, i.e. into 1Q 2017. As well, any bounce in the USD/JPY above the 125-levels could undermine both SMEs’ and consumers’ confidence, and this could be politically unpalatable especially ahead of the Upper House election (for half of the 242 seats) in early 2016 summer. A risk to this outlook though could come from the ECB should it decide to add to its existing QE measures, which could pressure the EUR/JPY lower. A drop in the EUR/JPY below the 125-levels to lows not seen for the past two years could elicit a response from the BOJ.
The market continues to position for further JPY weakness ahead as reflected in the latest positioning data where net JPY-short increased to 78611 contracts in the first four weeks of Nov vs. 3639 on 15 Sep. The positioning is likely in anticipation of the Fed lift-off in Dec that should intensify their policy divergence and encourage greater outflows from Japan in search of higher yields. This suggests downside risks to the JPY ahead but the slide lower might not be as large as in the early part of 2014 given the relatively smaller number of contracts compared to Jan 2014. Thus further USD/JPY upmoves should be capped around the 124-levels by year-end.
Deteriorating global risk environment could see flight to quality/safe-haven plays to Japanese assets. The ongoing ultra-loose monetary policy of the BOJ as well as the continued outflow of Japanese funds overseas in search of higher returns to keep the USD/JPY supported. However, risk sentiments could deteriorate in 2016 on a China-led global slowdown and political uncertainty from the US presidential elections in Nov 2016. The resultant negative impact on the Nikkei could drag the USD/JPY along with it, given the positive correlation between the two. Thus, the deteriorating global risk environment could see investors fleeing to safer and higher quality assets, particularly Japanese assets and weigh on the USD/JPY.
Net Yen Short Positioning Is Being Rebuilt Portfolio Outflows Should Keep USD/JPY Supported
Source: Bloomberg, CEIC, Maybank FX Research
-140000
-120000
-100000
-80000
-60000
-40000
-20000
0
7/1/20
144/2
/2014
4/3/20
141/4
/2014
29/4/
2014
27/5/
2014
24/6/
2014
22/7/
2014
19/8/
2014
16/9/
2014
14/10
/2014
11/11
/2014
9/12/2
014
6/1/20
153/2
/2015
3/3/20
1531
/3/20
1528
/4/20
1526
/5/20
1523
/6/20
1521
/7/20
1518
/8/20
1515
/9/20
1513
/10/20
1510
/11/20
15
Rebuilding of net Yen-short positioning?
-2,500
-2,000
-1,500
-1,000
-500
0
500
1,000
1,500
2,000
2,500
1/6
/201
4 1
5/6/
2014
29/
6/20
14 1
3/7/
2014
27/
7/20
14 1
0/8/
2014
24/
8/20
14 7
/9/2
014
21/
9/20
14 5
/10/
2014
19/
10/2
014
2/1
1/20
14 1
6/11
/201
4 3
0/11
/201
4 1
4/12
/201
4 2
8/12
/201
4 1
1/1/
2015
25/
1/20
15 8
/2/2
015
22/
2/20
15 8
/3/2
015
22/
3/20
15 5
/4/2
015
19/
4/20
15 3
/5/2
015
17/
5/20
15 3
1/5/
2015
14/
6/20
15 2
8/6/
2015
12/
7/20
15 2
6/7/
2015
9/8
/201
5 2
3/8/
2015
6/9
/201
5 2
0/9/
2015
4/1
0/20
15 1
8/10
/201
5 1
/11/
2015
Foreign Equities Foreign Bonds
JPY bn
outflows
inflows
YTD, the Japanese have invested JPY12.7tnand JPY9.5tn in foreign equities and debt

January 3, 2016 210
FX Research
CNY: More Market-Determined = Weaker Forecast 1Q 2016 2Q 2016 3Q 2016 4Q 2016
USD/CNY 6.55 (6.45)
6.60 (-)
6.65 (6.80)
6.70 (-)
Previous Forecast in Parenthesis
Motivation: We are biased towards a weaker CNY outlook in 2016 and PBOC will guide it against a basket of currencies, officially published by CFETS. China will enter the next half of the decade with lower growth targets, high debt and a more market determined yuan. Fragile fundamentals are likely to keep domestic investors keen on overseas investment. Overseas loans and trade credit outflows will rise as China loosens its control over capital account. Upmove of the USDCNY will be checked by sporadic interventions. We see a low risk of another outright devaluation. Current account surplus could prevent the yuan from depreciating more than 7% from the current value of around 6.40. Expect spot to trend higher towards 6.70 by end 2016 as we expect rate hike speculations to spur another round of dollar dominance. Eyes are on the annual NPC and CPPCC in Mar for growth targets.
Lower growth targets, cracks seen in Consumer. Overcapacity issues will remain until One Belt One Road takes flight along with AIIB. That should keep manufacturing sector under pressure. China’s consumers have become the pillar of growth but we are concerned about the fall in loan demand index for non-mfg and consumer sentiment. State Council should lower growth targets. Fragile fundamentals would continue to see domestic investors prefer overseas assets. Corporates have also been encouraged to seek higher yielding infrastructure investments overseas that could soak up excess production at home and boost exports.
Of high debt, fiscal reforms, social reforms. Total debt ratio of China is 250-300% of its GDP but China will not deleverage much in 2016. Yet, interest rates must be kept low for corporates to refinance their debt and engage in productive investment. We look for at most another interest rate cut of 25bps to 4.10%. RRR can be cut in intervals by another 200 bps to 15.0% (the low seen during the 2008 crisis period). Fiscal stimulus is key. Expect more local government debt to be converted to municipal bonds and more public private partnerships to crowd in private investment, alleviating the burden of the local governments. That should usher in social reforms.
Capital account liberalization – Slowly But Surely. The FX reform on 11 Aug has successfully converged with the daily USDCNY reference rate to spot prices but USDCNY is still trading at a discount to USDCNH. This gap could persist. Administrative measures have been imposed to discourage speculative bets on yuan depreciation. We expect capital account liberalization to proceed at a piece-meal pace. The State Council has pledged complete capital account liberalization by 2020 and the One Belt, One Road goal that will propel China to be one of the biggest net global creditors.
Falling Appetite for Credit CNH-CNY Gap Is Likely to Persist
Source: Bloomberg, CEIC, Maybank FX Research
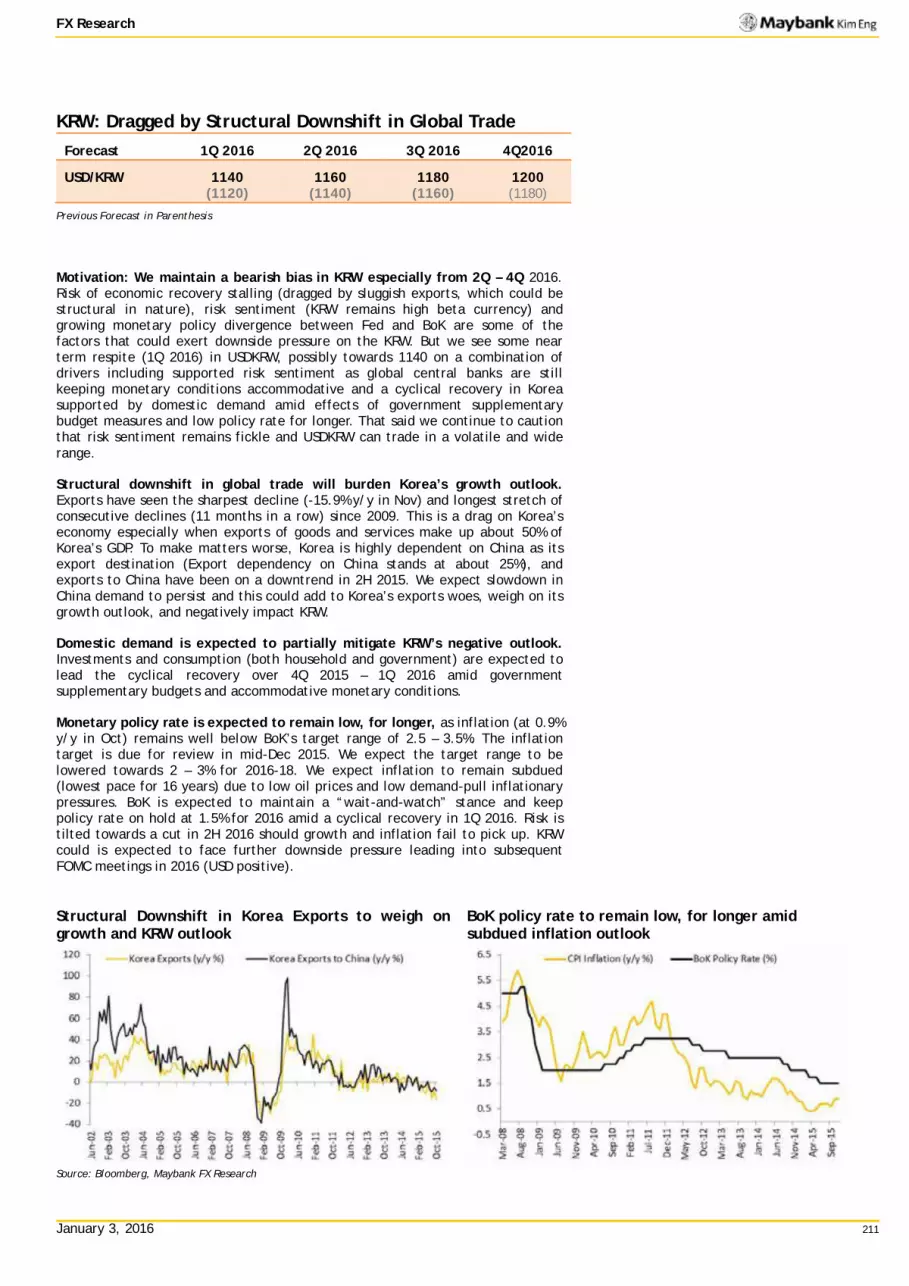
January 3, 2016 211
FX Research
KRW: Dragged by Structural Downshift in Global Trade Forecast 1Q 2016 2Q 2016 3Q 2016 4Q2016
USD/KRW 1140 (1120)
1160 (1140)
1180 (1160)
1200 (1180)
Previous Forecast in Parenthesis
Motivation: We maintain a bearish bias in KRW especially from 2Q – 4Q 2016. Risk of economic recovery stalling (dragged by sluggish exports, which could be structural in nature), risk sentiment (KRW remains high beta currency) and growing monetary policy divergence between Fed and BoK are some of the factors that could exert downside pressure on the KRW. But we see some near term respite (1Q 2016) in USDKRW, possibly towards 1140 on a combination of drivers including supported risk sentiment as global central banks are still keeping monetary conditions accommodative and a cyclical recovery in Korea supported by domestic demand amid effects of government supplementary budget measures and low policy rate for longer. That said we continue to caution that risk sentiment remains fickle and USDKRW can trade in a volatile and wide range.
Structural downshift in global trade will burden Korea’s growth outlook. Exports have seen the sharpest decline (-15.9% y/y in Nov) and longest stretch of consecutive declines (11 months in a row) since 2009. This is a drag on Korea’s economy especially when exports of goods and services make up about 50% of Korea’s GDP. To make matters worse, Korea is highly dependent on China as its export destination (Export dependency on China stands at about 25%), and exports to China have been on a downtrend in 2H 2015. We expect slowdown in China demand to persist and this could add to Korea’s exports woes, weigh on its growth outlook, and negatively impact KRW.
Domestic demand is expected to partially mitigate KRW’s negative outlook. Investments and consumption (both household and government) are expected to lead the cyclical recovery over 4Q 2015 – 1Q 2016 amid government supplementary budgets and accommodative monetary conditions.
Monetary policy rate is expected to remain low, for longer, as inflation (at 0.9% y/y in Oct) remains well below BoK’s target range of 2.5 – 3.5%. The inflation target is due for review in mid-Dec 2015. We expect the target range to be lowered towards 2 – 3% for 2016-18. We expect inflation to remain subdued (lowest pace for 16 years) due to low oil prices and low demand-pull inflationary pressures. BoK is expected to maintain a “wait-and-watch” stance and keep policy rate on hold at 1.5% for 2016 amid a cyclical recovery in 1Q 2016. Risk is tilted towards a cut in 2H 2016 should growth and inflation fail to pick up. KRW could is expected to face further downside pressure leading into subsequent FOMC meetings in 2016 (USD positive).
Structural Downshift in Korea Exports to weigh on growth and KRW outlook
BoK policy rate to remain low, for longer amid subdued inflation outlook
Source: Bloomberg, Maybank FX Research

January 3, 2016 212
FX Research
SGD: External & Domestic Challenges To Persist Forecast 1Q 2016 2Q 2016 3Q 2016 4Q 2016
USD/SGD 1.4100 (1.39)
1.4200 (-)
1.4400 (-)
1.4700 (-)
Previous Forecast in Parenthesis
Motivation: The outlook for the SGD remains dim in 2016 even though no further moves by the MAS are expected. Upside moves to the USD/SGD are expected given the SGD remains overvalued as reflected by our UIP model. Downside risks from domestic and external headwinds should put downside pressures on the USD/SGD, though downside should be limited by the persistent balance of payments surpluses.
Hurdles to further MAS policy adjustments remain high after the two easing moves in 2015 that sent the USD/SGD higher above the 1.40-levels currently from the 1.32-levels in early 2015. These moves were unlikely made to support growth but likely due to the changing outlook for inflation given the steady drop in the global oil prices. More easing could come in 2016 if growth underperforms significantly due to some risk event and/or should the pick-up in core inflation continue to stall. For now, core inflation is predicted to tick higher next year due to the fading effects of lower oil prices and the budgetary measures, which should allow the MAS to maintain its “modest and gradual appreciation” stance in 2016.
Climb in domestic interest rates could portend further upside risks to the USD/SGD. Our uncovered interest parity (UIP) model, which suggests that the SGD remains overvalued, could see further upside adjustments to the current levels of the spot USD/SGD. The expectations of a Fed fund rate hike in Dec are likely to drive the pair higher. The adjustment is already taking place as reflected in the uptick in the 3M SIBOR to around the 1.07%-levels, though this was off the year’s high of 1.14% (end-Sep), but which was still significantly above the 0.4% seen at the start of the year. This rapid jump in the interest rate suggests the potential for further USD/SGD upside ahead.
Risks to the SGD are to the downside as domestic and external headwinds weigh on the economy. Domestically, the ongoing restructuring of the economy away from reliance on foreign labour towards productivity-driven growth has resulted in the economy underperforming. Still soft global crude oil prices should be beneficial to the domestic economy Externally, the sluggish global growth outlook driven by a slowdown in China, the imminent lift-off in the Fed fund target rate, as well as the uncertainty arising from the US presidential election could intensify risk, stir a flight to safety and lead to greater volatility in the FX markets. However, back-stopping the currency is the strong persistent balance of payments surpluses that should limit any SGD sharp decline.
MAS On Hold – SGD NEER To Stay Below The Mid-Point Higher Core Inflation in 2016 But Could Still Be Well Below Its 5-Year Average
Source: Bloomberg, CEIC, Maybank FX Research
106
111
116
121
126
Apr 1
1
Jun
11
Aug
11
Oct 1
1
Dec
11
Feb
12
Apr 1
2
Jun
12
Aug
12
Oct 1
2
Dec
12
Feb
13
Apr 1
3
Jun
13
Aug
13
Oct 1
3
Dec
13
Feb
14
Apr 1
4
Jun
14
Aug
14
Oct 1
4
Dec
14
Feb
15
Apr 1
5
Jun
15
Aug
15
Oct 1
5
SGD NEER Mid Upper Lower
Oct 14 2013: No change in policy stance.
Oct 14, 2011: Shift to a Slightly Flatter Slope of 1.5% from 3.0%. No Change to the width or centre of the band.
Apr 13, 2012: Slope Steepened Slightly to estimated 2.0% from current 1.5% estimate, No Change to the centre of the band but band's width narrowed.
Oct 12, 2012: No change in policy stance.
Apr 12 2013: No change in policy stance.
Apr 14 2014: No change in policy stance.
Oct 14 2014: No change in policy stance.
Jan 28 2015:Surprise intermeeting reduction in slope of policy band.
Apr 14 2015:No change in policy stance.
Oct 14 2015: Slope reduced slightly. No Change to the width or centre of the band.
.
-2%
-1%
0%
1%
2%
3%
4%
5%
6%
7%
Jan
10
May
10
Sep
10
Jan
11
May
11
Sep
11
Jan
12
May
12
Sep
12
Jan
13
May
13
Sep
13
Jan
14
May
14
Sep
14
Jan
15
May
15
Sep
15
Headline Inflation Core Inflation
Average 5 year core inflation

January 3, 2016 213
FX Research
MYR: The Bottom is Nearing Forecast 1Q 2016 2Q 2016 3Q 2016 4Q2016
USD/MYR 3.9500 (4.1000)
4.1000 (4.2500)
4.1500 (4.3000)
4.1500 (4.3000)
Previous Forecast in Parenthesis
Motivation: We see limited weakness in the MYR and are slightly more optimistic than street estimates on a combination of drivers including, slowly dissipating concerns of domestic issues, relative stability in oil prices (as compared to previous rapid declines in 2014-2015), and these are supporting investor sentiment. We also expect domestic demand to remain resilient (despite some softness) and this is expected to help offset some of the sluggish external demand concerns. Near term outlook for portfolio flows have stabilized and further improvement will help mitigate the negativity surrounding MYR. To add, MYR has fallen by more than 25% (vs. USD) since end-2014, and USD long positioning in the pair could be at over-stretched levels. Unwinding of USD-longs, given an improvement in domestic sentiment could exacerbate the downside move further. In light of the above factors, we revised our USDMYR forecasts lower over the forecast horizon to reflect our optimism.
We continue to reiterate that Ringgit weakness is temporary and is not a reflection of underlying fundamentals (which remain intact). We expect to see some stability returning to Ringgit over the next year or so as political/contingent liability risk subsides, fiscal consolidation/reforms gains traction and oil prices stabilize at lower levels (upside risk on MYR given that Malaysia budget assumes oil price at low of $48/bbl; MBB forecast: $53/bbl).
We noted recent shifts in Malaysia’s declining dependence in commodities as its net commodity exports are much lower as a share of GDP compared to those of other major EM producers. Malaysia’s terms of trade is also somewhat stable. We believe the weaker ringgit could help the competitiveness of Malaysia’s manufacturing exports (which account for 60% of total good exports). Thus from both a price and output effect perspective, we would expect the weaker ringgit to be a net positive for the medium term growth outlook.
MYR is not immune to external development. Its high short term external debt and falling FX reserves will continue to weigh on the MYR, should downside risks to EM growth worsens. Malaysia’s dependence on foreign fund flows as well as relatively high foreigner ownership of MGS (~46%) are also other sources of vulnerability and could pose downside pressure on MYR, in times of market stresses amid any risk of rapid pace of Fed tightening (not our base line scenario).
Idiosyncratic risks will drive MYR direction MYR is not immune to external development
Source: Bloomberg, Maybank FX Research

January 3, 2016 214
FX Research
IDR: Weighed By Rate Cuts In 2016 Forecast 1Q 2016 2Q 2016 3Q 2016 4Q 2016
USD/IDR 14000 (14100)
14200 (-)
14400 (-)
14500 (-)
Previous Forecast in Parenthesis
Motivation: The IDR will continue to remain under pressure in 2016 as both domestic and external challenges persist. No rate cut is expected at end-2015 as BI is likely to wait until policy clarity in the US and China becomes clearer. However, two rate cuts are likely in 2016 to complement the series of stimulus measures announced by the government to support the underperforming economy. Meanwhile, the positive carry on government debt that has so far encouraged foreign fund inflows could reverse as these funds seek better returns elsewhere. Risks are thus to the upside for the USD/IDR in 2016.
BI has room to cut rates but is unlikely to do so until policy direction in the US and China is clearer. This is despite expected improvement in the current account deficit, the strengthening of the IDR against the USD since end-Sep and continued moderation in inflation, and political pressure. We believe the central bank should remain on hold in 2015, unless risks sentiments deteriorate significantly. In 2016, the Fed’s gradual pace of rate hikes should provide more breathing space for monetary easing, even as the current account deficit bounces back above 2% of GDP. Higher domestic borrowing cost and sluggish growth amid a more benign inflationary environment should prompt the BI to cut the policy rate at least once each in 1H and 2H. These adjustments should weigh on the IDR.
Sub-par macro-fundamentals to persist. Despite the series of measures announced as part of the government’s stimulus programme, the outlook for the economy does not look too bright. The economy is expected to expand by just 5.0% in 2016, just marginally improving from this year’s expected 4.8%. Execution risks as well as downside risks to growth from the sluggish global environment, particularly the slowdown in China and continued weakness in commodity prices could negatively impact trade and temper growth prospects ahead. These should constrain real GDP below its ten-year average of 5.8% in 2016. The sub-par fundamentals should lift the USD/IDR higher next year.
Portfolio flows into government debt could reverse in 2016 as foreign investors seek higher returns elsewhere. So far, the positive carry from government debt has led to foreign funds adding a net IDR75.8tnn to their outstanding holding of government debt year-to-date. Downside risks come from a China-led global slowdown and when the Fed begins their rate normalization, which could trigger another round of ‘bond tantrum’. In the led up to the FOMC meeting in Sep, where expectations was for a Fed fund rate lift-off, market had positioned itself by removing a net IDR14.2tnfrom their holding of government debt in the three-months to Sep. We could see more of such outflows in 2016 that could weigh on the IDR.
Worsening Terms Of Trade Lifting USD/IDR Higher Fed Rate Hikes Raises Risk of Funds Outflow
Source: Bloomberg, CEIC, Maybank FX Research
6000700080009000100001100012000130001400030%
35%
40%
45%
50%
55%
60%
Mar 0
8Au
g 08
Jan 0
9Ju
n 09
Nov 0
9Ap
r 10
Sep 1
0Fe
b 11
Jul 1
1De
c 11
May 1
2Oc
t 12
Mar 1
3Au
g 13
Jan 1
4Ju
n 14
Nov 1
4
Total Trade to GDP USD/IDR (rhs, inverted)
8000
9000
10000
11000
12000
13000
140000%5%
10%15%20%25%30%35%40%45%
Dec 1
2Fe
b 13
Apr 1
3Ju
n 13
Aug 1
3Oc
t 13
Dec 1
3Fe
b 14
Apr 1
4Ju
n 14
Aug 1
4Oc
t 14
Dec 1
4Fe
b 15
Apr 1
5Ju
n 15
Aug 1
5
Foreign Holding of Govt Debt (% of totall outstanding)USD/IDR (inverted, rhs)

January 3, 2016 215
FX Research
PHP: Political Uncertainties To Weigh Forecast 1Q 2016 2Q 2016 3Q 2016 4Q 2016
USD/PHP 48.00 (47.00)
48.00 (47.00)
47.80 (46.80)
47.80 (-)
Previous Forecast in Parenthesis
Motivation: We remain bearish on the PHP due to the upcoming presidential and general elections in May 2016, and risks from the El Nino weather phenomenon and possible slowdown in overseas remittances from the weak global economy. The possible bright spot preventing the further depreciation of the PHP against the USD is the BSP keeping rates on hold for 2016. This should act as a backstop for the PHP amid FX market volatility.
Policy rate adjustments by the BSP are unlikely given strong economic fundamentals. Strong current account surpluses, outperforming economic growth (above 5%), healthy import-cover ratio and short-term debt-to-reserve (18.3 months and 6.1 times respectively) make it unnecessary for the central bank to provide added support to the economy. Instead, we expect the BSP to keep its ammunition dry for a rainy day. In fact, unlike most of its regional peers, the BSP has kept its overnight borrowing rate steady so far in 2015. Even the political uncertainty from the presidential election in May 2016 is unlikely to move the BSP. Moreover, the uncertainty in the FX markets from the imminent US Fed lift-off and hikes thereafter should also discourage the central bank from cutting its policy rate anytime soon. Thus, this should provide the PHP with support amid uncertainties from the global economy led by a slowdown in China and domestic general elections.
Key risk in 2016 to the PHP is the upcoming presidential and general elections. Examination of the election trends on flows and the domestic currency showed that investors generally are not enthusiastic of the presidential election as incumbents are constitutionally barred from running for a second term. This is particularly true for the upcoming election as there is no certainty that President Aquino’s business-friendly policies and reforms would survive beyond his term of office especially if his favoured-candidate fails to win the election. Thus, the equity market is likely to be the main victim of political uncertainties up to six-months after the elections and the outflows should weigh on the PHP as well. Consequently, this could see the USD/PHP climb higher in 1H 2016.
Further risks to our IDR outlook stems from the El Nino weather phenomenon and the possible tapering of overseas remittances from the global slowdown. The El Nino weather phenomenon is expected to be severe in 2H 2016 and could lead to floods and droughts, negatively affecting crops and hence agricultural export earnings and domestic inflation. Sluggish global growth particularly in the G3 could slow the remittances, and put downward pressure on private consumption - the mainstay of economic growth.
Political Uncertainties Supportive Of USD/PHP Election Year Tends To Be Unfavourable To Equities
Source: Bloomberg, CEIC, Maybank FX Research
20
25
30
35
40
45
50
55
600100020003000400050006000700080009000
1991
1992
1993
1994
1995
1996
1997
1998
1999
2000
2001
2002
2003
2004
2005
2006
2007
2008
2009
2010
2011
2012
2013
2014
2015
2016
Philippines Stock Exchange IndexUSD/PHP (RHS - inverted) Presidential Elections
Asian Financial
Great Global Recession
European DebtCrisisDot-com Bust /
9-11 in US / SARS
PoliticalUncertaintiesAmid Global
Growth Concerns?
Mixed
-30%-20%-10%
0%10%20%30%40%
-6 -5 -4 -3 -2 -1 0 1 2 3 4 5 6
1992 1998 2004 2010
m/m
Election in May = 0

January 3, 2016 216
FX Research
THB: Downside Pressure From Domestic Concerns Forecast 1Q 2016 2Q 2016 3Q 2016 4Q 2016
USD/THB 35.50 (37.30)
36.00 (37.50)
36.50 (37.70)
36.50 (-)
Previous Forecast in Parenthesis
Motivation: We continue to expect further upside to the USD/THB in 2016 due to the continued underperformance of the economy, despite the stimulus package. In addition, political uncertainty could weigh on investor sentiments and could put downward pressure on the THB. However, the THB weakness is unlikely to be as severe as its regional peers due to the central bank holding its policy rate steady as well as it persistent current account surpluses.
No rate adjustments are expected for the rest of the year and in 2016 because the concomitant weakness in the THB from a rate cut is unlikely to be a panacea to the kingdom’s export woes as global demand remains soft; the imminent US Fed fund rate normalization in Dec has almost closed the window to a rate cut; and fiscal policy is a more effective tool to stimulate the economy than lower borrowing rates. This should help to keep the THB supported against the USD in 2015 and 2016. A possible risk to our policy rate outlook is rate hikes in 2016 to stem portfolio outflows in search of higher yields. While this is not our base case, such a move could be supportive of the THB and weigh on the USD/THB in 2016.
Domestic growth should rebound but remain below its 5-year average of 3.9%, supported by the stimulus package. The economy is likely to gain more traction in 2016 though due to the accelerated government spending and the on-going stimulus spending programme of THB54bn. There is unlikely to be a sharp rebound as these should only partially mitigate the drag on the economy from the external environment, increasing downside risks to the THB.
Domestic politics remain a key risk despite the current calm. Underlying political tensions could re-emerge as the drafting of the constitution gets underway again. The planned referendum in 2Q 2016 on the draft constitution could become a referendum on PM Prayuth and the junta instead. No matter which way the referendum goes, the only certainty is that the tenure of the un-elected PM Prayuth and his government could be prolonged. The political uncertainty arising from all of these could weigh on investor sentiments in 2016 and put downside pressure on the THB.
The current account surplus has strengthened to levels not seen in the past 10 years, due largely to the larger contraction in imports compared to exports. However, the surpluses could shrink in 2016 as imports rise on the stimulus package and exports continues to be weighed by the sluggish global economy led by a China-slowdown. This should put downward pressure on the THB.
Portfolio Outflows Weighing On The USD/THB Current Account Could Shrink In 2016
Source: Bloomberg, CEIC, Maybank FX Research
0
5
10
15
20
25
30
35
40
-150000
-100000
-50000
0
50000
100000
150000
200000
Apr10
Aug10
Dec10
Apr11
Aug11
Dec11
Apr12
Aug12
Dec12
Apr13
Aug13
Dec13
Apr14
Aug14
Dec14
Apr15
Aug15
Equities Government Debt USD/THB (rhs)
2728293031323334353637
-150000
-100000
-50000
0
50000
100000
150000
200000
250000
Jan 1
0Ma
y 10
Sep 1
0Ja
n 11
May 1
1Se
p 11
Jan 1
2Ma
y 12
Sep 1
2Ja
n 13
May 1
3Se
p 13
Jan 1
4Ma
y 14
Sep 1
4Ja
n 15
May 1
5Se
p 15
Current Account (THB mn) USD/THB
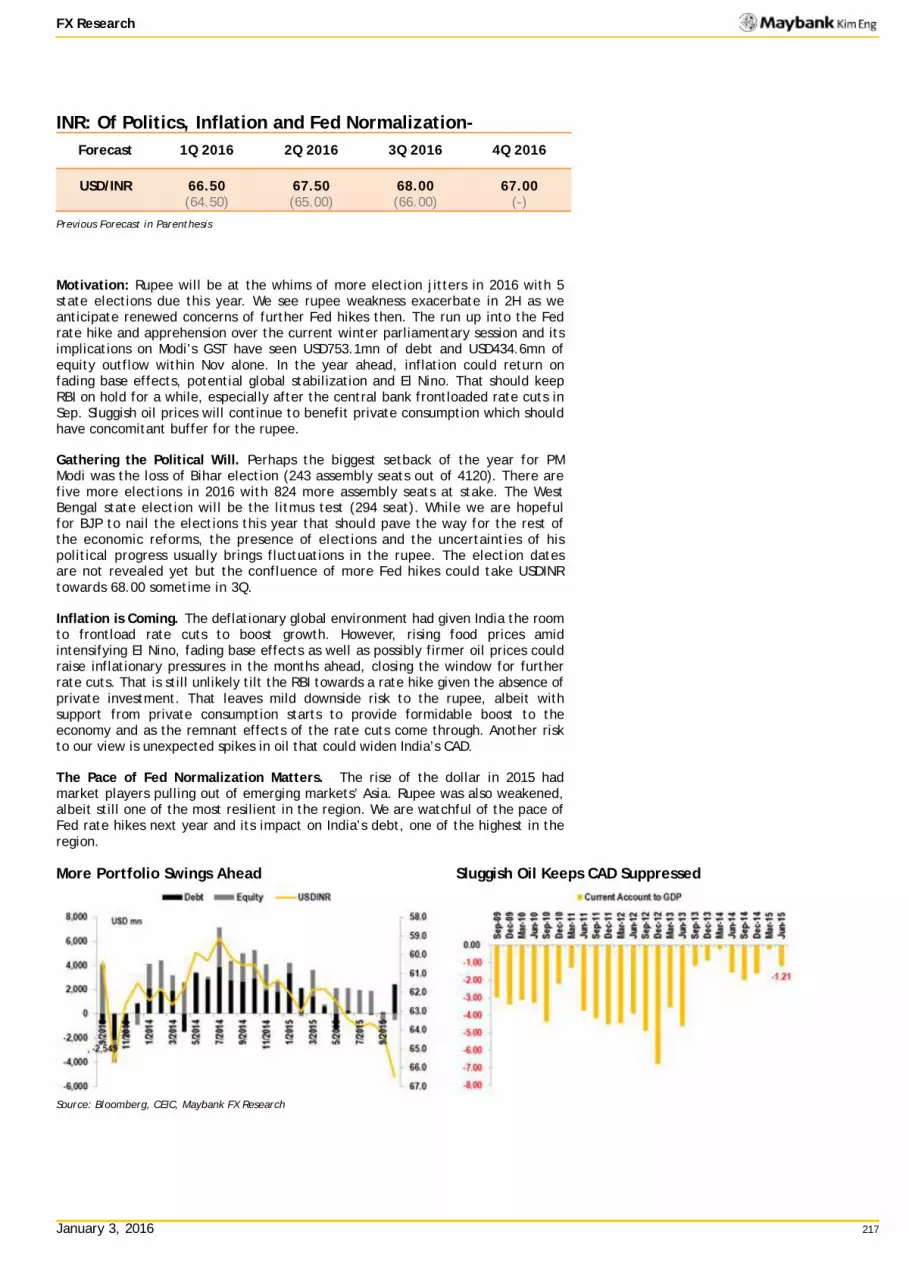
January 3, 2016 217
FX Research
INR: Of Politics, Inflation and Fed Normalization- Forecast 1Q 2016 2Q 2016 3Q 2016 4Q 2016
USD/INR 66.50 (64.50)
67.50 (65.00)
68.00 (66.00)
67.00 (-)
Previous Forecast in Parenthesis
Motivation: Rupee will be at the whims of more election jitters in 2016 with 5 state elections due this year. We see rupee weakness exacerbate in 2H as we anticipate renewed concerns of further Fed hikes then. The run up into the Fed rate hike and apprehension over the current winter parliamentary session and its implications on Modi’s GST have seen USD753.1mn of debt and USD434.6mn of equity outflow within Nov alone. In the year ahead, inflation could return on fading base effects, potential global stabilization and El Nino. That should keep RBI on hold for a while, especially after the central bank frontloaded rate cuts in Sep. Sluggish oil prices will continue to benefit private consumption which should have concomitant buffer for the rupee.
Gathering the Political Will. Perhaps the biggest setback of the year for PM Modi was the loss of Bihar election (243 assembly seats out of 4120). There are five more elections in 2016 with 824 more assembly seats at stake. The West Bengal state election will be the litmus test (294 seat). While we are hopeful for BJP to nail the elections this year that should pave the way for the rest of the economic reforms, the presence of elections and the uncertainties of his political progress usually brings fluctuations in the rupee. The election dates are not revealed yet but the confluence of more Fed hikes could take USDINR towards 68.00 sometime in 3Q.
Inflation is Coming. The deflationary global environment had given India the room to frontload rate cuts to boost growth. However, rising food prices amid intensifying El Nino, fading base effects as well as possibly firmer oil prices could raise inflationary pressures in the months ahead, closing the window for further rate cuts. That is still unlikely tilt the RBI towards a rate hike given the absence of private investment. That leaves mild downside risk to the rupee, albeit with support from private consumption starts to provide formidable boost to the economy and as the remnant effects of the rate cuts come through. Another risk to our view is unexpected spikes in oil that could widen India’s CAD.
The Pace of Fed Normalization Matters. The rise of the dollar in 2015 had market players pulling out of emerging markets’ Asia. Rupee was also weakened, albeit still one of the most resilient in the region. We are watchful of the pace of Fed rate hikes next year and its impact on India’s debt, one of the highest in the region.
More Portfolio Swings Ahead Sluggish Oil Keeps CAD Suppressed
Source: Bloomberg, CEIC, Maybank FX Research
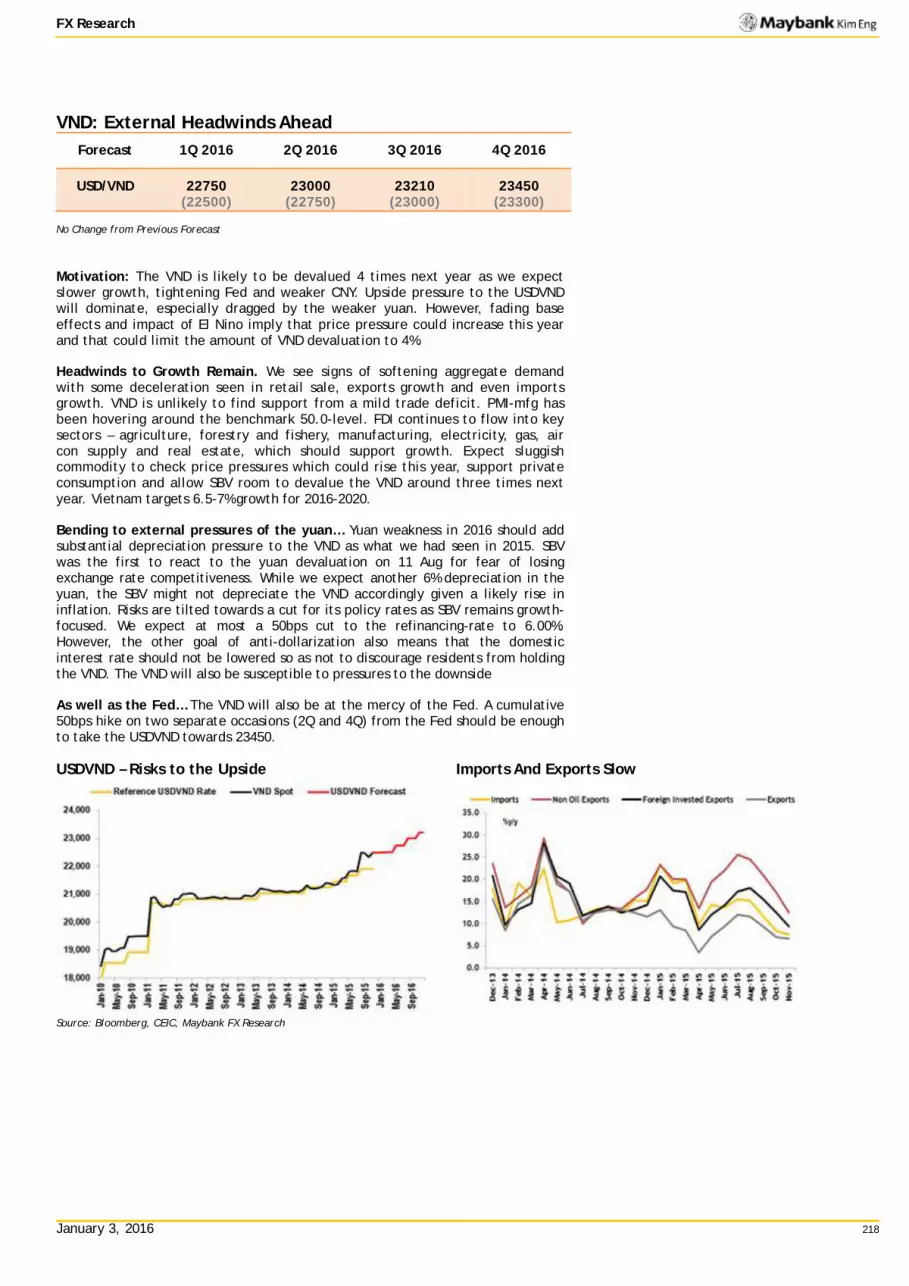
January 3, 2016 218
FX Research
VND: External Headwinds Ahead Forecast 1Q 2016 2Q 2016 3Q 2016 4Q 2016
USD/VND 22750 (22500)
23000 (22750)
23210 (23000)
23450 (23300)
No Change from Previous Forecast
Motivation: The VND is likely to be devalued 4 times next year as we expect slower growth, tightening Fed and weaker CNY. Upside pressure to the USDVND will dominate, especially dragged by the weaker yuan. However, fading base effects and impact of El Nino imply that price pressure could increase this year and that could limit the amount of VND devaluation to 4%.
Headwinds to Growth Remain. We see signs of softening aggregate demand with some deceleration seen in retail sale, exports growth and even imports growth. VND is unlikely to find support from a mild trade deficit. PMI-mfg has been hovering around the benchmark 50.0-level. FDI continues to flow into key sectors – agriculture, forestry and fishery, manufacturing, electricity, gas, air con supply and real estate, which should support growth. Expect sluggish commodity to check price pressures which could rise this year, support private consumption and allow SBV room to devalue the VND around three times next year. Vietnam targets 6.5-7% growth for 2016-2020.
Bending to external pressures of the yuan… Yuan weakness in 2016 should add substantial depreciation pressure to the VND as what we had seen in 2015. SBV was the first to react to the yuan devaluation on 11 Aug for fear of losing exchange rate competitiveness. While we expect another 6% depreciation in the yuan, the SBV might not depreciate the VND accordingly given a likely rise in inflation. Risks are tilted towards a cut for its policy rates as SBV remains growth-focused. We expect at most a 50bps cut to the refinancing-rate to 6.00%. However, the other goal of anti-dollarization also means that the domestic interest rate should not be lowered so as not to discourage residents from holding the VND. The VND will also be susceptible to pressures to the downside
As well as the Fed… The VND will also be at the mercy of the Fed. A cumulative 50bps hike on two separate occasions (2Q and 4Q) from the Fed should be enough to take the USDVND towards 23450.
USDVND – Risks to the Upside Imports And Exports Slow
Source: Bloomberg, CEIC, Maybank FX Research

January 3, 2016 219
FX Research
Global and Regional FX Outlook & Risks
ASEAN Debt Risks
A Slower China
Further Easing in DM
Rangy Oil
with Upside
Risk
TPP Fiscal Capacity
Domestic Demand
EL Nino
2016 Outlook
USD TWI
EUR
GBP
JPY
CNY
KRW
AUD
NZD
MYR
SGD
IDR
PHP
THB
INR VND
Source: Maybank FX Research

January 3, 2016 220
FX Research
2016 FX Outlook Summary
Currency Direction/ Bias Motivation
DXY Mild Bullish
Remain mildly bullish on the 2016 dollar outlook. Firmer US data and rising expectations of the Fed rate hike in Dec 2015 have been supporting the USD. We continue to expect a gradual pace of Fed tightening in 2016 and hence should not see excessive US strength but a rather supported USD.
EUR/USD Bearish
EUR is expected to face further downside pressure over the next 3 – 6 months amid further monetary easing, as ECB remains worried about subdued inflation. Beyond 6 months, we expect EUR to stabilize around 1.04 levels and gradually inch higher towards 1.08 into 2016-end, as monetary easing slows amid a pick-up in inflation off the back of oil prices stabilizing.
GBP/USD Bullish
Remain positive in GBP outlook over the forecast horizon, notwithstanding some near term weakness towards 1.48-1.50 levels in the next 2-3 weeks before rebounding. Ongoing economic recovery warrants a shift in monetary policy stance at some point in 1H 2016. This will result in monetary policy divergence between BoE and other G7 majors.
AUD/USD Neutral
We see intermittent spikes on fiscal and monetary boosts from China, keeping AUD in a volatile range with no directional bias for the currency. Key swings are still China’s growth prospects but much of the commodity slump is in the price.
NZD/USD Bearish
Bearish on the NZD, due to high risk of current account deficit widening further, declining ToT amid weakening demand, moderating growth outlook, benign inflation, soft dairy prices for longer and growing divergence of monetary policy between Fed and RBNZ.
USD/JPY Bearish
Positive on the JPY in 2016 as no additional easing measures is expected from the BOJ. Near-term weakness by end-2015 is possible as reflected in market positioning (increase in net JPY-shorts) in anticipation of the Fed lift-off in Dec. This should encourage further fund outflow in search of higher returns but could be transitory as China-led global growth and US political risks weigh on the pair. The riskier global environment in 2016 could lead to a flight to quality/safe-haven plays that could weigh on the USD/JPY.
USD/KRW Bullish
Maintain a bearish bias in KRW. Risk of economic recovery stalling (dragged by sluggish exports, which could be structural in nature), risk sentiment (KRW remains high beta currency) and growing monetary policy divergence between Fed and BoK are some of the factors that could exert downside pressure on the KRW. But in the near term (to 1Q 2016), KRW could see some respite due to supported risk sentiment (global monetary conditions remain accommodative) and cyclical recovery amid budget and monetary stimulus efforts.
USD/CNY Bullish
We are biased towards a weaker CNY outlook in 2016. China will enter the next half of the decade with lower growth targets, high debt and a more market determined yuan. Prevailiing current account surplus will keep CNY from depreciating more than 7% of current level of around 6.4.

January 3, 2016 221
FX Research
USD/SGD Bullish
Outlook for the SGD remains dim in 2016 even though no further moves by the MAS are expected. Upside moves to the USD/SGD are expected given the SGD remains overvalued as reflected by our UIP model. Downside risks from domestic and external headwinds should put downside pressures on the USD/SGD, though downside should be limited by the persistent balance of payments surpluses.
USD/MYR Mild Bullish
Still see MYR weakness but likely to be limited on a combination of drivers including, slowly dissipating concerns of domestic issues, relative stability in oil prices and relatively resilient domestic demand (to offset some external demand concerns).
USD/IDR Bullish
IDR to remain under pressure in 2016 as both domestic and external challenges persist. No rate cut is expected at end-2015 as BI is likely to wait until policy clarity in the US and China becomes clearer but two rate cuts are likely in 2016 to complement the series of stimulus measures announced by the government to support the underperforming economy. The positive carry on government debt that has so far encouraged foreign fund inflows could reverse as these funds seek better returns elsewhere. Risks are thus to the upside for the USD/IDR in 2016.
USD/PHP Bullish
Remain bearish on the PHP due to the upcoming presidential and general elections in May 2016, and risks from the El Nino weather phenomenon and possible slowdown in overseas remittances from the weak global economy. Possible bright spot preventing the further depreciation of the PHP against the USD is the BSP keeping rates on hold for 2016, which acts as a backstop for the PHP amid FX market volatility.
USD/THB Mild Bullish
Expect further upside to the USD/THB in 2016 due to the continued underperformance of the economy, despite the stimulus package. Political uncertainty could weigh on investor sentiments and put downward pressure on the THB. Move lower is unlikely to be as severe as its regional peers due to the central bank holding its policy rate steady as well as it persistent current account surpluses.
USD/INR Mild Bullish
INR will be at the whims of more election jitters in 2016 with 5 state elections due this year. We see rupee weakness exacerbate in 2H as we anticipate renewed concerns of further Fed hikes then. Sluggish oil prices will continue to benefit private consumption which should have concomitant buffer for the rupee.
USD/VND Bullish
The VND is likely to be devalued 4 times next year as we expect slower growth, tightening Fed and weaker CNY. Upside pressure to the USDVND will dominate, especially dragged by the weaker yuan. However, fading base effects and impact of El Nino imply that price pressure could increase this year and that could limit the amount of dung devaluation to 4%.
Source: Maybank FX Research

January 3, 2016 222
FX Research
2016 Asian Monetary Policy Summary
Policy Measure Direction/Bias Maybank Expectations 2016
JPY Monetary Base Easing Bias No additional measures are expected as the BOJ expects the 2% inflation target to be achieved in 2H FY 2016.
CNY 1-Yr Lending Rate Easing
Expect at most another 25 bps cut to 1Y lending rate, a most direct way to lower cost of financing. RRR to be lowered by 200bps in intervals to support liquidity conditions.
KRW Base Rate Easing Bias
BoK is expected to maintain a “wait-and-watch” stance and keep policy rate on hold at 1.5% for 2016 amid a cyclical recovery in 1Q 2016. Risk is tilted towards a cut in 2H 2016 should growth and inflation fail to pick up.
SGD Exchange Rate Easing Bias Hurdles remain high for additional moves by the MAS as core inflation should tick higher and growth is not expected to tank in 2016.
MYR O/N Policy Rate Neutral
Expect BNM to keep policy rate on hold at 3.25% for 2016 as BNM sought to maintain accommodate monetary policy to support domestic demand. BNM likely to focus on market liquidity which is in line with moves to encourage “onshoring” of local corporates currency earnings and deposits.
IDR O/N Reference Rate Easing
Two rate cuts are expected - once each in 1H and 2H 2016 - to reduce domestic borrowing cost and spur growth amid a more benign inflationary environment.
PHP O/N Reverse Repo Neutral
No policy rate adjustments are likely given its the strong economic fundamentals, including current account surpluses, outperforming economic growth, healthy import-cover ratio and short-term debt-to-reserve ratio.
THB 1-Day Repo Rate Easing Bias
No rate adjustments are expected in 2016 as a weak THB is not seen as a panacea for its export woes; given the imminent Fed fund rate hike; and BoT's views that fiscal policy is more appropriate than monetary policy to stimulate the economy.
INR Policy Repo Rate Easing Bias We do not see further interestrate adjustments amid rising inflation risks and still decent growth prospects.
VND Refinancing Rate Easing Bias Expect SBV to lower refinancing rate by 50bps to 6.00% to support investment and consumption.
Source: Maybank FX Research

January 3, 2016 223
FX Research
2016 FX Forecasts End Q1-16 f End Q2-16 f End Q3-16 f End Q4-16 f
USD/JPY 122.00 124.00 122.00 120.00
EUR/USD 1.0400 1.0400 1.0600 1.0800
GBP/USD 1.5600 1.5800 1.6000 1.6200
AUD/USD 0.7400 0.7000 0.6800 0.7000
NZD/USD 0.6400 0.6100 0.6200 0.6300
USD/SGD 1.4100 1.4200 1.4400 1.4700
USD/MYR 3.9500 4.1000 4.1500 4.1500
USD/IDR 14000 14200 14400 14500
USD/THB 35.50 36.00 36.50 36.50
USD/PHP 48.00 48.00 47.80 47.80 USD/CNY 6.55 6.60 6.65 6.70 USD/HKD 7.80 7.80 7.80 7.80
USD/TWD 33.30 33.40 33.40 33.50
USD/KRW 1140.00 1160.00 1180.00 1200.00 USD/INR 66.50 67.50 68.00 67.00 USD/VND 22750.00 23000.00 23210.00 23450.00 EUR/CNY 6.81 6.86 7.05 7.24 EUR/MYR 4.11 4.26 4.40 4.48
SGD Crosses End Q1-16 f End Q2-16 f End Q3-16 f End Q4-16 f 100 JPY/SGD 1.1557 1.1452 1.1803 1.2250
EUR/SGD 1.4664 1.4768 1.5264 1.5876 GBP/SGD 2.1996 2.2436 2.3040 2.3814 AUD/SGD 1.0434 0.9940 0.9792 1.0290 NZD/SGD 0.9024 0.8662 0.8928 0.9261 SGD/MYR 2.8014 2.8873 2.8819 2.8231 SGD/IDR 9929 10000 10000 9864 SGD/THB 25.18 25.35 25.35 24.83 SGD/PHP 34.04 33.80 33.19 32.52 SGD/CNY 4.65 4.65 4.62 4.56 SGD/JPY 86.52 87.32 84.72 81.63 SGD/HKD 5.53 5.49 5.42 5.31 SGD/TWD 23.62 23.52 23.19 22.79 SGD/KRW 808.51 816.90 819.44 816.33 SGD/INR 47.16 47.54 47.22 45.58
Other Crosses End Q1-16 f End Q2-16 f End Q3-16 f End Q4-16 f EUR/CNY 6.81 6.86 7.05 7.24 EUR/MYR 4.11 4.26 4.40 4.48 JPY/MYR 3.24 3.31 3.40 3.46 MYR/HKD 1.97 1.90 1.88 1.88 MYR/CNY 1.66 1.61 1.60 1.61 GBP/MYR 6.16 6.48 6.64 6.72 AUD/MYR 2.92 2.87 2.82 2.91 NZD/MYR 2.53 2.50 2.57 2.61 MYR/JPY 30.89 30.24 29.40 28.92 MYR/IDR 3544 3463 3470 3494 MYR/INR 15.95 16.36 16.84 16.46 MYR/KRW 289 283 284 289 MYR/PHP 11.59 12.15 11.71 11.52
Source: Maybank FX Research as at 30 Dec 2015. *These forecasts are meant to be indicative of FX trends and not meant to be point forecasts.

January 3, 2016
STRA
TEG
Y Re
gion
al
The Year As We See It
Seeing The Shrink
Not So Pessimistic on Asian Equities We are no longer as pessimistic on Asian equities as we were a year ago. We now think the bottoming process for the Asian markets has begun in both absolute terms and relative to global markets.
The reasons include import breakdown data as readings are consistent with the fact that a number of Asian countries are already in recession. Against this backdrop, we reckon there is a much greater likelihood of more proactive and effective fiscal policy. At the same time, valuations in the region typically only get lower during crises.
Rising Corporate Bond Risk Aversion and the USD Another reason has to do with us being less bullish on the USD. Our cover chart shows the spread between US Baa and Aaa corporate bonds. This indicator is a measure of risk aversion in the investment grade corporate bond market. The latest observations are consistent with periods of Fed easing rather than tightening! If the Fed is unable to raise rates, we could see a softer USD as carry gets less attractive. Even a flat to mildly rising USD could favour Asian equities.
To be sure there are risks, particularly in 1Q16 when data may be poor and a weaker RMB remains an overhang. And while we reckon equity returns over the full year may be only single digit, by year-end we are likely to be more positive than less so.
Be Opportunistic and Add Risk to Portfolios We recommend being opportunistic and inclined to add risk to the portfolio rather than be in capital-preservation mode. From a country perspective, we are raising China to Neutral from Underweight. We also raise Indonesia to Overweight from Underweight.
From a sector perspective, we find some relative valuations have gotten too extended. We recommend long industrials (playing to the infrastructure theme), short consumer staples. And long materials, short software and Internet.
Analysts
Willie Chan
(852) 2268 0631
Sadiq Currimbhoy
(65) 6231 5836
0
2
4
6
8
10
12
0.0
0.5
1.0
1.5
2.0
2.5
3.0
3.5
4.0
89 91 93 95 97 99 01 03 05 07 09 11 13 15
(%) % Moody's seasoned BAA-AAA corporate bond yieldFed fund rate (%) (RHS)
QE 2
QE 3
QE 1
Source: Board of Governors of the Federal Reserve System (US), Moody's Seasoned Baa Corporate Bond Yield© [BAA], Moody's Seasoned Aaa Corporate Bond Yield© [AAA],retrieved from FRED, Federal Reserve Bank of St. Louis, Bloomberg, Maybank Kim Eng

January 3, 2016 225
Strategy Research
Three Ideas:
Market: This year we think will mark the bottom of Asian equities in both absolute terms and relative to global markets. We would be opportunistically adding risk into portfolios.
Country: Raising China to Neutral; Raising Indonesia from Underweight.
Sector: Long Industrials, Short Staples; Long Materials, Short Software.
Bottoming process for Asian equities
We are not as negative on Asian equity markets as we were a year ago. We think Asian markets are now in a volatile bottoming process, both in absolute terms and relative to global markets.
First, several indicators show that some parts of Asia are already in recession. Second, while we remain USD bulls, we suspect upside for the USD may not be very strong in 2016. Third, we see rising pressure on developed markets, especially the US market. Fourth, Asian valuations are near trough levels, suggesting a great deal of bad news has been priced in. We think the market will remain volatile, particularly in 1Q16 as there is likely to be more downside pressure on the economy and earnings. However, all this suggests the bottoming process for Asian equities has begun. We are more inclined to put capital to work opportunistically in 2016 rather than be in capital-conservation mode.
One: On some metrics, much of Asia is already in recession (so governments start to flex fiscal muscle)
The charts below show the trends of Asian exports, imports excluding oil and capital goods imports. All three are at levels where in the past, Asia would be considered to be at recessionary levels. Notwithstanding that some imports are used for re-export, and export growth is weak, the charts show the recent deterioration has occurred even after a few years of lacklustre growth.
And as a measure of capex trends, the chart of Asia x Japan, India, Indonesia and the Philippines’ capital goods imports shows a rate of growth last seen during the 2001 and 2009 global recessions.
Fig 1: Asia x JP, Indo & Philip exports and non-oil imports YoY
Source: CEIC, Maybank Kim Eng
Fig 2: Asia x JP, India, Indo & Philp’s capital goods imports
Source: CEIC, Maybank Kim Eng
(40)
(20)
0
20
40
60
93 95 97 99 01 03 05 07 09 11 13 15
% Asia x Indo & Philip exports YoY (%), 3mmaAsia x Indo & Philip imports (x oil) YoY (%), 3mma
(30)
(20)
(10)
0
10
20
30
40
50
01 02 03 04 05 06 07 08 09 10 11 12 13 14 15
% Asia x JP, India, Indo & Philip capital goods imports

January 3, 2016 226
Strategy Research
The table below shows that with the exception of the Philippines, the rest of the Asian countries recorded negative YoY growth of non-oil imports and in November, Indonesia had the biggest decline (-50% YoY). Except Korea and the Philippines, the YoY growth of capital goods imports also shows that Asian capex is firmly in contraction mode.
Fig 3: Exports, imports, non-oil imports & capital goods imports, YoY, 3mma
Exports YoY
(%) Imports YoY
(%) Non-oil imports
YoY (%) Capital goods
imports YoY (%) China -6 -16 -12 -6 Hong Kong -4 -8 -7 -2 India -22 -26 -15 -8 Indonesia -19 -24 -50 -15 Korea -10 -19 -10 3 Malaysia -16 -23 -20 -15 Philippines -11 10 15 21 Singapore -15 -18 -5 -1 Taiwan -14 -19 -15 -1 Thailand -7 -18 -13 -7
Source: CEIC, Maybank Kim Eng
Government response & infrastructure
The extreme pressure is resulting in government fiscal action, either in the form of handouts or greater infrastructure spending (Suhaimi Ilias’s 2016 Outlook & Lookouts, figure 7, Asia – Fiscal Balance & Government Debt (% of GDP, 2016E), page 8) For example, the Indonesian government will increase the infrastructure budget by 8.3% to IDR314t - it accounts for 15% of the total 2016 budget, the highest in history. The list of infrastructure projects includes power plants, sea ports, airports and toll roads. Our Malaysia Head of Research, Wong Chew Hann, expects an action-packed year based on our estimate of MYR83b worth of infrastructure jobs to be awarded, which will be a record high after MYR46b in 2012. This would offset slower property-related construction jobs due to the soft property market. Beyond 2016, the KL-SG HSR and KVMRT 3 are the major infrastructure projects to sustain construction jobs momentum.
Two: Rate hikes and the USD may not be very strong
Trends in the corporate bond market put into question any Fed rate hikes. While the high-yield market spike has been well documented, we wanted to look at investment grade trends.
The chart below shows Moody’s Baa less Aaa corporate bond spreads. This is a measure of risk aversion in the investment grade corporate bond market: a widening spread means investors want AAA (most safe) more than BAA.
In the past, when the investment grade bond yield spread widened to the current levels, the Fed cut rates or even started a new round of quantitative easing. Even in 2002, a widening spread was met with more easing.

January 3, 2016 227
Strategy Research
Fig 4: Moody’s seasoned Baa-Aaa corporate bond yield & Fed fund rate
Source: Board of Governors of the Federal Reserve System (US), Moody's Seasoned Baa Corporate Bond Yield© [BAA], Moody's Seasoned Aaa Corporate Bond Yield© [AAA],retrieved from FRED, Federal Reserve Bank of St. Louis, Bloomberg, Maybank Kim Eng
In this case, the carry between US and German’s 2-year may not improve much from the current levels and further upside for USD would be limited.
Fig 5: US and German bond spreads
Source: Bloomberg, Maybank Kim Eng
Three: rising pressure on developed markets, especially the US market
The PE valuation for the US market is not cheap and is back to 2003 levels. However, the current forward earnings growth is far worse than at that time, marking the worst growth since 2009.
0
2
4
6
8
10
12
0.0
0.5
1.0
1.5
2.0
2.5
3.0
3.5
4.0
89 91 93 95 97 99 01 03 05 07 09 11 13 15
(%) % Moody's seasoned BAA-AAA corporate bond yieldFed fund rate (%) (RHS)
QE 2
QE 3
(6)
(5)
(4)
(3)
(2)
(1)
0
1
2
3
4
91 93 95 97 99 01 03 05 07 09 11 13 15
% US-Germany 2-yr spread US-Germany 10-yr spread
QE 1

January 3, 2016 228
Strategy Research
Fig 6: DS-US 12-mth forward PE
Source: DataStream, Maybank Kim Eng
Fig 7: US forward earnings growth YoY (%)
Source: DataStream, Maybank Kim Eng
The S&P has been trading in a narrow range but the number of stocks that are trading at above their 50-day and 200-day moving averages continue to decline. This poor market breadth may cause market volatility in 2016, particularly in 1Q.
Fig 8: Stocks trading above 50D & 200D moving average (US)
Source: Bloomberg, Maybank Kim Eng
Four: What’s Priced in & Asian valuations near trough levels The following chart shows the DS-Asia ex Japan is trading at below 1.5x PB. The current valuation is at much more attractive levels than last year and typically goes below that during crises.
5
10
15
20
25
30
93 95 97 99 01 03 05 07 09 11 13 15
(x) DS-US 12-mth Fwd PE
(40)
(30)
(20)
(10)
0
10
20
30
40
91 93 95 97 99 01 03 05 07 09 11 13 15
% DS-US forward earnings growth YoY (%)
1000
1200
1400
1600
1800
2000
2200
0
20
40
60
80
100
11 12 13 14 15 16
% Stocks trade above 200d moving avg (%)Stocks trade above 50d moving avg (%)S&P 500 (RHS)
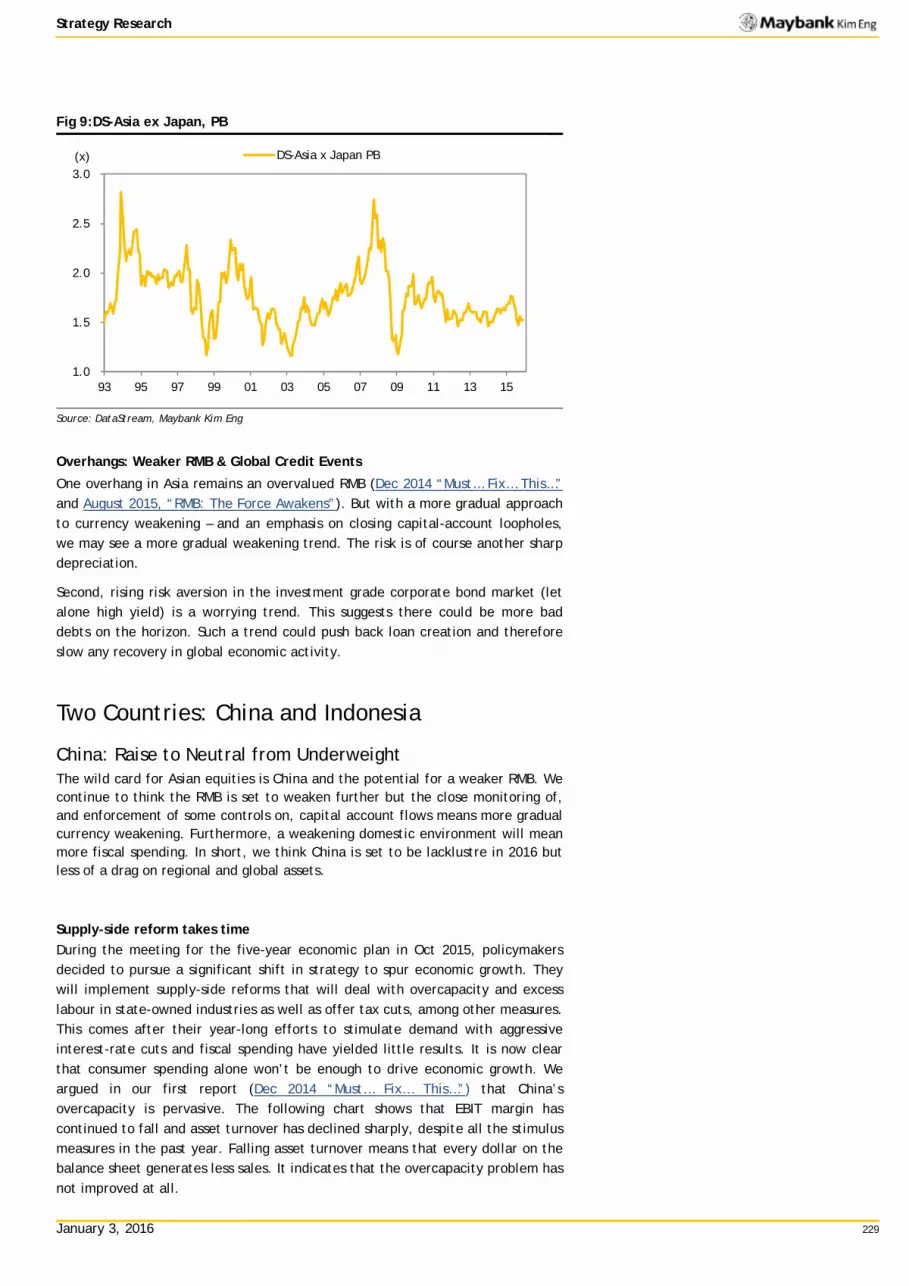
January 3, 2016 229
Strategy Research
Fig 9:DS-Asia ex Japan, PB
Source: DataStream, Maybank Kim Eng
Overhangs: Weaker RMB & Global Credit Events
One overhang in Asia remains an overvalued RMB (Dec 2014 “Must… Fix… This…” and August 2015, “RMB: The Force Awakens”). But with a more gradual approach to currency weakening – and an emphasis on closing capital-account loopholes, we may see a more gradual weakening trend. The risk is of course another sharp depreciation.
Second, rising risk aversion in the investment grade corporate bond market (let alone high yield) is a worrying trend. This suggests there could be more bad debts on the horizon. Such a trend could push back loan creation and therefore slow any recovery in global economic activity.
Two Countries: China and Indonesia
China: Raise to Neutral from Underweight The wild card for Asian equities is China and the potential for a weaker RMB. We continue to think the RMB is set to weaken further but the close monitoring of, and enforcement of some controls on, capital account flows means more gradual currency weakening. Furthermore, a weakening domestic environment will mean more fiscal spending. In short, we think China is set to be lacklustre in 2016 but less of a drag on regional and global assets.
Supply-side reform takes time During the meeting for the five-year economic plan in Oct 2015, policymakers decided to pursue a significant shift in strategy to spur economic growth. They will implement supply-side reforms that will deal with overcapacity and excess labour in state-owned industries as well as offer tax cuts, among other measures. This comes after their year-long efforts to stimulate demand with aggressive interest-rate cuts and fiscal spending have yielded little results. It is now clear that consumer spending alone won’t be enough to drive economic growth. We argued in our first report (Dec 2014 “Must… Fix… This…”) that China’s overcapacity is pervasive. The following chart shows that EBIT margin has continued to fall and asset turnover has declined sharply, despite all the stimulus measures in the past year. Falling asset turnover means that every dollar on the balance sheet generates less sales. It indicates that the overcapacity problem has not improved at all.
1.0
1.5
2.0
2.5
3.0
93 95 97 99 01 03 05 07 09 11 13 15
(x) DS-Asia x Japan PB

January 3, 2016 230
Strategy Research
We believe it will take a lot of time and pain to solve this issue. But as shown in figure 3, Chinese capital goods imports are negative now suggesting that capex cuts have already begun.
Fig 10: China EBIT margin and asset turnover
Source: Maybank Kim Eng
The government is also trying to support the property market again after all the tightening measures in the past few years. The chart on the left shows property sales momentum picked up modestly in the past few months due to policy relaxation and the lower interest-rate environment. Housing inventory in the nine major cities is also back to 2013 levels. On average, it takes around 11 months to absorb property inventory; around 5-10 months in tier-1 cities.
Fig 11:China property sales YoY
Source: CEIC, Maybank Kim Eng
Fig 12: Avg property inventories for China’s nine major cities
Source: Bloomberg, Maybank Kim Eng *9 major cities are Beijing, Shanghai, Guangzhou, Shenzhen, Dalian, Fuzhou, Changchun, Hangzhou, Nanchang
However, the following chart shows that there has been a huge volume of floor space under construction in the past few years. The yellow line shows that there was more than 13 trillion sq metres of floor space under construction in the past 12 months. This means a big potential supply is coming. The chart on the right shows that the floor space under construction is almost 10x more than the floor space sold; it would take a long time to digest the potential new supply. This is why the government is trying to boost property demand and reduce housing
6%
8%
10%
12%
14%
16%
60%
65%
70%
75%
80%
85%
90%
95%
2006 2007 2008 2009 2010 2011 2012 2013 2014 2015E
Asset Turnover EBIT Margin (RHS)
(60)
(40)
(20)
0
20
40
60
80
100
120
97 99 01 03 05 07 09 11 13 15
% Property sold, ytd, YoY (%)
4
6
8
10
12
14
16
18
10 11 12 13 14 15
month Average property inventory absorption period, month

January 3, 2016 231
Strategy Research
inventory by converting rural migrants into urban residents. We think the government will need to provide subsidies or tax cuts to support people buying properties in the second or third-tier cities, otherwise developers would need to cut prices later. However, we think it will take a lot of time to reduce the inventory unless the economy improves again.
Fig 13: Property under construction & sold
Source: CEIC, Maybank Kim Eng
Fig 14: Ratio between floor space under construction & sold
Source: CEIC, Maybank Kim Eng
This can explain why developers do not increase their land banks even though property prices and sales improved in the past few months. Developers are still focused on reducing inventory.
Fig 15: Land area purchased YoY, 3mma
Source: CEIC, Maybank Kim Eng
We expect China will maintain a loose monetary policy in 2016. However, we don’t expect it will be as aggressive as in 2015, otherwise, the spread between China’s 2-year bond yield and the US’s 2-year bond yield would narrow further. This could signal deterioration in the carry and could add further pressure on the RMB. Our Regional Economist, Suhaimi Ilias, expects at least one more interest-rate cut in China within 1H16 and we expect the RMB to still be under pressure.
0
2,000
4,000
6,000
8,000
10,000
12,000
14,000
16,000
0
200
400
600
800
1,000
1,200
1,400
1,600
97 99 01 03 05 07 09 11 13 15
sq m mn sq m mn Floor Space Sold - 12 mth rollingFloor Space Under Construction - 12 mth rolling (RHS)
3
4
5
6
7
8
9
10
11
97 99 01 03 05 07 09 11 13 15
(x) Floor Space Under Construction/Sold
(60)
(30)
0
30
60
90
120
01 03 05 07 09 11 13 15
% Land Area Purchased YoY%, 3mma
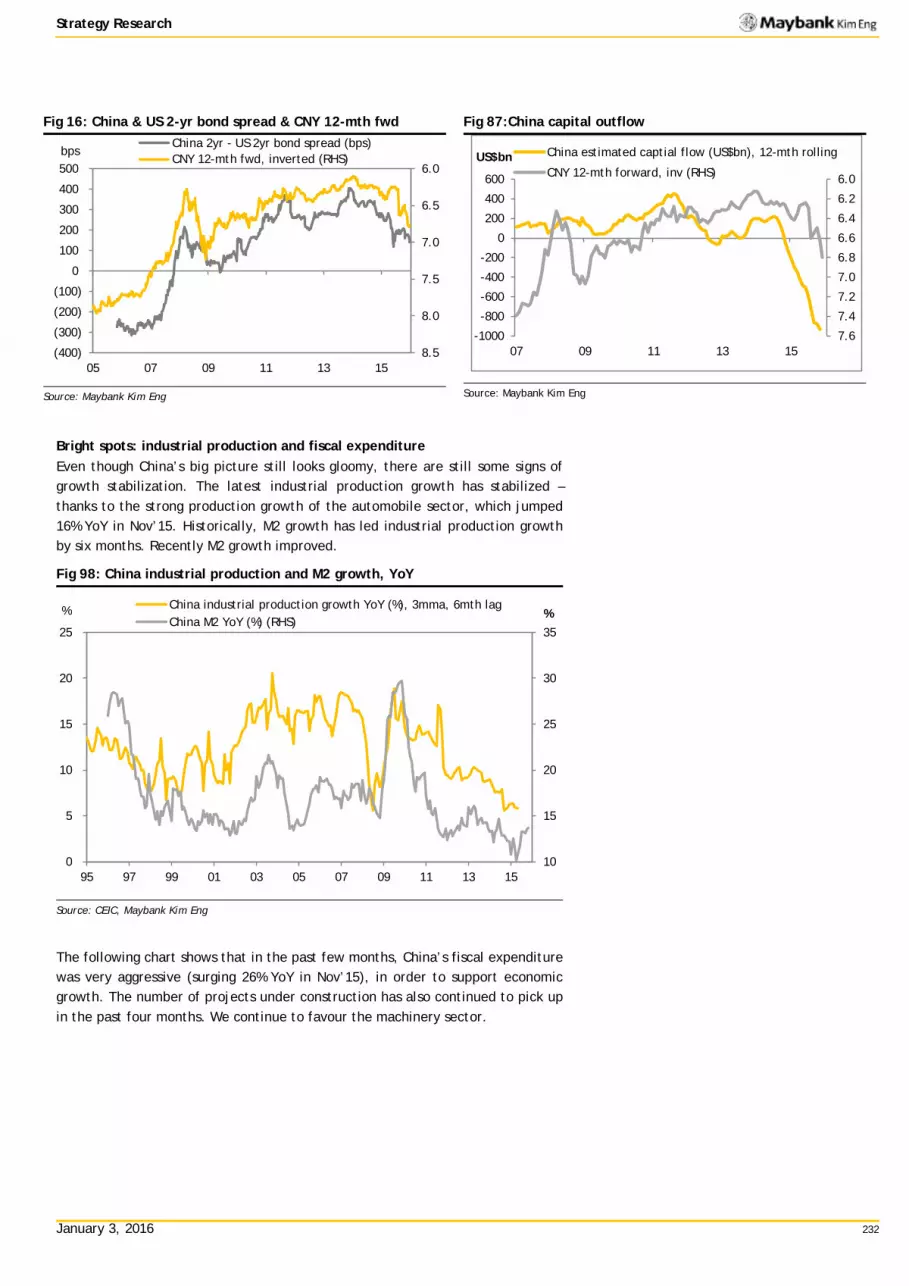
January 3, 2016 232
Strategy Research
Fig 16: China & US 2-yr bond spread & CNY 12-mth fwd
Source: Maybank Kim Eng
Fig 87:China capital outflow
Source: Maybank Kim Eng
Bright spots: industrial production and fiscal expenditure Even though China’s big picture still looks gloomy, there are still some signs of growth stabilization. The latest industrial production growth has stabilized – thanks to the strong production growth of the automobile sector, which jumped 16% YoY in Nov’15. Historically, M2 growth has led industrial production growth by six months. Recently M2 growth improved.
Fig 98: China industrial production and M2 growth, YoY
Source: CEIC, Maybank Kim Eng
The following chart shows that in the past few months, China’s fiscal expenditure was very aggressive (surging 26% YoY in Nov’15), in order to support economic growth. The number of projects under construction has also continued to pick up in the past four months. We continue to favour the machinery sector.
6.0
6.5
7.0
7.5
8.0
8.5(400)
(300)
(200)
(100)
0
100
200
300
400
500
05 07 09 11 13 15
bps China 2yr - US 2yr bond spread (bps)CNY 12-mth fwd, inverted (RHS)
6.0
6.2
6.4
6.6
6.8
7.0
7.2
7.4
7.6-1000
-800
-600
-400
-200
0
200
400
600
07 09 11 13 15
US$bn China estimated captial flow (US$bn), 12-mth rolling
CNY 12-mth forward, inv (RHS)
10
15
20
25
30
35
0
5
10
15
20
25
95 97 99 01 03 05 07 09 11 13 15
% % China industrial production growth YoY (%), 3mma, 6mth lagChina M2 YoY (%) (RHS)
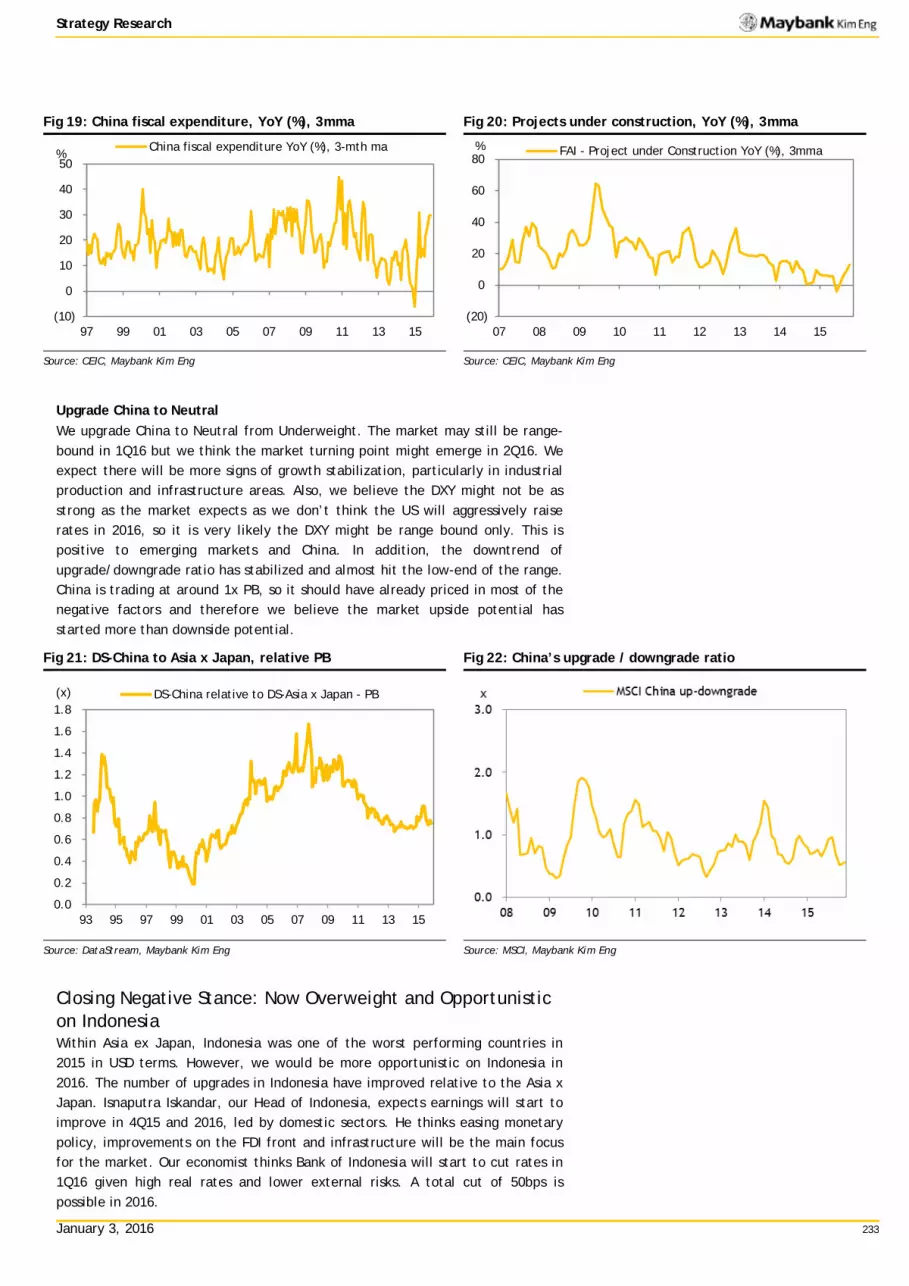
January 3, 2016 233
Strategy Research
Fig 19: China fiscal expenditure, YoY (%), 3mma
Source: CEIC, Maybank Kim Eng
Fig 20: Projects under construction, YoY (%), 3mma
Source: CEIC, Maybank Kim Eng
Upgrade China to Neutral We upgrade China to Neutral from Underweight. The market may still be range-bound in 1Q16 but we think the market turning point might emerge in 2Q16. We expect there will be more signs of growth stabilization, particularly in industrial production and infrastructure areas. Also, we believe the DXY might not be as strong as the market expects as we don’t think the US will aggressively raise rates in 2016, so it is very likely the DXY might be range bound only. This is positive to emerging markets and China. In addition, the downtrend of upgrade/downgrade ratio has stabilized and almost hit the low-end of the range. China is trading at around 1x PB, so it should have already priced in most of the negative factors and therefore we believe the market upside potential has started more than downside potential.
Fig 21: DS-China to Asia x Japan, relative PB
Source: DataStream, Maybank Kim Eng
Fig 22: China’s upgrade / downgrade ratio
Source: MSCI, Maybank Kim Eng
Closing Negative Stance: Now Overweight and Opportunistic on Indonesia Within Asia ex Japan, Indonesia was one of the worst performing countries in 2015 in USD terms. However, we would be more opportunistic on Indonesia in 2016. The number of upgrades in Indonesia have improved relative to the Asia x Japan. Isnaputra Iskandar, our Head of Indonesia, expects earnings will start to improve in 4Q15 and 2016, led by domestic sectors. He thinks easing monetary policy, improvements on the FDI front and infrastructure will be the main focus for the market. Our economist thinks Bank of Indonesia will start to cut rates in 1Q16 given high real rates and lower external risks. A total cut of 50bps is possible in 2016.
(10)
0
10
20
30
40
50
97 99 01 03 05 07 09 11 13 15
% China fiscal expenditure YoY (%), 3-mth ma
(20)
0
20
40
60
80
07 08 09 10 11 12 13 14 15
% FAI - Project under Construction YoY (%), 3mma
0.0
0.2
0.4
0.6
0.8
1.0
1.2
1.4
1.6
1.8
93 95 97 99 01 03 05 07 09 11 13 15
(x) DS-China relative to DS-Asia x Japan - PB

January 3, 2016 234
Strategy Research
Fig 23: Indonesia relative to Asia x Japan’s upgrade / downgrade ratio
Source: MSCI, Maybank Kim Eng
The government will increase the infrastructure budget by 8.3% to IDR314t - it accounts for 15% of the total 2016 budget. Our infrastructure analyst, Pandu Anugrah, favours Waskita Karya due to: 1) strong capital structure; 2) soaring order book; and 3) expansion into toll-road projects. Refer to Isnaputra and the team’s Indonesia Year Ahead on page 42, figure 25.
Sector Thoughts With a more positive disposition towards Asian markets, our sector trades are more cyclically positioned.
Relative trades (i): long industrials, short consumer staples
The following chart shows the relative PB of the DS-Asia ex Japan consumer staples relative to industrials has hit almost the peak. In our stress test report in Sep’-15, we highlighted that the consumer sector is less resilient than industrials, a reflection of the adjustment the latter sector has been making given what has been a prolonged regional economic slowdown. (Unmasking Asia: I So Wanna Be Resilient, September 10, 2015). Our consumer staples analyst, Jacqueline Ko, also found her clients are bearish on the consumer staples sector because of rich valuations and uncertain earnings. She expects further downside given the ex-growth prospects of the existing products and demanding valuations (Is the sector structurally dead?, October 30, 2015). We are more positive on the industrial sector, especially the machinery stocks, because of the number of infrastructure projects going to start, as we mentioned earlier. In addition, the bottom right-hand chart shows that if the DXY may not be strong this year, the industrial sector will benefit.

January 3, 2016 235
Strategy Research
Fig 24: DS-Asia x Japan Consumer staples rel Industrials, PB
Source: DataStream, Maybank Kim Eng
Fig 25: DS-Asia x Japan Industrials & DXY, inverse
Source: DataStream, Maybank Kim Eng
Relative trades (ii): long materials, short software
The following chart shows the relative PB of the DS-World software relative to materials. We use global data given the availability of history.
We are at the largest relative valuation divergence for these two sectors since the dotcom bubble in 2000. However, the bottom right-hand chart shows that the forward earnings growth of the DS-World software is on a downtrend. Therefore, we think the current valuation for the software sector is unsustainable.
Fig 106: DS- World & Asia x JP software relative materials, PB
Source: DataStream, Maybank Kim Eng
Fig 117: DS-World software forward earnings growth YoY (%)
Source: DataStream, Maybank Kim Eng
However, we think a lot of negative news on the materials sector appears to have been priced in - the DS-World materials is trading at 1.5x PB, which is at the bottom valuation range in the past 25 years.
While in relative terms, Asia ex Japan materials to software looks extended, in absolute terms, the PB has been lower. However, our team sees greater infrastructure projects in Asia going forward and a Chinese government that is getting serious about cutting excess capacity, especially in the copper, aluminium and steel sectors. Therefore, if the DXY is going to be range bound only in 2016, materials might have a strong bounce from the current deep valuation.
1.0
1.2
1.4
1.6
1.8
2.0
2.2
2.4
2.6
2.8
3.0
91 93 95 97 99 01 03 05 07 09 11 13 15
(x) DS-AxJ Consumer Staples rel to DS-AxJ Industrials - PB
60
70
80
90
100
110
120
1300
500
1,000
1,500
2,000
2,500
3,000
3,500
4,000
4,500
91 93 95 97 99 01 03 05 07 09 11 13 15
DS-Asia ex Japan Industrials index DXY (RHS), inv
0.0
5.0
10.0
15.0
20.0
25.0
1.0
2.0
3.0
4.0
5.0
6.0
7.0
8.0
91 93 95 97 99 01 03 05 07 09 11 13 15
(x) (x) DS-World software rel DS-World Materials - PB
DS-Asia x JP software rel DS-Asia x JP Materials - PB (RHS)
(20)(15)(10)(5)05
101520253035
09 10 11 12 13 14 15
% DS-World Software forward earnings growth YoY (%)

January 3, 2016 236
Strategy Research
Fig 28: DS- World & Asia x Japan basic materials PB
Source: DataStream, Maybank Kim Eng
Finally, our Internet analyst, Mitchell Kim, notes that Chinese e-commerce stocks are coming off a 50% 3-year GMV CAGR into a slower 23% 3-year CAGR cycle. As top-line growth slows, he believes visibility on profitability will play an increasingly more important role going forward. He is Neutral on the sector and does not favour JD.com because he believes the market overestimates the company’s ability to generate profit in the next two years. The company’s asset-heavy model will limit its ability to turn profitable without sacrificing top-line growth. (Dancing with nimble giant, December 8, 2015)
Bond Market Vol and Duration Stocks One of our central pillars for the 2015 strategy was a rising USD and rising USD volatility.
Our thinking has been that with central banks so fixated on QE and interest rates, the diverging economic performance would be captured in more volatile currencies. Arguably, this is what drove volatility in 2015. Furthermore, higher FX volatility for global companies translates into a higher cost of capital.
Instead for 2016, we suspect we could see more bond market volatility
In 2016, while the Fed is committed to not shrinking the balance sheet, fiscal deficits will need to be funded and that means more private-sector driven bond yields. But by allowing even a bit more market-driven adjustment in bond yields, and we suspect, higher bond market volatility, then this could mean less need for greater FX volatility.
Essentially, while in 2015, we reckon FX volatility drove other asset class volatility, in 2016, we suspect it is likely to be bond market volatility. Eventually, high volatility in one asset class spreads to other asset classes too.
For example, if global growth accelerates, and European and Japanese economic prospects improve, bond prices in Europe (where the curve shows negative yields five years out) and Japan appear too high. Similarly, if global growth slows, then US yields may not be able to rise but could move sharply in the other direction.
Higher bond market volatility = sell duration assets + pressured developed market equities
0.5
1.0
1.5
2.0
2.5
3.0
3.5
91 93 95 97 99 01 03 05 07 09 11 13 15
(x) World-DS Basic Materials - PB Asia x JP-DS Basic Materials - PB

January 3, 2016 237
Strategy Research
If we do see higher bond market volatility, we think this implies a negative stance towards duration assets such as Internet companies with steep valuations where earnings are very far out. These companies have moved higher due to lower discount rates thanks to global QE. If the rollback of QE means more volatility along the yield curve, then fair value multiples, given risk-adjusted cost of capital, would be lower. Given the narrow rally breadth (figure 8) in the US that means more pressure on US equities.
Fig 29: EURUSD and MOVE implied volatility
Source: Bloomberg, Maybank Kim Eng
0
50
100
150
200
250
300
0
5
10
15
20
25
30
05 06 07 08 09 10 11 12 13 14 15
EURUSD 3mth ATM implied volatilityMOVE Index (RHS)
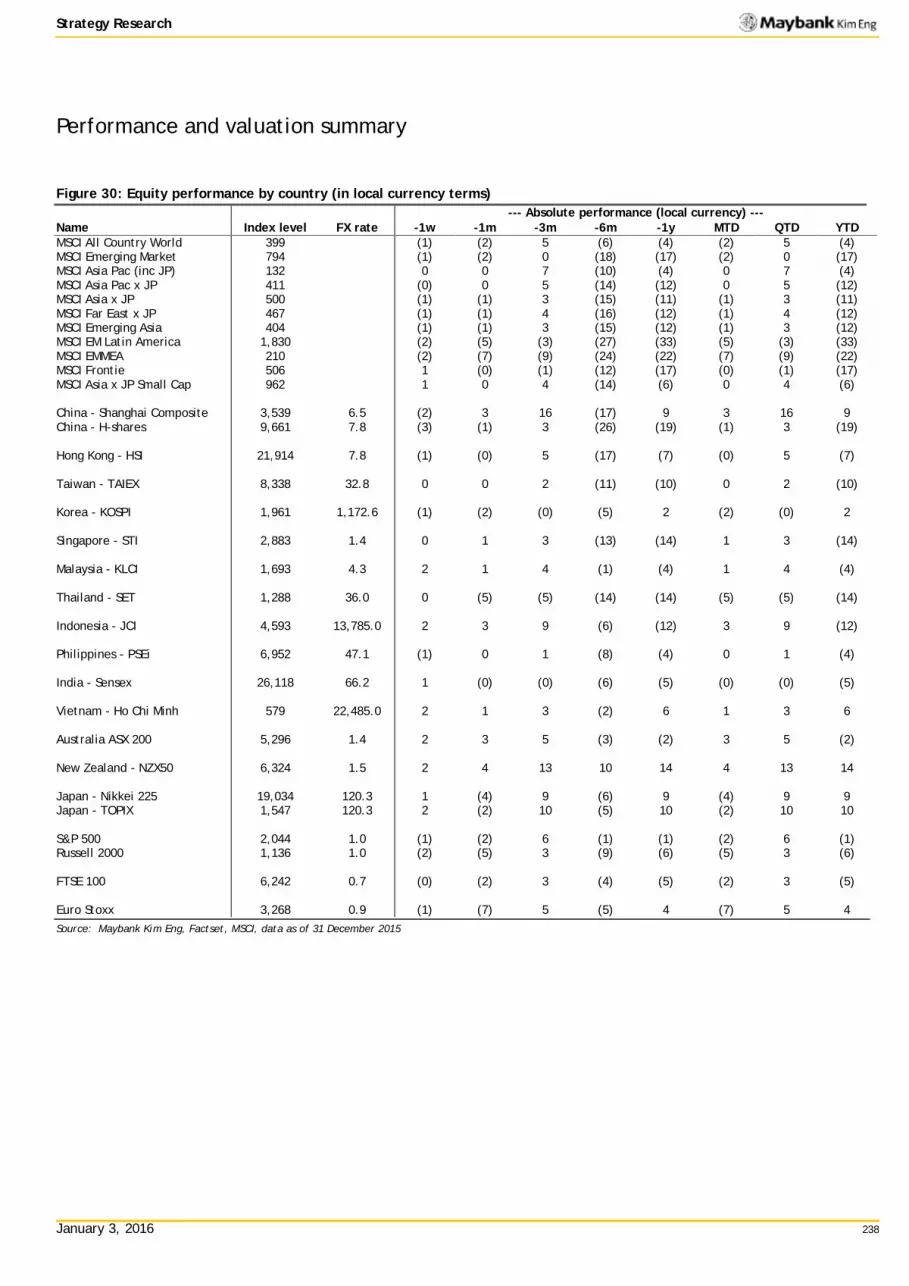
January 3, 2016 238
Strategy Research
Performance and valuation summary
Figure 30: Equity performance by country (in local currency terms)
Index level
FX rate --- Absolute performance (local currency) ---
Name -1w -1m -3m -6m -1y MTD QTD YTD MSCI All Country World 399
(1) (2) 5 (6) (4) (2) 5 (4)
MSCI Emerging Market 794
(1) (2) 0 (18) (17) (2) 0 (17) MSCI Asia Pac (inc JP) 132
0 0 7 (10) (4) 0 7 (4)
MSCI Asia Pac x JP 411
(0) 0 5 (14) (12) 0 5 (12) MSCI Asia x JP 500
(1) (1) 3 (15) (11) (1) 3 (11)
MSCI Far East x JP 467
(1) (1) 4 (16) (12) (1) 4 (12) MSCI Emerging Asia 404
(1) (1) 3 (15) (12) (1) 3 (12)
MSCI EM Latin America 1,830
(2) (5) (3) (27) (33) (5) (3) (33) MSCI EMMEA 210
(2) (7) (9) (24) (22) (7) (9) (22)
MSCI Frontie 506 1 (0) (1) (12) (17) (0) (1) (17) MSCI Asia x JP Small Cap 962
1 0 4 (14) (6) 0 4 (6)
China - Shanghai Composite 3,539 6.5 (2) 3 16 (17) 9 3 16 9
China - H-shares 9,661 7.8 (3) (1) 3 (26) (19) (1) 3 (19)
Hong Kong - HSI 21,914 7.8 (1) (0) 5 (17) (7) (0) 5 (7)
Taiwan - TAIEX 8,338 32.8 0 0 2 (11) (10) 0 2 (10)
Korea - KOSPI 1,961 1,172.6 (1) (2) (0) (5) 2 (2) (0) 2
Singapore - STI 2,883 1.4 0 1 3 (13) (14) 1 3 (14)
Malaysia - KLCI 1,693 4.3 2 1 4 (1) (4) 1 4 (4)
Thailand - SET 1,288 36.0 0 (5) (5) (14) (14) (5) (5) (14)
Indonesia - JCI 4,593 13,785.0 2 3 9 (6) (12) 3 9 (12)
Philippines - PSEi 6,952 47.1 (1) 0 1 (8) (4) 0 1 (4)
India - Sensex 26,118 66.2 1 (0) (0) (6) (5) (0) (0) (5)
Vietnam - Ho Chi Minh 579 22,485.0 2 1 3 (2) 6 1 3 6
Australia ASX 200 5,296 1.4 2 3 5 (3) (2) 3 5 (2)
New Zealand - NZX50 6,324 1.5 2 4 13 10 14 4 13 14
Japan - Nikkei 225 19,034 120.3 1 (4) 9 (6) 9 (4) 9 9 Japan - TOPIX 1,547 120.3 2 (2) 10 (5) 10 (2) 10 10
S&P 500 2,044 1.0 (1) (2) 6 (1) (1) (2) 6 (1) Russell 2000 1,136 1.0 (2) (5) 3 (9) (6) (5) 3 (6)
FTSE 100 6,242 0.7 (0) (2) 3 (4) (5) (2) 3 (5)
Euro Stoxx 3,268 0.9 (1) (7) 5 (5) 4 (7) 5 4 Source: Maybank Kim Eng, Factset, MSCI, data as of 31 December 2015

January 3, 2016 239
Strategy Research
Figure 31: Equity performance by country (in USD terms)
Index level
FX rate --- Absolute performance (USD) ---
Name -1w -1m -3m -6m -1y MTD QTD YTD MSCI All Country World 399
(1) (2) 5 (6) (4) (2) 5 (4)
MSCI Emerging Market 794
(1) (2) 0 (18) (17) (2) 0 (17) MSCI Asia Pac (inc JP) 132
0 0 7 (10) (4) 0 7 (4)
MSCI Asia Pac x JP 411
(0) 0 5 (14) (12) 0 5 (12) MSCI Asia x JP 500
(1) (1) 3 (15) (11) (1) 3 (11)
MSCI Far East x JP 467
(1) (1) 4 (16) (12) (1) 4 (12) MSCI Emerging Asia 404
(1) (1) 3 (15) (12) (1) 3 (12)
MSCI EM Latin America 1,830
(2) (5) (3) (27) (33) (5) (3) (33) MSCI EMMEA 210
(2) (7) (9) (24) (22) (7) (9) (22)
MSCI Frontie 506 1 (0) (1) (12) (17) (0) (1) (17) MSCI Asia x JP Small Cap 962
1 0 4 (14) (6) 0 4 (6)
China - Shanghai Composite 3,539 6.5 (2) 1 13 (21) 5 1 13 5
China - H-shares 9,661 7.8 (3) (1) 3 (26) (19) (1) 3 (19)
Hong Kong - HSI 21,914 7.8 (1) (0) 5 (16) (7) (0) 5 (7)
Taiwan - TAIEX 8,338 32.8 (0) (0) 2 (16) (14) (0) 2 (14)
Korea - KOSPI 1,961 1,172.6 (2) (3) 1 (10) (4) (3) 1 (4)
Singapore - STI 2,883 1.4 (0) 1 4 (17) (20) 1 4 (20)
Malaysia - KLCI 1,693 4.3 2 1 7 (13) (22) 1 7 (22)
Thailand - SET 1,288 36.0 1 (6) (4) (20) (21) (6) (4) (21)
Indonesia - JCI 4,593 13,785.0 1 4 16 (10) (21) 4 16 (21)
Philippines - PSEi 6,952 47.1 (0) 1 0 (12) (9) 1 0 (9)
India - Sensex 26,118 66.2 1 1 (1) (10) (9) 1 (1) (9)
Vietnam - Ho Chi Minh 579 22,485.0 2 1 3 (5) 1 1 3 1
Australia ASX 200 5,296 1.4 2 3 9 (8) (13) 3 9 (13)
New Zealand - NZX50 6,324 1.5 2 8 21 12 (1) 8 21 (1)
Japan - Nikkei 225 19,034 120.3 1 (1) 9 (4) 9 (1) 9 9 Japan - TOPIX 1,547 120.3 2 0 9 (3) 10 0 9 10
S&P 500 2,044 1.0 (1) (2) 6 (1) (1) (2) 6 (1) Russell 2000 1,136 1.0 (2) (5) 3 (9) (6) (5) 3 (6)
FTSE 100 6,242 0.7 (2) (4) 0 (10) (10) (4) 0 (10)
Euro Stoxx 3,268 0.9 (1) (4) 3 (7) (7) (4) 3 (7)
Source: Maybank Kim Eng, Factset, MSCI, data as of 31 December 2015

January 3, 2016 240
Strategy Research
Figure 32: Equity performance by country – relative performance
Index level
FX rate --- Relative performance to MSCI Asia x Japan ---
Name -1w -1m -3m -6m -1y MTD QTD YTD MSCI All Country World 399
0 (1) 1 9 7 (1) 1 7
MSCI Emerging Market 794
(0) (2) (3) (3) (6) (2) (3) (6) MSCI Asia Pac (inc JP) 132
1 1 3 5 7 1 3 7
MSCI Asia Pac x JP 411
1 1 1 1 (1) 1 1 (1) MSCI Asia x JP 500
MSCI Far East x JP 467
(0) (0) 1 (1) (0) (0) 1 (0) MSCI Emerging Asia 404
(0) (0) (0) (0) (0) (0) (0) (0)
MSCI EM Latin America 1,830
(1) (4) (7) (12) (22) (4) (7) (22) MSCI EMMEA 210
(2) (7) (12) (9) (11) (7) (12) (11)
MSCI Frontie 506 2 0 (5) 2 (6) 0 (5) (6) MSCI Asia x JP Small Cap 962
2 1 1 0 6 1 1 6
China - Shanghai Composite 3,539 6.5 (1) 2 10 (6) 16 2 10 16
China - H-shares 9,661 7.8 (2) (1) (1) (11) (8) (1) (1) (8)
Hong Kong - HSI 21,914 7.8 (0) 0 2 (2) 4 0 2 4
Taiwan - TAIEX 8,338 32.8 1 0 (1) (1) (2) 0 (1) (2)
Korea - KOSPI 1,961 1,172.6 (1) (2) (2) 5 7 (2) (2) 7
Singapore - STI 2,883 1.4 0 1 0 (3) (9) 1 0 (9)
Malaysia - KLCI 1,693 4.3 3 1 3 2 (10) 1 3 (10)
Thailand - SET 1,288 36.0 1 (5) (7) (5) (10) (5) (7) (10)
Indonesia - JCI 4,593 13,785.0 1 4 12 5 (10) 4 12 (10)
Philippines - PSEi 6,952 47.1 0 1 (3) 3 3 1 (3) 3
India - Sensex 26,118 66.2 2 1 (4) 5 2 1 (4) 2
Vietnam - Ho Chi Minh 579 22,485.0 3 2 (1) 10 12 2 (1) 12
Australia ASX 200 5,296 1.4 3 4 6 7 (2) 4 6 (2)
New Zealand - NZX50 6,324 1.5 3 8 18 27 11 8 18 11
Japan - Nikkei 225 19,034 120.3 2 (1) 6 11 20 (1) 6 20 Japan - TOPIX 1,547 120.3 2 1 6 11 21 1 6 21
S&P 500 2,044 1.0 0 (1) 3 14 11 (1) 3 11 Russell 2000 1,136 1.0 (1) (4) (0) 5 6 (4) (0) 6
FTSE 100 6,242 0.7 (1) (3) (3) 5 1 (3) (3) 1
Euro Stoxx 3,268 0.9 (1) (3) (1) 8 5 (3) (1) 5 Source: Maybank Kim Eng, Factset, MSCI, data as of 31 December 2015

January 3, 2016 241
Strategy Research
Figure 33: Equity performance by MSCI Asia ex Japan sector
--- Absolute performance ---
Name Index -1w -1m -3m -6m -1y MTD QTD YTD MSCI Asia ex Japan 500 (1) (1) 3 (15) (11) (1) 3 (11)
Energy 435 (2) (2) 5 (24) (21) (2) 5 (21)
Materials 251 (1) 2 5 (17) (12) 2 5 (12)
Industrials 149 (1) (2) (2) (18) (10) (2) (2) (10) Capital goods 137 (1) (3) (2) (19) (10) (3) (2) (10) Transportation 189 1 (0) 0 (15) (13) (0) 0 (13)
Consumer discretionary 422 (1) (1) 4 (8) (16) (1) 4 (16) Automobiles & Components 699 (1) (1) 4 (4) (15) (1) 4 (15) Retailing 238 (3) (2) (3) (16) (16) (2) (3) (16)
Consumer staples 406 (0) (1) 1 (10) (3) (1) 1 (3) Food/staples retail 106 (1) (8) (8) (14) (7) (8) (8) (7) Food/beverage/tobacco 328 (0) (1) 1 (11) (13) (1) 1 (13)
Health care 773 2 2 4 (3) 6 2 4 6
Financials 284 (1) 0 5 (18) (13) 0 5 (13) Banks 221 (1) (0) 3 (20) (18) (0) 3 (18) Diversified financials 514 (2) (2) 6 (25) (10) (2) 6 (10) Insurance 291 (2) (0) 9 (14) (1) (0) 9 (1) Real estate 174 (1) 2 5 (13) (10) 2 5 (10)
Technology 326 (1) (2) 6 (11) (8) (2) 6 (8) Software services 1,827 (0) (2) 6 (3) 12 (2) 6 12 Tech hardware 158 (2) (4) 5 (13) (13) (4) 5 (13) Semiconductors/equipment 300 (0) 2 8 (17) (18) 2 8 (18)
Telecoms 132 (1) (1) (2) (14) (11) (1) (2) (11)
Utilities 208 1 1 0 (10) (12) 1 0 (12) Source: Maybank Kim Eng, Factset, MSCI, data as of 31 December 2015

January 3, 2016 242
Strategy Research
Figure 34: Equity performance by MSCI Asia ex Japan sector – relative performance
--- Relative performance MSCI Asia ex Japan ---
Name Index -1w -1m -3m -6m -1y MTD QTD YTD MSCI Asia ex Japan 500
Energy 435 (1) (1) 2 (10) (10) (1) 2 (10)
Materials 251 0 3 1 (2) (1) 3 1 (1)
Industrials 149 (0) (2) (5) (3) 1 (2) (5) 1
Capital goods 137 (1) (2) (6) (4) 1 (2) (6) 1 Transportation 189 1 0 (3) 0 (2) 0 (3) (2)
Consumer discretionary 422 (0) (0) 0 7 (5) (0) 0 (5) Automobiles & Components 699 (1) (1) 1 10 (3) (1) 1 (3) Retailing 238 (2) (1) (6) (2) (4) (1) (6) (4)
Consumer staples 406 1 (1) (2) 5 8 (1) (2) 8 Food/staples retail 106 0 (7) (12) 1 5 (7) (12) 5 Food/beverage/tobacco 328 1 (1) (3) 4 (2) (1) (3) (2)
Health care 773 3 3 0 12 18 3 0 18
Financials 284 (0) 1 1 (3) (1) 1 1 (1) Banks 221 (0) 1 (1) (5) (7) 1 (1) (7) Diversified financials 514 (1) (1) 3 (11) 2 (1) 3 2 Insurance 291 (1) 0 5 1 11 0 5 11 Real estate 174 0 3 2 2 2 3 2 2
Technology 326 (0) (1) 3 4 3 (1) 3 3 Software services 1,827 1 (1) 3 12 23 (1) 3 23 Tech hardware 158 (1) (3) 2 2 (2) (3) 2 (2) Semiconductors/equipment 300 1 2 4 (2) (6) 2 4 (6)
Telecoms 132 0 (1) (5) 1 (0) (1) (5) (0)
Utilities 208 2 2 (3) 5 (0) 2 (3) (0) Source: Maybank Kim Eng, Factset, MSCI, data as of 31 December 2015

January 3, 2016 243
Strategy Research
Figure 35: MSCI country valuation
PE (x) EPS growth YoY (%) ROE(%) PB (x) DY (%)
2014F 2015F 2016F 2014F 2015F 2016F 2014F 2015F 2016F 2014F 2015F 2016F 2014F 2015F 2016F
Asia-ex-Japan
13.5 12.4 11.7 8 5 6 12 11 11 1.6 1.4 1.3 2.6 2.8 2.9 China
10.9 10.8 10.2 6 3 7 14 13 12 1.5 1.4 1.3 3.0 2.9 2.9
Hong Kong
14.0 15.2 13.8 32 (21) 10 10 7 8 1.4 1.1 1.1 3.4 3.1 3.4
Taiwan
14.6 12.1 11.8 28 6 2 13 13 12 1.9 1.6 1.5 2.9 4.1 4.2
Korea
12.3 10.0 10.1 (8) 24 (1) 9 10 9 1.1 1.0 0.9 1.4 1.7 2.0
Singapore
13.9 12.3 11.6 15 (3) 5.7 10 9 9 1.4 1.1 1.1 3.5 4.3 4.4
Malaysia
17.3 16.9 15.5 4 1 9 12 10 11 2.0 1.7 1.7 3.0 3.0 3.2
Thailand
18.3 14.8 12.1 (23) 2 22 12 12 13 2.2 1.7 1.6 2.8 3.5 3.7
Indonesia
17.3 16.3 14.7 11 (5) 11 20 17 17 3.5 2.8 2.5 2.2 2.4 2.5
Philippines
22.7 19.2 17.1 23 11 12 14 14 14 3.3 2.6 2.4 2.0 1.9 1.9
India
21.4 20.4 17.4 9 7 17 15 15 16 3.2 3.1 2.8 1.4 1.5 1.7 Japan 17.2 15.8 14.1 20 11 12 9 8 9 1.5 1.3 1.2 1.7 1.9 2.1
US (S&P 500)
18.3 18.3 17.4 7 -1 11 14 13 15 2.8 2.8 2.7 2.0 2.2 2.2 Europe (Euro Stoxx)
21.5 22.8 15.4 10 1 58 8 8 9 1.5 1.6 1.6 3.4 3.2 3.3
Source: Maybank Kim Eng, Factset, MSCI, Bloomberg data as of 31 December 2015

January 3, 2016 244
Strategy Research
Figure 36: MSCI Asia ex-Japan sector valuation
PE (x) EPS growth YoY (%) ROE (%) PB (x) DY (%)
2014F 2015F 2016F 2014F 2015F 2016F 2014F 2015F 2016F 2014F 2015F 2016F 2014F 2015F 2016F
Asia-ex-Japan
13.5 12.4 11.7 8 5 6 12 11 11 1.6 1.4 1.3 2.6 2.8 2.9
Energy
12.6 13.8 11.6 (22) (25) 19 9 6 7 1.1 0.9 0.8 3.1 3.1 3.1
Materials
19.0 16.3 13.8 (13) 18 18 6 6 7 1.1 1.0 1.0 2.5 2.8 2.8
Industrials
20.5 14.3 13.4 14 18 6 7 9 9 1.4 1.2 1.2 2.8 2.3 2.5 Capital goods
18.7 12.7 12.6 15 17 1 7 9 9 1.3 1.1 1.1 3.0 2.2 2.4
Transportation 25.2 27.9 20.8 16 11 21 30 6 7 9 1.6 1.5 1.4 2.1 2.5
Consumer discretionary 11.1 12.0 13.0 12 (5) (7) 12 14 12 12 1.7 1.6 1.4 2.3 2.2 Automobiles & Components 8.3 8.7 9.2 8 (5) (5) 13 15 13 13 1.3 1.2 1.1 1.7 2.0 Retailing
18.0 27.6 24.3 (2) 14 13 8 8 9 1.5 2.3 2.2 1.8 0.9 1.1
Consumer staples 25.3 26.5 23.9 21 5 16 12 12 13 13 3.2 3.1 2.8 1.8 1.7
Food/staples retail 25.3 26.8 19.7 20 (11) 53 (3) 9 12 11 2.3 2.4 2.3 1.7 1.8 Food/beverage/tobacco 22.5 23.1 20.9 19 6 9 13 12 11 12 2.6 2.3 2.2 2.1 2.1
Health care
29.3 31.8 25.2 29 24 26 14 15 16 4.2 4.7 4.0 0.8 0.7 0.8
Financials
11.0 9.4 9.0 14 8 5 11 11 11 1.3 1.0 1.0 3.1 3.6 3.7 Banks
8.8 7.6 7.3 9 4 3 14 13 12 1.2 1.0 0.9 3.9 4.5 4.6
Diversified financials 15.3 15.9 11.2 12 51 46 (6) 12 14 12 2.0 1.6 1.5 2.3 3.4 Insurance
17.1 13.9 13.2 41 23 6 12 12 12 2.0 1.7 1.5 1.3 1.7 1.8
Real estate
13.2 11.6 10.3 8 0 13 7 6 7 0.9 0.7 0.7 3.3 3.5 3.7
Technology
14.3 14.2 13.5 6 (1) 5 16 15 14 2.3 2.1 1.9 1.8 2.1 2.4 Software services 29.3 32.0 31.2 25 28 14 24 25 21 21 7.9 6.5 5.3 0.8 0.7 Tech hardware 10.8 10.8 10.1 10 37 (4) 2 13 12 11 1.4 1.2 1.1 2.1 2.9 Semiconductors/equipment 13.2 13.7 11.2 11 48 1 (0) 21 19 17 2.8 2.1 1.9 2.2 3.4
Telecoms
18.8 15.1 14.4 0 10 5 12 12 12 2.3 1.9 1.8 3.2 3.8 3.9
Utilities
9.4 9.8 11.7 100 (8) (16) 16 13 11 1.6 1.3 1.2 2.8 3.4 3.4 Source: Maybank Kim Eng, Factset, MSCI, Bloomberg data as of 31 December 2015
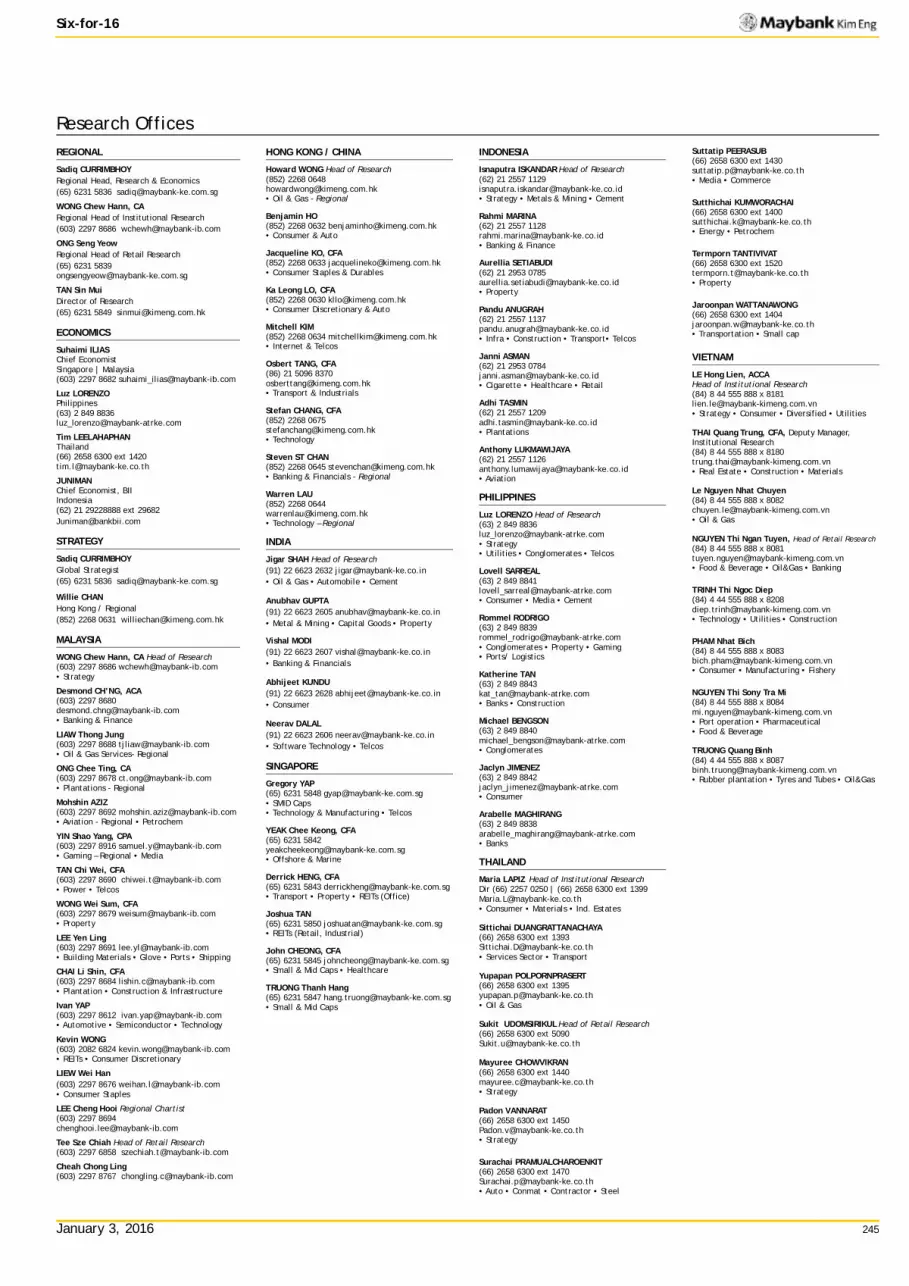
January 3, 2016 245
Six-for-16
Research Offices
REGIONAL
Sadiq CURRIMBHOY Regional Head, Research & Economics (65) 6231 5836 [email protected]
WONG Chew Hann, CA Regional Head of Institutional Research (603) 2297 8686 [email protected]
ONG Seng Yeow Regional Head of Retail Research (65) 6231 5839 [email protected]
TAN Sin Mui Director of Research (65) 6231 5849 [email protected]
ECONOMICS
Suhaimi ILIAS Chief Economist Singapore | Malaysia (603) 2297 8682 [email protected]
Luz LORENZO Philippines (63) 2 849 8836 [email protected]
Tim LEELAHAPHAN Thailand (66) 2658 6300 ext 1420 [email protected]
JUNIMAN Chief Economist, BII Indonesia (62) 21 29228888 ext 29682 [email protected]
STRATEGY
Sadiq CURRIMBHOY Global Strategist (65) 6231 5836 [email protected]
Willie CHAN Hong Kong / Regional (852) 2268 0631 [email protected]
MALAYSIA
WONG Chew Hann, CA Head of Research (603) 2297 8686 [email protected] • Strategy
Desmond CH’NG, ACA (603) 2297 8680 [email protected] • Banking & Finance
LIAW Thong Jung (603) 2297 8688 [email protected] • Oil & Gas Services- Regional
ONG Chee Ting, CA (603) 2297 8678 [email protected] • Plantations - Regional
Mohshin AZIZ (603) 2297 8692 [email protected] • Aviation - Regional • Petrochem
YIN Shao Yang, CPA (603) 2297 8916 [email protected] • Gaming – Regional • Media
TAN Chi Wei, CFA (603) 2297 8690 [email protected] • Power • Telcos
WONG Wei Sum, CFA (603) 2297 8679 [email protected] • Property
LEE Yen Ling (603) 2297 8691 [email protected] • Building Materials • Glove • Ports • Shipping
CHAI Li Shin, CFA (603) 2297 8684 [email protected] • Plantation • Construction & Infrastructure
Ivan YAP (603) 2297 8612 [email protected] • Automotive • Semiconductor • Technology
Kevin WONG (603) 2082 6824 [email protected] • REITs • Consumer Discretionary
LIEW Wei Han (603) 2297 8676 [email protected] • Consumer Staples
LEE Cheng Hooi Regional Chartist (603) 2297 8694 [email protected]
Tee Sze Chiah Head of Retail Research (603) 2297 6858 [email protected]
Cheah Chong Ling (603) 2297 8767 [email protected]
HONG KONG / CHINA
Howard WONG Head of Research (852) 2268 0648 [email protected] • Oil & Gas - Regional
Benjamin HO (852) 2268 0632 [email protected] • Consumer & Auto
Jacqueline KO, CFA (852) 2268 0633 [email protected] • Consumer Staples & Durables
Ka Leong LO, CFA (852) 2268 0630 [email protected] • Consumer Discretionary & Auto
Mitchell KIM (852) 2268 0634 [email protected] • Internet & Telcos
Osbert TANG, CFA (86) 21 5096 8370 [email protected] • Transport & Industrials
Stefan CHANG, CFA (852) 2268 0675 [email protected] • Technology
Steven ST CHAN (852) 2268 0645 [email protected] • Banking & Financials - Regional
Warren LAU (852) 2268 0644 [email protected] • Technology – Regional
INDIA
Jigar SHAH Head of Research (91) 22 6623 2632 [email protected] • Oil & Gas • Automobile • Cement
Anubhav GUPTA (91) 22 6623 2605 [email protected] • Metal & Mining • Capital Goods • Property
Vishal MODI (91) 22 6623 2607 [email protected] • Banking & Financials
Abhijeet KUNDU (91) 22 6623 2628 [email protected] • Consumer
Neerav DALAL (91) 22 6623 2606 [email protected] • Software Technology • Telcos
SINGAPORE
Gregory YAP (65) 6231 5848 [email protected] • SMID Caps • Technology & Manufacturing • Telcos
YEAK Chee Keong, CFA (65) 6231 5842 [email protected] • Offshore & Marine
Derrick HENG, CFA (65) 6231 5843 [email protected] • Transport • Property • REITs (Office)
Joshua TAN (65) 6231 5850 [email protected] • REITs (Retail, Industrial)
John CHEONG, CFA (65) 6231 5845 [email protected] • Small & Mid Caps • Healthcare
TRUONG Thanh Hang (65) 6231 5847 [email protected] • Small & Mid Caps
INDONESIA
Isnaputra ISKANDAR Head of Research (62) 21 2557 1129 [email protected] • Strategy • Metals & Mining • Cement
Rahmi MARINA (62) 21 2557 1128 [email protected] • Banking & Finance
Aurellia SETIABUDI (62) 21 2953 0785 [email protected] • Property
Pandu ANUGRAH (62) 21 2557 1137 [email protected] • Infra • Construction • Transport• Telcos
Janni ASMAN (62) 21 2953 0784 [email protected] • Cigarette • Healthcare • Retail
Adhi TASMIN (62) 21 2557 1209 [email protected] • Plantations
Anthony LUKMAWIJAYA (62) 21 2557 1126 [email protected] • Aviation
PHILIPPINES
Luz LORENZO Head of Research (63) 2 849 8836 [email protected] • Strategy • Utilities • Conglomerates • Telcos
Lovell SARREAL (63) 2 849 8841 [email protected] • Consumer • Media • Cement
Rommel RODRIGO (63) 2 849 8839 [email protected] • Conglomerates • Property • Gaming • Ports/ Logistics
Katherine TAN (63) 2 849 8843 [email protected] • Banks • Construction
Michael BENGSON (63) 2 849 8840 [email protected] • Conglomerates
Jaclyn JIMENEZ (63) 2 849 8842 [email protected] • Consumer
Arabelle MAGHIRANG (63) 2 849 8838 [email protected] • Banks
THAILAND
Maria LAPIZ Head of Institutional Research Dir (66) 2257 0250 | (66) 2658 6300 ext 1399 [email protected] • Consumer • Materials • Ind. Estates
Sittichai DUANGRATTANACHAYA (66) 2658 6300 ext 1393 [email protected] • Services Sector • Transport
Yupapan POLPORNPRASERT (66) 2658 6300 ext 1395 [email protected] • Oil & Gas
Sukit UDOMSIRIKUL Head of Retail Research (66) 2658 6300 ext 5090 [email protected]
Mayuree CHOWVIKRAN (66) 2658 6300 ext 1440 [email protected] • Strategy
Padon VANNARAT (66) 2658 6300 ext 1450 [email protected] • Strategy
Surachai PRAMUALCHAROENKIT (66) 2658 6300 ext 1470 [email protected] • Auto • Conmat • Contractor • Steel
Suttatip PEERASUB (66) 2658 6300 ext 1430 [email protected] • Media • Commerce
Sutthichai KUMWORACHAI (66) 2658 6300 ext 1400 [email protected] • Energy • Petrochem
Termporn TANTIVIVAT (66) 2658 6300 ext 1520 [email protected] • Property
Jaroonpan WATTANAWONG (66) 2658 6300 ext 1404 [email protected] • Transportation • Small cap
VIETNAM
LE Hong Lien, ACCA Head of Institutional Research (84) 8 44 555 888 x 8181 [email protected] • Strategy • Consumer • Diversified • Utilities
THAI Quang Trung, CFA, Deputy Manager, Institutional Research (84) 8 44 555 888 x 8180 [email protected] • Real Estate • Construction • Materials
Le Nguyen Nhat Chuyen (84) 8 44 555 888 x 8082 [email protected] • Oil & Gas
NGUYEN Thi Ngan Tuyen, Head of Retail Research (84) 8 44 555 888 x 8081 [email protected] • Food & Beverage • Oil&Gas • Banking
TRINH Thi Ngoc Diep (84) 4 44 555 888 x 8208 [email protected] • Technology • Utilities • Construction
PHAM Nhat Bich (84) 8 44 555 888 x 8083 [email protected] • Consumer • Manufacturing • Fishery
NGUYEN Thi Sony Tra Mi (84) 8 44 555 888 x 8084 [email protected] • Port operation • Pharmaceutical • Food & Beverage
TRUONG Quang Binh (84) 4 44 555 888 x 8087 [email protected] • Rubber plantation • Tyres and Tubes • Oil&Gas
January 3, 2016 246
Six-for-16
APPENDIX I: TERMS FOR PROVISION OF REPORT, DISCLAIMERS AND DISCLOSURES
DISCLAIMERS
This research report is prepared for general circulation and for information purposes only and under no circumstances should it be considered or intended as an offer to sell or a solicitation of an offer to buy the securities referred to herein. Investors should note that values of such securities, if any, may fluctuate and that each security’s price or value may rise or fall. Opinions or recommendations contained herein are in form of technical ratings and fundamental ratings. Technical ratings may differ from fundamental ratings as technical valuations apply different methodologies and are purely based on price and volume-related information extracted from the relevant jurisdiction’s stock exchange in the equity analysis. Accordingly, investors’ returns may be less than the original sum invested. Past performance is not necessarily a guide to future performance. This report is not intended to provide personal investment advice and does not take into account the specific investment objectives, the financial situation and the particular needs of persons who may receive or read this report. Investors should therefore seek financial, legal and other advice regarding the appropriateness of investing in any securities or the investment strategies discussed or recommended in this report.
The information contained herein has been obtained from sources believed to be reliable but such sources have not been independently verified by Maybank Investment Bank Berhad, its subsidiary and affiliates (collectively, “MKE”) and consequently no representation is made as to the accuracy or completeness of this report by MKE and it should not be relied upon as such. Accordingly, MKE and its officers, directors, associates, connected parties and/or employees (collectively, “Representatives”) shall not be liable for any direct, indirect or consequential losses or damages that may arise from the use or reliance of this report. Any information, opinions or recommendations contained herein are subject to change at any time, without prior notice.
This report may contain forward looking statements which are often but not always identified by the use of words such as “anticipate”, “believe”, “estimate”, “intend”, “plan”, “expect”, “forecast”, “predict” and “project” and statements that an event or result “may”, “will”, “can”, “should”, “could” or “might” occur or be achieved and other similar expressions. Such forward looking statements are based on assumptions made and information currently available to us and are subject to certain risks and uncertainties that could cause the actual results to differ materially from those expressed in any forward looking statements. Readers are cautioned not to place undue relevance on these forward-looking statements. MKE expressly disclaims any obligation to update or revise any such forward looking statements to reflect new information, events or circumstances after the date of this publication or to reflect the occurrence of unanticipated events.
MKE and its officers, directors and employees, including persons involved in the preparation or issuance of this report, may, to the extent permitted by law, from time to time participate or invest in financing transactions with the issuer(s) of the securities mentioned in this report, perform services for or solicit business from such issuers, and/or have a position or holding, or other material interest, or effect transactions, in such securities or options thereon, or other investments related thereto. In addition, it may make markets in the securities mentioned in the material presented in this report. MKE may, to the extent permitted by law, act upon or use the information presented herein, or the research or analysis on which they are based, before the material is published. One or more directors, officers and/or employees of MKE may be a director of the issuers of the securities mentioned in this report.
This report is prepared for the use of MKE’s clients and may not be reproduced, altered in any way, transmitted to, copied or distributed to any other party in whole or in part in any form or manner without the prior express written consent of MKE and MKE and its Representatives accepts no liability whatsoever for the actions of third parties in this respect.
This report is not directed to or intended for distribution to or use by any person or entity who is a citizen or resident of or located in any locality, state, country or other jurisdiction where such distribution, publication, availability or use would be contrary to law or regulation. This report is for distribution only under such circumstances as may be permitted by applicable law. The securities described herein may not be eligible for sale in all jurisdictions or to certain categories of investors. Without prejudice to the foregoing, the reader is to note that additional disclaimers, warnings or qualifications may apply based on geographical location of the person or entity receiving this report.
Malaysia
Opinions or recommendations contained herein are in the form of technical ratings and fundamental ratings. Technical ratings may differ from fundamental ratings as technical valuations apply different methodologies and are purely based on price and volume-related information extracted from Bursa Malaysia Securities Berhad in the equity analysis.
Singapore
This report has been produced as of the date hereof and the information herein may be subject to change. Maybank Kim Eng Research Pte. Ltd. (“Maybank KERPL”) in Singapore has no obligation to update such information for any recipient. For distribution in Singapore, recipients of this report are to contact Maybank KERPL in Singapore in respect of any matters arising from, or in connection with, this report. If the recipient of this report is not an accredited investor, expert investor or institutional investor (as defined under Section 4A of the Singapore Securities and Futures Act), Maybank KERPL shall be legally liable for the contents of this report, with such liability being limited to the extent (if any) as permitted by law.
Thailand
The disclosure of the survey result of the Thai Institute of Directors Association (“IOD”) regarding corporate governance is made pursuant to the policy of the Office of the Securities and Exchange Commission. The survey of the IOD is based on the information of a company listed on the Stock Exchange of Thailand and the market for Alternative Investment disclosed to the public and able to be accessed by a general public investor. The result, therefore, is from the perspective of a third party. It is not an evaluation of operation and is not based on inside information. The survey result is as of the date appearing in the Corporate Governance Report of Thai Listed Companies. As a result, the survey may be changed after that date. Maybank Kim Eng Securities (Thailand) Public Company Limited (“MBKET”) does not confirm nor certify the accuracy of such survey result.
Except as specifically permitted, no part of this presentation may be reproduced or distributed in any manner without the prior written permission of MBKET. MBKET accepts no liability whatsoever for the actions of third parties in this respect.
US
This research report prepared by MKE is distributed in the United States (“US”) to Major US Institutional Investors (as defined in Rule 15a-6 under the Securities Exchange Act of 1934, as amended) only by Maybank Kim Eng Securities USA Inc (“Maybank KESUSA”), a broker-dealer registered in the US (registered under Section 15 of the Securities Exchange Act of 1934, as amended). All responsibility for the distribution of this report by Maybank KESUSA in the US shall be borne by Maybank KESUSA. All resulting transactions by a US person or entity should be effected through a registered broker-dealer in the US. This report is not directed at you if MKE is prohibited or restricted by any legislation or regulation in any jurisdiction from making it available to you. You should satisfy yourself before reading it that Maybank KESUSA is permitted to provide research material concerning investments to you under relevant legislation and regulations.
UK
This document is being distributed by Maybank Kim Eng Securities (London) Ltd (“Maybank KESL”) which is authorized and regulated, by the Financial Services Authority and is for Informational Purposes only. This document is not intended for distribution to anyone defined as a Retail Client under the Financial Services and Markets Act 2000 within the UK. Any inclusion of a third party link is for the recipients convenience only, and that the firm does not take any responsibility for its comments or accuracy, and that access to such links is at the individuals own risk. Nothing in this report should be considered as constituting legal, accounting or tax advice, and that for accurate guidance recipients should consult with their own independent tax advisers.

January 3, 2016 247
Six-for-16
Disclosure of Interest Malaysia: MKE and its Representatives may from time to time have positions or be materially interested in the securities referred to herein and may further act as market maker or may have assumed an underwriting commitment or deal with such securities and may also perform or seek to perform investment banking services, advisory and other services for or relating to those companies.
Singapore: As of 3 January 2016, Maybank KERPL and the covering analyst do not have any interest in any companies recommended in this research report.
Thailand: MBKET may have a business relationship with or may possibly be an issuer of derivative warrants on the securities /companies mentioned in the research report. Therefore, Investors should exercise their own judgment before making any investment decisions. MBKET, its associates, directors, connected parties and/or employees may from time to time have interests and/or underwriting commitments in the securities mentioned in this report.
Hong Kong: KESHK may have financial interests in relation to an issuer or a new listing applicant referred to as defined by the requirements under Paragraph 16.5(a) of the Hong Kong Code of Conduct for Persons Licensed by or Registered with the Securities and Futures Commission.
As of 3 January 2016, KESHK and the authoring analyst do not have any interest in any companies recommended in this research report.
MKE may have, within the last three years, served as manager or co-manager of a public offering of securities for, or currently may make a primary market in issues of, any or all of the entities mentioned in this report or may be providing, or have provided within the previous 12 months, significant advice or investment services in relation to the investment concerned or a related investment and may receive compensation for the services provided from the companies covered in this report.
OTHERS Analyst Certification of Independence The views expressed in this research report accurately reflect the analyst’s personal views about any and all of the subject securities or issuers; and no part of the research analyst’s compensation was, is or will be, directly or indirectly, related to the specific recommendations or views expressed in the report.
Reminder Structured securities are complex instruments, typically involve a high degree of risk and are intended for sale only to sophisticated investors who are capable of understanding and assuming the risks involved. The market value of any structured security may be affected by changes in economic, financial and political factors (including, but not limited to, spot and forward interest and exchange rates), time to maturity, market conditions and volatility and the credit quality of any issuer or reference issuer. Any investor interested in purchasing a structured product should conduct its own analysis of the product and consult with its own professional advisers as to the risks involved in making such a purchase.
No part of this material may be copied, photocopied or duplicated in any form by any means or redistributed without the prior consent of MKE.
Ong Seng Yeow | Executive Director, Maybank Kim Eng Research
Definition of Ratings
Maybank Kim Eng Research uses the following rating system BUY Return is expected to be above 10% in the next 12 months (excluding dividends) HOLD Return is expected to be between - 10% to +10% in the next 12 months (excluding dividends) SELL Return is expected to be below -10% in the next 12 months (excluding dividends)
Applicability of Ratings
The respective analyst maintains a coverage universe of stocks, the list of which may be adjusted according to needs. Investment ratings are only applicable to the stocks which form part of the coverage universe. Reports on companies which are not part of the coverage do not carry investment ratings as we do not actively follow developments in these companies.
DISCLOSURES Legal Entities Disclosures Malaysia: This report is issued and distributed in Malaysia by Maybank Investment Bank Berhad (15938-H) which is a Participating Organization of Bursa Malaysia Berhad and a holder of Capital Markets and Services License issued by the Securities Commission in Malaysia. Singapore: This material is issued and distributed in Singapore by Maybank KERPL (Co. Reg No 197201256N) which is regulated by the Monetary Authority of Singapore. Indonesia: PT Kim Eng Securities (“PTKES”) (Reg. No. KEP-251/PM/1992) is a member of the Indonesia Stock Exchange and is regulated by the BAPEPAM LK. Thailand: MBKET (Reg. No.0107545000314) is a member of the Stock Exchange of Thailand and is regulated by the Ministry of Finance and the Securities and Exchange Commission. Philippines: Maybank ATRKES (Reg. No.01-2004-00019) is a member of the Philippines Stock Exchange and is regulated by the Securities and Exchange Commission. Vietnam: Maybank Kim Eng Securities JSC (License Number: 71/UBCK-GP) is licensed under the State Securities Commission of Vietnam.Hong Kong: KESHK (Central Entity No AAD284) is regulated by the Securities and Futures Commission. India: Kim Eng Securities India Private Limited (“KESI”) is a participant of the National Stock Exchange of India Limited (Reg No: INF/INB 231452435) and the Bombay Stock Exchange (Reg. No. INF/INB 011452431) and is regulated by Securities and Exchange Board of India. KESI is also registered with SEBI as Category 1 Merchant Banker (Reg. No. INM 000011708) US: Maybank KESUSA is a member of/ and is authorized and regulated by the FINRA – Broker ID 27861. UK: Maybank KESL (Reg No 2377538) is authorized and regulated by the Financial Services Authority.

January 3, 2016 248
Six-for-16
ý Malaysia Maybank Investment Bank Berhad (A Participating Organisation of Bursa Malaysia Securities Berhad) 33rd Floor, Menara Maybank, 100 Jalan Tun Perak, 50050 Kuala Lumpur Tel: (603) 2059 1888; Fax: (603) 2078 4194
ý Singapore Maybank Kim Eng Securities Pte Ltd Maybank Kim Eng Research Pte Ltd 50 North Canal Road Singapore 059304 Tel: (65) 6336 9090
ý London Maybank Kim Eng Securities (London) Ltd 5th Floor, Aldermary House 10-15 Queen Street London EC4N 1TX, UK Tel: (44) 20 7332 0221 Fax: (44) 20 7332 0302
ý New York Maybank Kim Eng Securities USA Inc 777 Third Avenue, 21st Floor New York, NY 10017, U.S.A. Tel: (212) 688 8886 Fax: (212) 688 3500
Stockbroking Business: Level 8, Tower C, Dataran Maybank, No.1, Jalan Maarof 59000 Kuala Lumpur Tel: (603) 2297 8888 Fax: (603) 2282 5136
ý Hong Kong Kim Eng Securities (HK) Ltd Level 30, Three Pacific Place, 1 Queen’s Road East, Hong Kong Tel: (852) 2268 0800 Fax: (852) 2877 0104
ý Indonesia PT Maybank Kim Eng Securities Plaza Bapindo Citibank Tower 17th Floor Jl Jend. Sudirman Kav. 54-55 Jakarta 12190, Indonesia Tel: (62) 21 2557 1188 Fax: (62) 21 2557 1189
ý India Kim Eng Securities India Pvt Ltd 2nd Floor, The International 16, Maharishi Karve Road, Churchgate Station, Mumbai City - 400 020, India Tel: (91) 22 6623 2600 Fax: (91) 22 6623 2604
ý Philippines Maybank ATR Kim Eng Securities Inc. 17/F, Tower One & Exchange Plaza Ayala Triangle, Ayala Avenue Makati City, Philippines 1200 Tel: (63) 2 849 8888 Fax: (63) 2 848 5738
ý Thailand Maybank Kim Eng Securities (Thailand) Public Company Limited 999/9 The Offices at Central World, 20th - 21st Floor, Rama 1 Road Pathumwan, Bangkok 10330, Thailand Tel: (66) 2 658 6817 (sales) Tel: (66) 2 658 6801 (research)
ý Vietnam Maybank Kim Eng Securities Limited 4A-15+16 Floor Vincom Center Dong Khoi, 72 Le Thanh Ton St. District 1 Ho Chi Minh City, Vietnam Tel : (84) 844 555 888 Fax : (84) 8 38 271 030
ý Saudi Arabia In association with Anfaal Capital Villa 47, Tujjar Jeddah Prince Mohammed bin Abdulaziz Street P.O. Box 126575 Jeddah 21352 Tel: (966) 2 6068686 Fax: (966) 26068787
ý South Asia Sales Trading Kevin Foy Regional Head Sales Trading [email protected] Tel: (65) 6336-5157 US Toll Free: 1-866-406-7447
ý North Asia Sales Trading Andrew Lee [email protected] Tel: (852) 2268 0283 US Toll Free: 1 877 837 7635
Malaysia
Rommel Jacob [email protected] Tel: (603) 2717 5152
Thailand Tanasak Krishnasreni [email protected] Tel: (66)2 658 6820
Indonesia
Harianto Liong [email protected] Tel: (62) 21 2557 1177
New York
Andrew Dacey [email protected] Tel: (212) 688 2956
India Manish Modi [email protected] Tel: (91)-22-6623-2601
Vietnam
Tien Nguyen [email protected] Tel: (84) 44 555 888 x8079
Philippines Keith Roy [email protected] Tel: (63) 2 848-5288
www.maybank-ke.com | www.maybank-keresearch.com


