Embed Size (px)
Citation preview

Sleep spindle detection: crowdsourcing and evaluatingperformance of experts, non-experts, and automated methods
Simon C. Warby1, Sabrina L. Wendt1,2, Peter Welinder3, Emil G.S. Munk1,2, Oscar Carrillo1,Helge B.D. Sorensen4, Poul Jennum2, Paul E. Peppard5, Pietro Perona3, and EmmanuelMignot11Center for Sleep Science and Medicine, Stanford University, California, USA2Danish Center for Sleep Medicine, Glostrup University Hospital, Glostrup, Denmark3Computational Vision Laboratory, California Institute of Technology, Pasadena, California, USA4Dept. of Electrical Engineering, Technical University of Denmark, Kongens Lyngby, Denmark5Department of Population Health Sciences, University of Wisconsin-Madison, Madison,Wisconsin, USA
AbstractSleep spindles are discrete, intermittent patterns of brain activity that arise as a result ofinteractions of several circuits in the brain. Increasingly, these oscillations are of biological andclinical interest because of their role in development, learning, and neurological disorders. Weused an internet interface to ‘crowdsource’ spindle identification from human experts and non-experts, and compared performance with 6 automated detection algorithms in middle-to-olderaged subjects from the general population. We also developed a method for forming groupconsensus, and refined methods of evaluating the performance of event detectors in physiologicaldata such as polysomnography. Compared to the gold standard, the highest performance was byindividual experts and the non-expert group consensus, followed by automated spindle detectors.Crowdsourcing the scoring of sleep data is an efficient method to collect large datasets, even fordifficult tasks such as spindle identification. Further refinements to automated sleep spindlealgorithms are needed for middle-to-older aged subjects.
KeywordsSleep EEG; electroencephalography; PSG; polysomnography; Performance evaluation;Benchmarking; Reliability; Validity; Agreement; Sensitivity; Specificity; Precision; Recall; Signalanalysis; Pattern recognition; Event detection; EEG microarchitecture; EEG features; SleepSpindles
COMPETING INTERESTS STATEMENTAll authors report no conflicts of interest.
AUTHOR CONTRIBUTIONSSCW, EM, and PP designed the research. PW and PP designed and coded the internet interface. SCW and PW collected the spindlescoring data. SCW and SLW performed the data analysis. SLW wrote the code to implement the automated spindle detectors. Allauthors provided input on data analysis and interpretation. PEP also provided source EEG data. HBDS, PJ, EM and PP also providedfinancial support. SCW, SLW and EM wrote the manuscript, which was discussed and edited by all authors.
NIH Public AccessAuthor ManuscriptNat Methods. Author manuscript; available in PMC 2014 October 01.
Published in final edited form as:Nat Methods. 2014 April ; 11(4): 385–392. doi:10.1038/nmeth.2855.
NIH
-PA Author Manuscript
NIH
-PA Author Manuscript
NIH
-PA Author Manuscript

INTRODUCTIONSleep spindles are measured by electroencephalography (EEG) as brief distinct bursts ofactivity in the sigma frequency range (11–16 Hz). They have a characteristic waxing andwaning shape, and are a key EEG feature used during sleep scoring to define non-REMstage 2 (N2) sleep1. Sleep spindle characteristics such as density (events/min), amplitude orduration are very stable from night-to-night for an individual2, 3, but vary substantiallybetween individuals4, 5. Spindle oscillation frequency tends to be slower anteriorly andfaster centrally/parietally, suggesting there may be two types of spindles6. The formationand frequency of spindles have been used as markers of the developing brain in infants7 andchange over the lifespan8–10. They are highly heritable11, 12, and are believed to play animportant functional role in synaptic plasticity and memory consolidation during sleep13–16.
Sleep spindles are also clinically important because alterations in spindle density areobserved in several disorders such as schizophrenia17, 18, autism19, epilepsy20, mentalretardation7, sleep disorders21–23 and neurodegenerative diseases24. These are significantchanges, as spindles result from interactions of several regions of the brain, including thethalamic reticular nucleus, thalamocortical relay neurons, the hippocampus, and thecortex25, 26. During wake, these same circuits are linked to learning, behavioral arousal, andsensory gating27. For this reason, identifying and studying characteristics of spindles mayreflect the integrity of these circuits in selected pathologies, and could have diagnostic valueas biomarkers.
Sleep spindles have traditionally been identified by visual inspection of the EEG by experttechnologists in sleep clinics, who are trained in the interpretation of physiological signalsfrom polysomnography. Visual identification by experts is the gold standard for spindledetection. However, visual identification of spindles is a slow and subjective process, andbecause of the rapidly growing biological and clinical interest in sleep spindles, severalautomated methods of spindle detection have been developed to speed up and standardizethis process. There are several basic methodological strategies for automated spindledetection, and each has given rise to many closely related spindle detectors.
Schimicek et al. published one of the first automated spindle detectors based on a band-passfiltering and amplitude threshold approach28. Today, this method is still the foundation fornumerous spindle algorithms used and optimized by different research groups8, 10, 29–40.Some algorithms replace the standardized band-pass filter with custom frequency rangefilters for each subject41–43. Another modification is to replace the initial band-pass filteringstep by an appropriate wavelet transformation18, 44. Other modifications include using theshape of the spindle to determine the beginning and end of the spindle rather than having asignal exceeding a constant threshold for the entire spindle duration17, 45, 46.
However, the performance of many spindle detection algorithms has not been evaluatedrigorously. Due to the difficulty in obtaining a gold standard dataset, algorithm developmentand testing is frequently performed on the same data. Datasets are typically small (less than15 subjects) and very few of these detection algorithms have been cross-validated orevaluated in more than one dataset. Furthermore, many of these detectors are designed foruse with EEG data from young adults. Spindle identification becomes a more difficult taskin older subjects because spindle density, amplitude and duration decrease with age8, 10.Although there has been some testing of automated detectors in young adults, theperformance of these detectors in older subjects is unclear.
The purpose of this study was to evaluate the performance of spindle identification bytrained experts, non-experts, and automated spindle-detection algorithms. To evaluateperformance, we compared the spindle detection of each scorer or group consensus to a gold
Warby et al. Page 2
Nat Methods. Author manuscript; available in PMC 2014 October 01.
NIH
-PA Author Manuscript
NIH
-PA Author Manuscript
NIH
-PA Author Manuscript

standard dataset. We generated the gold standard data from the group consensus of 24experts, who visually scored sleep spindles in the stage N2 sleep EEG from 110 subjectsfrom the general population. In order to collect this large dataset we crowdsourced thespindle scoring using an internet interface. This allowed trained experts at multiple sleepclinics to participate. In addition, we used the same interface to collect data from of 114non-experts, to determine how well they could perform on this skilled task. We developed asimple method for establishing group consensus, and made refinements to the performanceevaluation of event-detectors for polysomnography data. Finally, one important goal of thisstudy was to determine in an unbiased manner which of 6 previously published automatedspindle detection algorithms had the best performance in our EEG data from older subjects.Overall, spindle detection performance was highest in individual experts and the non-expertgroup consensus, followed by all automated detection methods we tested.
RESULTSThe EEG data47 from C3-M2 of 110 healthy subjects was divided into 25 second epochs andin total, 24 experts viewed 10,613 epochs, and 114 non-experts viewed 21,499 epochs for acombined total of 32,112 epoch views. Collection of the expert data took more than 10months. Collection of the non-expert data took less than 4 days.
Generation of the Gold StandardThe gold standard was established from the expert scorers using the group consensus rule(Supplementary Fig. 1). Each expert viewed a mean of 442 epochs (Fig. 1a). Each of the2,000 epochs in the dataset was viewed by a mean of 5.3 experts. More than 87 % of thedata was viewed by at least 4 experts (Fig. 1b).
The amount of consensus of the expert group is determined by the ‘threshold for expertgroup consensus’ (Tegc; see methods). To establish the gold standard dataset, we used a Tegcof 0.25. This value was used because it is the Tegc at which the mean individual expertperformance is maximized, and the standard deviation of the mean individual expertperformance is minimized (Fig. 1c). We also visually inspected the resulting dataset atvarious threshold values and found that Tegc = 0.25 captured the diversity of spindlemorphologies with acceptable quality. Below Tegc = 0.25, there was a large increase in thenumber of spindles (Fig. 1d), mostly of questionable quality. At Tegc = 0.25, there were1987 spindles in the expert group consensus (Fig. 1e). From this point, we refer to the expertgroup consensus data at Tegc= 0.25 as the ‘gold standard’.
Performance of Individual ExpertsIn a by-event analysis against the gold standard, the mean F1-score performance ofindividual experts was 0.75±0.06. In the by-sample analysis, the mean F1-score (0.69±0.06)and Cohen’s Kappa score (0.68±0.06, Supplementary Table 1) also indicate good agreementbetween individual experts and the gold standard, and low variability between experts. Fromthe precision-recall plot, the performance of the individual experts is consistently high,although as expected, some experts emphasize high precision (i.e. greater positive predictivevalue in identifying spindles) at the expense of recall (i.e. spindle-detection sensitivity), andvice-versa (Fig. 1f).
However, the individual experts are being compared to a gold standard to which theirscorings belong, giving them an advantage in the performance evaluation. To control forthis, we also compared the individual experts against an expert group consensus in whichthey did not contribute spindle scoring (Fig. 1f; Supplementary Table 2). The mean F1-scorein the by-event analysis of individual experts after this correction was 0.67±0.07.
Warby et al. Page 3
Nat Methods. Author manuscript; available in PMC 2014 October 01.
NIH
-PA Author Manuscript
NIH
-PA Author Manuscript
NIH
-PA Author Manuscript

Gold Standard - Sleep Spindle CharacteristicsMore than 70% of all spindles in the gold standard dataset were between 0.5 and 1 second induration (Fig. 2a, Supplementary Table 3). However, in contrast to the American Academyof Sleep Medicine (AASM) criteria for a lower threshold of 0.5 seconds,1 we allowed alower duration threshold of 0.3 seconds, and found 14% of spindles identified by experts fellin the 0.3–0.5 second duration range. We did not find any differences in spindlecharacteristics of spindles <0.5 seconds versus spindles >0.5 seconds; oscillation frequencywas not significantly different, and a weak positive linear correlation between duration andmaximum peak-to-peak amplitude was consistent for spindles of all durations. We speculatethat spindles ≥0.5 seconds may be a good criteria for defining N2 sleep, but spindles <0.5seconds may have the same neurophysiological basis, and are therefore of interest. As well,only 15% of identified spindles had a duration > 1 second. The oscillation frequency ofspindles varied from 10.5–16.1 Hz, with a mean of 13.3±1.0 Hz although slightly skewedtowards higher frequencies around 14 Hz (Fig. 2b). The mean maximum peak-to-peakamplitude of spindles was 27±11 μV (Fig. 2c), indicating that the majority of spindles in thisolder cohort of subjects were of moderate-to-low amplitude. The mean percent-to-peakamplitude was 49±21% (i.e. very near the center of the spindle), indicating that on average,spindles tend to have a symmetrical waxing and waning profile (Fig. 2d).
In the gold standard dataset, spindle density was variable between the 110 subjects but had amean density of 2.3±2.0 spindles/min (Fig. 2e). Consistent with previous reports, subjectage was negatively correlated with spindle density (Fig. 2f)8, 9, 48. The mean maximumamplitude of spindles was significantly greater in females than males (Fig. 2g), and wasnegatively correlated with subject age (Fig. 2h). Spindle oscillation frequency tended to benegatively correlated with age although it was not statistically significant (R2 = 0.037, p-value = 0.051). We also found the mean oscillation frequency and duration weresignificantly different between subjects (Fig. 2i). Subjects did not have a clear bimodaldistribution of spindle oscillation frequencies (Supplementary Fig. 2). This suggests thatthere are not discrete categories of ‘fast’ and ‘slow’ spindles at this central scalp location inolder individuals, rather subject differences of ‘faster’ and ‘slower’ spindles, which may bethe result of trait-like individual variation. We did not find a significant relationship betweenspindle density or spindle oscillation frequency with gender, body mass index, apnea/hypopnea index, leg-movement index or total sleep time (linear regression p-values >0.05).
Performance of the Non-Expert GroupThe 114 non-experts viewed a mean of 189 epochs each (Fig. 3a). The 2,000 epochs in thedataset were viewed by a mean of 10.7 non-experts (Fig. 3b). More than 99% of the datawas viewed by 10 or more non-experts.
As a measure of performance, we calculated the precision and recall of individual non-experts and the non-expert group consensus (Fig. 3c). The maximum by-event F1-scoreperformance of the non-expert group was 0.67 at a threshold (Tngc) of 0.4 (Fig. 3d), althoughthe group performed reasonably well across a range of consensus thresholds (F1-score > 0.5for 0.2 ≤ Tngc ≤ 0.5). There was a near exponential relationship between the amount of non-expert consensus and the number of spindles identified (Fig. 3e). At Tngc = 0.4, the non-expert group identified 1669 spindles (Fig. 3f), but only 1226 of these were correct(precision = 73%). In other words, of the 1987 spindles in the gold standard, the non-expertgroup correctly identified 1226 (recall = 62%). Further, the by-subject spindle densitycorrelation was very high (R2 = 0.815; Fig. 3g).
For the non-expert group consensus, we did not perform any data cleaning and used datafrom all non-experts regardless of how many epochs they actually scored for spindles.
Warby et al. Page 4
Nat Methods. Author manuscript; available in PMC 2014 October 01.
NIH
-PA Author Manuscript
NIH
-PA Author Manuscript
NIH
-PA Author Manuscript
Approximately 40 % of the recruited non-experts scored very little data (less than 15 epochsper non-expert). In addition, 11 out of the 2,000 epochs in the gold standard were not viewedby any non-experts. These epochs were interpreted as no spindle calls in the analysis of non-experts since we intended for them to be scored. The performance of the non-expert groupconsensus compared to the gold standard remains high despite these limitations.
Performance of the Automated DetectorsWe implemented and tested 6 previously published spindle detection algorithms. The by-event F1-score of the automated detectors ranged from 0.21 to 0.52. (Table 1;Supplementary Table 1). Each automated detector tended to find a different balance betweenrecall and precision (Fig. 4a). Detector a4 and a5 had the most balanced approaches (similarrecall and precision scores), while a5 had the highest overall by-event F1-score of theautomated detectors.
To determine whether automated detection of spindles could be improved by combiningdifferent detectors, we applied the group consensus rule to the group of detectors (Fig. 4a).The maximum F1-score performance of the automated group was obtained at a groupconsensus of 0.5 (F1-score = 0.54, Fig. 4b), but was only slightly better than the single bestautomated detector. We attempted to further improve the performance by combining theresults of automated detectors without success (Supplementary Note).
To measure the inter-detector agreement, we calculated the F1-score for each detector pair(Table 1). In general, detectors tended to agree with at least one other detector to a greaterdegree than with the gold standard. However, even detector pairs that weremethodologically similar did not have good agreement between them; the mean agreementbetween a2-a3-a4, which all use RMS and a constant threshold, was F1-score = 0.21±0.14.The total number of spindles detected by each detector (range 479 – 13,784), the inter-detector true positive spindle count, and the number of spindles detected in common by twodetectors varied greatly (Supplementary Table 4).
The by-subject correlation of spindle density between the gold standard and the automateddetectors ranged from R2 = 0.01 to 0.38 (Supplementary Fig. 3). We also compared sigmapower as an estimate for spindle density in each subject and found that it predicted spindledensity slightly better than the best single automated detector, but not better than the groupconsensus of the automated detectors (Fig. 4c,d,e).
To determine whether we could optimize the automated detectors to improve theirperformance, we varied their detection parameters to try and maximize their F1-score againstthe gold standard (Supplementary Fig. 4). We found that varying the detection parameterscould alter the balance between recall and precision, and in the case of some detectors,improve the F1-score moderately (Supplementary Table 5). However, even with this attemptto over-fit the detector performance to our data, the maximum performance of any onedetector was essentially unchanged (a5, maximum F1-score = 0.53).
Performance Comparison Between GroupsThe by-event precision and recall of individual experts, the non-expert group, and theautomated detectors were calculated against the gold standard (Fig. 5a). The by-sampleperformance of all groups was decreased relative to the by-event performance(Supplementary Table 1) due to the relaxed overlap threshold (Toverlap) we used for the by-event analysis. Toverlap is the amount of overlap between an event and a detection that isrequired for a detected spindle to match a gold standard spindle event and therefore beconsidered to be a true positive (see methods).
Warby et al. Page 5
Nat Methods. Author manuscript; available in PMC 2014 October 01.
NIH
-PA Author Manuscript
NIH
-PA Author Manuscript
NIH
-PA Author Manuscript

The by-subject estimate of spindle density varied between the detectors (Fig 5b). Themajority of automated detectors and the non-expert group tended to overestimate spindledensity for each subject relative to the gold standard, leading to higher recall of spindles inthe dataset, but lower overall precision. Detector a3 had the highest recall but overestimatedspindle density in the dataset by a factor greater than 7 (Supplementary Table 6).
The majority of detectors, as well as the non-expert group had a tendency to underestimatethe mean duration of spindles for each subject (Fig. 5c). Overall however, the range of meanspindle durations between detectors was quite small (0.55 – 0.82 seconds), suggesting thatthe detectors did a reasonable job of estimating average spindle duration (SupplementaryTable 7).
For evaluation of performance in the by-event analysis, we have allowed a relaxed Toverlapof 0.2. At this level of overlap, all groups perform at or near to their maximum F1-score, sowe did not constrain performance by the overlap threshold (Fig. 5D; Supplementary Note).Finally, we wanted to determine whether the performance of either the automated detectorsor the non-expert group could be improved by selecting a different level of expert groupconsensus for the gold standard. We found that performance could not be improved; eachgroup performed near-maximal against the chosen gold standard of Tegc > 0.25(Supplementary Fig. 5).
We also tested the effect of reducing the minimum spindle duration from 0.5 s to 0.3 s onperformance of the automated spindle detectors. We found that reducing the duration from0.5 s to 0.3 s had little impact on performance in 5/6 of the detectors (mean change in F1-score = −0.03±0.02, t-test p-value = 0.84) and in one detector (a5), resulted in a largeincrease in performance (F1-score +0.16). This increase in performance appears to be due tothe tendency of this detector to find many spindles of short duration (Fig. 5c) that would bediscarded when using a 0.5 s minimum duration criteria. Taken together, the change ofminimum duration did not negatively impact the performance of the automated detectors.
DISCUSSIONIndividual experts had consistently high by-event performance, and we were able to furthereliminate individual errors using the group consensus rule. As a group, the experts produceda high quality gold standard spindle dataset. To our knowledge, this is the largest and mostcomprehensively scored sleep spindle dataset used for validation of spindle detectors inolder adults.
To our surprise, even though the spindle-detection performance of individual non-expertswas highly variable and generally poor, the non-expert group consensus performed as wellas some individual experts. This was striking, as we made no attempt at cleaning the non-expert dataset through the removal of low quality scores or missing data; rather we collecteda large non-expert dataset and let the group consensus dictate performance. Notably, eventhough 3–4 non-experts scored a lot of data and performed almost randomly (Fig. 3c), thegroup consensus rule efficiently screened out this bad data. For non-experts, we found that ahigher level of group consensus (Tngc = 0.4) compared to experts (Tegc = 0.25) produced thehighest overall performance, which is consistent with the lower level of skill in individualnon-experts. These results suggest that crowdsourcing scorings from a large group of non-experts is a viable method to generate large datasets of scored EEG events.
Also to our surprise, we found that the automated detectors performed substantially worsethan anticipated in our dataset from older subjects. It was originally our goal to demonstratehow well the detectors perform, and identify which detector performed best relative to
Warby et al. Page 6
Nat Methods. Author manuscript; available in PMC 2014 October 01.
NIH
-PA Author Manuscript
NIH
-PA Author Manuscript
NIH
-PA Author Manuscript

humans. However, automated detector performance varied substantially between detectorsand was always inferior to human experts or the non-expert group. We were able to increaseperformance somewhat by using a group consensus rule, but improvement was marginal. Inour dataset, the correlation between by-subject spindle density and the estimated spindledensity from the best automated detector (a5; R2 = 0.38) was worse than relative sigmapower (R2 = 0.46) or the non-expert group (R2 = 0.81). This correlation with human scoringand relative sigma power suggests that for certain purposes, a large group of human non-experts or relative sigma power may be more useful than existing automated spindledetectors at estimating spindle activity at the by-subject level.
We have implemented each detector as closely as possible to how it has been describedpreviously in order to provide independent validation of their performance. We did notmodify or optimize the algorithms because if we did not have a gold standard, there is noway to appropriately optimize the detector. This is the normal situation facing a researcherthat wishes to implement a spindle detector in a research project. Without a reference goldstandard, changes to the algorithm (such as tuning the detection to a specific spindle density)are arbitrary and can introduce a methodological bias.
However, because we have a gold standard, we could also make adjustments to eachalgorithm to estimate the maximum possible performance in our dataset from middle/olderaged subjects. Although these results would be an over-estimate of future performance dueto over-fitting, it does give an indication of maximum performance. By adjusting thedetection parameters (primarily the amplitude threshold criteria), we could alter the balanceof recall and precision for each detector, and in some cases improve F1-score moderately.However, we did not find significant increases in F1-score performance overall, and themaximum performance of the detectors remained essentially unchanged (a5, maximum F1-score= 0.53).
There are several factors that could lead to the poor performance of the automated detectors.First, the mean age of subjects in this study was 57±8 years. Most of these detectors weredesigned to work in young, healthy subjects, and our performance measurements may notreflect performance in younger subjects. As expected, we find age-related decline in spindleamplitude, which likely impairs the performance of these amplitude-threshold basedalgorithms, and raises questions about whether this is a flawed methodological approach fordetecting spindles in older subjects. As well, some automated methods use veryindividualized and specific band-pass approaches that require the detection of both ‘fast’ and‘slow’ spindles at a single location on the scalp. Spindles are believed to be localphenomena 49, and topographical differences in spindle frequency are welldescribed 4, 16, 50. Our data only assessed spindles at C3, and spindles at other scalplocations may have different characteristics. However, we do not find good evidence tosupport two discrete populations of spindles at the C3 location in older subjects. Theoscillation frequency distributions we observed between subjects (Fig. 2b) and withinsubjects (Fig. 2i; Supplementary Fig. 2) suggest that at C3, subjects have an individualizeddistribution, often around a single mean oscillation frequency.
In addition, numerous publications describing automated spindle detectors have evaluatedperformance using specificity (the fraction of true negatives that are truly negative). Asspindles are rare events in a large EEG dataset, the uncalibrated specificity measurementwill be consistently high (specificity of the automated detectors we tested ranged from 0.81to 0.99, Supplementary Table 1), and therefore provide an unrealistically positive and notparticularly meaningful evaluation of performance. To avoid this pitfall, we have usedevaluation metrics inspired from information retrieval theory (precision, recall and F1-score)that are more appropriate to the analysis of discrete events in the EEG signal.
Warby et al. Page 7
Nat Methods. Author manuscript; available in PMC 2014 October 01.
NIH
-PA Author Manuscript
NIH
-PA Author Manuscript
NIH
-PA Author Manuscript

Although our results suggest that human spindle identification was superior to existingautomated detection algorithms, there are inherent limitations to manually identifiedspindles. Automated detectors are more reliable, objective and efficient. It is also possiblethat automated detectors were able to find obscured spindles in the EEG signal that aredifficult for the human eye to see. This may be particularly important in other stages ofsleep, such as N3, where spindles are more likely to be obscured by slow waves. It istherefore a reasonable goal to try and find an automated detector to replace human scoring.
However, we find that the agreement between the different automated detectors is generallyless than their agreement with the gold standard (Table 1, mean F1-score agreement betweendetectors = 0.32±0.16). In other words, this suggests that automated methods as a groupwere not consistent among themselves; they did not find the same ‘hidden’ spindles. Inaddition, each detector had a different bias towards precision or recall, resulting in theunder- or over-calling spindle density. This is an important consideration when selecting aspindle detector. It will be important to reconcile the differences between human andautomatically detected spindles, and the differences between automated detectors, before theautomated detectors can be considered the gold standard.
Implementing the previously published spindle detectors was difficult as we found thatalmost all publications unintentionally misreported, omitted, or were unclear about criticaltechnical details of the detector. (We emphasize that this is a common problem ofcomputational sciences, rather than something unique to these publications51). As a result, itwas difficult to reproduce the spindle detection algorithm using information from thepublication alone. All of the authors of the detectors we tested were extremely cooperativeand kindly shared the original algorithm code, or answered our questions on how toimplement their detector correctly. However, considering these difficulties and inherentlimitations to describing algorithms methods adequately, we strongly recommend thatsharing the algorithm code directly should be seen as an essential part of any publicationdescribing event detectors for physiological signals such as sleep polysomnography.
Improvements in automated spindle detectors can be expected when they are designedagainst large datasets that capture the diversity of spindle characteristics between subjects(including older age and patient populations), follow proper cross-validation techniques, anduse appropriate metrics for assessing performance. Further, a more detailed definition of asleep spindle is needed, and this definition should be based on the biology andneurophysiology of spindle characteristics. For example, our data suggests that the 0.5second minimum duration for spindles is arbitrary, and shorter spindles with the samecharacteristics as longer spindles appear to exist. Sleep technicians also frequently rely onspindles being a ‘distinct train of waves’ that is clearly distinguishable from background;this is a characteristic that is not captured well by current automated detectors. We arguethat the most interesting feature of spindles is how distinctly different their bursting activityis from immediate surrounding activity, because of the neurophysiological changes that arerequired to generate these rapid changes.
In conclusion, our study demonstrates that crowdsourcing experts and non-experts is aviable method for generating a large dataset of EEG event detections. Currently, the spindledetection performance of several automated algorithms was less than expert or non-expertgroup performance in this challenging dataset from older subjects. We generated spindleidentifications across a large number of subjects, and found a large amount of inter-subjectvariation in spindles. This dataset will serve as an indispensable reference to reflect inter-individual diversity in these traits, and as a platform to develop, improve and evaluate theperformance of automated spindle detectors.
Warby et al. Page 8
Nat Methods. Author manuscript; available in PMC 2014 October 01.
NIH
-PA Author Manuscript
NIH
-PA Author Manuscript
NIH
-PA Author Manuscript

ONLINE METHODSEEG Dataset
The EEG dataset used for spindle identification was extracted from a randomly selectedsubset of 110 subjects from the Wisconsin Sleep Cohort47. From 100 subjects, we randomlyselected 230 seconds (~4 minutes) of artifact-free N2 sleep (2 blocks of 115 s, each blockdivided in 5 consecutive 25 s epochs overlapping 2.5 s, for a total of 10 epochs per subject).In the remaining 10 subjects we randomly selected 2300s (~38 minutes) of N2 sleep (20blocks of 115 s, each block divided in 5 consecutive 25 s epochs overlapping 2.5 s, for atotal of 100 epochs per subject). Epochs containing EEG signal artifacts were discarded aftervisual inspection. In total, the raw EEG dataset was composed of 2,000 epochs of N2 sleep.The mean age of the 110 subjects was 57±8 years; 53% of the cohort was female.Demographics of the subjects are representative of middle to older-age subjects as in theparent Wisconsin Sleep Cohort, which is a sample of the general population (SupplementaryTable 8). All subjects provided written consent, and data collection and usage was approvedby the University of Wisconsin-Madison and Stanford University Institutional ReviewBoards.
Spindle Identification - Data Collection Using an Internet InterfaceTo collect a large sleep spindle dataset, we developed an internet interface so thatidentification could be collected remotely from a large group of scorers (‘crowdsourced’).The internet interface presented EEG data one epoch at a time and allowed the visualidentification of sleep spindles by human scorers. The EEG data was displayed using anepoch length of 25 s to ensure that the entire epoch would fit in a standard size internetbrowser window, and would not require the scorer to scroll back and forth to view the wholeepoch.
The data presented was from a single EEG channel (C3-M2), originally sampled at 100 Hzand filtered using standard clinical procedures (<0.3Hz, >35Hz1). Spindle amplitude andfrequency is maximal at C350. An example of EEG data presentation using the web interfaceis shown in Supplementary Figure 6. We were particularly careful to ensure that data waspresented in a familiar way for sleep experts (i.e. aspect ratio of the images was maintained,negative voltages were always displayed upward and values ranged from −50 to 50 μV;values out of this range were truncated to either of these limits). A 25 s epoch of EEG wasconverted to an image of size 900x90 pixels. Vertical gridlines identified 0.5 s increments.
The EEG data was organized in blocks of 5 epochs from one subject, and the blocks ofepochs were presented to the human scorers in random order. To minimize edge effects ofidentifying spindles that fell within an epoch boundary, epoch images were overlapped by2.5s, so that EEG data that fell at the edge of an epoch in one image would be 2.5s awayfrom the edge in a subsequent image. Any spindle identifications that were falsely split dueto epoch boundaries were merged using a simple rule: If the duration of the spindle was lessthan 0.3s and the adjacent spindle was less than 0.1s away, the two identifications weremerged. Following merging spindles that were split by the epoch boundary, any remainingspindle identifications less than 0.3s were discarded. Overall, the merging rule resulted inmerging of 6 spindles. Twenty-seven spindles in the gold standard dataset were discardedfor being less than 0.3 seconds.
Spindle identification was performed in the interface by drawing a bounding box aroundspindle events. To indicate scoring certainty in the presence of a spindle, each bounding boxhad to be labeled with a confidence score: ‘Definitely’, ‘Probably’, ‘Maybe’/‘Guessing’. Incases where no spindle events were detected, scorers were allowed to indicate that they didnot detect any spindles in that epoch by checking the ‘There are no spindles in the image’
Warby et al. Page 9
Nat Methods. Author manuscript; available in PMC 2014 October 01.
NIH
-PA Author Manuscript
NIH
-PA Author Manuscript
NIH
-PA Author Manuscript

checkbox. Scorers were able to go back and review or change their previous spindleidentifications within a block of epochs.
Human Non-Expert ScorersThe human non-expert spindle scorers were recruited from the Amazon Mechanical Turkwebsite (https://www.mturk.com/mturk/). The non-experts were paid piece-wise for theirwork, and were not screened for any experience with sleep or EEG data. Non-experts wereinstructed to read lay-language instructions on spindle identification (Supplementary Fig. 7)and performed a brief training session (15 epochs) before the actual spindle identificationtask.
Human Expert ScorersRegistered Polysomnographic Technologists (RPSGTs) were recruited as our expert scorers.These experts were recruited by word-of-mouth and from an advertisement on an onlineforum. In total, we recruited 24 experts from sleep clinics in the United States and Canada.Experts were instructed to read the same instructions and perform the same training sessionas non-experts. Experts were either paid piece-wise for the data collection or volunteeredtheir time. The most productive experts received small gifts for their work.
Automated Spindle DetectorsWe evaluated the performance of 6 previously published spindle detection algorithms thatare commonly used in the research literature. These detectors are labeled as a141, a217, a331,a410, a518, and a645. These algorithms are similar in their basic methodology, and all butone18 rely on initial band-pass filtering in the spindle frequency range. We made one changeto all of the automated detectors in that we allowed them to detect spindles with durations asshort at 0.3 s, since spindles of this duration are included in our gold standard dataset.
We implemented two methods10, 31 derived from Schimicek28 since many algorithms arebranching off from it (see introduction). The method can briefly be described as band-passfiltering in the spindle frequency range, calculating the root-mean-square (RMS) of thesignal in a moving window, and applying a constant threshold based on the amplitude of theRMS signal. Spindles are detected where the RMS exceeds the threshold for a specifiedminimum duration. The two implementations10, 31 differ in the frequency range of the band-pass filter, in the time resolution and window size for calculating the RMS, and in thedefinition of the threshold.
Moreover, we implemented a wavelet based algorithm18. First the data is wavelettransformed using a complex morlet wavelet mimicking a spindle shape and frequencycontent. Afterwards the moving average of the coefficients is calculated and the mean isused to obtain the threshold for spindle detection.
We also implemented an automated detector that uses individual spindle characteristics ofeach subject prior to detection41. For this detector, precise frequency boundaries for slowand fast spindles are first derived from the all night average amplitude spectrum during N2sleep. We used data from C3 and O1 to determine individual spindle characteristics whereasthe original method uses 29 channels. The spectrum is also used to derive the amplitudecriteria for spindle detection. After determining these measures, data is band-pass filtered ineither of the two bands and subjected to a constant threshold at the corresponding amplitudecriteria.
Finally we implemented two methods that use the spindle envelope to find the beginningand the end of a spindle after a part of the signal within these boundaries has exceeded the
Warby et al. Page 10
Nat Methods. Author manuscript; available in PMC 2014 October 01.
NIH
-PA Author Manuscript
NIH
-PA Author Manuscript
NIH
-PA Author Manuscript

threshold17, 45. One of the methods uses only local minima for boundaries17 whereas theother method uses local extrema of the signal and its first derivative45.
Pseudo-code of the different sleep spindle detector algorithms are presented inSupplementary Figure 8 to help the reader understand the details of how each detectorworks. Some detectors were originally implemented in other programs; for these, we havere-implemented the algorithms in MATLAB, and as such they may be slightly differentfrom the original. In some cases, we confirmed the similarity of the output by running boththe original and MATLAB implementation of the detector on the same dataset andcomparing the results. Our MATLAB code for each detector is available as SupplementarySoftware.
Group Consensus RuleIn order to produce a high-quality gold standard dataset, we aggregated the identificationsfrom multiple experts using a group consensus rule. The same group consensus rule is usedto find the non-expert group consensus and the automated group consensus. Based on theconfidence score provided by the human scorers, we assigned each annotation a weightedvalue: 1 (‘Definitely’), 0.75 (‘Probably’), 0.5 (‘Maybe’/’Guessing’) and 0 (Not Spindle).The automated spindle detections were always given a confidence value of 1. To find thegroup consensus at the ith sample we took the mean confidence values at the ith sample. Todetermine whether the group finds a spindle or not at each sample point, the group meanconfidence value must exceed the threshold (Tgc). The group consensus can vary from littleconsensus (gc >~0.0) to perfect agreement of all scorers (where gc = 1). An example of howthe group consensus rule is applied for at Tgc of 0.25 is provided in Supplementary Figure 1.The group consensus threshold will be referred to as Tegc for expert group consensus, Tngcfor non-expert group consensus and Tagc for automated group consensus. The gold standardis established from the expert group consensus at Tegc = 0.25. The strength of the groupconsensus method is that it requires agreement among the scorers and eliminates outlierdata. In datasets such as EEG, where events such as spindles only make up a smallproportion of the total data, poorly or randomly identifying events is unlikely to be includedin the group consensus, as multiple scorers have to make the same identification. Realexamples of the consensus in experts, non-experts, and automated detectors are provided inSupplementary Figure 9.
Performance EvaluationPerformance of human scorers or automated detectors was always compared to the goldstandard. We define individual spindles in the gold standard dataset to be events (E), whileindividual spindles identified by humans or detected by automated algorithms to be eventdetections (D). For event detections in EEG data such as sleep spindles, performance can beassessed in three different data domains, each having a different unit of measurement: by-sample, by-event and by-subject.
The by-sample performance analysis provides the most precise details about actualperformance and is equivocally determined. However, since the unit of measurement is asample point, it can be difficult to interpret the results because spindle events can becomposed of variable numbers of samples. By-event performance evaluation is easier tointerpret, but difficult to calculate because events and detections are of variable length andcan have variable overlap. We will present a set of rules for matching spindle events anddetections to accommodate less-than-perfect or multiple overlaps. The by-subject analysis,which summarizes information about each subject (e.g. spindle density) and is the easiest tocalculate, does not provide any direct information about the detector’s ability to identify thelocation of spindles in the EEG data.
Warby et al. Page 11
Nat Methods. Author manuscript; available in PMC 2014 October 01.
NIH
-PA Author Manuscript
NIH
-PA Author Manuscript
NIH
-PA Author Manuscript

By-Sample Performance AnalysisIn the by-sample analysis, the unit of measurement is digital sample points, which areuniform in length and non-overlapping (i.e. a signal sampled with 100 Hz contains 100samples per second). Building a classic 2x2 contingency table by calculating the number oftrue positive (TP), true negative (TN), false positive (FP) and false negative (FN) samples isstraightforward (see Definitions, Supplementary Fig. 10). However, since spindle events inEEG are relatively rare, the vast majority of sample points in the data will be TN, regardlessof how well a detector performs. For this reason, uncalibrated ‘specificity’ does not providea meaningful assessment of performance. Instead, ‘recall’ and ‘precision’ provide a moreuseful assessment of performance and are calculated as:
Recall is the same as ‘sensitivity’ or 1- ‘miss rate’. Precision is the same as positivepredictive value (PPV), ‘selectivity’, or ‘hit rate’. Although the terms sensitivity and positivepredictive value are more commonly used for diagnostic tests, the spindle detection task ismore similar to the task of information retrieval, where precision and recall are more widelyused. Precision and recall both can vary from 0 to a maximum of 1; a perfect scorer wouldfall in the top right corner of a precision-recall plot.
These two measures can be combined to obtain a single F1-score of agreement, which is theharmonic mean of precision and recall, ranging from 0 (no agreement with the standard) to 1(perfect agreement with the standard).
In the by-sample analysis it is also possible to calculate additional coefficients summarizingthe performance using the contingency table, such as Cohen’s Kappa or MatthewsCorrelation Coefficient, which correct for the large bias toward TN in the sparse EEGdataset. We found that these coefficients gave similar performance results to the F1-score.The by-sample analysis penalizes detections that do not align perfectly with the matchingevent and therefore provides the most detailed and rigorous assessment of detectorperformance.
By-Event Performance AnalysisIn the event-by-event analysis, the unit of measurement is the single sleep spindle, whichcan be variable in length. By-event scoring is classifying each spindle event and detectioninto a contingency table of TP, FP, and FN. Since non-spindle events (TN) are also variablein length and are not meaningful, they are not counted in the by-event analysis. As with theby-sample analysis, the by-event performance measures are recall, precision and F1-score.
To resolve the less-than-perfect overlap and multiple overlap problems between spindleevents and detections, a matching procedure is used to establish event-detection (ED) pairs.Multiple overlaps are not allowed; only one D can be matched with one E. The best match isdetermined by the ED pair with the maximum intersection/union score (max OED) thatexceeds the overlap threshold (Toverlap) which specifies how much overlap is required tomatch an E and D as an ED pair. In case of an exact tie in max OED scores, the temporally
Warby et al. Page 12
Nat Methods. Author manuscript; available in PMC 2014 October 01.
NIH
-PA Author Manuscript
NIH
-PA Author Manuscript
NIH
-PA Author Manuscript
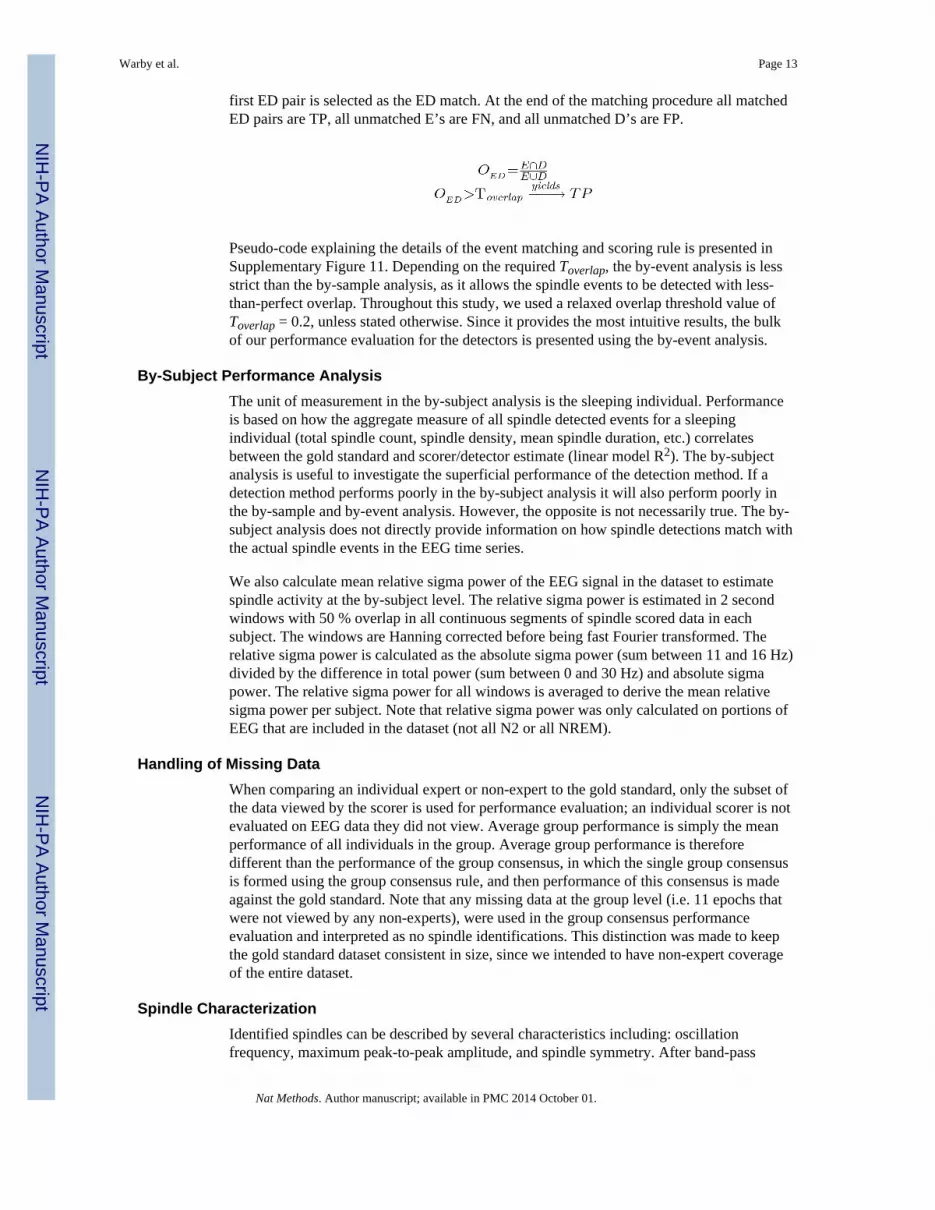
first ED pair is selected as the ED match. At the end of the matching procedure all matchedED pairs are TP, all unmatched E’s are FN, and all unmatched D’s are FP.
Pseudo-code explaining the details of the event matching and scoring rule is presented inSupplementary Figure 11. Depending on the required Toverlap, the by-event analysis is lessstrict than the by-sample analysis, as it allows the spindle events to be detected with less-than-perfect overlap. Throughout this study, we used a relaxed overlap threshold value ofToverlap = 0.2, unless stated otherwise. Since it provides the most intuitive results, the bulkof our performance evaluation for the detectors is presented using the by-event analysis.
By-Subject Performance AnalysisThe unit of measurement in the by-subject analysis is the sleeping individual. Performanceis based on how the aggregate measure of all spindle detected events for a sleepingindividual (total spindle count, spindle density, mean spindle duration, etc.) correlatesbetween the gold standard and scorer/detector estimate (linear model R2). The by-subjectanalysis is useful to investigate the superficial performance of the detection method. If adetection method performs poorly in the by-subject analysis it will also perform poorly inthe by-sample and by-event analysis. However, the opposite is not necessarily true. The by-subject analysis does not directly provide information on how spindle detections match withthe actual spindle events in the EEG time series.
We also calculate mean relative sigma power of the EEG signal in the dataset to estimatespindle activity at the by-subject level. The relative sigma power is estimated in 2 secondwindows with 50 % overlap in all continuous segments of spindle scored data in eachsubject. The windows are Hanning corrected before being fast Fourier transformed. Therelative sigma power is calculated as the absolute sigma power (sum between 11 and 16 Hz)divided by the difference in total power (sum between 0 and 30 Hz) and absolute sigmapower. The relative sigma power for all windows is averaged to derive the mean relativesigma power per subject. Note that relative sigma power was only calculated on portions ofEEG that are included in the dataset (not all N2 or all NREM).
Handling of Missing DataWhen comparing an individual expert or non-expert to the gold standard, only the subset ofthe data viewed by the scorer is used for performance evaluation; an individual scorer is notevaluated on EEG data they did not view. Average group performance is simply the meanperformance of all individuals in the group. Average group performance is thereforedifferent than the performance of the group consensus, in which the single group consensusis formed using the group consensus rule, and then performance of this consensus is madeagainst the gold standard. Note that any missing data at the group level (i.e. 11 epochs thatwere not viewed by any non-experts), were used in the group consensus performanceevaluation and interpreted as no spindle identifications. This distinction was made to keepthe gold standard dataset consistent in size, since we intended to have non-expert coverageof the entire dataset.
Spindle CharacterizationIdentified spindles can be described by several characteristics including: oscillationfrequency, maximum peak-to-peak amplitude, and spindle symmetry. After band-pass
Warby et al. Page 13
Nat Methods. Author manuscript; available in PMC 2014 October 01.
NIH
-PA Author Manuscript
NIH
-PA Author Manuscript
NIH
-PA Author Manuscript

filtering the EEG containing the spindle between 11–16 Hz using a 253th order equirippleFIR filter with stop-band attenuations of 10−4 at 10 and 17 Hz, the oscillation frequency(Hz) is calculated by dividing the sampling frequency by the mean inter-peak interval withinthe spindle (maxima to maxima intervals and minima to minima intervals, ignoring minorfluctuations). The maximum peak-to-peak amplitude (μV) is the maximum differencebetween adjacent local maxima and minima (peaks) within the 11–16 Hz filtered spindleevent. The spindle symmetry relates to the symmetry/skewedness of the spindle’s waxingand waning shape and is calculated by identifying the percentile within a spindle durationwhere the maximum peak-to-peak amplitude occurs; a spindle with the maximum amplitudeexactly in the middle of the spindle duration would have a symmetry score of 0.5. Spindlecharacterization was performed on spindles in the gold standard (Fig. 2), as well as spindlesidentified by automated detectors (Supplementary Note; Supplementary Fig. 11 &12).
Statistical AnalysisStatistical analysis (two-tailed t-test, one-way ANOVA or linear regression as appropriate)was performed using R (http://www.r-project.org/). The significance threshold used wasalpha = 0.05. Averages are shown as means ± standard deviations (SD). Histograms areplotted using the following conventions: If the data is non-continuous, the tick is centered inthe bar. If the data is continuous, the bars are justified left (i.e. the value at the tick belongsin the bar to the right of the tick).
Supplementary MaterialRefer to Web version on PubMed Central for supplementary material.
AcknowledgmentsThe authors would like to thank the RPSGT experts who participated in the spindle identification task, theparticipants and organizers of the Wisconsin Sleep Cohort who provided the polysomnography data. We also thankCan Liang, Eileen Leary, Hanna Ollila, and Helena Kraemer for their helpful discussions, and Eiríkur ÞórÁgústsson and Hyatt Moore for their input in the pilot study for this project. We are grateful to the authors of thepreviously published algorithms who generously shared their code and knowledge about spindle detectors. SCW issupported by the Brain and Behavior Research Foundation and is a Canadian Institutes of Health Research BantingFellow. EM is supported by National Institutes of Health grant NS23724. EEG data collection was supported bygrants from the National Heart, Lung, and Blood Institute (grant R01HL62252) and the National Center forResearch Resources (grant 1UL1RR025011) at the National Institutes of Health.
References1. Iber, C.; Ancoli-Israel, S.; Chesson, A.; Quan, SF. AASM Manual for the Scoring of Sleep and
Associated Events. 2007.
2. Silverstein LD, Levy CM. The stability of the sigma sleep spindle. Electroencephalogr ClinNeurophysiol. 1976; 40:666–670. [PubMed: 57053]
3. Tan X, Campbell IG, Feinberg I. Internight reliability and benchmark values for computer analysesof non-rapid eye movement (NREM) and REM EEG in normal young adult and elderly subjects.Clin Neurophysiol. 2001; 112:1540–1552. [PubMed: 11459695]
4. Werth E, Achermann P, Dijk DJ, Borbély AA. Spindle frequency activity in the sleep EEG:individual differences and topographic distribution. Electroencephalogr Clin Neurophysiol. 1997;103:535–542. [PubMed: 9402884]
5. De Gennaro L, Ferrara M, Vecchio F, Curcio G, Bertini M. An electroencephalographic fingerprintof human sleep. Neuroimage. 2005; 26:114–122. [PubMed: 15862211]
6. De Gennaro L, Ferrara M. Sleep spindles: an overview. Sleep Med Rev. 2003; 7:423–440.[PubMed: 14573378]
7. Shibagaki M, Kiyono S, Watanabe K. Spindle evolution in normal and mentally retarded children: areview. Sleep. 1982; 5:47–57. [PubMed: 7071451]
Warby et al. Page 14
Nat Methods. Author manuscript; available in PMC 2014 October 01.
NIH
-PA Author Manuscript
NIH
-PA Author Manuscript
NIH
-PA Author Manuscript

8. Crowley K, Trinder J, Kim Y, Carrington M, Colrain IM. The effects of normal aging on sleepspindle and K-complex production. Clin Neurophysiol. 2002; 113:1615–1622. [PubMed: 12350438]
9. Nicolas A, Petit D, Rompré S, Montplaisir J. Sleep spindle characteristics in healthy subjects ofdifferent age groups. Clin Neurophysiol. 2001; 112:521–527. [PubMed: 11222974]
10. Martin N, et al. Topography of age-related changes in sleep spindles. Neurobiol Aging. 2013;34:468–476. [PubMed: 22809452]
11. De Gennaro L, et al. The electroencephalographic fingerprint of sleep is genetically determined: atwin study. Ann Neurol. 2008; 64:455–460. [PubMed: 18688819]
12. Ambrosius U, et al. Heritability of sleep electroencephalogram. Biol Psychiatry. 2008; 64:344–348. [PubMed: 18405882]
13. Fogel SM, Smith CT. The function of the sleep spindle: a physiological index of intelligence and amechanism for sleep-dependent memory consolidation. Neurosci Biobehav Rev. 2011; 35:1154–1165. [PubMed: 21167865]
14. Walker MP. The role of sleep in cognition and emotion. Ann N Y Acad Sci. 2009; 1156:168–197.[PubMed: 19338508]
15. Diekelmann S, Born J. The memory function of sleep. Nat Rev Neurosci. 2010; 11:114–126.[PubMed: 20046194]
16. Barakat M, et al. Fast and slow spindle involvement in the consolidation of a new motor sequence.Behav Brain Res. 2011; 217:117–121. [PubMed: 20974183]
17. Ferrarelli F, et al. Reduced sleep spindle activity in schizophrenia patients. Am J Psychiatry. 2007;164:483–492. [PubMed: 17329474]
18. Wamsley EJ, et al. Reduced sleep spindles and spindle coherence in schizophrenia: mechanisms ofimpaired memory consolidation? Biol Psychiatry. 2012; 71:154–161. [PubMed: 21967958]
19. Limoges E, Mottron L, Bolduc C, Berthiaume C, Godbout R. Atypical sleep architecture and theautism phenotype. Brain. 2005; 128:1049–1061. [PubMed: 15705609]
20. Myatchin I, Lagae L. Sleep spindle abnormalities in children with generalized spike-wavedischarges. Pediatr Neurol. 2007; 36:106–111. [PubMed: 17275662]
21. Montagna P, Gambetti P, Cortelli P, Lugaresi E. Familial and sporadic fatal insomnia. LancetNeurol. 2003; 2:167–176. [PubMed: 12849238]
22. Espa F, Ondze B, Deglise P, Billiard M, Besset A. Sleep architecture, slow wave activity, andsleep spindles in adult patients with sleepwalking and sleep terrors. Clin Neurophysiol. 2000;111:929–939. [PubMed: 10802466]
23. Himanen SL, Virkkala J, Huupponen E, Hasan J. Spindle frequency remains slow in sleep apneapatients throughout the night. Sleep Medicine. 2003; 4:229–234. [PubMed: 14592327]
24. Petit D, Gagnon JF, Fantini ML, Ferini-Strambi L, Montplaisir J. Sleep and quantitative EEG inneurodegenerative disorders. J Psychosom Res. 2004; 56:487–496. [PubMed: 15172204]
25. Ferrara M, Moroni F, De Gennaro L, Nobili L. Hippocampal sleep features: relations to humanmemory function. Frontiers in Neurology. 2012; 3
26. Steriade M. Grouping of brain rhythms in corticothalamic systems. Neuroscience. 2006; 137:1087–1106. [PubMed: 16343791]
27. Vukadinovic Z. Sleep abnormalities in schizophrenia may suggest impaired trans-thalamic cortico-cortical communication: towards a dynamic model of the illness. Eur J Neurosci. 2011; 34:1031–1039. [PubMed: 21895800]
28. Schimicek P, Zeitlhofer J, Anderer P, Saletu B. Automatic sleep-spindle detection procedure:aspects of reliability and validity. Clin Electroencephalogr. 1994; 25:26–29. [PubMed: 8174288]
29. Huupponen E, et al. Optimization of sigma amplitude threshold in sleep spindle detection. J SleepRes. 2000; 9:327–334. [PubMed: 11386202]
30. Gais S, Mölle M, Helms K, Born J. Learning-dependent increases in sleep spindle density. JNeurosci. 2002; 22:6830–6834. [PubMed: 12151563]
31. Mölle M, Marshall L, Gais S, Born J. Grouping of spindle activity during slow oscillations inhuman non-rapid eye movement sleep. J Neurosci. 2002; 22:10941–10947. [PubMed: 12486189]
Warby et al. Page 15
Nat Methods. Author manuscript; available in PMC 2014 October 01.
NIH
-PA Author Manuscript
NIH
-PA Author Manuscript
NIH
-PA Author Manuscript
32. Anderer P, et al. An E-health solution for automatic sleep classification according to Rechtschaffenand Kales: validation study of the Somnolyzer 24 x 7 utilizing the Siesta database.Neuropsychobiology. 2005; 51:115–133. [PubMed: 15838184]
33. Schabus M, et al. Sleep spindle-related activity in the human EEG and its relation to generalcognitive and learning abilities. Eur J Neurosci. 2006; 23:1738–1746. [PubMed: 16623830]
34. Huupponen E, et al. Development and comparison of four sleep spindle detection methods. ArtifIntell Med. 2007; 40:157–170. [PubMed: 17555950]
35. Devuyst S, et al. Automatic sleep spindle detection in patients with sleep disorders. Conf ProcIEEE Eng Med Biol Soc. 2006; 1:3883–3886. [PubMed: 17947058]
36. Barakat M, et al. Sleep spindles predict neural and behavioral changes in motor sequenceconsolidation. Hum Brain Mapp. 2013; 34:2918–2928. [PubMed: 22674673]
37. Bergmann TO, Molle M, Diedrichs J, Born J, Siebner HR. Sleep spindle-related reactivation ofcategory-specific cortical regions after learning face-scene associations. Neuroimage. 2012;59:2733–2742. [PubMed: 22037418]
38. Ayoub A, et al. Differential effects on fast and slow spindle activity, and the sleep slow oscillationin humans with carbamazepine and flunarizine to antagonize voltage-dependent na(+) and ca(2+)channel activity. Sleep. 2013; 36:905–911. [PubMed: 23729934]
39. Ray LB, Fogel SM, Smith CT, Peters KR. Validating an automated sleep spindle detectionalgorithm using an individualized approach. J Sleep Res. 2010; 19:374–378. [PubMed: 20149067]
40. Schabus M, et al. Hemodynamic cerebral correlates of sleep spindles during human non-rapid eyemovement sleep. Proc Natl Acad Sci US A. 2007; 104:13164–13169.
41. Bódizs R, Körmendi J, Rigó P, Lázár AS. The individual adjustment method of sleep spindleanalysis: methodological improvements and roots in the fingerprint paradigm. J NeurosciMethods. 2009; 178:205–213. [PubMed: 19061915]
42. Ruch S, et al. Sleep stage II contributes to the consolidation of declarative memories.Neuropsychologia. 2012; 50:2389–2396. [PubMed: 22750121]
43. Bódizs R, Gombos F, Kovács I. Sleep EEG fingerprints reveal accelerated thalamocorticaloscillatory dynamics in Williams syndrome. Res Dev Disabil. 2012; 33:153–164. [PubMed:22093660]
44. Sitnikova E, Hramov AE, Koronovsky AA, van Luijtelaar G. Sleep spindles and spike-wavedischarges in EEG: Their generic features, similarities and distinctions disclosed with Fouriertransform and continuous wavelet analysis. J Neurosci Methods. 2009; 180:304–316. [PubMed:19383511]
45. Wendt SL, et al. Validation of a novel automatic sleep spindle detector with high performanceduring sleep in middle aged subjects. Conf Proc IEEE Eng Med Biol Soc. 2012; 2012:4250–4253.[PubMed: 23366866]
46. Plante DT, et al. Topographic and sex-related differences in sleep spindles in major depressivedisorder: a high-density EEG investigation. J Affect Disord. 2013; 146:120–125. [PubMed:22974470]
47. Peppard PE, et al. Increased Prevalence of Sleep-Disordered Breathing in Adults. Am J Epidemiol.2013; 177:1006–1014.
48. Feinberg I, Koresko RL, Heller N. EEG sleep patterns as a function of normal and pathologicalaging in man. J Psychiatr Res. 1967; 5:107–144. [PubMed: 6056816]
49. Nir Y, et al. Regional slow waves and spindles in human sleep. Neuron. 2011; 70:153–169.[PubMed: 21482364]
50. McCormick L, Nielsen T, Nicolas A, Ptito M, Montplaisir J. Topographical distribution of spindlesand K-complexes in normal subjects. Sleep. 1997; 20:939–941. [PubMed: 9456457]
51. Donoho DL. An invitation to reproducible computational research. Biostatistics (Oxford, England).2010; 11:385–388.
Warby et al. Page 16
Nat Methods. Author manuscript; available in PMC 2014 October 01.
NIH
-PA Author Manuscript
NIH
-PA Author Manuscript
NIH
-PA Author Manuscript

Figure 1.Generation of the gold standard and spindle detection performance of individual experts. (a)Histogram of the number of epochs viewed by 24 expert scorers. Each bin represents oneexpert, and they are arranged in descending order. (b) Histogram of the number of timesepochs were viewed by a specific number of experts. (c) Mean by-event performance (F1-score) of individual experts (shading is standard deviation) at varying thresholds ofconsensus. Average performance was maximized at Tegc = 0.25, and this level of groupconsensus was used to generate the gold standard expert dataset. (d) Number of spindlesfound at each Tegc threshold bin. Vertical line indicates optimal performance at Tegc = 0.25.(e) Cumulative number of spindles over the Tegc range. Horizontal line indicates the expertgroup identified 1987 spindles at Tegc = 0.25. (f) Precision-recall plot of individual expertperformance. Each square is one expert; the intensity of the color is scaled according to howmany epochs each expert viewed. The darkest squares are the experts that saw the most data.The line connected to each square indicates the decrease in performance in the leave-one-outanalysis that excludes the individual from the expert group consensus to correct for reportingbias. The position of the square indicates the performance after correction.
Warby et al. Page 17
Nat Methods. Author manuscript; available in PMC 2014 October 01.
NIH
-PA Author Manuscript
NIH
-PA Author Manuscript
NIH
-PA Author Manuscript

Figure 2.By-event and by-subject characteristics of 1,988 spindles in the gold standard dataset. (a)Duration. (b) Frequency. (c) Maximum peak-to-peak amplitude in the 11–16 Hz band. (d)Symmetry, measured as location of the maximum peak-to-peak amplitude relative to thelength of the spindle. Example spindles for each characteristic is provided above thehistogram. Black bars indicate spindle identification. (e) Spindle density in the 110 subjects.(f) Correlation between spindle density and subject age (R2 = 0.055, p-value = 0.013). (g)Mean maximum peak-to-peak amplitude of spindles in females versus males (t-test p-value= 3.03e−6). (h) Correlation between maximum peak-to-peak amplitude and subject age (R2 =0.059. p-value = 0.016). (i) Spindle oscillation frequency between subjects (ANOVA p-value = 9.93e−70), ordered by descending mean frequency.
Warby et al. Page 18
Nat Methods. Author manuscript; available in PMC 2014 October 01.
NIH
-PA Author Manuscript
NIH
-PA Author Manuscript
NIH
-PA Author Manuscript

Figure 3.Consensus and performance of the non-expert group for spindle detection. (a) Histogram ofthe number of epochs viewed by each of 114 non-expert scorers. Each bin represents onenon-expert, and they are arranged in descending order. (b) Histogram of the number of timesepochs are viewed by a specific number of non-experts. (c) By-event precision-recall plot ofnon-expert performance. Each circle is one non-expert; non-experts that viewed the mostdata are the darkest circles. Non-expert group consensus is plotted as a green line;performance at each consensus threshold (0–0.9) is indicated with a green circle.Performance of the group consensus is remarkably good, despite individuals with very lowperformance (bottom left). (d) F1-score performance of the non-expert group consensus at
Warby et al. Page 19
Nat Methods. Author manuscript; available in PMC 2014 October 01.
NIH
-PA Author Manuscript
NIH
-PA Author Manuscript
NIH
-PA Author Manuscript

different consensus thresholds (Tngc) in the by-event analysis. Optimal performance wasTngc = 0.4. (e) Number of spindles found at each Tngc threshold bin. Vertical orange lineindicates optimal performance of Tngc = 0.4. (f) Cumulative number of spindles over theTngc range. Horizontal orange line indicates that the non-expert group identified 1669spindles at Tngc= 0.4. (g) By-subject correlation between spindle density in the gold standardand spindle density of the non-expert group consensus (Tngc= 0.4). Each datapoint is onesleeping subject; darker circles indicate multiple subjects at the same position in the plot.
Warby et al. Page 20
Nat Methods. Author manuscript; available in PMC 2014 October 01.
NIH
-PA Author Manuscript
NIH
-PA Author Manuscript
NIH
-PA Author Manuscript
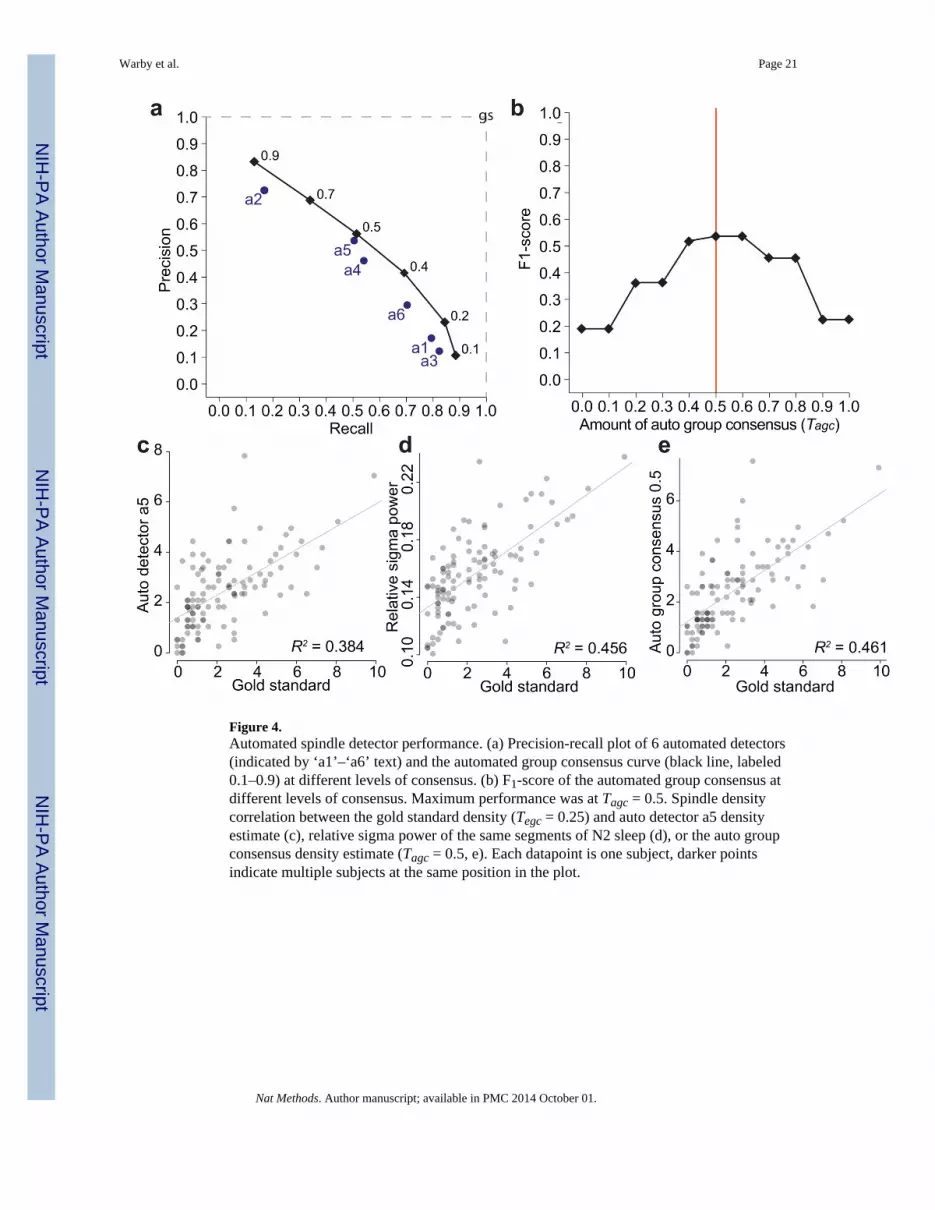
Figure 4.Automated spindle detector performance. (a) Precision-recall plot of 6 automated detectors(indicated by ‘a1’–‘a6’ text) and the automated group consensus curve (black line, labeled0.1–0.9) at different levels of consensus. (b) F1-score of the automated group consensus atdifferent levels of consensus. Maximum performance was at Tagc = 0.5. Spindle densitycorrelation between the gold standard density (Tegc = 0.25) and auto detector a5 densityestimate (c), relative sigma power of the same segments of N2 sleep (d), or the auto groupconsensus density estimate (Tagc = 0.5, e). Each datapoint is one subject, darker pointsindicate multiple subjects at the same position in the plot.
Warby et al. Page 21
Nat Methods. Author manuscript; available in PMC 2014 October 01.
NIH
-PA Author Manuscript
NIH
-PA Author Manuscript
NIH
-PA Author Manuscript

Figure 5.Performance of experts, non-experts and automated spindle detection algorithms. (a)Precision-recall plot of experts (red boxes, after correction with the leave-one-out analysis),non-expert group (Tngc = 0.0–0.9, green circles, also see Fig. 3) and automated methods (a1-a6) in the by-event analysis. Highest performance is closest to the top-right corner of theplot. (b) By-subject density estimates for each of the automated methods (a1-a6) and thenon-expert group (ng) against the gold standard (gs). Each dot is one subject. Dotted line isthe mean density in the gold standard. The mean and standard deviation of each detector isindicated by orange horizontal and vertical lines respectively. (c) By-subject spindleduration estimates; dotted line is the mean spindle duration in the gold standard. (d) Theeffect of varying the required amount of overlap (Toverlap) between event and detection inorder to be determined a true positive on the performance of the automated detector (a1-a6),non-expert group (ng, n=114, at ngc = 0.4) or the mean individual expert (e, n=24, redshading is standard deviation). Vertical orange line indicates the Toverlap threshold used bydefault in this study (0.2).
Warby et al. Page 22
Nat Methods. Author manuscript; available in PMC 2014 October 01.
NIH
-PA Author Manuscript
NIH
-PA Author Manuscript
NIH
-PA Author Manuscript

NIH
-PA Author Manuscript
NIH
-PA Author Manuscript
NIH
-PA Author Manuscript
Warby et al. Page 23
Tabl
e 1
Inte
r-de
tect
or b
y-ev
ent a
gree
men
t, m
easu
red
by F
1-sc
ore.
(gs
- g
old
stan
dard
(T
egc
= 0
.25)
, ngc
- n
on-e
xper
t gro
up c
onse
nsus
(T
ngc
= 0
.4),
agc
-au
tom
ated
gro
up c
onse
nsus
(T
agc
= 0
.5).
gsng
cag
ca1
a2a3
a4a5
a6
gs1
ngc
0.67
1
agc
0.54
0.50
1
a10.
280.
220.
281
a20.
280.
300.
400.
091
a30.
210.
170.
210.
440.
061
a40.
500.
460.
790.
310.
320.
261
a50.
520.
490.
840.
270.
360.
210.
711
a60.
410.
370.
480.
390.
170.
340.
480.
441
Nat Methods. Author manuscript; available in PMC 2014 October 01.


