Embed Size (px)
Citation preview
1
Social Cleavages and Political Dealignment in Contemporary Chile, 1995-2009
by
Matías A. Bargsted
Nicolás M. Somma
Institute of Sociology
Pontificia Universidad Católica de Chile
Forthcoming in Party Politics
Abstract:
There is abundant research on how social cleavages shape political preferences in
developed countries with uninterrupted democracies, but we know less about this topic
for middle income countries with recently restored democracies. In this analysis of the
Chilean case, we examine with Latinobarometer survey data from 1995 to 2009 the
evolution of social cleavages as shapers of political preferences (measured with a left-
right self-placement scale). We find a general process of dealignment across time,
indicated by the decreasing association between political preferences on the one hand,
and class, religion, and regime preferences on the other one. We tentatively link
dealingment at the mass level to the strategies pursued by political parties operating in a
political and economic context that encourages ideological moderation and convergence
to the center. These strategies weaken the differentiated signals needed for sustaining an
aligned citizenry.
Introduction
In 1989 Chileans elected their national political authorities by popular vote,
ending the seventeen-year long military dictatorship of General Augusto Pinochet and
honoring the country’s pedigree as one of the most robust democracies in Latin
America. As Chilean democracy consolidated in the following years, scholars started to
address pressing questions. To what extent did social cleavages shape the political
preferences of Chileans in the new democratic context? How did cleavages evolve as
2
democracy consolidated and socioeconomic modernization ensued? What might explain
the observed changes?
Past research provided two answers to these questions. One was developed by
Valenzuela and Scully (Scully, 1992; Valenzuela and Scully, 1997; Valenzuela et al.,
2007). Inspired by Lipset and Rokkan’s (1967) sociological model of party systems,
they argued that political preferences in post-authoritarian Chile - including voting
choices and ideological positions in a left-right scale – were essentially shaped by
traditional religious and class cleavages. These cleavages were not new - they had
structured political conflict in Chile since mid-nineteenth century (religion) and early
twentieth century (class).
Scholars such as Tironi and Agüero (Tironi y Agüero, 1999; Tironi et al., 2001)
and Torcal and Mainwaring (2003a), however, claimed that a new “regime preferences”
division between those who supported the Pinochet regime and those who opposed it
had displaced traditional cleavages like class or religion. This division, which was
epitomized by the 1988 plebiscite (in which Pinochet was voted out and the path for re-
democratization opened), shaped the new political landscape and had an enduring
impact on electoral preferences. Those supporting Pinochet favored the center-right
coalition (Alianza por Chile) and those opposing him favored the center-left coalition
(Concertación de Partidos por la Democracia). Several studies based on cross-sectional
survey data supported this claim (Agüero et al., 1998; Bonilla et al. 2011; Alvarez and
Katz, 2009; Ortega Frei, 2003; Tironi et al., 2001).
In this paper we examine the evolution of social cleavages in shaping Chileans’
political preferences (measured as self-identification in a left-right political scale)
between 1995 and 2009. We find that, for the entire period, both sociological and
3
regime preference variables shape locations on the left-right scale. However, we also
find a systematic reduction in the size of the marginal effects of multiple cleavage
variables, namely education, religious denomination, and regime preferences of
respondents. We relate this trend to a general process of ideological convergence among
Chilean parties, for which we provide some exploratory evidence. This convergence
process can be understood as a progressive political learning whereby political parties
adapted to the institutional and economic environment inherited from the Pinochet
regime.
We contribute to the debate in four ways. First, by exploring a case of relatively
recent democratic consolidation, we expand social cleavage research, which mostly
focuses on cases with uninterrupted democratic rule since World War II (i. e. Western
Europe and North America) but barely so in middle-income nations with recent
democratic transitions. This allows us to consider a new division – that between
supporters and opponents of a previous authoritarian regime, which for obvious reasons
has not been explored in uninterrupted democracies. We also look at the more
traditional class and religion cleavages.
Second, we test the widespread hypothesis about a generalized decline of social
cleavages (Inglehart 1990; Dalton 2002) by looking at cleavage strength year after year
– therefore not assuming linear patterns of evolution. This is consistent with an issue
evolution perspective (Carmines and Stimson, 1989), which claims that the strength of
cleavages vary in different directions according to the issues opportunistically activated
by political elites.
Third, by using yearly data for a fourteen-year period (1995-2009) we present a
truly longitudinal study of the evolution of Chilean cleavages. This is an improvement
4
over past studies about Chile, which typically use cross-sectional surveys and therefore
cannot assess whether the strength of cleavages increase or decrease across time (two
partial exceptions are Torcal and Mainwaring [2003a] and Raymond and Feltch [2012]).
We use a single dataset (the Latinobarometer survey) containing comparable
questionnaires and the same model specification across time.
Finally, we take into account the fact that not all Chileans express a preference
on the dependent variable of our analysis (the left-right ideological self-placement
scale). Consequently, we employ a Heckman selection model (Heckman, 1979), which
allows us to simultaneously estimate individuals’ propensity to express any ideological
preference as well as their position on the scale.
We first review the literature on social cleavages and political agency and then
describe the particularities of the Chilean political system. We then present our data,
methods, and results. In the discussion section we try to make sense of the results
considering party strategies and the institutional arrangements inherited from the
Pinochet regime. We conclude and present pending research tasks.
Social Cleavages and Political Agency
One of the most enduring debates in political sociology and political science
revolves around social cleavages – i. e. the extent to which structural traits like gender,
class, religion, or ethnicity shape electoral choices and political ideologies. The basic
idea is that people from different social groups systematically develop political
preferences and make electoral choices that seem to advance their group interests,
values, and identities.
5
While few would discuss that the association between social categories and
preferences exist under certain circumstances, a more pressing question is why cleavage
strength varies across time or places. One answer comes from a sociological approach,
which suggests that variations arise from changes in social-structural factors such as
inequality between and within groups, socioeconomic modernization, value change, and
changes in group size (Lipset and Rokkan 1967; Manza and Brooks 1999; Inglehart
1977). But because social structures typically change slowly, this approach alone cannot
explain changes in cleavage strength that take place over short time periods – such as
those we diagnose below for Chile. Thus, we emphasize a more dynamic “political
agency” approach, which focuses on how political actors react to the political,
economic, and social setting in which they are embedded (Chhibber and Torcal 1997;
Evans and Tilley 2012; Przeworski and Sprague 1986).
According to this approach the associations between social categories and
political preferences result from the choices of political actors embedded in particular
contexts. Parties and politicians develop strategies for gaining the support of certain
social groups. Groups respond to these appeals and increase their support towards the
party, yet at the same time other groups feel alienated and therefore support
disproportionately another party. This creates or deepens certain political conflicts and
identities - though not necessarily intentionally (Torcal and Mainwaring 2003;
Mainwaring et al. 2013; Hetherington 2001; Posner 2004). Conversely, conflicts may be
deactivated when parties develop catch-all strategies or when they move to the center of
the relevant axis of competition, because citizens may stop perceiving substantial
differences in political supply (Enyedi 2005; Kriesi 1998).
6
One key aspect for determining party strategies is the institutional context. For
instance, electoral rules may encourage parties to seek the median voter (Downs 1957,
Cox 1997), and this may require downplaying some conflicts and identities while
activating latent ones. The impact of institutional arrangements may not be immediate
but require time, as actors learn how to operate within certain rules. Political learning
helps explaining why cleavage strength may change across time due to institutional
factors even if rules do not change. We suggest that this is the case regarding the impact
of the binominal system in post-transitional Chile. Before presenting the data on Chile
we review research showing how the political agency approach accounts for changes in
cleavage strength regarding the three cleavages we consider in our analysis (class,
religion, and regime preferences).
Class and political preferences
Classic post-war electoral studies showed that in most industrial societies the
working class tended to support leftist parties while the middle and upper classes
supported liberal and conservative parties (Lipset, 1963; Lazarsfeld, et al., 1948; J.
Evans, 2004; Knutsen, 2007; G. Evans, 1999; Manza, Hout and Brooks, 1995). Social-
structural explanations of variations in the class cleavage include the embourgeoisement
thesis, the decline of labor unions, increasing occupational mobility (Dalton, 2002:153;
Evans, 2004:56; Manza, Brooks and Sauder, 2005:215) and cultural change (Inglehart
1990).
Recent studies emphasized the political agency model. Evans and Tilley (2012)
found that the decline of class voting in Britain resulted from the Labour Party’s move
to the political center in the 1990s and 2000s rather than from an increase in class
7
heterogeneity. Chhibber and Torcal (1997) argue that the resurgence of class voting in
Spain during the 1990s should be attributed to the policies of the governing PSOE. By
raising unemployment benefits and increasing social expenditures, these policies
increased workers’ support toward the PSOE and alienated the upper classes. For
contemporary Latin America, Mainwaring et al. (2013) found that class voting in Latin
America is higher in countries with a strong and viable leftist candidate. This is because
such candidates emphasize themes such as land reform, redistribution, and social
justice, which polarize the electorate along class lines.
Religion and political preferences
Religious identities can powerfully shape political preferences (Manza and
Brooks 1999). Individuals with certain religious identities may perceive that a given
political party furthers their interests, values, or beliefs to a greater extent than other
ones, thus supporting them disproportionately. These alignments may vary across
countries and regions, and some scholars focus on social-structural factors for
explaining them (Dalton, 2002:161; Esmer and Pattersson, 2007:499; Manza and
Wright, 2003).
Other scholars consider the strategies and choices of parties and candidates. For
instance, conservative or confessional parties may choose to emphasize moral issues
with strong religious overtones when they feel threatened by liberal governments
(Kalyvas 1998), therefore mobilizing religious supporters and alienating secular ones
(Mohseni and Wilcox 2008:211). As a reaction to religious embattlements, self-
confident irreligious parties may become more openly secular, as the American
8
Democrats did in the 1980s to face the arousal of the Republican-aligned Christian
Right (Mohseni and Wilcox 2008:211).
Parties and politicians may also make strategic choices that weaken religious
cleavages. European Christian Democratic parties originally mobilized voters on the
basis of religious identities, but as they became catch-all center or center-right parties –
as in Italy and Germany– they softened religious issues and attempted to attract non-
Christian groups and younger voters (Manza and Wright 2003:299; Mohseni and
Wilcox 2008:218).
Attitudes toward the authoritarian regime: a new divide?
Finally, we focus on the authoritarian-democratic division. This is absent in
cleavage studies of consolidated democracies simply because they do not have a recent
authoritarian past. Authoritarian regimes may leave a powerful legacy in their societies
– a legacy that colors citizens’ views of most political issues once democracy is
restored. Specifically, we argue that citizens’ political preferences may be shaped by
their positions toward the previous authoritarian regime (be it in favor or against it). If
they favored the authoritarian regime and the latter positioned itself as a rightist regime,
they should see themselves as rightist and favor rightist parties – and vice-versa. The
political agency approach suggests that parties will activate or downplay this division as
a means for obtaining votes or other kinds of political advantages (e. g. internal
cohesion). For instance, parties that adhere to the regime will activate the division when
the population holds a positive image about it, yet they will try to deactivate it when the
regime it loses legitimacy (Moreno 1999; Kitschelt et al. 2010, cap. 8).
9
The Chilean Case
Within Latin America, Chile is an interesting case because its social cleavages
are supposed to be comparatively strong (Dix, 1989; Mainwaring and Scully, 1995),
partially as a result of a party system similar to multi-party continental ones. Since
redemocratization in 1990, the Chilean party system revolved around two multi-party
coalitions: the center-left Concertación por la Democracia, composed by the Partido
Socialista (PS), Partido Por la Democracia (PPD), Democracia Cristiana (DC) and
Partido Radical Socialdemócrata (PRSD); and the center-right Alianza por el Cambio,
composed by Renovación Nacional (RN) and the Unión Demócrata Independiente
(UDI). The Concertación governed between 1990 and 2010, when it was defeated by
the Alianza – currently in power. The peculiar binominal electoral system –with only
two members being elected in each district – granted a similar number of legislators to
both coalitions.
Historically, the Chilean class cleavage stemmed from the early development of
a strong labor movement tied to leftist parties – a tie that was reinforced during the
Socialist government of Salvador Allende (1970-1973) – and the coalescence of the
industrial and landowning classes around rightist parties for protecting their privileges.
While some studies suggests that class should continue shaping political positions in the
post-authoritarian period (Valenzuela et al., 2007) others claim the opposite (Torcal and
Mainwaring 2003). Yet the issue has not been settled because we lack a comprehensive
exploration of the evolution of such cleavage across time.
The religious cleavage shaped the origins of Chile’s first party system in the
1850s. The conflict stemmed from divergences within the political class regarding the
influence of the Church on state and society (Scully, 1992; Valenzuela, 1995). But there
10
is less agreement about the current strength of religious cleavages or their evolution
across time. Some claim it is very influential (Valenzuela and Scully, 1997; Valenzuela
et al., 2007), others claim the opposite (Torcal and Mainwaring, 2003a), and a recent
study suggests an increasing salience of religion (Raymond and Feltch, 2012).
The regime division pits those who favor the authoritarian regime of Pinochet
versus those who prefer democracy. Prior studies found a strong association between
attitudes toward Pinochet’s regime and political preferences, with Pinochet supporters
favoring rightist parties and self-identifications and opponents favoring the left (Tironi
and Agüero, 1999; Tironi et al., 2001; Torcal and Mainwaring (2003a). These
associations stem from the heavy consequences of the regime for Chileans. The regime
was enduring (it lasted seventeen years) and highly repressive (thousands of its
opponents were tortured or assassinated). Moreover, it engaged in multiple market
reforms that reduced the regulatory role of the state, privatized social services such as
health, education and pensions, and increased the flexibility of the labor market.
Additionally, Pinochet sent clear clues that his regime was a rightist one – e. g. he
presented himself as saving the country from the Marxist left.
Data and methods
We use Chilean survey data from the Latinobarometer project between 1995 and
2009. It employs a probability sample of voting age citizens conducted every year with
the exception of 1999. For reasons detailed at length in the online supplement, this is the
best dataset for a longitudinal analysis of political preferences in Chile. We also provide
in the supplement a brief description of the methodological details of the
Latinoarometer surveys.
11
Dependent variable
We measure the political preferences of Chileans using respondents’ self-
placement on a scale ranging from 0 (left) to 10 (right). This scale is widely used in
political behavior research because it provides a shorthand to peoples’ orientation
“toward a society’s political leaders, ideologies and parties” (Mair, 2007:207). Prior
research shows that Chileans consistently order their political parties along the scale and
that it represents a meaningful construct for a majority of the population (Fontaine,
1995; Harbers etal. 2013; Kitschelt et al. 2010, chap. 5). Moreover, the political scale
has been previously used in research on social cleavages and is strongly correlated with
voting choices not only internationally (Norris and Inglehart, 2004:448; Mair,
2007:218-9, Barone et al., 2007) but also in Chile (Tironi et al., 2001, Torcal and
Mainwaring 2003a).1 Measures of party preference or vote recount might capture more
directly electoral preferences but have high levels of non-response which hinder
multivariate analysis (Morales, 2010). Also, voting behavior has limitations for studying
social cleavages and political preferences (Barone et al. 2007). Because electoral
choices are strongly influenced by contingencies of political supply (Alvarez and
Nagler, 2000; Cox, 1997), many individuals vote for parties that do not reflect their true
preferences. In this respect, the left-right scale presumably better reflects long term
ideological orientations.
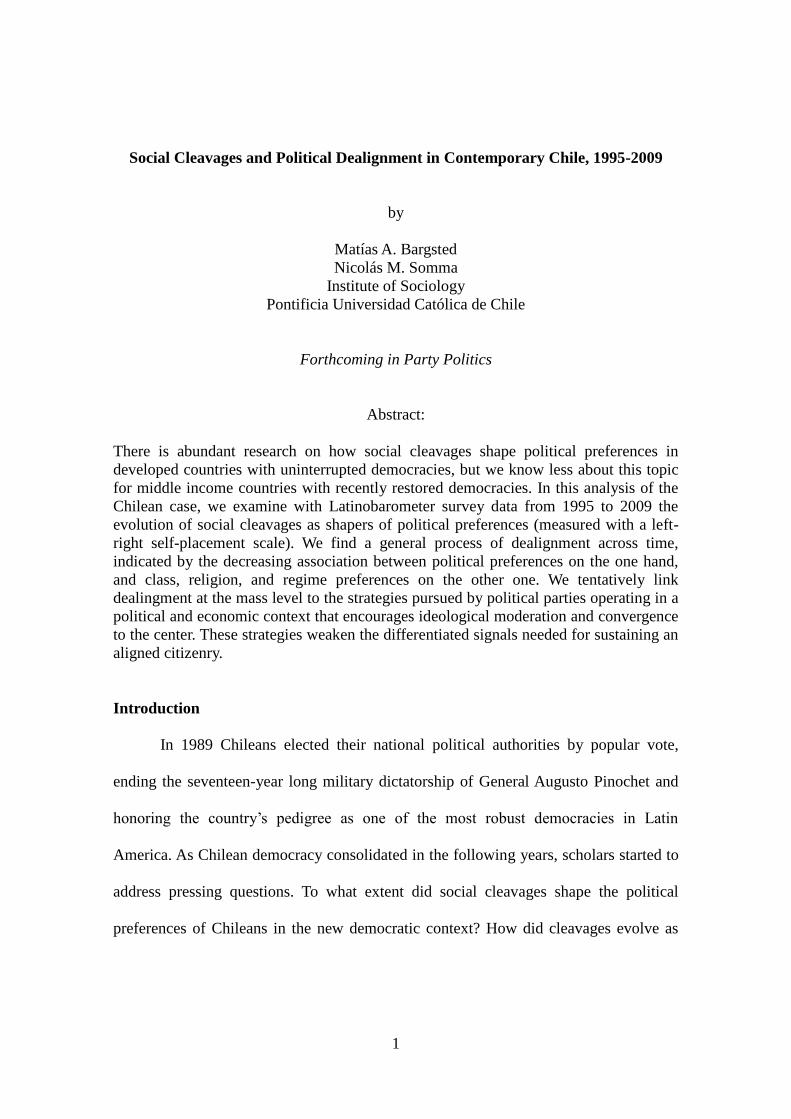
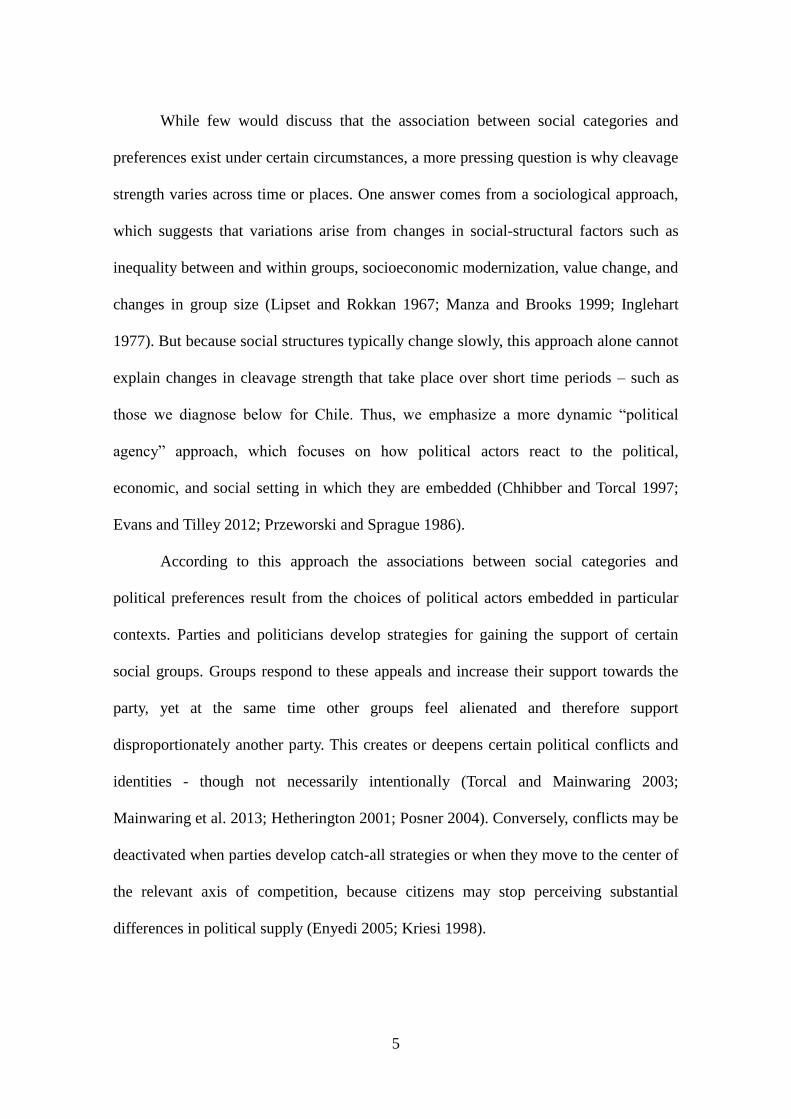
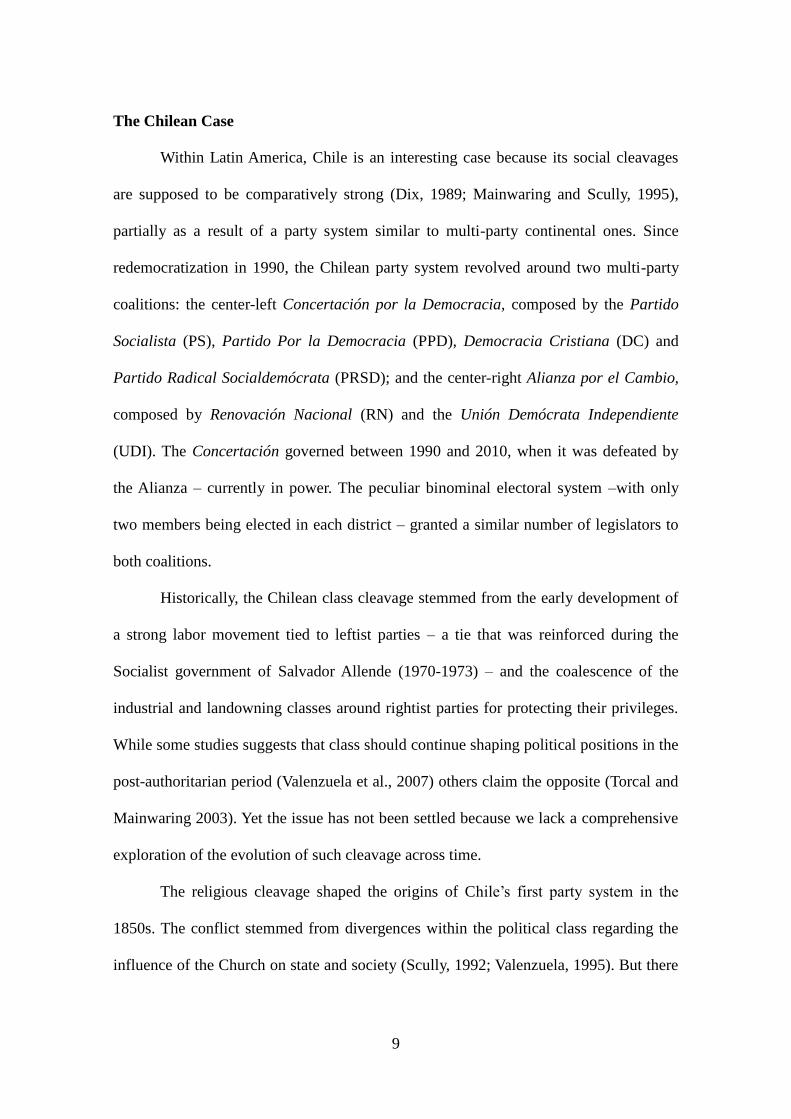
Still, the left-right scale in Chile has the problem that a sizeable and increasing
proportion of the population (around 30% in recent years) refuses to locate on it Figure
1shows the proportion of the population who mentions any position on the ideological
scale between 1995 and 2009. After 1997, when this proportion peaked to a 84%
1
In section 3 of the online supplement we provide empirical results that show a very strong association
between respondents’ position on the left-right scale and their declared electoral preferences.
12
(according to the weighted data) it decreased to a record low of 63% in 2003. Thereafter
the proportion of identifiers has remained around 70%. This proportion is too high to
ignore and, as we show below, there are important differences between the population
that mentions any position on the scale and the population that does not. This illustrates
a classical selection problem where the observed sample is not a random subset of the
entire sample (Achen, 1986). To address this problem we employ a Heckman selection
model (Heckman, 1979) and estimate simultaneously individuals’ propensity to express
any ideological preference as well as their position in the scale.
Independent variables
We measure the democracy-authoritarian divide with the following question:
“Which of the following statements do you agree most? a) Democracy is preferable to
any other kind of government, b) In certain situations, an authoritarian government can
be preferable or c) For people like me, it does not matter whether we have a democratic
or a non-democratic regime”. Hunneus and Maldonado (2003) and Valenzuela et al.
(2007) have convincingly argued that in Chile answers to this question reflect peoples’
attitudes (in favor or against) the Pinochet regime rather than abstract appraisals about
regime types. Therefore, those who prefer democracy favor the democratic regime
inaugurated in 1990, and those who prefer authoritarianism favor the previous
authoritarian regime. For our regression model we create two dummy variables that
indicate the authoritarian (alternative b) and indifference choice (alternative c), with the
last one also including the “Don’t Know” responses. Alternative a) (full democrats) is
the reference category.
13
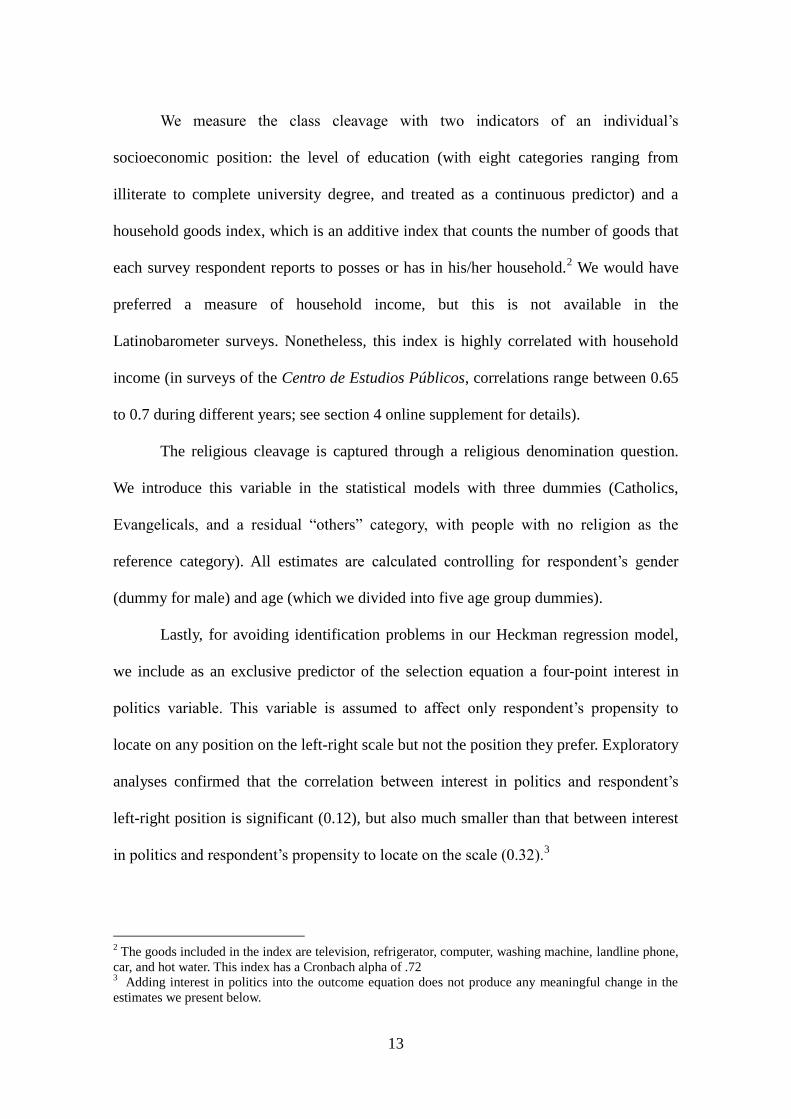
We measure the class cleavage with two indicators of an individual’s
socioeconomic position: the level of education (with eight categories ranging from
illiterate to complete university degree, and treated as a continuous predictor) and a
household goods index, which is an additive index that counts the number of goods that
each survey respondent reports to posses or has in his/her household.2 We would have
preferred a measure of household income, but this is not available in the
Latinobarometer surveys. Nonetheless, this index is highly correlated with household
income (in surveys of the Centro de Estudios Públicos, correlations range between 0.65
to 0.7 during different years; see section 4 online supplement for details).
The religious cleavage is captured through a religious denomination question.
We introduce this variable in the statistical models with three dummies (Catholics,
Evangelicals, and a residual “others” category, with people with no religion as the
reference category). All estimates are calculated controlling for respondent’s gender
(dummy for male) and age (which we divided into five age group dummies).
Lastly, for avoiding identification problems in our Heckman regression model,
we include as an exclusive predictor of the selection equation a four-point interest in
politics variable. This variable is assumed to affect only respondent’s propensity to
locate on any position on the left-right scale but not the position they prefer. Exploratory
analyses confirmed that the correlation between interest in politics and respondent’s
left-right position is significant (0.12), but also much smaller than that between interest
in politics and respondent’s propensity to locate on the scale (0.32).3
2 The goods included in the index are television, refrigerator, computer, washing machine, landline phone,
car, and hot water. This index has a Cronbach alpha of .72 3 Adding interest in politics into the outcome equation does not produce any meaningful change in the
estimates we present below.
14
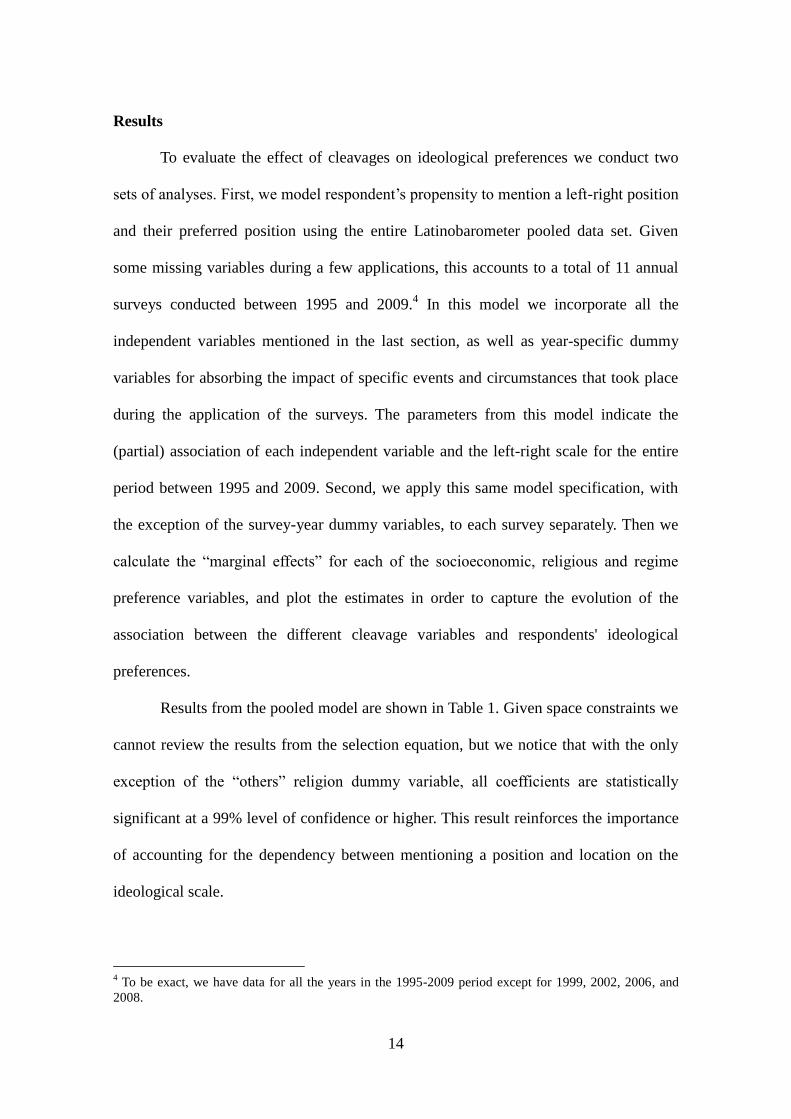
Results
To evaluate the effect of cleavages on ideological preferences we conduct two
sets of analyses. First, we model respondent’s propensity to mention a left-right position
and their preferred position using the entire Latinobarometer pooled data set. Given
some missing variables during a few applications, this accounts to a total of 11 annual
surveys conducted between 1995 and 2009.4 In this model we incorporate all the
independent variables mentioned in the last section, as well as year-specific dummy
variables for absorbing the impact of specific events and circumstances that took place
during the application of the surveys. The parameters from this model indicate the
(partial) association of each independent variable and the left-right scale for the entire
period between 1995 and 2009. Second, we apply this same model specification, with
the exception of the survey-year dummy variables, to each survey separately. Then we
calculate the “marginal effects” for each of the socioeconomic, religious and regime
preference variables, and plot the estimates in order to capture the evolution of the
association between the different cleavage variables and respondents' ideological
preferences.
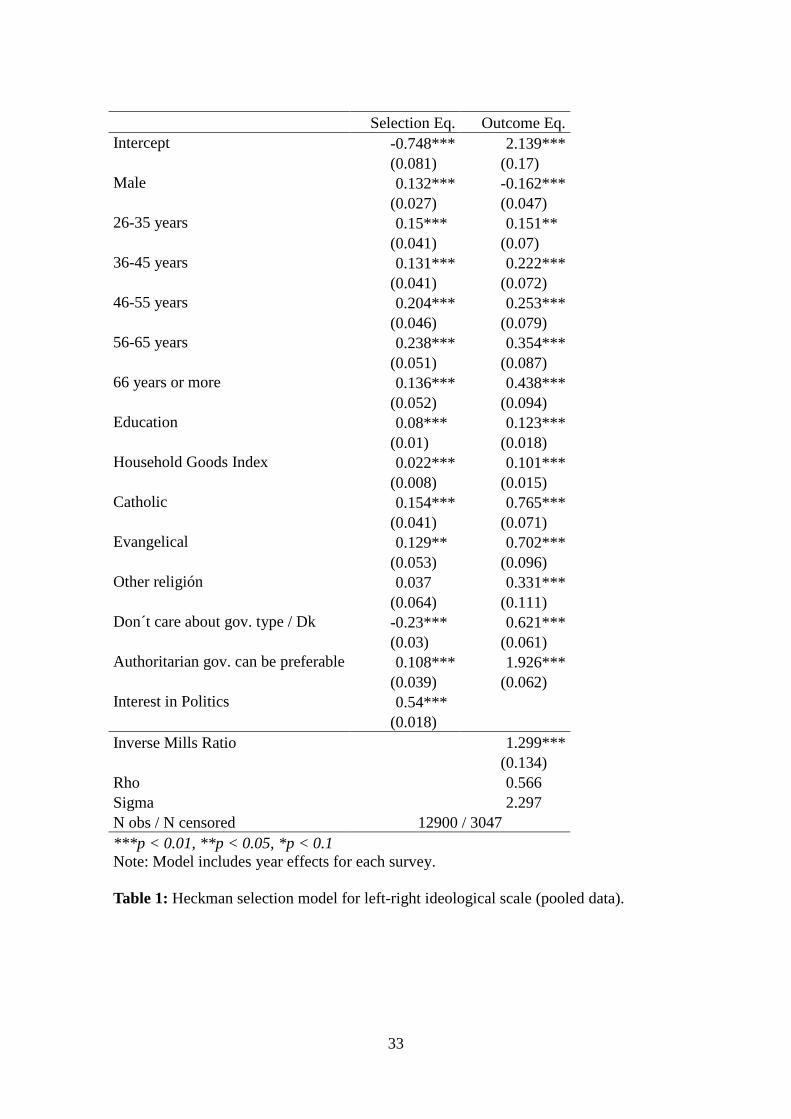
Results from the pooled model are shown in Table 1. Given space constraints we
cannot review the results from the selection equation, but we notice that with the only
exception of the “others” religion dummy variable, all coefficients are statistically
significant at a 99% level of confidence or higher. This result reinforces the importance
of accounting for the dependency between mentioning a position and location on the
ideological scale.
4 To be exact, we have data for all the years in the 1995-2009 period except for 1999, 2002, 2006, and
2008.
15
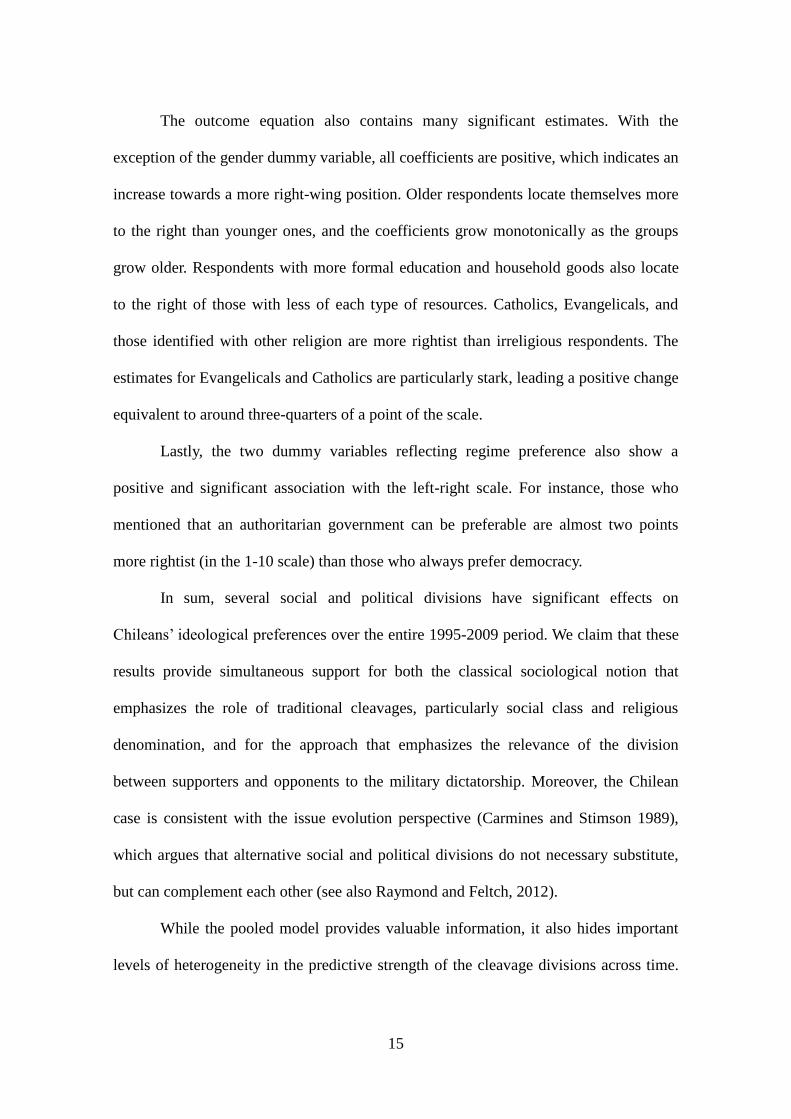
The outcome equation also contains many significant estimates. With the
exception of the gender dummy variable, all coefficients are positive, which indicates an
increase towards a more right-wing position. Older respondents locate themselves more
to the right than younger ones, and the coefficients grow monotonically as the groups
grow older. Respondents with more formal education and household goods also locate
to the right of those with less of each type of resources. Catholics, Evangelicals, and
those identified with other religion are more rightist than irreligious respondents. The
estimates for Evangelicals and Catholics are particularly stark, leading a positive change
equivalent to around three-quarters of a point of the scale.
Lastly, the two dummy variables reflecting regime preference also show a
positive and significant association with the left-right scale. For instance, those who
mentioned that an authoritarian government can be preferable are almost two points
more rightist (in the 1-10 scale) than those who always prefer democracy.
In sum, several social and political divisions have significant effects on
Chileans’ ideological preferences over the entire 1995-2009 period. We claim that these
results provide simultaneous support for both the classical sociological notion that
emphasizes the role of traditional cleavages, particularly social class and religious
denomination, and for the approach that emphasizes the relevance of the division
between supporters and opponents to the military dictatorship. Moreover, the Chilean
case is consistent with the issue evolution perspective (Carmines and Stimson 1989),
which argues that alternative social and political divisions do not necessary substitute,
but can complement each other (see also Raymond and Feltch, 2012).
While the pooled model provides valuable information, it also hides important
levels of heterogeneity in the predictive strength of the cleavage divisions across time.
16
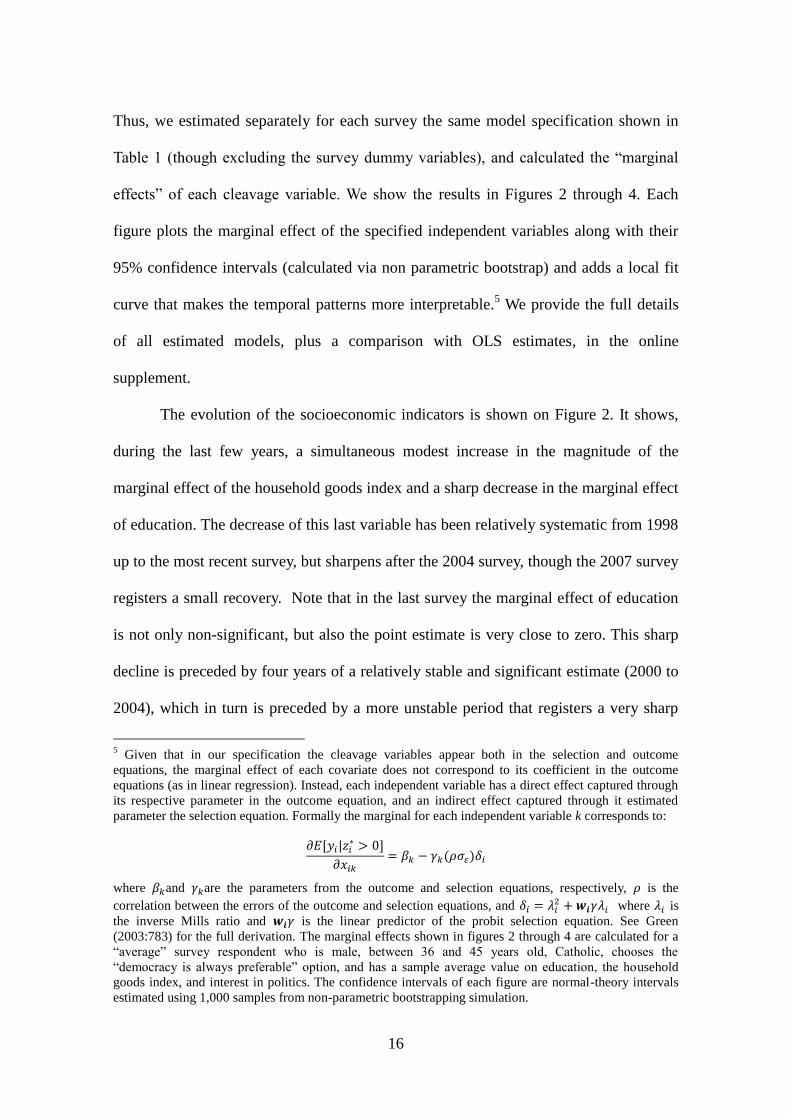
Thus, we estimated separately for each survey the same model specification shown in
Table 1 (though excluding the survey dummy variables), and calculated the “marginal
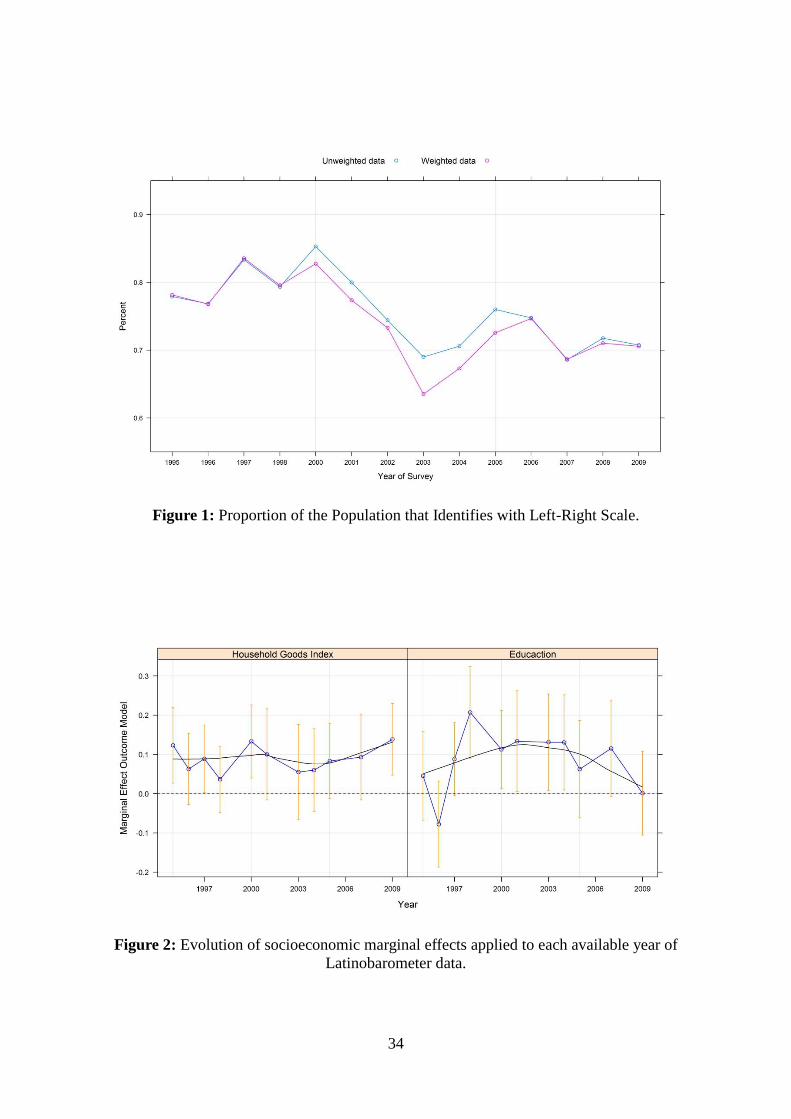
effects” of each cleavage variable. We show the results in Figures 2 through 4. Each
figure plots the marginal effect of the specified independent variables along with their
95% confidence intervals (calculated via non parametric bootstrap) and adds a local fit
curve that makes the temporal patterns more interpretable.5 We provide the full details
of all estimated models, plus a comparison with OLS estimates, in the online
supplement.
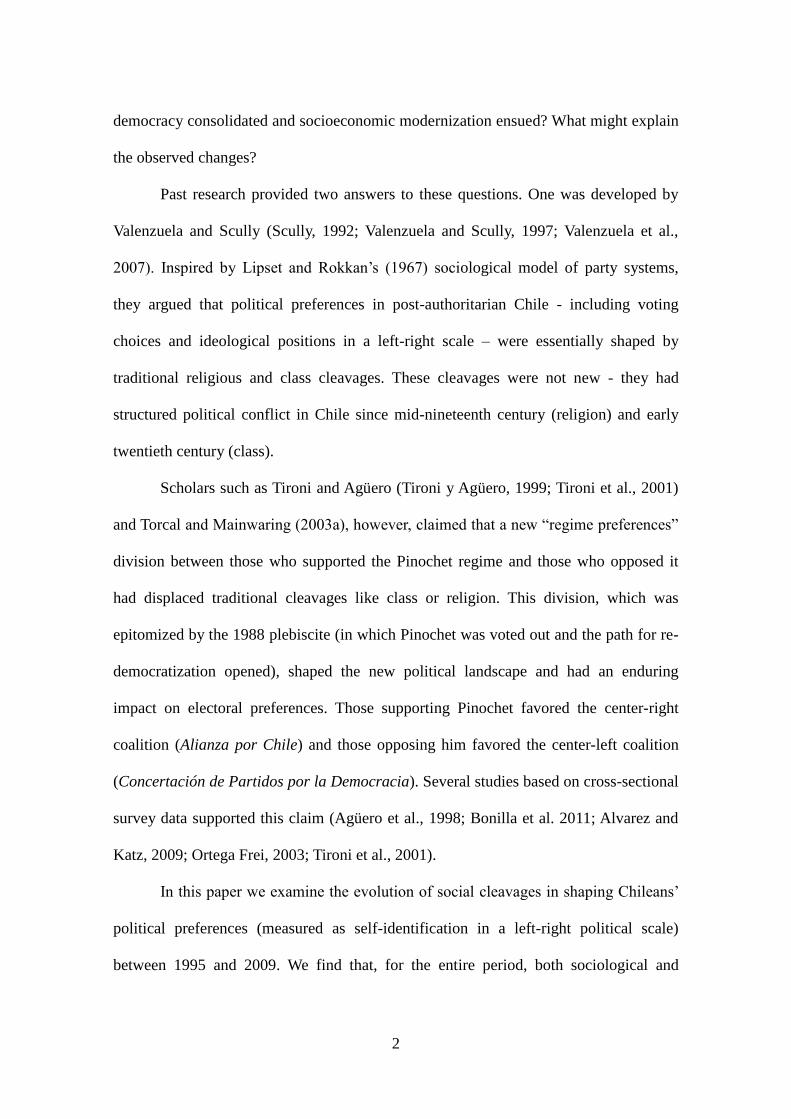
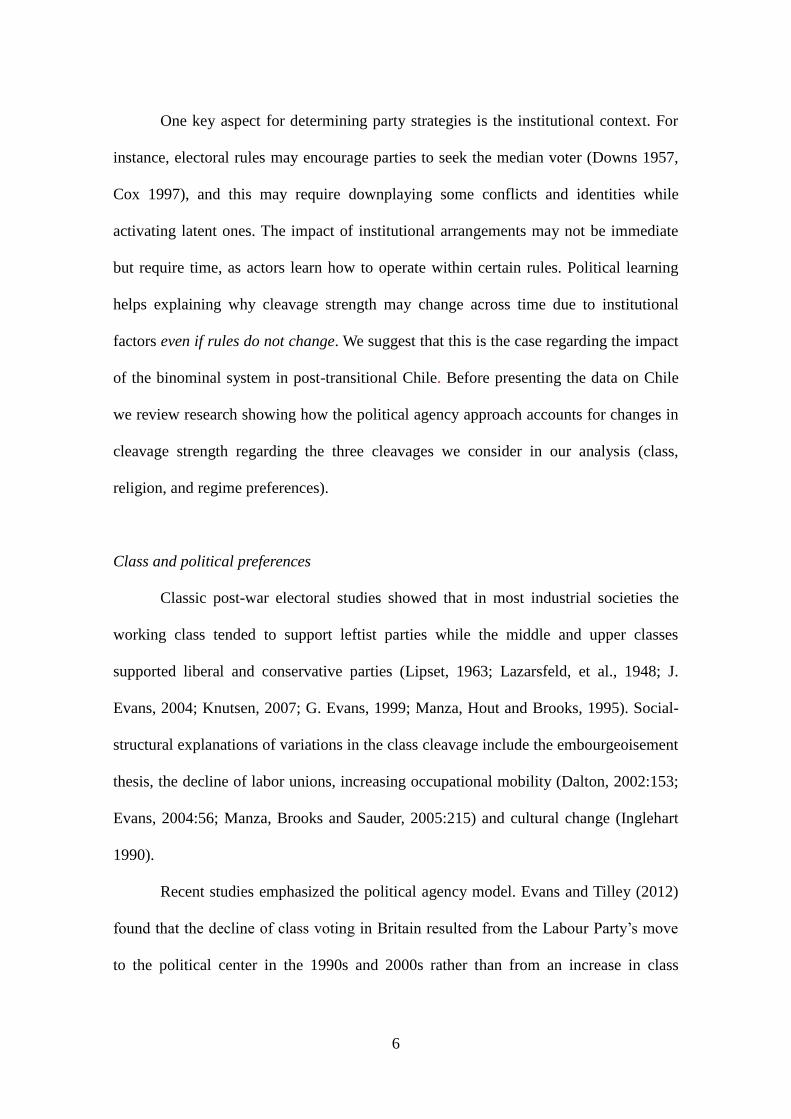
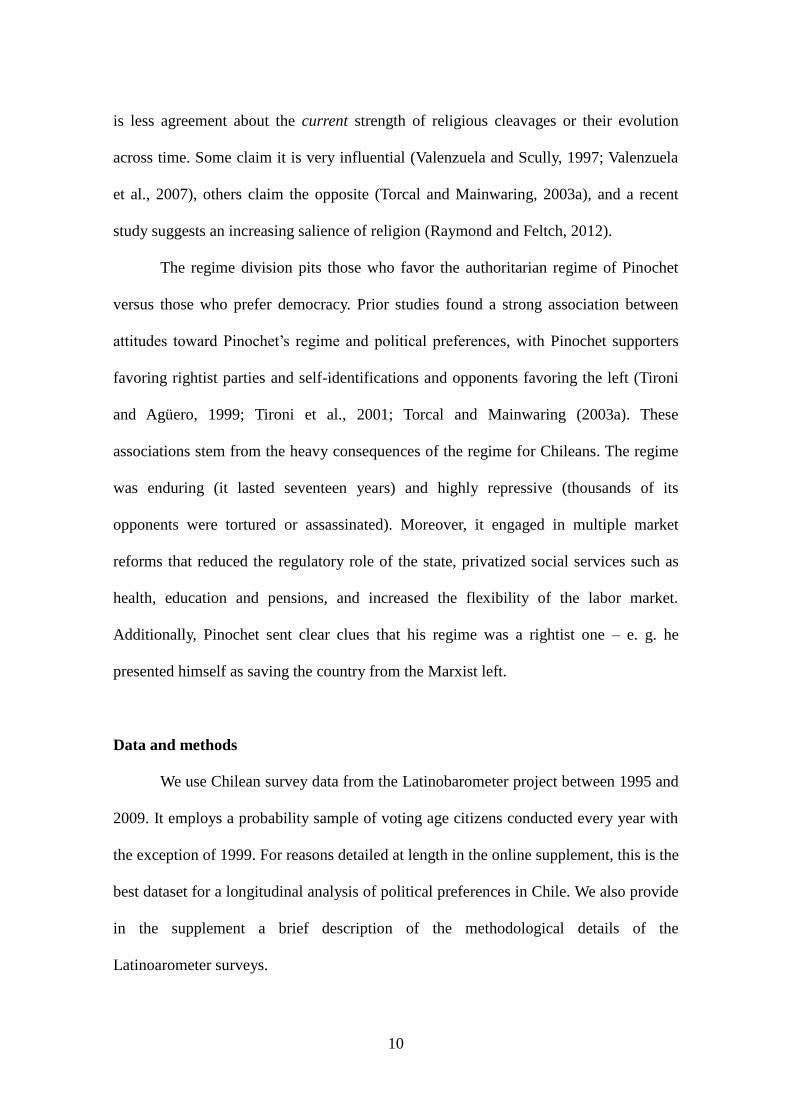
The evolution of the socioeconomic indicators is shown on Figure 2. It shows,
during the last few years, a simultaneous modest increase in the magnitude of the
marginal effect of the household goods index and a sharp decrease in the marginal effect
of education. The decrease of this last variable has been relatively systematic from 1998
up to the most recent survey, but sharpens after the 2004 survey, though the 2007 survey
registers a small recovery. Note that in the last survey the marginal effect of education
is not only non-significant, but also the point estimate is very close to zero. This sharp
decline is preceded by four years of a relatively stable and significant estimate (2000 to
2004), which in turn is preceded by a more unstable period that registers a very sharp
5 Given that in our specification the cleavage variables appear both in the selection and outcome
equations, the marginal effect of each covariate does not correspond to its coefficient in the outcome
equations (as in linear regression). Instead, each independent variable has a direct effect captured through
its respective parameter in the outcome equation, and an indirect effect captured through it estimated
parameter the selection equation. Formally the marginal for each independent variable k corresponds to:
where and are the parameters from the outcome and selection equations, respectively, is the
correlation between the errors of the outcome and selection equations, and where is
the inverse Mills ratio and is the linear predictor of the probit selection equation. See Green
(2003:783) for the full derivation. The marginal effects shown in figures 2 through 4 are calculated for a
“average” survey respondent who is male, between 36 and 45 years old, Catholic, chooses the
“democracy is always preferable” option, and has a sample average value on education, the household
goods index, and interest in politics. The confidence intervals of each figure are normal-theory intervals
estimated using 1,000 samples from non-parametric bootstrapping simulation.
17
increase of the association between education and self-location on the political scale. In
contrast to this movement, the marginal effect of the household good index registers a
weak but stable decrease during the first eight years of available data (and significant
only in some occasions). After this the trend reverses, and from 2004 onwards the
marginal effect becomes larger year after year. Its marginal effect becomes significant in
the 2009 survey.
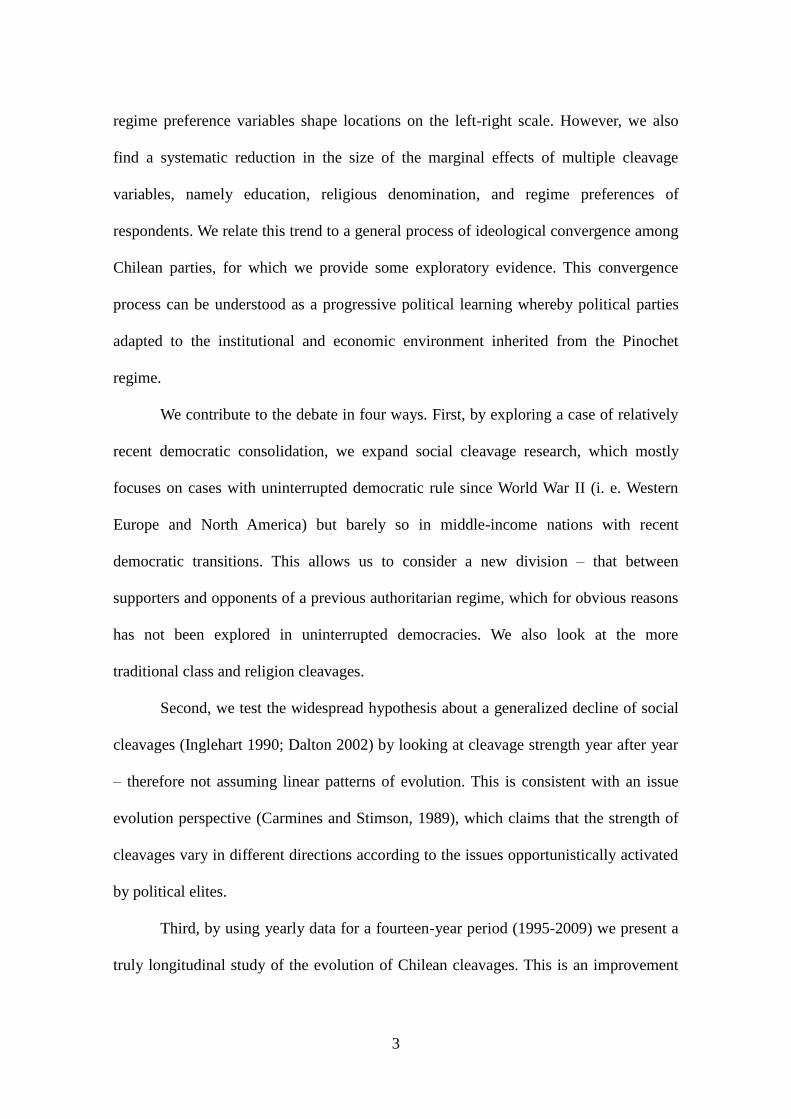
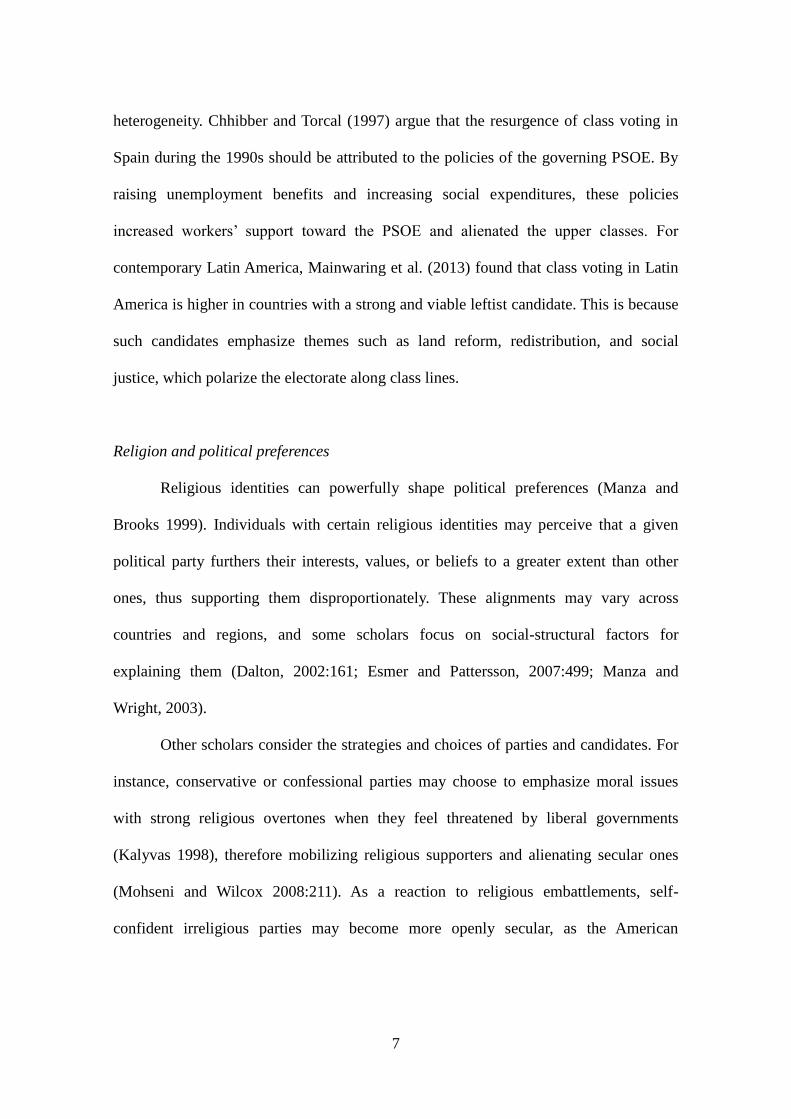
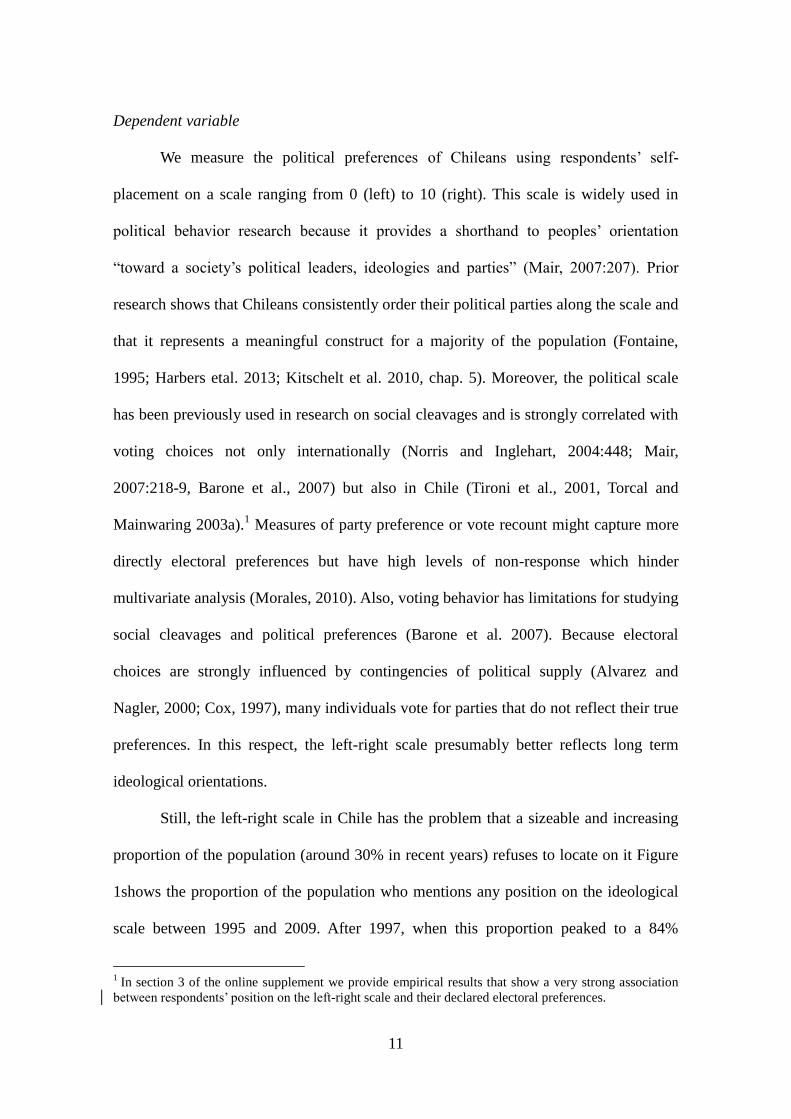
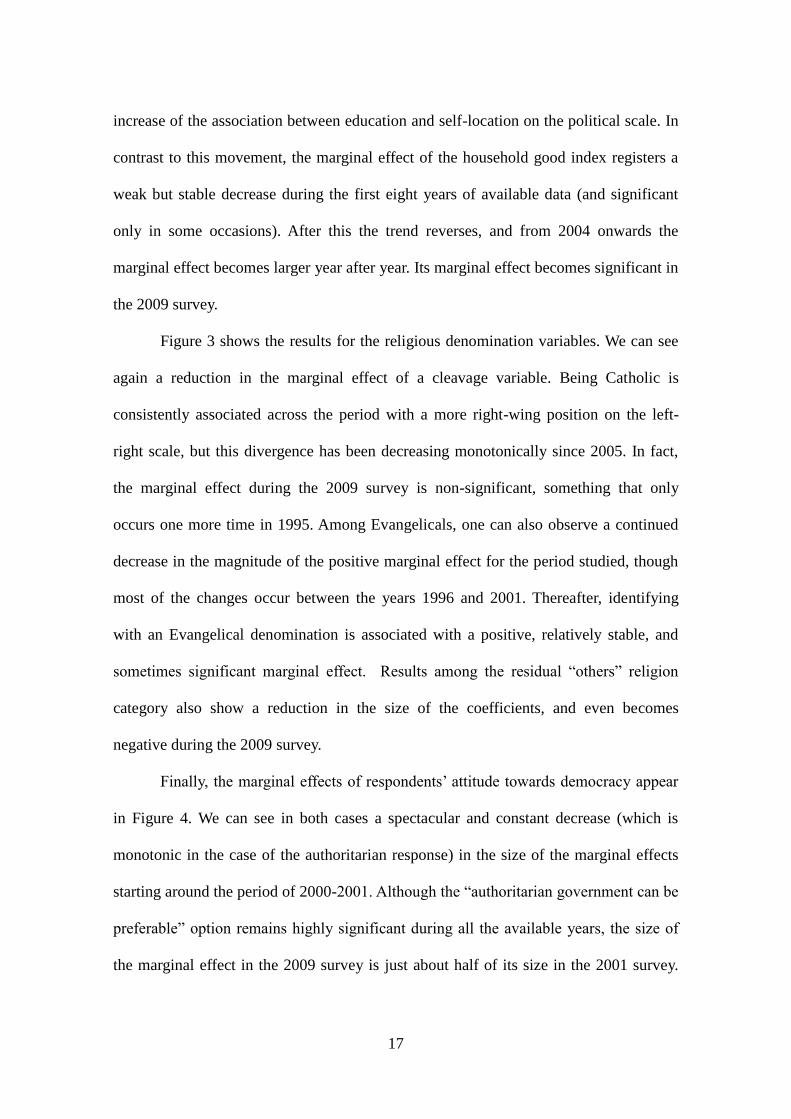
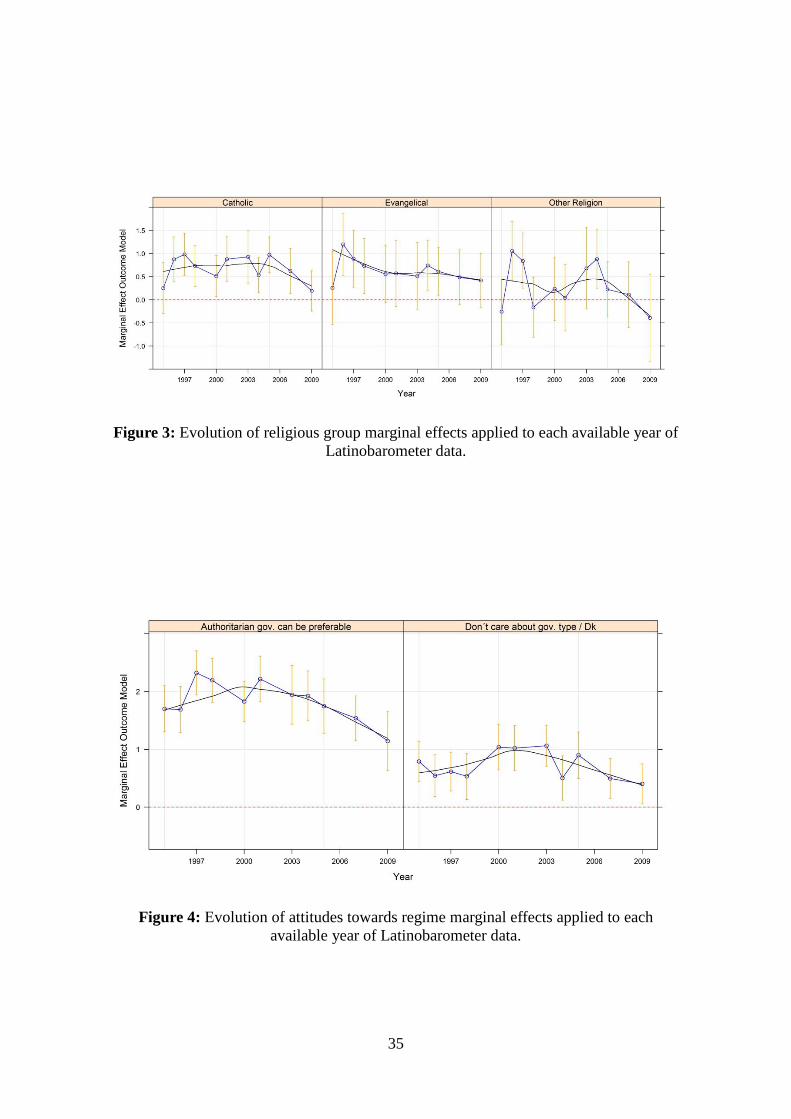
Figure 3 shows the results for the religious denomination variables. We can see
again a reduction in the marginal effect of a cleavage variable. Being Catholic is
consistently associated across the period with a more right-wing position on the left-
right scale, but this divergence has been decreasing monotonically since 2005. In fact,
the marginal effect during the 2009 survey is non-significant, something that only
occurs one more time in 1995. Among Evangelicals, one can also observe a continued
decrease in the magnitude of the positive marginal effect for the period studied, though
most of the changes occur between the years 1996 and 2001. Thereafter, identifying
with an Evangelical denomination is associated with a positive, relatively stable, and
sometimes significant marginal effect. Results among the residual “others” religion
category also show a reduction in the size of the coefficients, and even becomes
negative during the 2009 survey.
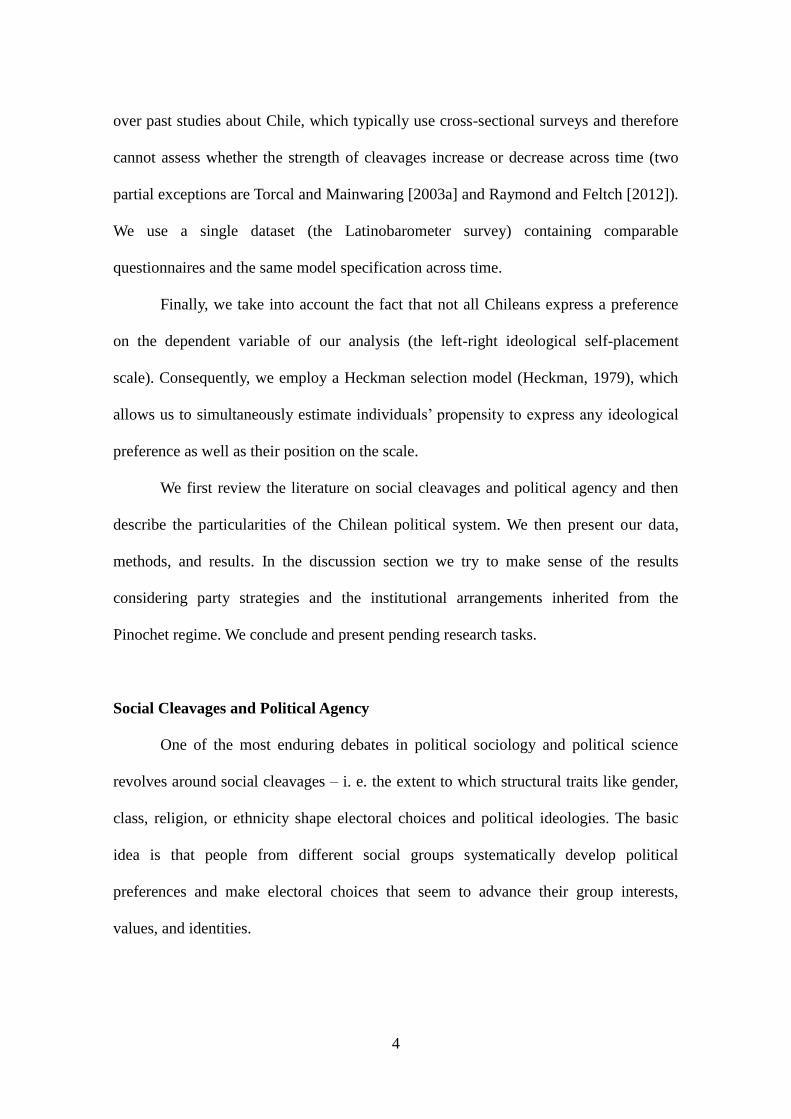
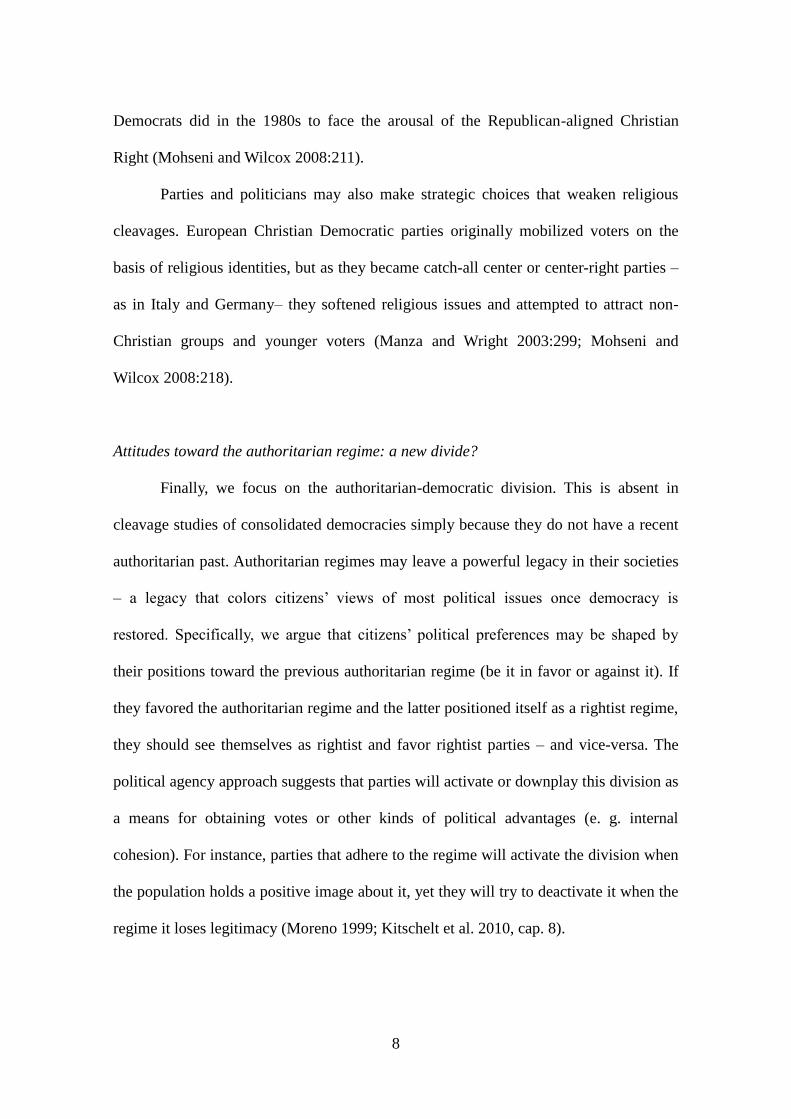
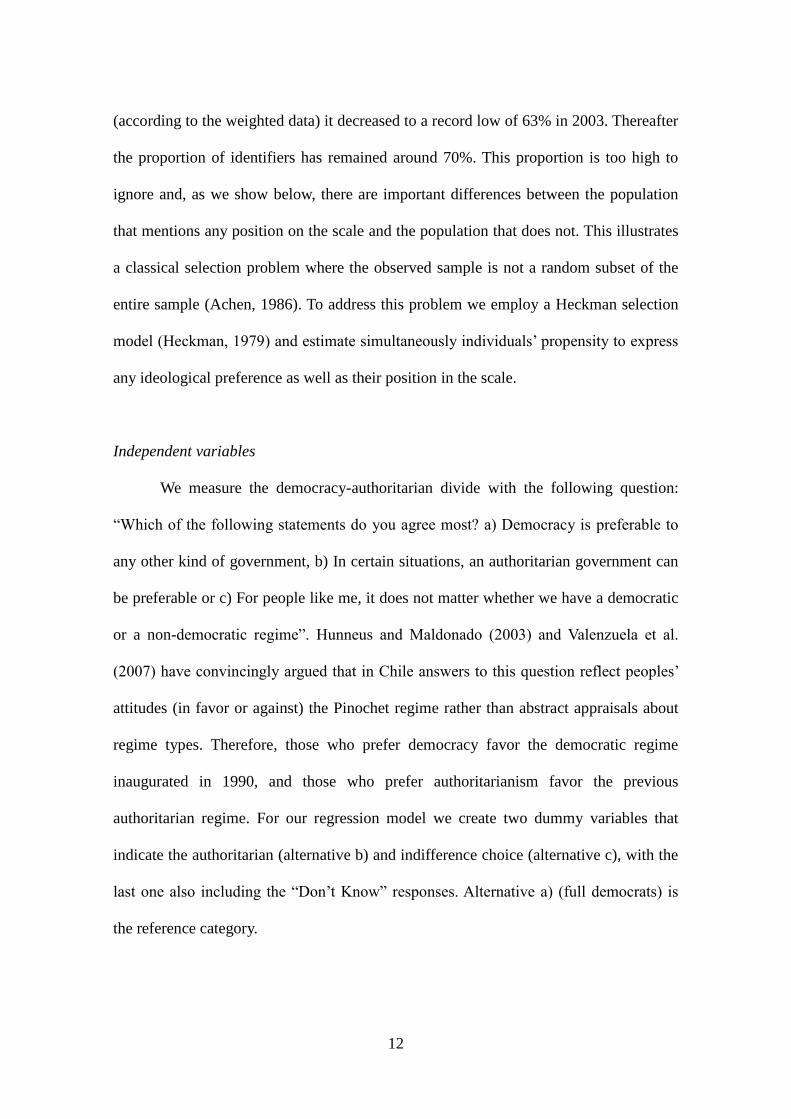
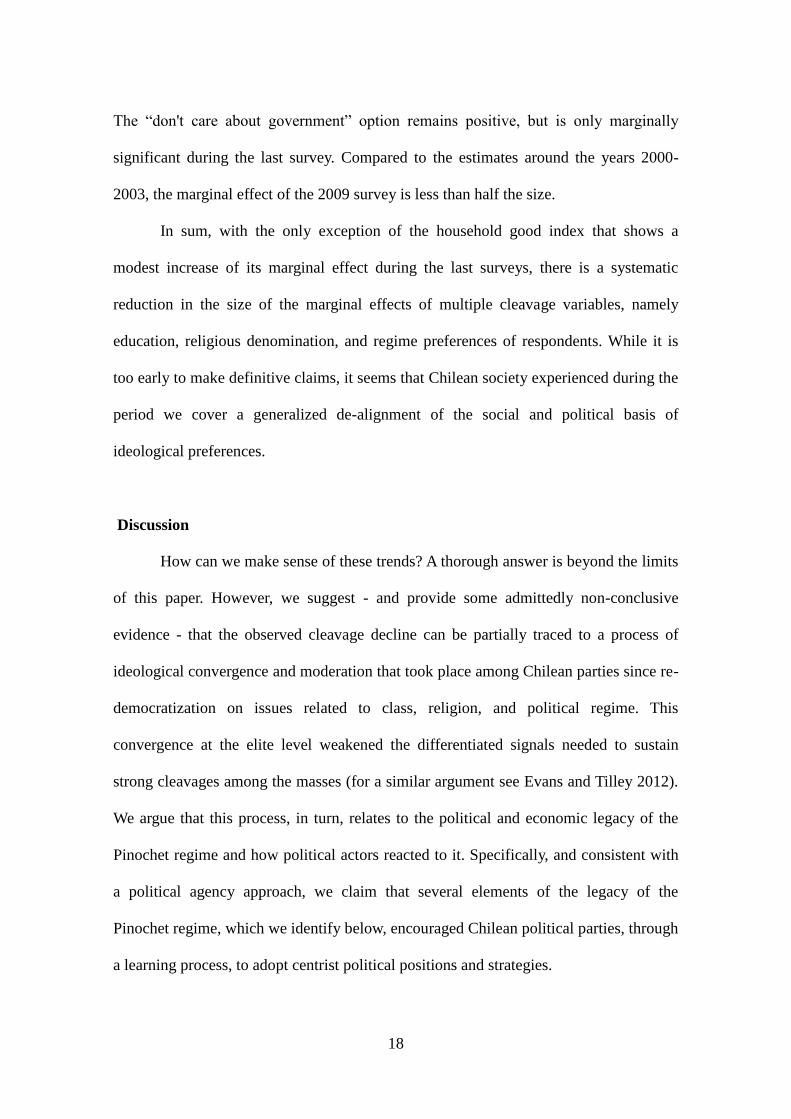
Finally, the marginal effects of respondents’ attitude towards democracy appear
in Figure 4. We can see in both cases a spectacular and constant decrease (which is
monotonic in the case of the authoritarian response) in the size of the marginal effects
starting around the period of 2000-2001. Although the “authoritarian government can be
preferable” option remains highly significant during all the available years, the size of
the marginal effect in the 2009 survey is just about half of its size in the 2001 survey.
18
The “don't care about government” option remains positive, but is only marginally
significant during the last survey. Compared to the estimates around the years 2000-
2003, the marginal effect of the 2009 survey is less than half the size.
In sum, with the only exception of the household good index that shows a
modest increase of its marginal effect during the last surveys, there is a systematic
reduction in the size of the marginal effects of multiple cleavage variables, namely
education, religious denomination, and regime preferences of respondents. While it is
too early to make definitive claims, it seems that Chilean society experienced during the
period we cover a generalized de-alignment of the social and political basis of
ideological preferences.
Discussion
How can we make sense of these trends? A thorough answer is beyond the limits
of this paper. However, we suggest - and provide some admittedly non-conclusive
evidence - that the observed cleavage decline can be partially traced to a process of
ideological convergence and moderation that took place among Chilean parties since re-
democratization on issues related to class, religion, and political regime. This
convergence at the elite level weakened the differentiated signals needed to sustain
strong cleavages among the masses (for a similar argument see Evans and Tilley 2012).
We argue that this process, in turn, relates to the political and economic legacy of the
Pinochet regime and how political actors reacted to it. Specifically, and consistent with
a political agency approach, we claim that several elements of the legacy of the
Pinochet regime, which we identify below, encouraged Chilean political parties, through
a learning process, to adopt centrist political positions and strategies.
19
Evidence of ideological convergence among Chilean political parties comes
from the Political Elites in Latin America (PELA) parliamentary survey (see
http://americo.usal.es/oir/elites/index.htm). This project surveyed Chilean deputies in
four occasions during the period under study (1993, 1998, 2002, and 2006). For tapping
the socio economic cleavage we consider a question about the socioeconomic model
that should prevail in society. Each interviewed congressman was asked to locate their
opinion on a 5-point scale in which 1 equals "would privatize all public services" and 5
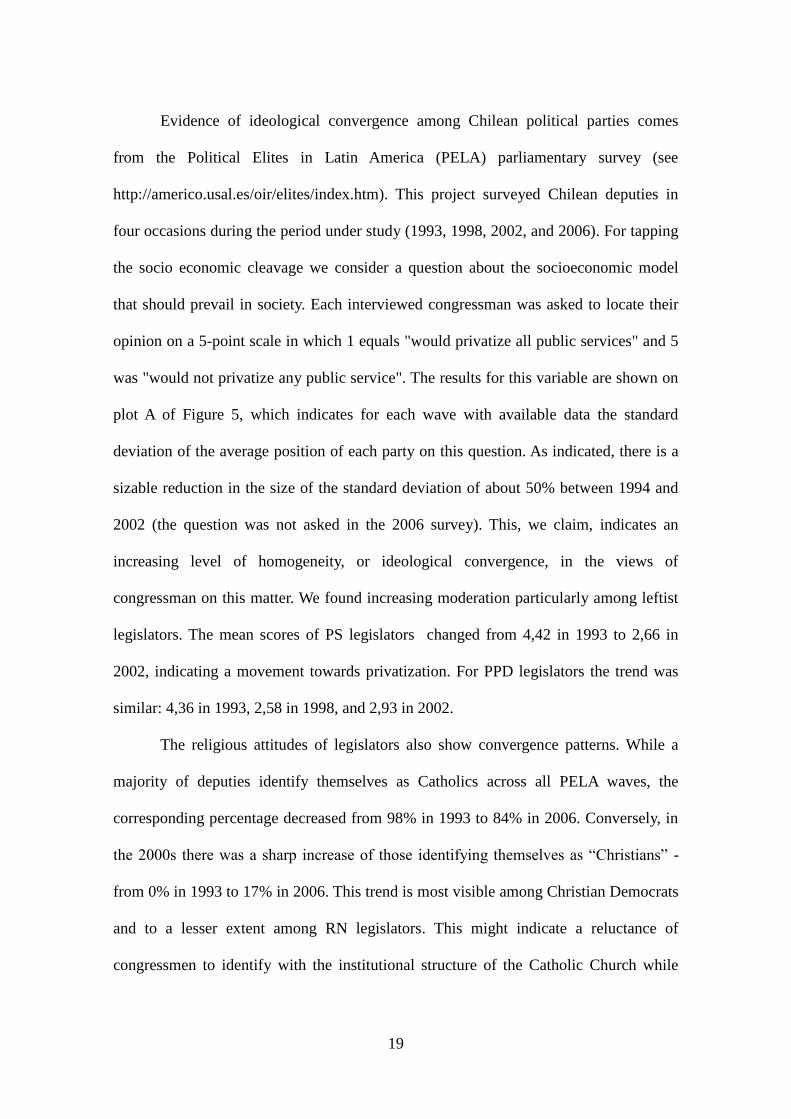
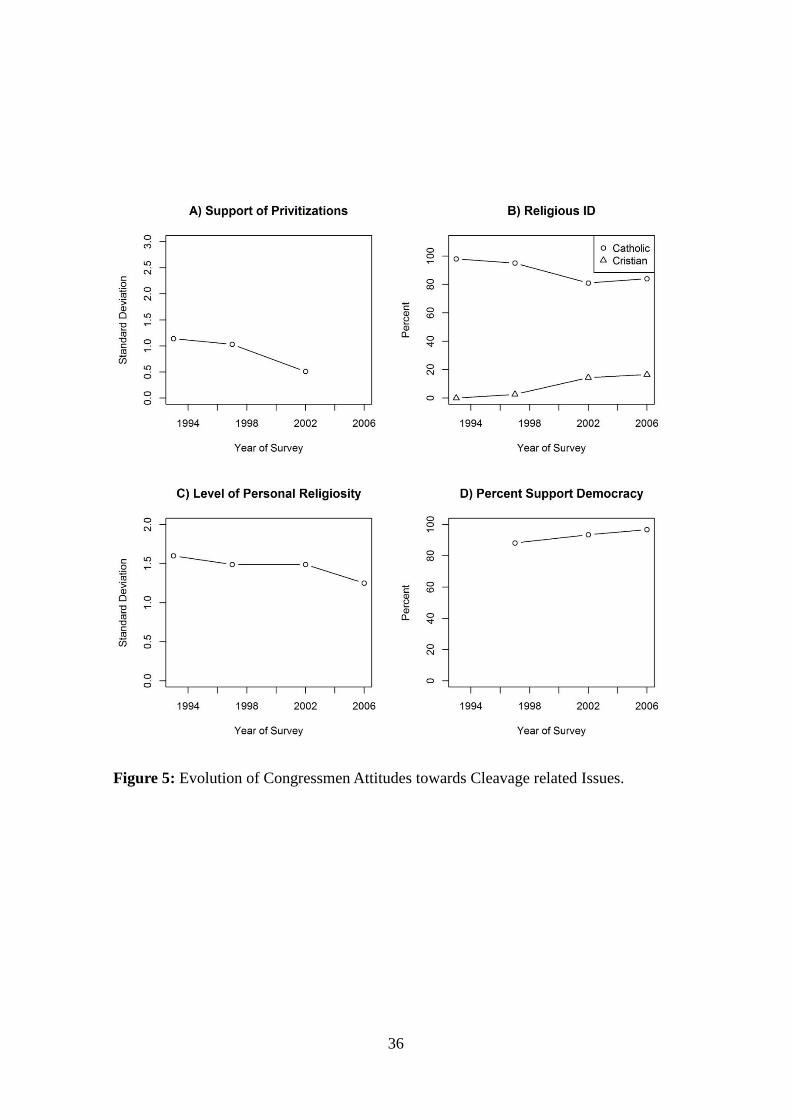
was "would not privatize any public service". The results for this variable are shown on
plot A of Figure 5, which indicates for each wave with available data the standard
deviation of the average position of each party on this question. As indicated, there is a
sizable reduction in the size of the standard deviation of about 50% between 1994 and
2002 (the question was not asked in the 2006 survey). This, we claim, indicates an
increasing level of homogeneity, or ideological convergence, in the views of
congressman on this matter. We found increasing moderation particularly among leftist
legislators. The mean scores of PS legislators changed from 4,42 in 1993 to 2,66 in
2002, indicating a movement towards privatization. For PPD legislators the trend was
similar: 4,36 in 1993, 2,58 in 1998, and 2,93 in 2002.
The religious attitudes of legislators also show convergence patterns. While a
majority of deputies identify themselves as Catholics across all PELA waves, the
corresponding percentage decreased from 98% in 1993 to 84% in 2006. Conversely, in
the 2000s there was a sharp increase of those identifying themselves as “Christians” -
from 0% in 1993 to 17% in 2006. This trend is most visible among Christian Democrats
and to a lesser extent among RN legislators. This might indicate a reluctance of
congressmen to identify with the institutional structure of the Catholic Church while
20
still maintaining a diffuse link with religion. There is also evidence of convergence on
religiosity. According to the PELA survey, the standard deviation of party means in a
question about personal religiosity (where 1=minimum and 10=maximum) decreased
steadily across time, indicating lower religious polarization, as shown on plot C of
Figure 5.
Lastly, changes in attitudes toward democracy among legislators are also
consistent with the decline of the regime divide at the mass level. The percentage of
Chilean legislators agreeing with the sentence “Democracy is better than any other form
of government” increased across time from 84% in 1997 to 96% in 2006 (question not
asked in 1993). This change resulted from an increasing valuation of democracy by RN
and UDI legislators - all Concertación legislators chose the democratic option in the
three survey waves. As legislators achieved a near consensus regarding democracy,
there was little room for activating the political regime divide; elite politics was less
capable of “feeding” this divide at the mass level.
The Pinochet legacy and political learning
How can we explain this apparent process of ideological convergence and
moderation among political elites? No doubt that many factors matter, including social-
structural trends. Increasing secularization and religious pluralism, as well as rising
levels of economic wealth, have perhaps undermined the politicization of identities
along religious and socio-economic lines. However, we believe there is a more
immediate factor, namely, the political and economic legacy of the Pinochet regime, and
particularly, the set of incentives around which political competition was structured.
Importantly, the adaptation to this new setting did not happen overnight but through a
21
process of political learning across the 1990s and 2000s. Much of the timing of the
results shown above is relatively consistent with this perspective.
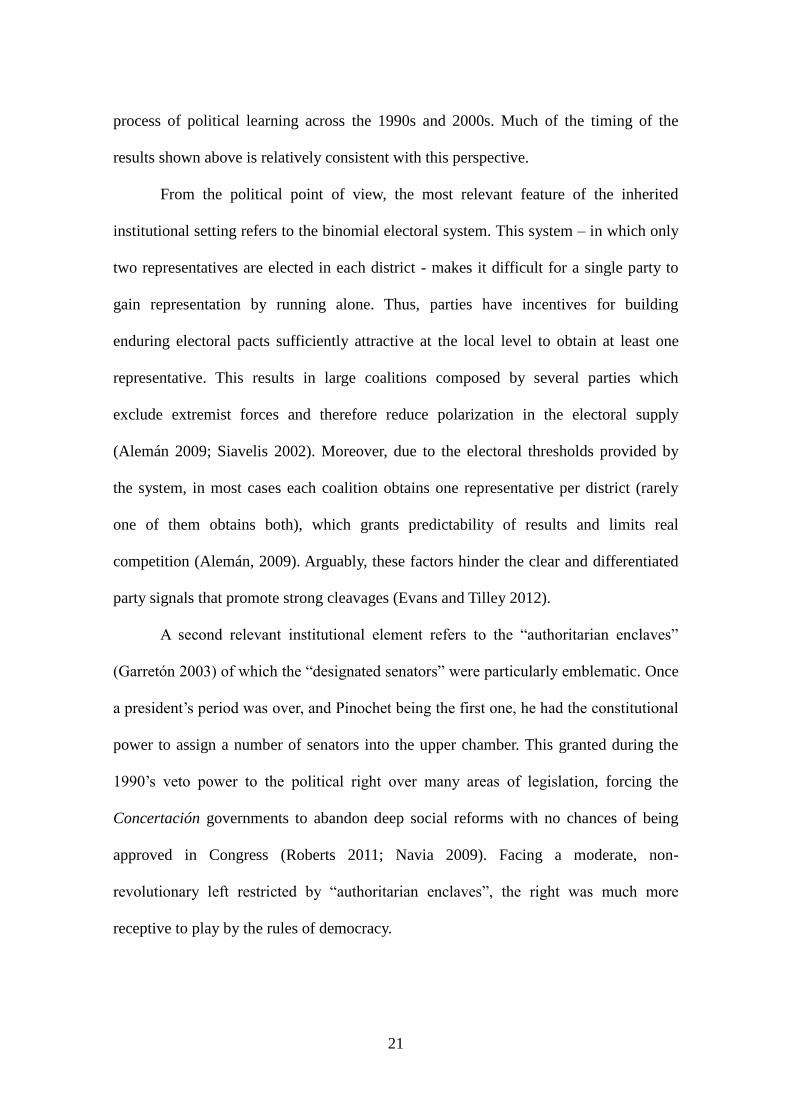
From the political point of view, the most relevant feature of the inherited
institutional setting refers to the binomial electoral system. This system – in which only
two representatives are elected in each district - makes it difficult for a single party to
gain representation by running alone. Thus, parties have incentives for building
enduring electoral pacts sufficiently attractive at the local level to obtain at least one
representative. This results in large coalitions composed by several parties which
exclude extremist forces and therefore reduce polarization in the electoral supply
(Alemán 2009; Siavelis 2002). Moreover, due to the electoral thresholds provided by
the system, in most cases each coalition obtains one representative per district (rarely
one of them obtains both), which grants predictability of results and limits real
competition (Alemán, 2009). Arguably, these factors hinder the clear and differentiated
party signals that promote strong cleavages (Evans and Tilley 2012).
A second relevant institutional element refers to the “authoritarian enclaves”
(Garretón 2003) of which the “designated senators” were particularly emblematic. Once
a president’s period was over, and Pinochet being the first one, he had the constitutional
power to assign a number of senators into the upper chamber. This granted during the
1990’s veto power to the political right over many areas of legislation, forcing the
Concertación governments to abandon deep social reforms with no chances of being
approved in Congress (Roberts 2011; Navia 2009). Facing a moderate, non-
revolutionary left restricted by “authoritarian enclaves”, the right was much more
receptive to play by the rules of democracy.
22
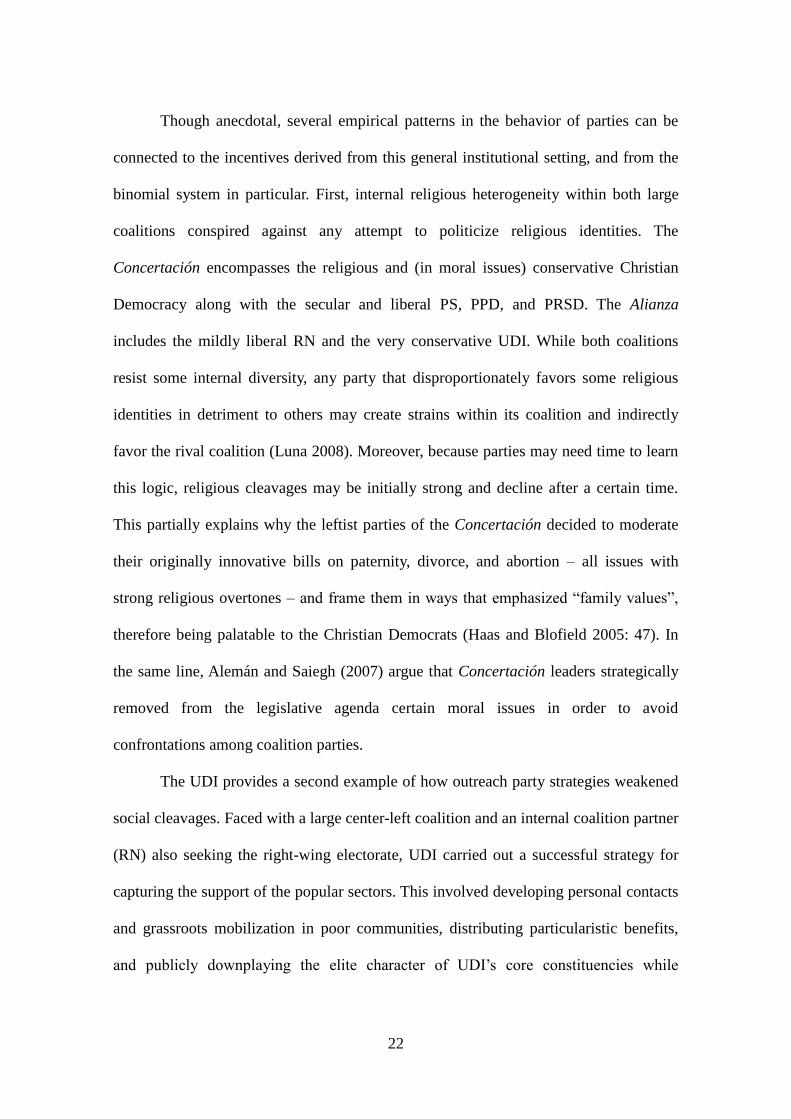
Though anecdotal, several empirical patterns in the behavior of parties can be
connected to the incentives derived from this general institutional setting, and from the
binomial system in particular. First, internal religious heterogeneity within both large
coalitions conspired against any attempt to politicize religious identities. The
Concertación encompasses the religious and (in moral issues) conservative Christian
Democracy along with the secular and liberal PS, PPD, and PRSD. The Alianza
includes the mildly liberal RN and the very conservative UDI. While both coalitions
resist some internal diversity, any party that disproportionately favors some religious
identities in detriment to others may create strains within its coalition and indirectly
favor the rival coalition (Luna 2008). Moreover, because parties may need time to learn
this logic, religious cleavages may be initially strong and decline after a certain time.
This partially explains why the leftist parties of the Concertación decided to moderate
their originally innovative bills on paternity, divorce, and abortion – all issues with
strong religious overtones – and frame them in ways that emphasized “family values”,
therefore being palatable to the Christian Democrats (Haas and Blofield 2005: 47). In
the same line, Alemán and Saiegh (2007) argue that Concertación leaders strategically
removed from the legislative agenda certain moral issues in order to avoid
confrontations among coalition parties.
The UDI provides a second example of how outreach party strategies weakened
social cleavages. Faced with a large center-left coalition and an internal coalition partner
(RN) also seeking the right-wing electorate, UDI carried out a successful strategy for
capturing the support of the popular sectors. This involved developing personal contacts
and grassroots mobilization in poor communities, distributing particularistic benefits,
and publicly downplaying the elite character of UDI’s core constituencies while
23
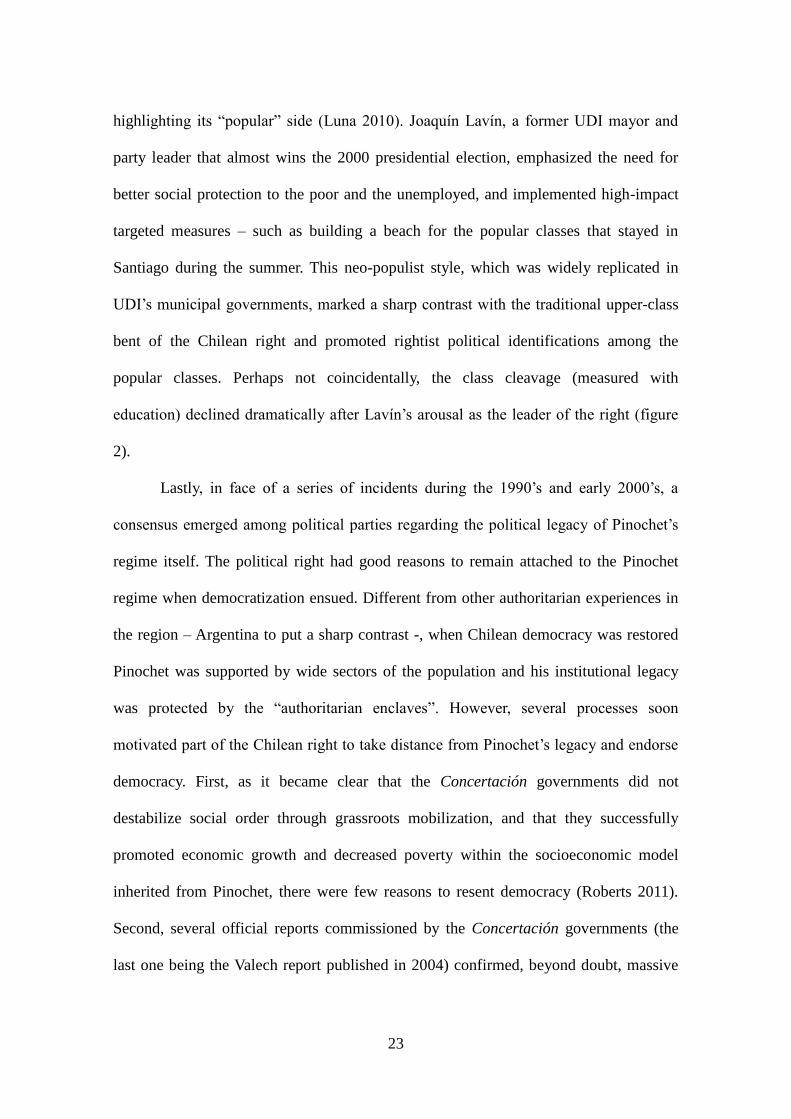
highlighting its “popular” side (Luna 2010). Joaquín Lavín, a former UDI mayor and
party leader that almost wins the 2000 presidential election, emphasized the need for
better social protection to the poor and the unemployed, and implemented high-impact
targeted measures – such as building a beach for the popular classes that stayed in
Santiago during the summer. This neo-populist style, which was widely replicated in
UDI’s municipal governments, marked a sharp contrast with the traditional upper-class
bent of the Chilean right and promoted rightist political identifications among the
popular classes. Perhaps not coincidentally, the class cleavage (measured with
education) declined dramatically after Lavín’s arousal as the leader of the right (figure
2).
Lastly, in face of a series of incidents during the 1990’s and early 2000’s, a
consensus emerged among political parties regarding the political legacy of Pinochet’s
regime itself. The political right had good reasons to remain attached to the Pinochet
regime when democratization ensued. Different from other authoritarian experiences in
the region – Argentina to put a sharp contrast -, when Chilean democracy was restored
Pinochet was supported by wide sectors of the population and his institutional legacy
was protected by the “authoritarian enclaves”. However, several processes soon
motivated part of the Chilean right to take distance from Pinochet’s legacy and endorse
democracy. First, as it became clear that the Concertación governments did not
destabilize social order through grassroots mobilization, and that they successfully
promoted economic growth and decreased poverty within the socioeconomic model
inherited from Pinochet, there were few reasons to resent democracy (Roberts 2011).
Second, several official reports commissioned by the Concertación governments (the
last one being the Valech report published in 2004) confirmed, beyond doubt, massive
24
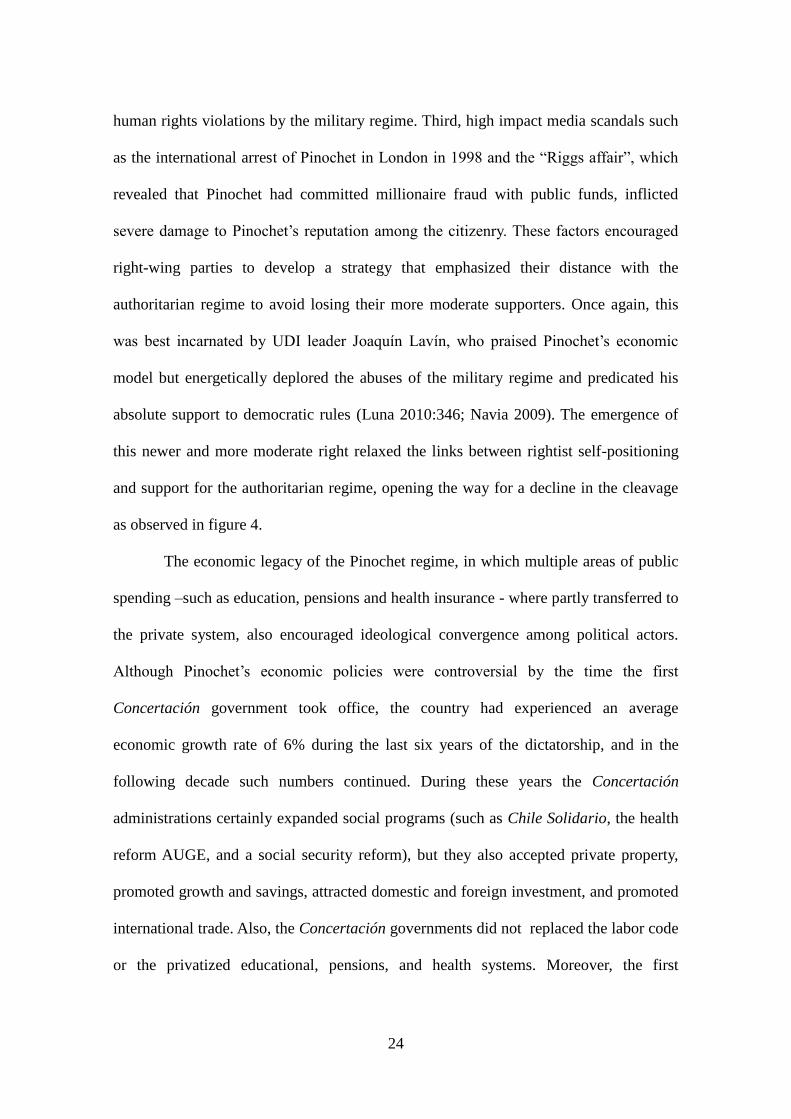
human rights violations by the military regime. Third, high impact media scandals such
as the international arrest of Pinochet in London in 1998 and the “Riggs affair”, which
revealed that Pinochet had committed millionaire fraud with public funds, inflicted
severe damage to Pinochet’s reputation among the citizenry. These factors encouraged
right-wing parties to develop a strategy that emphasized their distance with the
authoritarian regime to avoid losing their more moderate supporters. Once again, this
was best incarnated by UDI leader Joaquín Lavín, who praised Pinochet’s economic
model but energetically deplored the abuses of the military regime and predicated his
absolute support to democratic rules (Luna 2010:346; Navia 2009). The emergence of
this newer and more moderate right relaxed the links between rightist self-positioning
and support for the authoritarian regime, opening the way for a decline in the cleavage
as observed in figure 4.
The economic legacy of the Pinochet regime, in which multiple areas of public
spending –such as education, pensions and health insurance - where partly transferred to
the private system, also encouraged ideological convergence among political actors.
Although Pinochet’s economic policies were controversial by the time the first
Concertación government took office, the country had experienced an average
economic growth rate of 6% during the last six years of the dictatorship, and in the
following decade such numbers continued. During these years the Concertación
administrations certainly expanded social programs (such as Chile Solidario, the health
reform AUGE, and a social security reform), but they also accepted private property,
promoted growth and savings, attracted domestic and foreign investment, and promoted
international trade. Also, the Concertación governments did not replaced the labor code
or the privatized educational, pensions, and health systems. Moreover, the first
25
Concertación government with a socialist president, Ricardo Lagos, eased regulations
on private companies, increased private participation in mining and infrastructure
projects, and signed free trade agreements with the US and the European Union.
These examples clearly indicate that the Chilean left, particularly the Socialist
Party, abandoned their historical preferences towards radical socio-economic reform and
accepted the market-centered model of society imposed by Pinochet (Siavelis, 200),
though, of course, with important corrections. This process of political learning
ultimately undermined upper classes’ fear toward the left and weakened the link
between the left and the popular classes. Moreover, this helps understanding why, in a
national survey carried out in late 2005. almost half of those respondents self-identified
with the right or center-right approved Lagos’ performance (Navia 2009). In fact, as
with Lavín, it was during the Lagos administration that the class cleavage declined
most.
Conclusions
Past research on social cleavages and politics in Chile revolved around
the debate between the role of social categories (e. g. class and religion) versus that of
political divisions (such as attitudes in favor or against the Pinochet regime). Yet
because such research was based on cross-sectional data for one or at most two years
(Raymond and Feltch, 2012 for a notable exception), we did not know whether the
effect of cleavages changed across time. Using yearly surveys for the 1995-2009 period,
we found a generalized process of dealignment. We show that the effect of the division
between those favoring and those opposing democracy dwindled too. Interestingly, our
26
household goods index goes against this pattern and becomes more important as a
predictor of political preferences from 2004 onwards.
We provided some preliminary evidence indicating that cleavage decline is
paralleled by a process of ideological convergence and moderation among Chilean
parties that weakened the differentiated signals needed to sustain strong cleavages
among the masses. We also argue that this process can be understood as a progressive
political learning dynamic whereby political parties’ adapted to the institutional and
economic environment inherited from the Pinochet regime.
Of course, more research must be done before we reach firmer conclusions. For
instance, a comprehensive assessment of the class cleavage will require more refined
measures, particularly empirical operationalizations of class position based on
occupational categories such as those used in the social stratification literature (for
examples see Nieuwbeerta, 1995, Manza and Brooks, 1999, and Evans and Tilley,
2012). Also, the religious factor merits more research – for instance by including
indicators of public and private religiosity that cut across religious denominations.
27
References
Achen CH (1986) The Statistical Analysis of Quasi-Experiments. Berkeley, CA:
University of California Press.
Agüero F Tironi E Valenzuela E and Sunkel G (1998) Votantes, partidos e información
política: La frágil intermediación política en el Chile post-autoritario. Revista de
Ciencia Política 19:159-193.
Alemán E (2008) Policy positions in the Chilean senate: An analysis of coauthorship
and roll call data. Brazilian Political Science Review 2:74-92.
Alemán E (2009) Institutions, Political conflict and the cohesion of policy networks in
the Chilean congress, 1961–2006. Journal of Latin American Studies 41: 467–
491.
Alemán E and Saiegh SM (2007) Legislative preferences, political parties, and coalition
unity in Chile. Comparative Politics 39: 253-272.
Alvarez RM and Katz G (2009) Structural cleavages, electoral competition and partisan
divide: A Bayesian multinomial probit analysis of Chile's 2005 election. Electoral
Studies 28: 177-189.
Alvarez RM and Nagler J (2000) A new approach for modeling strategic voting in
multiparty elections. British Journal of Political Science 30: 57-75.
Bonilla, CA, RE Carlin, GJ Love and ES Méndez (2011) Social or Political Cleavages?
A Spatial Analysis of the Party System in Post-Authoritarian Chile. Public Choice
146: 9-21.
Blofield M and Haas L (2005) Defining a Democracy: Reforming the Laws on
Women's Rights in Chile, 1990-2002. Latin American Politics and Society 47: 35-
68.
28
Carmines EG, and Stimson JA (1989) Issue Evolution: Race and the Transformation of
American Politics. Princeton, NJ: Princeton University Press.
Chhibber P & Torcal M (1997). Elite Strategy, Social Cleavages, and Party Systems in a
New Democracy Spain. Comparative Political Studies, 30(1), 27-54.
Cox GW (1997) Making Votes Count: Strategic Coordination in the World's Electoral
Systems. New York, NY: Cambridge University Press.
Dalton RJ (2002) Citizen Politics: Public Opinion and Political Parties in Advanced
Industrial Democracies. Chatham, NJ: Chatham House.
Dix RH (1989) Cleavage structures and party systems in Latin America. Comparative
Politics 22: 23-37.
Downs A (1957). An Economic Theory of Democracy. Addison-Wesley Publishing
Company.
Enyedi Z (2005). The role of agency in cleavage formation. European Journal of
Political Research, 44(5), 697-720.
Evans G (1999) The End of Class Politics? Class Voting in Comparative Context.
Oxford: Oxford University Press.
Evans G and Tilley J (2012) How parties shape class politics: Explaining the decline of
the class basis of party support. British Journal of Political Science 42:137-161.
Evans J (2004) Voters & Voting: An introduction. London; Thousand Oaks, CA: Sage.
Fontaine A (1995) Significado del eje derecha-izquierda. Revista de Estudios Públicos
58: 79-135.
Garretón, MA (2003). Incomplete Democracy: Political Democratization in Chile and
Latin America. UNC Press.
29
Heckman JJ (1979) Sample selection bias as a specification error. Econometrica 47:
153-161.
Haas L and Blofield MH (2005). Defining a democracy: Reforming the laws on
women’s rights in Chile, 1990-2002. Latin American Politics & Society 47: 35-68
Hetherington MJ (2001) Resurgent mass partisanship: The role of elite polarization. The
American Political Science Review, 95: 619–631.
Hunneus C and Maldonado L (2003) Demócratas y nostálgicos del antiguo régimen.
Los apoyos a la democracia en Chile. Revista Española de Investigaciones
Sociológicas 120: 9-49.
Inglehart R (1977). The Silent Revolution. Princeton: Princeton University Press.
Inglehart R (1990) Culture Shift in Advanced Industrial Society. Princeton: Princeton
University Press.
Kalyvas SN (1998) From pulpit to party: party formation and the Christian Democratic
phenomenon. Comparative Politics, 30: 293–312.
Kitschelt H, Hawkins KA, Luna J P, Rosas, G and Zechmeister EJ (2010) Latin
American Party Systems. Cambridge University Press.
Kriesi H (1998) The transformation of cleavage politics: the 1997 Stein Rokkan
lecture. European Journal of Political Research, 33: 165–185.
Knutsen O (2007) The decline of social class? In: Dalton R and Klingemann HD (eds)
The Oxford Handbook of Political Behavior, Oxford University Press, pp. 457–
480.
Lazarsfeld P, Berelson B and Gaudet H (1948) The People's Choice: How The Voter
Makes Up His Mind in a Presidential Campaign. New York: Columbia University
Press
30
Lipset, SM (1963) Political Man: The Social Bases Of Politics. Anchor Books.
Lipset, SM and Rokkan S (1967) Cleavage structures, party systems, and voter
alignments: An introduction. In: Lipset SM and Rokkan S (eds) Party Systems and
Voter Alignments: Cross-National Perspectives, New York: Free Press, pp. 1-64.
Luna JP (2008) Partidos políticos y sociedad en Chile. Trayectoria histórica y
mutaciones recientes In: Fontaine A, Larroulet C, Navarrete J and Walker I (eds)
Reforma de los Partidos Políticos en Chile, Santiago: PNUD, CEP y Cieplan, pp.
75-124.
Luna JP (2010) Segmented party voter linkages in Latin America: The case of the UDI.
Journal of Latin American Studies 42: 325-56.
Mainwaring S and Scully T (1995). Building Democratic Institutions: Party Systems in
Latin America. Stanford, CA: Stanford University Press.
Mainwaring S, Torcal M and Somma NM (2013) The Left and the Mobilization of
Class Voting in Latin America. Unpublished manuscript.
Mair P (2007) Left-right orientations? In: Dalton R and Klingemann HD (eds) The
Oxford Handbook of Political Behavior, Oxford University Press, pp. 206-222.
Manza J, Brooks C and Sauder M (2005) Money, Participation, and Votes: Social
Cleavages and Electoral Politics. In: Janoski T et al. (eds), Handbook of Political
Sociology, New York: Cambridge University Press, pp. 201-226.
Manza J and Brooks C (1999) Social Cleavages and Political Change: Voter Alignments
and US Party Coalitions. New York: Oxford University Press.
Manza J and Wright N (2003) Religion and political behavior In: Dillon M (eds)
Handbook of the Sociology of Religion, New York: Cambridge University Press,
pp. 297-314.
31
Manza J, Hout M and Brooks C (1995) Class voting in capitalist democracies since
World War II: Dealigment, realigment, or trendless fluctuation? Annual Review of
Sociology 21: 137-162.
Mohseni P and Wilcox C (2007) Religion and political parties In: Haynes J (eds),
Handbook of Religion & Politics, London: Routledge, pp. 211-230
Morales M (2010) Disolución de la identificación partidaria en Chile. Documento de
Trabajo Encuesta Nacional UDP, Universidad Diego Portales.
Moreno AM (1999). Political Cleavages: Issues, Parties, and the Consolidation of
Democracy. Westview Press Inc.
Navia P (2009) The Chilean Left: Socialist and neoliberal In Burdick J, Oxhorn P, and
Roberts, KM (eds). Beyond Neoliberalism in Latin America? Societies and
Politics at the Crossroads. Palgrave Macmillan, pp. 17-41.
Nieuwbeerta P (1995) The Democratic Class Struggle in Twenty Countries, 1956-1990.
Amsterdam: Thesis Publishers.
Norris P and Inglehart R (2004) Sacred and Secular: Religion and Politics Worldwide.
New York: Cambridge University Press.
Ortega Frei E (2003) Los partidos políticos chilenos: Cambio y estabilidad en el
comportamiento electoral 1990-2000. Revista de Ciencia Política, 23(2): 109-147.
Posner D N (2004) The political salience of cultural difference: Why Chewas and
Tumbukas are allies in Zambia and adversaries in Malawi. American Political
Science Review 98: 529-545.
Przeworski A & Sprague JD (1986). Paper Stones: A History of Electoral Socialism.
Chicago: University of Chicago Press.
32
Raymond C and Barros Feltch BM (2012) Parties, cleavages and issue evolution: The
case of the religious-secular cleavage in Chile. Party Politics. Epub ahead of print
19 march 2012. DOI: 10.1177/1354068811436056
Roberts, KM (2011) Chile: the Left after Neoliberalism. In Steven Levitsky and KM
Roberts (eds), The Resurgence of the Latin American Left, John Hopkins,
Baltimore, pp. 325-347.
Scully TR (1992) Rethinking the center: Party Politics in Nineteenth and Twentieth-
Century Chile. Stanford, CA: Stanford University Press.
Siavelis PM (2002) Coalitions, voters and party system transformation in post-
authoritarian Chile. Government and Opposition, 37: 76–105.
Tironi E and Agüero F (1999) Will the new political landscape in Chile survive? Revista
de Estudios Públicos 74: 1-17.
Tironi E, Agüero F and Valenzuela E (2001) Clivajes políticos en Chile: perfil
sociológico de los electores de Lagos y Lavín. Revista Perspectivas 5: 73-87.
Torcal M and Mainwaring S (2003a) The political recrafting of social bases of party
competition: Chile, 1973-95. British Journal of Political Science 33: 55-84.
Valenzuela SJ and Scully TR (1997) Electoral choices and the party system in Chile:
Continuities and changes at the recovery of democracy. Comparative Politics 29:
511-527.
Valenzuela JS, Scully TR and Somma NM. (2007) The enduring presence of religion in
Chilean ideological positioning and voter options. Comparative Politics 40: 1-20.
33
Selection Eq. Outcome Eq.
Intercept -0.748*** 2.139***
(0.081) (0.17)
Male 0.132*** -0.162***
(0.027) (0.047)
26-35 years 0.15*** 0.151**
(0.041) (0.07)
36-45 years 0.131*** 0.222***
(0.041) (0.072)
46-55 years 0.204*** 0.253***
(0.046) (0.079)
56-65 years 0.238*** 0.354***
(0.051) (0.087)
66 years or more 0.136*** 0.438***
(0.052) (0.094)
Education 0.08*** 0.123***
(0.01) (0.018)
Household Goods Index 0.022*** 0.101***
(0.008) (0.015)
Catholic 0.154*** 0.765***
(0.041) (0.071)
Evangelical 0.129** 0.702***
(0.053) (0.096)
Other religión 0.037 0.331***
(0.064) (0.111)
Don´t care about gov. type / Dk -0.23*** 0.621***
(0.03) (0.061)
Authoritarian gov. can be preferable 0.108*** 1.926***
(0.039) (0.062)
Interest in Politics 0.54***
(0.018)
Inverse Mills Ratio
1.299***
(0.134)
Rho
0.566
Sigma
2.297
N obs / N censored 12900 / 3047
***p < 0.01, **p < 0.05, *p < 0.1
Note: Model includes year effects for each survey.
Table 1: Heckman selection model for left-right ideological scale (pooled data).
34
Figure 1: Proportion of the Population that Identifies with Left-Right Scale.
Figure 2: Evolution of socioeconomic marginal effects applied to each available year of
Latinobarometer data.
35
Figure 3: Evolution of religious group marginal effects applied to each available year of
Latinobarometer data.
Figure 4: Evolution of attitudes towards regime marginal effects applied to each
available year of Latinobarometer data.
36
Figure 5: Evolution of Congressmen Attitudes towards Cleavage related Issues.
Appendix Article “Social cleavages and political dealignment in contemporary Chile,
1995-2009”
In the following document we provide further methodological and statistical
information related to our empirical analysis presented in the paper. Section 1 provides
sample information of the survey data we employ and discusses the reasons for not using
other well known data sources. Section 2 provides detailed empirical estimates of the
Heckman selection model for each survey separately. Section 3 provides empirical
estimates showing the strong association between respondents’ position on the left-right
scale and their electoral preferences. And finally, section 4 provides some empirical results
that validate our household goods index as a reasonable socio economic measure.
1. Latinobarometer Survey Data
According to documentation of the Latinobarometrer Corporation, the Chilean
surveys between 1995 and 1998 employed probability with quota surveys that included the
male and female population aged 18 years and older living in the 29 cities over 40,000
inhabitants between the I to the X region of the country (and thereby excluded regions XI
and XII). This equates to 70% coverage of the adult population of the country. Respondents
within households were chosen using age and gender quotas, though households and census
districts were chosen randomly. The surveys conducted between 2000 and 2004 have the
same coverage than the earlier surveys, but employed multi-stage probability samples
including respondent selection within households. Thereafter, Latinobarometro surveys
employed multi-stage probability samples and covered the entire adult population of the
country. The data and abundant methodological information can be downloaded from
www.latinobarometro.org.
It is worth mentioning that the analysis we carry out cannot be done using the well-
known Centro de Estudios Públicos (CEP) surveys, which have employed multi-stage
probability samples since 1994. Several reasons justify this claim. First, the CEP failed to
regularly include in their surveys a measure able to capture the regime preference
dimension, and therefore, cannot be used to measure the evolution of the influence of this
fundamental political cleavage. According to our search there is one question that was
asked in several occasions. This was: “Considering both the good and bad things of the
governments I’m going to name, what grade from 1 to 7, where 1 is bad and 7 is excellent,
you would put the government of Augusto Pinochet?” The question was applied during 7
years between 1994 and 2003. The time span is not only shorter, but during the surveys
where this measure was included some other key social cleavage variables were excluded.
For example, between 1994 and 1999 not a single survey included both the Pinochet
government evaluation and a religious affiliation question. Considering this kind of data
limitations, we could potentially reproduce the type of analysis done in the article (with
simultaneous controls for all relevant cleavage variables) for the years 1999, 2000, 2001
and 2003. This short time period clearly represents an unsatisfactory option.
In second place, the CEP surveys did not ask the left-right self identification 10-
point scale up to the year 20041, and even after that the question wording experienced some
significant changes that undermine the temporal comparability of the data. The CEP
surveys do include, since 1994 up to this date, an ideological preference question that asks
respondents to mention the ideological position that best describes themselves (with
nominal response categories: right, center right, center, center left and left). Unfortunately
this last question has a much higher non response rate than the more abstract left-right 10-
point scale. Indeed, CEP surveys from years 2004 through 2009 included both questions in
the same questionnaires, which allow comparisons between both measures. For this entire
period (and using un-weighted data) the response rate of the nominal questions was, on
average, 18 percentage points lower. Consequently, we favored using the left-right scale
because it maximizes the amount of survey respondents that provide substantive
information.
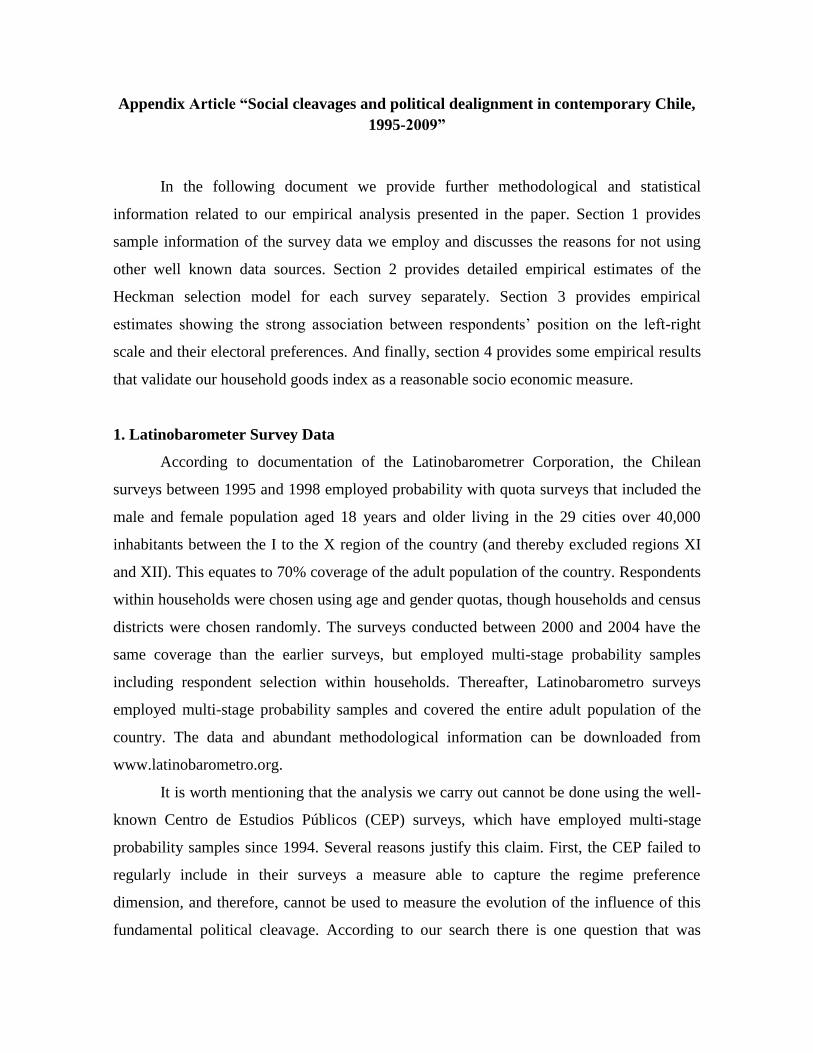
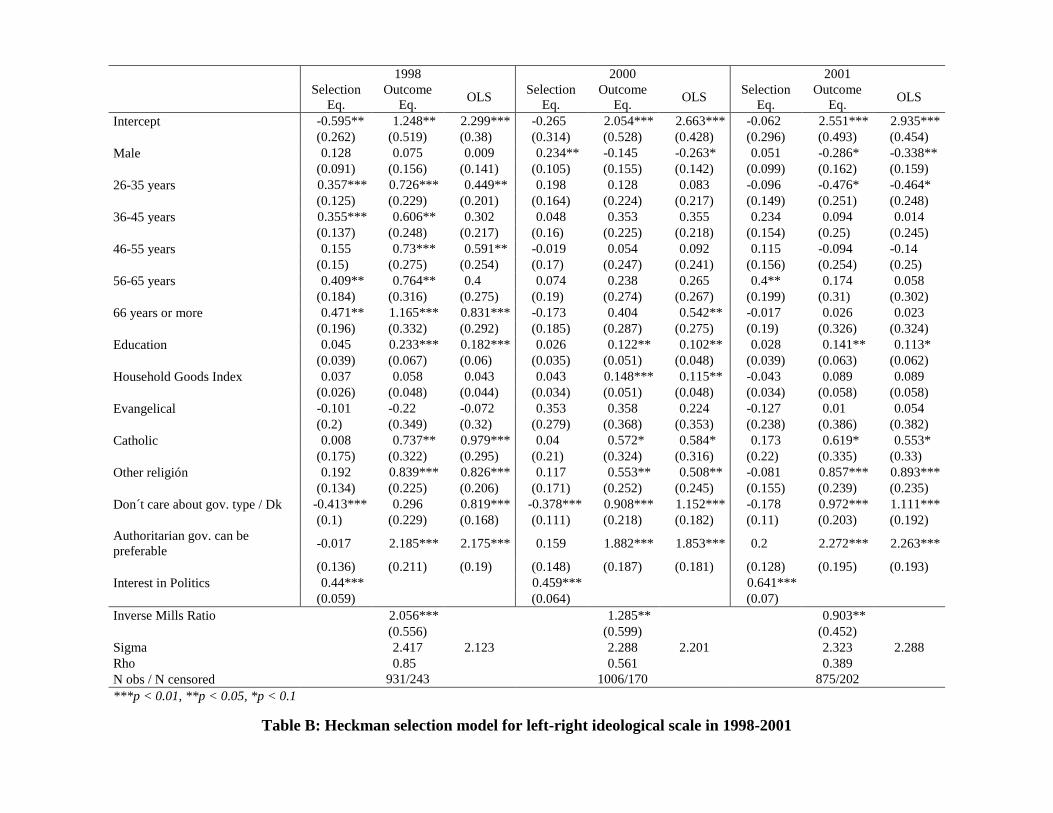
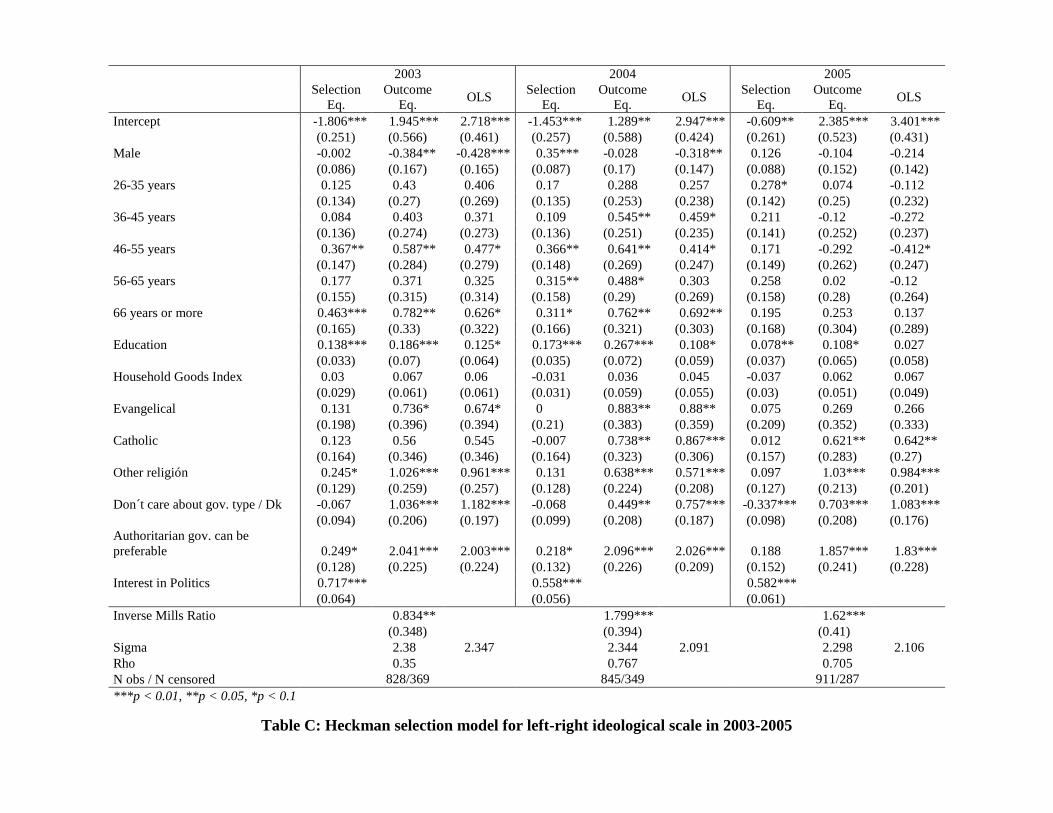
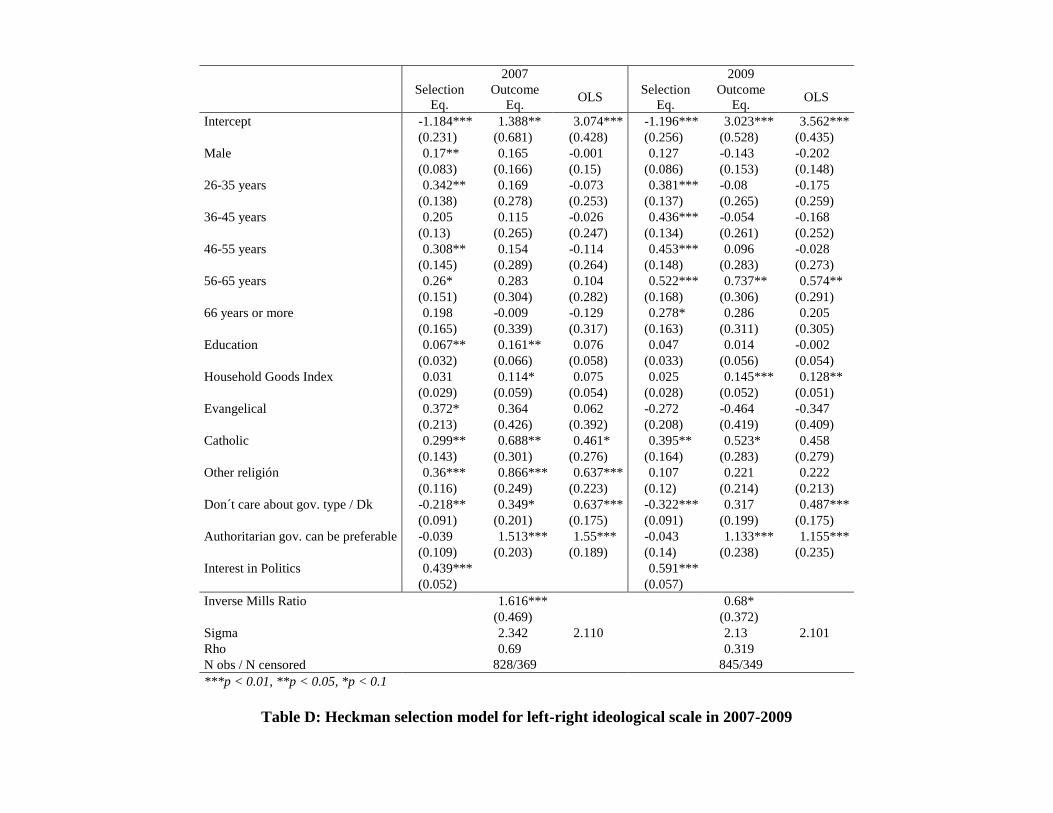
2. Heckman Model Selection and OLS Results
We begin providing the full results from each of the Heckman equations employed
to calculate figures 2, 3 and 4 of the paper. We also include, for comparison purposes, the
OLS estimates of the outcome equation. The results are shown on Tables A, B, C and D.
1 There is one survey in 1995 that includes a 10 point left-right self identification scale, but its question
wording is completely different than the surveys of 2004 and after.
It is interesting to note that OLS estimates either understate or overstate the
magnitude of the associations between some of the independent variables and the left-right
scale. Probably the most dramatic case refers to the coefficients of education. In this case,
the OLS estimates are in several occasions much smaller than the respective coefficients of
the outcome equation of the Heckman model. Consider the surveys from 1995, 2004, 2005,
2007 and 2009. In these cases the coefficients of the Heckman model at least double the
size of the OLS estimate. These results, however, should be of no surprise since education
is a strong positive predictor of whether each respondent mentioned a position on the left-
right scale. The OLS estimates of the household goods index are also smaller than the
Heckman estimates in several surveys, the most dramatic cases being observed in the
surveys of 1995, 2000, and 2009.
The opposite case can be observed among the estimates of the indifference option of
the regime preference question (“For people like me, it does not matter whether we have a
democratic or a non-democratic regime”). In this case, the OLS estimate tends to be larger
than the coefficient of the outcome equation of the Heckman model. In some cases (e. g. in
1998 and 2005) the differences are quite large..
Lastly, a second piece of information justifying the usage of a selection model,
instead of simply using OLS, can be found in the parameter estimate of the inverse mills
ratio. As shown in the tables, the estimate of the inverse mills ratio is significant at a 0.05
or lower in eight out of the eleven surveys, and is significant at a 0.10 level in nine out of
the eleven surveys.
1995 1996 1997
Selection
Eq.
Outcome
Eq. OLS
Selection
Eq.
Outcome
Eq. OLS
Selection
Eq.
Outcome
Eq. OLS
Intercept -0.958*** 1.862*** 3.286*** -1.161*** 3.206*** 3.637*** -0.29 2.159*** 2.721***
(0.257) (0.557) (0.426) (0.27) (0.519) (0.431) (0.287) (0.527) (0.372)
Male 0.147 -0.035 -0.186 0.104 -0.382** -0.44*** 0.109 -0.382*** -0.429***
(0.09) (0.166) (0.152) (0.093) (0.151) (0.147) (0.096) (0.134) (0.127)
26-35 years 0.087 0.294 0.269 -0.167 0.084 0.106 -0.043 0.07 0.094
(0.127) (0.221) (0.206) (0.131) (0.204) (0.204) (0.13) (0.183) (0.177)
36-45 years -0.098 0.24 0.366 -0.322** 0.165 0.201 0.15 0.162 0.132
(0.137) (0.25) (0.232) (0.138) (0.228) (0.224) (0.145) (0.195) (0.187)
46-55 years 0.143 0.47* 0.424* 0.06 0.379 0.368 0.02 -0.071 -0.068
(0.156) (0.275) (0.256) (0.163) (0.244) (0.243) (0.165) (0.228) (0.222)
56-65 years 0.191 0.354 0.292 -0.108 -0.127 -0.095 0.267 0.534** 0.438*
(0.177) (0.323) (0.302) (0.18) (0.291) (0.291) (0.191) (0.251) (0.236)
66 years or more -0.464** 0.592 1.047*** -0.093 0.311 0.335 0.113 0.413 0.385
(0.19) (0.421) (0.388) (0.189) (0.308) (0.307) (0.202) (0.283) (0.275)
Education 0.1*** 0.119* 0.016 0.103*** -0.053 -0.075 0.067* 0.108** 0.074
(0.033) (0.065) (0.056) (0.031) (0.057) (0.053) (0.038) (0.054) (0.048)
Household Goods Index 0.036 0.149*** 0.103** 0.046* 0.074 0.055 0.055** 0.105*** 0.085**
(0.027) (0.052) (0.048) (0.026) (0.046) (0.046) (0.027) (0.04) (0.036)
Evangelical -0.229 -0.426 -0.383 0.08 1.075*** 1.048*** 0.257 0.918*** 0.855***
(0.212) (0.397) (0.374) (0.224) (0.36) (0.36) (0.239) (0.325) (0.314)
Catholic 0.003 0.262 0.321 0.139 1.232*** 1.233*** 0.199 0.945*** 0.915***
(0.202) (0.396) (0.375) (0.202) (0.343) (0.343) (0.212) (0.302) (0.294)
Other religión 0.142 0.359 0.259 0.194 0.921*** 0.88*** 0.113 1.016*** 1.005***
(0.161) (0.291) (0.272) (0.159) (0.259) (0.258) (0.154) (0.216) (0.211)
Don´t care about gov. type / Dk -0.097 0.72*** 0.93*** -0.117 0.516*** 0.561*** -0.301*** 0.526*** 0.691***
(0.1) (0.2) (0.182) (0.102) (0.19) (0.183) (0.11) (0.197) (0.161)
Authoritarian gov. can be preferable 0.19 1.842*** 1.797*** 0.327** 1.765*** 1.721*** -0.182 2.268*** 2.357***
(0.125) (0.215) (0.2) (0.135) (0.19) (0.186) (0.132) (0.192) (0.178)
Interest in Politics 0.603***
0.708***
0.332***
(0.065)
(0.074)
(0.061)
Inverse Mills Ratio
1.997***
0.567
1.067
(0.452)
(0.389)
(0.679)
Sigma
2.563 2.311
2.172 2.166 2.009 1.927
Rho
0.779
0.261
0.531
N obs / N censored 964/271 890/251 957/182
***p < 0.01, **p < 0.05, *p < 0.1
Table A: Heckman selection model for left-right ideological scale in 1995-1997
1998 2000 2001
Selection
Eq.
Outcome
Eq. OLS
Selection
Eq.
Outcome
Eq. OLS
Selection
Eq.
Outcome
Eq. OLS
Intercept -0.595** 1.248** 2.299*** -0.265 2.054*** 2.663*** -0.062 2.551*** 2.935***
(0.262) (0.519) (0.38) (0.314) (0.528) (0.428) (0.296) (0.493) (0.454)
Male 0.128 0.075 0.009 0.234** -0.145 -0.263* 0.051 -0.286* -0.338**
(0.091) (0.156) (0.141) (0.105) (0.155) (0.142) (0.099) (0.162) (0.159)
26-35 years 0.357*** 0.726*** 0.449** 0.198 0.128 0.083 -0.096 -0.476* -0.464*
(0.125) (0.229) (0.201) (0.164) (0.224) (0.217) (0.149) (0.251) (0.248)
36-45 years 0.355*** 0.606** 0.302 0.048 0.353 0.355 0.234 0.094 0.014
(0.137) (0.248) (0.217) (0.16) (0.225) (0.218) (0.154) (0.25) (0.245)
46-55 years 0.155 0.73*** 0.591** -0.019 0.054 0.092 0.115 -0.094 -0.14
(0.15) (0.275) (0.254) (0.17) (0.247) (0.241) (0.156) (0.254) (0.25)
56-65 years 0.409** 0.764** 0.4 0.074 0.238 0.265 0.4** 0.174 0.058
(0.184) (0.316) (0.275) (0.19) (0.274) (0.267) (0.199) (0.31) (0.302)
66 years or more 0.471** 1.165*** 0.831*** -0.173 0.404 0.542** -0.017 0.026 0.023
(0.196) (0.332) (0.292) (0.185) (0.287) (0.275) (0.19) (0.326) (0.324)
Education 0.045 0.233*** 0.182*** 0.026 0.122** 0.102** 0.028 0.141** 0.113*
(0.039) (0.067) (0.06) (0.035) (0.051) (0.048) (0.039) (0.063) (0.062)
Household Goods Index 0.037 0.058 0.043 0.043 0.148*** 0.115** -0.043 0.089 0.089
(0.026) (0.048) (0.044) (0.034) (0.051) (0.048) (0.034) (0.058) (0.058)
Evangelical -0.101 -0.22 -0.072 0.353 0.358 0.224 -0.127 0.01 0.054
(0.2) (0.349) (0.32) (0.279) (0.368) (0.353) (0.238) (0.386) (0.382)
Catholic 0.008 0.737** 0.979*** 0.04 0.572* 0.584* 0.173 0.619* 0.553*
(0.175) (0.322) (0.295) (0.21) (0.324) (0.316) (0.22) (0.335) (0.33)
Other religión 0.192 0.839*** 0.826*** 0.117 0.553** 0.508** -0.081 0.857*** 0.893***
(0.134) (0.225) (0.206) (0.171) (0.252) (0.245) (0.155) (0.239) (0.235)
Don´t care about gov. type / Dk -0.413*** 0.296 0.819*** -0.378*** 0.908*** 1.152*** -0.178 0.972*** 1.111***
(0.1) (0.229) (0.168) (0.111) (0.218) (0.182) (0.11) (0.203) (0.192)
Authoritarian gov. can be
preferable -0.017 2.185*** 2.175*** 0.159 1.882*** 1.853*** 0.2 2.272*** 2.263***
(0.136) (0.211) (0.19) (0.148) (0.187) (0.181) (0.128) (0.195) (0.193)
Interest in Politics 0.44***
0.459***
0.641***
(0.059)
(0.064)
(0.07)
Inverse Mills Ratio
2.056***
1.285**
0.903**
(0.556)
(0.599)
(0.452)
Sigma
2.417 2.123
2.288 2.201 2.323 2.288
Rho
0.85
0.561
0.389
N obs / N censored 931/243 1006/170 875/202
***p < 0.01, **p < 0.05, *p < 0.1
Table B: Heckman selection model for left-right ideological scale in 1998-2001
2003 2004 2005
Selection
Eq.
Outcome
Eq. OLS
Selection
Eq.
Outcome
Eq. OLS
Selection
Eq.
Outcome
Eq. OLS
Intercept -1.806*** 1.945*** 2.718*** -1.453*** 1.289** 2.947*** -0.609** 2.385*** 3.401***
(0.251) (0.566) (0.461) (0.257) (0.588) (0.424) (0.261) (0.523) (0.431)
Male -0.002 -0.384** -0.428*** 0.35*** -0.028 -0.318** 0.126 -0.104 -0.214
(0.086) (0.167) (0.165) (0.087) (0.17) (0.147) (0.088) (0.152) (0.142)
26-35 years 0.125 0.43 0.406 0.17 0.288 0.257 0.278* 0.074 -0.112
(0.134) (0.27) (0.269) (0.135) (0.253) (0.238) (0.142) (0.25) (0.232)
36-45 years 0.084 0.403 0.371 0.109 0.545** 0.459* 0.211 -0.12 -0.272
(0.136) (0.274) (0.273) (0.136) (0.251) (0.235) (0.141) (0.252) (0.237)
46-55 years 0.367** 0.587** 0.477* 0.366** 0.641** 0.414* 0.171 -0.292 -0.412*
(0.147) (0.284) (0.279) (0.148) (0.269) (0.247) (0.149) (0.262) (0.247)
56-65 years 0.177 0.371 0.325 0.315** 0.488* 0.303 0.258 0.02 -0.12
(0.155) (0.315) (0.314) (0.158) (0.29) (0.269) (0.158) (0.28) (0.264)
66 years or more 0.463*** 0.782** 0.626* 0.311* 0.762** 0.692** 0.195 0.253 0.137
(0.165) (0.33) (0.322) (0.166) (0.321) (0.303) (0.168) (0.304) (0.289)
Education 0.138*** 0.186*** 0.125* 0.173*** 0.267*** 0.108* 0.078** 0.108* 0.027
(0.033) (0.07) (0.064) (0.035) (0.072) (0.059) (0.037) (0.065) (0.058)
Household Goods Index 0.03 0.067 0.06 -0.031 0.036 0.045 -0.037 0.062 0.067
(0.029) (0.061) (0.061) (0.031) (0.059) (0.055) (0.03) (0.051) (0.049)
Evangelical 0.131 0.736* 0.674* 0 0.883** 0.88** 0.075 0.269 0.266
(0.198) (0.396) (0.394) (0.21) (0.383) (0.359) (0.209) (0.352) (0.333)
Catholic 0.123 0.56 0.545 -0.007 0.738** 0.867*** 0.012 0.621** 0.642**
(0.164) (0.346) (0.346) (0.164) (0.323) (0.306) (0.157) (0.283) (0.27)
Other religión 0.245* 1.026*** 0.961*** 0.131 0.638*** 0.571*** 0.097 1.03*** 0.984***
(0.129) (0.259) (0.257) (0.128) (0.224) (0.208) (0.127) (0.213) (0.201)
Don´t care about gov. type / Dk -0.067 1.036*** 1.182*** -0.068 0.449** 0.757*** -0.337*** 0.703*** 1.083***
(0.094) (0.206) (0.197) (0.099) (0.208) (0.187) (0.098) (0.208) (0.176)
Authoritarian gov. can be
preferable 0.249* 2.041*** 2.003*** 0.218* 2.096*** 2.026*** 0.188 1.857*** 1.83***
(0.128) (0.225) (0.224) (0.132) (0.226) (0.209) (0.152) (0.241) (0.228)
Interest in Politics 0.717***
0.558***
0.582***
(0.064)
(0.056)
(0.061)
Inverse Mills Ratio
0.834**
1.799***
1.62***
(0.348)
(0.394)
(0.41)
Sigma
2.38 2.347
2.344 2.091 2.298 2.106
Rho
0.35
0.767
0.705
N obs / N censored 828/369 845/349 911/287
***p < 0.01, **p < 0.05, *p < 0.1
Table C: Heckman selection model for left-right ideological scale in 2003-2005
2007 2009
Selection
Eq.
Outcome
Eq. OLS
Selection
Eq.
Outcome
Eq. OLS
Intercept -1.184*** 1.388** 3.074*** -1.196*** 3.023*** 3.562***
(0.231) (0.681) (0.428) (0.256) (0.528) (0.435)
Male 0.17** 0.165 -0.001 0.127 -0.143 -0.202
(0.083) (0.166) (0.15) (0.086) (0.153) (0.148)
26-35 years 0.342** 0.169 -0.073 0.381*** -0.08 -0.175
(0.138) (0.278) (0.253) (0.137) (0.265) (0.259)
36-45 years 0.205 0.115 -0.026 0.436*** -0.054 -0.168
(0.13) (0.265) (0.247) (0.134) (0.261) (0.252)
46-55 years 0.308** 0.154 -0.114 0.453*** 0.096 -0.028
(0.145) (0.289) (0.264) (0.148) (0.283) (0.273)
56-65 years 0.26* 0.283 0.104 0.522*** 0.737** 0.574**
(0.151) (0.304) (0.282) (0.168) (0.306) (0.291)
66 years or more 0.198 -0.009 -0.129 0.278* 0.286 0.205
(0.165) (0.339) (0.317) (0.163) (0.311) (0.305)
Education 0.067** 0.161** 0.076 0.047 0.014 -0.002
(0.032) (0.066) (0.058) (0.033) (0.056) (0.054)
Household Goods Index 0.031 0.114* 0.075 0.025 0.145*** 0.128**
(0.029) (0.059) (0.054) (0.028) (0.052) (0.051)
Evangelical 0.372* 0.364 0.062 -0.272 -0.464 -0.347
(0.213) (0.426) (0.392) (0.208) (0.419) (0.409)
Catholic 0.299** 0.688** 0.461* 0.395** 0.523* 0.458
(0.143) (0.301) (0.276) (0.164) (0.283) (0.279)
Other religión 0.36*** 0.866*** 0.637*** 0.107 0.221 0.222
(0.116) (0.249) (0.223) (0.12) (0.214) (0.213)
Don´t care about gov. type / Dk -0.218** 0.349* 0.637*** -0.322*** 0.317 0.487***
(0.091) (0.201) (0.175) (0.091) (0.199) (0.175)
Authoritarian gov. can be preferable -0.039 1.513*** 1.55*** -0.043 1.133*** 1.155***
(0.109) (0.203) (0.189) (0.14) (0.238) (0.235)
Interest in Politics 0.439***
0.591***
(0.052)
(0.057)
Inverse Mills Ratio
1.616***
0.68*
(0.469)
(0.372)
Sigma
2.342 2.110
2.13 2.101
Rho
0.69
0.319
N obs / N censored 828/369 845/349
***p < 0.01, **p < 0.05, *p < 0.1
Table D: Heckman selection model for left-right ideological scale in 2007-2009
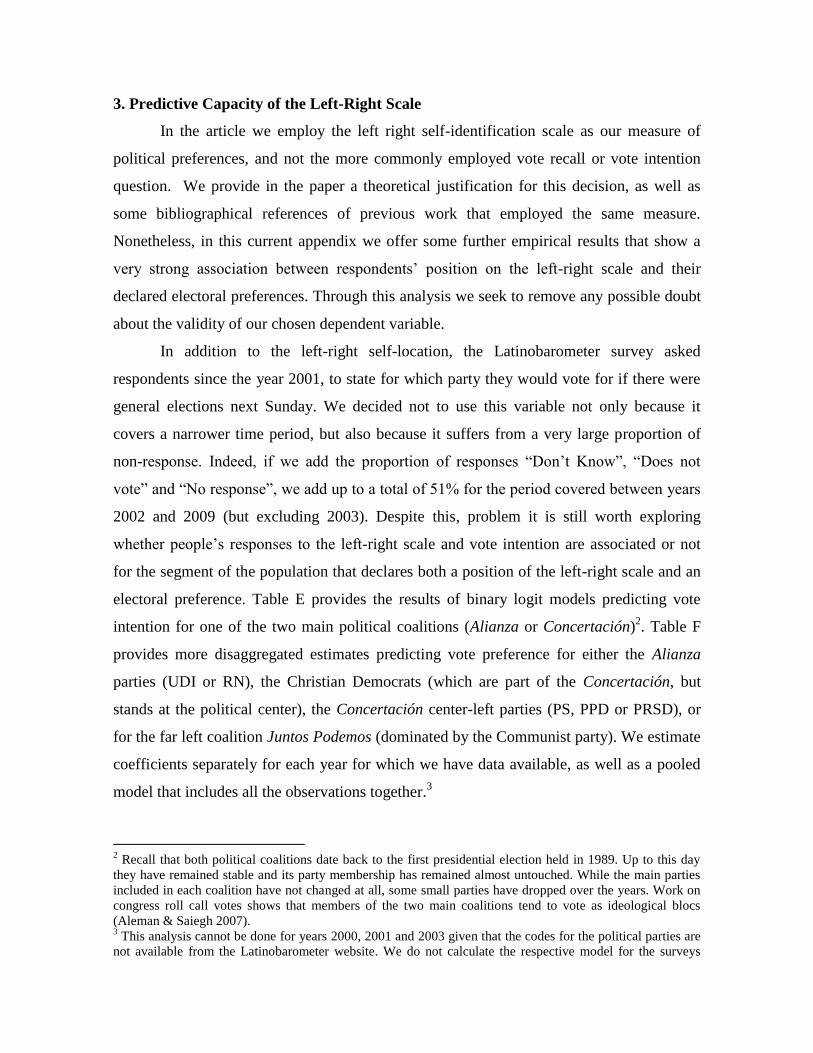
3. Predictive Capacity of the Left-Right Scale
In the article we employ the left right self-identification scale as our measure of
political preferences, and not the more commonly employed vote recall or vote intention
question. We provide in the paper a theoretical justification for this decision, as well as
some bibliographical references of previous work that employed the same measure.
Nonetheless, in this current appendix we offer some further empirical results that show a
very strong association between respondents’ position on the left-right scale and their
declared electoral preferences. Through this analysis we seek to remove any possible doubt
about the validity of our chosen dependent variable.
In addition to the left-right self-location, the Latinobarometer survey asked
respondents since the year 2001, to state for which party they would vote for if there were
general elections next Sunday. We decided not to use this variable not only because it
covers a narrower time period, but also because it suffers from a very large proportion of
non-response. Indeed, if we add the proportion of responses “Don’t Know”, “Does not
vote” and “No response”, we add up to a total of 51% for the period covered between years
2002 and 2009 (but excluding 2003). Despite this, problem it is still worth exploring
whether people’s responses to the left-right scale and vote intention are associated or not
for the segment of the population that declares both a position of the left-right scale and an
electoral preference. Table E provides the results of binary logit models predicting vote
intention for one of the two main political coalitions (Alianza or Concertación)2. Table F
provides more disaggregated estimates predicting vote preference for either the Alianza
parties (UDI or RN), the Christian Democrats (which are part of the Concertación, but
stands at the political center), the Concertación center-left parties (PS, PPD or PRSD), or
for the far left coalition Juntos Podemos (dominated by the Communist party). We estimate
coefficients separately for each year for which we have data available, as well as a pooled
model that includes all the observations together.3
2 Recall that both political coalitions date back to the first presidential election held in 1989. Up to this day
they have remained stable and its party membership has remained almost untouched. While the main parties
included in each coalition have not changed at all, some small parties have dropped over the years. Work on
congress roll call votes shows that members of the two main coalitions tend to vote as ideological blocs
(Aleman & Saiegh 2007). 3 This analysis cannot be done for years 2000, 2001 and 2003 given that the codes for the political parties are
not available from the Latinobarometer website. We do not calculate the respective model for the surveys
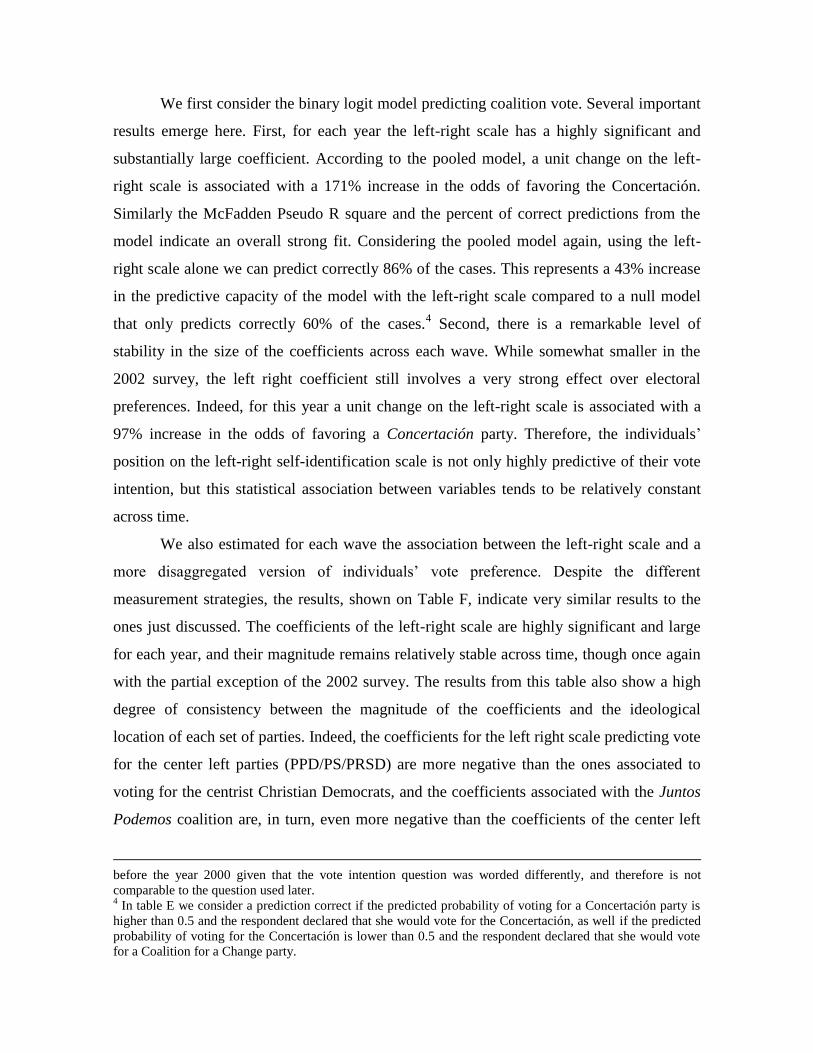
We first consider the binary logit model predicting coalition vote. Several important
results emerge here. First, for each year the left-right scale has a highly significant and
substantially large coefficient. According to the pooled model, a unit change on the left-
right scale is associated with a 171% increase in the odds of favoring the Concertación.
Similarly the McFadden Pseudo R square and the percent of correct predictions from the
model indicate an overall strong fit. Considering the pooled model again, using the left-
right scale alone we can predict correctly 86% of the cases. This represents a 43% increase
in the predictive capacity of the model with the left-right scale compared to a null model
that only predicts correctly 60% of the cases.4 Second, there is a remarkable level of
stability in the size of the coefficients across each wave. While somewhat smaller in the
2002 survey, the left right coefficient still involves a very strong effect over electoral
preferences. Indeed, for this year a unit change on the left-right scale is associated with a
97% increase in the odds of favoring a Concertación party. Therefore, the individuals’
position on the left-right self-identification scale is not only highly predictive of their vote
intention, but this statistical association between variables tends to be relatively constant
across time.
We also estimated for each wave the association between the left-right scale and a
more disaggregated version of individuals’ vote preference. Despite the different
measurement strategies, the results, shown on Table F, indicate very similar results to the
ones just discussed. The coefficients of the left-right scale are highly significant and large
for each year, and their magnitude remains relatively stable across time, though once again
with the partial exception of the 2002 survey. The results from this table also show a high
degree of consistency between the magnitude of the coefficients and the ideological
location of each set of parties. Indeed, the coefficients for the left right scale predicting vote
for the center left parties (PPD/PS/PRSD) are more negative than the ones associated to
voting for the centrist Christian Democrats, and the coefficients associated with the Juntos
Podemos coalition are, in turn, even more negative than the coefficients of the center left
before the year 2000 given that the vote intention question was worded differently, and therefore is not
comparable to the question used later. 4 In table E we consider a prediction correct if the predicted probability of voting for a Concertación party is
higher than 0.5 and the respondent declared that she would vote for the Concertación, as well if the predicted
probability of voting for the Concertación is lower than 0.5 and the respondent declared that she would vote
for a Coalition for a Change party.
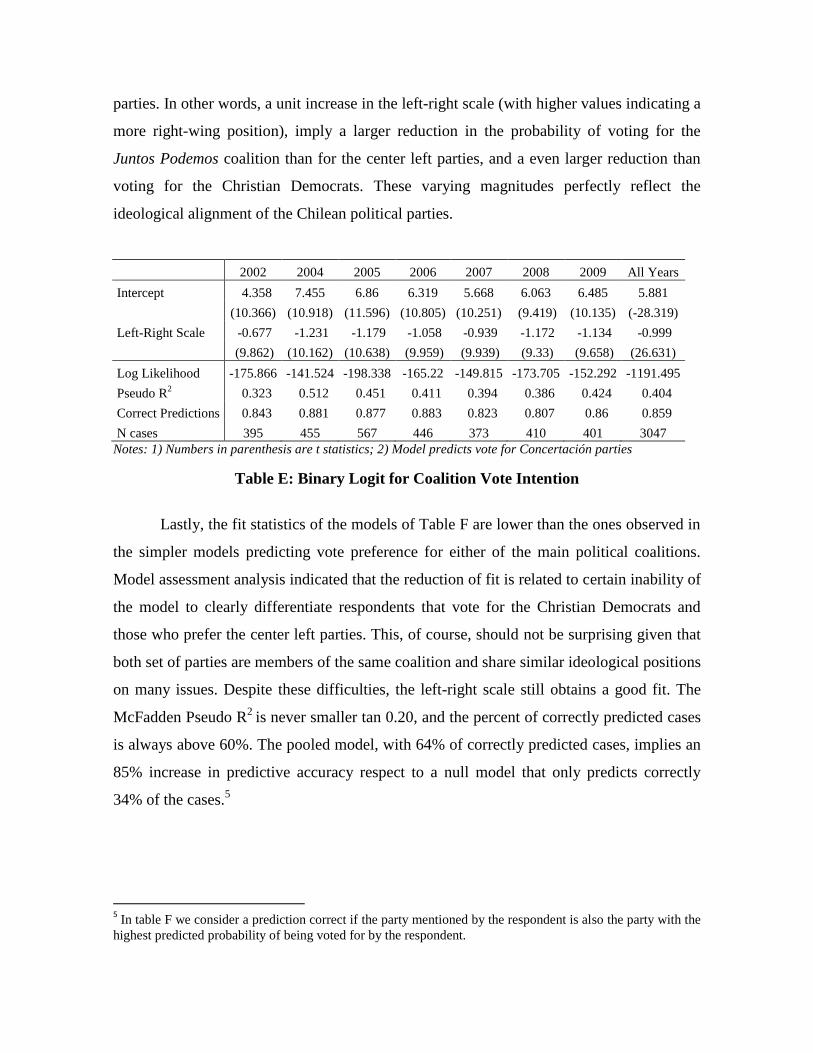
parties. In other words, a unit increase in the left-right scale (with higher values indicating a
more right-wing position), imply a larger reduction in the probability of voting for the
Juntos Podemos coalition than for the center left parties, and a even larger reduction than
voting for the Christian Democrats. These varying magnitudes perfectly reflect the
ideological alignment of the Chilean political parties.
2002 2004 2005 2006 2007 2008 2009 All Years
Intercept 4.358 7.455 6.86 6.319 5.668 6.063 6.485 5.881
(10.366) (10.918) (11.596) (10.805) (10.251) (9.419) (10.135) (-28.319)
Left-Right Scale -0.677 -1.231 -1.179 -1.058 -0.939 -1.172 -1.134 -0.999
(9.862) (10.162) (10.638) (9.959) (9.939) (9.33) (9.658) (26.631)
Log Likelihood -175.866 -141.524 -198.338 -165.22 -149.815 -173.705 -152.292 -1191.495
Pseudo R2 0.323 0.512 0.451 0.411 0.394 0.386 0.424 0.404
Correct Predictions 0.843 0.881 0.877 0.883 0.823 0.807 0.86 0.859
N cases 395 455 567 446 373 410 401 3047
Notes: 1) Numbers in parenthesis are t statistics; 2) Model predicts vote for Concertación parties
Table E: Binary Logit for Coalition Vote Intention
Lastly, the fit statistics of the models of Table F are lower than the ones observed in
the simpler models predicting vote preference for either of the main political coalitions.
Model assessment analysis indicated that the reduction of fit is related to certain inability of
the model to clearly differentiate respondents that vote for the Christian Democrats and
those who prefer the center left parties. This, of course, should not be surprising given that
both set of parties are members of the same coalition and share similar ideological positions
on many issues. Despite these difficulties, the left-right scale still obtains a good fit. The
McFadden Pseudo R2
is never smaller tan 0.20, and the percent of correctly predicted cases
is always above 60%. The pooled model, with 64% of correctly predicted cases, implies an
85% increase in predictive accuracy respect to a null model that only predicts correctly
34% of the cases.5
5 In table F we consider a prediction correct if the party mentioned by the respondent is also the party with the
highest predicted probability of being voted for by the respondent.
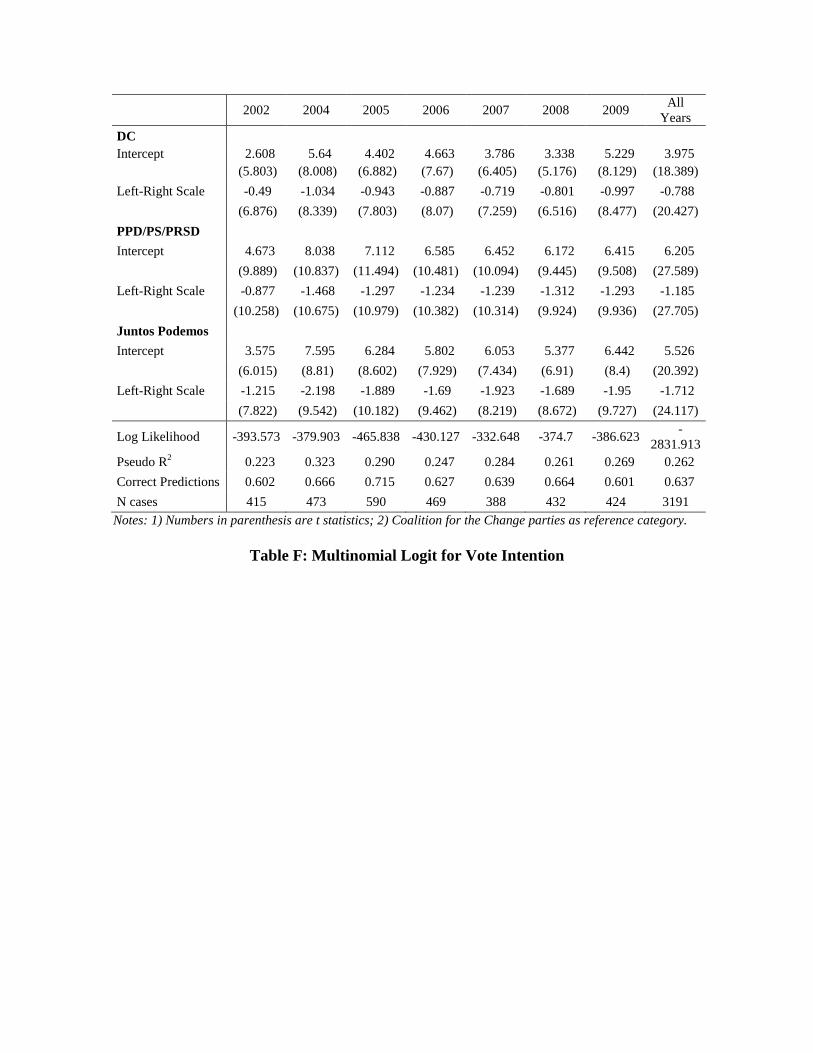
2002 2004 2005 2006 2007 2008 2009
All
Years
DC
Intercept 2.608 5.64 4.402 4.663 3.786 3.338 5.229 3.975
(5.803) (8.008) (6.882) (7.67) (6.405) (5.176) (8.129) (18.389)
Left-Right Scale -0.49 -1.034 -0.943 -0.887 -0.719 -0.801 -0.997 -0.788
(6.876) (8.339) (7.803) (8.07) (7.259) (6.516) (8.477) (20.427)
PPD/PS/PRSD
Intercept 4.673 8.038 7.112 6.585 6.452 6.172 6.415 6.205
(9.889) (10.837) (11.494) (10.481) (10.094) (9.445) (9.508) (27.589)
Left-Right Scale -0.877 -1.468 -1.297 -1.234 -1.239 -1.312 -1.293 -1.185
(10.258) (10.675) (10.979) (10.382) (10.314) (9.924) (9.936) (27.705)
Juntos Podemos
Intercept 3.575 7.595 6.284 5.802 6.053 5.377 6.442 5.526
(6.015) (8.81) (8.602) (7.929) (7.434) (6.91) (8.4) (20.392)
Left-Right Scale -1.215 -2.198 -1.889 -1.69 -1.923 -1.689 -1.95 -1.712
(7.822) (9.542) (10.182) (9.462) (8.219) (8.672) (9.727) (24.117)
Log Likelihood -393.573 -379.903 -465.838 -430.127 -332.648 -374.7 -386.623 -
2831.913
Pseudo R2 0.223 0.323 0.290 0.247 0.284 0.261 0.269 0.262
Correct Predictions 0.602 0.666 0.715 0.627 0.639 0.664 0.601 0.637
N cases 415 473 590 469 388 432 424 3191
Notes: 1) Numbers in parenthesis are t statistics; 2) Coalition for the Change parties as reference category.
Table F: Multinomial Logit for Vote Intention
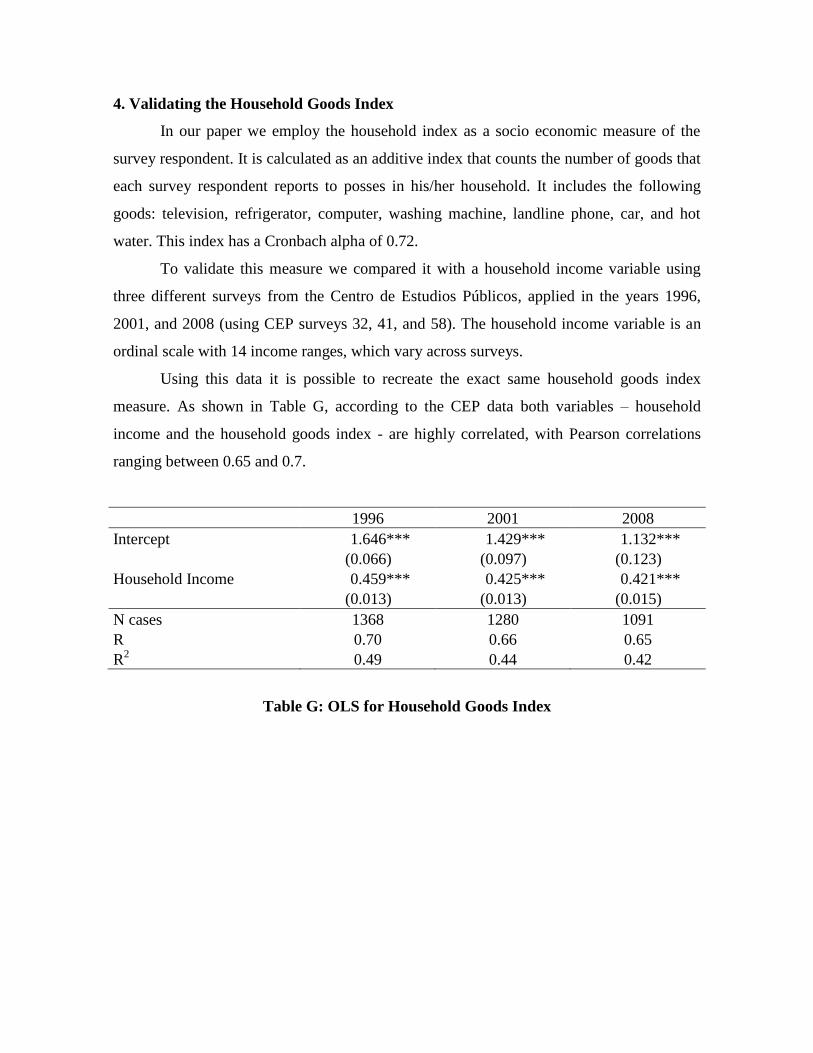
4. Validating the Household Goods Index
In our paper we employ the household index as a socio economic measure of the
survey respondent. It is calculated as an additive index that counts the number of goods that
each survey respondent reports to posses in his/her household. It includes the following
goods: television, refrigerator, computer, washing machine, landline phone, car, and hot
water. This index has a Cronbach alpha of 0.72.
To validate this measure we compared it with a household income variable using
three different surveys from the Centro de Estudios Públicos, applied in the years 1996,
2001, and 2008 (using CEP surveys 32, 41, and 58). The household income variable is an
ordinal scale with 14 income ranges, which vary across surveys.
Using this data it is possible to recreate the exact same household goods index
measure. As shown in Table G, according to the CEP data both variables – household
income and the household goods index - are highly correlated, with Pearson correlations
ranging between 0.65 and 0.7.
1996 2001 2008
Intercept 1.646*** 1.429*** 1.132***
(0.066) (0.097) (0.123)
Household Income 0.459*** 0.425*** 0.421***
(0.013) (0.013) (0.015)
N cases 1368 1280 1091
R 0.70 0.66 0.65
R2
0.49 0.44 0.42
Table G: OLS for Household Goods Index


![1995 Agenda Llatinoamericana [cat]](https://img.pdfslide.net/doc/110x75/63602831ef4a3767a80c1858/1995-agenda-llatinoamericana-cat.jpg)