Embed Size (px)
Citation preview
CompAM FUND
Société d'Investissement à Capital Variable Luxembourg
Unaudited semi-annual report as at 30 June 2015
Subscriptions may not be received on the basis of financial reports only. Subscriptions are valid only if made on the basis of the current prospectus, the Key Investor Information
Document, supplemented by the last annual report, and the most recent half-yearly report, if published thereafter.
R.C.S. Luxembourg B 92.095
49, Avenue J.F. Kennedy L - 1855 Luxembourg

CompAM FUND
Table of contents
Organisation of the Fund 4 Comparative Net Asset Values over the last three years
10
Combined Statement of Net Assets 12 Combined Statement of Operations and Changes in Net Assets
13
CompAM FUND - Active Emerging Credit 14 Statement of Net Assets 14 Statement of Operations and Changes in Net Assets 15 Portfolio 16 Options contracts 22 Forward foreign exchange contracts 23 CompAM FUND - Active European Equity 24 Statement of Net Assets 24 Statement of Operations and Changes in Net Assets 25 Portfolio 26 Commitments on futures contracts 28 CompAM FUND - Active Liquid Bond 29 Statement of Net Assets 29 Statement of Operations and Changes in Net Assets 30 Portfolio 31 Forward foreign exchange contracts 33 CompAM FUND - Active European Credit 34 Statement of Net Assets 34 Statement of Operations and Changes in Net Assets 35 Portfolio 36 Options contracts 39 Forward foreign exchange contracts 40 CompAM FUND - Active Dollar Bond 41 Statement of Net Assets 41 Statement of Operations and Changes in Net Assets 42 Portfolio 43 Options contracts 50 Forward foreign exchange contracts 51 CompAM FUND - Multimanager Balanced 52 Statement of Net Assets 52 Statement of Operations and Changes in Net Assets 53 Portfolio 54 Options contracts 55 Forward foreign exchange contracts 56
CompAM FUND - Multimanager Equity Africa & Middle East
57
Statement of Net Assets 57 Statement of Operations and Changes in Net Assets 58 Portfolio 59 Forward foreign exchange contracts 61 CompAM FUND - Multimanager Target Alpha 62 Statement of Net Assets 62 Statement of Operations and Changes in Net Assets 63 Portfolio 64 Options contracts 65 Forward foreign exchange contracts 66 CompAM FUND - SB Equity 67 Statement of Net Assets 67 Statement of Operations and Changes in Net Assets 68 Portfolio 69 CompAM FUND - SB Flexible 71 Statement of Net Assets 71 Statement of Operations and Changes in Net Assets 72 Portfolio 73 CompAM FUND - SB Bond 75 Statement of Net Assets 75 Statement of Operations and Changes in Net Assets 76 Portfolio 77 CompAM FUND - Active Bond Plus 79 Statement of Net Assets 79 Statement of Operations and Changes in Net Assets 80 Portfolio 81 Forward foreign exchange contracts 85 CompAM FUND - ML Opportunity 86 Statement of Net Assets 86 Statement of Operations and Changes in Net Assets 87 Portfolio 88 Commitments on futures contracts 89 CompAM FUND - Global Diversified 90 Statement of Net Assets 90 Statement of Operations and Changes in Net Assets 91 Portfolio 92 Options contracts 95 Forward foreign exchange contracts 96 CompAM FUND - Active Equity Selection 97 Statement of Net Assets 97 Statement of Operations and Changes in Net Assets 98 Portfolio 99 Commitments on futures contracts 101
2

CompAM FUND
CompAM FUND - Multimanager Global Equity 102 Statement of Net Assets 102 Statement of Operations and Changes in Net Assets 103 Portfolio 104 Options contracts 105 Forward foreign exchange contracts 106 CompAM FUND - Active Market Neutral 107 Statement of Net Assets 107 Statement of Operations and Changes in Net Assets 108 Portfolio 109 CompAM FUND - Cadence Strategic Asia 110 Statement of Net Assets 110 Statement of Operations and Changes in Net Assets 111 Portfolio 112 Notes to the financial statements 114
3

CompAM FUND
Organisation of the Fund
Board of Directors of the Fund
Chairman Mr. Massimo Scolari Independent member
Members Mr. Roberto Di Carlo Independent member Associate of The Directors’ Office
Mr. Gabriele Bruera Director of Compass Asset Management S.A.
Mr. Lamberto Conte Head of administration and compliance at Compass Asset Management S.A.
Registered Office 49, Avenue J.F. Kennedy L - 1855 Luxembourg
Management Company MDO Management Company S.A. 21st Century Building 19, rue de Bitburg L - 1273 Luxembourg
Board of Directors of the Management Company
Chairman Géry Daeninck Independent Management Consultant
Members Martin Vogel Chief Executive Officer, MDO Services S.A.
Yves Wagner Independent Management Consultant
John Li Independent Management Consultant
Garry Pieters Independent Management Consultant
4

CompAM FUND
Organisation of the Fund (continued)
Conducting Officers of the Management Company Mr. Riccardo del Tufo
Risk Manager MDO Services S.A., Luxembourg
Mr. Kim Kirsch Head of Legal & Compliance MDO Services S.A., Luxembourg
Mrs. Laurence Magloire Chief Operating Officer MDO Services S.A., Luxembourg
Mr. Olivier Schalbetter Risk Manager MDO Services S.A., Luxembourg
Investment Manager Compass Asset Management S.A. 18, Via Calprino CH - 6900 Paradiso-Lugano
Investment Advisers Alto Adige Banca S.p.A. - SÜDTIROL Bank AG (CompAM FUND: SB Equity, 31, Via dott. Streiter CompAM FUND: SB Flexible and IT - 39100 Bolzano CompAM FUND: SB Bond only)
(Cadence Strategic Asia only) Cadence Investment Partners LLP 61 Dublin Street Edinburgh, EH3 6NL, United Kingdom
Custodian and Paying Agent State Street Bank Luxembourg S.C.A. 49, Avenue J.F. Kennedy L - 1855 Luxembourg
Administrative Agent, State Street Bank Luxembourg S.C.A. Registrar and Transfer Agent 49, Avenue J.F. Kennedy
L - 1855 Luxembourg
5

CompAM FUND
Organisation of the Fund (continued) Domiciliary Agent State Street Bank Luxembourg S.A. 49, Avenue J.F. Kennedy L - 1855 Luxembourg Correspondent Bank, Paying Agent, Banca Sella Holding S.p.A. Nominee, Centralization Agent and 2, Via Italia Placing Agent in Italy IT - 13900 Biella Correspondent Bank Société Generale S.p.A. Via Benigno Crespi 19/A-MAC2 IT - 20159 Milano Cabinet de révision agréé Deloitte Audit Société à responsabilité limitée 560, Rue de Neudorf L - 2220 Luxembourg Legal Adviser Arendt & Medernach 14, rue Erasme L - 2082 Luxembourg
6

CompAM FUND
General information CompAM FUND (the "Fund") is an investment company organised as a "Société d’Investissement à Capital Variable" ("SICAV") under the laws of the Grand Duchy of Luxembourg. The Fund incorporated on 28 February 2003 in Luxembourg for an unlimited period is governed by the amended Luxembourg Law of 10 August 1915 on commercial companies and by the Part I of the amended Law of 17 December 2010 on Undertakings for Collective Investment (the "2010 Law"). The management of the Fund has been delegated to MDO Management Company S.A., a société anonyme, incorporated and subject to the laws of the Grand-Duchy of Luxembourg and duly authorized by the CSSF as a management company within the meaning of Chapter 15 of the 2010 Law. The Articles of Incorporation were published in the "Mémorial" on 4 April 2003, were last modified on 27 February 2004, and published in the "Mémorial" on 27 March 2004. As at 30 June 2015, the following Sub-Funds are open for subscription: CompAM FUND: Active Emerging Credit expressed in EUR CompAM FUND: Active European Equity expressed in EUR CompAM FUND: Active Liquid Bond expressed in EUR CompAM FUND: Active European Credit expressed in EUR CompAM FUND: Active Dollar Bond expressed in USD CompAM FUND: Multimanager Balanced expressed in EUR CompAM FUND: Multimanager Equity Africa & Middle East expressed in EUR CompAM FUND: Multimanager Target Alpha expressed in EUR CompAM FUND: SB Equity expressed in EUR CompAM FUND: SB Flexible expressed in EUR CompAM FUND: SB Bond expressed in EUR CompAM FUND: Active Bond Plus expressed in EUR CompAM FUND: ML Opportunity expressed in EUR CompAM FUND: Global Diversified expressed in EUR CompAM FUND: Active Equity Selection expressed in EUR CompAM FUND: Multimanager Global Equity expressed in EUR CompAM FUND: Active Market Neutral1 expressed in EUR CompAM FUND: Cadence Strategic Asia2 expressed in EUR 1 Launched on 5 May 2015 2 Launched on 17 April 2015
7

CompAM FUND
General information (continued) For each Sub-Fund, the Fund is entitled to issue Shares of different classes, as described in more details in the current Prospectus. For the time being, twenty classes of ordinary Shares are offered by the Fund, i.e. Class A Shares, Class A CHF hedged, Class B CHF hedged, Class D CHF hedged, Class I CHF hedged, Class M CHF hedged, Class Z CHF hedged, Class A USD hedged, Class B USD hedged, Class D USD hedged, Class I USD hedged, Class M USD hedged, Class Z USD hedged, Class B Shares, Class D Shares, Class E Shares, Class I Shares, Class L Shares, Class M Shares, Class S Shares, Class Y Shares, Class Z Shares. As at 30 June 2015, the classes of Shares offered by the different Sub-Funds are: CompAM FUND: Active Emerging Credit Class A, Class B, Class D, Class I, Class M,
Class S, Class Y and Class Z CompAM FUND: Active European Equity Class A, Class B, Class M, Class S, Class Y and
Class Z CompAM FUND: Active Liquid Bond Class A, Class B, Class D, Class I ,Class M,
Class S CHF hedged, Class Y and Class Z CompAM FUND: Active European Credit Class A, Class B, Class D, Class I, Class M,
Class Y and Class Z CompAM FUND: Active Dollar Bond Class A, Class B, Class D, Class E, Class I,
Class M, Class S, Class Y and Class Z CompAM FUND: Multimanager Balanced Class A, Class A CHF hedged, Class B CHF
hedged, Class D CHF hedged, Class I CHF hedged, Class M CHF hedged, Class S CHF hedged, Class Z CHF hedged, Class A USD hedged, Class B USD hedged, Class D USD hedged, Class I USD hedged, Class M USD hedged, Class Z USD hedged, Class B, Class D, Class I, Class M, and Class Z
CompAM FUND: Multimanager Equity Africa & Middle East
Class A, Class B, Class M and Class Z
CompAM FUND: Multimanager Target Alpha Class A, Class B, Class M and Class Z CompAM FUND: SB Equity Class A, Class B, Class D, Class I and Class M CompAM FUND: SB Flexible Class A, Class B, Class D, Class I and Class M CompAM FUND: SB Bond Class A, Class B, Class D, Class I and Class M CompAM FUND: Active Bond Plus Class B and Class I
8

CompAM FUND
General information (continued) CompAM FUND: ML Opportunity Class A, Class B and Class M CompAM FUND: Global Diversified Class A, Class B, Class M and Class Z
CompAM FUND: Active Equity Selection Class A, Class B, Class M, Class S, Class Y
and Class Z
CompAM FUND: Multimanager Global Equity Class A, Class B, Class M, Class S and Class Z
CompAM FUND: Active Market Neutral Class A, Class B, Class M, Class S, Class Y and Class Z
CompAM FUND: Cadence Strategic Asia Class A, Class B, Class C, Class I, Class L,
Class M, Class Y and Class Z The difference between the different classes of ordinary Shares relates to the dividend payment, minimum investment, investment management fee, performance fee and the placing fee which is payable quarterly in arrears to the relevant Placing Agents. Certain classes of ordinary Shares may not be offered for subscription by the Fund's Placing Agents in certain countries where the Fund is registered for public distribution. In such case, the investors wishing to subscribe for a class of Shares which is not offered for subscription by the Placing Agent appointed in their country of residence may apply to the Sub-Registrar and Transfer Agent in Luxembourg in order to subscribe for the relevant class of Shares.
The Class C Shares requires the prior approval of the Board of Directors of the Fund. The Class Y Shares is reserved to other Sub-Funds of the Fund for cross Sub-Fund Investments. The Class Z Shares is reserved to the Investment Manager, its employees and their relatives and requires the prior approval of the Board of Directors of the Fund. The Fund’s financial year begins on 1 January and ends on 31 December of the same year. Copies of the agreements, the Articles of Incorporation of the Fund, the current Prospectus, the Key Investor Information Document, the schedule of each investment portfolio activity for the year, and the latest financial reports may be obtained free of charge during normal office hours at the registered office of the Fund in Luxembourg. GLOBAL EXPOSURE As part of this risk management process, the global exposure of each Sub-Fund of the Fund is measured and controlled using the Commitment approach.
9

CompAM FUND
COMPARATIVE NET ASSET VALUES OVER THE LAST THREE YEARS
30 June 2015 31 December 2014 31 December 2013 Currency Total NAV per Share Total NAV per Share Total NAV per Share CompAM FUND - Active Emerging Credit Class A Shares EUR 18 611 962,16 1 689,469 16 430 991,64 1 616,673 25 389 881,36 1 602,442 Class B Shares EUR 1 611 160,38 1 616,699 1 639 919,63 1 550,083 1 221 374,20 1 544,768 Class D Shares EUR 286 750,42 107,714 259 427,98 105,886 240 156,04 109,354 Class M Shares EUR 22 506 224,04 144,239 20 532 637,99 137,748 10 127 928,47 136,010 Class Y Shares EUR 6 048 798,09 1 104,256 5 004 824,62 1 050,868 873 152,06 1 030,756 Class Z Shares EUR 281 510,07 1 714,371 306 326,13 1 627,317 356 600,25 1 601,136 Total Net Assets EUR 49 346 405,16 44 174 127,99 38 209 092,38 CompAM FUND - Active European Equity Class A Shares EUR 19 840 305,29 1 445,161 20 328 424,37 1 377,519 21 567 818,44 1 377,161 Class B Shares EUR 64 424,99 1 360,124 48 270,93 1 299,912 257 819,89 1 306,396 Class M Shares EUR 14 212 725,62 126,450 9 385 286,40 119,970 3 578 758,33 118,801 Class Y Shares EUR 1 668 296,84 1 038,520 1 275 692,60 981,288 – – Class Z Shares EUR 629 301,01 1 198,742 610 503,76 1 128,990 1 507 265,95 1 112,582 Total Net Assets EUR 36 415 053,75 31 648 178,06 26 911 662,61 CompAM FUND - Active Liquid Bond Class A Shares EUR 9 597 532,59 1 240,612 17 239 383,66 1 238,634 26 833 628,36 1 228,943 Class B Shares EUR 945 359,98 1 194,579 2 027 579,39 1 194,713 2 490 672,89 1 189,567 Class D Shares EUR 221 955,44 96,145 472 874,20 96,756 250 148,13 98,488 Class M Shares EUR 790 514,15 113,250 902 799,30 112,911 662 896,56 111,676 Class Y Shares EUR 2 381 544,28 1 014,002 2 812 652,23 1 007,900 – – Class Z Shares EUR 248 388,95 1 170,989 237 255,38 1 166,660 234 320,52 1 151,945 Total Net Assets EUR 14 185 295,39 23 692 544,16 30 471 666,46 CompAM FUND - Active European Credit Class A Shares EUR 16 388 395,95 1 480,410 11 588 965,65 1 449,925 21 266 423,93 1 390,168 Class B Shares EUR 2 366 391,17 1 410,973 1 985 855,70 1 384,924 2 066 712,86 1 333,769 Class D Shares EUR 2 245 533,39 94,647 1 381 725,21 93,982 261 945,00 99,923 Class M Shares EUR 14 988 164,08 153,372 10 887 036,66 149,844 12 220 691,26 142,964 Class Y Shares EUR 2 718 620,54 1 126,608 2 102 618,43 1 096,032 877 075,18 1 036,864 Class Z Shares EUR 1 832 108,55 1 705,871 1 834 803,82 1 659,501 3 130 130,62 1 569,572 Total Net Assets EUR 40 539 213,68 29 781 005,47 39 822 978,85 CompAM FUND - Active Dollar Bond Class A Shares USD 7 933 031,45 1 494,179 8 108 647,14 1 484,854 6 449 488,11 1 483,074 Class E Shares USD 20 270 260,69 1 649,397 26 024 976,58 1 632,965 8 570 678,40 1 619,466 Class M Shares USD 4 295 743,40 1 031,196 1 346 536,28 1 019,837 277 393,44 1 008,703 Class Y Shares USD 6 238 016,74 1 048,843 6 141 365,62 1 032,592 506 293,06 1 012,586 Class Z Shares EUR 4 872 196,74 1 004,810 4 802 720,58 990,482 – – Total Net Assets USD 43 609 249,02 46 424 246,20 15 803 853,01 CompAM FUND - Multimanager Balanced Class A Shares EUR 9 149 488,06 127,078 8 638 938,47 120,822 9 102 276,33 116,287 Class B Shares EUR 24 722,29 135,956 8 404,28 129,482 53 276,33 125,246 Class M Shares EUR 3 278 120,56 127,567 18 770 142,83 120,855 733 096,76 115,787 Class S Shares CHF 24 567 926,19 98,91 – – – – Total Net Assets EUR 36 046 399,33 27 417 485,58 9 888 649,42 CompAM FUND - Multimanager Equity Africa & Middle East Class A Shares EUR 4 357 599,71 74,476 1 782 272,53 72,787 4 678 681,33 73,237 Class B Shares EUR 3 928 805,10 95,400 2 214 540,76 93,563 1 012,96 94,396 Class M Shares EUR 694 630,32 78,178 2 338 557,06 76,140 7 626,93 76,269 Class Z Shares EUR – – 1 542 625,68 79,966 1 944 521,34 79,801 Total Net Assets EUR 8 981 035,13 7 877 996,03 6 631 842,56 CompAM FUND - Multimanager Target Alpha Class A Shares EUR 3 524 440,76 110,031 2 514 712,22 107,115 5 493 798,42 105,304 Class B Shares EUR – – – – 5 653,59 94,382 Class M Shares EUR 6 962 003,81 106,576 3 764 054,78 103,515 192 665,34 101,403 Class Z Shares EUR – – – – 1 015 186,58 93,726 Total Net Assets EUR 10 486 444,57 6 278 767,00 6 707 303,93 CompAM FUND - SB Equity Class B Shares EUR 6 301 842,10 1 286,799 5 066 539,58 1 195,246 3 179 187,32 1 097,391 Class D Shares EUR 1 027 742,20 1 233,037 1 019 608,78 1 148,187 921 461,57 1 063,853 Class I Shares EUR 6 951 000,80 1 260,882 5 659 713,85 1 156,313 7 643 788,12 1 037,382 Class M Shares EUR 302 844,94 1 186,129 365 663,65 1 090,202 135 942,81 982,849 Total Net Assets EUR 14 583 430,04 12 111 525,86 11 880 379,82 CompAM FUND - SB Flexible Class B Shares EUR 13 876 281,60 1 054,538 9 570 913,60 1 029,469 9 996 019,92 1 003,637 Class D Shares EUR 1 564 245,39 1 074,705 1 377 498,94 1 050,493 1 777 504,60 1 030,344 Class I Shares EUR 2 533 089,59 1 058,542 3 194 554,75 1 023,597 5 652 140,25 980,014 Class M Shares EUR 533 941,48 1 035,081 828 896,06 1 002,943 441 359,74 964,358 Total Net Assets EUR 18 507 558,06 14 971 863,35 17 867 024,51
10

CompAM FUND
COMPARATIVE NET ASSET VALUES OVER THE LAST THREE YEARS
CompAM FUND - SB Bond Class B Shares GBP 36 230 676,51 1 073,644 32 814 271,90 1 064,816 25 531 083,62 1 053,794 Class D Shares EUR 2 360 181,33 1 069,778 2 257 304,30 1 066,314 2 126 239,64 1 071,470 Class I Shares EUR 16 393 146,19 1 110,639 16 974 131,62 1 093,632 22 230 890,43 1 067,032 Class M Shares EUR 888 150,49 1 032,102 1 578 267,98 1 017,631 670 032,69 995,681 Total Net Assets EUR 55 872 154,52 53 623 975,80 50 558 246,38 CompAM FUND - Active Bond Plus Class B Shares EUR 1 833 820,45 1 044,260 629 790,38 1 017,440 – – Class I Shares EUR 24 304 793,64 1 133,497 30 346 386,33 1 101,759 30 226 735,00 1 079,373 Total Net Assets EUR 26 138 614,09 30 976 176,71 30 226 735,00 CompAM FUND - ML Opportunity Class M Shares EUR 1 148 032,00 847,343 1 427 805,76 849,438 1 607 106,56 961,177 Total Net Assets EUR 1 148 032,00 1 427 805,76 1 607 106,56 CompAM FUND - Global Diversified Class A Shares EUR 27 029 116,07 1 133,528 12 288 958,55 1 057,034 11 913 107,94 1 013,802 Class B Shares EUR 892 162,18 991,313 – – – – Class M Shares EUR 12 718 142,14 1 148,572 7 761 491,76 1 068,634 9 637 854,86 1 020,311 Total Net Assets EUR 40 639 420,39 20 050 450,31 21 550 962,80 CompAM FUND - Active Equity Selection Class A Shares EUR 5 311 591,68 1 042,445 4 762 442,59 945,894 – – Class M Shares EUR 7 502 526,71 1 056,468 5 393 373,99 954,141 – – Class Y Shares EUR 1 720 278,71 1 066,971 1 247 030,97 959,745 – – Class Z Shares EUR 7 369 798,00 1 072,340 8 313 489,65 956,441 – – Total Net Assets EUR 21 904 195,10 19 716 337,20 – CompAM FUND - Multimanager Global Equity Class A Shares EUR 1 035 732,35 1 136,827 590 048,34 1 037,553 – – Class M Shares EUR 29 061 067,81 1 242,773 23 288 987,81 1 131,509 – – Class Z Shares EUR 10 639 072,56 1 259,952 6 773 368,59 1 139,935 – – Total Net Assets EUR 40 735 872,72 306 524,74 – CompAM FUND - Active Market Neutral Class A Shares EUR 6 745 114,86 993,085 – – – – Class M Shares EUR 3 394 397,32 993,367 – – – – Class Y Shares EUR 945 707,33 995,481 – – – – Class Z Shares EUR 1 491 847,35 994,565 – – – – Total Net Assets EUR 12 577 066,86 – – CompAM FUND - Cadence Strategic Asia Class A Shares EUR 1 286 068,28 927,304 – – – – Class C Shares GBP 571 568,21 936,636 – – – – Class L Shares USD 143 304,79 955,365 – – – – Class M Shares EUR 8 263 415,87 929,297 – – – – Class Y Shares EUR 1 303 559,68 931,114 – – – – Class Z Shares EUR 2 200 281,91 929,973 – – – – Total Net Assets EUR 13 988 714,75 – –
11
CompAM FUND
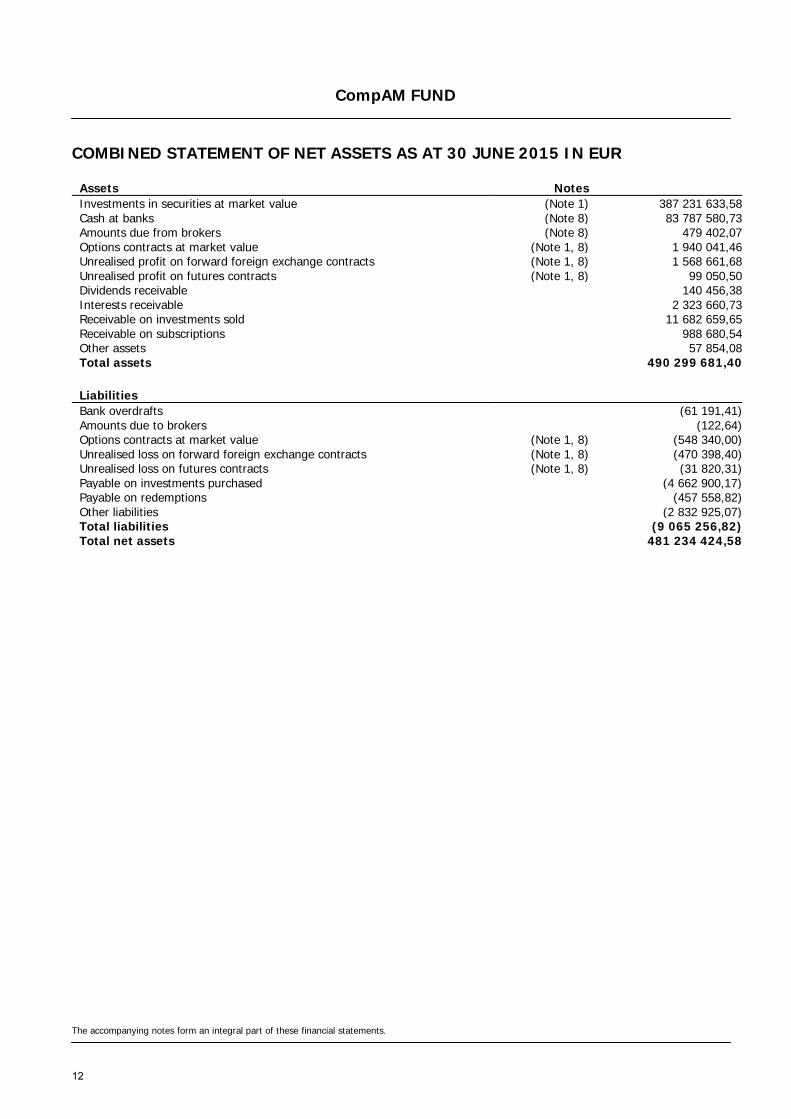
COMBINED STATEMENT OF NET ASSETS AS AT 30 JUNE 2015 IN EUR
Assets Notes Investments in securities at market value (Note 1) 387 231 633,58 Cash at banks (Note 8) 83 787 580,73 Amounts due from brokers (Note 8) 479 402,07 Options contracts at market value (Note 1, 8) 1 940 041,46 Unrealised profit on forward foreign exchange contracts (Note 1, 8) 1 568 661,68 Unrealised profit on futures contracts (Note 1, 8) 99 050,50 Dividends receivable 140 456,38 Interests receivable 2 323 660,73 Receivable on investments sold 11 682 659,65 Receivable on subscriptions 988 680,54 Other assets 57 854,08 Total assets 490 299 681,40
Liabilities Bank overdrafts (61 191,41) Amounts due to brokers (122,64) Options contracts at market value (Note 1, 8) (548 340,00) Unrealised loss on forward foreign exchange contracts (Note 1, 8) (470 398,40) Unrealised loss on futures contracts (Note 1, 8) (31 820,31) Payable on investments purchased (4 662 900,17) Payable on redemptions (457 558,82) Other liabilities (2 832 925,07) Total liabilities (9 065 256,82) Total net assets 481 234 424,58
The accompanying notes form an integral part of these financial statements.
12

CompAM FUND
COMBINED STATEMENT OF OPERATIONS AND CHANGES IN NET ASSETS FOR THE PERIOD ENDED 30 JUNE 2015 IN EUR
Net assets at the beginning of the period Notes 392 766 198,17
Net income from investments (Note 1d) 5 040 325,49 Interest on bank accounts (Note 1d) 4,18 Other income 13 085,23 Total income 5 053 414,90 Investment Management fees (Note 2) (2 419 754,47) Management Company fees (Note 3) (163 815,26) Performance fees (Note 4) (1 556 710,53) Custodian fees (113 079,89) Subscription tax (Note 5) (98 440,10) Interest paid (338,02) Custodian transaction fees (Note 6) (137 801,26) Other charges and taxes (612 813,26) Total expenses (5 102 752,79) Net investment income / (loss) (49 337,89) Net realised profit / (loss) on sales of investments, currencies and other financial instruments 6 358 106,84 Change in unrealised appreciation / (depreciation) on - Investments 7 782 528,52 - Options contracts (83 711,79) - Forward foreign exchange contracts (Note 1h) 2 159 269,68 - Futures contracts (Note 1i) 120 369,45 Net result of operations for the period 16 287 224,81
Distributions (Note 7) (39 736,42) Subscriptions for the period 185 174 299,57 Redemptions for the period (116 254 000,48) Conversion difference (Note 1g) 3 300 438,93
Net assets at the end of the period 481 234 424,58
The accompanying notes form an integral part of these financial statements.
13

CompAM FUND - Active Emerging Credit
STATEMENT OF NET ASSETS AS AT 30 JUNE 2015 IN EUR
Assets Notes Investments in securities at market value (Note 1) 39 707 592,95 Cash at banks 6 648 566,24 Amounts due from brokers (Note 8) 466,33 Options contracts at market value (Note 1, 8) 77 129,33 Unrealised profit on forward foreign exchange contracts (Note 1, 8) 820 283,69 Dividends receivable 22,03 Interests receivable 595 395,17 Receivable on investments sold 1 895 327,25 Other assets 6 138,52 Total assets 49 750 921,51
Liabilities Unrealised loss on forward foreign exchange contracts (Note 1, 8) (4 956,30) Payable on investments purchased (49 601,17) Payable on redemptions (4 471,91) Other liabilities (345 486,97) Total liabilities (404 516,35) Total net assets 49 346 405,16
Currency Net Asset Value per Share Shares outstanding
Class A Shares EUR 1 689,469 11 016,454 Class B Shares EUR 1 616,699 996,574 Class D Shares EUR 107,714 2 662,155 Class M Shares EUR 144,239 156 034,775 Class Y Shares EUR 1 104,256 5 477,716 Class Z Shares EUR 1 714,371 164,206
The accompanying notes form an integral part of these financial statements.
14

CompAM FUND - Active Emerging Credit
STATEMENT OF OPERATIONS AND CHANGES IN NET ASSETS FOR THE PERIOD ENDED 30 JUNE 2015 IN EUR
Net assets at the beginning of the period Notes 44 174 127,99
Net income from investments (Note 1d) 1 308 479,71 Interest on bank accounts (Note 1d) 4,18 Total Income 1 308 483,89 Investment Management fees (Note 2) (231 783,68) Management Company fees (Note 3) (17 869,49) Performance fees (Note 4) (260 041,96) Custodian fees (12 763,87) Subscription tax (Note 5) (13 008,79) Custodian transaction fees (Note 6) (10 767,69) Other charges and taxes (53 011,38) Total expenses (599 246,86) Net investment income / (loss) 709 237,03 Net realised profit / (loss) on sales of investments, currencies and other financial instruments (2 112 995,27) Change in unrealised appreciation / (depreciation) on: - Investments 2 073 959,64 - Options contracts (23 610,15) - Forward foreign exchange contracts (Note 1h) 1 710 387,39 Net result of operations for the period 2 356 978,64
Distributions (Note 7) (6 592,15) Subscriptions for the period 11 779 680,84 Redemptions for the period (8 957 790,16)
Net assets at the end of the period 49 346 405,16
The accompanying notes form an integral part of these financial statements.
15

CompAM FUND - Active Emerging Credit
PORTFOLIO AS AT 30 JUNE 2015 IN EUR
Quantity /
Nominal Description Currency Acquisition cost Market value % of
Net Assets
PORTFOLIO AT MARKET VALUE 35 548 068,08 39 707 592,95 80,47
TRANSFERABLE SECURITIES AND MONEY MARKET INSTRUMENTS ADMITTED TO AN OFFICIAL STOCK EXCHANGE LISTING 31 665 724,20 35 266 841,99 71,47
Shares 0,00 26 449,56 0,05
MEXICO 0,00 26 449,56 0,05
Telecommunication 0,00 26 449,56 0,05 265 750,00 MAXCOM TELECOMUNICACIONES SAB DE CV MXN 0,00 26 449,56 0,05
Ordinary Bonds 31 142 178,22 34 714 793,25 70,35
LUXEMBOURG 2 975 239,81 3 395 889,59 6,88
Energy 1 159 744,12 1 398 890,78 2,83
1 135 000,00
GAZPROM OAO VIA GAZ CAPITAL SA 2.85% 25/10/2019
CHF 843 038,91 1 015 169,25 2,05
500 000,00
GAZPROM NEFT OAO VIA GPN CAPITAL SA 4.375% 19/09/2022
USD 316 705,21 383 721,53 0,78
Finance 902 630,84 1 025 502,82 2,08
850 000,00
SBERBANK OF RUSSIA VIA SB CAPITAL SA 2.065% 28/02/2017
CHF 698 609,25 792 764,23 1,61
250 000,00
VTB BANK OJSC VIA VTB CAPITAL SA 3.15% 16/12/2016
CHF 204 021,59 232 738,59 0,47
Telecommunication 603 399,25 681 600,08 1,38
500 000,00
MILLICOM INTERNATIONAL CELLULAR SA 6.625% 15/10/2021
USD 369 918,00 463 440,17 0,94
250 000,00
MILLICOM INTERNATIONAL CELLULAR SA 6.00% 15/03/2025
USD 233 481,25 218 159,91 0,44
Basic Goods 309 465,60 289 895,91 0,59 400 000,00 MHP SA 8.25% 02/04/2020 USD 309 465,60 289 895,91 0,59
MEXICO 3 148 070,52 3 327 711,07 6,74
Industries 1 078 823,39 1 166 080,88 2,36 500 000,00 CEMEX SAB DE CV 6.50% 10/12/2019 USD 378 823,39 472 987,38 0,96 400 000,00 CEMEX SAB DE CV 4.75% 11/01/2022 EUR 400 000,00 403 076,00 0,81 300 000,00 CEMEX SAB DE CV 4.375% 05/03/2023 EUR 300 000,00 290 017,50 0,59
Energy 1 010 672,17 953 488,22 1,93 9 600 000,00 PETROLEOS MEXICANOS 7.47% 12/11/2026 MXN 568 491,52 523 102,59 1,06 300 000,00 PETROLEOS MEXICANOS 5.625% 23/01/2046 USD 257 020,09 251 771,69 0,51 100 000,00 PETROLEOS MEXICANOS 2.75% 21/04/2027 EUR 99 016,00 90 623,00 0,18 100 000,00 PETROLEOS MEXICANOS 4.50% 23/01/2026 USD 86 144,56 87 990,94 0,18
Finance 514 103,57 660 115,38 1,34 700 000,00 CREDITO REAL SAB DE CV 7.50% 13/03/2019 USD 514 103,57 660 115,38 1,34
Telecommunication 326 485,15 329 957,56 0,67 6 000 000,00 AMERICA MOVIL SAB DE CV 6.45% 05/12/2022 MXN 326 485,15 329 957,56 0,67
Basic Goods 217 986,24 218 069,03 0,44 250 000,00 JB Y CO SA DE CV 3.75% 13/05/2025 USD 217 986,24 218 069,03 0,44
TURKEY 2 269 922,66 2 591 102,81 5,25
Finance 1 198 446,44 1 401 115,30 2,84
500 000,00
TURKIYE VAKIFLAR BANKASI TAO 3.50% 17/06/2019
EUR 496 630,00 504 707,50 1,02
500 000,00 YAPI VE KREDI BANKASI AS 5.25% 03/12/2018 USD 367 756,14 463 633,13 0,94 500 000,00 TURKIYE HALK BANKASI AS 3.875% 05/02/2020 USD 334 060,30 432 774,67 0,88
Telecommunication 618 830,03 625 787,60 1,27 700 000,00 TURK TELEKOMUNIKASYON AS 4.875% 19/06/2024 USD 618 830,03 625 787,60 1,27
Basic Goods 452 646,19 564 199,91 1,14
700 000,00
ANADOLU EFES BIRACILIK VE MALT SANAYII AS 3.375% 01/11/2022
USD 452 646,19 564 199,91 1,14
The accompanying notes form an integral part of these financial statements.
16

CompAM FUND - Active Emerging Credit
PORTFOLIO AS AT 30 JUNE 2015 IN EUR
Quantity /
Nominal Description Currency Acquisition cost Market value % of
Net Assets
NETHERLANDS 1 987 777,41 2 129 376,08 4,31
Energy 1 190 737,49 1 179 625,51 2,39
500 000,00
PETROBRAS GLOBAL FINANCE BV 6.625% 16/01/2034
GBP 595 656,57 608 242,86 1,23
500 000,00
PETROBRAS GLOBAL FINANCE BV 5.625% 20/05/2043
USD 371 901,21 349 878,86 0,71
300 000,00
PETROBRAS GLOBAL FINANCE BV 6.85% 05/06/2115
USD 223 179,71 221 503,79 0,45
Telecommunication 464 988,91 497 163,48 1,01 300 000,00 VIMPELCOM HOLDINGS BV 5.20% 13/02/2019 USD 254 025,25 258 177,19 0,52 300 000,00 VIMPELCOM HOLDINGS BV 5.95% 13/02/2023 USD 210 963,66 238 986,29 0,49
Finance 332 051,01 452 587,09 0,91 500 000,00 MARFRIG HOLDING EUROPE BV 8.375% 09/05/2018 USD 332 051,01 452 587,09 0,91
CAYMAN ISLANDS 1 399 157,65 1 627 037,90 3,30
Finance 652 029,17 801 305,47 1,63 500 000,00 INVESTCORP SA 8.25% 01/11/2017 USD 385 534,50 482 036,47 0,98 350 000,00 QNB FINANCE LTD 2.875% 29/04/2020 USD 266 494,67 319 269,00 0,65
Industries 530 856,00 549 227,29 1,11
600 000,00
LIMA METRO LINE 2 FINANCE LTD 5.875% 05/07/2034
USD 530 856,00 549 227,29 1,11
Consumer Retail 216 272,48 276 505,14 0,56 300 000,00 MARFRIG OVERSEAS LTD 9.50% 04/05/2020 USD 216 272,48 276 505,14 0,56
ARGENTINA 1 127 733,92 1 464 837,65 2,97
Government 616 322,30 861 735,61 1,75 500 000,00 PROVINCIA DE BUENOS AIRES 10.875% 26/01/2021 USD 357 567,25 452 241,55 0,92
250 000,00
CITY OF BUENOS AIRES ARGENTINA 8.95% 19/02/2021
USD 221 150,75 230 291,93 0,47
200 000,00 PROVINCIA DE BUENOS AIRES 9.25% 15/04/2017 USD 37 604,30 179 202,13 0,36
Energy 511 411,62 603 102,04 1,22 400 000,00 YPF SA 8.75% 04/04/2024 USD 289 970,80 364 261,38 0,74 250 000,00 YPF SA 8.875% 19/12/2018 USD 221 440,82 238 840,66 0,48
IRELAND 1 042 152,97 1 293 315,04 2,62
Supranational 514 615,91 640 004,98 1,30 700 000,00 AFRICAN EXPORT-IMPORT BANK 4.75% 29/07/2019 USD 514 615,91 640 004,98 1,30
Industries 354 387,87 446 308,38 0,90
500 000,00
RUSSIAN RAILWAYS VIA RZD CAPITAL PLC 2.177% 26/02/2018
CHF 354 387,87 446 308,38 0,90
Raw materials 173 149,19 207 001,68 0,42 250 000,00 METALLOINVEST FINANCE LTD 5.625% 17/04/2020 USD 173 149,19 207 001,68 0,42
SLOVENIA 1 109 583,17 1 211 114,94 2,45
Government 612 983,17 687 449,94 1,39
500 000,00
SLOVENIA GOVERNMENT INTERNATIONAL BOND 5.25% 18/02/2024
USD 365 245,67 490 412,44 0,99
250 000,00 SLOVENIA GOVERNMENT BOND 1.50% 25/03/2035 EUR 247 737,50 197 037,50 0,40
Energy 496 600,00 523 665,00 1,06 500 000,00 PETROL DD LJUBLJANA 3.25% 24/06/2019 EUR 496 600,00 523 665,00 1,06
KAZAKHSTAN 1 093 231,50 1 206 937,15 2,45
Industries 779 509,70 898 145,17 1,82
500 000,00
KAZAKHSTAN TEMIR ZHOLY JSC 3.638% 20/06/2022
CHF 409 810,20 457 436,56 0,93
500 000,00
NATSIONALNAYA KOMPANIYA KAZAKHSTAN ENGINEERING AO 4.55% 03/12/2016
USD 369 699,50 440 708,61 0,89
Energy 313 721,80 308 791,98 0,63
400 000,00
KAZMUNAYGAS NATIONAL CO JSC 6.00% 07/11/2044
USD 313 721,80 308 791,98 0,63
The accompanying notes form an integral part of these financial statements.
17

CompAM FUND - Active Emerging Credit
DENMARK 1 215 290,67 1 181 570,37 2,39
Government 1 215 290,67 1 181 570,37 2,39 8 000 000,00 DENMARK GOVERNMENT BOND 4.00% 15/11/2017 DKK 1 215 290,67 1 181 570,37 2,39
GEORGIA 943 091,92 1 108 272,38 2,25
Finance 560 445,14 654 128,12 1,33 700 000,00 BANK OF GEORGIA JSC 7.75% 05/07/2017 USD 560 445,14 654 128,12 1,33
Industries 382 646,78 454 144,26 0,92 500 000,00 GEORGIAN OIL AND GAS CORP 6.875% 16/05/2017 USD 382 646,78 454 144,26 0,92
BRAZIL 922 232,56 1 017 641,88 2,06
Telecommunication 501 061,87 547 802,50 1,11 700 000,00 OI SA 5.75% 10/02/2022 USD 501 061,87 547 802,50 1,11
Finance 421 170,69 469 839,38 0,95
500 000,00
BANCO NACIONAL DE DESENVOLVIMENTO ECONOMICO E SOCIAL 5.50% 12/07/2020
USD 421 170,69 469 839,38 0,95
FRANCE 999 400,00 990 180,00 2,01
Government 999 400,00 990 180,00 2,01 1 000 000,00 UNEDIC 0.125% 05/03/2020 EUR 999 400,00 990 180,00 2,01
BRITISH VIRGIN ISLANDS 916 342,25 940 413,82 1,91
Energy 554 665,75 524 092,66 1,06
300 000,00
SINOPEC GROUP OVERSEAS DEVELOPMENT 2015 LTD 2.50% 28/04/2020
USD 278 106,51 265 313,70 0,54
300 000,00
SINOPEC GROUP OVERSEAS DEVELOPMENT 2015 LTD 3.25% 28/04/2025
USD 276 559,24 258 778,96 0,52
Raw materials 361 676,50 416 321,16 0,85 500 000,00 GTL TRADE FINANCE INC 7.25% 16/04/2044 USD 361 676,50 416 321,16 0,85
NIGERIA 748 826,17 860 180,91 1,74
Government 564 143,19 678 655,14 1,37
750 000,00
NIGERIA GOVERNMENT INTERNATIONAL BOND 5.125% 12/07/2018
USD 564 143,19 678 655,14 1,37
Supranational 184 682,98 181 525,77 0,37 200 000,00 AFRICA FINANCE CORP 4.375% 29/04/2020 USD 184 682,98 181 525,77 0,37
ISRAEL 560 015,25 720 793,00 1,46
Multi-Utilities 560 015,25 720 793,00 1,46 750 000,00 ISRAEL ELECTRIC CORP LTD 5.625% 21/06/2018 USD 560 015,25 720 793,00 1,46
AUSTRIA 546 352,96 690 093,84 1,40
Basic Goods 546 352,96 690 093,84 1,40 500 000,00 ESAL GMBH 6.25% 05/02/2023 USD 364 963,46 445 281,40 0,90 250 000,00 JBS INVESTMENTS GMBH 7.75% 28/10/2020 USD 181 389,50 244 812,44 0,50
HUNGARY 497 395,79 672 662,49 1,36
Government 497 395,79 672 662,49 1,36
500 000,00
HUNGARY GOVERNMENT INTERNATIONAL BOND 5.375% 25/03/2024
USD 354 571,14 486 943,58 0,99
200 000,00
HUNGARY GOVERNMENT INTERNATIONAL BOND 4.00% 25/03/2019
USD 142 824,65 185 718,91 0,37
BURUNDI 491 673,85 651 436,05 1,32
Supranational 491 673,85 651 436,05 1,32
700 000,00
EASTERN AND SOUTHERN AFRICAN TRADE AND DEVELOPMENT BANK 6.375% 06/12/2018
USD 491 673,85 651 436,05 1,32
SRI LANKA 513 102,10 644 657,20 1,31
Government 513 102,10 644 657,20 1,31
700 000,00
SRI LANKA GOVERNMENT INTERNATIONAL BOND 6.00% 14/01/2019
USD 513 102,10 644 657,20 1,31
The accompanying notes form an integral part of these financial statements.
18
CompAM FUND - Active Emerging Credit
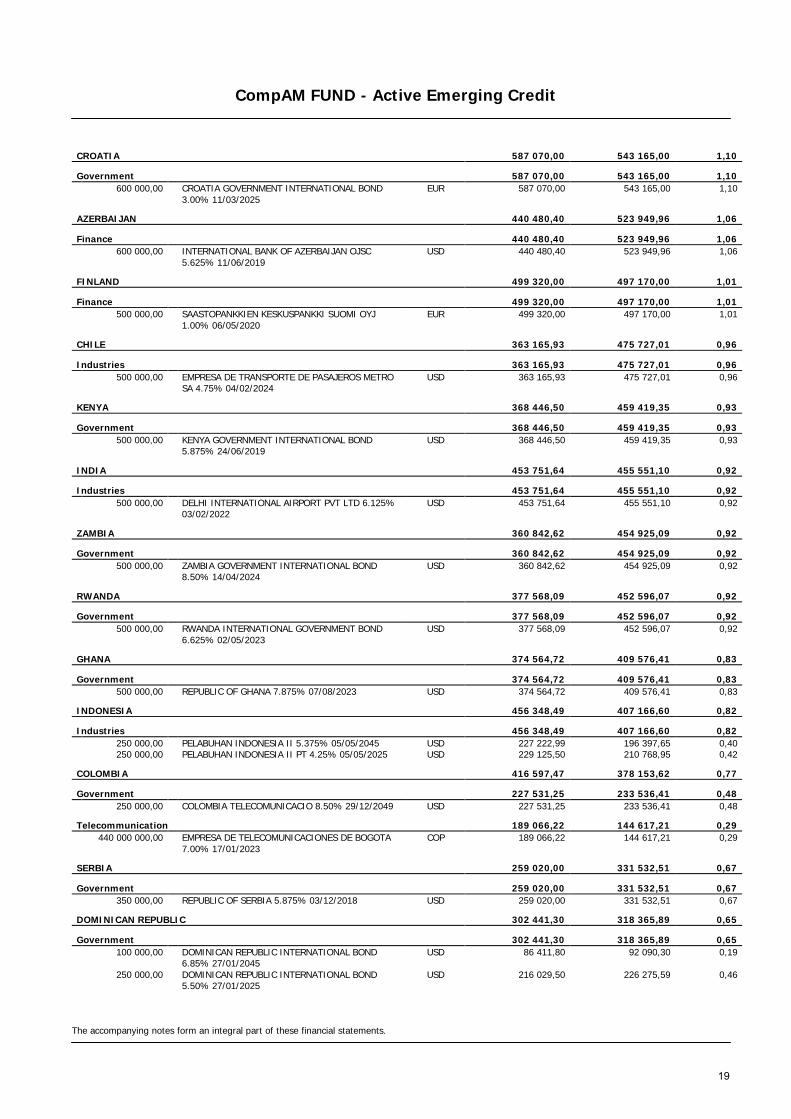
CROATIA 587 070,00 543 165,00 1,10
Government 587 070,00 543 165,00 1,10
600 000,00
CROATIA GOVERNMENT INTERNATIONAL BOND 3.00% 11/03/2025
EUR 587 070,00 543 165,00 1,10
AZERBAIJAN 440 480,40 523 949,96 1,06
Finance 440 480,40 523 949,96 1,06
600 000,00
INTERNATIONAL BANK OF AZERBAIJAN OJSC 5.625% 11/06/2019
USD 440 480,40 523 949,96 1,06
FINLAND 499 320,00 497 170,00 1,01
Finance 499 320,00 497 170,00 1,01
500 000,00
SAASTOPANKKIEN KESKUSPANKKI SUOMI OYJ 1.00% 06/05/2020
EUR 499 320,00 497 170,00 1,01
CHILE 363 165,93 475 727,01 0,96
Industries 363 165,93 475 727,01 0,96
500 000,00
EMPRESA DE TRANSPORTE DE PASAJEROS METRO SA 4.75% 04/02/2024
USD 363 165,93 475 727,01 0,96
KENYA 368 446,50 459 419,35 0,93
Government 368 446,50 459 419,35 0,93
500 000,00
KENYA GOVERNMENT INTERNATIONAL BOND 5.875% 24/06/2019
USD 368 446,50 459 419,35 0,93
INDIA 453 751,64 455 551,10 0,92
Industries 453 751,64 455 551,10 0,92
500 000,00
DELHI INTERNATIONAL AIRPORT PVT LTD 6.125% 03/02/2022
USD 453 751,64 455 551,10 0,92
ZAMBIA 360 842,62 454 925,09 0,92
Government 360 842,62 454 925,09 0,92
500 000,00
ZAMBIA GOVERNMENT INTERNATIONAL BOND 8.50% 14/04/2024
USD 360 842,62 454 925,09 0,92
RWANDA 377 568,09 452 596,07 0,92
Government 377 568,09 452 596,07 0,92
500 000,00
RWANDA INTERNATIONAL GOVERNMENT BOND 6.625% 02/05/2023
USD 377 568,09 452 596,07 0,92
GHANA 374 564,72 409 576,41 0,83
Government 374 564,72 409 576,41 0,83 500 000,00 REPUBLIC OF GHANA 7.875% 07/08/2023 USD 374 564,72 409 576,41 0,83
INDONESIA 456 348,49 407 166,60 0,82
Industries 456 348,49 407 166,60 0,82 250 000,00 PELABUHAN INDONESIA II 5.375% 05/05/2045 USD 227 222,99 196 397,65 0,40 250 000,00 PELABUHAN INDONESIA II PT 4.25% 05/05/2025 USD 229 125,50 210 768,95 0,42
COLOMBIA 416 597,47 378 153,62 0,77
Government 227 531,25 233 536,41 0,48 250 000,00 COLOMBIA TELECOMUNICACIO 8.50% 29/12/2049 USD 227 531,25 233 536,41 0,48
Telecommunication 189 066,22 144 617,21 0,29
440 000 000,00
EMPRESA DE TELECOMUNICACIONES DE BOGOTA 7.00% 17/01/2023
COP 189 066,22 144 617,21 0,29
SERBIA 259 020,00 331 532,51 0,67
Government 259 020,00 331 532,51 0,67 350 000,00 REPUBLIC OF SERBIA 5.875% 03/12/2018 USD 259 020,00 331 532,51 0,67
DOMINICAN REPUBLIC 302 441,30 318 365,89 0,65
Government 302 441,30 318 365,89 0,65
100 000,00
DOMINICAN REPUBLIC INTERNATIONAL BOND 6.85% 27/01/2045
USD 86 411,80 92 090,30 0,19
250 000,00
DOMINICAN REPUBLIC INTERNATIONAL BOND 5.50% 27/01/2025
USD 216 029,50 226 275,59 0,46
The accompanying notes form an integral part of these financial statements.
19

CompAM FUND - Active Emerging Credit
PORTFOLIO AS AT 30 JUNE 2015 IN EUR
Quantity /
Nominal Description Currency Acquisition cost Market value % of
Net Assets
VENEZUELA 401 082,11 309 154,57 0,63
Energy 401 082,11 309 154,57 0,63 1 000 000,00 PETROLEOS DE VENEZUELA SA 5.375% 12/04/2027 USD 401 082,11 309 154,57 0,63
MONTENEGRO 248 610,00 231 952,50 0,47
Government 248 610,00 231 952,50 0,47
250 000,00
MONTENEGRO GOVERNMENT INTERNATIONAL BOND 3.875% 18/03/2020
EUR 248 610,00 231 952,50 0,47
UNITED KINGDOM 219 681,96 207 024,07 0,42
Raw materials 219 681,96 207 024,07 0,42
220 416,00
COGNOR INTERNATIONAL FINANCE PLC 7.50% 01/02/2020
EUR 148 181,96 149 194,08 0,30
106 354,00
COGNOR INTERNATIONAL FINANCE PLC 5.00% 01/02/2021
EUR 71 500,00 57 829,99 0,12
SOUTH AFRICA 171 913,67 182 350,58 0,37
Multi-Utilities 171 913,67 182 350,58 0,37 200 000,00 ESKOM HLDG SOC LTD 7.125% 11/02/2025 USD 171 913,67 182 350,58 0,37
SINGAPORE 148 489,20 180 518,77 0,37
Raw materials 148 489,20 180 518,77 0,37 200 000,00 ABJA INVESTMENT CO PTE LTD 5.95% 31/07/2024 USD 148 489,20 180 518,77 0,37
MOROCCO 186 190,99 171 269,98 0,35
Raw materials 186 190,99 171 269,98 0,35 200 000,00 OCP SA 4.50% 22/10/2025 USD 186 190,99 171 269,98 0,35
Floating rate notes 523 545,98 525 599,18 1,07
CAYMAN ISLANDS 523 403,30 443 000,39 0,90
Finance 523 403,30 443 000,39 0,90 700 000,00 BANCO DO BRASIL SA FRN 29/10/2049 USD 523 403,30 443 000,39 0,90
MEXICO 0,00 82 111,53 0,17
Telecommunication 0,00 82 111,53 0,17 313 500,00 AXTEL SAB DE CV FRN 31/01/2020 MXN 0,00 82 111,53 0,17
ARGENTINA 142,68 487,26 0,00
Government 142,68 487,26 0,00
1 536,16
ARGENTINE REPUBLIC GOVERNMENT INTERNATIONAL BOND FRN 31/12/2033
ARS 142,68 477,58 0,00
1 430,00
ARGENTINE REPUBLIC GOVERNMENT INTERNATIONAL BOND FRN 15/12/2035
ARS 0,00 9,68 0,00
TRANSFERABLE SECURITIES AND MONEY MARKET INSTRUMENTS DEALT IN ON ANOTHER REGULATED MARKET 2 467 848,80 2 960 160,53 6,00
Ordinary Bonds 2 467 848,80 2 960 160,53 6,00
NETHERLANDS 567 745,25 691 683,54 1,40
Consumer Retail 567 745,25 691 683,54 1,40 750 000,00 VTR FINANCE BV 6.875% 15/01/2024 USD 567 745,25 691 683,54 1,40
ARGENTINA 382 384,13 625 043,35 1,27
Industries 382 384,13 625 043,35 1,27
684 990,75
TRANSPORTADORA DE GAS DEL SUR SA 9.625% 14/05/2020
USD 382 384,13 625 043,35 1,27
CHILE 436 433,04 438 089,02 0,89
Basic Goods 436 433,04 438 089,02 0,89 250 000,00 CENCOSUD SA 6.625% 12/02/2045 USD 218 513,97 211 894,20 0,43 250 000,00 CENCOSUD SA 5.15% 12/02/2025 USD 217 919,07 226 194,82 0,46
The accompanying notes form an integral part of these financial statements.
20

CompAM FUND - Active Emerging Credit
PORTFOLIO AS AT 30 JUNE 2015 IN EUR
Quantity /
Nominal Description Currency Acquisition cost Market value % of
Net Assets
MEXICO 323 109,43 360 637,15 0,73
Industries 323 109,43 360 637,15 0,73
375 000,00
SERVICIOS CORPORATIVOS JAVER SAPI DE CV 9.875% 06/04/2021
USD 323 109,43 360 637,15 0,73
VIRGIN ISLANDS 261 452,39 304 687,24 0,62
Consumer Retail 261 452,39 304 687,24 0,62
350 000,00
ARCOS DORADOS HOLDINGS INC 6.625% 27/09/2023
USD 261 452,39 304 687,24 0,62
CURACAO 215 532,11 273 543,37 0,55
Finance 215 532,11 273 543,37 0,55 300 000,00 SUAM FINANCE BV 4.875% 17/04/2024 USD 215 532,11 273 543,37 0,55
MALAYSIA 281 192,45 266 476,86 0,54
Energy 281 192,45 266 476,86 0,54 300 000,00 PETRONAS CAPITAL LTD 3.50% 18/03/2025 USD 281 192,45 266 476,86 0,54
OTHER TRANSFERABLE SECURITIES AND MONEY MARKET INSTRUMENTS 1 414 495,08 1 480 590,43 3,00
Ordinary Bonds 880 510,58 839 489,15 1,70
CANADA 521 202,35 486 136,95 0,98
Energy 521 202,35 486 136,95 0,98
750 000,00
PACIFIC RUBIALES ENERGY CORP 5.125% 28/03/2023
USD 521 202,35 486 136,95 0,98
ARMENIA 183 683,27 177 993,19 0,36
Government 183 683,27 177 993,19 0,36 200 000,00 REPUBLIC OF ARMENIA 7.15% 26/03/2025 USD 183 683,27 177 993,19 0,36
EGYPT 175 624,96 175 359,01 0,36
Government 175 624,96 175 359,01 0,36
200 000,00
EGYPT GOVERNMENT INTERNATIONAL BOND 5.875% 11/06/2025
USD 175 624,96 175 359,01 0,36
Floating rate notes 533 984,50 641 101,28 1,30
TANZANIA 533 984,50 641 101,28 1,30
Government 533 984,50 641 101,28 1,30
700 000,00
TANZANIA GOVERNMENT INTERNATIONAL BOND FRN 09/03/2020
USD 533 984,50 641 101,28 1,30
Total Portfolio 35 548 068,08 39 707 592,95 80,47
The accompanying notes form an integral part of these financial statements.
21

CompAM FUND - Active Emerging Credit
OPTIONS CONTRACTS AS AT 30 JUNE 2015
Quantity Call/Put Description Currency Acquisition cost Market value Commitment
(EUR)
LISTED ON AN OFFICIAL STOCK EXCHANGE 100 739,48 77 129,33 26 362 297,00
PURCHASED OPTIONS 100 739,48 77 129,33 26 362 297,00
250 EURODOLLAR FUTURE OPTION 99,38 14/12/15 USD 51 306,59 30 851,73 22,842,514.00
75 10YR US TREASURY NOTE FUTURE 126,50 24/07/15 USD 49 432,89 46 277,60 3,519,783.00
The accompanying notes form an integral part of these financial statements.
22

CompAM FUND - Active Emerging Credit
FORWARD FOREIGN EXCHANGE CONTRACTS AS AT 30 JUNE 2015
Maturity Purchase commitment in
currency Sale commitment in
currency Unrealised profit/(loss)
(EUR)
Net Unrealised profit / (loss) on forward foreign exchange contracts 815 327,39
Unrealised profit on forward foreign exchange contracts 820 283,69
30/09/2015 9 725 112,74 EUR 10 500 000,00 USD 313 355,80 30/10/2015 10 356 264,93 EUR 11 000 000,00 USD 501 628,68 30/11/2015 12 987 745,84 EUR 14 500 000,00 USD 4 831,50 30/09/2015 986 621,41 EUR 700 000,00 GBP 467,71
Unrealised loss on forward foreign exchange contracts (4 956,30)
30/09/2015 2 882 558,79 EUR 3 000 000,00 CHF (4 956,30)
The accompanying notes form an integral part of these financial statements.
23

CompAM FUND - Active European Equity
STATEMENT OF NET ASSETS AS AT 30 JUNE 2015 IN EUR
Assets Notes Investments in securities at market value (Note 1) 25 400 808,44 Cash at banks 11 182 147,77 Amounts due from brokers (Note 8) 195 782,64 Unrealised profit on futures contracts (Note 1, 8) 27 390,50 Dividends receivable 32 994,61 Interests receivable 925,00 Other assets 5 180,42 Total assets 36 845 229,38
Liabilities Unrealised loss on futures contracts (Note 1, 8) (30 265,38) Other liabilities (399 910,25) Total liabilities (430 175,63) Total net assets 36 415 053,75
Currency Net Asset Value per Share Shares outstanding
Class A Shares EUR 1 445,161 13 728,787 Class B Shares EUR 1 360,124 47,367 Class M Shares EUR 126,450 112 398,220 Class Y Shares EUR 1 038,520 1 606,417 Class Z Shares EUR 1 198,742 524,968
The accompanying notes form an integral part of these financial statements.
24

CompAM FUND - Active European Equity
STATEMENT OF OPERATIONS AND CHANGES IN NET ASSETS FOR THE PERIOD ENDED 30 JUNE 2015 IN EUR
Net assets at the beginning of the period Notes 31 648 178,06
Net income from investments (Note 1d) 465 553,99 Total Income 465 553,99 Investment Management fees (Note 2) (279 349,02) Management Company fees (Note 3) (13 277,21) Performance fees (Note 4) (191 893,80) Custodian fees (9 483,69) Subscription tax (Note 5) (9 897,25) Custodian transaction fees (Note 6) (1,81) Other charges and taxes (38 355,72) Total expenses (542 258,50) Net investment income / (loss) (76 704,51) Net realised profit / (loss) on sales of investments, currencies and other financial instruments 1 630 936,12 Change in unrealised appreciation / (depreciation) on: - Investments 209 726,31 - Futures contracts (Note 1i) 2 219,99 Net result of operations for the period 1 766 177,91
Subscriptions for the period 13 931 819,66 Redemptions for the period (10 931 121,88)
Net assets at the end of the period 36 415 053,75
The accompanying notes form an integral part of these financial statements.
25
CompAM FUND - Active European Equity
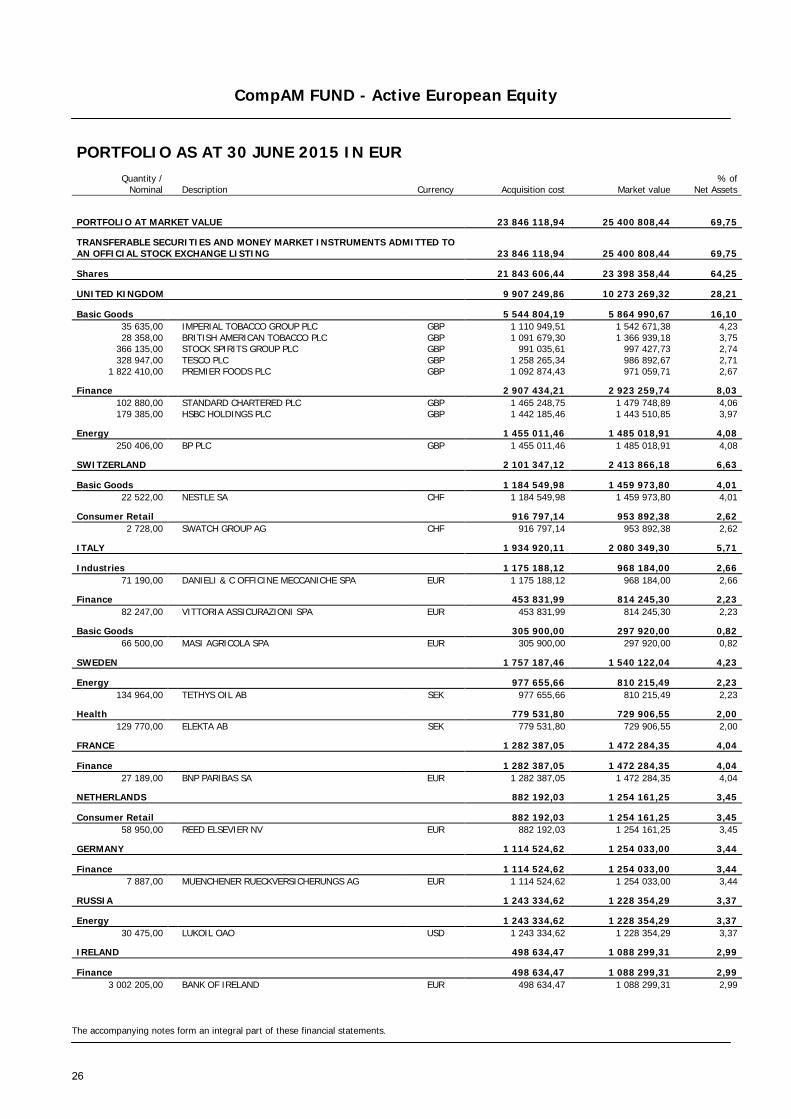
PORTFOLIO AS AT 30 JUNE 2015 IN EUR
Quantity /
Nominal Description Currency Acquisition cost Market value % of
Net Assets
PORTFOLIO AT MARKET VALUE 23 846 118,94 25 400 808,44 69,75
TRANSFERABLE SECURITIES AND MONEY MARKET INSTRUMENTS ADMITTED TO AN OFFICIAL STOCK EXCHANGE LISTING 23 846 118,94 25 400 808,44 69,75
Shares 21 843 606,44 23 398 358,44 64,25
UNITED KINGDOM 9 907 249,86 10 273 269,32 28,21
Basic Goods 5 544 804,19 5 864 990,67 16,10 35 635,00 IMPERIAL TOBACCO GROUP PLC GBP 1 110 949,51 1 542 671,38 4,23 28 358,00 BRITISH AMERICAN TOBACCO PLC GBP 1 091 679,30 1 366 939,18 3,75 366 135,00 STOCK SPIRITS GROUP PLC GBP 991 035,61 997 427,73 2,74 328 947,00 TESCO PLC GBP 1 258 265,34 986 892,67 2,71 1 822 410,00 PREMIER FOODS PLC GBP 1 092 874,43 971 059,71 2,67
Finance 2 907 434,21 2 923 259,74 8,03 102 880,00 STANDARD CHARTERED PLC GBP 1 465 248,75 1 479 748,89 4,06 179 385,00 HSBC HOLDINGS PLC GBP 1 442 185,46 1 443 510,85 3,97
Energy 1 455 011,46 1 485 018,91 4,08 250 406,00 BP PLC GBP 1 455 011,46 1 485 018,91 4,08
SWITZERLAND 2 101 347,12 2 413 866,18 6,63
Basic Goods 1 184 549,98 1 459 973,80 4,01 22 522,00 NESTLE SA CHF 1 184 549,98 1 459 973,80 4,01
Consumer Retail 916 797,14 953 892,38 2,62 2 728,00 SWATCH GROUP AG CHF 916 797,14 953 892,38 2,62
ITALY 1 934 920,11 2 080 349,30 5,71
Industries 1 175 188,12 968 184,00 2,66 71 190,00 DANIELI & C OFFICINE MECCANICHE SPA EUR 1 175 188,12 968 184,00 2,66
Finance 453 831,99 814 245,30 2,23 82 247,00 VITTORIA ASSICURAZIONI SPA EUR 453 831,99 814 245,30 2,23
Basic Goods 305 900,00 297 920,00 0,82 66 500,00 MASI AGRICOLA SPA EUR 305 900,00 297 920,00 0,82
SWEDEN 1 757 187,46 1 540 122,04 4,23
Energy 977 655,66 810 215,49 2,23 134 964,00 TETHYS OIL AB SEK 977 655,66 810 215,49 2,23
Health 779 531,80 729 906,55 2,00 129 770,00 ELEKTA AB SEK 779 531,80 729 906,55 2,00
FRANCE 1 282 387,05 1 472 284,35 4,04
Finance 1 282 387,05 1 472 284,35 4,04 27 189,00 BNP PARIBAS SA EUR 1 282 387,05 1 472 284,35 4,04
NETHERLANDS 882 192,03 1 254 161,25 3,45
Consumer Retail 882 192,03 1 254 161,25 3,45 58 950,00 REED ELSEVIER NV EUR 882 192,03 1 254 161,25 3,45
GERMANY 1 114 524,62 1 254 033,00 3,44
Finance 1 114 524,62 1 254 033,00 3,44 7 887,00 MUENCHENER RUECKVERSICHERUNGS AG EUR 1 114 524,62 1 254 033,00 3,44
RUSSIA 1 243 334,62 1 228 354,29 3,37
Energy 1 243 334,62 1 228 354,29 3,37 30 475,00 LUKOIL OAO USD 1 243 334,62 1 228 354,29 3,37
IRELAND 498 634,47 1 088 299,31 2,99
Finance 498 634,47 1 088 299,31 2,99 3 002 205,00 BANK OF IRELAND EUR 498 634,47 1 088 299,31 2,99
The accompanying notes form an integral part of these financial statements.
26

CompAM FUND - Active European Equity
PORTFOLIO AS AT 30 JUNE 2015 IN EUR
Quantity /
Nominal Description Currency Acquisition cost Market value % of
Net Assets
GREECE 1 121 829,10 793 619,40 2,18
Consumer Retail 1 121 829,10 793 619,40 2,18 119 548,00 OPAP SA EUR 1 121 829,10 793 619,40 2,18
Zero-Coupon Bonds 2 002 512,50 2 002 450,00 5,50
GERMANY 2 002 512,50 2 002 450,00 5,50
Government 2 002 512,50 2 002 450,00 5,50 2 000 000,00 BUNDESSCHATZANWEISUNGEN 0.00% 11/12/2015 EUR 2 002 512,50 2 002 450,00 5,50
Total Portfolio 23 846 118,94 25 400 808,44 69,75
The accompanying notes form an integral part of these financial statements.
27

CompAM FUND - Active European Equity
COMMITMENTS ON FUTURE CONTRACTS AS AT 30 JUNE 2015
Size Quantity
Purchase /
Sale Description Maturity Currency
Unrealised profit / (loss)
(EUR) Commitment
(EUR)
Total Unrealised profit / (loss) on futures contracts and commitment (2 874,88) 5 772 735,23
Unrealised profit on futures contracts and commitment 27 390,50 3 399 159,00
1 110 Purchase IBEX MINI INDEX 17/07/2015 EUR 4 625,50 1 185 239,00
10 32 Purchase EURO STOXX 50 18/09/2015 EUR 7 040,00 1 099 520,00 25 2 Purchase DAX INDEX 18/09/2015 EUR 3 775,00 550 075,00 5 5 Purchase FTSE/MIB INDEX 18/09/2015 EUR 11 950,00 564 325,00
Unrealised loss on futures contracts and commitment (30 265,38) 2 373 576,23
10 14 Purchase SWISS MARKET INDEX 18/09/2015 CHF (6 319,17) 1 181 954,21 10 13 Purchase FTSE 100 INDEX 18/09/2015 GBP (23 946,21) 1 191 622,02
The accompanying notes form an integral part of these financial statements.
28

CompAM FUND - Active Liquid Bond
STATEMENT OF NET ASSETS AS AT 30 JUNE 2015 IN EUR
Assets Notes Investments in securities at market value (Note 1) 13 440 944,98 Cash at banks 692 742,59 Interests receivable 114 929,05 Total assets 14 248 616,62
Liabilities Unrealised loss on forward foreign exchange contracts (Note 1, 8) (826,06) Other liabilities (62 495,17) Total liabilities (63 321,23) Total net assets 14 185 295,39
Currency Net Asset Value per Share Shares outstanding
Class A Shares EUR 1 240,612 7 736,125 Class B Shares EUR 1 194,579 791,375 Class D Shares EUR 96,145 2 308,537 Class M Shares EUR 113,250 6 980,258 Class Y Shares EUR 1 014,002 2 348,659 Class Z Shares EUR 1 170,989 212,119
The accompanying notes form an integral part of these financial statements.
29

CompAM FUND - Active Liquid Bond
STATEMENT OF OPERATIONS AND CHANGES IN NET ASSETS FOR THE PERIOD ENDED 30 JUNE 2015 IN EUR
Net assets at the beginning of the period Notes 23 692 544,16
Net income from investments (Note 1d) 146 076,04 Total Income 146 076,04 Investment Management fees (Note 2) (90 622,30) Management Company fees (Note 3) (7 502,32) Performance fees (Note 4) (12 520,88) Custodian fees (5 358,86) Subscription tax (Note 5) (4 685,38) Custodian transaction fees (Note 6) (2 526,76) Other charges and taxes (35 069,43) Total expenses (158 285,93) Net investment income / (loss) (12 209,89) Net realised profit / (loss) on sales of investments, currencies and other financial instruments 361 858,91 Change in unrealised appreciation / (depreciation) on: - Investments (237 116,96) - Forward foreign exchange contracts (Note 1h) (483,80) Net result of operations for the period 112 048,26
Distributions (Note 7) (2 006,08) Subscriptions for the period 4 568 729,16 Redemptions for the period (14 186 020,11)
Net assets at the end of the period 14 185 295,39
The accompanying notes form an integral part of these financial statements.
30

CompAM FUND - Active Liquid Bond
PORTFOLIO AS AT 30 JUNE 2015 IN EUR
Quantity /
Nominal Description Currency Acquisition cost Market value % of
Net Assets
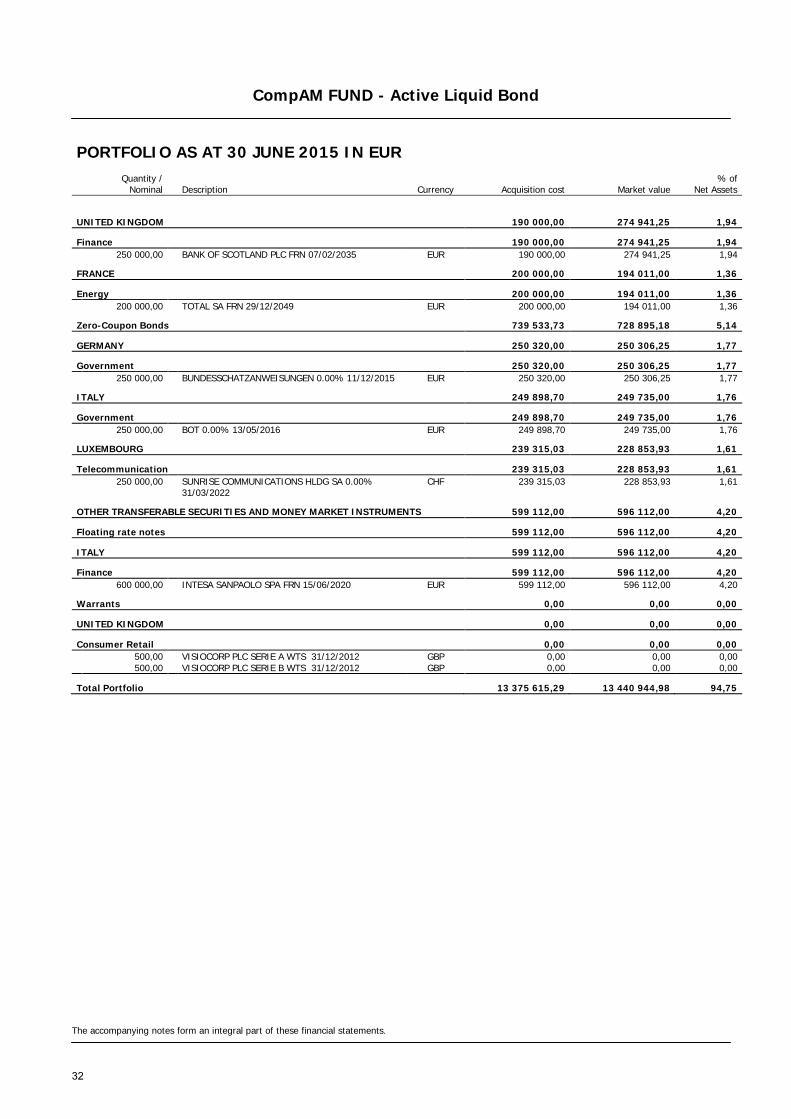
PORTFOLIO AT MARKET VALUE 13 375 615,29 13 440 944,98 94,75
TRANSFERABLE SECURITIES AND MONEY MARKET INSTRUMENTS ADMITTED TO AN OFFICIAL STOCK EXCHANGE LISTING 12 776 503,29 12 844 832,98 90,55
Ordinary Bonds 10 146 969,56 10 146 408,05 71,53
LUXEMBOURG 5 853 973,75 5 880 793,75 41,46
Supranational 5 603 973,75 5 630 842,50 39,70 3 000 000,00 EIB 2.625% 15/03/2016 EUR 3 086 730,00 3 057 780,00 21,56 2 500 000,00 EFSF 2.75% 18/07/2016 EUR 2 517 243,75 2 573 062,50 18,14
Energy 250 000,00 249 951,25 1,76 250 000,00 TRAFIGURA FUNDING SA 5.00% 27/04/2020 EUR 250 000,00 249 951,25 1,76
FRANCE 1 998 295,00 1 979 330,00 13,95
Government 1 499 100,00 1 485 270,00 10,47 1 500 000,00 UNEDIC 0.125% 05/03/2020 EUR 1 499 100,00 1 485 270,00 10,47
Finance 499 195,00 494 060,00 3,48 500 000,00 DEXIA CREDIT LOCAL SA 0.25% 19/03/2020 EUR 499 195,00 494 060,00 3,48
FINLAND 698 254,00 694 502,00 4,90
Finance 499 320,00 497 170,00 3,51
500 000,00
SAASTOPANKKIEN KESKUSPANKKI SUOMI OYJ 1.00% 06/05/2020
EUR 499 320,00 497 170,00 3,51
Energy 198 934,00 197 332,00 1,39 200 000,00 NESTE OIL OYJ 2.125% 17/03/2022 EUR 198 934,00 197 332,00 1,39
IRELAND 499 645,00 486 225,00 3,43
Finance 499 645,00 486 225,00 3,43 250 000,00 ALLIED IRISH BANKS PLC 1.375% 16/03/2020 EUR 249 927,50 243 256,25 1,72 250 000,00 BANK OF IRELAND 1.25% 09/04/2020 EUR 249 717,50 242 968,75 1,71
UNITED KINGDOM 449 308,00 469 907,25 3,31
Energy 250 000,00 264 586,25 1,86 250 000,00 BP CAPITAL MARKETS PLC 2.177% 28/09/2021 EUR 250 000,00 264 586,25 1,86
Multi-Utilities 199 308,00 205 321,00 1,45 200 000,00 ICAP GROUP HOLDINGS PLC 3.125% 06/03/2019 EUR 199 308,00 205 321,00 1,45
ITALY 249 087,50 257 171,25 1,81
Finance 249 087,50 257 171,25 1,81 250 000,00 BANCO POPOLARE SC 3.50% 14/03/2019 EUR 249 087,50 257 171,25 1,81
NETHERLANDS 247 667,50 230 782,50 1,63
Finance 247 667,50 230 782,50 1,63 250 000,00 ABN AMRO BANK NV 1.00% 16/04/2025 EUR 247 667,50 230 782,50 1,63
DENMARK 150 738,81 147 696,30 1,04
Government 150 738,81 147 696,30 1,04 1 000 000,00 DENMARK GOVERNMENT BOND 4.00% 15/11/2017 DKK 150 738,81 147 696,30 1,04
Floating rate notes 1 890 000,00 1 969 529,75 13,88
UNITED STATES 1 000 000,00 999 765,00 7,05
Basic Goods 1 000 000,00 999 765,00 7,05 500 000,00 COCA-COLA CO FRN 09/09/2019 EUR 500 000,00 499 965,00 3,53 500 000,00 COCA-COLA CO FRN 09/03/2017 EUR 500 000,00 499 800,00 3,52
NORWAY 500 000,00 500 812,50 3,53
Energy 500 000,00 500 812,50 3,53 500 000,00 STATOIL ASA FRN 19/08/2019 EUR 500 000,00 500 812,50 3,53
The accompanying notes form an integral part of these financial statements.
31
CompAM FUND - Active Liquid Bond
PORTFOLIO AS AT 30 JUNE 2015 IN EUR
Quantity /
Nominal Description Currency Acquisition cost Market value % of
Net Assets
UNITED KINGDOM 190 000,00 274 941,25 1,94
Finance 190 000,00 274 941,25 1,94 250 000,00 BANK OF SCOTLAND PLC FRN 07/02/2035 EUR 190 000,00 274 941,25 1,94
FRANCE 200 000,00 194 011,00 1,36
Energy 200 000,00 194 011,00 1,36 200 000,00 TOTAL SA FRN 29/12/2049 EUR 200 000,00 194 011,00 1,36
Zero-Coupon Bonds 739 533,73 728 895,18 5,14
GERMANY 250 320,00 250 306,25 1,77
Government 250 320,00 250 306,25 1,77 250 000,00 BUNDESSCHATZANWEISUNGEN 0.00% 11/12/2015 EUR 250 320,00 250 306,25 1,77
ITALY 249 898,70 249 735,00 1,76
Government 249 898,70 249 735,00 1,76 250 000,00 BOT 0.00% 13/05/2016 EUR 249 898,70 249 735,00 1,76
LUXEMBOURG 239 315,03 228 853,93 1,61
Telecommunication 239 315,03 228 853,93 1,61
250 000,00
SUNRISE COMMUNICATIONS HLDG SA 0.00% 31/03/2022
CHF 239 315,03 228 853,93 1,61
OTHER TRANSFERABLE SECURITIES AND MONEY MARKET INSTRUMENTS 599 112,00 596 112,00 4,20
Floating rate notes 599 112,00 596 112,00 4,20
ITALY 599 112,00 596 112,00 4,20
Finance 599 112,00 596 112,00 4,20 600 000,00 INTESA SANPAOLO SPA FRN 15/06/2020 EUR 599 112,00 596 112,00 4,20
Warrants 0,00 0,00 0,00
UNITED KINGDOM 0,00 0,00 0,00
Consumer Retail 0,00 0,00 0,00 500,00 VISIOCORP PLC SERIE A WTS 31/12/2012 GBP 0,00 0,00 0,00 500,00 VISIOCORP PLC SERIE B WTS 31/12/2012 GBP 0,00 0,00 0,00
Total Portfolio 13 375 615,29 13 440 944,98 94,75
The accompanying notes form an integral part of these financial statements.
32

CompAM FUND - Active Liquid Bond
FORWARD FOREIGN EXCHANGE CONTRACTS AS AT 30 JUNE 2015
Maturity Purchase commitment in
currency Sale commitment in
currency Unrealised profit/(loss)
(EUR)
Net Unrealised profit / (loss) on forward foreign exchange contracts (826,06)
Unrealised loss on forward foreign exchange contracts (826,06)
30/09/2015 480 426,46 EUR 500 000,00 CHF (826,06)
The accompanying notes form an integral part of these financial statements.
33

CompAM FUND - Active European Credit
STATEMENT OF NET ASSETS AS AT 30 JUNE 2015 IN EUR
Assets Notes Investments in securities at market value (Note 1) 34 347 005,02 Cash at banks 4 345 823,06 Amounts due from brokers (Note 8) 53 251,00 Options contracts at market value (Note 1, 8) 12 925,00 Unrealised profit on forward foreign exchange contracts (Note 1, 8) 20,07 Interests receivable 401 635,04 Receivable on investments sold 2 086 435,11 Total assets 41 247 094,30
Liabilities Unrealised loss on forward foreign exchange contracts (Note 1, 8) (43 598,68) Payable on investments purchased (500 000,00) Payable on redemptions (11 109,42) Other liabilities (153 172,52) Total liabilities (707 880,62) Total net assets 40 539 213,68
Currency Net Asset Value per Share Shares outstanding
Class A Shares EUR 1 480,410 11 070,175 Class B Shares EUR 1 410,973 1 677,134 Class D Shares EUR 94,647 23 725,385 Class M Shares EUR 153,372 97 724,189 Class Y Shares EUR 1 126,608 2 413,103 Class Z Shares EUR 1 705,871 1 074,002
The accompanying notes form an integral part of these financial statements.
34
CompAM FUND - Active European Credit
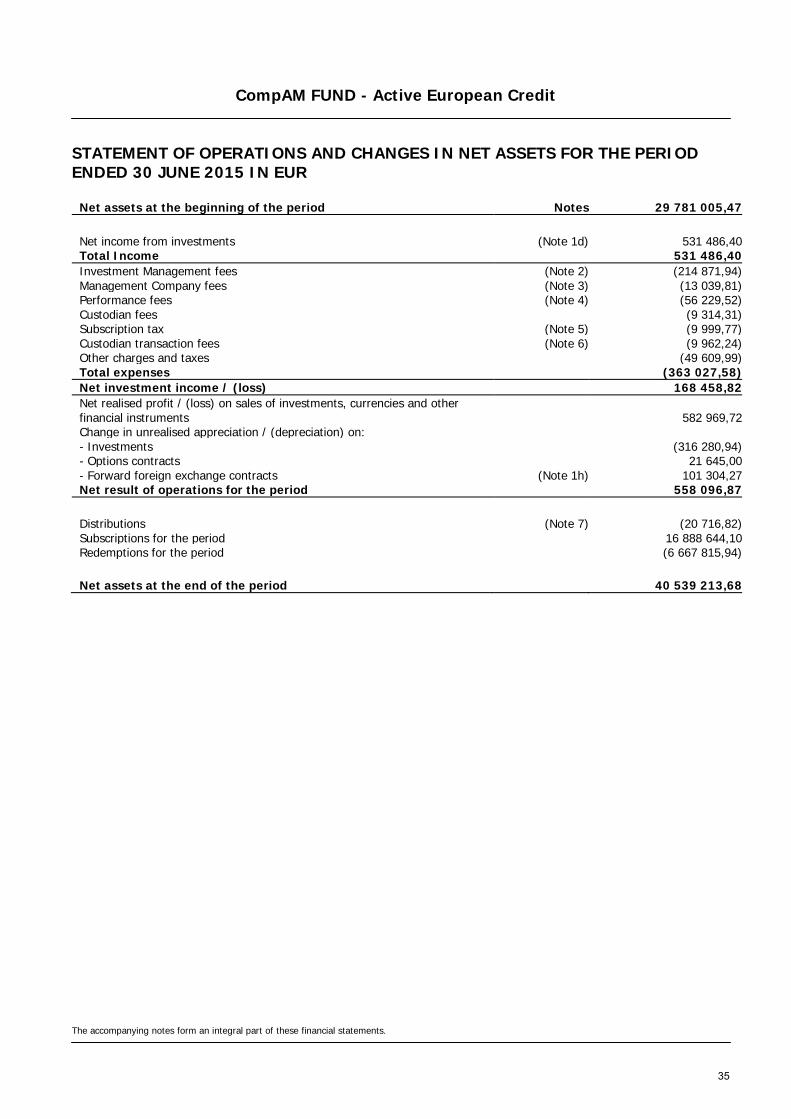
STATEMENT OF OPERATIONS AND CHANGES IN NET ASSETS FOR THE PERIOD ENDED 30 JUNE 2015 IN EUR
Net assets at the beginning of the period Notes 29 781 005,47
Net income from investments (Note 1d) 531 486,40 Total Income 531 486,40 Investment Management fees (Note 2) (214 871,94) Management Company fees (Note 3) (13 039,81) Performance fees (Note 4) (56 229,52) Custodian fees (9 314,31) Subscription tax (Note 5) (9 999,77) Custodian transaction fees (Note 6) (9 962,24) Other charges and taxes (49 609,99) Total expenses (363 027,58) Net investment income / (loss) 168 458,82 Net realised profit / (loss) on sales of investments, currencies and other financial instruments 582 969,72 Change in unrealised appreciation / (depreciation) on: - Investments (316 280,94) - Options contracts 21 645,00 - Forward foreign exchange contracts (Note 1h) 101 304,27 Net result of operations for the period 558 096,87
Distributions (Note 7) (20 716,82) Subscriptions for the period 16 888 644,10 Redemptions for the period (6 667 815,94)
Net assets at the end of the period 40 539 213,68
The accompanying notes form an integral part of these financial statements.
35

CompAM FUND - Active European Credit
PORTFOLIO AS AT 30 JUNE 2015 IN EUR
Quantity /
Nominal Description Currency Acquisition cost Market value % of
Net Assets
PORTFOLIO AT MARKET VALUE 34 202 465,93 34 347 005,02 84,73
TRANSFERABLE SECURITIES AND MONEY MARKET INSTRUMENTS ADMITTED TO AN OFFICIAL STOCK EXCHANGE LISTING 32 988 042,65 33 627 271,12 82,95
Ordinary Bonds 20 276 801,19 20 703 899,19 51,07
LUXEMBOURG 7 384 356,26 7 271 335,99 17,94
Supranational 5 194 950,00 5 146 125,00 12,70 5 000 000,00 EFSF 2.75% 18/07/2016 EUR 5 194 950,00 5 146 125,00 12,70
Telecommunication 1 689 406,26 1 625 308,49 4,01 600 000,00 MATTERHORN TELECOM SA 3.875% 01/05/2022 EUR 600 000,00 571 503,00 1,41 600 000,00 MATTERHORN TELECOM SA 3.652% 01/05/2022 CHF 581 281,26 551 525,49 1,36 500 000,00 WIND ACQUISITION FINANCE SA 4.00% 15/07/2020 EUR 508 125,00 502 280,00 1,24
Energy 500 000,00 499 902,50 1,23 500 000,00 TRAFIGURA FUNDING SA 5.00% 27/04/2020 EUR 500 000,00 499 902,50 1,23
UNITED KINGDOM 3 967 698,13 4 265 875,19 10,52
Raw materials 1 277 761,10 1 057 355,60 2,61 500 000,00 INEOS FINANCE PLC 4.00% 01/05/2023 EUR 500 000,00 477 687,50 1,18
617 166,00
COGNOR INTERNATIONAL FINANCE PLC 7.50% 01/02/2020
EUR 524 623,24 417 744,24 1,03
297 791,00
COGNOR INTERNATIONAL FINANCE PLC 5.00% 01/02/2021
EUR 253 137,86 161 923,86 0,40
Energy 565 738,85 799 163,23 1,97
500 000,00
SOUTHERN WATER GREENSANDS FINANCING PLC 8.50% 15/04/2019
GBP 565 738,85 799 163,23 1,97
Consumer Retail 606 867,97 729 618,30 1,80
500 000,00
JAGUAR LAND ROVER AUTOMOTIVE PLC 5.00% 15/02/2022
GBP 606 867,97 729 618,30 1,80
Finance 517 330,21 669 198,06 1,65 450 000,00 GALA GROUP FINANCE PLC 8.875% 01/09/2018 GBP 517 330,21 669 198,06 1,65
Industries 500 000,00 521 387,50 1,28 500 000,00 EC FINANCE PLC 5.125% 15/07/2021 EUR 500 000,00 521 387,50 1,28
Health 500 000,00 489 152,50 1,21 500 000,00 EPHIOS BONDCO PLC 6.25% 01/07/2022 EUR 500 000,00 489 152,50 1,21
FRANCE 3 446 170,50 3 433 717,50 8,47
Government 1 998 800,00 1 980 360,00 4,88 2 000 000,00 UNEDIC 0.125% 05/03/2020 EUR 1 998 800,00 1 980 360,00 4,88
Finance 748 792,50 741 090,00 1,83 750 000,00 DEXIA CREDIT LOCAL SA 0.25% 19/03/2020 EUR 748 792,50 741 090,00 1,83
Consumer Retail 500 000,00 507 367,50 1,25 250 000,00 NUMERICABLE GROUP SA 5.375% 15/05/2022 EUR 250 000,00 254 608,75 0,63 250 000,00 NUMERICABLE GROUP SA 5.625% 15/05/2024 EUR 250 000,00 252 758,75 0,62
Industries 198 578,00 204 900,00 0,51 200 000,00 EUROPCAR GROUPE SA 5.75% 15/06/2022 EUR 198 578,00 204 900,00 0,51
NETHERLANDS 2 335 906,16 2 592 430,18 6,39
Telecommunication 1 328 406,16 1 533 175,18 3,78 1 000 000,00 UPC HOLDING BV 6.75% 15/03/2023 CHF 828 406,16 1 045 530,18 2,58 500 000,00 ZIGGO SECURED FINANCE BV 3.75% 15/01/2025 EUR 500 000,00 487 645,00 1,20
Consumer Retail 1 007 500,00 1 059 255,00 2,61 1 000 000,00 ADRIA BIDCO BV 7.875% 15/11/2020 EUR 1 007 500,00 1 059 255,00 2,61
The accompanying notes form an integral part of these financial statements.
36

CompAM FUND - Active European Credit
PORTFOLIO AS AT 30 JUNE 2015 IN EUR
Quantity /
Nominal Description Currency Acquisition cost Market value % of
Net Assets
IRELAND 999 435,00 984 847,50 2,43
Consumer Retail 500 000,00 498 910,00 1,23
500 000,00
ARDAGH PACKAGING FINANCE PLC 4.25% 15/01/2022
EUR 500 000,00 498 910,00 1,23
Finance 499 435,00 485 937,50 1,20 500 000,00 BANK OF IRELAND 1.25% 09/04/2020 EUR 499 435,00 485 937,50 1,20
FINLAND 499 320,00 497 170,00 1,23
Finance 499 320,00 497 170,00 1,23
500 000,00
SAASTOPANKKIEN KESKUSPANKKI SUOMI OYJ 1.00% 06/05/2020
EUR 499 320,00 497 170,00 1,23
SWITZERLAND 472 663,86 485 995,28 1,20
Finance 472 663,86 485 995,28 1,20 500 000,00 ZUERCHER KANTONALBANK 0.25% 31/03/2021 CHF 472 663,86 485 995,28 1,20
CAYMAN ISLANDS 500 000,00 471 875,00 1,16
Telecommunication 500 000,00 471 875,00 1,16 500 000,00 UPCB FINANCE IV LTD 4.00% 15/01/2027 EUR 500 000,00 471 875,00 1,16
JERSEY 446 251,28 460 426,80 1,14
Finance 446 251,28 460 426,80 1,14 500 000,00 HBOS CAPITAL FUNDING LP 6.85% 29/03/2049 USD 446 251,28 460 426,80 1,14
GERMANY 225 000,00 240 225,75 0,59
Consumer Retail 225 000,00 240 225,75 0,59
225 000,00
UNITYMEDIA HESSEN GMBH & CO KG 5.50% 15/09/2022
EUR 225 000,00 240 225,75 0,59
Floating rate notes 9 759 578,83 10 007 906,20 24,69
SWITZERLAND 1 707 892,90 1 877 150,98 4,63
Finance 1 707 892,90 1 877 150,98 4,63 500 000,00 CREDIT SUISSE AG FRN 18/09/2025 EUR 496 605,00 556 325,00 1,37 600 000,00 UBS AG FRN 22/05/2023 USD 466 490,40 544 698,48 1,35 500 000,00 UBS AG FRN 12/02/2026 EUR 497 035,00 531 990,00 1,31
250 000,00
DEMETER INVESTMENTS BV FOR SWISS LIFE AG FRN 29/12/2049
EUR 247 762,50 244 137,50 0,60
IRELAND 1 587 456,63 1 827 339,72 4,51
Finance 1 587 456,63 1 827 339,72 4,51
1 000 000,00
WILLOW NO 2 IRELAND PLC FOR ZURICH INSURANCE CO LTD FRN 01/10/2045
USD 934 118,30 840 589,72 2,07
1 000 000,00 DEPFA BANK PLC FRN 15/12/2015 EUR 653 338,33 986 750,00 2,44
UNITED STATES 1 750 000,00 1 745 606,25 4,31
Basic Goods 1 000 000,00 999 930,00 2,47 1 000 000,00 COCA-COLA CO FRN 09/09/2019 EUR 1 000 000,00 999 930,00 2,47
Finance 750 000,00 745 676,25 1,84 750 000,00 GOLDMAN SACHS GROUP INC FRN 29/05/2020 EUR 750 000,00 745 676,25 1,84
UNITED KINGDOM 594 330,00 1 319 718,00 3,25
Finance 594 330,00 1 319 718,00 3,25 1 200 000,00 BANK OF SCOTLAND PLC FRN 07/02/2035 EUR 594 330,00 1 319 718,00 3,25
FRANCE 999 880,00 991 487,50 2,45
Finance 999 880,00 991 487,50 2,45 500 000,00 LA MONDIALE SAM FRN 29/12/2049 EUR 500 000,00 509 067,50 1,26
500 000,00
CREDIT AGRICOLE ASSURANCES SA FRN 29/01/2049
EUR 499 880,00 482 420,00 1,19
The accompanying notes form an integral part of these financial statements.
37

CompAM FUND - Active European Credit
PORTFOLIO AS AT 30 JUNE 2015 IN EUR
Quantity /
Nominal Description Currency Acquisition cost Market value % of
Net Assets
SWEDEN 886 450,00 874 942,50 2,16
Consumer Retail 511 450,00 500 505,00 1,24 500 000,00 VOLVO TREASURY AB FRN 10/03/2078 EUR 511 450,00 500 505,00 1,24
Finance 375 000,00 374 437,50 0,92 500 000,00 NORDEA BANK AB FRN 29/09/2049 EUR 375 000,00 374 437,50 0,92
GREECE 948 989,80 633 097,50 1,56
Government 948 989,80 633 097,50 1,56
1 550 000,00
HELLENIC REPUBLIC GOVERNMENT BOND FRN 24/02/2027
EUR 948 989,80 633 097,50 1,56
NETHERLANDS 1 034 579,50 486 910,00 1,20
Consumer Retail 492 865,00 459 910,00 1,13
500 000,00
VOLKSWAGEN INTERNATIONAL FINANCE NV FRN 29/12/2049
EUR 492 865,00 459 910,00 1,13
Industries 541 714,50 27 000,00 0,07 600 000,00 PFLEIDERER FINANCE BV FRN 29/05/2049 EUR 541 714,50 27 000,00 0,07
LUXEMBOURG 250 000,00 251 653,75 0,62
Telecommunication 250 000,00 251 653,75 0,62 250 000,00 MATTERHORN TELECOM SA FRN 01/05/2022 EUR 250 000,00 251 653,75 0,62
Zero-Coupon Bonds 2 951 662,63 2 915 465,73 7,19
ITALY 1 997 858,02 2 000 050,00 4,93
Government 1 997 858,02 2 000 050,00 4,93 2 000 000,00 BOT 0.00% 14/08/2015 EUR 1 997 858,02 2 000 050,00 4,93
LUXEMBOURG 953 804,61 915 415,73 2,26
Telecommunication 953 804,61 915 415,73 2,26
1 000 000,00
SUNRISE COMMUNICATIONS HLDG SA 0.00% 31/03/2022
CHF 953 804,61 915 415,73 2,26
TRANSFERABLE SECURITIES AND MONEY MARKET INSTRUMENTS DEALT IN ON ANOTHER REGULATED MARKET 193 853,28 222 973,90 0,55
Ordinary Bonds 193 853,28 222 973,90 0,55
LUXEMBOURG 193 853,28 222 973,90 0,55
Industries 193 853,28 222 973,90 0,55 250 000,00 AGUILA 3 SA 7.875% 31/01/2018 USD 193 853,28 222 973,90 0,55
OTHER TRANSFERABLE SECURITIES AND MONEY MARKET INSTRUMENTS 1 020 570,00 496 760,00 1,23
Warrants 0,00 0,00 0,00
UNITED KINGDOM 0,00 0,00 0,00
Consumer Retail 0,00 0,00 0,00 850,00 VISIOCORP PLC SERIE A WTS 31/12/2012 GBP 0,00 0,00 0,00 850,00 VISIOCORP PLC SERIE B WTS 31/12/2012 GBP 0,00 0,00 0,00
Floating rate notes 1 020 570,00 496 760,00 1,23
ITALY 499 260,00 496 760,00 1,23
Finance 499 260,00 496 760,00 1,23 500 000,00 INTESA SANPAOLO SPA FRN 15/06/2020 EUR 499 260,00 496 760,00 1,23
IRELAND 521 310,00 0,00 0,00
Consumer Retail 521 310,00 0,00 0,00 1 000 000,00 WATERFORD WEDGWOOD PLC FRN 01/12/2010 EUR 521 310,00 0,00 0,00
Total Portfolio 34 202 465,93 34 347 005,02 84,73
The accompanying notes form an integral part of these financial statements.
38

CompAM FUND - Active European Credit
OPTIONS CONTRACTS AS AT 30 JUNE 2015
Quantity Call/Put Description Currency Acquisition cost Market value Commitment
(EUR)
LISTED ON AN OFFICIAL STOCK EXCHANGE 49 280,00 40 675,00 2 832 666,00
PURCHASED OPTIONS 49 280,00 40 675,00 2 832 666,00
22 FTSE MIB INDEX 21 000,00 17/07/15 EUR 19 030,00 12 925,00 267,740.00 25 OGBL CALL 150,50 24/07/15 EUR 30 250,00 27 750,00 2,564,926.00
The accompanying notes form an integral part of these financial statements.
39
CompAM FUND - Active European Credit
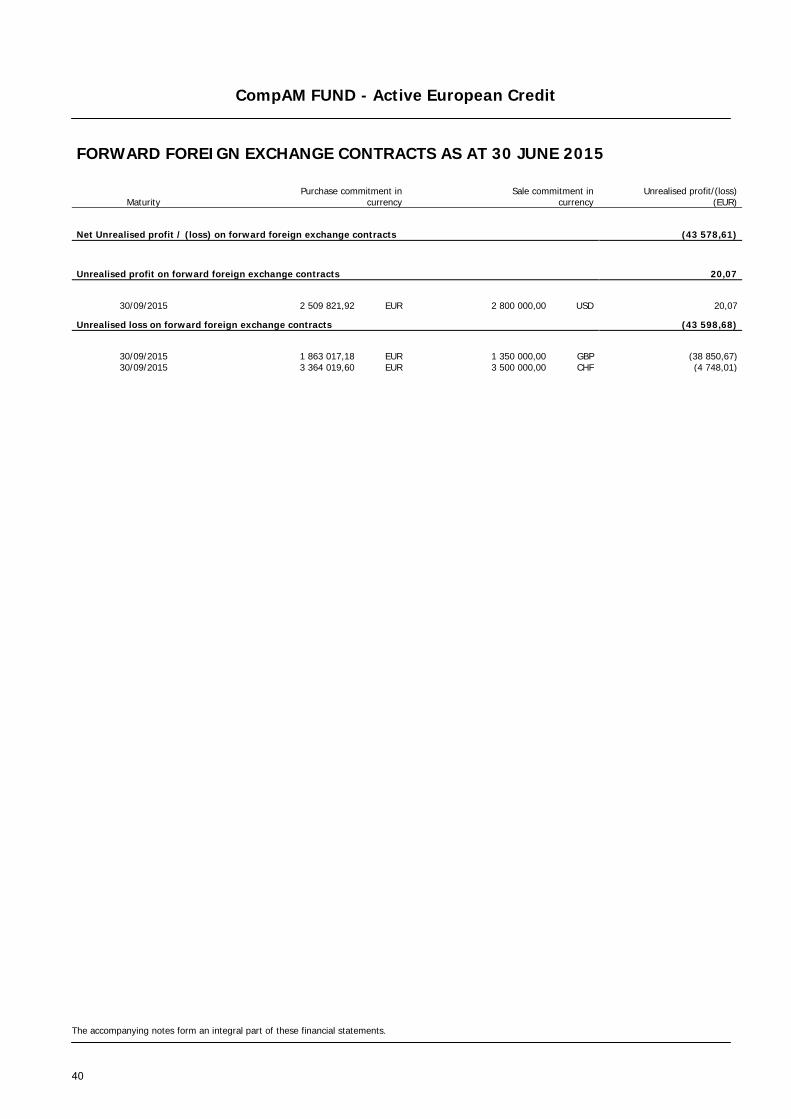
FORWARD FOREIGN EXCHANGE CONTRACTS AS AT 30 JUNE 2015
Maturity Purchase commitment in
currency Sale commitment in
currency Unrealised profit/(loss)
(EUR)
Net Unrealised profit / (loss) on forward foreign exchange contracts (43 578,61)
Unrealised profit on forward foreign exchange contracts 20,07
30/09/2015 2 509 821,92 EUR 2 800 000,00 USD 20,07
Unrealised loss on forward foreign exchange contracts (43 598,68)
30/09/2015 1 863 017,18 EUR 1 350 000,00 GBP (38 850,67) 30/09/2015 3 364 019,60 EUR 3 500 000,00 CHF (4 748,01)
The accompanying notes form an integral part of these financial statements.
40

CompAM FUND - Active Dollar Bond
STATEMENT OF NET ASSETS AS AT 30 JUNE 2015 IN USD
Assets Notes Investments in securities at market value (Note 1) 37 597 289,73 Cash at banks 1 737 039,42 Options contracts at market value (Note 1, 8) 61 875,00 Unrealised profit on forward foreign exchange contracts (Note 1, 8) 2 503,91 Interests receivable 459 069,10 Receivable on investments sold 4 262 532,09 Receivable on subscriptions 30 693,49 Other assets 11 492,04 Total assets 44 162 494,78
Liabilities Unrealised loss on forward foreign exchange contracts (Note 1, 8) (311 620,34) Payable on investments purchased (36 843,75) Other liabilities (204 781,67) Total liabilities (553 245,76) Total net assets 43 609 249,02
Currency Net Asset Value per Share Shares outstanding
Class A Shares USD 1 494,179 5 309,291 Class E Shares USD 1 649,397 12 289,498 Class M Shares USD 1 031,196 4 165,786 Class Y Shares USD 1 048,843 5 947,523 Class Z Shares USD 1 004,810 4 848,874
The accompanying notes form an integral part of these financial statements.
41

CompAM FUND - Active Dollar Bond
STATEMENT OF OPERATIONS AND CHANGES IN NET ASSETS FOR THE PERIOD ENDED 30 JUNE 2015 IN USD
Net assets at the beginning of the period Notes 46 424 246,20
Net income from investments (Note 1d) 1 034 314,76 Total Income 1 034 314,76 Investment Management fees (Note 2) (271 133,59) Management Company fees (Note 3) (16 615,12) Performance fees (Note 4) (58 859,78) Custodian fees (11 867,92) Subscription tax (Note 5) (11 607,96) Custodian transaction fees (Note 6) (13 220,24) Other charges and taxes (40 501,62) Total expenses (423 806,23) Net investment income / (loss) 610 508,53 Net realised profit / (loss) on sales of investments, currencies and other financial instruments (265 956,37) Change in unrealised appreciation / (depreciation) on: - Investments 689 311,12 - Options contracts (19 843,75) - Forward foreign exchange contracts (Note 1h) (414 805,81) Net result of operations for the period 599 213,72
Subscriptions for the period 10 371 535,65 Redemptions for the period (13 785 746,55)
Net assets at the end of the period 43 609 249,02
The accompanying notes form an integral part of these financial statements.
42

CompAM FUND - Active Dollar Bond
PORTFOLIO AS AT 30 JUNE 2015 IN USD
Quantity /
Nominal Description Currency Acquisition cost Market value % of
Net Assets
PORTFOLIO AT MARKET VALUE 38 376 198,66 37 597 289,73 86,21
TRANSFERABLE SECURITIES AND MONEY MARKET INSTRUMENTS ADMITTED TO AN OFFICIAL STOCK EXCHANGE LISTING 27 224 365,31 26 668 756,88 61,16
Ordinary Bonds 23 741 629,19 23 734 598,86 54,43
LUXEMBOURG 3 636 467,14 3 886 563,96 8,91
Telecommunication 2 156 721,17 2 148 404,51 4,92 600 000,00 MATTERHORN TELECOM SA 3.875% 01/05/2022 EUR 636 539,94 636 768,60 1,46 600 000,00 MATTERHORN TELECOM SA 3.652% 01/05/2022 CHF 616 681,23 614 509,66 1,41
250 000,00
MILLICOM INTERNATIONAL CELLULAR SA 6.625% 15/10/2021
USD 250 000,00 258 182,50 0,59
250 000,00
MILLICOM INTERNATIONAL CELLULAR SA 6.00% 15/03/2025
USD 250 000,00 243 073,75 0,55
200 000,00 ALTICE FINANCING SA 6.50% 15/01/2022 USD 200 000,00 199 876,00 0,46 200 000,00 ALTICE SA 7.75% 15/05/2022 USD 203 500,00 195 994,00 0,45
Energy 841 153,63 1 011 023,40 2,32
800 000,00
GAZPROM OAO VIA GAZ CAPITAL SA 2.85% 25/10/2019
CHF 657 613,63 797 252,15 1,83
250 000,00
GAZPROM NEFT OAO VIA GPN CAPITAL SA 4.375% 19/09/2022
USD 183 540,00 213 771,25 0,49
Finance 638 592,34 727 136,05 1,67
550 000,00
SBERBANK OF RUSSIA VIA SB CAPITAL SA 2.065% 28/02/2017
CHF 503 576,91 571 545,66 1,31
150 000,00
VTB BANK OJSC VIA VTB CAPITAL SA 3.15% 16/12/2016
CHF 135 015,43 155 590,39 0,36
TURKEY 1 409 612,50 1 404 930,75 3,22
Finance 841 562,50 836 694,75 1,92
400 000,00
TURKIYE VAKIFLAR BANKASI TAO 3.75% 15/04/2018
USD 395 664,00 397 040,00 0,91
250 000,00 TURKIYE HALK BANKASI AS 3.875% 05/02/2020 USD 247 252,50 241 098,75 0,55 200 000,00 TURKIYE IS BANKASI 3.75% 10/10/2018 USD 198 646,00 198 556,00 0,46
Telecommunication 301 050,00 298 822,50 0,68 300 000,00 TURK TELEKOMUNIKASYON AS 4.875% 19/06/2024 USD 301 050,00 298 822,50 0,68
Basic Goods 267 000,00 269 413,50 0,62
300 000,00
ANADOLU EFES BIRACILIK VE MALT SANAYII AS 3.375% 01/11/2022
USD 267 000,00 269 413,50 0,62
MEXICO 1 423 484,28 1 343 721,29 3,08
Energy 460 821,63 430 765,72 0,99 200 000,00 PETROLEOS MEXICANOS 5.625% 23/01/2046 USD 198 548,00 187 016,00 0,43 2 400 000,00 PETROLEOS MEXICANOS 7.47% 12/11/2026 MXN 162 453,63 145 710,22 0,33 100 000,00 PETROLEOS MEXICANOS 4.50% 23/01/2026 USD 99 820,00 98 039,50 0,23
Industries 400 000,00 396 447,00 0,91 200 000,00 CEMEX SAB DE CV 5.875% 25/03/2019 USD 200 000,00 205 568,00 0,47 200 000,00 CEMEX SAB DE CV 5.70% 11/01/2025 USD 200 000,00 190 879,00 0,44
Telecommunication 362 662,65 306 365,57 0,70 5 000 000,00 AMERICA MOVIL SAB DE CV 6.45% 05/12/2022 MXN 362 662,65 306 365,57 0,70
Finance 200 000,00 210 143,00 0,48 200 000,00 CREDITO REAL SAB DE CV 7.50% 13/03/2019 USD 200 000,00 210 143,00 0,48
ARGENTINA 1 094 300,14 1 119 154,40 2,57
Government 641 315,14 650 108,15 1,49
250 000,00
CITY OF BUENOS AIRES ARGENTINA 8.95% 19/02/2021
USD 250 000,00 256 591,25 0,59
250 000,00 PROVINCIA DE BUENOS AIRES 11.75% 05/10/2015 USD 252 282,50 253 750,00 0,58 140 000,00 PROVINCIA DE BUENOS AIRES 9.25% 15/04/2017 USD 139 032,64 139 766,90 0,32
Energy 452 985,00 469 046,25 1,08 250 000,00 YPF SA 8.875% 19/12/2018 USD 252 985,00 266 116,25 0,61
The accompanying notes form an integral part of these financial statements.
43

CompAM FUND - Active Dollar Bond
PORTFOLIO AS AT 30 JUNE 2015 IN USD
Quantity /
Nominal Description Currency Acquisition cost Market value % of
Net Assets 200 000,00 YPF SA 8.75% 04/04/2024 USD 200 000,00 202 930,00 0,47
UNITED KINGDOM 1 242 029,54 1 102 838,52 2,53
Industries 675 900,37 580 929,91 1,33 500 000,00 EC FINANCE PLC 5.125% 15/07/2021 EUR 675 900,37 580 929,91 1,33
Consumer Retail 481 600,14 475 776,01 1,09
250 000,00
JAGUAR LAND ROVER AUTOMOTIVE PLC 3.50% 15/03/2020
USD 250 000,00 248 422,50 0,57
150 000,00
JAGUAR LAND ROVER AUTOMOTIVE PLC 3.875% 01/03/2023
GBP 231 600,14 227 353,51 0,52
Raw materials 84 529,03 46 132,60 0,11
44 083,00
COGNOR INTERNATIONAL FINANCE PLC 7.50% 01/02/2020
EUR 57 017,94 33 246,25 0,08
21 270,00
COGNOR INTERNATIONAL FINANCE PLC 5.00% 01/02/2021
EUR 27 511,09 12 886,35 0,03
KAZAKHSTAN 1 199 750,25 1 101 022,64 2,52
Industries 808 222,62 755 194,53 1,73
500 000,00
KAZAKHSTAN TEMIR ZHOLY JSC 3.638% 20/06/2022
CHF 558 222,62 509 675,78 1,17
250 000,00
NATSIONALNAYA KOMPANIYA KAZAKHSTAN ENGINEERING AO 4.55% 03/12/2016
USD 250 000,00 245 518,75 0,56
Energy 390 160,00 344 056,00 0,79
400 000,00
KAZMUNAYGAS NATIONAL CO JSC 6.00% 07/11/2044
USD 390 160,00 344 056,00 0,79
Finance 1 367,63 1 772,11 0,00 2 208,00 BTA BANK JSC 5.50% 21/12/2022 USD 1 367,63 1 772,11 0,00
BRAZIL 1 042 250,00 1 003 064,75 2,30
Finance 516 250,00 523 495,00 1,20
500 000,00
BANCO NACIONAL DE DESENVOLVIMENTO ECONOMICO E SOCIAL 5.50% 12/07/2020
USD 516 250,00 523 495,00 1,20
Telecommunication 526 000,00 479 569,75 1,10 550 000,00 OI SA 5.75% 10/02/2022 USD 526 000,00 479 569,75 1,10
FRANCE 942 195,00 915 612,50 2,10
Finance 492 195,00 469 967,50 1,08 500 000,00 SOCIETE GENERALE SA 4.25% 14/04/2025 USD 492 195,00 469 967,50 1,08
Consumer Retail 450 000,00 445 645,00 1,02 250 000,00 NUMERICABLE-SFR SAS 6.00% 15/05/2022 USD 250 000,00 247 495,00 0,57 200 000,00 NUMERICABLE-SFR SAS 6.25% 15/05/2024 USD 200 000,00 198 150,00 0,45
IRELAND 765 702,23 856 238,66 1,96
Supranational 444 615,00 458 417,25 1,05 450 000,00 AFRICAN EXPORT-IMPORT BANK 4.75% 29/07/2019 USD 444 615,00 458 417,25 1,05
Industries 321 087,23 397 821,41 0,91
400 000,00
RUSSIAN RAILWAYS VIA RZD CAPITAL PLC 2.177% 26/02/2018
CHF 321 087,23 397 821,41 0,91
CAYMAN ISLANDS 800 591,11 828 188,00 1,90
Industries 400 000,00 407 966,00 0,94
400 000,00
LIMA METRO LINE 2 FINANCE LTD 5.875% 05/07/2034
USD 400 000,00 407 966,00 0,94
Finance 199 991,11 214 834,00 0,49 200 000,00 INVESTCORP SA 8.25% 01/11/2017 USD 199 991,11 214 834,00 0,49
Consumer Retail 200 600,00 205 388,00 0,47 200 000,00 MARFRIG OVERSEAS LTD 9.50% 04/05/2020 USD 200 600,00 205 388,00 0,47
INDONESIA 680 425,00 639 545,00 1,47
Industries 492 925,00 453 665,00 1,04 250 000,00 PELABUHAN INDONESIA II 5.375% 05/05/2045 USD 245 435,00 218 826,25 0,50
The accompanying notes form an integral part of these financial statements.
44

CompAM FUND - Active Dollar Bond
PORTFOLIO AS AT 30 JUNE 2015 IN USD
Quantity /
Nominal Description Currency Acquisition cost Market value % of
Net Assets 250 000,00 PELABUHAN INDONESIA II PT 4.25% 05/05/2025 USD 247 490,00 234 838,75 0,54
Energy 187 500,00 185 880,00 0,43 200 000,00 PERTAMINA PERSERO 6.00% 03/05/2042 USD 187 500,00 185 880,00 0,43
GEORGIA 545 883,00 565 359,25 1,30
Finance 298 473,00 312 355,50 0,72 300 000,00 BANK OF GEORGIA JSC 7.75% 05/07/2017 USD 298 473,00 312 355,50 0,72
Industries 247 410,00 253 003,75 0,58 250 000,00 GEORGIAN OIL AND GAS CORP 6.875% 16/05/2017 USD 247 410,00 253 003,75 0,58
JERSEY 506 250,00 513 007,50 1,18
Finance 506 250,00 513 007,50 1,18 500 000,00 HBOS CAPITAL FUNDING LP 6.85% 29/03/2049 USD 506 250,00 513 007,50 1,18
NETHERLANDS 520 150,00 512 241,00 1,17
Energy 327 150,00 320 467,00 0,73
200 000,00
PETROBRAS GLOBAL FINANCE BV 6.85% 05/06/2115
USD 162 140,00 164 533,00 0,37
200 000,00
PETROBRAS GLOBAL FINANCE BV 5.625% 20/05/2043
USD 165 010,00 155 934,00 0,36
Telecommunication 193 000,00 191 774,00 0,44 200 000,00 VIMPELCOM HOLDINGS BV 5.20% 13/02/2019 USD 193 000,00 191 774,00 0,44
INDIA 507 300,00 507 575,00 1,16
Industries 507 300,00 507 575,00 1,16
500 000,00
DELHI INTERNATIONAL AIRPORT PVT LTD 6.125% 03/02/2022
USD 507 300,00 507 575,00 1,16
UNITED ARAB EMIRATES 499 815,00 502 995,00 1,15
Finance 499 815,00 502 995,00 1,15 500 000,00 EMIRATES NBD PJSC 3.25% 19/11/2019 USD 499 815,00 502 995,00 1,15
SWITZERLAND 499 525,00 496 310,00 1,14
Finance 499 525,00 496 310,00 1,14 500 000,00 UBS AG 5.125% 15/05/2024 USD 499 525,00 496 310,00 1,14
AUSTRIA 488 750,00 496 132,50 1,14
Basic Goods 488 750,00 496 132,50 1,14 500 000,00 ESAL GMBH 6.25% 05/02/2023 USD 488 750,00 496 132,50 1,14
CHILE 498 815,00 491 487,50 1,13
Telecommunication 498 815,00 491 487,50 1,13
500 000,00
EMPRESA NACIONAL DE TELECOMUNICACIONES SA 4.75% 01/08/2026
USD 498 815,00 491 487,50 1,13
CHINA 452 021,50 470 709,00 1,08
Computing and IT 452 021,50 470 709,00 1,08 450 000,00 LENOVO GROUP LTD 4.70% 08/05/2019 USD 452 021,50 470 709,00 1,08
SLOVENIA 395 156,00 427 187,00 0,98
Government 395 156,00 427 187,00 0,98
200 000,00
SLOVENIA GOVERNMENT INTERNATIONAL BOND 5.25% 18/02/2024
USD 196 494,00 218 567,00 0,50
200 000,00
SLOVENIA GOVERNMENT INTERNATIONAL BOND 4.125% 18/02/2019
USD 198 662,00 208 620,00 0,48
CROATIA 433 179,19 403 462,93 0,93
Government 433 179,19 403 462,93 0,93
400 000,00
CROATIA GOVERNMENT INTERNATIONAL BOND 3.00% 11/03/2025
EUR 433 179,19 403 462,93 0,93
The accompanying notes form an integral part of these financial statements.
45

CompAM FUND - Active Dollar Bond
PORTFOLIO AS AT 30 JUNE 2015 IN USD
Quantity /
Nominal Description Currency Acquisition cost Market value % of
Net Assets
BRITISH VIRGIN ISLANDS 397 196,00 389 296,00 0,89
Energy 397 196,00 389 296,00 0,89
200 000,00
SINOPEC GROUP OVERSEAS DEVELOPMENT 2015 LTD 2.50% 28/04/2020
USD 199 152,00 197 075,00 0,45
200 000,00
SINOPEC GROUP OVERSEAS DEVELOPMENT 2015 LTD 3.25% 28/04/2025
USD 198 044,00 192 221,00 0,44
AZERBAIJAN 400 000,00 389 190,00 0,89
Finance 400 000,00 389 190,00 0,89
400 000,00
INTERNATIONAL BANK OF AZERBAIJAN OJSC 5.625% 11/06/2019
USD 400 000,00 389 190,00 0,89
HUNGARY 298 068,00 310 392,00 0,71
Government 298 068,00 310 392,00 0,71
300 000,00
HUNGARY GOVERNMENT INTERNATIONAL BOND 4.00% 25/03/2019
USD 298 068,00 310 392,00 0,71
SRI LANKA 300 000,00 307 833,00 0,71
Government 300 000,00 307 833,00 0,71
300 000,00
SRI LANKA GOVERNMENT INTERNATIONAL BOND 6.00% 14/01/2019
USD 300 000,00 307 833,00 0,71
COLOMBIA 250 000,00 260 206,25 0,60
Government 250 000,00 260 206,25 0,60 250 000,00 COLOMBIA TELECOMUNICACIO 8.50% 29/12/2049 USD 250 000,00 260 206,25 0,60
MONTENEGRO 263 936,81 258 441,46 0,59
Government 263 936,81 258 441,46 0,59
250 000,00
MONTENEGRO GOVERNMENT INTERNATIONAL BOND 3.875% 18/03/2020
EUR 263 936,81 258 441,46 0,59
KENYA 250 000,00 254 201,25 0,58
Government 250 000,00 254 201,25 0,58
250 000,00
KENYA GOVERNMENT INTERNATIONAL BOND 6.875% 24/06/2024
USD 250 000,00 254 201,25 0,58
RWANDA 247 187,50 252 141,25 0,58
Government 247 187,50 252 141,25 0,58
250 000,00
RWANDA INTERNATIONAL GOVERNMENT BOND 6.625% 02/05/2023
USD 247 187,50 252 141,25 0,58
NIGERIA 255 625,00 252 052,50 0,58
Government 255 625,00 252 052,50 0,58
250 000,00
NIGERIA GOVERNMENT INTERNATIONAL BOND 5.125% 12/07/2018
USD 255 625,00 252 052,50 0,58
GUERNSEY 249 872,50 247 160,00 0,57
Finance 249 872,50 247 160,00 0,57
250 000,00
CREDIT SUISSE GROUP FUNDING GUERNSEY LTD 2.75% 26/03/2020
USD 249 872,50 247 160,00 0,57
GHANA 247 877,50 228 175,00 0,52
Government 247 877,50 228 175,00 0,52 250 000,00 REPUBLIC OF GHANA 7.875% 07/08/2023 USD 247 877,50 228 175,00 0,52
SINGAPORE 200 000,00 203 019,00 0,47
Raw materials 200 000,00 203 019,00 0,47 200 000,00 ABJA INVESTMENT CO PTE LTD 4.85% 31/01/2020 USD 200 000,00 203 019,00 0,47
SOUTH AFRICA 198 214,00 202 735,00 0,46
Multi-Utilities 198 214,00 202 735,00 0,46 200 000,00 ESKOM HOLDINGS SOC LTD 6.75% 06/08/2023 USD 198 214,00 202 735,00 0,46
The accompanying notes form an integral part of these financial statements.
46

CompAM FUND - Active Dollar Bond
PORTFOLIO AS AT 30 JUNE 2015 IN USD
Quantity /
Nominal Description Currency Acquisition cost Market value % of
Net Assets
MALAYSIA 200 000,00 199 936,00 0,46
Energy 200 000,00 199 936,00 0,46 200 000,00 PETRONAS GLOBAL SUKUK LTD 2.707% 18/03/2020 USD 200 000,00 199 936,00 0,46
ETHIOPIA 200 000,00 198 736,00 0,46
Government 200 000,00 198 736,00 0,46
200 000,00
FEDERAL DEMOCRATIC REPUBLIC OF ETHIOPIA 6.625% 11/12/2024
USD 200 000,00 198 736,00 0,46
COSTA RICA 200 000,00 193 737,00 0,44
Government 200 000,00 193 737,00 0,44
200 000,00
COSTA RICA GOVERNMENT INTERNATIONAL BOND 7.00% 04/04/2044
USD 200 000,00 193 737,00 0,44
Floating rate notes 2 942 691,84 2 424 179,96 5,56
IRELAND 1 199 352,00 1 123 902,00 2,58
Finance 1 199 352,00 1 123 902,00 2,58
1 200 000,00
WILLOW NO 2 IRELAND PLC FOR ZURICH INSURANCE CO LTD FRN 01/10/2045
USD 1 199 352,00 1 123 902,00 2,58
SWITZERLAND 694 375,00 679 153,50 1,56
Finance 694 375,00 679 153,50 1,56 500 000,00 CREDIT SUISSE GROUP AG FRN 29/12/2049 USD 494 375,00 476 852,50 1,09 200 000,00 UBS AG FRN 22/05/2023 USD 200 000,00 202 301,00 0,47
GREECE 748 964,84 409 585,46 0,94
Government 748 964,84 409 585,46 0,94
900 000,00
HELLENIC REPUBLIC GOVERNMENT BOND FRN 24/02/2027
EUR 748 964,84 409 585,46 0,94
CAYMAN ISLANDS 300 000,00 211 539,00 0,48
Finance 300 000,00 211 539,00 0,48 300 000,00 BANCO DO BRASIL SA FRN 29/10/2049 USD 300 000,00 211 539,00 0,48
Zero-Coupon Bonds 540 044,28 509 978,06 1,17
LUXEMBOURG 540 044,28 509 978,06 1,17
Telecommunication 540 044,28 509 978,06 1,17
500 000,00
SUNRISE COMMUNICATIONS HLDG SA 0.00% 31/03/2022
CHF 540 044,28 509 978,06 1,17
TRANSFERABLE SECURITIES AND MONEY MARKET INSTRUMENTS DEALT IN ON ANOTHER REGULATED MARKET 10 559 129,35 10 324 917,85 23,67
Floating rate notes 250 000,00 232 785,00 0,53
NETHERLANDS 250 000,00 232 785,00 0,53
Energy 250 000,00 232 785,00 0,53 250 000,00 PETROBRAS GLOBAL FINANCE BV FRN 15/01/2019 USD 250 000,00 232 785,00 0,53
Ordinary Bonds 5 311 835,52 5 092 108,90 11,68
NETHERLANDS 1 213 281,00 1 180 045,00 2,71
Consumer Retail 1 015 625,00 1 005 990,00 2,31 500 000,00 VTR FINANCE BV 6.875% 15/01/2024 USD 515 625,00 513 782,50 1,18
500 000,00
FIAT CHRYSLER AUTOMOBILES NV 5.25% 15/04/2023
USD 500 000,00 492 207,50 1,13
Energy 197 656,00 174 055,00 0,40
200 000,00
PETROBRAS GLOBAL FINANCE BV 4.375% 20/05/2023
USD 197 656,00 174 055,00 0,40
The accompanying notes form an integral part of these financial statements.
47

CompAM FUND - Active Dollar Bond
PORTFOLIO AS AT 30 JUNE 2015 IN USD
Quantity /
Nominal Description Currency Acquisition cost Market value % of
Net Assets
UNITED STATES 747 687,50 692 687,50 1,59
Computing and IT 747 687,50 692 687,50 1,59 500 000,00 APPLE INC 2.15% 09/02/2022 USD 499 905,00 480 950,00 1,10 250 000,00 APPLE INC 3.45% 09/02/2045 USD 247 782,50 211 737,50 0,49
MEXICO 655 937,50 659 515,63 1,51
Industries 407 812,50 401 821,88 0,92
375 000,00
SERVICIOS CORPORATIVOS JAVER SAPI DE CV 9.875% 06/04/2021
USD 407 812,50 401 821,88 0,92
Energy 248 125,00 257 693,75 0,59 250 000,00 PETROLEOS MEXICANOS 6.375% 23/01/2045 USD 248 125,00 257 693,75 0,59
CHILE 498 865,00 488 118,75 1,12
Basic Goods 498 865,00 488 118,75 1,12 250 000,00 CENCOSUD SA 5.15% 12/02/2025 USD 249 092,50 252 026,25 0,58 250 000,00 CENCOSUD SA 6.625% 12/02/2045 USD 249 772,50 236 092,50 0,54
ARGENTINA 376 837,50 381 258,75 0,87
Industries 376 837,50 381 258,75 0,87
375 000,00
TRANSPORTADORA DE GAS DEL SUR SA 9.625% 14/05/2020
USD 376 837,50 381 258,75 0,87
UNITED KINGDOM 326 250,00 329 370,00 0,76
Consumer Retail 326 250,00 329 370,00 0,76 300 000,00 JAGUAR LAND ROVER PLC 8.125% 15/05/2021 USD 326 250,00 329 370,00 0,76
CANADA 443 062,50 328 522,50 0,75
Energy 443 062,50 328 522,50 0,75
450 000,00
PACIFIC RUBIALES ENERGY CORP 5.625% 19/01/2025
USD 443 062,50 328 522,50 0,75
BRAZIL 249 120,00 247 622,50 0,57
Finance 249 120,00 247 622,50 0,57 250 000,00 CAIXA ECONOMICA FEDERAL 4.25% 13/05/2019 USD 249 120,00 247 622,50 0,57
CURACAO 200 760,00 203 188,00 0,47
Finance 200 760,00 203 188,00 0,47 200 000,00 SUAM FINANCE BV 4.875% 17/04/2024 USD 200 760,00 203 188,00 0,47
MALAYSIA 198 250,00 197 939,00 0,45
Energy 198 250,00 197 939,00 0,45 200 000,00 PETRONAS CAPITAL LTD 3.50% 18/03/2025 USD 198 250,00 197 939,00 0,45
VIRGIN ISLANDS 201 784,00 193 990,00 0,44
Consumer Retail 201 784,00 193 990,00 0,44
200 000,00
ARCOS DORADOS HOLDINGS INC 6.625% 27/09/2023
USD 201 784,00 193 990,00 0,44
JAMAICA 200 000,00 189 851,00 0,44
Telecommunication 200 000,00 189 851,00 0,44 200 000,00 DIGICEL GROUP LTD 7.125% 01/04/2022 USD 200 000,00 189 851,00 0,44
BERMUDA 0,52 0,27 0,00
Finance 0,52 0,27 0,00
0,68
NEWLAND INTERNATIONAL PROPERTIES CORP 9.50% 03/07/2017
USD 0,52 0,27 0,00
Zero-Coupon Bonds 4 997 293,83 5 000 023,95 11,46
UNITED STATES 4 997 293,83 5 000 023,95 11,46
Government 4 997 293,83 5 000 023,95 11,46 5 000 000,00 UNITED STATES TREASURY BILL 0.00% 23/07/2015 USD 4 997 293,83 5 000 023,95 11,46
The accompanying notes form an integral part of these financial statements.
48

CompAM FUND - Active Dollar Bond
PORTFOLIO AS AT 30 JUNE 2015 IN USD
Quantity /
Nominal Description Currency Acquisition cost Market value % of
Net Assets
OTHER TRANSFERABLE SECURITIES AND MONEY MARKET INSTRUMENTS 592 704,00 603 615,00 1,38
Ordinary Bonds 292 704,00 297 480,00 0,68
ARMENIA 292 704,00 297 480,00 0,68
Government 292 704,00 297 480,00 0,68 300 000,00 REPUBLIC OF ARMENIA 7.15% 26/03/2025 USD 292 704,00 297 480,00 0,68
Floating rate notes 300 000,00 306 135,00 0,70
TANZANIA 300 000,00 306 135,00 0,70
Government 300 000,00 306 135,00 0,70
300 000,00
TANZANIA GOVERNMENT INTERNATIONAL BOND FRN 09/03/2020
USD 300 000,00 306 135,00 0,70
Total Portfolio 38 376 198,66 37 597 289,73 86,21
The accompanying notes form an integral part of these financial statements.
49

CompAM FUND - Active Dollar Bond
OPTIONS CONTRACTS AS AT 30 JUNE 2015
Quantity Call/Put Description Currency Acquisition cost Market value Commitment
(USD)
LISTED ON AN OFFICIAL STOCK EXCHANGE 81 718,75 61 875,00 22 998 080,00
PURCHASED OPTIONS 81 718,75 61 875,00 22 998 080,00
200 EURODOLLAR FUTURE OPTION 99,38 14/12/15 USD 45 000,00 27 500,00 20,381,004.00
50 10YR US TREASURY NOTE FUTURE 126,50 24/07/15 USD 36 718,75 34 375,00 2,617,076.00
The accompanying notes form an integral part of these financial statements.
50

CompAM FUND - Active Dollar Bond
FORWARD FOREIGN EXCHANGE CONTRACTS AS AT 30 JUNE 2015
Maturity Purchase commitment in
currency Sale commitment in
currency Unrealised profit/(loss)
(USD)
Net Unrealised profit / (loss) on forward foreign exchange contracts (309 116,43)
Unrealised profit on forward foreign exchange contracts 2 503,91
30/09/2015 539 401,67 USD 500 000,00 CHF 2 503,91
Unrealised loss on forward foreign exchange contracts (311 620,34)
30/09/2015 1 236 152,52 USD 1 200 000,00 CHF (52 402,11) 30/09/2015 1 024 471,70 USD 700 000,00 GBP (75 706,94) 30/09/2015 2 650 745,00 USD 2 500 000,00 EUR (138 319,77) 30/09/2015 533 456,00 USD 500 000,00 EUR (24 356,95) 30/09/2015 623 814,10 USD 600 000,00 CHF (20 463,21) 30/09/2015 966 044,61 USD 900 000,00 CHF (371,36)
The accompanying notes form an integral part of these financial statements.
51

CompAM FUND - Multimanager Balanced
STATEMENT OF NET ASSETS AS AT 30 JUNE 2015 IN EUR
Assets Notes Investments in securities at market value (Note 1) 29 880 269,11 Cash at banks 6 927 151,74 Options contracts at market value (Note 1, 8) 425 438,74 Unrealised profit on forward foreign exchange contracts (Note 1, 8) 331 670,09 Interests receivable 33 563,03 Receivable on investments sold 144 949,10 Other assets 7 528,16 Total assets 37 750 569,97
Liabilities Bank overdrafts (60 813,37) Options contracts at market value (Note 1, 8) (140 600,00) Unrealised loss on forward foreign exchange contracts (Note 1, 8) (1 242,97) Payable on investments purchased (1 344 487,06) Other liabilities (157 027,24) Total liabilities (1 704 170,64) Total net assets 36 046 399,33
Currency Net Asset Value per Share Shares outstanding
Class A Shares EUR 127,078 71 998,909 Class B Shares EUR 135,956 181,840 Class M Shares EUR 127,567 25 697,211 Class S CHF hedged CHF 98,914 248 376,635
The accompanying notes form an integral part of these financial statements.
52

CompAM FUND - Multimanager Balanced
STATEMENT OF OPERATIONS AND CHANGES IN NET ASSETS FOR THE PERIOD ENDED 30 JUNE 2015 IN EUR
Net assets at the beginning of the period Notes 27 417 485,58
Net income from investments (Note 1d) 38 380,47 Other income 2 389,65 Total Income 40 770,12 Investment Management fees (Note 2) (164 408,35) Management Company fees (Note 3) (6 075,99) Performance fees (Note 4) (85 058,40) Custodian fees (5 542,79) Subscription tax (Note 5) (3 871,67) Custodian transaction fees (Note 6) (13 134,60) Other charges and taxes (30 683,66) Total expenses (308 775,46) Net investment income / (loss) (268 005,34) Net realised profit / (loss) on sales of investments, currencies and other financial instruments 307 166,02 Change in unrealised appreciation / (depreciation) on: - Investments 1 428 830,34 - Options contracts 10 783,41 - Forward foreign exchange contracts (Note 1h) 330 427,12 Net result of operations for the period 1 809 201,55
Subscriptions for the period 28 662 124,98 Redemptions for the period (21 842 412,78)
Net assets at the end of the period 36 046 399,33
The accompanying notes form an integral part of these financial statements.
53

CompAM FUND - Multimanager Balanced
PORTFOLIO AS AT 30 JUNE 2015 IN EUR
Quantity /
Nominal Description Currency Acquisition cost Market value % of
Net Assets
PORTFOLIO AT MARKET VALUE 26 985 674,10 29 880 269,11 82,89
TRANSFERABLE SECURITIES AND MONEY MARKET INSTRUMENTS ADMITTED TO AN OFFICIAL STOCK EXCHANGE LISTING 2 490 919,58 2 465 902,11 6,84
Ordinary Bonds 2 490 919,58 2 465 902,11 6,84
DENMARK 1 502 489,74 1 476 641,24 4,10
Government 1 502 489,74 1 476 641,24 4,10 10 000 000,00 DENMARK GOVERNMENT BOND 4.00% 15/11/2017 DKK 1 502 489,74 1 476 641,24 4,10
UNITED STATES 988 429,84 989 260,87 2,74
Government 988 429,84 989 260,87 2,74
1 100 000,00
UNITED STATES TREASURY NOTE 0.50% 15/06/2016
USD 988 429,84 989 260,87 2,74
INVESTMENT FUNDS 24 494 754,52 27 414 367,00 76,05
UCI Units 24 494 754,52 27 414 367,00 76,05
LUXEMBOURG 16 651 243,69 18 211 438,47 50,52
Finance 16 651 243,69 18 211 438,47 50,52 4 666,55 JULIUS BAER MULTILABEL - ARTEMIDE -C- EUR 552 200,04 646 037,74 1,79 1 918,39 COMPAM FUND - ACTIVE EUROPEAN CREDIT -Y- EUR 2 039 699,26 2 161 275,77 6,00 2 026,05 COMPAM FUND - ACTIVE EMERGING CREDIT -Y- EUR 2 119 999,64 2 237 272,35 6,21 5 947,52 COMPAM FUND - ACTIVE DOLLAR BOND -Y- USD 4 543 113,80 5 598 652,23 15,53 6 077,89 GAM STAR LUX - EMERGING ALPHA -I- EUR 609 998,05 611 800,41 1,70 6 020,11 GAM STAR LUX - EUROPEAN ALPHA -I- EUR 609 998,05 667 871,00 1,85 500,00 COMPAM FUND - ACTIVE LIQUID BOND -B- EUR 501 683,13 507 001,00 1,41 1 200,00 COMPAM FUND - CADENCE STRATEGIC ASIA -Y- EUR 1 200 000,00 1 117 336,80 3,10 1 300,02 COMPAM FUND - ACTIVE EUROPEAN EQUITY -Y- EUR 1 300 000,23 1 350 094,69 3,74 1 299,34 COMPAM FUND - ACTIVE EQUITY SELECTION -Y- EUR 1 300 000,25 1 386 353,83 3,85 475,79 BANOR SICAV - ITALY LONG SHORT EQUITY -I- EUR 599 997,66 632 303,78 1,75 7,79 ALQUITY SICAV - ALQUITY ASIA FUND -A- USD 0,00 760,16 0,00
629,98
ALPHA UCITS SICAV - ANAVON GLOBAL EQUITY LONG/SHORT FUND -E-
EUR 654 553,58 677 480,49 1,88
620,00 COMPAM FUND - ACTIVE MARKET NEUTRAL -Y- EUR 620 000,00 617 198,22 1,71
IRELAND 5 722 391,86 6 911 768,31 19,17
Finance 5 722 391,86 6 911 768,31 19,17
5 392,10
ODEY INVESTMENTS PLC - ODEY GIANO EUROPEAN FUND -ACC-
EUR 592 504,48 628 306,36 1,74
7 300,00 EGERTON CAPITAL EQUITY FUND PLC -A- EUR 1 039 737,08 1 353 420,00 3,75 6 469,46 GAVEKAL ASIAN OPPORTUNITIES UCITS FUND -A- EUR 1 149 999,83 1 420 110,29 3,94 60 448,51 CANTILLON GLOBAL EQUITY FUND -O- EUR 1 199 999,97 1 419 349,17 3,94 4 761,95 ODEY INVESTMENTS PLC - ODEY ODYSSEY FUND EUR 609 999,19 713 694,40 1,98
9 366,04
WINTON UCITS FUNDS PLC - WINTON GLOBAL EQUITY FUND -Z-
USD 1 130 151,31 1 376 888,09 3,82
UNITED KINGDOM 1 521 091,09 1 680 191,61 4,66
Finance 1 521 091,09 1 680 191,61 4,66 587 075,08 FUNDSMITH EQUITY FUND -I ACC- GBP 1 521 091,09 1 680 191,61 4,66
FRANCE 600 027,88 610 968,61 1,70
Finance 600 027,88 610 968,61 1,70 471,75 JL EQUITY MARKET NEUTRAL -A- EUR 600 027,88 610 968,61 1,70
Total Portfolio 26 985 674,10 29 880 269,11 82,89
The accompanying notes form an integral part of these financial statements.
54

CompAM FUND - Multimanager Balanced
OPTIONS CONTRACTS AS AT 30 JUNE 2015
Quantity Call/Put Description Currency Acquisition cost Market value Commitment
(EUR)
LISTED ON AN OFFICIAL STOCK EXCHANGE 274 055,33 284 838,74 11 374 760,00
PURCHASED OPTIONS 419 004,43 425 438,74 7 538 943,00
200 DAX INDEX 10 500,00 18/09/15 EUR 354 487,56 342 700,00 1,819,477.00 100 10YR US TREASURY NOTE 126,00 24/07/15 USD 64 516,87 82 738,74 5,719,466.00
WRITTEN OPTIONS (144 949,10) (140 600,00) 3 835 817,00
(200) DAX INDEX 9 600,00 18/09/15 EUR (144 949,10) (140 600,00) 3,835,817.00
The accompanying notes form an integral part of these financial statements.
55
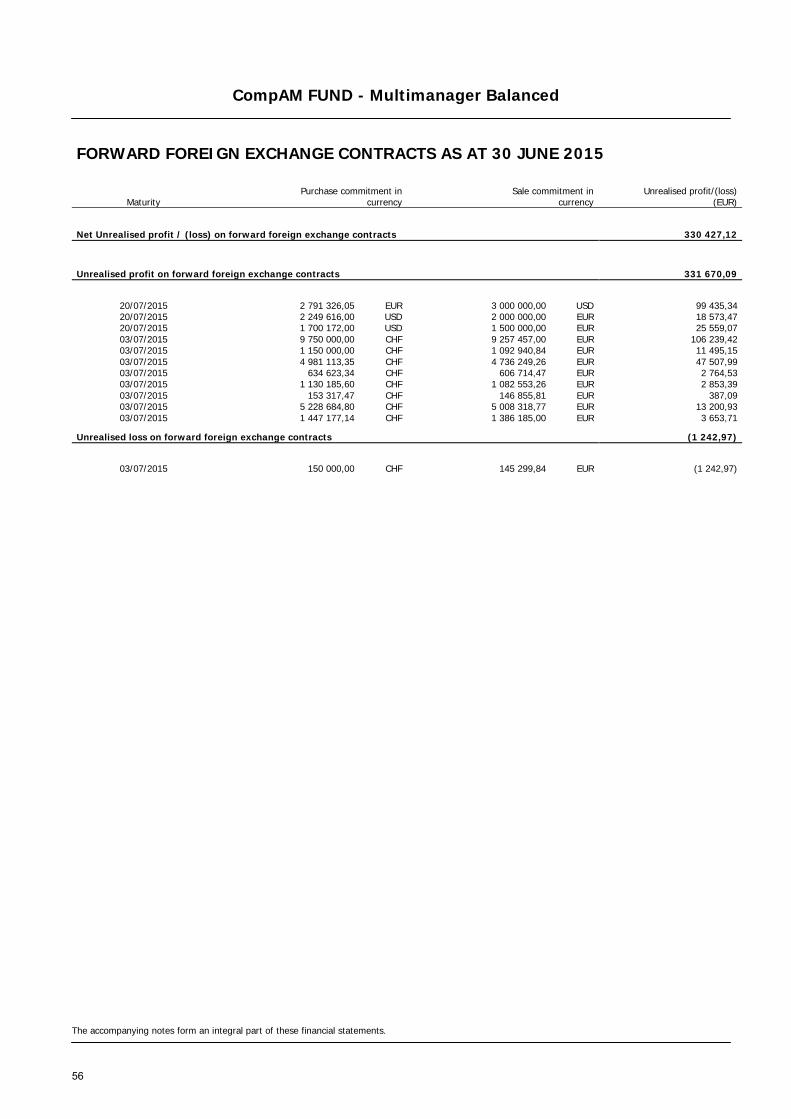
CompAM FUND - Multimanager Balanced
FORWARD FOREIGN EXCHANGE CONTRACTS AS AT 30 JUNE 2015
Maturity Purchase commitment in
currency Sale commitment in
currency Unrealised profit/(loss)
(EUR)
Net Unrealised profit / (loss) on forward foreign exchange contracts 330 427,12
Unrealised profit on forward foreign exchange contracts 331 670,09
20/07/2015 2 791 326,05 EUR 3 000 000,00 USD 99 435,34 20/07/2015 2 249 616,00 USD 2 000 000,00 EUR 18 573,47 20/07/2015 1 700 172,00 USD 1 500 000,00 EUR 25 559,07 03/07/2015 9 750 000,00 CHF 9 257 457,00 EUR 106 239,42 03/07/2015 1 150 000,00 CHF 1 092 940,84 EUR 11 495,15 03/07/2015 4 981 113,35 CHF 4 736 249,26 EUR 47 507,99 03/07/2015 634 623,34 CHF 606 714,47 EUR 2 764,53 03/07/2015 1 130 185,60 CHF 1 082 553,26 EUR 2 853,39 03/07/2015 153 317,47 CHF 146 855,81 EUR 387,09 03/07/2015 5 228 684,80 CHF 5 008 318,77 EUR 13 200,93 03/07/2015 1 447 177,14 CHF 1 386 185,00 EUR 3 653,71
Unrealised loss on forward foreign exchange contracts (1 242,97)
03/07/2015 150 000,00 CHF 145 299,84 EUR (1 242,97)
The accompanying notes form an integral part of these financial statements.
56

CompAM FUND - Multimanager Equity Africa & Middle East
STATEMENT OF NET ASSETS AS AT 30 JUNE 2015 IN EUR
Assets Notes Investments in securities at market value (Note 1) 8 438 898,20 Cash at banks 560 212,61 Unrealised profit on forward foreign exchange contracts (Note 1, 8) 9 332,52 Dividends receivable 7 178,13 Receivable on investments sold 16 332,30 Total assets 9 031 953,76
Liabilities Unrealised loss on forward foreign exchange contracts (Note 1, 8) (7 915,36) Other liabilities (43 003,27) Total liabilities (50 918,63) Total net assets 8 981 035,13
Currency Net Asset Value per Share Shares outstanding
Class A Shares EUR 74,476 58 510,423 Class B Shares EUR 95,400 41 182,601 Class M Shares EUR 78,178 8 885,295
The accompanying notes form an integral part of these financial statements.
57

CompAM FUND - Multimanager Equity Africa & Middle East
STATEMENT OF OPERATIONS AND CHANGES IN NET ASSETS FOR THE PERIOD ENDED 30 JUNE 2015 IN EUR
Net assets at the beginning of the period Notes 7 877 996,03
Net income from investments (Note 1d) 83 854,79 Other income 4 613,95 Total Income 88 468,74 Investment Management fees (Note 2) (66 216,05) Management Company fees (Note 3) (3 383,15) Performance fees (Note 4) (10 402,04) Custodian fees (2 648,10) Subscription tax (Note 5) (1 585,38) Custodian transaction fees (Note 6) (5 008,27) Other charges and taxes (21 280,05) Total expenses (110 523,04) Net investment income / (loss) (22 054,30) Net realised profit / (loss) on sales of investments, currencies and other financial instruments 418 675,39 Change in unrealised appreciation / (depreciation) on: - Investments (201 971,30) - Forward foreign exchange contracts (Note 1h) 1 417,16 Net result of operations for the period 196 066,95
Subscriptions for the period 6 567 555,37 Redemptions for the period (5 660 583,22)
Net assets at the end of the period 8 981 035,13
The accompanying notes form an integral part of these financial statements.
58

CompAM FUND - Multimanager Equity Africa & Middle East
PORTFOLIO AS AT 30 JUNE 2015 IN EUR
Quantity /
Nominal Description Currency Acquisition cost Market value % of
Net Assets
PORTFOLIO AT MARKET VALUE 8 536 393,52 8 438 898,20 93,96
TRANSFERABLE SECURITIES AND MONEY MARKET INSTRUMENTS ADMITTED TO AN OFFICIAL STOCK EXCHANGE LISTING 3 710 325,74 3 490 246,05 38,86
Shares 3 710 325,74 3 490 246,05 38,86
UNITED KINGDOM 975 878,95 904 458,07 10,07
Raw materials 413 693,60 348 310,40 3,88 4 000,00 RIO TINTO PLC GBP 162 798,59 147 587,12 1,64 10 000,00 ANGLO AMERICAN PLC GBP 151 445,67 129 646,87 1,45 45 000,00 LONMIN PLC GBP 99 449,34 71 076,41 0,79
Finance 265 235,08 278 913,68 3,11 6 000,00 BANK OF GEORGIA HOLDINGS PLC GBP 151 689,55 165 146,26 1,84 40 000,00 OLD MUTUAL PLC GBP 113 545,53 113 767,42 1,27
Energy 167 505,46 143 846,63 1,60 30 000,00 TULLOW OIL PLC GBP 167 505,46 143 846,63 1,60
Health 129 444,81 133 387,36 1,48 10 000,00 AL NOOR HOSPITALS GROUP PLC GBP 129 444,81 133 387,36 1,48
SOUTH AFRICA 545 088,82 570 969,27 6,36
Telecommunication 247 319,20 253 717,87 2,83 15 000,00 MTN GROUP LTD ZAR 247 319,20 253 717,87 2,83
Basic Goods 216 818,18 230 583,97 2,57 11 000,00 TIGER BRANDS LTD ZAR 216 818,18 230 583,97 2,57
Raw materials 52 463,19 53 392,96 0,59 4 000,00 OMNIA HOLDINGS LTD ZAR 52 463,19 53 392,96 0,59
Energy 28 488,25 33 274,47 0,37 1 000,00 SASOL LTD ZAR 28 488,25 33 274,47 0,37
NIGERIA 562 549,19 489 596,36 5,45
Finance 391 069,46 336 149,63 3,74 152 500,00 GUARANTY TRUST BANK PLC NGN 20 751,69 18 586,45 0,21 1 000 000,00 STANBIC IBTC HLDG PLC NGN 155 839,97 121 833,26 1,35 1 000 000,00 ZENITH BANK PLC NGN 97 105,12 86 862,60 0,97 5 495 800,00 DIAMOND BANK PLC NGN 117 372,68 108 867,32 1,21
Energy 171 479,73 153 446,73 1,71 100 000,00 SEPLAT PETROLEUM DEVELOPMENT CO PLC NGN 171 479,73 153 446,73 1,71
EGYPT 456 547,66 415 578,55 4,63
Finance 179 035,59 159 432,54 1,78 502 000,00 PALM HILLS DEVELOPMENTS SAE EGP 179 035,59 159 432,54 1,78
Telecommunication 96 028,69 95 513,67 1,06 100 000,00 TELECOM EGYPT CO EGP 96 028,69 95 513,67 1,06
Industries 102 393,93 88 220,75 0,98 50 000,00 ARABIAN CEMENT CO EGP 102 393,93 88 220,75 0,98
Consumer Retail 79 089,45 72 411,59 0,81 60 000,00 ORIENTAL WEAVERS EGP 79 089,45 72 411,59 0,81
KENYA 371 021,41 336 354,13 3,74
Basic Goods 154 650,69 137 451,65 1,53 50 000,00 EAST AFRICAN BREWERIES LTD KES 154 650,69 137 451,65 1,53
Telecommunication 115 066,36 117 516,64 1,31 790 000,00 SAFARICOM LTD KES 115 066,36 117 516,64 1,31
Raw materials 101 304,36 81 385,84 0,90 120 000,00 ARM CEMENT LTD KES 101 304,36 81 385,84 0,90
The accompanying notes form an integral part of these financial statements.
59

CompAM FUND - Multimanager Equity Africa & Middle East
PORTFOLIO AS AT 30 JUNE 2015 IN EUR
Quantity /
Nominal Description Currency Acquisition cost Market value % of
Net Assets
JERSEY 297 326,54 275 857,78 3,07
Raw materials 203 744,51 189 981,72 2,11 100 000,00 CENTAMIN PLC GBP 80 285,52 87 160,53 0,97 1 700,00 RANDGOLD RESOURCES LTD GBP 123 458,99 102 821,19 1,14
Energy 93 582,03 85 876,06 0,96 12 000,00 GENEL ENERGY PLC GBP 93 582,03 85 876,06 0,96
BRITISH VIRGIN ISLANDS 184 342,20 176 400,68 1,96
Raw materials 87 312,87 92 259,59 1,03 45 000,00 GEM DIAMONDS LTD GBP 87 312,87 92 259,59 1,03
Finance 97 029,33 84 141,09 0,93 15 000,00 ATLAS MARA LTD USD 97 029,33 84 141,09 0,93
UNITED ARAB EMIRATES 115 146,76 115 531,21 1,29
Finance 115 146,76 115 531,21 1,29 60 000,00 EMAAR PROPERTIES PJSC AED 115 146,76 115 531,21 1,29
FRANCE 108 709,73 104 250,00 1,16
Finance 108 709,73 104 250,00 1,16 10 000,00 COFACE SA EUR 108 709,73 104 250,00 1,16
NETHERLANDS 93 714,48 101 250,00 1,13
Industries 93 714,48 101 250,00 1,13 15 000,00 MOTA-ENGIL AFRICA NV EUR 93 714,48 101 250,00 1,13
INVESTMENT FUNDS 4 826 067,78 4 948 652,15 55,10
UCI Units 4 826 067,78 4 948 652,15 55,10
LUXEMBOURG 2 777 081,36 2 838 011,29 31,60
Finance 2 777 081,36 2 838 011,29 31,60 3 311,68 SILK AFRICAN LIONS FUND -I- EUR 435 074,72 483 603,90 5,38
3 464,28
BELLEVUE FUNDS LUX - BB AFRICAN OPPORTUNITIES -I-
EUR 798 137,83 765 016,95 8,52
33 686,27
INVESTEC GLOBAL STRATEGY FUND LTD - AFRICA OPPORTUNITIES FUND -I-
USD 528 963,69 529 390,25 5,89
1 000,00
HSBC GLOBAL INVESTMENT FUNDS - FRONTIER MARKETS -IA-
USD 100 348,75 125 536,72 1,40
185,05 COMPAM FUND - ACTIVE EMERGING CREDIT -Y- EUR 200 000,00 204 342,57 2,28
50 000,00
DB X-TRACKERS MSCI PAKISTAN IM TRN INDEX UCITS ETF
EUR 84 053,51 90 000,00 1,00
2 138,06
SCHRODER INTERNATIONAL SELECTION FUND - FRONTIER MARKETS EQUITY -K-
USD 267 223,46 274 674,14 3,06
4 415,00
RBS MARKET ACCESS MSCI EMERGING AND FRONTIER AFRICA EX SOUTH AFRICA INDEX ETF
EUR 271 691,69 276 511,45 3,08
803,79
ALQUITY SICAV - ALQUITY INDIAN SUBCONTINENT FUND -FM-
USD 91 587,71 88 935,31 0,99
FRANCE 1 149 793,96 1 147 869,15 12,78
Finance 1 149 793,96 1 147 869,15 12,78 4,73 RMA AFRICA -I- EUR 499 860,09 505 884,30 5,63 5,18 RMA ACTIONS MAROC -I- EUR 649 933,87 641 984,85 7,15
IRELAND 899 192,46 962 771,71 10,72
Finance 899 192,46 962 771,71 10,72 20 000,00 ETFS DAXGLOBAL GOLD MINING GO UCITS ETF -G- EUR 299 192,46 298 100,00 3,32
49 056,88
MAGNA UMBRELLA FUND PLC - MAGNA MENA FUND -G-
EUR 600 000,00 664 671,71 7,40
Total Portfolio 8 536 393,52 8 438 898,20 93,96
The accompanying notes form an integral part of these financial statements.
60

CompAM FUND - Multimanager Equity Africa & Middle East
FORWARD FOREIGN EXCHANGE CONTRACTS AS AT 30 JUNE 2015
Maturity Purchase commitment in
currency Sale commitment in
currency Unrealised profit/(loss)
(EUR)
Net Unrealised profit / (loss) on forward foreign exchange contracts 1 417,16
Unrealised profit on forward foreign exchange contracts 9 332,52
04/08/2015 155 176,37 EUR 2 100 000,00 ZAR 842,24 04/08/2015 449 444,94 EUR 6 000 000,00 ZAR 8 490,28
Unrealised loss on forward foreign exchange contracts (7 915,36)
02/10/2015 2 057 153,08 EUR 2 300 000,00 USD (4 407,04) 02/10/2015 954 426,15 EUR 680 000,00 GBP (3 508,32)
The accompanying notes form an integral part of these financial statements.
61

CompAM FUND - Multimanager Target Alpha
STATEMENT OF NET ASSETS AS AT 30 JUNE 2015 IN EUR
Assets Notes Investments in securities at market value (Note 1) 9 954 214,23 Cash at banks 563 273,47 Options contracts at market value (Note 1, 8) 178 449,37 Interests receivable 15 191,38 Receivable on investments sold 57 979,64 Other assets 542,83 Total assets 10 769 650,92
Liabilities Amounts due to brokers (122,64) Options contracts at market value (Note 1, 8) (56 240,00) Unrealised loss on forward foreign exchange contracts (Note 1, 8) (35 595,67) Payable on investments purchased (142 035,02) Other liabilities (49 213,02) Total liabilities (283 206,35) Total net assets 10 486 444,57
Currency Net Asset Value per Share Shares outstanding
Class A Shares EUR 110,031 32 031,263 Class M Shares EUR 106,576 65 324,029
The accompanying notes form an integral part of these financial statements.
62
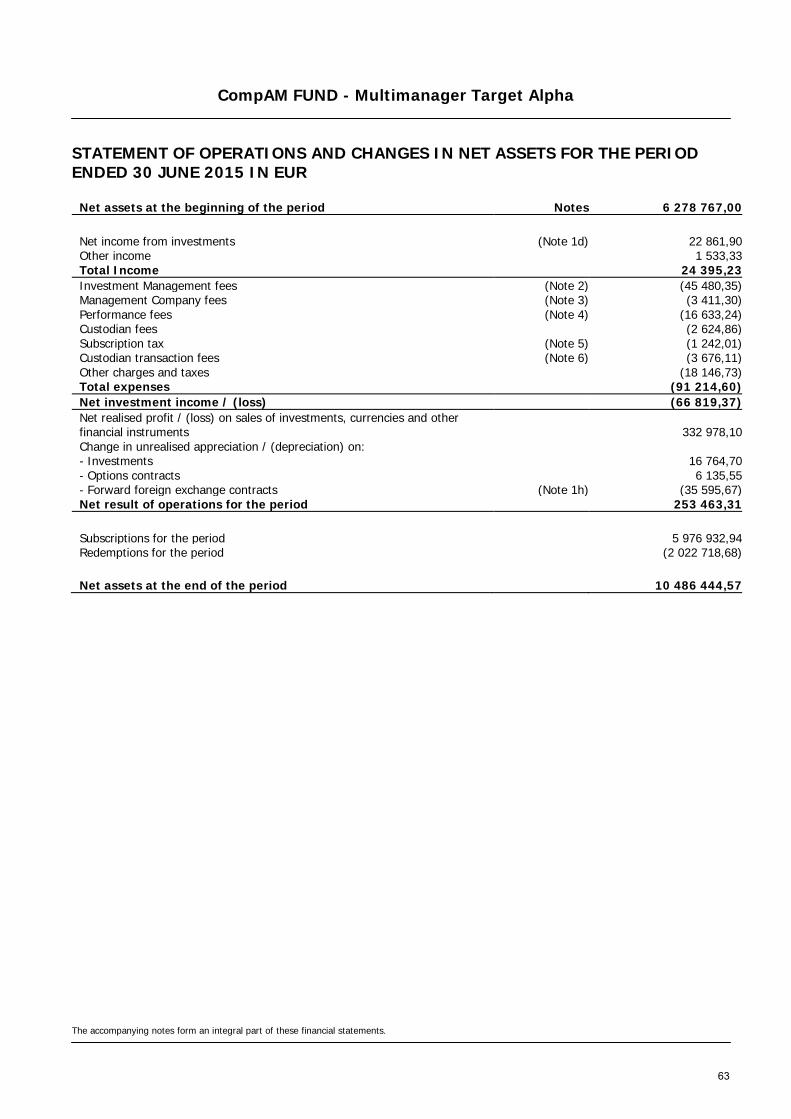
CompAM FUND - Multimanager Target Alpha
STATEMENT OF OPERATIONS AND CHANGES IN NET ASSETS FOR THE PERIOD ENDED 30 JUNE 2015 IN EUR
Net assets at the beginning of the period Notes 6 278 767,00
Net income from investments (Note 1d) 22 861,90 Other income 1 533,33 Total Income 24 395,23 Investment Management fees (Note 2) (45 480,35) Management Company fees (Note 3) (3 411,30) Performance fees (Note 4) (16 633,24) Custodian fees (2 624,86) Subscription tax (Note 5) (1 242,01) Custodian transaction fees (Note 6) (3 676,11) Other charges and taxes (18 146,73) Total expenses (91 214,60) Net investment income / (loss) (66 819,37) Net realised profit / (loss) on sales of investments, currencies and other financial instruments 332 978,10 Change in unrealised appreciation / (depreciation) on: - Investments 16 764,70 - Options contracts 6 135,55 - Forward foreign exchange contracts (Note 1h) (35 595,67) Net result of operations for the period 253 463,31
Subscriptions for the period 5 976 932,94 Redemptions for the period (2 022 718,68)
Net assets at the end of the period 10 486 444,57
The accompanying notes form an integral part of these financial statements.
63

CompAM FUND - Multimanager Target Alpha
PORTFOLIO AS AT 30 JUNE 2015 IN EUR
Quantity /
Nominal Description Currency Acquisition cost Market value % of
Net Assets
PORTFOLIO AT MARKET VALUE 9 581 891,14 9 954 214,23 94,92
TRANSFERABLE SECURITIES AND MONEY MARKET INSTRUMENTS ADMITTED TO AN OFFICIAL STOCK EXCHANGE LISTING 1 885 521,46 1 896 251,36 18,08
Ordinary Bonds 1 885 521,46 1 896 251,36 18,08
LUXEMBOURG 1 885 521,46 1 896 251,36 18,08
Supranational 1 885 521,46 1 896 251,36 18,08 1 200 000,00 EIB 1.625% 18/12/2018 USD 1 061 265,46 1 086 731,36 10,36 800 000,00 EIB 3.32% 12/12/2015 EUR 824 256,00 809 520,00 7,72
INVESTMENT FUNDS 7 696 369,68 8 057 962,87 76,84
UCI Units 7 696 369,68 8 057 962,87 76,84
LUXEMBOURG 6 359 175,10 6 621 413,92 63,14
Finance 6 359 175,10 6 621 413,92 63,14 3 000,00 GAM STAR LUX - EMERGING ALPHA -I- EUR 303 761,28 301 980,00 2,88 3 000,00 GAM STAR LUX - EUROPEAN ALPHA -I- EUR 314 265,04 332 820,00 3,17
3 000,00
MERRILL LYNCH INVESTMENT SOLUTIONS - THEOREMA EUROPEAN EQUITY LONG-SHORT UCITS -BA-
EUR 342 540,00 347 310,00 3,31
250,00 BANOR SICAV - ITALY LONG SHORT EQUITY -I- EUR 302 463,94 332 237,50 3,17
487,22
ALPHA UCITS SICAV - ANAVON GLOBAL EQUITY LONG/SHORT FUND -E-
EUR 503 521,36 523 959,61 5,00
520,95 COMPAM FUND - ACTIVE EMERGING CREDIT -Y- EUR 550 000,37 575 258,85 5,49 1 848,66 COMPAM FUND - ACTIVE LIQUID BOND -B- EUR 1 870 686,18 1 874 543,92 17,88 306,40 COMPAM FUND - ACTIVE EUROPEAN EQUITY -Y- EUR 299 999,88 318 201,49 3,03 312,97 COMPAM FUND - ACTIVE EQUITY SELECTION -Y- EUR 300 000,36 333 925,65 3,18 200,00 COMPAM FUND - CADENCE STRATEGIC ASIA -Y- EUR 200 000,00 186 222,80 1,78 330,00 COMPAM FUND - ACTIVE MARKET NEUTRAL -Y- EUR 330 000,00 328 508,73 3,13
2 000,00
DB PLATINUM IV DBX SYSTEMATIC ALPHA INDEX FUND -I1CE-
EUR 213 249,95 263 000,00 2,51
2 500,00 JULIUS BAER MULTILABEL - ARTEMIDE -C- EUR 278 687,72 346 100,00 3,30 494,71 COMPAM FUND - ACTIVE EUROPEAN CREDIT -Y- EUR 549 999,02 557 345,37 5,31
IRELAND 1 137 179,78 1 232 968,30 11,76
Finance 1 137 179,78 1 232 968,30 11,76 1 275,38 GAVEKAL ASIAN OPPORTUNITIES UCITS FUND -A- EUR 250 000,01 279 957,57 2,67 11 587,14 CANTILLON GLOBAL EQUITY FUND -O- EUR 249 999,99 272 069,41 2,59
4 000,00
ISHARES MSCI JAPAN USD HEDGED UCITS ETF -H- -A-
USD 117 982,32 118 991,21 1,14
2 500,00
ODEY INVESTMENTS PLC - ODEY GIANO EUROPEAN FUND -ACC-
EUR 269 197,25 291 308,75 2,78
1 459,77 EGERTON CAPITAL EQUITY FUND PLC -A- EUR 250 000,21 270 641,36 2,58
FRANCE 200 014,80 203 580,65 1,94
Finance 200 014,80 203 580,65 1,94 157,19 JL EQUITY MARKET NEUTRAL -A- EUR 200 014,80 203 580,65 1,94
Total Portfolio 9 581 891,14 9 954 214,23 94,92
The accompanying notes form an integral part of these financial statements.
64

CompAM FUND - Multimanager Target Alpha
OPTIONS CONTRACTS AS AT 30 JUNE 2015
Quantity Call/Put Description Currency Acquisition cost Market value Commitment
(EUR)
LISTED ON AN OFFICIAL STOCK EXCHANGE 116 073,82 122 209,37 56 240,00
PURCHASED OPTIONS 174 053,46 178 449,37 —
50 10YR US TREASURY NOTE 126,00 24/07/15 USD 32 258,44 41 369,37 — 80 DAX INDEX 10 500,00 18/09/15 EUR 141 795,02 137 080,00 —
WRITTEN OPTIONS (57 979,64) (56 240,00) 56 240,00
(80) DAX INDEX 9 600,00 18/09/15 EUR (57 979,64) (56 240,00) 56,240.00
The accompanying notes form an integral part of these financial statements.
65

CompAM FUND - Multimanager Target Alpha
FORWARD FOREIGN EXCHANGE CONTRACTS AS AT 30 JUNE 2015
Maturity Purchase commitment in
currency Sale commitment in
currency Unrealised profit/(loss)
(EUR)
Net Unrealised profit / (loss) on forward foreign exchange contracts (35 595,67)
Unrealised loss on forward foreign exchange contracts (35 595,67)
18/08/2015 7 400 000,00 DKK 1 146 414,13 USD (35 595,67)
The accompanying notes form an integral part of these financial statements.
66

CompAM FUND - SB Equity
STATEMENT OF NET ASSETS AS AT 30 JUNE 2015 IN EUR
Assets Notes Investments in securities at market value (Note 1) 13 825 836,10 Cash at banks 872 549,11 Dividends receivable 5 087,66 Receivable on subscriptions 10 886,81 Other assets 864,05 Total assets 14 715 223,73
Liabilities Other liabilities (131 793,69) Total liabilities (131 793,69) Total net assets 14 583 430,04
Currency Net Asset Value per Share Shares outstanding
Class B Shares EUR 1 286,799 4 897,302 Class D Shares EUR 1 233,037 833,505 Class I Shares EUR 1 260,882 5 512,809 Class M Shares EUR 1 186,129 255,322
The accompanying notes form an integral part of these financial statements.
67

CompAM FUND - SB Equity
STATEMENT OF OPERATIONS AND CHANGES IN NET ASSETS FOR THE PERIOD ENDED 30 JUNE 2015 IN EUR
Net assets at the beginning of the period Notes 12 111 525,86
Net income from investments (Note 1d) 26 391,44 Total Income 26 391,44 Investment Management fees (Note 2) (86 426,48) Management Company fees (Note 3) (4 830,66) Performance fees (Note 4) (105 956,63) Custodian fees (3 450,38) Subscription tax (Note 5) (2 345,07) Custodian transaction fees (Note 6) (1,81) Other charges and taxes (26 969,17) Total expenses (229 980,20) Net investment income / (loss) (203 588,76) Net realised profit / (loss) on sales of investments, currencies and other financial instruments 453 435,66 Change in unrealised appreciation / (depreciation) on: - Investments 719 624,52 Net result of operations for the period 969 471,42
Distributions (Note 7) (831,28) Subscriptions for the period 3 886 858,56 Redemptions for the period (2 383 594,52)
Net assets at the end of the period 14 583 430,04
The accompanying notes form an integral part of these financial statements.
68

CompAM FUND - SB Equity
PORTFOLIO AS AT 30 JUNE 2015 IN EUR
Quantity /
Nominal Description Currency Acquisition cost Market value % of
Net Assets
PORTFOLIO AT MARKET VALUE 11 788 211,38 13 825 836,10 94,81
TRANSFERABLE SECURITIES AND MONEY MARKET INSTRUMENTS ADMITTED TO AN OFFICIAL STOCK EXCHANGE LISTING 1 777 984,66 1 707 942,63 11,71
Shares 1 777 984,66 1 707 942,63 11,71
UNITED STATES 901 845,05 913 149,21 6,26
Raw materials 470 467,71 496 237,07 3,40 9 000,00 NEWMONT MINING CORP USD 213 648,53 188 691,45 1,29 3 000,00 ROYAL GOLD INC USD 108 087,04 165 832,00 1,14 790,00 PRECISION CASTPARTS CORP USD 148 732,14 141 713,62 0,97
Consumer Retail 197 279,96 151 212,97 1,04 4 868,00 COACH INC USD 197 279,96 151 212,97 1,04
Computing and IT 136 907,53 145 988,16 1,00 1 000,00 INTERNATIONAL BUSINESS MACHINES CORP USD 136 907,53 145 988,16 1,00
Basic Goods 97 189,85 119 711,01 0,82 3 400,00 COCA-COLA CO USD 97 189,85 119 711,01 0,82
CANADA 625 465,71 498 170,92 3,42
Raw materials 625 465,71 498 170,92 3,42 16 700,00 BARRICK GOLD CORP USD 199 417,92 159 775,64 1,10 11 000,00 SILVER WHEATON CORP USD 171 120,26 171 190,10 1,17 45 000,00 ELDORADO GOLD CORP USD 254 927,53 167 205,18 1,15
FRANCE 138 269,20 154 673,50 1,06
Energy 138 269,20 154 673,50 1,06 3 550,00 TOTAL SA EUR 138 269,20 154 673,50 1,06
NETHERLANDS 112 404,70 141 949,00 0,97
Basic Goods 112 404,70 141 949,00 0,97 3 800,00 UNILEVER NV EUR 112 404,70 141 949,00 0,97
INVESTMENT FUNDS 10 010 226,72 12 117 893,47 83,10
UCI Units 10 010 226,72 12 117 893,47 83,10
LUXEMBOURG 4 540 228,87 5 909 742,96 40,52
Finance 4 540 228,87 5 909 742,96 40,52 365,58 ALLIANZ RCM EUROPE EQUITY GROWTH -IT- EUR 592 519,41 934 890,06 6,41
4 683,00
RBS MARKET ACCESS MSCI FRONTIER MARKETS INDEX ETF
EUR 315 114,99 305 191,11 2,09
2 967,19 EURIZON EASYFUND - BOND USD LTE -ZH- EUR 686 506,01 674 443,20 4,62
3 197,15
EPSILON FUND - EMERGING BOND TOTAL RETURN -I-
EUR 431 328,05 431 935,51 2,96
16 108,25
CAPITAL GROUP EUROPEAN GROWTH AND INCOME FUND -Z-
EUR 500 000,08 484 536,16 3,32
31 340,07 JPMORGAN FUNDS - US VALUE FUND -C- USD 441 656,95 655 660,68 4,50 2 371,00 PARVEST EQUITY USA GROWTH -I- USD 263 495,15 523 143,67 3,59
5 861,05
ABERDEEN GLOBAL - EMERGING MARKETS EQUITY FUND -I2-
USD 274 009,47 351 216,02 2,41
33 420,18
ABERDEEN GLOBAL - EMERGING MARKETS SMALLER COMPANIES FUND -I2-
USD 440 529,76 575 398,87 3,94
153,74 PIONEER FUNDS - CHINA EQUITY -H- -A- EUR 165 646,69 268 034,93 1,84 4 791,98 JPMORGAN INVESTMENT FUNDS - US EQUITY -C- USD 429 422,31 705 292,75 4,84
FRANCE 2 525 581,28 2 738 522,00 18,78
Finance 2 525 581,28 2 738 522,00 18,78 30 000,00 LYXOR ETF MSCI INDIA EUR 435 730,91 443 355,00 3,04 4 900,00 LYXOR ETF MSCI EUROPE -D- EUR 608 308,30 649 103,00 4,45 66 000,00 LYXOR ETF MSCI EMERGING MARKETS -A- EUR 533 155,86 598 290,00 4,10 2 950,00 LYXOR ETF DOW JONES INDUSTRIAL AVERAGE -D- EUR 440 953,86 476 395,50 3,27 4 850,00 LYXOR ETF JAPAN TOPIX EUR 507 432,35 571 378,50 3,92
The accompanying notes form an integral part of these financial statements.
69

CompAM FUND - SB Equity
PORTFOLIO AS AT 30 JUNE 2015 IN EUR
Quantity /
Nominal Description Currency Acquisition cost Market value % of
Net Assets
IRELAND 2 484 396,58 2 729 321,54 18,72
Finance 2 484 396,58 2 729 321,54 18,72 23 350,00 ISHARES II PLC - ISHARES MSCI EUROPE EUR 522 960,88 563 202,00 3,86 34 036,00 ISHARES S&P 500 UCITS ETF EUR 600 645,74 629 410,73 4,32 32 248,00 ISHARES MSCI EMERGING MARKETS ETF EUR 1 012 219,95 1 087 402,56 7,46 38 750,00 ISHARES MSCI JAPAN UCITS ETF DIST EUR 348 570,01 449 306,25 3,08
UNITED KINGDOM 460 019,99 740 306,97 5,08
Finance 460 019,99 740 306,97 5,08
216 040,79
THREADNEEDLE INVESTMENT FUNDS ICVC - EUROPEAN SELECT FUND -2 ACC-
EUR 460 019,99 740 306,97 5,08
Total Portfolio 11 788 211,38 13 825 836,10 94,81
The accompanying notes form an integral part of these financial statements.
70

CompAM FUND - SB Flexible
STATEMENT OF NET ASSETS AS AT 30 JUNE 2015 IN EUR
Assets Notes Investments in securities at market value (Note 1) 16 636 879,76 Cash at banks 1 926 936,20 Interests receivable 23 812,26 Receivable on subscriptions 12 000,00 Other assets 2 170,14 Total assets 18 601 798,36
Liabilities Other liabilities (94 240,30) Total liabilities (94 240,30) Total net assets 18 507 558,06
Currency Net Asset Value per Share Shares outstanding
Class B Shares EUR 1 054,538 13 158,640 Class D Shares EUR 1 074,705 1 455,512 Class I Shares EUR 1 058,542 2 392,999 Class M Shares EUR 1 035,081 515,845
The accompanying notes form an integral part of these financial statements.
71

CompAM FUND - SB Flexible
STATEMENT OF OPERATIONS AND CHANGES IN NET ASSETS FOR THE PERIOD ENDED 30 JUNE 2015 IN EUR
Net assets at the beginning of the period Notes 14 971 863,35
Net income from investments (Note 1d) 13 575,47 Other income 4 462,57 Total Income 18 038,04 Investment Management fees (Note 2) (126 492,93) Management Company fees (Note 3) (5 868,22) Performance fees (Note 4) (36 427,09) Custodian fees (3 985,39) Subscription tax (Note 5) (2 196,70) Custodian transaction fees (Note 6) (6 036,35) Other charges and taxes (42 541,79) Total expenses (223 548,47) Net investment income / (loss) (205 510,43) Net realised profit / (loss) on sales of investments, currencies and other financial instruments 106 211,59 Change in unrealised appreciation / (depreciation) on: - Investments 427 991,36 Net result of operations for the period 328 692,52
Subscriptions for the period 5 855 042,07 Redemptions for the period (2 648 039,88)
Net assets at the end of the period 18 507 558,06
The accompanying notes form an integral part of these financial statements.
72

CompAM FUND - SB Flexible
PORTFOLIO AS AT 30 JUNE 2015 IN EUR
Quantity /
Nominal Description Currency Acquisition cost Market value % of
Net Assets
PORTFOLIO AT MARKET VALUE 15 946 198,03 16 636 879,76 89,89
TRANSFERABLE SECURITIES AND MONEY MARKET INSTRUMENTS ADMITTED TO AN OFFICIAL STOCK EXCHANGE LISTING 431 487,74 426 202,92 2,30
Ordinary Bonds 431 487,74 426 202,92 2,30
LUXEMBOURG 431 487,74 426 202,92 2,30
Supranational 431 487,74 426 202,92 2,30 1 500 000,00 EIB 10.50% 21/12/2017 BRL 431 487,74 426 202,92 2,30
INVESTMENT FUNDS 15 514 710,29 16 210 676,84 87,59
UCI Units 15 514 710,29 16 210 676,84 87,59
LUXEMBOURG 8 200 273,87 8 773 913,00 47,41
Finance 8 200 273,87 8 773 913,00 47,41
6 161,17
CGS FMS GLOBAL EVOLUTION FRONTIER MARKETS -I-
EUR 832 887,22 849 132,59 4,59
67,36
NATIXIS AM FUNDS - SEEYOND MULTI ASSET CONSERVATIVE GROWTH FUND -IA-
EUR 762 342,62 764 310,09 4,13
5 638,16
SCHRODER INTERNATIONAL SELECTION FUND - GLOBAL DYNAMIC BALANCED -A-
EUR 771 356,67 749 706,14 4,05
1 070,56
EURIZON INVESTMENT SICAV - FLEXIBLE BETA TOTAL RETURN -I-
EUR 732 852,53 808 262,85 4,37
819,78 COMPAM FUND - ACTIVE EMERGING CREDIT -Y- EUR 867 846,33 905 251,40 4,89
651,11
LYXOR QUANTITATIVE FUND - ABSOLUTE RETURN MULTI ASSETS 8 -I-
EUR 750 291,36 797 941,82 4,31
698,07
OYSTER FUNDS - MULTI-ASSET ABSOLUTE RETURN EUR -R2-
EUR 759 432,98 756 556,95 4,09
61 744,61
STANDARD LIFE INVESTMENTS GLOBAL SICAV - GLOBAL ABSOLUTE RETURN STRATEGIES FUND -DIA-
EUR 771 535,91 803 093,58 4,34
5 688,84 ETHNA-AKTIV -ET- EUR 643 063,65 783 580,55 4,23
4 833,92
EURIZON EASYFUND - AZIONI STRATEGIA FLESSIBILE -Z-
EUR 633 195,05 738 042,75 3,99
5 075,28 DNCA INVEST - EUROSE -I- EUR 675 469,55 818 034,28 4,42
FRANCE 2 351 015,44 2 780 816,46 15,02
Finance 2 351 015,44 2 780 816,46 15,02 6 570,00 LYXOR ETF MSCI EUROPE -D- EUR 770 446,63 870 327,90 4,70 1 164,71 CARMIGNAC PATRIMOINE -AA- EUR 638 029,50 768 638,06 4,15 74 300,00 LYXOR ETF MSCI EMERGING MARKETS -A- EUR 593 988,19 673 529,50 3,64 2 900,00 LYXOR ETF DOW JONES INDUSTRIAL AVERAGE -D- EUR 348 551,12 468 321,00 2,53
IRELAND 2 494 492,99 2 573 688,74 13,91
Finance 2 494 492,99 2 573 688,74 13,91 30 800,00 ISHARES S&P 500 UCITS ETF EUR 532 573,26 569 569,00 3,08 7 150,00 ISHARES II PLC - ISHARES MSCI EUROPE EUR 177 578,88 172 458,00 0,93
622 886,64
BNY MELLON ABSOLUTE RETURN EQUITY FUND -TH-
EUR 700 000,00 725 226,91 3,92
102 457,48
ANIMA FUNDS PLC - STAR HIGH POTENTIAL EUROPE -I-
EUR 722 437,90 755 746,83 4,08
10 400,00 ISHARES MSCI EMERGING MARKETS ETF EUR 361 902,95 350 688,00 1,90
UNITED KINGDOM 793 044,46 773 495,74 4,18
Finance 793 044,46 773 495,74 4,18 49 578,29 M&G DYNAMIC ALLOCATION FUND EUR 793 044,46 773 495,74 4,18
AUSTRIA 785 849,93 766 813,48 4,14
Finance 785 849,93 766 813,48 4,14
4 868,66
RAIFFEISEN R 337 STRATEGIC ALLOCATION MASTER AR1 -I IVA-
EUR 785 849,93 766 813,48 4,14
The accompanying notes form an integral part of these financial statements.
73

CompAM FUND - SB Flexible
PORTFOLIO AS AT 30 JUNE 2015 IN EUR
Quantity /
Nominal Description Currency Acquisition cost Market value % of
Net Assets
UNITED STATES 890 033,60 541 949,42 2,93
Finance 890 033,60 541 949,42 2,93 34 000,00 MARKET VECTORS GOLD MINERS ETF USD 890 033,60 541 949,42 2,93
Total Portfolio 15 946 198,03 16 636 879,76 89,89
The accompanying notes form an integral part of these financial statements.
74

CompAM FUND - SB Bond
STATEMENT OF NET ASSETS AS AT 30 JUNE 2015 IN EUR
Assets Notes Investments in securities at market value (Note 1) 45 174 395,37 Cash at banks 10 654 443,32 Interests receivable 196 200,99 Receivable on investments sold 1 415 756,13 Receivable on subscriptions 38 266,17 Other assets 447,85 Total assets 57 479 509,83
Liabilities Payable on investments purchased (1 366 209,48) Payable on redemptions (37 231,90) Other liabilities (203 913,93) Total liabilities (1 607 355,31) Total net assets 55 872 154,52
Currency Net Asset Value per Share Shares outstanding
Class B Shares GBP 1 073,644 33 745,533 Class D Shares EUR 1 069,778 2 206,234 Class I Shares EUR 1 110,639 14 760,103 Class M Shares EUR 1 032,102 860,526
The accompanying notes form an integral part of these financial statements.
75
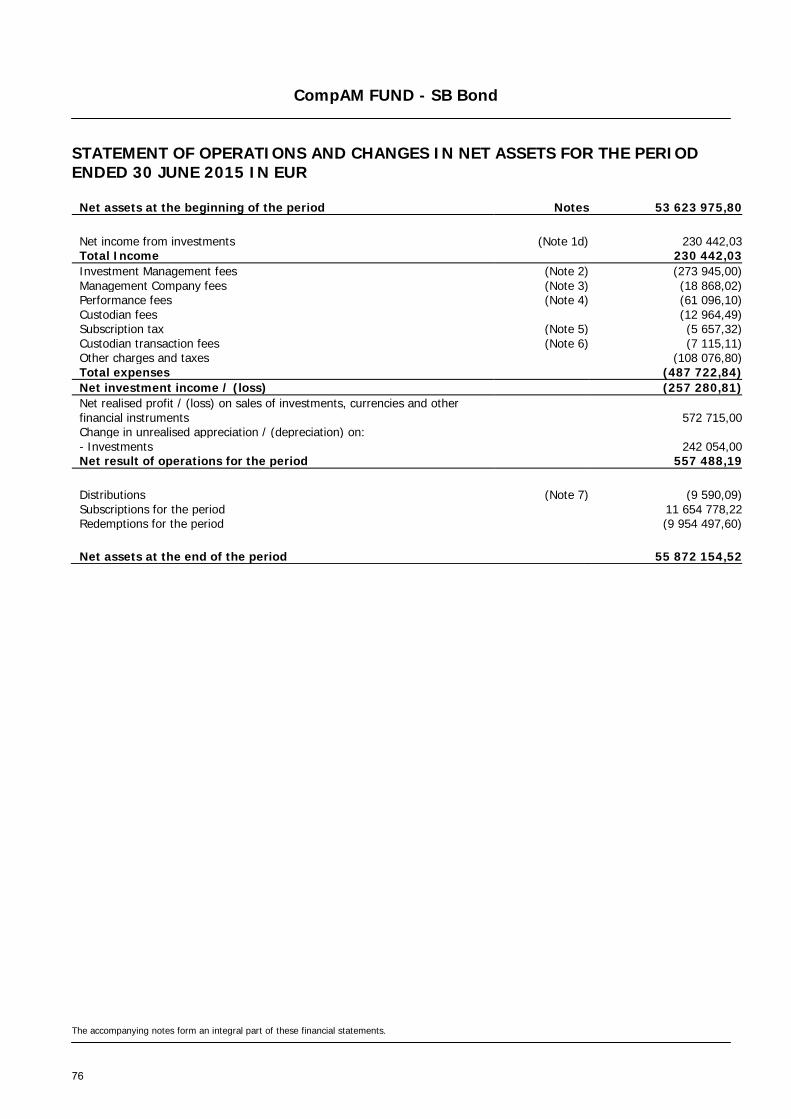
CompAM FUND - SB Bond
STATEMENT OF OPERATIONS AND CHANGES IN NET ASSETS FOR THE PERIOD ENDED 30 JUNE 2015 IN EUR
Net assets at the beginning of the period Notes 53 623 975,80
Net income from investments (Note 1d) 230 442,03 Total Income 230 442,03 Investment Management fees (Note 2) (273 945,00) Management Company fees (Note 3) (18 868,02) Performance fees (Note 4) (61 096,10) Custodian fees (12 964,49) Subscription tax (Note 5) (5 657,32) Custodian transaction fees (Note 6) (7 115,11) Other charges and taxes (108 076,80) Total expenses (487 722,84) Net investment income / (loss) (257 280,81) Net realised profit / (loss) on sales of investments, currencies and other financial instruments 572 715,00 Change in unrealised appreciation / (depreciation) on: - Investments 242 054,00 Net result of operations for the period 557 488,19
Distributions (Note 7) (9 590,09) Subscriptions for the period 11 654 778,22 Redemptions for the period (9 954 497,60)
Net assets at the end of the period 55 872 154,52
The accompanying notes form an integral part of these financial statements.
76

CompAM FUND - SB Bond
PORTFOLIO AS AT 30 JUNE 2015 IN EUR
Quantity /
Nominal Description Currency Acquisition cost Market value % of
Net Assets
PORTFOLIO AT MARKET VALUE 44 766 102,08 45 174 395,37 80,85
TRANSFERABLE SECURITIES AND MONEY MARKET INSTRUMENTS ADMITTED TO AN OFFICIAL STOCK EXCHANGE LISTING 8 472 901,56 8 261 048,01 14,78
Ordinary Bonds 6 982 526,52 6 783 868,46 12,14
MEXICO 1 575 988,87 1 632 675,00 2,92
Telecommunication 773 788,92 826 459,75 1,48 15 000 000,00 AMERICA MOVIL SAB DE CV 6.45% 05/12/2022 MXN 773 788,92 826 459,75 1,48
Government 802 199,95 806 215,25 1,44 13 500 000,00 MEXICAN BONOS 6.50% 10/06/2021 MXN 802 199,95 806 215,25 1,44
LUXEMBOURG 1 658 675,06 1 562 744,03 2,80
Supranational 1 658 675,06 1 562 744,03 2,80 5 500 000,00 EIB 10.50% 21/12/2017 BRL 1 658 675,06 1 562 744,03 2,80
BRAZIL 1 121 626,44 1 002 012,15 1,79
Government 1 121 626,44 1 002 012,15 1,79
3 500 000,00
BRAZILIAN GOVERNMENT INTERNATIONAL BOND 12.50% 05/01/2016
BRL 1 121 626,44 1 002 012,15 1,79
UNITED STATES 791 362,03 804 358,20 1,44
Supranational 791 362,03 804 358,20 1,44 55 000 000,00 INTERNATIONAL FINANCE CORP 7.80% 03/06/2019 INR 791 362,03 804 358,20 1,44
COLOMBIA 715 614,59 646 900,83 1,16
Government 715 614,59 646 900,83 1,16
1 700 000 000,00
COLOMBIA GOVERNMENT INTERNATIONAL BOND 7.75% 14/04/2021
COP 715 614,59 646 900,83 1,16
CHILE 603 883,16 601 755,00 1,08
Government 603 883,16 601 755,00 1,08
400 000 000,00
CHILE GOVERNMENT INTERNATIONAL BOND 5.50% 05/08/2020
CLP 603 883,16 601 755,00 1,08
UNITED KINGDOM 515 376,37 533 423,25 0,95
Supranational 515 376,37 533 423,25 0,95
8 000 000 000,00
EUROPEAN BANK FOR RECONSTRUCTION & DEVELOPMENT 7.25% 08/02/2016
IDR 515 376,37 533 423,25 0,95
UCI Units 1 490 375,04 1 477 179,55 2,64
LUXEMBOURG 1 490 375,04 1 477 179,55 2,64
Finance 1 490 375,04 1 477 179,55 2,64 6 708,35 EURIZON EASYFUND - BOND HIGH YIELD -Z- EUR 1 490 375,04 1 477 179,55 2,64
INVESTMENT FUNDS 36 293 200,52 36 913 347,36 66,07
UCI Units 36 293 200,52 36 913 347,36 66,07
LUXEMBOURG 27 585 206,17 28 211 760,63 50,49
Finance 27 585 206,17 28 211 760,63 50,49
19 509,56
EPSILON FUND - EMERGING BOND TOTAL RETURN -I-
EUR 2 573 600,00 2 635 741,42 4,72
19 394,72
CGS FMS GLOBAL EVOLUTION FRONTIER MARKETS -I-
EUR 2 319 999,94 2 672 979,76 4,78
1 925,89 COMPAM FUND - ACTIVE EMERGING CREDIT -Y- EUR 2 039 813,20 2 126 675,59 3,81
16 837,51
EURIZON OPPORTUNITA - OBBLIGAZIONI FLESSIBILE -I-
EUR 1 814 409,97 1 832 762,85 3,28
17 127,31 EURIZON EASYFUND - BOND USD LTE -ZH- EUR 3 911 919,84 3 893 038,47 6,97 5 529,06 NEW MILLENNIUM - AUGUSTUM CORPORATE BOND EUR 1 098 735,00 1 117 036,19 2,00
381,57
NN L EMERGING MARKETS DEBT HARD CURRENCY -IHC-
EUR 1 867 332,36 1 861 497,31 3,33
The accompanying notes form an integral part of these financial statements.
77

CompAM FUND - SB Bond
PORTFOLIO AS AT 30 JUNE 2015 IN EUR
Quantity /
Nominal Description Currency Acquisition cost Market value % of
Net Assets
29 777,95
AXA IM FIXED INCOME INVESTMENT STRATEGIES - US CORPORATE BOND -ZH-
EUR 3 119 258,91 3 125 195,54 5,59
12 756,19
GOLDMAN SACHS GLOBAL STRATEGIC INCOME BOND PORTFOLIO -IA-
EUR 1 500 000,03 1 487 116,28 2,66
2 753,56
AMUNDI FUNDS - BOND US OPPORTUNISTIC CORE PLUS -IHEC-
EUR 3 174 297,91 3 179 589,65 5,69
255 238,52
HSBC GLOBAL INVESTMENT FUNDS - GEM DEBT TOTAL RETURN -L1CH-
EUR 2 613 315,00 2 707 314,93 4,85
9 574,56
AXA IM FIXED INCOME INVESTMENT STRATEGIES - US SHORT DURATION HIGH YIELD -B-
EUR 1 552 524,01 1 572 812,64 2,81
IRELAND 5 729 533,40 5 924 270,85 10,60
Finance 5 729 533,40 5 924 270,85 10,60
161 301,81
PIMCO FUNDS GLOBAL INVESTORS SERIES PLC - TOTAL RETURN BOND FUND -HI ACC-
EUR 3 226 232,75 3 366 368,67 6,02
21 527,54
MUZINICH SHORT DURATION HIGH YIELD FUND -H- -A-
EUR 2 503 300,65 2 557 902,18 4,58
UNITED KINGDOM 1 824 961,54 2 075 969,57 3,72
Finance 1 824 961,54 2 075 969,57 3,72 108 127,36 M&G OPTIMAL INCOME FUND -C A- EUR 1 824 961,54 2 075 969,57 3,72
UNITED STATES 1 153 499,41 701 346,31 1,26
Finance 1 153 499,41 701 346,31 1,26 44 000,00 MARKET VECTORS GOLD MINERS ETF USD 1 153 499,41 701 346,31 1,26
Total Portfolio 44 766 102,08 45 174 395,37 80,85
The accompanying notes form an integral part of these financial statements.
78

CompAM FUND - Active Bond Plus
STATEMENT OF NET ASSETS AS AT 30 JUNE 2015 IN EUR
Assets Notes Investments in securities at market value (Note 1) 22 808 087,59 Cash at banks 2 856 972,18 Unrealised profit on forward foreign exchange contracts (Note 1, 8) 185 638,45 Dividends receivable 4 990,46 Interests receivable 306 908,15 Receivable on investments sold 274 188,11 Total assets 26 436 784,94
Liabilities Unrealised loss on forward foreign exchange contracts (Note 1, 8) (15 338,12) Other liabilities (282 832,73) Total liabilities (298 170,85) Total net assets 26 138 614,09
Currency Net Asset Value per Share Shares outstanding
Class B Shares EUR 1 044,260 1 756,095 Class I Shares EUR 1 133,497 21 442,306
The accompanying notes form an integral part of these financial statements.
79

CompAM FUND - Active Bond Plus
STATEMENT OF OPERATIONS AND CHANGES IN NET ASSETS FOR THE PERIOD ENDED 30 JUNE 2015 IN EUR
Net assets at the beginning of the period Notes 30 976 176,71
Net income from investments (Note 1d) 445 323,30 Total Income 445 323,30 Investment Management fees (Note 2) (178 266,77) Management Company fees (Note 3) (10 252,35) Performance fees (Note 4) (232 719,69) Custodian fees (7 323,09) Subscription tax (Note 5) (6 943,65) Custodian transaction fees (Note 6) (16 648,38) Other charges and taxes (37 641,49) Total expenses (489 795,42) Net investment income / (loss) (44 472,12) Net realised profit / (loss) on sales of investments, currencies and other financial instruments 358 247,74 Change in unrealised appreciation / (depreciation) on: - Investments 331 222,80 - Forward foreign exchange contracts (Note 1h) 285 878,34 Net result of operations for the period 930 876,76
Subscriptions for the period 2 476 352,01 Redemptions for the period (8 244 791,39)
Net assets at the end of the period 26 138 614,09
The accompanying notes form an integral part of these financial statements.
80

CompAM FUND - Active Bond Plus
PORTFOLIO AS AT 30 JUNE 2015 IN EUR
Quantity /
Nominal Description Currency Acquisition cost Market value % of
Net Assets
PORTFOLIO AT MARKET VALUE 22 341 506,58 22 808 087,59 87,26
TRANSFERABLE SECURITIES AND MONEY MARKET INSTRUMENTS ADMITTED TO AN OFFICIAL STOCK EXCHANGE LISTING 21 692 668,77 22 137 220,60 84,69
Shares 2 778 477,79 2 692 246,94 10,30
GERMANY 1 397 430,97 1 349 921,18 5,16
Industries 479 177,43 447 478,67 1,71 2 458,00 MAN SE EUR 231 055,16 227 094,62 0,87 8 410,00 DEUTSCHE POST AG EUR 248 122,27 220 384,05 0,84
Finance 229 462,38 227 850,70 0,87 1 631,00 ALLIANZ SE EUR 229 462,38 227 850,70 0,87
Telecommunication 228 378,94 226 311,60 0,87 14 648,00 DEUTSCHE TELEKOM AG EUR 228 378,94 226 311,60 0,87
Consumer Retail 230 580,45 225 617,64 0,86 2 298,00 BAYERISCHE MOTOREN WERKE AG EUR 230 580,45 225 617,64 0,86
Raw materials 229 831,77 222 662,57 0,85 9 542,00 THYSSENKRUPP AG EUR 229 831,77 222 662,57 0,85
FRANCE 691 057,13 656 029,20 2,51
Consumer Retail 231 147,11 221 320,05 0,85 1 113,00 ILIAD SA EUR 231 147,11 221 320,05 0,85
Finance 229 784,23 217 972,44 0,83 33 768,00 NATIXIS SA EUR 229 784,23 217 972,44 0,83
Industries 230 125,79 216 736,71 0,83 6 463,00 BOUYGUES SA EUR 230 125,79 216 736,71 0,83
NETHERLANDS 229 049,19 239 362,55 0,92
Telecommunication 229 049,19 239 362,55 0,92 69 785,00 KONINKLIJKE KPN NV EUR 229 049,19 239 362,55 0,92
BELGIUM 230 398,20 228 752,41 0,88
Telecommunication 230 398,20 228 752,41 0,88 7 223,00 PROXIMUS EUR 230 398,20 228 752,41 0,88
FINLAND 230 542,30 218 181,60 0,83
Industries 230 542,30 218 181,60 0,83 5 994,00 KONE OYJ EUR 230 542,30 218 181,60 0,83
Ordinary Bonds 14 452 541,40 14 993 772,81 57,36
LUXEMBOURG 4 804 677,14 4 789 645,66 18,32
Supranational 3 116 970,00 3 087 675,00 11,81 3 000 000,00 EFSF 2.75% 18/07/2016 EUR 3 116 970,00 3 087 675,00 11,81
Energy 614 510,23 665 112,38 2,54
500 000,00
GAZPROM OAO VIA GAZ CAPITAL SA 4.95% 19/07/2022
USD 364 510,23 415 161,13 1,59
250 000,00 TRAFIGURA FUNDING SA 5.00% 27/04/2020 EUR 250 000,00 249 951,25 0,95
Telecommunication 590 640,63 561 514,24 2,15 300 000,00 MATTERHORN TELECOM SA 3.875% 01/05/2022 EUR 300 000,00 285 751,50 1,09 300 000,00 MATTERHORN TELECOM SA 3.625% 01/05/2022 CHF 290 640,63 275 762,74 1,06
Finance 482 556,28 475 344,04 1,82 250 000,00 TRAFIGURA FUNDING SA 5.25% 29/11/2018 EUR 250 000,00 256 721,25 0,98
300 000,00
SBERBANK OF RUSSIA VIA SB CAPITAL SA 5.25% 23/05/2023
USD 232 556,28 218 622,79 0,84
The accompanying notes form an integral part of these financial statements.
81

CompAM FUND - Active Bond Plus
PORTFOLIO AS AT 30 JUNE 2015 IN EUR
Quantity /
Nominal Description Currency Acquisition cost Market value % of
Net Assets
IRELAND 1 173 789,22 1 297 898,20 4,97
Finance 1 173 789,22 1 297 898,20 4,97 500 000,00 PGH CAPITAL LTD 5.75% 07/07/2021 GBP 624 419,72 751 164,95 2,88
300 000,00
BANK OF IRELAND MORTGAGE BANK 3.125% 20/11/2015
EUR 299 442,00 303 477,00 1,16
250 000,00 ALLIED IRISH BANKS PLC 1.375% 16/03/2020 EUR 249 927,50 243 256,25 0,93
GERMANY 1 249 407,50 1 261 571,25 4,83
Industries 499 250,00 527 750,00 2,02 500 000,00 HOCHTIEF AG 3.875% 20/03/2020 EUR 499 250,00 527 750,00 2,02
Finance 498 595,00 491 842,50 1,88 500 000,00 LBBW 2.875% 27/05/2026 EUR 498 595,00 491 842,50 1,88
Consumer Retail 251 562,50 241 978,75 0,93 250 000,00 UNITYMEDIA GMBH 3.75% 15/01/2027 EUR 251 562,50 241 978,75 0,93
NETHERLANDS 1 120 899,00 1 142 103,13 4,37
Energy 573 957,50 622 092,13 2,38
750 000,00
PETROBRAS GLOBAL FINANCE BV 3.00% 15/01/2019
USD 573 957,50 622 092,13 2,38
Finance 546 941,50 520 011,00 1,99 300 000,00 NN GROUP NV 1.00% 18/03/2022 EUR 299 274,00 289 228,50 1,11 250 000,00 ABN AMRO BANK NV 1.00% 16/04/2025 EUR 247 667,50 230 782,50 0,88
FRANCE 1 040 123,84 1 096 986,63 4,20
Finance 748 792,50 741 090,00 2,84 750 000,00 DEXIA CREDIT LOCAL SA 0.25% 19/03/2020 EUR 748 792,50 741 090,00 2,84
Consumer Retail 291 331,34 355 896,63 1,36 400 000,00 NUMERICABLE-SFR SAS 4.875% 15/05/2019 USD 291 331,34 355 896,63 1,36
TURKEY 797 923,67 870 427,27 3,33
Finance 380 909,00 445 431,73 1,70
500 000,00
TURKIYE VAKIFLAR BANKASI TAO 3.75% 15/04/2018
USD 380 909,00 445 431,73 1,70
Telecommunication 220 817,73 223 495,57 0,86 250 000,00 TURK TELEKOMUNIKASYON AS 4.875% 19/06/2024 USD 220 817,73 223 495,57 0,86
Basic Goods 196 196,94 201 499,97 0,77
250 000,00
ANADOLU EFES BIRACILIK VE MALT SANAYII AS 3.375% 01/11/2022
USD 196 196,94 201 499,97 0,77
UNITED KINGDOM 750 000,00 760 231,25 2,91
Industries 500 000,00 521 387,50 2,00 500 000,00 EC FINANCE PLC 5.125% 15/07/2021 EUR 500 000,00 521 387,50 2,00
Raw materials 250 000,00 238 843,75 0,91 250 000,00 INEOS FINANCE PLC 4.00% 01/05/2023 EUR 250 000,00 238 843,75 0,91
MEXICO 499 506,00 505 611,00 1,93
Industries 300 000,00 302 307,00 1,15 300 000,00 CEMEX SAB DE CV 4.75% 11/01/2022 EUR 300 000,00 302 307,00 1,15
Energy 199 506,00 203 304,00 0,78 200 000,00 PETROLEOS MEXICANOS 3.75% 16/04/2026 EUR 199 506,00 203 304,00 0,78
FINLAND 499 320,00 497 170,00 1,90
Finance 499 320,00 497 170,00 1,90
500 000,00
SAASTOPANKKIEN KESKUSPANKKI SUOMI OYJ 1.00% 06/05/2020
EUR 499 320,00 497 170,00 1,90
PORTUGAL 499 075,00 488 680,00 1,87
Finance 499 075,00 488 680,00 1,87 500 000,00 NOVO BANCO SA 2.625% 08/05/2017 EUR 499 075,00 488 680,00 1,87
The accompanying notes form an integral part of these financial statements.
82

CompAM FUND - Active Bond Plus
PORTFOLIO AS AT 30 JUNE 2015 IN EUR
Quantity /
Nominal Description Currency Acquisition cost Market value % of
Net Assets
SWITZERLAND 360 329,86 445 440,71 1,70
Finance 360 329,86 445 440,71 1,70 500 000,00 UBS AG 5.125% 15/05/2024 USD 360 329,86 445 440,71 1,70
GEORGIA 328 138,40 373 787,50 1,43
Finance 328 138,40 373 787,50 1,43 400 000,00 BANK OF GEORGIA JSC 7.75% 05/07/2017 USD 328 138,40 373 787,50 1,43
ARGENTINA 289 970,80 364 261,38 1,39
Energy 289 970,80 364 261,38 1,39 400 000,00 YPF SA 8.75% 04/04/2024 USD 289 970,80 364 261,38 1,39
BRAZIL 323 951,71 352 158,75 1,35
Telecommunication 323 951,71 352 158,75 1,35 450 000,00 OI SA 5.75% 10/02/2022 USD 323 951,71 352 158,75 1,35
VIRGIN ISLANDS 225 985,51 254 664,80 0,97
Energy 225 985,51 254 664,80 0,97 300 000,00 CNOOC FINANCE 2013 LTD 3.00% 09/05/2023 USD 225 985,51 254 664,80 0,97
SWEDEN 239 443,75 247 112,78 0,95
Telecommunication 239 443,75 247 112,78 0,95 227 500,00 NORCELL SWEDEN HOLDING 2 10.75% 29/09/2019 EUR 239 443,75 247 112,78 0,95
ITALY 250 000,00 246 022,50 0,94
Finance 250 000,00 246 022,50 0,94 250 000,00 UNIPOLSAI SPA 5.75% 31/12/2049 EUR 250 000,00 246 022,50 0,94
Floating rate notes 4 461 649,58 4 451 200,85 17,03
NORWAY 1 002 500,00 1 001 625,00 3,83
Energy 1 002 500,00 1 001 625,00 3,83 1 000 000,00 STATOIL ASA FRN 19/08/2019 EUR 1 002 500,00 1 001 625,00 3,83
SWITZERLAND 744 367,50 800 462,50 3,06
Finance 744 367,50 800 462,50 3,06 500 000,00 CREDIT SUISSE AG FRN 18/09/2025 EUR 496 605,00 556 325,00 2,13
250 000,00
DEMETER INVESTMENTS BV FOR SWISS LIFE AG FRN 29/12/2049
EUR 247 762,50 244 137,50 0,93
ITALY 499 550,00 538 425,00 2,06
Finance 499 550,00 538 425,00 2,06 500 000,00 UNICREDIT SPA FRN 28/10/2025 EUR 499 550,00 538 425,00 2,06
UNITED STATES 500 000,00 499 965,00 1,91
Basic Goods 500 000,00 499 965,00 1,91 500 000,00 COCA-COLA CO FRN 09/09/2019 EUR 500 000,00 499 965,00 1,91
UNITED KINGDOM 389 949,59 489 086,68 1,87
Finance 389 949,59 489 086,68 1,87 450 000,00 ROYAL BANK OF SCOTLAND PLC FRN 16/03/2022 CHF 389 949,59 489 086,68 1,87
LUXEMBOURG 350 000,00 352 864,75 1,35
Finance 350 000,00 352 864,75 1,35 350 000,00 JOHN DEERE BANK SA FRN 19/03/2019 EUR 350 000,00 352 864,75 1,35
GREECE 445 594,50 265 492,50 1,02
Government 445 594,50 265 492,50 1,02
650 000,00
HELLENIC REPUBLIC GOVERNMENT BOND FRN 24/02/2027
EUR 445 594,50 265 492,50 1,02
The accompanying notes form an integral part of these financial statements.
83

CompAM FUND - Active Bond Plus
PORTFOLIO AS AT 30 JUNE 2015 IN EUR
Quantity /
Nominal Description Currency Acquisition cost Market value % of
Net Assets
IRELAND 280 235,49 252 176,92 0,97
Finance 280 235,49 252 176,92 0,97
300 000,00
WILLOW NO 2 IRELAND PLC FOR ZURICH INSURANCE CO LTD FRN 01/10/2045
USD 280 235,49 252 176,92 0,97
SWEDEN 249 452,50 251 102,50 0,96
Consumer Retail 249 452,50 251 102,50 0,96 250 000,00 VOLVO TREASURY AB FRN 10/06/2075 EUR 249 452,50 251 102,50 0,96
TRANSFERABLE SECURITIES AND MONEY MARKET INSTRUMENTS DEALT IN ON ANOTHER REGULATED MARKET 149 577,81 174 106,99 0,67
Ordinary Bonds 149 577,81 174 106,99 0,67
VIRGIN ISLANDS 149 577,81 174 106,99 0,67
Consumer Retail 149 577,81 174 106,99 0,67
200 000,00
ARCOS DORADOS HOLDINGS INC 6.625% 27/09/2023
USD 149 577,81 174 106,99 0,67
OTHER TRANSFERABLE SECURITIES AND MONEY MARKET INSTRUMENTS 499 260,00 496 760,00 1,90
Floating rate notes 499 260,00 496 760,00 1,90
ITALY 499 260,00 496 760,00 1,90
Finance 499 260,00 496 760,00 1,90 500 000,00 INTESA SANPAOLO SPA FRN 15/06/2020 EUR 499 260,00 496 760,00 1,90
Total Portfolio 22 341 506,58 22 808 087,59 87,26
The accompanying notes form an integral part of these financial statements.
84

CompAM FUND - Active Bond Plus
FORWARD FOREIGN EXCHANGE CONTRACTS AS AT 30 JUNE 2015
Maturity Purchase commitment in
currency Sale commitment in
currency Unrealised profit/(loss)
(EUR)
Net Unrealised profit / (loss) on forward foreign exchange contracts 170 300,33
Unrealised profit on forward foreign exchange contracts 185 638,45
30/09/2015 3 771 069,67 EUR 4 000 000,00 USD 185 638,45
Unrealised loss on forward foreign exchange contracts (15 338,12)
30/09/2015 690 007,31 EUR 500 000,00 GBP (14 388,19) 30/09/2015 961 555,10 EUR 1 000 000,00 CHF (949,93)
The accompanying notes form an integral part of these financial statements.
85

CompAM FUND - ML Opportunity
STATEMENT OF NET ASSETS AS AT 30 JUNE 2015 IN EUR
Assets Notes Investments in securities at market value (Note 1) 1 007 212,58 Cash at banks 160 283,14 Amounts due from brokers (Note 8) 2 924,00 Dividends receivable 18,50 Interests receivable 2 337,84 Total assets 1 172 776,06
Liabilities Unrealised loss on futures contracts (Note 1, 8) (1 554,93) Other liabilities (23 189,13) Total liabilities (24 744,06) Total net assets 1 148 032,00
Currency Net Asset Value per Share Shares outstanding
Class M Shares EUR 847,343 1 354,861
The accompanying notes form an integral part of these financial statements.
86

CompAM FUND - ML Opportunity
STATEMENT OF OPERATIONS AND CHANGES IN NET ASSETS FOR THE PERIOD ENDED 30 JUNE 2015 IN EUR
Net assets at the beginning of the period Notes 1 427 805,76
Net income from investments (Note 1d) 4 201,48 Other income 85,73 Total Income 4 287,21 Investment Management fees (Note 2) (5 753,71) Management Company fees (Note 3) (447,54) Performance fees (Note 4) (227,54) Custodian fees (2 622,69) Subscription tax (Note 5) (302,19) Custodian transaction fees (Note 6) (2 559,34) Other charges and taxes (14 051,63) Total expenses (25 964,64) Net investment income / (loss) (21 677,43) Net realised profit / (loss) on sales of investments, currencies and other financial instruments 29 175,10 Change in unrealised appreciation / (depreciation) on: - Investments (9 308,00) - Futures contracts (Note 1i) 1 019,46 Net result of operations for the period (790,87)
Redemptions for the period (278 982,89)
Net assets at the end of the period 1 148 032,00
The accompanying notes form an integral part of these financial statements.
87

CompAM FUND - ML Opportunity
PORTFOLIO AS AT 30 JUNE 2015 IN EUR
Quantity /
Nominal Description Currency Acquisition cost Market value % of
Net Assets
PORTFOLIO AT MARKET VALUE 987 023,84 1 007 212,58 87,73
TRANSFERABLE SECURITIES AND MONEY MARKET INSTRUMENTS ADMITTED TO AN OFFICIAL STOCK EXCHANGE LISTING 835 994,59 835 117,58 72,74
Ordinary Bonds 455 802,50 455 015,00 39,63
LUXEMBOURG 255 302,50 254 815,00 22,19
Supranational 255 302,50 254 815,00 22,19 250 000,00 EIB 2.625% 15/03/2016 EUR 255 302,50 254 815,00 22,19
GERMANY 200 500,00 200 200,00 17,44
Government 200 500,00 200 200,00 17,44 200 000,00 BUNDESSCHATZANWEISUNGEN 0.25% 11/09/2015 EUR 200 500,00 200 200,00 17,44
Zero-Coupon Bonds 380 192,09 380 102,58 33,11
GERMANY 230 215,13 230 261,58 20,06
Government 230 215,13 230 261,58 20,06 200 000,00 BUNDESSCHATZANWEISUNGEN 0.00% 11/12/2015 EUR 200 168,00 200 245,00 17,44 15 000,00 GERMAN TREASURY BILL 0.00% 28/10/2015 EUR 15 030,33 15 014,70 1,31 15 000,00 GERMAN TREASURY BILL 0.00% 15/07/2015 EUR 15 016,80 15 001,88 1,31
ITALY 149 976,96 149 841,00 13,05
Government 149 976,96 149 841,00 13,05 150 000,00 BOT 0.00% 13/05/2016 EUR 149 976,96 149 841,00 13,05
INVESTMENT FUNDS 151 029,25 172 095,00 14,99
UCI Units 151 029,25 172 095,00 14,99
GERMANY 151 029,25 172 095,00 14,99
Finance 151 029,25 172 095,00 14,99 4 470,00 ISHARES STOXX EUROPE 600 UCITS ETF DE EUR 151 029,25 172 095,00 14,99
Total Portfolio 987 023,84 1 007 212,58 87,73
The accompanying notes form an integral part of these financial statements.
88

CompAM FUND - ML Opportunity
COMMITMENTS ON FUTURE CONTRACTS AS AT 30 JUNE 2015
Size Quantity
Purchase /
Sale Description Maturity Currency
Unrealised profit / (loss)
(EUR) Commitment
(EUR)
Total Unrealised profit / (loss) on futures contracts and commitment (1 554,93) 92 191,71
Unrealised loss on futures contracts and commitment (1 554,93) 92 191,71
50 1 Purchase S&P 500 E-MINI 18/09/2015 USD (1 554,93) 92 191,71
The accompanying notes form an integral part of these financial statements.
89

CompAM FUND - Global Diversified
STATEMENT OF NET ASSETS AS AT 30 JUNE 2015 IN EUR
Assets Notes Investments in securities at market value (Note 1) 32 743 985,42 Cash at banks 5 975 801,77 Options contracts at market value (Note 1, 8) 118 500,00 Dividends receivable 17 434,81 Interests receivable 181 318,56 Receivable on investments sold 1 276 305,63 Receivable on subscriptions 899 980,00 Other assets 3 647,25 Total assets 41 216 973,44
Liabilities Unrealised loss on forward foreign exchange contracts (Note 1, 8) (9 204,34) Payable on investments purchased (339 781,09) Other liabilities (228 567,62) Total liabilities (577 553,05) Total net assets 40 639 420,39
Currency Net Asset Value per Share Shares outstanding
Class A Shares EUR 1 133,528 23 845,121 Class B Shares EUR 991,313 899,980 Class M Shares EUR 1 148,572 11 073,000
The accompanying notes form an integral part of these financial statements.
90

CompAM FUND - Global Diversified
STATEMENT OF OPERATIONS AND CHANGES IN NET ASSETS FOR THE PERIOD ENDED 30 JUNE 2015 IN EUR
Net assets at the beginning of the period Notes 20 050 450,31
Net income from investments (Note 1d) 389 624,50 Total Income 389 624,50 Investment Management fees (Note 2) (122 518,59) Management Company fees (Note 3) (9 474,11) Performance fees (Note 4) (135 545,53) Custodian fees (6 767,24) Subscription tax (Note 5) (8 186,60) Custodian transaction fees (Note 6) (14 860,10) Other charges and taxes (32 554,62) Total expenses (329 906,79) Net investment income / (loss) 59 717,71 Net realised profit / (loss) on sales of investments, currencies and other financial instruments 1 228 915,48 Change in unrealised appreciation / (depreciation) on: - Investments (101 388,47) - Options contracts 2 100,00 - Forward foreign exchange contracts (Note 1h) (9 204,34) - Futures contracts (Note 1i) 31 950,00 Net result of operations for the period 1 212 090,38
Subscriptions for the period 19 376 879,70
Net assets at the end of the period 40 639 420,39
The accompanying notes form an integral part of these financial statements.
91
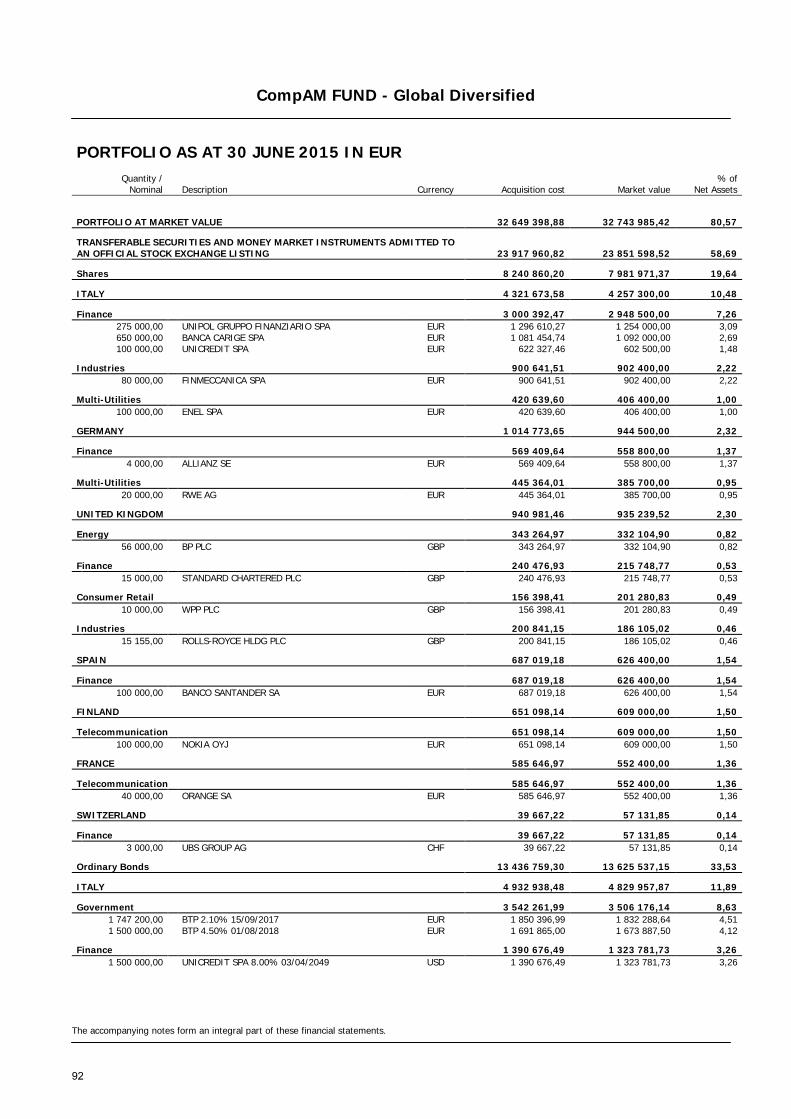
CompAM FUND - Global Diversified
PORTFOLIO AS AT 30 JUNE 2015 IN EUR
Quantity /
Nominal Description Currency Acquisition cost Market value % of
Net Assets
PORTFOLIO AT MARKET VALUE 32 649 398,88 32 743 985,42 80,57
TRANSFERABLE SECURITIES AND MONEY MARKET INSTRUMENTS ADMITTED TO AN OFFICIAL STOCK EXCHANGE LISTING 23 917 960,82 23 851 598,52 58,69
Shares 8 240 860,20 7 981 971,37 19,64
ITALY 4 321 673,58 4 257 300,00 10,48
Finance 3 000 392,47 2 948 500,00 7,26 275 000,00 UNIPOL GRUPPO FINANZIARIO SPA EUR 1 296 610,27 1 254 000,00 3,09 650 000,00 BANCA CARIGE SPA EUR 1 081 454,74 1 092 000,00 2,69 100 000,00 UNICREDIT SPA EUR 622 327,46 602 500,00 1,48
Industries 900 641,51 902 400,00 2,22 80 000,00 FINMECCANICA SPA EUR 900 641,51 902 400,00 2,22
Multi-Utilities 420 639,60 406 400,00 1,00 100 000,00 ENEL SPA EUR 420 639,60 406 400,00 1,00
GERMANY 1 014 773,65 944 500,00 2,32
Finance 569 409,64 558 800,00 1,37 4 000,00 ALLIANZ SE EUR 569 409,64 558 800,00 1,37
Multi-Utilities 445 364,01 385 700,00 0,95 20 000,00 RWE AG EUR 445 364,01 385 700,00 0,95
UNITED KINGDOM 940 981,46 935 239,52 2,30
Energy 343 264,97 332 104,90 0,82 56 000,00 BP PLC GBP 343 264,97 332 104,90 0,82
Finance 240 476,93 215 748,77 0,53 15 000,00 STANDARD CHARTERED PLC GBP 240 476,93 215 748,77 0,53
Consumer Retail 156 398,41 201 280,83 0,49 10 000,00 WPP PLC GBP 156 398,41 201 280,83 0,49
Industries 200 841,15 186 105,02 0,46 15 155,00 ROLLS-ROYCE HLDG PLC GBP 200 841,15 186 105,02 0,46
SPAIN 687 019,18 626 400,00 1,54
Finance 687 019,18 626 400,00 1,54 100 000,00 BANCO SANTANDER SA EUR 687 019,18 626 400,00 1,54
FINLAND 651 098,14 609 000,00 1,50
Telecommunication 651 098,14 609 000,00 1,50 100 000,00 NOKIA OYJ EUR 651 098,14 609 000,00 1,50
FRANCE 585 646,97 552 400,00 1,36
Telecommunication 585 646,97 552 400,00 1,36 40 000,00 ORANGE SA EUR 585 646,97 552 400,00 1,36
SWITZERLAND 39 667,22 57 131,85 0,14
Finance 39 667,22 57 131,85 0,14 3 000,00 UBS GROUP AG CHF 39 667,22 57 131,85 0,14
Ordinary Bonds 13 436 759,30 13 625 537,15 33,53
ITALY 4 932 938,48 4 829 957,87 11,89
Government 3 542 261,99 3 506 176,14 8,63 1 747 200,00 BTP 2.10% 15/09/2017 EUR 1 850 396,99 1 832 288,64 4,51 1 500 000,00 BTP 4.50% 01/08/2018 EUR 1 691 865,00 1 673 887,50 4,12
Finance 1 390 676,49 1 323 781,73 3,26 1 500 000,00 UNICREDIT SPA 8.00% 03/04/2049 USD 1 390 676,49 1 323 781,73 3,26
The accompanying notes form an integral part of these financial statements.
92
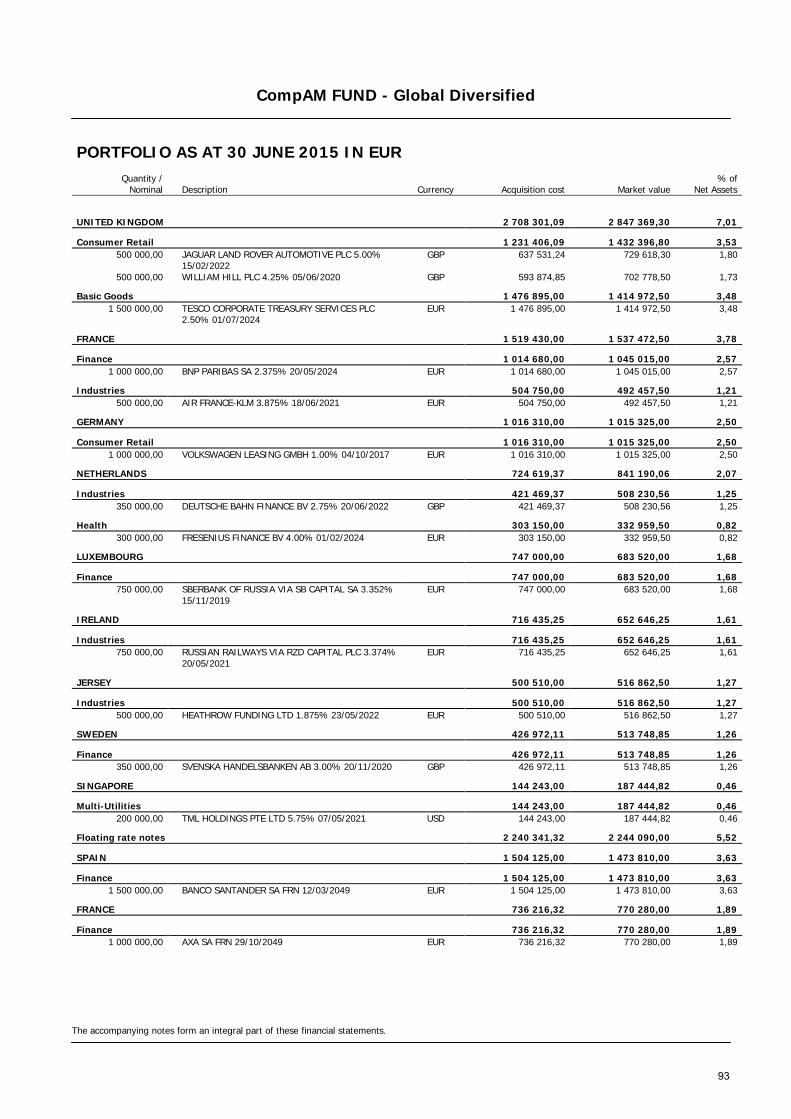
CompAM FUND - Global Diversified
PORTFOLIO AS AT 30 JUNE 2015 IN EUR
Quantity /
Nominal Description Currency Acquisition cost Market value % of
Net Assets
UNITED KINGDOM 2 708 301,09 2 847 369,30 7,01
Consumer Retail 1 231 406,09 1 432 396,80 3,53
500 000,00
JAGUAR LAND ROVER AUTOMOTIVE PLC 5.00% 15/02/2022
GBP 637 531,24 729 618,30 1,80
500 000,00 WILLIAM HILL PLC 4.25% 05/06/2020 GBP 593 874,85 702 778,50 1,73
Basic Goods 1 476 895,00 1 414 972,50 3,48
1 500 000,00
TESCO CORPORATE TREASURY SERVICES PLC 2.50% 01/07/2024
EUR 1 476 895,00 1 414 972,50 3,48
FRANCE 1 519 430,00 1 537 472,50 3,78
Finance 1 014 680,00 1 045 015,00 2,57 1 000 000,00 BNP PARIBAS SA 2.375% 20/05/2024 EUR 1 014 680,00 1 045 015,00 2,57
Industries 504 750,00 492 457,50 1,21 500 000,00 AIR FRANCE-KLM 3.875% 18/06/2021 EUR 504 750,00 492 457,50 1,21
GERMANY 1 016 310,00 1 015 325,00 2,50
Consumer Retail 1 016 310,00 1 015 325,00 2,50 1 000 000,00 VOLKSWAGEN LEASING GMBH 1.00% 04/10/2017 EUR 1 016 310,00 1 015 325,00 2,50
NETHERLANDS 724 619,37 841 190,06 2,07
Industries 421 469,37 508 230,56 1,25 350 000,00 DEUTSCHE BAHN FINANCE BV 2.75% 20/06/2022 GBP 421 469,37 508 230,56 1,25
Health 303 150,00 332 959,50 0,82 300 000,00 FRESENIUS FINANCE BV 4.00% 01/02/2024 EUR 303 150,00 332 959,50 0,82
LUXEMBOURG 747 000,00 683 520,00 1,68
Finance 747 000,00 683 520,00 1,68
750 000,00
SBERBANK OF RUSSIA VIA SB CAPITAL SA 3.352% 15/11/2019
EUR 747 000,00 683 520,00 1,68
IRELAND 716 435,25 652 646,25 1,61
Industries 716 435,25 652 646,25 1,61
750 000,00
RUSSIAN RAILWAYS VIA RZD CAPITAL PLC 3.374% 20/05/2021
EUR 716 435,25 652 646,25 1,61
JERSEY 500 510,00 516 862,50 1,27
Industries 500 510,00 516 862,50 1,27 500 000,00 HEATHROW FUNDING LTD 1.875% 23/05/2022 EUR 500 510,00 516 862,50 1,27
SWEDEN 426 972,11 513 748,85 1,26
Finance 426 972,11 513 748,85 1,26 350 000,00 SVENSKA HANDELSBANKEN AB 3.00% 20/11/2020 GBP 426 972,11 513 748,85 1,26
SINGAPORE 144 243,00 187 444,82 0,46
Multi-Utilities 144 243,00 187 444,82 0,46 200 000,00 TML HOLDINGS PTE LTD 5.75% 07/05/2021 USD 144 243,00 187 444,82 0,46
Floating rate notes 2 240 341,32 2 244 090,00 5,52
SPAIN 1 504 125,00 1 473 810,00 3,63
Finance 1 504 125,00 1 473 810,00 3,63 1 500 000,00 BANCO SANTANDER SA FRN 12/03/2049 EUR 1 504 125,00 1 473 810,00 3,63
FRANCE 736 216,32 770 280,00 1,89
Finance 736 216,32 770 280,00 1,89 1 000 000,00 AXA SA FRN 29/10/2049 EUR 736 216,32 770 280,00 1,89
The accompanying notes form an integral part of these financial statements.
93

CompAM FUND - Global Diversified
PORTFOLIO AS AT 30 JUNE 2015 IN EUR
Quantity /
Nominal Description Currency Acquisition cost Market value % of
Net Assets
TRANSFERABLE SECURITIES AND MONEY MARKET INSTRUMENTS DEALT IN ON ANOTHER REGULATED MARKET 1 186 550,72 1 297 208,85 3,19
Floating rate notes 470 464,72 450 565,46 1,11
FRANCE 470 464,72 450 565,46 1,11
Energy 470 464,72 450 565,46 1,11
500 000,00
TOTAL CAPITAL INTERNATIONAL SA FRN 10/08/2018
USD 470 464,72 450 565,46 1,11
Ordinary Bonds 716 086,00 846 643,39 2,08
UNITED STATES 359 869,75 442 903,01 1,09
Industries 359 869,75 442 903,01 1,09 500 000,00 AVIS BUDGET CAR RENTAL LLC 5.50% 01/04/2023 USD 359 869,75 442 903,01 1,09
CANADA 356 216,25 403 740,38 0,99
Industries 356 216,25 403 740,38 0,99 500 000,00 BOMBARDIER INC 6.125% 15/01/2023 USD 356 216,25 403 740,38 0,99
OTHER TRANSFERABLE SECURITIES AND MONEY MARKET INSTRUMENTS 1 305 950,00 1 305 380,00 3,21
Shares 225 000,00 232 500,00 0,57
ITALY 225 000,00 232 500,00 0,57
Computing and IT 225 000,00 232 500,00 0,57 75 000,00 CALEIDO GROUP SPA EUR 225 000,00 232 500,00 0,57
Ordinary Bonds 1 080 950,00 1 072 880,00 2,64
FRANCE 1 080 950,00 1 072 880,00 2,64
Telecommunication 1 080 950,00 1 072 880,00 2,64 1 000 000,00 ORANGE SA 4.75% 21/02/2017 EUR 1 080 950,00 1 072 880,00 2,64
INVESTMENT FUNDS 6 238 937,34 6 289 798,05 15,48
UCI Units 6 238 937,34 6 289 798,05 15,48
UNITED STATES 2 213 947,20 2 342 873,97 5,77
Finance 2 213 947,20 2 342 873,97 5,77 9 000,00 POWERSHARES QQQ TRUST SERIES 1 USD 817 529,39 864 862,74 2,13 8 000,00 SPDR S&P 500 ETF TRUST USD 1 396 417,81 1 478 011,23 3,64
IRELAND 1 590 214,52 1 552 200,00 3,82
Finance 1 590 214,52 1 552 200,00 3,82 13 000,00 ISHARES USD TREASURY BOND 1-3 UCITS ETF EUR 1 590 214,52 1 552 200,00 3,82
LUXEMBOURG 1 249 999,96 1 239 724,08 3,05
Finance 1 249 999,96 1 239 724,08 3,05
7 472,17
JULIUS BAER MULTILABEL - HYBRID BONDS FUND -C-
EUR 999 999,98 984 682,04 2,42
2 533,70 MAINTOWER - AMARANTO ITALIAN MARKET EUR 249 999,98 255 042,04 0,63
GERMANY 1 184 775,66 1 155 000,00 2,84
Finance 1 184 775,66 1 155 000,00 2,84 30 000,00 ISHARES STOXX EUROPE 600 UCITS ETF DE EUR 1 184 775,66 1 155 000,00 2,84
Total Portfolio 32 649 398,88 32 743 985,42 80,57
The accompanying notes form an integral part of these financial statements.
94

CompAM FUND - Global Diversified
OPTIONS CONTRACTS AS AT 30 JUNE 2015
Quantity Call/Put Description Currency Acquisition cost Market value Commitment
(EUR)
LISTED ON AN OFFICIAL STOCK EXCHANGE 116 400,00 118 500,00 2 142 090,00
PURCHASED OPTIONS 116 400,00 118 500,00 2 142 090,00
150 EURO STOXX 50 INDEX 3 375,00 17/07/15 EUR 116 400,00 118 500,00 2,142,090.00
The accompanying notes form an integral part of these financial statements.
95

CompAM FUND - Global Diversified
FORWARD FOREIGN EXCHANGE CONTRACTS AS AT 30 JUNE 2015
Maturity Purchase commitment in
currency Sale commitment in
currency Unrealised profit/(loss)
(EUR)
Net Unrealised profit / (loss) on forward foreign exchange contracts (9 204,34)
Unrealised loss on forward foreign exchange contracts (9 204,34)
31/07/2015 2 106 848,10 EUR 1 500 000,00 GBP (9 204,34)
The accompanying notes form an integral part of these financial statements.
96

CompAM FUND - Active Equity Selection
STATEMENT OF NET ASSETS AS AT 30 JUNE 2015 IN EUR
Assets Notes Investments in securities at market value (Note 1) 9 654 511,85 Cash at banks 12 190 925,33 Amounts due from brokers (Note 8) 216 020,10 Unrealised profit on futures contracts (Note 1, 8) 71 660,00 Dividends receivable 20 598,89 Interests receivable 1 420,49 Receivable on investments sold 327 369,77 Other assets 5 592,81 Total assets 22 488 099,24
Liabilities Bank overdrafts (371,38) Payable on redemptions (404 745,58) Other liabilities (178 787,18) Total liabilities (583 904,14) Total net assets 21 904 195,10
Currency Net Asset Value per Share Shares outstanding
Class A Shares EUR 1 042,445 5 095,319 Class M Shares EUR 1 056,468 7 101,520 Class Y Shares EUR 1 066,971 1 612,302 Class Z Shares EUR 1 072,340 6 872,635
The accompanying notes form an integral part of these financial statements.
97

CompAM FUND - Active Equity Selection
STATEMENT OF OPERATIONS AND CHANGES IN NET ASSETS FOR THE PERIOD ENDED 30 JUNE 2015 IN EUR
Net assets at the beginning of the period Notes 19 716 337,20
Net income from investments (Note 1d) 271 454,63 Total Income 271 454,63 Investment Management fees (Note 2) (117 875,14) Management Company fees (Note 3) (8 457,41) Performance fees (Note 4) (144 972,00) Custodian fees (6 040,98) Subscription tax (Note 5) (6 117,59) Custodian transaction fees (Note 6) (10 617,46) Other charges and taxes (23 059,69) Total expenses (317 140,27) Net investment income / (loss) (45 685,64) Net realised profit / (loss) on sales of investments, currencies and other financial instruments 1 502 099,30 Change in unrealised appreciation / (depreciation) on: - Investments 832 992,86 - Futures contracts (Note 1i) 85 180,00 Net result of operations for the period 2 374 586,52
Subscriptions for the period 7 815 897,85 Redemptions for the period (8 002 626,47)
Net assets at the end of the period 21 904 195,10
The accompanying notes form an integral part of these financial statements.
98

CompAM FUND - Active Equity Selection
PORTFOLIO AS AT 30 JUNE 2015 IN EUR
Quantity /
Nominal Description Currency Acquisition cost Market value % of
Net Assets
PORTFOLIO AT MARKET VALUE 9 967 094,42 9 654 511,85 44,08
TRANSFERABLE SECURITIES AND MONEY MARKET INSTRUMENTS ADMITTED TO AN OFFICIAL STOCK EXCHANGE LISTING 7 896 349,50 7 491 618,35 34,20
Shares 7 896 349,50 7 491 618,35 34,20
UNITED KINGDOM 2 639 373,76 2 450 645,11 11,19
Basic Goods 1 069 025,56 926 230,57 4,23 340 000,00 STOCK SPIRITS GROUP PLC GBP 1 069 025,56 926 230,57 4,23
Raw materials 665 545,97 838 118,69 3,83 12 800,00 CRODA INTERNATIONAL PLC GBP 407 247,13 497 211,64 2,27 80 000,00 ACACIA MINING PLC GBP 258 298,84 340 907,05 1,56
Energy 658 674,42 409 069,27 1,87 92 500,00 SOCO INTERNATIONAL PLC GBP 486 192,82 229 793,26 1,05 74 800,00 CAIRN ENERGY PLC GBP 172 481,60 179 276,01 0,82
Consumer Retail 246 127,81 277 226,58 1,26 60 750,00 POUNDLAND GROUP PLC GBP 246 127,81 277 226,58 1,26
SWEDEN 1 003 064,06 840 447,59 3,84
Energy 1 003 064,06 840 447,59 3,84 140 000,00 TETHYS OIL AB SEK 1 003 064,06 840 447,59 3,84
GREECE 1 140 402,23 796 620,00 3,64
Consumer Retail 1 140 402,23 796 620,00 3,64 120 000,00 OPAP SA EUR 1 140 402,23 796 620,00 3,64
ITALY 624 186,91 716 065,00 3,27
Finance 624 186,91 716 065,00 3,27 499 000,00 DEA CAPITAL SPA EUR 624 186,91 716 065,00 3,27
SPAIN 592 950,63 657 600,00 3,00
Basic Goods 592 950,63 657 600,00 3,00
96 000,00
DISTRIBUIDORA INTERNACIONAL DE ALIMENTACION SA
EUR 592 950,63 657 600,00 3,00
GERMANY 555 613,93 482 300,00 2,20
Consumer Retail 555 613,93 482 300,00 2,20 20 000,00 ELRINGKLINGER AG EUR 555 613,93 482 300,00 2,20
FRANCE 462 689,16 475 180,00 2,17
Industries 462 689,16 475 180,00 2,17 23 000,00 BUREAU VERITAS SA EUR 462 689,16 475 180,00 2,17
AUSTRIA 322 990,06 439 550,00 2,00
Finance 322 990,06 439 550,00 2,00 59 000,00 S IMMO AG EUR 322 990,06 439 550,00 2,00
NORWAY 289 539,23 368 327,84 1,68
Industries 289 539,23 368 327,84 1,68 45 000,00 TOMRA SYSTEMS ASA NOK 289 539,23 368 327,84 1,68
DENMARK 265 539,53 264 882,81 1,21
Computing and IT 265 539,53 264 882,81 1,21 13 000,00 NNIT A/S DKK 265 539,53 264 882,81 1,21
The accompanying notes form an integral part of these financial statements.
99

CompAM FUND - Active Equity Selection
PORTFOLIO AS AT 30 JUNE 2015 IN EUR
Quantity /
Nominal Description Currency Acquisition cost Market value % of
Net Assets
INVESTMENT FUNDS 2 070 744,92 2 162 893,50 9,88
UCI Units 2 070 744,92 2 162 893,50 9,88
GERMANY 2 070 744,92 2 162 893,50 9,88
Finance 2 070 744,92 2 162 893,50 9,88 61 700,00 ISHARES EURO STOXX 50 UCITS ETF DE EUR 2 070 744,92 2 162 893,50 9,88
Total Portfolio 9 967 094,42 9 654 511,85 44,08
The accompanying notes form an integral part of these financial statements.
100

CompAM FUND - Active Equity Selection
COMMITMENTS ON FUTURE CONTRACTS AS AT 30 JUNE 2015
Size Quantity
Purchase /
Sale Description Maturity Currency
Unrealised profit / (loss)
(EUR) Commitment
(EUR)
Total Unrealised profit / (loss) on futures contracts and commitment 71 660,00 12 129 080,00
Unrealised profit on futures contracts and commitment 71 660,00 12 129 080,00
10 353 Purchase EURO STOXX 50 18/09/2015 EUR 71 660,00 12 129 080,00
The accompanying notes form an integral part of these financial statements.
101

CompAM FUND - Multimanager Global Equity
STATEMENT OF NET ASSETS AS AT 30 JUNE 2015 IN EUR
Assets Notes Investments in securities at market value (Note 1) 35 710 237,48 Cash at banks 4 933 980,91 Options contracts at market value (Note 1, 8) 1 072 065,90 Unrealised profit on forward foreign exchange contracts (Note 1, 8) 219 469,59 Interests receivable 358,61 Receivable on investments sold 362 372,75 Other assets 11 978,25 Total assets 42 310 463,49
Liabilities Options contracts at market value (Note 1, 8) (351 500,00) Unrealised loss on forward foreign exchange contracts (Note 1, 8) (72 040,09) Payable on investments purchased (887 718,90) Other liabilities (263 331,78) Total liabilities (1 574 590,77) Total net assets 40 735 872,72
Currency Net Asset Value per Share Shares outstanding
Class A Shares EUR 1 136,827 911,073 Class M Shares EUR 1 242,773 23 384,045 Class Z Shares EUR 1 259,952 8 444,028
The accompanying notes form an integral part of these financial statements.
102

CompAM FUND - Multimanager Global Equity
STATEMENT OF OPERATIONS AND CHANGES IN NET ASSETS FOR THE PERIOD ENDED 30 JUNE 2015 IN EUR
Net assets at the beginning of the period Notes 30 652 404,74
Investment Management fees (Note 2) (134 631,15) Management Company fees (Note 3) (26 145,53) Performance fees (Note 4) (154 158,24) Custodian fees (9 354,48) Subscription tax (Note 5) (8 672,35) Custodian transaction fees (Note 6) (21 720,00) Other charges and taxes (38 343,39) Total expenses (393 025,14) Net investment income / (loss) (393 025,14) Net realised profit / (loss) on sales of investments, currencies and other financial instruments 906 241,26 Change in unrealised appreciation / (depreciation) on: - Investments 2 761 315,24 - Options contracts (82 955,74) - Forward foreign exchange contracts (Note 1h) 147 429,50 Net result of operations for the period 3 339 005,12
Subscriptions for the period 8 815 783,25 Redemptions for the period (2 071 320,39)
Net assets at the end of the period 40 735 872,72
The accompanying notes form an integral part of these financial statements.
103

CompAM FUND - Multimanager Global Equity
PORTFOLIO AS AT 30 JUNE 2015 IN EUR
Quantity /
Nominal Description Currency Acquisition cost Market value % of
Net Assets
PORTFOLIO AT MARKET VALUE 30 150 782,01 35 710 237,48 87,66
TRANSFERABLE SECURITIES AND MONEY MARKET INSTRUMENTS ADMITTED TO AN OFFICIAL STOCK EXCHANGE LISTING 499 195,00 493 995,00 1,21
Ordinary Bonds 499 195,00 493 995,00 1,21
FRANCE 499 195,00 493 995,00 1,21
Finance 499 195,00 493 995,00 1,21 500 000,00 DEXIA CREDIT LOCAL SA 0.25% 19/03/2020 EUR 499 195,00 493 995,00 1,21
INVESTMENT FUNDS 29 651 587,01 35 216 242,48 86,45
UCI Units 29 651 587,01 35 216 242,48 86,45
IRELAND 18 498 384,42 21 867 735,56 53,68
Finance 18 498 384,42 21 867 735,56 53,68 165 800,33 CANTILLON GLOBAL EQUITY FUND -O- EUR 3 499 999,99 3 893 041,47 9,56
25 055,62
WINTON UCITS FUNDS PLC - WINTON GLOBAL EQUITY FUND -Z-
USD 2 855 353,86 3 683 392,72 9,04
135 000,00
ISHARES MSCI JAPAN USD HEDGED UCITS ETF -H- -A-
USD 3 441 310,27 4 015 953,43 9,86
20 827,58
WINTON UCITS FUNDS PLC - WINTON EUROPEAN EQUITY FUND -Z-
EUR 2 499 999,93 2 559 021,90 6,28
17 425,86 EGERTON CAPITAL EQUITY FUND PLC -A- EUR 2 849 999,84 3 230 754,44 7,93 15 247,01 GAVEKAL ASIAN OPPORTUNITIES UCITS FUND -A- EUR 2 480 000,05 3 346 870,29 8,22
7 616,41
GAVEKAL MULTI FD - GAVEKAL KNOWLEDGE LEADERS FUND -I-
USD 871 720,48 1 138 701,31 2,79
LUXEMBOURG 7 682 774,96 8 656 920,83 21,25
Finance 7 682 774,96 8 656 920,83 21,25 2 525,60 LOYS SICAV - LOYS GLOBAL -I- EUR 1 949 998,79 2 120 773,26 5,20 1 595,56 LOYS EUROPA SYSTEM -A- EUR 999 999,67 998 354,72 2,45 26 822,20 GAM STAR LUX - EUROPEAN MOMENTUM -I- -A- EUR 2 999 998,33 3 440 751,82 8,45 17 138,69 INVESCO FUNDS SICAV - INDIA EQUITY FUND -C- USD 854 030,16 945 535,22 2,32 11 806,46 ALQUITY SICAV - ALQUITY ASIA FUND -A- USD 878 748,01 1 151 505,81 2,83
UNITED KINGDOM 3 470 427,63 4 691 586,09 11,52
Finance 3 470 427,63 4 691 586,09 11,52 1 639 285,22 FUNDSMITH EQUITY FUND -I ACC- GBP 3 470 427,63 4 691 586,09 11,52
Total Portfolio 30 150 782,01 35 710 237,48 87,66
The accompanying notes form an integral part of these financial statements.
104

CompAM FUND - Multimanager Global Equity
OPTIONS CONTRACTS AS AT 30 JUNE 2015
Quantity Call/Put Description Currency Acquisition cost Market value Commitment
(EUR)
LISTED ON AN OFFICIAL STOCK EXCHANGE 803 521,64 720 565,90 351 500,00
PURCHASED OPTIONS 1 165 894,39 1 072 065,90 —
500 DAX INDEX 10,500 00 18/09/15 EUR 886 218,90 856 750,00 — 100 FTSE 100 INDEX 7,200 00 18/09/15 GBP 118 383,32 8 469,04 — 250 10YR US TREASURY NOTE 126 00 24/07/15 USD 161 292,17 206 846,86 —
WRITTEN OPTIONS (362 372,75) (351 500,00) 351 500,00
(500) DAX INDEX 9,600 00 18/09/15 EUR (362 372,75) (351 500,00) 351,500.00
The accompanying notes form an integral part of these financial statements.
105

CompAM FUND - Multimanager Global Equity
FORWARD FOREIGN EXCHANGE CONTRACTS AS AT 30 JUNE 2015
Maturity Purchase commitment in
currency Sale commitment in
currency Unrealised profit/(loss)
(EUR)
Net Unrealised profit / (loss) on forward foreign exchange contracts 147 429,50
Unrealised profit on forward foreign exchange contracts 219 469,59
20/07/2015 3 000 000,00 GBP 4 075 533,22 EUR 157 481,09 20/07/2015 8 000 000,00 USD 7 116 386,73 EUR 61 988,50
Unrealised loss on forward foreign exchange contracts (72 040,09)
20/07/2015 4 160 974,22 EUR 3 000 000,00 GBP (72 040,09)
The accompanying notes form an integral part of these financial statements.
106

CompAM FUND - Active Market Neutral
STATEMENT OF NET ASSETS AS AT 30 JUNE 2015 IN EUR
Assets Notes Investments in securities at market value (Note 1) 3 406 427,15 Cash at banks 9 138 009,22 Amounts due from brokers (Note 8) 10 957,99 Dividends receivable 635,29 Interests receivable 37 648,35 Total assets 12 593 678,00
Liabilities Other liabilities (16 611,14) Total liabilities (16 611,14) Total net assets 12 577 066,86
Currency Net Asset Value per Share Shares outstanding
Class A Shares EUR 993,085 6 792,083 Class M Shares EUR 993,367 3 417,061 Class Y Shares EUR 995,481 950,000 Class Z Shares EUR 994,565 1 500,000
The accompanying notes form an integral part of these financial statements.
107

CompAM FUND - Active Market Neutral
STATEMENT OF OPERATIONS AND CHANGES IN NET ASSETS FOR THE PERIOD FROM 5 MAY 2015 TO 30 JUNE 2015 IN EUR
Net assets at the beginning of the period Notes 0,00
Net income from investments (Note 1d) 18 574,42 Total Income 18 574,42 Investment Management fees (Note 2) (14 381,36) Performance fees (Note 4) (0,92) Custodian fees (848,15) Subscription tax (Note 5) (1 572,14) Custodian transaction fees (Note 6) (560,00) Other charges and taxes (4 487,19) Total expenses (21 849,76) Net investment income / (loss) (3 275,34) Net realised profit / (loss) on sales of investments, currencies and other financial instruments (7 389,57) Change in unrealised appreciation / (depreciation) on: - Investments (52 402,18) Net result of operations for the period (63 067,09)
Subscriptions for the period 12 669 042,06 Redemptions for the period (28 908,11)
Net assets at the end of the period 12 577 066,86
The accompanying notes form an integral part of these financial statements.
108

CompAM FUND - Active Market Neutral
PORTFOLIO AS AT 30 JUNE 2015 IN EUR
Quantity /
Nominal Description Currency Acquisition cost Market value % of
Net Assets
PORTFOLIO AT MARKET VALUE 3 458 829,33 3 406 427,15 27,08
TRANSFERABLE SECURITIES AND MONEY MARKET INSTRUMENTS ADMITTED TO AN OFFICIAL STOCK EXCHANGE LISTING 3 458 829,33 3 406 427,15 27,08
Shares 1 934 078,52 1 887 902,15 15,01
ITALY 1 676 012,15 1 664 906,85 13,24
Consumer Retail 833 374,16 831 165,15 6,61 82 703,00 WORLD DUTY FREE SPA EUR 833 374,16 831 165,15 6,61
Industries 438 820,95 417 581,70 3,32 30 000,00 ANSALDO STS SPA EUR 284 868,60 280 050,00 2,23 17 170,00 BUZZI UNICEM SPA EUR 153 952,35 137 531,70 1,09
Telecommunication 277 317,04 292 960,00 2,33 320 000,00 TELECOM ITALIA SPA EUR 277 317,04 292 960,00 2,33
Basic Goods 126 500,00 123 200,00 0,98 27 500,00 MASI AGRICOLA SPA EUR 126 500,00 123 200,00 0,98
RUSSIA 125 642,62 109 231,83 0,87
Energy 125 642,62 109 231,83 0,87 2 710,00 LUKOIL OAO USD 125 642,62 109 231,83 0,87
GERMANY 95 311,47 81 260,00 0,64
Multi-Utilities 95 311,47 81 260,00 0,64 6 800,00 E.ON SE EUR 95 311,47 81 260,00 0,64
UNITED KINGDOM 37 112,28 32 503,47 0,26
Basic Goods 37 112,28 32 503,47 0,26 61 000,00 PREMIER FOODS PLC GBP 37 112,28 32 503,47 0,26
Ordinary Bonds 1 524 750,81 1 518 525,00 12,07
SPAIN 1 524 750,81 1 518 525,00 12,07
Government 1 524 750,81 1 518 525,00 12,07 1 500 000,00 SPAIN GOVERNMENT BOND 3.75% 31/10/2015 EUR 1 524 750,81 1 518 525,00 12,07
Total Portfolio 3 458 829,33 3 406 427,15 27,08
The accompanying notes form an integral part of these financial statements.
109

CompAM FUND - Cadence Strategic Asia
STATEMENT OF NET ASSETS AS AT 30 JUNE 2015 IN EUR
Assets Notes Investments in securities at market value (Note 1) 11 350 571,83 Cash at banks 2 598 760,51 Dividends receivable 51 496,00 Other assets 3 449,64 Total assets 14 004 277,98
Liabilities Bank overdrafts (6,66) Other liabilities (15 556,57) Total liabilities (15 563,23) Total net assets 13 988 714,75
Currency Net Asset Value per Share Shares outstanding
Class A Shares EUR 927,304 1 386,890 Class C Shares GBP 936,636 610,235 Class L Shares USD 955,365 150,000 Class M Shares EUR 929,297 8 892,116 Class Y Shares EUR 931,114 1 400,000 Class Z Shares EUR 929,973 2 365,964
The accompanying notes form an integral part of these financial statements.
110

CompAM FUND - Cadence Strategic Asia
STATEMENT OF OPERATIONS AND CHANGES IN NET ASSETS FOR THE PERIOD FROM 17 APRIL 2015 TO 30 JUNE 2015 IN EUR
Net assets at the beginning of the period Notes 0,00
Net income from investments (Note 1d) 115 742,25 Total Income 115 742,25 Investment Management fees (Note 2) (23 387,90) Custodian fees (1 335,00) Subscription tax (Note 5) (1 738,04) Custodian transaction fees (Note 6) (740,00) Other charges and taxes (2 580,12) Total expenses (29 781,06) Net investment income / (loss) 85 961,19 Net realised profit / (loss) on sales of investments, currencies and other financial instruments (74 774,56) Change in unrealised appreciation / (depreciation) on: - Investments (962 145,58) Net result of operations for the period (950 958,95)
Subscriptions for the period 14 939 673,70
Net assets at the end of the period 13 988 714,75
The accompanying notes form an integral part of these financial statements.
111

CompAM FUND - Cadence Strategic Asia
PORTFOLIO AS AT 30 JUNE 2015 IN EUR
Quantity /
Nominal Description Currency Acquisition cost Market value % of
Net Assets
PORTFOLIO AT MARKET VALUE 12 312 717,41 11 350 571,83 81,14
TRANSFERABLE SECURITIES AND MONEY MARKET INSTRUMENTS ADMITTED TO AN OFFICIAL STOCK EXCHANGE LISTING 10 514 426,47 9 517 316,39 68,04
Shares 10 514 426,47 9 517 316,39 68,04
HONG KONG 2 133 916,17 1 870 613,32 13,37
Finance 943 147,00 844 371,80 6,04 278 618,00 SJM HLDG LTD HKD 337 765,03 270 944,76 1,94 97 600,00 AIA GROUP LTD HKD 605 381,97 573 427,04 4,10
Telecommunication 746 947,63 620 463,98 4,43 54 000,00 CHINA MOBILE LTD HKD 746 947,63 620 463,98 4,43
Consumer Retail 443 821,54 405 777,54 2,90 76 197,00 TELEVISION BROADCASTS LTD HKD 443 821,54 405 777,54 2,90
TAIWAN 1 581 184,63 1 610 124,76 11,51
Computing and IT 888 830,46 853 101,71 6,10
208 000,00
TAIWAN SEMICONDUCTOR MANUFACTURING CO LTD
TWD 888 830,46 853 101,71 6,10
Raw materials 376 020,04 399 091,50 2,85 35 000,00 CATCHER TECHNOLOGY CO LTD TWD 376 020,04 399 091,50 2,85
Consumer Retail 316 334,13 357 931,55 2,56 46 000,00 MAKALOT INDUSTRIAL CO LTD TWD 316 334,13 357 931,55 2,56
CAYMAN ISLANDS 1 301 129,40 1 298 020,77 9,28
Industries 487 348,79 508 659,94 3,64 13 411,00 WUXI PHARMATECH CAYMAN INC -ADR- USD 487 348,79 508 659,94 3,64
Consumer Retail 420 415,79 395 799,18 2,83 22 100,00 TENCENT HLDG LTD HKD 420 415,79 395 799,18 2,83
Computing and IT 393 364,82 393 561,65 2,81 3 027,00 NETEASE INC -ADR- USD 393 364,82 393 561,65 2,81
BERMUDA 1 353 111,29 1 185 399,22 8,47
Industries 535 905,10 458 741,51 3,28 158 820,00 JOHNSON ELECTRIC HOLDINGS LTD HKD 535 905,10 458 741,51 3,28
Multi-Utilities 412 618,16 363 572,06 2,60 7 147,00 JARDINE MATHESON HOLDINGS LTD USD 412 618,16 363 572,06 2,60
Basic Goods 404 588,03 363 085,65 2,59 46 500,00 DAIRY FARM INTERNATIONAL HOLDINGS LTD USD 404 588,03 363 085,65 2,59
THAILAND 854 937,28 748 867,50 5,35
Telecommunication 490 794,28 447 058,49 3,19 70 100,00 ADVANCED INFO SERVICE PCL THB 490 794,28 447 058,49 3,19
Finance 364 143,00 301 809,01 2,16 73 041,00 SIAM COMMERCIAL BANK PCL THB 364 143,00 301 809,01 2,16
MALAYSIA 854 982,63 721 063,56 5,16
Telecommunication 458 720,76 392 159,97 2,81 255 200,00 AXIATA GROUP BHD MYR 458 720,76 392 159,97 2,81
Finance 396 261,87 328 903,59 2,35 170 700,00 GENTING BHD MYR 396 261,87 328 903,59 2,35
KOREA 651 795,12 552 245,78 3,95
Computing and IT 651 795,12 552 245,78 3,95 530,00 SAMSUNG ELECTRONICS CO LTD KRW 651 795,12 552 245,78 3,95
The accompanying notes form an integral part of these financial statements.
112

CompAM FUND - Cadence Strategic Asia
PORTFOLIO AS AT 30 JUNE 2015 IN EUR
Quantity /
Nominal Description Currency Acquisition cost Market value % of
Net Assets
SINGAPORE 471 385,22 442 829,43 3,17
Telecommunication 471 385,22 442 829,43 3,17 157 060,00 SINGAPORE TELECOMMUNICATIONS LTD SGD 471 385,22 442 829,43 3,17
INDIA 472 024,23 425 540,24 3,04
Computing and IT 472 024,23 425 540,24 3,04 29 914,00 INFOSYS LTD -ADR- USD 472 024,23 425 540,24 3,04
BRITISH VIRGIN ISLANDS 395 711,59 401 298,01 2,87
Industries 395 711,59 401 298,01 2,87 18 607,00 HOLLYSYS AUTOMATION TECHNOLOGIES LTD USD 395 711,59 401 298,01 2,87
CHINA 444 248,91 261 313,80 1,87
Consumer Retail 444 248,91 261 313,80 1,87 66 000,00 GREAT WALL MOTOR CO LTD HKD 444 248,91 261 313,80 1,87
OTHER TRANSFERABLE SECURITIES AND MONEY MARKET INSTRUMENTS 1 798 290,94 1 833 255,44 13,10
Warrants 1 798 290,94 1 833 255,44 13,10
LUXEMBOURG 946 391,25 977 770,29 6,99
Health 576 297,19 580 542,05 4,15 21 945,00 LUPIN LTD 12/04/2017 INR 576 297,19 580 542,05 4,15
Consumer Retail 370 094,06 397 228,24 2,84 6 993,00 MARUTI SUZUKI INDIA LTD 24/07/2015 INR 370 094,06 397 228,24 2,84
UNITED KINGDOM 851 899,69 855 485,15 6,11
Finance 851 899,69 855 485,15 6,11 25 185,00 BARCLAYS BANK PLC 30/04/2018 USD 429 152,63 430 917,85 3,08 106 747,00 BARCLAYS BANK PLC 30/04/2018 USD 422 747,06 424 567,30 3,03
Total Portfolio 12 312 717,41 11 350 571,83 81,14
The accompanying notes form an integral part of these financial statements.
113

CompAM FUND
Notes to the financial statements
Note 1 - Accounting Policies
a) Presentation of the financial statements
The financial statements of the Fund are established in accordance with the Luxembourg legal and regulatory requirements concerning Undertakings for Collective Investment ("UCIs") and generally accepted accounting principles.
b) Valuation of securities
- The value of assets which are listed or dealt in on any stock exchange is based on the last available price on the stock exchange which is normally the principal market for such assets.
- The value of assets dealt in on any Regulated Market is based on the last available price.
- In the event that any assets are not listed or dealt in on any stock exchange or on any other Regulated Market, or if, with respect to assets listed or dealt in on any stock exchange, or other Regulated Market as aforesaid, the price as determined pursuant to sub-paragraphs here above is not representative of the fair market value of the relevant assets, the value of such assets is based on the reasonably foreseeable sales price determined prudently and in good faith by the Board of Directors of the Fund.
- The liquidating value of futures or forward foreign exchange contracts and warrants traded on exchanges or on other Regulated Markets is based upon the last available settlement prices of these contracts on exchanges and Regulated Markets on which the particular futures or forward foreign exchange contracts are traded by the Fund; provided that if a futures or forward foreign exchange contracts could not be liquidated on the day with respect to which net assets are being determined, the basis for determining the liquidating value of such contract is such value as the Board of Directors of the Fund may deem fair and reasonable.
- Units or shares of open-ended UCI are valued at their last determined and available net asset value or, if such price is not representative of the fair market value of such assets, then the price is determined by the Board of Directors of the Fund on a fair and equitable basis. Units or shares of a closed-ended UCI are valued at their last available stock market value.
- All other securities and other assets are valued at fair market value, as determined in good faith pursuant to procedures established by the Board of Directors of the Fund or a committee appointed to that effect by the Board of Directors of the Fund.
c) Conversion of the acquisition cost of securities in the portfolio
For securities expressed in currencies other than the reference currency of the Sub-Fund, the conversion of the acquisition cost is calculated based on the closing exchange rates of the day of purchase.
d) Investment income
A dividend income is recognised on an ex-dividend basis and is recorded net of withholding taxes. Interest income is recorded on an accrual basis.
114

CompAM FUND
Note 1 - Accounting Policies (continued)
e) Conversion of foreign currencies Cash at banks, other net assets and the market value of the securities in portfolio expressed in currencies other than the reference currency of the Sub-Fund are converted into this currency at the exchange rate prevailing as at 30 June 2015. Income and expenses expressed in currencies other than the reference currency of the Sub-Fund are converted into this currency at the exchange rate prevailing on the date of the transaction. Exchange gains and losses are recorded in the Statement of Operations and Changes in Net Assets.
f) Formation expenses Formation expenses are amortised on a straight line basis over a period of 5 years. Expenses incurred in connection with the creation of any additional Sub-Fund shall be borne by the relevant Sub-Fund and are amortised over a period of 5 years.
g) Combined financial statements The accounting records of each Sub-Fund are kept in the corresponding valuation currency; the Statements of Net Assets are established in the reference currency of the Sub-Fund and the Combined Statement of Net Assets is presented in euros (“EUR”). The combined statements correspond to the sum of the statements of each Sub-Fund. The accounting records of combined financial statements equal to the sum of each corresponding record in financial statements of each Sub-Fund and are converted in EUR with the exchange rate as at 30 June 2015. The differences of exchange rates are recorded in Statement of Operations and Changes in Net Assets under « Conversion difference ». The consolidation rate prevailing as at 30 June 2015 is the following:
1 EUR = 1.11420USD US DOLLAR The differences of exchange ensuing from the revaluation of Net Assets as at December 31, 2013 with the consolidation rate as at 30 June 2015 are included in the Combined Statements of Operations and Changes in Net Assets under the caption “Conversion difference”. As at 30 June 2015, the total of cross sub-fund investments amounted to EUR 22 385 46,26 and therefore the combined net asset value at the level of the SICAV at period-end without cross-investments would amount to EUR 458 848 963,32. The Sub-Funds CompAM FUND - Multimanager Balanced, CompAM FUND - Multimanager Equity Africa & Middle East, CompAM FUND - Multimanager Target Alpha, CompAM FUND - SB Flexible and CompAM FUND - SB Bond held investments in various sub-funds of CompAM Funds at period end.
115

CompAM FUND
Note 1 - Accounting Policies (continued)
h) Forward foreign exchange contracts Forward foreign exchange contracts are valued at forward market rates for the remaining period from valuation date to the maturity of the contract. Net realised profit / (loss) and change in unrealised appreciation / (depreciation) on forward foreign exchange contracts are recorded in the Statement of Net Assets and in the Statement of Operations and Changes in Net Assets.
i) Future contracts Future contracts are valued at their last known traded price on the stock exchanges or regulated markets on which they are traded. Net realised profit / (loss) and change in unrealised appreciation / (depreciation) on future contracts are recorded in the Statement of Net Assets and in the Statement of Operations and Changes in Net Assets. Note 2 - Investment Management fees In remuneration for its services, the Investment Manager is entitled to receive an annual management fee payable monthly and calculated on the average net assets of each Sub-Fund during the relevant month. Annual rates as at 30 June 2015 are described below:
Class A shares
Class B shares
Class D shares
Class E shares
Class I shares
Class M shares
Class S shares
Class Y shares
Class Z shares
CompAM FUND: Active Emerging Credit 1,250% 1,400% 1,500% N/A 0,800% 0,800% 1,250% 0,000% 0,600%
CompAM FUND: Active European Equity 2,000% 2,300% N/A N/A N/A 0,950% 2,000% 0,000% 0,600%
CompAM FUND: Active Liquid Bond 1,000% 1,100% 1,150% N/A 0,650% 0,650% 1,000% 0,000% 0,600%
CompAM FUND: Active European Credit 1,500% 1,700% 1,800% N/A 0,950% 0,950% 1,500% 0,000% 0,600%
CompAM FUND: Active Dollar Bond 2,100% 1,600% 1,800% 1,250% 1,000% 1,000% 1,250% 0,000% 0,600%
CompAM FUND: Multimanager Balanced 1,450% 1,500% 1,525% N/A 0,750% 0,750% 1,000% N/A 0,600% CompAM FUND: Multimanager Equity Africa & Middle East 1,450% 1,900% N/A N/A N/A 0,750% N/A N/A 0,600%
CompAM FUND: Multimanager Target Alpha 1,250% 1,600% N/A N/A N/A 0,750% N/A N/A 0,600%
CompAM FUND: SB Equity 1,600% 2,100% 2,500% N/A 0,300% 0,800% N/A N/A N/A
CompAM FUND: SB Flexible 1,400% 1,800% 2,100% N/A 0,250% 0,700% N/A N/A N/A
CompAM FUND: SB Bond 1,000% 1,400% 1,600% N/A 0,200% 0,500% N/A N/A N/A
CompAM FUND: Active Bond Plus N/A 1,500% N/A N/A 1,200% N/A N/A N/A N/A
CompAM FUND: ML Opportunity 1,350% 1,550% N/A N/A N/A 0,900% N/A N/A N/A
CompAM FUND: Global Diversified 1,100% 1,600% N/A N/A N/A 0,600% N/A N/A 0,300% CompAM FUND: Active Equity Selection 2,000% 2,300% N/A N/A N/A 0,950% 2,000% 0,000% 0,600% CompAM FUND: Multimanager Global Equity 1,250% 1,600% N/A N/A N/A 0,750% 1,250% N/A 0,600%
CompAM FUND: Active Market Neutral 1,250% 1,500% N/A N/A N/A 1,000% 1,250% 0,000% 0,600% CompAM FUND: Cadence Strategic Asia 2,000% 2,300% N/A N/A 0,750% 0,950% N/A 0,000% 0,600%
116

CompAM FUND
Note 2 - Investment Management fees (continued) With regards to Sub-Funds investing a substantial proportion of their assets in investment funds, the Investment Manager shall ensure that in respect of the Fund investments in UCITS and/or other UCIs, linked to the Fund, the total management fee (excluding any performance fee, if any) charged to the Fund and each of the UCITS and /or other UCIs in which they invest, shall not exceed 2,50% of the relevant net assets under management, as per Art. 46(3) of the amended Law of December 17, 2010 relating to Undertakings for Collective Investments. As at 30 June 2015, the following Sub-Funds invest principally in UCITS and or/other UCIs: CompAM FUND: Multimanager Balanced CompAM FUND: Multimanager Equity Africa & Middle East CompAM FUND: Multimanager Target Alpha CompAM FUND: SB Equity CompAM FUND: SB Flexible CompAM FUND: SB Bond CompAM FUND: Multimanager Global Equity Total amount of any rebates of the management commissions applied on underlying UCITS or UCI managed by third companies are transferred to the Sub-Fund on a quarterly basis and registered in the Statement of Operations and Changes in Net Assets under the heading “Other income”. With regard to the investments within the same umbrella structure, there is no duplication of management/subscription or repurchase fees. As a remuneration for its advisory services, the Investment Adviser will be paid an investment advisory fee out of the investment management fee perceived by the Investment Manager. Note 3 - Management Company fees The Management Company is entitled to receive an annual Management company fee payable quarterly and calculated on the quarterly average Net Assets of the previous quarter as follows: - 0,07% per year for Total Net Assets up to €250 million - 0,06% per year for Total Net Assets between €250 million and €500 million - 0,05% per year for Total Net Assets between €500 million and €1 billion - 0,04% per year for Total Net Assets above €1 billion. The Management Company will be entitled to a minimum fee of €120,000 per year.
117

CompAM FUND
Note 4 - Performance fees The Investment Manager is entitled to receive an annual performance fee, calculated on a daily basis and representing per share the below mentioned rate of the annual performance of the Net Asset Value per share of the relevant Sub-Fund: Sub-Funds Share classes CompAM FUND: Active Emerging Credit Classes A, B, D, M and Y: 10% Class Z: none CompAM FUND: Active European Equity Classes A, B, M and Y: 10% Class Z: none CompAM FUND: Active Liquid Bond Classes A, B, D, M and Y: 10% Class Z: none CompAM FUND: Active European Credit Classes A, B, D, M and Y: 10% Class Z: none CompAM FUND: Active Dollar Bond Classes A, E, M and Y: 10% Class Z: none CompAM FUND: Multimanager Balanced Classes A, B and M: 5%
Class Z: none CompAM FUND: Multimanager Equity Africa & Middle East Classes A, B and M: 5% Class Z: none CompAM FUND: Multimanager Target Alpha Classes A, B and M: 5% Class Z: none CompAM FUND: SB Equity Classes I and M: 8% Classes B and D: 12% CompAM FUND: SB Flexible Classes I and M: 8% Classes B and D: 12% CompAM FUND: SB Bond Classes I and M: 8% Classes B and D: 12% CompAM FUND: Active Bond Plus Class B and I: 20% CompAM FUND: ML Opportunity Classes A and M: 10% CompAM FUND: Global Diversified Classes A and M: 10% Class Z: none CompAM FUND: Active Equity Selection Class A, B, M and Y : 10% Class Z: none CompAM FUND: Multimanager Global Equity Class A, B and M: 5% Class Z: none CompAM FUND: Active Market Neutral Class A, B, M,S and Y : 10%
The detailed calculation method of the performance fee is described in the current Prospectus. Note 5 - Subscription Tax (« Taxe d’abonnement ») The Fund is governed by Luxembourg Laws. Pursuant to the 2010 Law, the Fund is subject to an annual subscription tax (“taxe d’abonnement”) of 0,05% which is payable quarterly and calculated on the basis of the Net Assets of each Sub-Fund on the last day of each quarter.
118

CompAM FUND
Note 5 - Subscription Tax (« Taxe d’abonnement ») (continued) A reduced tax rate of 0.01% per annum of the net assets will be applicable to classes of Shares which are only sold to and held by Institutional Investors as well as to certain Sub-Funds investing exclusively in money market instruments which is payable quarterly and calculated on the basis of the Net Assets of each Sub-Fund on the last day of each quarter. Pursuant to Article 175 (a) of the amended Law of 17 December 2010, the Net Assets invested in Undertakings for Collective Investments already subject to the “taxe d’abonnement” are exempt from this tax. Note 6 - Transaction Costs For the period ended 30 June 2015, the Fund incurred transaction costs which are included in the acquisition cost (composed of broker fees and stamp duties) relating to purchases or sales of investment securities and/or other eligible assets. Custodian transaction fees are recorded in the Statement of Operations and Changes in Net Assets under the caption "Custodian transaction fees". Not all transaction costs are separately identifiable. For fixed income investments, forward foreign exchange contracts and other derivative contracts, transaction costs are included in the purchase or sales price and are not separately disclosed. The transaction costs recorded by the Fund for the financial period from 1 January 2015 until 30 June 2015 amount to the following:
Sub-Fund Currency Custodian transaction
fees
Brokerage fees
Total transaction
fees
CompAM FUND: Active Emerging Credit EUR 10 767,69 1 207,86 11 975,55 CompAM FUND: Active European Equity EUR 1,81 40 299,92 40 301,73 CompAM FUND: Active Liquid Bond EUR 2 526,76 27,20 2 553,96 CompAM FUND: Active European Credit EUR 9 962,24 605,78 10 568,02 CompAM FUND: Active Dollar Bond USD 13 220,24 1 224,79 14 445,03 CompAM FUND: Multimanager Balanced EUR 13 134,60 2 390,99 15 525,59 CompAM FUND: Multimanager Equity Africa & Middle East
EUR 5 008,27 52 790,00 57 798,27
CompAM FUND: Multimanager Target Alpha EUR 3 676,11 1 995,56 5 671,67 CompAM FUND: SB Equity EUR 1,81 1 229,26 1 231,07 CompAM FUND: SB Flexible EUR 6 036,35 563,72 6 600,07 CompAM FUND: SB Bond EUR 7 115,11 477,03 7 592,14 CompAM FUND: Active Bond Plus EUR 16 648,38 29 255,81 45 904,19 CompAM FUND: ML Opportunity EUR 2 559,34 40,61 2 599,95 CompAM FUND: Global Diversified EUR 14 860,10 21 284,09 36 144,19 CompAM FUND: Active Equity Selection EUR 10 617,46 31 847,78 42 465,24 CompAM FUND: Multimanager Global Equity EUR 21 720,00 12 435,35 34 155,35 CompAM FUND: Active Market Neutral EUR 560,00 5 743,19 6 303,19 CompAM FUND: Cadence Strategic Asia EUR 740,00 27 876,51 28 616,51
119

CompAM FUND
Note 7 - Dividends Distribution Class D Shares allow the distribution of dividends. During the financial period, the following distributions occurred: Sub-Funds Class
Share Currency Distribution
Date Number of
outstanding shares
Amount paid
CompAM FUND: Bond Active Emerging Credit D EUR 20/01/2015 2 450,076 3 680,01
CompAM FUND: Active Liquid Bond D EUR 20/01/2015 4 780,426 1 085,16
CompAM FUND: Active European Credit D EUR 20/01/2015 15 333,066 9 015,84 CompAM FUND: SB Equity D EUR 20/01/2015 889,051 447,19 CompAM FUND: SB Bond D EUR 20/01/2015 2 098,029 5 843,01
CompAM FUND: Active Emerging Credit D EUR 29/04/2015 2 563,502 2 912,14
CompAM FUND: Active Liquid Bond D EUR 29/04/2015 2 684,891 920,92
CompAM FUND: Active European Credit D EUR 29/04/2015 24 275,889 11 700,98
CompAM FUND: SB Equity D EUR 29/04/2015 831,361 384,09
CompAM FUND: SB Bond D EUR 29/04/2015 2 188,713 3 747,08 Note 8 - Forward foreign exchange contracts and futures contracts Details of open positions in forward foreign exchange and futures contracts as at 30 June 2015 are disclosed in the statements following the Portfolios of the concerned Sub-Funds. Note 9 - Changes in the securities portfolio A copy of the changes in the securities portfolio for the period ended 30 June 2015 is available free of charge at the registered office of the Fund.
120


