Embed Size (px)
Citation preview
Science of the Total Environment 524–525 (2015) 300–309
Contents lists available at ScienceDirect
Science of the Total Environment
j ourna l homepage: www.e lsev ie r .com/ locate /sc i totenv
Sociodemographic patterns of household water-use costs in Puerto Rico
Xue Yu a, Reza Ghasemizadeh a, Ingrid Padilla b, John D. Meeker c, Jose F. Cordero d, Akram Alshawabkeh a,⁎a Department of Civil and Environmental Engineering, Northeastern University, Boston, MA 02115, USAb Department of Civil Engineering and Surveying, University of Puerto Rico, Mayaguez 00682, Puerto Ricoc Department of Environmental Health Sciences, University of Michigan School of Public Health, Ann Arbor, MI 48109, USAd University of Puerto Rico Graduate School of Public Health, University of Puerto Rico Medical Sciences Campus, San Juan 00936, Puerto Rico
H I G H L I G H T S
• Household water-use varies among different sociodemographic groups.• PCA identified the soft and hard coefficients relating to household water-use.• The soft coefficient refers to household socioeconomic factors.• The hard coefficient refers to dwelling factors.• The variables affecting household water-use differ among various demographic groups.
⁎ Corresponding author at: Department of Civil andNortheastern University, 360 Huntington Avenue, 515ST,
E-mail address: [email protected] (A. Alshawabkeh)
http://dx.doi.org/10.1016/j.scitotenv.2015.04.0430048-9697/© 2015 Elsevier B.V. All rights reserved.
a b s t r a c t
a r t i c l e i n f oArticle history:Received 22 January 2015Received in revised form 7 April 2015Accepted 12 April 2015Available online xxxx
Editor: Simon Pollard
Keywords:Household water-use costsIPUMSSociodemographicFactor analysisPuerto Rico (USA)
Variability of household water-use costs across different sociodemographic groups in Puerto Rico is evaluatedusing census microdata from the Integrated Public Use Microdata Series (IPUMS). Multivariate analyses suchas multiple linear regression (MLR) and factor analysis (FA) are used to classify, extract and interpret the house-hold water-use costs. The FA results suggest two principal varifactors in explaining the variability of householdwater-use costs (64% in 2000 and 50% in 2010), which are grouped into a soft coefficient (social, economic anddemographic characteristics of household residents, i.e., age, size, income, education) and a hard coefficient(dwelling conditions, i.e., number of rooms, units in the building, building age). The demographic profile of ahigh water-use household in Puerto Rico tends to be that of renters, people who live in larger or older buildings,people living in metro areas, or those with higher education level and higher income. The findings and discus-sions from this study will help decision makers to plan holistic and integrated water management to achievewater sustainability.
© 2015 Elsevier B.V. All rights reserved.
1. Introduction
In addition to protectingwater resources, householdwater conserva-tion is a feasible and important approach to balance between freshwatersupply and consumption. Studies on the variability of household water-use includemany environmental, engineering, social, economic and cul-tural factors (Corbella and Pujol, 2009; Inman and Jeffrey, 2006;Jorgensen et al., 2009; Willis et al., 2011; Rathnayaka et al., 2014),which are highly characterized with disparate spatial and temporaltraits. Understanding the spatial and temporal patterns of householdwater-use costs within a complex social and demographic contextis important for implementing holistic and integrated water-usemanagement.
Environmental Engineering,Boston, MA 02115, USA..
As a vital resource in sustaining human life, protecting humanhealth, supporting economic development, and maintaining naturaland cultural integrity (Gleick et al., 2002), the philosophies of watermanagement change over time.Water has been considered as a naturalresource that has utilization value but little economic value. As the pres-sure and demand for water supply increase, the recognition of the eco-nomic value of water resources and hence water pricing proceduresattracts more attention to meet the imbalance between water supplyand demand (Mitchell, 1984; Arbuésa et al., 2003; Wodraska, 2006)even for areas with abundant water resources. Water pricing proce-dures try to adopt the marginal cost pricing strategy to allocate waterto the most valuable needs and consequently reduce the ultimatewater-use (Agthe and Billings, 1987). However, beyond the consider-ation of social justice (Renwick and Archibald, 1998), recent studiesshow that the relationship between water-use cost and water price isweak especially for renters and low income households (Renwick andArchibald, 1998; Hoffmann et al., 2006), and the effects from pricing
301X. Yu et al. / Science of the Total Environment 524–525 (2015) 300–309
on water demand vary according to the use, given the basic and essen-tial usages (Dalhuisen et al., 2003). Reynaud (2013) suggested that pricepolicy and non-price policy should be viewed as complementaryregulation. Household water-use trends may be further influenced bypsychological factors, such as trust between consumers and waterauthority (Jorgensen et al., 2009), and local water conservation culturesuch as taking shorter showers, turning off the tapwaterwhile brushingteeth, and washing only full loads of laundry or dishwasher (Fieldinget al., 2012). Another direction of meeting water demand is domesticconservation, for example using more efficient water consumptiondevices such as efficient laundry machines, showers and toilets(Rathnayaka et al., 2014). Upgrading water-use devices in a large scalehowever is a big task that involves both economic (payback period)and social (awareness in water conservation and willingness in spend-ing more on the efficient devices) considerations (Piper and Martin,1997; Millock and Nauges, 2010).
Beyond studies on the factors driving household water-use costs, itis also imperative to understand their variability across large temporaland spatial scales. There are a few studies addressing this issue (tempo-ral variability: Balling et al., 2008; spatial variability: Chang et al., 2010;temporal and spatial variability: House-Peters et al., 2010; Aggarwalet al., 2012; Yun et al., 2014). However, these studies are either focusedon a specific urban or rural areas (Phoenix, Arizona, USA, Balling et al.,2008; Gold Coast, Australia, Willis et al., 2013; rural Puerto Rico, Jainet al., 2014), are not covering the complete demographic structure(single-family, Portland, Oregon, USA, Chang et al., 2010; and the refer-enced studies on urban residential water consumption summarized inthis paper), or are not considering the whole social and demographicfactors in a spatial or temporal scale (social variations in householdwater-use in Greater Amman, Jordan, Potter and Darmame, 2010). Inturn, the temporal household water-use variability can reflect theclimatic (Breyer and Chang, 2014), social, population and water supplyand management transitions (House-Peters and Chang, 2011; Sauri,2013). The spatial variability of household water-use reflects the struc-ture of the household, economic status and local water-use culture.Moreover, household water-use is largely linked with its demographicstructure, which includes the size of the household, age, and numberof children. A large household with more residents is inclined to usemore water than a small household, but the per capita water-use maybe smaller than the single-person household because of the sharing ofutilities and more efficient water usage (Carr et al., 1990).
In this study, we quantify the sociodemographic patterns ofhousehold water-use costs in Puerto Rico. We test the hypothesisthat household water-use costs differ among different social and demo-graphic groups both temporally and spatially. The findings of thesociodemographic patterns of household water-use costs can be usefulfor the planning and managing water resources and understanding theresidential water-use behaviors and spatial variability in a social anddemographic context.
2. Method
2.1. Study site
Puerto Rico, which consists of one main island and a number ofsmaller islands, is located between the Caribbean Sea and the NorthAtlantic Sea. The shape of themain island is roughly described as rectan-gular with a width of 160 km from east to west, a length of 55 km fromnorth to south, and an area of 8710 km2. Puerto Rico has a typical trop-ical climate with small seasonal variations in temperatures which rangefrom 19.4 to 29.6 °C (Daly et al., 2003). The climate tends to be moremoist and colder in the elevatedmountainous areas. The average annualprecipitation is estimated at 1700mm and around 60% of evapotranspi-ration, with wetter months in May and from August to November(monthly precipitation ranges from 170 to 220 mm) and drier in the
other months (ranges from 70 to 120 mm), respectively (Daly et al.,2003).
The topography is divided into three major regions: the middlemountainous areas, the coastal plains and the northern karst region.The mountainous area that divides the main island into northern andsouthern regions accounts roughly 60% of the land area. Puerto Rico ishome of many natural wonders including beautiful beaches and moun-tains, exuberant vegetation, and abundant water resources (Hunter andArbona, 1995). The main island is characterized with karst formationwhich covers around 27.5% of the total island surface area, where themajority of the karst lies in the northern eluviated limestone terrainaccounting for about 60% of the total karst area (Ghasemizadeh et al.,2012). However, the groundwater in this area is severely contaminateddue to improper waste dumping as a result of industrialization,especially the growth of the pharmaceutical companies since the mid-1950s and also the population expansion (Ramcharran, 2011; Yu et al.,2015). As a result, groundwater use was discontinued as a source ofpublic water supply in many areas of Puerto Rico since 2005 (Molina-Rivera and Gómez-Gómez, 2008).
2.2. Sociodemographic changes
The case of Puerto Rico is of special interest, because (1) it isgeographically independent as an island with a very high populationdensity; (2) it went through significant social, economic and populationchanges over the past several decades; (3) its water resources areseverely stressed, especially the groundwater which is threatened bycontamination; and (4) there is considerable transition and adjustmentin its public water-use management to meet the stringent water de-mand subject to the socioeconomic, demographic and environmentalpressures.
The variation of Puerto Rico populations is a dramatic reflection ofsocial and economic changes over time. The population increasedsteadily from 2.71million in 1970 to 3.81 million in 2000, was stagnantfor a few years but started to decrease at a slow rate in recent years(Table 1). Puerto Rico is a highly populated island with approximately420 persons per km2, which ranks the fourth highest in America by2010. Urbanization has occurred rapidly in the past decades, with98.8% of the population living in urban areas by 2010. The metropolitanarea of San Juan, which encompasses 41 of the 78 municipalities inPuerto Rico, has a population density up to 3192 persons per km2 andis among the most populated regions in the U.S. and territories(Martinuzzi et al., 2007). The number of households increased continu-ously during the population expansion period and also during the pop-ulation stagnant period and recent declining period, which is consistentwith the continued decrease of the household size. The household sizedecreased from an average of 4.2 persons in 1970 to 2.6 persons in2010 (38% reduction). Households were predominantly couple withno child households and single-person households (Table 2), emphasiz-ing the family orientation of Puerto Rican municipalities.
The economic status of the population in Puerto Rico showed thatthe median family income decreased from $14,300 in 1970 to $12,400in 1980, $12,100 in 1990, then increased to $14,500 in 2000 anddecreased to $14,000 in 2010. The poverty rate of the population stayedat high rates around 60% from 1970 to 1990, and then it decreased to49% in 2000 and 45% in 2010. During the time when populationincreased, the labor force increased and the unemployment ratedecreased from 19.5% in 1970 to 10.2% in 2000, then the labor forcedecreased and the unemployment rate climbed to a rate of 16.4% after2007. There is a trend that more labor force move to work in govern-ment and service related professionals such as managerial, technical,sales and administrative support occupations, and less people tend towork for manufacturing and farm related occupations.
The government-managed Puerto Rico Aqueduct and SewerAuthority (PRASA) is the only authorized entity for water quality,watermanagement, andwater supply in Puerto Rico. PRASAwithdrawn
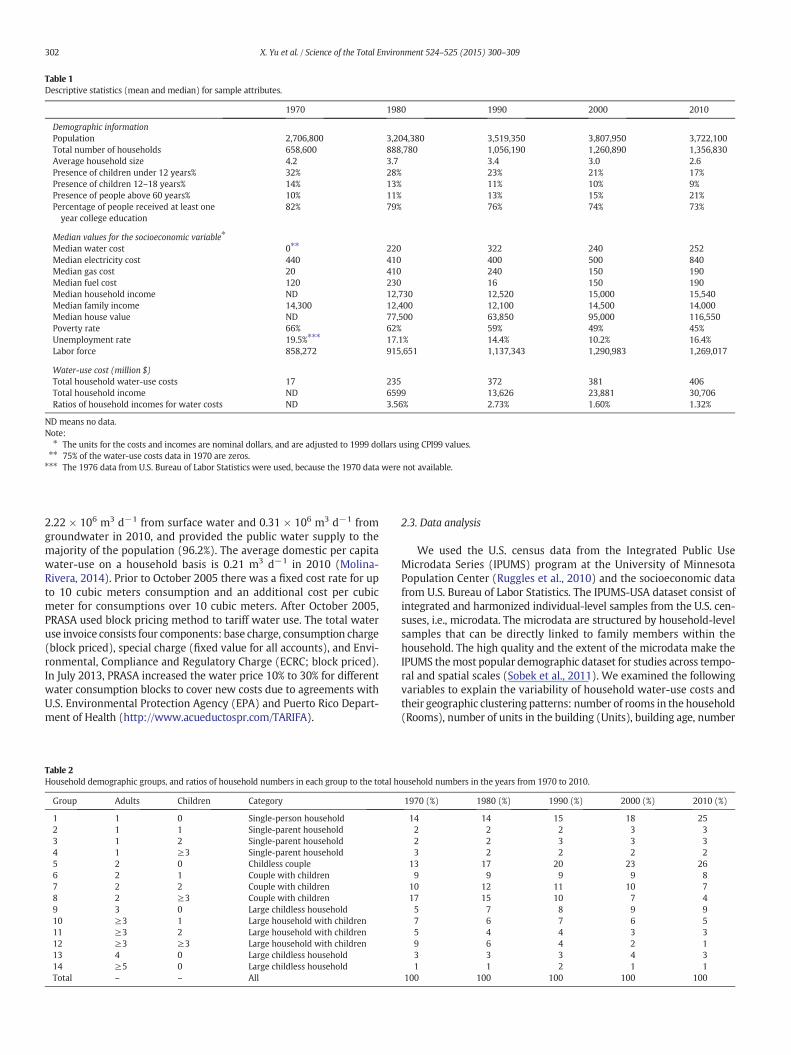
Table 1Descriptive statistics (mean and median) for sample attributes.
1970 1980 1990 2000 2010
Demographic informationPopulation 2,706,800 3,204,380 3,519,350 3,807,950 3,722,100Total number of households 658,600 888,780 1,056,190 1,260,890 1,356,830Average household size 4.2 3.7 3.4 3.0 2.6Presence of children under 12 years% 32% 28% 23% 21% 17%Presence of children 12–18 years% 14% 13% 11% 10% 9%Presence of people above 60 years% 10% 11% 13% 15% 21%Percentage of people received at least oneyear college education
82% 79% 76% 74% 73%
Median values for the socioeconomic variable⁎
Median water cost 0⁎⁎ 220 322 240 252Median electricity cost 440 410 400 500 840Median gas cost 20 410 240 150 190Median fuel cost 120 230 16 150 190Median household income ND 12,730 12,520 15,000 15,540Median family income 14,300 12,400 12,100 14,500 14,000Median house value ND 77,500 63,850 95,000 116,550Poverty rate 66% 62% 59% 49% 45%Unemployment rate 19.5%⁎⁎⁎ 17.1% 14.4% 10.2% 16.4%Labor force 858,272 915,651 1,137,343 1,290,983 1,269,017
Water-use cost (million $)Total household water-use costs 17 235 372 381 406Total household income ND 6599 13,626 23,881 30,706Ratios of household incomes for water costs ND 3.56% 2.73% 1.60% 1.32%
ND means no data.Note:⁎ The units for the costs and incomes are nominal dollars, and are adjusted to 1999 dollars using CPI99 values.⁎⁎ 75% of the water-use costs data in 1970 are zeros.⁎⁎⁎ The 1976 data from U.S. Bureau of Labor Statistics were used, because the 1970 data were not available.
302 X. Yu et al. / Science of the Total Environment 524–525 (2015) 300–309
2.22 × 10⁶ m3 d−1 from surface water and 0.31 × 10⁶ m3 d−1 fromgroundwater in 2010, and provided the public water supply to themajority of the population (96.2%). The average domestic per capitawater-use on a household basis is 0.21 m3 d−1 in 2010 (Molina-Rivera, 2014). Prior to October 2005 there was a fixed cost rate for upto 10 cubic meters consumption and an additional cost per cubicmeter for consumptions over 10 cubic meters. After October 2005,PRASA used block pricing method to tariff water use. The total wateruse invoice consists four components: base charge, consumption charge(block priced), special charge (fixed value for all accounts), and Envi-ronmental, Compliance and Regulatory Charge (ECRC; block priced).In July 2013, PRASA increased the water price 10% to 30% for differentwater consumption blocks to cover new costs due to agreements withU.S. Environmental Protection Agency (EPA) and Puerto Rico Depart-ment of Health (http://www.acueductospr.com/TARIFA).
Table 2Household demographic groups, and ratios of household numbers in each group to the total h
Group Adults Children Category
1 1 0 Single-person household2 1 1 Single-parent household3 1 2 Single-parent household4 1 ≥3 Single-parent household5 2 0 Childless couple6 2 1 Couple with children7 2 2 Couple with children8 2 ≥3 Couple with children9 3 0 Large childless household10 ≥3 1 Large household with children11 ≥3 2 Large household with children12 ≥3 ≥3 Large household with children13 4 0 Large childless household14 ≥5 0 Large childless householdTotal – – All
2.3. Data analysis
We used the U.S. census data from the Integrated Public UseMicrodata Series (IPUMS) program at the University of MinnesotaPopulation Center (Ruggles et al., 2010) and the socioeconomic datafrom U.S. Bureau of Labor Statistics. The IPUMS-USA dataset consist ofintegrated and harmonized individual-level samples from the U.S. cen-suses, i.e., microdata. The microdata are structured by household-levelsamples that can be directly linked to family members within thehousehold. The high quality and the extent of the microdata make theIPUMS themost popular demographic dataset for studies across tempo-ral and spatial scales (Sobek et al., 2011). We examined the followingvariables to explain the variability of household water-use costs andtheir geographic clustering patterns: number of rooms in the household(Rooms), number of units in the building (Units), building age, number
ousehold numbers in the years from 1970 to 2010.
1970 (%) 1980 (%) 1990 (%) 2000 (%) 2010 (%)
14 14 15 18 252 2 2 3 32 2 3 3 33 2 2 2 2
13 17 20 23 269 9 9 9 8
10 12 11 10 717 15 10 7 45 7 8 9 97 6 7 6 55 4 4 3 39 6 4 2 13 3 3 4 31 1 2 1 1
100 100 100 100 100
303X. Yu et al. / Science of the Total Environment 524–525 (2015) 300–309
of residents in the household (Size), householder age (Age), household-er education level or the maximum education level of the couple(Education), annual household income (Income), annual householdelectricity cost (Electricity), household demographic profile (PF), PublicUseMicrodata Area (PUMA), population density in each PUMA (density),and central coordinates of PUMA (latitude and longitude). The economicstatus is reflected by poverty index (PI), whereas PI ≤ 50 as very poor,50 b PI ≤ 100 as poor, 100 b PI ≤ 150 as normal, 150 b PI ≤ 200 asgood, and PI N 200 as rich. We consider the demographic effects throughfactors related to persons within the household. In order to examine thehistorical transitions of the sociodemographic profiles, we focus on thedecennial census years of 1970, 1980, 1990, 2000 and 2010 in ouranalysis.
The census microdata which contain extensive sociodemographicinformation are ideal for clustering and multilevel analyses. Followingthe household size and structure classification methods by a householdincome study in Germany (Peichl et al., 2012) and a residential waterconsumption study in the City of Gold Coast, Australia (Willis et al.,2013), the households are divided into 14 demographic groups accord-ing to the number of adults and children (Table 2). A personwith an agebelow18 years (b18) is considered as child, above 18 years as adult, andabove 60 years as an older adult. In order to compare the economicvariables with monetary values across years, they were adjusted withinflation rates to constant 1999 dollars, which corresponds to the dollaramounts in the 2000 census. Though water price growth rate is animportant factor influencing household water-use (Pint, 1999), it wasnot considered in this study because of lack of data and for simplicityof analysis. The census microdata are weighted both at householdand personal level based on similar demographic conditions, i.e., 1%for 1970 data and 5% for 1980, 1990, 2000 and 2010 data. Though theweights were generally in agreement, there were some variations inyears 1990, 2000 and 2010 with standard deviations from 2% to 17%.
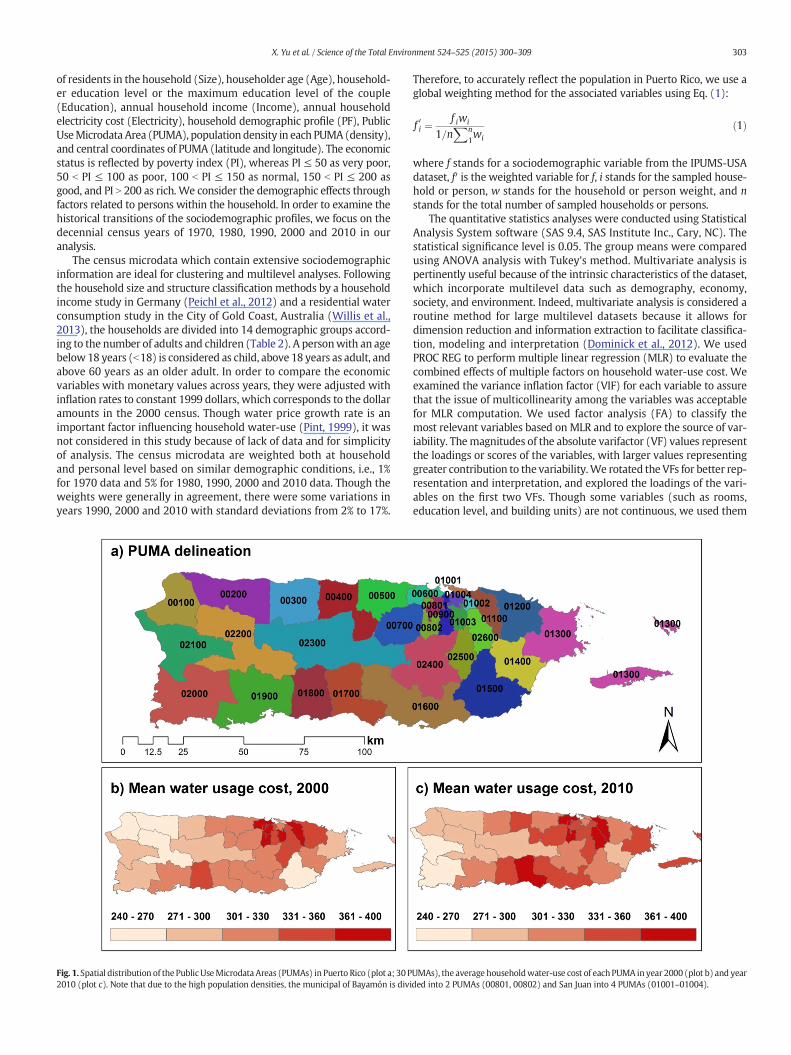
Fig. 1. Spatial distribution of the PublicUseMicrodata Areas (PUMAs) in Puerto Rico (plot a; 30P2010 (plot c). Note that due to the high population densities, the municipal of Bayamón is divi
Therefore, to accurately reflect the population in Puerto Rico, we use aglobal weighting method for the associated variables using Eq. (1):
f 0i ¼f iwi
1=nXn
1wi
ð1Þ
where f stands for a sociodemographic variable from the IPUMS-USAdataset, f′ is the weighted variable for f, i stands for the sampled house-hold or person, w stands for the household or person weight, and nstands for the total number of sampled households or persons.
The quantitative statistics analyses were conducted using StatisticalAnalysis System software (SAS 9.4, SAS Institute Inc., Cary, NC). Thestatistical significance level is 0.05. The group means were comparedusing ANOVA analysis with Tukey's method. Multivariate analysis ispertinently useful because of the intrinsic characteristics of the dataset,which incorporate multilevel data such as demography, economy,society, and environment. Indeed, multivariate analysis is considered aroutine method for large multilevel datasets because it allows fordimension reduction and information extraction to facilitate classifica-tion, modeling and interpretation (Dominick et al., 2012). We usedPROC REG to perform multiple linear regression (MLR) to evaluate thecombined effects of multiple factors on household water-use cost. Weexamined the variance inflation factor (VIF) for each variable to assurethat the issue of multicollinearity among the variables was acceptablefor MLR computation. We used factor analysis (FA) to classify themost relevant variables based on MLR and to explore the source of var-iability. Themagnitudes of the absolute varifactor (VF) values representthe loadings or scores of the variables, with larger values representinggreater contribution to the variability.We rotated the VFs for better rep-resentation and interpretation, and explored the loadings of the vari-ables on the first two VFs. Though some variables (such as rooms,education level, and building units) are not continuous, we used them
UMAs), the average householdwater-use cost of eachPUMA in year 2000 (plot b) and yearded into 2 PUMAs (00801, 00802) and San Juan into 4 PUMAs (01001–01004).
304 X. Yu et al. / Science of the Total Environment 524–525 (2015) 300–309
to create contour maps to show the trend of their influence on house-hold water-use costs.
The geographic patterns of the census data were analyzed usingthe Geographic Information System (ESRI ArcGIS 10.2) software. Thesmallest geographic unit for the census data that include the householdlevel data is PUMA,which includes at least 100,000 people to protect theconfidentiality of the surveyed individuals and households. The delinea-tion of PUMAs is carried out by each state and may be subject to varia-tions when there are significant changes in population. In the case ofPuerto Rico, we mainly used those of 2000, which contains 30 PUMAsand did not change throughout the years to 2010 (Fig. 1).
3. Results
3.1. Household water-use cost
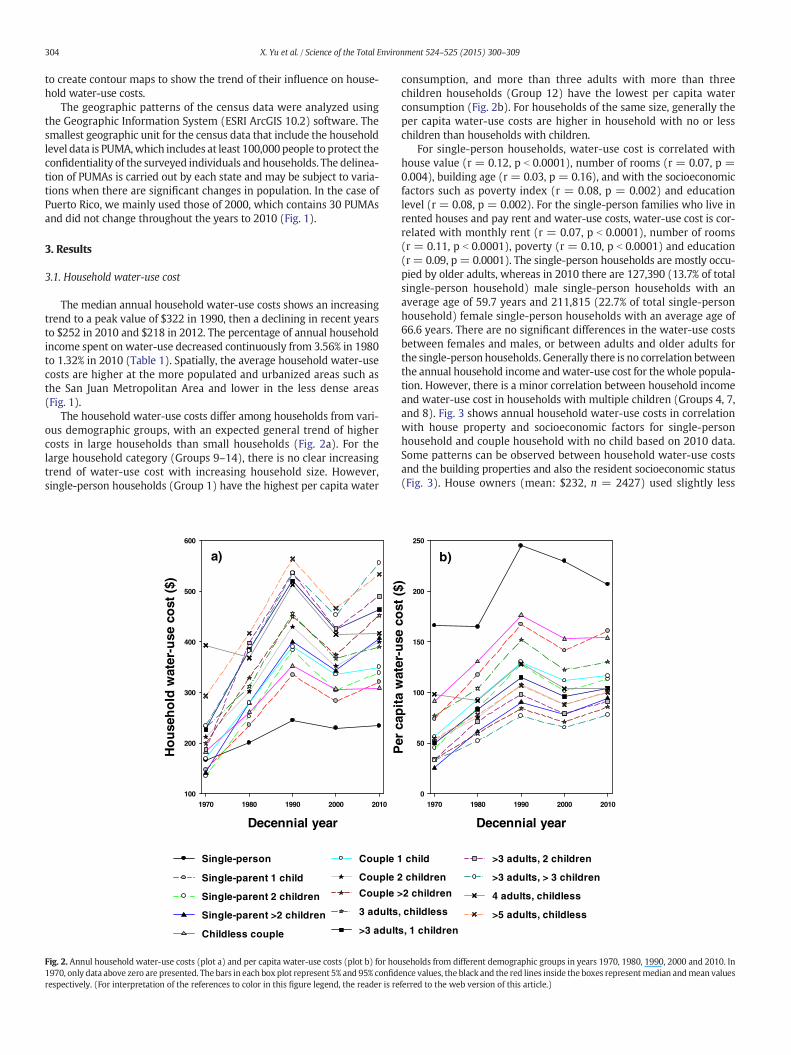
The median annual household water-use costs shows an increasingtrend to a peak value of $322 in 1990, then a declining in recent yearsto $252 in 2010 and $218 in 2012. The percentage of annual householdincome spent on water-use decreased continuously from 3.56% in 1980to 1.32% in 2010 (Table 1). Spatially, the average household water-usecosts are higher at the more populated and urbanized areas such asthe San Juan Metropolitan Area and lower in the less dense areas(Fig. 1).
The household water-use costs differ among households from vari-ous demographic groups, with an expected general trend of highercosts in large households than small households (Fig. 2a). For thelarge household category (Groups 9–14), there is no clear increasingtrend of water-use cost with increasing household size. However,single-person households (Group 1) have the highest per capita water
Decennial year
1970 1980 1990 2000 2010
Ho
use
ho
ld w
ater
-use
co
st (
$)
100
200
300
400
500
600
a)
Couple 1
Couple 2
Couple >
3 adults
>3 adult
Single-person
Single-parent 1 child
Single-parent 2 children
Single-parent >2 children
Childless couple
Fig. 2. Annul household water-use costs (plot a) and per capita water-use costs (plot b) for hou1970, only data above zero are presented. The bars in each box plot represent 5% and 95% confidrespectively. (For interpretation of the references to color in this figure legend, the reader is re
consumption, and more than three adults with more than threechildren households (Group 12) have the lowest per capita waterconsumption (Fig. 2b). For households of the same size, generally theper capita water-use costs are higher in household with no or lesschildren than households with children.
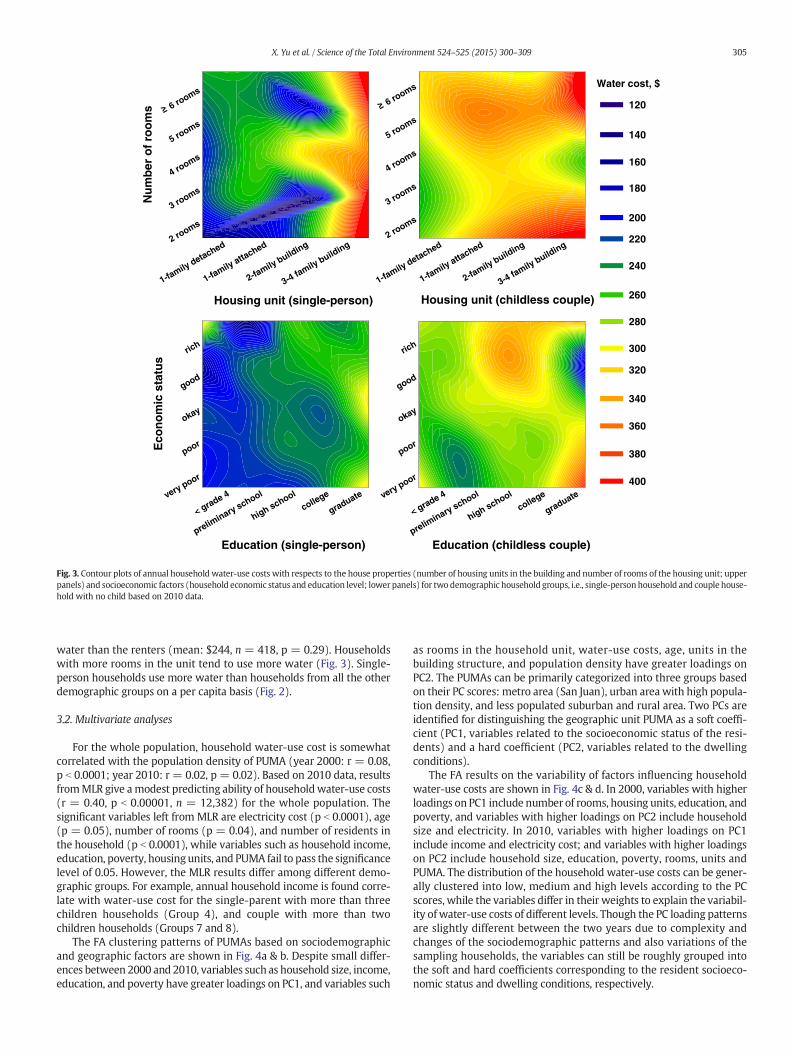
For single-person households, water-use cost is correlated withhouse value (r = 0.12, p b 0.0001), number of rooms (r = 0.07, p =0.004), building age (r = 0.03, p = 0.16), and with the socioeconomicfactors such as poverty index (r = 0.08, p = 0.002) and educationlevel (r = 0.08, p = 0.002). For the single-person families who live inrented houses and pay rent and water-use costs, water-use cost is cor-related with monthly rent (r = 0.07, p b 0.0001), number of rooms(r = 0.11, p b 0.0001), poverty (r = 0.10, p b 0.0001) and education(r = 0.09, p = 0.0001). The single-person households are mostly occu-pied by older adults, whereas in 2010 there are 127,390 (13.7% of totalsingle-person household) male single-person households with anaverage age of 59.7 years and 211,815 (22.7% of total single-personhousehold) female single-person households with an average age of66.6 years. There are no significant differences in the water-use costsbetween females and males, or between adults and older adults forthe single-person households. Generally there is no correlation betweenthe annual household income andwater-use cost for thewhole popula-tion. However, there is a minor correlation between household incomeand water-use cost in households with multiple children (Groups 4, 7,and 8). Fig. 3 shows annual household water-use costs in correlationwith house property and socioeconomic factors for single-personhousehold and couple household with no child based on 2010 data.Some patterns can be observed between household water-use costsand the building properties and also the resident socioeconomic status(Fig. 3). House owners (mean: $232, n = 2427) used slightly less
Decennial year
1970 1980 1990 2000 2010
Per
cap
ita
wat
er-u
se c
ost
($)
0
50
100
150
200
250
b)
child
children
2 children
, childless
s, 1 children
>3 adults, 2 children
>3 adults, > 3 children
4 adults, childless
>5 adults, childless
seholds from different demographic groups in years 1970, 1980, 1990, 2000 and 2010. Inence values, the black and the red lines inside the boxes representmedian andmean valuesferred to the web version of this article.)
1-family
detached
1-family
attached
2-family
building
3-4 familybuilding
Nu
mb
er o
f ro
om
s
2 rooms
3 rooms
4 rooms
5 rooms
6 rooms
1-family
detached
1-family
attached
2-family
building
3-4 familybuilding
2 rooms
3 rooms
4 rooms
5 rooms
6 rooms
< grade 4
preliminary
school
high school
college
graduate
Eco
no
mic
sta
tus
verypoor
poor
okay
good
rich
< grade 4
preliminary
school
high school
college
graduateverypoor
poor
okay
good
rich
Housing unit (single-person) Housing unit (childless couple)
Education (single-person) Education (childless couple)
120
140
160
180
200
220
240
260
280
300
320
340
360
380
400
Water cost, $
Fig. 3. Contour plots of annual household water-use costs with respects to the house properties (number of housing units in the building and number of rooms of the housing unit; upperpanels) and socioeconomic factors (household economic status and education level; lower panels) for twodemographic household groups, i.e., single-personhousehold and couple house-hold with no child based on 2010 data.
305X. Yu et al. / Science of the Total Environment 524–525 (2015) 300–309
water than the renters (mean: $244, n = 418, p = 0.29). Householdswith more rooms in the unit tend to use more water (Fig. 3). Single-person households use more water than households from all the otherdemographic groups on a per capita basis (Fig. 2).
3.2. Multivariate analyses
For the whole population, household water-use cost is somewhatcorrelated with the population density of PUMA (year 2000: r = 0.08,p b 0.0001; year 2010: r = 0.02, p = 0.02). Based on 2010 data, resultsfromMLR give amodest predicting ability of householdwater-use costs(r = 0.40, p b 0.00001, n = 12,382) for the whole population. Thesignificant variables left from MLR are electricity cost (p b 0.0001), age(p = 0.05), number of rooms (p = 0.04), and number of residents inthe household (p b 0.0001), while variables such as household income,education, poverty, housing units, and PUMA fail to pass the significancelevel of 0.05. However, the MLR results differ among different demo-graphic groups. For example, annual household income is found corre-late with water-use cost for the single-parent with more than threechildren households (Group 4), and couple with more than twochildren households (Groups 7 and 8).
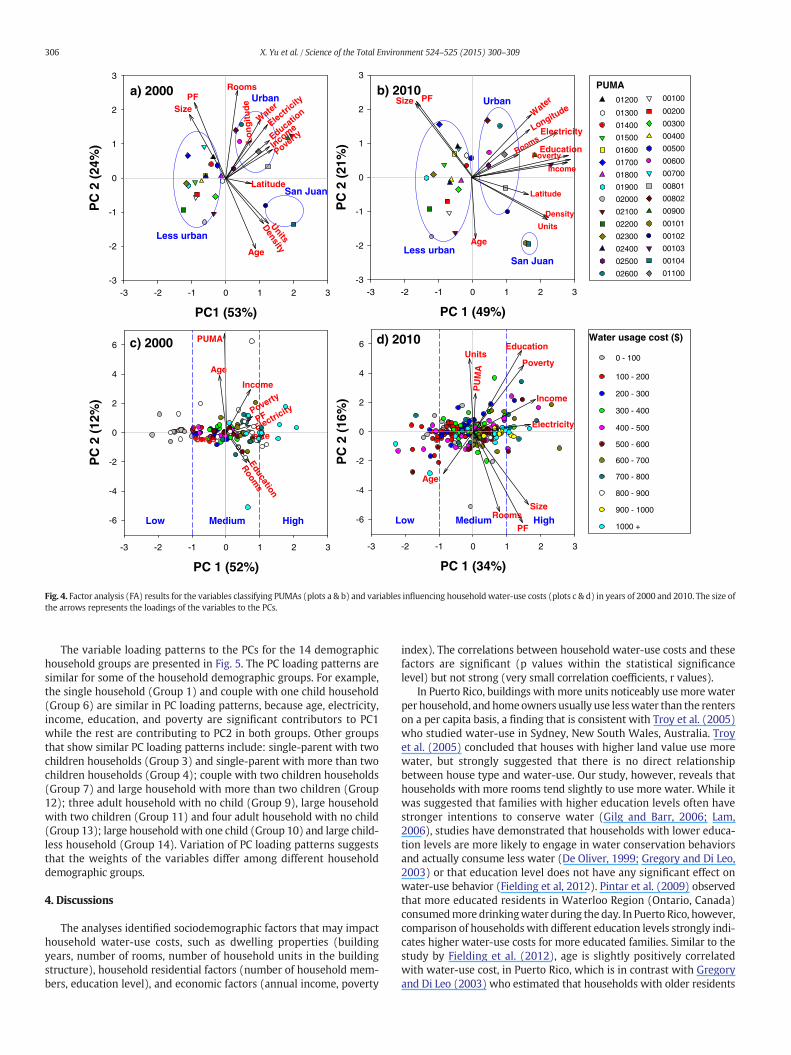
The FA clustering patterns of PUMAs based on sociodemographicand geographic factors are shown in Fig. 4a & b. Despite small differ-ences between 2000 and 2010, variables such as household size, income,education, and poverty have greater loadings on PC1, and variables such
as rooms in the household unit, water-use costs, age, units in thebuilding structure, and population density have greater loadings onPC2. The PUMAs can be primarily categorized into three groups basedon their PC scores: metro area (San Juan), urban area with high popula-tion density, and less populated suburban and rural area. Two PCs areidentified for distinguishing the geographic unit PUMA as a soft coeffi-cient (PC1, variables related to the socioeconomic status of the resi-dents) and a hard coefficient (PC2, variables related to the dwellingconditions).
The FA results on the variability of factors influencing householdwater-use costs are shown in Fig. 4c & d. In 2000, variables with higherloadings on PC1 include number of rooms, housing units, education, andpoverty, and variables with higher loadings on PC2 include householdsize and electricity. In 2010, variables with higher loadings on PC1include income and electricity cost; and variables with higher loadingson PC2 include household size, education, poverty, rooms, units andPUMA. The distribution of the household water-use costs can be gener-ally clustered into low, medium and high levels according to the PCscores, while the variables differ in their weights to explain the variabil-ity of water-use costs of different levels. Though the PC loading patternsare slightly different between the two years due to complexity andchanges of the sociodemographic patterns and also variations of thesampling households, the variables can still be roughly grouped intothe soft and hard coefficients corresponding to the resident socioeco-nomic status and dwelling conditions, respectively.
PC 1 (34%)
-3 -2 -1 0 1 2 3
PC
2 (
16%
)
-6
-4
-2
0
2
4
6
Rooms
Electricity
PU
MA
EducationUnits
Income
PF
Age
Poverty
Size
PUMA
Age
Income
Poverty
PF
sizeElectric
ity
Education
Rooms
c) 2000 d) 2010
Low Medium High Low Medium High
PC 1 (52%)
-3 -2 -1 0 1 2 3
PC
2 (
12%
)
-6
-4
-2
0
2
4
6
PC1 (53%)
-3 -2 -1 0 1 2 3
PC
2 (
24%
)
-3
-2
-1
0
1
2
3
PC 1 (49%)
-3 -2 -1 0 1 2 3
PC
2 (
21%
)
-3
-2
-1
0
1
2
3
PF
Age
SizeW
ater
Longitude
EducationPoverty
Income
Units
Density
Latitude
RoomsElectricity
PF
Age
SizeW
ater
Lo
ng
itu
de
Education
Poverty
Income
Units
Density
Latitude
Rooms
Electricity
a) 2000 b) 2010
San Juan
Urban
Less urban
Less urban
San Juan
Urban 01200
01300
01400
01500
01600
01700
01800
01900
02000
02100
02200
02300
02400
02500
02600
00100
00200
00300
00400
00500
00600
00700
00801
00802
00900
00101
00102
00103
00104
01100
PUMA
Units
0 - 100
100 - 200
200 - 300
300 - 400
400 - 500
500 - 600
600 - 700
700 - 800
800 - 900
900 - 1000
1000 +
Water usage cost ($)
Fig. 4. Factor analysis (FA) results for the variables classifying PUMAs (plots a & b) and variables influencing householdwater-use costs (plots c & d) in years of 2000 and 2010. The size ofthe arrows represents the loadings of the variables to the PCs.
306 X. Yu et al. / Science of the Total Environment 524–525 (2015) 300–309
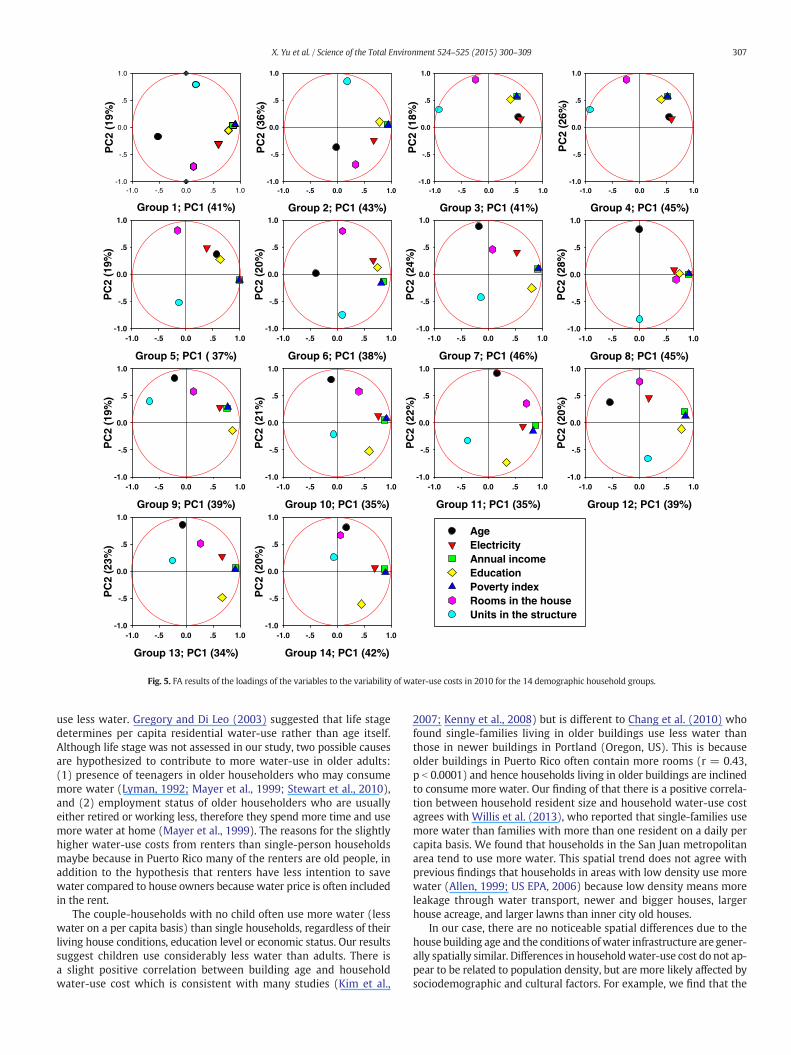
The variable loading patterns to the PCs for the 14 demographichousehold groups are presented in Fig. 5. The PC loading patterns aresimilar for some of the household demographic groups. For example,the single household (Group 1) and couple with one child household(Group 6) are similar in PC loading patterns, because age, electricity,income, education, and poverty are significant contributors to PC1while the rest are contributing to PC2 in both groups. Other groupsthat show similar PC loading patterns include: single-parent with twochildren households (Group 3) and single-parent with more than twochildren households (Group 4); couple with two children households(Group 7) and large household with more than two children (Group12); three adult household with no child (Group 9), large householdwith two children (Group 11) and four adult household with no child(Group 13); large household with one child (Group 10) and large child-less household (Group 14). Variation of PC loading patterns suggeststhat the weights of the variables differ among different householddemographic groups.
4. Discussions
The analyses identified sociodemographic factors that may impacthousehold water-use costs, such as dwelling properties (buildingyears, number of rooms, number of household units in the buildingstructure), household residential factors (number of household mem-bers, education level), and economic factors (annual income, poverty
index). The correlations between household water-use costs and thesefactors are significant (p values within the statistical significancelevel) but not strong (very small correlation coefficients, r values).
In Puerto Rico, buildings with more units noticeably usemore waterper household, and homeowners usually use lesswater than the renterson a per capita basis, a finding that is consistent with Troy et al. (2005)who studied water-use in Sydney, New South Wales, Australia. Troyet al. (2005) concluded that houses with higher land value use morewater, but strongly suggested that there is no direct relationshipbetween house type and water-use. Our study, however, reveals thathouseholds with more rooms tend slightly to use more water. While itwas suggested that families with higher education levels often havestronger intentions to conserve water (Gilg and Barr, 2006; Lam,2006), studies have demonstrated that households with lower educa-tion levels are more likely to engage in water conservation behaviorsand actually consume less water (De Oliver, 1999; Gregory and Di Leo,2003) or that education level does not have any significant effect onwater-use behavior (Fielding et al, 2012). Pintar et al. (2009) observedthat more educated residents in Waterloo Region (Ontario, Canada)consumedmore drinkingwater during the day. In Puerto Rico, however,comparison of households with different education levels strongly indi-cates higher water-use costs for more educated families. Similar to thestudy by Fielding et al. (2012), age is slightly positively correlatedwith water-use cost, in Puerto Rico, which is in contrast with Gregoryand Di Leo (2003) who estimated that households with older residents
Group 1; PC1 (41%)
-1.0 -.5 0.0 .5 1.0
PC
2 (1
9%)
-1.0
-.5
0.0
.5
1.0
Group 2; PC1 (43%)
-1.0 -.5 0.0 .5 1.0
PC
2 (3
6%)
-1.0
-.5
0.0
.5
1.0
Group 3; PC1 (41%)
-1.0 -.5 0.0 .5 1.0
PC
2 (1
8%)
-1.0
-.5
0.0
.5
1.0
Group 5; PC1 ( 37%)
-1.0 -.5 0.0 .5 1.0
PC
2 (1
9%)
-1.0
-.5
0.0
.5
1.0
Group 4; PC1 (45%)
-1.0 -.5 0.0 .5 1.0
PC
2 (2
6%)
-1.0
-.5
0.0
.5
1.0
Group 6; PC1 (38%)
-1.0 -.5 0.0 .5 1.0
PC
2 (2
0%)
-1.0
-.5
0.0
.5
1.0
Group 7; PC1 (46%)
-1.0 -.5 0.0 .5 1.0
PC
2 (2
4%)
-1.0
-.5
0.0
.5
1.0
Group 8; PC1 (45%)
-1.0 -.5 0.0 .5 1.0
PC
2 (2
8%)
-1.0
-.5
0.0
.5
1.0
Group 9; PC1 (39%)
-1.0 -.5 0.0 .5 1.0
PC
2 (1
9%)
-1.0
-.5
0.0
.5
1.0
Group 10; PC1 (35%)
-1.0 -.5 0.0 .5 1.0
PC
2 (2
1%)
-1.0
-.5
0.0
.5
1.0
Group 11; PC1 (35%)
-1.0 -.5 0.0 .5 1.0
PC
2 (2
2%)
-1.0
-.5
0.0
.5
1.0
Group 12; PC1 (39%)
-1.0 -.5 0.0 .5 1.0
PC
2 (2
0%)
-1.0
-.5
0.0
.5
1.0
Group 13; PC1 (34%)
-1.0 -.5 0.0 .5 1.0
PC
2 (2
3%)
-1.0
-.5
0.0
.5
1.0
Group 14; PC1 (42%)
-1.0 -.5 0.0 .5 1.0
PC
2 (2
0%)
-1.0
-.5
0.0
.5
1.0
AgeElectricityAnnual incomeEducationPoverty indexRooms in the houseUnits in the structure
Fig. 5. FA results of the loadings of the variables to the variability of water-use costs in 2010 for the 14 demographic household groups.
307X. Yu et al. / Science of the Total Environment 524–525 (2015) 300–309
use less water. Gregory and Di Leo (2003) suggested that life stagedetermines per capita residential water-use rather than age itself.Although life stage was not assessed in our study, two possible causesare hypothesized to contribute to more water-use in older adults:(1) presence of teenagers in older householders who may consumemore water (Lyman, 1992; Mayer et al., 1999; Stewart et al., 2010),and (2) employment status of older householders who are usuallyeither retired or working less, therefore they spend more time and usemore water at home (Mayer et al., 1999). The reasons for the slightlyhigher water-use costs from renters than single-person householdsmaybe because in Puerto Rico many of the renters are old people, inaddition to the hypothesis that renters have less intention to savewater compared to house owners because water price is often includedin the rent.
The couple-households with no child often use more water (lesswater on a per capita basis) than single households, regardless of theirliving house conditions, education level or economic status. Our resultssuggest children use considerably less water than adults. There isa slight positive correlation between building age and householdwater-use cost which is consistent with many studies (Kim et al.,
2007; Kenny et al., 2008) but is different to Chang et al. (2010) whofound single-families living in older buildings use less water thanthose in newer buildings in Portland (Oregon, US). This is becauseolder buildings in Puerto Rico often contain more rooms (r = 0.43,p b 0.0001) and hence households living in older buildings are inclinedto consume more water. Our finding of that there is a positive correla-tion between household resident size and household water-use costagrees with Willis et al. (2013), who reported that single-families usemore water than families with more than one resident on a daily percapita basis. We found that households in the San Juan metropolitanarea tend to use more water. This spatial trend does not agree withprevious findings that households in areas with low density use morewater (Allen, 1999; US EPA, 2006) because low density means moreleakage through water transport, newer and bigger houses, largerhouse acreage, and larger lawns than inner city old houses.
In our case, there are no noticeable spatial differences due to thehouse building age and the conditions ofwater infrastructure are gener-ally spatially similar. Differences in householdwater-use cost do not ap-pear to be related to population density, but are more likely affected bysociodemographic and cultural factors. For example, we find that the
308 X. Yu et al. / Science of the Total Environment 524–525 (2015) 300–309
household size appears to be smaller in themore densely San Juan area.In summary, the demographic profile of a high water-use household inPuerto Rico tends to be that of renters, peoplewho live in larger or olderbuildings, people living in metro areas, or those with higher educationlevel and higher income.
The FA results suggest two coefficients incorporating the variousfactors influencing household water-use cost: the soft coefficient(socioeconomic factors) and the hard coefficient (dwelling factors).The FA results indicate that the most influential factors on householdwater-use cost may vary among different demographic groups. Forexample, the hard coefficient is more dominant in affecting water-usefor single-person households. This finding implicates the significanceof studies on sociodemographic patterns of household water-use costbecause more individualized methods could be proposed to reducehousehold water-use cost by identifying the most relevant factors. Theweak predicting ability of household water-use cost from our analysissuggests the limitations of this study. We propose further studies onsurveying the detailed household water-use cost patterns and relatedfactors for households from various demographic groups in a temporaland spatial scale as a case study to supplement the micro-informationon household water-use. Findings and analyses in the study can beextended to other populations with IPUMS in order to achieve nationalsustainability and water resources management objectives.
5. Conclusion
Household water-use costs in Puerto Rico increased from 1970 to1990, then remained stable but slightly decreased more recently.Despite the complexpatterns ofwater-use costs amongdifferent house-hold demographic groups, we identified several trends of householdwater-use as well as sociodemographic factors important in residentialwater demandmanagement in Puerto Rico. Smaller households, rentedhouseholds, households with higher education and higher income,household living in larger and older buildings, or households in metro-politan area are likely to consumemore water on a per capita basis. TheFA results on the multiple variables influencing household water-usecosts indicate two PCs, soft and hard coefficients, which are the socio-economic status of the household residents and the correlation withthe household dwelling conditions, respectively. The weak ability topredict household water-use cost using these variables necessitatesfurther studies, especially multidisciplinary research of the social andpsychological aspects as well as micro-case studies of household water-use.
Acknowledgments
Support of the work described is provided through Award NumberP42ES017198 from the National Institute of Environmental HealthSciences of the National Institute of Health to the Puerto Rico Testsitefor Exploring Contamination Threats (PROTECT) Superfund ResearchProgram Center. The content is solely the responsibility of the authorsand does not necessarily represent the official views or policies of theNational Institute of Environmental Health Sciences and the NationalInstitute of Health. We also thankM. Bartok from Puerto Rico Aqueductand Sewer Authority for the water tariff information.
References
Aggarwal, R.M., Guhathakurta, S., Grossman-Clarke, S., Lathey, V., 2012. How do variationsin Urban Heat Islands in space and time influence household water use? The caseof Phoenix, Arizona. Water Resour. Res. 48, W06518. http://dx.doi.org/10.1029/2011WR010924.
Agthe, D.E., Billings, R., 1987. Equity, price elasticity, and household income under in-creasing block rates for water. Am. J. Econ. Sociol. 46, 273–286. http://dx.doi.org/10.1111/j.1536-7150.1987.tb01966.x.
Allen, E., 1999. Measuring the environmental footprint of the new urbanisim. New UrbanNews 4, 16–18.
Arbués, F., Garcı a-Valiñas, M.A., Martınez-Espiñeira, R., 2003. Estimation of residentialwater demand: a state-of-the-art review. J. Socio-Econ. 32, 81–102. http://dx.doi.org/10.3390/w6102929.
Balling, R.C., Gober, P., Jones, N., 2008. Sensitivity of residential water consumption tovariations in climate: an intraurban analysis of Phoenix, Arizona. Water Resour. Res.44, W10401. http://dx.doi.org/10.1029/2007WR006722.
Breyer, B., Chang, H., 2014. Urban water consumption and weather variation in thePortland, Oregon metropolitan area. Urban Clim. 9, 1–18. http://dx.doi.org/10.1016/j.uclim.2014.05.001.
Carr, J.E., Chase, E.B., Paulson, R.W., Moody, D.W., 1990. National Water Summary 1987—
hydrologic events and water supply and use. USGS Water Supply Paper, 2350.Chang, H., Parandvash, G.H., Shandas, V., 2010. Spatial variations of single-family residen-
tial water consumption in Portland, Oregon. Urban Geogr. 31, 953–972. http://dx.doi.org/10.2747/0272-3638.31.7.953.
Corbella, H.M., Pujol, D.S., 2009. What lies behind domestic water use? A review essay onthe drivers of domestic water consumption. Bol. AGEN 50, 297–314.
Dalhuisen, J.M., Florax, R., De Grot, H., Nijkamp, P., 2003. Price and income elasticities ofresidential water demand: a meta-analysis. Land Econ. 79, 292–308. http://dx.doi.org/10.3368/le.79.2.292.
Daly, C., Helmer, E.H., Quiṅones, M., 2003. Mapping the climate of Puerto Rico, Viequesand Culebra. Int. J. Climatol. 23, 1359–1381. http://dx.doi.org/10.1002/joc.937.
De Oliver, M., 1999. Attitudes and inaction: a case study of the manifest demographics ofurban water conservation. Environ. Behav. 31 (3), 372–394. http://dx.doi.org/10.1177/00139169921972155.
Dominick, D., Juahir, H., Latif, M.T., Zain, S.M., Aris, A.Z., 2012. Spatial assessment ofair quality patterns in Malaysia using multivariate analysis. Atmos. Environ. 60,172–181. http://dx.doi.org/10.1016/j.atmosenv.2012.06.021.
Fielding, K.S., Russell, S., Spinks, A., Mankad, A., 2012. Determinants of household waterconservation: the role of demographic, infrastructure, behavior, and psychosocialvariables. Water Resour. Res. 48, W10510. http://dx.doi.org/10.1029/2012WR012398.
Ghasemizadeh, R., Hellweger, F., Butscher, C., Padilla, I., Vesper, D., Field, M., Alshawabkeh,A., 2012. Review: groundwater flow and transport modeling of karst aquifers, withparticular reference to the North Coast Limestone aquifer system of Puerto Rico.Hydrogeol. J. 20 (8), 1441–1461. http://dx.doi.org/10.1007/s10040-012-0897-4.
Gilg, A., Barr, S., 2006. Behavioral attitudes towards water saving? Evidence from a studyof environmental actions. Ecol. Econ. 57, 400–414. http://dx.doi.org/10.1016/j.ecolecon.2005.04.010.
Gleick, P.H., Burns, W.C.G., Chalecki, E.L., Cohen, M., Cushing, K.K., Mann, A., Reyes, R.,Wolff, G.H., Wong, A.K., 2002. The world's water, 2002-2003. The biennial report onfreshwater resources. Washington, D.C.: Island Press.
Gregory, G.D., Di Leo, M., 2003. Repeated behavior and environmental psychology: therole of personal involvement and habit formation in explaining water consumption.J. Appl. Soc. Psychol. 33 (6), 1261–1296. http://dx.doi.org/10.1111/j.1559-1816.2003.tb01949.x.
Hoffmann,M.,Worthington, A., Higgs, H., 2006. Urbanwater demandwith fixed volumetricchanging in a large municipality: the case of Brisbane, Australia. Aust. J. Agric. Econ. 50,347–359.
House-Peters, L.A., Chang, H., 2011. Urban water demand modeling: review of concepts,methods, and organizing principles. Water Resour. Res. 47, W05401. http://dx.doi.org/10.1029/2010WR009624.
House-Peters, L., Pratt, B., Chang, H., 2010. Effects of urban spatial structure,sociodemographics, and climate on residentialwater consumption inHillsboro, Oregon.J. Am. Water Resour. Assoc. 46, 461–472. http://dx.doi.org/10.1029/2010WR009624.
Hunter, J.M., Arbona, S.I., 1995. Paradise lost: an introduction to the geography of waterpollution in Puerto Rico. Soc. Sci. Med. 40, 1331–1355. http://dx.doi.org/10.1016/0277-9536(94)00255-R.
Inman, D., Jeffrey, P., 2006. A review of residential demand-side management tool perfor-mance and influences on implementation effectiveness. Urban Water J. 3, 127–143.http://dx.doi.org/10.1080/15730620600961288.
Jain, M., Lim, Y., Arce-Nazario, J.A., Uriarte, M., 2014. Perceptional and socio-demographicfactors associated with household drinking water management strategies in ruralPuerto Rico. PLoS ONE 9 (2), e88059. http://dx.doi.org/10.1371/journal.pone.0088059.
Jorgensen, B., Graymore,M.,O'Toole, K., 2009.Householdwater use behavior: an integratedmodel. J. Environ. Manag. 91, 227–236. http://dx.doi.org/10.1016/j.jenvman.2009.08.009.
Kenny, D.S., Goemans, C., Klein, R., Lowrey, J., Reidy, K., 2008. Residential water demandmanagement: lessons from Aurora, Colorado. J. Am. Water Resour. Assoc. 44,192–207. http://dx.doi.org/10.1111/j.1752-1688.2007.00147.x.
Kim, S.H., Choi, S.H., Koo, J.K., Choi, S.I., Hyun, L.H., 2007. Trend analysis of domestic waterconsumption depending upon social, cultural, economic parameters. Water Sci.Technol. 7, 61–68. http://dx.doi.org/10.2166/ws.2007.097.
Lam, S., 2006. Predicting intention to save water: theory of planned behavior, response ef-ficacy, vulnerability, and perceived efficiency of alternative solutions. J. Appl. Soc.Psychol. 36 (11), 2803–2824. http://dx.doi.org/10.1111/j.0021-9029.2006.00129.x.
Lyman, R.A., 1992. Peak and off-peak residential water demand. Water Resour. Res. 28,2159–2167. http://dx.doi.org/10.1029/92WR01082.
Martinuzzi, S., Gould, W.A., Gonzalez, O.M.R., 2007. Land development, land use, andurban sprawl in Puerto Rico integrating remote sensing and population censusdata. Landsc. Urban Plan. 79, 288–297. http://dx.doi.org/10.1016/j.landurbplan.2006.02.014.
Mayer, P.W., DeOreo, W.B., Opitz, E.M., Kiefer, J.C., Davis, W.Y., Dziegielewski, B., Nelson, J.O.,1999. Residential End Uses of Water. American Water Works Association (310 pp.).
Millock, K., Nauges, C., 2010. Household adoption of water-efficient equipment: the roleof socio-economic factors, environmental attitudes and policy. Environ. Resour.Econ. 46, 539–565. http://dx.doi.org/10.1007/s10640-010-9360-y.
309X. Yu et al. / Science of the Total Environment 524–525 (2015) 300–309
Mitchell, B., 1984. The value of water as a commodity. Can. Water Resour. J. 9, 30–37.http://dx.doi.org/10.4296/cwrj0902030.
Molina-Rivera, W.L., 2014. Estimated water use in Puerto Rico, 2010. U.S. GeologicalSurvey Open-File Report 2014-1117 http://dx.doi.org/10.3133/ofr20141117.
Molina-Rivera, W.L., Gómez-Gómez, F., 2008. Estimated water use in Puerto Rico, 2005.U.S. Geological Survey Open-File Report 2008–1286.
Peichl, A., Pestel, N., Schneider, H., 2012. Does size matter? The impact of changes inhousehold structure on income distribution in Germany. Rev. Income Wealth 58,118–141. http://dx.doi.org/10.1111/j.1475-4991.2011.00448.x.
Pint, E.M., 1999. Household responses to increased water rates during the Californiadrought. Land Econ. 75, 246–266.
Pintar, K.D., Waltner-Toews, D., Charron, D., Pollari, F., Fazil, A., McEwen, S.A., Nesbitt, A.,Majowicz, S., 2009. Water consumption habits of a south-western Ontario community.J. Water Health 7, 276–292. http://dx.doi.org/10.2166/wh.2009.038.
Piper, S., Martin, W.E., 1997. Household willingness to pay for improved rural water sup-plies: a comparison of four sites. Water Resour. Res. 33, 2153–2163. http://dx.doi.org/10.1029/97WR01898.
Potter, R.B., Darmame, K., 2010. Contemporary social variations in household water use,management strategies and awareness under conditions of ‘water stress’: the caseof Greater Amman, Jordan. Habitat Int. 34, 115–124. http://dx.doi.org/10.1016/j.habitatint.2009.08.001.
Ramcharran, H., 2011. The pharmaceutical industry of Puerto Rico: ramifications of globalcompetition. J. Policy Model 33, 395–406. http://dx.doi.org/10.1016/j.jpolmod.2010.11.003.
Rathnayaka, K., Maheepala, S., Nawarathna, B., George, B., Malano, H., Arora, M., Roberts,P., 2014. Factors affecting the variability of household water use in Melbourne,Australia. Resour. Conserv. Recycl. 92, 85–94. http://dx.doi.org/10.1016/j.resconrec.2014.08.012.
Renwick, M.E., Archibald, S.O., 1998. Demand side management policies for residentialwater use: who bears the conservation burden? Land Econ. 74, 343–360.
Reynaud, A., 2013. Assessing the impact of price and non-price policies on residentialwater demand: a case study in Wisconsin. Int. J. Water Resour. Dev. 29, 415–433.http://dx.doi.org/10.1080/07900627.2012.721670.
Ruggles, S., Alexander, T., Genadek, K., Goeken, R., Schroeder, M.B., Sobek, M., 2010.Integrated Public Use Microdata Series: Version 5.0 (Machine-readable database).University of Minnesota, Minneapolis.
Sauri, D., 2013. Water conservation: theory and evidence in urban areas of the developedworld. Annu. Rev. Environ. Resour. 38, 227–248. http://dx.doi.org/10.1146/annurev-environ-013113-142651.
Sobek, M., Cleveland, L., Flood, S., Hall, P.K., King, M.L., Ruggles, S., Schroeder, M., 2011. Bigdata: large-scale historical infrastructure from theMinnesota Population Center. Hist.Methods 44, 61–68. http://dx.doi.org/10.1080/01615440.2011.564572.
Stewart, R.A., Willis, R., Giurco, D., Panuwatwanich, K., Capati, G., 2010. Web based knowl-edge management system: linking smart metering to the future of urban water plan-ning. Aust. Plan. 47, 66–74. http://dx.doi.org/10.1080/07293681003767769.
Troy, P., Holloway, D., Randolph, B., 2005. Water Use and the Built Environment: Patternsof Water Consumption in Sydney. City Futures Research Centre. Faculty of the BuiltEnvironment, University of NSW.
US EPA, 2006. Growing towardmore efficient water use: linking development, infrastruc-ture, and drinking water policies. Development, Community, and EnvironmentDivision, EPA 230-R-06-001 (Washington, D.C.).
Willis, R.M., Stewart, R., Panuwatwanich, K., Williams, P.R., Hollingsworth, A.L., 2011.Quantifying the influence of environmental and water conservation attitudeson household end use water consumption. J. Environ. Manag. 92, 1996–2009.http://dx.doi.org/10.1016/j.jenvman.2011.03.023.
Willis, R.M., Rodney, A., Giurco, D.P., Mohammad, R.T., Mousavinejad, A., 2013. End usewater consumption in households: impact of socio-demographic factors and efficientdevices. J. Clean. Prod. 60, 107–115. http://dx.doi.org/10.1016/j.jclepro.2011.08.006.
Wodraska, J.W., 2006. Water: resource or commodity? J. Am. Water Works Assoc. 98,86–90.
Yu, X., Ghasemizadeh, R., Padilla, I., Irizarry, C., Kaeli, D., Alshawabkeh, A., 2015. Spatio-temporal changes of CVOC concentrations in karst aquifers: analysis of three decadesof data from Puerto Rico. Sci. Total Environ. 511, 1–10. http://dx.doi.org/10.1016/j.scitotenv.2014.12.031.n.
Yun, O., Wentz, E.A., Ruddell, B.L., Harlan, S.L., 2014. Amulti-scale analysis of single-familyresidential water use in the Phoenix metropolitan area. JAWRA J. Am. Water Resour.Assoc. 50, 448–467. http://dx.doi.org/10.1111/jawr.12133.


