Embed Size (px)
Citation preview

Software Architectures:
Case Studies
Authors: Students in Software Architectures course
Computer Science and Computer Engineering Department
University of Arkansas
May 2014
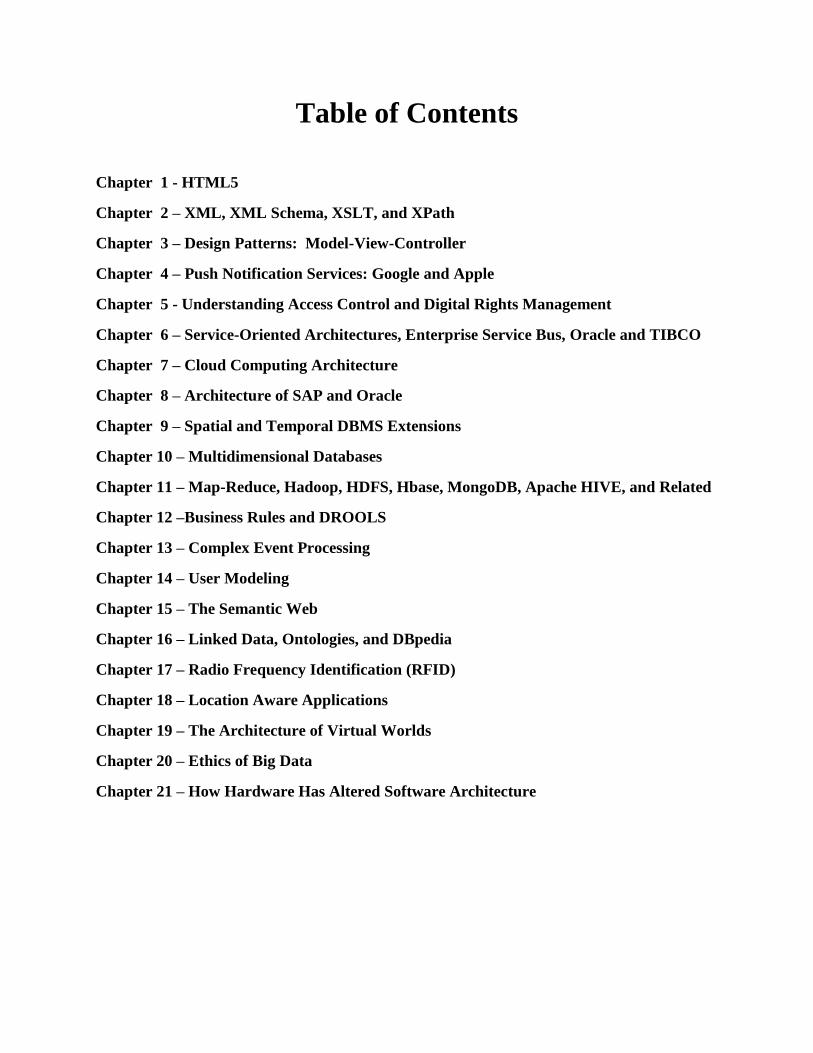
Table of Contents
Chapter 1 - HTML5
Chapter 2 – XML, XML Schema, XSLT, and XPath
Chapter 3 – Design Patterns: Model-View-Controller
Chapter 4 – Push Notification Services: Google and Apple
Chapter 5 - Understanding Access Control and Digital Rights Management
Chapter 6 – Service-Oriented Architectures, Enterprise Service Bus, Oracle and TIBCO
Chapter 7 – Cloud Computing Architecture
Chapter 8 – Architecture of SAP and Oracle
Chapter 9 – Spatial and Temporal DBMS Extensions
Chapter 10 – Multidimensional Databases
Chapter 11 – Map-Reduce, Hadoop, HDFS, Hbase, MongoDB, Apache HIVE, and Related
Chapter 12 –Business Rules and DROOLS
Chapter 13 – Complex Event Processing
Chapter 14 – User Modeling
Chapter 15 – The Semantic Web
Chapter 16 – Linked Data, Ontologies, and DBpedia
Chapter 17 – Radio Frequency Identification (RFID)
Chapter 18 – Location Aware Applications
Chapter 19 – The Architecture of Virtual Worlds
Chapter 20 – Ethics of Big Data
Chapter 21 – How Hardware Has Altered Software Architecture
SOFTWARE ARCHITECTURES
Chapter 1 – HTML5 Anh Au
Summary In this chapter, we cover HTML5 and the specifications of HTML5. HTML takes a major part
in defining the Web platform. We will cover high level concepts, the history of HTML, and
famous HTML implementations. This chapter also covers how this system fits into a larger
application architecture. Lastly, we will go over the high level architecture of HTML5 and cover
HTML5 structures and technologies.
Introduction
High level concepts – what is the basic functionality of this system HyperText Markup Language (HTML) is the markup language used by to create, interpret, and
annotate hypertext documents on any platform. HTML5 is the fifth and latest standard for
HTML. It is enhanced to provide multimedia and interactive content without needing additional
plug-ins.1 The current version more easily and effectively supports the creation of web
applications that are able to work with the user, the user’s local data, and server.
Glossary
CERN European Organization for Nuclear Research
CSS Cascading Style Sheets
A style sheet language used for describing the look and formatting of
a document written in a markup language
DOM Document Object Model
A cross-platform and language-independent convention for
representing and interacting with objects in HTML, XHTML, and
XML documents
DTD Document Type Definition
A set of markup declarations that define a document type for an
SGML-family markup language
GPU Graphics Processing Unit
HyperText Text displayed on a computer display with hyperlinks to other text
which the reader can immediately access
IETF Internet Engineering Task Force
Develops and promotes Internet standards
Internet A global system of interconnected computer networks that use the
standard Internet protocol suite to link several billion devices
worldwide
JS JavaScript
The scripting language of the Web
Markup
language
Modern system for annotating a document in a way that is
syntactically distinguishable from the text
PHP PHP: Hypertext Preprocessor
1
SOFTWARE ARCHITECTURES
A server-side scripting language designed for web development
RTC Real-Time Communication
SGML Standard Generalized Markup Language
Used for defining generalized markup languages for documents
W3C World Wide Web Consortium
The main international standards organization for the World Wide
Web
WHATWG Web Hypertext Application Technology Working Group
A community of people interested in evolving HTML
XHTM L Extensible HyperText Markup Language
A family of XML markup languages that extends versions of HTML
XML Extensible Markup Language
A markup language that defines a set of rules for encoding documents
in a format that is both human-readable and machine-readable
2
SOFTWARE ARCHITECTURES
History Although the origin of the Internet began around the 1960s, the field of academia began to utilize
the Internet in the 1980s. Progressing into the 1990s, the increasing popularity of the Internet
had created an impact on cultures and businesses everywhere.
CERN researchers were
looking for a system that would
the central location where
documents could be created
and shared. The idea came to
be ENQUIRE in 1980. In
1989, physicist and CERN
contractor Tim Berners-Lee
incorporated the ever-growing
Internet into the ENQUIRE
system. He suggested a
hypertext system that would
use hyperlinks connecting to
the Internet. By late 1990,
Berners-Lee created HTML
and the browser and server
software. 2
Figure 1. ENQUIRE Proposal9
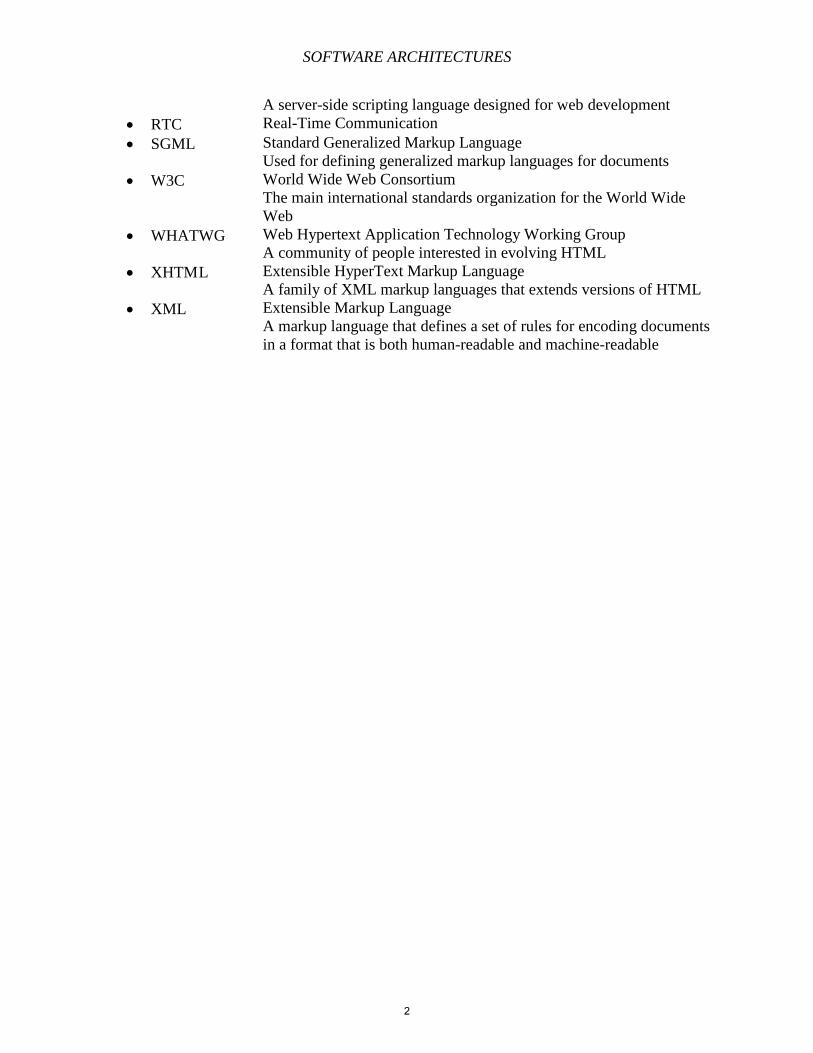
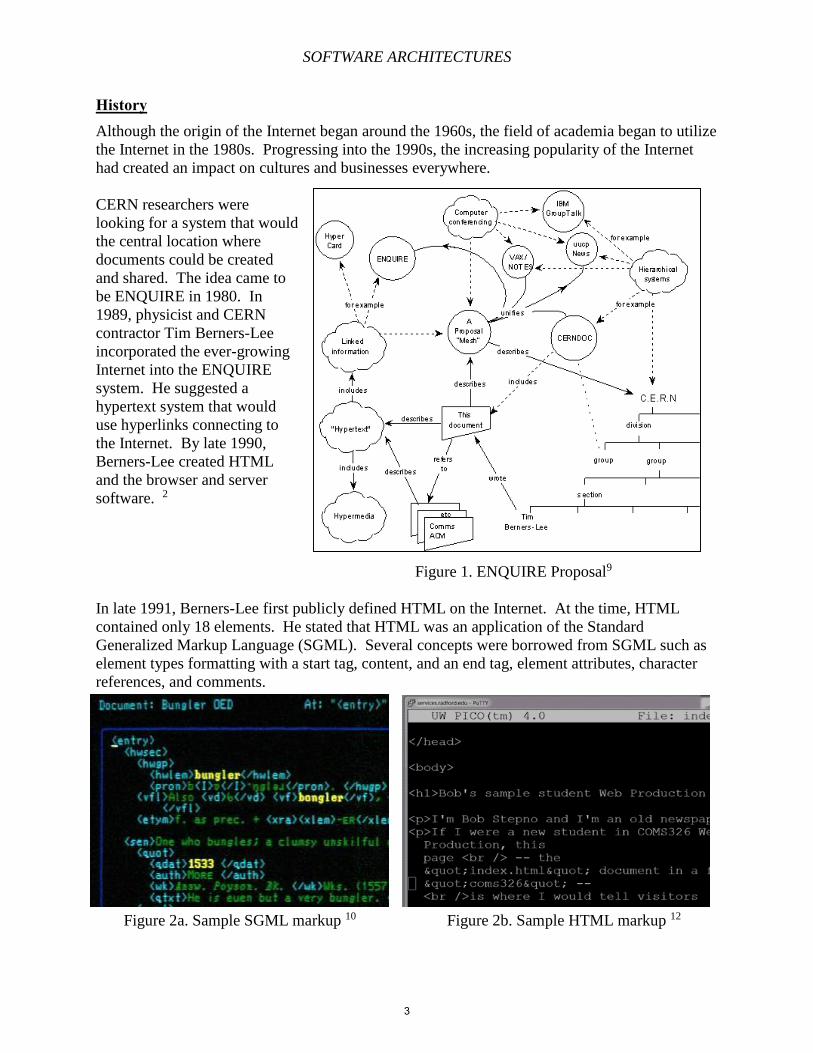
In late 1991, Berners-Lee first publicly defined HTML on the Internet. At the time, HTML
contained only 18 elements. He stated that HTML was an application of the Standard
Generalized Markup Language (SGML). Several concepts were borrowed from SGML such as
element types formatting with a start tag, content, and an end tag, element attributes, character
references, and comments.
Figure 2a. Sample SGML markup 10 Figure 2b. Sample HTML markup 12
3
SOFTWARE ARCHITECTURES
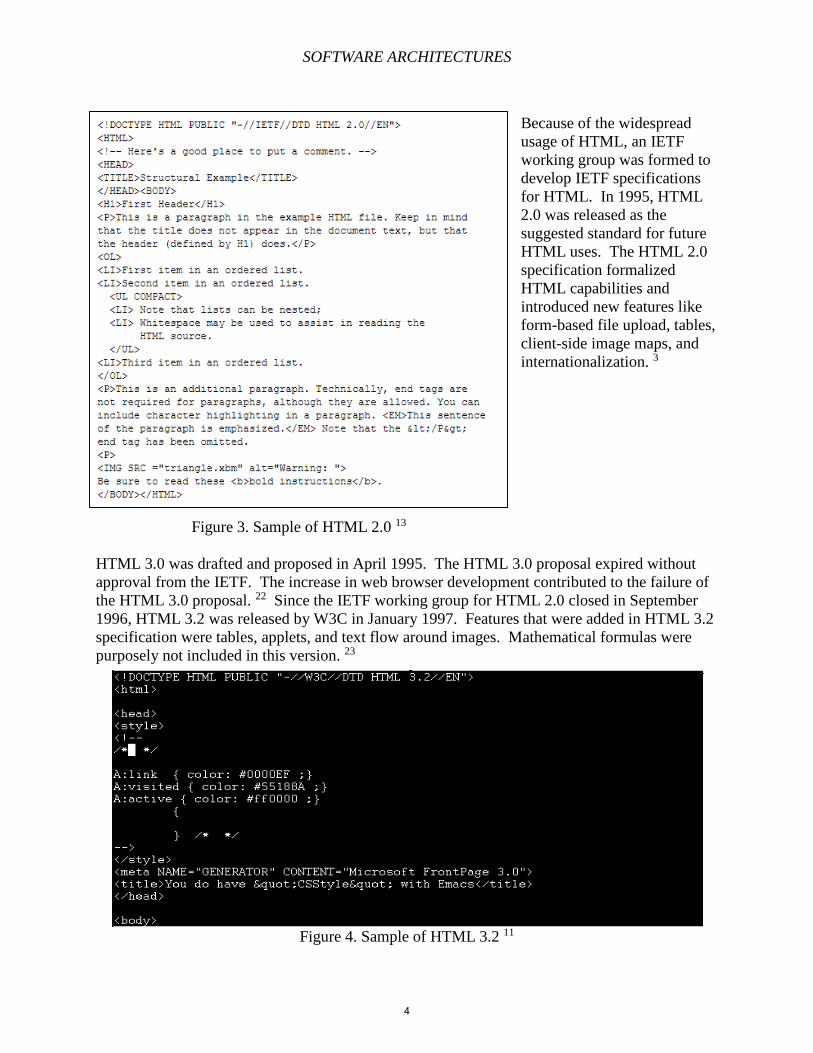
Because of the widespread
usage of HTML, an IETF
working group was formed to
develop IETF specifications
for HTML. In 1995, HTML
2.0 was released as the
suggested standard for future
HTML uses. The HTML 2.0
specification formalized
HTML capabilities and
introduced new features like
form-based file upload, tables,
client-side image maps, and
internationalization. 3
Figure 3. Sample of HTML 2.0 13
HTML 3.0 was drafted and proposed in April 1995. The HTML 3.0 proposal expired without
approval from the IETF. The increase in web browser development contributed to the failure of
the HTML 3.0 proposal. 22 Since the IETF working group for HTML 2.0 closed in September
1996, HTML 3.2 was released by W3C in January 1997. Features that were added in HTML 3.2
specification were tables, applets, and text flow around images. Mathematical formulas were
purposely not included in this version. 23
Figure 4. Sample of HTML 3.2 11
4
SOFTWARE ARCHITECTURES
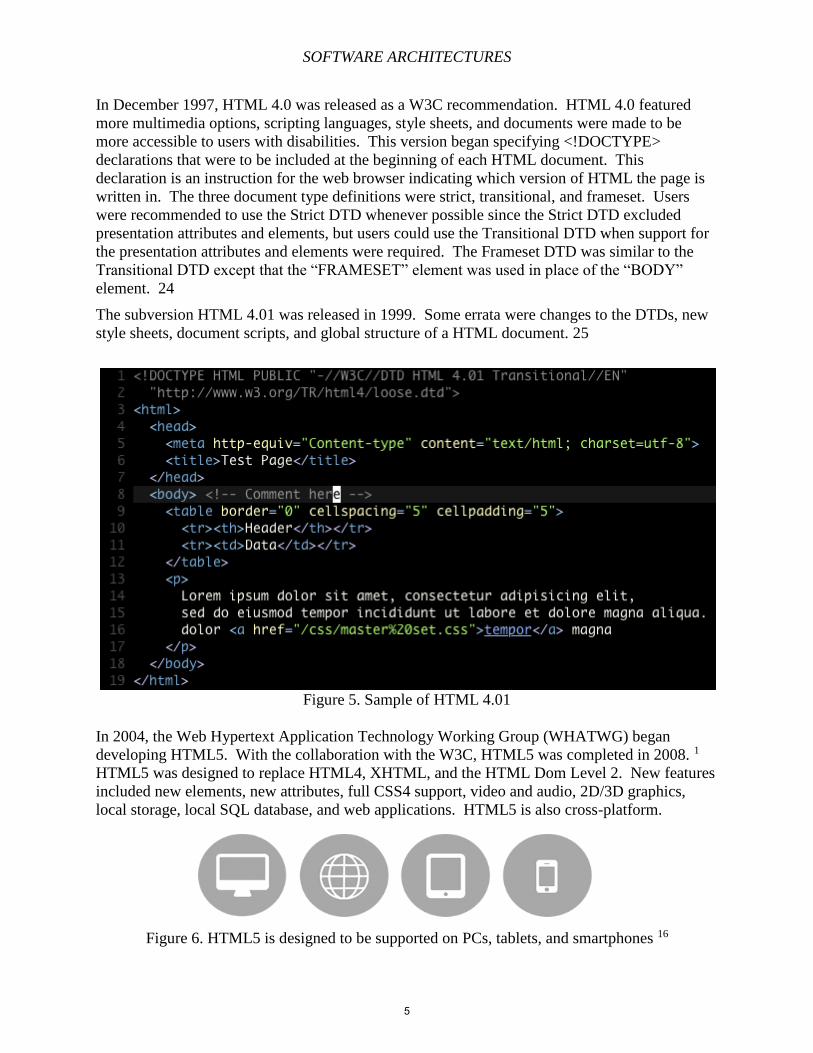
In December 1997, HTML 4.0 was released as a W3C recommendation. HTML 4.0 featured
more multimedia options, scripting languages, style sheets, and documents were made to be
more accessible to users with disabilities. This version began specifying <!DOCTYPE>
declarations that were to be included at the beginning of each HTML document. This
declaration is an instruction for the web browser indicating which version of HTML the page is
written in. The three document type definitions were strict, transitional, and frameset. Users
were recommended to use the Strict DTD whenever possible since the Strict DTD excluded
presentation attributes and elements, but users could use the Transitional DTD when support for
the presentation attributes and elements were required. The Frameset DTD was similar to the
Transitional DTD except that the “FRAMESET” element was used in place of the “BODY”
element. 24
The subversion HTML 4.01 was released in 1999. Some errata were changes to the DTDs, new
style sheets, document scripts, and global structure of a HTML document. 25
Figure 5. Sample of HTML 4.01
In 2004, the Web Hypertext Application Technology Working Group (WHATWG) began
developing HTML5. With the collaboration with the W3C, HTML5 was completed in 2008. 1
HTML5 was designed to replace HTML4, XHTML, and the HTML Dom Level 2. New features
included new elements, new attributes, full CSS4 support, video and audio, 2D/3D graphics,
local storage, local SQL database, and web applications. HTML5 is also cross-platform.
Figure 6. HTML5 is designed to be supported on PCs, tablets, and smartphones 16
5
SOFTWARE ARCHITECTURES
Famous system implementations Since every browser vendor provides HTML5 support and HTML5 has become the only truly
cross-platform application environment, there are billions of examples of HTML.
Open source blogging tools, such as WordPress, are an example of HTML implementations. In
conjunction with CSS and PHP, WordPress themes and posts use these languages to change the
aesthetics and functionality of a WordPress website.
In 2011, Facebook had two focuses - HTML5 and mobile. Facebook’s Chief Technology
Officer, Bret Taylor, saw the two focuses as very interrelated concepts. Taylor claimed
HTML5 as the future of mobile. Since it was ideal to keep Facebook consistent on desktop site
and on mobile, Facebook took after the HTML5 trend. There were even internal teams devoted
to creating HTML5 Facebook games! 5
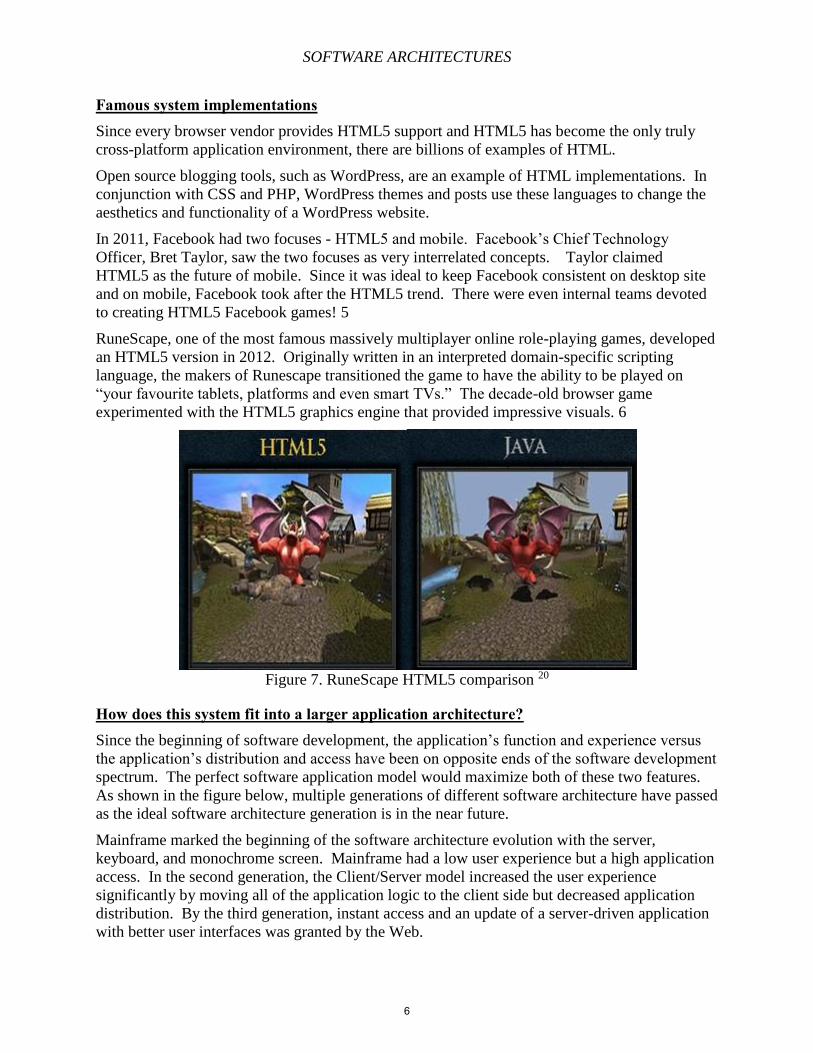
RuneScape, one of the most famous massively multiplayer online role-playing games, developed
an HTML5 version in 2012. Originally written in an interpreted domain-specific scripting
language, the makers of Runescape transitioned the game to have the ability to be played on
“your favourite tablets, platforms and even smart TVs.” The decade-old browser game
experimented with the HTML5 graphics engine that provided impressive visuals. 6
Figure 7. RuneScape HTML5 comparison 20
How does this system fit into a larger application architecture? Since the beginning of software development, the application’s function and experience versus
the application’s distribution and access have been on opposite ends of the software development
spectrum. The perfect software application model would maximize both of these two features.
As shown in the figure below, multiple generations of different software architecture have passed
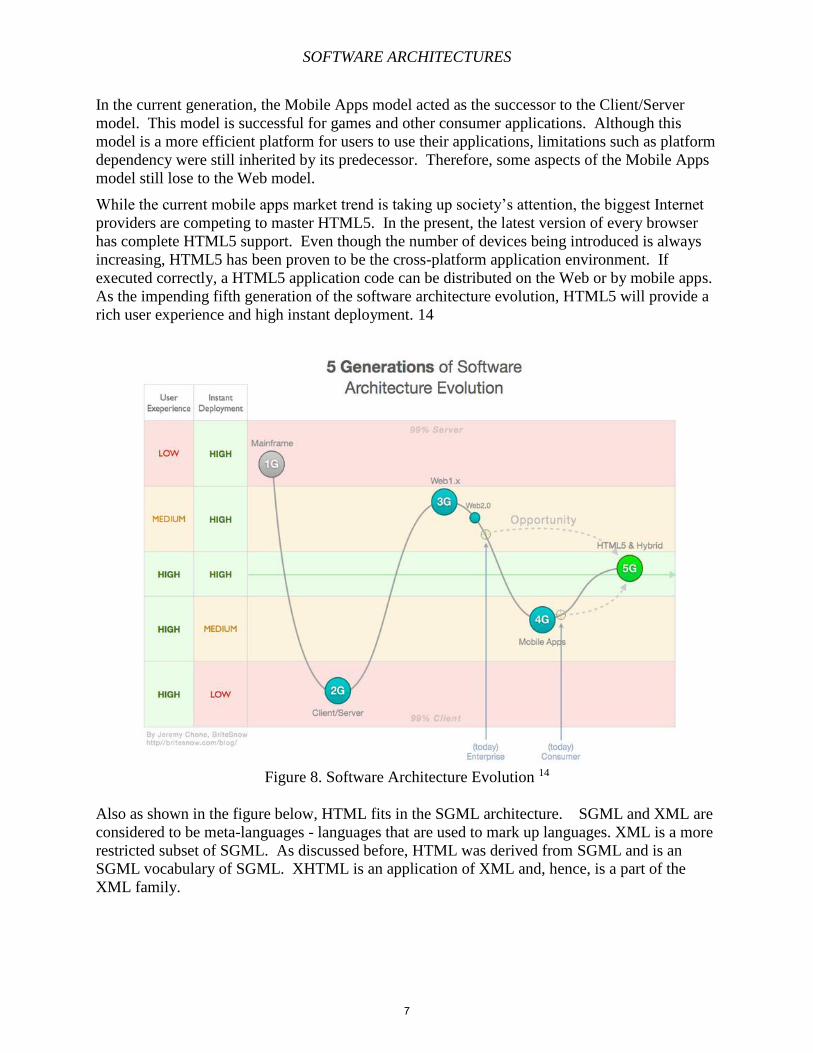
as the ideal software architecture generation is in the near future.
Mainframe marked the beginning of the software architecture evolution with the server,
keyboard, and monochrome screen. Mainframe had a low user experience but a high application
access. In the second generation, the Client/Server model increased the user experience
significantly by moving all of the application logic to the client side but decreased application
distribution. By the third generation, instant access and an update of a server-driven application
with better user interfaces was granted by the Web.
6
SOFTWARE ARCHITECTURES
In the current generation, the Mobile Apps model acted as the successor to the Client/Server
model. This model is successful for games and other consumer applications. Although this
model is a more efficient platform for users to use their applications, limitations such as platform
dependency were still inherited by its predecessor. Therefore, some aspects of the Mobile Apps
model still lose to the Web model.
While the current mobile apps market trend is taking up society’s attention, the biggest Internet
providers are competing to master HTML5. In the present, the latest version of every browser
has complete HTML5 support. Even though the number of devices being introduced is always
increasing, HTML5 has been proven to be the cross-platform application environment. If
executed correctly, a HTML5 application code can be distributed on the Web or by mobile apps.
As the impending fifth generation of the software architecture evolution, HTML5 will provide a
rich user experience and high instant deployment. 14
Figure 8. Software Architecture Evolution 14
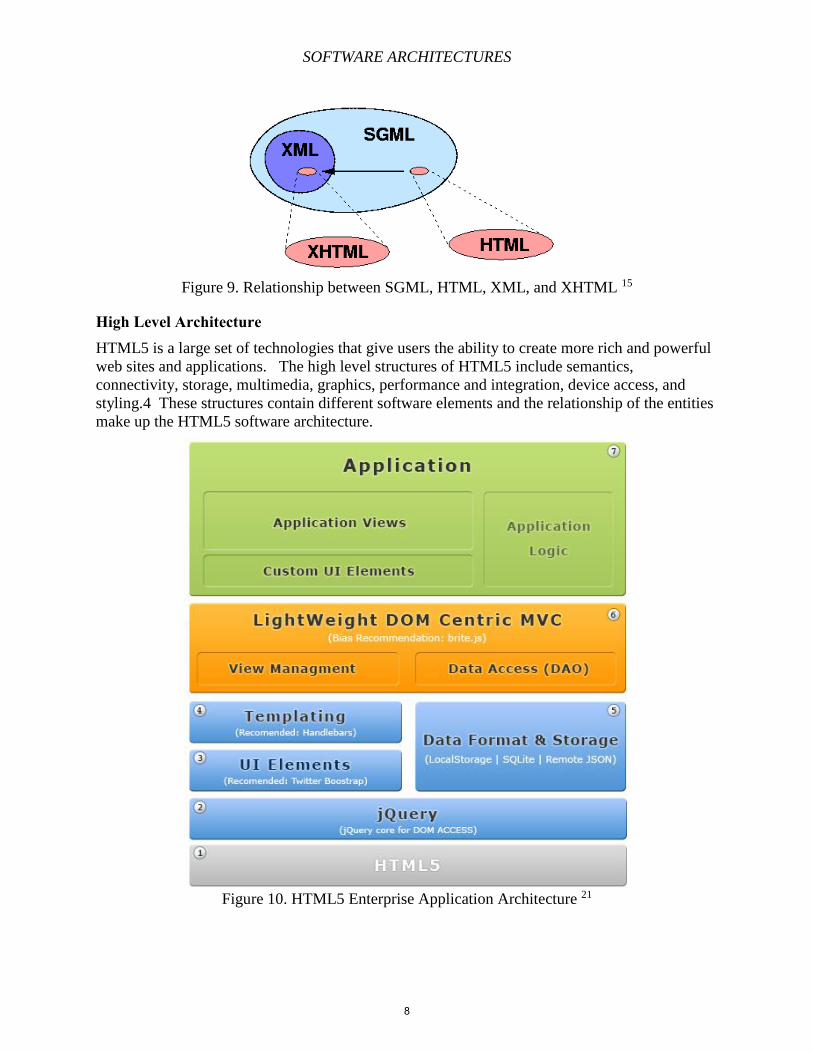
Also as shown in the figure below, HTML fits in the SGML architecture. SGML and XML are
considered to be meta-languages - languages that are used to mark up languages. XML is a more
restricted subset of SGML. As discussed before, HTML was derived from SGML and is an
SGML vocabulary of SGML. XHTML is an application of XML and, hence, is a part of the
XML family.
7
SOFTWARE ARCHITECTURES
Figure 9. Relationship between SGML, HTML, XML, and XHTML 15
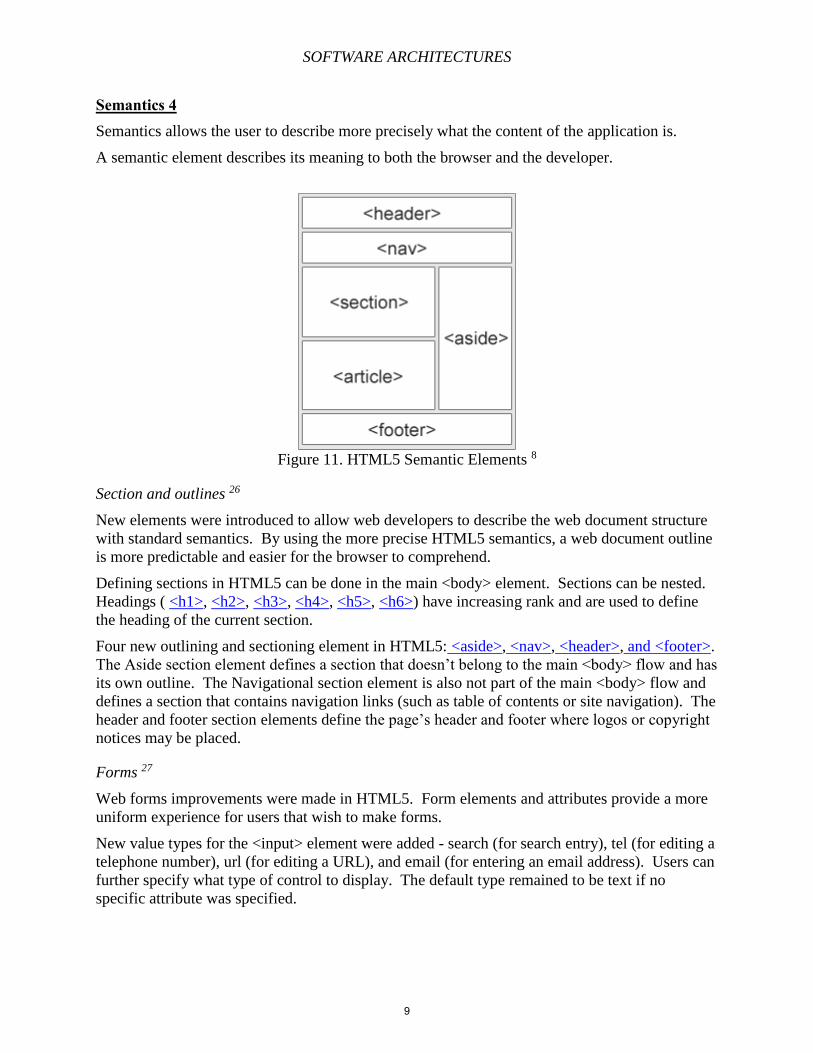
High Level Architecture HTML5 is a large set of technologies that give users the ability to create more rich and powerful
web sites and applications. The high level structures of HTML5 include semantics,
connectivity, storage, multimedia, graphics, performance and integration, device access, and
styling.4 These structures contain different software elements and the relationship of the entities
make up the HTML5 software architecture.
Figure 10. HTML5 Enterprise Application Architecture 21
8
SOFTWARE ARCHITECTURES
Semantics 4 Semantics allows the user to describe more precisely what the content of the application is.
A semantic element describes its meaning to both the browser and the developer.
Figure 11. HTML5 Semantic Elements 8
Section and outlines 26
New elements were introduced to allow web developers to describe the web document structure
with standard semantics. By using the more precise HTML5 semantics, a web document outline
is more predictable and easier for the browser to comprehend.
Defining sections in HTML5 can be done in the main <body> element. Sections can be nested.
Headings ( <h1>, <h2>, <h3>, <h4>, <h5>, <h6>) have increasing rank and are used to define
the heading of the current section.
Four new outlining and sectioning element in HTML5: <aside>, <nav>, <header>, and <footer>.
The Aside section element defines a section that doesn’t belong to the main <body> flow and has
its own outline. The Navigational section element is also not part of the main <body> flow and
defines a section that contains navigation links (such as table of contents or site navigation). The
header and footer section elements define the page’s header and footer where logos or copyright
notices may be placed.
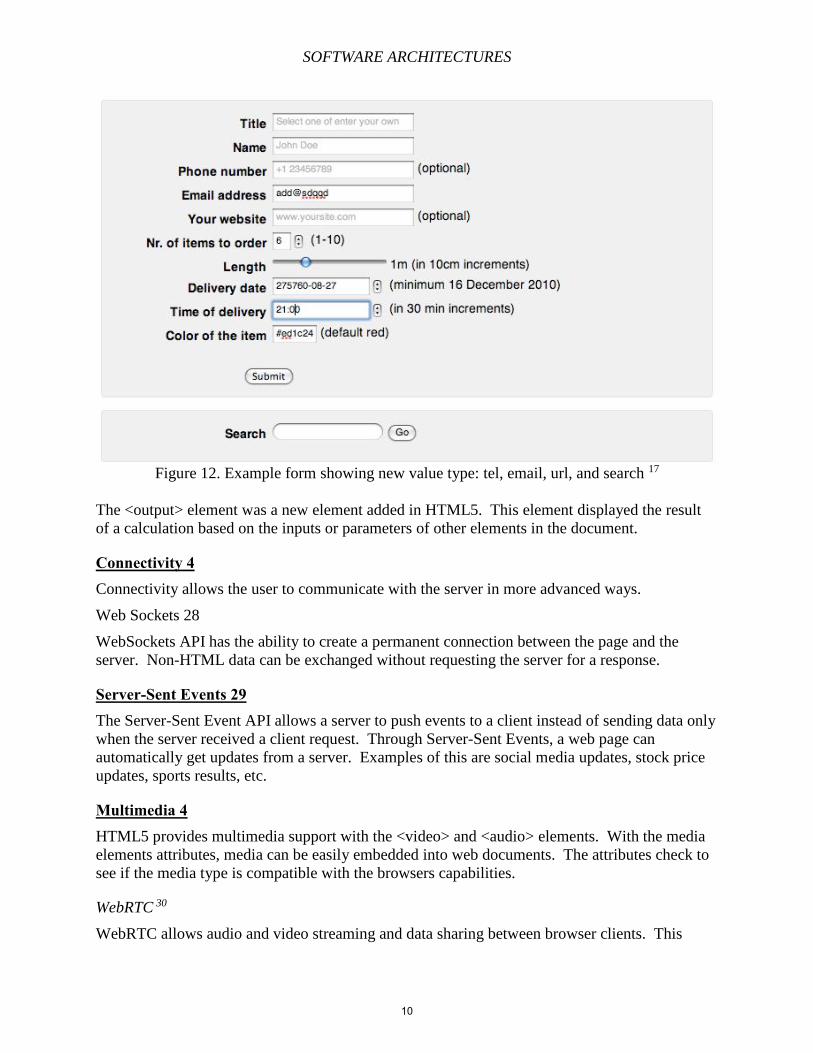
Forms 27
Web forms improvements were made in HTML5. Form elements and attributes provide a more
uniform experience for users that wish to make forms.
New value types for the <input> element were added - search (for search entry), tel (for editing a
telephone number), url (for editing a URL), and email (for entering an email address). Users can
further specify what type of control to display. The default type remained to be text if no
specific attribute was specified.
9
SOFTWARE ARCHITECTURES
Figure 12. Example form showing new value type: tel, email, url, and search 17
The <output> element was a new element added in HTML5. This element displayed the result
of a calculation based on the inputs or parameters of other elements in the document.
Connectivity 4 Connectivity allows the user to communicate with the server in more advanced ways.
Web Sockets 28
WebSockets API has the ability to create a permanent connection between the page and the
server. Non-HTML data can be exchanged without requesting the server for a response.
Server-Sent Events 29 The Server-Sent Event API allows a server to push events to a client instead of sending data only
when the server received a client request. Through Server-Sent Events, a web page can
automatically get updates from a server. Examples of this are social media updates, stock price
updates, sports results, etc.
Multimedia 4 HTML5 provides multimedia support with the <video> and <audio> elements. With the media
elements attributes, media can be easily embedded into web documents. The attributes check to
see if the media type is compatible with the browsers capabilities.
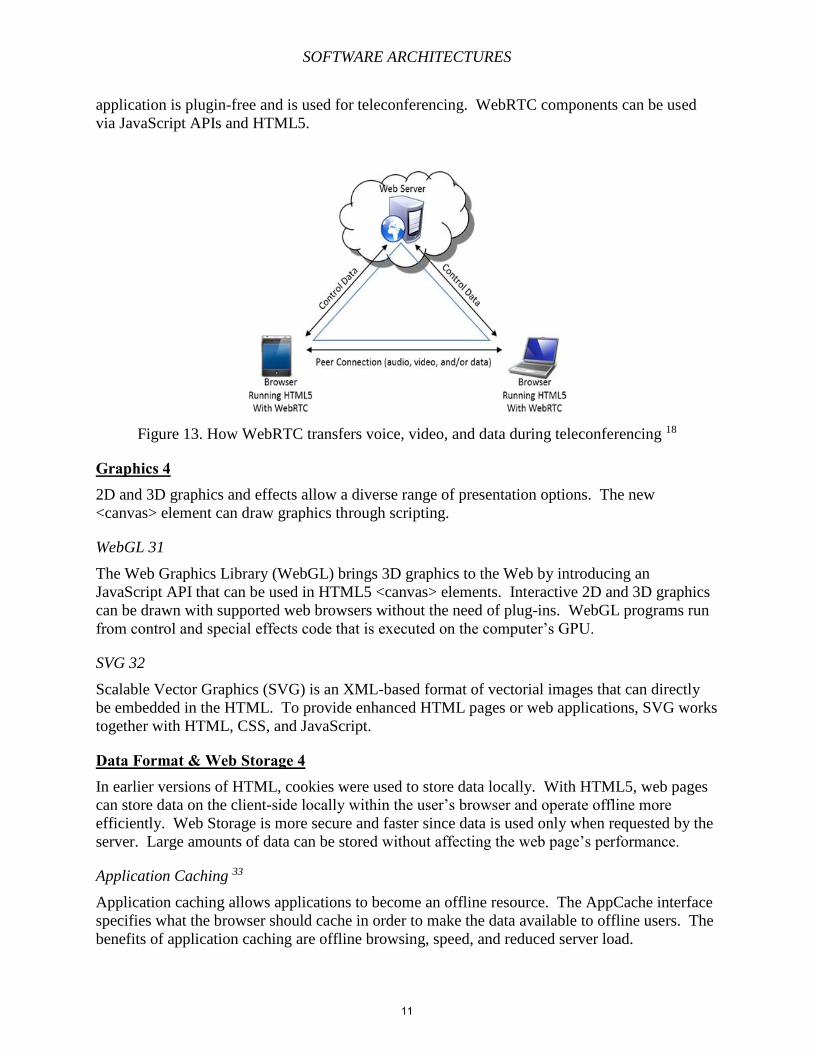
WebRTC 30
WebRTC allows audio and video streaming and data sharing between browser clients. This
10
SOFTWARE ARCHITECTURES
application is plugin-free and is used for teleconferencing. WebRTC components can be used
via JavaScript APIs and HTML5.
Figure 13. How WebRTC transfers voice, video, and data during teleconferencing 18
Graphics 4 2D and 3D graphics and effects allow a diverse range of presentation options. The new
<canvas> element can draw graphics through scripting.
WebGL 31
The Web Graphics Library (WebGL) brings 3D graphics to the Web by introducing an
JavaScript API that can be used in HTML5 <canvas> elements. Interactive 2D and 3D graphics
can be drawn with supported web browsers without the need of plug-ins. WebGL programs run
from control and special effects code that is executed on the computer’s GPU.
SVG 32
Scalable Vector Graphics (SVG) is an XML-based format of vectorial images that can directly
be embedded in the HTML. To provide enhanced HTML pages or web applications, SVG works
together with HTML, CSS, and JavaScript.
Data Format & Web Storage 4 In earlier versions of HTML, cookies were used to store data locally. With HTML5, web pages
can store data on the client-side locally within the user’s browser and operate offline more
efficiently. Web Storage is more secure and faster since data is used only when requested by the
server. Large amounts of data can be stored without affecting the web page’s performance.
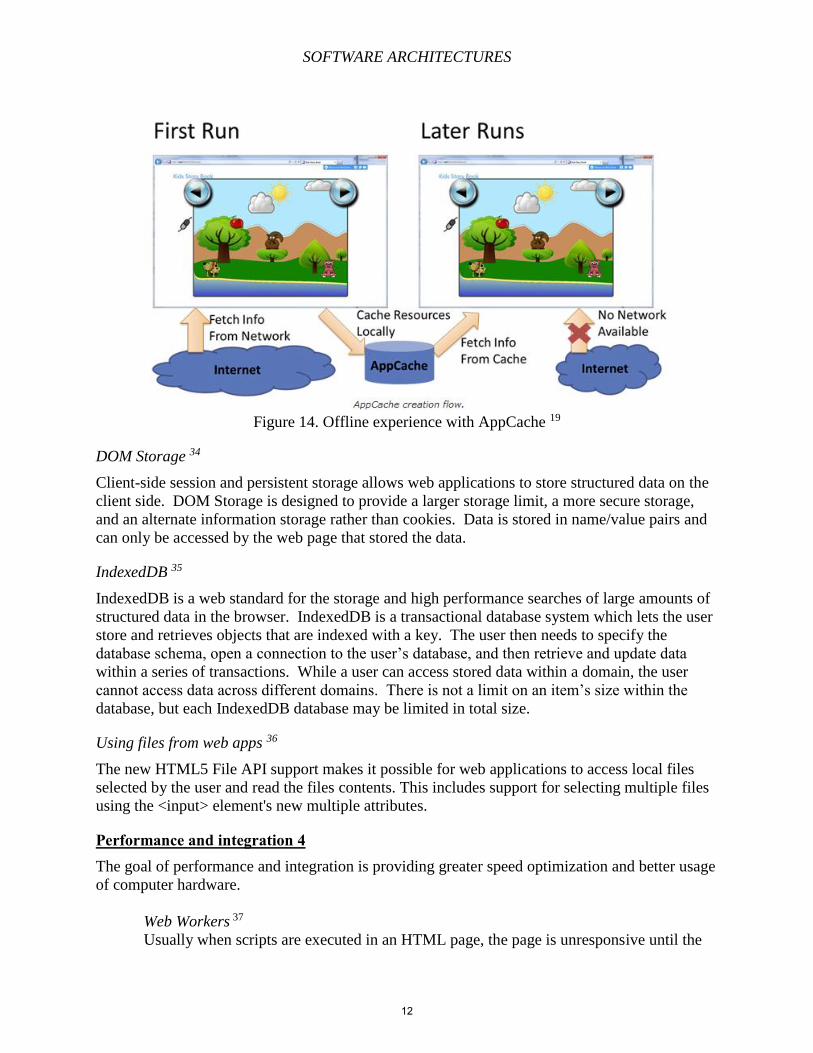
Application Caching 33
Application caching allows applications to become an offline resource. The AppCache interface
specifies what the browser should cache in order to make the data available to offline users. The
benefits of application caching are offline browsing, speed, and reduced server load.
11
SOFTWARE ARCHITECTURES
Figure 14. Offline experience with AppCache 19
DOM Storage 34
Client-side session and persistent storage allows web applications to store structured data on the
client side. DOM Storage is designed to provide a larger storage limit, a more secure storage,
and an alternate information storage rather than cookies. Data is stored in name/value pairs and
can only be accessed by the web page that stored the data.
IndexedDB 35
IndexedDB is a web standard for the storage and high performance searches of large amounts of
structured data in the browser. IndexedDB is a transactional database system which lets the user
store and retrieves objects that are indexed with a key. The user then needs to specify the
database schema, open a connection to the user’s database, and then retrieve and update data
within a series of transactions. While a user can access stored data within a domain, the user
cannot access data across different domains. There is not a limit on an item’s size within the
database, but each IndexedDB database may be limited in total size.
Using files from web apps 36
The new HTML5 File API support makes it possible for web applications to access local files
selected by the user and read the files contents. This includes support for selecting multiple files
using the <input> element's new multiple attributes.
Performance and integration 4 The goal of performance and integration is providing greater speed optimization and better usage
of computer hardware.
Web Workers 37
Usually when scripts are executed in an HTML page, the page is unresponsive until the
12
SOFTWARE ARCHITECTURES
script is done. With web workers, the performance of the page is not affected. Web
workers are JavaScript evaluations to background threads and runs independently of
other scripts. Web workers actually prevent the threads from slowing down interactive
events.
Device Access 4 Device access allows for the usage of various input and output hardware devices through device
APIs. A common example of this is the Camera API. After the user activates the <input>
element with type = “file” and chooses the device camera, this allows the device’s camera to take
and upload pictures to the current web page.
Geolocation 38
The Geolocation API lets browsers locate the position of the user using their provided location.
To ensure privacy, users are asked for permission before reporting their location information.
Touch Events 39
Touch events are handlers to react to events created by a user pressing touch screens or
trackpads. A surface is considered a touch-sensitive surface. A touch point is a point of contact
with the surface. Touch events have several interfaces from Touch (a single point of contact),
TouchEvent (an event when the state of touches on the surface changes), TouchList (a group of
touches), and DocumentTouch (contains methods for creating Touch and TouchList objects).
Styling (Templating) 4 Styling allows authors to create more sophisticated themes. CSS has been improved to be able to
style more complex elements. With HTML5, CSS has new background styling features, more
fancy borders, animations, and new presentational layouts.
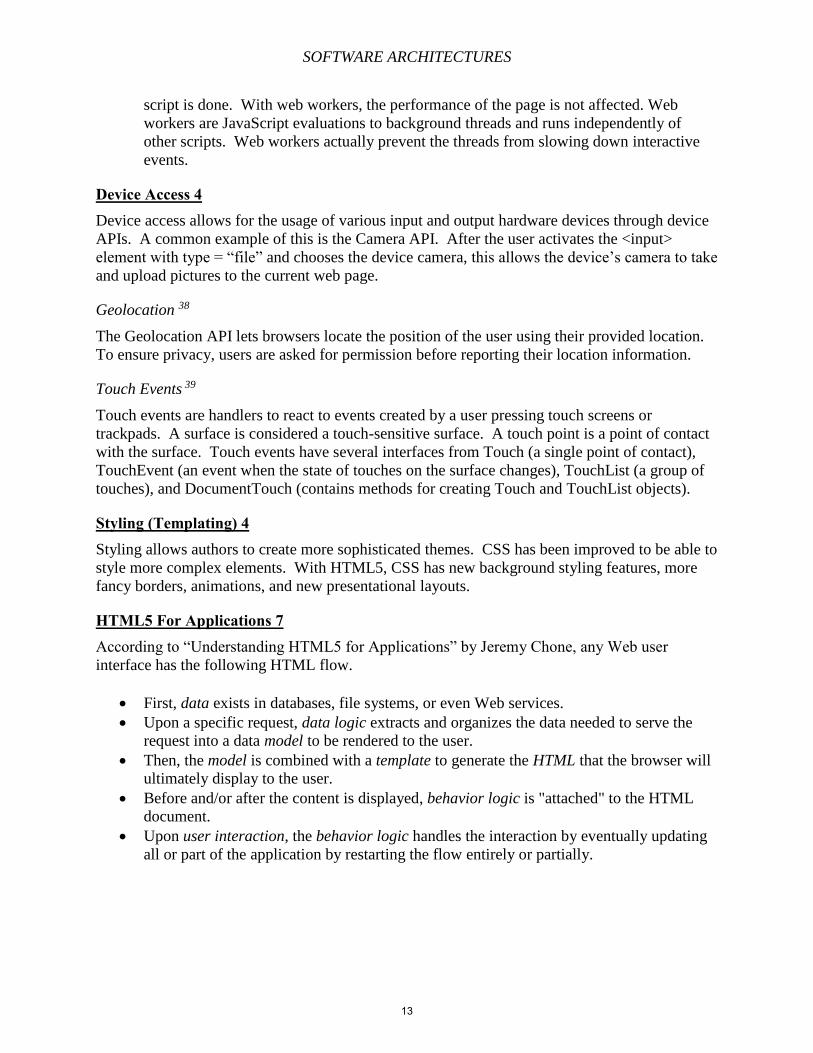
HTML5 For Applications 7 According to “Understanding HTML5 for Applications” by Jeremy Chone, any Web user
interface has the following HTML flow.
First, data exists in databases, file systems, or even Web services.
Upon a specific request, data logic extracts and organizes the data needed to serve the
request into a data model to be rendered to the user.
Then, the model is combined with a template to generate the HTML that the browser will
ultimately display to the user.
Before and/or after the content is displayed, behavior logic is "attached" to the HTML
document.
Upon user interaction, the behavior logic handles the interaction by eventually updating
all or part of the application by restarting the flow entirely or partially.
13
SOFTWARE ARCHITECTURES
Figure 15. HTML Application Flow Chart 7
HTML5 capability to interact with the client versus the server has evolutionized since the Web
model. Although using client and server produces the best results, it is now possible to create
full applications with the DOM without a server if needed.
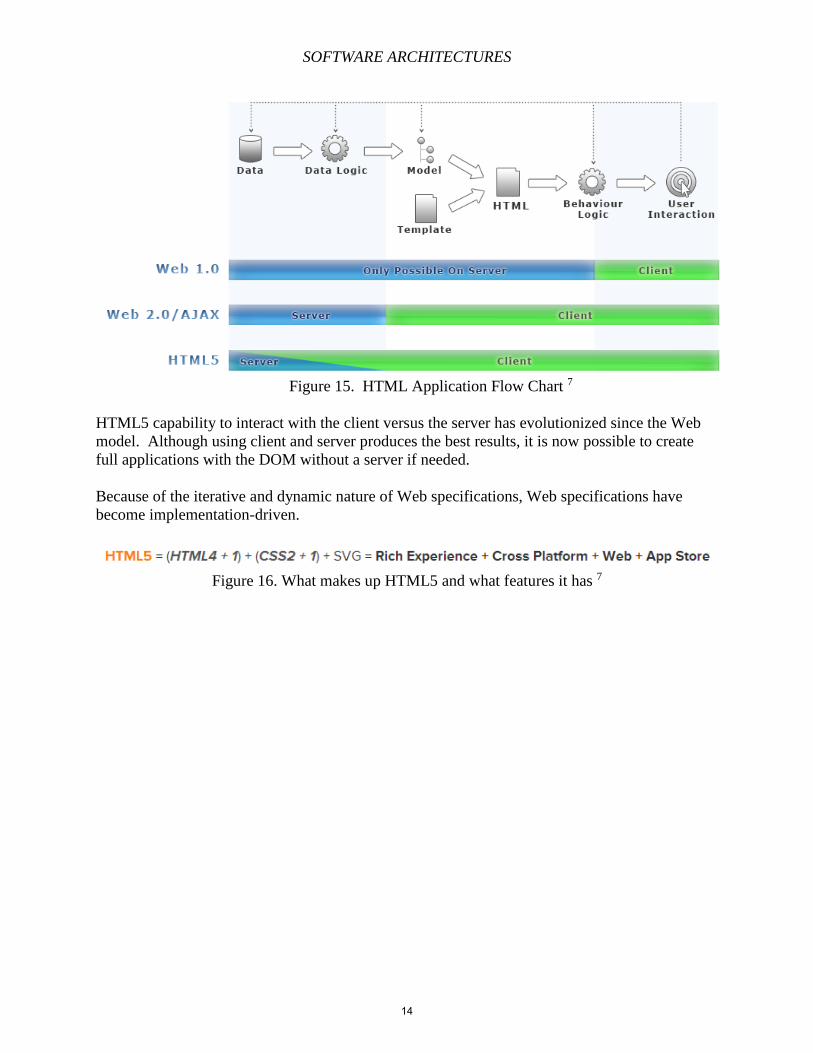
Because of the iterative and dynamic nature of Web specifications, Web specifications have
become implementation-driven.
Figure 16. What makes up HTML5 and what features it has 7
14
SOFTWARE ARCHITECTURES
References
[1] http://www.w3schools.com/html/html5_intro.asp
[2] http://www.w3.org/History/1989/proposal.html
[3] https://tools.ietf.org/html/rfc1866
[4] https://developer.mozilla.org/en-US/docs/Web/Guide/HTML/HTML5
[5] http://techcrunch.com/2011/01/27/facebook-bret-taylor/
[6] http://www.eurogamer.net/articles/2012-08-30-mmo-runescape-being-developed-for-tablets-
smart-tvs-and-other-platforms
[7] http://britesnow.com/blog/understanding-html5-for-applications
[8] http://www.w3schools.com/html/img_sem_elements.gif
[9] http://www.w3.org/History/1989/proposal-msw.html
[10] http://en.wikipedia.org/wiki/File:OED-LEXX-Bungler.jpg
[11] http://www.irt.org/articles/js148/723x387xmodule.gif.pagespeed.ic.YO23tRb60b.png
[12] http://www.radford.edu/~rstepno/coms326/picoclip400w.png
[13] http://www.w3.org/MarkUp/html-spec/html-spec.txt
[14] http://britesnow.com/blog/software-architecture-evolution-mobile-apps-to-html5
[15] http://www.uni-potsdam.de/u/zeik/kurse/HTML-Tutorial/beziehungen.htm
[16] http://canvaskite.com/wp-content/uploads/2014/02/crossp-platform-mobile-app-
development-company1.png
[17] http://developersmix.files.wordpress.com/2011/08/html5-form.jpg
[18] http://twimgs.com/nojitter/ehk/13may/Kelly_webrtc_F1.png
[19] http://vincenthomedev.files.wordpress.com/2011/12/image1.png
[20] http://www.dpsvip.com/images/news/picture%20comparison.jpg
[21] http://britesnow.com/html5/html5-application-architecture
[22] http://www.w3.org/MarkUp/html3/CoverPage
[23] http://www.w3.org/TR/REC-html32
[24] http://www.w3.org/TR/REC-html40-971218/
[25] http://www.w3.org/TR/html401/
[26] https://developer.mozilla.org/en-
US/docs/Web/Guide/HTML/Sections_and_Outlines_of_an_HTML5_document
[27] https://developer.mozilla.org/en-US/docs/Web/Guide/HTML/Forms_in_HTML
[28] https://developer.mozilla.org/en-US/docs/WebSockets
[29] https://developer.mozilla.org/en-US/docs/Server-sent_events/Using_server-sent_events
[30] https://developer.mozilla.org/en-US/docs/WebRTC
[31] https://developer.mozilla.org/en-US/docs/Web/WebGL
[32] https://developer.mozilla.org/en-US/docs/Web/SVG
[33] https://developer.mozilla.org/en-US/docs/HTML/Using_the_application_cache
[34] https://developer.mozilla.org/en-US/docs/DOM/Storage
[35] https://developer.mozilla.org/en-US/docs/IndexedDB
[36] https://developer.mozilla.org/en-US/docs/Using_files_from_web_applications
[37] https://developer.mozilla.org/en-US/docs/DOM/Using_web_workers
[38] https://developer.mozilla.org/en-US/docs/Using_geolocation
[39] https://developer.mozilla.org/en-US/docs/DOM/Touch_events
15
SOFTWARE ARCHITECTURES
Chapter 2 – XML, XML Schema, XSLT, and XPath
Ryan McAlister
Summary XML stands for Extensible Markup Language, meaning it uses tags to denote data much
like HTML. Unlike HTML though it was designed to carry data, not to display it. XML is used
to structure, store and transport data. Some of the extensions for XML help with this. The three
we are going to look at are XML Schema, XSLT and XPath. XML Schema gives us a way to
validate if a XML document follows a specific structure. XSLT gives us a way to convert XML
documents into different formats. XPath gives us a way to extract data from XML documents in
an easy format.
Introduction XML and the standard extensions give us a way to design documents in a way that helps
us work with data. Usually XML is used in conjunction with HTML. XML keeps all the data in a
separate file that an HTML document can read and display. This is helpful if you need to display
data that is constantly changing. Without XML we would have to edit the HTML every time the
data changed. With XML we just keep the data in a separate file then have the HTML read it
from there keeping it updated.
XML Schema is used to describe the structure of XML documents. We do this by
describing what elements and attributes can appear in the document. Elements are used to give a
name and a type to describe and define the data contained in that instance. These are much like
variables in programming languages. Attributes allow us to describe an element even further.
Once we build our schema, we can then use it to validate XML documents, making sure they are
in the format we want.
XPath gives us a way to traverse XML documents and pull certain pieces of data out of
the document. It works by taking an expression and returning the data that matches the location
or locations described by the expression. We can then use this information in many different
ways.
XSLT allows us to transform our XML documents into other XML documents, HTML or
XHTML. This works by creating a XSL Style Sheet which we will use to describe how to
transform the different elements in the XML document. Then, we link the XSL Style Sheet with
a XML Document. It will then transform the data and give us a new document and leave the old
document unchanged. This is especially helpful if we wanted to only transform some of the data
into one document, and then transform the part we did not use into another document.
XML - Extensible Markup Language XML is an application of SGML (Standard Generalized Markup Language), a powerful
markup language specified in the mid-1980s. XML was developed in 1996 and became a W3C
Recommendation in 1998. W3C is the World Wide Web Consortium, the main standards
organization of the Web.
16
SOFTWARE ARCHITECTURES
XML documents are used in a variety of ways, but their main usage is to store and
structure data to be used by other formats. XML draws many comparisons to HTML, because
they are both markup languages, but they are used for different things and are generally used in
conjunction with each other. XML is built to store data in an efficient way, not to display data.
HTML is used to display data, but it is not adept at storing data. Usually XML is used to store
the data and HTML pulls the data out of the XML file and displays it. This is helpful because the
data in the XML document can change and the HTML file does not need to be adjusted.
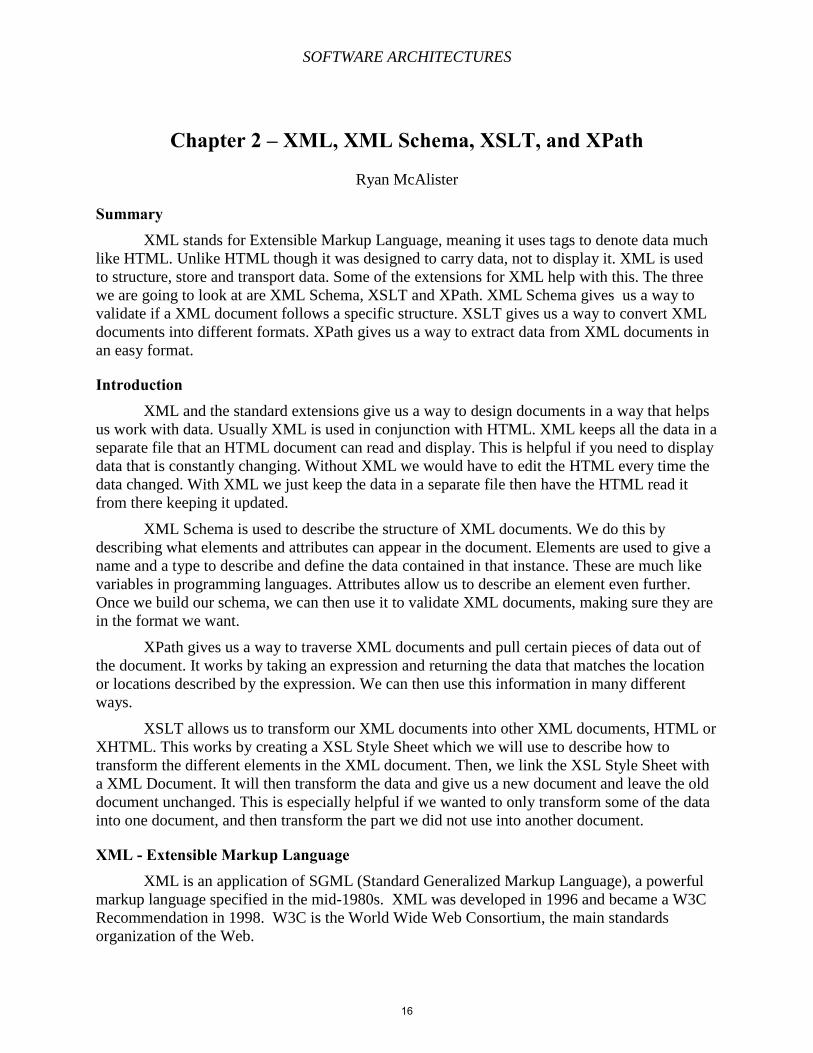
XML Basics If we look at the XML document in
Figure 1.1 to the right, the first thing we will
notice is that it looks very similar to HTML.
This is because they are both markup languages
and both use tags to describe the data present.
There are a few key differences that we will
discuss that makes XML different from HTML.
The main difference we will look at is that XML
allows the use of user defined tags, whereas
HTML only allows for the user to use
predefined tags.
The usage of user defined tags allows us to describe the data in any way see fit. This also
allows the data to become not just machine readable, but also easily read by humans. Let us take
a closer look at what this example.
The first line is the XML declaration. It defines what XML version we are using‒in this
case version 1.0. The next line describes the root element of the document. Here we are saying it
is a note. The next 3 lines are the child elements of the root element, which we use describe the
contents of the note. The final line defines the end of the root element. This just says that our
note is finished.
As you can see this makes it very easy for humans to read, because all the tags are
descriptive enough to describe what is contained within them. Looking at this we can easily
discern that this is a note, to a student, from a teacher, telling the student that there is a test next
Tuesday. Through the use of tags, a machine can also be able to describe it in a way that is
useful. For example, if we only needed the body of the note, a machine could easily look in the
note root element for the <body> child element and return what is inside that element.
Figure 1.1: An Example of a XML Document
17
SOFTWARE ARCHITECTURES
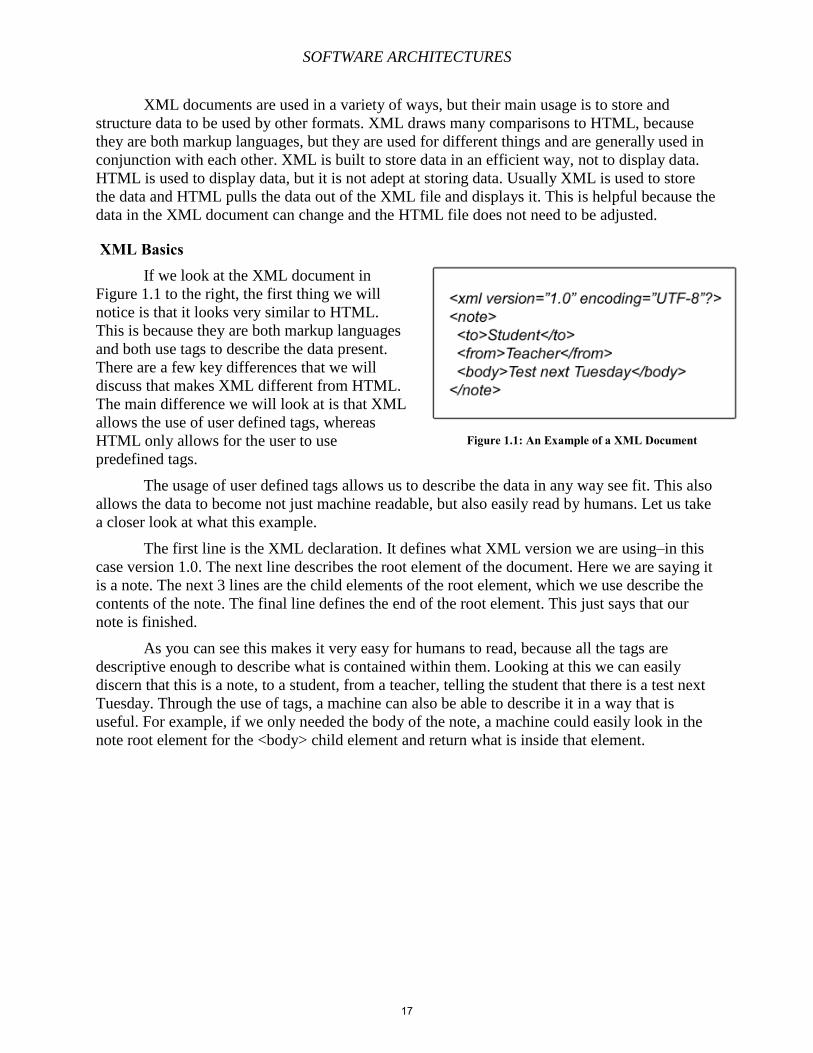
Figure 1.2: Another example XML Document XML is not just for small datasets, we can apply the same principles we used for the note
and create much larger datasets. For example, what if we wanted to create an XML document
detailing all the computers in an computer lab. Say we wanted to know the computer's name,
whether it is a Mac or PC, and the date it was purchased. Our root element would be
<computerlab>, and it would be populated by child elements of <computer>. Figure 1.2 shows
how this XML document would be formatted. In the example, we only list 3 computers, but we
could continue to add <computer> elements for every computer in a large computer lab.
The things to take away from this are relatively simple. Firstly, XML is a markup
language, much like HTML, used to store data as opposed to displaying it. Secondly, that it
allows for user defined tags that can be much more descriptive and easier to read. Lastly, that it
is not just for small datasets but very large ones as well.
XML Schema There are many Schemas out the for XML, but for the purpose of this text we will be
describing the first one recommended by the W3C. XML Schema is a way for us to define how
to build an XML document. We do this by describing what elements should be present, where in
the document they are located, and what attributes they have. From there, we can build a
document to the specifications laid out in our schema. We can also test a document against our
schema to determine if it is a valid match or not.
18
SOFTWARE ARCHITECTURES
The syntax of XML Schema
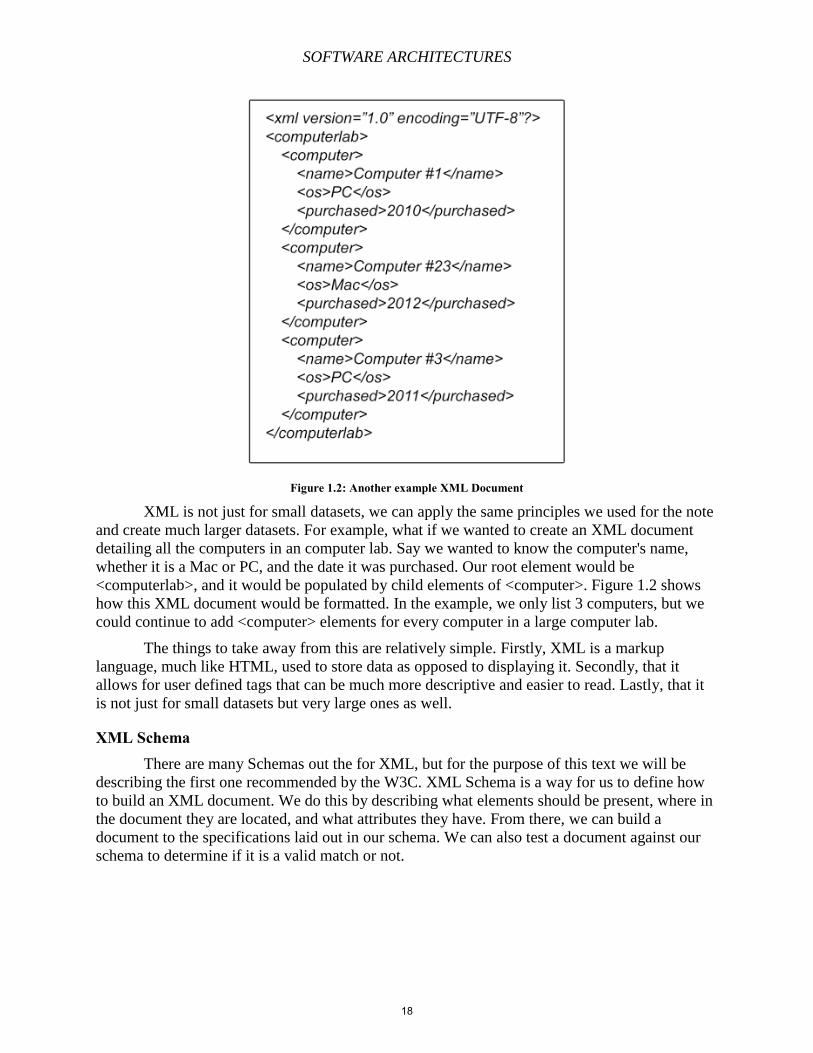
Figure 1.3: Example of XML Schema Before we look at how to use an XML Schema, we need to first view the different pieces
of the schema. If we take a look at Figure 1.3, we can see a XML Schema for our example from
Figure 1.1. Looking at the first line we see a definition for a element called note with no type
specified. There is no type specified in the element definition because the next line defines the
note element as a complex type. A complex type is
mainly used when an element will contain other
elements. The next line is <xs.sequence> this simply
means that the child elements follow this line must
appear in the order that is in the schema. There is also
<xs.all> and <xs.choice> that could be placed here
instead. <xs.all> means that all the elements must be
present, but in no particular order. <xs.choice> means
that either one element or another can occur. The next
3 lines are definitions for the child elements. These are
simple elements that only have a name and a type. The
most common types are listed in Figure 1.4. Then, we
just close out the tags for the remaining open tags.
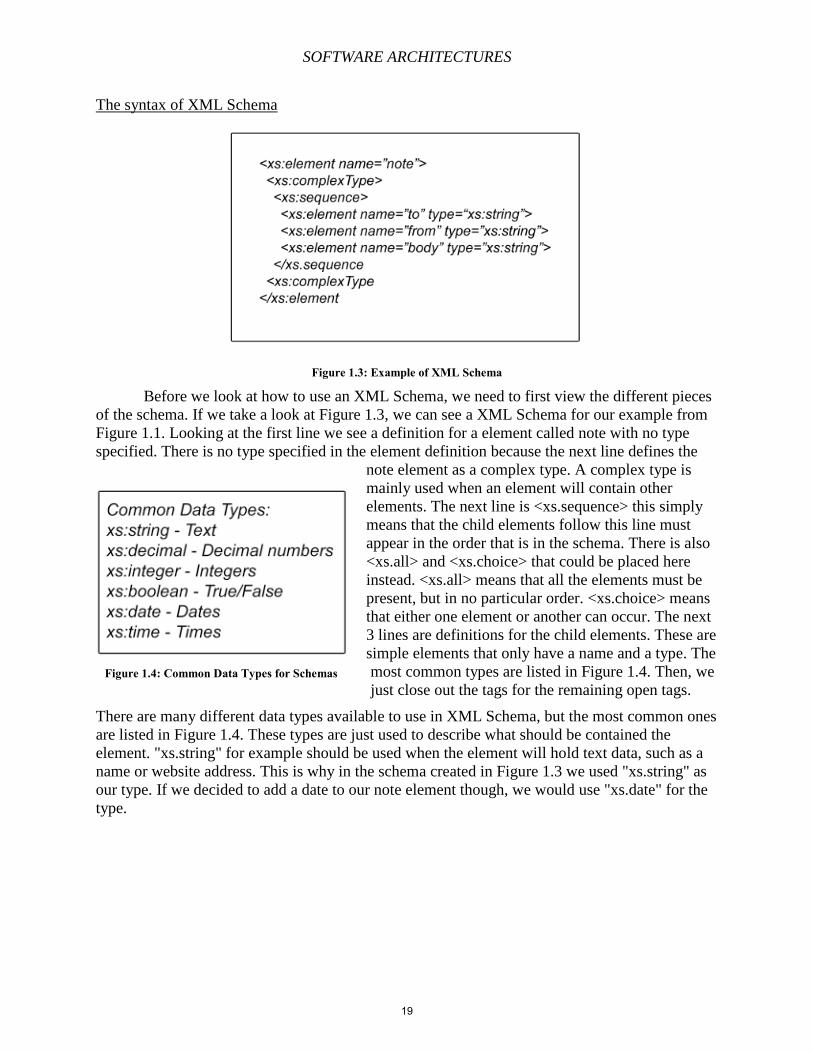
There are many different data types available to use in XML Schema, but the most common ones
are listed in Figure 1.4. These types are just used to describe what should be contained the
element. "xs.string" for example should be used when the element will hold text data, such as a
name or website address. This is why in the schema created in Figure 1.3 we used "xs.string" as
our type. If we decided to add a date to our note element though, we would use "xs.date" for the
type.
Figure 1.4: Common Data Types for Schemas
19
SOFTWARE ARCHITECTURES
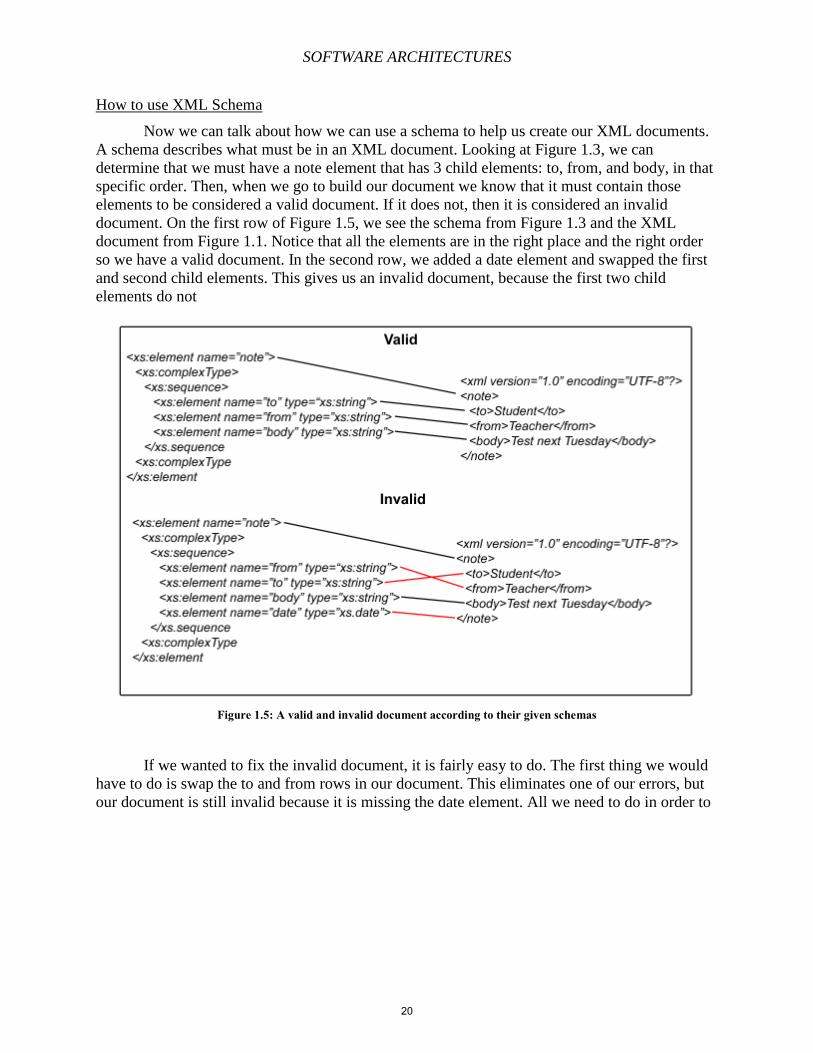
How to use XML Schema
Now we can talk about how we can use a schema to help us create our XML documents.
A schema describes what must be in an XML document. Looking at Figure 1.3, we can
determine that we must have a note element that has 3 child elements: to, from, and body, in that
specific order. Then, when we go to build our document we know that it must contain those
elements to be considered a valid document. If it does not, then it is considered an invalid
document. On the first row of Figure 1.5, we see the schema from Figure 1.3 and the XML
document from Figure 1.1. Notice that all the elements are in the right place and the right order
so we have a valid document. In the second row, we added a date element and swapped the first
and second child elements. This gives us an invalid document, because the first two child
elements do not
If we wanted to fix the invalid document, it is fairly easy to do. The first thing we would
have to do is swap the to and from rows in our document. This eliminates one of our errors, but
our document is still invalid because it is missing the date element. All we need to do in order to
Figure 1.5: A valid and invalid document according to their given schemas
20
SOFTWARE ARCHITECTURES
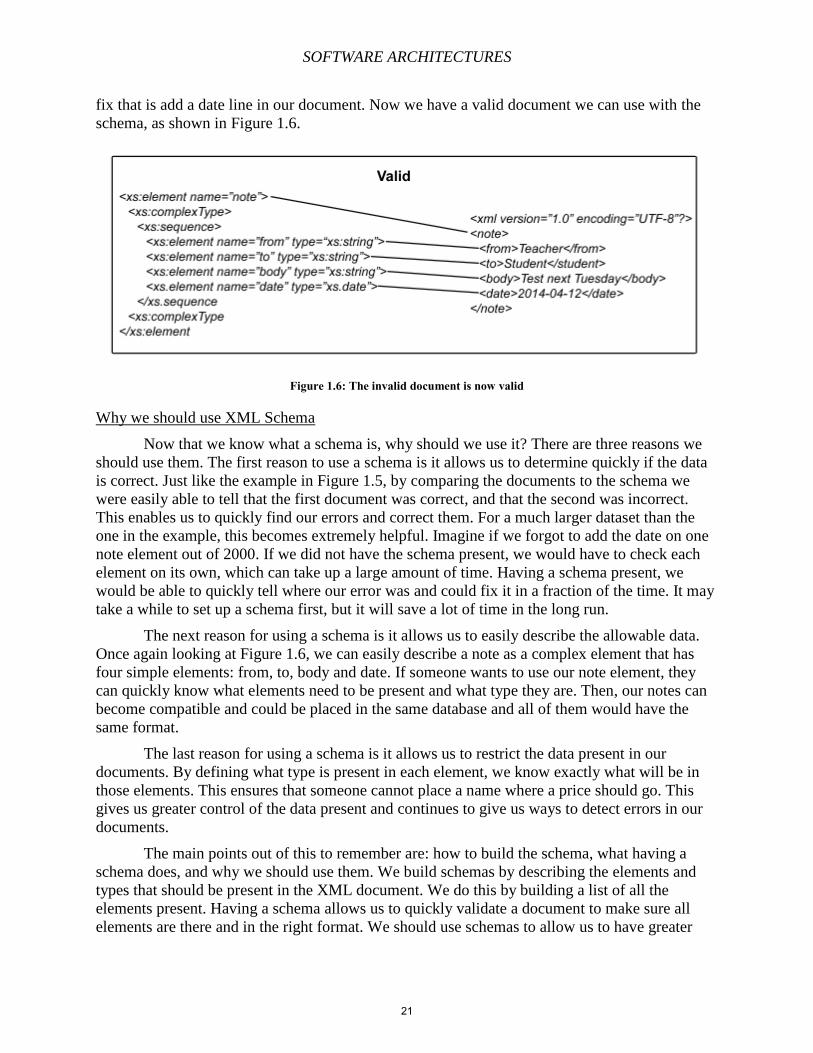
fix that is add a date line in our document. Now we have a valid document we can use with the
schema, as shown in Figure 1.6.
Figure 1.6: The invalid document is now valid
Why we should use XML Schema
Now that we know what a schema is, why should we use it? There are three reasons we
should use them. The first reason to use a schema is it allows us to determine quickly if the data
is correct. Just like the example in Figure 1.5, by comparing the documents to the schema we
were easily able to tell that the first document was correct, and that the second was incorrect.
This enables us to quickly find our errors and correct them. For a much larger dataset than the
one in the example, this becomes extremely helpful. Imagine if we forgot to add the date on one
note element out of 2000. If we did not have the schema present, we would have to check each
element on its own, which can take up a large amount of time. Having a schema present, we
would be able to quickly tell where our error was and could fix it in a fraction of the time. It may
take a while to set up a schema first, but it will save a lot of time in the long run.
The next reason for using a schema is it allows us to easily describe the allowable data.
Once again looking at Figure 1.6, we can easily describe a note as a complex element that has
four simple elements: from, to, body and date. If someone wants to use our note element, they
can quickly know what elements need to be present and what type they are. Then, our notes can
become compatible and could be placed in the same database and all of them would have the
same format.
The last reason for using a schema is it allows us to restrict the data present in our
documents. By defining what type is present in each element, we know exactly what will be in
those elements. This ensures that someone cannot place a name where a price should go. This
gives us greater control of the data present and continues to give us ways to detect errors in our
documents.
The main points out of this to remember are: how to build the schema, what having a
schema does, and why we should use them. We build schemas by describing the elements and
types that should be present in the XML document. We do this by building a list of all the
elements present. Having a schema allows us to quickly validate a document to make sure all
elements are there and in the right format. We should use schemas to allow us to have greater
21
SOFTWARE ARCHITECTURES
control over our data and to keep it in a format that is easily read and understood by both
machine and humans.
XPath XPath is the language we use to find information in XML documents. It uses expressions
to select a node, or multiple nodes, based on a given criteria. Nodes and elements are
synonymous within an XML document. This works by comparing the criteria given in the XPath
against the elements, and for all matches it returns them, all others are ignored. This becomes
useful for selecting given elements when using XSLT to create new documents from data
contained in a separate document.
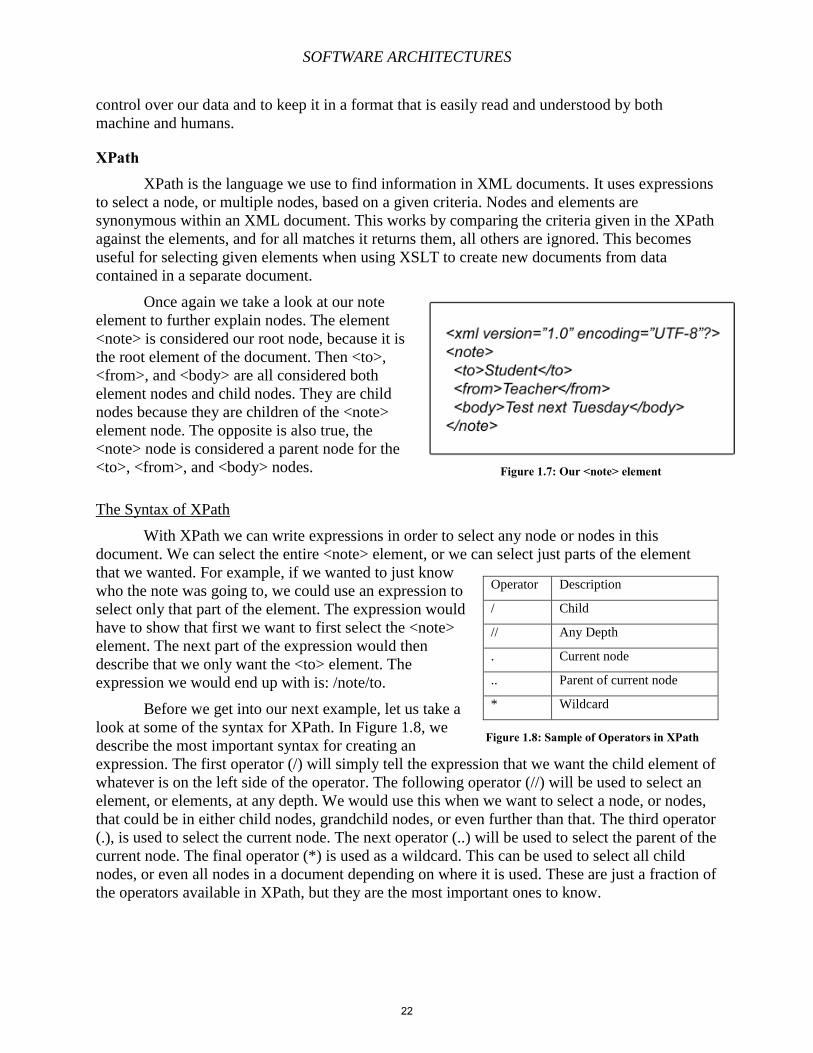
Once again we take a look at our note
element to further explain nodes. The element
<note> is considered our root node, because it is
the root element of the document. Then <to>,
<from>, and <body> are all considered both
element nodes and child nodes. They are child
nodes because they are children of the <note>
element node. The opposite is also true, the
<note> node is considered a parent node for the
<to>, <from>, and <body> nodes.
The Syntax of XPath
With XPath we can write expressions in order to select any node or nodes in this
document. We can select the entire <note> element, or we can select just parts of the element
that we wanted. For example, if we wanted to just know
who the note was going to, we could use an expression to
select only that part of the element. The expression would
have to show that first we want to first select the <note>
element. The next part of the expression would then
describe that we only want the <to> element. The
expression we would end up with is: /note/to.
Before we get into our next example, let us take a
look at some of the syntax for XPath. In Figure 1.8, we
describe the most important syntax for creating an
expression. The first operator (/) will simply tell the expression that we want the child element of
whatever is on the left side of the operator. The following operator (//) will be used to select an
element, or elements, at any depth. We would use this when we want to select a node, or nodes,
that could be in either child nodes, grandchild nodes, or even further than that. The third operator
(.), is used to select the current node. The next operator (..) will be used to select the parent of the
current node. The final operator (*) is used as a wildcard. This can be used to select all child
nodes, or even all nodes in a document depending on where it is used. These are just a fraction of
the operators available in XPath, but they are the most important ones to know.
Operator Description
/ Child
// Any Depth
. Current node
.. Parent of current node
* Wildcard
Figure 1.8: Sample of Operators in XPath
Figure 1.7: Our <note> element
22
SOFTWARE ARCHITECTURES
Now we have the basics of syntax and what
a node is, we will look at a more complex example.
For this, we are going to use the computer lab
element we used earlier in the chapter. The
<computerlab> element is our root element. Our
root element then has three child elements that are
each a <computer> element. Then each of the
<computer> elements has three more simple
elements: <name>, <os>, and <purchased>. In the
next section, we will go over some more complex
expressions and how they work.
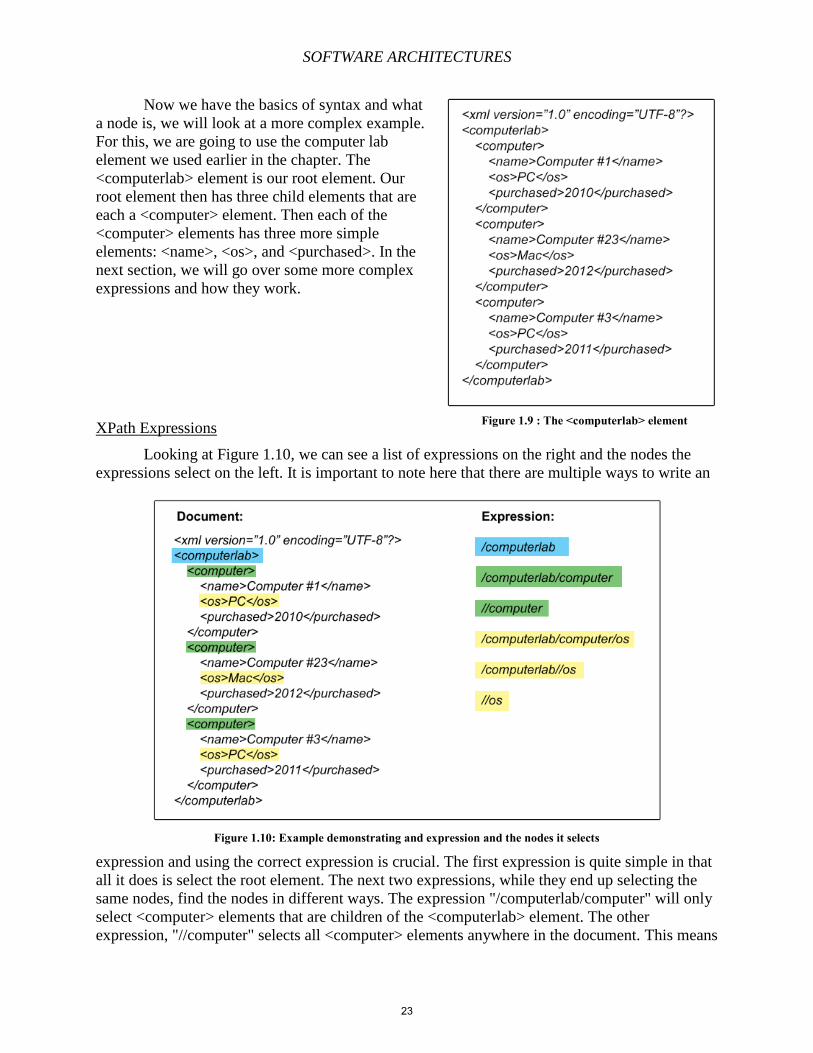
XPath Expressions
Looking at Figure 1.10, we can see a list of expressions on the right and the nodes the
expressions select on the left. It is important to note here that there are multiple ways to write an
expression and using the correct expression is crucial. The first expression is quite simple in that
all it does is select the root element. The next two expressions, while they end up selecting the
same nodes, find the nodes in different ways. The expression "/computerlab/computer" will only
select <computer> elements that are children of the <computerlab> element. The other
expression, "//computer" selects all <computer> elements anywhere in the document. This means
Figure 1.9 : The <computerlab> element
Figure 1.10: Example demonstrating and expression and the nodes it selects
23
SOFTWARE ARCHITECTURES
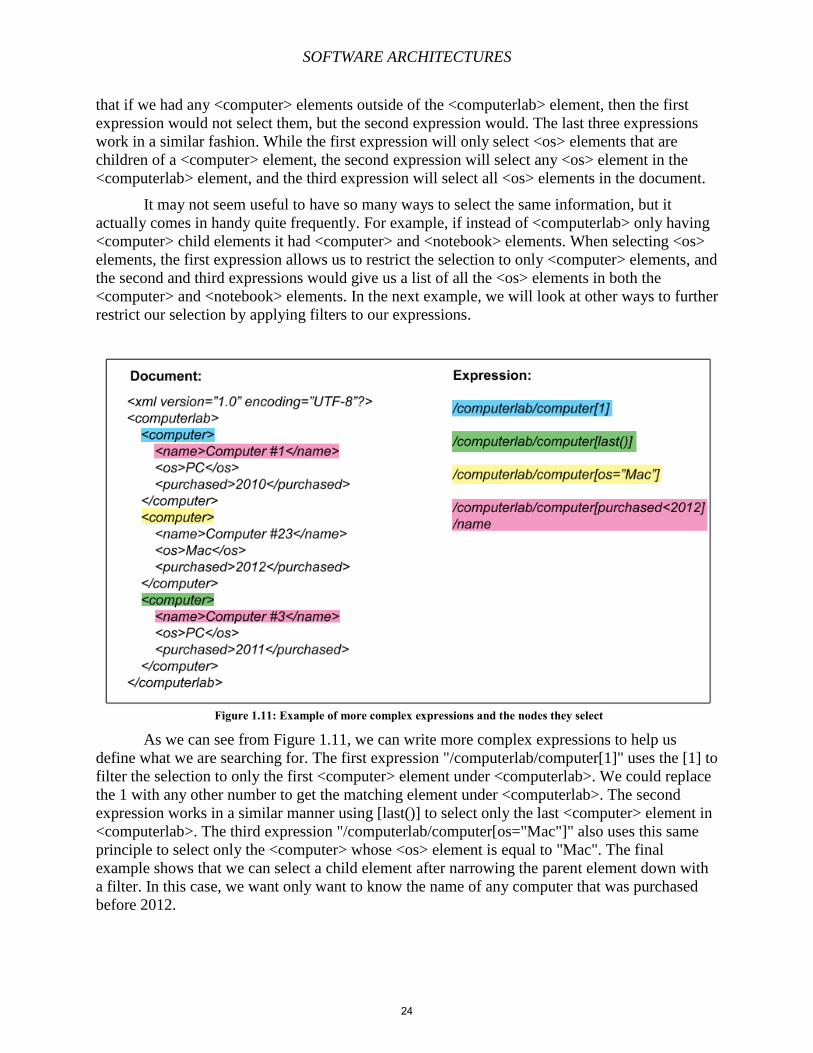
that if we had any <computer> elements outside of the <computerlab> element, then the first
expression would not select them, but the second expression would. The last three expressions
work in a similar fashion. While the first expression will only select <os> elements that are
children of a <computer> element, the second expression will select any <os> element in the
<computerlab> element, and the third expression will select all <os> elements in the document.
It may not seem useful to have so many ways to select the same information, but it
actually comes in handy quite frequently. For example, if instead of <computerlab> only having
<computer> child elements it had <computer> and <notebook> elements. When selecting <os>
elements, the first expression allows us to restrict the selection to only <computer> elements, and
the second and third expressions would give us a list of all the <os> elements in both the
<computer> and <notebook> elements. In the next example, we will look at other ways to further
restrict our selection by applying filters to our expressions.
As we can see from Figure 1.11, we can write more complex expressions to help us
define what we are searching for. The first expression "/computerlab/computer[1]" uses the [1] to
filter the selection to only the first <computer> element under <computerlab>. We could replace
the 1 with any other number to get the matching element under <computerlab>. The second
expression works in a similar manner using [last()] to select only the last <computer> element in
<computerlab>. The third expression "/computerlab/computer[os="Mac"]" also uses this same
principle to select only the <computer> whose <os> element is equal to "Mac". The final
example shows that we can select a child element after narrowing the parent element down with
a filter. In this case, we want only want to know the name of any computer that was purchased
before 2012.
Figure 1.11: Example of more complex expressions and the nodes they select
24
SOFTWARE ARCHITECTURES
Benefits of XPath
So why should we use XPath to retrieve the data we need? The answer is quite simple---it saves time. Without XPath as an option, we would have to search through all the elements by
hand and compile a list manually. On small documents this would not be much of an issue, but
on much larger documents with thousands of elements, it becomes essential to have a way to
compile a list quickly and efficiently. Also, the syntax is relatively simple which allows us to
write an expression to select the data we need in mere seconds.
XPath also has the benefit of allowing us to work with dynamic data easily. If we did not
use XPath, we would have to change data not only in the original XML document, but also every
place that data is referenced. This could lead to many problems if all the references were not
changed accordingly. However, with XPath, we are able to write an expression that will help us
keep all our data up to date so we do not have to worry about keeping up with every reference, as
long as our expressions are correct.
To reiterate, XPath is an extremely helpful tool that allows us to select specific elements
of a XML document. We do this by creating both simple and complex expressions, depending on
our needs. It also has the benefits of saving us time and making working with dynamic data that
much easier.
Extensible Stylesheet Language (XSLT) XSLT, or Extensible Stylesheet Language, is a powerful tool we have that allows us to
transform our XML documents into other XML documents, HTML, and other formats.
Transforming an XML document into another XML document is helpful if we want a document
with only parts of the original. This also has the advantage of leaving the original document
unchanged. This allows us to use the same data in many different references.
We know that XML is useful for storing data but does not do a good job at displaying
data. One of the other main uses for XSLT enables us to fix that problem. By allowing us to
transform a XML document into HTML or XHTML, we are then able to display the data in a
more readable manner. This enables many places to store data in XML documents, and then use
XSLT to transform it into HTML to be viewed as a webpage.
Before we start looking into how XSLT transforms documents, remember that XML and
HTML are markup languages. Both use tags to denote data, but the difference is XML has user
defined tags, while HTML has predefined tags. This means that XSLT needs to change our user
defined tags into equivalent tags in HTML.
How XSLT Transforms Data
The way XSLT transforms the tags from one to the other is through the use of a
Stylesheet. A Stylesheet is written by the user, and its purpose is to map the tags from our XML
document into different HTML tags. For example, in our <note> element we might want to
change our <to> element tag into a <p> tag if we were going to HTML. Stylesheets allow us to
automate this process, so we do not have to change every tag by hand.
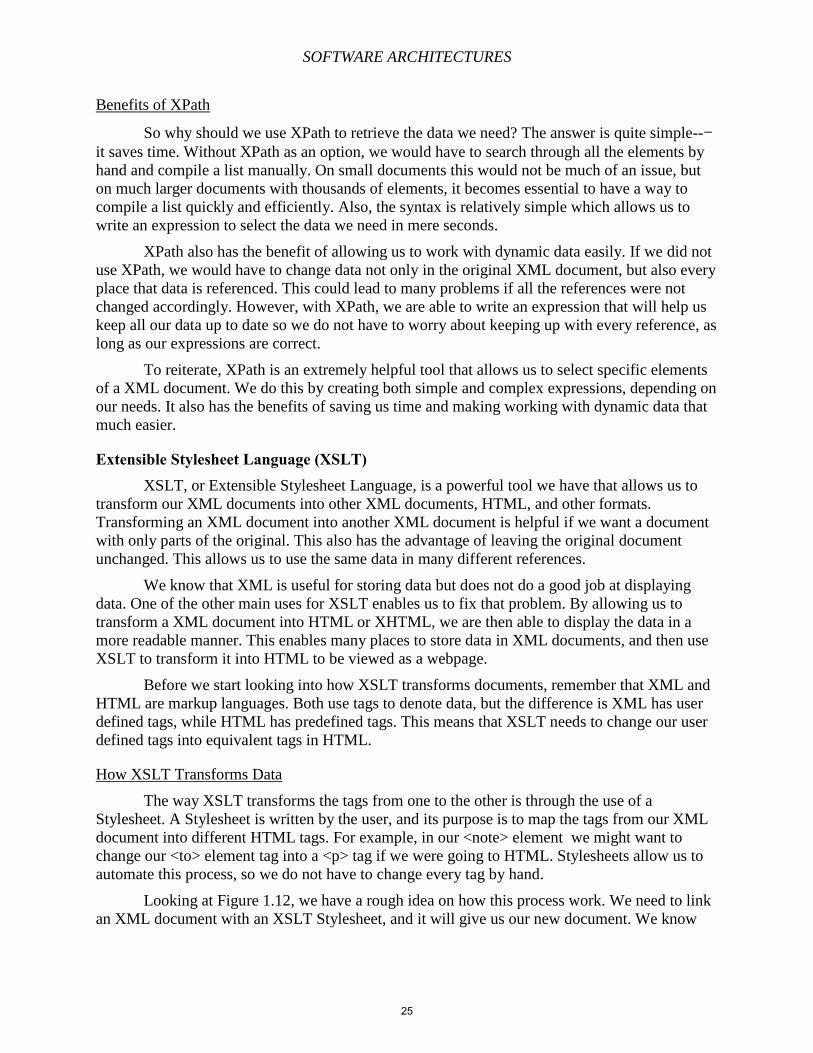
Looking at Figure 1.12, we have a rough idea on how this process work. We need to link
an XML document with an XSLT Stylesheet, and it will give us our new document. We know
25
SOFTWARE ARCHITECTURES
what a XML document and an XSLT Stylesheet is, but what is inside an XSLT Stylesheet and
how does it work? The answer depends on whether we are transforming to XML or to HTML.
If we are transforming one XML document into another, then the Stylesheet will look
very similar to an XML document. On the other hand, if we are going from XML to HTML, the
document will look more like HTML. The main difference we will notice is that instead of hard
coding that data into the sheet, we give it an address to pull the data from a XML document.
After creating our Stylesheet, we need to link the XML document to our Stylesheet. We do this
by adding a reference to the top of our document to the location of the Stylesheet.
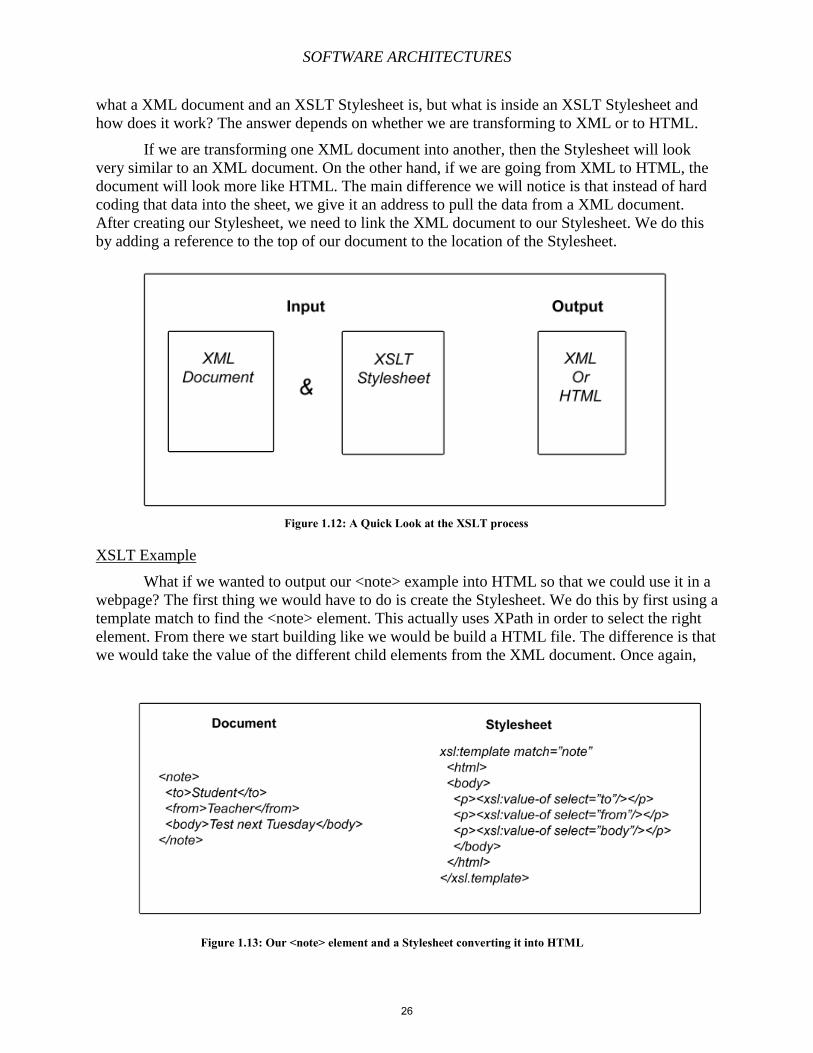
XSLT Example
What if we wanted to output our <note> example into HTML so that we could use it in a
webpage? The first thing we would have to do is create the Stylesheet. We do this by first using a
template match to find the <note> element. This actually uses XPath in order to select the right
element. From there we start building like we would be build a HTML file. The difference is that
we would take the value of the different child elements from the XML document. Once again,
Figure 1.12: A Quick Look at the XSLT process
Figure 1.13: Our <note> element and a Stylesheet converting it into HTML
26
SOFTWARE ARCHITECTURES
this uses XPath to find the correct value. This is done with the use of an XSLT function value-of.
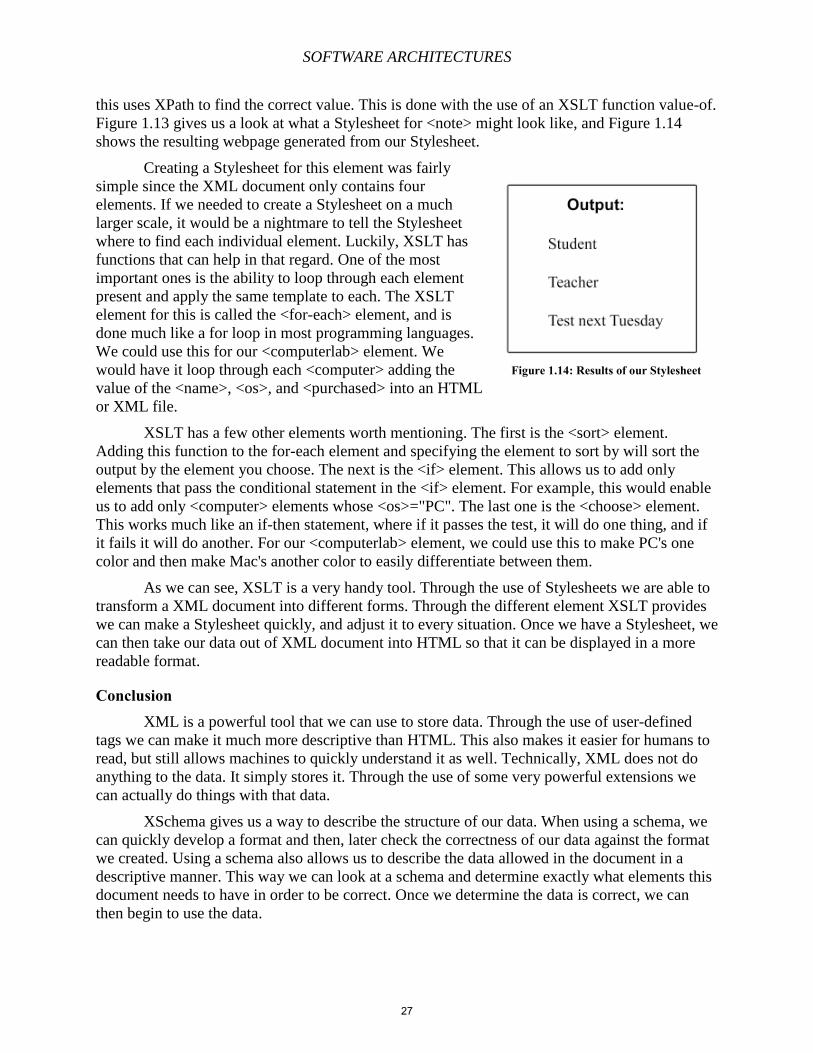
Figure 1.13 gives us a look at what a Stylesheet for <note> might look like, and Figure 1.14
shows the resulting webpage generated from our Stylesheet.
Creating a Stylesheet for this element was fairly
simple since the XML document only contains four
elements. If we needed to create a Stylesheet on a much
larger scale, it would be a nightmare to tell the Stylesheet
where to find each individual element. Luckily, XSLT has
functions that can help in that regard. One of the most
important ones is the ability to loop through each element
present and apply the same template to each. The XSLT
element for this is called the <for-each> element, and is
done much like a for loop in most programming languages.
We could use this for our <computerlab> element. We
would have it loop through each <computer> adding the
value of the <name>, <os>, and <purchased> into an HTML
or XML file.
XSLT has a few other elements worth mentioning. The first is the <sort> element.
Adding this function to the for-each element and specifying the element to sort by will sort the
output by the element you choose. The next is the <if> element. This allows us to add only
elements that pass the conditional statement in the <if> element. For example, this would enable
us to add only <computer> elements whose <os>="PC". The last one is the <choose> element.
This works much like an if-then statement, where if it passes the test, it will do one thing, and if
it fails it will do another. For our <computerlab> element, we could use this to make PC's one
color and then make Mac's another color to easily differentiate between them.
As we can see, XSLT is a very handy tool. Through the use of Stylesheets we are able to
transform a XML document into different forms. Through the different element XSLT provides
we can make a Stylesheet quickly, and adjust it to every situation. Once we have a Stylesheet, we
can then take our data out of XML document into HTML so that it can be displayed in a more
readable format.
Conclusion XML is a powerful tool that we can use to store data. Through the use of user-defined
tags we can make it much more descriptive than HTML. This also makes it easier for humans to
read, but still allows machines to quickly understand it as well. Technically, XML does not do
anything to the data. It simply stores it. Through the use of some very powerful extensions we
can actually do things with that data.
XSchema gives us a way to describe the structure of our data. When using a schema, we
can quickly develop a format and then, later check the correctness of our data against the format
we created. Using a schema also allows us to describe the data allowed in the document in a
descriptive manner. This way we can look at a schema and determine exactly what elements this
document needs to have in order to be correct. Once we determine the data is correct, we can
then begin to use the data.
Figure 1.14: Results of our Stylesheet
27
SOFTWARE ARCHITECTURES
XPath is how we begin to access the data in our XML document. With XPath, we have a
way to select specific pieces of data from a document. Using expressions, we can select all of a
given element, or narrow down the selected elements by placing restrictions. Once we find the
information, it is normally passed on to another extension, like XSLT, in order to be processed.
XSLT is used to transform an XML document to another XML document or other
formats like HTML. It accomplishes this task through the use of Stylesheets. Stylesheets allow
the user to create a template that is used to convert the file. By converting a XML document into
HTML, it allows us to display the data. This way we can share the data inside the XML
document with the world.
References [1] XML Tutorial, www.w3shools.com/xml/default.asp, accessed: 04/17/2014
[2] XML Schema Tutorial, www.w3schools.com/schema/defualt.asp, accessed: 04/17/2014
[3] XPath Tutorial, www.w3schools.com/XPath/defualt.asp, accessed: 04/18/2014
[4] XSLT Tutorial, www.w3schools.com/xsl/default.asp, accessed: 04/19/2014
[5] Understanding XML Schema, msdn.microsoft.com/en-us/library/aa468557.aspx, accessed:
04/20/2014
[6] Practical XML: Parsing, www.kdgregory.com/index.php?page=xml.parsing, accessed:
04/19/2014
[7] XPath Reference, msdn.microsoft.com/en-us/library/ms256115(v=vs.110).aspx, accessed:
04/18/2014
[8] Markup Language Definition, www.linfo.org/markup_language.html, accessed 04/16/2014
[9] Transforming XML Data with XSLT,
docs.oracle.com/javaee/1.4/tutorial/doc/JAXPXSLT6.html accessed: 04/23/2014
28
SOFTWARE ARCHITECTURES
Chapter 3 – Design Patterns: Model-View-Controller Martin Mugisha
Brief History
Smalltalk programmers developed the concept of Model-View-Controllers, like
most other software engineering concepts. These programmers were gathered at the
Learning Research Group (LRG) of Xerox PARC based in Palo Alto, California. This
group included Alan Kay, Dan Ingalls and Red Kaehler among others. C language which
was developed at Bell Labs was already out there and thus they were a few design
standards in place[ 1] .
The arrival of Smalltalk would however change all these standards and set the
future tone for programming. This language is where the concept of Model-View-
Controller first emerged. However, Ted Kaehler is the one most credited for this design
pattern. He had a paper in 1978 titled ‘A note on DynaBook requirements’. The first
name however for it was not MVC but ‘Thing-Model-View-Set’. The aim of the MVC
pattern was to mediate the way the user could interact with the software[ 1] .
This pattern has been greatly accredited with the later development of modern
Graphical User Interfaces(GUI). Without Kaehler, and his MVC, we would have still
been using terminal to input our commands.
Introduction
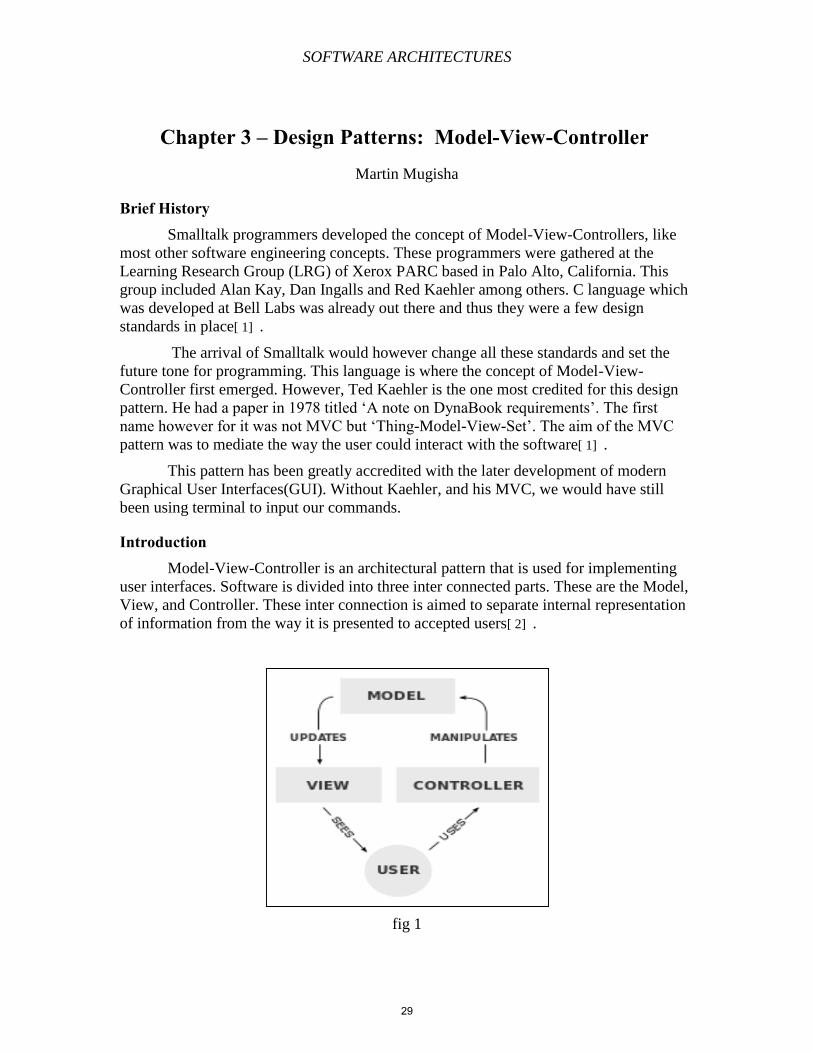
Model-View-Controller is an architectural pattern that is used for implementing
user interfaces. Software is divided into three inter connected parts. These are the Model,
View, and Controller. These inter connection is aimed to separate internal representation
of information from the way it is presented to accepted users[ 2] .
fig 1
29
SOFTWARE ARCHITECTURES
As shown in fig 1, the MVC has three components that interact to show us our
unique information.
Component Interaction Below is a detailed description of the interaction of the components in the MVC
design pattern:
1. Controller
A controller aids in changing the particular state of the model.
The controller takes input from the mouse and keyboard inputs from the
user and in turn commanding the model and view to change as required.
A controller interprets interactions from the view and translates them into
actions to be performed by the model. User interactions range from HTTP
POST and GET in Web applications or clicks and menu selections in
Standalone applications.
The controller is also responsible for setting the appropriate view to the
appropriate user.
2. Model
A model is an object representing date or even an activity. A database
table or even some particular plant-floor production machine process.
The model manages the behavior and also the data of the software
application domain.
The model accepts requests for information and responds to the set of
instructions meant to change that particular state.
The model shows application data and rules that manage access to update
this data.
The model shows the state and low-level behavior of the component. It
controls the state and all its changes
3. View
The view is the visual representation of the state of the model.
The view renders the contents of a model through accessing the data and
specifying how the data should be presented.
The view controls the graphical and textual output representations of the
software application.
A view typically attaches to a model and renders its contents for display.
In summary the MVC frame work likes like this:
Input- Processing Output
ControllerModelView
30
SOFTWARE ARCHITECTURES
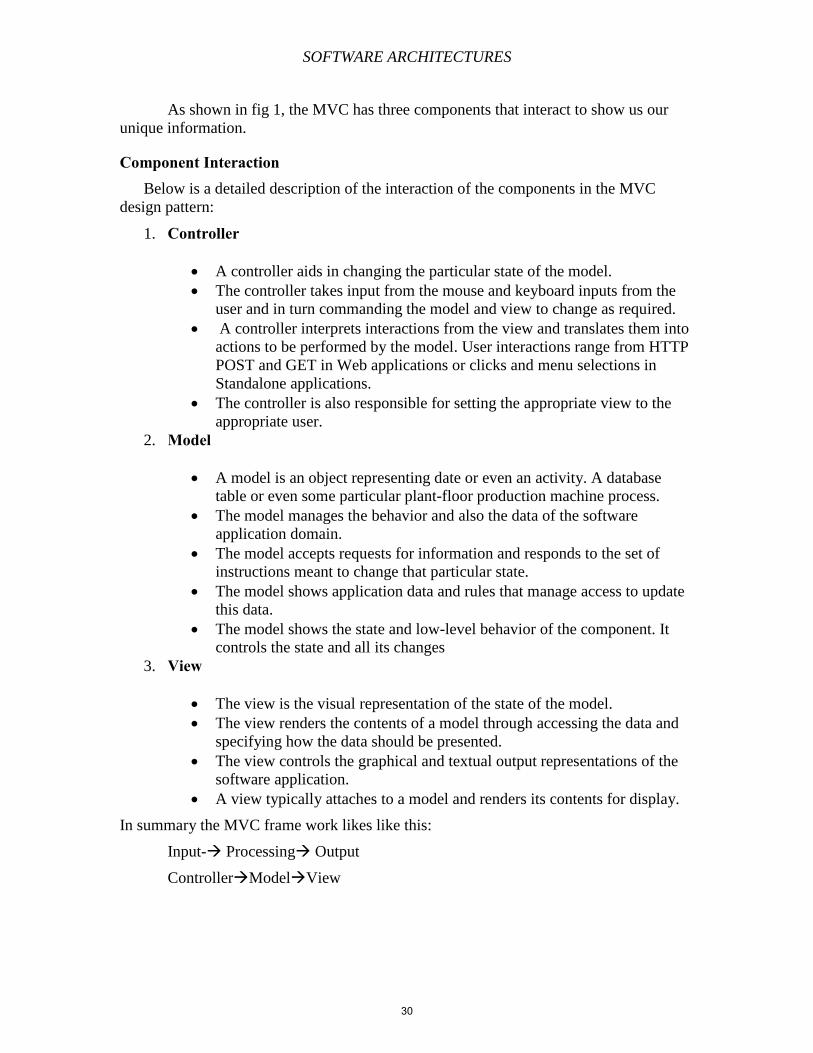
Implementation of an MVC
In the section, I will talk about a few implementations of the MVC design pattern
and in particular with Web applications. The MVC pattern has become a popular design
pattern with large scale web enterprise application[ 2] .
Fig 2[ 2] below shows a sample implementation of MVC design patern. The
application is broken down into particular functions, tasks or operations each of which is
related to the particular user[ 2] . Each fuction refers to a single controller which may
refer to one or more controllers and usually just a single view. Each function deals with
an HTTP GET and POST request[ 2] .
Fig 2 .
The Model This is a business entity which has all the properties and functions required by a
single business entity. It is always a subclass of an abstract super class with properties
and functions common to all database tables. The table is responsible for an array of
responsibility ranging from data validation, business rules to task specific behavior while
31
SOFTWARE ARCHITECTURES
actual generation of Data Manipulation Language (DML) statements is handled in a
separate class[ 2] .
The DML This can also be called the Data Access Object and this is the only object in the
framework, which has the permission to communicate with the database. This object can
only be called by a model component. This helps in isolating the Model from the
underlying database and as such eases the applications ability to be switched from one
RDBMS to another simply by switching the DML class[ 2] .
The View This an implementation of a series of scripts that are combined with specific
output from each database class to produce an XML document in this case. This file will
also include data associated with user menus pagination and scrolling. The XML is then
transformed into an HTML document by using generic XSL style sheets[ 2] .
The Controller The component is implemented as a series of functions which interact with either
one or more models[ 2] . Each controller is a class and you can have an array of them
interacting with different models. Each of them often deal with the following:
Handling HTTP POST and GET request.
Instantiates an object for each business entity
It calls methods on those appropriate objects and thus dealing with a number of
database occurrences both as input and as output.
It calls the relevant view object.
A good way of understanding what all this means is that in a business of selling
shoes for example. There are mangers, sales clerks and the owner. Each of this can send
particular requests to the model through the controller and get views that show what is in
the database but relevant to them. A manger can have administrative privileges where he
can see everyone’s work hours, wages and sales. A sales clerk can only see what shoes
are available in the store and sale them but can’t see anyone else wage or work hours.
The owner can see all of this information and more like when his supplier is expected to
bring in more stock and how much he spends on the stock plus his gross and net profile.
Project For a project to do further research into this concept, I chose to create a social
media application based on anonymous story telling where stories were tailored for each
user based on information the gave us on where they went to school at. I used PHP as the
scripting language combined with MySQL database.
Overview on PHP PHP is at the forefront of the Web 2.0 boom. Though it’s a relatively young
programming language, just over fifteen years, there are millions of developers and
32
SOFTWARE ARCHITECTURES
powers over twenty million websites. Its large open source community and also leading
players in the IT market like IBM, Oracle and Microsoft endorse PHP[ 3] .
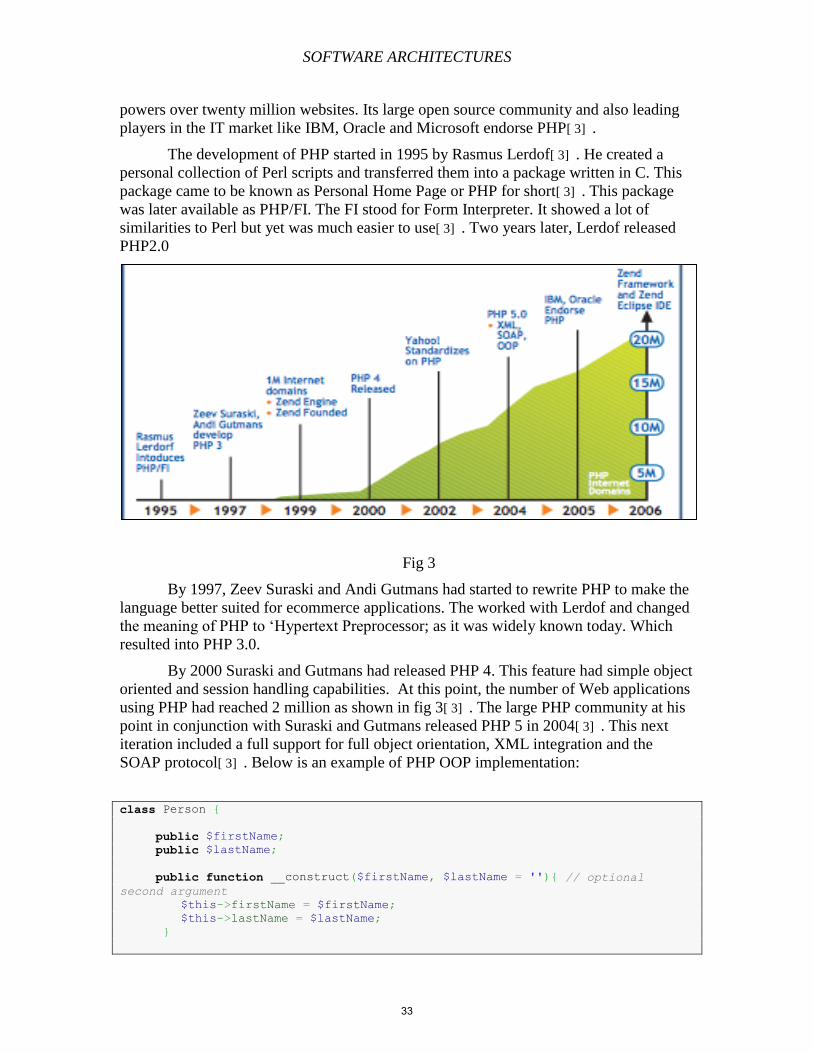
The development of PHP started in 1995 by Rasmus Lerdof[ 3] . He created a
personal collection of Perl scripts and transferred them into a package written in C. This
package came to be known as Personal Home Page or PHP for short[ 3] . This package
was later available as PHP/FI. The FI stood for Form Interpreter. It showed a lot of
similarities to Perl but yet was much easier to use[ 3] . Two years later, Lerdof released
PHP2.0
Fig 3
By 1997, Zeev Suraski and Andi Gutmans had started to rewrite PHP to make the
language better suited for ecommerce applications. The worked with Lerdof and changed
the meaning of PHP to ‘Hypertext Preprocessor; as it was widely known today. Which
resulted into PHP 3.0.
By 2000 Suraski and Gutmans had released PHP 4. This feature had simple object
oriented and session handling capabilities. At this point, the number of Web applications
using PHP had reached 2 million as shown in fig 3[ 3] . The large PHP community at his
point in conjunction with Suraski and Gutmans released PHP 5 in 2004[ 3] . This next
iteration included a full support for full object orientation, XML integration and the
SOAP protocol[ 3] . Below is an example of PHP OOP implementation:
class Person {
public $firstName;
public $lastName;
public function __construct($firstName, $lastName = ''){ // optional
second argument
$this->firstName = $firstName;
$this->lastName = $lastName;
}
33
SOFTWARE ARCHITECTURES
public function greet() {
return 'Hello, my name is ' . $this->firstName . ' ' . $this->lastName . '.';
}
public static function staticGreet($firstName, $lastName) {
return 'Hello, my name is ' . $firstName . ' ' . $lastName . '.';
}
}
$he = new Person('John', 'Smith');
$she = new Person('Sally', 'Davis');
$other = new Person('iAmine');
echo $he->greet(); // prints "Hello, my name is John Smith." echo '<br />';
echo $she->greet(); // prints "Hello, my name is Sally Davis." echo '<br />';
echo $other->greet(); // prints "Hello, my name is iAmine ." echo '<br />';
echo Person::staticGreet('Jane', 'Doe'); // prints "Hello, my name is Jane
Doe."
PHP 5.1 came in late 2005 and introduced an abstraction layer called PDO[ 3] .
This eased PHP’s use with various databases from different vendors[ 3] . By this point,
the number of web 2.0 applications with PHP was reaching 20 million as shown if fig 3.
PHP today is a fully comprehensive programming language with solid object
orientation support. It has often been referred to as a scripting language but it is more of a
dynamic programming language. Unlike the traditional C and Java, PHP doesn’t need to
be compiled but rather interpreted at run time. PHP is behind some of today’s most
revolutionary and powerful Web applications like Facebook which has a user base of
over 800 million and a constant Alexa rank of 2. Other Web apps include Digg, Yahoo
and Wordpress Some of whose logos are easily identified as shown in fig 4
Fig 4- Logos of popular apps using PHP
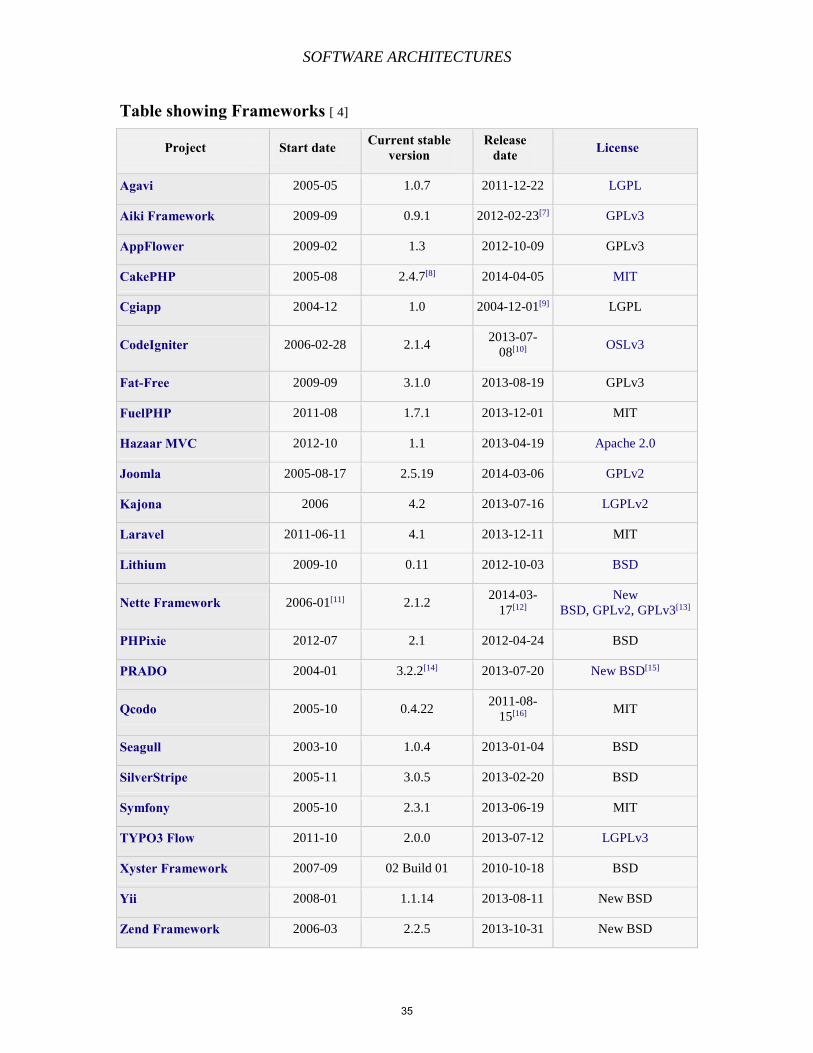
PHP MVC frameworks PHP has had an array of open source and proprietary frameworks
developed to handle strict development. Companies like Facebook have developed their
own frameworks but never the less; they are many open source frameworks out there that
can be used to create your own Enterprise application with accordance to their particular
license. Below is a list of today’s most widely used frameworks, their release date and
type of license:
34
SOFTWARE ARCHITECTURES
Table showing Frameworks [ 4]
Project Start date Current stable version
Release date License
Agavi 2005-05 1.0.7 2011-12-22 LGPL
Aiki Framework 2009-09 0.9.1 2012-02-23[7] GPLv3
AppFlower 2009-02 1.3 2012-10-09 GPLv3
CakePHP 2005-08 2.4.7[8] 2014-04-05 MIT
Cgiapp 2004-12 1.0 2004-12-01[9] LGPL
CodeIgniter 2006-02-28 2.1.4 2013-07-
08[10] OSLv3
Fat-Free 2009-09 3.1.0 2013-08-19 GPLv3
FuelPHP 2011-08 1.7.1 2013-12-01 MIT
Hazaar MVC 2012-10 1.1 2013-04-19 Apache 2.0
Joomla 2005-08-17 2.5.19 2014-03-06 GPLv2
Kajona 2006 4.2 2013-07-16 LGPLv2
Laravel 2011-06-11 4.1 2013-12-11 MIT
Lithium 2009-10 0.11 2012-10-03 BSD
Nette Framework 2006-01[11] 2.1.2 2014-03-
17[12]
New
BSD, GPLv2, GPLv3[13]
PHPixie 2012-07 2.1 2012-04-24 BSD
PRADO 2004-01 3.2.2[14] 2013-07-20 New BSD[15]
Qcodo 2005-10 0.4.22 2011-08-
15[16] MIT
Seagull 2003-10 1.0.4 2013-01-04 BSD
SilverStripe 2005-11 3.0.5 2013-02-20 BSD
Symfony 2005-10 2.3.1 2013-06-19 MIT
TYPO3 Flow 2011-10 2.0.0 2013-07-12 LGPLv3
Xyster Framework 2007-09 02 Build 01 2010-10-18 BSD
Yii 2008-01 1.1.14 2013-08-11 New BSD
Zend Framework 2006-03 2.2.5 2013-10-31 New BSD
35
SOFTWARE ARCHITECTURES
The above libraries all have a few characteristics in common. They all provide
libraries to access the database session management and promote code reuse. This in turn
means that the effort and time put into development is significantly reduced and so are
the resources required to develop and maintain the web application.
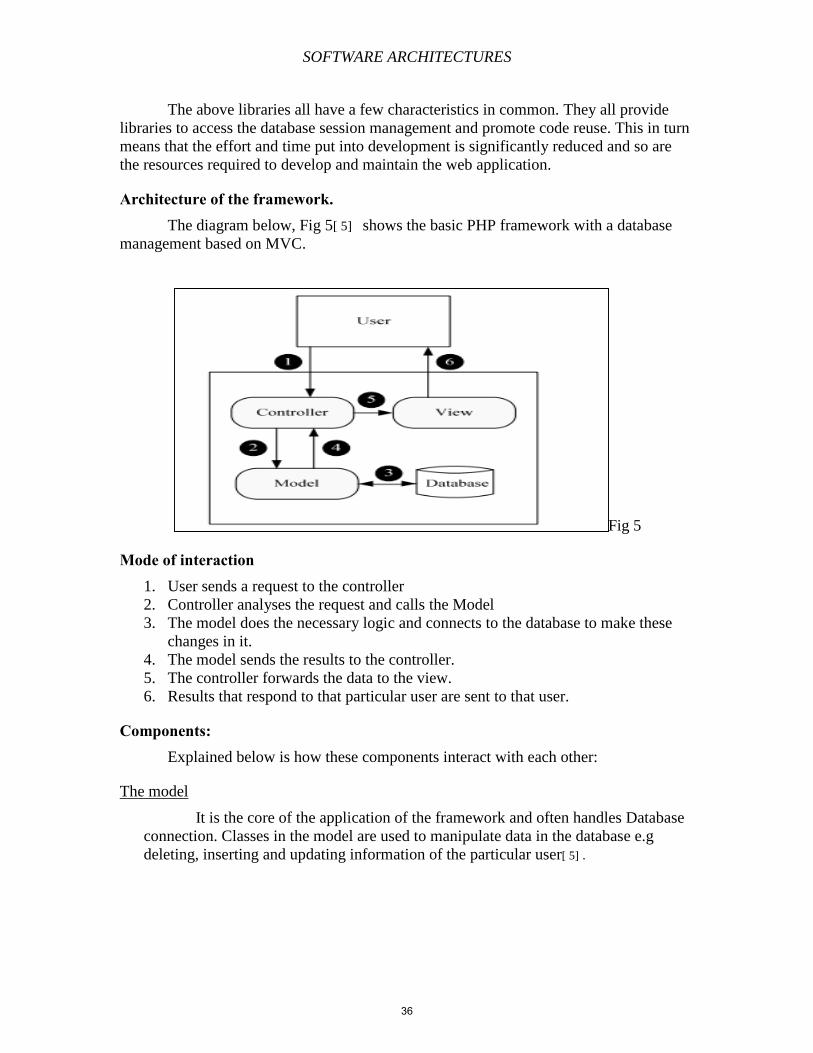
Architecture of the framework. The diagram below, Fig 5[ 5] shows the basic PHP framework with a database
management based on MVC.
Fig 5
Mode of interaction 1. User sends a request to the controller
2. Controller analyses the request and calls the Model
3. The model does the necessary logic and connects to the database to make these
changes in it.
4. The model sends the results to the controller.
5. The controller forwards the data to the view.
6. Results that respond to that particular user are sent to that user.
Components: Explained below is how these components interact with each other:
The model
It is the core of the application of the framework and often handles Database
connection. Classes in the model are used to manipulate data in the database e.g
deleting, inserting and updating information of the particular user[ 5] .
36
SOFTWARE ARCHITECTURES
The View
This is the user interface of the controller. It is the face of the response to
users events. Presentation is often in HTML, CSS, JavaScript. Multiple views can
exist for a single model[ 5] .
The Controller
This component implements the flow of control between the view and the
model[ 5] . It as mentioned earlier contains code that handles actions that cause a
change on the model.
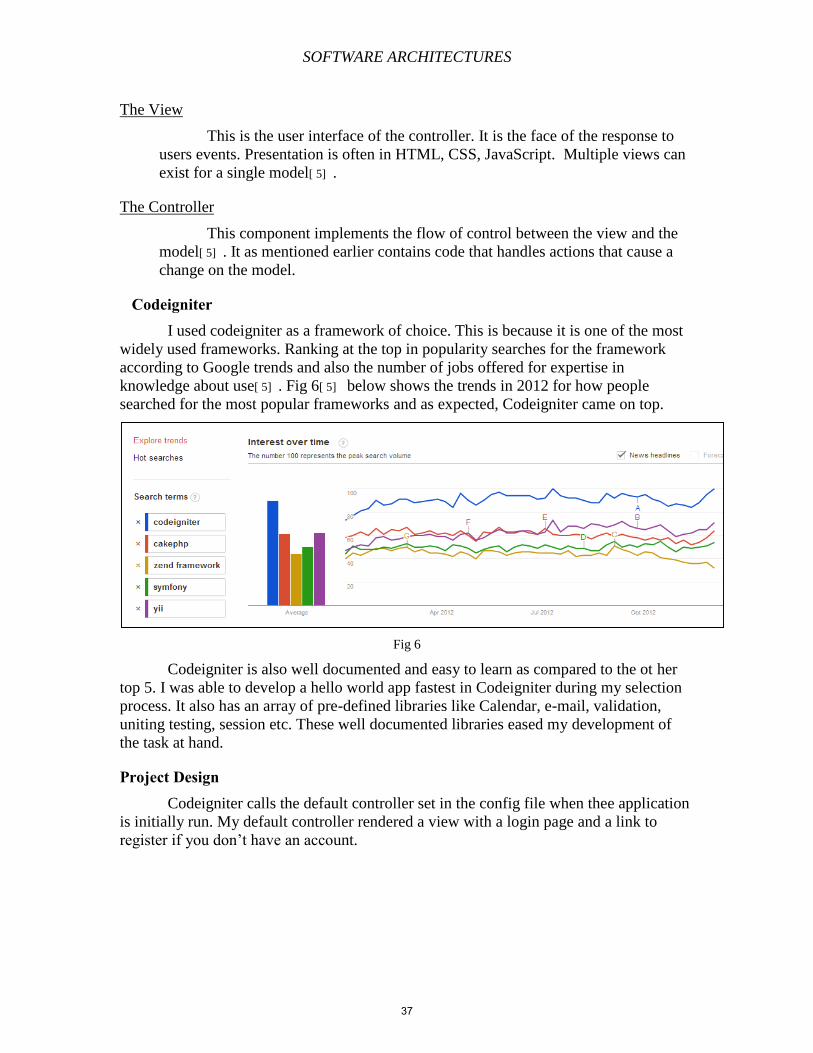
Codeigniter I used codeigniter as a framework of choice. This is because it is one of the most
widely used frameworks. Ranking at the top in popularity searches for the framework
according to Google trends and also the number of jobs offered for expertise in
knowledge about use[ 5] . Fig 6[ 5] below shows the trends in 2012 for how people
searched for the most popular frameworks and as expected, Codeigniter came on top.
Fig 6
Codeigniter is also well documented and easy to learn as compared to the ot her
top 5. I was able to develop a hello world app fastest in Codeigniter during my selection
process. It also has an array of pre-defined libraries like Calendar, e-mail, validation,
uniting testing, session etc. These well documented libraries eased my development of
the task at hand.
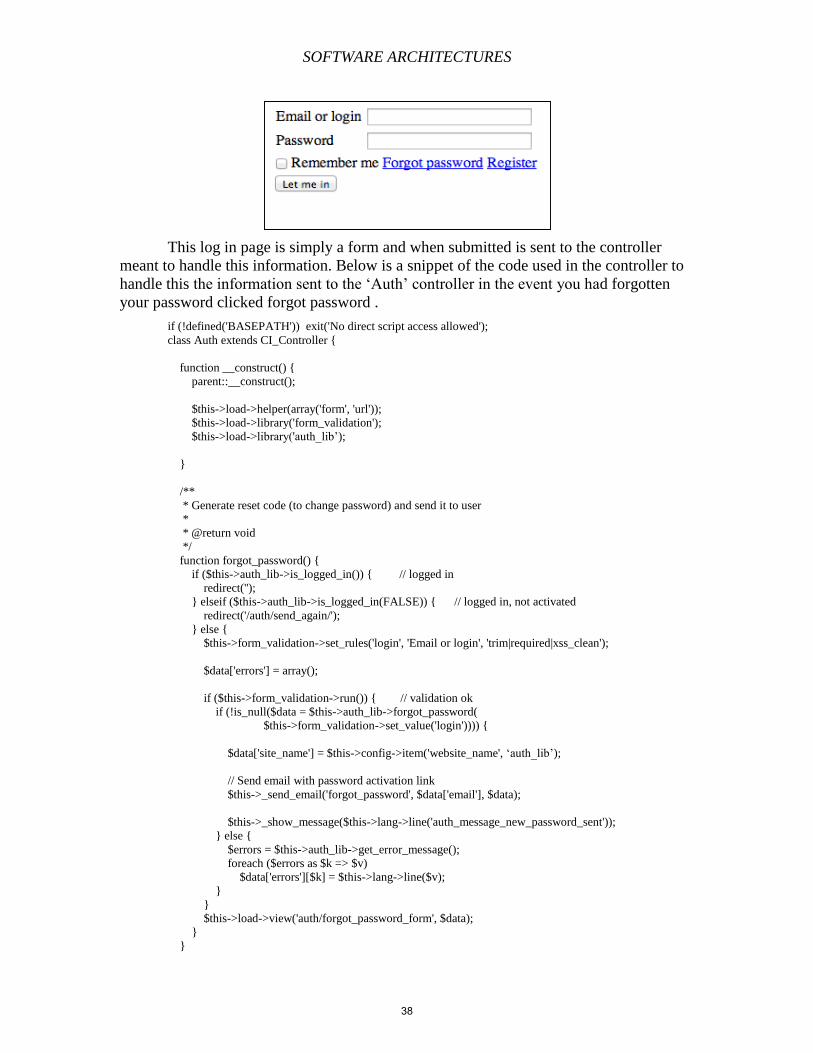
Project Design Codeigniter calls the default controller set in the config file when thee application
is initially run. My default controller rendered a view with a login page and a link to
register if you don’t have an account.
37
SOFTWARE ARCHITECTURES
This log in page is simply a form and when submitted is sent to the controller
meant to handle this information. Below is a snippet of the code used in the controller to
handle this the information sent to the ‘Auth’ controller in the event you had forgotten
your password clicked forgot password .
if (!defined('BASEPATH')) exit('No direct script access allowed');
class Auth extends CI_Controller {
function __construct() {
parent::__construct();
$this->load->helper(array('form', 'url'));
$this->load->library('form_validation');
$this->load->library('auth_lib’);
}
/**
* Generate reset code (to change password) and send it to user
*
* @return void
*/
function forgot_password() {
if ($this->auth_lib->is_logged_in()) { // logged in
redirect('');
} elseif ($this->auth_lib->is_logged_in(FALSE)) { // logged in, not activated
redirect('/auth/send_again/');
} else {
$this->form_validation->set_rules('login', 'Email or login', 'trim|required|xss_clean');
$data['errors'] = array();
if ($this->form_validation->run()) { // validation ok
if (!is_null($data = $this->auth_lib->forgot_password(
$this->form_validation->set_value('login')))) {
$data['site_name'] = $this->config->item('website_name', ‘auth_lib’);
// Send email with password activation link
$this->_send_email('forgot_password', $data['email'], $data);
$this->_show_message($this->lang->line('auth_message_new_password_sent'));
} else {
$errors = $this->auth_lib->get_error_message();
foreach ($errors as $k => $v)
$data['errors'][$k] = $this->lang->line($v);
}
}
$this->load->view('auth/forgot_password_form', $data);
}
}
38
SOFTWARE ARCHITECTURES
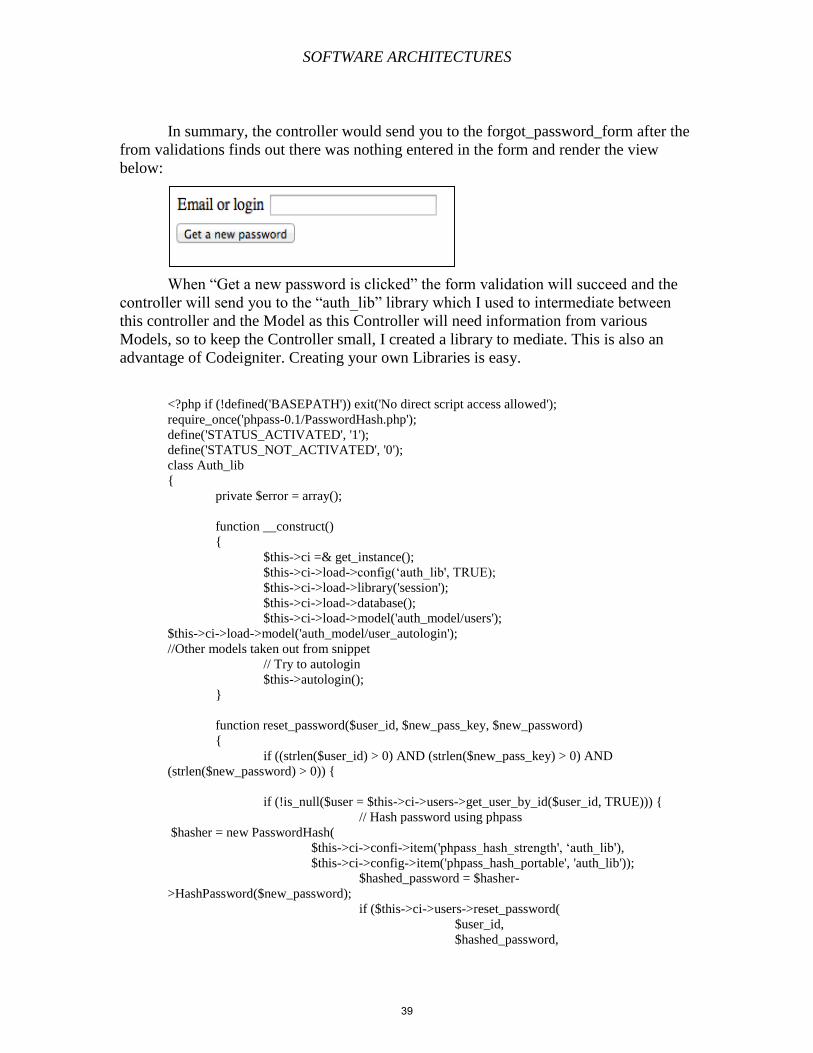
In summary, the controller would send you to the forgot_password_form after the
from validations finds out there was nothing entered in the form and render the view
below:
When “Get a new password is clicked” the form validation will succeed and the
controller will send you to the “auth_lib” library which I used to intermediate between
this controller and the Model as this Controller will need information from various
Models, so to keep the Controller small, I created a library to mediate. This is also an
advantage of Codeigniter. Creating your own Libraries is easy.
<?php if (!defined('BASEPATH')) exit('No direct script access allowed');
require_once('phpass-0.1/PasswordHash.php');
define('STATUS_ACTIVATED', '1');
define('STATUS_NOT_ACTIVATED', '0');
class Auth_lib
{
private $error = array();
function __construct()
{
$this->ci =& get_instance();
$this->ci->load->config(‘auth_lib', TRUE);
$this->ci->load->library('session');
$this->ci->load->database();
$this->ci->load->model('auth_model/users');
$this->ci->load->model('auth_model/user_autologin');
//Other models taken out from snippet
// Try to autologin
$this->autologin();
}
function reset_password($user_id, $new_pass_key, $new_password)
{
if ((strlen($user_id) > 0) AND (strlen($new_pass_key) > 0) AND
(strlen($new_password) > 0)) {
if (!is_null($user = $this->ci->users->get_user_by_id($user_id, TRUE))) {
// Hash password using phpass
$hasher = new PasswordHash(
$this->ci->confi->item('phpass_hash_strength', ‘auth_lib'),
$this->ci->config->item('phpass_hash_portable', 'auth_lib'));
$hashed_password = $hasher-
>HashPassword($new_password);
if ($this->ci->users->reset_password(
$user_id,
$hashed_password,
39
SOFTWARE ARCHITECTURES
$new_pass_key,
$this->ci->config->item('forgot_password_expire', ‘auth_lib'))) { //
success
// Clear all user's autologins
$this->ci->user_autologin->clear($user->id);
return array(
'user_id' => $user_id,
'username'=> $user->username,
'email' => $user->email,
'new_password' => $new_password,
);
}
}
}
return NULL;
}
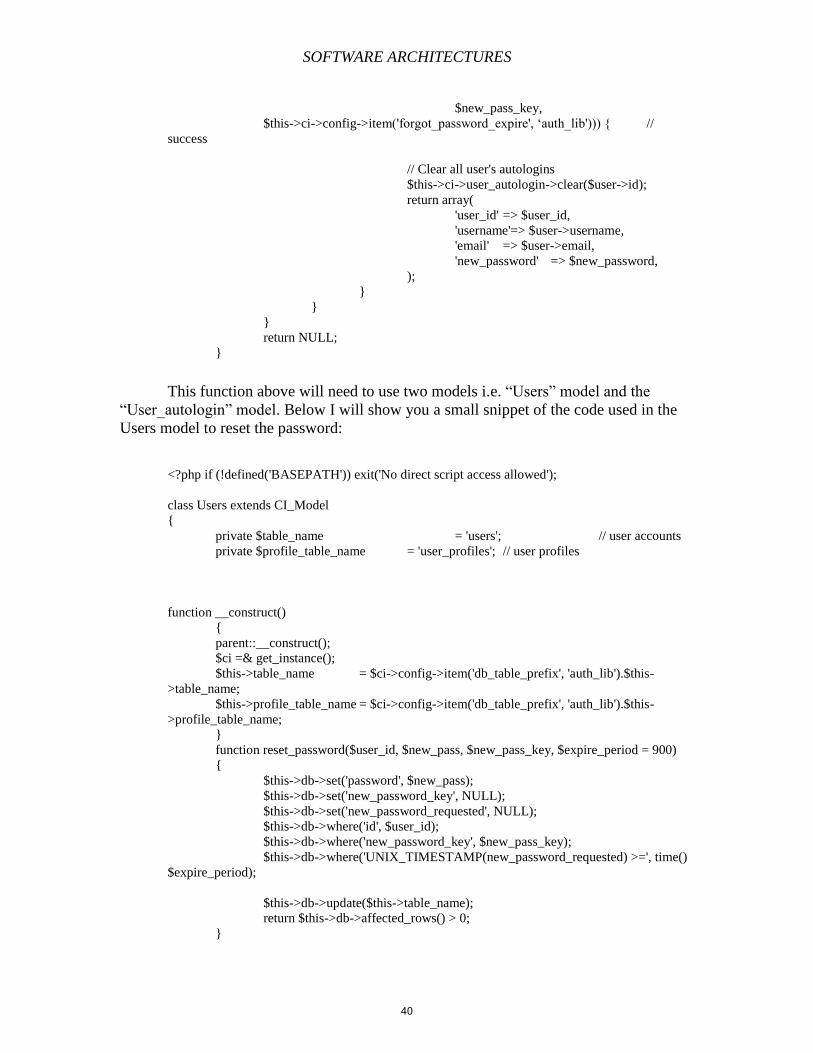
This function above will need to use two models i.e. “Users” model and the
“User_autologin” model. Below I will show you a small snippet of the code used in the
Users model to reset the password:
<?php if (!defined('BASEPATH')) exit('No direct script access allowed');
class Users extends CI_Model
{
private $table_name = 'users'; // user accounts
private $profile_table_name = 'user_profiles'; // user profiles
function __construct()
{
parent::__construct();
$ci =& get_instance();
$this->table_name = $ci->config->item('db_table_prefix', 'auth_lib').$this-
>table_name;
$this->profile_table_name = $ci->config->item('db_table_prefix', 'auth_lib').$this-
>profile_table_name;
}
function reset_password($user_id, $new_pass, $new_pass_key, $expire_period = 900)
{
$this->db->set('password', $new_pass);
$this->db->set('new_password_key', NULL);
$this->db->set('new_password_requested', NULL);
$this->db->where('id', $user_id);
$this->db->where('new_password_key', $new_pass_key);
$this->db->where('UNIX_TIMESTAMP(new_password_requested) >=', time()
$expire_period);
$this->db->update($this->table_name);
return $this->db->affected_rows() > 0;
}
40
SOFTWARE ARCHITECTURES
As you can tell above, the model will connect to the database and change the data
related to this particular user. Though I did not show code for what the view looked like,
you can notice from the little I have shown above how the OOP principles being followed
that are the same in the regular programming languages like JAVA. The code is also easy
to read and follow. And shows a perfect example of the MVC interaction. My project
turned out to be more extensive than I thought as a lot had to be done to maintain strict
development standards and security of information. I also used a bunch of other
technologies like JQuery libraries and the twitter Bootstrap CSS framework to build a
more attractive user interface.
I was able to have some substantial progress with a lot of elements of this
application developed as the full stack developer. The development time for the
deliverables I was able to accomplish could have taken up to three or four times longer if
I had not used this framework.
Conclusion By choosing the right software technologies, development of an application can
be changed dramatically. The MVC pattern framework is an example of that technology.
It eases the development of maintainable code. It also eases labor division as developers
can be split into User Interface developers and application logic. Extending and reusing
applications written in the MVC pattern is easy e.g. A single model can be used by
multiple controllers and also a single controller can use multiple models.
All in all, MVC frameworks reduce development time, promote code re-use and
ease specialization of developers. This in turn maximizes the potential results obtained
from the developers making it a revolutionary concept.
References [1] "PHP MVC Tutorial: Understanding the Model-View-Controller." Udemy Blog.
N.p., n.d. Web. 29 Apr. 2014. <https://www.udemy.com/blog/php-mvc-tutorial/>.
[2] "The Model-View-Controller (MVC) Design Pattern for PHP." The Model-View-
Controller (MVC) Design Pattern for PHP. N.p., n.d. Web. 29 Apr. 2014.
<http://www.tonymarston.net/php-mysql/model-view-controller.html#introduction>
[3] "An overview of php." zend.org. N.p., n.d. Web. 29 Apr. 2014.
<http://static.zend.com/topics/overview_on_php.pdf>.
[4] "Comparison of web application frameworks." Wikipedia. Wikimedia Foundation,
29 Apr. 2014. Web. 29 Apr. 2014. <http://en.wikipedia.org/wiki/Comparison_of
web_application_framework>.
[5] "PHP FRAMEWORK FOR DATABASE MANAGEMENT BASED ON MVC
PATTERN ." http://airccse.org/. N.p., n.d. Web. 29 Apr. 2014.
<http://airccse.org/journal/jcsit/0411csit19.pdf
41
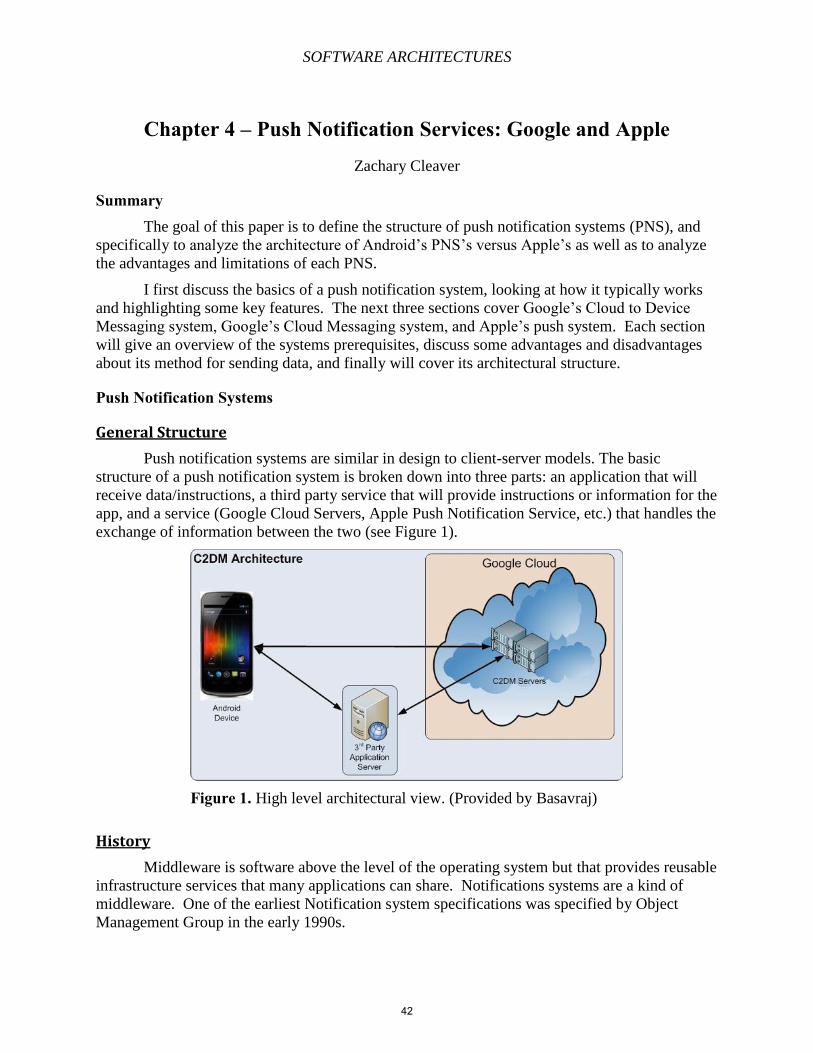
SOFTWARE ARCHITECTURES
Chapter 4 – Push Notification Services: Google and Apple
Zachary Cleaver
Summary The goal of this paper is to define the structure of push notification systems (PNS), and
specifically to analyze the architecture of Android’s PNS’s versus Apple’s as well as to analyze
the advantages and limitations of each PNS.
I first discuss the basics of a push notification system, looking at how it typically works
and highlighting some key features. The next three sections cover Google’s Cloud to Device
Messaging system, Google’s Cloud Messaging system, and Apple’s push system. Each section
will give an overview of the systems prerequisites, discuss some advantages and disadvantages
about its method for sending data, and finally will cover its architectural structure.
Push Notification Systems
General Structure
Push notification systems are similar in design to client-server models. The basic
structure of a push notification system is broken down into three parts: an application that will
receive data/instructions, a third party service that will provide instructions or information for the
app, and a service (Google Cloud Servers, Apple Push Notification Service, etc.) that handles the
exchange of information between the two (see Figure 1).
Figure 1. High level architectural view. (Provided by Basavraj)
History
Middleware is software above the level of the operating system but that provides reusable
infrastructure services that many applications can share. Notifications systems are a kind of
middleware. One of the earliest Notification system specifications was specified by Object
Management Group in the early 1990s.
42
SOFTWARE ARCHITECTURES
Advantage
The server that sends information to the application from the third party server acts as a
middleman to communicate and control the rate at which data is exchanged. This allows for
information to be “pushed” to a device without having to stress the device by keeping multiple
applications running at once. Applications can remain off or idle on a device while the user
receives a notification that new information or updates are available for a specific application.
This greatly increases run time efficiency on a device by allowing the user to be in control of
what apps are running while still being able to receive information from the third party servers.
Google’s Cloud to Device Messaging
Prerequisites
In order for an Android device to receive messages from an application server, there are
some basic requirements that must first be met when using the C2DM service (Basavraj)
The device must be version 2.2 or higher
A registered Google account must be present on the device
The server that wishes to send data must be able to “talk” HTTP and connect to the
C2DM server
The application should have the proper permissions the receive messages from the C2DM
service and be able to make an internet connection
The developer of the application must register through the C2DM site to use the service
Data Sent
The amount of data that could be sent by Google’s first notification system was limited to
1024 bytes. Google also restricted the number of continuous messages that could be sent, as well
as the number of messages a server can send to a specific device. The maximum number of
messages a service could send was 200,000 per day.
A drawback of C2DM is that it does not guarantee the delivery of a message to the
application and it does not guarantee that the order of multiple messages will be maintained
(Basavraj). Bourdeaux elaborates on this and believes in is due to the “file-and-forget” nature of
Google’s service. Because of this, developers would be wary to send a notification that their app
has a new message rather than sending the message itself. However, Bourdeaux pointed out an
improvement at the time versus Apple’s push notification—C2DM allowed the application to be
woken up rather than taking Apple’s method of simply sending a notification. This may seem
like a minor feature compared to today’s services, but this development helped improve the
capabilities and standards for future push notification systems.
Main Sequence of Events
There are five basic steps that C2DM follows according to Google’s documentation:
1. The third party service sends a message to the C2DM servers that it wishes to pass on to
its application
2. The Google servers enqueues and stores the message in its database until it can be
delivered if the device is currently offline
43
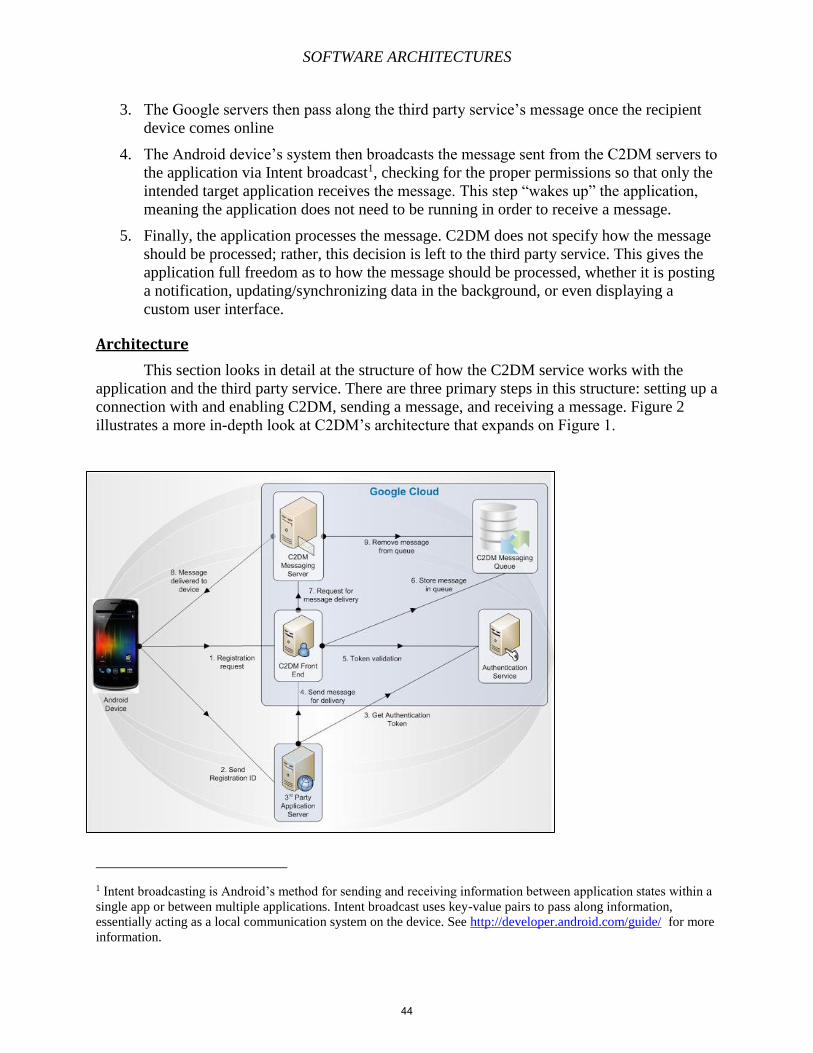
SOFTWARE ARCHITECTURES
3. The Google servers then pass along the third party service’s message once the recipient
device comes online
4. The Android device’s system then broadcasts the message sent from the C2DM servers to
the application via Intent broadcast1, checking for the proper permissions so that only the
intended target application receives the message. This step “wakes up” the application,
meaning the application does not need to be running in order to receive a message.
5. Finally, the application processes the message. C2DM does not specify how the message
should be processed; rather, this decision is left to the third party service. This gives the
application full freedom as to how the message should be processed, whether it is posting
a notification, updating/synchronizing data in the background, or even displaying a
custom user interface.
Architecture
This section looks in detail at the structure of how the C2DM service works with the
application and the third party service. There are three primary steps in this structure: setting up a
connection with and enabling C2DM, sending a message, and receiving a message. Figure 2
illustrates a more in-depth look at C2DM’s architecture that expands on Figure 1.
1 Intent broadcasting is Android’s method for sending and receiving information between application states within a
single app or between multiple applications. Intent broadcast uses key-value pairs to pass along information,
essentially acting as a local communication system on the device. See http://developer.android.com/guide/ for more
information.
44
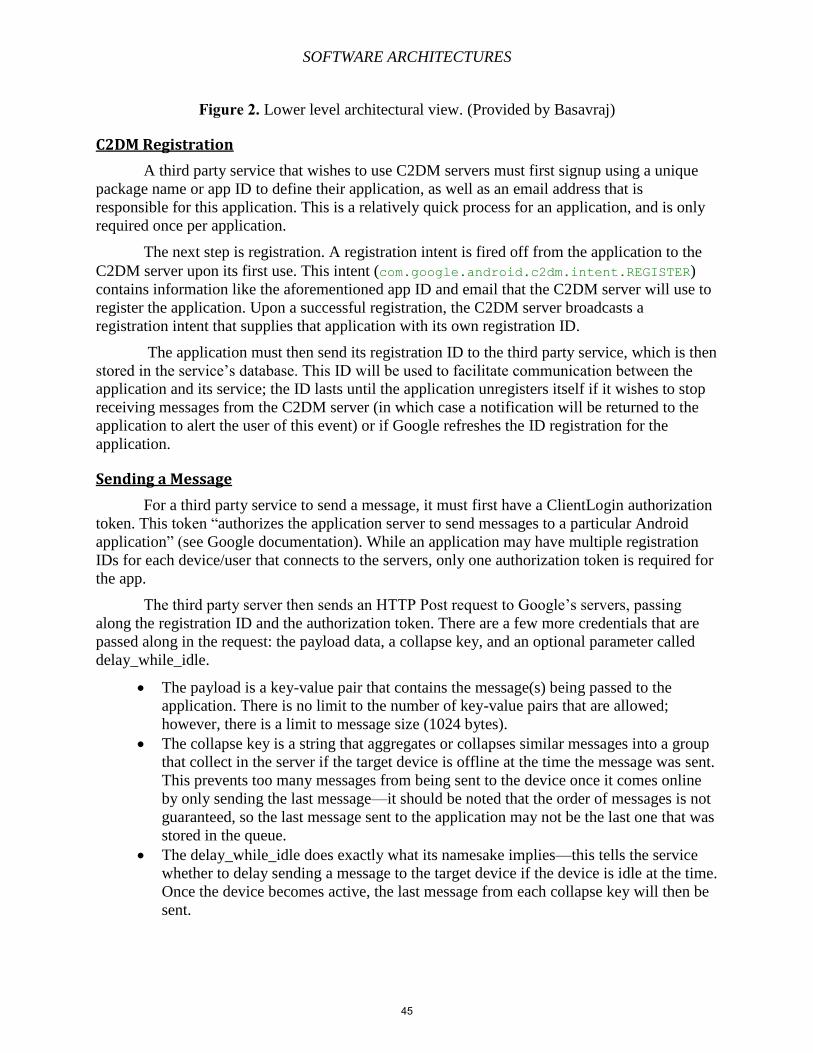
SOFTWARE ARCHITECTURES
Figure 2. Lower level architectural view. (Provided by Basavraj)
C2DM Registration
A third party service that wishes to use C2DM servers must first signup using a unique
package name or app ID to define their application, as well as an email address that is
responsible for this application. This is a relatively quick process for an application, and is only
required once per application.
The next step is registration. A registration intent is fired off from the application to the
C2DM server upon its first use. This intent (com.google.android.c2dm.intent.REGISTER) contains information like the aforementioned app ID and email that the C2DM server will use to
register the application. Upon a successful registration, the C2DM server broadcasts a
registration intent that supplies that application with its own registration ID.
The application must then send its registration ID to the third party service, which is then
stored in the service’s database. This ID will be used to facilitate communication between the
application and its service; the ID lasts until the application unregisters itself if it wishes to stop
receiving messages from the C2DM server (in which case a notification will be returned to the
application to alert the user of this event) or if Google refreshes the ID registration for the
application.
Sending a Message
For a third party service to send a message, it must first have a ClientLogin authorization
token. This token “authorizes the application server to send messages to a particular Android
application” (see Google documentation). While an application may have multiple registration
IDs for each device/user that connects to the servers, only one authorization token is required for
the app.
The third party server then sends an HTTP Post request to Google’s servers, passing
along the registration ID and the authorization token. There are a few more credentials that are
passed along in the request: the payload data, a collapse key, and an optional parameter called
delay_while_idle.
The payload is a key-value pair that contains the message(s) being passed to the
application. There is no limit to the number of key-value pairs that are allowed;
however, there is a limit to message size (1024 bytes).
The collapse key is a string that aggregates or collapses similar messages into a group
that collect in the server if the target device is offline at the time the message was sent.
This prevents too many messages from being sent to the device once it comes online
by only sending the last message—it should be noted that the order of messages is not
guaranteed, so the last message sent to the application may not be the last one that was
stored in the queue.
The delay_while_idle does exactly what its namesake implies—this tells the service
whether to delay sending a message to the target device if the device is idle at the time.
Once the device becomes active, the last message from each collapse key will then be
sent.
45
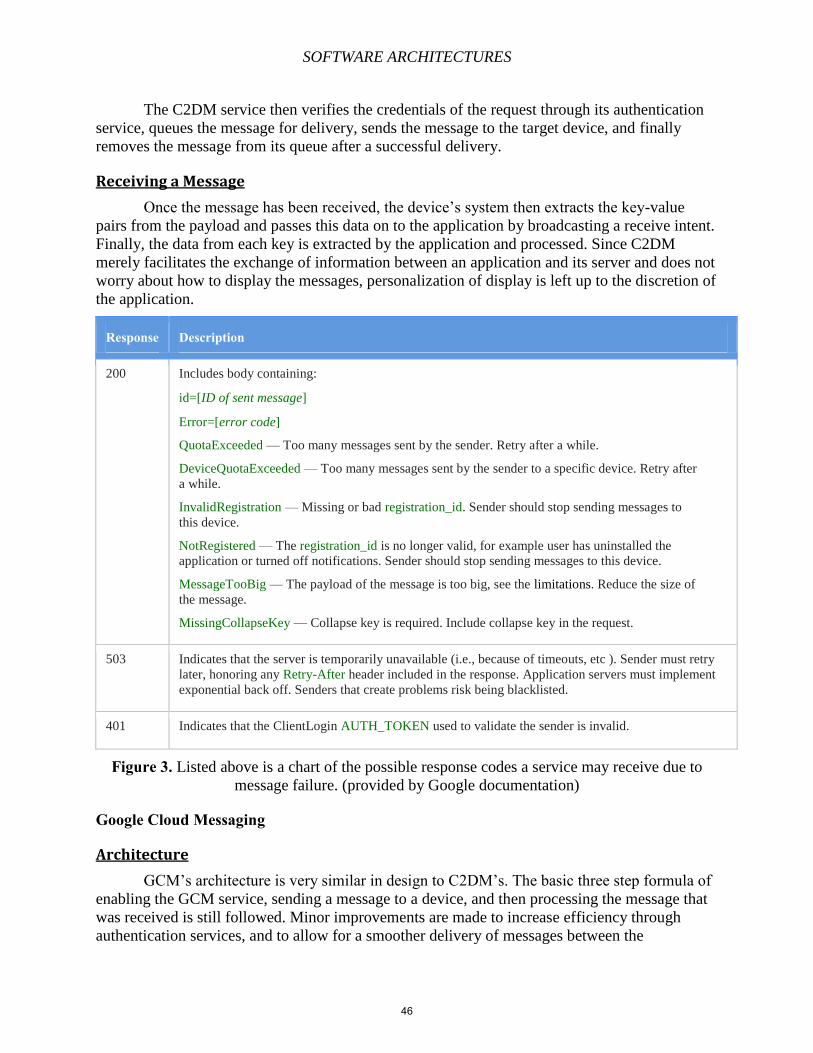
SOFTWARE ARCHITECTURES
The C2DM service then verifies the credentials of the request through its authentication
service, queues the message for delivery, sends the message to the target device, and finally
removes the message from its queue after a successful delivery.
Receiving a Message
Once the message has been received, the device’s system then extracts the key-value
pairs from the payload and passes this data on to the application by broadcasting a receive intent.
Finally, the data from each key is extracted by the application and processed. Since C2DM
merely facilitates the exchange of information between an application and its server and does not
worry about how to display the messages, personalization of display is left up to the discretion of
the application.
Response Description
200 Includes body containing:
id=[ID of sent message]
Error=[error code]
o QuotaExceeded — Too many messages sent by the sender. Retry after a while.
o DeviceQuotaExceeded — Too many messages sent by the sender to a specific device. Retry after
a while.
o InvalidRegistration — Missing or bad registration_id. Sender should stop sending messages to
this device.
o NotRegistered — The registration_id is no longer valid, for example user has uninstalled the
application or turned off notifications. Sender should stop sending messages to this device.
o MessageTooBig — The payload of the message is too big, see the limitations. Reduce the size of
the message.
o MissingCollapseKey — Collapse key is required. Include collapse key in the request.
503 Indicates that the server is temporarily unavailable (i.e., because of timeouts, etc ). Sender must retry
later, honoring any Retry-After header included in the response. Application servers must implement
exponential back off. Senders that create problems risk being blacklisted.
401 Indicates that the ClientLogin AUTH_TOKEN used to validate the sender is invalid.
Figure 3. Listed above is a chart of the possible response codes a service may receive due to
message failure. (provided by Google documentation)
Google Cloud Messaging
Architecture
GCM’s architecture is very similar in design to C2DM’s. The basic three step formula of
enabling the GCM service, sending a message to a device, and then processing the message that
was received is still followed. Minor improvements are made to increase efficiency through
authentication services, and to allow for a smoother delivery of messages between the
46
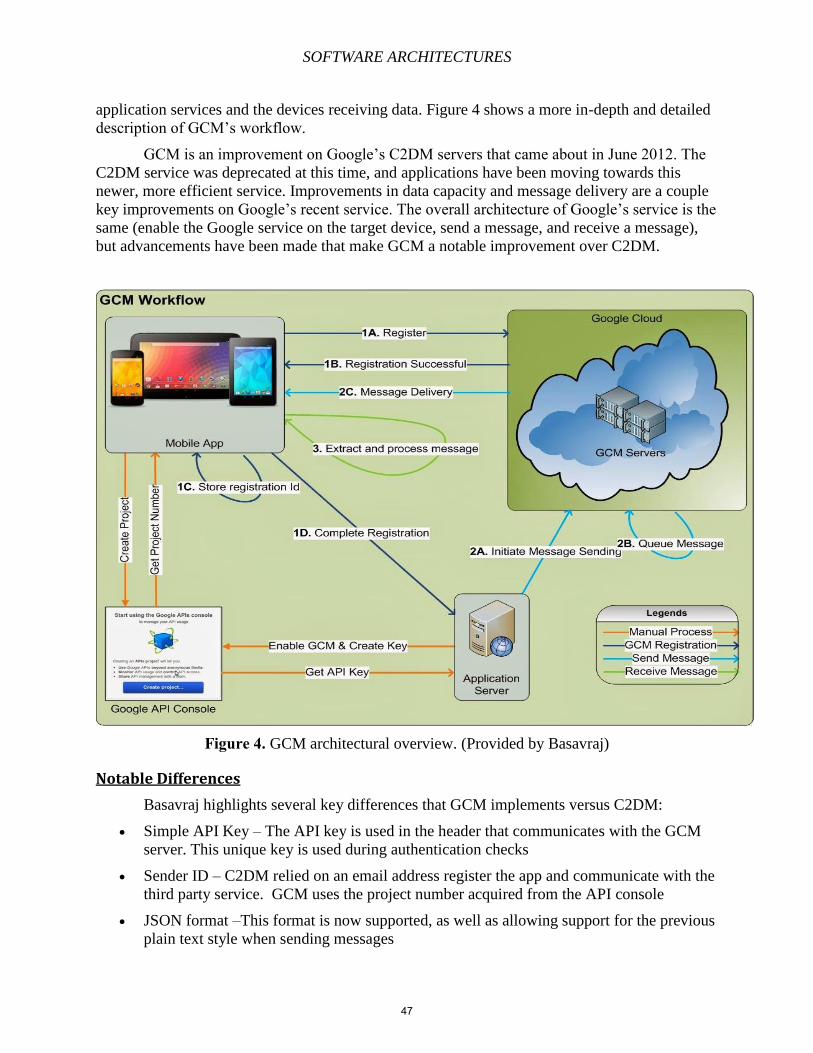
SOFTWARE ARCHITECTURES
application services and the devices receiving data. Figure 4 shows a more in-depth and detailed
description of GCM’s workflow.
GCM is an improvement on Google’s C2DM servers that came about in June 2012. The
C2DM service was deprecated at this time, and applications have been moving towards this
newer, more efficient service. Improvements in data capacity and message delivery are a couple
key improvements on Google’s recent service. The overall architecture of Google’s service is the
same (enable the Google service on the target device, send a message, and receive a message),
but advancements have been made that make GCM a notable improvement over C2DM.
Figure 4. GCM architectural overview. (Provided by Basavraj)
Notable Differences
Basavraj highlights several key differences that GCM implements versus C2DM:
Simple API Key – The API key is used in the header that communicates with the GCM
server. This unique key is used during authentication checks
Sender ID – C2DM relied on an email address register the app and communicate with the
third party service. GCM uses the project number acquired from the API console
JSON format –This format is now supported, as well as allowing support for the previous
plain text style when sending messages
47
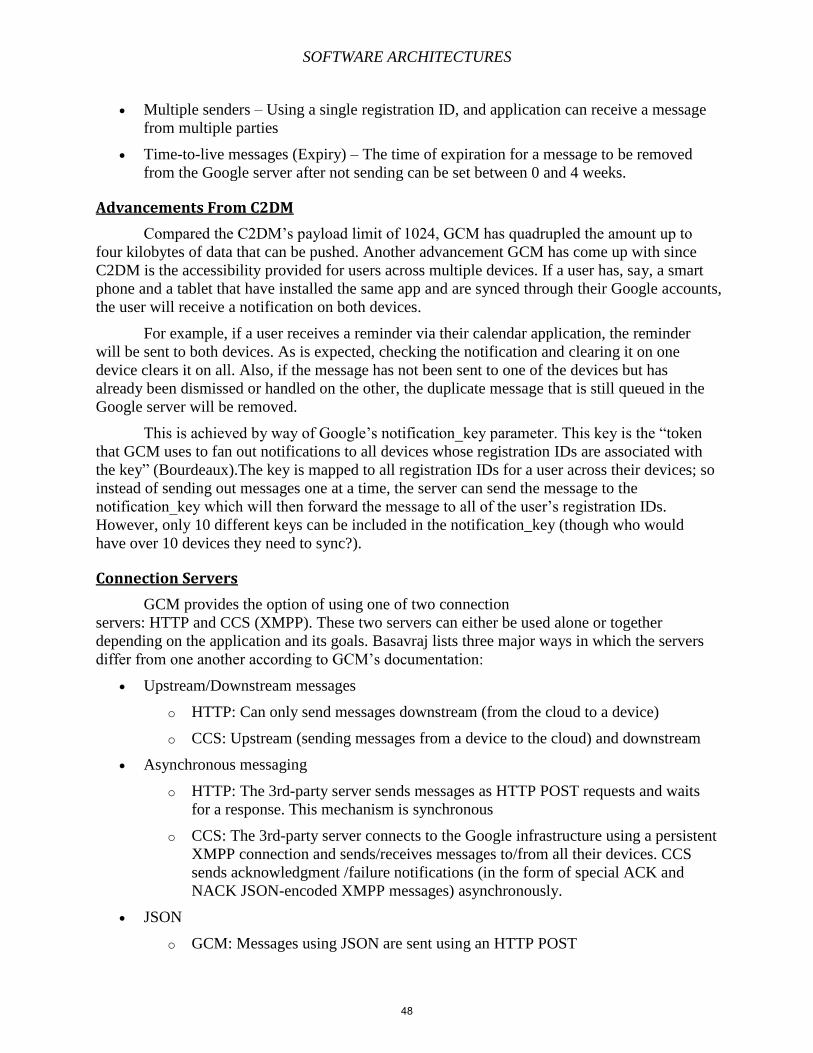
SOFTWARE ARCHITECTURES
Multiple senders – Using a single registration ID, and application can receive a message
from multiple parties
Time-to-live messages (Expiry) – The time of expiration for a message to be removed
from the Google server after not sending can be set between 0 and 4 weeks.
Advancements From C2DM
Compared the C2DM’s payload limit of 1024, GCM has quadrupled the amount up to
four kilobytes of data that can be pushed. Another advancement GCM has come up with since
C2DM is the accessibility provided for users across multiple devices. If a user has, say, a smart
phone and a tablet that have installed the same app and are synced through their Google accounts,
the user will receive a notification on both devices.
For example, if a user receives a reminder via their calendar application, the reminder
will be sent to both devices. As is expected, checking the notification and clearing it on one
device clears it on all. Also, if the message has not been sent to one of the devices but has
already been dismissed or handled on the other, the duplicate message that is still queued in the
Google server will be removed.
This is achieved by way of Google’s notification_key parameter. This key is the “token
that GCM uses to fan out notifications to all devices whose registration IDs are associated with
the key” (Bourdeaux).The key is mapped to all registration IDs for a user across their devices; so
instead of sending out messages one at a time, the server can send the message to the
notification_key which will then forward the message to all of the user’s registration IDs.
However, only 10 different keys can be included in the notification_key (though who would
have over 10 devices they need to sync?).
Connection Servers
GCM provides the option of using one of two connection
servers: HTTP and CCS (XMPP). These two servers can either be used alone or together
depending on the application and its goals. Basavraj lists three major ways in which the servers
differ from one another according to GCM’s documentation:
Upstream/Downstream messages
o HTTP: Can only send messages downstream (from the cloud to a device)
o CCS: Upstream (sending messages from a device to the cloud) and downstream
Asynchronous messaging
o HTTP: The 3rd-party server sends messages as HTTP POST requests and waits
for a response. This mechanism is synchronous
o CCS: The 3rd-party server connects to the Google infrastructure using a persistent
XMPP connection and sends/receives messages to/from all their devices. CCS
sends acknowledgment /failure notifications (in the form of special ACK and
NACK JSON-encoded XMPP messages) asynchronously.
JSON
o GCM: Messages using JSON are sent using an HTTP POST
48
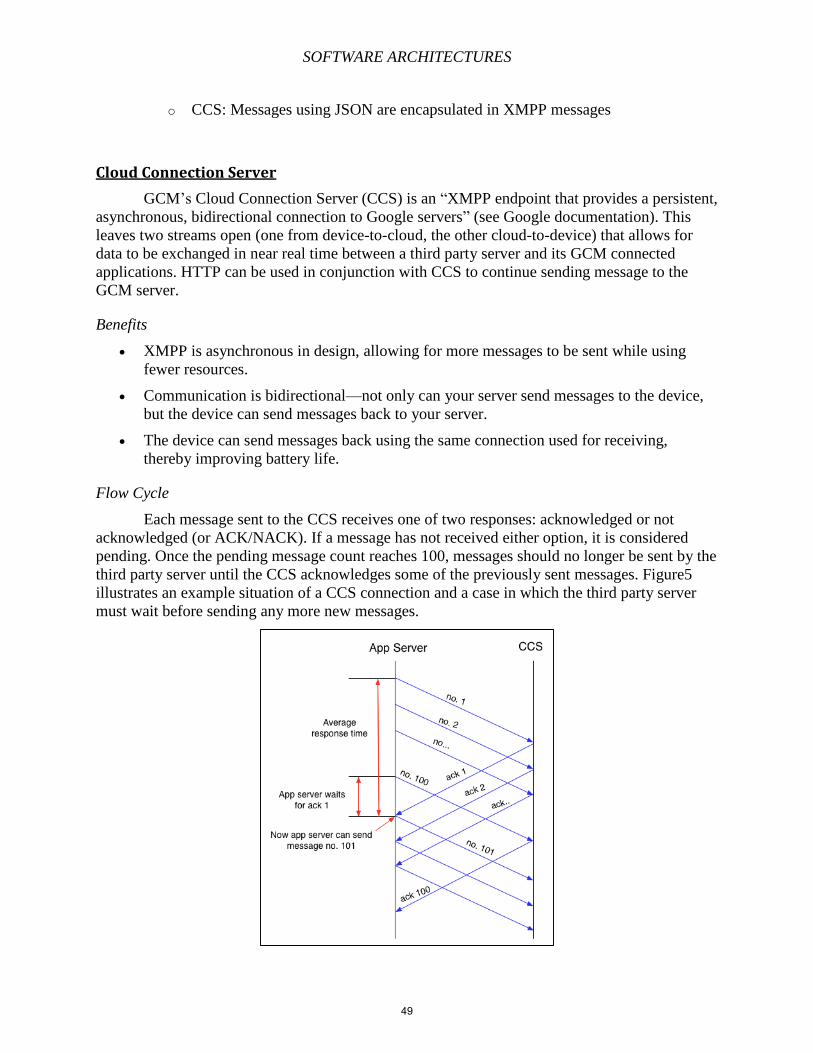
SOFTWARE ARCHITECTURES
o CCS: Messages using JSON are encapsulated in XMPP messages
Cloud Connection Server
GCM’s Cloud Connection Server (CCS) is an “XMPP endpoint that provides a persistent,
asynchronous, bidirectional connection to Google servers” (see Google documentation). This
leaves two streams open (one from device-to-cloud, the other cloud-to-device) that allows for
data to be exchanged in near real time between a third party server and its GCM connected
applications. HTTP can be used in conjunction with CCS to continue sending message to the
GCM server.
Benefits
XMPP is asynchronous in design, allowing for more messages to be sent while using
fewer resources.
Communication is bidirectional—not only can your server send messages to the device,
but the device can send messages back to your server.
The device can send messages back using the same connection used for receiving,
thereby improving battery life.
Flow Cycle
Each message sent to the CCS receives one of two responses: acknowledged or not
acknowledged (or ACK/NACK). If a message has not received either option, it is considered
pending. Once the pending message count reaches 100, messages should no longer be sent by the
third party server until the CCS acknowledges some of the previously sent messages. Figure5
illustrates an example situation of a CCS connection and a case in which the third party server
must wait before sending any more new messages.
49
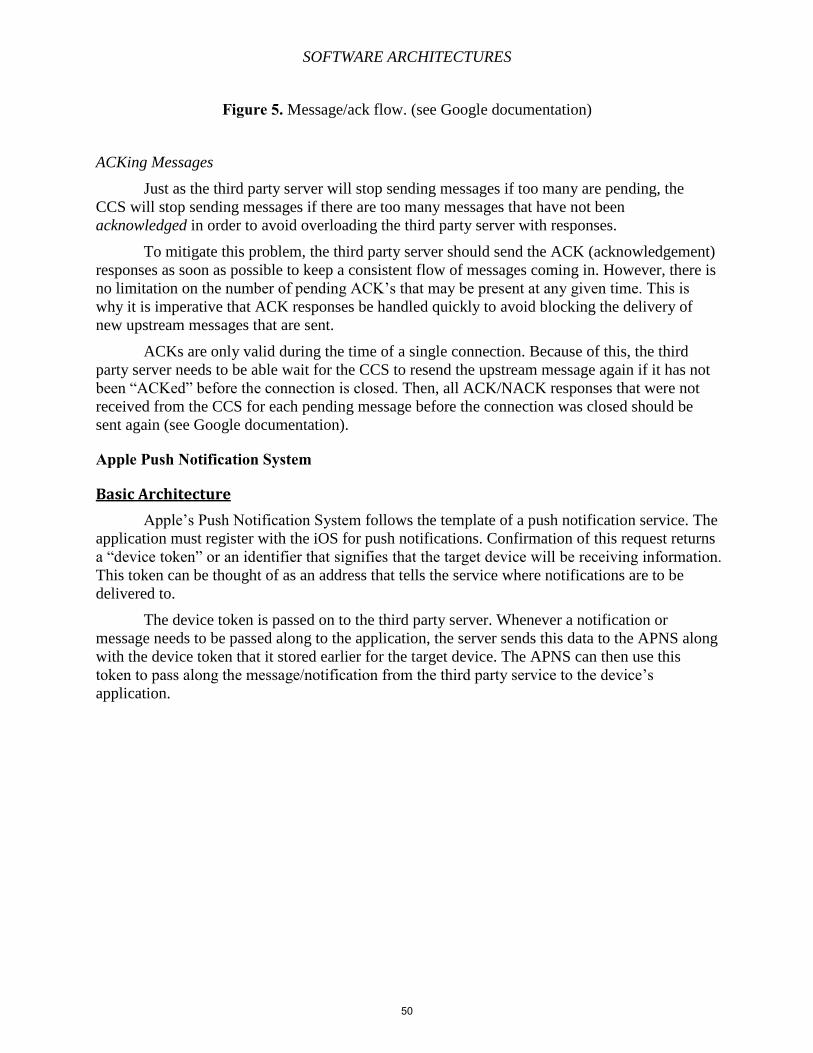
SOFTWARE ARCHITECTURES
Figure 5. Message/ack flow. (see Google documentation)
ACKing Messages
Just as the third party server will stop sending messages if too many are pending, the
CCS will stop sending messages if there are too many messages that have not been
acknowledged in order to avoid overloading the third party server with responses.
To mitigate this problem, the third party server should send the ACK (acknowledgement)
responses as soon as possible to keep a consistent flow of messages coming in. However, there is
no limitation on the number of pending ACK’s that may be present at any given time. This is
why it is imperative that ACK responses be handled quickly to avoid blocking the delivery of
new upstream messages that are sent.
ACKs are only valid during the time of a single connection. Because of this, the third
party server needs to be able wait for the CCS to resend the upstream message again if it has not
been “ACKed” before the connection is closed. Then, all ACK/NACK responses that were not
received from the CCS for each pending message before the connection was closed should be
sent again (see Google documentation).
Apple Push Notification System
Basic Architecture
Apple’s Push Notification System follows the template of a push notification service. The
application must register with the iOS for push notifications. Confirmation of this request returns
a “device token” or an identifier that signifies that the target device will be receiving information.
This token can be thought of as an address that tells the service where notifications are to be
delivered to.
The device token is passed on to the third party server. Whenever a notification or
message needs to be passed along to the application, the server sends this data to the APNS along
with the device token that it stored earlier for the target device. The APNS can then use this
token to pass along the message/notification from the third party service to the device’s
application.
50
SOFTWARE ARCHITECTURES
Figure 6. Basic workflow of APNS. (Table provided by Hafizji)
Payload
Apple’s payload comes in some distinct ways compared to Google’s notification system.
The structure is the same in that the payload is represented by a key-value pair. However,
Apple’s maximum size allowed for a payload is only 256 bytes—a small amount compared to
Google’s four kilobytes.
Similarly to Google, Apple also uses JSON objects to exchange information between
applications and servers. However, Apple allows for three different styles of notifications to be
delivered:
1) A standard alert message
2) A badge icon over the app icon with a number indicating the number of new
notifications
3) A sound to play
Below is an example of a JSON object. The “alert” and “sound” tags are the key-value
pairs of the “aps” object, which is referred to as a dictionary type (this type is similar to the map
51
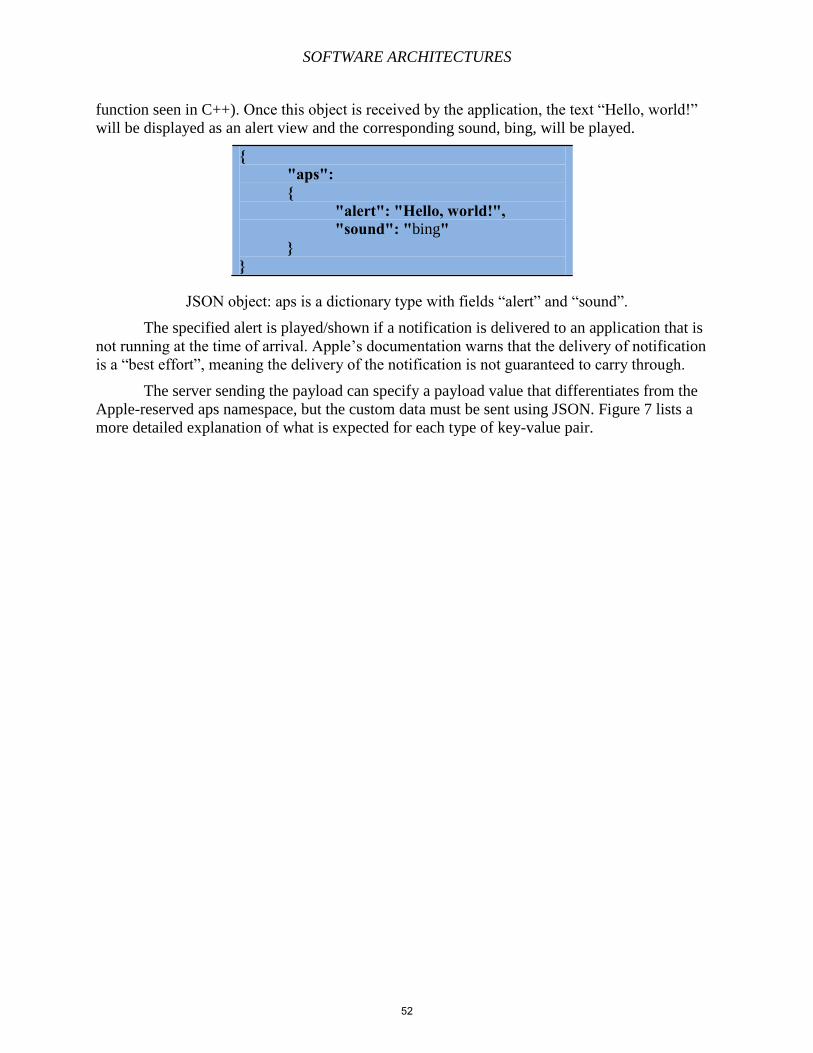
SOFTWARE ARCHITECTURES
function seen in C++). Once this object is received by the application, the text “Hello, world!”
will be displayed as an alert view and the corresponding sound, bing, will be played.
{ "aps": { "alert": "Hello, world!", "sound": "bing" } }
JSON object: aps is a dictionary type with fields “alert” and “sound”.
The specified alert is played/shown if a notification is delivered to an application that is
not running at the time of arrival. Apple’s documentation warns that the delivery of notification
is a “best effort”, meaning the delivery of the notification is not guaranteed to carry through.
The server sending the payload can specify a payload value that differentiates from the
Apple-reserved aps namespace, but the custom data must be sent using JSON. Figure 7 lists a
more detailed explanation of what is expected for each type of key-value pair.
52
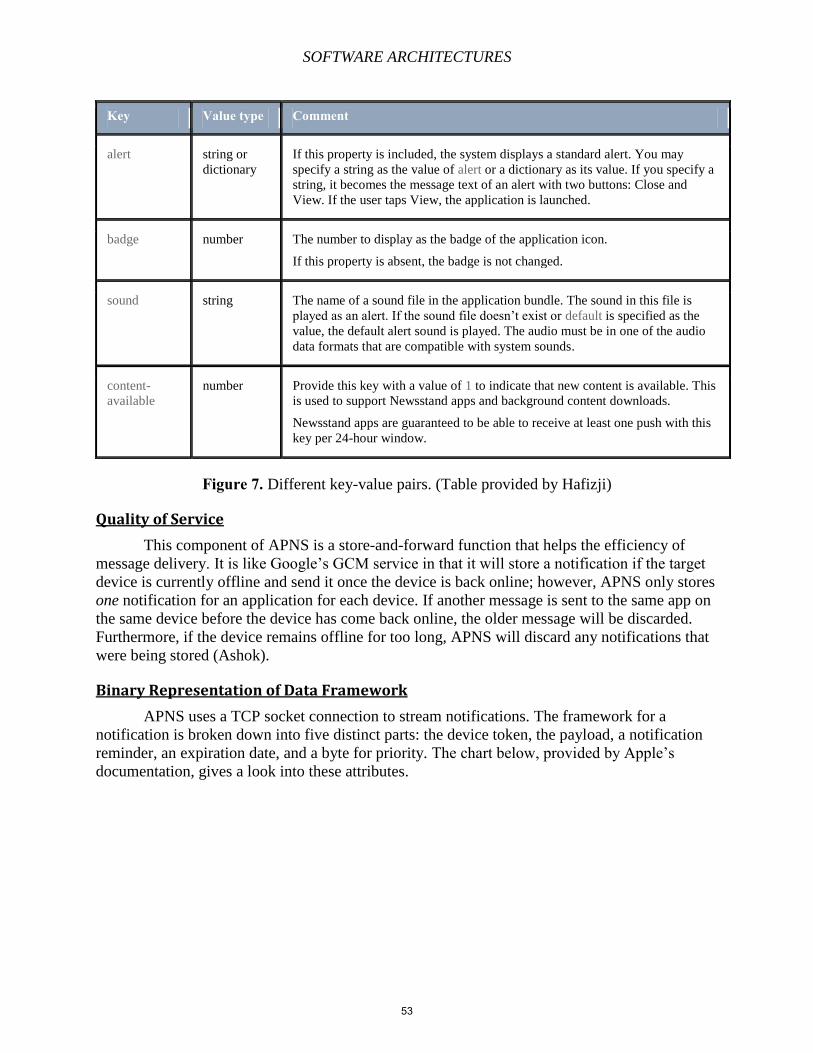
SOFTWARE ARCHITECTURES
Key Value type Comment
alert string or
dictionary
If this property is included, the system displays a standard alert. You may
specify a string as the value of alert or a dictionary as its value. If you specify a
string, it becomes the message text of an alert with two buttons: Close and
View. If the user taps View, the application is launched.
badge number The number to display as the badge of the application icon.
If this property is absent, the badge is not changed.
sound string The name of a sound file in the application bundle. The sound in this file is
played as an alert. If the sound file doesn’t exist or default is specified as the
value, the default alert sound is played. The audio must be in one of the audio
data formats that are compatible with system sounds.
content-
available
number Provide this key with a value of 1 to indicate that new content is available. This
is used to support Newsstand apps and background content downloads.
Newsstand apps are guaranteed to be able to receive at least one push with this
key per 24-hour window.
Figure 7. Different key-value pairs. (Table provided by Hafizji)
Quality of Service
This component of APNS is a store-and-forward function that helps the efficiency of
message delivery. It is like Google’s GCM service in that it will store a notification if the target
device is currently offline and send it once the device is back online; however, APNS only stores
one notification for an application for each device. If another message is sent to the same app on
the same device before the device has come back online, the older message will be discarded.
Furthermore, if the device remains offline for too long, APNS will discard any notifications that
were being stored (Ashok).
Binary Representation of Data Framework
APNS uses a TCP socket connection to stream notifications. The framework for a
notification is broken down into five distinct parts: the device token, the payload, a notification
reminder, an expiration date, and a byte for priority. The chart below, provided by Apple’s
documentation, gives a look into these attributes.
53
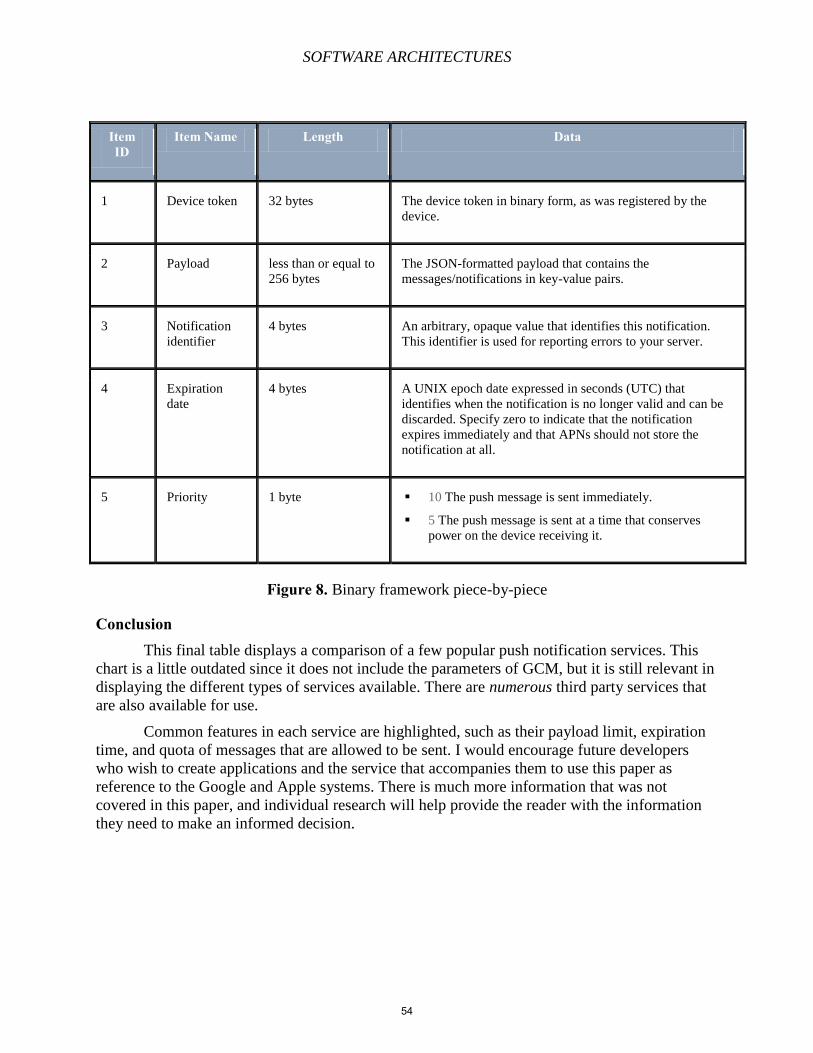
SOFTWARE ARCHITECTURES
Figure 8. Binary framework piece-by-piece
Conclusion This final table displays a comparison of a few popular push notification services. This
chart is a little outdated since it does not include the parameters of GCM, but it is still relevant in
displaying the different types of services available. There are numerous third party services that
are also available for use.
Common features in each service are highlighted, such as their payload limit, expiration
time, and quota of messages that are allowed to be sent. I would encourage future developers
who wish to create applications and the service that accompanies them to use this paper as
reference to the Google and Apple systems. There is much more information that was not
covered in this paper, and individual research will help provide the reader with the information
they need to make an informed decision.
Item ID
Item Name Length Data
1 Device token 32 bytes The device token in binary form, as was registered by the
device.
2 Payload less than or equal to
256 bytes
The JSON-formatted payload that contains the
messages/notifications in key-value pairs.
3 Notification
identifier
4 bytes An arbitrary, opaque value that identifies this notification.
This identifier is used for reporting errors to your server.
4 Expiration
date
4 bytes A UNIX epoch date expressed in seconds (UTC) that
identifies when the notification is no longer valid and can be
discarded. Specify zero to indicate that the notification
expires immediately and that APNs should not store the
notification at all.
5 Priority 1 byte 10 The push message is sent immediately.
5 The push message is sent at a time that conserves
power on the device receiving it.
54
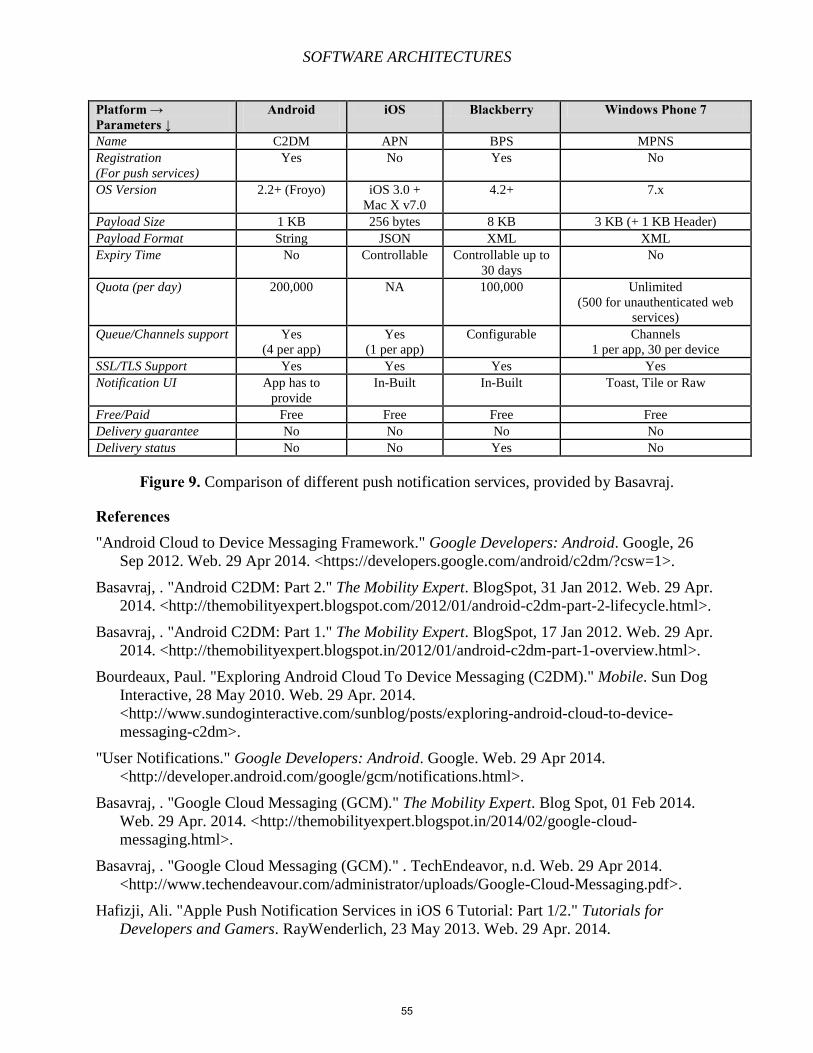
SOFTWARE ARCHITECTURES
Platform →
Parameters ↓
Android
iOS Blackberry Windows Phone 7
Name C2DM APN BPS MPNS
Registration
(For push services)
Yes No Yes No
OS Version 2.2+ (Froyo) iOS 3.0 +
Mac X v7.0
4.2+ 7.x
Payload Size 1 KB 256 bytes 8 KB 3 KB (+ 1 KB Header)
Payload Format String JSON XML XML
Expiry Time No Controllable Controllable up to
30 days
No
Quota (per day) 200,000 NA 100,000 Unlimited
(500 for unauthenticated web
services)
Queue/Channels support Yes
(4 per app)
Yes
(1 per app)
Configurable Channels
1 per app, 30 per device
SSL/TLS Support Yes Yes Yes Yes
Notification UI App has to
provide
In-Built In-Built Toast, Tile or Raw
Free/Paid Free Free Free Free
Delivery guarantee No No No No
Delivery status No No Yes No
Figure 9. Comparison of different push notification services, provided by Basavraj.
References "Android Cloud to Device Messaging Framework." Google Developers: Android. Google, 26
Sep 2012. Web. 29 Apr 2014. <https://developers.google.com/android/c2dm/?csw=1>.
Basavraj, . "Android C2DM: Part 2." The Mobility Expert. BlogSpot, 31 Jan 2012. Web. 29 Apr.
2014. <http://themobilityexpert.blogspot.com/2012/01/android-c2dm-part-2-lifecycle.html>.
Basavraj, . "Android C2DM: Part 1." The Mobility Expert. BlogSpot, 17 Jan 2012. Web. 29 Apr.
2014. <http://themobilityexpert.blogspot.in/2012/01/android-c2dm-part-1-overview.html>.
Bourdeaux, Paul. "Exploring Android Cloud To Device Messaging (C2DM)." Mobile. Sun Dog
Interactive, 28 May 2010. Web. 29 Apr. 2014.
<http://www.sundoginteractive.com/sunblog/posts/exploring-android-cloud-to-device-
messaging-c2dm>.
"User Notifications." Google Developers: Android. Google. Web. 29 Apr 2014.
<http://developer.android.com/google/gcm/notifications.html>.
Basavraj, . "Google Cloud Messaging (GCM)." The Mobility Expert. Blog Spot, 01 Feb 2014.
Web. 29 Apr. 2014. <http://themobilityexpert.blogspot.in/2014/02/google-cloud-
messaging.html>.
Basavraj, . "Google Cloud Messaging (GCM)." . TechEndeavor, n.d. Web. 29 Apr 2014.
<http://www.techendeavour.com/administrator/uploads/Google-Cloud-Messaging.pdf>.
Hafizji, Ali. "Apple Push Notification Services in iOS 6 Tutorial: Part 1/2." Tutorials for
Developers and Gamers. RayWenderlich, 23 May 2013. Web. 29 Apr. 2014.
55

SOFTWARE ARCHITECTURES
<http://www.raywenderlich.com/32960/apple-push-notification-services-in-ios-6-tutorial-
part-1>.
Basavraj, . "Android C2DM: Part 3." The Mobility Expert. BlogSpot, 16 Feb 2012. Web. 29 Apr.
2014. <http://themobilityexpert.blogspot.in/2012/02/android-c2dm-part-3.html>.
Kumar, Ashok. "Apple Push Notification Service."SlideShare.net. N.p., 25 Feb 2013. Web. 29
Apr 2014. <http://www.slideshare.net/ashokkk/apple-push-notification-service>.
56
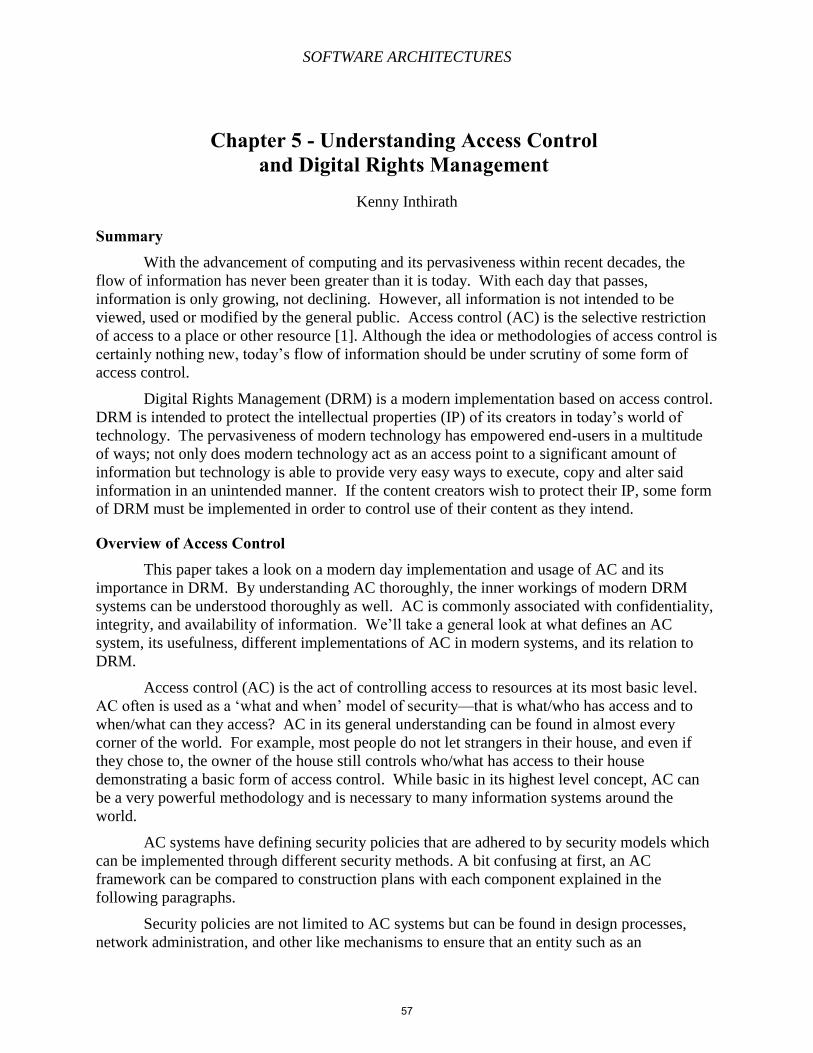
SOFTWARE ARCHITECTURES
Chapter 5 - Understanding Access Control and Digital Rights Management
Kenny Inthirath
Summary With the advancement of computing and its pervasiveness within recent decades, the
flow of information has never been greater than it is today. With each day that passes,
information is only growing, not declining. However, all information is not intended to be
viewed, used or modified by the general public. Access control (AC) is the selective restriction
of access to a place or other resource [1]. Although the idea or methodologies of access control is
certainly nothing new, today’s flow of information should be under scrutiny of some form of
access control.
Digital Rights Management (DRM) is a modern implementation based on access control.
DRM is intended to protect the intellectual properties (IP) of its creators in today’s world of
technology. The pervasiveness of modern technology has empowered end-users in a multitude
of ways; not only does modern technology act as an access point to a significant amount of
information but technology is able to provide very easy ways to execute, copy and alter said
information in an unintended manner. If the content creators wish to protect their IP, some form
of DRM must be implemented in order to control use of their content as they intend.
Overview of Access Control This paper takes a look on a modern day implementation and usage of AC and its
importance in DRM. By understanding AC thoroughly, the inner workings of modern DRM
systems can be understood thoroughly as well. AC is commonly associated with confidentiality,
integrity, and availability of information. We’ll take a general look at what defines an AC
system, its usefulness, different implementations of AC in modern systems, and its relation to
DRM.
Access control (AC) is the act of controlling access to resources at its most basic level.
AC often is used as a ‘what and when’ model of security—that is what/who has access and to
when/what can they access? AC in its general understanding can be found in almost every
corner of the world. For example, most people do not let strangers in their house, and even if
they chose to, the owner of the house still controls who/what has access to their house
demonstrating a basic form of access control. While basic in its highest level concept, AC can
be a very powerful methodology and is necessary to many information systems around the
world.
AC systems have defining security policies that are adhered to by security models which
can be implemented through different security methods. A bit confusing at first, an AC
framework can be compared to construction plans with each component explained in the
following paragraphs.
Security policies are not limited to AC systems but can be found in design processes,
network administration, and other like mechanisms to ensure that an entity such as an
57

SOFTWARE ARCHITECTURES
organization or system is secure. Security policies are guidelines that do not explicitly tell you
how to incorporate those guidelines. Overall goals are there but details are not. Security policies
detail documents that express concisely what protection is needed and what defines a secure state
for the system. In our construction plan analogy, it is very similar to blueprints of a house where
the document represents the overall framework for the construction project but lacks the details
to actually build the house and thus it is up to the construction firm on how they wish to build it.
Security models are interpretations of security policies and are the detailed
implementation and incorporation of those guidelines. Security models map techniques
necessary to enforce the security policies represented by mathematics and analytical ideas.
Four common models will be covered in this paper: Mandatory Access Control (MAC), Role
Based Access Control (RBAC), Discretionary Access Control (DAC) and Rule Based-Role
Based Access Control (RB-RBAC). In our blueprint example, a security model would be the
detailed plans on how to carry out construction of the building, electrical, plumbing and various
other systems.
Access control methods are techniques used to implement security models that align with
the respective model. Methods can be broken down into two categories, Logical Access Control
(LAC) and Physical Access Control (PAC). LAC focuses more on AC through permissions and
account restrictions whereas PAC utilizes physical barriers to prevent unauthorized access. Each
category has various implementations depending on the security model chosen. In our
construction analogy, access control methods can be thought of the specific materials to use in
the electrical or plumbing system implementation.
Mandatory Access Control (MAC)
An access control model that enforces security policies independent of user operations
[2]. Only the owner has management of the AC and inversely the end user has no control over
any settings for anyone. The two common models associated with MAC are the Bell-LaPadula
model and Biba model.
The Bell-LaPadula model was developed and is still in use for government and military
purposes focusing on confidentiality. The model works by having tiered levels of security where
a user at the highest level can only write at that level and nothing below it (write up), but can
also read at lower levels (read down). If one does not have the correct clearance level, then they
should not be able to access that information since it should be unassociated with them.
58
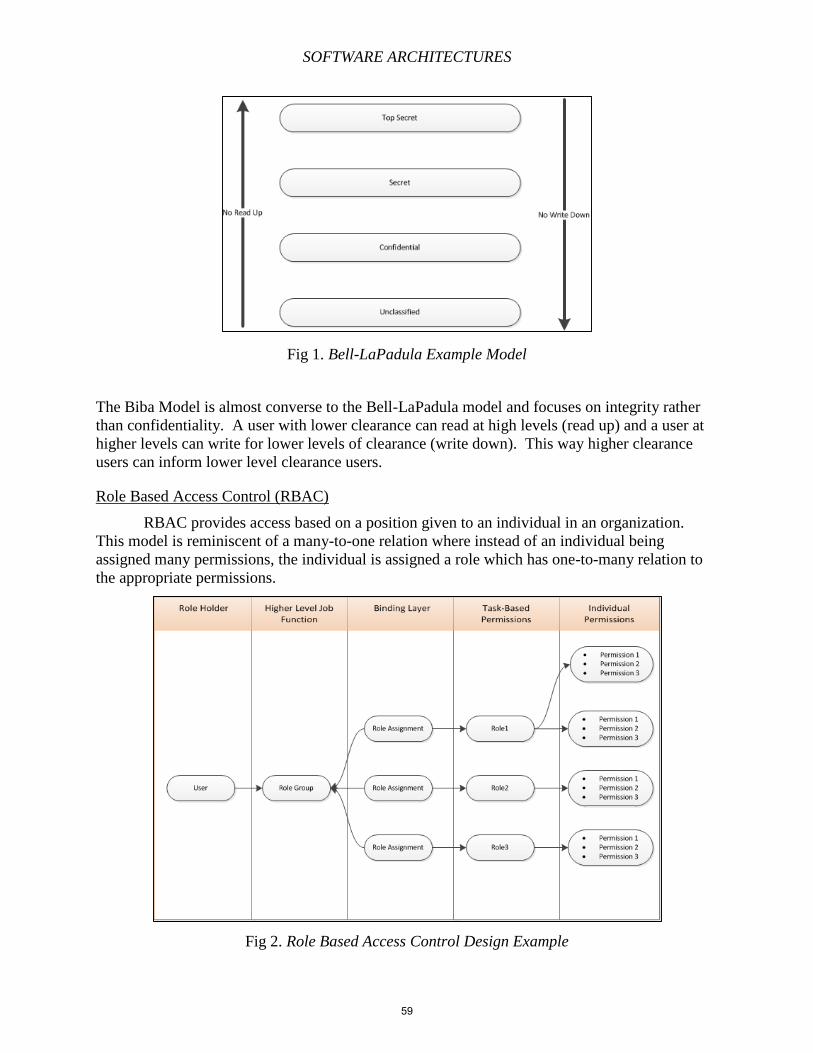
SOFTWARE ARCHITECTURES
Fig 1. Bell-LaPadula Example Model
The Biba Model is almost converse to the Bell-LaPadula model and focuses on integrity rather
than confidentiality. A user with lower clearance can read at high levels (read up) and a user at
higher levels can write for lower levels of clearance (write down). This way higher clearance
users can inform lower level clearance users.
Role Based Access Control (RBAC)
RBAC provides access based on a position given to an individual in an organization.
This model is reminiscent of a many-to-one relation where instead of an individual being
assigned many permissions, the individual is assigned a role which has one-to-many relation to
the appropriate permissions.
Fig 2. Role Based Access Control Design Example
59
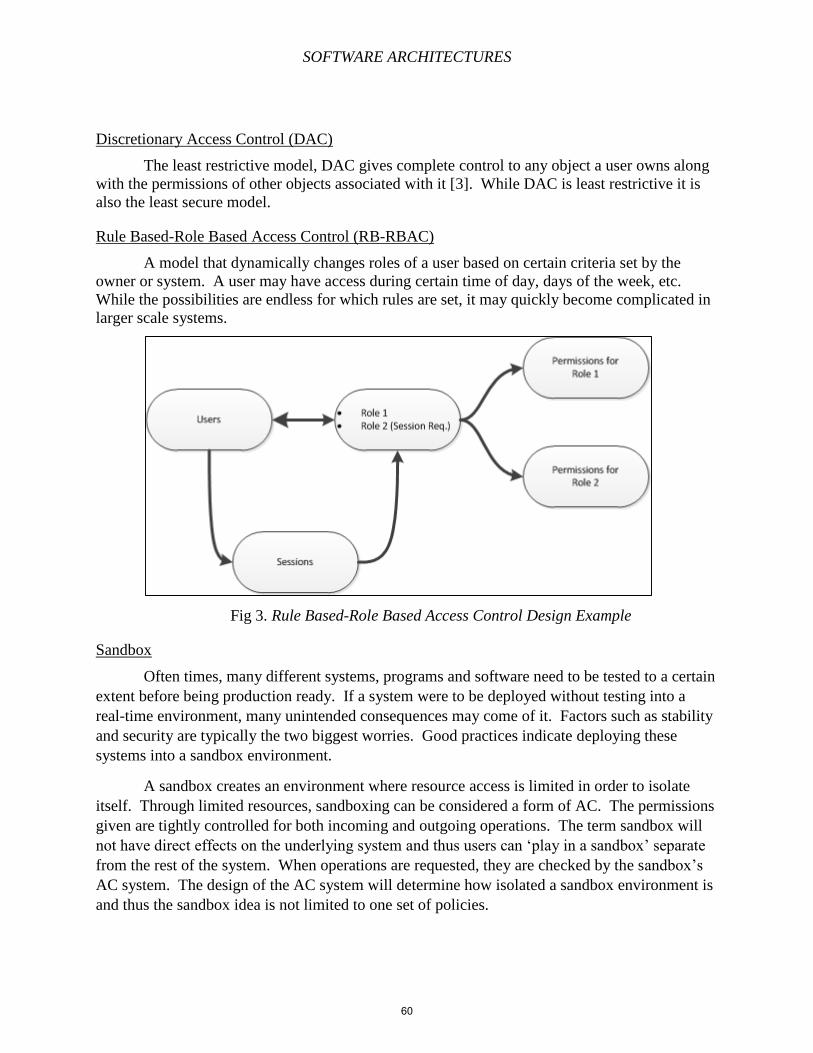
SOFTWARE ARCHITECTURES
Discretionary Access Control (DAC)
The least restrictive model, DAC gives complete control to any object a user owns along
with the permissions of other objects associated with it [3]. While DAC is least restrictive it is
also the least secure model.
Rule Based-Role Based Access Control (RB-RBAC)
A model that dynamically changes roles of a user based on certain criteria set by the
owner or system. A user may have access during certain time of day, days of the week, etc.
While the possibilities are endless for which rules are set, it may quickly become complicated in
larger scale systems.
Fig 3. Rule Based-Role Based Access Control Design Example
Sandbox
Often times, many different systems, programs and software need to be tested to a certain
extent before being production ready. If a system were to be deployed without testing into a
real-time environment, many unintended consequences may come of it. Factors such as stability
and security are typically the two biggest worries. Good practices indicate deploying these
systems into a sandbox environment.
A sandbox creates an environment where resource access is limited in order to isolate
itself. Through limited resources, sandboxing can be considered a form of AC. The permissions
given are tightly controlled for both incoming and outgoing operations. The term sandbox will
not have direct effects on the underlying system and thus users can ‘play in a sandbox’ separate
from the rest of the system. When operations are requested, they are checked by the sandbox’s
AC system. The design of the AC system will determine how isolated a sandbox environment is
and thus the sandbox idea is not limited to one set of policies.
60
SOFTWARE ARCHITECTURES
The design of the AC system depends on the software being tested or testing procedures.
The goal of a sandbox is eventually integrate the new system eventually in the production
environment and thus each sandbox will have different requirements to test and thus different
levels of access to different resources.
Case Study: HPAnywhere
With the mass adoption of smartphones and other such capable devices, the policy of
Bring Your Own Device (BYOD) has become a hot topic in many workplaces and institutions in
today’s society. Due to the computational power of smartphones, low cost and wide availability
they have increased innovation and productivity in many lives over. The benefits can be carried
though a traditional workplace if employees were able to use and have resources provided for
their personal smartphones for work. This can potentially cut company cost by not having to
purchase as much hardware, but more importantly take advantage of the ability to consume data
anywhere, anytime provided by smartphones. However, many security issues are raised when the
policy of BYOD is considered. IT departments must make sure that these devices comply with
company security standards, compliances and are generally acceptable to use within such an
environment.
Hewlett-Packard’s (HP) solution to mobile devices in the work place comes in the form
of the HPAnywhere platform. HPAnywhere provides a secure container environment for
HTML5 based mini-applications (miniapps). Miniapps are developed using HTML5 ensuring
cross platform compatibility between mobile operating systems and are then placed on an
HPAnywhere server. Each application has its own Java based backend application that can be
called by the miniapp using RESTful webservices which acts as the business logic to a backend
resource. The power of HPAnywhere comes with the platform acting as a secure middleman
between mobile devices and resources behind corporate firewalls; this intermittent connection
creates a secure channel between personal devices and corporate resources in the form a
smartphone application.
A user first provides login credentials in the HPAnywhere app for smartphones. The
login credentials are connected to a reverse proxy who returns a session cookie allowing the
phone to access resources behind a corporate firewall. Once the cookie is received, the user has
access to the HPAnywhere server. Since the miniapps are stored on the server, each miniapp is
loaded on demand. However, HPAnywhere provides another form of access control in
administration of the miniapps.
61
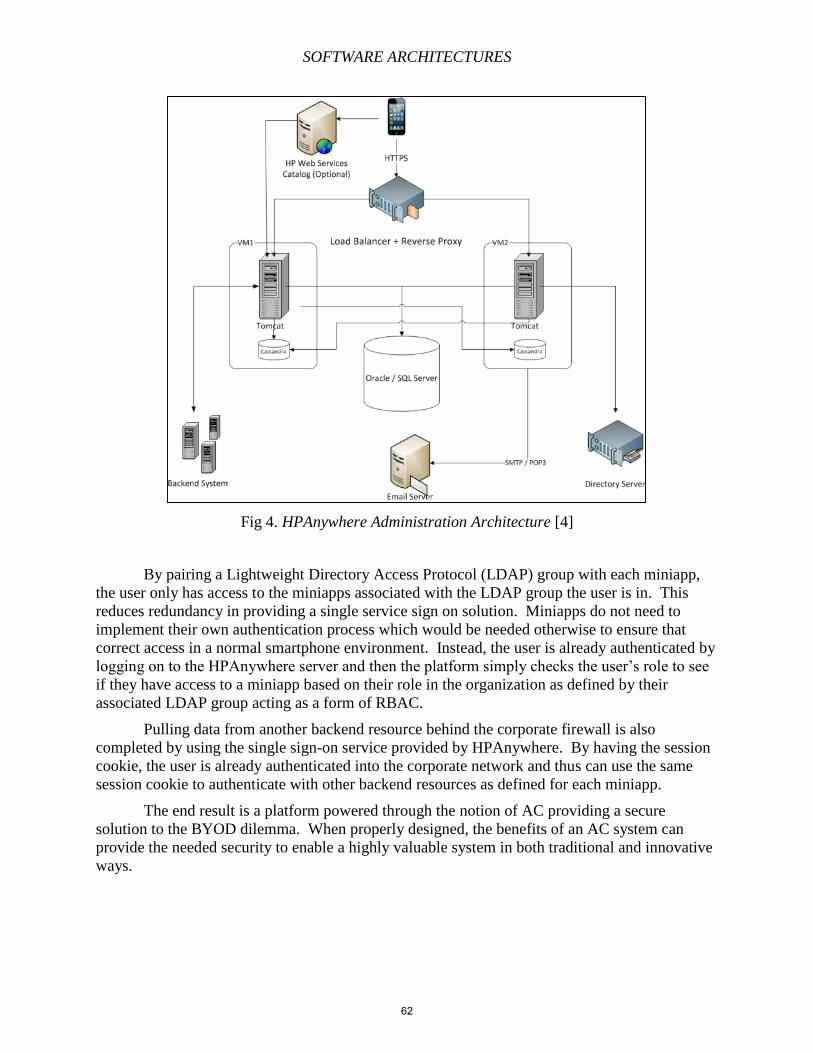
SOFTWARE ARCHITECTURES
Fig 4. HPAnywhere Administration Architecture [4]
By pairing a Lightweight Directory Access Protocol (LDAP) group with each miniapp,
the user only has access to the miniapps associated with the LDAP group the user is in. This
reduces redundancy in providing a single service sign on solution. Miniapps do not need to
implement their own authentication process which would be needed otherwise to ensure that
correct access in a normal smartphone environment. Instead, the user is already authenticated by
logging on to the HPAnywhere server and then the platform simply checks the user’s role to see
if they have access to a miniapp based on their role in the organization as defined by their
associated LDAP group acting as a form of RBAC.
Pulling data from another backend resource behind the corporate firewall is also
completed by using the single sign-on service provided by HPAnywhere. By having the session
cookie, the user is already authenticated into the corporate network and thus can use the same
session cookie to authenticate with other backend resources as defined for each miniapp.
The end result is a platform powered through the notion of AC providing a secure
solution to the BYOD dilemma. When properly designed, the benefits of an AC system can
provide the needed security to enable a highly valuable system in both traditional and innovative
ways.
62
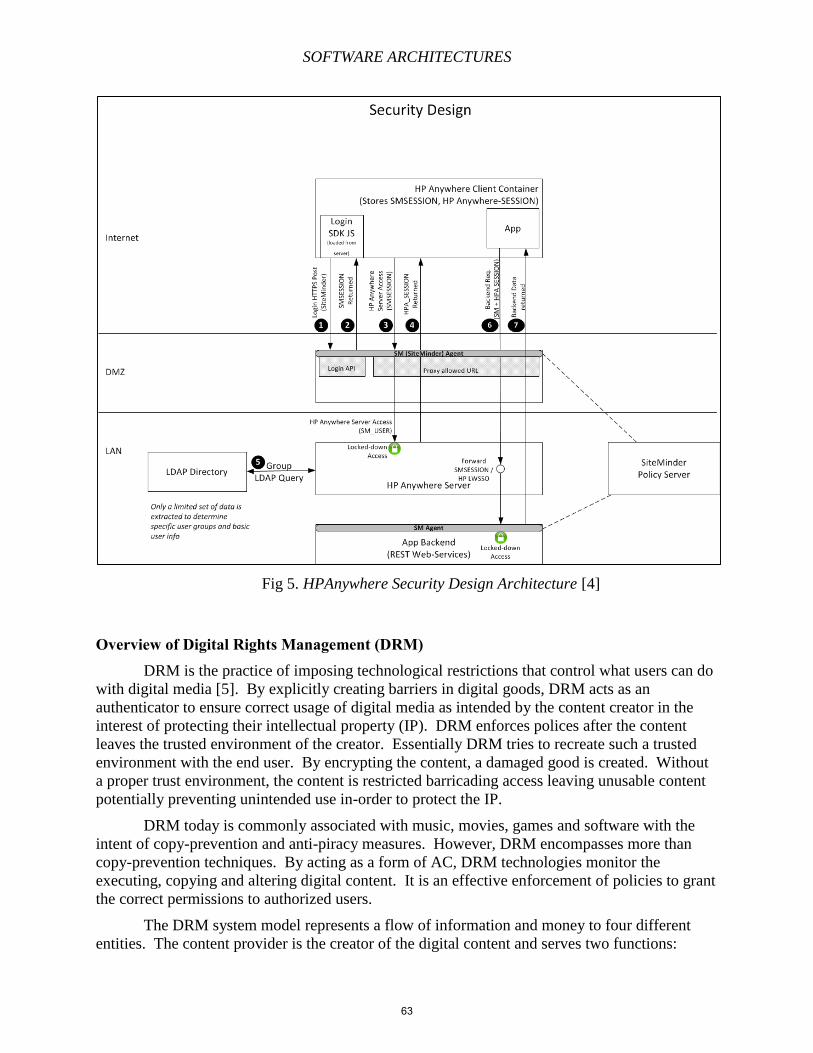
SOFTWARE ARCHITECTURES
Fig 5. HPAnywhere Security Design Architecture [4]
Overview of Digital Rights Management (DRM) DRM is the practice of imposing technological restrictions that control what users can do
with digital media [5]. By explicitly creating barriers in digital goods, DRM acts as an
authenticator to ensure correct usage of digital media as intended by the content creator in the
interest of protecting their intellectual property (IP). DRM enforces polices after the content
leaves the trusted environment of the creator. Essentially DRM tries to recreate such a trusted
environment with the end user. By encrypting the content, a damaged good is created. Without
a proper trust environment, the content is restricted barricading access leaving unusable content
potentially preventing unintended use in-order to protect the IP.
DRM today is commonly associated with music, movies, games and software with the
intent of copy-prevention and anti-piracy measures. However, DRM encompasses more than
copy-prevention techniques. By acting as a form of AC, DRM technologies monitor the
executing, copying and altering digital content. It is an effective enforcement of policies to grant
the correct permissions to authorized users.
The DRM system model represents a flow of information and money to four different
entities. The content provider is the creator of the digital content and serves two functions:
63
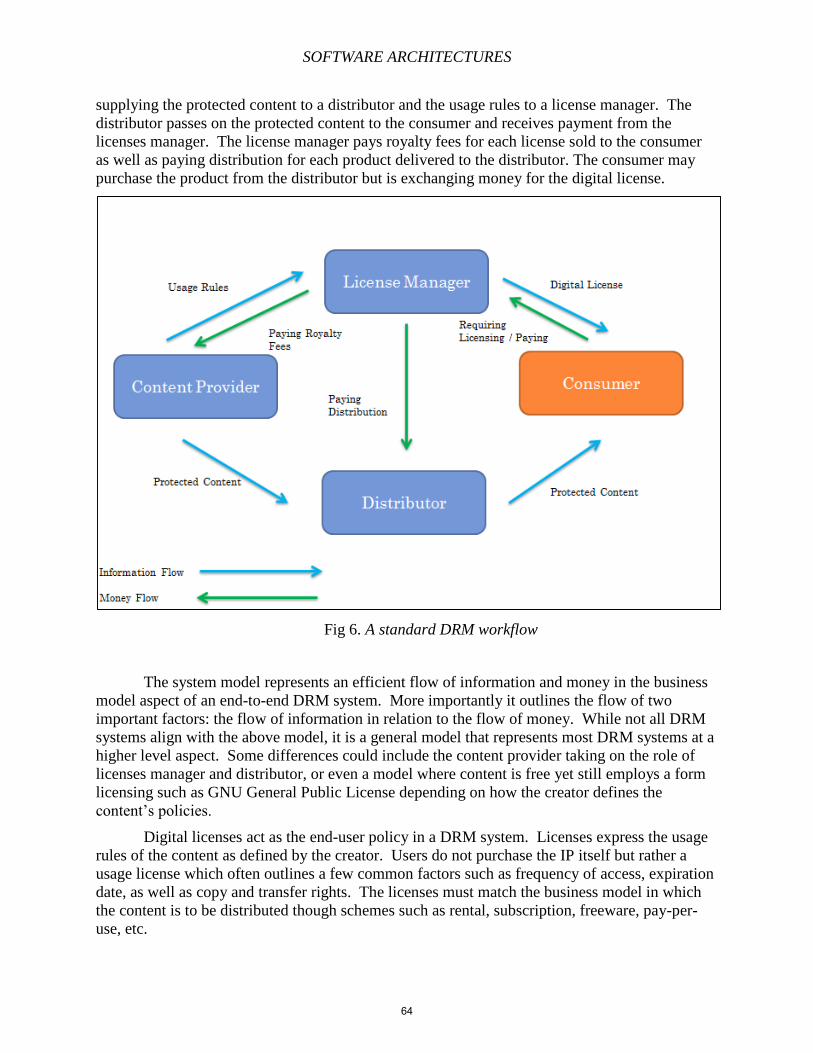
SOFTWARE ARCHITECTURES
supplying the protected content to a distributor and the usage rules to a license manager. The
distributor passes on the protected content to the consumer and receives payment from the
licenses manager. The license manager pays royalty fees for each license sold to the consumer
as well as paying distribution for each product delivered to the distributor. The consumer may
purchase the product from the distributor but is exchanging money for the digital license.
Fig 6. A standard DRM workflow
The system model represents an efficient flow of information and money in the business
model aspect of an end-to-end DRM system. More importantly it outlines the flow of two
important factors: the flow of information in relation to the flow of money. While not all DRM
systems align with the above model, it is a general model that represents most DRM systems at a
higher level aspect. Some differences could include the content provider taking on the role of
licenses manager and distributor, or even a model where content is free yet still employs a form
licensing such as GNU General Public License depending on how the creator defines the
content’s policies.
Digital licenses act as the end-user policy in a DRM system. Licenses express the usage
rules of the content as defined by the creator. Users do not purchase the IP itself but rather a
usage license which often outlines a few common factors such as frequency of access, expiration
date, as well as copy and transfer rights. The licenses must match the business model in which
the content is to be distributed though schemes such as rental, subscription, freeware, pay-per-
use, etc.
64
SOFTWARE ARCHITECTURES
History of DRM
While the distribution of copyrighted material is nothing new, there has always been a
fear of new media technologies. One of the better known examples comes from a congressional
hearing in 1982 where the Motion Picture Association of America (MPAA) proclaims “I say to
you that the VCR is to the American Film producer and the American public as the Boston
strangler is to the woman home alone” [6]. While hyperbolic in description, it shows the
extremity of what the MPAA thought of the VCR at the time and the capabilities many media
industries feared. The Recording Industry of American (RIAA) expresses similar sentiments in a
1990 hearing. “For many years, the music industry has been gravely concerned about the
devastating impact of home taping “.
While iterations of new technologies were being released, content providers became
increasingly skeptical and the fear of unintended and illegal circulation continued to increase.
Content media giants begin to war with piracy by forcing prevention measures upon all
consumers, legitimate or not. The industry that deemed prevention measures must be taken into
account was (and still are) financially and politically strong organizations with seemingly little
opposition at the time. It can be said that their interest was in maximizing and securing profits
by this new standard they sought to impose by protecting their IP.
One of the first legislation to be introduced was the Audio Home Recording Act (AHRA)
in 1987. The arrival of a new audio medium Digital Audio Tapes (DAT) allowed consumers to
make their own recordings with quality comparable to compact discs. The recording industry
lobbied for legislation in the U.S. that required the production or import of DAT recorders to
include copy-control techniques. While the music industry had already opposed home taping,
they did not want to integrate such a possibility for this to become a standard in the U.S.
Through lobbying, threats, and market pressure, the recording industry was prepared to have
strict regulations in the sale and purchase of DAT recorders. One of the consequences of the
harsh opposition kept DAT recorders out of U.S. stores for years in favor of the recording
industry. Eventually the recording industry and electronic industry came to an agreement that let
consumers legal right to make noncommercial recordings for personal enjoyment and
manufacturers the legal right to help them do so and eventually became law in 1992. AHRA was
quickly outdated.
The rise of home computers as entertainment systems quickly became a reality. A
revolution began with royalty-free copying and distribution of music through the ability to burn
CDs for use in personal CD players and cars. Even later, the widespread popularity of peer-to-
peer systems became prevalent in the home music revolution thanks to the internet. AHRA did
not cover the unforeseen revolution and thus the home computer based distribution was
unregulated. While there were still AHRA regulated devices and methods to consume music,
consumers preferred disc copying and file-sharing methods due to the regulations not present due
to its convenience. Thus AHRA became outdated and really only served as a stepping stone into
future DRM implementations.
Digital Millennium Copyright Act (DMCA)
Perhaps the most known and controversial copyright law in recent memory, the Digital
Millennium Copyright Act (DMCA) was a dramatic change to copyright law due to the
65
SOFTWARE ARCHITECTURES
forthcoming digital age. The DMCA criminalizes production and dissemination of technology,
devices, or services intended to circumvent measures that control access to copyrighted works.
[6]. with three different bans or stipulations the first follows as “No person shall circumvent a
technological measure that effectively controls access to a work protected under this title” [6].
The second ban prohibits manufacturing, importing and trafficking in tools aid in AC DRM
circumvention. The third ban prohibits tools to circumvent DRM systems that do not block
access but prevent unauthorized copying or alteration.
By 1994, the internet was becoming more commonplace as the number of users would
begin to come into the tens of millions within the next few years. Copyright holders came to fear
the age of the internet and quickly developed policies to address of online copyright
infringement. Media industries threatened to boycott the internet as a media outlet if stronger
copyright laws were not put in place. By seeking to force internet distribution through DRM
systems backed by the law, copyright holders were guaranteed an initial form of protection by
criminalizing circumvention of the AC provided by DRM systems.
The impact of DMCA created a significant shift in copyright law using it as a means for
regulation of technology. AHRA had only regulated a small class of technology whereas DMCA
can potentially regulate an infinite number of devices. Any copyrighted work that is digitized
can be wrapped in encryption and thus falls under regulation of DMCA.
One of the most notable cases appeared in 1999 when the infamous Napster became a
mainstream service. At its peak, Napster had 80 million registered users, and while there had
been other forms of file-sharing through a peer-to-peer program, Napster specialized in audio
files in the form of mp3. Napster gave the ability to acquire almost all of the music in the world
for free. The recording industry began suing Napster which led its eventual shutdown in 2001.
Despite the shutdown of Napster, more and more technologies came in its place and while they
come and go, they still remain prevalent in today’s world. P2P software is still readily available
as well as widely used. While multiple attempt to control its proliferation through legal means, it
has not worked.
Media industries began to target the user base by suing copyright infringers creating a
large spectacle regarding public relations. Some users sued included single mothers, deceased
individuals and even teenage girls. Again, the litigation brought forth did not have much effect
on the use of P2P. What ensued was a public relations nightmare for many companies. The
public outlook on such cases was ill-received garnering and becoming an object of hatred for
many young people and technology enthusiasts across the nation. The public support for to stop
copyright infringers are not apparent and continues in that direction today because of the large
hindrance created in most DRM systems.
Since DMCA has had such an adverse effect on copyright laws, it began as a precursor to
many hot topics surrounding the World Wide Web today. Bills such as the Stop Online Piracy
Act (SOPA) or Protect IP Act (PIPA) came from the fundamentals presented in the DMCA.
These bills are constantly in the public eye as they represent many issues in user privacy,
subjugation to mandatory AC, and other means of scrutiny by the government. Again, those in
favor for these bills tend to be large content corporations who seek to shape the landscape
through lobbying and litigation. However with the pervasiveness of technology and age of social
networks, many end users who would be affected are aware of such moves. There is a constant
struggle between both sides to find middle grounds as interest generally differ.
66
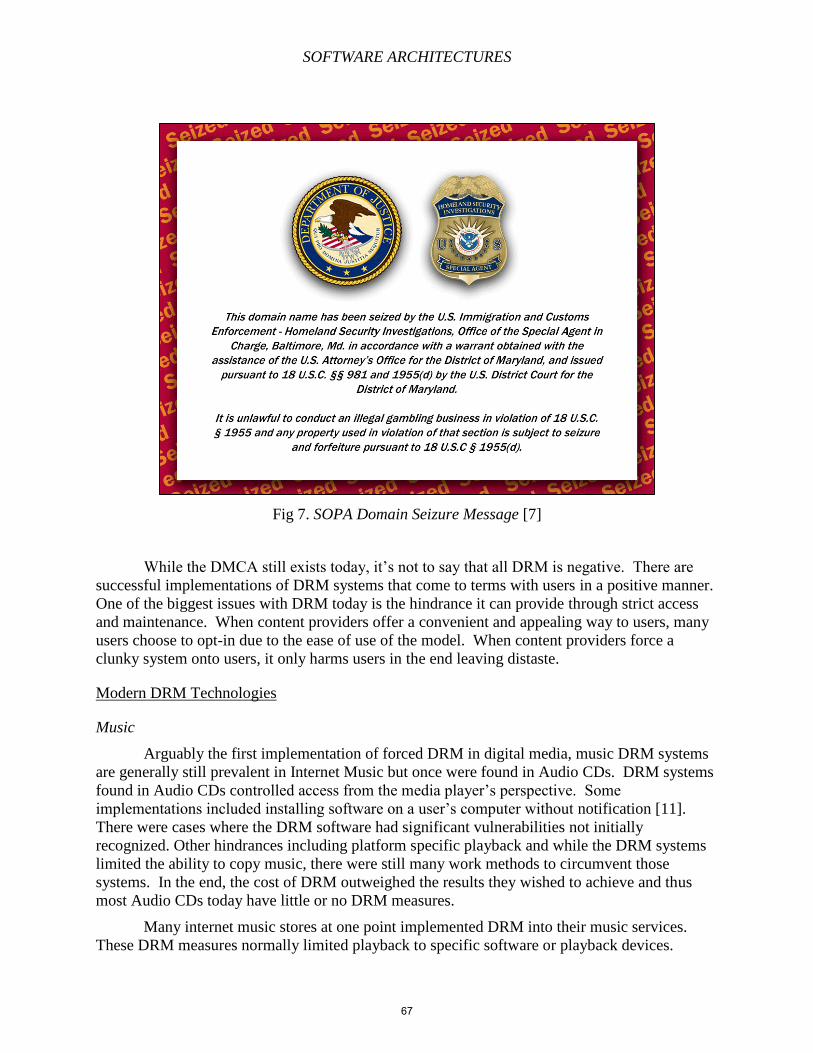
SOFTWARE ARCHITECTURES
Fig 7. SOPA Domain Seizure Message [7]
While the DMCA still exists today, it’s not to say that all DRM is negative. There are
successful implementations of DRM systems that come to terms with users in a positive manner.
One of the biggest issues with DRM today is the hindrance it can provide through strict access
and maintenance. When content providers offer a convenient and appealing way to users, many
users choose to opt-in due to the ease of use of the model. When content providers force a
clunky system onto users, it only harms users in the end leaving distaste.
Modern DRM Technologies
Music
Arguably the first implementation of forced DRM in digital media, music DRM systems
are generally still prevalent in Internet Music but once were found in Audio CDs. DRM systems
found in Audio CDs controlled access from the media player’s perspective. Some
implementations included installing software on a user’s computer without notification [11].
There were cases where the DRM software had significant vulnerabilities not initially
recognized. Other hindrances including platform specific playback and while the DRM systems
limited the ability to copy music, there were still many work methods to circumvent those
systems. In the end, the cost of DRM outweighed the results they wished to achieve and thus
most Audio CDs today have little or no DRM measures.
Many internet music stores at one point implemented DRM into their music services.
These DRM measures normally limited playback to specific software or playback devices.
67
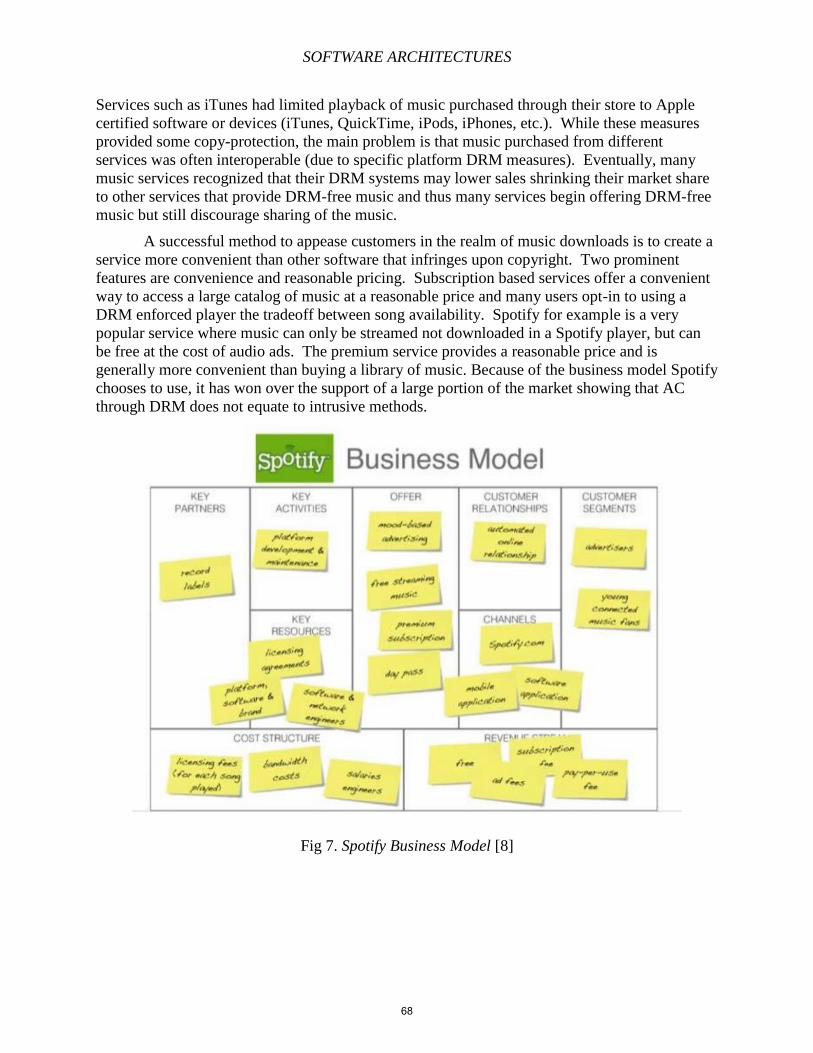
SOFTWARE ARCHITECTURES
Services such as iTunes had limited playback of music purchased through their store to Apple
certified software or devices (iTunes, QuickTime, iPods, iPhones, etc.). While these measures
provided some copy-protection, the main problem is that music purchased from different
services was often interoperable (due to specific platform DRM measures). Eventually, many
music services recognized that their DRM systems may lower sales shrinking their market share
to other services that provide DRM-free music and thus many services begin offering DRM-free
music but still discourage sharing of the music.
A successful method to appease customers in the realm of music downloads is to create a
service more convenient than other software that infringes upon copyright. Two prominent
features are convenience and reasonable pricing. Subscription based services offer a convenient
way to access a large catalog of music at a reasonable price and many users opt-in to using a
DRM enforced player the tradeoff between song availability. Spotify for example is a very
popular service where music can only be streamed not downloaded in a Spotify player, but can
be free at the cost of audio ads. The premium service provides a reasonable price and is
generally more convenient than buying a library of music. Because of the business model Spotify
chooses to use, it has won over the support of a large portion of the market showing that AC
through DRM does not equate to intrusive methods.
Fig 7. Spotify Business Model [8]
68
SOFTWARE ARCHITECTURES
Software and Computer Games
Software and computer games have implemented various forms of DRM throughout
recent decades. Many forms of its modern implementation have been intrusive and frustrating
for many users legitimate and otherwise. One of the most common methods is through the use of
serial keys. The content can only be accessed if a legitimate serial key is provided by the user
normally in the form of an alphanumeric string.
Another approach is to limit the number of times a software or game can be installed. By
keeping track of how many times a serial key is used, the software will only work given it is
within its approved limit. Many users however (as with other forms of DRM) regularly
experience frustration. Software may become unusable even though it has only been used on one
computer either by performing unexpected tasks that warrant as a separate install such as
upgrading operating systems or reformatting the hard drive.
Persistent online authentication is yet another form of DRM for software and games. By
constantly requiring a connection to an authentication server, the software or game access is only
granted so long as the user is connected. By creating such a strict trusted environment, it forces
the user at their convenience to meet the requirements meaning that the software or game is
unusable without an internet connection.
Some games and software’s DRM may be related to its piracy rate. By forcing such an
intrusive DRM measure, it may often be easier (and more convenient) to the user to just pirate
the game than go through official channels in a legitimate setup though it may not always be the
case. While the methods of enforcement advance, the ability of end users to circumvent AC still
and will continue to prevail. DRM in this case acts more as a deterrent that is forced on all users
with the possibility of problems arising because of its requirement.
However some DRM methods are much less intrusive than others. For example, the PC
games platform Steam ties purchases to a personal account. While the user may not be able to
sell, trade or give access to other users, it provides many benefits of convenience to the user.
Having a centralized location, fast-download speeds, social aspects, availability between
multiple devices, low prices as well as other features benefit the end user greatly. Many users
aren’t even aware of the DRM enforcement other than providing login credentials and games
cannot be traded or sold. Because of the business model of Steam, many users willingly opt-in
benefiting the users, publishers and managers of Steam to create a thriving PC gaming
ecosystem.
69
SOFTWARE ARCHITECTURES
Film and Video
Fig 9. DVD FBI Warning Message [9]
Film and video DRM systems are delivered in 3 main mediums: physical disc based,
digital file formats and through internet streams. While generally unobtrusive to playback, the
DRM seeks anti-copying measures.
Physical disc based methods are deployed on almost all disc formats. It is a simple and
inexpensive measure to deter piracy by having hardware decrypt encrypted video. As long as a
user has purchased a legitimate copy, most playback devices are able to access the content
without much effort given support by the player.
Digital file formats share more similarities with music DRM-measures where certain
playback is affected by the software used and from where the video was purchased.
Streaming video is quickly becoming a popular way to view video content online. Some
services do not bother with any form of DRM to protect users from capturing data while it is
streaming, however it requires a lot more effort. The main form of AC comes from subscription
or pay-per-view services. These are enforced by creating unique sessions for authorized users
that cannot be created elsewhere. For example, Netflix as a video subscription service
implements Microsoft Silverlight which creates unique viewing sessions every time a video is
requested. However it does not come without the occasional hiccup. Netflix requires supported
browser and equipment, and while it has a large support matrix, not all equipment is supported.
It also introduces limited access and resources are ultimately controlled by Netflix as the user
does not have access to a personal copy. Video streaming services are able to add and redact
content with little or no notice to the user.
70
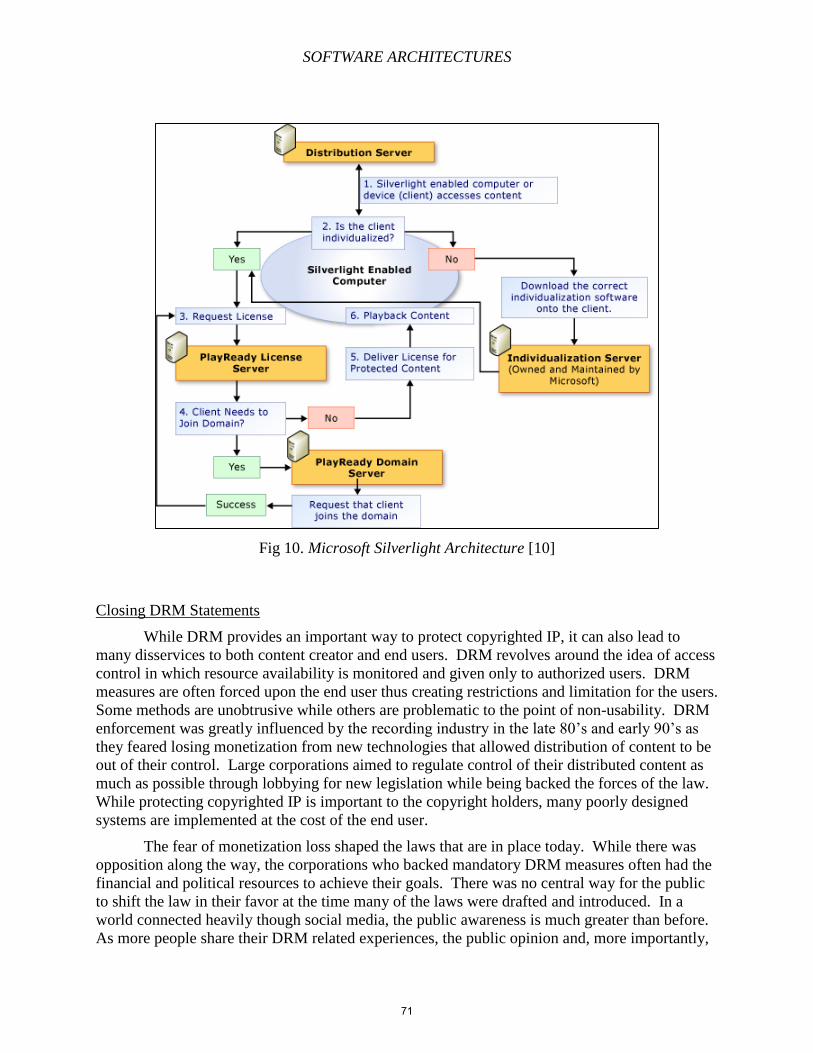
SOFTWARE ARCHITECTURES
Fig 10. Microsoft Silverlight Architecture [10]
Closing DRM Statements
While DRM provides an important way to protect copyrighted IP, it can also lead to
many disservices to both content creator and end users. DRM revolves around the idea of access
control in which resource availability is monitored and given only to authorized users. DRM
measures are often forced upon the end user thus creating restrictions and limitation for the users.
Some methods are unobtrusive while others are problematic to the point of non-usability. DRM
enforcement was greatly influenced by the recording industry in the late 80’s and early 90’s as
they feared losing monetization from new technologies that allowed distribution of content to be
out of their control. Large corporations aimed to regulate control of their distributed content as
much as possible through lobbying for new legislation while being backed the forces of the law.
While protecting copyrighted IP is important to the copyright holders, many poorly designed
systems are implemented at the cost of the end user.
The fear of monetization loss shaped the laws that are in place today. While there was
opposition along the way, the corporations who backed mandatory DRM measures often had the
financial and political resources to achieve their goals. There was no central way for the public
to shift the law in their favor at the time many of the laws were drafted and introduced. In a
world connected heavily though social media, the public awareness is much greater than before.
As more people share their DRM related experiences, the public opinion and, more importantly,
71
SOFTWARE ARCHITECTURES
public voice has a greater presence. The relation between industry and consumers is an
interesting one primarily in the fact that they rely upon each other yet are often detrimental with
industry imposing DRM and consumers partaking in piracy. While both sides are sometime
detrimental, they do not represent either side holistically which is where the disparity comes in
on the topic of DRM enforcing it on all users.
While most DRM systems are mostly looked down upon by the public, it is largely
necessary to sustain IP protection and income for many copyright holders. While corporations
continually look for a way to eliminate piracy through litigation, it is only a temporary solution
and only shows the stride of public disinterest in DRM as the users constantly find and provide a
growing number of alternate solutions. At the same time, end users continue to hurt content
creators through exploiting their systems. A possibility to the problem is that both sides are
looking at the extreme end of the spectrums with corporations trying to maximize as much profit
through restrictions and users looking to maximize convenience which may entail not paying
royalties. A middle ground should be found in order to please both sides. Such a solution that
could please the majority of both parties already exists. Looking at existing business models of
popular services such as Spotify, Netflix and Steam alleviate much of the tension and problem
created by the need for DRM. These solutions create a healthy relationship between creator and
consumer and are popular for a reason, because users feel the price and experience is worth
opting in for. The popularity of these services only shows that new design methods and business
models must be created in order to sustain in today’s internet age rather than holding on to
failing practices that have not worked before. Both sides must be informed on what needs to be
done rather than resemble a power struggle.
Access control is essential, and while too much may be a bad thing, not enough can be as
well. DRM is based on the idea of access control which has shown to be immensely useful yet
and its current state is counter-productive because the content of information it controls involve
legal issues. While there are two sides, the idea of access control began with good intentions and
it is with good intentions how DRM should be carried out, from both sides.
References [1] RFC 4949 – Internet Security Glossary, Version 2,
http://tools.ietf.org/html/rfc4949, accessed: 4/22/14
[2] Crues, Access Control: Models and Methods,
http://resources.infosecinstitute.com/access-control-models-and-methods/, accessed: 4/22/14
[3] Methods for Access Control: Advances and Limitations, Harvey Mudd College
[4] HPAnywhere Developer’s Guide
http://developer.hpanywhere.com/wp-
content/uploads/10.11/HP_Anywhere_Online_Help/Default.htm?title=3+Administration#Ad
min_Guide/Overview.htm%3FTocPath%3DManage%20HP%20Anywhere%7CAdministrati
on%7C_____0, accessed: 4/22/14
[5] What is DRM? | Defective by Design
http://www.defectivebydesign.org/what_is_drm_digital_restrictions_management, accessed:
4/25/14
72
SOFTWARE ARCHITECTURES
[6] Herman, A Political History of DRM and Related Copyright Debates, 1987-2012, Yale
Journal of Law and Technology, Vol. 14, 1-1-2012
[7] Domain Seizure Image
http://blog.discountasp.net/wp-
content/uploads/2012/03/IPRC_Seized_2011_05_Baltimore.gif, accessed: 4/27/14
[8] Spotify Business Model Image
http://flatworldbusiness.files.wordpress.com/2012/10/spotify_businessmodel.png, accessed:
4/27/14
[9] FBI Warning Image
http://jooh.no/wp-content/uploads/2011/01/fbi-copyright-warning-2.jpg, accessed: 4/28/14
[10] Microsoft Silverlight Architecture
http://i.msdn.microsoft.com/dynimg/IC400721.png, accessed: 4/29/14
[11] Digital Millennium Copyright Act - Wikipedia
http://en.wikipedia.org/wiki/Digital_Millennium_Copyright_Act, accessed: 4/29/14
73
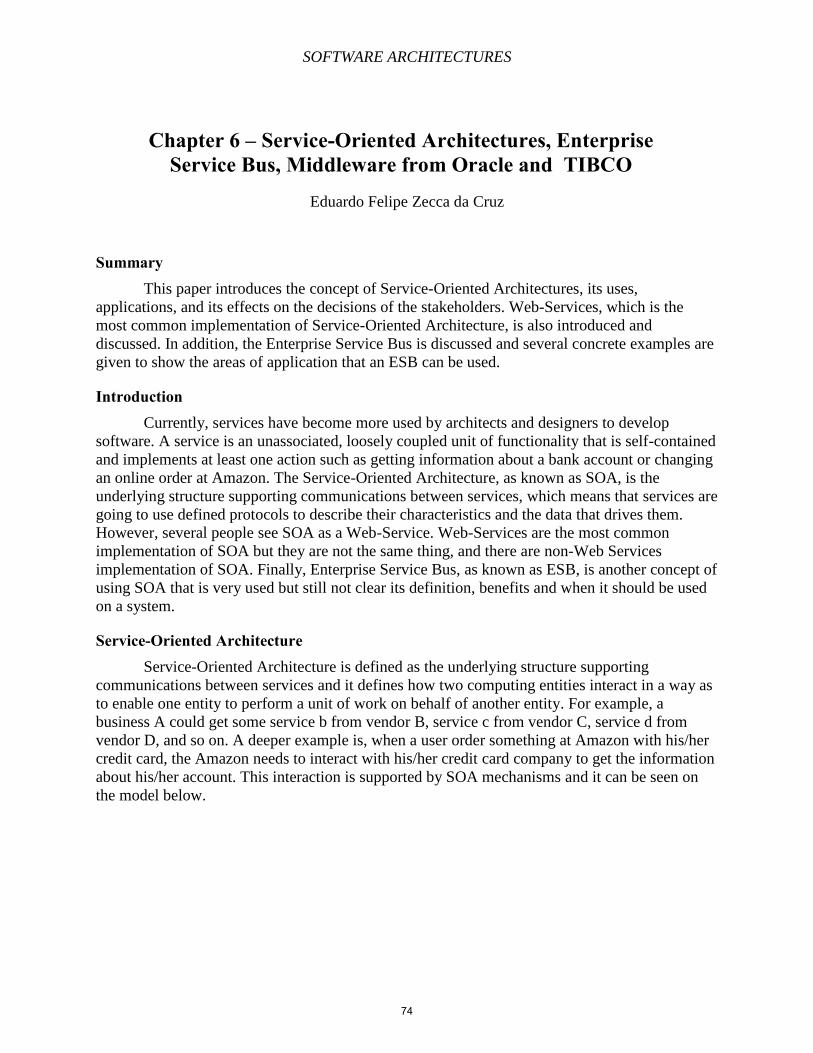
SOFTWARE ARCHITECTURES
Chapter 6 – Service-Oriented Architectures, Enterprise Service Bus, Middleware from Oracle and TIBCO
Eduardo Felipe Zecca da Cruz
Summary This paper introduces the concept of Service-Oriented Architectures, its uses,
applications, and its effects on the decisions of the stakeholders. Web-Services, which is the
most common implementation of Service-Oriented Architecture, is also introduced and
discussed. In addition, the Enterprise Service Bus is discussed and several concrete examples are
given to show the areas of application that an ESB can be used.
Introduction Currently, services have become more used by architects and designers to develop
software. A service is an unassociated, loosely coupled unit of functionality that is self-contained
and implements at least one action such as getting information about a bank account or changing
an online order at Amazon. The Service-Oriented Architecture, as known as SOA, is the
underlying structure supporting communications between services, which means that services are
going to use defined protocols to describe their characteristics and the data that drives them.
However, several people see SOA as a Web-Service. Web-Services are the most common
implementation of SOA but they are not the same thing, and there are non-Web Services
implementation of SOA. Finally, Enterprise Service Bus, as known as ESB, is another concept of
using SOA that is very used but still not clear its definition, benefits and when it should be used
on a system.
Service-Oriented Architecture Service-Oriented Architecture is defined as the underlying structure supporting
communications between services and it defines how two computing entities interact in a way as
to enable one entity to perform a unit of work on behalf of another entity. For example, a
business A could get some service b from vendor B, service c from vendor C, service d from
vendor D, and so on. A deeper example is, when a user order something at Amazon with his/her
credit card, the Amazon needs to interact with his/her credit card company to get the information
about his/her account. This interaction is supported by SOA mechanisms and it can be seen on
the model below.
74
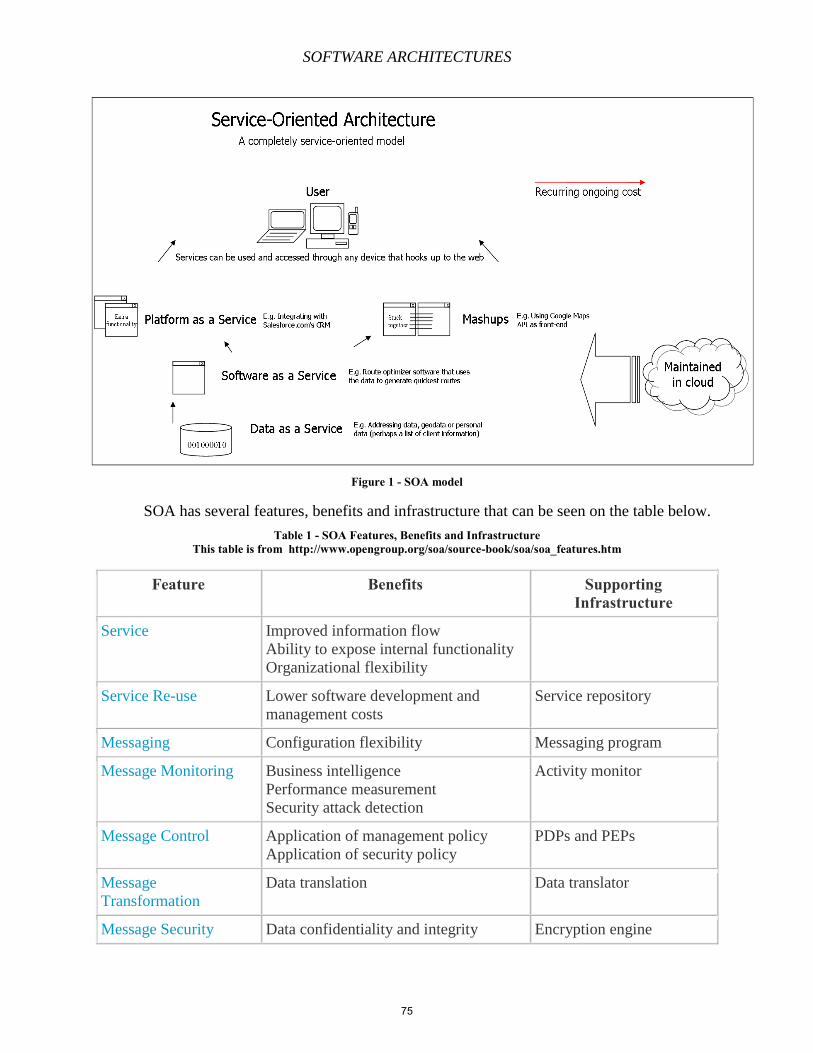
SOFTWARE ARCHITECTURES
Figure 1 - SOA model
SOA has several features, benefits and infrastructure that can be seen on the table below.
Table 1 - SOA Features, Benefits and Infrastructure This table is from http://www.opengroup.org/soa/source-book/soa/soa_features.htm
Feature Benefits Supporting Infrastructure
Service Improved information flow
Ability to expose internal functionality
Organizational flexibility
Service Re-use Lower software development and
management costs
Service repository
Messaging Configuration flexibility Messaging program
Message Monitoring Business intelligence
Performance measurement
Security attack detection
Activity monitor
Message Control Application of management policy
Application of security policy
PDPs and PEPs
Message
Transformation
Data translation Data translator
Message Security Data confidentiality and integrity Encryption engine
75
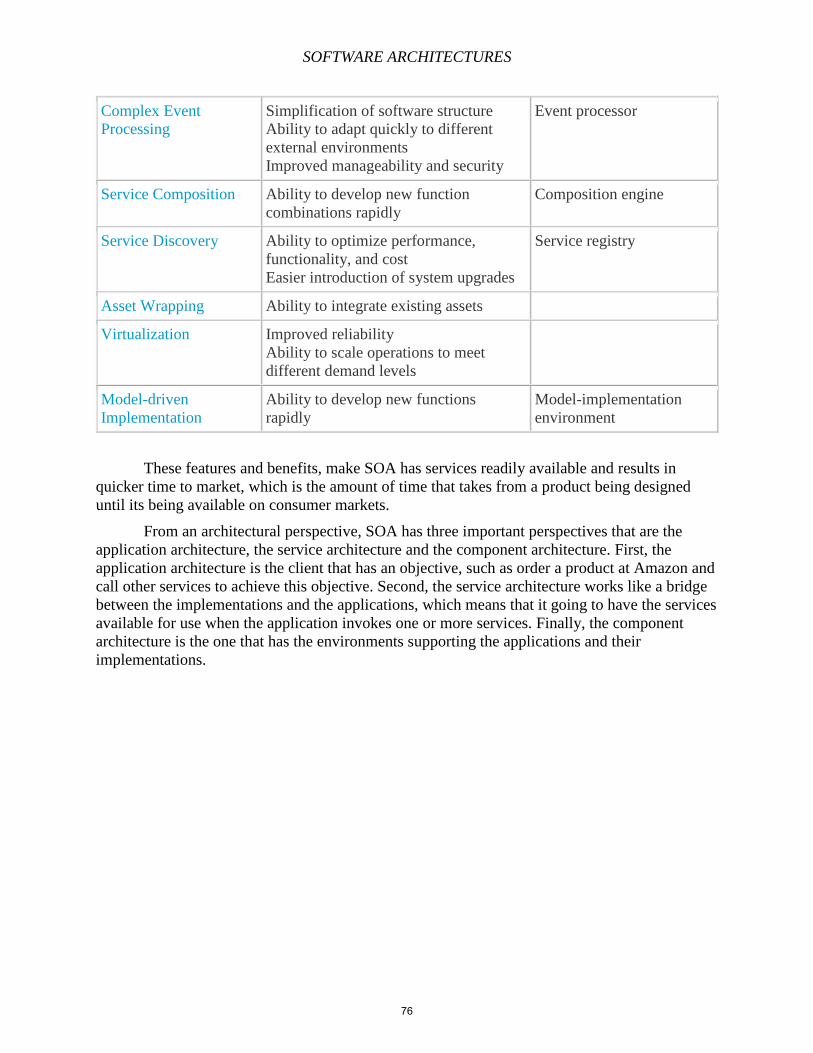
SOFTWARE ARCHITECTURES
Complex Event
Processing
Simplification of software structure
Ability to adapt quickly to different
external environments
Improved manageability and security
Event processor
Service Composition Ability to develop new function
combinations rapidly
Composition engine
Service Discovery Ability to optimize performance,
functionality, and cost
Easier introduction of system upgrades
Service registry
Asset Wrapping Ability to integrate existing assets
Virtualization Improved reliability
Ability to scale operations to meet
different demand levels
Model-driven
Implementation
Ability to develop new functions
rapidly
Model-implementation
environment
These features and benefits, make SOA has services readily available and results in
quicker time to market, which is the amount of time that takes from a product being designed
until its being available on consumer markets.
From an architectural perspective, SOA has three important perspectives that are the
application architecture, the service architecture and the component architecture. First, the
application architecture is the client that has an objective, such as order a product at Amazon and
call other services to achieve this objective. Second, the service architecture works like a bridge
between the implementations and the applications, which means that it going to have the services
available for use when the application invokes one or more services. Finally, the component
architecture is the one that has the environments supporting the applications and their
implementations.
76
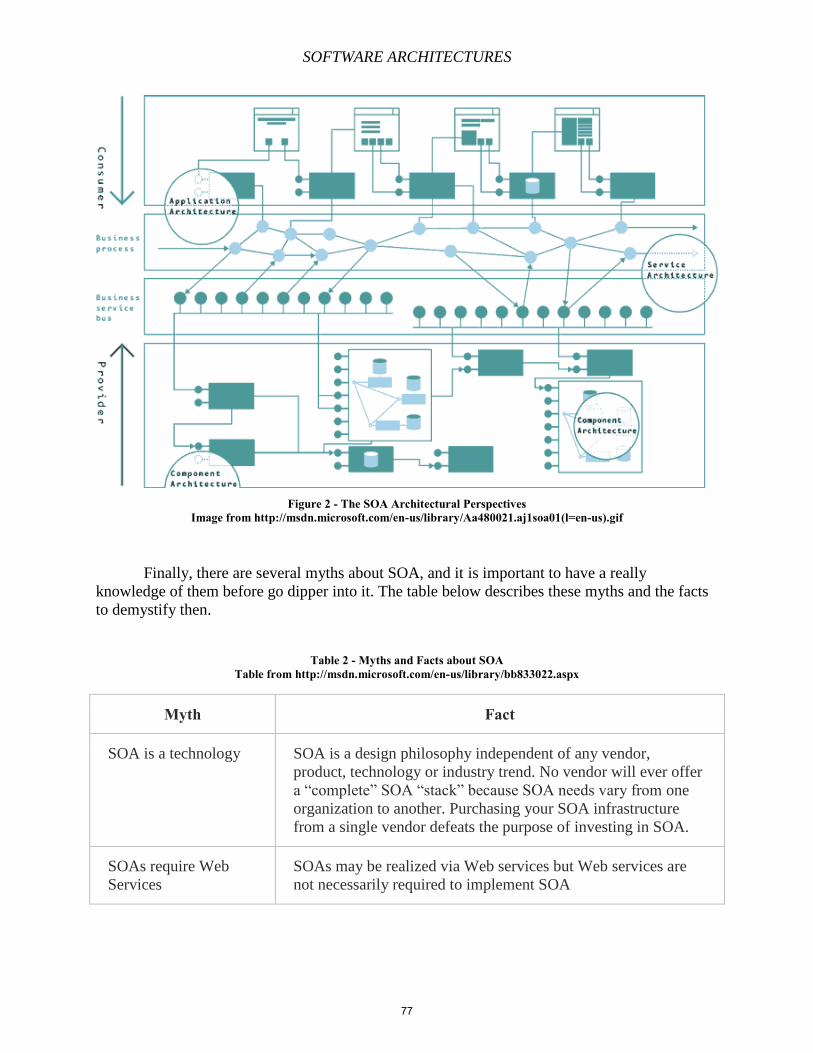
SOFTWARE ARCHITECTURES
Figure 2 - The SOA Architectural Perspectives Image from http://msdn.microsoft.com/en-us/library/Aa480021.aj1soa01(l=en-us).gif
Finally, there are several myths about SOA, and it is important to have a really
knowledge of them before go dipper into it. The table below describes these myths and the facts
to demystify then.
Table 2 - Myths and Facts about SOA Table from http://msdn.microsoft.com/en-us/library/bb833022.aspx
Myth Fact
SOA is a technology SOA is a design philosophy independent of any vendor,
product, technology or industry trend. No vendor will ever offer
a “complete” SOA “stack” because SOA needs vary from one
organization to another. Purchasing your SOA infrastructure
from a single vendor defeats the purpose of investing in SOA.
SOAs require Web
Services
SOAs may be realized via Web services but Web services are
not necessarily required to implement SOA
77
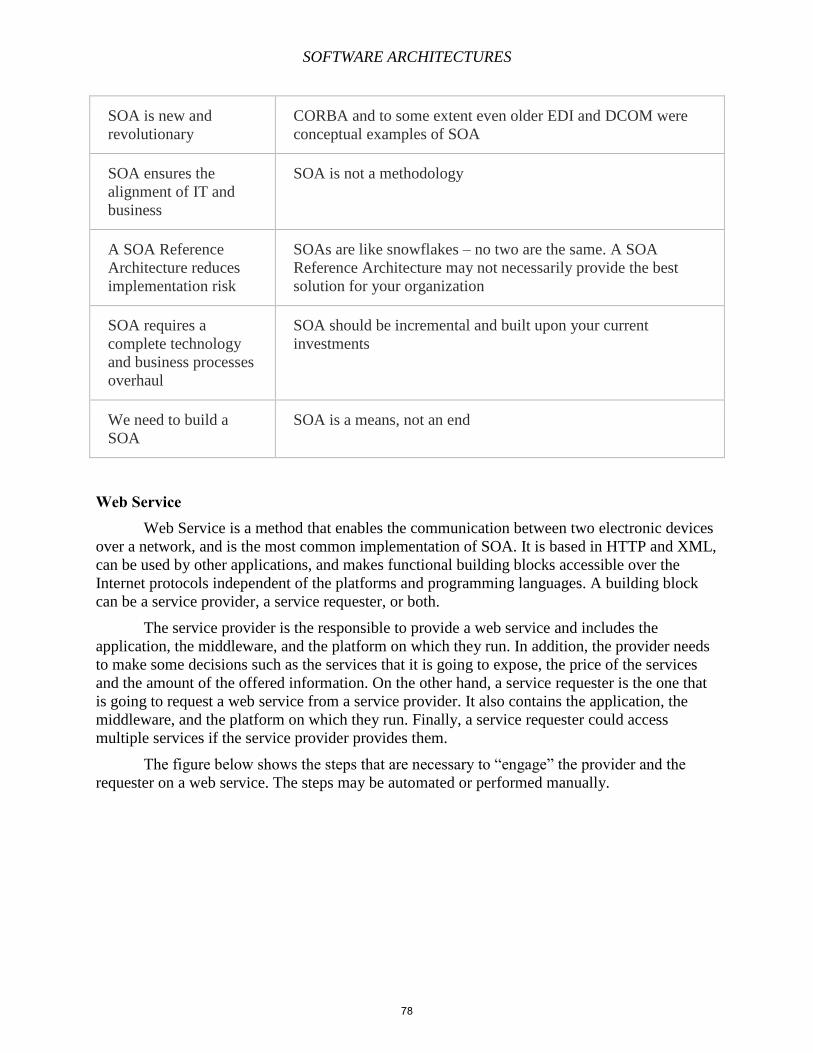
SOFTWARE ARCHITECTURES
SOA is new and
revolutionary
CORBA and to some extent even older EDI and DCOM were
conceptual examples of SOA
SOA ensures the
alignment of IT and
business
SOA is not a methodology
A SOA Reference
Architecture reduces
implementation risk
SOAs are like snowflakes – no two are the same. A SOA
Reference Architecture may not necessarily provide the best
solution for your organization
SOA requires a
complete technology
and business processes
overhaul
SOA should be incremental and built upon your current
investments
We need to build a
SOA
SOA is a means, not an end
Web Service Web Service is a method that enables the communication between two electronic devices
over a network, and is the most common implementation of SOA. It is based in HTTP and XML,
can be used by other applications, and makes functional building blocks accessible over the
Internet protocols independent of the platforms and programming languages. A building block
can be a service provider, a service requester, or both.
The service provider is the responsible to provide a web service and includes the
application, the middleware, and the platform on which they run. In addition, the provider needs
to make some decisions such as the services that it is going to expose, the price of the services
and the amount of the offered information. On the other hand, a service requester is the one that
is going to request a web service from a service provider. It also contains the application, the
middleware, and the platform on which they run. Finally, a service requester could access
multiple services if the service provider provides them.
The figure below shows the steps that are necessary to “engage” the provider and the
requester on a web service. The steps may be automated or performed manually.
78
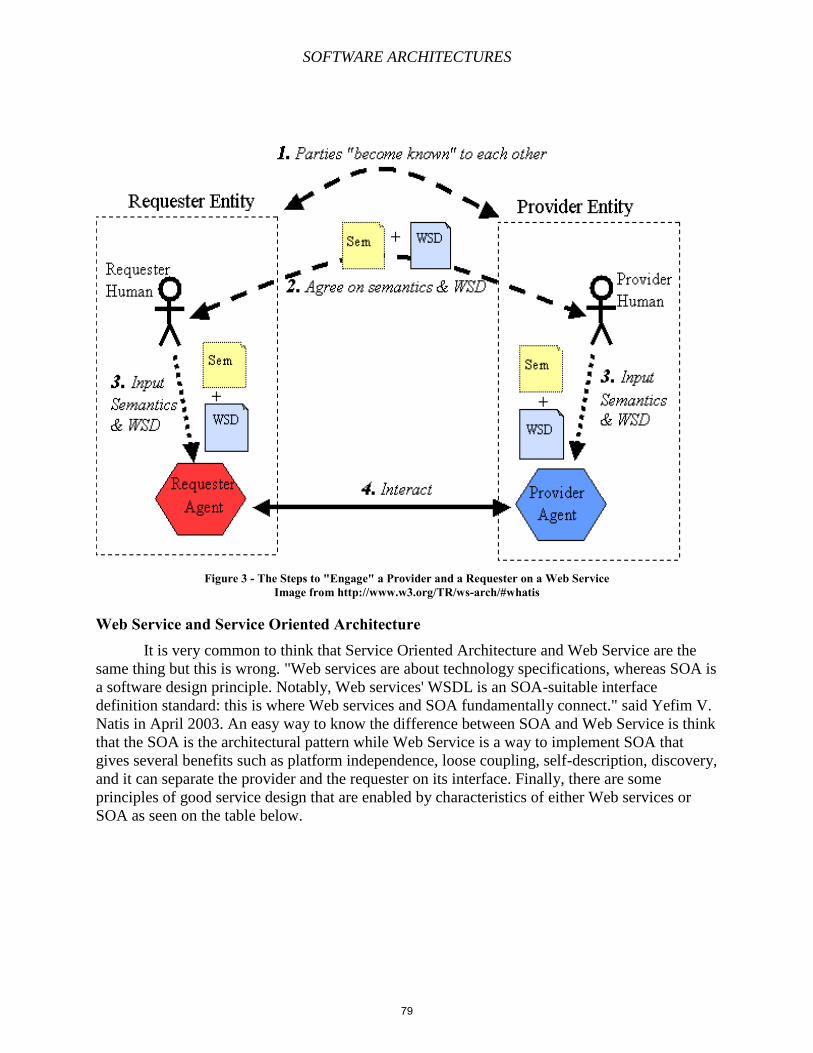
SOFTWARE ARCHITECTURES
Figure 3 - The Steps to "Engage" a Provider and a Requester on a Web Service Image from http://www.w3.org/TR/ws-arch/#whatis
Web Service and Service Oriented Architecture It is very common to think that Service Oriented Architecture and Web Service are the
same thing but this is wrong. "Web services are about technology specifications, whereas SOA is
a software design principle. Notably, Web services' WSDL is an SOA-suitable interface
definition standard: this is where Web services and SOA fundamentally connect." said Yefim V.
Natis in April 2003. An easy way to know the difference between SOA and Web Service is think
that the SOA is the architectural pattern while Web Service is a way to implement SOA that
gives several benefits such as platform independence, loose coupling, self-description, discovery,
and it can separate the provider and the requester on its interface. Finally, there are some
principles of good service design that are enabled by characteristics of either Web services or
SOA as seen on the table below.
79
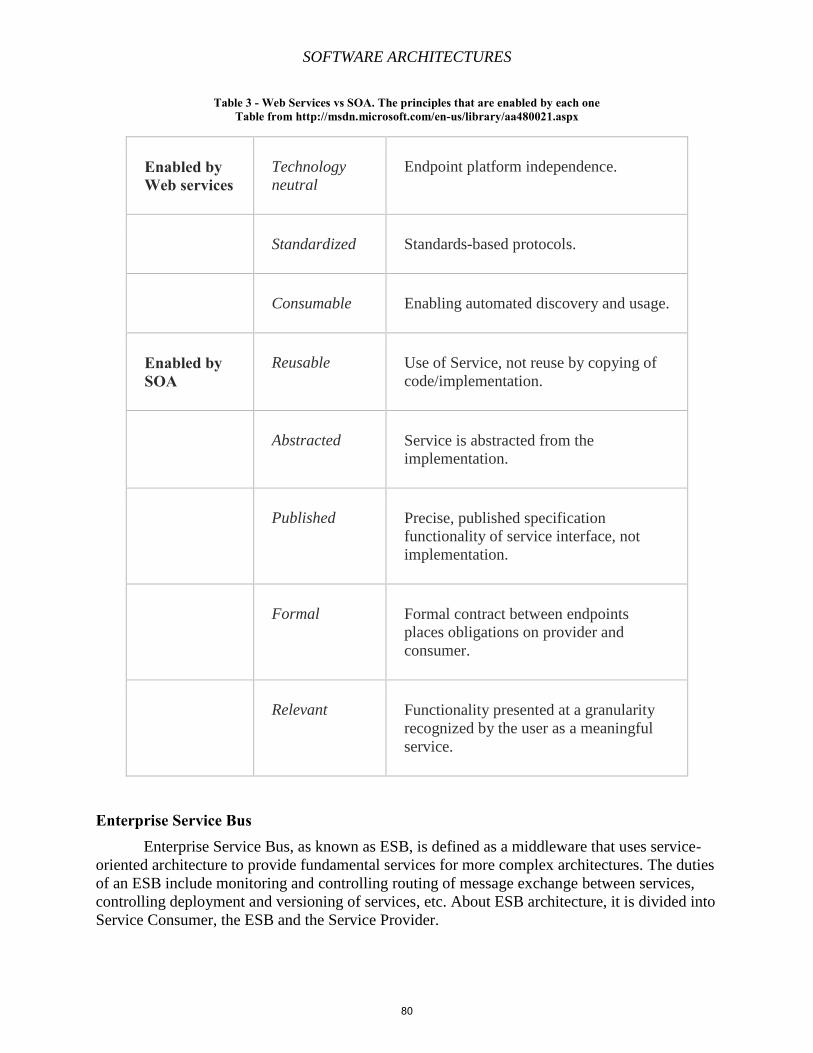
SOFTWARE ARCHITECTURES
Table 3 - Web Services vs SOA. The principles that are enabled by each one Table from http://msdn.microsoft.com/en-us/library/aa480021.aspx
Enabled by Web services
Technology
neutral
Endpoint platform independence.
Standardized Standards-based protocols.
Consumable Enabling automated discovery and usage.
Enabled by SOA
Reusable Use of Service, not reuse by copying of
code/implementation.
Abstracted Service is abstracted from the
implementation.
Published Precise, published specification
functionality of service interface, not
implementation.
Formal Formal contract between endpoints
places obligations on provider and
consumer.
Relevant Functionality presented at a granularity
recognized by the user as a meaningful
service.
Enterprise Service Bus Enterprise Service Bus, as known as ESB, is defined as a middleware that uses service-
oriented architecture to provide fundamental services for more complex architectures. The duties
of an ESB include monitoring and controlling routing of message exchange between services,
controlling deployment and versioning of services, etc. About ESB architecture, it is divided into
Service Consumer, the ESB and the Service Provider.
80
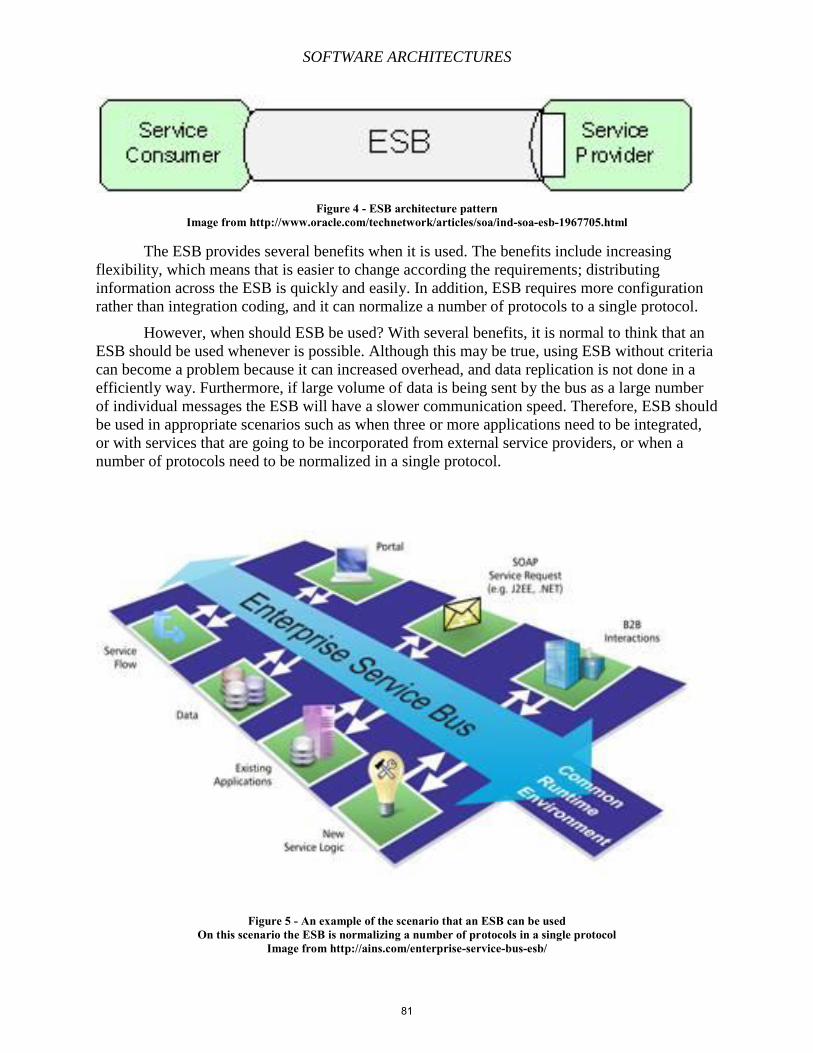
SOFTWARE ARCHITECTURES
Figure 4 - ESB architecture pattern Image from http://www.oracle.com/technetwork/articles/soa/ind-soa-esb-1967705.html
The ESB provides several benefits when it is used. The benefits include increasing
flexibility, which means that is easier to change according the requirements; distributing
information across the ESB is quickly and easily. In addition, ESB requires more configuration
rather than integration coding, and it can normalize a number of protocols to a single protocol.
However, when should ESB be used? With several benefits, it is normal to think that an
ESB should be used whenever is possible. Although this may be true, using ESB without criteria
can become a problem because it can increased overhead, and data replication is not done in a
efficiently way. Furthermore, if large volume of data is being sent by the bus as a large number
of individual messages the ESB will have a slower communication speed. Therefore, ESB should
be used in appropriate scenarios such as when three or more applications need to be integrated,
or with services that are going to be incorporated from external service providers, or when a
number of protocols need to be normalized in a single protocol.
Figure 5 - An example of the scenario that an ESB can be used On this scenario the ESB is normalizing a number of protocols in a single protocol
Image from http://ains.com/enterprise-service-bus-esb/
81
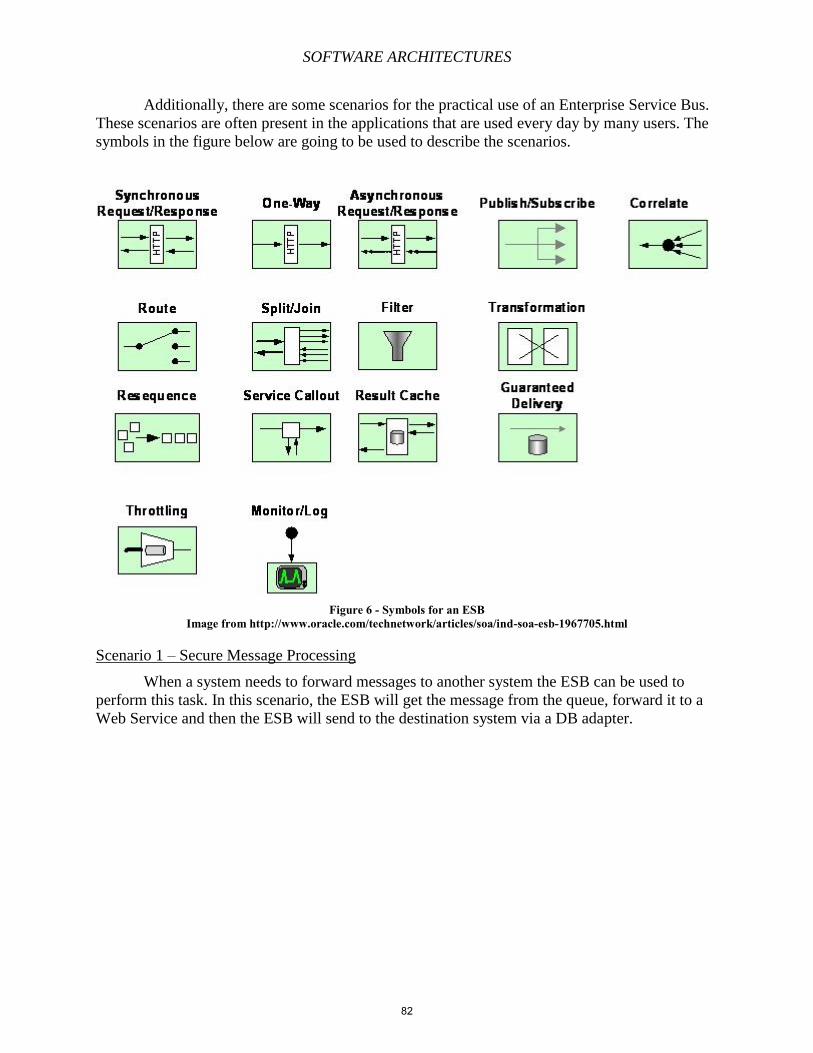
SOFTWARE ARCHITECTURES
Additionally, there are some scenarios for the practical use of an Enterprise Service Bus.
These scenarios are often present in the applications that are used every day by many users. The
symbols in the figure below are going to be used to describe the scenarios.
Figure 6 - Symbols for an ESB Image from http://www.oracle.com/technetwork/articles/soa/ind-soa-esb-1967705.html
Scenario 1 – Secure Message Processing
When a system needs to forward messages to another system the ESB can be used to
perform this task. In this scenario, the ESB will get the message from the queue, forward it to a
Web Service and then the ESB will send to the destination system via a DB adapter.
82
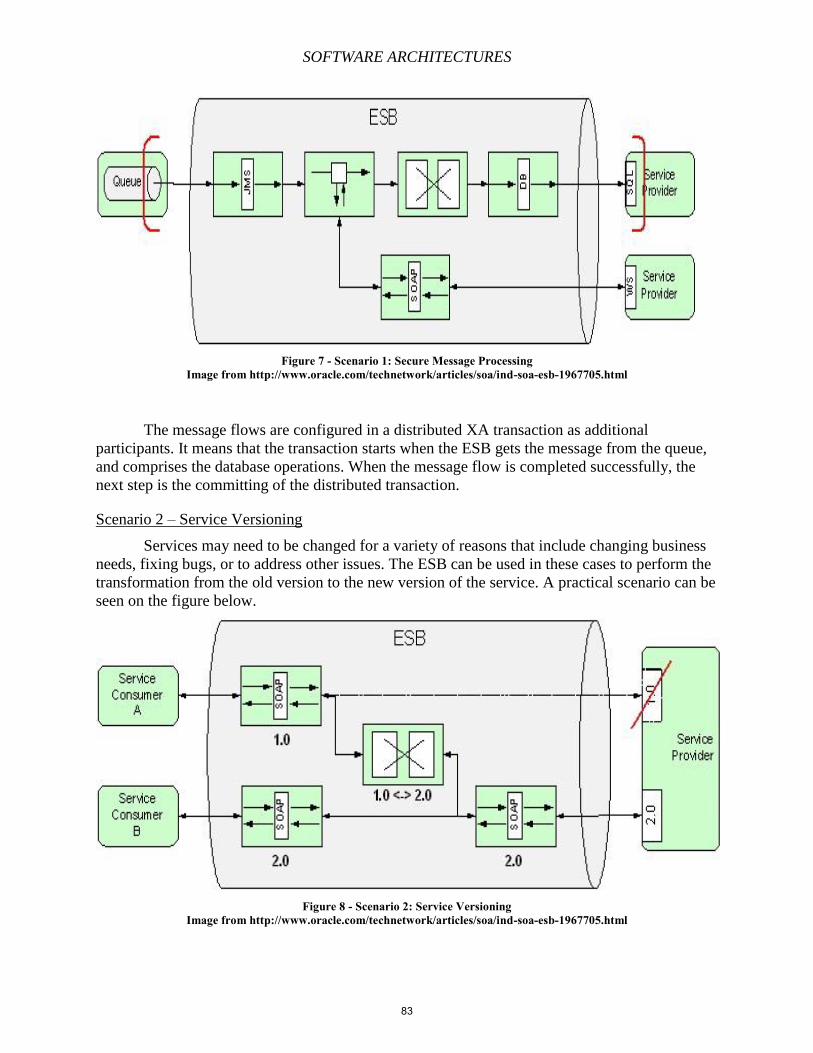
SOFTWARE ARCHITECTURES
Figure 7 - Scenario 1: Secure Message Processing Image from http://www.oracle.com/technetwork/articles/soa/ind-soa-esb-1967705.html
The message flows are configured in a distributed XA transaction as additional
participants. It means that the transaction starts when the ESB gets the message from the queue,
and comprises the database operations. When the message flow is completed successfully, the
next step is the committing of the distributed transaction.
Scenario 2 – Service Versioning
Services may need to be changed for a variety of reasons that include changing business
needs, fixing bugs, or to address other issues. The ESB can be used in these cases to perform the
transformation from the old version to the new version of the service. A practical scenario can be
seen on the figure below.
Figure 8 - Scenario 2: Service Versioning Image from http://www.oracle.com/technetwork/articles/soa/ind-soa-esb-1967705.html
83
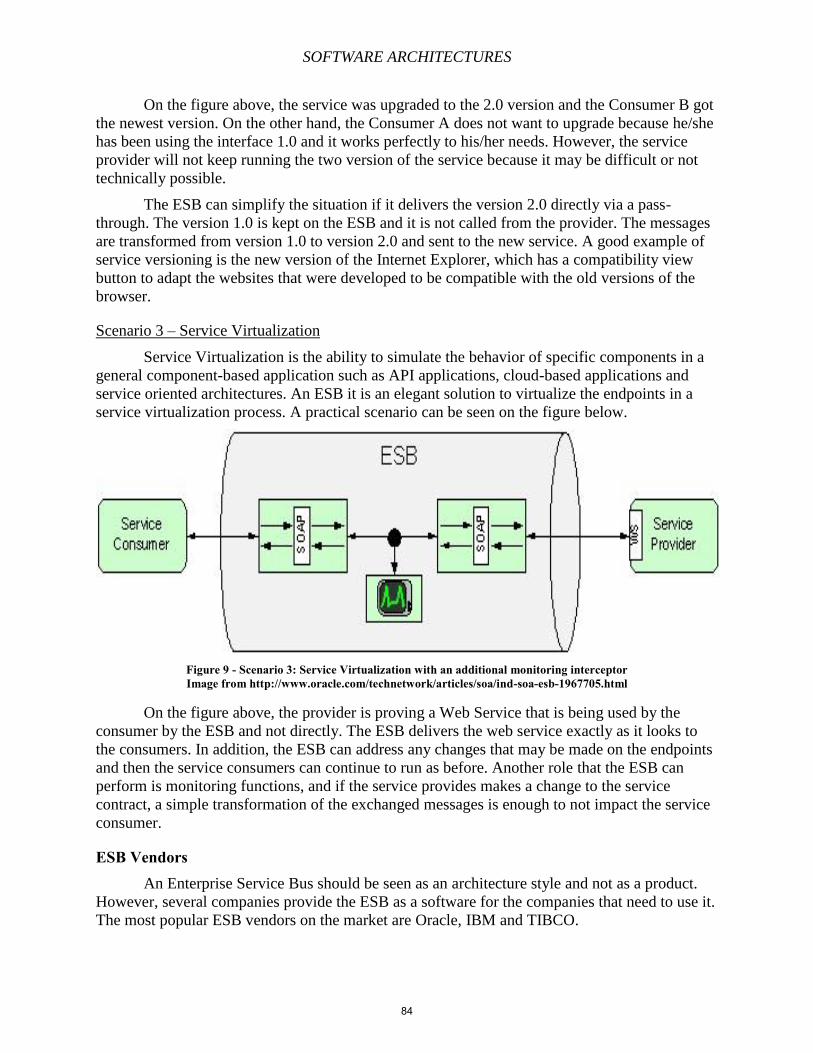
SOFTWARE ARCHITECTURES
On the figure above, the service was upgraded to the 2.0 version and the Consumer B got
the newest version. On the other hand, the Consumer A does not want to upgrade because he/she
has been using the interface 1.0 and it works perfectly to his/her needs. However, the service
provider will not keep running the two version of the service because it may be difficult or not
technically possible.
The ESB can simplify the situation if it delivers the version 2.0 directly via a pass-
through. The version 1.0 is kept on the ESB and it is not called from the provider. The messages
are transformed from version 1.0 to version 2.0 and sent to the new service. A good example of
service versioning is the new version of the Internet Explorer, which has a compatibility view
button to adapt the websites that were developed to be compatible with the old versions of the
browser.
Scenario 3 – Service Virtualization
Service Virtualization is the ability to simulate the behavior of specific components in a
general component-based application such as API applications, cloud-based applications and
service oriented architectures. An ESB it is an elegant solution to virtualize the endpoints in a
service virtualization process. A practical scenario can be seen on the figure below.
Figure 9 - Scenario 3: Service Virtualization with an additional monitoring interceptor Image from http://www.oracle.com/technetwork/articles/soa/ind-soa-esb-1967705.html
On the figure above, the provider is proving a Web Service that is being used by the
consumer by the ESB and not directly. The ESB delivers the web service exactly as it looks to
the consumers. In addition, the ESB can address any changes that may be made on the endpoints
and then the service consumers can continue to run as before. Another role that the ESB can
perform is monitoring functions, and if the service provides makes a change to the service
contract, a simple transformation of the exchanged messages is enough to not impact the service
consumer.
ESB Vendors An Enterprise Service Bus should be seen as an architecture style and not as a product.
However, several companies provide the ESB as a software for the companies that need to use it.
The most popular ESB vendors on the market are Oracle, IBM and TIBCO.
84
SOFTWARE ARCHITECTURES
Oracle is on the market with the Oracle Fusion Middleware, IBM with the WebSephere
Enterprise Service Bus, and TIBCO with the TIBCO ActiveMatrix Service Bus. All of them
offer the ESB basic capabilities such as support of multiple protocols, protocol conversion, data
transformation and data-based routing, support of composite services, support of multiple
standards, extensibility, etc. In addition, they offer a set of extended functionality that includes
graphical editing tools, SLA monitoring and management, BPEL and other business process
support, business activity monitoring, dynamic service provisioning and complex event
processing.
These three vendors are considered as the best on the market. Their products include all
the capabilities of ESB, and include very broad feature sets that include support for many
protocols, interaction models, file formats, error handling features, and more.
Figure 10 - Oracle Fusion Middleware, TIBCO Active Matrix and IBM WebSphere ESB logo Images from: http://www.soapros.com/ibm/img/websphere_esb.jpg http://directwebremoting.org/dwr2/media/tibco-activematrix.png http://xumulus.com/wp-content/uploads/2012/06/oraclefusion.jpg
Conclusion Services have become more used for applications. The goal of Service Oriented
Architecture is to provide a way to make the communications between the services. SOA has
many features and benefits that make the use of SOA be essential to deliver the business agility
and IT flexibility by Web Services. However, SOA and Web Services are always seen as the
same thing. Web Service is the most common implementation of SOA, but SOA is much more
than just the Web Services. A good way to distinguish SOA and Web Services is thinking that
SOA is the architectural pattern while Web Service is a way to implement SOA.
Another tool that uses the SOA model to promote interoperability between the services is
the Enterprise Service Bus. ESB is a middleware that does the mediation and integration between
environments and it has several duties and benefits that are provided when an ESB is used.
Although that ESB looks like a software, it should be seen as an architecture style or pattern
because there is no standard of ESB. In addition, ESB should be used with criteria, and in
appropriate environments, otherwise there are several disadvantages that will make it inefficient.
Finally, on the market, there are several companies that provides ESB and they should be
carefully analyzed for a company that wants to buy this kind of service.
References Chapter 1: Service Oriented Architecture (SOA). (n.d.). Chapter 1: Service Oriented
Architecture (SOA). Retrieved April 28, 2014, from http://msdn.microsoft.com/en-
us/library/bb833022.aspx
Grund, V., & Rexroad, C. (2007, December 5). Enterprise Service Bus implementation patterns.
85
SOFTWARE ARCHITECTURES
Enterprise Service Bus implementation patterns. Retrieved April 28, 2014, from
http://www.ibm.com/developerworks/websphere/library/techarticles/0712_grund/0712_
grund.html
Kress, J., Maier, B., Normann, H., Schmeidel, D., Schmutz, G., Trops, B., et al. (n.d.). Enterprise
Service Bus. Enterprise Service Bus. Retrieved April 21, 2014, from
http://www.oracle.com/technetwork/articles/soa/ind-soa-esb-1967705.html
Oracle Fusion Middleware. (n.d.). Oracle. Retrieved April 21, 2014, from
http://www.oracle.com/us/products/middleware/overview/index.html
Rouse, M. (n.d.). Service-Oriented Architecture (SOA). SearchSOA. Retrieved April 21, 2014,
from http://searchsoa.techtarget.com/definition/service-oriented-architecture
Rouse, M. (n.d.). Enterprise Service Bus (ESB). SearchSOA. Retrieved April 21, 2014, from
http://searchsoa.techtarget.com/definition/enterprise-service-bus
Sprott, D., & Wilkes, L. (n.d.). Understanding Service-Oriented Architecture. Understanding
Service-Oriented Architecture. Retrieved April 21, 2014, from
http://msdn.microsoft.com/en-us/library/aa480021.aspx
TIBCO ActiveMatrix Service Bus. (n.d.). TIBCO. Retrieved April 21, 2014, from
http://www.tibco.com/products/automation/application-integration/enterprise-service-
bus/activematrix-service-bus/default.jsp
Taylor, R. N., & Medvidovic̕, N. (2010). Software architecture: foundations, theory, and
practice. Hoboken, N.J.: Wiley.
WebSphere Enterprise Service Bus. (n.d.). IBM -. Retrieved April 21, 2014, from http://www-
03.ibm.com/software/products/en/wsesb
86
SOFTWARE ARCHITECTURES
Chapter 7 – Cloud Computing Architecture
JD Pack
Abstract The term “cloud computing” has been around for many years – it’s roots go back even
before using the Internet became a daily phenomenon for businesses and consumers. The
underlying concept of cloud computing relates to the idea of sharable resources, such as
computation time and memory usage. If computing resources were to be shared within large
entities such as the banking, technology industries, and even federal agencies, the cost-savings
and efficiency measures would be largely noticeable. In this paper, the various models of cloud
technologies will be explored, along with their deployment models and their current
implementations. Also, the idea of cloud architectures will be a central focus of the paper,
detailing the current attempts of building a useful and employable cloud framework and
examining what could be done with current cloud models to make them more usable. Issues and
vulnerabilities within cloud technologies will also be analyzed.
What is Cloud Computing? According to the National Institute of Standards and Technology (NIST), “Cloud
Computing is a model for enabling ubiquitous, convenient, on-demand network access to a
shared pool of configurable computing resources that can be rapidly provisioned and released
with minimal management of error or service provider interaction [1].” The term “cloud
computing” is commonly described as a stack of features or services, in the sense that users of
the cloud can access a customized set of services best suited to their needs in a convenient and
timely manner. The features of a cloud system are utilized not only by consumers and
corporations, but by government agencies as well.
NIST defines five essential characteristics that make up a cloud computing architecture:
on-demand self-service, broad network access, resource pooling, rapid elasticity, and measured
service. On-demand self-service means that a consumer can use the cloud service offered to
them without having to interact with the provider of the service. They are only allowed to use
certain parts of the cloud service, but that service is scalable, which allows them to provision
computing capabilities as they see fit. Another essential part of cloud computing, broad network
access, states that a cloud’s capabilities are available through the use of the Internet and are
accessed using various types of thick or thin-client platforms (e.g., laptops, mobile devices,
workstations, etc.). Next, it is imperative that cloud computing services provide some way to
serve all of the clients accessing its features, via resource pooling. Resources that are pooled
include storage, computational and graphics processing, memory, and network bandwidth. This
is typically performed through the use of both physical and virtual resources that can be
dynamically scaled to meet consumer demands. Additionally, the customer using the cloud
service need not know that actual physical location of the resources provided, but may be able to
specify a location that has been abstracted to fit efficiency and low-latency requirements (such as
country, state, or datacenter). Another important component of the cloud computing model is
rapid elasticity. As defined by NIST, rapid elasticity means that “capabilities can be elastically
provisioned and released, in some cases automatically, to scale rapidly outward and inward
87
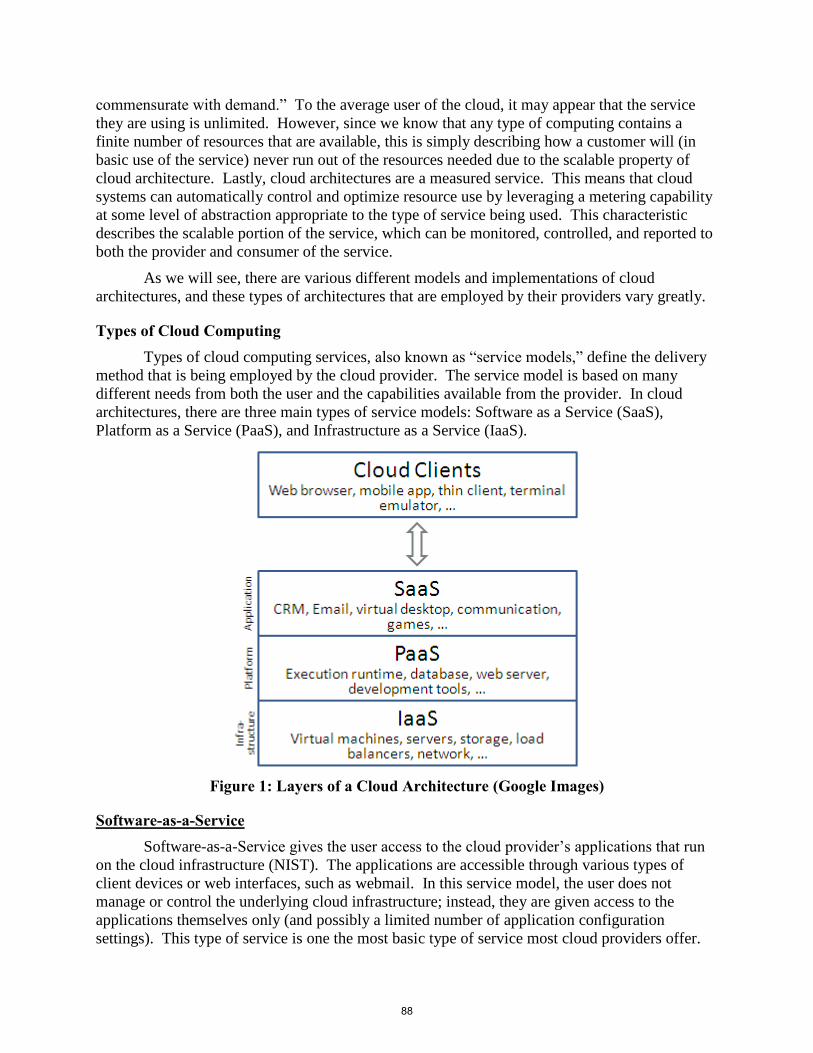
commensurate with demand.” To the average user of the cloud, it may appear that the service
they are using is unlimited. However, since we know that any type of computing contains a
finite number of resources that are available, this is simply describing how a customer will (in
basic use of the service) never run out of the resources needed due to the scalable property of
cloud architecture. Lastly, cloud architectures are a measured service. This means that cloud
systems can automatically control and optimize resource use by leveraging a metering capability
at some level of abstraction appropriate to the type of service being used. This characteristic
describes the scalable portion of the service, which can be monitored, controlled, and reported to
both the provider and consumer of the service.
As we will see, there are various different models and implementations of cloud
architectures, and these types of architectures that are employed by their providers vary greatly.
Types of Cloud Computing Types of cloud computing services, also known as “service models,” define the delivery
method that is being employed by the cloud provider. The service model is based on many
different needs from both the user and the capabilities available from the provider. In cloud
architectures, there are three main types of service models: Software as a Service (SaaS),
Platform as a Service (PaaS), and Infrastructure as a Service (IaaS).
Figure 1: Layers of a Cloud Architecture (Google Images)
Software-as-a-Service Software-as-a-Service gives the user access to the cloud provider’s applications that run
on the cloud infrastructure (NIST). The applications are accessible through various types of
client devices or web interfaces, such as webmail. In this service model, the user does not
manage or control the underlying cloud infrastructure; instead, they are given access to the
applications themselves only (and possibly a limited number of application configuration
settings). This type of service is one the most basic type of service most cloud providers offer.
88
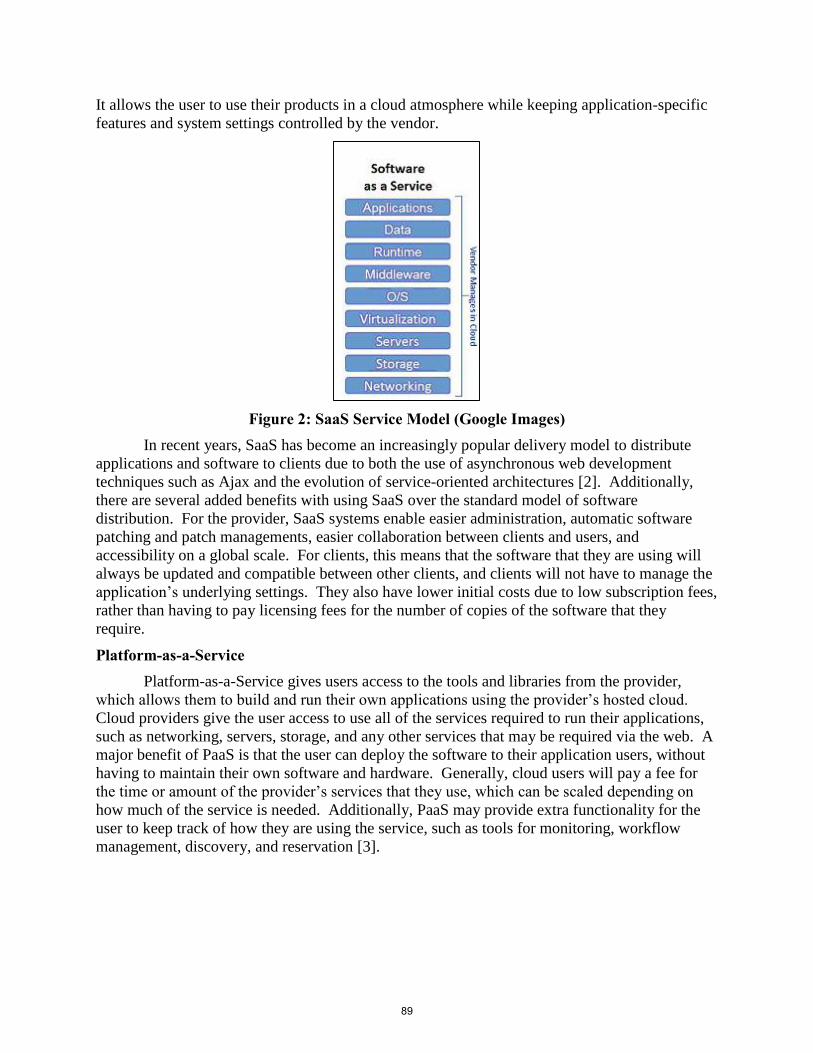
It allows the user to use their products in a cloud atmosphere while keeping application-specific
features and system settings controlled by the vendor.
Figure 2: SaaS Service Model (Google Images) In recent years, SaaS has become an increasingly popular delivery model to distribute
applications and software to clients due to both the use of asynchronous web development
techniques such as Ajax and the evolution of service-oriented architectures [2]. Additionally,
there are several added benefits with using SaaS over the standard model of software
distribution. For the provider, SaaS systems enable easier administration, automatic software
patching and patch managements, easier collaboration between clients and users, and
accessibility on a global scale. For clients, this means that the software that they are using will
always be updated and compatible between other clients, and clients will not have to manage the
application’s underlying settings. They also have lower initial costs due to low subscription fees,
rather than having to pay licensing fees for the number of copies of the software that they
require.
Platform-as-a-Service Platform-as-a-Service gives users access to the tools and libraries from the provider,
which allows them to build and run their own applications using the provider’s hosted cloud.
Cloud providers give the user access to use all of the services required to run their applications,
such as networking, servers, storage, and any other services that may be required via the web. A
major benefit of PaaS is that the user can deploy the software to their application users, without
having to maintain their own software and hardware. Generally, cloud users will pay a fee for
the time or amount of the provider’s services that they use, which can be scaled depending on
how much of the service is needed. Additionally, PaaS may provide extra functionality for the
user to keep track of how they are using the service, such as tools for monitoring, workflow
management, discovery, and reservation [3].
89
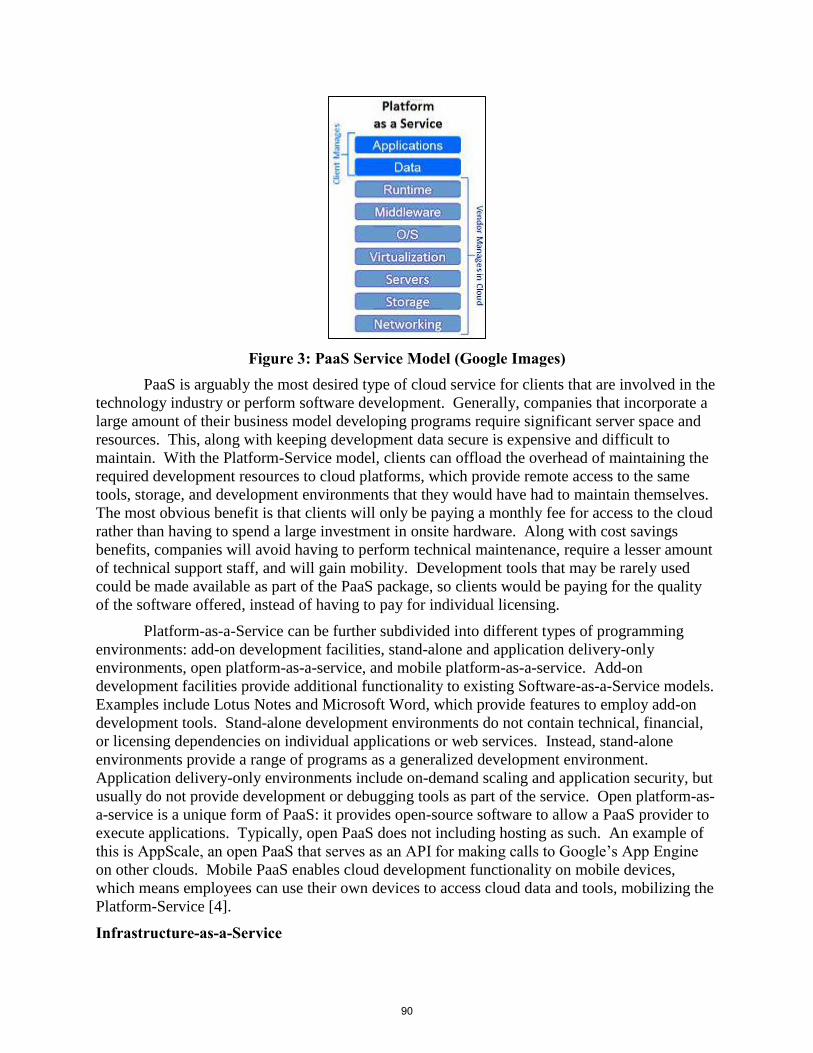
Figure 3: PaaS Service Model (Google Images) PaaS is arguably the most desired type of cloud service for clients that are involved in the
technology industry or perform software development. Generally, companies that incorporate a
large amount of their business model developing programs require significant server space and
resources. This, along with keeping development data secure is expensive and difficult to
maintain. With the Platform-Service model, clients can offload the overhead of maintaining the
required development resources to cloud platforms, which provide remote access to the same
tools, storage, and development environments that they would have had to maintain themselves.
The most obvious benefit is that clients will only be paying a monthly fee for access to the cloud
rather than having to spend a large investment in onsite hardware. Along with cost savings
benefits, companies will avoid having to perform technical maintenance, require a lesser amount
of technical support staff, and will gain mobility. Development tools that may be rarely used
could be made available as part of the PaaS package, so clients would be paying for the quality
of the software offered, instead of having to pay for individual licensing.
Platform-as-a-Service can be further subdivided into different types of programming
environments: add-on development facilities, stand-alone and application delivery-only
environments, open platform-as-a-service, and mobile platform-as-a-service. Add-on
development facilities provide additional functionality to existing Software-as-a-Service models.
Examples include Lotus Notes and Microsoft Word, which provide features to employ add-on
development tools. Stand-alone development environments do not contain technical, financial,
or licensing dependencies on individual applications or web services. Instead, stand-alone
environments provide a range of programs as a generalized development environment.
Application delivery-only environments include on-demand scaling and application security, but
usually do not provide development or debugging tools as part of the service. Open platform-as-
a-service is a unique form of PaaS: it provides open-source software to allow a PaaS provider to
execute applications. Typically, open PaaS does not including hosting as such. An example of
this is AppScale, an open PaaS that serves as an API for making calls to Google’s App Engine
on other clouds. Mobile PaaS enables cloud development functionality on mobile devices,
which means employees can use their own devices to access cloud data and tools, mobilizing the
Platform-Service [4].
Infrastructure-as-a-Service
90
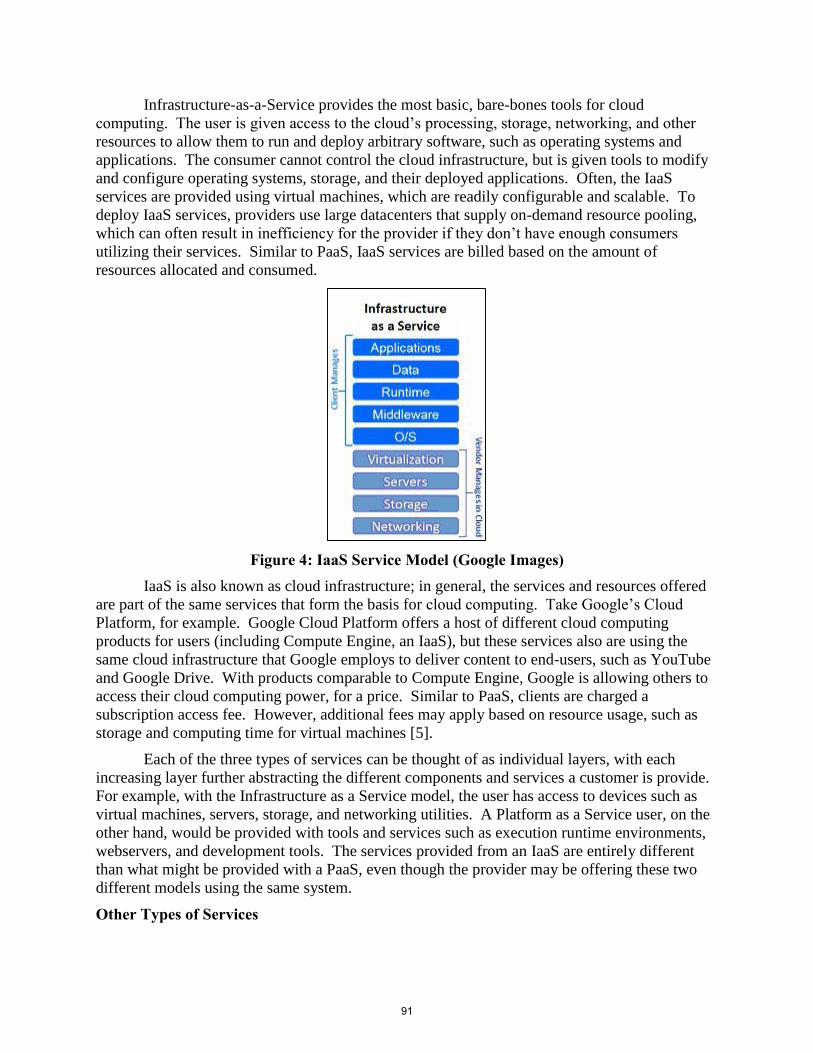
Infrastructure-as-a-Service provides the most basic, bare-bones tools for cloud
computing. The user is given access to the cloud’s processing, storage, networking, and other
resources to allow them to run and deploy arbitrary software, such as operating systems and
applications. The consumer cannot control the cloud infrastructure, but is given tools to modify
and configure operating systems, storage, and their deployed applications. Often, the IaaS
services are provided using virtual machines, which are readily configurable and scalable. To
deploy IaaS services, providers use large datacenters that supply on-demand resource pooling,
which can often result in inefficiency for the provider if they don’t have enough consumers
utilizing their services. Similar to PaaS, IaaS services are billed based on the amount of
resources allocated and consumed.
Figure 4: IaaS Service Model (Google Images) IaaS is also known as cloud infrastructure; in general, the services and resources offered
are part of the same services that form the basis for cloud computing. Take Google’s Cloud
Platform, for example. Google Cloud Platform offers a host of different cloud computing
products for users (including Compute Engine, an IaaS), but these services also are using the
same cloud infrastructure that Google employs to deliver content to end-users, such as YouTube
and Google Drive. With products comparable to Compute Engine, Google is allowing others to
access their cloud computing power, for a price. Similar to PaaS, clients are charged a
subscription access fee. However, additional fees may apply based on resource usage, such as
storage and computing time for virtual machines [5].
Each of the three types of services can be thought of as individual layers, with each
increasing layer further abstracting the different components and services a customer is provide.
For example, with the Infrastructure as a Service model, the user has access to devices such as
virtual machines, servers, storage, and networking utilities. A Platform as a Service user, on the
other hand, would be provided with tools and services such as execution runtime environments,
webservers, and development tools. The services provided from an IaaS are entirely different
than what might be provided with a PaaS, even though the provider may be offering these two
different models using the same system.
Other Types of Services
91
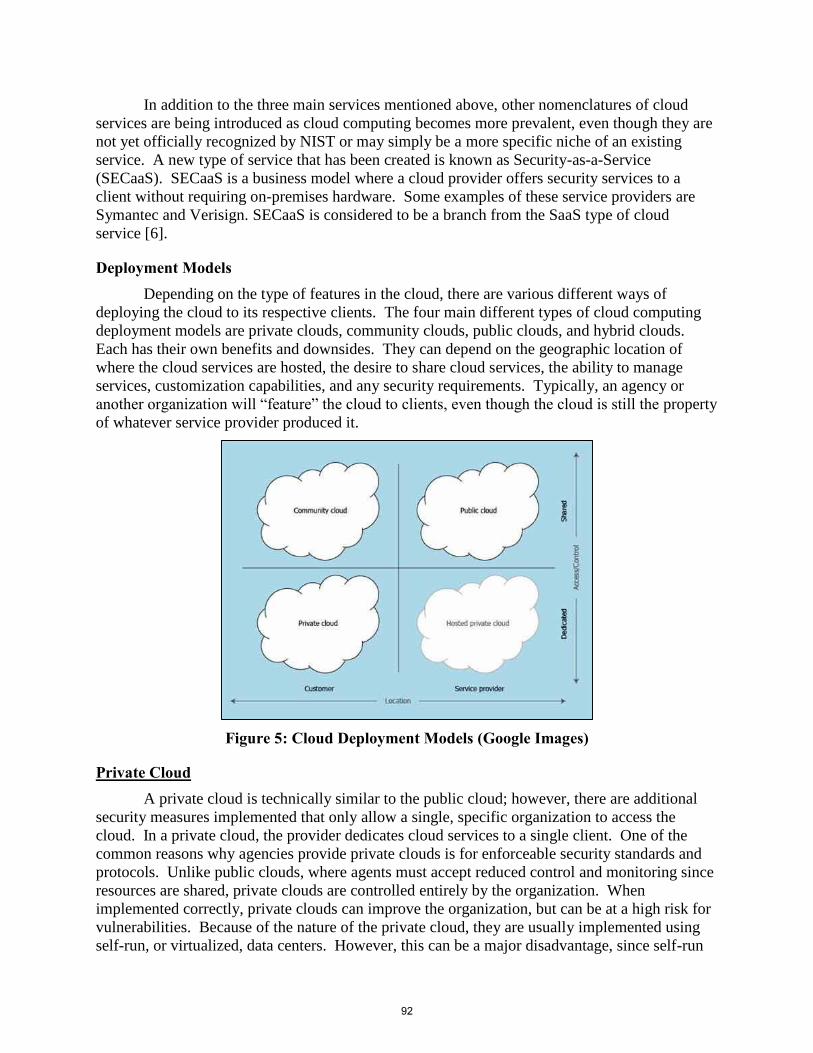
In addition to the three main services mentioned above, other nomenclatures of cloud
services are being introduced as cloud computing becomes more prevalent, even though they are
not yet officially recognized by NIST or may simply be a more specific niche of an existing
service. A new type of service that has been created is known as Security-as-a-Service
(SECaaS). SECaaS is a business model where a cloud provider offers security services to a
client without requiring on-premises hardware. Some examples of these service providers are
Symantec and Verisign. SECaaS is considered to be a branch from the SaaS type of cloud
service [6].
Deployment Models Depending on the type of features in the cloud, there are various different ways of
deploying the cloud to its respective clients. The four main different types of cloud computing
deployment models are private clouds, community clouds, public clouds, and hybrid clouds.
Each has their own benefits and downsides. They can depend on the geographic location of
where the cloud services are hosted, the desire to share cloud services, the ability to manage
services, customization capabilities, and any security requirements. Typically, an agency or
another organization will “feature” the cloud to clients, even though the cloud is still the property
of whatever service provider produced it.
Figure 5: Cloud Deployment Models (Google Images)
Private Cloud A private cloud is technically similar to the public cloud; however, there are additional
security measures implemented that only allow a single, specific organization to access the
cloud. In a private cloud, the provider dedicates cloud services to a single client. One of the
common reasons why agencies provide private clouds is for enforceable security standards and
protocols. Unlike public clouds, where agents must accept reduced control and monitoring since
resources are shared, private clouds are controlled entirely by the organization. When
implemented correctly, private clouds can improve the organization, but can be at a high risk for
vulnerabilities. Because of the nature of the private cloud, they are usually implemented using
self-run, or virtualized, data centers. However, this can be a major disadvantage, since self-run
92
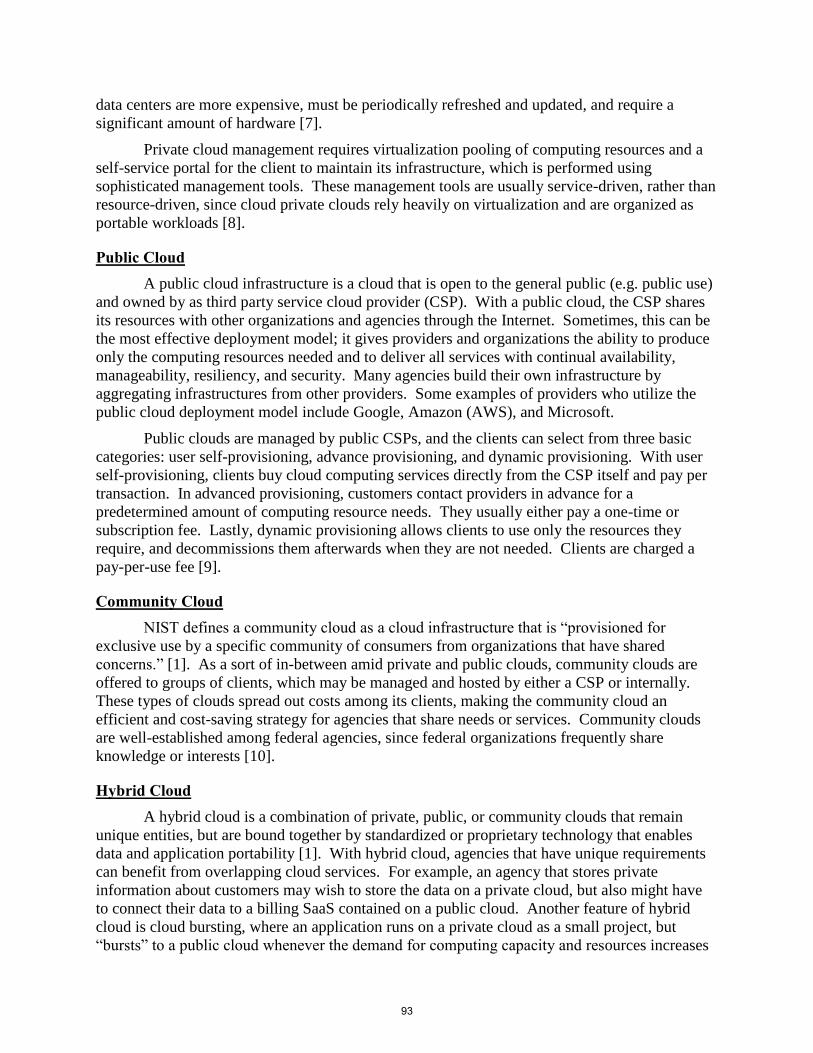
data centers are more expensive, must be periodically refreshed and updated, and require a
significant amount of hardware [7].
Private cloud management requires virtualization pooling of computing resources and a
self-service portal for the client to maintain its infrastructure, which is performed using
sophisticated management tools. These management tools are usually service-driven, rather than
resource-driven, since cloud private clouds rely heavily on virtualization and are organized as
portable workloads [8].
Public Cloud A public cloud infrastructure is a cloud that is open to the general public (e.g. public use)
and owned by as third party service cloud provider (CSP). With a public cloud, the CSP shares
its resources with other organizations and agencies through the Internet. Sometimes, this can be
the most effective deployment model; it gives providers and organizations the ability to produce
only the computing resources needed and to deliver all services with continual availability,
manageability, resiliency, and security. Many agencies build their own infrastructure by
aggregating infrastructures from other providers. Some examples of providers who utilize the
public cloud deployment model include Google, Amazon (AWS), and Microsoft.
Public clouds are managed by public CSPs, and the clients can select from three basic
categories: user self-provisioning, advance provisioning, and dynamic provisioning. With user
self-provisioning, clients buy cloud computing services directly from the CSP itself and pay per
transaction. In advanced provisioning, customers contact providers in advance for a
predetermined amount of computing resource needs. They usually either pay a one-time or
subscription fee. Lastly, dynamic provisioning allows clients to use only the resources they
require, and decommissions them afterwards when they are not needed. Clients are charged a
pay-per-use fee [9].
Community Cloud NIST defines a community cloud as a cloud infrastructure that is “provisioned for
exclusive use by a specific community of consumers from organizations that have shared
concerns.” [1]. As a sort of in-between amid private and public clouds, community clouds are
offered to groups of clients, which may be managed and hosted by either a CSP or internally.
These types of clouds spread out costs among its clients, making the community cloud an
efficient and cost-saving strategy for agencies that share needs or services. Community clouds
are well-established among federal agencies, since federal organizations frequently share
knowledge or interests [10].
Hybrid Cloud A hybrid cloud is a combination of private, public, or community clouds that remain
unique entities, but are bound together by standardized or proprietary technology that enables
data and application portability [1]. With hybrid cloud, agencies that have unique requirements
can benefit from overlapping cloud services. For example, an agency that stores private
information about customers may wish to store the data on a private cloud, but also might have
to connect their data to a billing SaaS contained on a public cloud. Another feature of hybrid
cloud is cloud bursting, where an application runs on a private cloud as a small project, but
“bursts” to a public cloud whenever the demand for computing capacity and resources increases
93
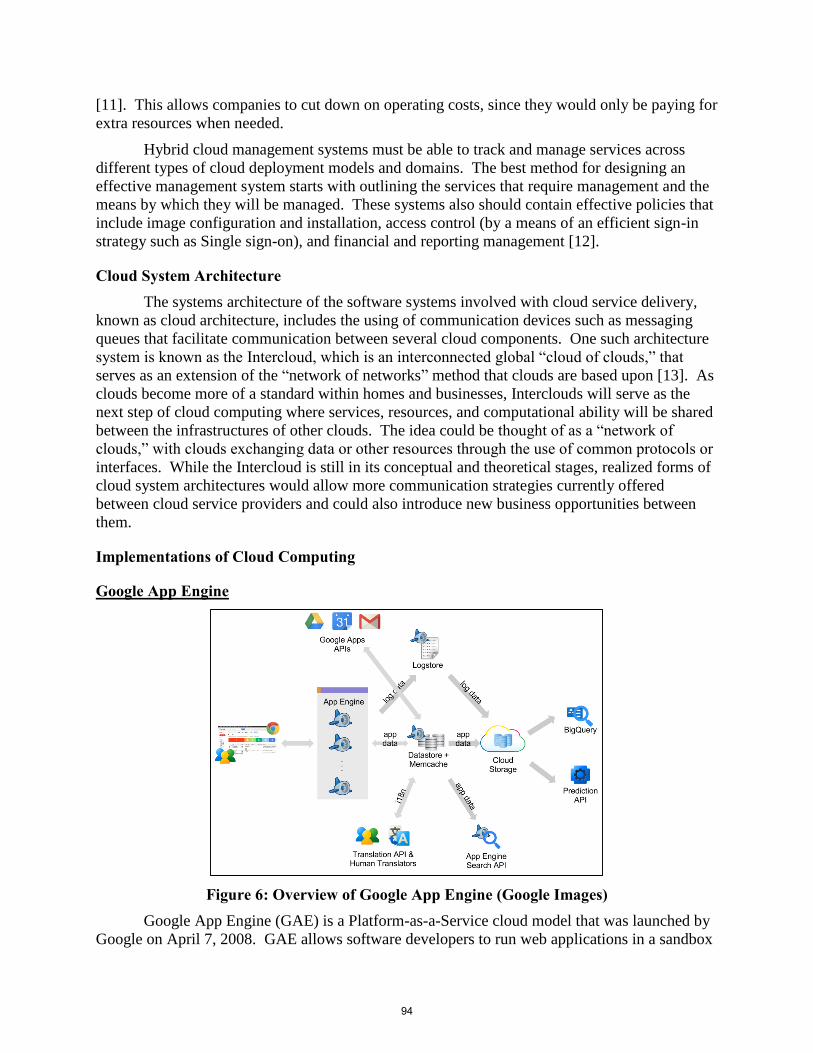
[11]. This allows companies to cut down on operating costs, since they would only be paying for
extra resources when needed.
Hybrid cloud management systems must be able to track and manage services across
different types of cloud deployment models and domains. The best method for designing an
effective management system starts with outlining the services that require management and the
means by which they will be managed. These systems also should contain effective policies that
include image configuration and installation, access control (by a means of an efficient sign-in
strategy such as Single sign-on), and financial and reporting management [12].
Cloud System Architecture The systems architecture of the software systems involved with cloud service delivery,
known as cloud architecture, includes the using of communication devices such as messaging
queues that facilitate communication between several cloud components. One such architecture
system is known as the Intercloud, which is an interconnected global “cloud of clouds,” that
serves as an extension of the “network of networks” method that clouds are based upon [13]. As
clouds become more of a standard within homes and businesses, Interclouds will serve as the
next step of cloud computing where services, resources, and computational ability will be shared
between the infrastructures of other clouds. The idea could be thought of as a “network of
clouds,” with clouds exchanging data or other resources through the use of common protocols or
interfaces. While the Intercloud is still in its conceptual and theoretical stages, realized forms of
cloud system architectures would allow more communication strategies currently offered
between cloud service providers and could also introduce new business opportunities between
them.
Implementations of Cloud Computing
Google App Engine
Figure 6: Overview of Google App Engine (Google Images) Google App Engine (GAE) is a Platform-as-a-Service cloud model that was launched by
Google on April 7, 2008. GAE allows software developers to run web applications in a sandbox
94
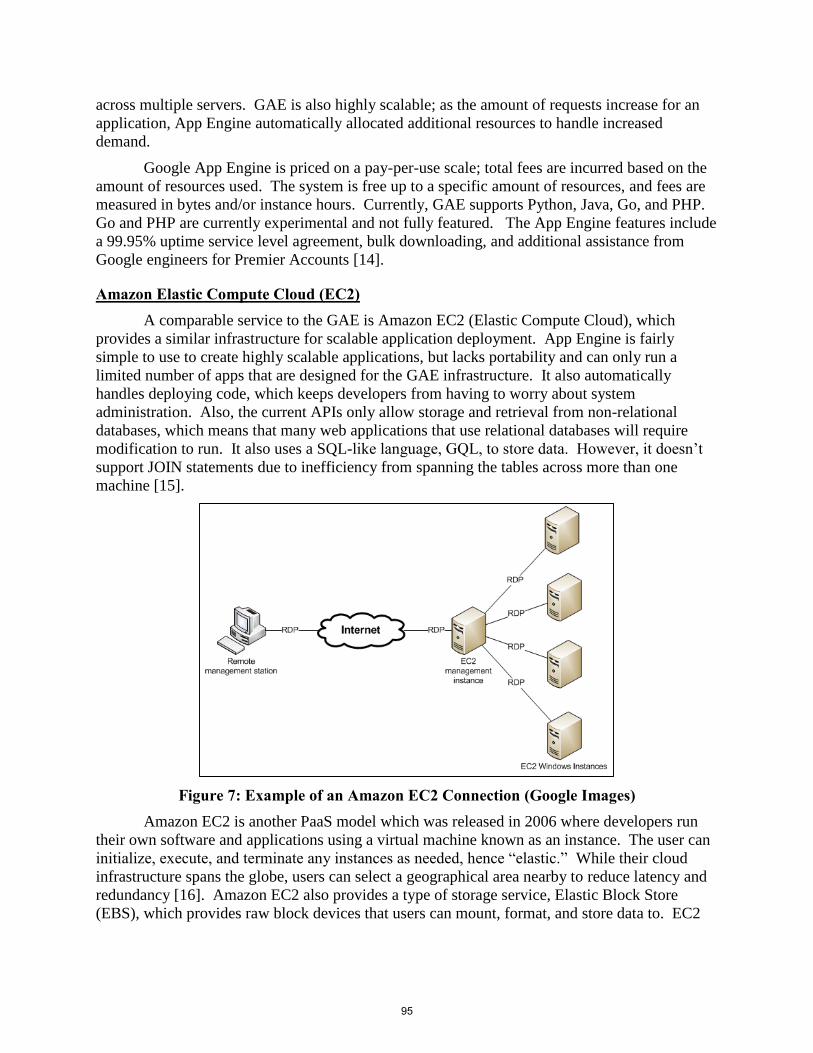
across multiple servers. GAE is also highly scalable; as the amount of requests increase for an
application, App Engine automatically allocated additional resources to handle increased
demand.
Google App Engine is priced on a pay-per-use scale; total fees are incurred based on the
amount of resources used. The system is free up to a specific amount of resources, and fees are
measured in bytes and/or instance hours. Currently, GAE supports Python, Java, Go, and PHP.
Go and PHP are currently experimental and not fully featured. The App Engine features include
a 99.95% uptime service level agreement, bulk downloading, and additional assistance from
Google engineers for Premier Accounts [14].
Amazon Elastic Compute Cloud (EC2) A comparable service to the GAE is Amazon EC2 (Elastic Compute Cloud), which
provides a similar infrastructure for scalable application deployment. App Engine is fairly
simple to use to create highly scalable applications, but lacks portability and can only run a
limited number of apps that are designed for the GAE infrastructure. It also automatically
handles deploying code, which keeps developers from having to worry about system
administration. Also, the current APIs only allow storage and retrieval from non-relational
databases, which means that many web applications that use relational databases will require
modification to run. It also uses a SQL-like language, GQL, to store data. However, it doesn’t
support JOIN statements due to inefficiency from spanning the tables across more than one
machine [15].
Figure 7: Example of an Amazon EC2 Connection (Google Images) Amazon EC2 is another PaaS model which was released in 2006 where developers run
their own software and applications using a virtual machine known as an instance. The user can
initialize, execute, and terminate any instances as needed, hence “elastic.” While their cloud
infrastructure spans the globe, users can select a geographical area nearby to reduce latency and
redundancy [16]. Amazon EC2 also provides a type of storage service, Elastic Block Store
(EBS), which provides raw block devices that users can mount, format, and store data to. EC2
95
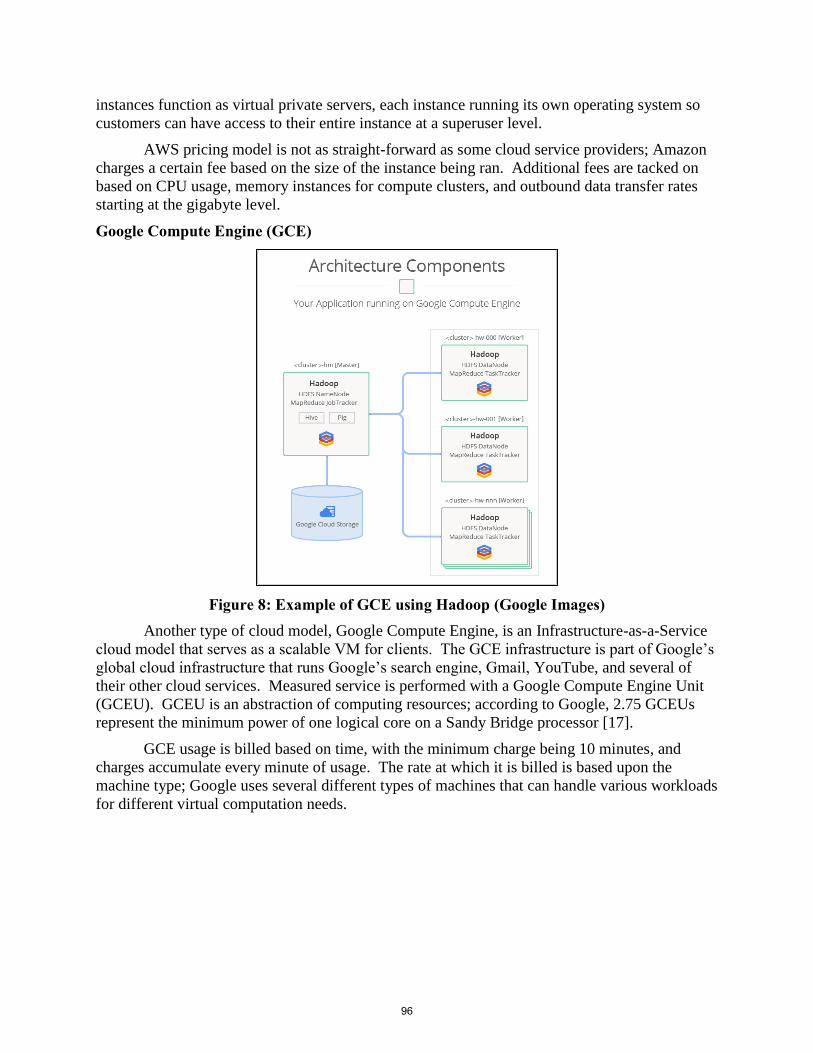
instances function as virtual private servers, each instance running its own operating system so
customers can have access to their entire instance at a superuser level.
AWS pricing model is not as straight-forward as some cloud service providers; Amazon
charges a certain fee based on the size of the instance being ran. Additional fees are tacked on
based on CPU usage, memory instances for compute clusters, and outbound data transfer rates
starting at the gigabyte level.
Google Compute Engine (GCE)
Figure 8: Example of GCE using Hadoop (Google Images) Another type of cloud model, Google Compute Engine, is an Infrastructure-as-a-Service
cloud model that serves as a scalable VM for clients. The GCE infrastructure is part of Google’s
global cloud infrastructure that runs Google’s search engine, Gmail, YouTube, and several of
their other cloud services. Measured service is performed with a Google Compute Engine Unit
(GCEU). GCEU is an abstraction of computing resources; according to Google, 2.75 GCEUs
represent the minimum power of one logical core on a Sandy Bridge processor [17].
GCE usage is billed based on time, with the minimum charge being 10 minutes, and
charges accumulate every minute of usage. The rate at which it is billed is based upon the
machine type; Google uses several different types of machines that can handle various workloads
for different virtual computation needs.
96
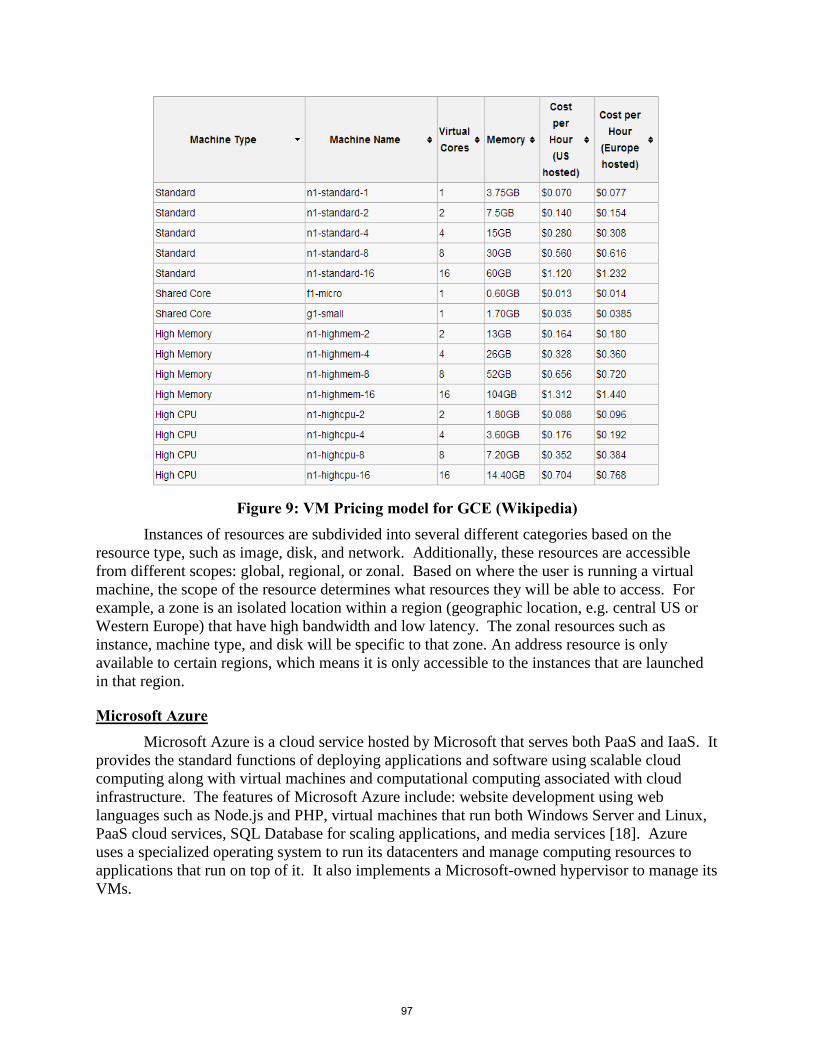
Figure 9: VM Pricing model for GCE (Wikipedia) Instances of resources are subdivided into several different categories based on the
resource type, such as image, disk, and network. Additionally, these resources are accessible
from different scopes: global, regional, or zonal. Based on where the user is running a virtual
machine, the scope of the resource determines what resources they will be able to access. For
example, a zone is an isolated location within a region (geographic location, e.g. central US or
Western Europe) that have high bandwidth and low latency. The zonal resources such as
instance, machine type, and disk will be specific to that zone. An address resource is only
available to certain regions, which means it is only accessible to the instances that are launched
in that region.
Microsoft Azure Microsoft Azure is a cloud service hosted by Microsoft that serves both PaaS and IaaS. It
provides the standard functions of deploying applications and software using scalable cloud
computing along with virtual machines and computational computing associated with cloud
infrastructure. The features of Microsoft Azure include: website development using web
languages such as Node.js and PHP, virtual machines that run both Windows Server and Linux,
PaaS cloud services, SQL Database for scaling applications, and media services [18]. Azure
uses a specialized operating system to run its datacenters and manage computing resources to
applications that run on top of it. It also implements a Microsoft-owned hypervisor to manage its
VMs.
97
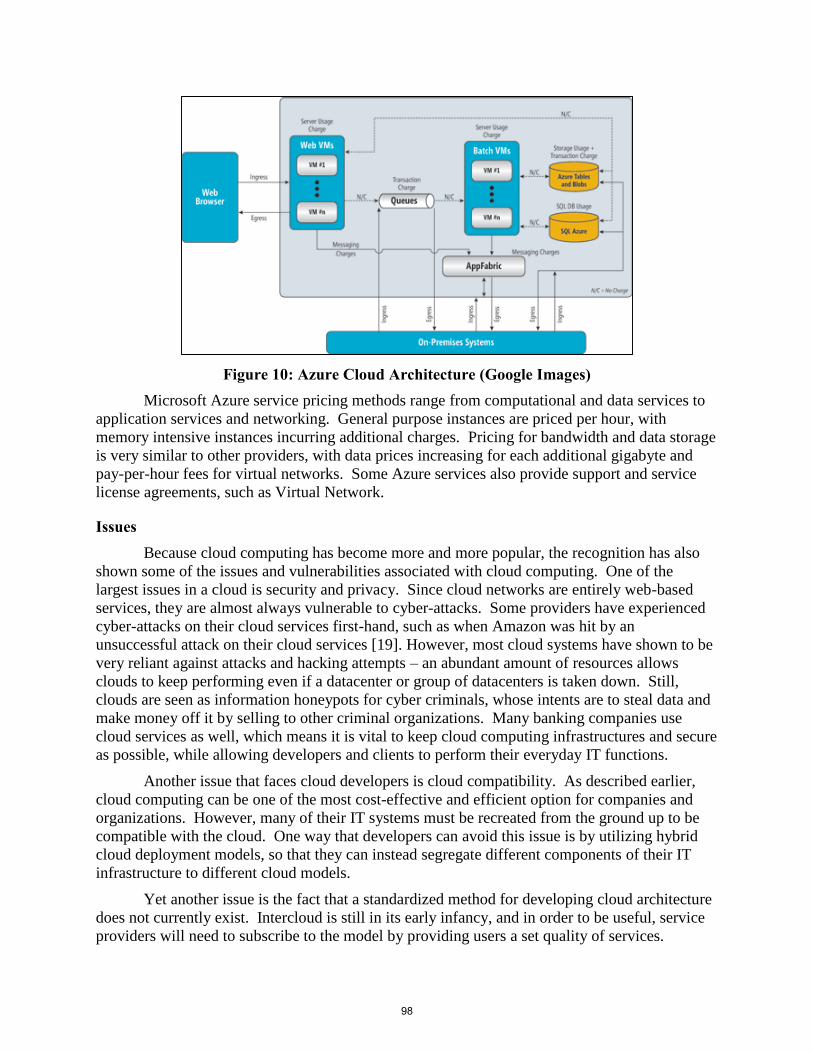
Figure 10: Azure Cloud Architecture (Google Images) Microsoft Azure service pricing methods range from computational and data services to
application services and networking. General purpose instances are priced per hour, with
memory intensive instances incurring additional charges. Pricing for bandwidth and data storage
is very similar to other providers, with data prices increasing for each additional gigabyte and
pay-per-hour fees for virtual networks. Some Azure services also provide support and service
license agreements, such as Virtual Network.
Issues Because cloud computing has become more and more popular, the recognition has also
shown some of the issues and vulnerabilities associated with cloud computing. One of the
largest issues in a cloud is security and privacy. Since cloud networks are entirely web-based
services, they are almost always vulnerable to cyber-attacks. Some providers have experienced
cyber-attacks on their cloud services first-hand, such as when Amazon was hit by an
unsuccessful attack on their cloud services [19]. However, most cloud systems have shown to be
very reliant against attacks and hacking attempts – an abundant amount of resources allows
clouds to keep performing even if a datacenter or group of datacenters is taken down. Still,
clouds are seen as information honeypots for cyber criminals, whose intents are to steal data and
make money off it by selling to other criminal organizations. Many banking companies use
cloud services as well, which means it is vital to keep cloud computing infrastructures and secure
as possible, while allowing developers and clients to perform their everyday IT functions.
Another issue that faces cloud developers is cloud compatibility. As described earlier,
cloud computing can be one of the most cost-effective and efficient option for companies and
organizations. However, many of their IT systems must be recreated from the ground up to be
compatible with the cloud. One way that developers can avoid this issue is by utilizing hybrid
cloud deployment models, so that they can instead segregate different components of their IT
infrastructure to different cloud models.
Yet another issue is the fact that a standardized method for developing cloud architecture
does not currently exist. Intercloud is still in its early infancy, and in order to be useful, service
providers will need to subscribe to the model by providing users a set quality of services.
98
Because cloud computing standards are immature, it’s very difficult for a client to be able to
recognize the quality of the services that they are receiving. A fallback for the client is to ensure
that the provider that they are purchasing the service from uses technology that complies to NIST
standards and uses cloud models that conform to the NIST definition of cloud computing [20].
Conclusion To summarize, cloud computing offers a new set of services and technologies that had
never been available before the early 21st century, through the use of the World Wide Web.
Only recently in the past few years have service providers and standards organizations began to
start thinking about the importance of standardizing cloud computing technologies. In order for
cloud services to be beneficial for not only today’s companies and organizations, but for future
ones as well, cloud service providers will need to work together to create a cloud framework that
encourages interconnection and stability. Clients should be able to choose services that are
suited to their needs, whether it be infrastructure, platform, or software-oriented. Additionally,
the deployment models for these cloud services should match a standardized set of methods
introduced by standards organizations such as NIST so that clients can know everything about
the cloud service they will be using. In comparing the different implementations of current cloud
models, it’s clear there is no “one size fits all” cloud – there are many different advantages and
disadvantages associated with each different type of cloud service. The company that makes the
most constructive use of cloud resources is the one who compares different cloud models against
the types of services that they need and is flexible enough to branch different compartments of
their IT infrastructure into separate, but interconnected cloud services. Lastly, while clouds are
mostly resilient towards cyber-security attacks, service downtime, and compatibility issues, it’s
important that these and any other issues be addressed so that the cloud model can continue to be
updated. An updated and efficient cloud means that both clients and providers will be able to
take full advantage of a cloud computing system.
References [1] Mell, Grance, “The NIST Definition of Cloud Computing,” Internet:
http://csrc.nist.gov/publications/nistpubs/800-145/SP800-145.pdf, 2011.
[2] “Ajax Asynchronous JavaScript and XML,” Internet:
http://searchwindevelopment.techtarget.com/definition/Ajax, 2007.
[3] “Platform as a Service,” Internet: http://en.wikipedia.org/wiki/Platform_as_a_service,
2013.
[4] “About MobiDM,” Internet: http://www.mobidm.com/about-mobidm/mobile-platform-as-
a-service-mpaas/, 2014.
[5] “Compute Engine,” Internet: https://cloud.google.com/products/compute-engine/, 2014.
[6] “Security as a Service (SaaS),” Internet:
http://searchsecurity.techtarget.com/definition/Security-as-a-Service, 2010.
[7] “Is a Private Cloud Really More Secure?,” Internet: http://cloudandcompute.com/private-
cloud/private-cloud-more-secure/, 2014.
99
[8] “A Guide to Managing Private Clouds,” Internet:
http://www.datacenterknowledge.com/archives/2010/04/19/a-guide-to-managing-private-
clouds/, 2010.
[9] “Elastic Application Container: A Lightweight Approach for Cloud Resource
Provisioning,” Internet: http://www.datacenterknowledge.com/archives/2010/04/19/a-
guide-to-managing-private-clouds/, 2012.
[10] “Federal IT Shared Services Strategy,” Internet: http://cloud.cio.gov/document/federal-it-
shared-services-strategy, 2012.
[11] “Cloud Bursting,” Internet: http://searchcloudcomputing.techtarget.com/definition/cloud-
bursting, 2014.
[12] “Hybrid Management Tools and Strategies,” Internet:
http://searchcloudcomputing.techtarget.com/tip/Hybrid-cloud-management-tools-and-
strategies, 2012.
[13] “Vint Cerf: Despite Its Age the Internet is Still Filled with Problems,” Internet:
http://readwrite.com/2009/02/15/vint_cerf_despite_its_age_the#awesm=~oCR0Eb6P1drO
cg, 2009
[14] “Google App Engine: Platform as a Service,” Internet:
https://developers.google.com/appengine/, 2014.
[15] “Campfire One: Introducing Google App Engine (pt. 3),” Internet:
https://www.youtube.com/watch?v=oG6Ac7d-Nx8, 2008.
[16] “Amazon Web Services adds ‘Resiliency’ to EC2 Compute Service.,” Internet:
http://www.cnet.com/news/amazon-web-services-adds-resiliency-to-ec2-compute-
service/, 2008.
[17] “Google Compute Engine: Virtual Machines at Google Scale,” Internet:
https://developers.google.com/compute/, 2014.
[18] “The Cloud for Modern Business,” Internet: http://azure.microsoft.com/en-us/, 2014.
[19] “WikiLeaks cables: Shell, Operation Payback and Assange for the Nobel Prize – as it
Happened,” Internet: http://www.theguardian.com/news/blog/2010/dec/09/wikileaks-us-
embassy-cables-live-updates, 2014.
[20] “The Risks Involved in Cloud Computing,” Internet:
http://mobiledevices.about.com/od/additionalresources/tp/The-Risks-Involved-In-Cloud-
Computing.htm, 2011.
100
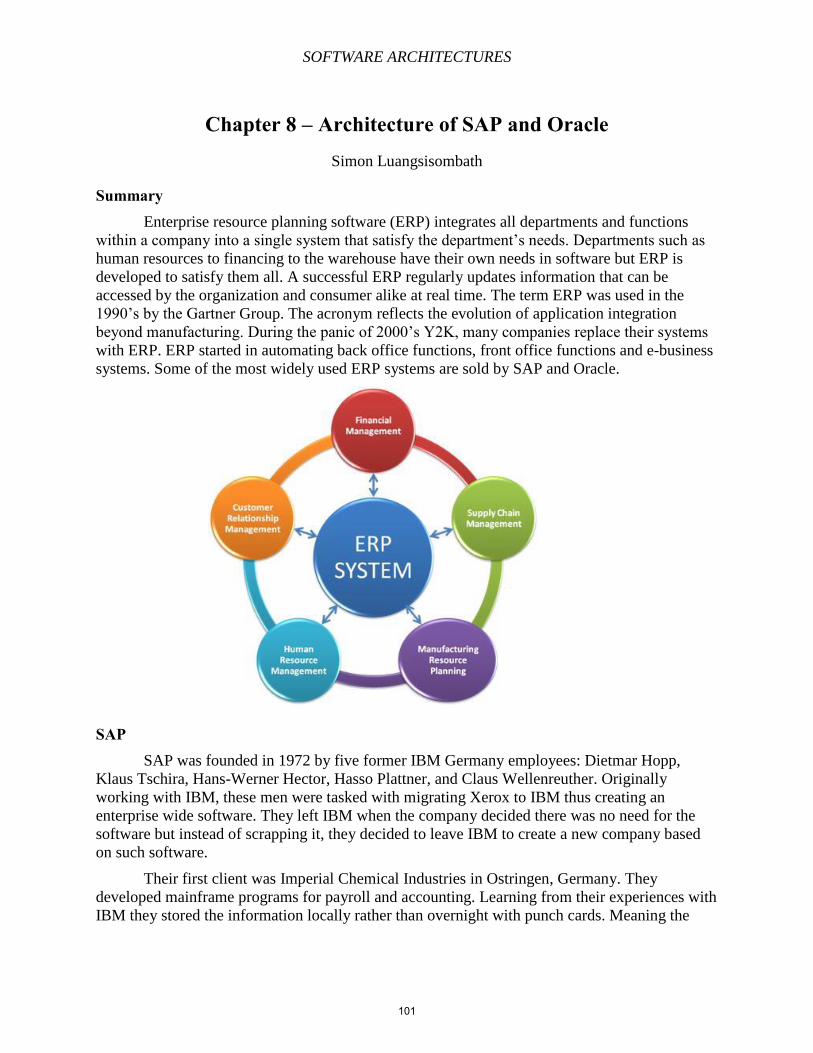
SOFTWARE ARCHITECTURES
Chapter 8 – Architecture of SAP and Oracle Simon Luangsisombath
Summary Enterprise resource planning software (ERP) integrates all departments and functions
within a company into a single system that satisfy the department’s needs. Departments such as
human resources to financing to the warehouse have their own needs in software but ERP is
developed to satisfy them all. A successful ERP regularly updates information that can be
accessed by the organization and consumer alike at real time. The term ERP was used in the
1990’s by the Gartner Group. The acronym reflects the evolution of application integration
beyond manufacturing. During the panic of 2000’s Y2K, many companies replace their systems
with ERP. ERP started in automating back office functions, front office functions and e-business
systems. Some of the most widely used ERP systems are sold by SAP and Oracle.
SAP SAP was founded in 1972 by five former IBM Germany employees: Dietmar Hopp,
Klaus Tschira, Hans-Werner Hector, Hasso Plattner, and Claus Wellenreuther. Originally
working with IBM, these men were tasked with migrating Xerox to IBM thus creating an
enterprise wide software. They left IBM when the company decided there was no need for the
software but instead of scrapping it, they decided to leave IBM to create a new company based
on such software.
Their first client was Imperial Chemical Industries in Ostringen, Germany. They
developed mainframe programs for payroll and accounting. Learning from their experiences with
IBM they stored the information locally rather than overnight with punch cards. Meaning the
101
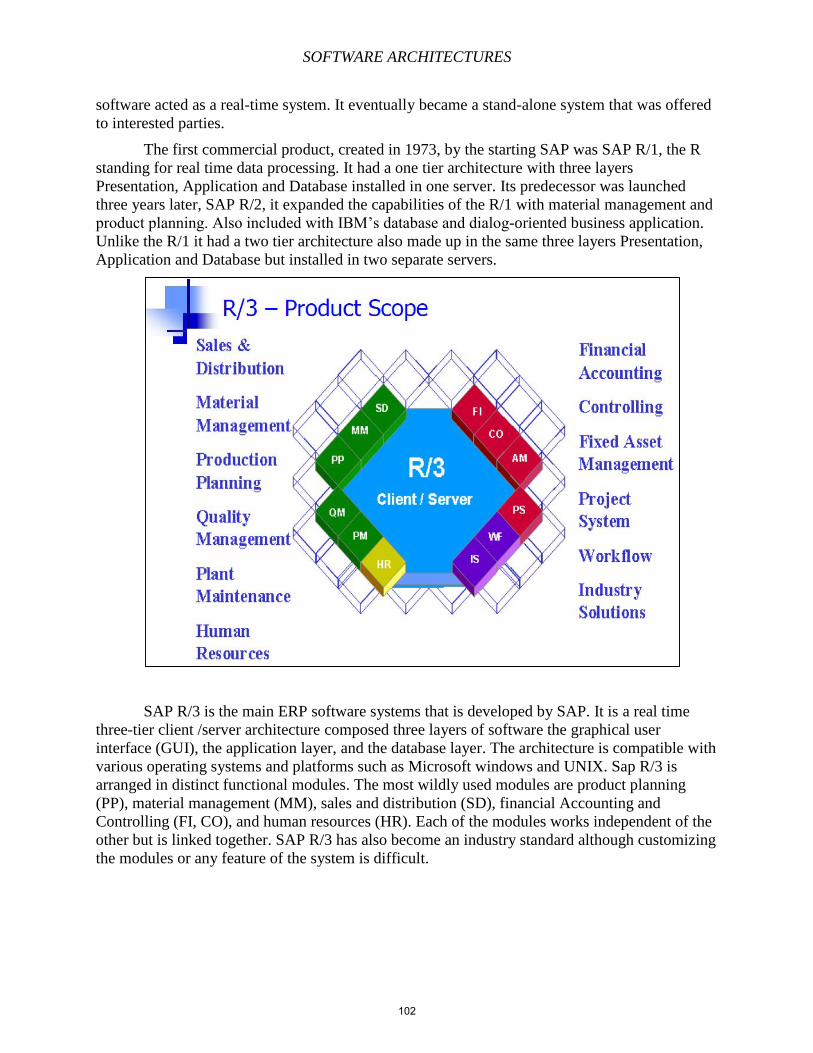
SOFTWARE ARCHITECTURES
software acted as a real-time system. It eventually became a stand-alone system that was offered
to interested parties.
The first commercial product, created in 1973, by the starting SAP was SAP R/1, the R
standing for real time data processing. It had a one tier architecture with three layers
Presentation, Application and Database installed in one server. Its predecessor was launched
three years later, SAP R/2, it expanded the capabilities of the R/1 with material management and
product planning. Also included with IBM’s database and dialog-oriented business application.
Unlike the R/1 it had a two tier architecture also made up in the same three layers Presentation,
Application and Database but installed in two separate servers.
SAP R/3 is the main ERP software systems that is developed by SAP. It is a real time
three-tier client /server architecture composed three layers of software the graphical user
interface (GUI), the application layer, and the database layer. The architecture is compatible with
various operating systems and platforms such as Microsoft windows and UNIX. Sap R/3 is
arranged in distinct functional modules. The most wildly used modules are product planning
(PP), material management (MM), sales and distribution (SD), financial Accounting and
Controlling (FI, CO), and human resources (HR). Each of the modules works independent of the
other but is linked together. SAP R/3 has also become an industry standard although customizing
the modules or any feature of the system is difficult.
102
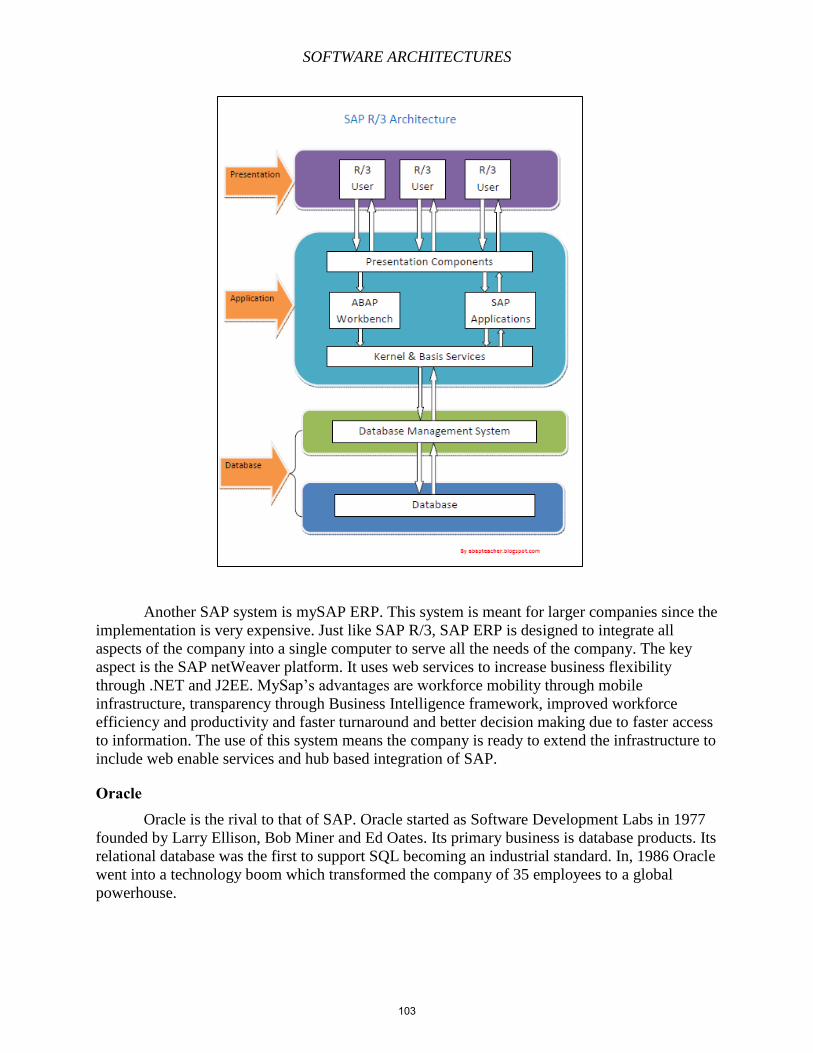
SOFTWARE ARCHITECTURES
Another SAP system is mySAP ERP. This system is meant for larger companies since the
implementation is very expensive. Just like SAP R/3, SAP ERP is designed to integrate all
aspects of the company into a single computer to serve all the needs of the company. The key
aspect is the SAP netWeaver platform. It uses web services to increase business flexibility
through .NET and J2EE. MySap’s advantages are workforce mobility through mobile
infrastructure, transparency through Business Intelligence framework, improved workforce
efficiency and productivity and faster turnaround and better decision making due to faster access
to information. The use of this system means the company is ready to extend the infrastructure to
include web enable services and hub based integration of SAP.
Oracle Oracle is the rival to that of SAP. Oracle started as Software Development Labs in 1977
founded by Larry Ellison, Bob Miner and Ed Oates. Its primary business is database products. Its
relational database was the first to support SQL becoming an industrial standard. In, 1986 Oracle
went into a technology boom which transformed the company of 35 employees to a global
powerhouse.
103
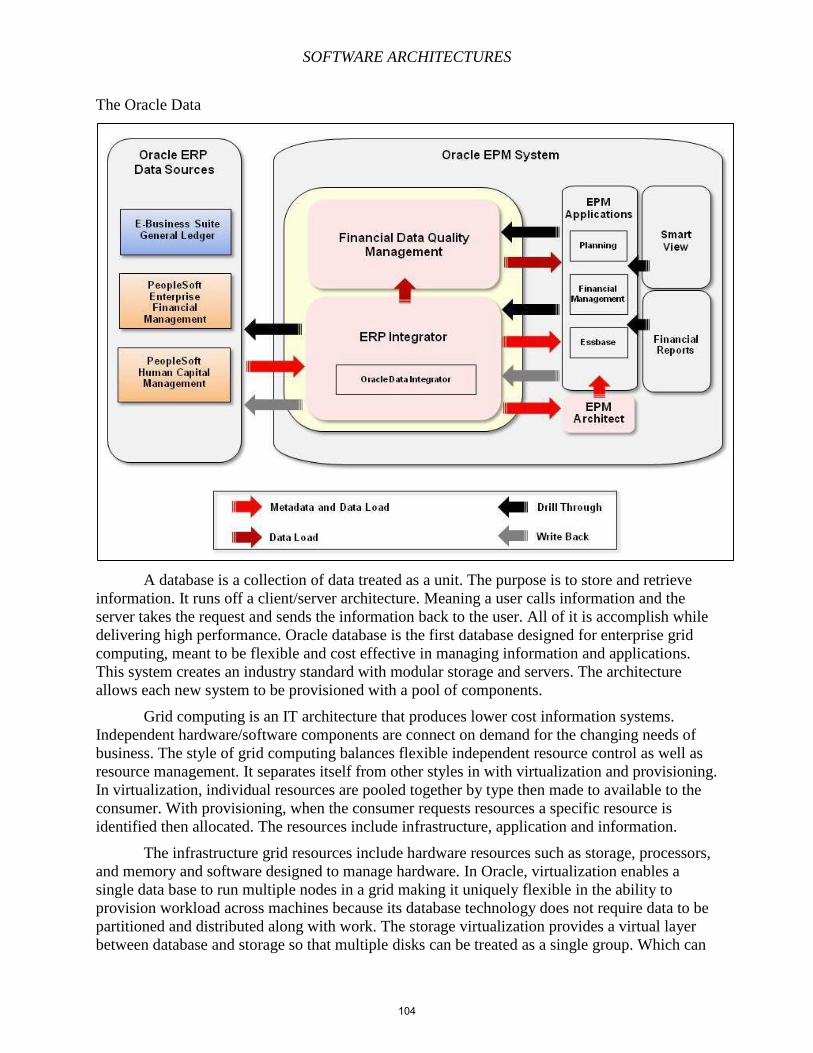
SOFTWARE ARCHITECTURES
The Oracle Data
A database is a collection of data treated as a unit. The purpose is to store and retrieve
information. It runs off a client/server architecture. Meaning a user calls information and the
server takes the request and sends the information back to the user. All of it is accomplish while
delivering high performance. Oracle database is the first database designed for enterprise grid
computing, meant to be flexible and cost effective in managing information and applications.
This system creates an industry standard with modular storage and servers. The architecture
allows each new system to be provisioned with a pool of components.
Grid computing is an IT architecture that produces lower cost information systems.
Independent hardware/software components are connect on demand for the changing needs of
business. The style of grid computing balances flexible independent resource control as well as
resource management. It separates itself from other styles in with virtualization and provisioning.
In virtualization, individual resources are pooled together by type then made to available to the
consumer. With provisioning, when the consumer requests resources a specific resource is
identified then allocated. The resources include infrastructure, application and information.
The infrastructure grid resources include hardware resources such as storage, processors,
and memory and software designed to manage hardware. In Oracle, virtualization enables a
single data base to run multiple nodes in a grid making it uniquely flexible in the ability to
provision workload across machines because its database technology does not require data to be
partitioned and distributed along with work. The storage virtualization provides a virtual layer
between database and storage so that multiple disks can be treated as a single group. Which can
104
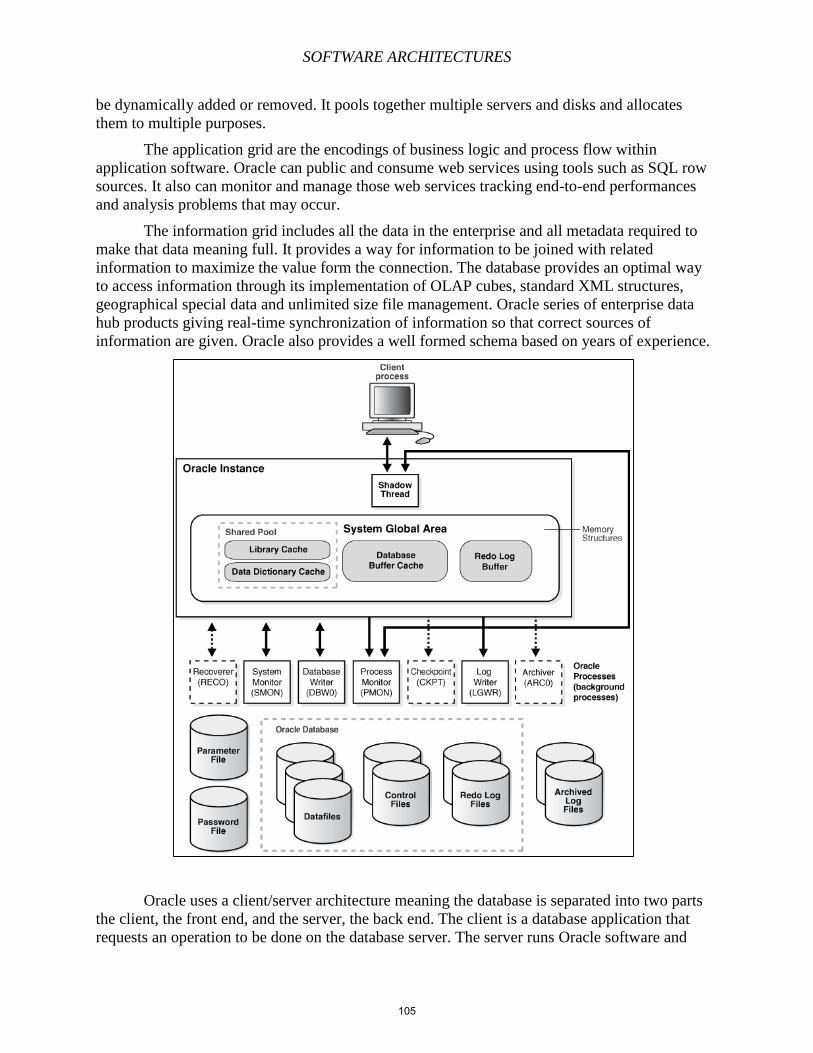
SOFTWARE ARCHITECTURES
be dynamically added or removed. It pools together multiple servers and disks and allocates
them to multiple purposes.
The application grid are the encodings of business logic and process flow within
application software. Oracle can public and consume web services using tools such as SQL row
sources. It also can monitor and manage those web services tracking end-to-end performances
and analysis problems that may occur.
The information grid includes all the data in the enterprise and all metadata required to
make that data meaning full. It provides a way for information to be joined with related
information to maximize the value form the connection. The database provides an optimal way
to access information through its implementation of OLAP cubes, standard XML structures,
geographical special data and unlimited size file management. Oracle series of enterprise data
hub products giving real-time synchronization of information so that correct sources of
information are given. Oracle also provides a well formed schema based on years of experience.
Oracle uses a client/server architecture meaning the database is separated into two parts
the client, the front end, and the server, the back end. The client is a database application that
requests an operation to be done on the database server. The server runs Oracle software and
105
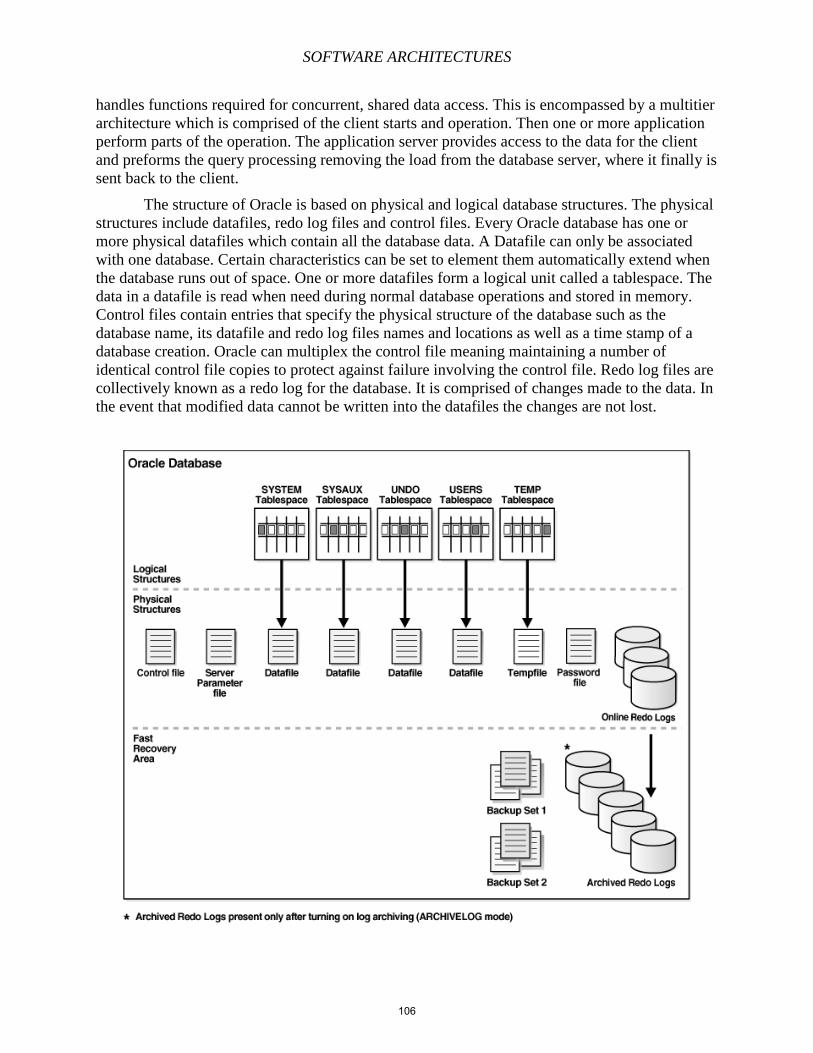
SOFTWARE ARCHITECTURES
handles functions required for concurrent, shared data access. This is encompassed by a multitier
architecture which is comprised of the client starts and operation. Then one or more application
perform parts of the operation. The application server provides access to the data for the client
and preforms the query processing removing the load from the database server, where it finally is
sent back to the client.
The structure of Oracle is based on physical and logical database structures. The physical
structures include datafiles, redo log files and control files. Every Oracle database has one or
more physical datafiles which contain all the database data. A Datafile can only be associated
with one database. Certain characteristics can be set to element them automatically extend when
the database runs out of space. One or more datafiles form a logical unit called a tablespace. The
data in a datafile is read when need during normal database operations and stored in memory.
Control files contain entries that specify the physical structure of the database such as the
database name, its datafile and redo log files names and locations as well as a time stamp of a
database creation. Oracle can multiplex the control file meaning maintaining a number of
identical control file copies to protect against failure involving the control file. Redo log files are
collectively known as a redo log for the database. It is comprised of changes made to the data. In
the event that modified data cannot be written into the datafiles the changes are not lost.
106
SOFTWARE ARCHITECTURES
The logical database structure includes data blocks, extents and segments. Data in Oracle
is stored into a data block. One block corresponds to a specific number of bytes of physical
database space on the disk. Extends is the next level of space which is a specific number of
contiguous data blocks used to store information. Segments are above extends meaning it
contains a seed of extends allocated for a certain logical structure.
Features of Oracle include concurrency, read consistency, a locking mechanism, quiesce
database, real application clusters and portability. Concurrency, which happens when the same
data is access by multiple users, is a primary concern in a multiuser database. Oracle resolves
this issue by using various types of clocks and a multi-version consistency model based on the
concept of a transaction. Oracle’s read consistency guarantees the state of data seen by a
statement is consistent with the time that the data was accessed. It ensures that readers do not
wait for writers of data and writer do not wait for readers of the same data. To manage this
Oracle creates a read-consistent set of data when the table is queried and simultaneously updated.
When the update occurs the original data is overridden unless the transaction is uncommitted
meaning the data is held later and the original data is intact. By default, Oracle queried data is
consistent with respect to the time it was accessed.
The locking mechanism is used by Oracle to prevent data from being access by multiple
users at the same time. When updating information, the data server hold that information in a
lock and until the update is either submitted or committed no one else can make changes to the
locked information. Oracles lock manager maintains two types of row locks exclusive locks and
share locks. Exclusive locks can be places on a resource such as a table while many share locks
can be places on a single table but neither can create the lock on the table if one already locks a
table. There are occasions where isolation is need for the database administrators one way is to
put the database in restricted mode but in most cases it is difficult so Oracle uses a quiesced state
that doesn’t disrupt users. In this state administrators can safely perform actions whose
executions would require isolation from concurrent non-DBA users.
Real Application Clusters comprises several Oracle instances running on multiple
clustered computers. It uses cluster software to access a shared database residing on a shared
disk. Combining processing power of interconnected computers, RAC provides system
redundancy, near linear scalability and high availability. Oracle provide portability a cross major
platforms and ensure applications run without modifications after changing. The reason being
that Oracle code is identical across platforms.
As a company get larger manageability comes into effect where some have difficulty
maintaining and updating software and databases. Oracle provides a solution to that problem. Its
database provides a high degree of self-management making the task of the database
administrators easier and allow them to focus on more important parts of the database. Oracles
self-managing database include automatic undo management, dynamic memory management,
Oracle-managed files and Recover Manager. With the Oracle Enterprise Manager it provides
integrated solutions for centrally managing the systems environment. Oracle also has an
automatic storage management that simplifies the layout of the datafiles, control files and log
files. Database files are distributed automatically across available disks when database storage is
rebalanced during a storage configuration change. The database resource manager controls the
distribution of resources among sessions by controlling the execution schedule in the database.
Resources can then be distributed for based on plan directives.
107
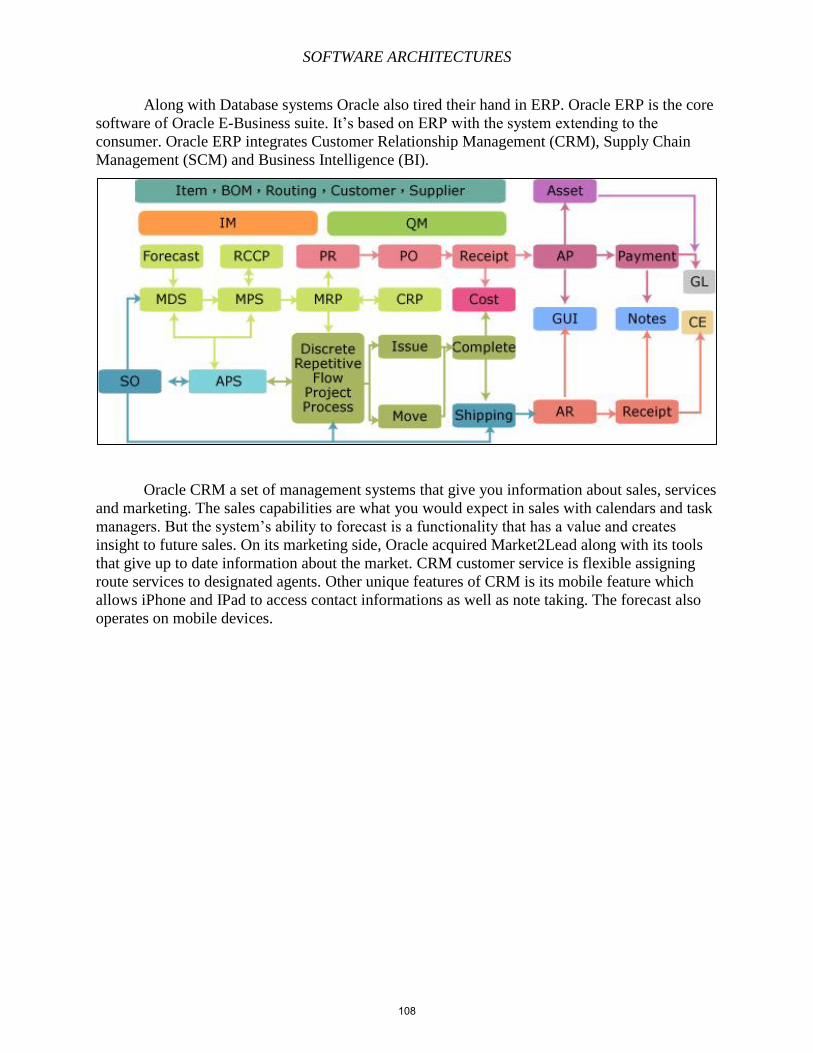
SOFTWARE ARCHITECTURES
Along with Database systems Oracle also tired their hand in ERP. Oracle ERP is the core
software of Oracle E-Business suite. It’s based on ERP with the system extending to the
consumer. Oracle ERP integrates Customer Relationship Management (CRM), Supply Chain
Management (SCM) and Business Intelligence (BI).
Oracle CRM a set of management systems that give you information about sales, services
and marketing. The sales capabilities are what you would expect in sales with calendars and task
managers. But the system’s ability to forecast is a functionality that has a value and creates
insight to future sales. On its marketing side, Oracle acquired Market2Lead along with its tools
that give up to date information about the market. CRM customer service is flexible assigning
route services to designated agents. Other unique features of CRM is its mobile feature which
allows iPhone and IPad to access contact informations as well as note taking. The forecast also
operates on mobile devices.
108
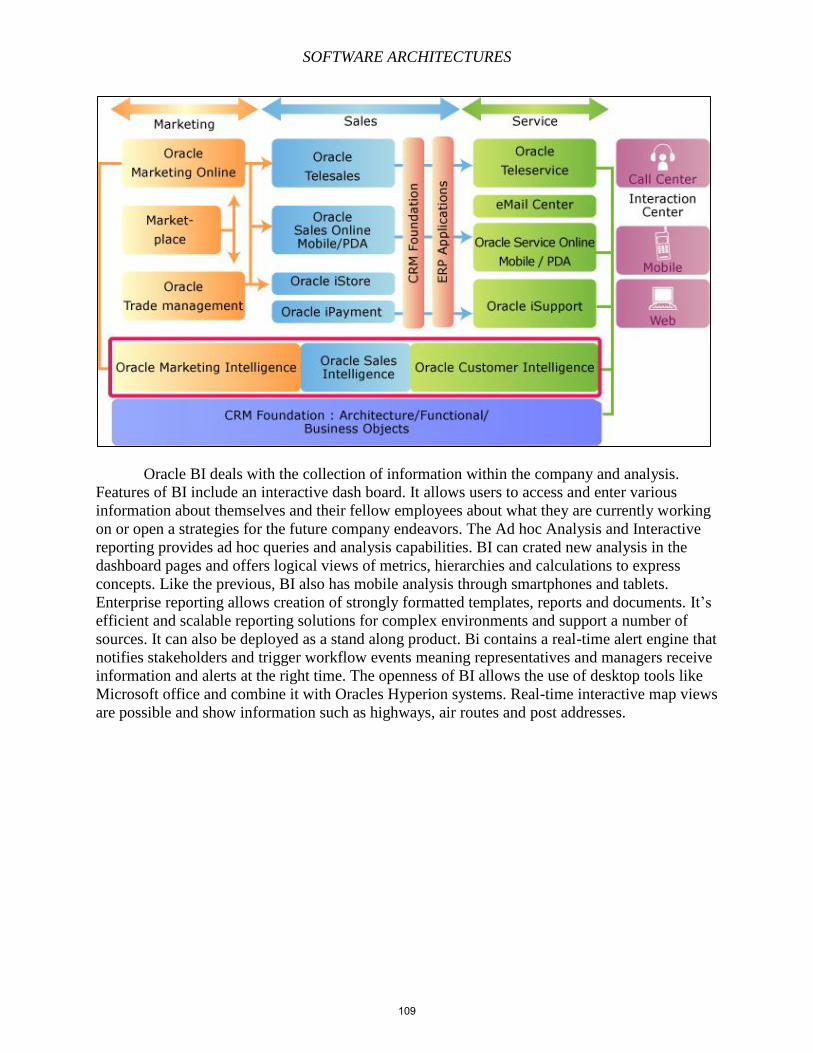
SOFTWARE ARCHITECTURES
Oracle BI deals with the collection of information within the company and analysis.
Features of BI include an interactive dash board. It allows users to access and enter various
information about themselves and their fellow employees about what they are currently working
on or open a strategies for the future company endeavors. The Ad hoc Analysis and Interactive
reporting provides ad hoc queries and analysis capabilities. BI can crated new analysis in the
dashboard pages and offers logical views of metrics, hierarchies and calculations to express
concepts. Like the previous, BI also has mobile analysis through smartphones and tablets.
Enterprise reporting allows creation of strongly formatted templates, reports and documents. It’s
efficient and scalable reporting solutions for complex environments and support a number of
sources. It can also be deployed as a stand along product. Bi contains a real-time alert engine that
notifies stakeholders and trigger workflow events meaning representatives and managers receive
information and alerts at the right time. The openness of BI allows the use of desktop tools like
Microsoft office and combine it with Oracles Hyperion systems. Real-time interactive map views
are possible and show information such as highways, air routes and post addresses.
109
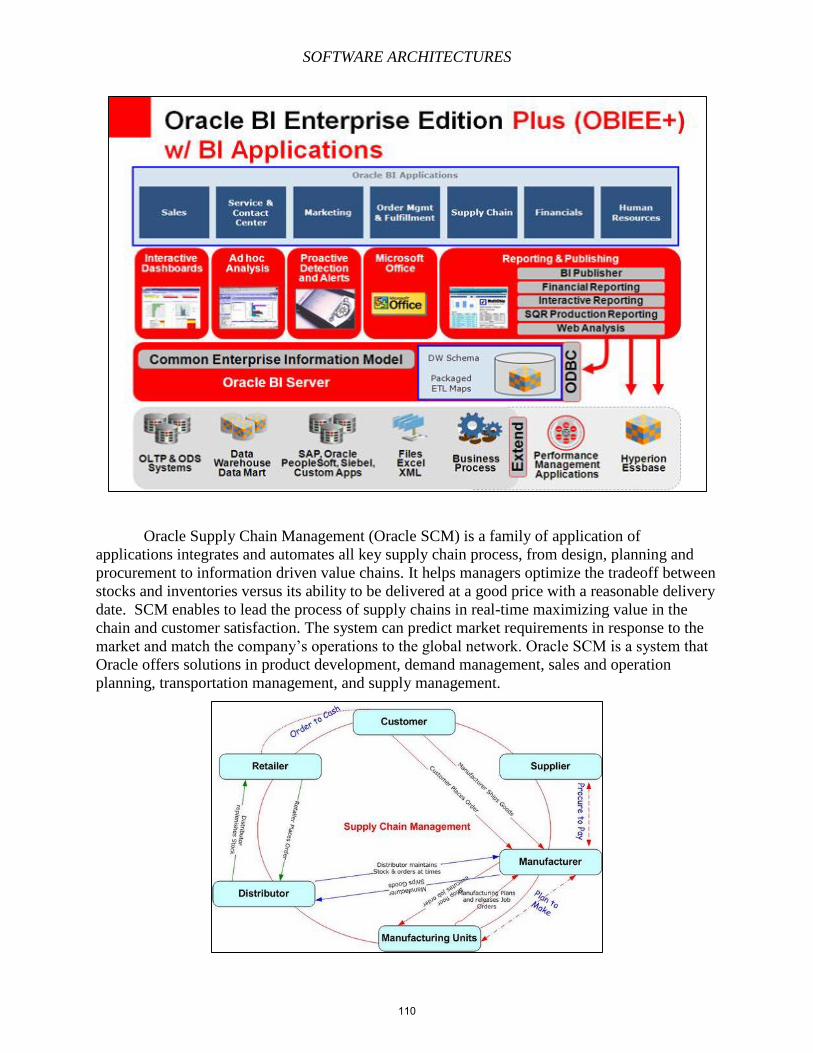
SOFTWARE ARCHITECTURES
Oracle Supply Chain Management (Oracle SCM) is a family of application of
applications integrates and automates all key supply chain process, from design, planning and
procurement to information driven value chains. It helps managers optimize the tradeoff between
stocks and inventories versus its ability to be delivered at a good price with a reasonable delivery
date. SCM enables to lead the process of supply chains in real-time maximizing value in the
chain and customer satisfaction. The system can predict market requirements in response to the
market and match the company’s operations to the global network. Oracle SCM is a system that
Oracle offers solutions in product development, demand management, sales and operation
planning, transportation management, and supply management.
110
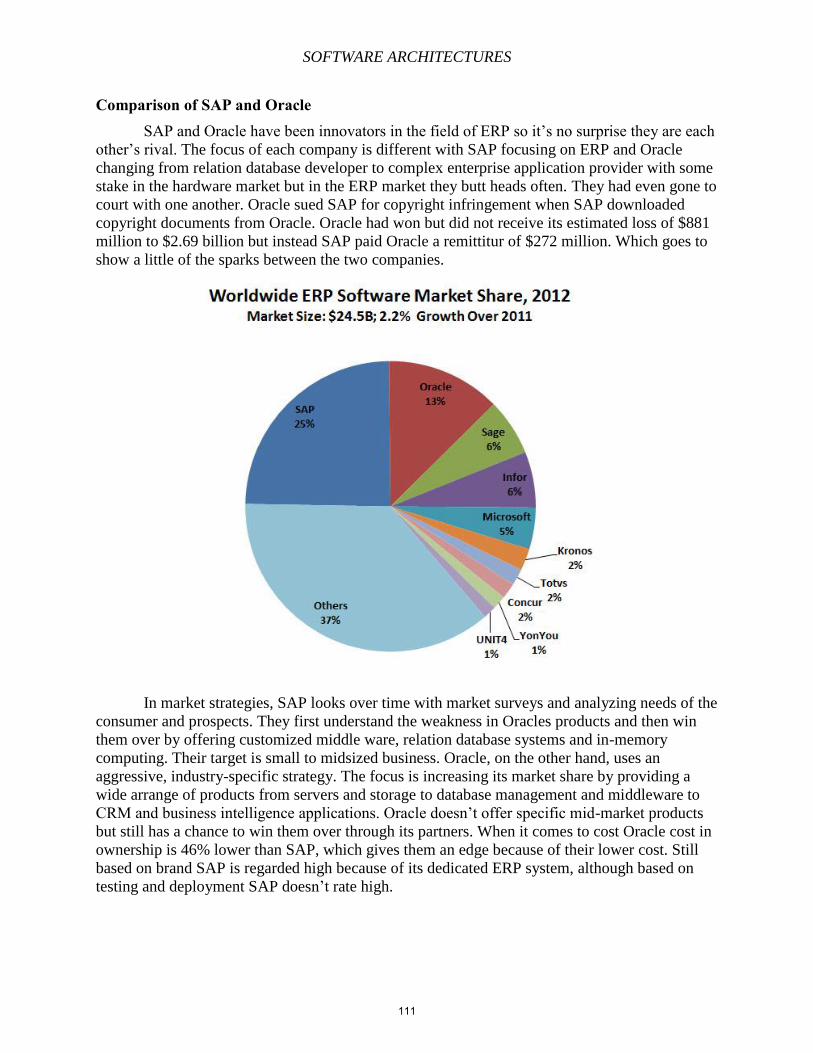
SOFTWARE ARCHITECTURES
Comparison of SAP and Oracle SAP and Oracle have been innovators in the field of ERP so it’s no surprise they are each
other’s rival. The focus of each company is different with SAP focusing on ERP and Oracle
changing from relation database developer to complex enterprise application provider with some
stake in the hardware market but in the ERP market they butt heads often. They had even gone to
court with one another. Oracle sued SAP for copyright infringement when SAP downloaded
copyright documents from Oracle. Oracle had won but did not receive its estimated loss of $881
million to $2.69 billion but instead SAP paid Oracle a remittitur of $272 million. Which goes to
show a little of the sparks between the two companies.
In market strategies, SAP looks over time with market surveys and analyzing needs of the
consumer and prospects. They first understand the weakness in Oracles products and then win
them over by offering customized middle ware, relation database systems and in-memory
computing. Their target is small to midsized business. Oracle, on the other hand, uses an
aggressive, industry-specific strategy. The focus is increasing its market share by providing a
wide arrange of products from servers and storage to database management and middleware to
CRM and business intelligence applications. Oracle doesn’t offer specific mid-market products
but still has a chance to win them over through its partners. When it comes to cost Oracle cost in
ownership is 46% lower than SAP, which gives them an edge because of their lower cost. Still
based on brand SAP is regarded high because of its dedicated ERP system, although based on
testing and deployment SAP doesn’t rate high.
111
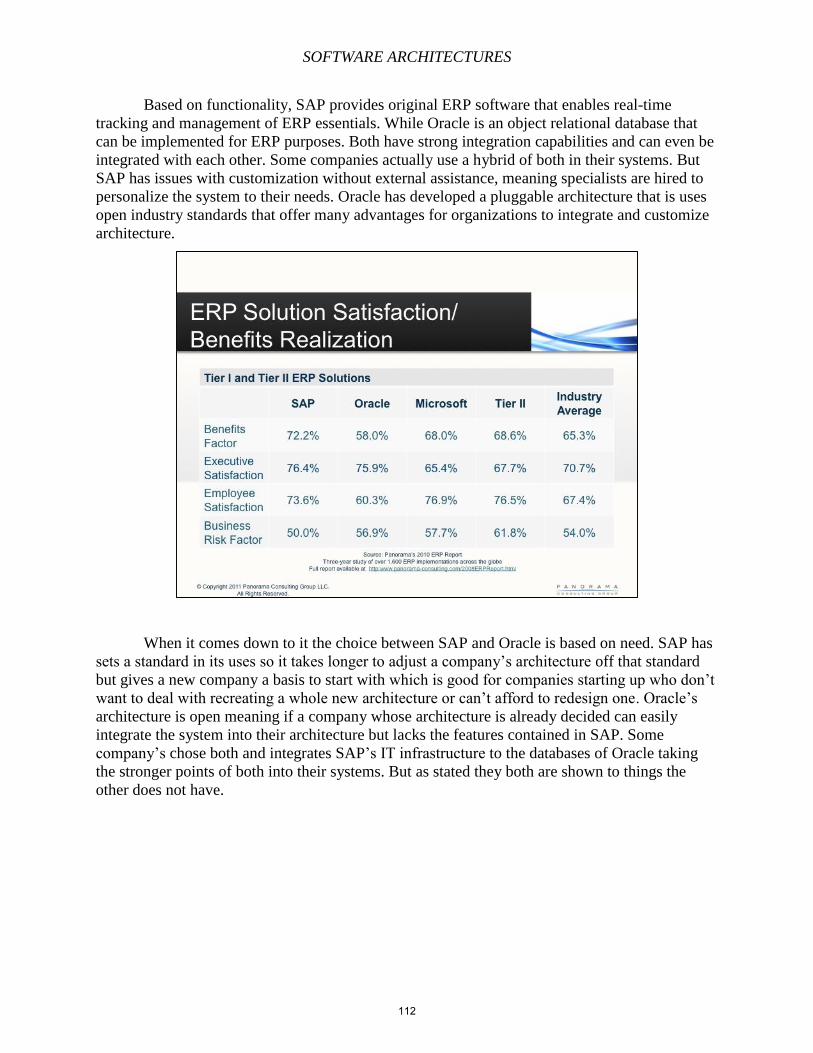
SOFTWARE ARCHITECTURES
Based on functionality, SAP provides original ERP software that enables real-time
tracking and management of ERP essentials. While Oracle is an object relational database that
can be implemented for ERP purposes. Both have strong integration capabilities and can even be
integrated with each other. Some companies actually use a hybrid of both in their systems. But
SAP has issues with customization without external assistance, meaning specialists are hired to
personalize the system to their needs. Oracle has developed a pluggable architecture that is uses
open industry standards that offer many advantages for organizations to integrate and customize
architecture.
When it comes down to it the choice between SAP and Oracle is based on need. SAP has
sets a standard in its uses so it takes longer to adjust a company’s architecture off that standard
but gives a new company a basis to start with which is good for companies starting up who don’t
want to deal with recreating a whole new architecture or can’t afford to redesign one. Oracle’s
architecture is open meaning if a company whose architecture is already decided can easily
integrate the system into their architecture but lacks the features contained in SAP. Some
company’s chose both and integrates SAP’s IT infrastructure to the databases of Oracle taking
the stronger points of both into their systems. But as stated they both are shown to things the
other does not have.
112
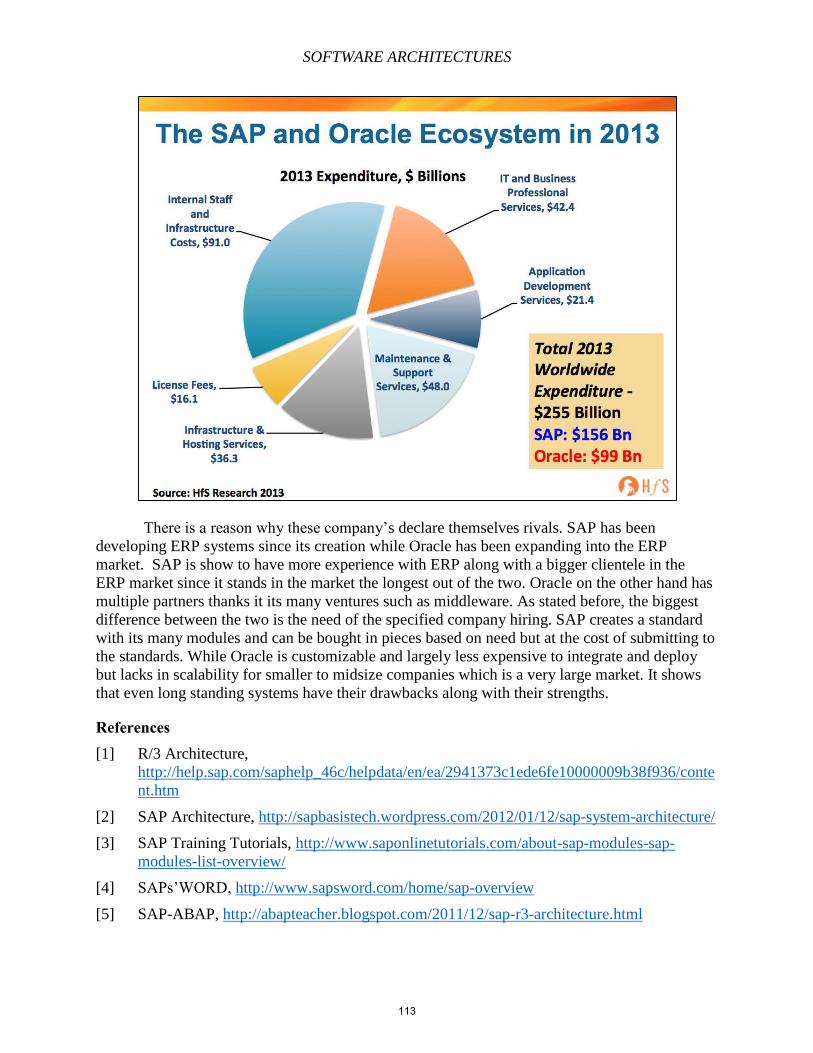
SOFTWARE ARCHITECTURES
There is a reason why these company’s declare themselves rivals. SAP has been
developing ERP systems since its creation while Oracle has been expanding into the ERP
market. SAP is show to have more experience with ERP along with a bigger clientele in the
ERP market since it stands in the market the longest out of the two. Oracle on the other hand has
multiple partners thanks it its many ventures such as middleware. As stated before, the biggest
difference between the two is the need of the specified company hiring. SAP creates a standard
with its many modules and can be bought in pieces based on need but at the cost of submitting to
the standards. While Oracle is customizable and largely less expensive to integrate and deploy
but lacks in scalability for smaller to midsize companies which is a very large market. It shows
that even long standing systems have their drawbacks along with their strengths.
References [1] R/3 Architecture,
http://help.sap.com/saphelp_46c/helpdata/en/ea/2941373c1ede6fe10000009b38f936/conte
nt.htm
[2] SAP Architecture, http://sapbasistech.wordpress.com/2012/01/12/sap-system-architecture/
[3] SAP Training Tutorials, http://www.saponlinetutorials.com/about-sap-modules-sap-
modules-list-overview/
[4] SAPs’WORD, http://www.sapsword.com/home/sap-overview
[5] SAP-ABAP, http://abapteacher.blogspot.com/2011/12/sap-r3-architecture.html
113
SOFTWARE ARCHITECTURES
[6] Ravi V. , Shreepriya Garg, “Upgrade Dilemma- SAP R/3 Enterprise or mySap ERP?”,
April, 2005, http://www.infosys.com/consulting/packaged-application-services/white-
papers/Documents/SAP-R3-Enterprise-mySAP-ERP.pdf
[7] Oracle Database Concepts,
http://docs.oracle.com/cd/B19306_01/server.102/b14220/intro.htm
[8] Software Advice, http://erp.softwareadvice.com/oracle-software-brand/
[9] Centriqs, http://www.centriqs.biz/smallbusiness/sap-vs-oracle.php
[10] Forbes, http://www.forbes.com/sites/louiscolumbus/2013/05/12/2013-erp-market-share-
update-sap-solidifies-market-leadership/
[11] Oracle, http://otndnld.oracle.co.jp/document/products/epm/111200/E-
17236/epm.1112/erpi_admin/frameset.htm?ch01s03.html
[12] Ares, http://www.ares.com.tw/en/products/oracle/
[13] OracleApps Epicenter, http://www.oracleappshub.com/ebs-
suite/technical/functional/supply-chain-management-scm-techno-functional-guide/
[14] Crmsearch, http://www.crmsearch.com/oracle-crm-customization.php
[15] Oracle, http://www.oracle.com/us/bi-enterprise-edition-plus-ds-078848.pdf
[16] Mythics, http://www.mythics.com/solutions/mythics-consulting1/epm-bi-and-data-
warehousing
[17] Panorama Consulting Solutions, http://panorama-consulting.com/oracle-ebs-vs-microsoft-
dynamics-why-the-discrepancy-in-erp-software-satisfaction/
[18] Oracle,
http://docs.oracle.com/cd/E11882_01/server.112/e10897/storage.htm#ADMQS006
[19] Wikipedia, http://en.wikipedia.org/wiki/Oracle_Corporation_v._SAP_AG
114
SOFTWARE ARCHITECTURES
Chapter 9 – Spatial and Temporal DBMS Extensions
Swetha Namburi
Introduction In our day-to-day life, maintaining an accurate database is very important. A database is a tool
which is used to store and keep record of information. The database can be anything right from
list of groceries to a telephone directory. For example, when you are travelling to a new place,
you might continuously want to know the closest gas station on your way or you need to be
reminded to buy drinks when you are close to a supermarket. So, in these two cases the data is
continuously changing as per location and time. This information requires a separate database
unlike relational database management system (DBMS) for it to be processed as the queries are
based on space and time which is called a spatio –temporal database.
Spatio-temporal database concepts
Before getting to know about the implementation of the spatio-temporal DB, let me first explain
about spatial and temporal databases because they are needed to create spatio-temporal database
systems.
Spatial Databases
Definition: Many applications in various fields require management of geometric,
geographic or spatial data (data related to space) such as model of the human brain, a
geographic space: surface of the earth, man-made space: layout of VLSI design, 3-D space
representation of the chains of protein molecules etc. A spatial database is a database system
(DBMS) that is optimized to store and query basic spatial objects. It stores the spatial
attributes, which have properties related to space. A relational database manages different
types of numeric and character data but not objects such as points, lines and polygons. To
manage this kind of data and also complex structures such as linear networks, 3D objects,
Triangulated irregular networks and linear networks, spatial databases are used. For a typical
database, additional features have to be added for the efficient processing of spatial data
types.
Modeling: Let us assume a 2 dimensional Geographic Information System application; two
basic things need to be represented. They are:
Objects in space – rivers, cities or roads etc. different entities that are arranged in space
and each of them has its geometric description. This comes under modeling single
objects.
Space – to describe the total space that is saying something about every point in space.
This is an example of modeling spatially related collection of objects.
Fundamental data types – These can be used for modeling single objects.
Point: a moving vehicle, a University
Line: a road segment, road network
Region: a count, voting area
115
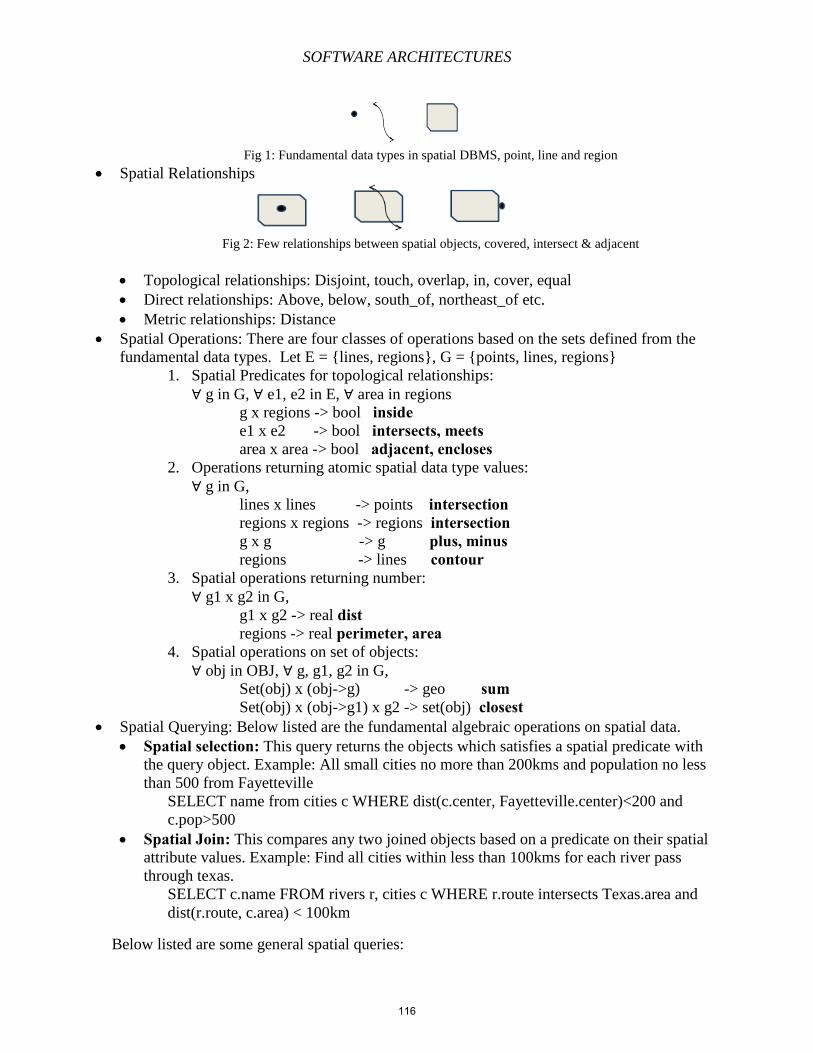
SOFTWARE ARCHITECTURES
Fig 1: Fundamental data types in spatial DBMS, point, line and region
Spatial Relationships
Fig 2: Few relationships between spatial objects, covered, intersect & adjacent
Topological relationships: Disjoint, touch, overlap, in, cover, equal
Direct relationships: Above, below, south_of, northeast_of etc.
Metric relationships: Distance
Spatial Operations: There are four classes of operations based on the sets defined from the
fundamental data types. Let E = {lines, regions}, G = {points, lines, regions}
1. Spatial Predicates for topological relationships:
∀ g in G, ∀ e1, e2 in E, ∀ area in regions
g x regions -> bool inside
e1 x e2 -> bool intersects, meets
area x area -> bool adjacent, encloses
2. Operations returning atomic spatial data type values:
∀ g in G,
lines x lines -> points intersection
regions x regions -> regions intersection
g x g -> g plus, minus
regions -> lines contour
3. Spatial operations returning number:
∀ g1 x g2 in G,
g1 x g2 -> real dist regions -> real perimeter, area
4. Spatial operations on set of objects:
∀ obj in OBJ, ∀ g, g1, g2 in G,
Set(obj) x (obj->g) -> geo sum Set(obj) x (obj->g1) x g2 -> set(obj) closest
Spatial Querying: Below listed are the fundamental algebraic operations on spatial data. Spatial selection: This query returns the objects which satisfies a spatial predicate with
the query object. Example: All small cities no more than 200kms and population no less
than 500 from Fayetteville SELECT name from cities c WHERE dist(c.center, Fayetteville.center)<200 and
c.pop>500
Spatial Join: This compares any two joined objects based on a predicate on their spatial
attribute values. Example: Find all cities within less than 100kms for each river pass
through texas.
SELECT c.name FROM rivers r, cities c WHERE r.route intersects Texas.area and
dist(r.route, c.area) < 100km
Below listed are some general spatial queries:
116
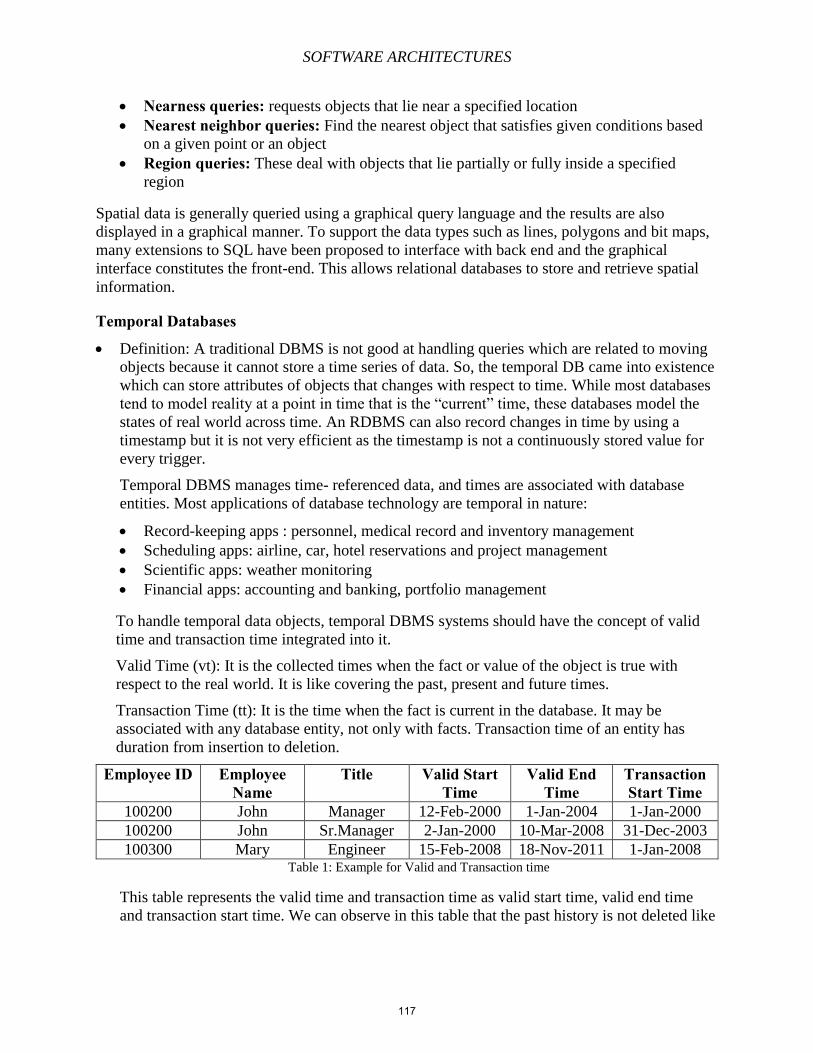
SOFTWARE ARCHITECTURES
Nearness queries: requests objects that lie near a specified location
Nearest neighbor queries: Find the nearest object that satisfies given conditions based
on a given point or an object Region queries: These deal with objects that lie partially or fully inside a specified
region
Spatial data is generally queried using a graphical query language and the results are also
displayed in a graphical manner. To support the data types such as lines, polygons and bit maps,
many extensions to SQL have been proposed to interface with back end and the graphical
interface constitutes the front-end. This allows relational databases to store and retrieve spatial
information.
Temporal Databases
Definition: A traditional DBMS is not good at handling queries which are related to moving
objects because it cannot store a time series of data. So, the temporal DB came into existence
which can store attributes of objects that changes with respect to time. While most databases
tend to model reality at a point in time that is the “current” time, these databases model the
states of real world across time. An RDBMS can also record changes in time by using a
timestamp but it is not very efficient as the timestamp is not a continuously stored value for
every trigger.
Temporal DBMS manages time- referenced data, and times are associated with database
entities. Most applications of database technology are temporal in nature:
Record-keeping apps : personnel, medical record and inventory management
Scheduling apps: airline, car, hotel reservations and project management
Scientific apps: weather monitoring
Financial apps: accounting and banking, portfolio management
To handle temporal data objects, temporal DBMS systems should have the concept of valid
time and transaction time integrated into it.
Valid Time (vt): It is the collected times when the fact or value of the object is true with
respect to the real world. It is like covering the past, present and future times.
Transaction Time (tt): It is the time when the fact is current in the database. It may be
associated with any database entity, not only with facts. Transaction time of an entity has
duration from insertion to deletion.
Employee ID Employee Name
Title Valid Start Time
Valid End Time
Transaction Start Time
100200 John Manager 12-Feb-2000 1-Jan-2004 1-Jan-2000
100200 John Sr.Manager 2-Jan-2000 10-Mar-2008 31-Dec-2003
100300 Mary Engineer 15-Feb-2008 18-Nov-2011 1-Jan-2008 Table 1: Example for Valid and Transaction time
This table represents the valid time and transaction time as valid start time, valid end time
and transaction start time. We can observe in this table that the past history is not deleted like
117
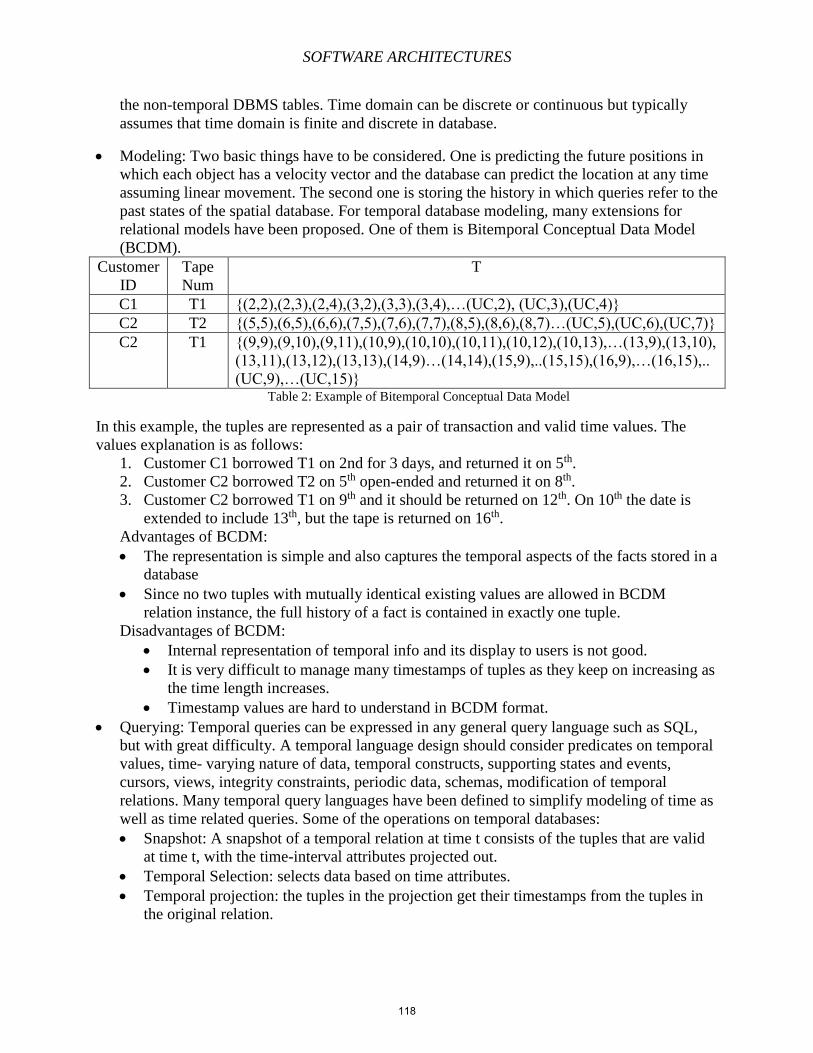
SOFTWARE ARCHITECTURES
the non-temporal DBMS tables. Time domain can be discrete or continuous but typically
assumes that time domain is finite and discrete in database.
Modeling: Two basic things have to be considered. One is predicting the future positions in
which each object has a velocity vector and the database can predict the location at any time
assuming linear movement. The second one is storing the history in which queries refer to the
past states of the spatial database. For temporal database modeling, many extensions for
relational models have been proposed. One of them is Bitemporal Conceptual Data Model
(BCDM).
Customer
ID
Tape
Num
T
C1 T1 {(2,2),(2,3),(2,4),(3,2),(3,3),(3,4),…(UC,2), (UC,3),(UC,4)}
C2 T2 {(5,5),(6,5),(6,6),(7,5),(7,6),(7,7),(8,5),(8,6),(8,7)…(UC,5),(UC,6),(UC,7)}
C2 T1 {(9,9),(9,10),(9,11),(10,9),(10,10),(10,11),(10,12),(10,13),…(13,9),(13,10),
(13,11),(13,12),(13,13),(14,9)…(14,14),(15,9),..(15,15),(16,9),…(16,15),..
(UC,9),…(UC,15)} Table 2: Example of Bitemporal Conceptual Data Model
In this example, the tuples are represented as a pair of transaction and valid time values. The
values explanation is as follows:
1. Customer C1 borrowed T1 on 2nd for 3 days, and returned it on 5th.
2. Customer C2 borrowed T2 on 5th open-ended and returned it on 8th.
3. Customer C2 borrowed T1 on 9th and it should be returned on 12th. On 10th the date is
extended to include 13th, but the tape is returned on 16th.
Advantages of BCDM:
The representation is simple and also captures the temporal aspects of the facts stored in a
database
Since no two tuples with mutually identical existing values are allowed in BCDM
relation instance, the full history of a fact is contained in exactly one tuple.
Disadvantages of BCDM:
Internal representation of temporal info and its display to users is not good.
It is very difficult to manage many timestamps of tuples as they keep on increasing as
the time length increases.
Timestamp values are hard to understand in BCDM format.
Querying: Temporal queries can be expressed in any general query language such as SQL,
but with great difficulty. A temporal language design should consider predicates on temporal
values, time- varying nature of data, temporal constructs, supporting states and events,
cursors, views, integrity constraints, periodic data, schemas, modification of temporal
relations. Many temporal query languages have been defined to simplify modeling of time as
well as time related queries. Some of the operations on temporal databases:
Snapshot: A snapshot of a temporal relation at time t consists of the tuples that are valid
at time t, with the time-interval attributes projected out.
Temporal Selection: selects data based on time attributes.
Temporal projection: the tuples in the projection get their timestamps from the tuples in
the original relation.
118
SOFTWARE ARCHITECTURES
Temporal Join: the time-interval of a tuple in the result is the intersection of the time-
intervals of the tuples from which it is derived.
Example: Find where and when will it snow given Clouds(X, Y, Time, humidity) and
Region(X, Y, Time, temperature)
(SELECT x, y, time FROM Cloud WHERE humidity>=80) INTERSECT (SELECT x, y,
time FROM Region WHERE temperature <= 32)
Spatio-Temporal Databases
Definition: Spatio-temporal databases can be defined as a database that embodies spatial,
temporal and spatio-temporal database concepts and captures both spatial and temporal
aspects of data as per Wikipedia.
Applications: There are three types of Spatio-temporal applications.
Involving objects with continuous motion: navigational systems manage moving objects,
objects change position, but not shape
Dealing with discrete changes of and among objects: objects shape and their positions may
change discretely in time
Managing objects integrating continuous motion as well as changes of shape: A “storm” is
modeled as a “moving” object with changing properties and shape over time.
Spatio-Temporal Semantics: To explain about database model, we need to know some
semantics.
Spatio-temporal attribute: An attribute that contains the evolution of a spatial object in time
that is spatial attribute and time attribute.
Spatio-temporal object: An object that contains a ST attribute
Spatio-temporal evolution: the evolution of an object in time
Examples: land parcels are evaluated when a weekday is finished and this kind of evolution
is called a discrete point based that is the shape of a land parcel is changing in time, but only
in discrete steps.
Spatio-Temporal Database Models: A data model gives a detailed understanding of the
system for which the design is created. They can ease communication among the main
programmer, designer and the ultimate customer. The main aspect of spatio-temporal
Information systems is the spatio-temporal Data models. These models describe the data
types, relationships, operations and rules to maintain database integrity for the entities of
spatio-temporal databases. They also must provide adequate support for spatio-temporal
queries and analytical methods to be implemented in the spatio-temporal Information
Systems.
119
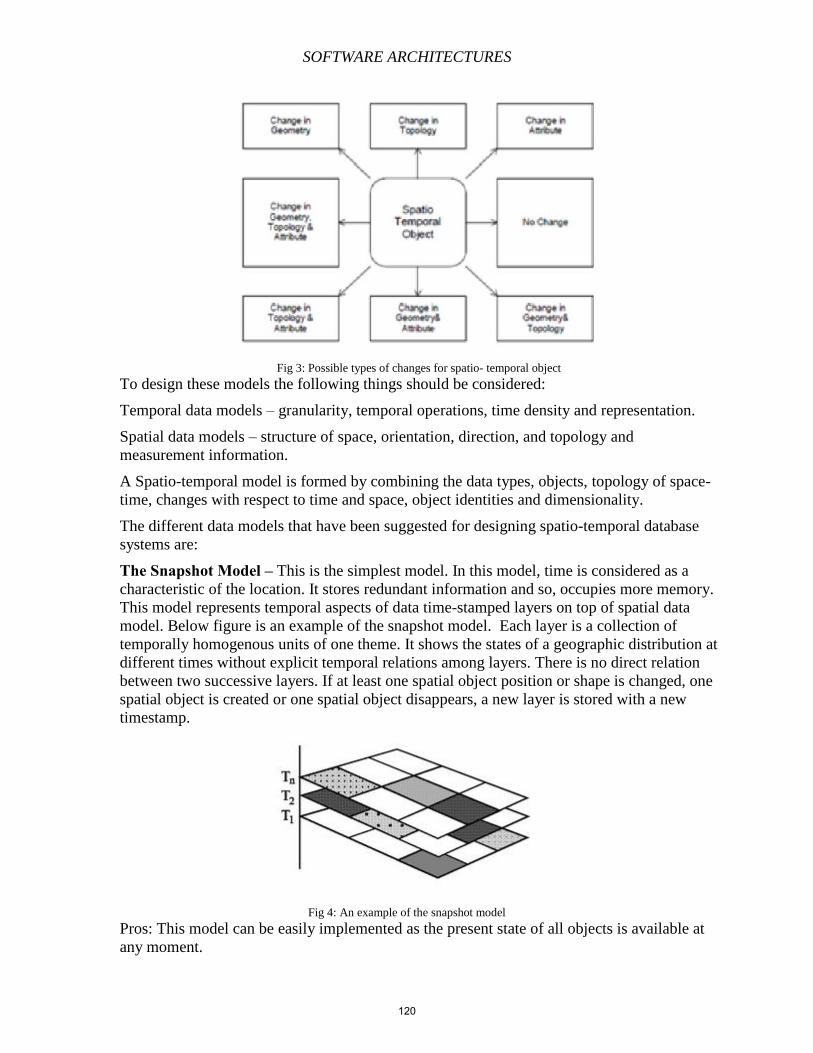
SOFTWARE ARCHITECTURES
Fig 3: Possible types of changes for spatio- temporal object
To design these models the following things should be considered:
Temporal data models – granularity, temporal operations, time density and representation.
Spatial data models – structure of space, orientation, direction, and topology and
measurement information.
A Spatio-temporal model is formed by combining the data types, objects, topology of space-
time, changes with respect to time and space, object identities and dimensionality.
The different data models that have been suggested for designing spatio-temporal database
systems are:
The Snapshot Model – This is the simplest model. In this model, time is considered as a
characteristic of the location. It stores redundant information and so, occupies more memory.
This model represents temporal aspects of data time-stamped layers on top of spatial data
model. Below figure is an example of the snapshot model. Each layer is a collection of
temporally homogenous units of one theme. It shows the states of a geographic distribution at
different times without explicit temporal relations among layers. There is no direct relation
between two successive layers. If at least one spatial object position or shape is changed, one
spatial object is created or one spatial object disappears, a new layer is stored with a new
timestamp.
Fig 4: An example of the snapshot model
Pros: This model can be easily implemented as the present state of all objects is available at
any moment.
120
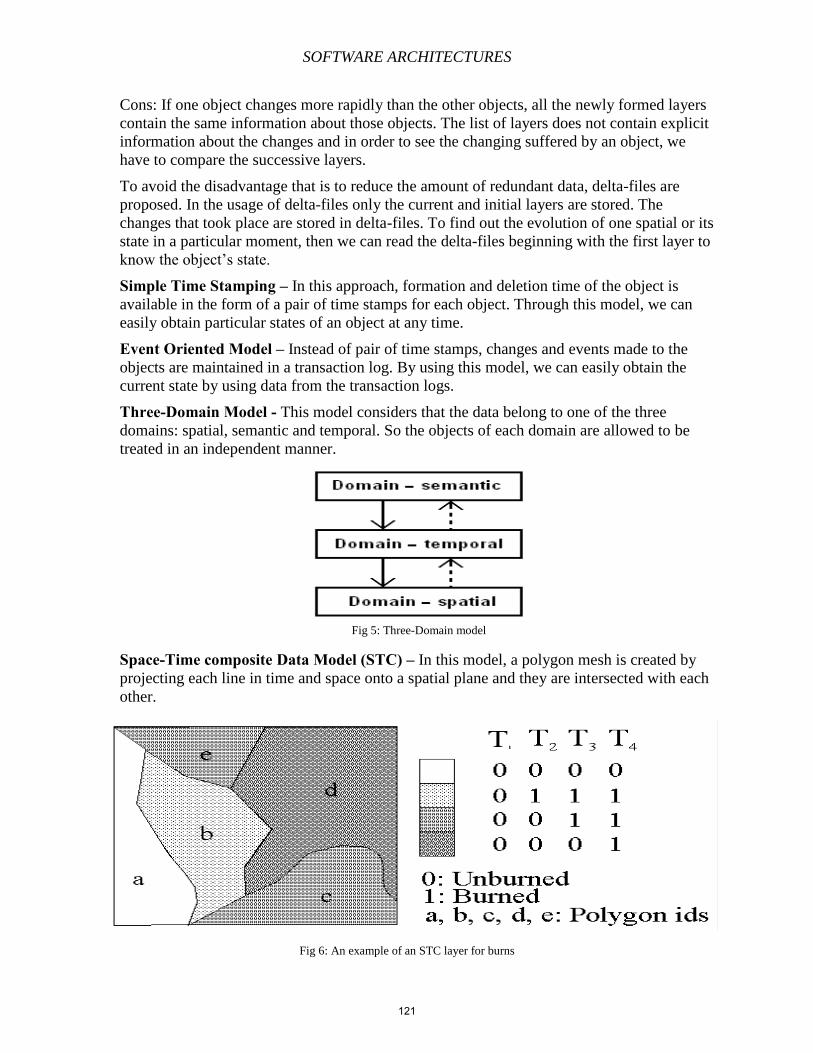
SOFTWARE ARCHITECTURES
Cons: If one object changes more rapidly than the other objects, all the newly formed layers
contain the same information about those objects. The list of layers does not contain explicit
information about the changes and in order to see the changing suffered by an object, we
have to compare the successive layers.
To avoid the disadvantage that is to reduce the amount of redundant data, delta-files are
proposed. In the usage of delta-files only the current and initial layers are stored. The
changes that took place are stored in delta-files. To find out the evolution of one spatial or its
state in a particular moment, then we can read the delta-files beginning with the first layer to
know the object’s state.
Simple Time Stamping – In this approach, formation and deletion time of the object is
available in the form of a pair of time stamps for each object. Through this model, we can
easily obtain particular states of an object at any time.
Event Oriented Model – Instead of pair of time stamps, changes and events made to the
objects are maintained in a transaction log. By using this model, we can easily obtain the
current state by using data from the transaction logs.
Three-Domain Model - This model considers that the data belong to one of the three
domains: spatial, semantic and temporal. So the objects of each domain are allowed to be
treated in an independent manner.
Fig 5: Three-Domain model
Space-Time composite Data Model (STC) – In this model, a polygon mesh is created by
projecting each line in time and space onto a spatial plane and they are intersected with each
other.
Fig 6: An example of an STC layer for burns
121
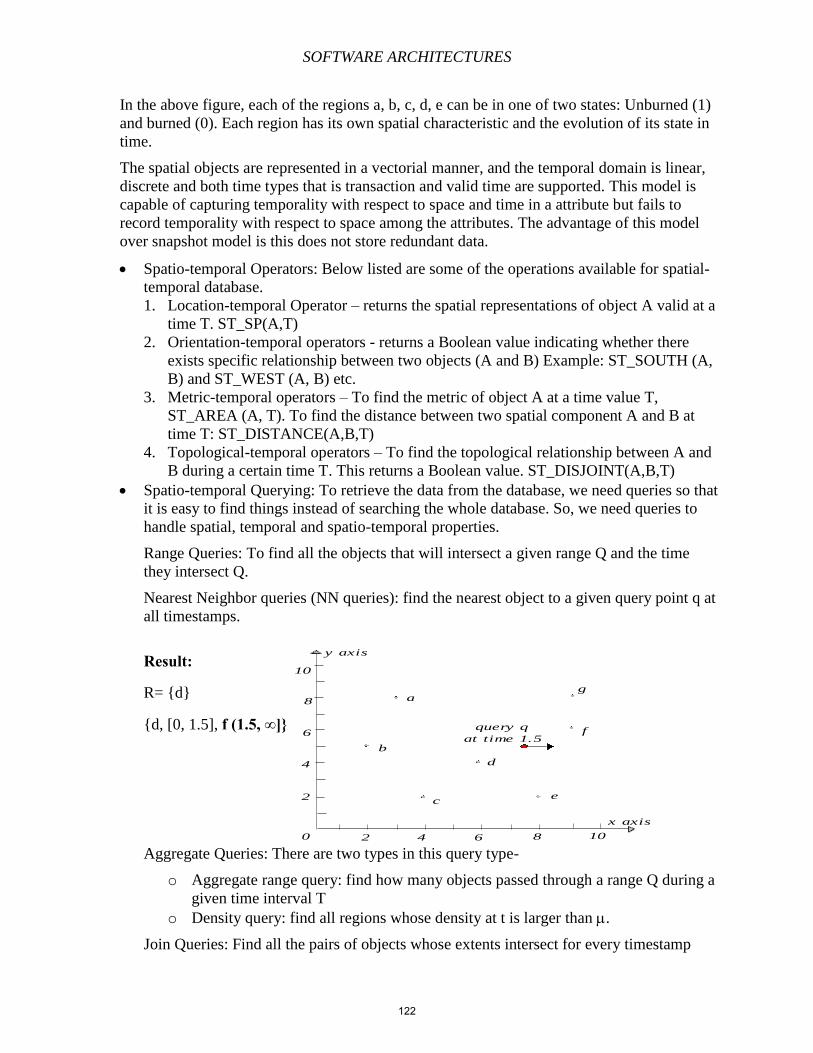
SOFTWARE ARCHITECTURES
In the above figure, each of the regions a, b, c, d, e can be in one of two states: Unburned (1)
and burned (0). Each region has its own spatial characteristic and the evolution of its state in
time.
The spatial objects are represented in a vectorial manner, and the temporal domain is linear,
discrete and both time types that is transaction and valid time are supported. This model is
capable of capturing temporality with respect to space and time in a attribute but fails to
record temporality with respect to space among the attributes. The advantage of this model
over snapshot model is this does not store redundant data.
Spatio-temporal Operators: Below listed are some of the operations available for spatial-
temporal database.
1. Location-temporal Operator – returns the spatial representations of object A valid at a
time T. ST_SP(A,T)
2. Orientation-temporal operators - returns a Boolean value indicating whether there
exists specific relationship between two objects (A and B) Example: ST_SOUTH (A,
B) and ST_WEST (A, B) etc.
3. Metric-temporal operators – To find the metric of object A at a time value T,
ST_AREA (A, T). To find the distance between two spatial component A and B at
time T: ST_DISTANCE(A,B,T)
4. Topological-temporal operators – To find the topological relationship between A and
B during a certain time T. This returns a Boolean value. ST_DISJOINT(A,B,T)
Spatio-temporal Querying: To retrieve the data from the database, we need queries so that
it is easy to find things instead of searching the whole database. So, we need queries to
handle spatial, temporal and spatio-temporal properties.
Range Queries: To find all the objects that will intersect a given range Q and the time
they intersect Q.
Nearest Neighbor queries (NN queries): find the nearest object to a given query point q at
all timestamps.
Result:
R= {d}
{d, [0, 1.5], f (1.5, ∞]}
Aggregate Queries: There are two types in this query type-
o Aggregate range query: find how many objects passed through a range Q during a
given time interval T
o Density query: find all regions whose density at t is larger than .
Join Queries: Find all the pairs of objects whose extents intersect for every timestamp
20 4 6 8 10
2
4
6
8
10
x axis
y axis
a
b
ec
d
query q fat time 1.5
g
122
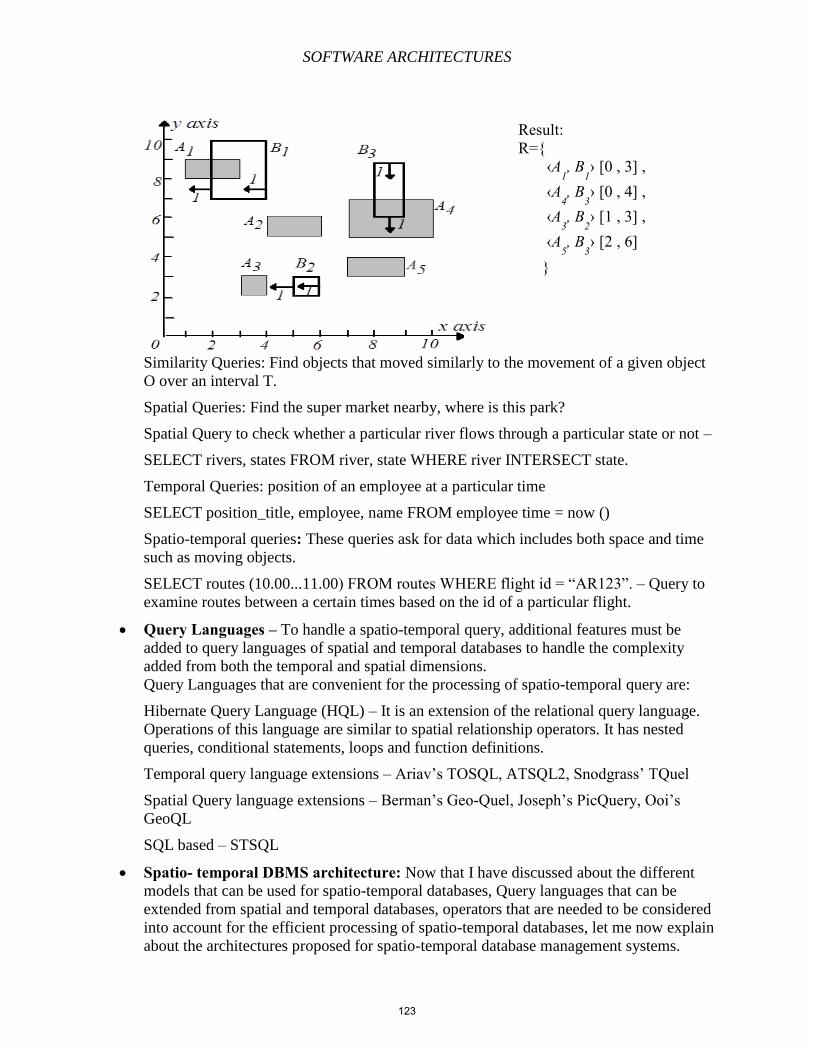
SOFTWARE ARCHITECTURES
Similarity Queries: Find objects that moved similarly to the movement of a given object
O over an interval T.
Spatial Queries: Find the super market nearby, where is this park?
Spatial Query to check whether a particular river flows through a particular state or not –
SELECT rivers, states FROM river, state WHERE river INTERSECT state.
Temporal Queries: position of an employee at a particular time
SELECT position_title, employee, name FROM employee time = now ()
Spatio-temporal queries: These queries ask for data which includes both space and time
such as moving objects.
SELECT routes (10.00...11.00) FROM routes WHERE flight id = “AR123”. – Query to
examine routes between a certain times based on the id of a particular flight.
Query Languages – To handle a spatio-temporal query, additional features must be
added to query languages of spatial and temporal databases to handle the complexity
added from both the temporal and spatial dimensions. Query Languages that are convenient for the processing of spatio-temporal query are: Hibernate Query Language (HQL) – It is an extension of the relational query language.
Operations of this language are similar to spatial relationship operators. It has nested
queries, conditional statements, loops and function definitions.
Temporal query language extensions – Ariav’s TOSQL, ATSQL2, Snodgrass’ TQuel
Spatial Query language extensions – Berman’s Geo-Quel, Joseph’s PicQuery, Ooi’s
GeoQL
SQL based – STSQL
Spatio- temporal DBMS architecture: Now that I have discussed about the different
models that can be used for spatio-temporal databases, Query languages that can be
extended from spatial and temporal databases, operators that are needed to be considered
into account for the efficient processing of spatio-temporal databases, let me now explain
about the architectures proposed for spatio-temporal database management systems.
Result:
R={
‹A1, B
1› [0 , 3] ,
‹A4, B
3› [0 , 4] ,
‹A3, B
2› [1 , 3] ,
‹A5, B
3› [2 , 6]
}
123
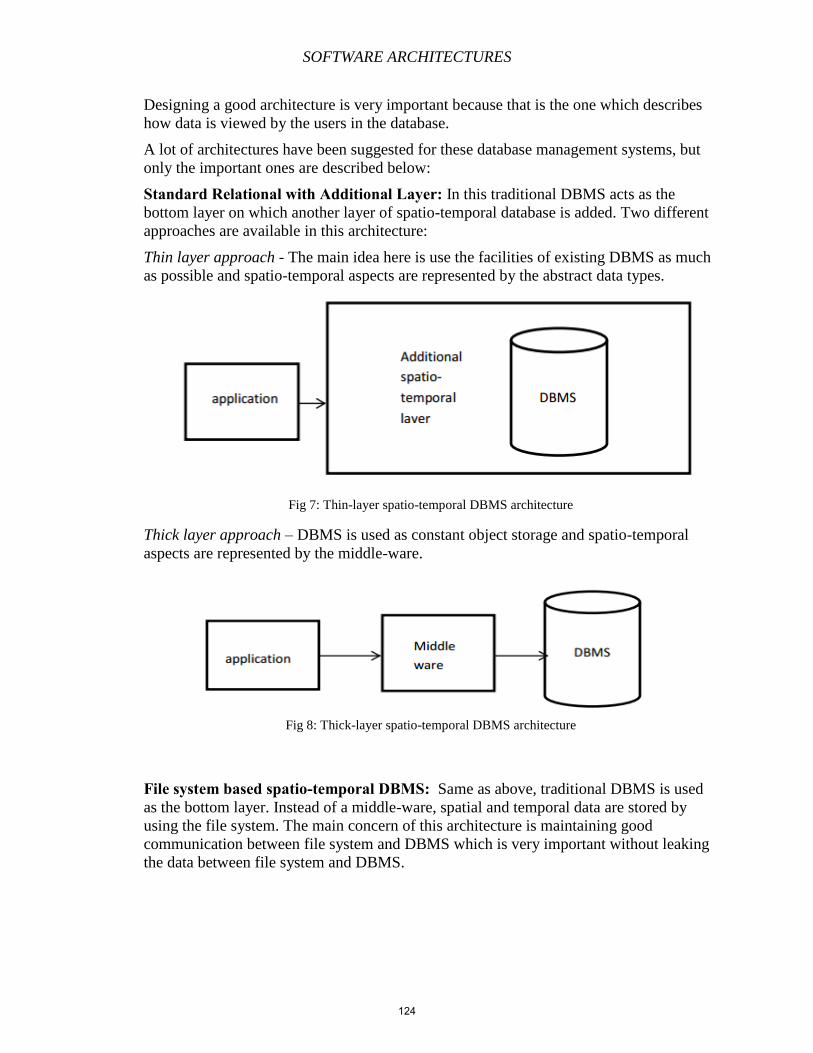
SOFTWARE ARCHITECTURES
Designing a good architecture is very important because that is the one which describes
how data is viewed by the users in the database.
A lot of architectures have been suggested for these database management systems, but
only the important ones are described below:
Standard Relational with Additional Layer: In this traditional DBMS acts as the
bottom layer on which another layer of spatio-temporal database is added. Two different
approaches are available in this architecture:
Thin layer approach - The main idea here is use the facilities of existing DBMS as much
as possible and spatio-temporal aspects are represented by the abstract data types.
Fig 7: Thin-layer spatio-temporal DBMS architecture
Thick layer approach – DBMS is used as constant object storage and spatio-temporal
aspects are represented by the middle-ware.
Fig 8: Thick-layer spatio-temporal DBMS architecture
File system based spatio-temporal DBMS: Same as above, traditional DBMS is used
as the bottom layer. Instead of a middle-ware, spatial and temporal data are stored by
using the file system. The main concern of this architecture is maintaining good
communication between file system and DBMS which is very important without leaking
the data between file system and DBMS.
124
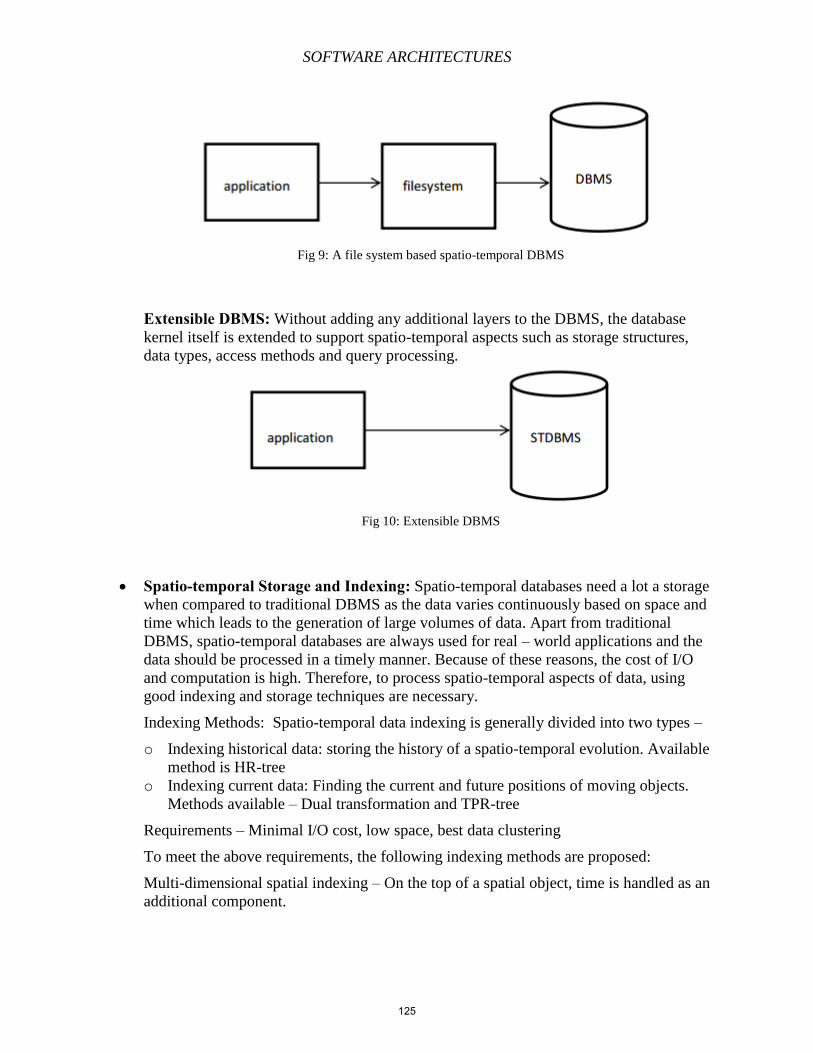
SOFTWARE ARCHITECTURES
Fig 9: A file system based spatio-temporal DBMS
Extensible DBMS: Without adding any additional layers to the DBMS, the database
kernel itself is extended to support spatio-temporal aspects such as storage structures,
data types, access methods and query processing.
Fig 10: Extensible DBMS
Spatio-temporal Storage and Indexing: Spatio-temporal databases need a lot a storage
when compared to traditional DBMS as the data varies continuously based on space and
time which leads to the generation of large volumes of data. Apart from traditional
DBMS, spatio-temporal databases are always used for real – world applications and the
data should be processed in a timely manner. Because of these reasons, the cost of I/O
and computation is high. Therefore, to process spatio-temporal aspects of data, using
good indexing and storage techniques are necessary. Indexing Methods: Spatio-temporal data indexing is generally divided into two types –
o Indexing historical data: storing the history of a spatio-temporal evolution. Available
method is HR-tree
o Indexing current data: Finding the current and future positions of moving objects.
Methods available – Dual transformation and TPR-tree
Requirements – Minimal I/O cost, low space, best data clustering
To meet the above requirements, the following indexing methods are proposed:
Multi-dimensional spatial indexing – On the top of a spatial object, time is handled as an
additional component.
125
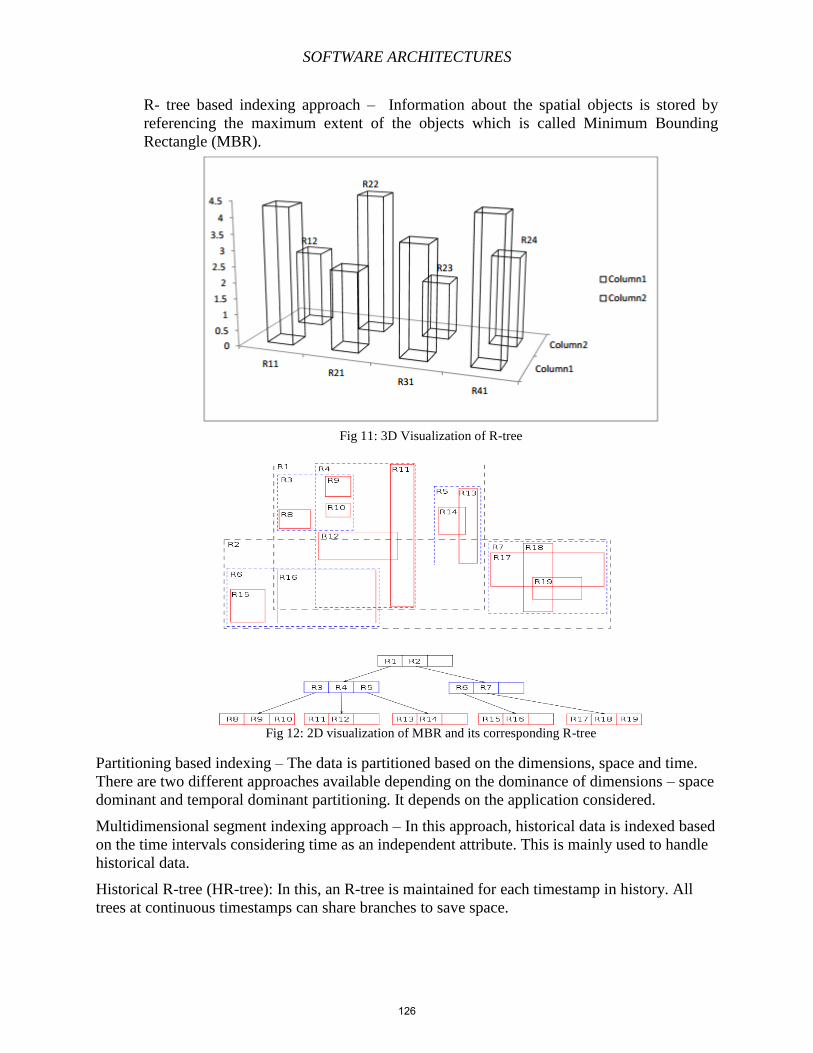
SOFTWARE ARCHITECTURES
R- tree based indexing approach – Information about the spatial objects is stored by
referencing the maximum extent of the objects which is called Minimum Bounding
Rectangle (MBR).
Fig 11: 3D Visualization of R-tree
Fig 12: 2D visualization of MBR and its corresponding R-tree
Partitioning based indexing – The data is partitioned based on the dimensions, space and time.
There are two different approaches available depending on the dominance of dimensions – space
dominant and temporal dominant partitioning. It depends on the application considered.
Multidimensional segment indexing approach – In this approach, historical data is indexed based
on the time intervals considering time as an independent attribute. This is mainly used to handle
historical data.
Historical R-tree (HR-tree): In this, an R-tree is maintained for each timestamp in history. All
trees at continuous timestamps can share branches to save space.
126
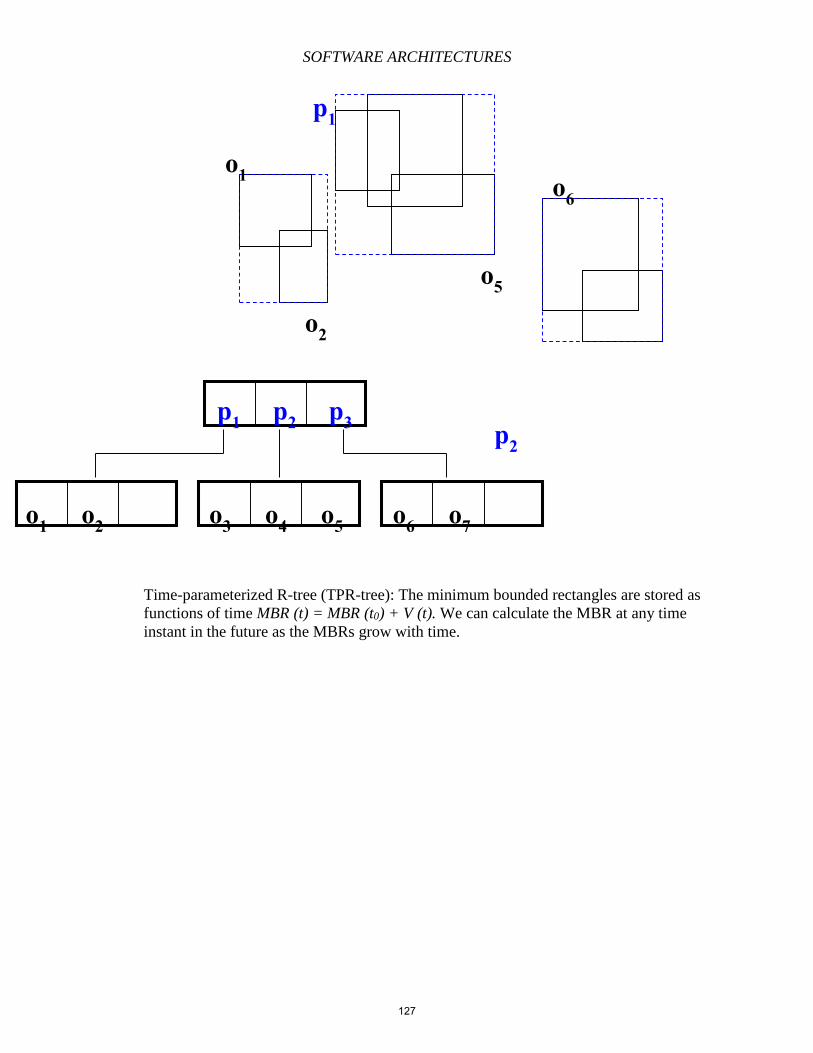
SOFTWARE ARCHITECTURES
Time-parameterized R-tree (TPR-tree): The minimum bounded rectangles are stored as
functions of time MBR (t) = MBR (t0) + V (t). We can calculate the MBR at any time
instant in the future as the MBRs grow with time.
o1
o2
o6
o5
p1 p2 p3
o1 o2 o3 o4 o5 o6 o7
p1
p2
127
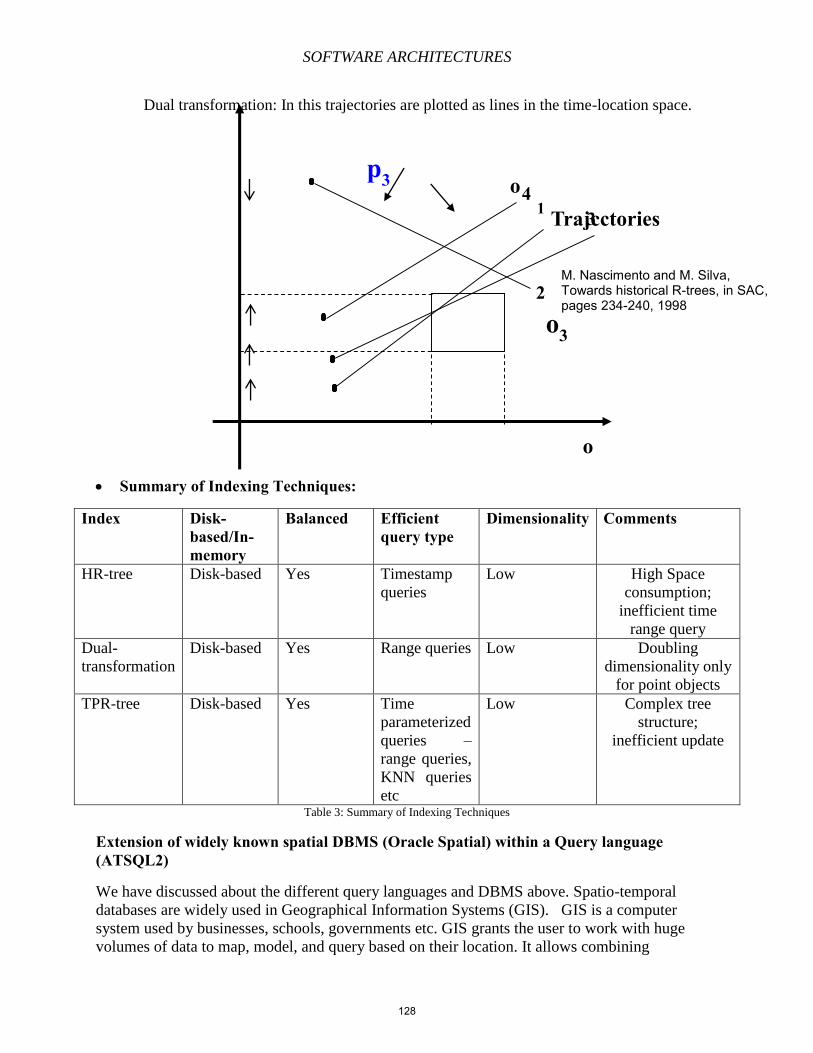
SOFTWARE ARCHITECTURES
Dual transformation: In this trajectories are plotted as lines in the time-location space.
Summary of Indexing Techniques:
Index Disk-based/In-memory
Balanced Efficient query type
Dimensionality Comments
HR-tree Disk-based Yes Timestamp
queries
Low High Space
consumption;
inefficient time
range query
Dual-
transformation
Disk-based Yes Range queries Low Doubling
dimensionality only
for point objects
TPR-tree Disk-based Yes Time
parameterized
queries –
range queries,
KNN queries
etc
Low Complex tree
structure;
inefficient update
Table 3: Summary of Indexing Techniques
Extension of widely known spatial DBMS (Oracle Spatial) within a Query language (ATSQL2)
We have discussed about the different query languages and DBMS above. Spatio-temporal
databases are widely used in Geographical Information Systems (GIS). GIS is a computer
system used by businesses, schools, governments etc. GIS grants the user to work with huge
volumes of data to map, model, and query based on their location. It allows combining
o
o
1
2
3
4
Trajcctories
M. Nascimento and M. Silva, Towards historical R-trees, in SAC, pages 234-240, 1998
o3
p3
128
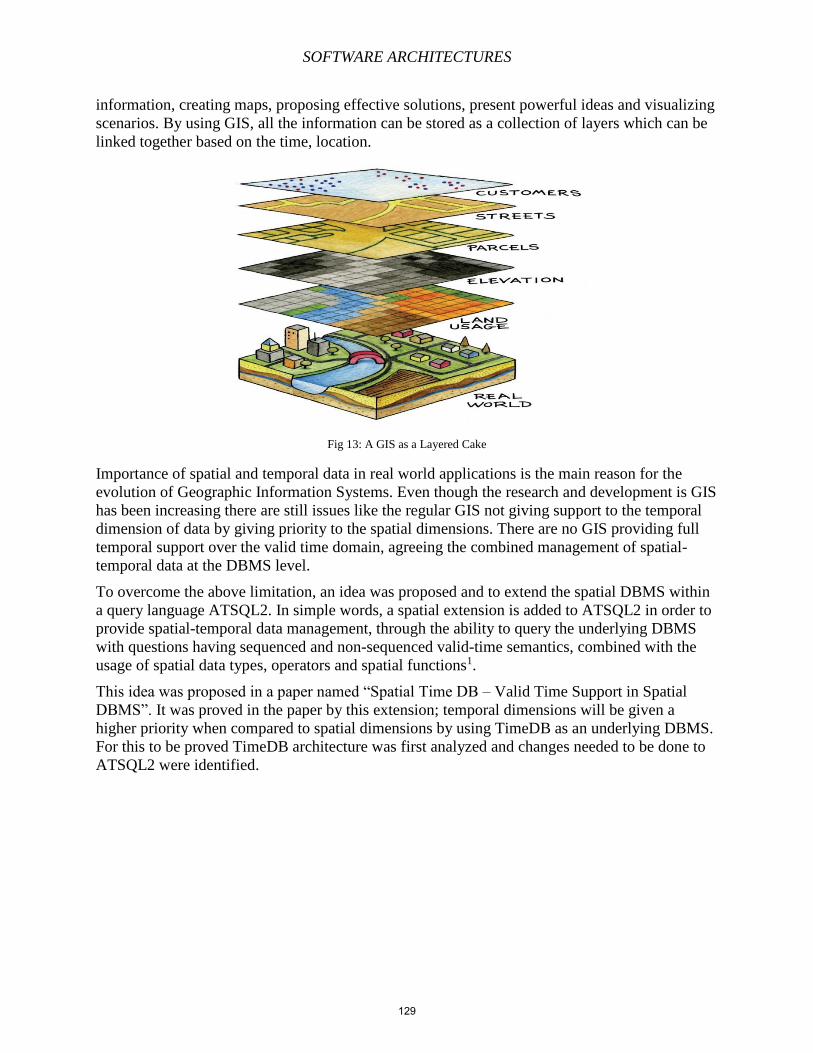
SOFTWARE ARCHITECTURES
information, creating maps, proposing effective solutions, present powerful ideas and visualizing
scenarios. By using GIS, all the information can be stored as a collection of layers which can be
linked together based on the time, location.
Fig 13: A GIS as a Layered Cake
Importance of spatial and temporal data in real world applications is the main reason for the
evolution of Geographic Information Systems. Even though the research and development is GIS
has been increasing there are still issues like the regular GIS not giving support to the temporal
dimension of data by giving priority to the spatial dimensions. There are no GIS providing full
temporal support over the valid time domain, agreeing the combined management of spatial-
temporal data at the DBMS level.
To overcome the above limitation, an idea was proposed and to extend the spatial DBMS within
a query language ATSQL2. In simple words, a spatial extension is added to ATSQL2 in order to
provide spatial-temporal data management, through the ability to query the underlying DBMS
with questions having sequenced and non-sequenced valid-time semantics, combined with the
usage of spatial data types, operators and spatial functions1.
This idea was proposed in a paper named “Spatial Time DB – Valid Time Support in Spatial
DBMS”. It was proved in the paper by this extension; temporal dimensions will be given a
higher priority when compared to spatial dimensions by using TimeDB as an underlying DBMS.
For this to be proved TimeDB architecture was first analyzed and changes needed to be done to
ATSQL2 were identified.
129
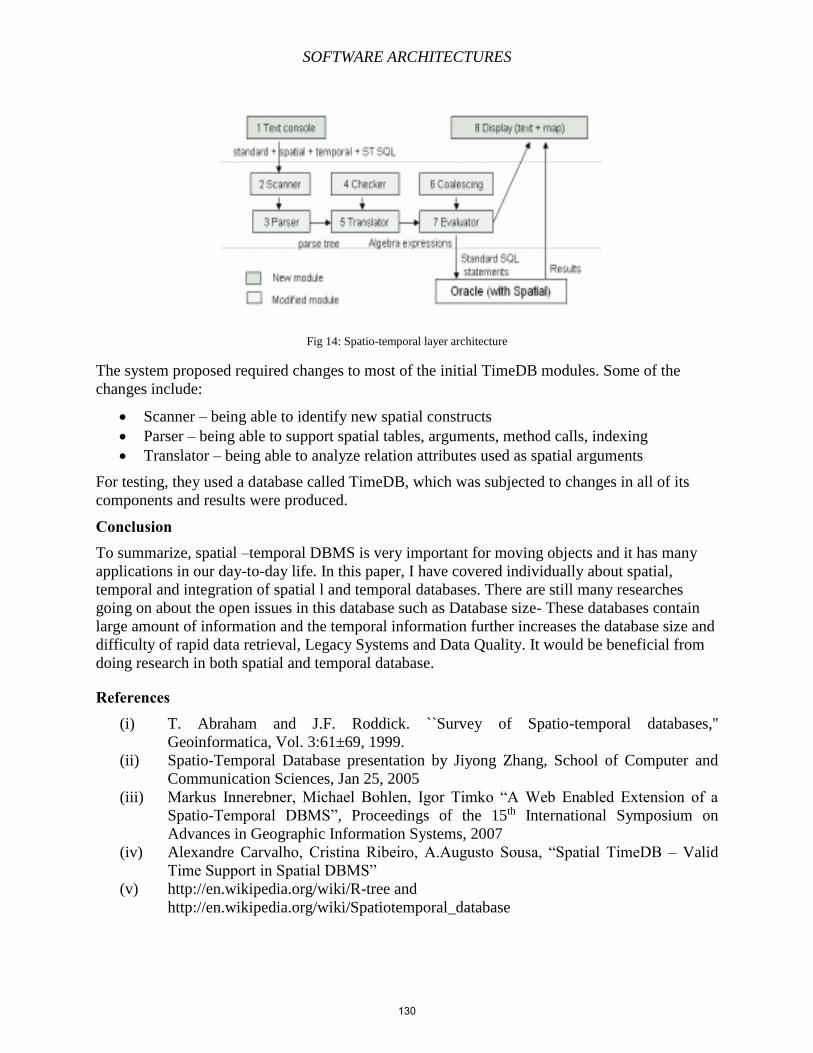
SOFTWARE ARCHITECTURES
Fig 14: Spatio-temporal layer architecture
The system proposed required changes to most of the initial TimeDB modules. Some of the
changes include:
Scanner – being able to identify new spatial constructs
Parser – being able to support spatial tables, arguments, method calls, indexing
Translator – being able to analyze relation attributes used as spatial arguments
For testing, they used a database called TimeDB, which was subjected to changes in all of its
components and results were produced.
Conclusion
To summarize, spatial –temporal DBMS is very important for moving objects and it has many
applications in our day-to-day life. In this paper, I have covered individually about spatial,
temporal and integration of spatial l and temporal databases. There are still many researches
going on about the open issues in this database such as Database size- These databases contain
large amount of information and the temporal information further increases the database size and
difficulty of rapid data retrieval, Legacy Systems and Data Quality. It would be beneficial from
doing research in both spatial and temporal database.
References
(i) T. Abraham and J.F. Roddick. ``Survey of Spatio-temporal databases,''
Geoinformatica, Vol. 3:61±69, 1999.
(ii) Spatio-Temporal Database presentation by Jiyong Zhang, School of Computer and
Communication Sciences, Jan 25, 2005
(iii) Markus Innerebner, Michael Bohlen, Igor Timko “A Web Enabled Extension of a
Spatio-Temporal DBMS”, Proceedings of the 15th International Symposium on
Advances in Geographic Information Systems, 2007
(iv) Alexandre Carvalho, Cristina Ribeiro, A.Augusto Sousa, “Spatial TimeDB – Valid
Time Support in Spatial DBMS”
(v) http://en.wikipedia.org/wiki/R-tree and
http://en.wikipedia.org/wiki/Spatiotemporal_database
130
SOFTWARE ARCHITECTURES
Chapter 10 – Multidimensional Databases Matthew Moccaro
Summary Multidimensional databases are those which are optimized for the retrieval of data by
using multidimensional storage structures such as multidimensional arrays and data cubes. This
emerging technology helps organizations to make strategic decisions and gives them a new way
of thinking about large quantities of information [1]. They also give everyone a new way to
more efficiently and effectively organize our data. Finally, even in relational and other types of
databases, multidimensional concepts can still carry over to be an effective solution to a problem.
Data warehouses are the main setting for multidimensional database applications. Data
warehouses are a server or group of servers which store a great magnitude of data [2]. This data
is normally infrequently updated but still useful to conduct large-scale analytical queries.
Preparing a data warehouse can be a difficult but worthwhile process when data needs
preparation for the complex queries which will be run. The results of these queries help make
decisions. Multidimensional databases are the key in which these applications become more
efficient. Where a relational database may take minutes to complete a query, a multidimensional
database can take only seconds to retrieve the requested dataset [3].
OLAP, or Online Analytical Processing, is a type of application which is concerned with
obtaining specific information to make strategic decisions [2]. This type of application is
becoming increasingly critical for businesses to stay current with trends and their competition.
They also help to make customizations in marketing and other business aspects. OLAP queries
are run on large amounts of data, normally stored in data warehouses which may or may not use
multidimensional databases. Multiple versions of OLAP, including Relational OLAP, or
ROLAP, and Multidimensional OLAP, or MOLAP, can also be explored. They can be a vital
part of any business plan.
When learning any subject, a hands-on example is always helpful. Essbase is a
multidimensional database system currently being maintained and developed by Oracle [4]. It
was originally developed by Hyperion which has since been acquired by Oracle. Gaining actual
experience with this tool can help to better outline certain aspects and to illustrate
multidimensional aspects in clearer way. We can also see how to use a multidimensional
database for actual analytical applications. Essbase is highly regarded, being on several
innovative technology lists [5].
All of these components create a scenario where multidimensional databases can be an
integral part of data analytics. Businesses can use these databases to visualize their data in the
most organized way. Multidimensional databases can help to gather information quickly so that
decisions can be made quicker, which can make a huge difference in the success of a business.
Data warehouses store the data needed to make these decisions. OLAP applications can help to
deliver this data in the most efficient way possible. Finally, Essbase is an actual example of all of
these concepts in practice. Overall, we can see how multidimensional databases and their related
components can help businesses everywhere be as efficient as possible.
131
SOFTWARE ARCHITECTURES
Multidimensional Databases
Introduction Databases have become an indispensable part of many technology related industries.
They help us to store data and keep track of data. Databases are useful to store small sets of data
as well as large ones, ranging from only a few sets of data for a small office to many terabytes of
data for the biggest corporations. There are many different types of databases which have been
in development since the mid-twentieth century. These different databases help to achieve the
most efficient data storage structure for the data in use. Multidimensional databases have come
into light recently compared to other database platforms, but are proving their worth in being
very efficient in the field of data analysis [2].
The origins of multidimensional databases come from IRI Software and Comshare, two
companies that, in the 1960s, began developing the initial traces of multidimensional data
storage. IRI Express was the main application which allowed analytical processing. Comshare
developed System W, which was another popular application for analysis. Finally, Hyperion
Solutions released the Essbase system in 1991. This system was later bought by Oracle and has
become one of the most popular multidimensional database systems to date [6].
Two other technologies were also developed in the 1990s which helped in the
development of multidimensional databases. The concept of OLAP was brought forth by E.F.
Codd, and this name has become synonymous with multidimensional databases and data analysis
today. Also, data warehouses had begun to develop in many places. These warehouses held
large amounts of data which were normally queried and analyzed using the popular relational
model. However, with the development of multidimensional models, database administrators
and application developers now had a new, more efficient tool to analyze their data.
The mass market has also seen an increase in the availability in this technology for
smaller applications. Microsoft has released a multidimensional database system called MS
OLAP Server which was first available in 1998. IBM also has a version of Essbase integrated
with their popular DB2 server. Both of these services allow users to do several things. First, it
allows users to get hands-on experience with this technology. This is a great advantage to both
users and businesses alike as users of all experience levels will be able to use this technology in
small-scale applications such as a small business financing analysis application.
Multidimensional Databases: Example by Comparison To illustrate a multidimensional database, we will first explain and demonstrate the most
common type of database, the relational database [2]. The relational database is one which uses
the relational model. The relational model stores data within tables, where data can be easily
organized, viewed, and updated. This is very similar to a desktop spreadsheet application. Each
column in the table defines a field of data, describing all of the data below the heading. For
example, if the column was entitled “Car Model,” all of the data in this column should represent
a specific car model. Each row in the table defines a different “tuple” or “record.” This row is a
set of related data that goes together in the database. This type of database is extremely common
and used in small applications as well as extremely large applications, holding data for millions
of transactions for customers and other types of data. An example of a typical relational
database table is shown in Table 1.
132
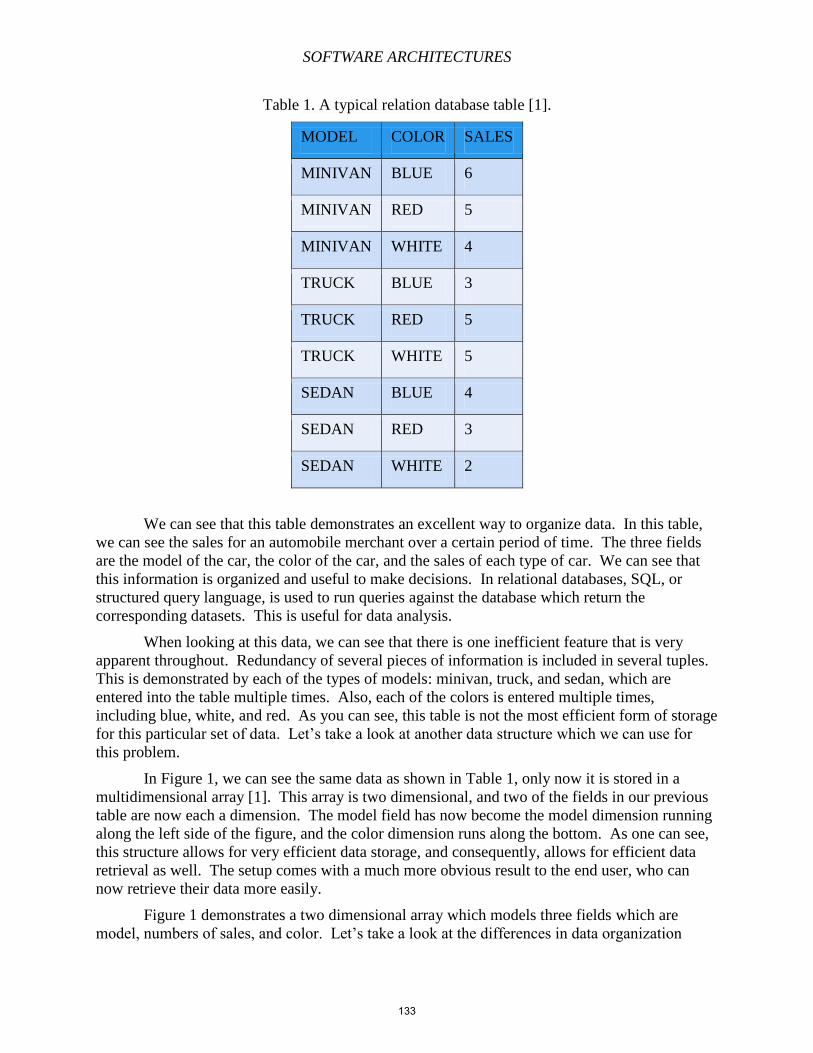
SOFTWARE ARCHITECTURES
Table 1. A typical relation database table [1].
MODEL COLOR SALES
MINIVAN BLUE 6
MINIVAN RED 5
MINIVAN WHITE 4
TRUCK BLUE 3
TRUCK RED 5
TRUCK WHITE 5
SEDAN BLUE 4
SEDAN RED 3
SEDAN WHITE 2
We can see that this table demonstrates an excellent way to organize data. In this table,
we can see the sales for an automobile merchant over a certain period of time. The three fields
are the model of the car, the color of the car, and the sales of each type of car. We can see that
this information is organized and useful to make decisions. In relational databases, SQL, or
structured query language, is used to run queries against the database which return the
corresponding datasets. This is useful for data analysis.
When looking at this data, we can see that there is one inefficient feature that is very
apparent throughout. Redundancy of several pieces of information is included in several tuples.
This is demonstrated by each of the types of models: minivan, truck, and sedan, which are
entered into the table multiple times. Also, each of the colors is entered multiple times,
including blue, white, and red. As you can see, this table is not the most efficient form of storage
for this particular set of data. Let’s take a look at another data structure which we can use for
this problem.
In Figure 1, we can see the same data as shown in Table 1, only now it is stored in a
multidimensional array [1]. This array is two dimensional, and two of the fields in our previous
table are now each a dimension. The model field has now become the model dimension running
along the left side of the figure, and the color dimension runs along the bottom. As one can see,
this structure allows for very efficient data storage, and consequently, allows for efficient data
retrieval as well. The setup comes with a much more obvious result to the end user, who can
now retrieve their data more easily.
Figure 1 demonstrates a two dimensional array which models three fields which are
model, numbers of sales, and color. Let’s take a look at the differences in data organization
133
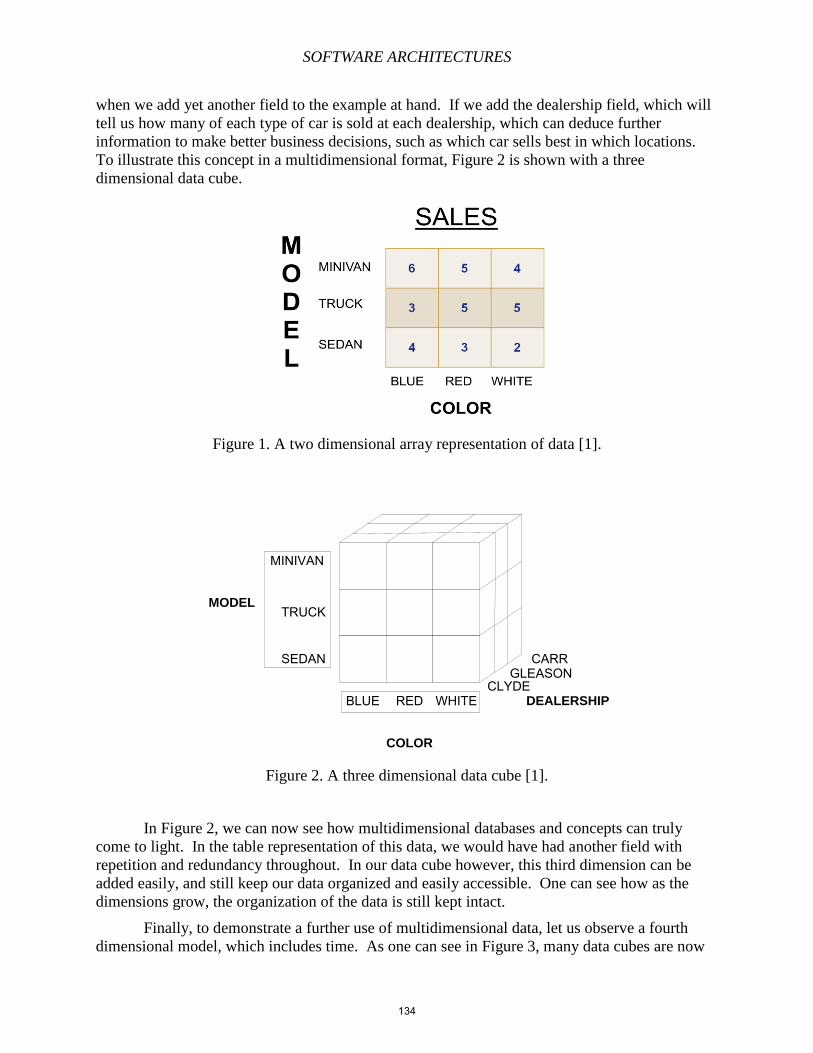
SOFTWARE ARCHITECTURES
when we add yet another field to the example at hand. If we add the dealership field, which will
tell us how many of each type of car is sold at each dealership, which can deduce further
information to make better business decisions, such as which car sells best in which locations.
To illustrate this concept in a multidimensional format, Figure 2 is shown with a three
dimensional data cube.
Figure 1. A two dimensional array representation of data [1].
MINIVAN
TRUCK
SEDAN
BLUE RED WHITECLYDE
GLEASONCARR
COLOR
DEALERSHIP
MODEL
Figure 2. A three dimensional data cube [1].
In Figure 2, we can now see how multidimensional databases and concepts can truly
come to light. In the table representation of this data, we would have had another field with
repetition and redundancy throughout. In our data cube however, this third dimension can be
added easily, and still keep our data organized and easily accessible. One can see how as the
dimensions grow, the organization of the data is still kept intact.
Finally, to demonstrate a further use of multidimensional data, let us observe a fourth
dimensional model, which includes time. As one can see in Figure 3, many data cubes are now
134
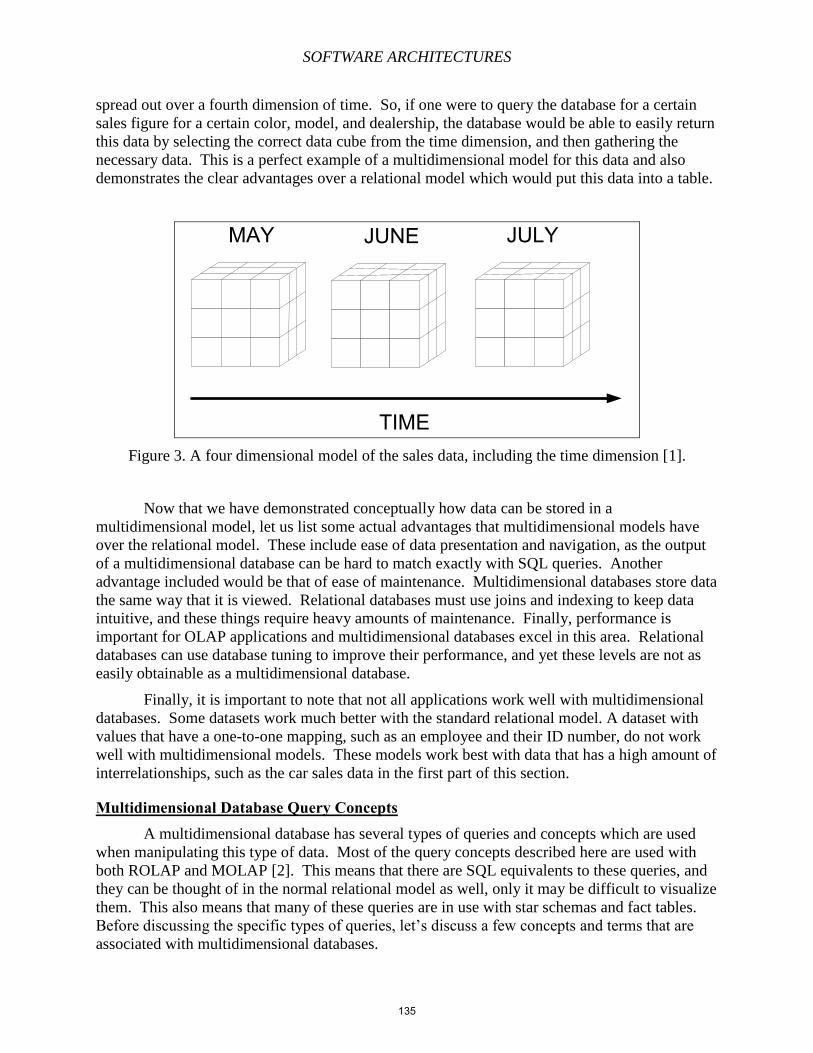
SOFTWARE ARCHITECTURES
spread out over a fourth dimension of time. So, if one were to query the database for a certain
sales figure for a certain color, model, and dealership, the database would be able to easily return
this data by selecting the correct data cube from the time dimension, and then gathering the
necessary data. This is a perfect example of a multidimensional model for this data and also
demonstrates the clear advantages over a relational model which would put this data into a table.
MAY JUNE JULY
TIME
Figure 3. A four dimensional model of the sales data, including the time dimension [1].
Now that we have demonstrated conceptually how data can be stored in a
multidimensional model, let us list some actual advantages that multidimensional models have
over the relational model. These include ease of data presentation and navigation, as the output
of a multidimensional database can be hard to match exactly with SQL queries. Another
advantage included would be that of ease of maintenance. Multidimensional databases store data
the same way that it is viewed. Relational databases must use joins and indexing to keep data
intuitive, and these things require heavy amounts of maintenance. Finally, performance is
important for OLAP applications and multidimensional databases excel in this area. Relational
databases can use database tuning to improve their performance, and yet these levels are not as
easily obtainable as a multidimensional database.
Finally, it is important to note that not all applications work well with multidimensional
databases. Some datasets work much better with the standard relational model. A dataset with
values that have a one-to-one mapping, such as an employee and their ID number, do not work
well with multidimensional models. These models work best with data that has a high amount of
interrelationships, such as the car sales data in the first part of this section.
Multidimensional Database Query Concepts A multidimensional database has several types of queries and concepts which are used
when manipulating this type of data. Most of the query concepts described here are used with
both ROLAP and MOLAP [2]. This means that there are SQL equivalents to these queries, and
they can be thought of in the normal relational model as well, only it may be difficult to visualize
them. This also means that many of these queries are in use with star schemas and fact tables.
Before discussing the specific types of queries, let’s discuss a few concepts and terms that are
associated with multidimensional databases.
135
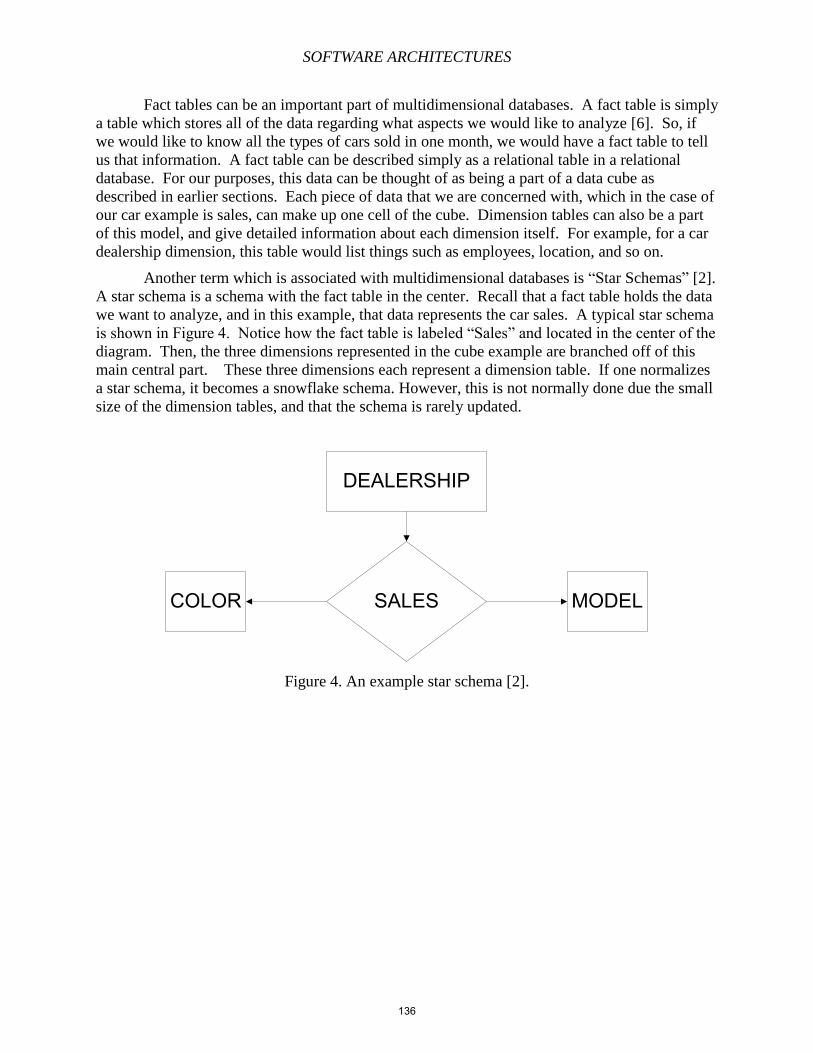
SOFTWARE ARCHITECTURES
Fact tables can be an important part of multidimensional databases. A fact table is simply
a table which stores all of the data regarding what aspects we would like to analyze [6]. So, if
we would like to know all the types of cars sold in one month, we would have a fact table to tell
us that information. A fact table can be described simply as a relational table in a relational
database. For our purposes, this data can be thought of as being a part of a data cube as
described in earlier sections. Each piece of data that we are concerned with, which in the case of
our car example is sales, can make up one cell of the cube. Dimension tables can also be a part
of this model, and give detailed information about each dimension itself. For example, for a car
dealership dimension, this table would list things such as employees, location, and so on.
Another term which is associated with multidimensional databases is “Star Schemas” [2].
A star schema is a schema with the fact table in the center. Recall that a fact table holds the data
we want to analyze, and in this example, that data represents the car sales. A typical star schema
is shown in Figure 4. Notice how the fact table is labeled “Sales” and located in the center of the
diagram. Then, the three dimensions represented in the cube example are branched off of this
main central part. These three dimensions each represent a dimension table. If one normalizes
a star schema, it becomes a snowflake schema. However, this is not normally done due the small
size of the dimension tables, and that the schema is rarely updated.
SALESCOLOR MODEL
DEALERSHIP
Figure 4. An example star schema [2].
136
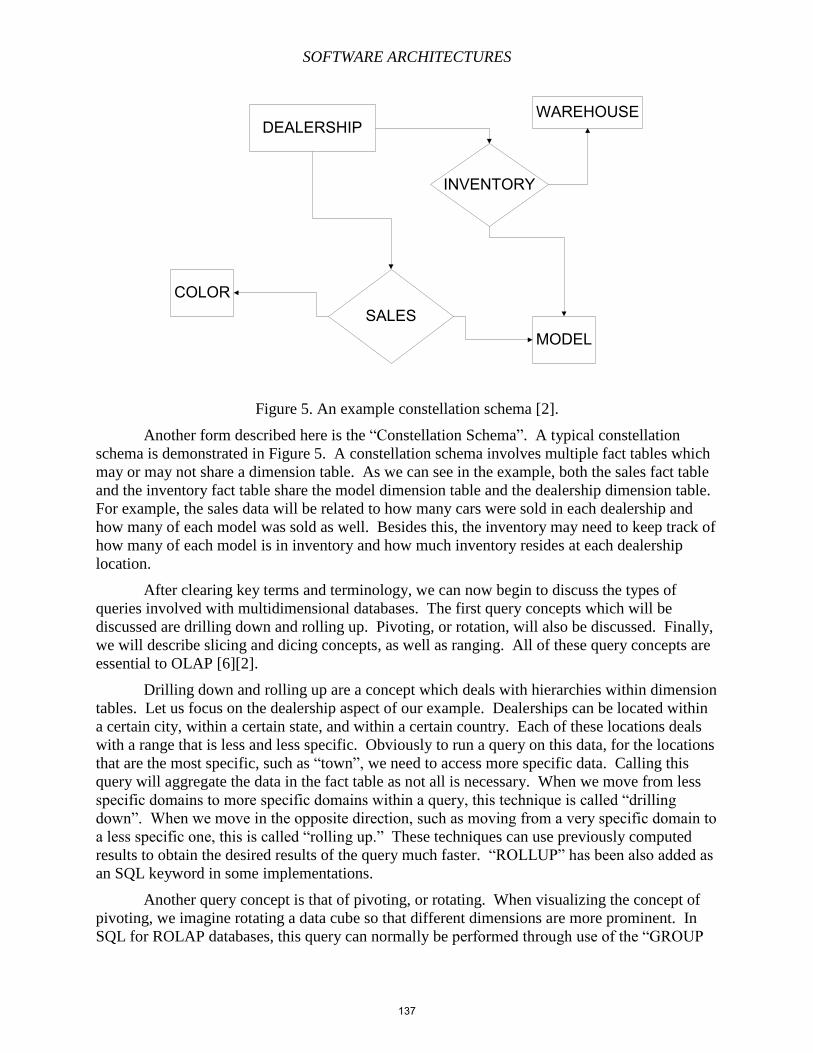
SOFTWARE ARCHITECTURES
SALESCOLOR
MODEL
DEALERSHIP
INVENTORY
WAREHOUSE
Figure 5. An example constellation schema [2].
Another form described here is the “Constellation Schema”. A typical constellation
schema is demonstrated in Figure 5. A constellation schema involves multiple fact tables which
may or may not share a dimension table. As we can see in the example, both the sales fact table
and the inventory fact table share the model dimension table and the dealership dimension table.
For example, the sales data will be related to how many cars were sold in each dealership and
how many of each model was sold as well. Besides this, the inventory may need to keep track of
how many of each model is in inventory and how much inventory resides at each dealership
location.
After clearing key terms and terminology, we can now begin to discuss the types of
queries involved with multidimensional databases. The first query concepts which will be
discussed are drilling down and rolling up. Pivoting, or rotation, will also be discussed. Finally,
we will describe slicing and dicing concepts, as well as ranging. All of these query concepts are
essential to OLAP [6][2].
Drilling down and rolling up are a concept which deals with hierarchies within dimension
tables. Let us focus on the dealership aspect of our example. Dealerships can be located within
a certain city, within a certain state, and within a certain country. Each of these locations deals
with a range that is less and less specific. Obviously to run a query on this data, for the locations
that are the most specific, such as “town”, we need to access more specific data. Calling this
query will aggregate the data in the fact table as not all is necessary. When we move from less
specific domains to more specific domains within a query, this technique is called “drilling
down”. When we move in the opposite direction, such as moving from a very specific domain to
a less specific one, this is called “rolling up.” These techniques can use previously computed
results to obtain the desired results of the query much faster. “ROLLUP” has been also added as
an SQL keyword in some implementations.
Another query concept is that of pivoting, or rotating. When visualizing the concept of
pivoting, we imagine rotating a data cube so that different dimensions are more prominent. In
SQL for ROLAP databases, this query can normally be performed through use of the “GROUP
137
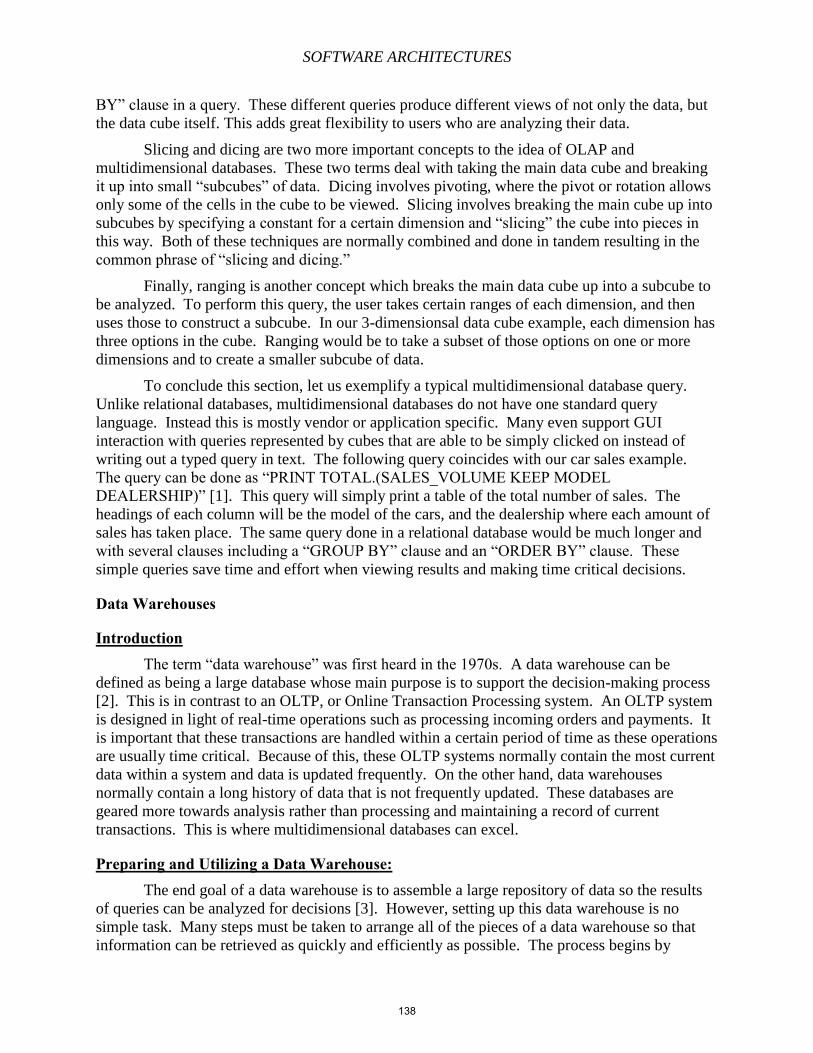
SOFTWARE ARCHITECTURES
BY” clause in a query. These different queries produce different views of not only the data, but
the data cube itself. This adds great flexibility to users who are analyzing their data.
Slicing and dicing are two more important concepts to the idea of OLAP and
multidimensional databases. These two terms deal with taking the main data cube and breaking
it up into small “subcubes” of data. Dicing involves pivoting, where the pivot or rotation allows
only some of the cells in the cube to be viewed. Slicing involves breaking the main cube up into
subcubes by specifying a constant for a certain dimension and “slicing” the cube into pieces in
this way. Both of these techniques are normally combined and done in tandem resulting in the
common phrase of “slicing and dicing.”
Finally, ranging is another concept which breaks the main data cube up into a subcube to
be analyzed. To perform this query, the user takes certain ranges of each dimension, and then
uses those to construct a subcube. In our 3-dimensionsal data cube example, each dimension has
three options in the cube. Ranging would be to take a subset of those options on one or more
dimensions and to create a smaller subcube of data.
To conclude this section, let us exemplify a typical multidimensional database query.
Unlike relational databases, multidimensional databases do not have one standard query
language. Instead this is mostly vendor or application specific. Many even support GUI
interaction with queries represented by cubes that are able to be simply clicked on instead of
writing out a typed query in text. The following query coincides with our car sales example.
The query can be done as “PRINT TOTAL.(SALES_VOLUME KEEP MODEL
DEALERSHIP)” [1]. This query will simply print a table of the total number of sales. The
headings of each column will be the model of the cars, and the dealership where each amount of
sales has taken place. The same query done in a relational database would be much longer and
with several clauses including a “GROUP BY” clause and an “ORDER BY” clause. These
simple queries save time and effort when viewing results and making time critical decisions.
Data Warehouses
Introduction The term “data warehouse” was first heard in the 1970s. A data warehouse can be
defined as being a large database whose main purpose is to support the decision-making process
[2]. This is in contrast to an OLTP, or Online Transaction Processing system. An OLTP system
is designed in light of real-time operations such as processing incoming orders and payments. It
is important that these transactions are handled within a certain period of time as these operations
are usually time critical. Because of this, these OLTP systems normally contain the most current
data within a system and data is updated frequently. On the other hand, data warehouses
normally contain a long history of data that is not frequently updated. These databases are
geared more towards analysis rather than processing and maintaining a record of current
transactions. This is where multidimensional databases can excel.
Preparing and Utilizing a Data Warehouse: The end goal of a data warehouse is to assemble a large repository of data so the results
of queries can be analyzed for decisions [3]. However, setting up this data warehouse is no
simple task. Many steps must be taken to arrange all of the pieces of a data warehouse so that
information can be retrieved as quickly and efficiently as possible. The process begins by
138
SOFTWARE ARCHITECTURES
retrieving data from “source systems,” which normally include different applications in use by
the organization decisions are being made for. This can include OLTP databases including data
such as order processing and employee payroll. This data must be extracted from the source
systems using whatever methods may be specific to that system. After the data is properly
extracted, it must be transformed. This transformation can include many processes, including
cleansing, validating, being integrated, and organizing. After this process, the data must then be
loaded in a way which is efficient and effective for analysis. This loaded data must also be
accessible to the people who must make the decisions, and these people may not always have an
intense technical background. Therefore, it is essential that this data be prepared in a way that is
also easy to understand. This entire process is known as the “Extract, Transform, and Load”
process. It is abbreviated ETL.
After the data is properly brought through the ETL process, the data now resides in what
is termed a “data mart.” A data mart is a database which contains organized data ready for
analysis. These databases can be specialized for certain groups including the finance division of
a company. Also, this data must be analyzed and then presented in a manner where the decision-
makers can easily observe and understand the data and its trends. This can be done in the form
of reports on data in the database. Groups of these reports and the analysis that goes with them
are called “Business Intelligence.” The entire group of processes, including the ETL process and
the presentation of the data to the people who make decisions, constitutes what is normally
termed a data warehouse.
STRATEGIC QUESTION
SOURCE SYSTEM
TRANSFORMDATA
LOAD DATA
DATA MARTBUSINESS
INTELLIGENCE
ETL PROCESS
Figure 6. The data warehouse preparation process [5].
139
SOFTWARE ARCHITECTURES
The data warehouse preparation process is illustrated in Figure 6. It begins with the user
asking a strategic question which needs answering for the benefit of the organization. The ETL
process is then initiated. It begins by extracting data from the source system. Then, once the
data is extracted, it can be transformed. This is including all of the processes explained for the
data transformation stage previously. Next, the data is loaded into the data mart and ready to be
analyzed. Once the data is analyzed and the queries are run on the database, business
intelligence is produced in the form of any preferred reporting materials. Finally, these materials
are sent back to the original asked of the question, so that they may be analyzed and a decision
can be made.
Multidimensional Database Involvement Since the main focus of this chapter is multidimensional databases, it is important not to
forget where these databases fit in with the picture of data warehouses. As one can see after
reading through this section, data warehouses are the platform in which analytical queries are
run. A data warehouse, and a multidimensional database for this example, must have two main
goals in order to be used effectively. The first is the ability to be understood. The query results,
as well as the data sitting in the data mart, are useless if the data cannot be interpreted and used
for decision making. Secondly, the goal of producing timely results is also a top priority. Since
multidimensional databases are implemented with query performance regarding analysis in
mind, they prove their usefulness in this manner. As with the data warehouse preparation
process, the process of setting up a dimensional model which will be effective for your
organization is also no easy task. However, it is one that is worthwhile and able to keep your
business thriving.
OLAP
Introduction OLAP stands for Online Analytical Processing. Its main definition can be described as
obtaining specific information to guide strategic decisions [2]. We have already presented two
different types of OLAP in this chapter, including ROLAP and MOLAP. ROLAP stands for
Relational OLAP, which uses the relational model for implementing the database and
multidimensional concepts are simply used to visualize the data. MOLAP stands for
Multidimensional OLAP, which is where the database is actually implemented and stored in the
form of data cubes. In this section, we will describe OLAP in more detail, so that the role of
multidimensional databases within OLAP can be better understood.
A History In 1993, E.F. Codd coined the term OLAP [6]. In the report where this term first
appeared, Codd and his co-authors defined twelve rules for an application to actually be
considered as an OLAP application [7]. However, this proposal did not succeed, yet the term
was carried on and used everywhere. Further on in time, it was suggested that all OLAP tools
must pass the FASMI test, which is an abbreviation for Fast Analysis of Shared
Multidimensional Information. This test ensured several characteristics to make the database
efficient for analysis via complex queries. This test, as well as the characteristic tests which
come with it, do not truly define a standard measure for each of their attributes. This means that
140
SOFTWARE ARCHITECTURES
instead of this test, the overall consensus is that for an application to be considered an OLAP
application, it must be able to present data in a multidimensional view.
There was, at one point, an OLAP council. This council formed in the mid 1990s.
However, no major players entered into the council, and it eventually was forgotten. Because of
this, no standard has ever been set for the OLAP model. There is no one set query language or
data model for OLAP at the time of this writing, only vendor specific languages for each
multidimensional database.
Comparison to OLTP and Other Topics OLAP is almost always compared with OLTP. Recall that OLTP deals with maintaining
and storing current data, whilst OLAP is concerned with analysis and storage of a multitude of
data for analysis. This leads to the notion that OLTP’s workload is foreseeable, while OLAP’s
workload is unforeseeable. This is because an OLTP system is designed to deal with the same
queries frequently, including updating, inserting, and deleting data. OLAP systems are designed
to determine different trends and to constantly search for data that is useful to solve a problem.
Therefore, these problems can be new each time the data is queried. Another difference between
OLTP and OLAP is that the data with an OLTP system is read and write while the data within an
OLAP system is read only. This is because OLTP systems will need to constantly update their
data for things such as transactions and user accounts. OLAP systems are made to have queries
run against data for the past several years, and if this data were to be changed it would
compromise the integrity of the entire system. Therefore, OLAP systems should only be read
from. The query structure for an OLTP system is normally also simple. Simple update and
insert queries should cover most of the queries arranged in an OLTP system. They also do not
cover large volumes of data. OLAP queries however, normally deal with huge amounts of data,
with complex clauses in the query statements. Finally, another important difference between
OLAP and OLTP systems is the number of users. An OLTP database, such as one for a retail
store chain, may have millions of users each day. However, an OLAP database may have only a
few users, as only the organization’s decision-makers need to be concerned with the data.
Even though there is no standard query language for OLAP systems and
multidimensional databases, there have been several research proposals towards this technology.
In industry, the accepted standard is MDX, which stands for Multidimensional Expressions.
This language was developed by Microsoft and released in 1997. An example query template of
this type of language would be:
[ WITH <MeasureDefinition>+ ]
SELECT <DimensionSpecification>+
FROM <CubeName>
[WHERE <SlicerClause> ] [7]
As one can see, this query has syntax similar to that of SQL, which makes it very easy for a
database user to make the transition from relational models to multidimensional models. One
can also see in this example how a specific cube can be selected along with a specific dimension
along that cube. Slicing can be performed in the WHERE clause of this query. The WITH
clause of this query also allow complex calculations. This makes multidimensional queries more
accessible. The following is an actual query for a multidimensional database:
141
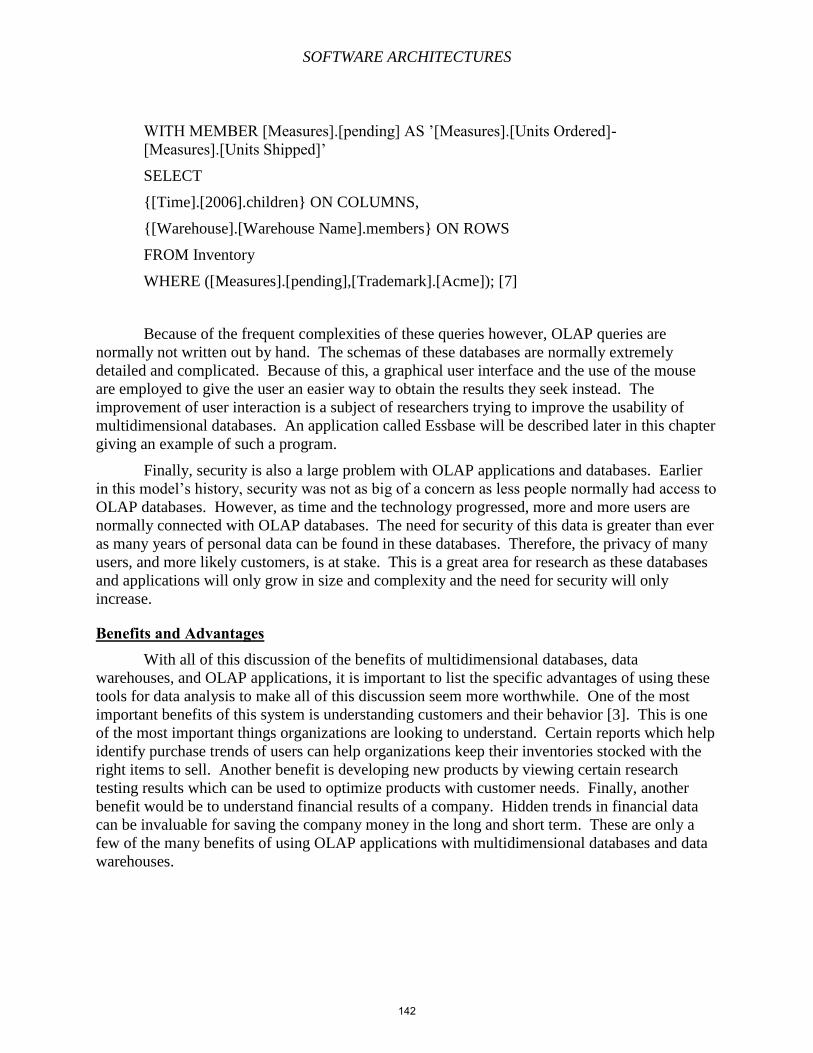
SOFTWARE ARCHITECTURES
WITH MEMBER [Measures].[pending] AS ’[Measures].[Units Ordered]-
[Measures].[Units Shipped]’
SELECT
{[Time].[2006].children} ON COLUMNS,
{[Warehouse].[Warehouse Name].members} ON ROWS
FROM Inventory
WHERE ([Measures].[pending],[Trademark].[Acme]); [7]
Because of the frequent complexities of these queries however, OLAP queries are
normally not written out by hand. The schemas of these databases are normally extremely
detailed and complicated. Because of this, a graphical user interface and the use of the mouse
are employed to give the user an easier way to obtain the results they seek instead. The
improvement of user interaction is a subject of researchers trying to improve the usability of
multidimensional databases. An application called Essbase will be described later in this chapter
giving an example of such a program.
Finally, security is also a large problem with OLAP applications and databases. Earlier
in this model’s history, security was not as big of a concern as less people normally had access to
OLAP databases. However, as time and the technology progressed, more and more users are
normally connected with OLAP databases. The need for security of this data is greater than ever
as many years of personal data can be found in these databases. Therefore, the privacy of many
users, and more likely customers, is at stake. This is a great area for research as these databases
and applications will only grow in size and complexity and the need for security will only
increase.
Benefits and Advantages With all of this discussion of the benefits of multidimensional databases, data
warehouses, and OLAP applications, it is important to list the specific advantages of using these
tools for data analysis to make all of this discussion seem more worthwhile. One of the most
important benefits of this system is understanding customers and their behavior [3]. This is one
of the most important things organizations are looking to understand. Certain reports which help
identify purchase trends of users can help organizations keep their inventories stocked with the
right items to sell. Another benefit is developing new products by viewing certain research
testing results which can be used to optimize products with customer needs. Finally, another
benefit would be to understand financial results of a company. Hidden trends in financial data
can be invaluable for saving the company money in the long and short term. These are only a
few of the many benefits of using OLAP applications with multidimensional databases and data
warehouses.
142
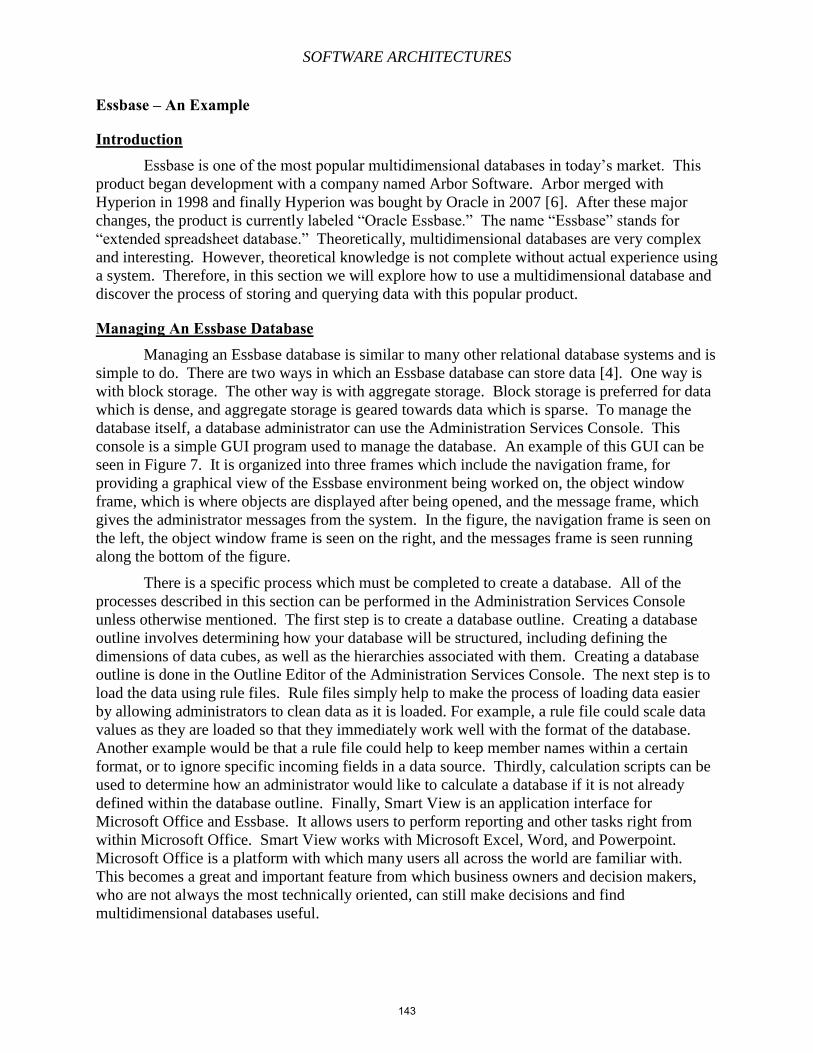
SOFTWARE ARCHITECTURES
Essbase – An Example
Introduction Essbase is one of the most popular multidimensional databases in today’s market. This
product began development with a company named Arbor Software. Arbor merged with
Hyperion in 1998 and finally Hyperion was bought by Oracle in 2007 [6]. After these major
changes, the product is currently labeled “Oracle Essbase.” The name “Essbase” stands for
“extended spreadsheet database.” Theoretically, multidimensional databases are very complex
and interesting. However, theoretical knowledge is not complete without actual experience using
a system. Therefore, in this section we will explore how to use a multidimensional database and
discover the process of storing and querying data with this popular product.
Managing An Essbase Database Managing an Essbase database is similar to many other relational database systems and is
simple to do. There are two ways in which an Essbase database can store data [4]. One way is
with block storage. The other way is with aggregate storage. Block storage is preferred for data
which is dense, and aggregate storage is geared towards data which is sparse. To manage the
database itself, a database administrator can use the Administration Services Console. This
console is a simple GUI program used to manage the database. An example of this GUI can be
seen in Figure 7. It is organized into three frames which include the navigation frame, for
providing a graphical view of the Essbase environment being worked on, the object window
frame, which is where objects are displayed after being opened, and the message frame, which
gives the administrator messages from the system. In the figure, the navigation frame is seen on
the left, the object window frame is seen on the right, and the messages frame is seen running
along the bottom of the figure.
There is a specific process which must be completed to create a database. All of the
processes described in this section can be performed in the Administration Services Console
unless otherwise mentioned. The first step is to create a database outline. Creating a database
outline involves determining how your database will be structured, including defining the
dimensions of data cubes, as well as the hierarchies associated with them. Creating a database
outline is done in the Outline Editor of the Administration Services Console. The next step is to
load the data using rule files. Rule files simply help to make the process of loading data easier
by allowing administrators to clean data as it is loaded. For example, a rule file could scale data
values as they are loaded so that they immediately work well with the format of the database.
Another example would be that a rule file could help to keep member names within a certain
format, or to ignore specific incoming fields in a data source. Thirdly, calculation scripts can be
used to determine how an administrator would like to calculate a database if it is not already
defined within the database outline. Finally, Smart View is an application interface for
Microsoft Office and Essbase. It allows users to perform reporting and other tasks right from
within Microsoft Office. Smart View works with Microsoft Excel, Word, and Powerpoint.
Microsoft Office is a platform with which many users all across the world are familiar with.
This becomes a great and important feature from which business owners and decision makers,
who are not always the most technically oriented, can still make decisions and find
multidimensional databases useful.
143
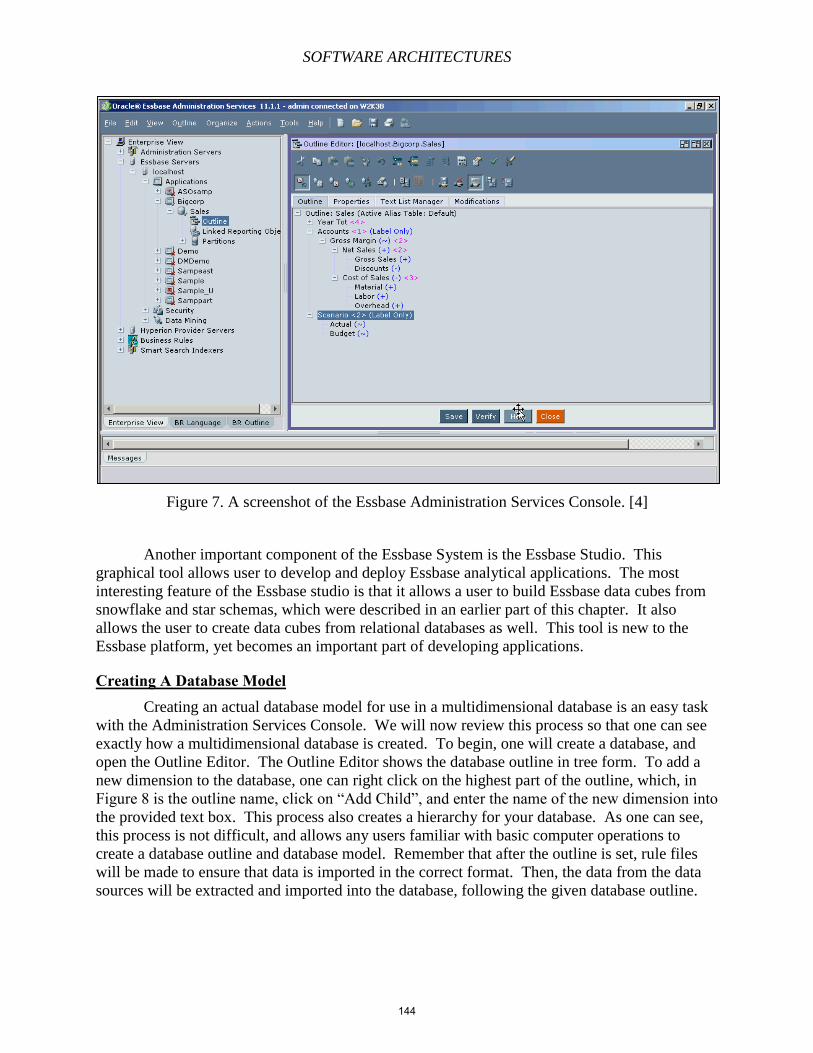
SOFTWARE ARCHITECTURES
Figure 7. A screenshot of the Essbase Administration Services Console. [4]
Another important component of the Essbase System is the Essbase Studio. This
graphical tool allows user to develop and deploy Essbase analytical applications. The most
interesting feature of the Essbase studio is that it allows a user to build Essbase data cubes from
snowflake and star schemas, which were described in an earlier part of this chapter. It also
allows the user to create data cubes from relational databases as well. This tool is new to the
Essbase platform, yet becomes an important part of developing applications.
Creating A Database Model Creating an actual database model for use in a multidimensional database is an easy task
with the Administration Services Console. We will now review this process so that one can see
exactly how a multidimensional database is created. To begin, one will create a database, and
open the Outline Editor. The Outline Editor shows the database outline in tree form. To add a
new dimension to the database, one can right click on the highest part of the outline, which, in
Figure 8 is the outline name, click on “Add Child”, and enter the name of the new dimension into
the provided text box. This process also creates a hierarchy for your database. As one can see,
this process is not difficult, and allows any users familiar with basic computer operations to
create a database outline and database model. Remember that after the outline is set, rule files
will be made to ensure that data is imported in the correct format. Then, the data from the data
sources will be extracted and imported into the database, following the given database outline.
144
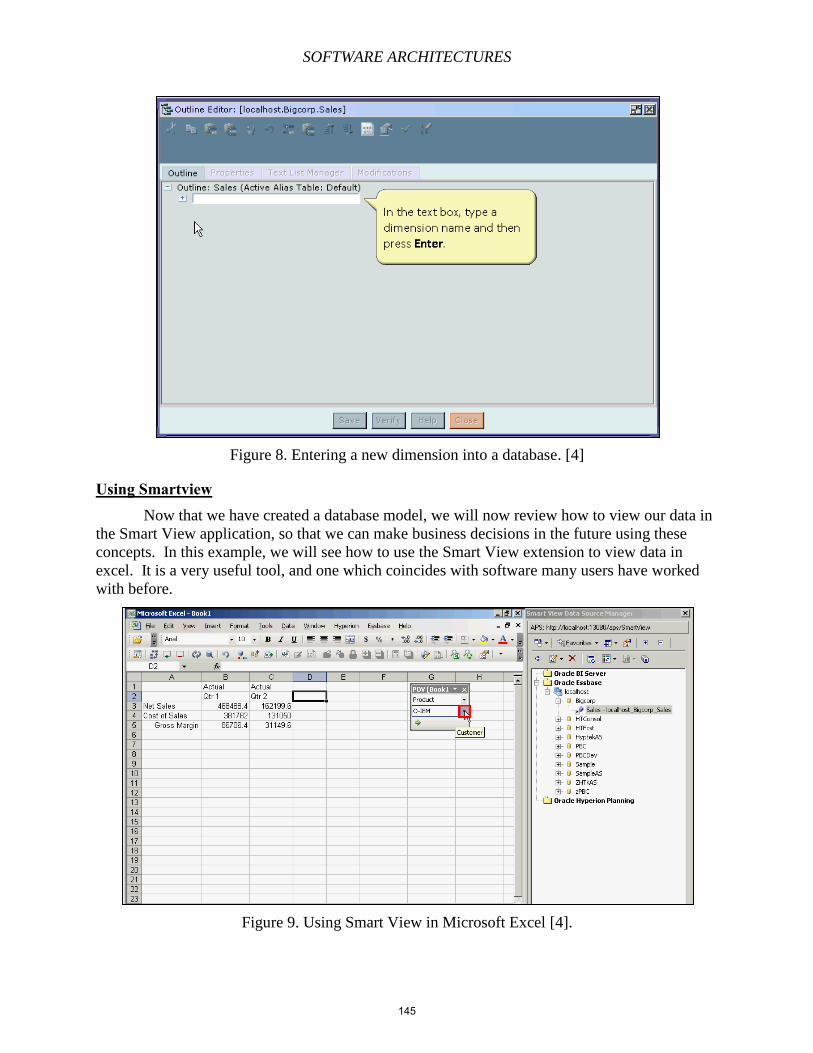
SOFTWARE ARCHITECTURES
Figure 8. Entering a new dimension into a database. [4]
Using Smartview Now that we have created a database model, we will now review how to view our data in
the Smart View application, so that we can make business decisions in the future using these
concepts. In this example, we will see how to use the Smart View extension to view data in
excel. It is a very useful tool, and one which coincides with software many users have worked
with before.
Figure 9. Using Smart View in Microsoft Excel [4].
145
SOFTWARE ARCHITECTURES
To begin, one will open up a running instance of Microsoft Excel. Then, open the Smart
View Data Source Manager. We will now create an ad hoc report and initiate a query against the
Essbase database. Then, we will view the data within Microsoft Excel. An example of this is
shown in Figure 9, where we can see the data for IBM shown in the spreadsheet. For the next
step, we will open up and connect to a server instance by finding the specific database in the
Data Source Manager and then logging in. Then we will right click on the database and select
“Ad-hoc Analysis.” If one wishes to drill down into the hierarchy of the database, one only
needs to double-click on that particular cell in the database to view the data. As can be seen in
Figure 9, this format is not only familiar, but allows non-technical decision makers to view the
data in their data warehouses in the simple format of an excel spreadsheet.
Review and Conclusion In this chapter, we have reviewed the many aspects of multidimensional databases. We
have seen that, most importantly, multidimensional databases help to more quickly and
efficiently analyze data. The first concepts which were reviewed were the differences between
multidimensional databases and relational databases. We saw how multidimensional arrays can
help to better organize and display data. We also saw how this is now always the best format for
certain types of data, such as individual mappings. Next we saw conceptually how a three
dimensional database and a four dimensional database for car sales over a period of time would
be set up. This chapter also discusses star schemas and constellation schemas. Next, the types of
query concepts, such as drilling down as slicing and dicing, that were associated with
multidimensional databases were explained.
In the following section, we discussed data warehouses. Recall that data warehouses are
large databases filled with data to be analyzed. This data does not need to be updated frequently
but is normally found in very large amounts. The process to prepare and load data into a data
warehouse was explained in several stages. OLAP was discussed in the next section. OLAP
stands for Online Analytical Processing and it can be defined as the process of obtaining specific
information to make strategic decisions for an organization. With OLAP, no standard query
language has been defined for OLAP applications. There are many differences between OLAP
and OLTP, and security is a true concern for today’s OLAP applications and databases. Finally,
Essbase is an example of a multidimensional OLAP system in use today. It is currently
developed by Oracle and uses several GUIs to accomplish certain tasks. The processes involved
in setting up a database with the Administration Services Console are discussed. Also, creating a
database model and viewing data in the Smart View Microsoft Office extension are explained.
Overall, this chapter discusses the most important parts of multidimensional databases, and gives
the reader a starting point for using them when timely data analysis is required. It can help all
organizations gain a great advantage in today’s competitive business world.
References [1] “An Introduction To Multidimensional Database Technology.” 1995. Kenan
Technologies. 19 April 2014. Web.
<http://www.fing.edu.uy/inco/grupos/csi/esp/Cursos/cursos_act/2003/DAP_SistDW/Mat
erial/ken96.pdf>
[2] Kifer, Michael. Bernstein, Arthur. Lewis, Philip. Database Systems, Pearson Education
Inc., Boston, MA, 2006.
146
SOFTWARE ARCHITECTURES
[3] Reeves, Laura. “A Managers Guide to Data Warehousing.” 13 May 2009. John Wiley &
Sons.
[4] “Oracle Essbase 11.1.1 – Tutorials.” Oracle Technology Network. 25 April 2014. Web.
<http://www.oracle.com/technetwork/middleware/essbase/tutorials/ess11-088612.html>
[5] “Online analytical processing.” Wikipedia: The Free Encyclopedia. Wikimedia
Foundation, Inc. 5 April 2014. Web. 25 April 2014.
<http://en.wikipedia.org/wiki/OLAP>
[6] Pedersen, Torben Bach, and Christian S. Jensen. "Multidimensional database
technology." Computer 34.12 (2001): 40-46.
<https://mis.uhcl.edu/rob/Course/DW/Lectures/Multidimensional%20Database.pdf>
[7] Abelló, Alberto, and Oscar Romero. "On-line analytical processing." Encyclopedia of
Database Systems. Springer US, 2009. 1949-1954.
147
SOFTWARE ARCHITECTURES
Chapter 11 – Map-Reduce, Hadoop, HDFS, Hbase, MongoDB, Apache HIVE, and Related
Xiangzhe Li
Summary Nowadays, there are more and more data everyday about everything. For instance, here
are some of the astonishing data from the book Hadoop the Definitive Guide: “The New York
Stock Exchange generates about one terabyte of new trade data per day. Facebook hosts
approximately 10 billion photos, taking up one petabyte of storage. Ancestry.com, the genealogy
site, stores around 2.5 petabytes of data. The Internet Archive stores around 2 petabytes of data,
and is growing at a rate of 20 terabytes per month.” (Whites) The Large Hadron Collider near
Geneva, Switzerland, will produce about 15 petabytes of data per year. In the business world,
having a precise way of determining the accurate information from the big set of data is very
critical and can help the company reduce the cost of information retrieval. In this chapter, we
will talk about the different components of the software architecture and frameworks that process
massive amount of unstructured data. Some of the topics include Map-Reduce, Hadoop, HDFS,
Hbase, MongoDB, and Apache HIVE.
Introduction
High Level Concepts
In reality, even though the technology improvement allows the storage capacities of hard
drive to increase, the speed at which the data is accessed has not made significant progress. For
instance, research found that “One typical drive from 1990 could store 1,370 MB of data and had
a transfer speed of 4.4 MB/s, you could read all the data from a full drive in around five minutes.
Over 20 years later, one terabyte drives are the norm, but the transfer speed is around 100 MB/s,
so it takes more than two and a half hours to read all the data off the disk.” (Whites) Wow, even
though the transfer speed has increased over 20 times, the storage has increased so significantly
that the time for accessing the data become 30 times longer under the old processing methods.
For this reason, the concept of parallel computing has brought the initial invention of big data
processing with tools such as the Hadoop family.
History
The initial version of Hadoop was created in early 2005 by Doug Cutting and Michael
Cafarella, while Cutting was working at Yahoo! at the time. The name of the project came after
his son’s toy elephant. The original purpose of the project was to support an open-source web
search platform called Nutch. Nutch was initiated in 2002 and it was based on open source
information retrieval framework called Apache Lucene and using the Java language as its
backbone for the structure. After the initiate architecture of Nutch was created, Cutting and
Cafarella realized that it was not able to support the billions of pages on the web. In 2003,
Google published a paper about a fully functioning product called the Googles Distributed File
System. Then later in 2004, following the Googles Distributed File System, Cutting and
148
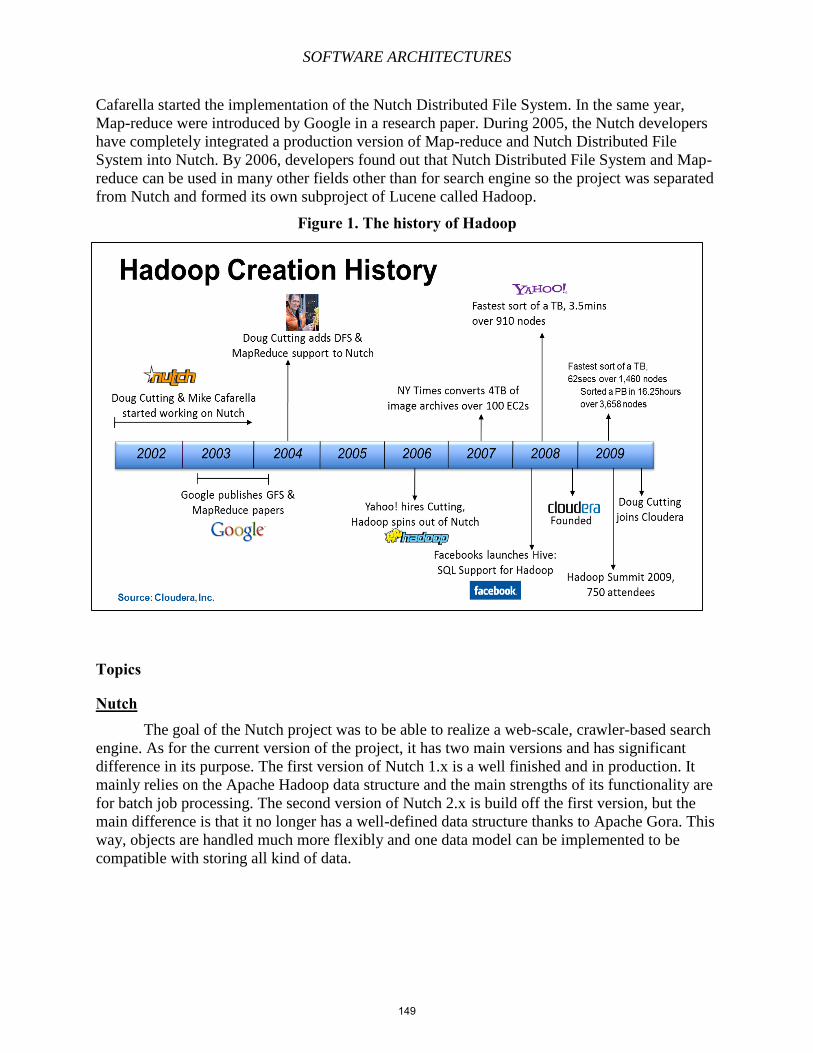
SOFTWARE ARCHITECTURES
Cafarella started the implementation of the Nutch Distributed File System. In the same year,
Map-reduce were introduced by Google in a research paper. During 2005, the Nutch developers
have completely integrated a production version of Map-reduce and Nutch Distributed File
System into Nutch. By 2006, developers found out that Nutch Distributed File System and Map-
reduce can be used in many other fields other than for search engine so the project was separated
from Nutch and formed its own subproject of Lucene called Hadoop.
Figure 1. The history of Hadoop
Topics
Nutch
The goal of the Nutch project was to be able to realize a web-scale, crawler-based search
engine. As for the current version of the project, it has two main versions and has significant
difference in its purpose. The first version of Nutch 1.x is a well finished and in production. It
mainly relies on the Apache Hadoop data structure and the main strengths of its functionality are
for batch job processing. The second version of Nutch 2.x is build off the first version, but the
main difference is that it no longer has a well-defined data structure thanks to Apache Gora. This
way, objects are handled much more flexibly and one data model can be implemented to be
compatible with storing all kind of data.
149
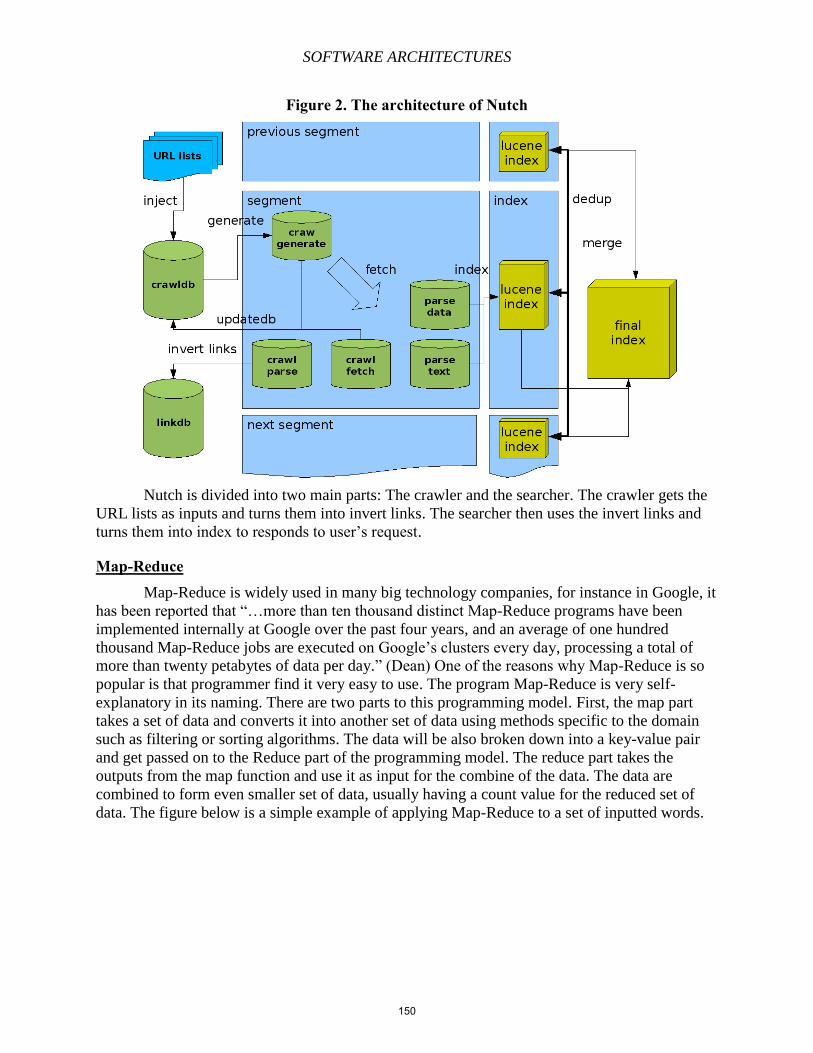
SOFTWARE ARCHITECTURES
Figure 2. The architecture of Nutch
Nutch is divided into two main parts: The crawler and the searcher. The crawler gets the
URL lists as inputs and turns them into invert links. The searcher then uses the invert links and
turns them into index to responds to user’s request.
Map-Reduce
Map-Reduce is widely used in many big technology companies, for instance in Google, it
has been reported that “…more than ten thousand distinct Map-Reduce programs have been
implemented internally at Google over the past four years, and an average of one hundred
thousand Map-Reduce jobs are executed on Google’s clusters every day, processing a total of
more than twenty petabytes of data per day.” (Dean) One of the reasons why Map-Reduce is so
popular is that programmer find it very easy to use. The program Map-Reduce is very self-
explanatory in its naming. There are two parts to this programming model. First, the map part
takes a set of data and converts it into another set of data using methods specific to the domain
such as filtering or sorting algorithms. The data will be also broken down into a key-value pair
and get passed on to the Reduce part of the programming model. The reduce part takes the
outputs from the map function and use it as input for the combine of the data. The data are
combined to form even smaller set of data, usually having a count value for the reduced set of
data. The figure below is a simple example of applying Map-Reduce to a set of inputted words.
150

SOFTWARE ARCHITECTURES
Figure 3. The Map-Reduce example
As you can see, in this Map-Reduce function, a set of inputted data is passed into the
mapping part and split based on their names. Then it is passed into the reduce function and
rearranged into the final set of individual key/value pair. Having explained how Map-Reduce
work in higher structure, now it is the time to express the key detail of its usage in technical
terms. The code for creating a Map-Reduce program requires 3 different components. It consists
of a Map function, a Reduce function, and the code that runs the job. A brief touch on one of the
3 components, the map function is incorporated in a generic mapper, where Hadoop uses its own
set of data type that works much more efficiently for the inputted data. The inputted text value is
converted into a Java String and uses the substring function to retrieve the data we are looking
for.
As for the progression of the updates for Map-Reduce API, there are several new changes
with the newer version. For instance, the new API 0.20.0 preferred abstract classes over
interfaces since it ease the integration part of implementing a new functions without breaking the
old structure of the class. In addition, the configuration in the newer version has been combined
into a centralized location. In the older version, the job configuration is set up in a JobConf
object, which involves its own declaration of XML documents. But in the newer version, this
specific declaration is removed and it is included with every other configuration.
Hadoop
Hadoop software library is an open source framework that allows the distributed
computing of large amount of data using the Map-Reduce programming model. The software
itself is able to detect and handle the failure during the computation. All of the components are
designed so they can detect the occurrence of failure and will let the framework handle it. Some
of the components of the Hadoop project are:
Hadoop Common – The module that contains common utilities and libraries that support
the other Hadoop modules.
151
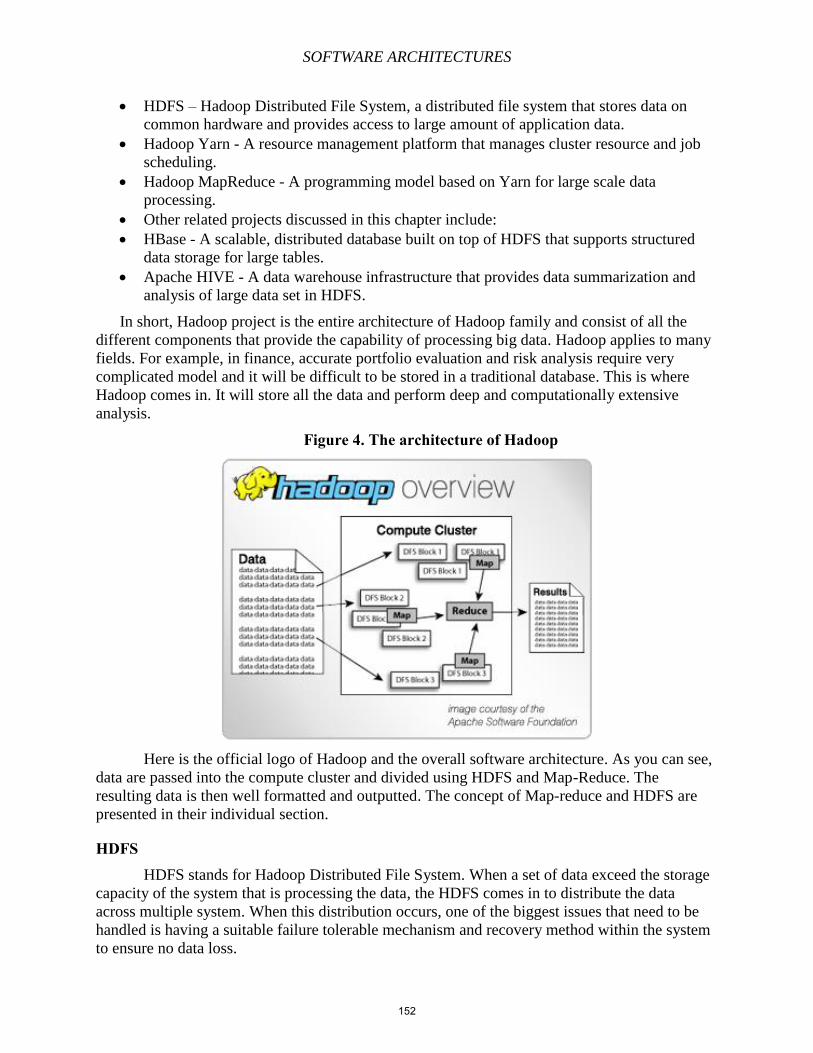
SOFTWARE ARCHITECTURES
HDFS – Hadoop Distributed File System, a distributed file system that stores data on
common hardware and provides access to large amount of application data.
Hadoop Yarn - A resource management platform that manages cluster resource and job
scheduling.
Hadoop MapReduce - A programming model based on Yarn for large scale data
processing.
Other related projects discussed in this chapter include:
HBase - A scalable, distributed database built on top of HDFS that supports structured
data storage for large tables.
Apache HIVE - A data warehouse infrastructure that provides data summarization and
analysis of large data set in HDFS.
In short, Hadoop project is the entire architecture of Hadoop family and consist of all the
different components that provide the capability of processing big data. Hadoop applies to many
fields. For example, in finance, accurate portfolio evaluation and risk analysis require very
complicated model and it will be difficult to be stored in a traditional database. This is where
Hadoop comes in. It will store all the data and perform deep and computationally extensive
analysis.
Figure 4. The architecture of Hadoop
Here is the official logo of Hadoop and the overall software architecture. As you can see,
data are passed into the compute cluster and divided using HDFS and Map-Reduce. The
resulting data is then well formatted and outputted. The concept of Map-reduce and HDFS are
presented in their individual section.
HDFS HDFS stands for Hadoop Distributed File System. When a set of data exceed the storage
capacity of the system that is processing the data, the HDFS comes in to distribute the data
across multiple system. When this distribution occurs, one of the biggest issues that need to be
handled is having a suitable failure tolerable mechanism and recovery method within the system
to ensure no data loss.
152
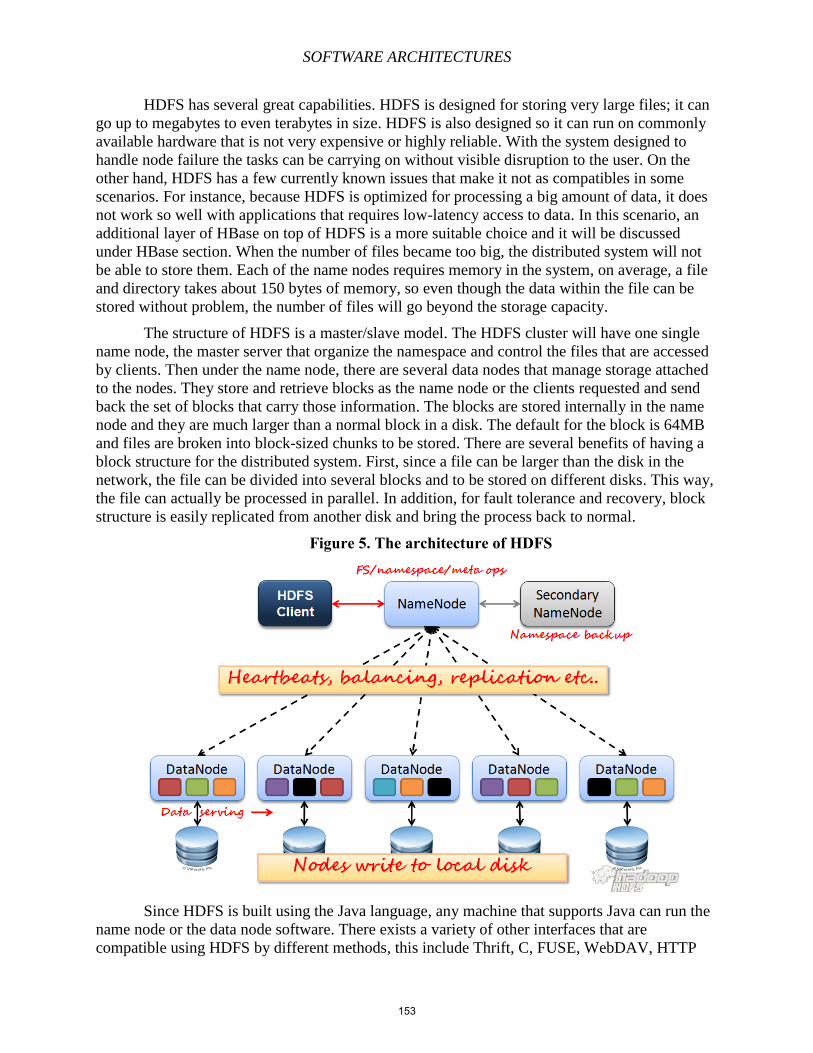
SOFTWARE ARCHITECTURES
HDFS has several great capabilities. HDFS is designed for storing very large files; it can
go up to megabytes to even terabytes in size. HDFS is also designed so it can run on commonly
available hardware that is not very expensive or highly reliable. With the system designed to
handle node failure the tasks can be carrying on without visible disruption to the user. On the
other hand, HDFS has a few currently known issues that make it not as compatibles in some
scenarios. For instance, because HDFS is optimized for processing a big amount of data, it does
not work so well with applications that requires low-latency access to data. In this scenario, an
additional layer of HBase on top of HDFS is a more suitable choice and it will be discussed
under HBase section. When the number of files became too big, the distributed system will not
be able to store them. Each of the name nodes requires memory in the system, on average, a file
and directory takes about 150 bytes of memory, so even though the data within the file can be
stored without problem, the number of files will go beyond the storage capacity.
The structure of HDFS is a master/slave model. The HDFS cluster will have one single
name node, the master server that organize the namespace and control the files that are accessed
by clients. Then under the name node, there are several data nodes that manage storage attached
to the nodes. They store and retrieve blocks as the name node or the clients requested and send
back the set of blocks that carry those information. The blocks are stored internally in the name
node and they are much larger than a normal block in a disk. The default for the block is 64MB
and files are broken into block-sized chunks to be stored. There are several benefits of having a
block structure for the distributed system. First, since a file can be larger than the disk in the
network, the file can be divided into several blocks and to be stored on different disks. This way,
the file can actually be processed in parallel. In addition, for fault tolerance and recovery, block
structure is easily replicated from another disk and bring the process back to normal.
Figure 5. The architecture of HDFS
Since HDFS is built using the Java language, any machine that supports Java can run the
name node or the data node software. There exists a variety of other interfaces that are
compatible using HDFS by different methods, this include Thrift, C, FUSE, WebDAV, HTTP
153
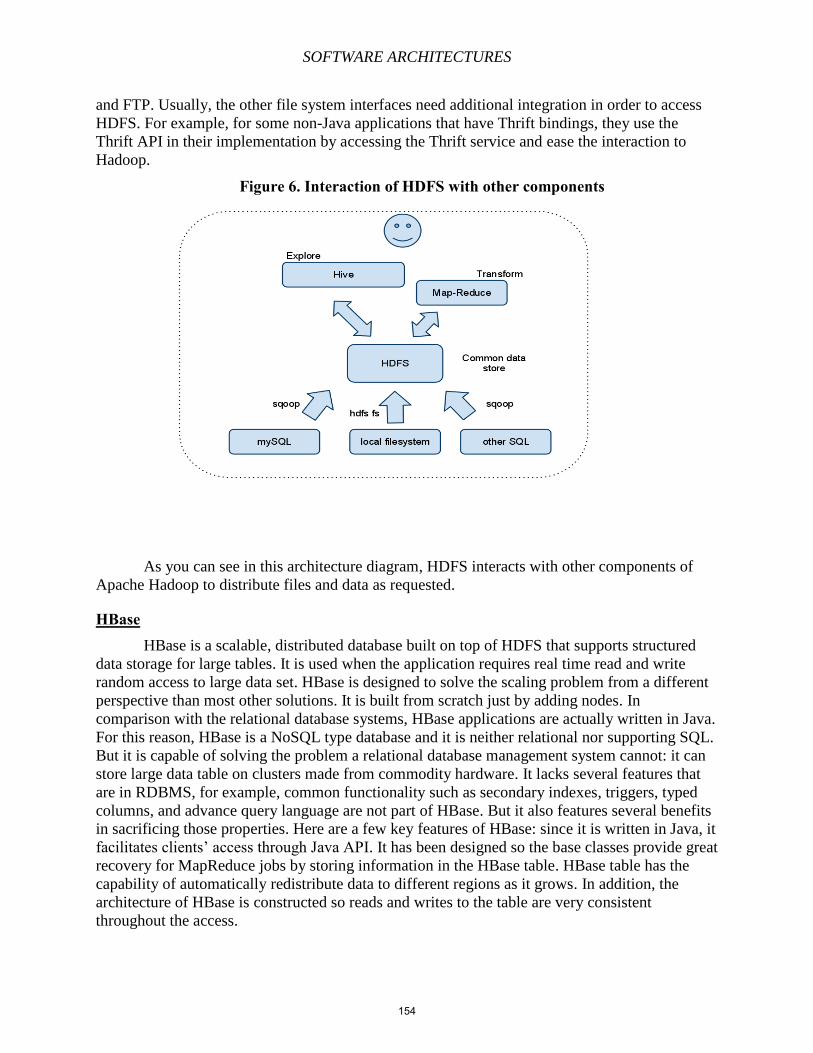
SOFTWARE ARCHITECTURES
and FTP. Usually, the other file system interfaces need additional integration in order to access
HDFS. For example, for some non-Java applications that have Thrift bindings, they use the
Thrift API in their implementation by accessing the Thrift service and ease the interaction to
Hadoop.
Figure 6. Interaction of HDFS with other components
As you can see in this architecture diagram, HDFS interacts with other components of
Apache Hadoop to distribute files and data as requested.
HBase HBase is a scalable, distributed database built on top of HDFS that supports structured
data storage for large tables. It is used when the application requires real time read and write
random access to large data set. HBase is designed to solve the scaling problem from a different
perspective than most other solutions. It is built from scratch just by adding nodes. In
comparison with the relational database systems, HBase applications are actually written in Java.
For this reason, HBase is a NoSQL type database and it is neither relational nor supporting SQL.
But it is capable of solving the problem a relational database management system cannot: it can
store large data table on clusters made from commodity hardware. It lacks several features that
are in RDBMS, for example, common functionality such as secondary indexes, triggers, typed
columns, and advance query language are not part of HBase. But it also features several benefits
in sacrificing those properties. Here are a few key features of HBase: since it is written in Java, it
facilitates clients’ access through Java API. It has been designed so the base classes provide great
recovery for MapReduce jobs by storing information in the HBase table. HBase table has the
capability of automatically redistribute data to different regions as it grows. In addition, the
architecture of HBase is constructed so reads and writes to the table are very consistent
throughout the access.
154
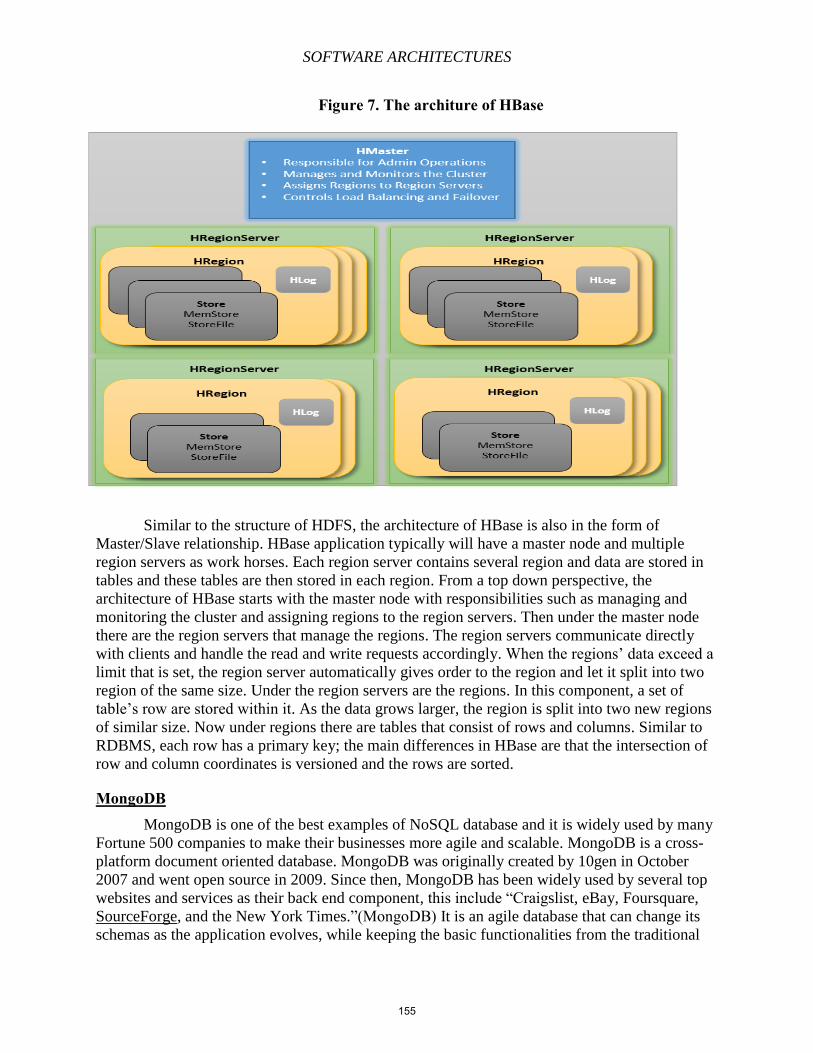
SOFTWARE ARCHITECTURES
Figure 7. The architure of HBase
Similar to the structure of HDFS, the architecture of HBase is also in the form of
Master/Slave relationship. HBase application typically will have a master node and multiple
region servers as work horses. Each region server contains several region and data are stored in
tables and these tables are then stored in each region. From a top down perspective, the
architecture of HBase starts with the master node with responsibilities such as managing and
monitoring the cluster and assigning regions to the region servers. Then under the master node
there are the region servers that manage the regions. The region servers communicate directly
with clients and handle the read and write requests accordingly. When the regions’ data exceed a
limit that is set, the region server automatically gives order to the region and let it split into two
region of the same size. Under the region servers are the regions. In this component, a set of
table’s row are stored within it. As the data grows larger, the region is split into two new regions
of similar size. Now under regions there are tables that consist of rows and columns. Similar to
RDBMS, each row has a primary key; the main differences in HBase are that the intersection of
row and column coordinates is versioned and the rows are sorted.
MongoDB MongoDB is one of the best examples of NoSQL database and it is widely used by many
Fortune 500 companies to make their businesses more agile and scalable. MongoDB is a cross-
platform document oriented database. MongoDB was originally created by 10gen in October
2007 and went open source in 2009. Since then, MongoDB has been widely used by several top
websites and services as their back end component, this include “Craigslist, eBay, Foursquare,
SourceForge, and the New York Times.”(MongoDB) It is an agile database that can change its
schemas as the application evolves, while keeping the basic functionalities from the traditional
155
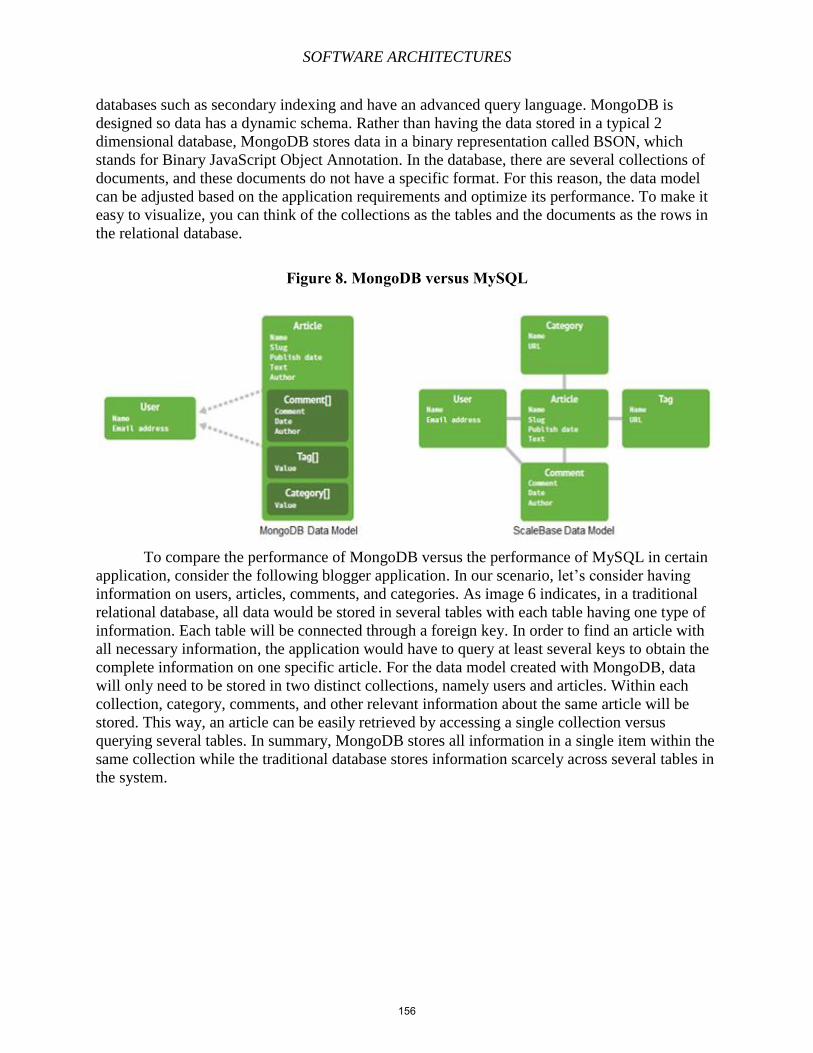
SOFTWARE ARCHITECTURES
databases such as secondary indexing and have an advanced query language. MongoDB is
designed so data has a dynamic schema. Rather than having the data stored in a typical 2
dimensional database, MongoDB stores data in a binary representation called BSON, which
stands for Binary JavaScript Object Annotation. In the database, there are several collections of
documents, and these documents do not have a specific format. For this reason, the data model
can be adjusted based on the application requirements and optimize its performance. To make it
easy to visualize, you can think of the collections as the tables and the documents as the rows in
the relational database.
Figure 8. MongoDB versus MySQL
To compare the performance of MongoDB versus the performance of MySQL in certain
application, consider the following blogger application. In our scenario, let’s consider having
information on users, articles, comments, and categories. As image 6 indicates, in a traditional
relational database, all data would be stored in several tables with each table having one type of
information. Each table will be connected through a foreign key. In order to find an article with
all necessary information, the application would have to query at least several keys to obtain the
complete information on one specific article. For the data model created with MongoDB, data
will only need to be stored in two distinct collections, namely users and articles. Within each
collection, category, comments, and other relevant information about the same article will be
stored. This way, an article can be easily retrieved by accessing a single collection versus
querying several tables. In summary, MongoDB stores all information in a single item within the
same collection while the traditional database stores information scarcely across several tables in
the system.
156
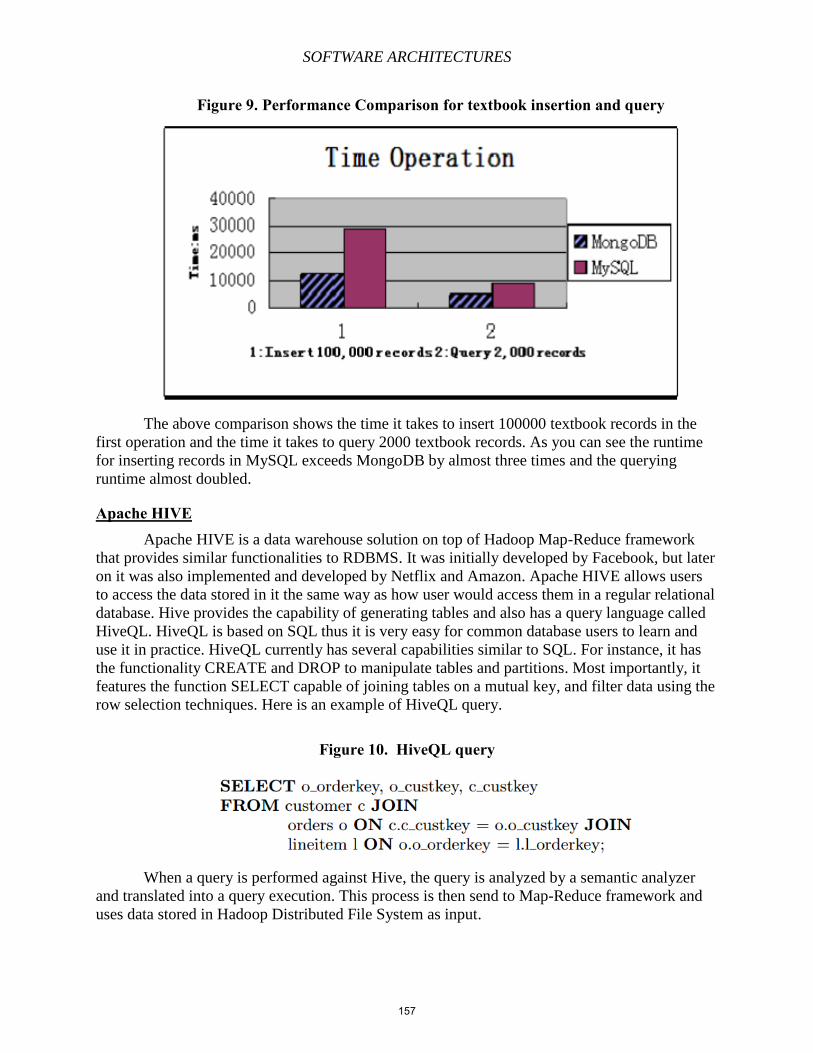
SOFTWARE ARCHITECTURES
Figure 9. Performance Comparison for textbook insertion and query
The above comparison shows the time it takes to insert 100000 textbook records in the
first operation and the time it takes to query 2000 textbook records. As you can see the runtime
for inserting records in MySQL exceeds MongoDB by almost three times and the querying
runtime almost doubled.
Apache HIVE Apache HIVE is a data warehouse solution on top of Hadoop Map-Reduce framework
that provides similar functionalities to RDBMS. It was initially developed by Facebook, but later
on it was also implemented and developed by Netflix and Amazon. Apache HIVE allows users
to access the data stored in it the same way as how user would access them in a regular relational
database. Hive provides the capability of generating tables and also has a query language called
HiveQL. HiveQL is based on SQL thus it is very easy for common database users to learn and
use it in practice. HiveQL currently has several capabilities similar to SQL. For instance, it has
the functionality CREATE and DROP to manipulate tables and partitions. Most importantly, it
features the function SELECT capable of joining tables on a mutual key, and filter data using the
row selection techniques. Here is an example of HiveQL query.
Figure 10. HiveQL query
When a query is performed against Hive, the query is analyzed by a semantic analyzer
and translated into a query execution. This process is then send to Map-Reduce framework and
uses data stored in Hadoop Distributed File System as input.
157
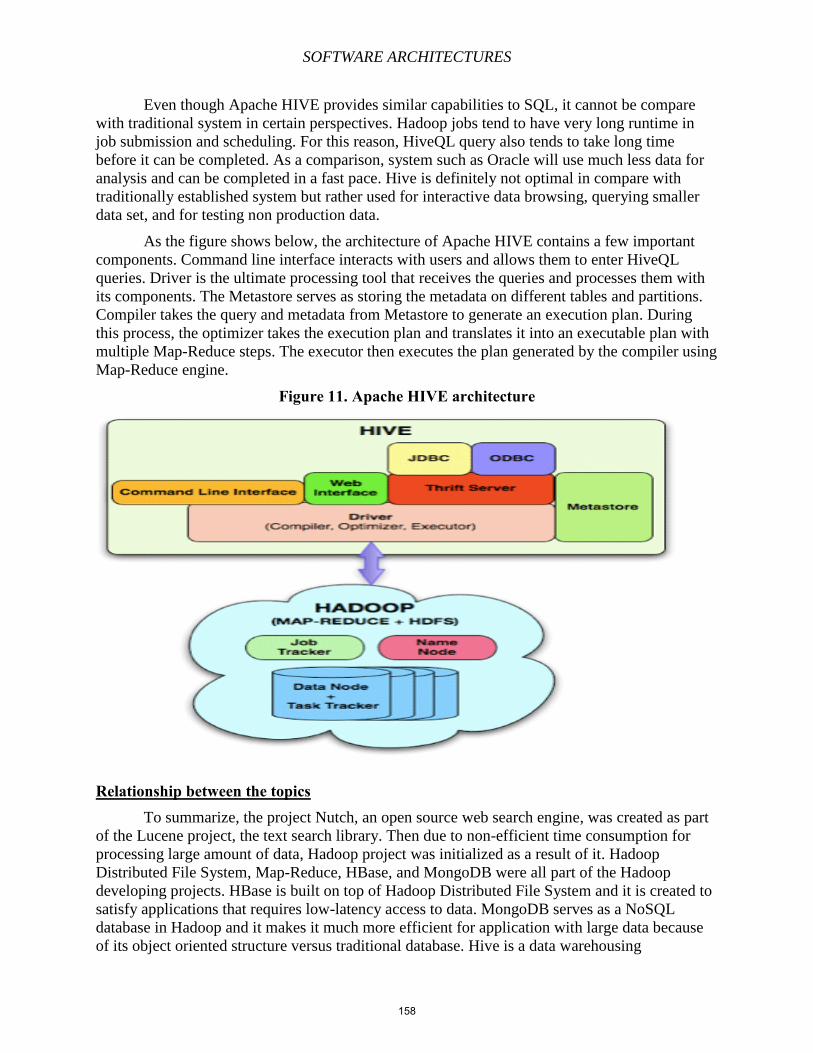
SOFTWARE ARCHITECTURES
Even though Apache HIVE provides similar capabilities to SQL, it cannot be compare
with traditional system in certain perspectives. Hadoop jobs tend to have very long runtime in
job submission and scheduling. For this reason, HiveQL query also tends to take long time
before it can be completed. As a comparison, system such as Oracle will use much less data for
analysis and can be completed in a fast pace. Hive is definitely not optimal in compare with
traditionally established system but rather used for interactive data browsing, querying smaller
data set, and for testing non production data.
As the figure shows below, the architecture of Apache HIVE contains a few important
components. Command line interface interacts with users and allows them to enter HiveQL
queries. Driver is the ultimate processing tool that receives the queries and processes them with
its components. The Metastore serves as storing the metadata on different tables and partitions.
Compiler takes the query and metadata from Metastore to generate an execution plan. During
this process, the optimizer takes the execution plan and translates it into an executable plan with
multiple Map-Reduce steps. The executor then executes the plan generated by the compiler using
Map-Reduce engine.
Figure 11. Apache HIVE architecture
Relationship between the topics To summarize, the project Nutch, an open source web search engine, was created as part
of the Lucene project, the text search library. Then due to non-efficient time consumption for
processing large amount of data, Hadoop project was initialized as a result of it. Hadoop
Distributed File System, Map-Reduce, HBase, and MongoDB were all part of the Hadoop
developing projects. HBase is built on top of Hadoop Distributed File System and it is created to
satisfy applications that requires low-latency access to data. MongoDB serves as a NoSQL
database in Hadoop and it makes it much more efficient for application with large data because
of its object oriented structure versus traditional database. Hive is a data warehousing
158
SOFTWARE ARCHITECTURES
architecture on top of Hadoop Map-Reduce framework for users to be capable of handling data
the same way users would access a traditional relational database management system. Hadoop
Distributed File System is the centralized file processing architecture and it is used by Hive to
store the data. Hive uses Map-Reduce engine to execute the logical plan of the HiveQL query
and retrieve data from HDFS.
References [1] Tom Whites, Hadoop The Definitive Guide, O’Reilly Media, 1005 Gravenstein Highway
North, Sebastopol, CA 95472, 2011
[2] Jeffrey Dean, Sanjay Ghemawat, “MapReduce: Simplified Data Processing on Large
Clusters,” Communications of the ACM, New York, NY, USA, January 2008, Pages 107-
113.
[3] An overview of the Hadoop/MapReduce/HBase framework and its current applications in
bioinformatics, http://www.biomedcentral.com/content/pdf/1471-2105-11-S12-S1.pdf,
accessed: 04/21/2014
[4] What Is Apache Hadoop?, http://hadoop.apache.org/, accessed: 04/26/2014
[5] Zhu Wei-ping, “Using MongoDB to implement textbook management system instead of
MySQL”, Communication Software and Networks (ICCSN), 2011 IEEE 3rd International
Conference. Page 303 – 305.
[6] MongoDB, http://en.wikipedia.org/wiki/MongoDB, accessed: 04/27/2014
Picture sources - (Other pictures are from the references documents))
http://yoyoclouds.wordpress.com/tag/hdfs/
http://xiaochongzhang.me/blog/?p=334
http://mmcg.z52.ru/drupal/node/3
http://www-01.ibm.com/software/ebusiness/jstart/hadoop/
http://xiaochongzhang.me/blog/?p=338
http://www.scalebase.com/extreme-scalability-with-mongodb-and-mysql-part-2-data-
distribution-reads-writes-and-data-redistribution/
http://practicalanalytics.wordpress.com/2011/11/06/explaining-hadoop-to-management-
whats-the-big-data-deal/
http://home.in.tum.de/~gruenhei/Agruenheid_ideas11.pdf
http://www.cubrid.org/blog/dev-platform/platforms-for-big-data/
159
SOFTWARE ARCHITECTURES
Chapter 12 –Business Rules and DROOLS Katanosh Morovat
Introduction In the recent decade, the information systems community declares a new concept which is called
business rules. This new concept is a formal approach for identifying the rules that encapsulate
the structure, constraint, and control the operation as a one package. Before advent of this
definition, system analysts have been able to describe the structure of the data and functions that
manipulate these data, and almost always the constraints would be neglected.
Business rules are statements that precisely describe, constrain, and control the structure,
operations and strategies of a business in an organization. Other terms which come with business
rules, are business rules engine, and business rules management system. Business rules engine
which is a component of business rules management system is a software system that executes a
set of business rules. Business rules management system monitors and maintains the variety and
complexity of decision logic that is used by operational systems within an organization or
enterprise. This logic is referred to as business rules. One of more widely used business rules
management system is Drools, more correctly known as a production rules system. Drools use an
enhanced implementation of the Rete algorithm. Drools support the JSR-94 standard for its
business rules engine and enterprise framework for the construction, maintenance, and
enforcement of business policies in an organization, application, or service.
This paper describes the nature of business rules, business rules engine, and business rules
management system. It also prepares some information about the Drools, included several
projects, which is a software system prepared by JBoss Community, and different productions
made by Logitech which have used the business rules method.
Business rules Definition – A business rule is a statement that defines or constrains some aspect of business
and always resolves to true or false. Business rules declare business structure or behavior of the
business. Business rules describe the operations, definitions and constraints that exist in an
organization [1]. Business rules include policies, requirements, and conditional statements that
are used to determine the tactical actions that take place in applications and systems [5]. Business
rules are classified into two groups: Static and Dynamic. Static business rules are constraints or
derivations that apply to each individual state of the business. Dynamic business rules are
concerned to a request of actions in response to events [9].
While business rules show an organization the detail of operations, strategy shows the methods
to focus the business at a high level to optimize results. In other words, a strategy provides high-
level direction about what an organization should do; business rules translate strategy to action
by defining several rules. These rules can be used to help the organization to achieve its goals,
remove limitations to market development, reduce costly fees, and comply with necessary
requirements [1].
For example, a business rule could show the computation of taxes for each employee’s wages.
160
SOFTWARE ARCHITECTURES
The most important points for effective business rules are the ability to define the rules clearly
and make sure that the rules do not conflict.
Business rules must be a term or fact (like structural assertion), or a constraint (like action
assertion), or a derivation. They are atomic; it means that they cannot be broken further into
more detailed business rules. If broken apart any further, they might be loss of important
information about the business [3].
Business rules are an abstraction of the policies and habits of a business organization. We need a
methodology to develop the rules which are used by business process management systems. In
computer software development, this methodology is called business rules approach.
Business rules approach formalizes business rules in a language that is understandable. Business
rules define comprehensible statements about business actions and using the information used to
decide an action; this formal definition becomes information for processing and running rules
engines [2].
Advantages Compare to the traditional methods, business rules approach has the following major advantages
[6]:
Decrease the cost of modification of business logic
Decrease the development time
Make some changes more faster and easier with less risk
Share the rules among multiple applications
Requirements can be easily translated into rules
Each rule describes a small portion of the business logic and is not part of a large
program
Rules are more understandable by non-technical staff, due to the use of flows, decision
tables, and specific languages
Business rules add another layer to systems that automate business processes. This new added
layer helps to improve the productivity in the workplace. It also enhances business agility and
increases the manageability of business processes by easily accessing the rules.
In traditional systems, if we need to make some changes in business logic located inside of an
automated business process, not only it often takes considerable time, but also it tends to create
errors. Furthermore, since the life cycle of business models has greatly shortened, ability to adapt
to changes in external environment can be worthy. These needs can be answered by business
rules [2].
Moreover, in any IT application, compared to the application code, the rate of the changing of
business rules is very high. Since business rules engines serve as pluggable software components
which execute business rules, a business rules approach can act as an independent component
which is out of application code (externalization) and has been attached to the application code.
Due to this externalization of business rules, business users are able to modify the rules
frequently without the need for IT intervention. Hence, the system becomes more adaptable with
business rules that change dynamically [1].
161
SOFTWARE ARCHITECTURES
Gathering Business Rules Gathering business rules for any organizations must be done in one of the following two ways:
Organizations can proactively describe its business practices and produce a database of
rules. Although this activity may be beneficial, it may be expensive and time consuming.
Using this method, organizations should hire someone, who has detailed information
about the business, to collect and document various standards and methods of the
business rules [1].
Organizations can discover and document business rules informally during the first steps
of a project. This business rules gathering is vulnerable to the creation of inconsistent or
conflicting business rules between different organizational units, or even within an
organizational unit over time. Consequently, this method may create problems that can be
difficult to find and solve. If the rules are not collected correctly and if they do not cover
the entire business logic, they are not valuable. On the other hand, this method is less
costly and easier to perform than the first method [1].
One of the best ways to collect and document business rules is defining a methodology which is
called business rules methodology. This methodology defines the process of capturing business
rules in a natural language. That is verifiable and understandable way. This process can be
performed in real-time. Collecting business rules is also called rules harvesting or business rule
mining. Software technologies are designed to extract business rules through the analysis of
legacy source code.
Categorizing of Business Rules A statement of a business rule falls into one of four categories:
Definitions of business terms: The language for expressing the rules is the most basic
element of a business rule. The definition of a term is a business rule that shows how
people describe the business. As a result, definitions of terms create a category of
business rule. Generally terms have been documented in a Glossary or as entities in a
conceptual model or entity-relationship model [3].
Facts: The behavior of an organization can be described using the facts that relate terms
to each other. For instance, to say that a customer can place an order is a business rule.
Facts can be documented as natural language sentences, by using a graphical model, and
facts can be shown relationships, attributes, and generalization structures [3].
Constraints ( as ‘action assertions’): Constraints describe conditions or limitations in
behavior. For example, what data may or may not be updated, or prevent an action to
taking place [3].
Derivations: Derivation refers to how knowledge in one form may be transformed into
other knowledge, probably in a different form [3].
Obstacles Business rules are collected in the following situations:
When dictated by law
During business analyses
As short-lived aid to engineers
162
SOFTWARE ARCHITECTURES
The first obstacle of using business rules management system is the cost and effort that is
necessary to maintain the set of rules. This set of rules is caused by having an inconsistent
approach. If the rules have been rapidly changed, the cost of maintenance will be increased. The
next common obstacle is resistance from employees who understand that their knowledge of
business rules is the key to their employment [1].
Knowledge Engineering of Business Rules Generally, due to several communication problems and misinterpretation, it is a long iterative
process to model the application domain and then to develop the business rules in organization.
Business rules are formal and understandable for customer who generally has limited knowledge
of system development. Hence defining an integrated development environment that supports
domain specific language (DSL), and visualization is vital. DSL could be helpful for declarative
knowledge engineering [15].
Business rules in connection with domain specific language play a role like a bridge between the
customer and the developer. Based on the declarative specification, a business analyst makes a
communication between business rules and domain specific languages. In domain specific
language, the developer can implement the business rules and the customer can understand this
formalization which is executable. So during the development phase, the developer and the
customer can discuss about DSL specification. Prolog is a language which is evaluated in
bottom-up manner, and is appropriate to develop a domain specific language iteratively. Since
business rules usually have to be evaluated in bottom-up, forward chaining manner, using prolog
might be useful [15]. Domain Specific Language Recently domain specific language have become popular in knowledge engineering for business
rules. Unlike general-purpose programming language such as Java and C, a DSL is a
specification language for a special problem domain. DSLs are remarkably used in business
process modeling, and help business analyst to develop a formal specification of the business
rules based on DSLs. Consequently this formal specification can be corrected and refined by the
developers. It can be executable and it might be implemented later in another programming
language.
One of the negative point of using DSL is that it is really difficult in practical project. It adds an
additional effort at the beginning of the software project. If DSL is not developed carefully
enough, the project will be failed [15].
Business Rules Engine Definition – A Business rules engine is a software system that executes a set of business rules.
The rules may come from several sources such as legal regulation (for example, a table for the
calculation of taxes), company policies (for example, all employees who work more than 200
hours in month are eligible to receive a bonus). A business rules system defines these company
policies and other operational decisions, then tests, executes and maintains these definitions
separately from the application code.
Business rules engines typically support rules, facts, priorities, mutual exclusions, preconditions,
and other functions [1].
163
SOFTWARE ARCHITECTURES
Business rules engine software is generally provided as a component of a business rules
management system which provides the ability to register, define, classify, and manage all the
rules, verify consistency of rules definitions, define the relationships between different rules, and
relate some of these rules to application codes that are affected by, or will enforce one or more of
the rules [1]. Based on the context or behavior of the system we need to make a decision about
using business rules engine or not.
The following conditions show how defining rules engine is helpful [6].
The logic is too complex to be dealt with using the simple condition statement in the code
The solution might be dependent upon frequent changes
The solution would comprise of too many nested condition statements
The hardcode version would be unmaintainable
The following conditions tell us when using rules engines are not an appropriate solution [6].
The logic behind the rules is simple
Using a series of simple conditional statements inside the rule files is vital
Regardless of the problem's complexity, if it is not under frequent changes or does not
change at all
The problem can be divided in to a small set of conditions and actions
Types of Business Rules Engines Rules engines as a whole might be executed in two different methods such as:
Forward chaining: This method typically starts with the available data and uses rules to
extract more data until a goal is reached. A business rules engine, using forward chaining,
searches the rules until it finds one where the antecedent rule (like “If” clause) is known
to be true. When such a rule is found, the engine can conclude the consequent (like
“Then” clause). Business rules engines will iterate through this process until a goal is
reached [4].
Backward chaining: This method typically starts with a list of goals or a hypothesis and
works backwards from the consequent to the antecedent to search for available data that
will support any of these consequents. In this case, a rules engine seeks to resolve the
facts that fit a particular goal. A business rules engine using backward chaining would
search the rules until it finds one which has a consequent (like “Then” clause) that
matches a desired goal. It is often called goal driven because it tries to determine if
something exists based on existing information [4].
Based on how rules are scheduled for execution, a number of different types of rules engines can
be distinguished as follows:
Production/Inference rules: These types of rules are used to represent behaviors of the
type IF condition THEN action [1]. For example, this rule could answer the question:
"Should this employee be allowed to receive the mortgage?" This rule for this question
would be executed in the form of: "IF some-condition THEN allow-employee-a-
mortgage".
Reaction/Event Condition Action rules: These types of rules detect and react to incoming
events and process event patterns [1]. For example, a reactive rule engine could be used
164
SOFTWARE ARCHITECTURES
to alert a manager that an employee works in the office generally less than 8 hours almost
every day.
Deterministic rules: These types of rules do not always behave like forward chaining and
backward chaining, but instead they use domain-specific language-approaches to describe
policies [1]. Domain-specific language is a type of languages which defines its own
representation of rules, requirement of translation to generic rules engines or its own
custom engines [5]. This approach is often easier to implement and maintain, and
provides better performance.
Business Rules Management System Definition – A business rules management system (BRMS) is a software system that is used to
define, deploy, execute, monitor and maintain the variety and complexity of business rules that
are used by operational systems within an organization [5]. For example, Drools is a business
rule management system that uses both forward chaining and backward chaining as an inference-
based rules engine.
A BRMS includes, at minimum
A repository, which is a storing decision logic to be externalized from application code
Tools, which are using by both technical developer and business experts to define and
manage business rules
A runtime environment, which is an applications, by using business rules engines, can
execute and manage business rules within the BRMS
Advantages The positive points of a BRMS are as follows [5]:
Separate business logic management teams from software development team
Reduce dependence on IT departments for changes in live systems
Increase control over business rules implementation
Express business rules with increased precision, by using a business vocabulary syntax,
and clarify the business policies using graphical presentation
Improve the efficiency of processes by increasing of decision automation
Disadvantages Some disadvantages of the BRMS are as follows [5]:
Comprehensive subjective matters expertise is required for specific products. On the
other hands, technical developers must know how to write rules and integrate software
with existing systems
Due to rule harvesting, integration with existing systems, security constraints, rule
migration and rule edit tracking, development cycle might be long.
165
SOFTWARE ARCHITECTURES
DROOLS Definition - Drools is a rules engine implementation based on Charles Forgy’s Rete algorithm
tailored for the Java language. Rete algorithm has been adapted to an object-oriented interface
and empowered to accept more natural expression of business rules with regards to business
objects. Drools is written in Java, but able to run on Java and .Net [7]. Drools is designed to
accept pluggable language implementations. Rules can be written in Java, and Python. Drools
provides Declarative Programming and is flexible enough to match the semantics of all problem
domains with Domain Specific Languages (DSL) via XML using a schema defined for the
problem domain. DSLs consist of XML elements and attributes that represent the problem
domain [7]. Drools introduces the Business Logic integration Platform which provides a unified
and integrated platform for Rules, Workflow and Event Processing [8]. This framework provides
generic method for functional and non-functional solutions. Drools consists of several projects,
such as follow:
Drools Guvnor (business rules manager)
Drools Expert (rules engine)
Drools Flow (process/workflow)
Drools Fusion (event processing/temporal reasoning)
Drools Planner(automated planning)
Drools Guvnor Drools Guvnor is a business rules manager. By using user friendly interfaces, a business rules
manager allows managing and changing rules in a multi-user environment.
Guvnor is a web and network components. The business rules manager is a combination of core
drools and other tools [10]
Guvnor can be used in the following situations:
Manage versions or deployment of rules
Multiple users of different skill levels access and edit rules
Lack of infrastructure to manage rules
Exist lots of business rules
Guvnor can be used individually or by using an IDE tools (often both together). Guvnor can be
"branded" and made part of the application, or it can be a central rule repository.
Guvnor cannot be used in the following situations [10]:
Applications have the rules in a database
Rules management system and user interface are already exist both together
Rules are used to solve complex algorithmic problems
Rules are essentially an integral part of the application
Guvnor Features Include the multiple types of rules editors (GUI, text) as follows:
Guided Rule Editor
166
SOFTWARE ARCHITECTURES
Rule Templates
Decision Tables
Store multiple rule "assets" together as a package
Support the domain specific language
Support the complex event processing
Provide the version control (historical assets)
Provide tools for testing the rules
Make validation and verification of the rules
Categorize the rules
Build and deploy of its assets including:
o Assembly of assets into a binary package
o Assembly of a self-contained camel-server
Drools Flow Drools Flow provides workflow for the Drools platform. A workflow or business process shows
the order of execution of several steps. Describing a complex composition of different tasks is
being easier by using flow chart. Moreover, processes are useful in describing state-based, long-
running processes. Using these processes, Drools Flow empowers end users to specify, execute
and monitor their business logic. Drools Flow is able to easily insert into any Java application or
can run standalone in a server environment [13].
Drools Flow is a community project and an official workflow product at JBoss. The two
traditional approaches such as process-oriented and rule-oriented make some confusion for users.
It brings some ambiguity about which tool users should be using to model which bits. Drools is a
move away from a rule-centric or process-centric attitude to a more behavior modeling approach
with a lot more flexibility for users to model their problems how they want. Hence using Drools
knowledge-oriented platform, Drools Flow provides advanced integration between processes and
rules. Drools Flow is designed based on rules, independent process, and events which are
integrated into the one engine as a framework with pluggable execution behavior [13].
Drools Expert Drools Expert is a declarative, rule based, coding environment. This allows users to focus on
"what it is they want to do", and not the "how to do this".
To understand the concept of rule based systems and how they work, it might be a good start
from defining the Artificial Intelligence concept. Artificial Intelligence is one of a branch of
computer science that develops machines and software by intelligence. Computer vision, neural
networks, machine learning, knowledge representation and reasoning (KRR), and expert system
are branches of AI. Knowledge representation and reasoning (KRR), and expert system have
made their way into commercial systems. For example, expert systems is used in the business
rules management systems (BRMS) [11].
Knowledge representation is about how we represent our knowledge in symbolic form, i.e. how
we describe something. Reasoning is about how we go about the act of thinking using this
knowledge.
167
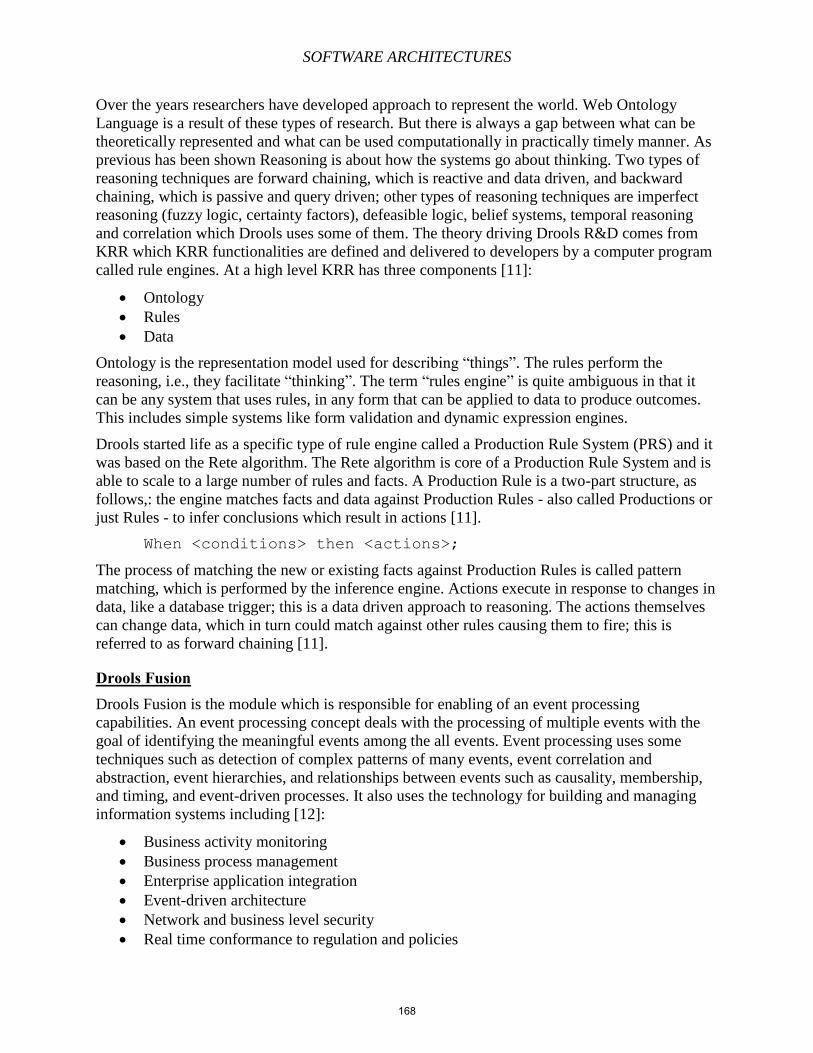
SOFTWARE ARCHITECTURES
Over the years researchers have developed approach to represent the world. Web Ontology
Language is a result of these types of research. But there is always a gap between what can be
theoretically represented and what can be used computationally in practically timely manner. As
previous has been shown Reasoning is about how the systems go about thinking. Two types of
reasoning techniques are forward chaining, which is reactive and data driven, and backward
chaining, which is passive and query driven; other types of reasoning techniques are imperfect
reasoning (fuzzy logic, certainty factors), defeasible logic, belief systems, temporal reasoning
and correlation which Drools uses some of them. The theory driving Drools R&D comes from
KRR which KRR functionalities are defined and delivered to developers by a computer program
called rule engines. At a high level KRR has three components [11]:
Ontology
Rules
Data
Ontology is the representation model used for describing “things”. The rules perform the
reasoning, i.e., they facilitate “thinking”. The term “rules engine” is quite ambiguous in that it
can be any system that uses rules, in any form that can be applied to data to produce outcomes.
This includes simple systems like form validation and dynamic expression engines.
Drools started life as a specific type of rule engine called a Production Rule System (PRS) and it
was based on the Rete algorithm. The Rete algorithm is core of a Production Rule System and is
able to scale to a large number of rules and facts. A Production Rule is a two-part structure, as
follows,: the engine matches facts and data against Production Rules - also called Productions or
just Rules - to infer conclusions which result in actions [11].
When <conditions> then <actions>;
The process of matching the new or existing facts against Production Rules is called pattern
matching, which is performed by the inference engine. Actions execute in response to changes in
data, like a database trigger; this is a data driven approach to reasoning. The actions themselves
can change data, which in turn could match against other rules causing them to fire; this is
referred to as forward chaining [11].
Drools Fusion Drools Fusion is the module which is responsible for enabling of an event processing
capabilities. An event processing concept deals with the processing of multiple events with the
goal of identifying the meaningful events among the all events. Event processing uses some
techniques such as detection of complex patterns of many events, event correlation and
abstraction, event hierarchies, and relationships between events such as causality, membership,
and timing, and event-driven processes. It also uses the technology for building and managing
information systems including [12]:
Business activity monitoring
Business process management
Enterprise application integration
Event-driven architecture
Network and business level security
Real time conformance to regulation and policies
168
SOFTWARE ARCHITECTURES
Drools Fusion is a unified behavioral modeling platform which can be achieved by getting
together three modeling such as Rules, or Processes, or Events modeling as their main modeling
concept. In this regards a platform must understand all of these concepts as primary concepts and
allow them to leverage on each other strengths. Some features of Drools Fusion, as follows, are
[12]:
Events as first class citizens
Support asynchronous multi-thread streams
Support for temporal reasoning
Support events garbage collection
Support reasoning over absence of events
Support of sliding Windows
Drools Fusion has two goals. The first is to increase the capabilities of the Drools Expert module
with features like temporal reasoning that are useful when dealing with events, and regular facts.
The second allows Drools to enable modeling of event processing scenarios. Drools allows more
flexibility on modeling scenario that range from batch to real time processing. Scenarios that are
very frequent in business environments like [12]:
Algorithm Trading
Telecom Rating
Credit Approval
Insurance Pricing
Risk Management
Drools Planner Every organization faces several planning problems such as providing products or services with
a limited set of constrained resources (employees, assets, time and money). Drools Planner or
OptaPlanner is able to optimize a planning in order to do more business with less resource.
OptaPlanner is a lightweight, embeddable planning engine written in Java. It could be used to
solve constraint satisfaction problems efficiently [14].
Drools Planner solves use case, such as Agenda scheduling, Educational timetabling, Job shop
scheduling and so on. These use cases are probably NP-complete, this means:
It's easy to verify a given solution to a problem in reasonable time.
There might not find the optimal solution of a problem in reasonable time.
The suggestion of this planner is a tough task; and solving the problem is probably more difficult
than anticipation of it. Advanced optimization algorithms help the planner to find a good solution
for these types of problems in reasonable time by using limited recourses.
A planning problem has 2 levels of negative constraints in minimum [14]:
A hard constraint must not be broken. For example, one teacher can not teach two
different lessons at the same time.
A soft constraint should not be broken if it possible to be avoided. For example, teacher
X does not like to teach on Friday afternoon.
169
SOFTWARE ARCHITECTURES
Some problems have positive constraints as follows:
A soft constraint should be fulfilled if possible. For example, teacher Y likes to teach on
Monday morning.
Each solution of a planning problem can be graded with a score that is result of the constraints
definition. Score constraints are described by using an Object Orientated language, such as Java
code or Drools rules that is easy, flexible and scalable [14].
A planning problem has a variety of solutions. The following shows several categories of
solutions [14]:
A possible solution is a solution, no matter it breaks any number of constraints or not.
Planning problems could have an incredibly large number of possible solutions that
numerous of them are worthless.
A feasible solution is a solution that does not break into hard constraints. The number of
feasible solutions could be relative to the number of possible solutions that some of them
occasionally are no feasible solutions. Every feasible solution is a possible solution.
An optimal solution is a solution with the highest score. Planning problems could have
one or a few optimal solutions, but at least there is always one optimal solution, even in
the case that there are no feasible solutions and the optimal solution isn't feasible.
The best solution is the solution with having the highest score. This has been found by an
implementation in a certain amount of time. The best solution that is likely to be feasible
and, given enough time, it's an optimal solution.
Consequently, there are a huge number of possible solutions (if calculated correctly), even they
have a small dataset. Drools Planner supports several optimization algorithms to efficiently go
through that incredibly large number of possible solutions. Although depending on the use case,
some optimization algorithms perform better than others, it's impossible to tell in advance.
Changing the solver configuration in a several lines of code makes easily switch from one
optimization algorithm to the other optimization algorithm in a planner.
Conclusion Currently Business rules have been declared by Information Systems Community. Business rules
are statements that describe business process. They model business structure, and they can
control the behavior of process. Business rules might be appropriate to persons, processes,
business behavior, and computer systems in organizations. Business rules are careful,
unambiguous, and consistent approach for describing rules. Business rules engine is a software
system that is responsible to execute the set of rules, and business rules management system
monitors and maintains these set of rules.
Recently one of the most popular tool for business rules implementation is DOOLS that is an
expert system framework; it uses rules as knowledge representation. This framework provides
generic method for functional and non-functional solutions. Drools consists of several projects
that they are in charge of managing the business rules, defining rules engine, providing the
workflow, executing and controlling the event processing, and making automated planning.
References [1] http://en.wikipedia.org/wiki/Business_rule
170
SOFTWARE ARCHITECTURES
[2] http://en.wikipedia.org/wiki/Business_rules_engine
[3] David Hay, Allan Kolber, “GUIDE Business Rules Project,”, The Business Rules Group,
final report, revision 1.3, July 2000
[4] http://en.wikipedia.org/wiki/Forward_chaining
[5] http://en.wikipedia.org/wiki/Business_rule_management_system
[6] Marcin Grzejszczak, Mario Fusco, “Business Rules Management Systems with Drools,”,
http://www.jboss.org/drools/drools-expert.html
[7] http://legacy.drools.codehouse.org
[8] www.Jboss.org/drools
[9] Nasser Karimi, Junichi Iijima,”A Logical Approach for Implementing Dynamic Business
Rules,”, Contemporary Management Research, Pages 29-52, Vol. 6, No. 1, March 2010
[10] JBoss Drools team, “Guvnor User Guide, For users and administrators of Guvnor,”,
Version 5.5.0.Final, http://www.jboss.org/drools/team.html
[11] JBoss Drools team, “Drools Expert User Guide,”, Version 5.5.0.Final,
http://www.jboss.org/drools/team.html
[12] JBoss Drools team, “Drools Fusion User Guide,”, Version 5.5.0.Final,
http://www.jboss.org/drools/team.html
[13] www.jboss.org/drools/documentations/flow
[14] JBoss Drools team, “Drools Planner User Guide,”, Version 5.5.0.Final,
http://www.jboss.org/drools/team.html
[15] Ludwig Ostermayer, Dietmar Seipel, “Knowledge Engineering for Business Rules in
PROLOG,”, University of Würzburg, Department of Computer Science, Würzburg,
Germany
171
SOFTWARE ARCHITECTURES
Chapter 13 – Complex Event Processing
Matt McClelland
1.0 – Summary
1.1 - Introduction In today’s world, business enterprises are quickly becoming more and more complex.
Different processes take place all over the world and events are flying through the enterprise IT
systems. These systems have grown from standalone applications that were able to handle a
certain aspect within an enterprise to an enterprise wide IT system that provides a coupling
between the different IT applications.
These enterprise wide IT systems are widespread across large enterprises and generate
many events that flow through each of the enterprise system layers. These events then feed other
applications and/or services which in turn generate new events. Most events that occur in a
business enterprise system are simple events that can easily be traced and monitored, but the
more complex events - which usually consist of multiple, unrelated simple events - are hard to
keep track off. Thus, to tackle this issue and make complex events more meaningful, a new type
of event processing is introduced: complex event processing.
1.2 – Complex Event Processing
Complex Event Processing (CEP) is primarily an event processing concept that deals
with the task of combining data from multiple sources to infer events or patterns that suggest
more complicated circumstances. The goal of Complex Event Processing is to identify
meaningful events (such as opportunities or threats) and respond to them as quickly as possible.
CEP employs techniques such as detection of complex patterns of many events, event correlation
and abstraction, event hierarchies, and relationships between events such as causality,
membership, and timing, and event-driven processes [2].
The thought behind Complex Event Processing is based on the observation that in many
cases actions are triggered not by a single event, but by a complex arrangement of events,
happening at different times, and within different contexts. It is primarily used to predict high-
level events likely to result from specific sets of low-level factors and is also used to identify and
analyze cause-and-effect relationships among events in real time, allowing personnel to
proactively take effective actions in response to specific scenarios [1].
2.0 – Use Cases/Purposes: As you may already know, Complex Event Processing is quickly becoming one of the most
popular emerging technologies in the IT world and is more and more frequently being used by
various businesses for building and maintaining complex information systems such as the following:
Business Activity Monitoring (BAM)
Business Process Management (BPM)
Enterprise Application Integration (EAI)
Event-Driven Architectures (EDA)
172
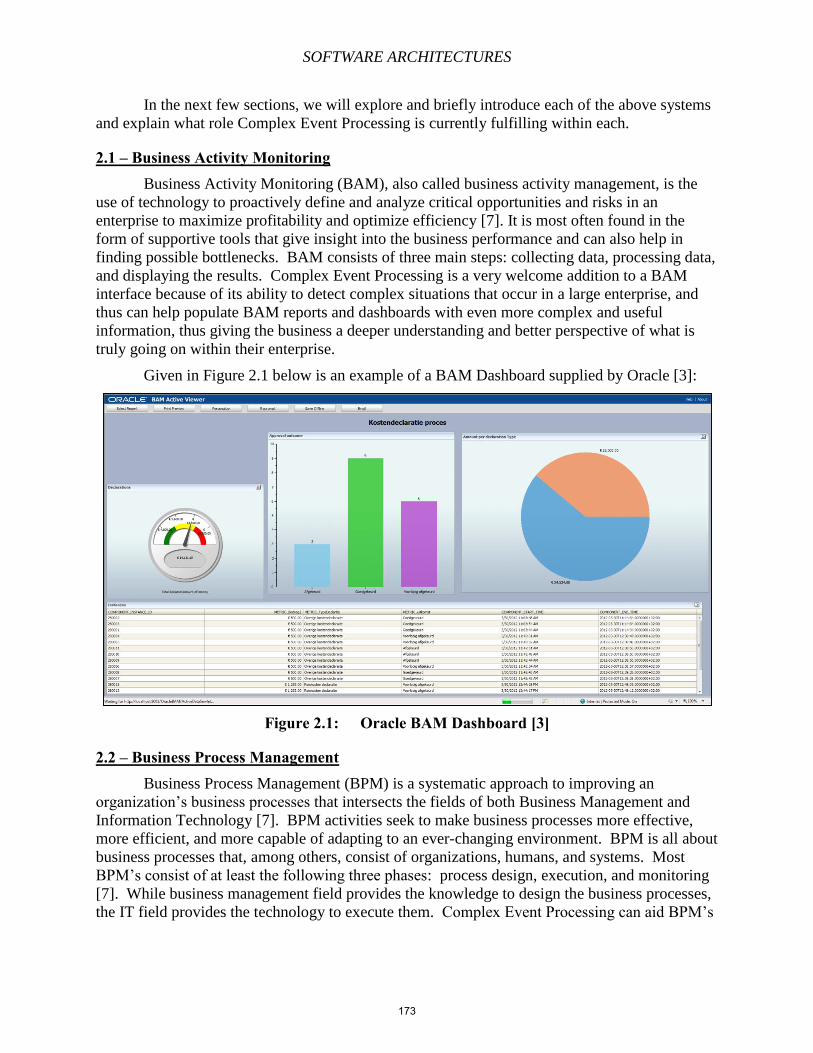
SOFTWARE ARCHITECTURES
In the next few sections, we will explore and briefly introduce each of the above systems
and explain what role Complex Event Processing is currently fulfilling within each.
2.1 – Business Activity Monitoring Business Activity Monitoring (BAM), also called business activity management, is the
use of technology to proactively define and analyze critical opportunities and risks in an
enterprise to maximize profitability and optimize efficiency [7]. It is most often found in the
form of supportive tools that give insight into the business performance and can also help in
finding possible bottlenecks. BAM consists of three main steps: collecting data, processing data,
and displaying the results. Complex Event Processing is a very welcome addition to a BAM
interface because of its ability to detect complex situations that occur in a large enterprise, and
thus can help populate BAM reports and dashboards with even more complex and useful
information, thus giving the business a deeper understanding and better perspective of what is
truly going on within their enterprise.
Given in Figure 2.1 below is an example of a BAM Dashboard supplied by Oracle [3]:
Figure 2.1: Oracle BAM Dashboard [3]
2.2 – Business Process Management Business Process Management (BPM) is a systematic approach to improving an
organization’s business processes that intersects the fields of both Business Management and
Information Technology [7]. BPM activities seek to make business processes more effective,
more efficient, and more capable of adapting to an ever-changing environment. BPM is all about
business processes that, among others, consist of organizations, humans, and systems. Most
BPM’s consist of at least the following three phases: process design, execution, and monitoring
[7]. While business management field provides the knowledge to design the business processes,
the IT field provides the technology to execute them. Complex Event Processing can aid BPM’s
173
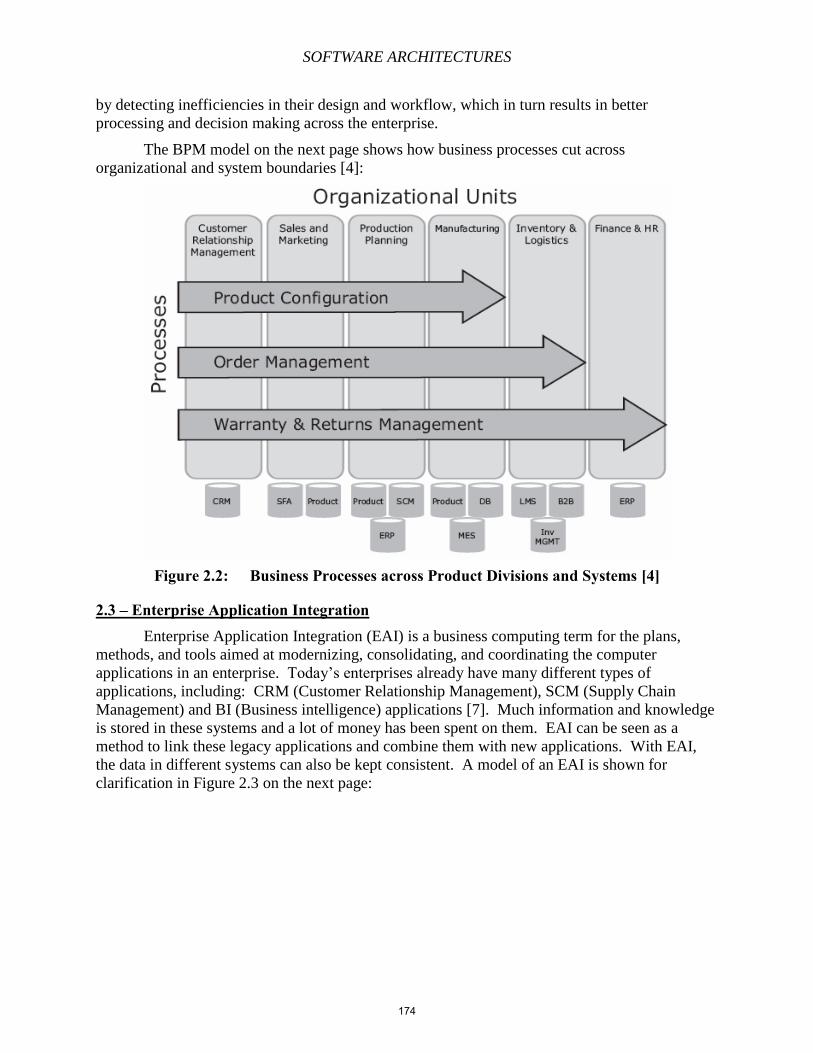
SOFTWARE ARCHITECTURES
by detecting inefficiencies in their design and workflow, which in turn results in better
processing and decision making across the enterprise.
The BPM model on the next page shows how business processes cut across
organizational and system boundaries [4]:
Figure 2.2: Business Processes across Product Divisions and Systems [4]
2.3 – Enterprise Application Integration Enterprise Application Integration (EAI) is a business computing term for the plans,
methods, and tools aimed at modernizing, consolidating, and coordinating the computer
applications in an enterprise. Today’s enterprises already have many different types of
applications, including: CRM (Customer Relationship Management), SCM (Supply Chain
Management) and BI (Business intelligence) applications [7]. Much information and knowledge
is stored in these systems and a lot of money has been spent on them. EAI can be seen as a
method to link these legacy applications and combine them with new applications. With EAI,
the data in different systems can also be kept consistent. A model of an EAI is shown for
clarification in Figure 2.3 on the next page:
174
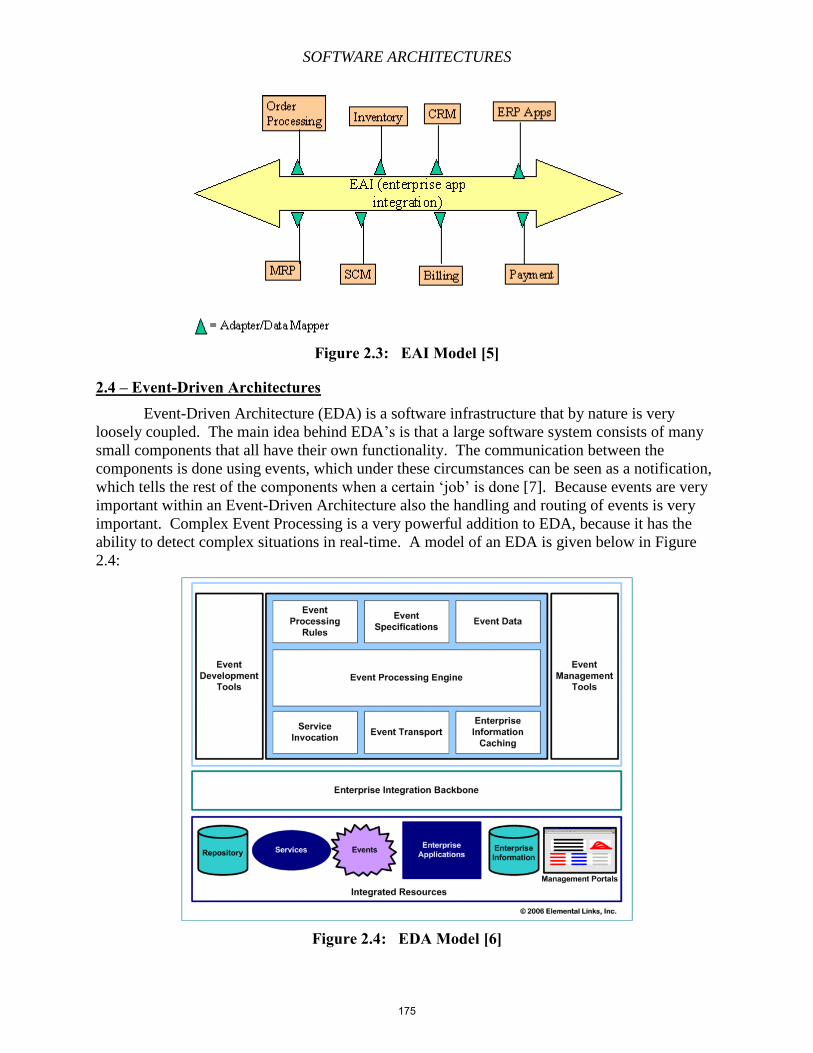
SOFTWARE ARCHITECTURES
Figure 2.3: EAI Model [5]
2.4 – Event-Driven Architectures Event-Driven Architecture (EDA) is a software infrastructure that by nature is very
loosely coupled. The main idea behind EDA’s is that a large software system consists of many
small components that all have their own functionality. The communication between the
components is done using events, which under these circumstances can be seen as a notification,
which tells the rest of the components when a certain ‘job’ is done [7]. Because events are very
important within an Event-Driven Architecture also the handling and routing of events is very
important. Complex Event Processing is a very powerful addition to EDA, because it has the
ability to detect complex situations in real-time. A model of an EDA is given below in Figure
2.4:
Figure 2.4: EDA Model [6]
175
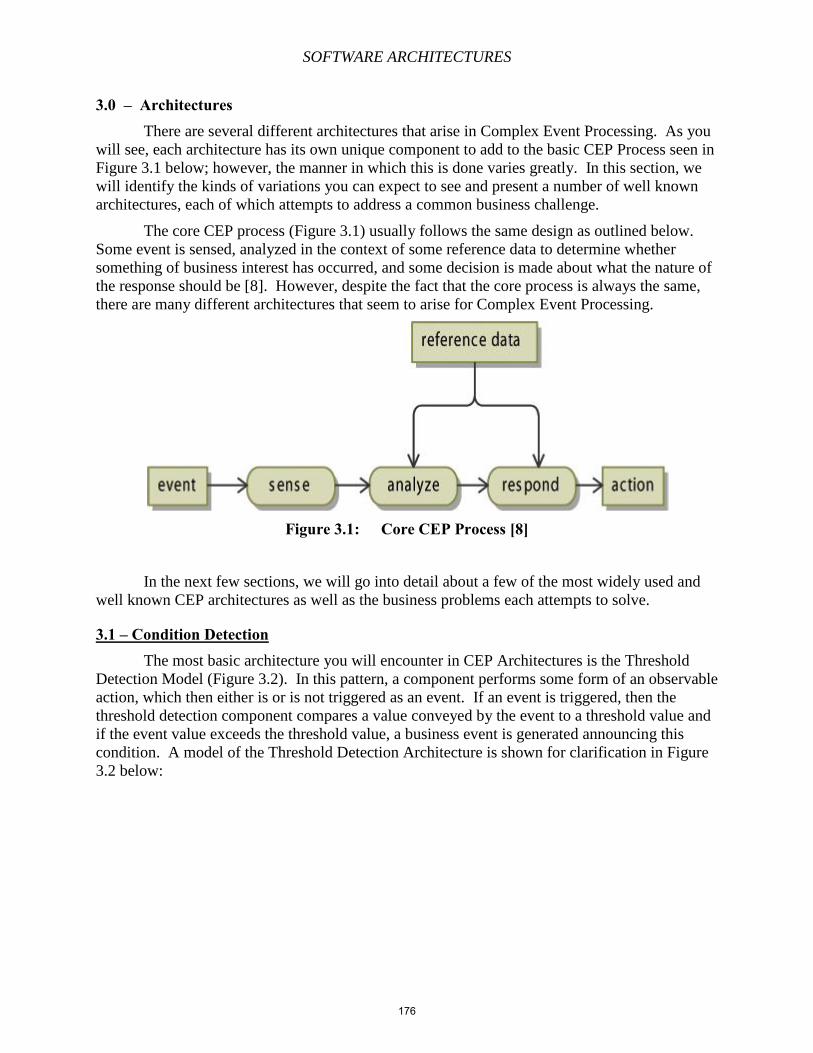
SOFTWARE ARCHITECTURES
3.0 – Architectures There are several different architectures that arise in Complex Event Processing. As you
will see, each architecture has its own unique component to add to the basic CEP Process seen in
Figure 3.1 below; however, the manner in which this is done varies greatly. In this section, we
will identify the kinds of variations you can expect to see and present a number of well known
architectures, each of which attempts to address a common business challenge.
The core CEP process (Figure 3.1) usually follows the same design as outlined below.
Some event is sensed, analyzed in the context of some reference data to determine whether
something of business interest has occurred, and some decision is made about what the nature of
the response should be [8]. However, despite the fact that the core process is always the same,
there are many different architectures that seem to arise for Complex Event Processing.
Figure 3.1: Core CEP Process [8]
In the next few sections, we will go into detail about a few of the most widely used and
well known CEP architectures as well as the business problems each attempts to solve.
3.1 – Condition Detection The most basic architecture you will encounter in CEP Architectures is the Threshold
Detection Model (Figure 3.2). In this pattern, a component performs some form of an observable
action, which then either is or is not triggered as an event. If an event is triggered, then the
threshold detection component compares a value conveyed by the event to a threshold value and
if the event value exceeds the threshold value, a business event is generated announcing this
condition. A model of the Threshold Detection Architecture is shown for clarification in Figure
3.2 below:
176
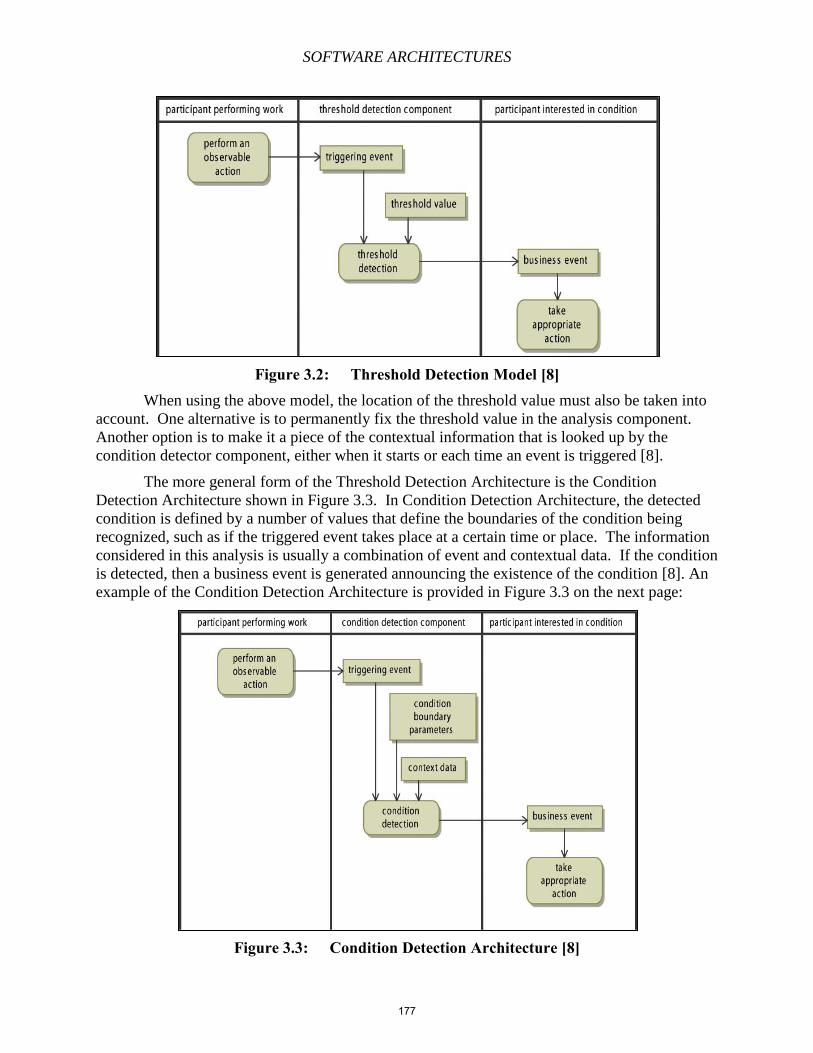
SOFTWARE ARCHITECTURES
Figure 3.2: Threshold Detection Model [8] When using the above model, the location of the threshold value must also be taken into
account. One alternative is to permanently fix the threshold value in the analysis component.
Another option is to make it a piece of the contextual information that is looked up by the
condition detector component, either when it starts or each time an event is triggered [8].
The more general form of the Threshold Detection Architecture is the Condition
Detection Architecture shown in Figure 3.3. In Condition Detection Architecture, the detected
condition is defined by a number of values that define the boundaries of the condition being
recognized, such as if the triggered event takes place at a certain time or place. The information
considered in this analysis is usually a combination of event and contextual data. If the condition
is detected, then a business event is generated announcing the existence of the condition [8]. An
example of the Condition Detection Architecture is provided in Figure 3.3 on the next page:
Figure 3.3: Condition Detection Architecture [8]
177
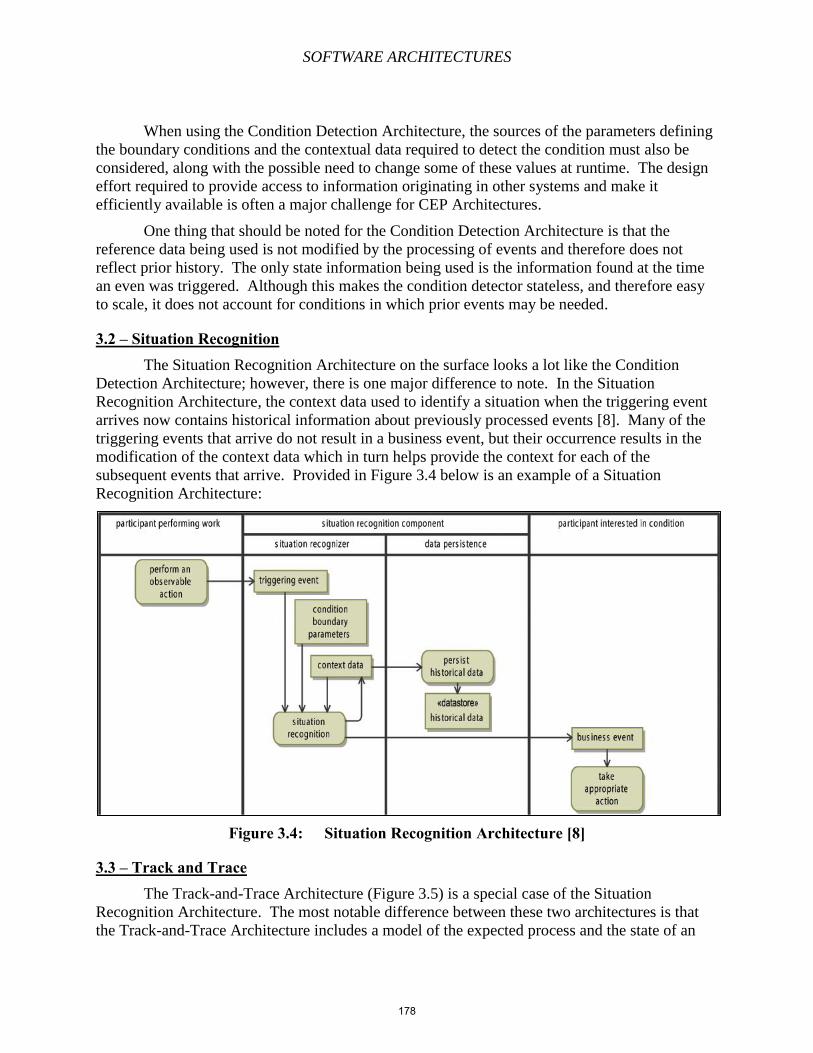
SOFTWARE ARCHITECTURES
When using the Condition Detection Architecture, the sources of the parameters defining
the boundary conditions and the contextual data required to detect the condition must also be
considered, along with the possible need to change some of these values at runtime. The design
effort required to provide access to information originating in other systems and make it
efficiently available is often a major challenge for CEP Architectures.
One thing that should be noted for the Condition Detection Architecture is that the
reference data being used is not modified by the processing of events and therefore does not
reflect prior history. The only state information being used is the information found at the time
an even was triggered. Although this makes the condition detector stateless, and therefore easy
to scale, it does not account for conditions in which prior events may be needed.
3.2 – Situation Recognition The Situation Recognition Architecture on the surface looks a lot like the Condition
Detection Architecture; however, there is one major difference to note. In the Situation
Recognition Architecture, the context data used to identify a situation when the triggering event
arrives now contains historical information about previously processed events [8]. Many of the
triggering events that arrive do not result in a business event, but their occurrence results in the
modification of the context data which in turn helps provide the context for each of the
subsequent events that arrive. Provided in Figure 3.4 below is an example of a Situation
Recognition Architecture:
Figure 3.4: Situation Recognition Architecture [8]
3.3 – Track and Trace The Track-and-Trace Architecture (Figure 3.5) is a special case of the Situation
Recognition Architecture. The most notable difference between these two architectures is that
the Track-and-Trace Architecture includes a model of the expected process and the state of an
178
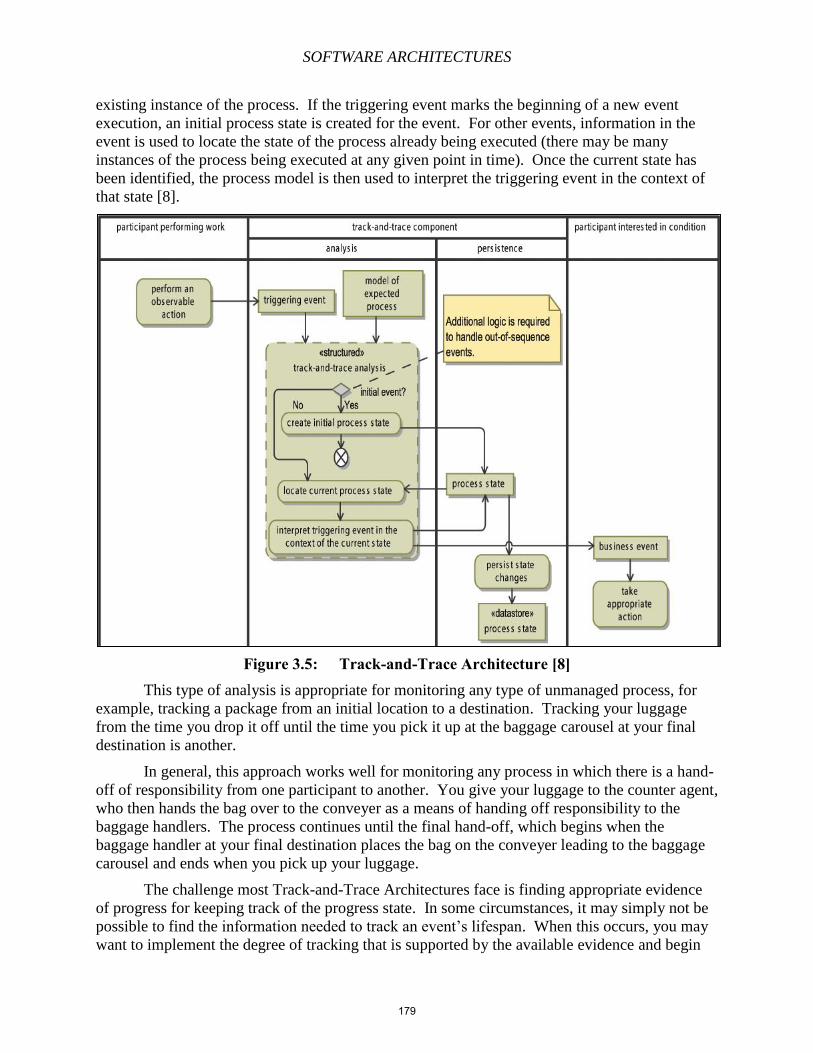
SOFTWARE ARCHITECTURES
existing instance of the process. If the triggering event marks the beginning of a new event
execution, an initial process state is created for the event. For other events, information in the
event is used to locate the state of the process already being executed (there may be many
instances of the process being executed at any given point in time). Once the current state has
been identified, the process model is then used to interpret the triggering event in the context of
that state [8].
Figure 3.5: Track-and-Trace Architecture [8] This type of analysis is appropriate for monitoring any type of unmanaged process, for
example, tracking a package from an initial location to a destination. Tracking your luggage
from the time you drop it off until the time you pick it up at the baggage carousel at your final
destination is another.
In general, this approach works well for monitoring any process in which there is a hand-
off of responsibility from one participant to another. You give your luggage to the counter agent,
who then hands the bag over to the conveyer as a means of handing off responsibility to the
baggage handlers. The process continues until the final hand-off, which begins when the
baggage handler at your final destination places the bag on the conveyer leading to the baggage
carousel and ends when you pick up your luggage.
The challenge most Track-and-Trace Architectures face is finding appropriate evidence
of progress for keeping track of the progress state. In some circumstances, it may simply not be
possible to find the information needed to track an event’s lifespan. When this occurs, you may
want to implement the degree of tracking that is supported by the available evidence and begin
179
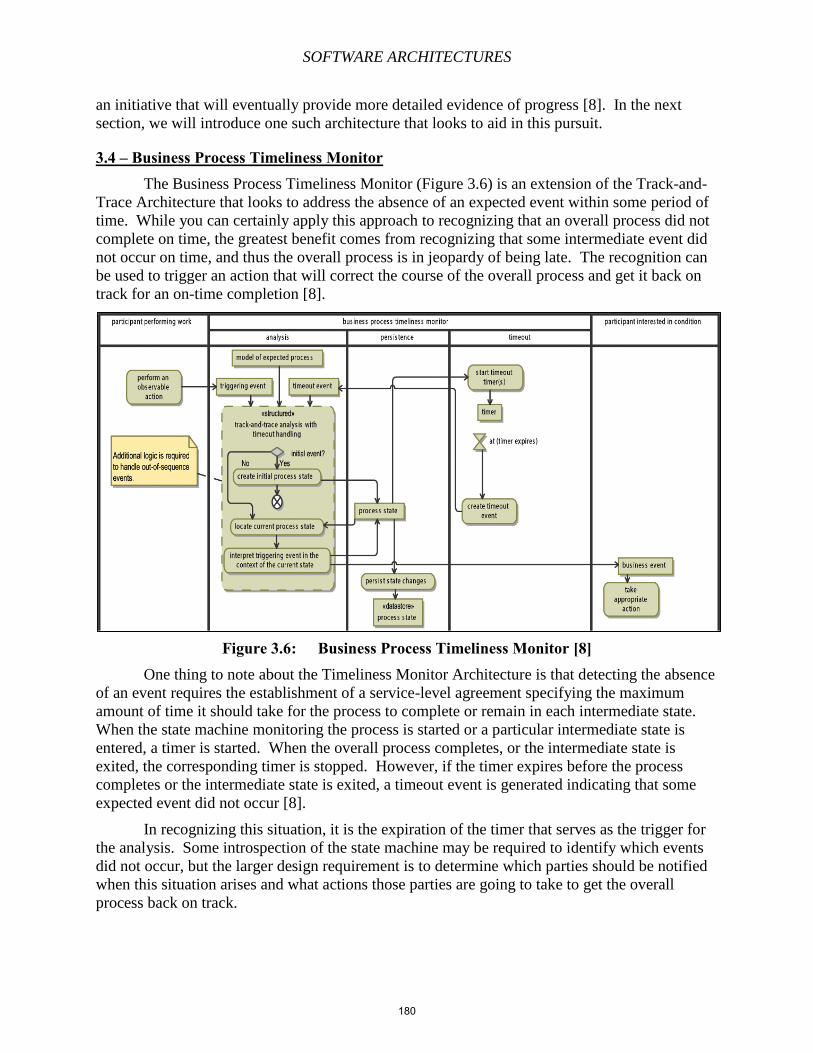
SOFTWARE ARCHITECTURES
an initiative that will eventually provide more detailed evidence of progress [8]. In the next
section, we will introduce one such architecture that looks to aid in this pursuit.
3.4 – Business Process Timeliness Monitor The Business Process Timeliness Monitor (Figure 3.6) is an extension of the Track-and-
Trace Architecture that looks to address the absence of an expected event within some period of
time. While you can certainly apply this approach to recognizing that an overall process did not
complete on time, the greatest benefit comes from recognizing that some intermediate event did
not occur on time, and thus the overall process is in jeopardy of being late. The recognition can
be used to trigger an action that will correct the course of the overall process and get it back on
track for an on-time completion [8].
Figure 3.6: Business Process Timeliness Monitor [8] One thing to note about the Timeliness Monitor Architecture is that detecting the absence
of an event requires the establishment of a service-level agreement specifying the maximum
amount of time it should take for the process to complete or remain in each intermediate state.
When the state machine monitoring the process is started or a particular intermediate state is
entered, a timer is started. When the overall process completes, or the intermediate state is
exited, the corresponding timer is stopped. However, if the timer expires before the process
completes or the intermediate state is exited, a timeout event is generated indicating that some
expected event did not occur [8].
In recognizing this situation, it is the expiration of the timer that serves as the trigger for
the analysis. Some introspection of the state machine may be required to identify which events
did not occur, but the larger design requirement is to determine which parties should be notified
when this situation arises and what actions those parties are going to take to get the overall
process back on track.
180
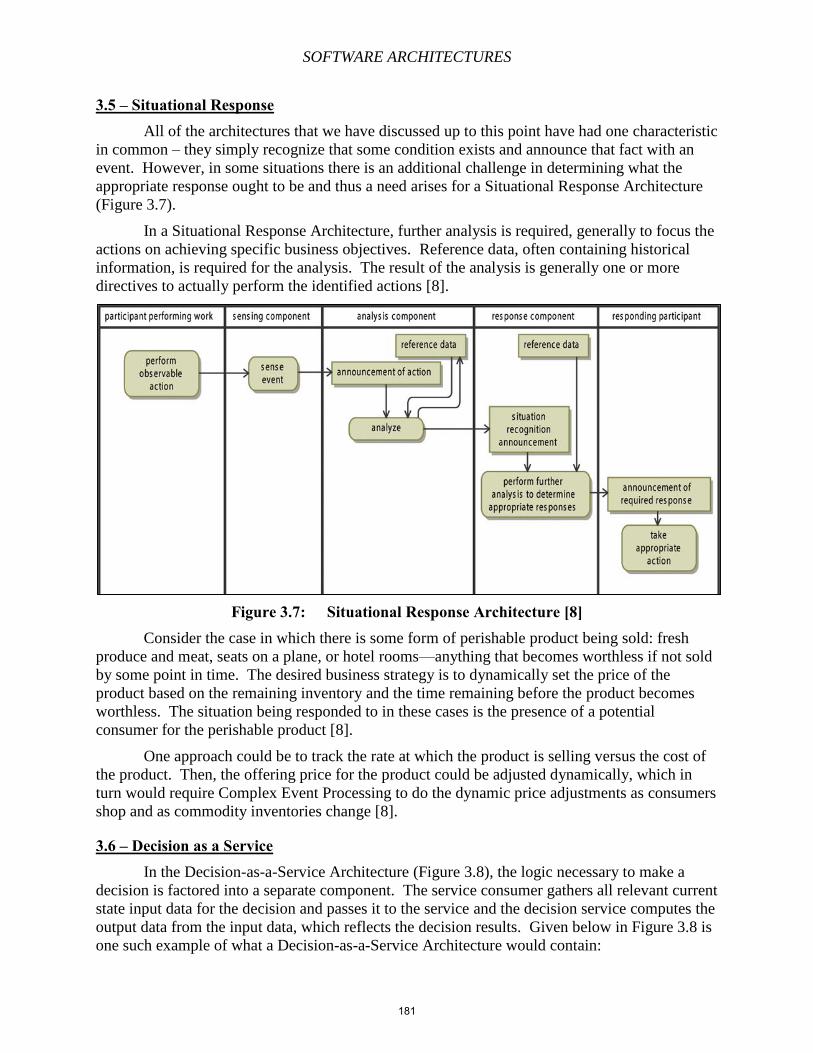
SOFTWARE ARCHITECTURES
3.5 – Situational Response All of the architectures that we have discussed up to this point have had one characteristic
in common – they simply recognize that some condition exists and announce that fact with an
event. However, in some situations there is an additional challenge in determining what the
appropriate response ought to be and thus a need arises for a Situational Response Architecture
(Figure 3.7).
In a Situational Response Architecture, further analysis is required, generally to focus the
actions on achieving specific business objectives. Reference data, often containing historical
information, is required for the analysis. The result of the analysis is generally one or more
directives to actually perform the identified actions [8].
Figure 3.7: Situational Response Architecture [8] Consider the case in which there is some form of perishable product being sold: fresh
produce and meat, seats on a plane, or hotel rooms—anything that becomes worthless if not sold
by some point in time. The desired business strategy is to dynamically set the price of the
product based on the remaining inventory and the time remaining before the product becomes
worthless. The situation being responded to in these cases is the presence of a potential
consumer for the perishable product [8].
One approach could be to track the rate at which the product is selling versus the cost of
the product. Then, the offering price for the product could be adjusted dynamically, which in
turn would require Complex Event Processing to do the dynamic price adjustments as consumers
shop and as commodity inventories change [8].
3.6 – Decision as a Service In the Decision-as-a-Service Architecture (Figure 3.8), the logic necessary to make a
decision is factored into a separate component. The service consumer gathers all relevant current
state input data for the decision and passes it to the service and the decision service computes the
output data from the input data, which reflects the decision results. Given below in Figure 3.8 is
one such example of what a Decision-as-a-Service Architecture would contain:
181
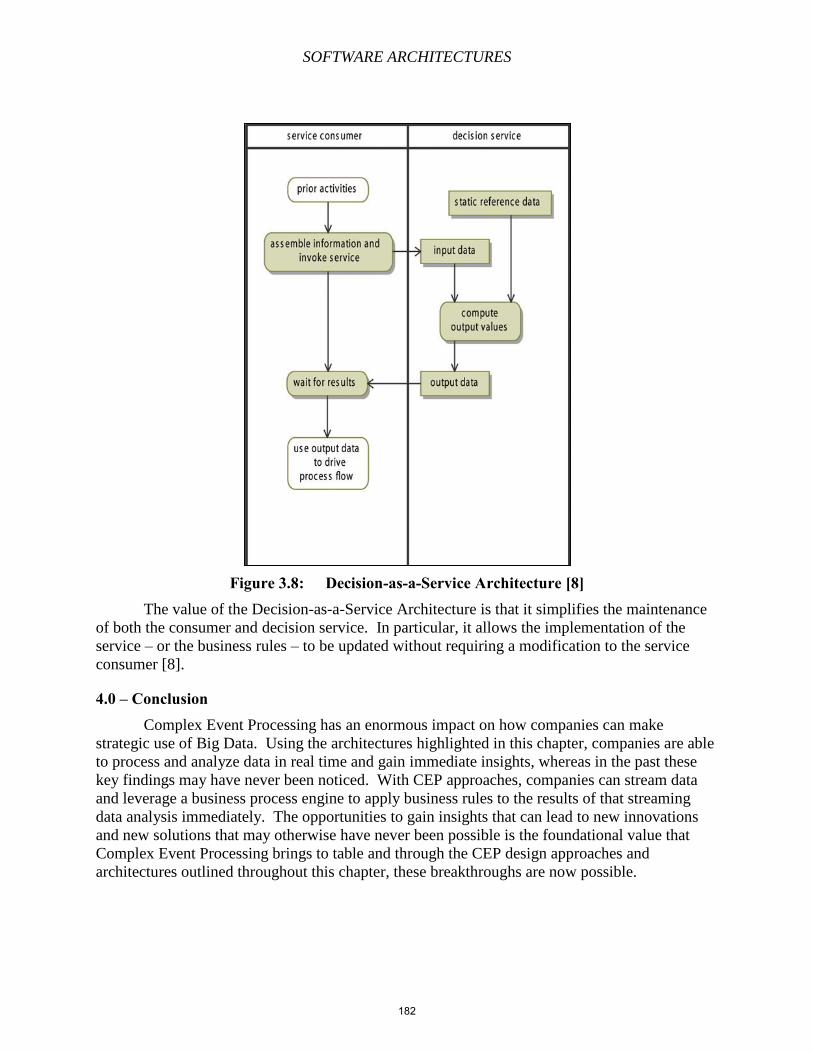
SOFTWARE ARCHITECTURES
Figure 3.8: Decision-as-a-Service Architecture [8] The value of the Decision-as-a-Service Architecture is that it simplifies the maintenance
of both the consumer and decision service. In particular, it allows the implementation of the
service – or the business rules – to be updated without requiring a modification to the service
consumer [8].
4.0 – Conclusion Complex Event Processing has an enormous impact on how companies can make
strategic use of Big Data. Using the architectures highlighted in this chapter, companies are able
to process and analyze data in real time and gain immediate insights, whereas in the past these
key findings may have never been noticed. With CEP approaches, companies can stream data
and leverage a business process engine to apply business rules to the results of that streaming
data analysis immediately. The opportunities to gain insights that can lead to new innovations
and new solutions that may otherwise have never been possible is the foundational value that
Complex Event Processing brings to table and through the CEP design approaches and
architectures outlined throughout this chapter, these breakthroughs are now possible.
182
SOFTWARE ARCHITECTURES
References [1]. SearchSOA: Complex event processing (CEP); Date Accessed: April 13, 2014;
http://searchsoa.techtarget.com/definition/complex-event-processing
[2]. Wikipedia: Complex event processing; Date Accessed: April 19, 2014;
http://en.wikipedia.org/wiki/Complex_Event_Processing
[3]. Starting Oracle Business Activity Monitoring (BAM) with the BPM Suite; Date Accessed:
April 20, 2014; http://blog.whitehorses.nl/2012/03/30/starting-oracle-business-activity-
monitoring-bam-with-the-bpm-suite/
[4]. Extending the Business Value of SOA Through Business Process Management; Date
Accessed: April 20, 2014; http://www.ebizq.net/web_resources/whitepapers/BPM-
SOA_wp.pdf
[5]. Application Integration – A Short Tutorial; Date Accessed: April 20, 2014;
http://ngecacit.com/AIM/AIM-explain/Tutorial-Application%20Integration.htm
[6]. Event-Driven Architecture Overview; Date Accessed: April 20, 2014;
http://www.elementallinks.com/2006/02/06/event-driven-architecture-
overview/#sthash.T0dTMVSW.dpbs
[7]. MindTree: Enabling predictive analysis in service oriented BPM solutions; Date Accessed:
April 26, 2014; http://www.mindtree.com/sites/default/files/mindtree-thought-posts-white-
paper-enabling-predictive-analysis-in-service-oriented-bpm-solutions.pdf
[8]. Brown, Paul; Architecting Complex-Event Processing Solutions with TIBCO; Publisher:
Addison-Wesley Professional; September 21, 2013
183
SOFTWARE ARCHITECTURES
Chapter 14 – User Modeling Blake Peters
User modeling and profiling has been used to evaluate systems and predict user behaviors
for a considerable time.[2] User modeling is a subdivision of human-computer interaction and
describes the process of building up and modifying a user model in order to provide for a better
experience by the user. Human-computer interaction studies the interactions and the relationships
between humans and computers.[4] Human-computer interaction is more “screen deep” and user
interfaces, but is a multidisciplinary field covering many areas. During the first ten to fifteen
years of the computing era, human-computer interaction focused on graphical user interfaces and
tasks such as using windows, icons, menus, and pointing devices to create more usable systems.
Since then, interface problems have become better understood and the primary concerns of
human-computer interaction have shifted toward tasks, shared understanding with explanations,
justifications, and argumentation about actions. These new challenges aim at improving the way
people are using computers to work, think, communicate, learn, critique, explain, argue, debate,
observe, calculate, simulate, and design.[4] The aim of this paper is to explore the history of user
modeling as well as go into detail about the different models and applications which use these
models.
The conception of user modeling began with the need and desire to provide better support
for human-computer collaboration. User modeling was seen as a way in which a computer and a
human could work together to achieve shared goals. Human-computer collaboration could be
approached from two different perspectives: a complementing approach and an emulation
approach. The emulation approach can be viewed as a way to give computers “human-like
abilities.” The complementing approach is based on the fact that computers are not human and
that the human-centered design should exploit the differences of human and computer by
developing new interaction and collaboration possibilities.[4] Early works of user modeling
focused on the human emulation approach. Due to limited success in this approach, focus has
since shifted to the complementing approach.
A user model represents a collection of personal data associated with a specific user.[1]
This data is then used to predict the users actions and common routines. There are different types
of user models each with their own benefits and determines how data about the user is collected.
The type of user model used is generally decided based upon the type of application using the
user model. The key to user modeling is the data gathering. There are three main ways of
gathering data, and the model used usually dictates which approach to take. One approach to
gathering data is to explicitly ask the user for specific facts upon their first use of the system.
Another approach is to learn the user’s preferences by observing and interpreting their
interactions with the system. The final major approach to gathering data for user models is a
hybrid approach of the two previously mentioned methods. This approach explicitly asks for
feedback from the user as well as learning the user’s preferences through system interactions. To
this date, there are four general types of user models. The first and most basic type is the static
user model. Upon the user’s first use of the application, data is collected by having the user
either answer questions or manually set their preferences or settings. Once this data is gathered it
is usually not changed again, it is static. Changes in the user’s preferences are normally not
184
SOFTWARE ARCHITECTURES
registered and no learning algorithms are used to change the model. The next major type of user
model is the dynamic user model. Data about the user is gathered from changes in user interests,
user interactions with the system, and or the learning progress of the user. This allows for a more
up to date representation of the user. The models are constantly updated to make the goals of the
user more easily reached. The third major user model is the stereotype based user model. Data is
gathered through demographic statistics. Based on these statistics, the user is classified into a
“stereotype,” and the system adapts to this stereotype. An advantage of this model is that
assumptions can be made about a user even though there might not be data about that what
specifically the user is doing. Because data is gathered through demographic studies, the system
knows the characteristics of other users of the same stereotype. The final major user model is the
highly adaptive user model. This model aims to be the most specific type of user model and
allows for a highly adaptive system. This can combine techniques used by the three previous
models, and can be seen as a more adaptive dynamic model. While this model has the greatest
benefits, it requires a lot of data gathering.[1]
The above models can further be categorized as either adaptive systems or adaptable
systems. The adaptive systems are those in which the system itself makes changes to the user
model. These systems are common in active help systems, critiquing systems, differential
descriptions, user interface customization, and information retrieval applications.[5] The
adaptable systems are those in which the user manually alters the user model. These systems are
common in information retrieval, end-user modifiability, tailorability, filtering, and design in use
applications.[5] Both types of systems have their own strengths and weaknesses. Strengths of
adaptive systems include little or no effort by the user, and don’t require the user to have special
knowledge of the system or application.[5] Benefits of adaptable systems include the user being
in control, the concept that the user knows their task best, the system knowledge will fit better,
and a success model already exists.[5] Weaknesses of adaptive systems are the user can have
difficulty developing a coherent model of the system, there is a loss of control, and there are few,
if any, existing success models. Weaknesses of adaptable systems can be the system becoming
incompatible, the user has to do substantial work, and complexity is increased, meaning the user
needs to learn the adaptation component.[5] Both adaptive and adaptable systems require their
own mechanisms. Adaptive systems require models of users, tasks, and dialogs, as well as a
knowledge base of goals and plans, powerful matching capabilities, and an incremental update of
models. Adaptable systems require a layered architecture, domain models and domain-
orientation, “back-talk” from the system, and design rationale.[5]
The beginning practice of user modeling can be traced back to around 1978 by the works
of a group of computer scientists by the names of Allen, Cohen, Perrault, and Rich.[3] Following
the research by this group, for a ten-year period there was an explosion of systems developed
implementing this research. These systems collected different types of information about, and
exhibited different kinds of adaptation to, their current users.[3] With these early systems, there
was no clear distinction between system components that served user modeling purposes and
components that performed other tasks. The user modeling was performed by the application
system. Tim Finin, in 1986, published his ‘General User Modeling System,’ also known as
GUMS. GUMS was a software that allowed programmers of user-adaptive applications the
definition of simple stereotype hierarchies. For each stereotype, there were Prolog facts
describing members of the stereotype and rules prescribing the system’s reasoning about
them.[3] Upon runtime, GUMS would accept and store new facts about the user provided by the
application system. The system would then verify the consistency of a new fact with currently
185
SOFTWARE ARCHITECTURES
held assumptions, inform the application about recognized inconsistencies, and answer queries of
the application concerning the currently held assumptions about the user.[3] The greatest take
away from GUMS was the provision of selected user modeling services at runtime that could be
configured during development time. While GUMS was never used together with an application
system, it set the framework for the basic functionality of future “general user modeling
systems.”
During the early nineties, research groups from different countries began independently
developing user model shells by condensing basic structures and processes. During this time,
five major user model shells emerged. The first of the five user model shells was developed in
1994 and was called “UMT.” UMT allowed the developer the definition of hierarchically
ordered user stereotypes, and rules for user model inferences as well as contradiction
detection.[3] Once the application gathered information about the user, this data could be
classified as invariable premises or assumptions. After “activating” the rules along with all
applicable stereotypes, contradictions between the assumptions were looked for. If contradictions
between these assumptions were found, various resolution strategies would be applied. The next
major user model developed during this time went by the name “BGP-MS.” BGP-MS was
developed in 1995 and allowed assumptions about the user and stereotypical assumptions about
user groups to be represented in a first-order predicate logic.[3] A subset of these assumptions
was stored in a terminological logic. This allowed inferences across different assumption types to
be defined in a first-order modal logic. By doing this, the system could be used as a network
server with multi-user and multi-application capabilities. Also developed in 1995 was the next
user model shell, “Doppelganger.” Doppelganger was a user modeling server that accepted
information about the user from hardware and software sensors. Techniques for generalizing and
extrapolating data from the sensors were left up to the user model developers.[3] Doppelganger
also allowed users to view and edit their own user models. The next user model shell, also
developed in 1995, was dubbed “Tagus.” Tagus would represent assumptions about the user in
first-order formulas, with operators expressing the assumption type.[3] Like UMT, Tagus
allowed for the definition of stereotype hierarchy, but also contained an inference mechanism, a
truth maintenance system, and a diagnostic subsystem that included a library of misconceptions.
Tagus was the first shell that supported “simulation of the user” through forward-directed
inferences on the basis of the user model, and the diagnosis of unexpected user behavior.[3] The
final major user model shell developed in 1995 went by “um.” Um was a user modeling toolkit
which represented assumptions about the user’s knowledge, beliefs, preferences, and other user
characteristics in attribute-value pairs.[3] Each piece of information was accompanied by a list of
evidence. This list would then be used to determine an assumption’s truth or falsehood. The
source of each piece of evidence, its type, and a time stamp would be recorded and logged.
Another early system developed which showed success in user modeling was called the
WEST system. WEST was a coaching system for a game called “How the West was Won” that
modeled on “Chutes and Ladders.”[4] Players would rotate three spinners and have to form an
arithmetic expression from the three numbers that turned up on the spinners using addition,
subtraction, multiplication, and division operators as well as appropriate parenthesis. The value
of the expression would be the amount of spaces the player could move. For example if a player
received a 2, 3, and 4 from the spinners, they could form the expression (2+3)*4=20, and the
player could move 20 spaces. Towns occur every ten spaces, and if landed on, the player would
move to the next town. If a player landed on a chute, they would slide to the end of the chute. If
you landed on an opponent, the opponent would be sent back two towns. Thus, the strategy
186
SOFTWARE ARCHITECTURES
would be to figure out all possible combinations of moves and choose the one placing you the
farthest ahead. Analysis of the game revealed that students rather than employing this strategy
would rely on a strategy such as adding the two smallest numbers and multiplying by the largest
number. The WEST system analyzed students’ moves in terms of the optimal strategy and could
rate the moves with respect to that strategy.[4] The WEST system would note if students would
consistently follow a less-than-optimal strategy, such as not taking opportunities to land on a
town, chute, or opponent. If such a pattern was detected, the WEST system would intervene at an
opportune time, such as a student’s move being far from optimal, and would point out how the
student could have done much better. The student would then have the option to retake the move.
While the WEST system was a very primitive user modeling system, it was one of the first to
explore basic problems of user modeling at the time. One of these basic problems was in the area
of shared context. The computer coaches were restricted to inferring the students’ short-comings
from whatever they did in the context of playing the game or solving the problem.[4] Another
problem addressed was that of initiative and intrusiveness. The WEST user model was used to
make a judgment of when to give valuable advice and make relevant comments to students
without being so intrusive as to destroy the fun of the game. The user model was also used to
avoid the danger that students would never develop the necessary skills for examining their own
behavior and looking for the causes of their own mistakes because the “coach” immediately
pointed out the students’ errors.[4] Another problem solved by the WEST system was that of
relevance. By assessing the situational context and acting accordingly, students were advised in a
way in which they could see the usefulness of the issue at a time when they were most receptive
to the idea being presented.[4] The system would then, based on information stored in the user
model, use explicit intervention and tutoring strategies to enable the system to say the “right”
thing at the “right” time. The WEST system was successful at this time because it worked in a
very simple domain in which outcomes were limited to the combinatorics of a few variables. The
“coach” operated in a “closed-world” environment, and could play an optimal game by
determining the complete range of alternative behaviors. Individual, low level events were easy
to interpret, and incrementally the user model was constructed by exploiting many events
occurring in the same domain.
Decisions as to what important structures and processes should go into user modeling
shell systems were mostly based on intuition and/or experience of the shell developers through
prior work on user-adaptive systems.[3] Kleiber in 1994, and Pohl in 1998 made efforts to put
these decisions on more empirical grounds. Kleiber and Pohl, rather than performing a
comprehensive review of prior user-adaptive systems and determining current and future system
needs, merely identified individual user-adaptive application systems in the literature that would
have profited from the functionality of their own developed shell systems.
In 1995, Kobsa, in an attempt to extend the de facto definition of user modeling shells
introduced by GUMS and to avoid characterizing user modeling shell systems via internal
structures and processes, created a list of frequently-found services of such systems. The list was
as follows:[3]
The representation of assumptions about one ore more types of user characteristics in
models of individual users (e.g. assumptions about their knowledge, misconceptions,
goals, plans, preferences, tasks, and abilities);
The representation of relevant common characteristics of users pertaining to specific user
subgroups of the application system (the so-called stereotypes);
187
SOFTWARE ARCHITECTURES
The classification of users as belonging to one or more of these subgroups, and the
integration of the typical characteristics of these subgroups into the current individual
user model;
The recording of user’s behavior, particularly their past interaction with the system;
The formation of assumptions about the user based on the interaction history;
The generalization of the interaction histories of many users into stereotypes;
The drawing of additional assumptions about the current user based on initial ones;
Consistency maintenance in the user model;
The provision of the current assumptions about the user, as well as justifications for these
assumptions;
The evaluation of the entries in the current user model, and the comparison with given
standards;
This characterization was not backed up by a comprehensive analysis of what user modeling
services were actually demanded from current and future user-adaptive systems, but was
observational only. From this list, three main requirements for user modeling emerged:
Generality, Expressiveness, and Strong Inferential Capabilities. Generality, including domain
independence, touched on the importance of such systems being usable in as many application
and content domains as possible, and within these domains for as many user modeling tasks as
possible. Therefore, these shells were expected to provide as many services as possible. At this
time “Concessions” were only made for shell systems in student-adaptive tutoring systems,
which were expected to be usable for teaching different subject matters, but not for additional
application domains besides educational ones. Expressiveness delved into the shell system’s
ability to express as many types of assumptions about the user as possible at the same time. This
not only included the different types of propositional attitudes, but also all sorts of reflexive
assumptions concerning the user and the system, plus uncertainty and vagueness in these
assumptions. The final important requirement of user modeling shell systems was strong
inferential capabilities. These systems were expected to perform all sorts of reasoning that are
traditionally distinguished in artificial intelligence and formal logic, such as reasoning in a first-
order predicate logic, complex modal reasoning (reasoning about types of modalities), reasoning
with uncertainty, plausible reasoning when full information is not available, and conflict
resolution when contradictory assumptions are detected.[3] The rationale for placing so much
importance on these requirements fell in the affinity of user modeling research of those days to
artificial intelligence, natural-language dialog, and intelligent tutoring. The complex assumptions
and reasoning about the user identified in these domains was expected to be supported by these
modeling shells, as well as the ability to be used in a wide range of domains as well. Such
complex user modeling and reasoning capabilities became redundant in the mid-nineties when
user-adaptive application systems shifted towards different domains with less demanding user
modeling requirements and user-tailored web sites. Another note about just about all of these
user modeling shell systems up to this point, was that each adhered to a “mentalistic” paradigm.
That is, they modeled “propositional attitudes” of the user like his or her knowledge, beliefs,
goals, preferences, and interests. User behavior was not regarded as a phenomenon that should
be analyzed and modeled, but as an information source for drawing assumptions about users’
propositional attitudes. At this point, the Doppelganger shell was the only one that provided
means for detecting patterns in user behavior.[3]
188
SOFTWARE ARCHITECTURES
The “academic” user modeling shells of the early nineties didn’t receive much
distribution or acknowledgment. The BGP-MS shell was the only user modeling shell used
outside of the institution that it was originally developed, and even then, there were few reports
on extensive external usage. Despite this, many of the ideas explored in the prototypical systems
have since made it into commercial user modeling software.
In the late 1990’s, there was a boom in the demand for user modeling and user modeling
shells. At this time web personalization was increasingly recognized in the area of electronic
commerce. Web personalization allowed for product offerings, sales promotions, product news,
ad banners, etc. to be targeted to each individual user, taking the user’s navigation data, purchase
history and other previous interactions with the electronic merchant into account.[2] This
personalization allowed the relationship between customers on the Internet to go from
anonymous mass marketing and sales to a more “one-to-one” market. User modeling and user
modeling shells could play an important role in challenge. Around 50 different tool systems for
web personalization with very different capabilities were currently being advertised. Of these 50,
there were 5 major tool systems: Group Lens, LikeMinds, Personalization Server, Frontmind,
and Learn Sesame. Group Lens employed various collaborative filtering algorithms for
predicting users’ interests. Predictions were based on ratings explicitly provided by the user,
implicit ratings derived from navigational data, and data from transaction history. The
navigational data was obtained through products that the online customer viewed and products
that had been put into the shopping cart. LikeMinds was similar to Group Lens but included a
more modular architecture, better load distribution, ODBC support, and slightly different input
types. Personalization Server allowed for the definition of rules that assign individual users to
one or more user groups based on their demographic data, such as gender or age, as well as
information about the user’s system usage and information about the user’s software, hardware,
and network environments. Rules could also be defined for inferring individual assumptions
about the user from his or her navigation behavior, and for personalizing the content of web
pages. Personalization Server was very similar to the stereotype approach of user modeling.
Frontmind provided a rule-based development, management, and a simulation environment for
personalized information and personalized services on the web. Frontmind distinguished itself
from other rule-based products like Personalization Server by having Bayesian networks for
modeling users’ behavior integrated into its personalization framework. A Bayesian network is a
probabilistic graphical model that represents a set of random variables and their conditional
dependencies via a directed acyclic graph.[1] For example, a Bayesian network could represent
the probabilistic relationships between diseases and symptoms. Given symptoms, the network
can be used to compute the probabilities of the presence of various diseases. Learn Sesame
allowed for the definition of a domain model consisting of objects, object attributes, and event
types. It accepted information about the user from an application, categorized this information
based on the domain model, and tried to detect recurrent patterns, correlations, and similarities
through incremental clustering. Observations would then be reported back to the application.
Client-server architecture became the central characteristic of most current commercial
systems. With this, user modeling systems would not be functionally integrated into the
application but would communicate with the application through inter-process communication
and could serve more than one user/client applications at the same time. This generally, was not
the case for current academic user modeling shell systems. This client-server architecture
provided a number of benefits over embedded user modeling components. These advantages
included:[3]
189
SOFTWARE ARCHITECTURES
Information about the user was maintained in a central or virtually integrated repository
and put at the disposal of more than one application at the same time.
User information acquired by one application could be employed by other applications,
and vice versa.
Information about users was stored in a non-redundant manner. The consistency and
coherence of information gathered by different applications could be more easily
achieved.
Information about user groups, either available a priori as stereotypes or dynamically
calculated as user group models, could be maintained with low redundancy.
Methods and tools for system security, identification, authentication, access control and
encryption could be applied for protecting user models in user modeling servers.
Complementary user information that was dispersed across the enterprise could be
integrated more easily with the information in the user model repository.
These new commercial user modeling servers also provided new user modeling services. One of
the major new services was the ability to compare different users’ selective actions. In particular
application areas, users’ choices couldn’t very well be reconstructed by step-wise reasoning
processes, but only by reference to vague concepts like users’ taste, personality, and lifestyle. In
domains like these, it was found useful to match users’ selective actions with those of other
users, and to predict users’ future selective actions based on those of the most similar other users.
For this reason many current commercial user modeling servers supported the comparison of
different users’ action patterns using “collaborative” filtering algorithms. Another major service
provided by these commercial user modeling servers was the ability to import external user-
related information. At the time, many businesses already owned customer and marketing data,
and usually wanted to integrate these into user modeling systems when starting with personalized
e-commerce. ODBC interfaces or native support for a wide variety of databases were required to
access external data. Due to business processes and software, external user-related information
would constantly be updated in parallel to the e-commerce application. This required the data to
be continually integrated at a reasonable cost without impairing the response time.[3] Privacy
support was another important service provided by these commercial user modeling servers.
Many company privacy policies, industry privacy norms, and conventions, national and
international privacy legislation, and privacy-supporting software tools and service providers
were emerging at this time. It became important for these user modeling servers to support any
company privacy policy that complied with these constraints and to be able to take advantage of
all major privacy software and services that would then be available on the market.
The commercial user modeling servers at this time were very much behavior-oriented. The
observed user actions or action patterns often lead directly to adaptations, without an explicit
representation of the user characteristics (interests, knowledge, plans, etc.) that probably underlie
this behavior and justify these adaptations. By making these assumptions explicit, the user
modeling system would be able to employ the assumptions for purposes other than only those for
which they were recorded, as was the case for classical user modeling shells.[3]
User modeling servers of this time lacked on the dimensions of generality, expressiveness, and
inferential capabilities, which were all regarded as important for the academic user modeling
shells. These user modeling servers, in many cases, were quite domain-dependent. This meant
that their user model representation was very much intertwined with processing considerations,
and could only be used for limited personalization purposes. While these user modeling servers
190
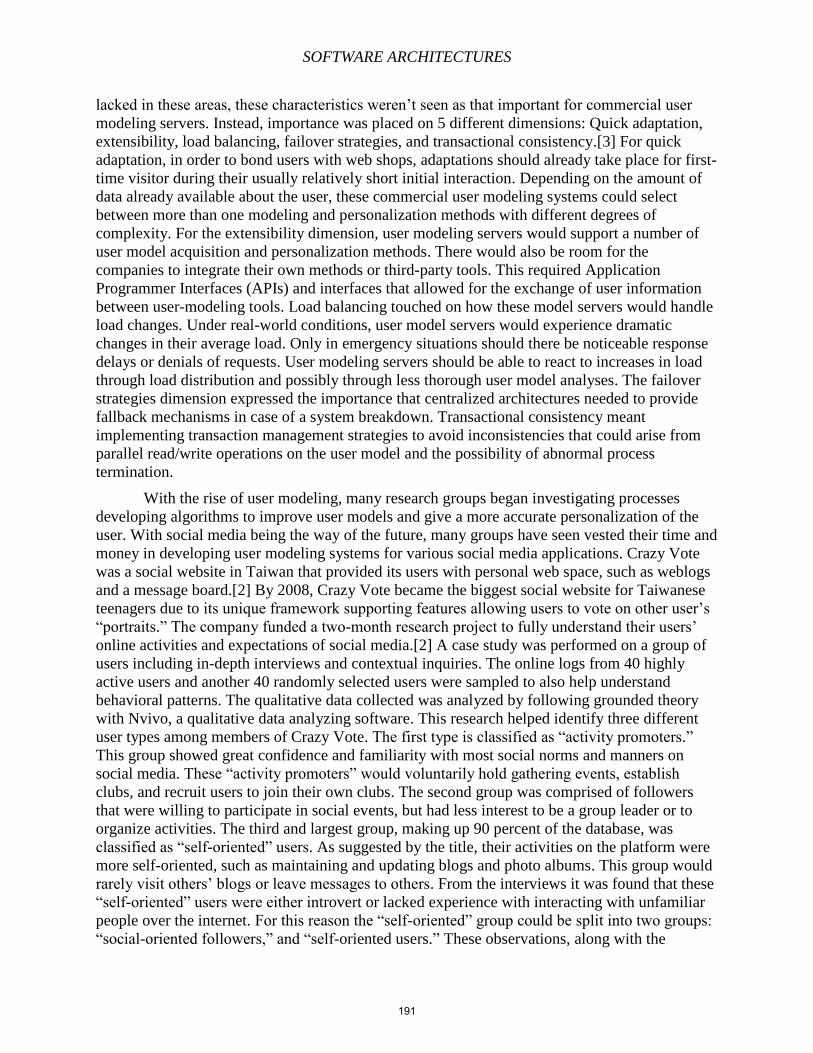
SOFTWARE ARCHITECTURES
lacked in these areas, these characteristics weren’t seen as that important for commercial user
modeling servers. Instead, importance was placed on 5 different dimensions: Quick adaptation,
extensibility, load balancing, failover strategies, and transactional consistency.[3] For quick
adaptation, in order to bond users with web shops, adaptations should already take place for first-
time visitor during their usually relatively short initial interaction. Depending on the amount of
data already available about the user, these commercial user modeling systems could select
between more than one modeling and personalization methods with different degrees of
complexity. For the extensibility dimension, user modeling servers would support a number of
user model acquisition and personalization methods. There would also be room for the
companies to integrate their own methods or third-party tools. This required Application
Programmer Interfaces (APIs) and interfaces that allowed for the exchange of user information
between user-modeling tools. Load balancing touched on how these model servers would handle
load changes. Under real-world conditions, user model servers would experience dramatic
changes in their average load. Only in emergency situations should there be noticeable response
delays or denials of requests. User modeling servers should be able to react to increases in load
through load distribution and possibly through less thorough user model analyses. The failover
strategies dimension expressed the importance that centralized architectures needed to provide
fallback mechanisms in case of a system breakdown. Transactional consistency meant
implementing transaction management strategies to avoid inconsistencies that could arise from
parallel read/write operations on the user model and the possibility of abnormal process
termination.
With the rise of user modeling, many research groups began investigating processes
developing algorithms to improve user models and give a more accurate personalization of the
user. With social media being the way of the future, many groups have seen vested their time and
money in developing user modeling systems for various social media applications. Crazy Vote
was a social website in Taiwan that provided its users with personal web space, such as weblogs
and a message board.[2] By 2008, Crazy Vote became the biggest social website for Taiwanese
teenagers due to its unique framework supporting features allowing users to vote on other user’s
“portraits.” The company funded a two-month research project to fully understand their users’
online activities and expectations of social media.[2] A case study was performed on a group of
users including in-depth interviews and contextual inquiries. The online logs from 40 highly
active users and another 40 randomly selected users were sampled to also help understand
behavioral patterns. The qualitative data collected was analyzed by following grounded theory
with Nvivo, a qualitative data analyzing software. This research helped identify three different
user types among members of Crazy Vote. The first type is classified as “activity promoters.”
This group showed great confidence and familiarity with most social norms and manners on
social media. These “activity promoters” would voluntarily hold gathering events, establish
clubs, and recruit users to join their own clubs. The second group was comprised of followers
that were willing to participate in social events, but had less interest to be a group leader or to
organize activities. The third and largest group, making up 90 percent of the database, was
classified as “self-oriented” users. As suggested by the title, their activities on the platform were
more self-oriented, such as maintaining and updating blogs and photo albums. This group would
rarely visit others’ blogs or leave messages to others. From the interviews it was found that these
“self-oriented” users were either introvert or lacked experience with interacting with unfamiliar
people over the internet. For this reason the “self-oriented” group could be split into two groups:
“social-oriented followers,” and “self-oriented users.” These observations, along with the
191
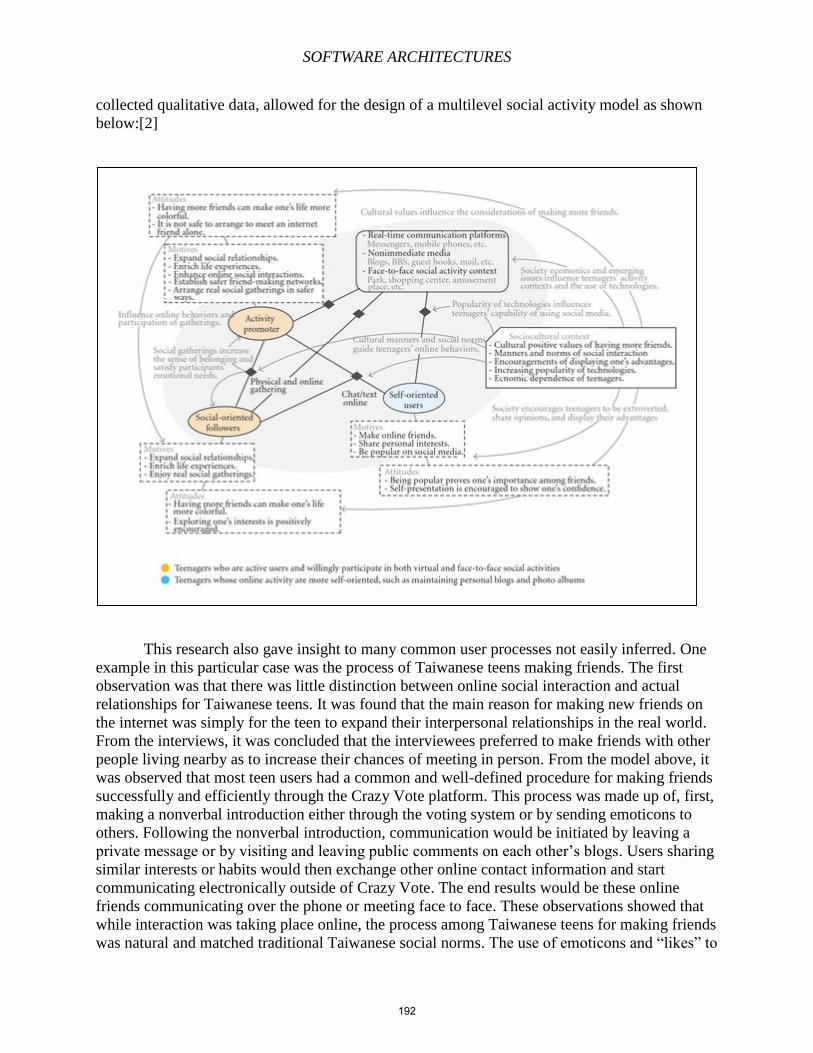
SOFTWARE ARCHITECTURES
collected qualitative data, allowed for the design of a multilevel social activity model as shown
below:[2]
This research also gave insight to many common user processes not easily inferred. One
example in this particular case was the process of Taiwanese teens making friends. The first
observation was that there was little distinction between online social interaction and actual
relationships for Taiwanese teens. It was found that the main reason for making new friends on
the internet was simply for the teen to expand their interpersonal relationships in the real world.
From the interviews, it was concluded that the interviewees preferred to make friends with other
people living nearby as to increase their chances of meeting in person. From the model above, it
was observed that most teen users had a common and well-defined procedure for making friends
successfully and efficiently through the Crazy Vote platform. This process was made up of, first,
making a nonverbal introduction either through the voting system or by sending emoticons to
others. Following the nonverbal introduction, communication would be initiated by leaving a
private message or by visiting and leaving public comments on each other’s blogs. Users sharing
similar interests or habits would then exchange other online contact information and start
communicating electronically outside of Crazy Vote. The end results would be these online
friends communicating over the phone or meeting face to face. These observations showed that
while interaction was taking place online, the process among Taiwanese teens for making friends
was natural and matched traditional Taiwanese social norms. The use of emoticons and “likes” to
192
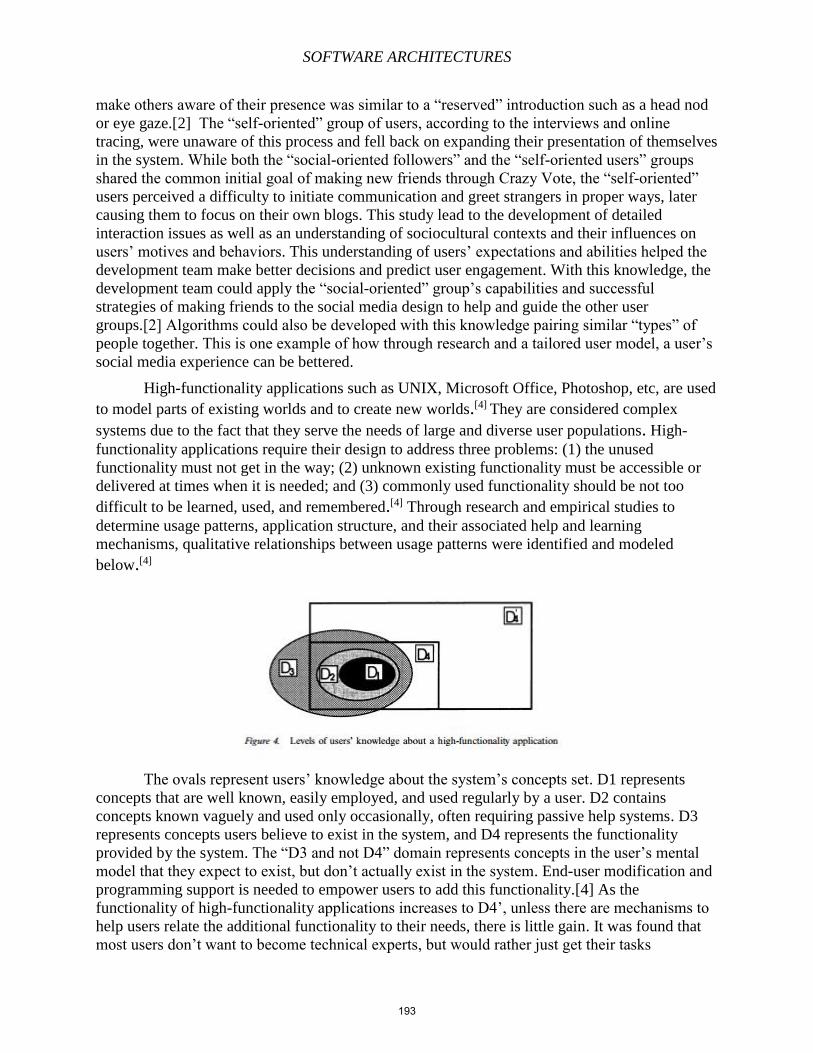
SOFTWARE ARCHITECTURES
make others aware of their presence was similar to a “reserved” introduction such as a head nod
or eye gaze.[2] The “self-oriented” group of users, according to the interviews and online
tracing, were unaware of this process and fell back on expanding their presentation of themselves
in the system. While both the “social-oriented followers” and the “self-oriented users” groups
shared the common initial goal of making new friends through Crazy Vote, the “self-oriented”
users perceived a difficulty to initiate communication and greet strangers in proper ways, later
causing them to focus on their own blogs. This study lead to the development of detailed
interaction issues as well as an understanding of sociocultural contexts and their influences on
users’ motives and behaviors. This understanding of users’ expectations and abilities helped the
development team make better decisions and predict user engagement. With this knowledge, the
development team could apply the “social-oriented” group’s capabilities and successful
strategies of making friends to the social media design to help and guide the other user
groups.[2] Algorithms could also be developed with this knowledge pairing similar “types” of
people together. This is one example of how through research and a tailored user model, a user’s
social media experience can be bettered.
High-functionality applications such as UNIX, Microsoft Office, Photoshop, etc, are used
to model parts of existing worlds and to create new worlds.[4] They are considered complex
systems due to the fact that they serve the needs of large and diverse user populations. High-
functionality applications require their design to address three problems: (1) the unused
functionality must not get in the way; (2) unknown existing functionality must be accessible or
delivered at times when it is needed; and (3) commonly used functionality should be not too
difficult to be learned, used, and remembered.[4] Through research and empirical studies to
determine usage patterns, application structure, and their associated help and learning
mechanisms, qualitative relationships between usage patterns were identified and modeled
below.[4]
The ovals represent users’ knowledge about the system’s concepts set. D1 represents
concepts that are well known, easily employed, and used regularly by a user. D2 contains
concepts known vaguely and used only occasionally, often requiring passive help systems. D3
represents concepts users believe to exist in the system, and D4 represents the functionality
provided by the system. The “D3 and not D4” domain represents concepts in the user’s mental
model that they expect to exist, but don’t actually exist in the system. End-user modification and
programming support is needed to empower users to add this functionality.[4] As the
functionality of high-functionality applications increases to D4’, unless there are mechanisms to
help users relate the additional functionality to their needs, there is little gain. It was found that
most users don’t want to become technical experts, but would rather just get their tasks
193
SOFTWARE ARCHITECTURES
completed. The area of interest to research in user modeling is the area of D4 that is not part of
D3. This area represents the system functionality whose existence is unknown to users. In this
domain, information access, such as the user-initiated location of information when they perceive
a need for an operation, is not sufficient. Information delivery (the system volunteering
information that it inferred to be relevant to the users’ task at hand) is required.[4] Active help
systems are required to point out to users functionality that may be useful for their tasks and to
help users avoid getting stuck on suboptimal plateaus. The above figure (labeled Figure 4.)
shows usage patterns of such high-functionality applications without taking into account specific
tasks of users. The user has no reason to worry about additional existing functionality in D4 if
this functionality isn’t relevant to their tasks. If the system does provide functionality in D4
relevant to the users’ tasks, it would be desirable to avoid having users be unable to perform their
task or to do so in a suboptimal or error-prone way because they don’t know about this
functionality. Now consider the below figure:[4]
Here the gray rectangle T represents the information that is relevant to the users’ task at hand,
and the dots represent different pieces of functionality. Passive support systems supporting
information access can help users to explore pieces of functionality that are contained in D3 and
T. Active intelligent systems supporting information delivery are needed for the functionality
contained in T and not in D3. The functionality of all dots, including the ones contained in D4
outside of T is often offered by specific push systems such as “Did You Know” systems or
Microsoft’s “Tip of the Day.”[4] User modeling for these high-functionality systems in this way
aid the user in completing their task without overwhelming them with mass amounts of unneeded
functionality or much technical knowledge.
While user modeling has evolved quite a bit since its earlier days, there is still a lot of
work to be done. Predictions regarding the future development of user modeling remain fairly
speculative, due to the rapidly changing nature of computing and computing devices.
Personalization has been proven to benefit both users and providers of the personalized services;
it is safe to say that generic tool systems used for personalization will continue to be developed.
With this being said, the exact form user modeling systems of the future will take on is will be
influenced by characteristics of system usage that are difficult to predict. While this is difficult to
predict, it is possible to formulate considerations regarding future systems. One of such
considerations is aimed toward mobile user modeling systems. Computing is increasingly
becoming more and more geared toward mobile computing. The reliability of mobile networks,
and possibly their bandwidth, is of concern due to the demands of these client-server
194
SOFTWARE ARCHITECTURES
architectures for user modeling systems, which require permanent connectivity. One proposed
solution to this is to impose a “user model agent” to reside on the server side. This agent would
either be replicated at the beginning of each interaction, or could be a “true” mobile agent and
stay with the user all of the time, either on the mobile computing device or on a gadget that the
user always wears. Another concern of the future deals with user modeling for smart appliances.
To date, the domain of user modeling has been almost exclusively in computing systems.
“Smart” appliances are starting to become more and more popular. There can be great benefit for
users in integrating personalization options in their smart appliances. There have already been a
few steps in this direction. One example is the ability for car radios to store users pre-set stations,
traffic news, and volume and tone. Another example is the ability for a person’s car keys to have
a chip that communicates with the car and adjusts the driver’s seat position, mirror position, GPS
settings, and other “personal” settings. A final consideration is the development of multiple-
purpose user modeling systems. These would be systems that rather than store information about
individual users, but for multiple users in general. Some examples of systems that would benefit
from this could be organizational directory services, skill inventory systems, organizational or
global expert-finding applications, etc. These systems would make use of a central user model
server rather than a local user model agent. Basing the user model representation of these
systems on standards that were developed for directory services would help transfer user
modeling systems from the area of proprietary developments into that of industry standards.[3]
With this wide range of possibilities for future computing systems, devices, and applications, it is
unlikely that there will be a single or a small number of universal user modeling systems suitable
for a large number of user modeling tasks. The more probable outcome is the development of a
wide variety of generic user modeling systems, each of which would support only a few of the
very different future instances of personalization and other applications of information about the
user.
References
1. http://en.wikipedia.org/wiki/User_modeling
2. http://www.hindawi.com/journals/ahci/2012/123725/
3. http://umuai.org/anniversary/2001-UMUAI-kobsa.pdf
4. http://sistemas-humano-computacionais.wdfiles.com/local--
files/capitulo%3Amodelagem-e-simulacao-de-sistemas-humano-
computacio/user%20modeling.pdf
5. http://www.ics.uci.edu/~kobsa/papers/2004-HCI-Encyclopedia-kobsa.pdf
195
SOFTWARE ARCHITECTURES
Chapter 15 – The Semantic Web Ron Smith
Suppose that you receive an email from a company wishing to schedule an interview
with you. Currently, you would need to check your email to know it was received or,
perhaps, your device might notify you that an email was received. Either way, you must look
at the email to know what it contains and what you need to do about it. You would, then,
email them back and forth to arrange a time and date. Of course, your two schedules are
going to be very different, so it could take some rearranging of other tasks to reach a suitable
compromise. Due to delay between each subsequent communication, it could be a day or
two before everything is finalized. But with technology as advanced as it is, we would rather
make machines do this kind of grunt work for us. What if, instead, upon receiving the email,
your device could read it for you, determine that an event needed scheduling, and go through
the process of comparing availability and rearranging schedules for us. This is one example
of what the Semantic Web seeks to bring about.
What is the Semantic Web? In the year 1990, Tim-Berners Lee and Robert Cailliau created the World Wide Web
as a set of “hypertext documents” linked together as a “web.” However, despite the first
“web browser” being an editor as well as a viewer, it ran only on the NeXTStep operating
system, making those lacking access to this system unable to edit pages. Around the mid-
90’s, when the first widely available browsers such as Netscape, Mosaic, and Internet
Explorer were made available, the internet boom began and in October 1994, Lee founded
the World Wide Web Consortium (W3C) to create and oversee web standards. As usage
increased, things like blogs, social networks, and wikis began to take shape, bringing Lee’s
original vision of the Web as a “collaborative medium” to fruition. Despite these leaps in
progress, there is still much room for improvement.
Humans can do many things through the Web such as make purchases, schedule
events, and remotely interact with other devices. The machine, though, cannot do these
things without a human directing it. Most markup languages used to create web pages
merely describe the page and its links to other pages and are, therefore, designed with
human-readability in mind as opposed to machine-readability. If we wish for machines to be
capable of performing the tasks on the Web that humans can, we must create a Web that is
interpretable by machines that can “understand” the content of web pages and act on that
information. This is the basis of the Semantic Web.
Tim-Berners Lee coined the term “Semantic Web” in 2001 defining it as “a web of
data that can be processed directly and indirectly by machines.” This means that a machine
agent will be able to interpret the content of a web page rather than merely describe it. With
the current Web, a machine agent looking at a web page can see how it is structured and
196
formatted, but not what kind of information a form processes or what a user might do with its
results. It can find keywords in the page and return them to a search engine, but not what
relationships those words have to each other or what information they convey. The
Semantic Web seeks to remedy this situation by adding metadata (data about data) to the
already existing information on a web page. This metadata would stay behind the scenes and
would not be visible to the user and, instead, would be used by machines to interpret the data.
After the metadata has been created and attached to each item on the page, a machine
can now identify each piece and its function within the whole. But this is a on a single page.
How do you make sure that the identification will be consistently accurate across multiple
pages? Or companies? Or languages? We want a machine agent to be able to interact with
any page on the Web so, if we stop here, any inconsistencies in metadata format will cause
the agent to fail in its tasks. For this reason, we create ontologies to help organize and relate
the information present in the page and its metadata. These ontologies represent information
as a hierarchy of classes and domains with shared vocabularies so that information can be
easily organized and interpreted by machines. Once these ontologies and associated
metadata are plentiful enough on the new Web, we can begin to create the machine agents
that will perform actions on this data. These agents will learn from the inputs provided by
the user, interact with other agents, and do, in a quick and efficient manner, what would
otherwise have to be done by humans.
Representation The first task in implementing the Semantic Web is creating metadata to describe
information in a web page. If each piece of information points to a URL containing data
about that data, machines could follow that URL to further learn about it. This becomes the
basis for the machine agents’ learning. A simple example of describing data in this way is
Extensible Markup Language (XML). Using XML, one can create arbitrary data structures
with user defined names and contents. A parser can then be told to look through these
structures by simply telling it to look for the names of each segment. This satisfies the
requirement for machine-readability, but XML fails to describe what the names and
structures actually mean. As an extension of the capabilities of XML, the W3C outlined the
Resource Description Framework (RDF) data model in the late 1990’s. RDF 1.0 was
published as a W3C recommendation in February 2004, and RDF 1.1 was published in a
W3C Working Group Note in February 2014. RDF is currently the standard for metadata
creation for the Semantic Web.
The RDF Data Model The RDF data model is similar in representation to entity-relationship diagrams in
that it seeks to describe information by denoting the object, a relation, and what it has that
relation to. These three statements make up what is known as an RDF triple: subject,
predicate, and object. For example, “New York City has the location 40°42′46″N
74°00′21″W” as an RDF triple would have the subject “New York City,” the predicate “has
the location,” and the object “40°42′46″N 74°00′21″W.” Furthermore, say that we have the
following set of triples (in pseudocode):
197
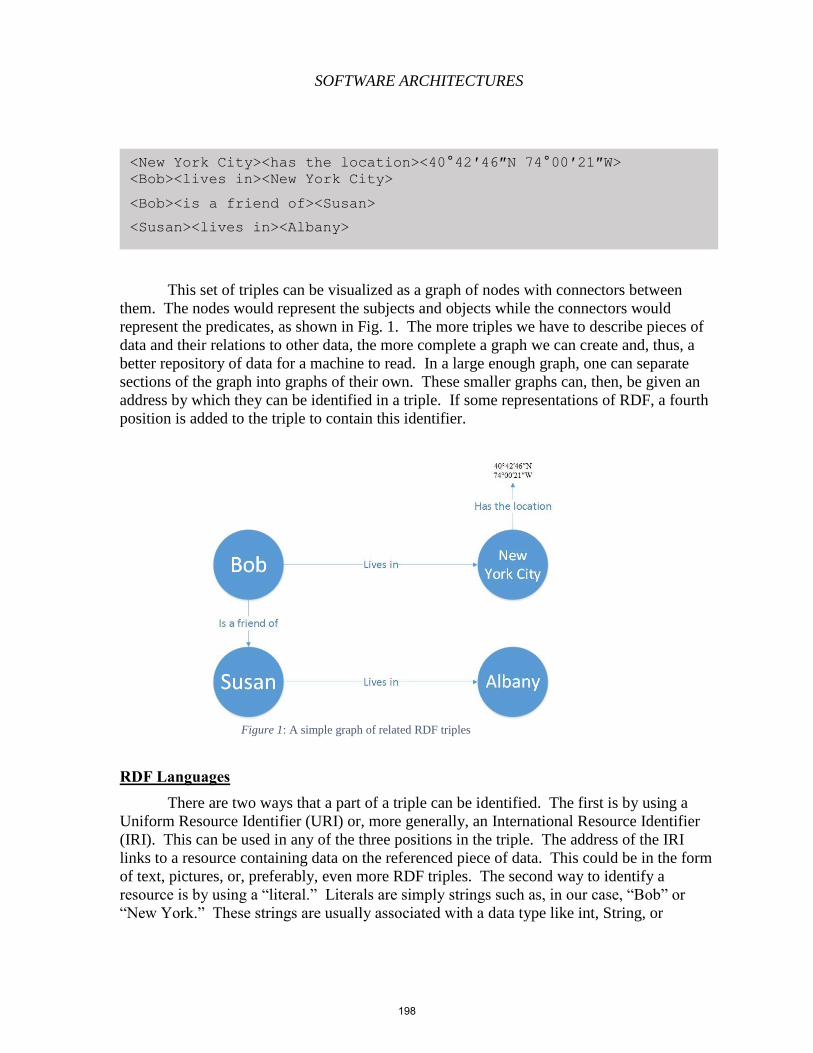
SOFTWARE ARCHITECTURES
This set of triples can be visualized as a graph of nodes with connectors between
them. The nodes would represent the subjects and objects while the connectors would
represent the predicates, as shown in Fig. 1. The more triples we have to describe pieces of
data and their relations to other data, the more complete a graph we can create and, thus, a
better repository of data for a machine to read. In a large enough graph, one can separate
sections of the graph into graphs of their own. These smaller graphs can, then, be given an
address by which they can be identified in a triple. If some representations of RDF, a fourth
position is added to the triple to contain this identifier.
RDF Languages There are two ways that a part of a triple can be identified. The first is by using a
Uniform Resource Identifier (URI) or, more generally, an International Resource Identifier
(IRI). This can be used in any of the three positions in the triple. The address of the IRI
links to a resource containing data on the referenced piece of data. This could be in the form
of text, pictures, or, preferably, even more RDF triples. The second way to identify a
resource is by using a “literal.” Literals are simply strings such as, in our case, “Bob” or
“New York.” These strings are usually associated with a data type like int, String, or
Figure 1: A simple graph of related RDF triples
<New York City><has the location><40°42′46″N 74°00′21″W>
<Bob><lives in><New York City>
<Bob><is a friend of><Susan>
<Susan><lives in><Albany>
198
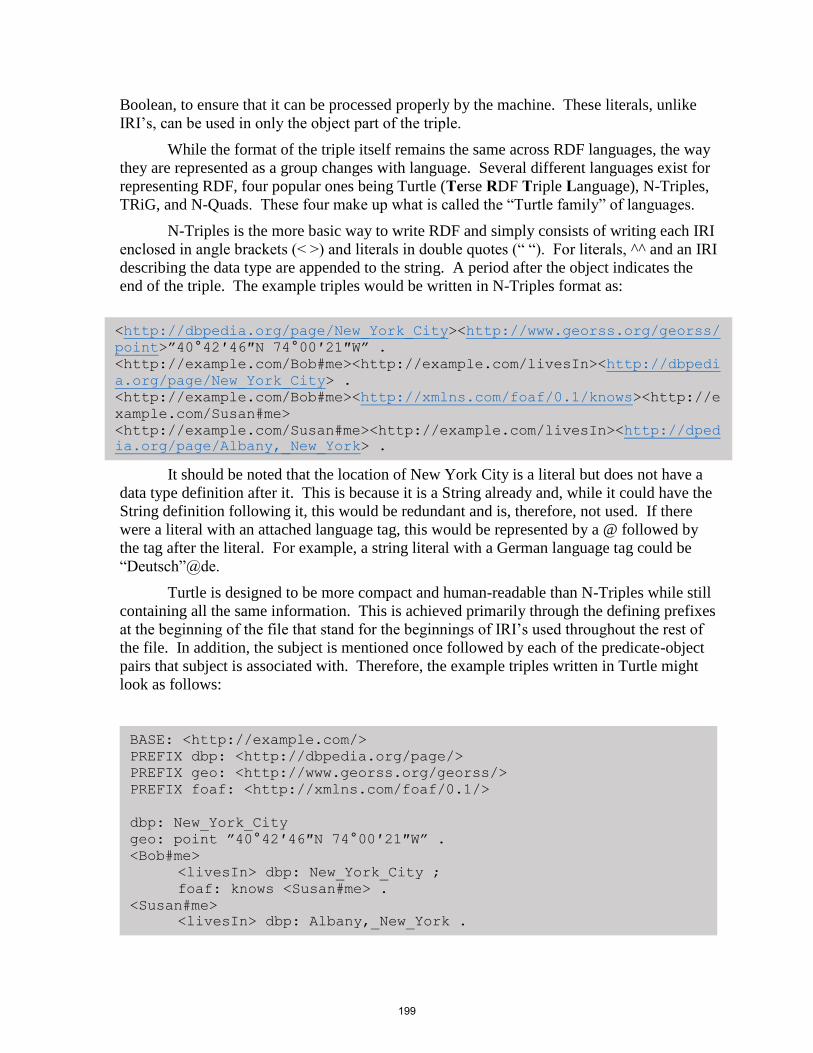
Boolean, to ensure that it can be processed properly by the machine. These literals, unlike
IRI’s, can be used in only the object part of the triple.
While the format of the triple itself remains the same across RDF languages, the way
they are represented as a group changes with language. Several different languages exist for
representing RDF, four popular ones being Turtle (Terse RDF Triple Language), N-Triples,
TRiG, and N-Quads. These four make up what is called the “Turtle family” of languages.
N-Triples is the more basic way to write RDF and simply consists of writing each IRI
enclosed in angle brackets (< >) and literals in double quotes (“ “). For literals, ^^ and an IRI
describing the data type are appended to the string. A period after the object indicates the
end of the triple. The example triples would be written in N-Triples format as:
It should be noted that the location of New York City is a literal but does not have a
data type definition after it. This is because it is a String already and, while it could have the
String definition following it, this would be redundant and is, therefore, not used. If there
were a literal with an attached language tag, this would be represented by a @ followed by
the tag after the literal. For example, a string literal with a German language tag could be
“Deutsch”@de.
Turtle is designed to be more compact and human-readable than N-Triples while still
containing all the same information. This is achieved primarily through the defining prefixes
at the beginning of the file that stand for the beginnings of IRI’s used throughout the rest of
the file. In addition, the subject is mentioned once followed by each of the predicate-object
pairs that subject is associated with. Therefore, the example triples written in Turtle might
look as follows:
<http://dbpedia.org/page/New_York_City><http://www.georss.org/georss/
point>”40°42′46″N 74°00′21″W” .
<http://example.com/Bob#me><http://example.com/livesIn><http://dbpedi
a.org/page/New_York_City> .
<http://example.com/Bob#me><http://xmlns.com/foaf/0.1/knows><http://e
xample.com/Susan#me>
<http://example.com/Susan#me><http://example.com/livesIn><http://dped
ia.org/page/Albany,_New_York> .
BASE: <http://example.com/>
PREFIX dbp: <http://dbpedia.org/page/>
PREFIX geo: <http://www.georss.org/georss/>
PREFIX foaf: <http://xmlns.com/foaf/0.1/>
dbp: New_York_City
geo: point ”40°42′46″N 74°00′21″W” .
<Bob#me>
<livesIn> dbp: New_York_City ;
foaf: knows <Susan#me> .
<Susan#me>
<livesIn> dbp: Albany,_New_York .
199
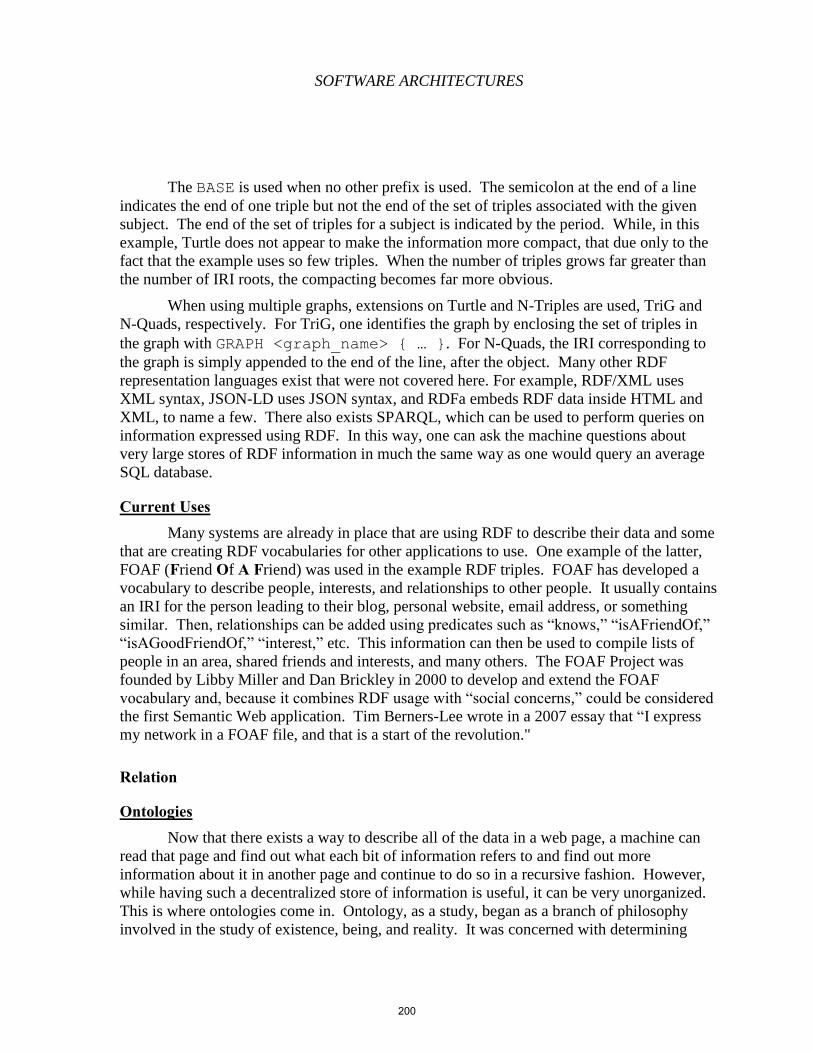
SOFTWARE ARCHITECTURES
The BASE is used when no other prefix is used. The semicolon at the end of a line
indicates the end of one triple but not the end of the set of triples associated with the given
subject. The end of the set of triples for a subject is indicated by the period. While, in this
example, Turtle does not appear to make the information more compact, that due only to the
fact that the example uses so few triples. When the number of triples grows far greater than
the number of IRI roots, the compacting becomes far more obvious.
When using multiple graphs, extensions on Turtle and N-Triples are used, TriG and
N-Quads, respectively. For TriG, one identifies the graph by enclosing the set of triples in
the graph with GRAPH <graph_name> { … }. For N-Quads, the IRI corresponding to
the graph is simply appended to the end of the line, after the object. Many other RDF
representation languages exist that were not covered here. For example, RDF/XML uses
XML syntax, JSON-LD uses JSON syntax, and RDFa embeds RDF data inside HTML and
XML, to name a few. There also exists SPARQL, which can be used to perform queries on
information expressed using RDF. In this way, one can ask the machine questions about
very large stores of RDF information in much the same way as one would query an average
SQL database.
Current Uses Many systems are already in place that are using RDF to describe their data and some
that are creating RDF vocabularies for other applications to use. One example of the latter,
FOAF (Friend Of A Friend) was used in the example RDF triples. FOAF has developed a
vocabulary to describe people, interests, and relationships to other people. It usually contains
an IRI for the person leading to their blog, personal website, email address, or something
similar. Then, relationships can be added using predicates such as “knows,” “isAFriendOf,”
“isAGoodFriendOf,” “interest,” etc. This information can then be used to compile lists of
people in an area, shared friends and interests, and many others. The FOAF Project was
founded by Libby Miller and Dan Brickley in 2000 to develop and extend the FOAF
vocabulary and, because it combines RDF usage with “social concerns,” could be considered
the first Semantic Web application. Tim Berners-Lee wrote in a 2007 essay that “I express
my network in a FOAF file, and that is a start of the revolution."
Relation
Ontologies Now that there exists a way to describe all of the data in a web page, a machine can
read that page and find out what each bit of information refers to and find out more
information about it in another page and continue to do so in a recursive fashion. However,
while having such a decentralized store of information is useful, it can be very unorganized.
This is where ontologies come in. Ontology, as a study, began as a branch of philosophy
involved in the study of existence, being, and reality. It was concerned with determining
200
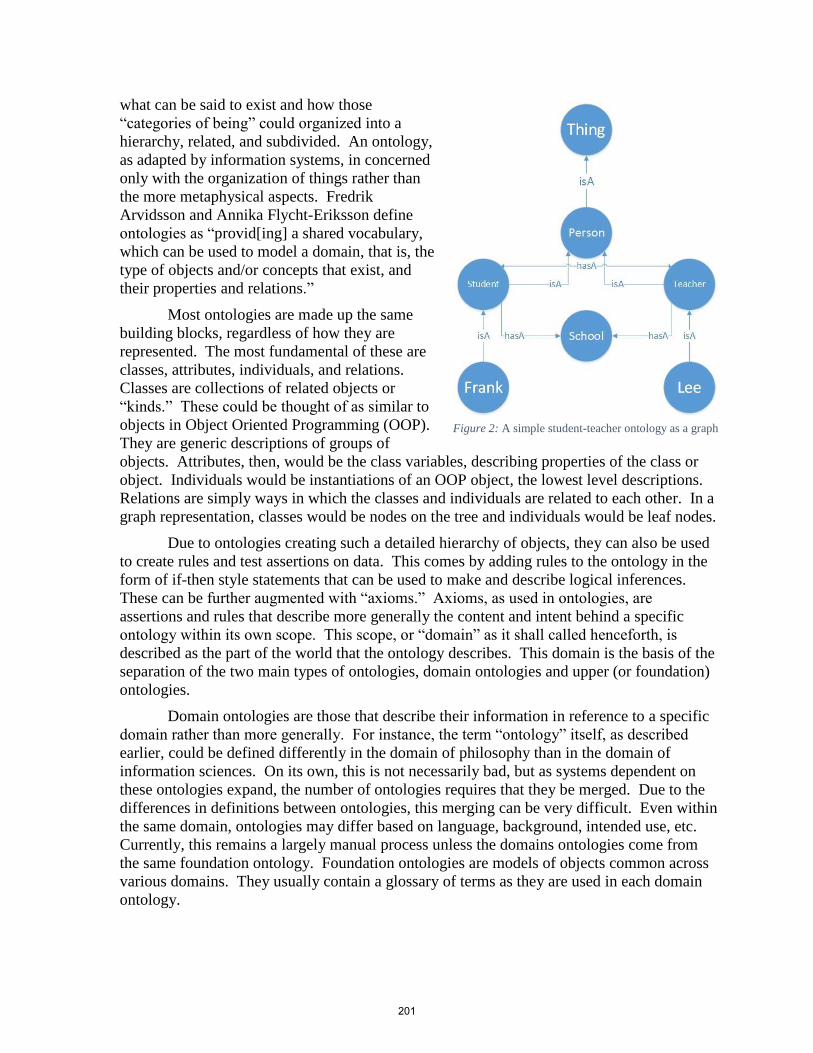
what can be said to exist and how those
“categories of being” could organized into a
hierarchy, related, and subdivided. An ontology,
as adapted by information systems, in concerned
only with the organization of things rather than
the more metaphysical aspects. Fredrik
Arvidsson and Annika Flycht-Eriksson define
ontologies as “provid[ing] a shared vocabulary,
which can be used to model a domain, that is, the
type of objects and/or concepts that exist, and
their properties and relations.”
Most ontologies are made up the same
building blocks, regardless of how they are
represented. The most fundamental of these are
classes, attributes, individuals, and relations.
Classes are collections of related objects or
“kinds.” These could be thought of as similar to
objects in Object Oriented Programming (OOP).
They are generic descriptions of groups of
objects. Attributes, then, would be the class variables, describing properties of the class or
object. Individuals would be instantiations of an OOP object, the lowest level descriptions.
Relations are simply ways in which the classes and individuals are related to each other. In a
graph representation, classes would be nodes on the tree and individuals would be leaf nodes.
Due to ontologies creating such a detailed hierarchy of objects, they can also be used
to create rules and test assertions on data. This comes by adding rules to the ontology in the
form of if-then style statements that can be used to make and describe logical inferences.
These can be further augmented with “axioms.” Axioms, as used in ontologies, are
assertions and rules that describe more generally the content and intent behind a specific
ontology within its own scope. This scope, or “domain” as it shall called henceforth, is
described as the part of the world that the ontology describes. This domain is the basis of the
separation of the two main types of ontologies, domain ontologies and upper (or foundation)
ontologies.
Domain ontologies are those that describe their information in reference to a specific
domain rather than more generally. For instance, the term “ontology” itself, as described
earlier, could be defined differently in the domain of philosophy than in the domain of
information sciences. On its own, this is not necessarily bad, but as systems dependent on
these ontologies expand, the number of ontologies requires that they be merged. Due to the
differences in definitions between ontologies, this merging can be very difficult. Even within
the same domain, ontologies may differ based on language, background, intended use, etc.
Currently, this remains a largely manual process unless the domains ontologies come from
the same foundation ontology. Foundation ontologies are models of objects common across
various domains. They usually contain a glossary of terms as they are used in each domain
ontology.
Figure 2: A simple student-teacher ontology as a graph
201
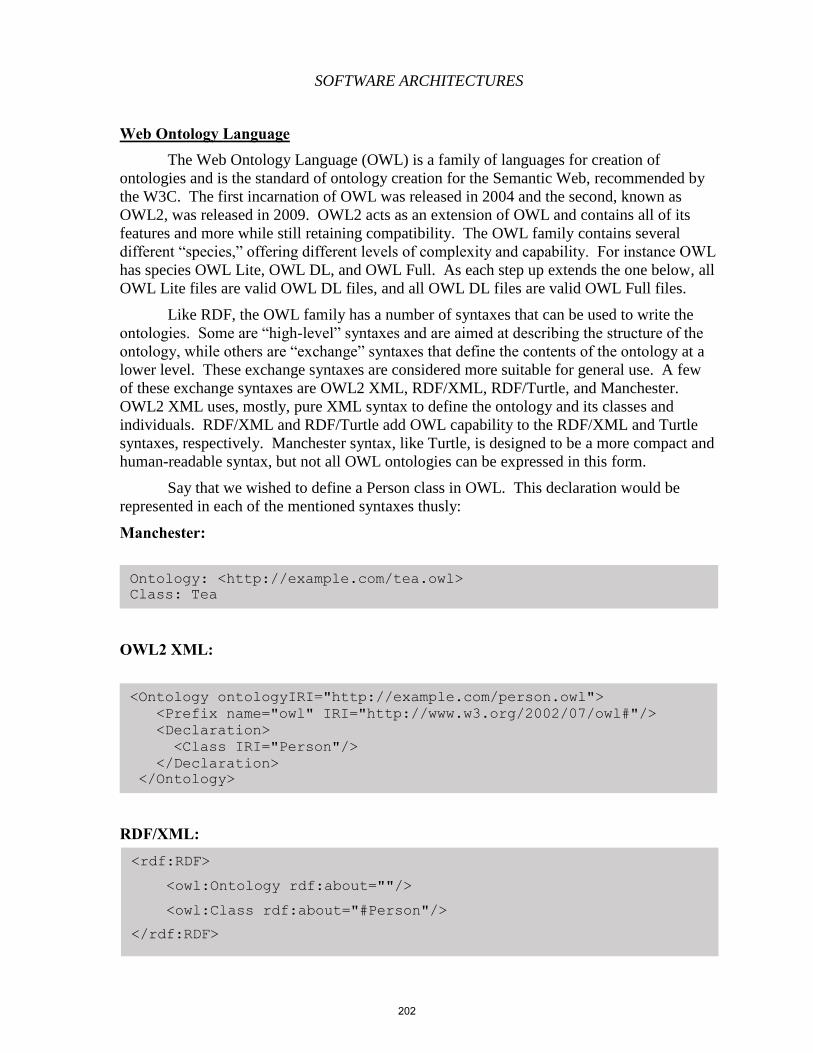
SOFTWARE ARCHITECTURES
Web Ontology Language The Web Ontology Language (OWL) is a family of languages for creation of
ontologies and is the standard of ontology creation for the Semantic Web, recommended by
the W3C. The first incarnation of OWL was released in 2004 and the second, known as
OWL2, was released in 2009. OWL2 acts as an extension of OWL and contains all of its
features and more while still retaining compatibility. The OWL family contains several
different “species,” offering different levels of complexity and capability. For instance OWL
has species OWL Lite, OWL DL, and OWL Full. As each step up extends the one below, all
OWL Lite files are valid OWL DL files, and all OWL DL files are valid OWL Full files.
Like RDF, the OWL family has a number of syntaxes that can be used to write the
ontologies. Some are “high-level” syntaxes and are aimed at describing the structure of the
ontology, while others are “exchange” syntaxes that define the contents of the ontology at a
lower level. These exchange syntaxes are considered more suitable for general use. A few
of these exchange syntaxes are OWL2 XML, RDF/XML, RDF/Turtle, and Manchester.
OWL2 XML uses, mostly, pure XML syntax to define the ontology and its classes and
individuals. RDF/XML and RDF/Turtle add OWL capability to the RDF/XML and Turtle
syntaxes, respectively. Manchester syntax, like Turtle, is designed to be a more compact and
human-readable syntax, but not all OWL ontologies can be expressed in this form.
Say that we wished to define a Person class in OWL. This declaration would be
represented in each of the mentioned syntaxes thusly:
Manchester:
OWL2 XML:
RDF/XML:
<Ontology ontologyIRI="http://example.com/person.owl">
<Prefix name="owl" IRI="http://www.w3.org/2002/07/owl#"/>
<Declaration>
<Class IRI="Person"/>
</Declaration>
</Ontology>
Ontology: <http://example.com/tea.owl>
Class: Tea
<rdf:RDF>
<owl:Ontology rdf:about=""/>
<owl:Class rdf:about="#Person"/>
</rdf:RDF>
202
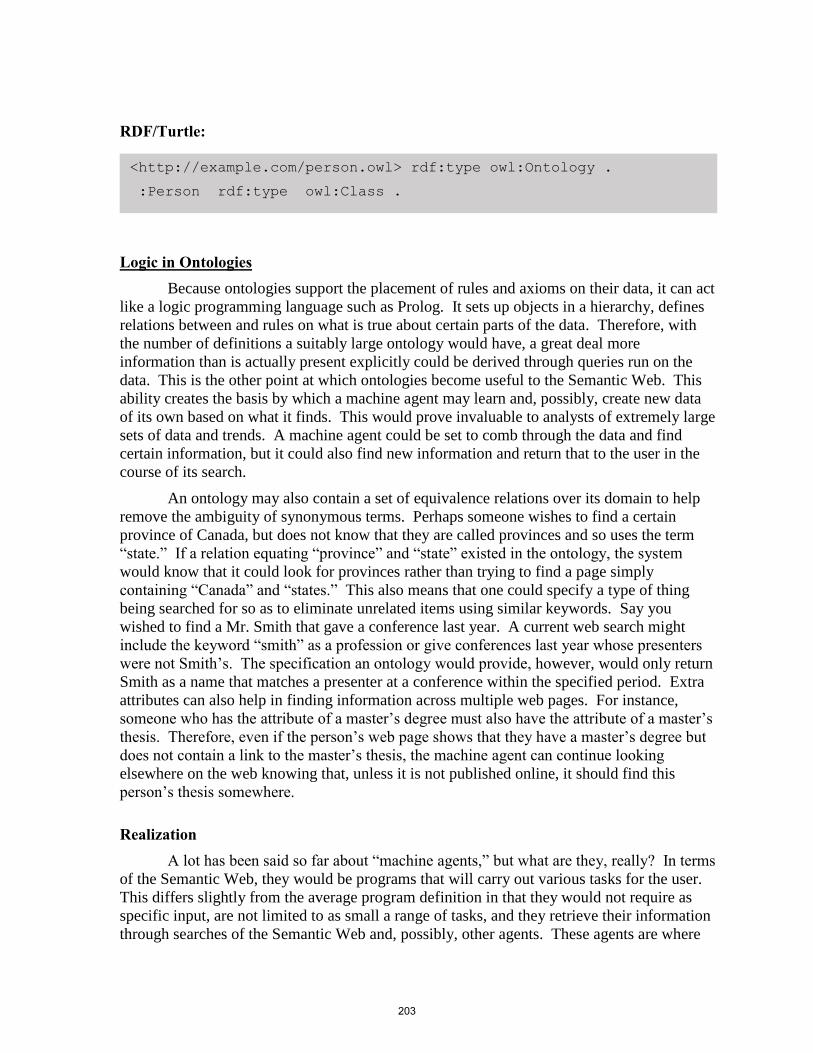
RDF/Turtle:
Logic in Ontologies Because ontologies support the placement of rules and axioms on their data, it can act
like a logic programming language such as Prolog. It sets up objects in a hierarchy, defines
relations between and rules on what is true about certain parts of the data. Therefore, with
the number of definitions a suitably large ontology would have, a great deal more
information than is actually present explicitly could be derived through queries run on the
data. This is the other point at which ontologies become useful to the Semantic Web. This
ability creates the basis by which a machine agent may learn and, possibly, create new data
of its own based on what it finds. This would prove invaluable to analysts of extremely large
sets of data and trends. A machine agent could be set to comb through the data and find
certain information, but it could also find new information and return that to the user in the
course of its search.
An ontology may also contain a set of equivalence relations over its domain to help
remove the ambiguity of synonymous terms. Perhaps someone wishes to find a certain
province of Canada, but does not know that they are called provinces and so uses the term
“state.” If a relation equating “province” and “state” existed in the ontology, the system
would know that it could look for provinces rather than trying to find a page simply
containing “Canada” and “states.” This also means that one could specify a type of thing
being searched for so as to eliminate unrelated items using similar keywords. Say you
wished to find a Mr. Smith that gave a conference last year. A current web search might
include the keyword “smith” as a profession or give conferences last year whose presenters
were not Smith’s. The specification an ontology would provide, however, would only return
Smith as a name that matches a presenter at a conference within the specified period. Extra
attributes can also help in finding information across multiple web pages. For instance,
someone who has the attribute of a master’s degree must also have the attribute of a master’s
thesis. Therefore, even if the person’s web page shows that they have a master’s degree but
does not contain a link to the master’s thesis, the machine agent can continue looking
elsewhere on the web knowing that, unless it is not published online, it should find this
person’s thesis somewhere.
Realization A lot has been said so far about “machine agents,” but what are they, really? In terms
of the Semantic Web, they would be programs that will carry out various tasks for the user.
This differs slightly from the average program definition in that they would not require as
specific input, are not limited to as small a range of tasks, and they retrieve their information
through searches of the Semantic Web and, possibly, other agents. These agents are where
<http://example.com/person.owl> rdf:type owl:Ontology .
:Person rdf:type owl:Class .
203
SOFTWARE ARCHITECTURES
the real power of the Semantic Web is shown and, as the amount of linked information on the
Web grows, so too will the agents’ capabilities. We can create single agents that handle
many types of tasks or many agents to handle specific tasks. The many agent idea might
seem odd today because why would someone want to create and sift through which agent to
use to accomplish a task. However, with everything linked through the Web, agents that
perform these smaller scale tasks could simply be shared across the Web and a user could
have a personal machine agent look through each agent’s tags to see what task it performs
and select the proper one for the task. In this way, agents would not be limited even to
finding information on their own. They could make use of any part of the Web to
accomplish their goals.
Single-Agent Let’s start with what a single agent can do with the Semantic Web. Ways have
already been described how an agent could use the metadata and relations of a Semantic Web
page, but there is another aspect of the ontologies that enhances the agent’s capabilities.
With the logical inference abilities of an ontology, proofs can be set up to verify information.
Say, then, your agent’s search comes up with something unexpected and you wish to verify
that the information is correct. Your agent will give the list of information it found and run it
through the rules set up by the ontology and show that its data is, in fact, correct. In addition
to this, you will want to make sure that the information is from a reliable source. This where
“digital signatures” come in. These signatures will be attached to the web pages and/or
agents so that your agent can verify what the source of the information is and whether or not
that source can be trusted. The user, of course, could also set up their own restrictions on
where their agent gets its data. This process could be much like “trusted sites” in the current
web work. The user could define sources of information that the agent has encountered as
trusted or not. Even if they are trusted, the user could simply refuse the site anyway if they
do not want information form that source.
This particular method could be used as a means of parental control as well. If a
parent did not wish a child to see a particular web site or group of sites relating to certain
information, they could simply instruct the agent to not retrieve information from those
sources. Thus, rather than returning the conspicuous “Forbidden” message, the child would
not even be informed that those pages exist. The same idea could also be extended to work
the other way around for security purposes. Say a company or even military organization
does not want certain information that they have stored on the web to be accessed by
unauthorized people. They could instruct the web page to check the signature of any agent
that tries to access it and, if the agent is on a trusted list, let them through or, if they are not
trusted, see to who or what that agent belongs to determine if the attempted access was a
threat or if it was merely stumbled upon the page. The seeking agent, of course, would have
a record that it tried to visit this site, but unless the user accessed the log of pages visited,
they would be given no indication of the page’s existence.
Agents and Services The interview scheduling example given at the beginning of this chapter would not
have been performed by a single agent on its own. It would have enlisted the aid of any other
204
services that could do the tasks it needed. In this way, these tasks could be carried out
simultaneously where possible to expedite the process. Once it enlisted services gathered the
information needed, they could simply return it to the original agent which could, then,
continue its processes as could the services it enlisted. This type of process is called “service
discovery.” This can only occur when the services and the agent seeking them use the same
“language” and can, therefore, transmit information between them. Currently, this is
uncommon but, with the Semantic Web, everything would be inter-interpretable and, if
needed, ontologies could aid in understanding between particularly large understanding
barriers. Once information be transmitted, the agent can determine what the service does and
how and can make an informed decision based on that information. Whether the service can
be trusted links back to the digital signatures and proofs discussed earlier.
With the decentralized store of data the Semantic Web would have, a person could
create a service, post it on the web with appropriate metadata, and these services could be
advertised in a common location so that other agents could easily locate them. Web-service
based applications similar to this already exist and are becoming more and more common.
These web services, however, are not self-advertising and, therefore, a user must already
know that they exist to make use of them. These services also do not make use of services or
information outside of their own store. Since these web-services are close to what we want,
though, all they need is a sufficient store of metadata, links to appropriate ontologies, and a
place to advertise them and they will be nicely migrated to Semantic Web usage.
Inter-Agent Given the number of people sending their machine agents about on the Web, it is
inevitable that many will meet each other at various times. In current multi-threaded
programming, two threads trying to access the same information could lead to a “data race”
and is avoided whenever possible. Multiple machine agents trying to access the same
information or services, however, can be beneficial to all agents involved. The service can
be notified that multiple agents want the same information and simply distribute it to each
one. This way, the service would not have to perform the same tasks multiple times in a row,
but it would also save time for the agents arriving later than others. While the agents are
together, they could also see each other’s ontologies and exchange the aspects that are
helpful to their tasks and be, therefore better equipped. The user can also be notified that its
agent has gained new nodes and relations on its ontology and the user can review them and
get new ideas for their own agents, ontologies, etc. Of course, ontologies between different
agents will almost never map perfectly. However, if enough ontologies get their
vocabularies from similar sources, this would prove far less of a problem. At first contact,
two agents would merely need to establish a sort of temporary mapping between each other’s
ontologies, but as they interact more and more often with each other, these mappings would
need to become more efficient and accurate. Finding the best way to do these mappings and
determine when what kind is needed, etc. is a challenging aspect of the Semantic Web and a
topic of continuing work
Challenges Many critics have pointed out various “flaws” in the feasibility and implementation of
the Semantic Web. Some of these concerns are simpler to solve and others are topics on
205
SOFTWARE ARCHITECTURES
ongoing discussion and debate. Here will be discussed the most prominent of these
challenges.
The Internet is BIG The current World Wide Web has billions of pages. For the Semantic Web to be
fully realized, each of these pages should be encoded with machine-readable data, linked to
ontologies, etc. Doing this manually would take an extremely long time and, since a great
deal of the population would not or could not perform this task, the task would fall to a
relatively small group of people to convert the entire Web to machine-readability. One also
has to take into account the rate at which web pages are being created. Even if the Web
could be converted in its entirety, it would be very difficult to try and eliminate duplicate
pages and ontological terms. Any automated system to deal with eliminating duplicates or
reasoning through the current data would have to deal with massive input sizes that would
take an equally massive amount of computing power. This second problem is one that is
difficult to solve and is an ongoing subject of investigation. The first, however, is a little
easier to solve.
The average person will not be willing to convert their web pages to Semantic Web
standards without first seeing that it would be beneficial enough to be worth their time.
However, for this to happen, people need to create pages this way so that others can see what
they are capable of. Escape from this cycle requires that some create semantic web pages to
be serve those example roles. Luckily, there are many projects already doing exactly that.
DBPedia, for example, is taking pages from Wikipedia, publishing them in structured format
using RDF and making them available to the public. Another is the aforementioned Friend
of a Friend project. Now that people can see some of the potential of the Semantic Web, they
need to be able to publish pages like this themselves. This requires that doing so be simple
enough for the average person to do without a great deal of effort. In fact, it should require
little to no effort at all.
An example solution to this would be to use an interface that requires of the user no
programming ability and keeps most of the generation of metadata behind the scenes. An
example would be something that allows users to drag-and-drop metadata and ontology
presets onto certain data in the page that can be edited in a menu. Each of these components
should be implemented in as close to natural language as possible so as to promote
understanding to the user of what, exactly, they are doing. There are many other possible
ways to go about it, but creating a way for the average person to easily create Semantic Web
pages would greatly aid the problems of converting the current Web and ensuring that future
web pages are also compatible.
Vagueness Human speech is often interspersed with vague phrases like “long,” “big,” etc. This
would result in vagueness in both user input and the metadata and ontologies themselves.
Added complication arises when conflicting ideas of what the term means make their way to
the same reasoning space. For instance, “tall” means something very different when
speaking of buildings than it does when speaking of people or of mountains. Trying to
206
resolve the differences or overlap them into the same knowledge base poses a great
difficulty. The most common way to deal with this issue is through the use of “fuzzy logic.”
Fuzzy logic, rather than assigning specific values to these terms, assigns a range of values.
The range can also be set to different values in different contexts or ontologies.
Censorship and Privacy The amount of data in the Semantic Web allows for more information to be shared
among more people than ever before. Because this would, ideally, be applied universally,
however, this would also cause a great deal of information to be available that people might
not want known. For instance, formerly anonymous posts might have a tag attached to them
revealing the author or concepts previously kept hidden through usage of invented words,
images, etc. could be interpreted by means of the metadata attached to it. For the former, this
would consist of a severe breach of privacy in the view of many people. For the latter, it
would enable censorship by governments in previously unseen magnitudes. The combination
of a FOAF profile and location metadata might enable someone to easily find out where a
user or people they know are at almost any given moment. Even with the current Web,
censorship and privacy are subjects of much continuing debate and are even more so in the
context of the Semantic Web.
Future Applications The Semantic Web allows us to describe anything on the web. This, of course, is not
limited to what is currently available. As new items or knowledge come about, the Semantic
Web will allow us to describe those things in terms of what we already know or invent new
ways to describe them, making this new knowledge more readily available and
understandable to the average person. This also means that current information can cross
barriers of knowledge, culture, language, etc. making all information understandable by all.
Completely different groups of people would be able to understand each other because the
information could be put in a way they could easily understand.
To take it even further, URI’s can be used to describe both virtual and physical
objects. With the Semantic Web, we can extend its capabilities to any web-enabled device.
Things such as TVs, stereos, appliances, etc. would be able to utilize the Web to aid in
accomplishing their tasks as well. A thermostat could read your schedule and change the
temperature in your house to save energy while you are gone. You could tell your oven what
you want it to cook and it could consult the manufacturer and determine how to do so
automatically. The possibilities are endless.
Summary Many of the examples of the abilities of a fully functional Semantic Web that have
been here presented, if presented to someone a decade ago, would have been seen as mere
science fiction. Perhaps there are some still who would see it as such. However, with the
development and rising awareness of technologies such as RDF and machine ontologies,
such a world is very well within our grasp. We have the tools to make the Semantic Web a
reality in the near future. All we must do is make it so.
207
SOFTWARE ARCHITECTURES
References
"Berners-Lee, Tim; Cailliau, Robert (12 November 1990). "WorldWideWeb: Proposal for a
hypertexts Project"
"Tim Berners-Lee's original World Wide Web browser".
"Berners-Lee on the read/write web". BBC News. 2005-08-09.
Berners-Lee, T., Hendler, J., & Lassila, O. (2001). The semantic web. Scientific american,
284(5), 28-37.
http://www.w3.org/TR/2014/NOTE-rdf11-primer-20140225/ (February 25, 2014)
Berners Lee, Tim. "CSail". Giant Global Graph. MA, USA: MIT..
Arvidsson, F.; Flycht-Eriksson, A. "Ontologies I" (PDF).
Web Ontology Language
Hendler, J. (2001). Agents and the semantic web. IEEE Intelligent systems, 16(2), 30-37.
World Web Size
208
SOFTWARE ARCHITECTURES
Chapter 16 – Linked Data, Ontologies, and DBpedia Alex Adamec
Abstract The Semantic Web is a collaborative movement which promotes common data formats
on the World Wide Web and aims to convert the currently unstructured and semi-structured
documents on the web into a “web of data” by encouraging the inclusion of semantic content
(metadata) in web pages. [7] Not only does the Semantic Web need access to data, but
relationships among data should be made available, too. This collection of interrelated datasets
on the web is referred to as Linked Data, and the relationships among the data are defined using
vocabularies, or ontologies. [11] [13] Just as relational databases or XML need specific query
languages, the Web of Data needs its own specific query language and facilities. This is provided
by the SPARQL query language and the accompanying protocols. [14] To improve the quality of
data integration on the web, inferences are used to automatically analyze the content of data and
discover new relationships. [12]
1 – Background Cognitive scientist Allan M. Collins, linguist M. Ross Quillian, and psychologist
Elizabeth F. Loftus formed the concept of the Semantic Network Model in the early 1960s as a
form to represent semantically structured knowledge. [7] By inserting machine-readable
metadata about pages and how they are related to each other, the Semantic Network Model
extends the network of hyperlinked human-readable web pages by enabling automated agents to
access the Web more intelligently and perform tasks on behalf of users. [7] The term "Semantic
Web" was coined by Tim Berners-Lee, the inventor of the World Wide Web and director of the
World Wide Web Consortium ("W3C"). He defines the Semantic Web as "a web of data that can
be processed directly and indirectly by machines." [7]
2 – Purpose Today, humans can use the web to perform tasks which machines are incapable of
accomplishing without human direction because web pages are designed to be read by people,
not machines. The semantic web, however, is a system that requires that the relevant information
sources be semantically structured so as to enable machines to "understand" and respond to
complex human requests based on their meaning. [7]
Tim Berners-Lee originally expressed the vision of the Semantic Web as follows:
I have a dream for the Web [in which computers] become capable of analyzing all the data on the Web – the
content, links, and transactions between people and computers. A "Semantic Web", which makes this
possible, has yet to emerge, but when it does, the day-to-day mechanisms of trade, bureaucracy and our daily
lives will be handled by machines talking to machines. The "intelligent agents" people have touted for ages
will finally materialize. [7]
209
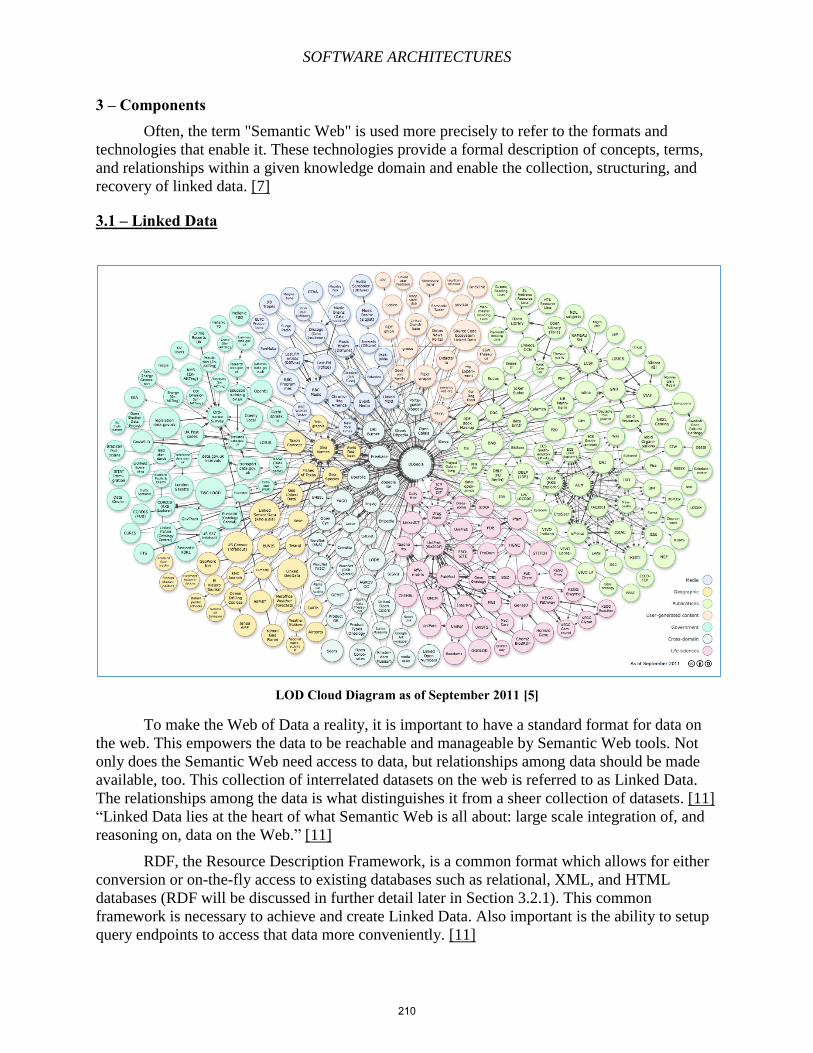
SOFTWARE ARCHITECTURES
3 – Components Often, the term "Semantic Web" is used more precisely to refer to the formats and
technologies that enable it. These technologies provide a formal description of concepts, terms,
and relationships within a given knowledge domain and enable the collection, structuring, and
recovery of linked data. [7]
3.1 – Linked Data
LOD Cloud Diagram as of September 2011 [5]
To make the Web of Data a reality, it is important to have a standard format for data on
the web. This empowers the data to be reachable and manageable by Semantic Web tools. Not
only does the Semantic Web need access to data, but relationships among data should be made
available, too. This collection of interrelated datasets on the web is referred to as Linked Data.
The relationships among the data is what distinguishes it from a sheer collection of datasets. [11]
“Linked Data lies at the heart of what Semantic Web is all about: large scale integration of, and
reasoning on, data on the Web.” [11]
RDF, the Resource Description Framework, is a common format which allows for either
conversion or on-the-fly access to existing databases such as relational, XML, and HTML
databases (RDF will be discussed in further detail later in Section 3.2.1). This common
framework is necessary to achieve and create Linked Data. Also important is the ability to setup
query endpoints to access that data more conveniently. [11]
210
SOFTWARE ARCHITECTURES
3.2 – Ontologies The Semantic Web is a Web of Data — of people and titles and dates and product
numbers and any other data one might think of. Semantic Web technologies such as RDF, OWL,
and SPARQL combine to allow applications to query that data and draw inferences using
ontologies. [11]
Ontologies define the concepts and “terms” (relationships) used to describe and represent
an area of concern. According to the World Wide Web Consortium, ontologies “are used to
classify the terms that can be used in a particular application, characterize possible relationships,
and define possible constraints on using those terms.” [13] The complexity of ontologies can
vary greatly. Ontologies can be very simple (describing only one or two concepts) or very
intricate (containing several thousand terms). [13]
The terms “ontology” and “vocabulary” are used interchangeably, although their
meanings differ slightly. The word “ontology” is typically reserved for more complex, formal
collections of terms, whereas “vocabulary” is used when such strict formalism is unnecessary or
used only in a very loose sense. [13]
Vocabularies help data integration when ambiguities may exist on the terms used in the
different data sets. Vocabularies also form the basic building blocks for inference techniques.
W3C offers an example of this regarding the application of ontologies in the field of health care:
Medical professionals use [ontologies] to represent knowledge about symptoms, diseases, and treatments.
Pharmaceutical companies use [ontologies] to represent information about drugs, dosages, and allergies.
Combining this knowledge from the medical and pharmaceutical communities with patient data enables a
whole range of intelligent applications such as decision support tools that search for possible treatments;
systems that monitor drug efficacy and possible side effects; and tools that support epidemiological
research. [13]
Another use of ontologies is to organize knowledge. Ontologies can be used as standard
formalisms by museums, libraries, enterprises, newspapers, etc. to manage their large collections
of historical artifacts, books, business glossaries, and news reports. [13]
The complexity of the vocabularies used varies by application. Although some
applications may decide to rely on the logic of the application program and not even use small
vocabularies, other applications may need more complex ontologies with complex reasoning
procedures. It all depends on the requirements and the goals of the applications. To satisfy these
different needs, a large palette of techniques to describe and define different forms of
vocabularies in a standard format are used: These include RDF and RDF Schemas, Simple
Knowledge Organization System (SKOS), Web Ontology Language (OWL), and the Rule
Interchange Format (RIF). [13]
3.2.1 – Ontology Languages
Ontologies are constructed using formal languages known as ontology languages. These
languages permit the encoding of knowledge about specific domains and often include reasoning
rules that support the processing of that knowledge. [6] Usually declarative languages, ontology
languages are almost always generalizations of frame languages, and they are commonly based
on either description logic or first-order logic. [6]
211
SOFTWARE ARCHITECTURES
Resource Description Framework
One example of an ontology language is the Resource Description Framework (RDF). RDF is a
general method to decompose any type of knowledge into small pieces using some rules about
the semantics, or meaning, of those pieces. [8] The following is an example of some RDF:
@PREFIX : <HTTP://WWW.EXAMPLE.ORG/> .
:JOHN A :PERSON .
:JOHN :HASMOTHER :SUSAN .
:JOHN :HASFATHER :RICHARD .
:RICHARD :HASBROTHER :LUKE .
RDF isn’t concerned merely with how it is written. RDF is about representing network-
or graph-structured information. [8] Like RDF, XML also is designed to be simple and general-
purpose, and RDF can be written in XML such as in the following example:
<RDF:RDF XMLNS:RDF="HTTP://WWW.W3.ORG/1999/02/22-RDF-SYNTAX-NS#"
XMLNS:NS="HTTP://WWW.EXAMPLE.ORG/#">
<NS:PERSON RDF:ABOUT="HTTP://WWW.EXAMPLE.ORG/#JOHN">
<NS:HASMOTHER RDF:RESOURCE="HTTP://WWW.EXAMPLE.ORG/#SUSAN" />
<NS:HASFATHER>
<RDF:DESCRIPTION RDF:ABOUT="HTTP://WWW.EXAMPLE.ORG/#RICHARD">
<NS:HASBROTHER RDF:RESOURCE="HTTP://WWW.EXAMPLE.ORG/#LUKE" />
</RDF:DESCRIPTION>
</NS:HASFATHER>
</NS:PERSON>
</RDF:RDF>
RDF is designed to represent knowledge in a distributed world and thus is particularly
concerned with meaning. Each element mentioned in RDF means something, whether a
reference to an abstract concept, something concrete in the world, or a fact. [8]
RDF is well suited for distributed knowledge. RDF applications are able to combine RDF
files from different sources and easily learn from them new things by linking documents together
by their common vocabularies and by allowing any document to use any vocabulary. This
flexibility is fairly unique to RDF. [8]
@PREFIX : <HTTP://WWW.EXAMPLE.ORG/> .
:RICHARD :HASSISTER :REBECCA
{ ?A :HASFATHER ?B . ?B :HASSISTER ?C . } => { ?A :HASAUNT ?C } .
In the RDF above, the document uses two other relations to define what it means to be an
aunt. In RDF, names of entities are global. [8] This means when :JOHN and :HASFATHER are
used in one document, applications can assume they have the same meaning in any other RDF
document with the same @prefix. [8] Because of this, an application would be able to put this
document together with the first RDF document to determine that :REBECCA is :JOHN's aunt.
RDF can be used to integrate data from different sources without custom programming or to
offer data for re-use by other parties. [8]
212
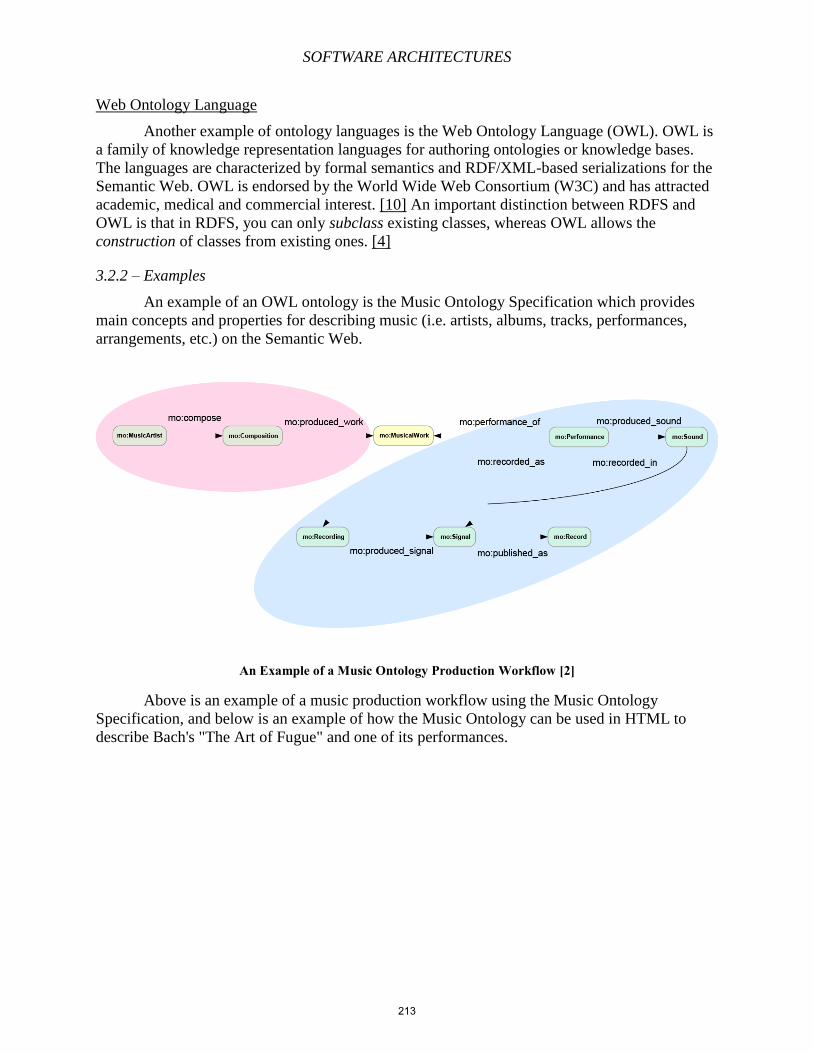
SOFTWARE ARCHITECTURES
Web Ontology Language
Another example of ontology languages is the Web Ontology Language (OWL). OWL is
a family of knowledge representation languages for authoring ontologies or knowledge bases.
The languages are characterized by formal semantics and RDF/XML-based serializations for the
Semantic Web. OWL is endorsed by the World Wide Web Consortium (W3C) and has attracted
academic, medical and commercial interest. [10] An important distinction between RDFS and
OWL is that in RDFS, you can only subclass existing classes, whereas OWL allows the
construction of classes from existing ones. [4]
3.2.2 – Examples
An example of an OWL ontology is the Music Ontology Specification which provides
main concepts and properties for describing music (i.e. artists, albums, tracks, performances,
arrangements, etc.) on the Semantic Web.
An Example of a Music Ontology Production Workflow [2]
Above is an example of a music production workflow using the Music Ontology
Specification, and below is an example of how the Music Ontology can be used in HTML to
describe Bach's "The Art of Fugue" and one of its performances.
213
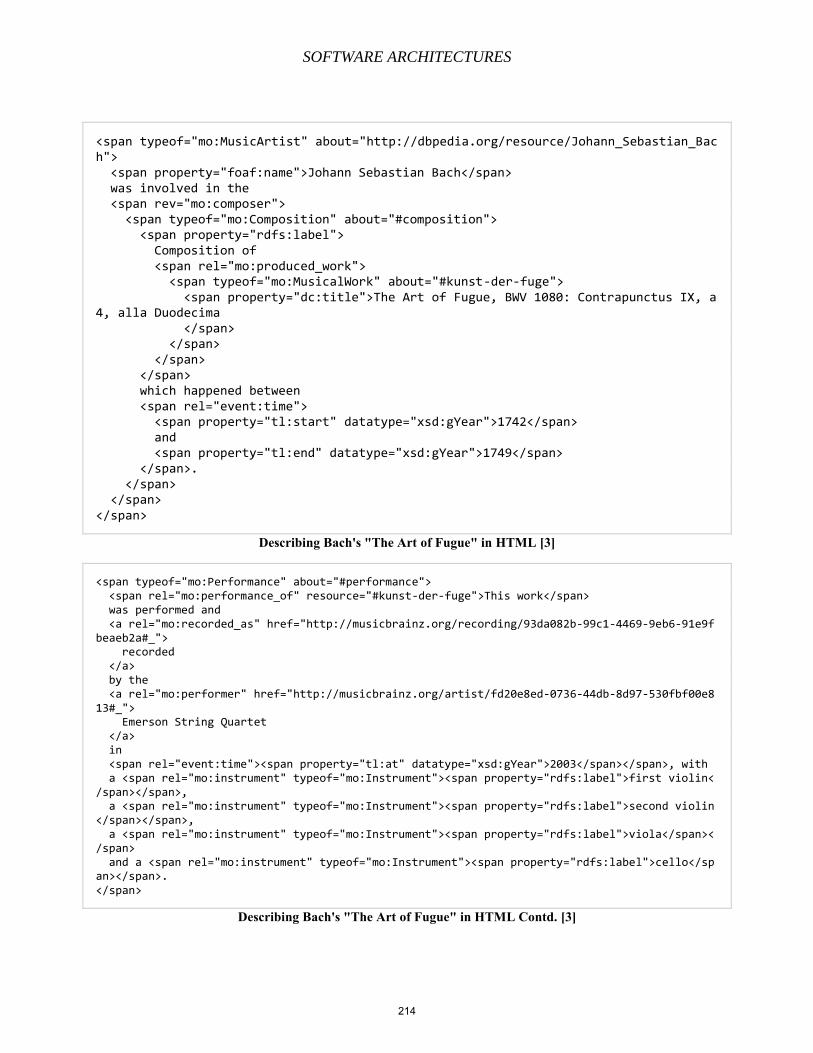
SOFTWARE ARCHITECTURES
<span typeof="mo:MusicArtist" about="http://dbpedia.org/resource/Johann_Sebastian_Bach"> <span property="foaf:name">Johann Sebastian Bach</span> was involved in the <span rev="mo:composer"> <span typeof="mo:Composition" about="#composition"> <span property="rdfs:label"> Composition of <span rel="mo:produced_work"> <span typeof="mo:MusicalWork" about="#kunst-der-fuge"> <span property="dc:title">The Art of Fugue, BWV 1080: Contrapunctus IX, a 4, alla Duodecima </span> </span> </span> </span> which happened between <span rel="event:time"> <span property="tl:start" datatype="xsd:gYear">1742</span> and <span property="tl:end" datatype="xsd:gYear">1749</span> </span>. </span> </span> </span>
Describing Bach's "The Art of Fugue" in HTML [3]
<span typeof="mo:Performance" about="#performance"> <span rel="mo:performance_of" resource="#kunst-der-fuge">This work</span> was performed and <a rel="mo:recorded_as" href="http://musicbrainz.org/recording/93da082b-99c1-4469-9eb6-91e9fbeaeb2a#_"> recorded </a> by the <a rel="mo:performer" href="http://musicbrainz.org/artist/fd20e8ed-0736-44db-8d97-530fbf00e813#_"> Emerson String Quartet </a> in <span rel="event:time"><span property="tl:at" datatype="xsd:gYear">2003</span></span>, with a <span rel="mo:instrument" typeof="mo:Instrument"><span property="rdfs:label">first violin</span></span>, a <span rel="mo:instrument" typeof="mo:Instrument"><span property="rdfs:label">second violin</span></span>, a <span rel="mo:instrument" typeof="mo:Instrument"><span property="rdfs:label">viola</span></span> and a <span rel="mo:instrument" typeof="mo:Instrument"><span property="rdfs:label">cello</span></span>. </span>
Describing Bach's "The Art of Fugue" in HTML Contd. [3]
214
SOFTWARE ARCHITECTURES
3.3 – Queries The Web of Data, usually represented using RDF, needs its own, RDF-specific query
language and facilities just as relational databases and XML need specific query languages such
as SQL and XQuery, respectively. This is provided by the SPARQL query language and the
accompanying protocols. SPARQL makes it possible to send queries and receive results, e.g.,
through HTTP or SOAP. [14]
As W3C explains, “SPARQL queries are based on (triple) patterns. RDF can be seen as a
set of relationships among resources (i.e., RDF triples); SPARQL queries provide one or more
patterns against such relationships. These triple patterns are similar to RDF triples, except that
one or more of the constituent resource references are variables. A SPARQL engine would
returns the resources for all triples that match these patterns.” [14]
Consumers are able to use SPARQL to extract possibly complex information like existing
resource references and their relationships. This information can be returned, for example, in a
table format, and this table can then be incorporated into another web page. This approach allows
SPARQL to provide a powerful tool to build complex mash-up sites or search engines that
include data stemming from the Semantic Web. [14]
3.4 – Inferences Inference on the Semantic Web can be characterized, broadly speaking, by discovering
new relationships or ontologies. Data is modeled as a set of named relationships between
resources. “Inference” means that automatic procedures are able to generate new relationships
based on the data and on some additional information in the form of a vocabulary or rule sets.
[12]
Both vocabularies (ontologies) and rule sets draw upon knowledge representation
techniques. Generally speaking, ontologies concentrate on classification methods, and rules
focus on defining a general mechanism for discovering and generating new relationships based
on existing ones. Unlike rule sets, ontologies put an emphasis on defining 'classes' and
'subclasses', on defining how individual resources can be associated to such classes, and on
characterizing the relationships among classes and their instances. [12]
To improve the quality of data integration on the web, inferences are used to
automatically analyze the content of data and discover new relationships. Inference based
techniques are also important in discovering possible inconsistencies in the (integrated) data.
[12]
4 – Projects This section lists one of the many projects and tools that exist to create Semantic Web
solutions: DBpedia.
215
SOFTWARE ARCHITECTURES
4.1 – DBpedia
DBpedia Logo [9]
Wikipedia has grown into one of the central knowledge sources of mankind, maintained
by thousands of contributors. The DBpedia project leverages this gigantic source of knowledge
by extracting structured information from Wikipedia and by making this information accessible
on the Web under the terms of the Creative Commons Attribution-ShareAlike 3.0 License and
the GNU Free Documentation License. [1]
According to dbpedia.org, “The English version of the DBpedia knowledge base
currently describes 4.0 million things, out of which 3.22 million are classified in a consistent
ontology, including 832,000 persons, 639,000 places (including 427,000 populated places),
372,000 creative works (including 116,000 music albums, 78,000 films and 18,500 video
games), 209,000 organizations (including 49,000 companies and 45,000 educational institutions),
226,000 species and 5,600 diseases.” [1]
Localized versions of DBpedia are also available in 119 languages. Together, all of these
versions describe 24.9 million things, out of which 16.8 million are interlinked with the concepts
from the English Dbpedia. The full DBpedia data set features labels and abstracts for 12.6
million unique things in 119 different languages; 24.6 million links to images and 27.6 million
links to external web pages; 45.0 million external links into other RDF datasets, 67.0 million
links to Wikipedia categories, and 41.2 million YAGO categories. The dataset consists of 2.46
billion pieces of information (RDF triples) out of which 470 million were extracted from the
English edition of Wikipedia, 1.98 billion were extracted from other language editions, and about
45 million are links to external datasets. [1]
The DBpedia knowledge base has several advantages over existing knowledge bases. The
DBpedia knowledge base covers many domains; it represents real community agreement; it
automatically evolves as Wikipedia changes, and it is truly multilingual. [1] “The DBpedia
knowledge base allows you to ask quite surprising queries against Wikipedia, for instance ‘Give
me all cities in New Jersey with more than 10,000 inhabitants’ or ‘Give me all Italian musicians
from the 18th century’. Altogether, the use cases of the DBpedia knowledge base are widespread
and range from enterprise knowledge management, over Web search to revolutionizing
Wikipedia search,” dbpedia.org explains. [1]
5 – Conclusion The Semantic Web is a collaborative movement which uses vocabularies, or ontologies,
to define the relationships among data and create collections of interrelated datasets on the web,
referred to as Linked Data. [11] [13] By promoting common data formats on the World Wide
Web and by encouraging the inclusion of semantic content in web pages, the Semantic Web
movement aims to convert the documents on the web into a “web of data”. [7] The SPARQL
query language and the accompanying protocols provide a specific query language to extract
possibly complex information like existing resource references and their relationships. [14]
216
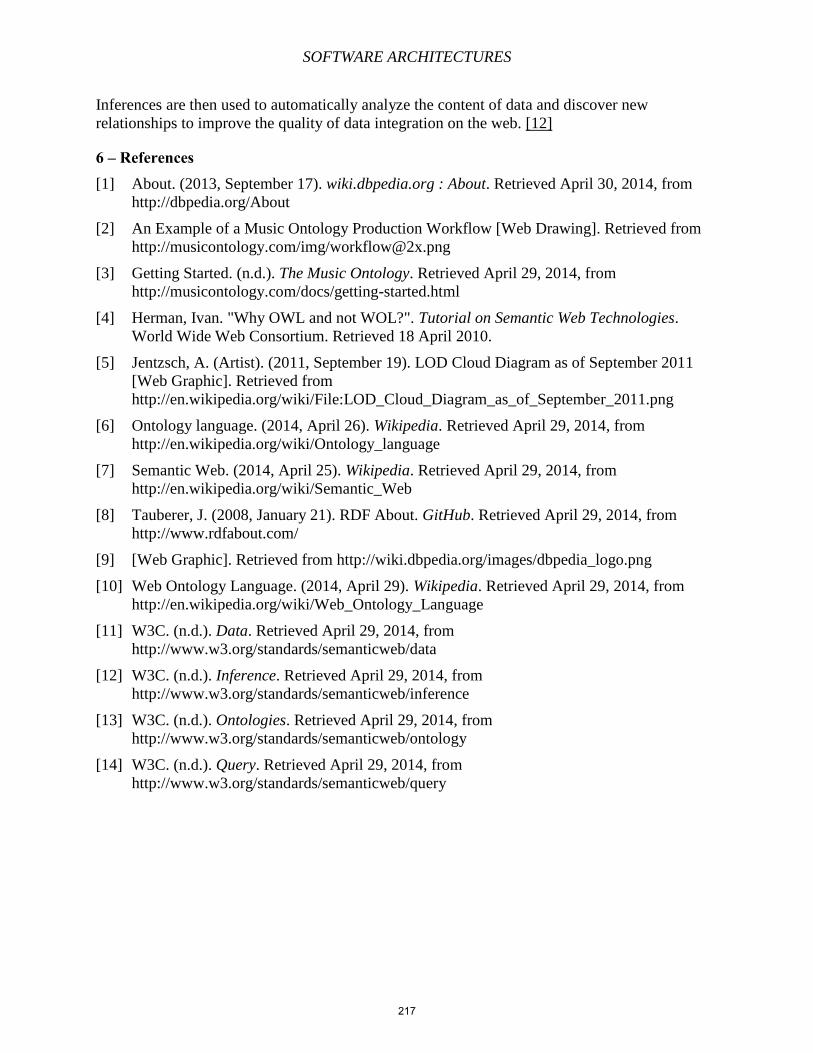
SOFTWARE ARCHITECTURES
Inferences are then used to automatically analyze the content of data and discover new
relationships to improve the quality of data integration on the web. [12]
6 – References [1] About. (2013, September 17). wiki.dbpedia.org : About. Retrieved April 30, 2014, from
http://dbpedia.org/About
[2] An Example of a Music Ontology Production Workflow [Web Drawing]. Retrieved from
http://musicontology.com/img/[email protected]
[3] Getting Started. (n.d.). The Music Ontology. Retrieved April 29, 2014, from
http://musicontology.com/docs/getting-started.html
[4] Herman, Ivan. "Why OWL and not WOL?". Tutorial on Semantic Web Technologies.
World Wide Web Consortium. Retrieved 18 April 2010.
[5] Jentzsch, A. (Artist). (2011, September 19). LOD Cloud Diagram as of September 2011
[Web Graphic]. Retrieved from
http://en.wikipedia.org/wiki/File:LOD_Cloud_Diagram_as_of_September_2011.png
[6] Ontology language. (2014, April 26). Wikipedia. Retrieved April 29, 2014, from
http://en.wikipedia.org/wiki/Ontology_language
[7] Semantic Web. (2014, April 25). Wikipedia. Retrieved April 29, 2014, from
http://en.wikipedia.org/wiki/Semantic_Web
[8] Tauberer, J. (2008, January 21). RDF About. GitHub. Retrieved April 29, 2014, from
http://www.rdfabout.com/
[9] [Web Graphic]. Retrieved from http://wiki.dbpedia.org/images/dbpedia_logo.png
[10] Web Ontology Language. (2014, April 29). Wikipedia. Retrieved April 29, 2014, from
http://en.wikipedia.org/wiki/Web_Ontology_Language
[11] W3C. (n.d.). Data. Retrieved April 29, 2014, from
http://www.w3.org/standards/semanticweb/data
[12] W3C. (n.d.). Inference. Retrieved April 29, 2014, from
http://www.w3.org/standards/semanticweb/inference
[13] W3C. (n.d.). Ontologies. Retrieved April 29, 2014, from
http://www.w3.org/standards/semanticweb/ontology
[14] W3C. (n.d.). Query. Retrieved April 29, 2014, from
http://www.w3.org/standards/semanticweb/query
217
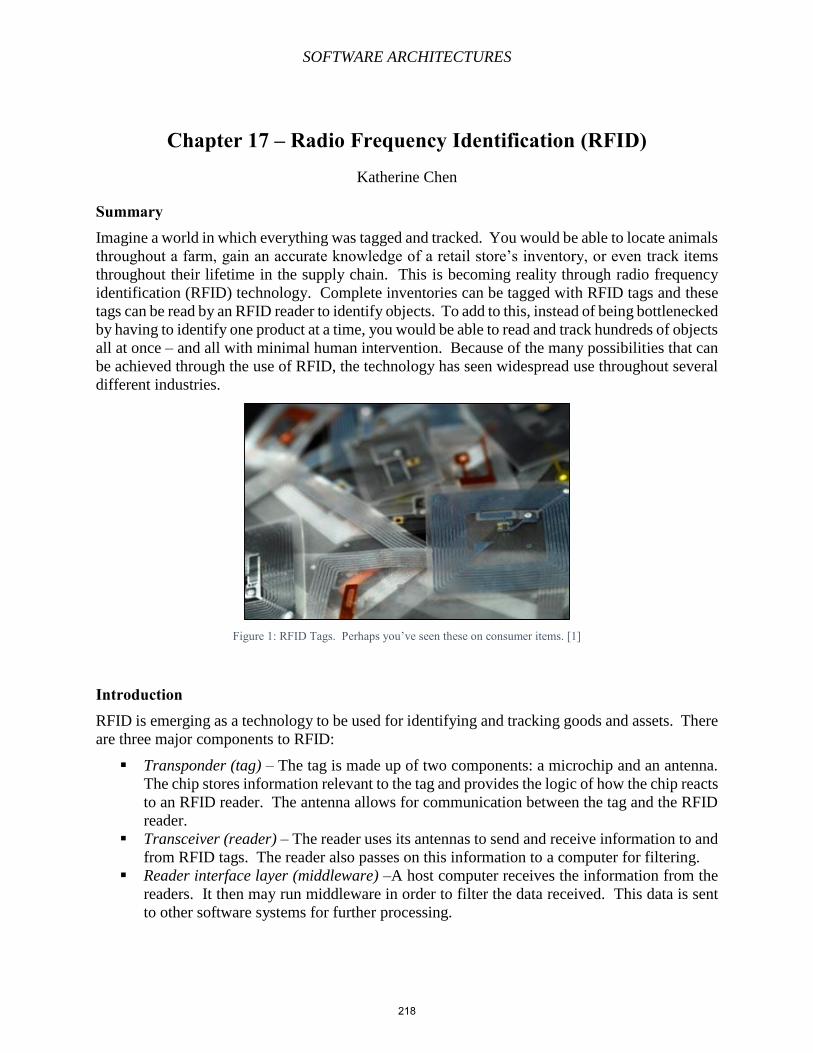
SOFTWARE ARCHITECTURES
Chapter 17 – Radio Frequency Identification (RFID) Katherine Chen
Summary
Imagine a world in which everything was tagged and tracked. You would be able to locate animals
throughout a farm, gain an accurate knowledge of a retail store’s inventory, or even track items
throughout their lifetime in the supply chain. This is becoming reality through radio frequency
identification (RFID) technology. Complete inventories can be tagged with RFID tags and these
tags can be read by an RFID reader to identify objects. To add to this, instead of being bottlenecked
by having to identify one product at a time, you would be able to read and track hundreds of objects
all at once – and all with minimal human intervention. Because of the many possibilities that can
be achieved through the use of RFID, the technology has seen widespread use throughout several
different industries.
Figure 1: RFID Tags. Perhaps you’ve seen these on consumer items. [1]
Introduction RFID is emerging as a technology to be used for identifying and tracking goods and assets. There
are three major components to RFID:
Transponder (tag) – The tag is made up of two components: a microchip and an antenna.
The chip stores information relevant to the tag and provides the logic of how the chip reacts
to an RFID reader. The antenna allows for communication between the tag and the RFID
reader.
Transceiver (reader) – The reader uses its antennas to send and receive information to and
from RFID tags. The reader also passes on this information to a computer for filtering.
Reader interface layer (middleware) –A host computer receives the information from the
readers. It then may run middleware in order to filter the data received. This data is sent
to other software systems for further processing.
218
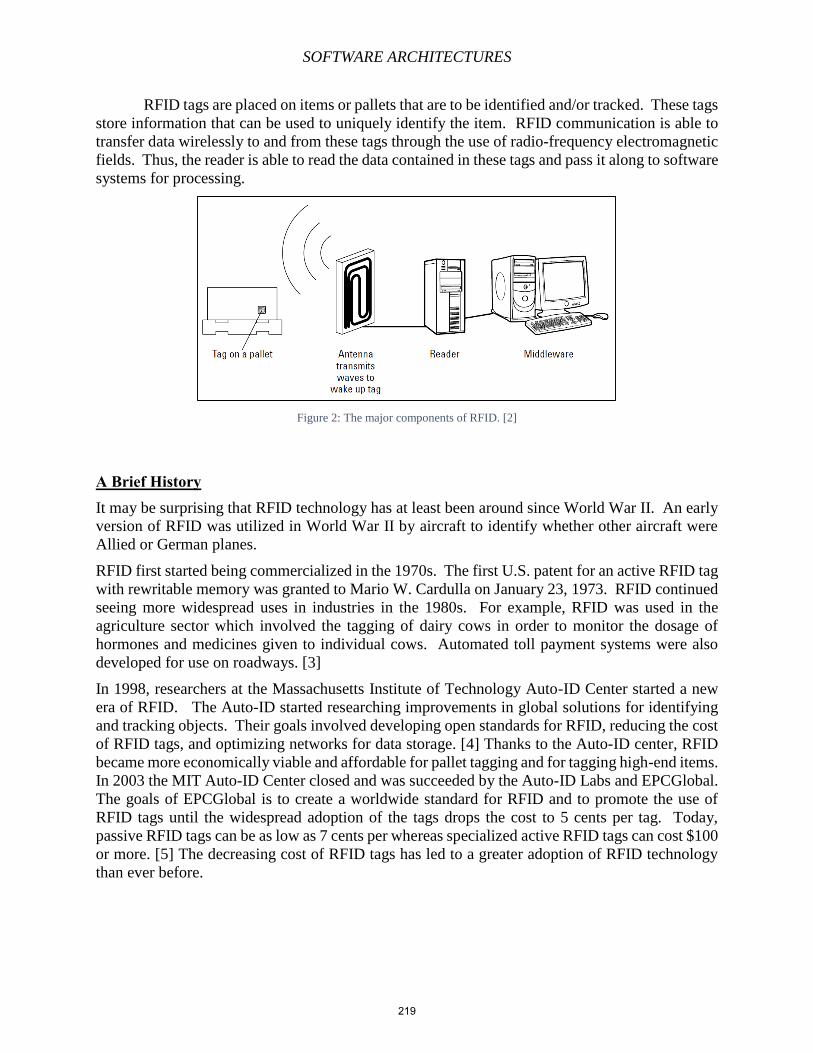
SOFTWARE ARCHITECTURES
RFID tags are placed on items or pallets that are to be identified and/or tracked. These tags
store information that can be used to uniquely identify the item. RFID communication is able to
transfer data wirelessly to and from these tags through the use of radio-frequency electromagnetic
fields. Thus, the reader is able to read the data contained in these tags and pass it along to software
systems for processing.
Figure 2: The major components of RFID. [2]
A Brief History It may be surprising that RFID technology has at least been around since World War II. An early
version of RFID was utilized in World War II by aircraft to identify whether other aircraft were
Allied or German planes.
RFID first started being commercialized in the 1970s. The first U.S. patent for an active RFID tag
with rewritable memory was granted to Mario W. Cardulla on January 23, 1973. RFID continued
seeing more widespread uses in industries in the 1980s. For example, RFID was used in the
agriculture sector which involved the tagging of dairy cows in order to monitor the dosage of
hormones and medicines given to individual cows. Automated toll payment systems were also
developed for use on roadways. [3]
In 1998, researchers at the Massachusetts Institute of Technology Auto-ID Center started a new
era of RFID. The Auto-ID started researching improvements in global solutions for identifying
and tracking objects. Their goals involved developing open standards for RFID, reducing the cost
of RFID tags, and optimizing networks for data storage. [4] Thanks to the Auto-ID center, RFID
became more economically viable and affordable for pallet tagging and for tagging high-end items.
In 2003 the MIT Auto-ID Center closed and was succeeded by the Auto-ID Labs and EPCGlobal.
The goals of EPCGlobal is to create a worldwide standard for RFID and to promote the use of
RFID tags until the widespread adoption of the tags drops the cost to 5 cents per tag. Today,
passive RFID tags can be as low as 7 cents per whereas specialized active RFID tags can cost $100
or more. [5] The decreasing cost of RFID tags has led to a greater adoption of RFID technology
than ever before.
219
SOFTWARE ARCHITECTURES
Benefits Barcode technology is the current dominant technology in the broad automatic identification
technologies category. RFID would seem like a natural successor to barcodes. However, UPC
barcodes are currently very prevalent in industries—most notably in retail. Instead of RFID
replacing barcodes, both technologies are likely to co-exist in the near future. Yet more and more
companies are likely to see increased use of RFID tagging because of certain benefits RFID
provides. These benefits include:
Being able to identify every object with a unique serial number. Items will be able to be
tracked all the way back to where they were produced, and this information could perhaps
be applied in situations such as for targeted recall. Companies will also have better
inventory control by being able to utilize serialized data and by tracking each item
individually.
Increased security on items. Since entire inventories can be tagged, the ability to track and
know the location of the item is at all times would allow for anti-theft measures to be put
in place.
Being able to read multiple RFID tags at once. This means that RFID enables a reduction
in processing time through the supply chain because of being able to read multiple objects
at once instead of having to scan one item at a time.
No line of sight requirement needed to read an RFID tag. An item would not have to be
oriented a certain way like barcode technology requires for scanning of the UPC. Since
RFID tags utilize radio waves, the tag does not even need to be visible and can actually be
hidden inside the item.
Minimizing labor costs. Since RFID technology can be automated to detect items as soon
as they arrive near the reader, this eliminates the need for human labor costs that have
traditionally be used for scanning purposes. This also reduces the rate of errors that human
intervention usually introduces.
Longer range for reading an RFID tag. Whereas a barcode has to be scanned in close
proximity, the RFID tags that are usually used in a supply chain can be read from a range
of 20 to 30 feet. Other RFID tags, such as the battery-powered tags, have a long read range
of 300 feet. [5]
Durability. RFID tags are more durable than barcodes and can sustain functionality even
through harsher environments. Also the durability of RFID tags means that tags can last
for a long period of time and thus consistently be reused.
Data can be written onto RFID tags. Not only can data be read from the tag, but data can
also be written into the tag by a user. Critical information can be stored directly onto the
tag, allowing for data to be accessed even in situations where a central database cannot be
easily accessed. An RFID tag can store up to several kB of data. [4]
Although RFID brings certain advantages over barcodes, RFID technology will likely not be a
complete replacement for barcodes. A few reasons for these include:
It may be advantageous to have multiple sources of data on an object (e.g. have both an
RFID tag and a barcode on the same object).
RFID tags are more expensive to implement than barcodes.
RFID labels cannot be generated and distributed electronically (e.g. printing out an airline
boarding pass received through email).
220
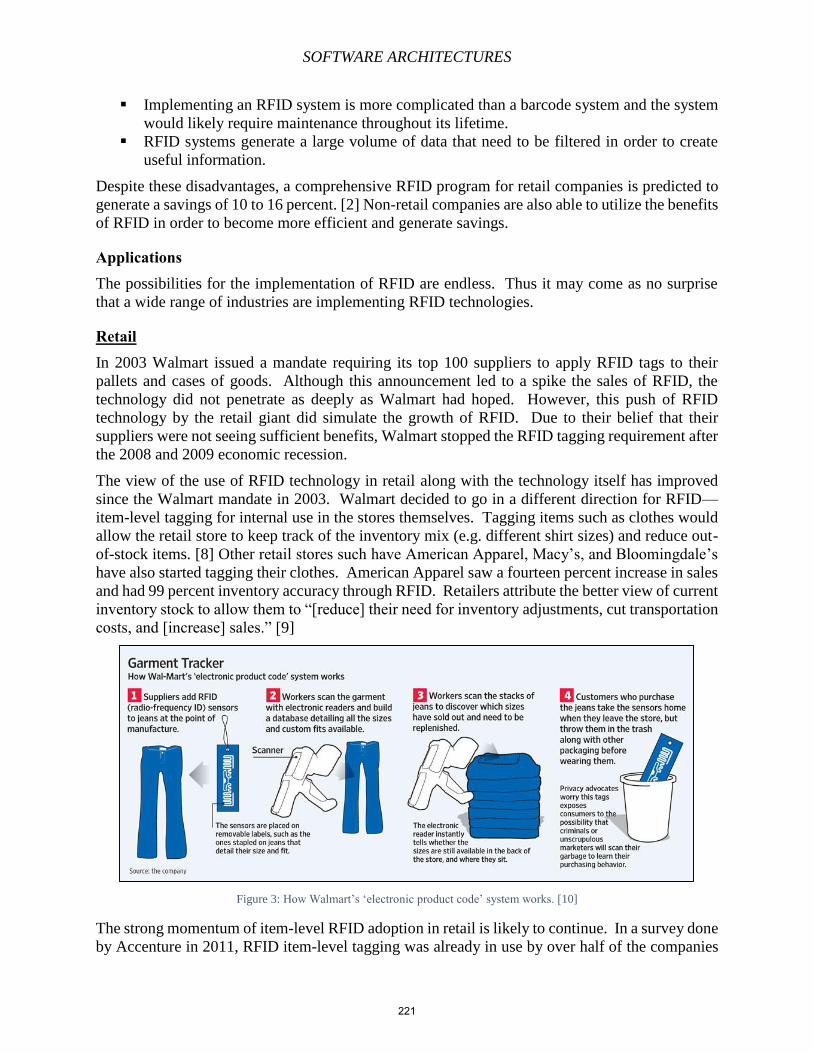
SOFTWARE ARCHITECTURES
Implementing an RFID system is more complicated than a barcode system and the system
would likely require maintenance throughout its lifetime.
RFID systems generate a large volume of data that need to be filtered in order to create
useful information.
Despite these disadvantages, a comprehensive RFID program for retail companies is predicted to
generate a savings of 10 to 16 percent. [2] Non-retail companies are also able to utilize the benefits
of RFID in order to become more efficient and generate savings.
Applications The possibilities for the implementation of RFID are endless. Thus it may come as no surprise
that a wide range of industries are implementing RFID technologies.
Retail In 2003 Walmart issued a mandate requiring its top 100 suppliers to apply RFID tags to their
pallets and cases of goods. Although this announcement led to a spike the sales of RFID, the
technology did not penetrate as deeply as Walmart had hoped. However, this push of RFID
technology by the retail giant did simulate the growth of RFID. Due to their belief that their
suppliers were not seeing sufficient benefits, Walmart stopped the RFID tagging requirement after
the 2008 and 2009 economic recession.
The view of the use of RFID technology in retail along with the technology itself has improved
since the Walmart mandate in 2003. Walmart decided to go in a different direction for RFID—
item-level tagging for internal use in the stores themselves. Tagging items such as clothes would
allow the retail store to keep track of the inventory mix (e.g. different shirt sizes) and reduce out-
of-stock items. [8] Other retail stores such have American Apparel, Macy’s, and Bloomingdale’s
have also started tagging their clothes. American Apparel saw a fourteen percent increase in sales
and had 99 percent inventory accuracy through RFID. Retailers attribute the better view of current
inventory stock to allow them to “[reduce] their need for inventory adjustments, cut transportation
costs, and [increase] sales.” [9]
Figure 3: How Walmart’s ‘electronic product code’ system works. [10]
The strong momentum of item-level RFID adoption in retail is likely to continue. In a survey done
by Accenture in 2011, RFID item-level tagging was already in use by over half of the companies
221
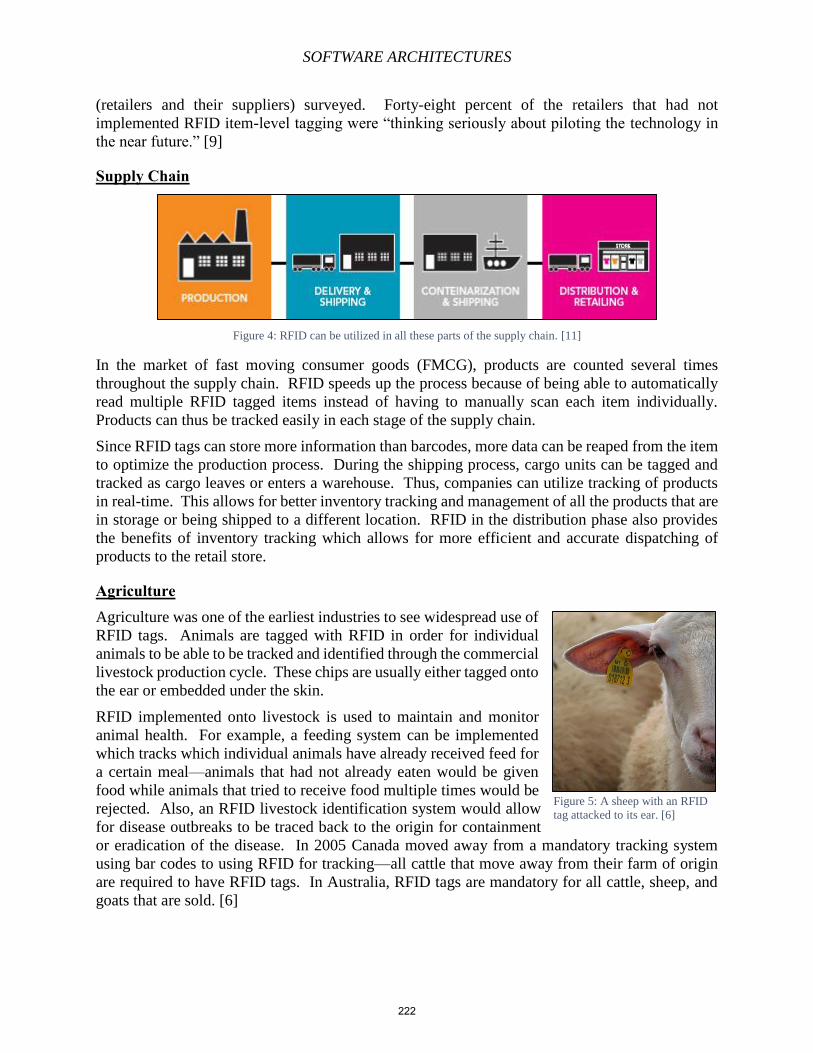
SOFTWARE ARCHITECTURES
(retailers and their suppliers) surveyed. Forty-eight percent of the retailers that had not
implemented RFID item-level tagging were “thinking seriously about piloting the technology in
the near future.” [9]
Supply Chain
Figure 4: RFID can be utilized in all these parts of the supply chain. [11]
In the market of fast moving consumer goods (FMCG), products are counted several times
throughout the supply chain. RFID speeds up the process because of being able to automatically
read multiple RFID tagged items instead of having to manually scan each item individually.
Products can thus be tracked easily in each stage of the supply chain.
Since RFID tags can store more information than barcodes, more data can be reaped from the item
to optimize the production process. During the shipping process, cargo units can be tagged and
tracked as cargo leaves or enters a warehouse. Thus, companies can utilize tracking of products
in real-time. This allows for better inventory tracking and management of all the products that are
in storage or being shipped to a different location. RFID in the distribution phase also provides
the benefits of inventory tracking which allows for more efficient and accurate dispatching of
products to the retail store.
Agriculture Agriculture was one of the earliest industries to see widespread use of
RFID tags. Animals are tagged with RFID in order for individual
animals to be able to be tracked and identified through the commercial
livestock production cycle. These chips are usually either tagged onto
the ear or embedded under the skin.
RFID implemented onto livestock is used to maintain and monitor
animal health. For example, a feeding system can be implemented
which tracks which individual animals have already received feed for
a certain meal—animals that had not already eaten would be given
food while animals that tried to receive food multiple times would be
rejected. Also, an RFID livestock identification system would allow
for disease outbreaks to be traced back to the origin for containment
or eradication of the disease. In 2005 Canada moved away from a mandatory tracking system
using bar codes to using RFID for tracking—all cattle that move away from their farm of origin
are required to have RFID tags. In Australia, RFID tags are mandatory for all cattle, sheep, and
goats that are sold. [6]
Figure 5: A sheep with an RFID
tag attacked to its ear. [6]
222
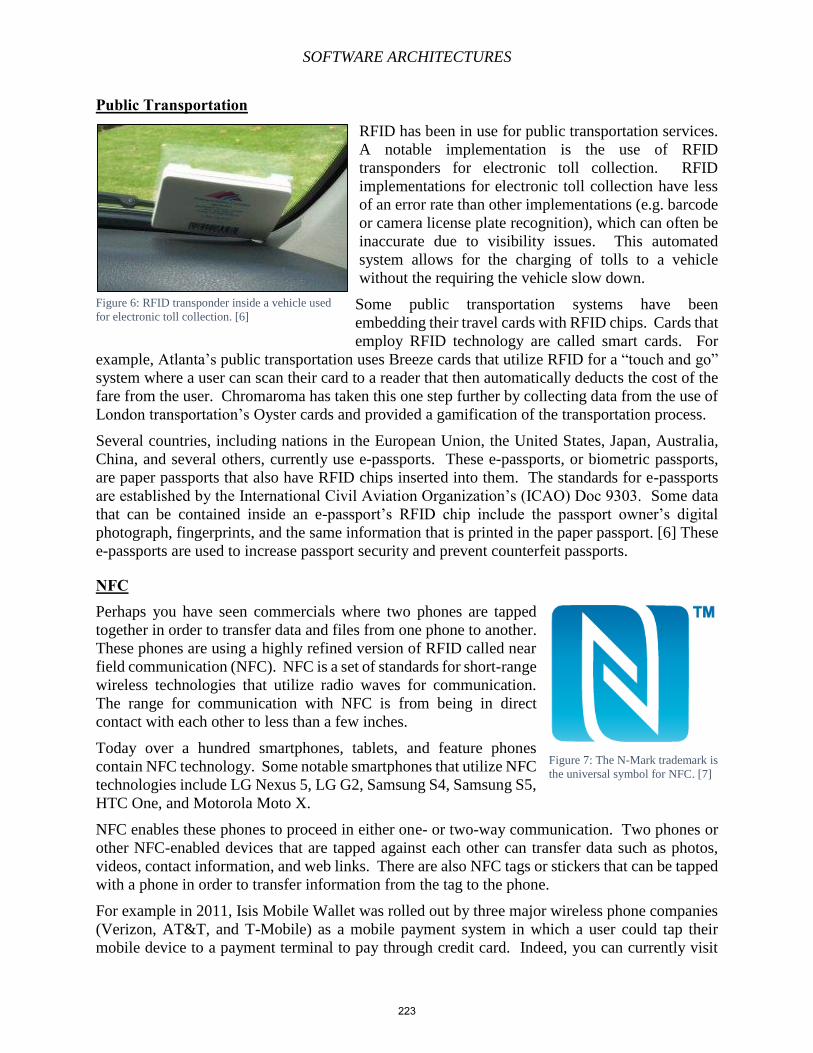
SOFTWARE ARCHITECTURES
Public Transportation RFID has been in use for public transportation services.
A notable implementation is the use of RFID
transponders for electronic toll collection. RFID
implementations for electronic toll collection have less
of an error rate than other implementations (e.g. barcode
or camera license plate recognition), which can often be
inaccurate due to visibility issues. This automated
system allows for the charging of tolls to a vehicle
without the requiring the vehicle slow down.
Some public transportation systems have been
embedding their travel cards with RFID chips. Cards that
employ RFID technology are called smart cards. For
example, Atlanta’s public transportation uses Breeze cards that utilize RFID for a “touch and go”
system where a user can scan their card to a reader that then automatically deducts the cost of the
fare from the user. Chromaroma has taken this one step further by collecting data from the use of
London transportation’s Oyster cards and provided a gamification of the transportation process.
Several countries, including nations in the European Union, the United States, Japan, Australia,
China, and several others, currently use e-passports. These e-passports, or biometric passports,
are paper passports that also have RFID chips inserted into them. The standards for e-passports
are established by the International Civil Aviation Organization’s (ICAO) Doc 9303. Some data
that can be contained inside an e-passport’s RFID chip include the passport owner’s digital
photograph, fingerprints, and the same information that is printed in the paper passport. [6] These
e-passports are used to increase passport security and prevent counterfeit passports.
NFC Perhaps you have seen commercials where two phones are tapped
together in order to transfer data and files from one phone to another.
These phones are using a highly refined version of RFID called near
field communication (NFC). NFC is a set of standards for short-range
wireless technologies that utilize radio waves for communication.
The range for communication with NFC is from being in direct
contact with each other to less than a few inches.
Today over a hundred smartphones, tablets, and feature phones
contain NFC technology. Some notable smartphones that utilize NFC
technologies include LG Nexus 5, LG G2, Samsung S4, Samsung S5,
HTC One, and Motorola Moto X.
NFC enables these phones to proceed in either one- or two-way communication. Two phones or
other NFC-enabled devices that are tapped against each other can transfer data such as photos,
videos, contact information, and web links. There are also NFC tags or stickers that can be tapped
with a phone in order to transfer information from the tag to the phone.
For example in 2011, Isis Mobile Wallet was rolled out by three major wireless phone companies
(Verizon, AT&T, and T-Mobile) as a mobile payment system in which a user could tap their
mobile device to a payment terminal to pay through credit card. Indeed, you can currently visit
Figure 7: The N-Mark trademark is
the universal symbol for NFC. [7]
Figure 6: RFID transponder inside a vehicle used
for electronic toll collection. [6]
223
SOFTWARE ARCHITECTURES
your local Toys “R” Us or CVS Pharmacy store and pay for your purchase with your NFC-enabled
devices!
The Inner Workings of RFID Earlier we discussed the three major components of RFID. Let’s delve deeper into the inner
workings of RFID.
Passive, Battery-assisted passive, and Active RFID Tags There are three types of RFID tags in terms of drawing a power source—passive, battery-assisted
passive, and active.
Figure 8: Passive tags vs active tags. [13]
Passive. Passive RFID tags do not contain their own power source. Instead, the tag’s
microchip is activated by absorbing energy from the radio wave electromagnetic field
emitted by an RFID reader. This means that the reader has to send out a relatively strong
signal in order to power on the passive tags. After activation, the tag will briefly emit radio
waves containing information stored in its memory that are then received by the receiver.
The sending of a signal to the receiver by a tag is called backscattering. Due to not
containing a battery, the lifespans of passive tags are virtually unlimited and these tags are
usually smaller and cheaper than other types of RFID tags. Also the range of transmission
for passive tags are shorter (usually up to six meters away) and have a smaller memory
capacity than active tags. [4] These are the tags that are inexpensive enough to be used on
disposable goods and in situations where a huge volume of items need to be tagged, such
as in item-level RFID tagging systems.
Battery-assisted passive (BAP). Battery-assisted passive, or semi-passive, tags contain a
small battery. Like passive tags, the battery-assisted passive tag’s microchip is activated
by a reader. However, the tag does not need to harvest as much energy from the reader’s
radio waves since the tag is mainly powered by the battery instead. The stored battery
improves performance of the tag over passive tags. Some of the performance benefits
include longer read/write ranges (over 100 meters), greater data storage capability, and the
ability to use monitoring sensors. Not having the tag continually powered on provides a
longer battery life (up to 5 years) over active tags. [12] Semi-passive tags are more
expensive than passive tags but less expensive than active tags.
Active. Active RFID tags also contain a battery as a power source for the tag’s microchip.
Unlike the other tags though, active tags are not activated by readers but are instead
periodically transmitting signals. While active tags have the same benefits of semi-passive
224
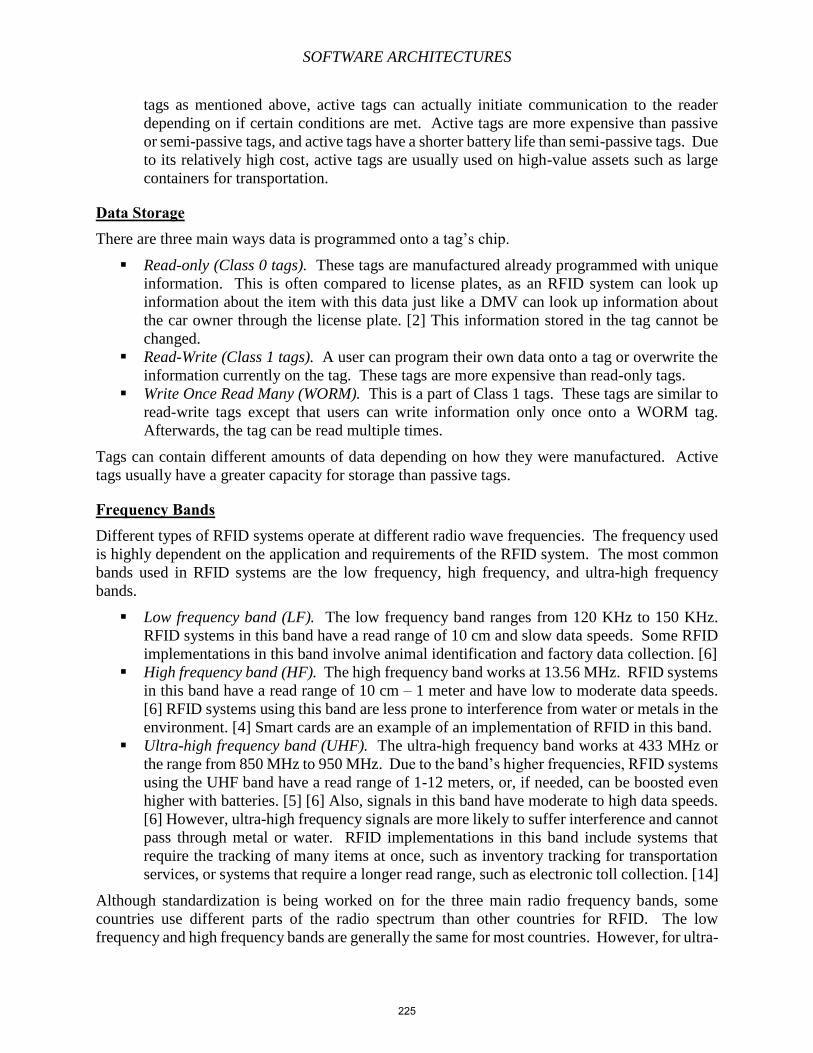
SOFTWARE ARCHITECTURES
tags as mentioned above, active tags can actually initiate communication to the reader
depending on if certain conditions are met. Active tags are more expensive than passive
or semi-passive tags, and active tags have a shorter battery life than semi-passive tags. Due
to its relatively high cost, active tags are usually used on high-value assets such as large
containers for transportation.
Data Storage There are three main ways data is programmed onto a tag’s chip.
Read-only (Class 0 tags). These tags are manufactured already programmed with unique
information. This is often compared to license plates, as an RFID system can look up
information about the item with this data just like a DMV can look up information about
the car owner through the license plate. [2] This information stored in the tag cannot be
changed.
Read-Write (Class 1 tags). A user can program their own data onto a tag or overwrite the
information currently on the tag. These tags are more expensive than read-only tags.
Write Once Read Many (WORM). This is a part of Class 1 tags. These tags are similar to
read-write tags except that users can write information only once onto a WORM tag.
Afterwards, the tag can be read multiple times.
Tags can contain different amounts of data depending on how they were manufactured. Active
tags usually have a greater capacity for storage than passive tags.
Frequency Bands Different types of RFID systems operate at different radio wave frequencies. The frequency used
is highly dependent on the application and requirements of the RFID system. The most common
bands used in RFID systems are the low frequency, high frequency, and ultra-high frequency
bands.
Low frequency band (LF). The low frequency band ranges from 120 KHz to 150 KHz.
RFID systems in this band have a read range of 10 cm and slow data speeds. Some RFID
implementations in this band involve animal identification and factory data collection. [6]
High frequency band (HF). The high frequency band works at 13.56 MHz. RFID systems
in this band have a read range of 10 cm – 1 meter and have low to moderate data speeds.
[6] RFID systems using this band are less prone to interference from water or metals in the
environment. [4] Smart cards are an example of an implementation of RFID in this band.
Ultra-high frequency band (UHF). The ultra-high frequency band works at 433 MHz or
the range from 850 MHz to 950 MHz. Due to the band’s higher frequencies, RFID systems
using the UHF band have a read range of 1-12 meters, or, if needed, can be boosted even
higher with batteries. [5] [6] Also, signals in this band have moderate to high data speeds.
[6] However, ultra-high frequency signals are more likely to suffer interference and cannot
pass through metal or water. RFID implementations in this band include systems that
require the tracking of many items at once, such as inventory tracking for transportation
services, or systems that require a longer read range, such as electronic toll collection. [14]
Although standardization is being worked on for the three main radio frequency bands, some
countries use different parts of the radio spectrum than other countries for RFID. The low
frequency and high frequency bands are generally the same for most countries. However, for ultra-
225
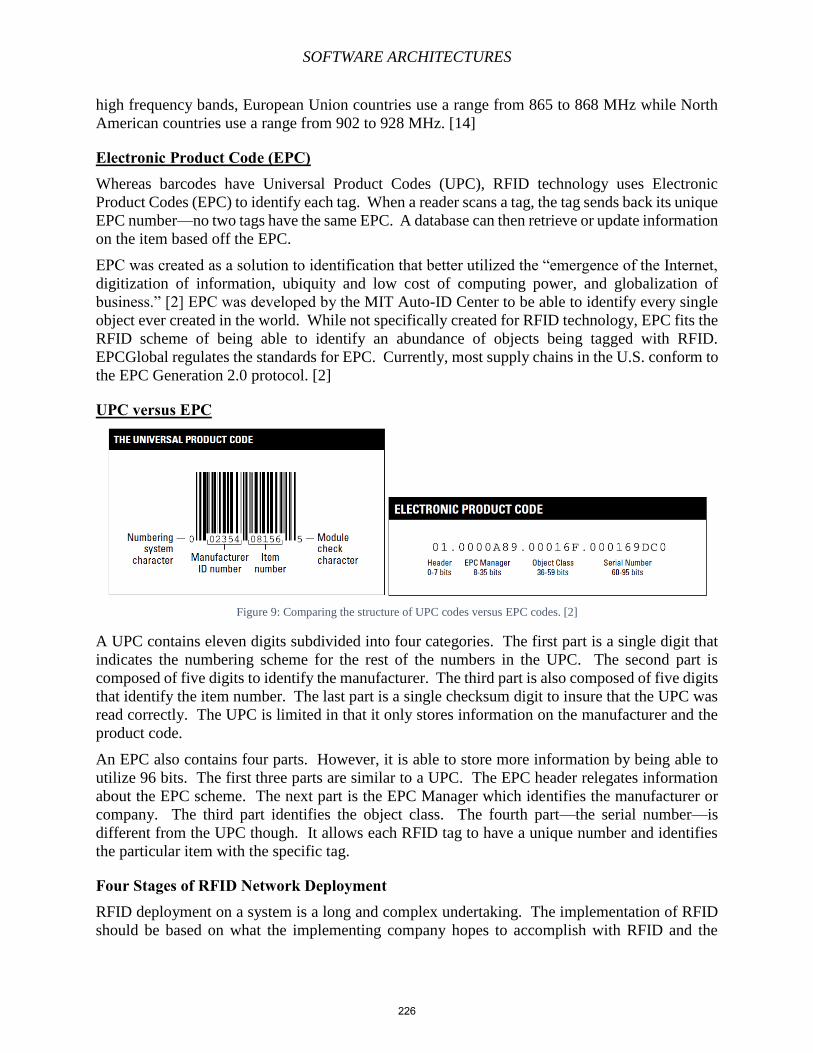
SOFTWARE ARCHITECTURES
high frequency bands, European Union countries use a range from 865 to 868 MHz while North
American countries use a range from 902 to 928 MHz. [14]
Electronic Product Code (EPC) Whereas barcodes have Universal Product Codes (UPC), RFID technology uses Electronic
Product Codes (EPC) to identify each tag. When a reader scans a tag, the tag sends back its unique
EPC number—no two tags have the same EPC. A database can then retrieve or update information
on the item based off the EPC.
EPC was created as a solution to identification that better utilized the “emergence of the Internet,
digitization of information, ubiquity and low cost of computing power, and globalization of
business.” [2] EPC was developed by the MIT Auto-ID Center to be able to identify every single
object ever created in the world. While not specifically created for RFID technology, EPC fits the
RFID scheme of being able to identify an abundance of objects being tagged with RFID.
EPCGlobal regulates the standards for EPC. Currently, most supply chains in the U.S. conform to
the EPC Generation 2.0 protocol. [2]
UPC versus EPC
Figure 9: Comparing the structure of UPC codes versus EPC codes. [2]
A UPC contains eleven digits subdivided into four categories. The first part is a single digit that
indicates the numbering scheme for the rest of the numbers in the UPC. The second part is
composed of five digits to identify the manufacturer. The third part is also composed of five digits
that identify the item number. The last part is a single checksum digit to insure that the UPC was
read correctly. The UPC is limited in that it only stores information on the manufacturer and the
product code.
An EPC also contains four parts. However, it is able to store more information by being able to
utilize 96 bits. The first three parts are similar to a UPC. The EPC header relegates information
about the EPC scheme. The next part is the EPC Manager which identifies the manufacturer or
company. The third part identifies the object class. The fourth part—the serial number—is
different from the UPC though. It allows each RFID tag to have a unique number and identifies
the particular item with the specific tag.
Four Stages of RFID Network Deployment RFID deployment on a system is a long and complex undertaking. The implementation of RFID
should be based on what the implementing company hopes to accomplish with RFID and the
226
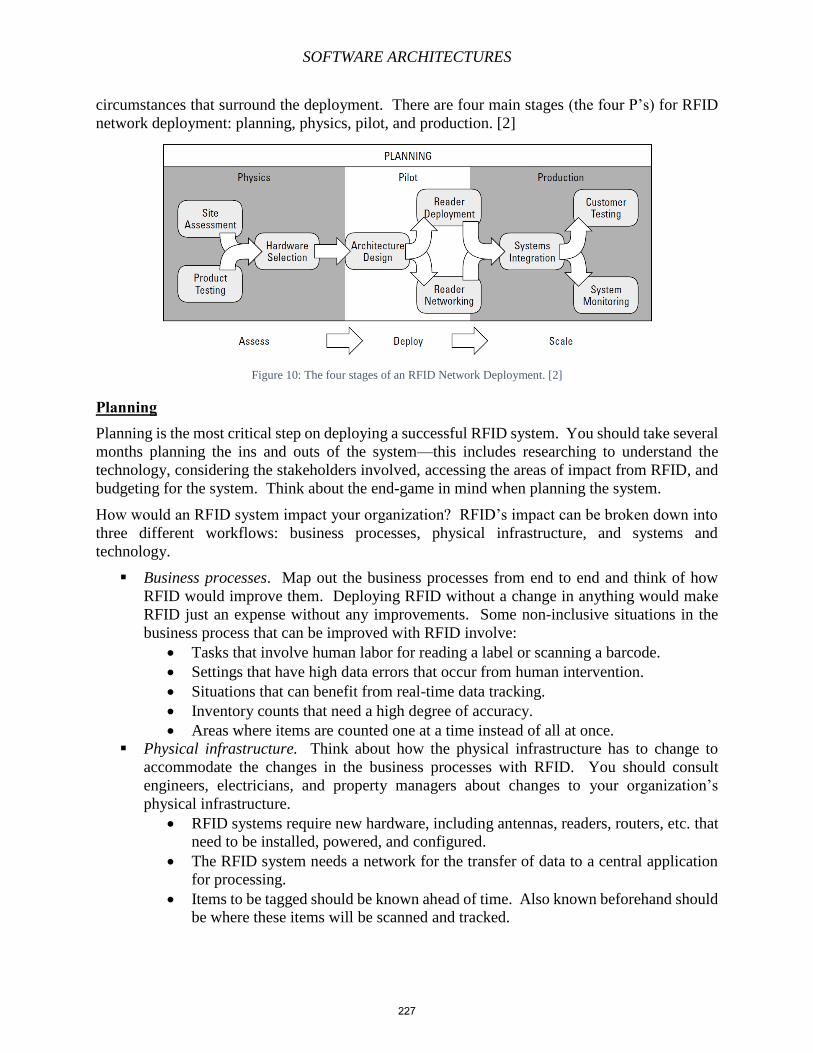
SOFTWARE ARCHITECTURES
circumstances that surround the deployment. There are four main stages (the four P’s) for RFID
network deployment: planning, physics, pilot, and production. [2]
Figure 10: The four stages of an RFID Network Deployment. [2]
Planning Planning is the most critical step on deploying a successful RFID system. You should take several
months planning the ins and outs of the system—this includes researching to understand the
technology, considering the stakeholders involved, accessing the areas of impact from RFID, and
budgeting for the system. Think about the end-game in mind when planning the system.
How would an RFID system impact your organization? RFID’s impact can be broken down into
three different workflows: business processes, physical infrastructure, and systems and
technology.
Business processes. Map out the business processes from end to end and think of how
RFID would improve them. Deploying RFID without a change in anything would make
RFID just an expense without any improvements. Some non-inclusive situations in the
business process that can be improved with RFID involve:
Tasks that involve human labor for reading a label or scanning a barcode.
Settings that have high data errors that occur from human intervention.
Situations that can benefit from real-time data tracking.
Inventory counts that need a high degree of accuracy.
Areas where items are counted one at a time instead of all at once.
Physical infrastructure. Think about how the physical infrastructure has to change to
accommodate the changes in the business processes with RFID. You should consult
engineers, electricians, and property managers about changes to your organization’s
physical infrastructure.
RFID systems require new hardware, including antennas, readers, routers, etc. that
need to be installed, powered, and configured.
The RFID system needs a network for the transfer of data to a central application
for processing.
Items to be tagged should be known ahead of time. Also known beforehand should
be where these items will be scanned and tracked.
227
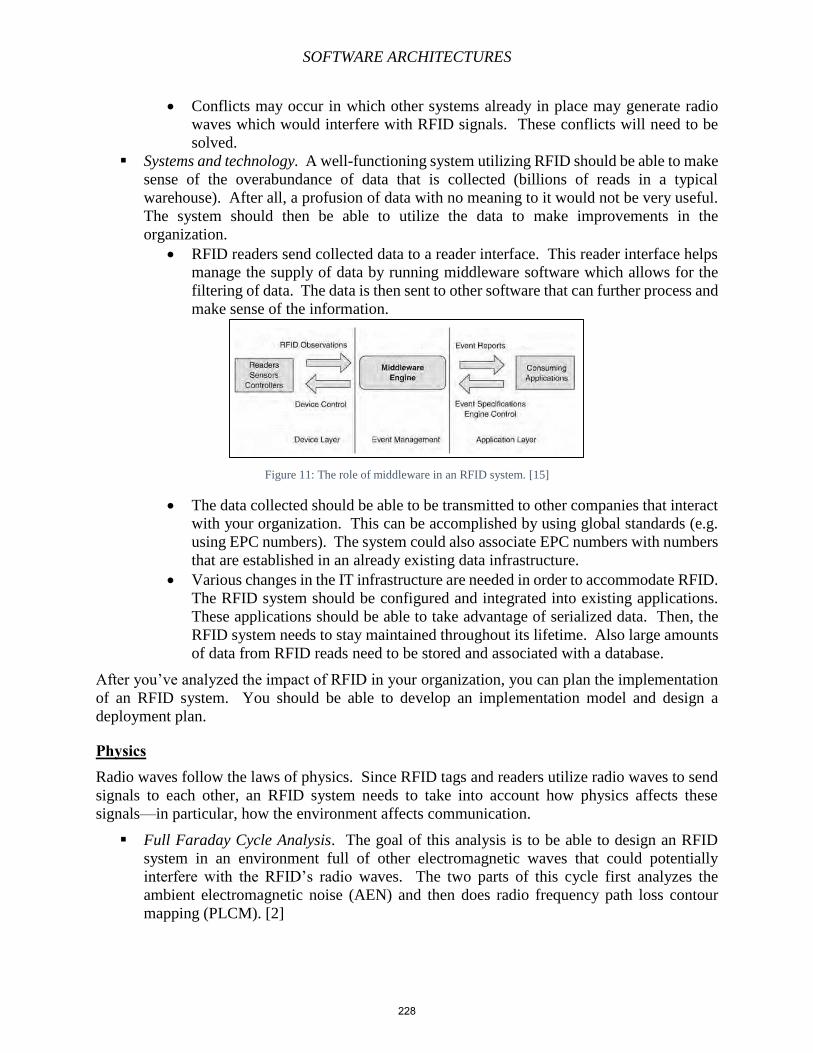
SOFTWARE ARCHITECTURES
Conflicts may occur in which other systems already in place may generate radio
waves which would interfere with RFID signals. These conflicts will need to be
solved.
Systems and technology. A well-functioning system utilizing RFID should be able to make
sense of the overabundance of data that is collected (billions of reads in a typical
warehouse). After all, a profusion of data with no meaning to it would not be very useful.
The system should then be able to utilize the data to make improvements in the
organization.
RFID readers send collected data to a reader interface. This reader interface helps
manage the supply of data by running middleware software which allows for the
filtering of data. The data is then sent to other software that can further process and
make sense of the information.
Figure 11: The role of middleware in an RFID system. [15]
The data collected should be able to be transmitted to other companies that interact
with your organization. This can be accomplished by using global standards (e.g.
using EPC numbers). The system could also associate EPC numbers with numbers
that are established in an already existing data infrastructure.
Various changes in the IT infrastructure are needed in order to accommodate RFID.
The RFID system should be configured and integrated into existing applications.
These applications should be able to take advantage of serialized data. Then, the
RFID system needs to stay maintained throughout its lifetime. Also large amounts
of data from RFID reads need to be stored and associated with a database.
After you’ve analyzed the impact of RFID in your organization, you can plan the implementation
of an RFID system. You should be able to develop an implementation model and design a
deployment plan.
Physics Radio waves follow the laws of physics. Since RFID tags and readers utilize radio waves to send
signals to each other, an RFID system needs to take into account how physics affects these
signals—in particular, how the environment affects communication.
Full Faraday Cycle Analysis. The goal of this analysis is to be able to design an RFID
system in an environment full of other electromagnetic waves that could potentially
interfere with the RFID’s radio waves. The two parts of this cycle first analyzes the
ambient electromagnetic noise (AEN) and then does radio frequency path loss contour
mapping (PLCM). [2]
228
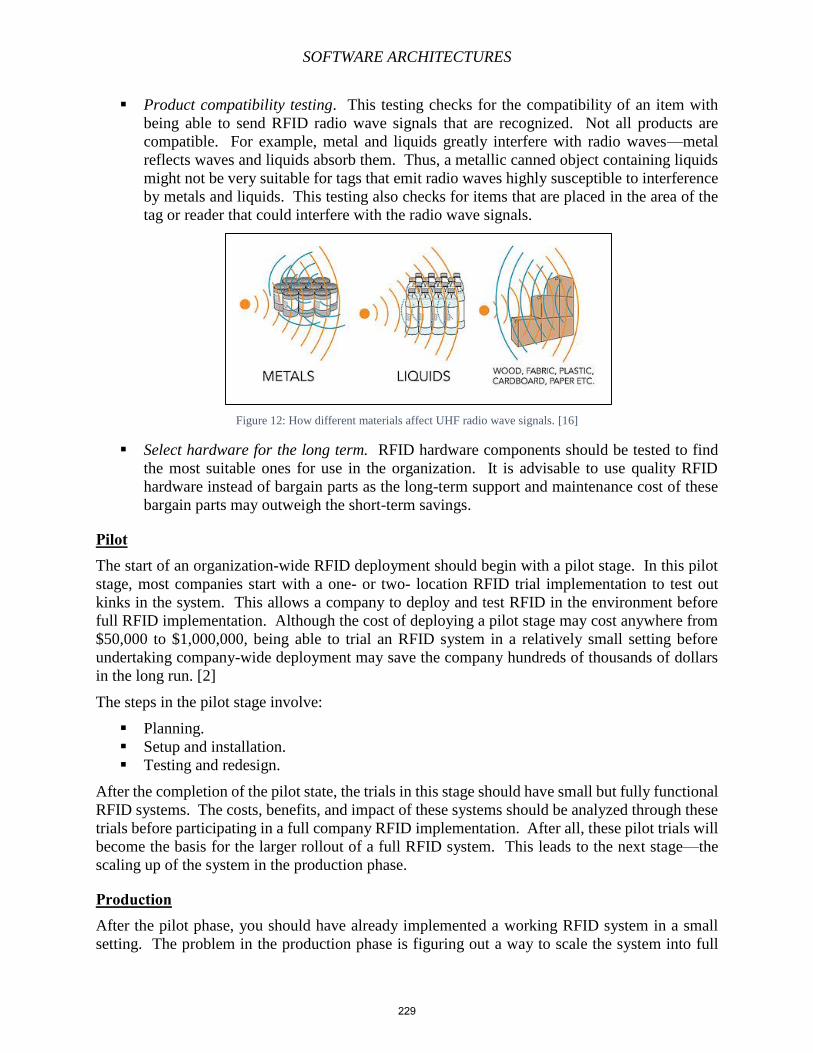
SOFTWARE ARCHITECTURES
Product compatibility testing. This testing checks for the compatibility of an item with
being able to send RFID radio wave signals that are recognized. Not all products are
compatible. For example, metal and liquids greatly interfere with radio waves—metal
reflects waves and liquids absorb them. Thus, a metallic canned object containing liquids
might not be very suitable for tags that emit radio waves highly susceptible to interference
by metals and liquids. This testing also checks for items that are placed in the area of the
tag or reader that could interfere with the radio wave signals.
Figure 12: How different materials affect UHF radio wave signals. [16]
Select hardware for the long term. RFID hardware components should be tested to find
the most suitable ones for use in the organization. It is advisable to use quality RFID
hardware instead of bargain parts as the long-term support and maintenance cost of these
bargain parts may outweigh the short-term savings.
Pilot The start of an organization-wide RFID deployment should begin with a pilot stage. In this pilot
stage, most companies start with a one- or two- location RFID trial implementation to test out
kinks in the system. This allows a company to deploy and test RFID in the environment before
full RFID implementation. Although the cost of deploying a pilot stage may cost anywhere from
$50,000 to $1,000,000, being able to trial an RFID system in a relatively small setting before
undertaking company-wide deployment may save the company hundreds of thousands of dollars
in the long run. [2]
The steps in the pilot stage involve:
Planning.
Setup and installation.
Testing and redesign.
After the completion of the pilot state, the trials in this stage should have small but fully functional
RFID systems. The costs, benefits, and impact of these systems should be analyzed through these
trials before participating in a full company RFID implementation. After all, these pilot trials will
become the basis for the larger rollout of a full RFID system. This leads to the next stage—the
scaling up of the system in the production phase.
Production After the pilot phase, you should have already implemented a working RFID system in a small
setting. The problem in the production phase is figuring out a way to scale the system into full
229
SOFTWARE ARCHITECTURES
company-wide deployment. The complexity of the system grows exponentially as the system
grows larger—more RFID readers have to be added, the network has to grow bigger, and more
data is to be collected. The production phase is similar to the pilot phase in that you are deploying
more RFID nodes into the company’s system. However, in this phase you should be thinking
about the big picture.
Tasks in the production stage include:
Managing the RFID network. This is the most complex task of the production stage. The
RFID readers need to be configured optimally and stay correctly configured. Then the
RFID network needs to be designed with the physics components (e.g. radio wave
communication) in mind. Since this is at the core of the system, any errors in the RFID
network might be disastrous to the organization.
Integrating RFID into existing systems. An RFID network will most likely produce an
abundance of data that outweighs the amount of data produced in your current system.
Thus, the organization’s existing systems should be adapted to be able to process and take
advantage of this data. Thankfully, many current major software vendors for inventory,
enterprise resource planning, and warehouse management have adapted their applications
with additions that allow for RFID system integration.
Educating users to work with the newly adopted system. Employees that work in the
environment of the RFID system need to learn to adapt accordingly. They should be trained
in the usage of RFID, what behaviors impact the success of RFID, and common issues that
could occur in the RFID system. For example, workers should know that parking a forklift
in between a reader and its tags could potentially interfere with the communicating radio
wave signals.
Allowing for system interaction with outside partners. After the organization feels
confident that their RFID system and infrastructure are working well, they should allow
for the sharing of their information with associating organizations so that the interactions
between companies can reap the benefits of RFID. This allows for a more streamlined and
efficient interaction process. For example, companies that deal with inventory
management can allow for easy visibility of their inventory to their partners. Companies
that deal with asset tracking can use RFID data to show real-time visibility of items to their
interacting companies.
After the production phase, your organization should have a fully functioning company-wide
integrated RFID system in place. The system will still require maintenance and possibly have to
be adapted to future changes in the business structure. However, hopefully with proper planning,
testing, and deployment of the RFID system, the costs for maintenance and adaptation will be
severely reduced!
Concerns
Privacy With RFID technology contributing to the surge of tracking and big data, it also contains all the
privacy concerns that are associated with tracking and big data. The main two privacy concerns
with RFID are:
230
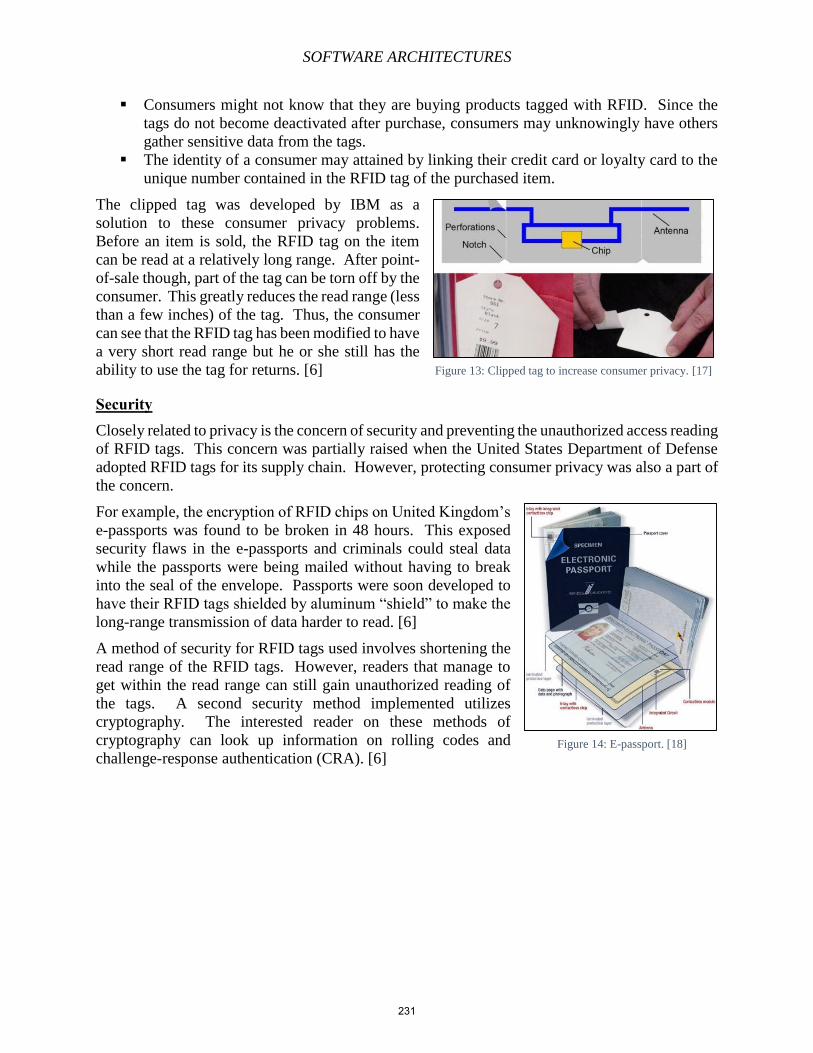
SOFTWARE ARCHITECTURES
Consumers might not know that they are buying products tagged with RFID. Since the
tags do not become deactivated after purchase, consumers may unknowingly have others
gather sensitive data from the tags.
The identity of a consumer may attained by linking their credit card or loyalty card to the
unique number contained in the RFID tag of the purchased item.
The clipped tag was developed by IBM as a
solution to these consumer privacy problems.
Before an item is sold, the RFID tag on the item
can be read at a relatively long range. After point-
of-sale though, part of the tag can be torn off by the
consumer. This greatly reduces the read range (less
than a few inches) of the tag. Thus, the consumer
can see that the RFID tag has been modified to have
a very short read range but he or she still has the
ability to use the tag for returns. [6]
Security Closely related to privacy is the concern of security and preventing the unauthorized access reading
of RFID tags. This concern was partially raised when the United States Department of Defense
adopted RFID tags for its supply chain. However, protecting consumer privacy was also a part of
the concern.
For example, the encryption of RFID chips on United Kingdom’s
e-passports was found to be broken in 48 hours. This exposed
security flaws in the e-passports and criminals could steal data
while the passports were being mailed without having to break
into the seal of the envelope. Passports were soon developed to
have their RFID tags shielded by aluminum “shield” to make the
long-range transmission of data harder to read. [6]
A method of security for RFID tags used involves shortening the
read range of the RFID tags. However, readers that manage to
get within the read range can still gain unauthorized reading of
the tags. A second security method implemented utilizes
cryptography. The interested reader on these methods of
cryptography can look up information on rolling codes and
challenge-response authentication (CRA). [6]
Figure 13: Clipped tag to increase consumer privacy. [17]
Figure 14: E-passport. [18]
231
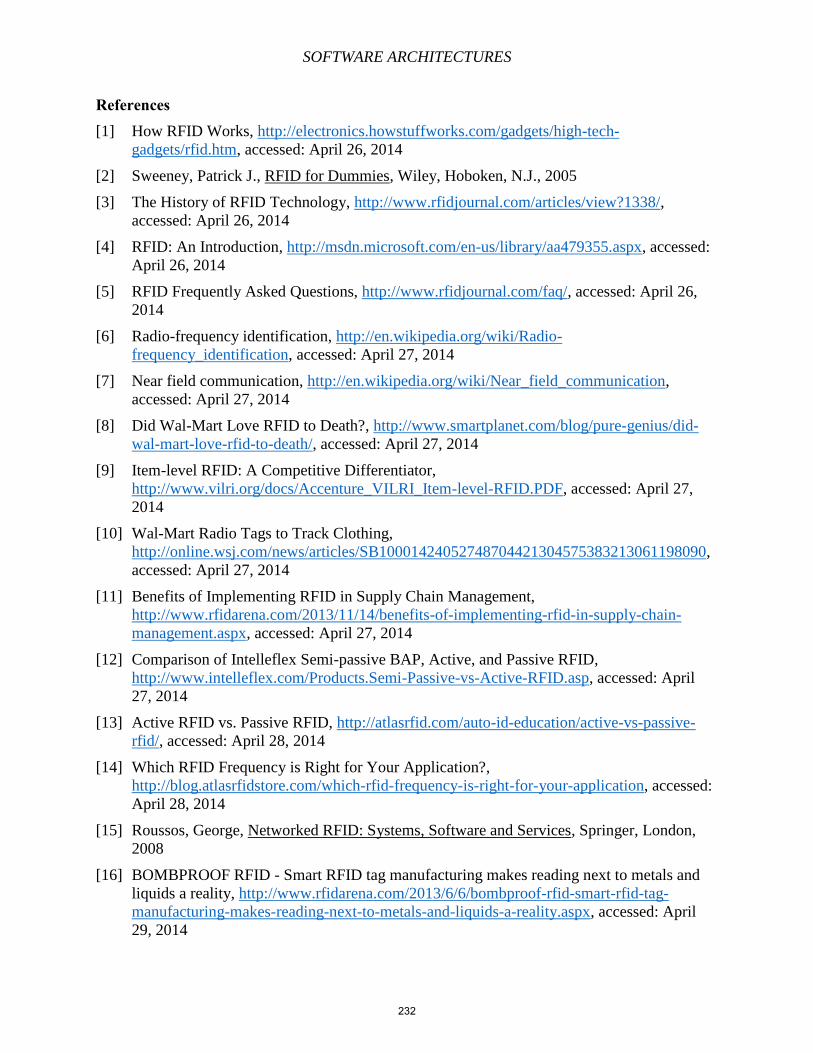
SOFTWARE ARCHITECTURES
References [1] How RFID Works, http://electronics.howstuffworks.com/gadgets/high-tech-
gadgets/rfid.htm, accessed: April 26, 2014
[2] Sweeney, Patrick J., RFID for Dummies, Wiley, Hoboken, N.J., 2005
[3] The History of RFID Technology, http://www.rfidjournal.com/articles/view?1338/,
accessed: April 26, 2014
[4] RFID: An Introduction, http://msdn.microsoft.com/en-us/library/aa479355.aspx, accessed:
April 26, 2014
[5] RFID Frequently Asked Questions, http://www.rfidjournal.com/faq/, accessed: April 26,
2014
[6] Radio-frequency identification, http://en.wikipedia.org/wiki/Radio-
frequency_identification, accessed: April 27, 2014
[7] Near field communication, http://en.wikipedia.org/wiki/Near_field_communication,
accessed: April 27, 2014
[8] Did Wal-Mart Love RFID to Death?, http://www.smartplanet.com/blog/pure-genius/did-
wal-mart-love-rfid-to-death/, accessed: April 27, 2014
[9] Item-level RFID: A Competitive Differentiator,
http://www.vilri.org/docs/Accenture_VILRI_Item-level-RFID.PDF, accessed: April 27,
2014
[10] Wal-Mart Radio Tags to Track Clothing,
http://online.wsj.com/news/articles/SB10001424052748704421304575383213061198090,
accessed: April 27, 2014
[11] Benefits of Implementing RFID in Supply Chain Management,
http://www.rfidarena.com/2013/11/14/benefits-of-implementing-rfid-in-supply-chain-
management.aspx, accessed: April 27, 2014
[12] Comparison of Intelleflex Semi-passive BAP, Active, and Passive RFID,
http://www.intelleflex.com/Products.Semi-Passive-vs-Active-RFID.asp, accessed: April
27, 2014
[13] Active RFID vs. Passive RFID, http://atlasrfid.com/auto-id-education/active-vs-passive-
rfid/, accessed: April 28, 2014
[14] Which RFID Frequency is Right for Your Application?,
http://blog.atlasrfidstore.com/which-rfid-frequency-is-right-for-your-application, accessed:
April 28, 2014
[15] Roussos, George, Networked RFID: Systems, Software and Services, Springer, London,
2008
[16] BOMBPROOF RFID - Smart RFID tag manufacturing makes reading next to metals and
liquids a reality, http://www.rfidarena.com/2013/6/6/bombproof-rfid-smart-rfid-tag-
manufacturing-makes-reading-next-to-metals-and-liquids-a-reality.aspx, accessed: April
29, 2014
232

SOFTWARE ARCHITECTURES
[17] Privacy-enabled RFID labels for product tracking, http://www.gizmag.com/go/5865/,
accessed: April 29, 2014
[18] New RFID Passports: Staging for the NAU, http://www.thebuzzmedia.com/new-rfid-
passports-staging-for-the-nau/, accessed: April 29, 2014
233
SOFTWARE ARCHITECTURES
Chapter 18 – Location Aware Applications Ben Gooding
1. Summary This chapter will cover the many forms of location aware applications, the challenges associated
with these applications as well as their architecture. The majority of location aware applications
are utilized by mobile devices. There are some location aware applications for desktop
computers, such as find local singles in Fayetteville ads, however that is not the focus of this
chapter. There are four main types of location aware applications that will be discussed and they
are: proximity based applications, indoor localization, traditional localization (GPS &
triangulation), and human mobility prediction.
2. Introduction Location aware applications are a class of computer based applications that use location data to
control the application’s functionality. These types of applications have a wide range of uses and
are continually growing in popularity. This popularity growth has been caused by the steady
increase in the number of mobile devices in the hands of potential users.
Location aware applications have grown from just being simple services to growing into
complex and ever evolving applications [8].
This is not necessarily a new concept that came around with the invention of the mobile phone.
Computers have been using the IP Address of a person searching to determine the user’s rough
geographic location. Posters that list location information for a local concert and a person
relaying information to another can be considered a location aware system.
So what exactly is a location aware application? This can be defined as
“…information services accessible with mobile devices through the mobile network and utilizing
the ability to make use of the location of the mobile device [3]”
We can further define this by making note of what questions an location aware application will
answer [3]:
“Where am I?”
“What is nearby?” or
“How can I go to?”
To fully understand how a location aware application works we will look at the five components
that go into their development [3]:
Mobile Devices – This is the tool that a user will use to gain access to the application.
Without the mobile device there is not location aware application. These can consist
of a GPS navigation unit, Smartphone, tablet or even smart watches.
Communication Network – In some fashion the mobile device needs to contact either
the application server or the positioning component. This is the network form being
used to transmit data.
234
SOFTWARE ARCHITECTURES
Positioning component – This is the component that will be utilized to determine the
user’s position. This may consist of the GPS adaptor, a WLAN, cellular towers or
even sound waves. The user may also manually specify their location.
Service and Application Provider – The service provider is responsible for providing
a number of different services to the user and is responsible for processing the service
request. This can consist of route calculation, search results, nearby friends, etc.
Data and Content Provider – If the service provider does not control all of the
information than some requests will go to the data provider. This can be a mapping
company or the Yellow Pages.
3. GPS & Cellular Localization
3.1 Introduction
GPS and cellular localization can be used to identify the location for many of the applications
that will be discussed within this paper. However, both are deserving of their own section as they
are such an important piece of the location aware application ecosystem. Within this section the
topics of how GPS works, what cellular triangulation is, the challenges associated with these
methods, as well as a brief overview of GPS navigation applications.
3.2 How does GPS Work?
GPS stands for Global Positioning System. It is interesting to think that in 2001 GPS navigation
units first began to hit the shelves. These very expensive devices unlocked a whole new world of
possibilities. When GPS first hit consumer shelves people wanted to know how a device that can
provide your location with an accuracy of about 10m would not have a service fee. Over time, as
the price and popularity of this grew the curiosity associated with GPS began to dissipate. It was
something that was just there and did its job. So how exactly does it work?
To begin with we need to understand that the GPS network we all use is owned and operated by
the United States government, mainly the Department of Defense. The DoD doesn’t call the GPS
system just GPS, it goes by the name Navstar. Other countries or groups of countries have their
own systems similar to GPS. For example, the European Union version of GPS is known as
Galileo, named after the famous astronomer. Since Navstar is operated by the DoD it is clear that
the original purpose was for military use. Military use of Navstar will provide accuracy of
10mm! In 1983 the DoD decided to open the use of Navstar up to civilians, however the
accuracy was only up to about 100m for them. This accuracy was degraded so that the focus
could be for military use; however in 2000 this was eliminated. This may explain why there was
an explosion of GPS navigation units in 2001.
235
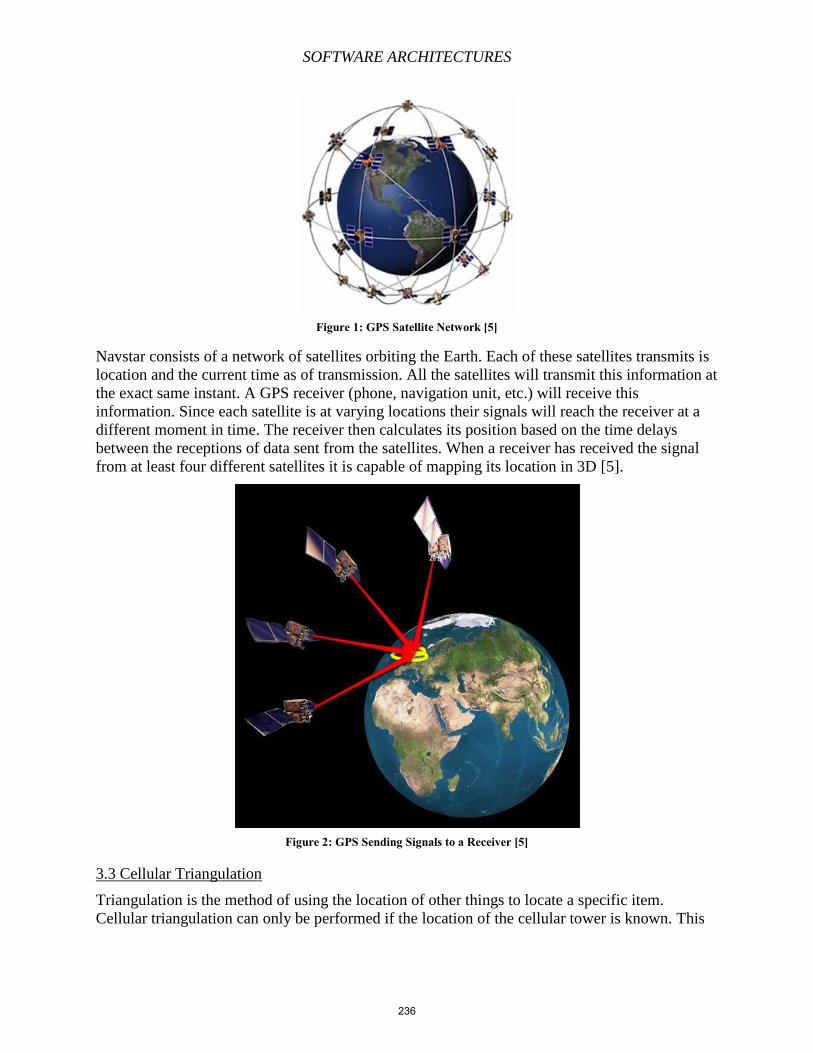
SOFTWARE ARCHITECTURES
Figure 1: GPS Satellite Network [5]
Navstar consists of a network of satellites orbiting the Earth. Each of these satellites transmits is
location and the current time as of transmission. All the satellites will transmit this information at
the exact same instant. A GPS receiver (phone, navigation unit, etc.) will receive this
information. Since each satellite is at varying locations their signals will reach the receiver at a
different moment in time. The receiver then calculates its position based on the time delays
between the receptions of data sent from the satellites. When a receiver has received the signal
from at least four different satellites it is capable of mapping its location in 3D [5].
Figure 2: GPS Sending Signals to a Receiver [5]
3.3 Cellular Triangulation
Triangulation is the method of using the location of other things to locate a specific item.
Cellular triangulation can only be performed if the location of the cellular tower is known. This
236
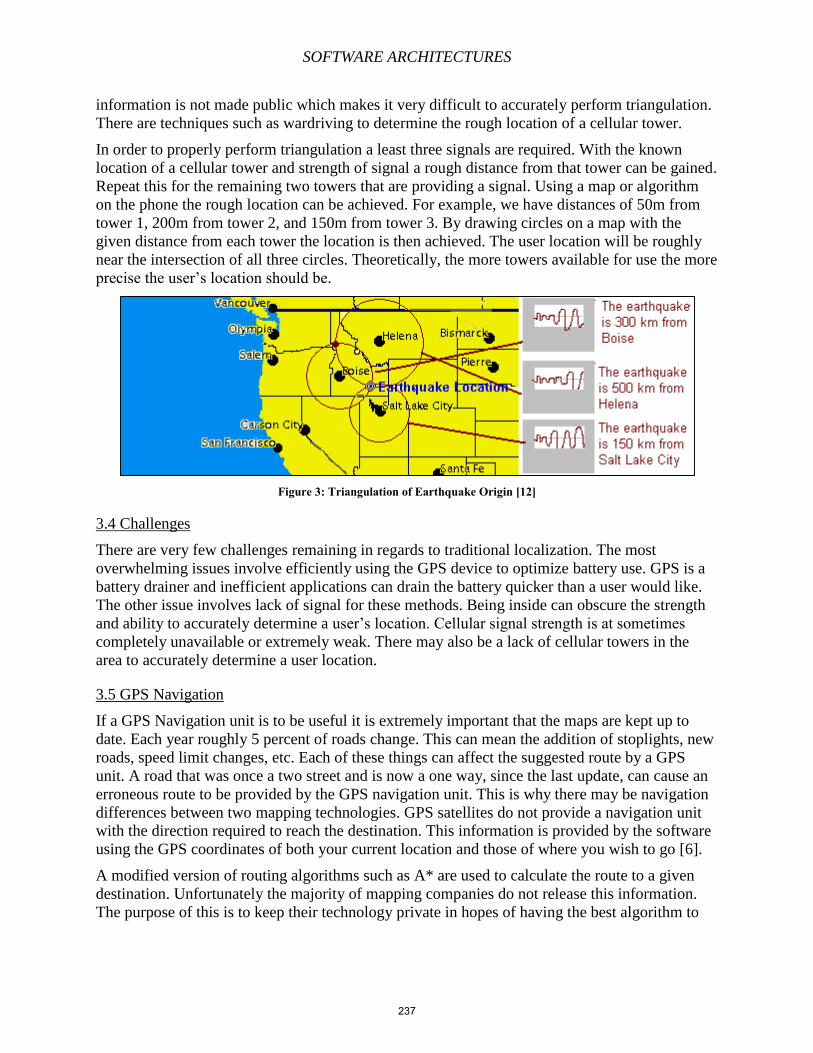
SOFTWARE ARCHITECTURES
information is not made public which makes it very difficult to accurately perform triangulation.
There are techniques such as wardriving to determine the rough location of a cellular tower.
In order to properly perform triangulation a least three signals are required. With the known
location of a cellular tower and strength of signal a rough distance from that tower can be gained.
Repeat this for the remaining two towers that are providing a signal. Using a map or algorithm
on the phone the rough location can be achieved. For example, we have distances of 50m from
tower 1, 200m from tower 2, and 150m from tower 3. By drawing circles on a map with the
given distance from each tower the location is then achieved. The user location will be roughly
near the intersection of all three circles. Theoretically, the more towers available for use the more
precise the user’s location should be.
Figure 3: Triangulation of Earthquake Origin [12]
3.4 Challenges
There are very few challenges remaining in regards to traditional localization. The most
overwhelming issues involve efficiently using the GPS device to optimize battery use. GPS is a
battery drainer and inefficient applications can drain the battery quicker than a user would like.
The other issue involves lack of signal for these methods. Being inside can obscure the strength
and ability to accurately determine a user’s location. Cellular signal strength is at sometimes
completely unavailable or extremely weak. There may also be a lack of cellular towers in the
area to accurately determine a user location.
3.5 GPS Navigation
If a GPS Navigation unit is to be useful it is extremely important that the maps are kept up to
date. Each year roughly 5 percent of roads change. This can mean the addition of stoplights, new
roads, speed limit changes, etc. Each of these things can affect the suggested route by a GPS
unit. A road that was once a two street and is now a one way, since the last update, can cause an
erroneous route to be provided by the GPS navigation unit. This is why there may be navigation
differences between two mapping technologies. GPS satellites do not provide a navigation unit
with the direction required to reach the destination. This information is provided by the software
using the GPS coordinates of both your current location and those of where you wish to go [6].
A modified version of routing algorithms such as A* are used to calculate the route to a given
destination. Unfortunately the majority of mapping companies do not release this information.
The purpose of this is to keep their technology private in hopes of having the best algorithm to
237
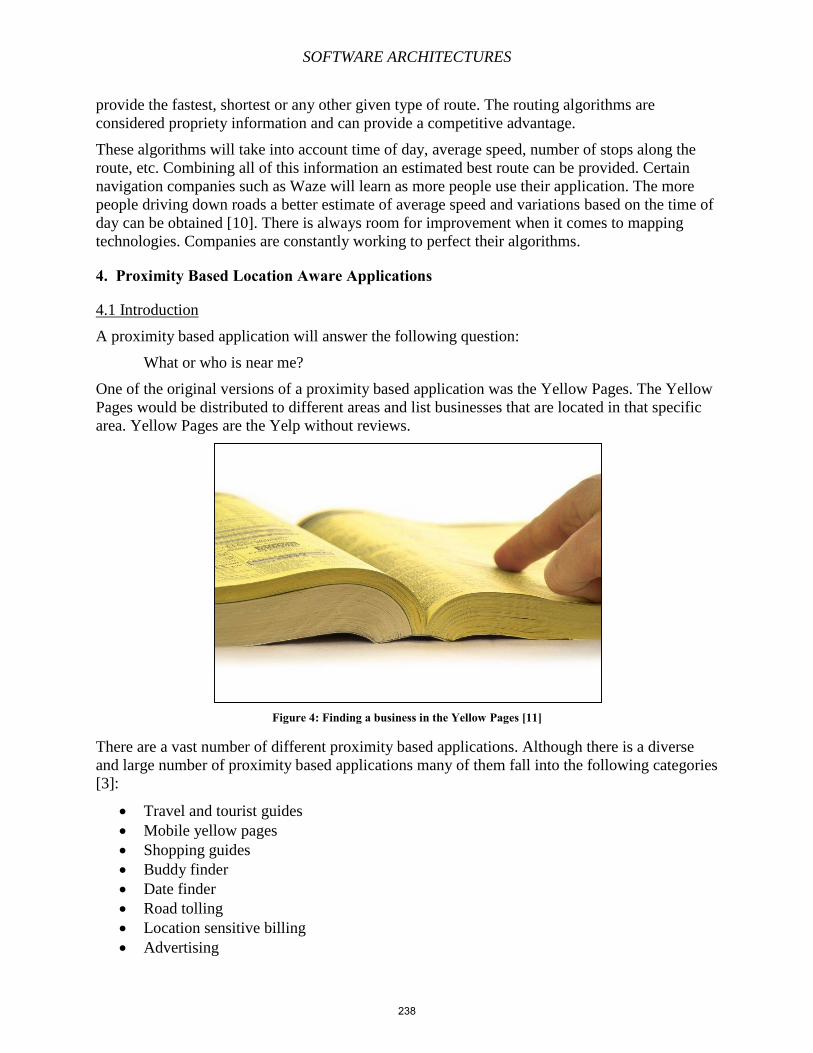
SOFTWARE ARCHITECTURES
provide the fastest, shortest or any other given type of route. The routing algorithms are
considered propriety information and can provide a competitive advantage.
These algorithms will take into account time of day, average speed, number of stops along the
route, etc. Combining all of this information an estimated best route can be provided. Certain
navigation companies such as Waze will learn as more people use their application. The more
people driving down roads a better estimate of average speed and variations based on the time of
day can be obtained [10]. There is always room for improvement when it comes to mapping
technologies. Companies are constantly working to perfect their algorithms.
4. Proximity Based Location Aware Applications
4.1 Introduction
A proximity based application will answer the following question:
What or who is near me?
One of the original versions of a proximity based application was the Yellow Pages. The Yellow
Pages would be distributed to different areas and list businesses that are located in that specific
area. Yellow Pages are the Yelp without reviews.
Figure 4: Finding a business in the Yellow Pages [11]
There are a vast number of different proximity based applications. Although there is a diverse
and large number of proximity based applications many of them fall into the following categories
[3]:
Travel and tourist guides
Mobile yellow pages
Shopping guides
Buddy finder
Date finder
Road tolling
Location sensitive billing
Advertising
238
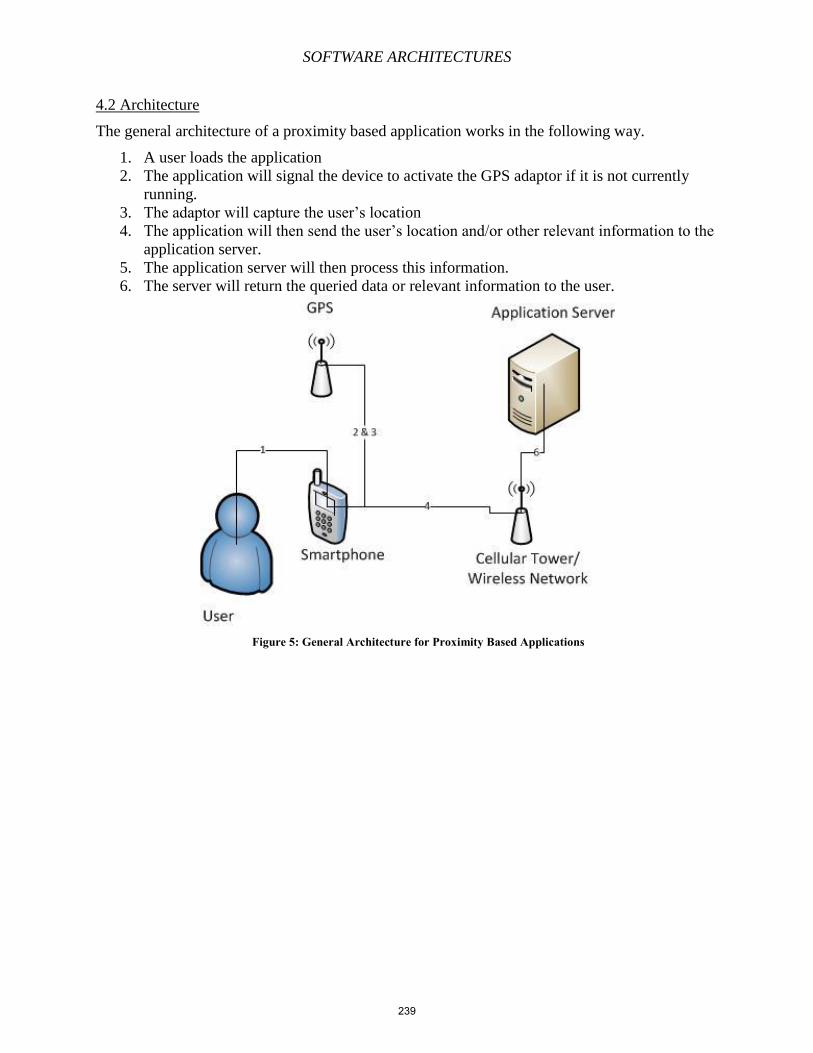
SOFTWARE ARCHITECTURES
4.2 Architecture
The general architecture of a proximity based application works in the following way.
1. A user loads the application
2. The application will signal the device to activate the GPS adaptor if it is not currently
running.
3. The adaptor will capture the user’s location
4. The application will then send the user’s location and/or other relevant information to the
application server.
5. The application server will then process this information.
6. The server will return the queried data or relevant information to the user.
Figure 5: General Architecture for Proximity Based Applications
239
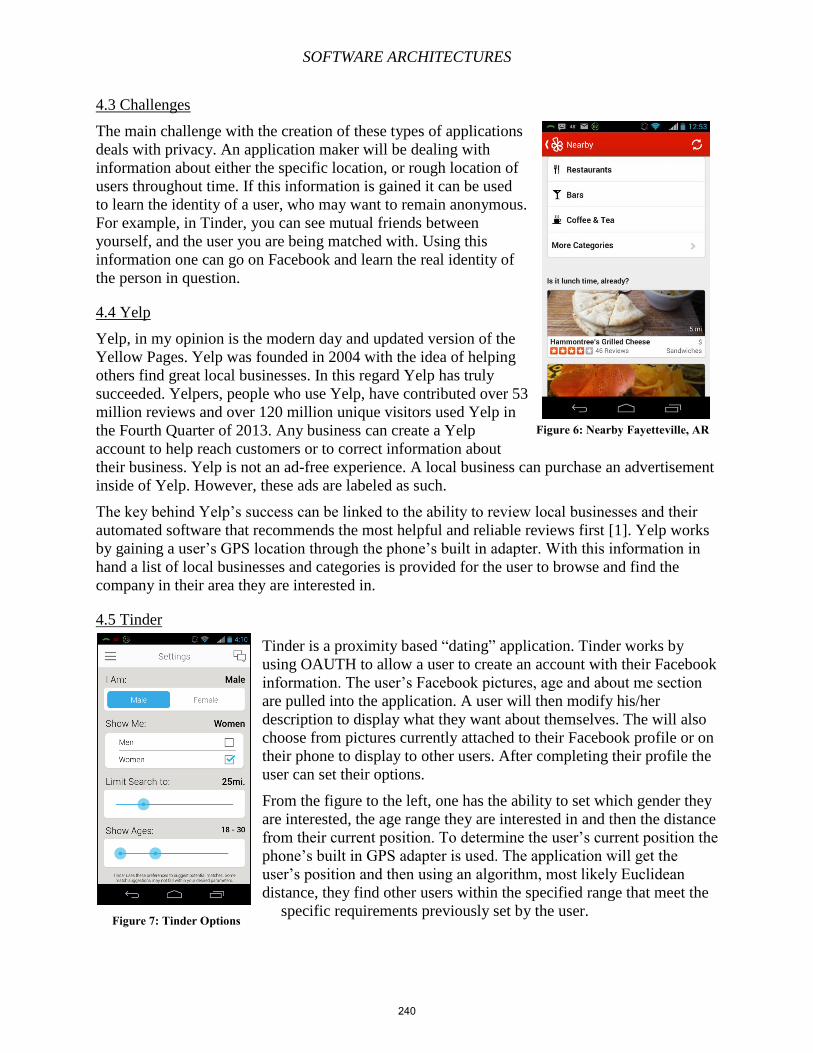
SOFTWARE ARCHITECTURES
4.3 Challenges
The main challenge with the creation of these types of applications
deals with privacy. An application maker will be dealing with
information about either the specific location, or rough location of
users throughout time. If this information is gained it can be used
to learn the identity of a user, who may want to remain anonymous.
For example, in Tinder, you can see mutual friends between
yourself, and the user you are being matched with. Using this
information one can go on Facebook and learn the real identity of
the person in question.
4.4 Yelp
Yelp, in my opinion is the modern day and updated version of the
Yellow Pages. Yelp was founded in 2004 with the idea of helping
others find great local businesses. In this regard Yelp has truly
succeeded. Yelpers, people who use Yelp, have contributed over 53
million reviews and over 120 million unique visitors used Yelp in
the Fourth Quarter of 2013. Any business can create a Yelp
account to help reach customers or to correct information about
their business. Yelp is not an ad-free experience. A local business can purchase an advertisement
inside of Yelp. However, these ads are labeled as such.
The key behind Yelp’s success can be linked to the ability to review local businesses and their
automated software that recommends the most helpful and reliable reviews first [1]. Yelp works
by gaining a user’s GPS location through the phone’s built in adapter. With this information in
hand a list of local businesses and categories is provided for the user to browse and find the
company in their area they are interested in.
4.5 Tinder
Tinder is a proximity based “dating” application. Tinder works by
using OAUTH to allow a user to create an account with their Facebook
information. The user’s Facebook pictures, age and about me section
are pulled into the application. A user will then modify his/her
description to display what they want about themselves. The will also
choose from pictures currently attached to their Facebook profile or on
their phone to display to other users. After completing their profile the
user can set their options.
From the figure to the left, one has the ability to set which gender they
are interested, the age range they are interested in and then the distance
from their current position. To determine the user’s current position the
phone’s built in GPS adapter is used. The application will get the
user’s position and then using an algorithm, most likely Euclidean
distance, they find other users within the specified range that meet the
specific requirements previously set by the user.
Figure 6: Nearby Fayetteville, AR
Figure 7: Tinder Options
240
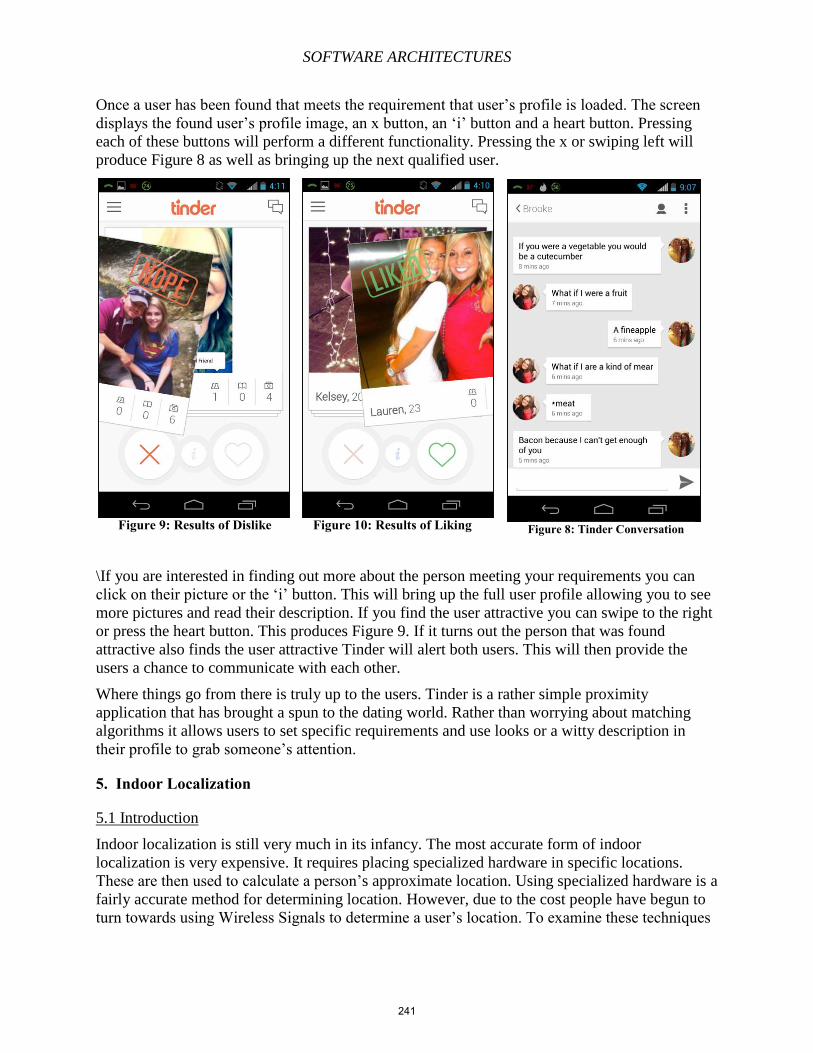
SOFTWARE ARCHITECTURES
Once a user has been found that meets the requirement that user’s profile is loaded. The screen
displays the found user’s profile image, an x button, an ‘i’ button and a heart button. Pressing
each of these buttons will perform a different functionality. Pressing the x or swiping left will
produce Figure 8 as well as bringing up the next qualified user.
Figure 9: Results of Dislike Figure 10: Results of Liking
\If you are interested in finding out more about the person meeting your requirements you can
click on their picture or the ‘i’ button. This will bring up the full user profile allowing you to see
more pictures and read their description. If you find the user attractive you can swipe to the right
or press the heart button. This produces Figure 9. If it turns out the person that was found
attractive also finds the user attractive Tinder will alert both users. This will then provide the
users a chance to communicate with each other.
Where things go from there is truly up to the users. Tinder is a rather simple proximity
application that has brought a spun to the dating world. Rather than worrying about matching
algorithms it allows users to set specific requirements and use looks or a witty description in
their profile to grab someone’s attention.
5. Indoor Localization
5.1 Introduction
Indoor localization is still very much in its infancy. The most accurate form of indoor
localization is very expensive. It requires placing specialized hardware in specific locations.
These are then used to calculate a person’s approximate location. Using specialized hardware is a
fairly accurate method for determining location. However, due to the cost people have begun to
turn towards using Wireless Signals to determine a user’s location. To examine these techniques
Figure 8: Tinder Conversation
241
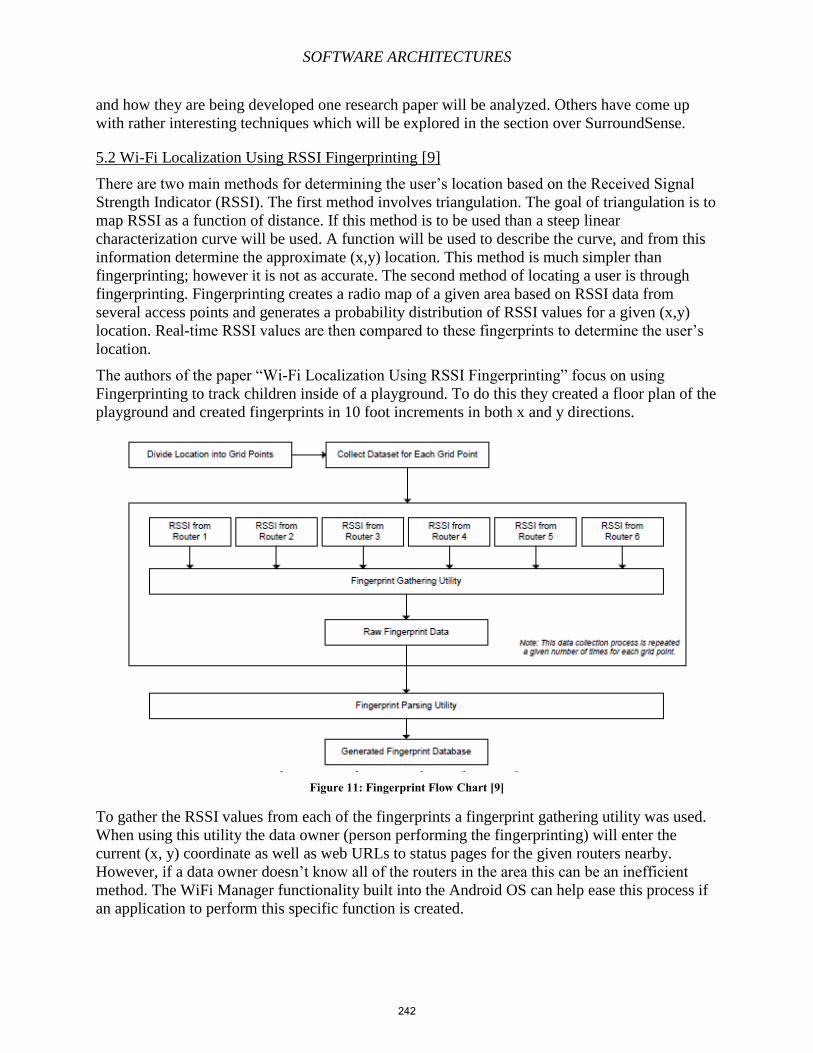
SOFTWARE ARCHITECTURES
and how they are being developed one research paper will be analyzed. Others have come up
with rather interesting techniques which will be explored in the section over SurroundSense.
5.2 Wi-Fi Localization Using RSSI Fingerprinting [9]
There are two main methods for determining the user’s location based on the Received Signal
Strength Indicator (RSSI). The first method involves triangulation. The goal of triangulation is to
map RSSI as a function of distance. If this method is to be used than a steep linear
characterization curve will be used. A function will be used to describe the curve, and from this
information determine the approximate (x,y) location. This method is much simpler than
fingerprinting; however it is not as accurate. The second method of locating a user is through
fingerprinting. Fingerprinting creates a radio map of a given area based on RSSI data from
several access points and generates a probability distribution of RSSI values for a given (x,y)
location. Real-time RSSI values are then compared to these fingerprints to determine the user’s
location.
The authors of the paper “Wi-Fi Localization Using RSSI Fingerprinting” focus on using
Fingerprinting to track children inside of a playground. To do this they created a floor plan of the
playground and created fingerprints in 10 foot increments in both x and y directions.
Figure 11: Fingerprint Flow Chart [9]
To gather the RSSI values from each of the fingerprints a fingerprint gathering utility was used.
When using this utility the data owner (person performing the fingerprinting) will enter the
current (x, y) coordinate as well as web URLs to status pages for the given routers nearby.
However, if a data owner doesn’t know all of the routers in the area this can be an inefficient
method. The WiFi Manager functionality built into the Android OS can help ease this process if
an application to perform this specific function is created.
242
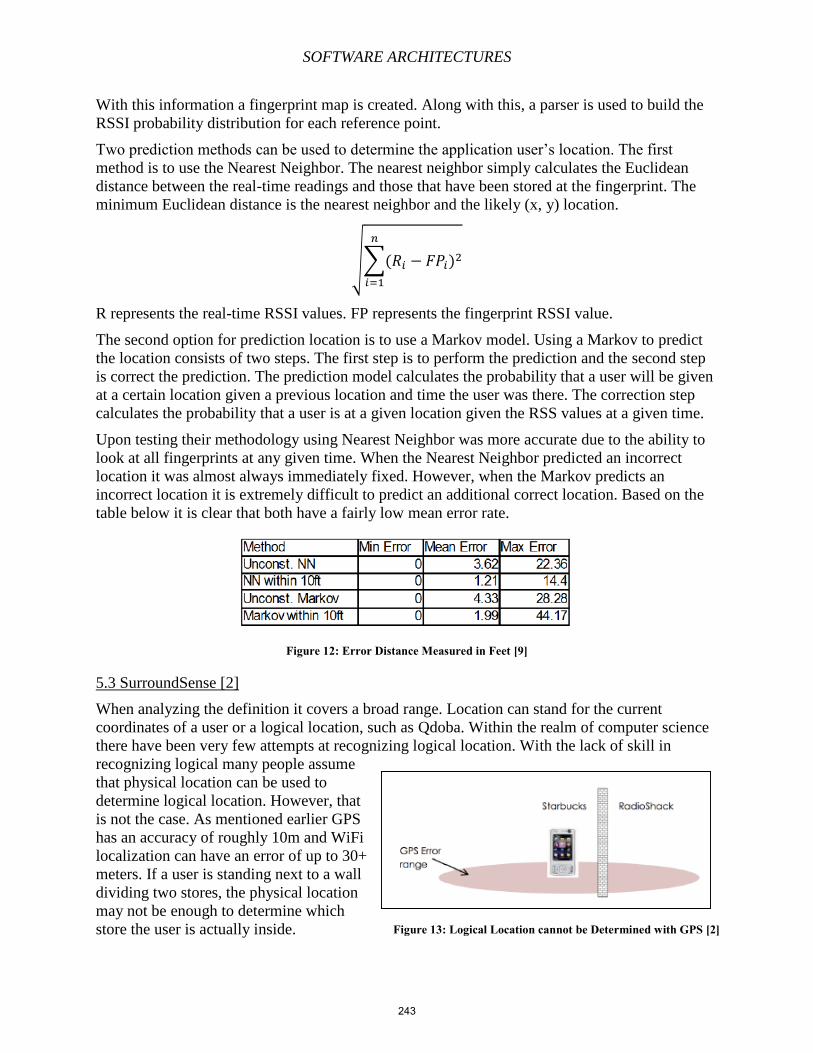
SOFTWARE ARCHITECTURES
With this information a fingerprint map is created. Along with this, a parser is used to build the
RSSI probability distribution for each reference point.
Two prediction methods can be used to determine the application user’s location. The first
method is to use the Nearest Neighbor. The nearest neighbor simply calculates the Euclidean
distance between the real-time readings and those that have been stored at the fingerprint. The
minimum Euclidean distance is the nearest neighbor and the likely (x, y) location.
√∑(𝑅𝑖 − 𝐹𝑃𝑖)2𝑛
𝑖=1
R represents the real-time RSSI values. FP represents the fingerprint RSSI value.
The second option for prediction location is to use a Markov model. Using a Markov to predict
the location consists of two steps. The first step is to perform the prediction and the second step
is correct the prediction. The prediction model calculates the probability that a user will be given
at a certain location given a previous location and time the user was there. The correction step
calculates the probability that a user is at a given location given the RSS values at a given time.
Upon testing their methodology using Nearest Neighbor was more accurate due to the ability to
look at all fingerprints at any given time. When the Nearest Neighbor predicted an incorrect
location it was almost always immediately fixed. However, when the Markov predicts an
incorrect location it is extremely difficult to predict an additional correct location. Based on the
table below it is clear that both have a fairly low mean error rate.
Figure 12: Error Distance Measured in Feet [9]
5.3 SurroundSense [2]
When analyzing the definition it covers a broad range. Location can stand for the current
coordinates of a user or a logical location, such as Qdoba. Within the realm of computer science
there have been very few attempts at recognizing logical location. With the lack of skill in
recognizing logical many people assume
that physical location can be used to
determine logical location. However, that
is not the case. As mentioned earlier GPS
has an accuracy of roughly 10m and WiFi
localization can have an error of up to 30+
meters. If a user is standing next to a wall
dividing two stores, the physical location
may not be enough to determine which
store the user is actually inside. Figure 13: Logical Location cannot be Determined with GPS [2]
243
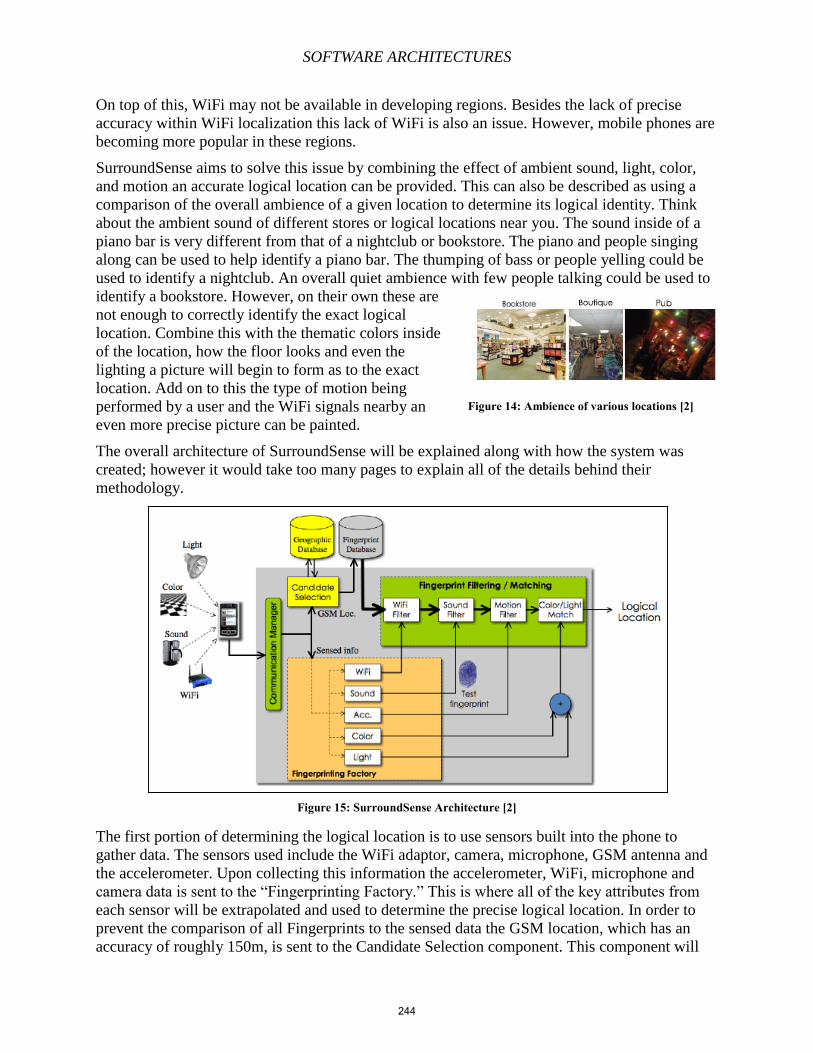
SOFTWARE ARCHITECTURES
On top of this, WiFi may not be available in developing regions. Besides the lack of precise
accuracy within WiFi localization this lack of WiFi is also an issue. However, mobile phones are
becoming more popular in these regions.
SurroundSense aims to solve this issue by combining the effect of ambient sound, light, color,
and motion an accurate logical location can be provided. This can also be described as using a
comparison of the overall ambience of a given location to determine its logical identity. Think
about the ambient sound of different stores or logical locations near you. The sound inside of a
piano bar is very different from that of a nightclub or bookstore. The piano and people singing
along can be used to help identify a piano bar. The thumping of bass or people yelling could be
used to identify a nightclub. An overall quiet ambience with few people talking could be used to
identify a bookstore. However, on their own these are
not enough to correctly identify the exact logical
location. Combine this with the thematic colors inside
of the location, how the floor looks and even the
lighting a picture will begin to form as to the exact
location. Add on to this the type of motion being
performed by a user and the WiFi signals nearby an
even more precise picture can be painted.
The overall architecture of SurroundSense will be explained along with how the system was
created; however it would take too many pages to explain all of the details behind their
methodology.
Figure 15: SurroundSense Architecture [2]
The first portion of determining the logical location is to use sensors built into the phone to
gather data. The sensors used include the WiFi adaptor, camera, microphone, GSM antenna and
the accelerometer. Upon collecting this information the accelerometer, WiFi, microphone and
camera data is sent to the “Fingerprinting Factory.” This is where all of the key attributes from
each sensor will be extrapolated and used to determine the precise logical location. In order to
prevent the comparison of all Fingerprints to the sensed data the GSM location, which has an
accuracy of roughly 150m, is sent to the Candidate Selection component. This component will
Figure 14: Ambience of various locations [2]
244
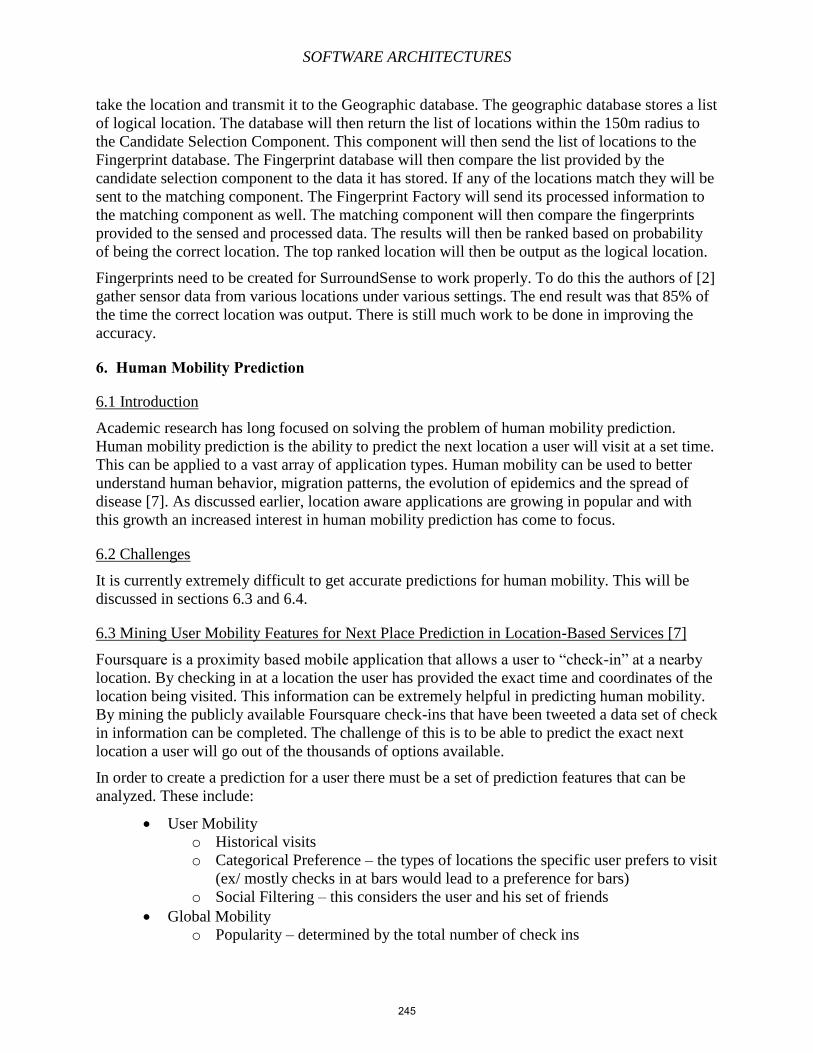
SOFTWARE ARCHITECTURES
take the location and transmit it to the Geographic database. The geographic database stores a list
of logical location. The database will then return the list of locations within the 150m radius to
the Candidate Selection Component. This component will then send the list of locations to the
Fingerprint database. The Fingerprint database will then compare the list provided by the
candidate selection component to the data it has stored. If any of the locations match they will be
sent to the matching component. The Fingerprint Factory will send its processed information to
the matching component as well. The matching component will then compare the fingerprints
provided to the sensed and processed data. The results will then be ranked based on probability
of being the correct location. The top ranked location will then be output as the logical location.
Fingerprints need to be created for SurroundSense to work properly. To do this the authors of [2]
gather sensor data from various locations under various settings. The end result was that 85% of
the time the correct location was output. There is still much work to be done in improving the
accuracy.
6. Human Mobility Prediction
6.1 Introduction
Academic research has long focused on solving the problem of human mobility prediction.
Human mobility prediction is the ability to predict the next location a user will visit at a set time.
This can be applied to a vast array of application types. Human mobility can be used to better
understand human behavior, migration patterns, the evolution of epidemics and the spread of
disease [7]. As discussed earlier, location aware applications are growing in popular and with
this growth an increased interest in human mobility prediction has come to focus.
6.2 Challenges
It is currently extremely difficult to get accurate predictions for human mobility. This will be
discussed in sections 6.3 and 6.4.
6.3 Mining User Mobility Features for Next Place Prediction in Location-Based Services [7]
Foursquare is a proximity based mobile application that allows a user to “check-in” at a nearby
location. By checking in at a location the user has provided the exact time and coordinates of the
location being visited. This information can be extremely helpful in predicting human mobility.
By mining the publicly available Foursquare check-ins that have been tweeted a data set of check
in information can be completed. The challenge of this is to be able to predict the exact next
location a user will go out of the thousands of options available.
In order to create a prediction for a user there must be a set of prediction features that can be
analyzed. These include:
User Mobility
o Historical visits
o Categorical Preference – the types of locations the specific user prefers to visit
(ex/ mostly checks in at bars would lead to a preference for bars)
o Social Filtering – this considers the user and his set of friends
Global Mobility
o Popularity – determined by the total number of check ins
245
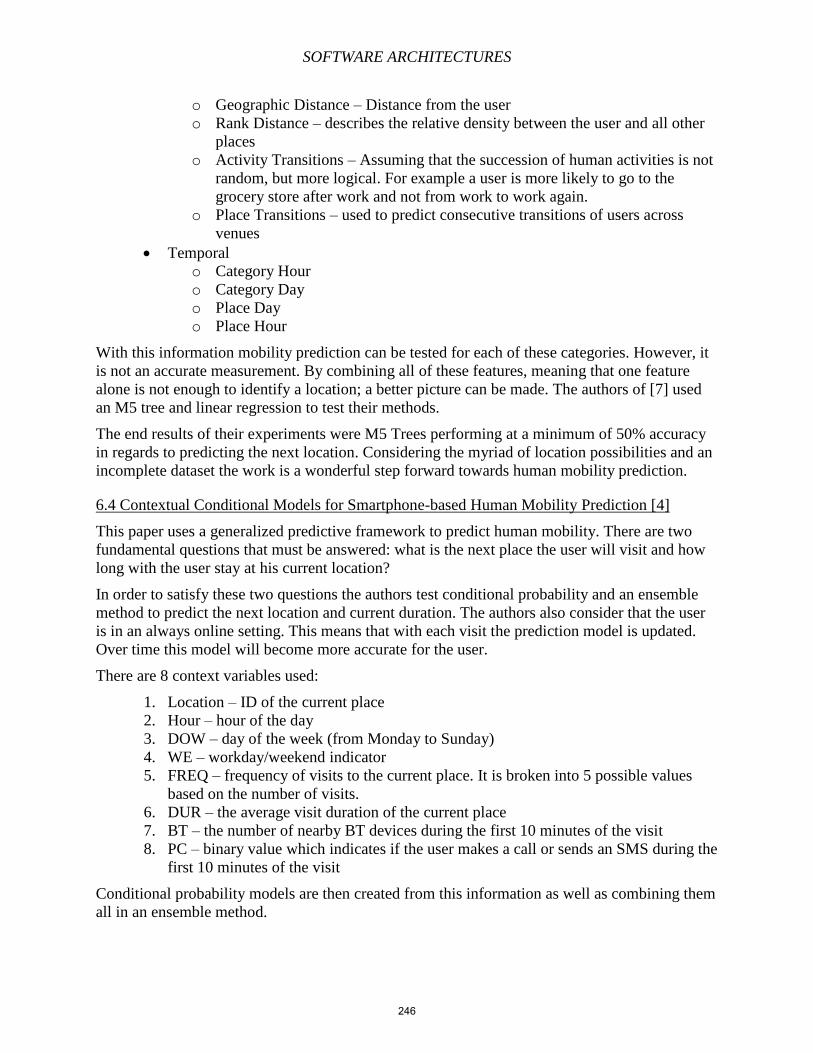
SOFTWARE ARCHITECTURES
o Geographic Distance – Distance from the user
o Rank Distance – describes the relative density between the user and all other
places
o Activity Transitions – Assuming that the succession of human activities is not
random, but more logical. For example a user is more likely to go to the
grocery store after work and not from work to work again.
o Place Transitions – used to predict consecutive transitions of users across
venues
Temporal
o Category Hour
o Category Day
o Place Day
o Place Hour
With this information mobility prediction can be tested for each of these categories. However, it
is not an accurate measurement. By combining all of these features, meaning that one feature
alone is not enough to identify a location; a better picture can be made. The authors of [7] used
an M5 tree and linear regression to test their methods.
The end results of their experiments were M5 Trees performing at a minimum of 50% accuracy
in regards to predicting the next location. Considering the myriad of location possibilities and an
incomplete dataset the work is a wonderful step forward towards human mobility prediction.
6.4 Contextual Conditional Models for Smartphone-based Human Mobility Prediction [4]
This paper uses a generalized predictive framework to predict human mobility. There are two
fundamental questions that must be answered: what is the next place the user will visit and how
long with the user stay at his current location?
In order to satisfy these two questions the authors test conditional probability and an ensemble
method to predict the next location and current duration. The authors also consider that the user
is in an always online setting. This means that with each visit the prediction model is updated.
Over time this model will become more accurate for the user.
There are 8 context variables used:
1. Location – ID of the current place
2. Hour – hour of the day
3. DOW – day of the week (from Monday to Sunday)
4. WE – workday/weekend indicator
5. FREQ – frequency of visits to the current place. It is broken into 5 possible values
based on the number of visits.
6. DUR – the average visit duration of the current place
7. BT – the number of nearby BT devices during the first 10 minutes of the visit
8. PC – binary value which indicates if the user makes a call or sends an SMS during the
first 10 minutes of the visit
Conditional probability models are then created from this information as well as combining them
all in an ensemble method.
246
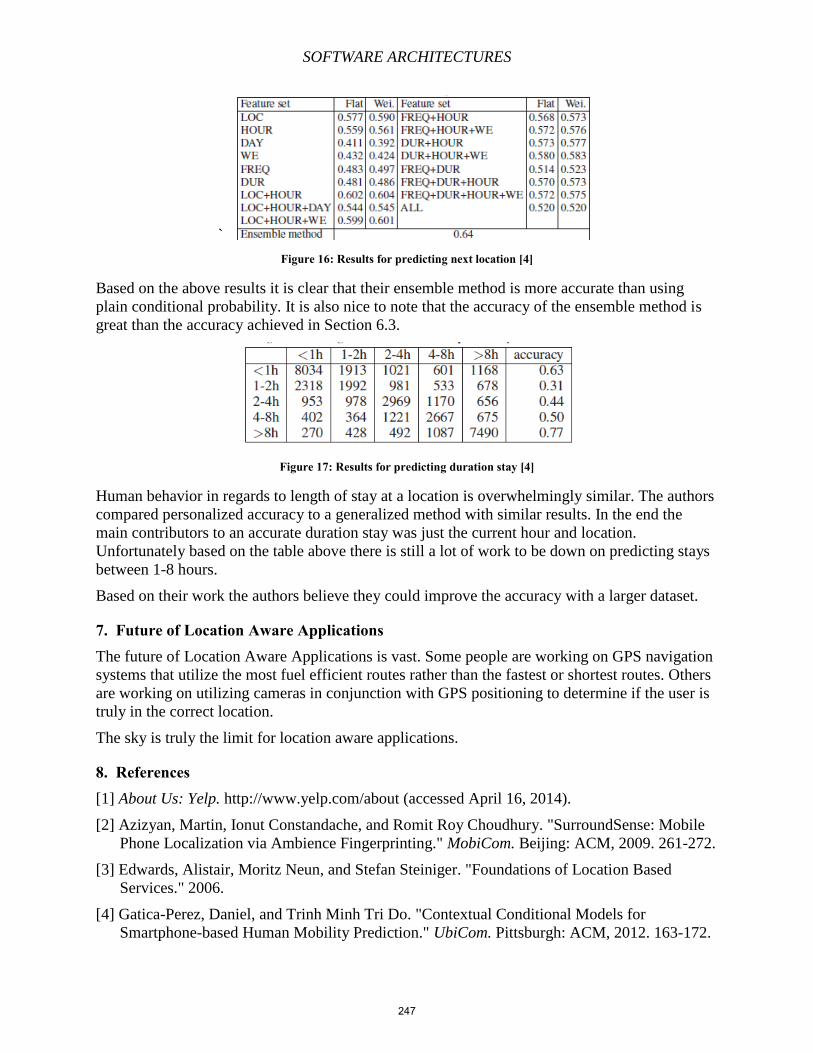
SOFTWARE ARCHITECTURES
`
Figure 16: Results for predicting next location [4]
Based on the above results it is clear that their ensemble method is more accurate than using
plain conditional probability. It is also nice to note that the accuracy of the ensemble method is
great than the accuracy achieved in Section 6.3.
Figure 17: Results for predicting duration stay [4]
Human behavior in regards to length of stay at a location is overwhelmingly similar. The authors
compared personalized accuracy to a generalized method with similar results. In the end the
main contributors to an accurate duration stay was just the current hour and location.
Unfortunately based on the table above there is still a lot of work to be down on predicting stays
between 1-8 hours.
Based on their work the authors believe they could improve the accuracy with a larger dataset.
7. Future of Location Aware Applications The future of Location Aware Applications is vast. Some people are working on GPS navigation
systems that utilize the most fuel efficient routes rather than the fastest or shortest routes. Others
are working on utilizing cameras in conjunction with GPS positioning to determine if the user is
truly in the correct location.
The sky is truly the limit for location aware applications.
8. References [1] About Us: Yelp. http://www.yelp.com/about (accessed April 16, 2014).
[2] Azizyan, Martin, Ionut Constandache, and Romit Roy Choudhury. "SurroundSense: Mobile
Phone Localization via Ambience Fingerprinting." MobiCom. Beijing: ACM, 2009. 261-272.
[3] Edwards, Alistair, Moritz Neun, and Stefan Steiniger. "Foundations of Location Based
Services." 2006.
[4] Gatica-Perez, Daniel, and Trinh Minh Tri Do. "Contextual Conditional Models for
Smartphone-based Human Mobility Prediction." UbiCom. Pittsburgh: ACM, 2012. 163-172.
247
SOFTWARE ARCHITECTURES
[5] Griffin, Darren. How does the Global Positioning System work? June 26, 2011.
http://www.pocketgpsworld.com/howgpsworks.php (accessed April 16, 2014).
[6] How does GPS Mapping Software Work? http://www.mio.com/technology-gps-mapping-
work.htm (accessed April 16, 2014).
[7] Lathia, Neal, Cecilia Mascolo, Anastasios Noulas, and Salvatore Scellato. "Mining User
Mobility Features for Next Place Prediction in Location-based Services." International
Conference on Data Mining. IEEE, 2012. 1038-1043.
[8] Location-based Service: Wikipedia. http://en.wikipedia.org/wiki/Location_based_service
(accessed April 16, 2014).
[9] Navarro, Eduardo, Benjamin Peuker, and Michael Quan. Wi-Fi Localization Using RSSI
Fingerprinting. San Luis Obispo: California Polytechnic State University, 2010.
[10] Routing Server: Waze Wiki. https://wiki.waze.com/wiki/Routing_server (accessed April 16,
2014).
[11] Stewart, Mike. State of the Yellow Pages Industry. http://www.smbseo.com/state-of-the-
yellow-pages-industry (accessed April 16, 2014).
[12] What is Triangulation? http://www.qrg.northwestern.edu/projects/vss/docs/Navigation/1-
what-is-triangulation.html (accessed April 16, 2014).
248
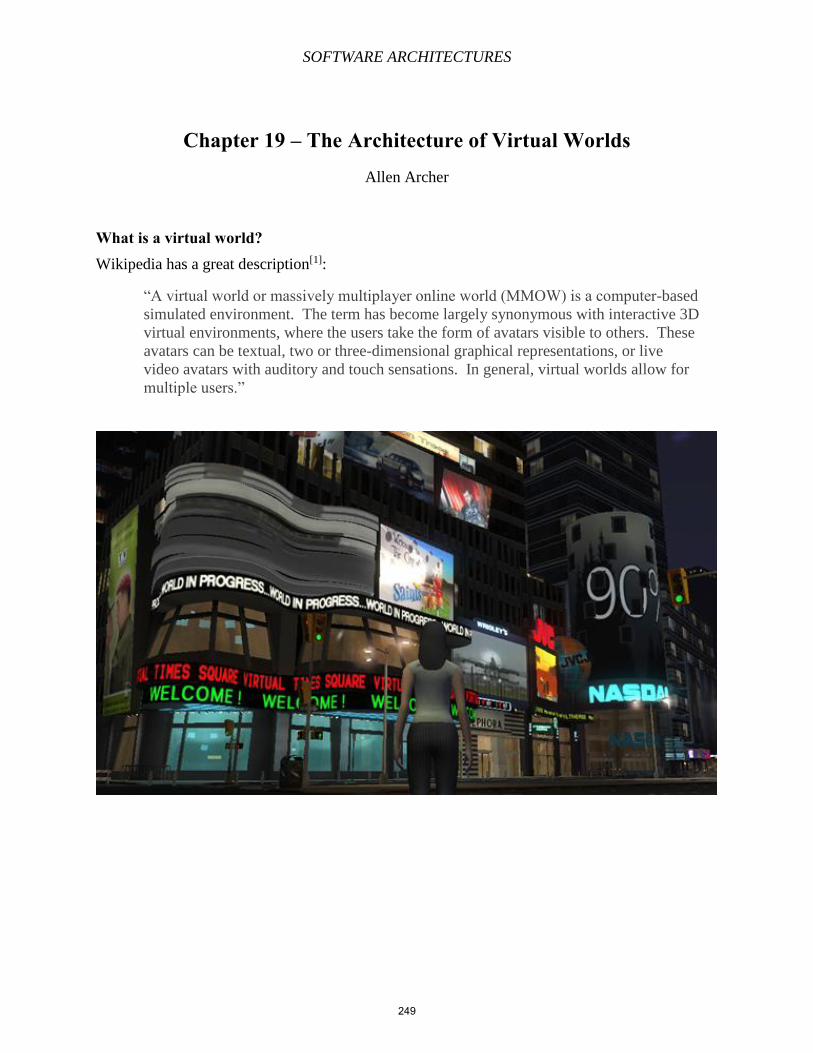
SOFTWARE ARCHITECTURES
Chapter 19 – The Architecture of Virtual Worlds Allen Archer
What is a virtual world? Wikipedia has a great description[1]:
“A virtual world or massively multiplayer online world (MMOW) is a computer-based
simulated environment. The term has become largely synonymous with interactive 3D
virtual environments, where the users take the form of avatars visible to others. These
avatars can be textual, two or three-dimensional graphical representations, or live
video avatars with auditory and touch sensations. In general, virtual worlds allow for
multiple users.”
249
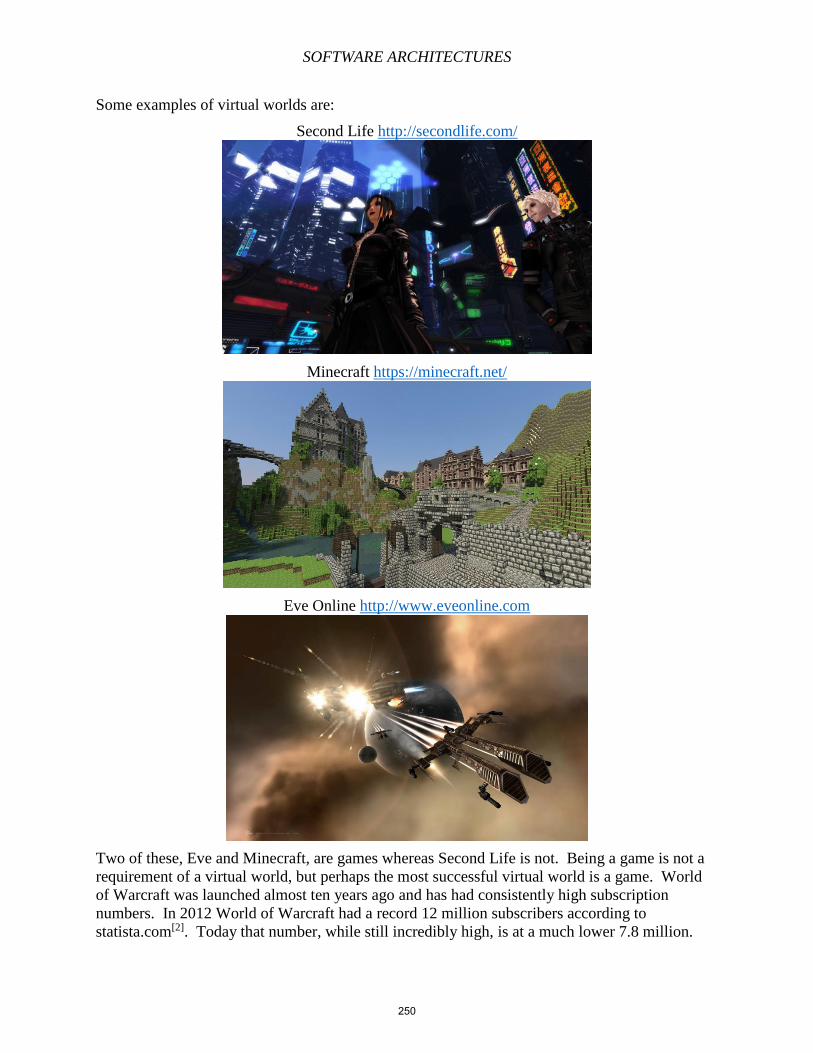
SOFTWARE ARCHITECTURES
Some examples of virtual worlds are:
Second Life http://secondlife.com/
Minecraft https://minecraft.net/
Eve Online http://www.eveonline.com
Two of these, Eve and Minecraft, are games whereas Second Life is not. Being a game is not a
requirement of a virtual world, but perhaps the most successful virtual world is a game. World
of Warcraft was launched almost ten years ago and has had consistently high subscription
numbers. In 2012 World of Warcraft had a record 12 million subscribers according to
statista.com[2]. Today that number, while still incredibly high, is at a much lower 7.8 million.
250
SOFTWARE ARCHITECTURES
According to Guinness World Records[3], "World of Warcraft is the most popular Massively
Multiplayer Online Role-Playing Game" with, at that time in 2008, 10 million subscribers.
So what is World of Warcraft?
http://us.battle.net/wow/en/
It is a game created by Blizzard Entertainment and from their own website battle.net[4],
"World of Warcraft is an online game where players from around the world assume the
roles of heroic fantasy characters and explore a virtual world full of mystery, magic, and
endless adventure."
World of Warcraft is a Massively Multiplayer Online Role-Playing Game, MMORPG for short.
Blizzard says, "In an MMORPG, you play the role of a unique character in a persistent online
world shared by thousands of other players."
All of this information about World of Warcraft is interesting, but what does it have to do with
the architecture of virtual worlds? Most virtual worlds like World of Warcraft are proprietary
and closed source software so there is no real way to examine the architecture of a game like
World of Warcraft. However, it is possible to examine the structure of the virtual world and how
the users are allowed to interact with that world to determine some of the structural elements of
the virtual world.
In addition to examining World of Warcraft, Blizzard has other virtual worlds which we can
explore. By comparing different virtual worlds, specifically those made by the same company,
we will be able to examine some of the common components of virtual worlds.
251
SOFTWARE ARCHITECTURES
What other virtual worlds has Blizzard created? StarCraft II
http://us.battle.net/sc2/en/
StarCraft II is the sequel to Blizzard's wildly popular science fiction real-time strategy game that
was released in 1998. In a real-time strategy game, players take the role of a battle commander
and issue orders to units to build buildings or other units and to attack other player units and
buildings.
Diablo III
http://us.battle.net/d3/en/
Diablo III is the third action adventure role playing game in the fantasy Diablo series which
started with Diablo in 1996. In an action adventure role playing game, players take the role of a
fantasy adventurer character and fight monsters and complete epic quests while gaining
experience and loot.
Hearthstone
http://us.battle.net/hearthstone/en/
Hearthstone is a collectible card game set in the same world as World of Warcraft. In this game,
players create decks using cards they have won or purchased. Players play other players in head
to head games. All of the cards in the game represent characters from World of Warcraft.
How can a card game be a virtual world? While it's true that it can be hard to understand how some of these games can be considered
virtual worlds. The two main components of virtual worlds are a computer simulation of a world
and the allowance of many users to take part in the same simulation. In Hearthstone, the world is
simply represented and simulated in a very different manner than the other games.
Here are some of the observations we can make about these virtual worlds.
252
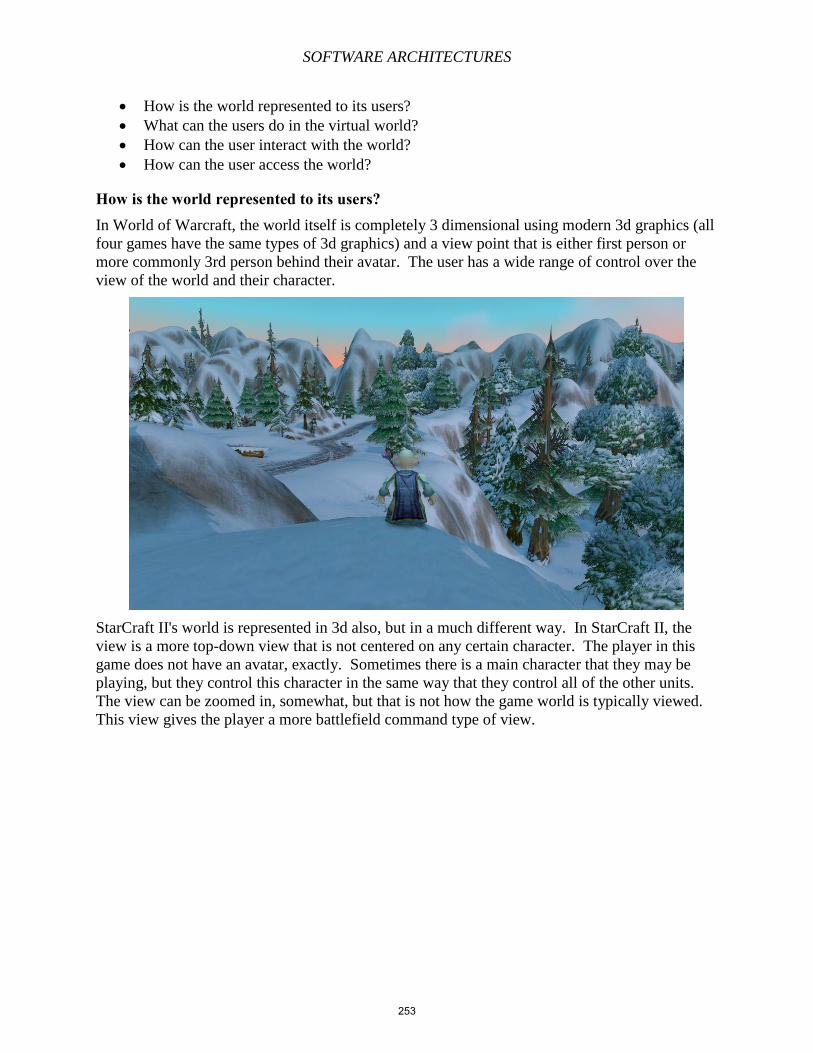
SOFTWARE ARCHITECTURES
How is the world represented to its users?
What can the users do in the virtual world?
How can the user interact with the world?
How can the user access the world?
How is the world represented to its users? In World of Warcraft, the world itself is completely 3 dimensional using modern 3d graphics (all
four games have the same types of 3d graphics) and a view point that is either first person or
more commonly 3rd person behind their avatar. The user has a wide range of control over the
view of the world and their character.
StarCraft II's world is represented in 3d also, but in a much different way. In StarCraft II, the
view is a more top-down view that is not centered on any certain character. The player in this
game does not have an avatar, exactly. Sometimes there is a main character that they may be
playing, but they control this character in the same way that they control all of the other units.
The view can be zoomed in, somewhat, but that is not how the game world is typically viewed.
This view gives the player a more battlefield command type of view.
253
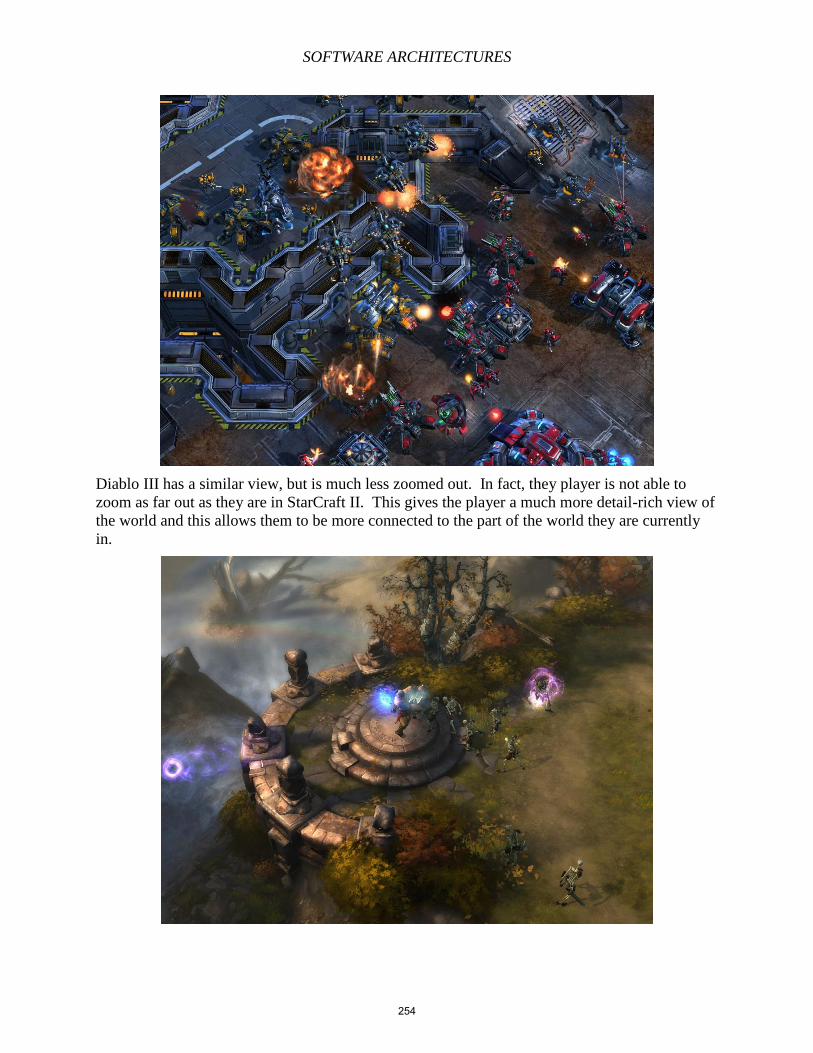
SOFTWARE ARCHITECTURES
Diablo III has a similar view, but is much less zoomed out. In fact, they player is not able to
zoom as far out as they are in StarCraft II. This gives the player a much more detail-rich view of
the world and this allows them to be more connected to the part of the world they are currently
in.
254
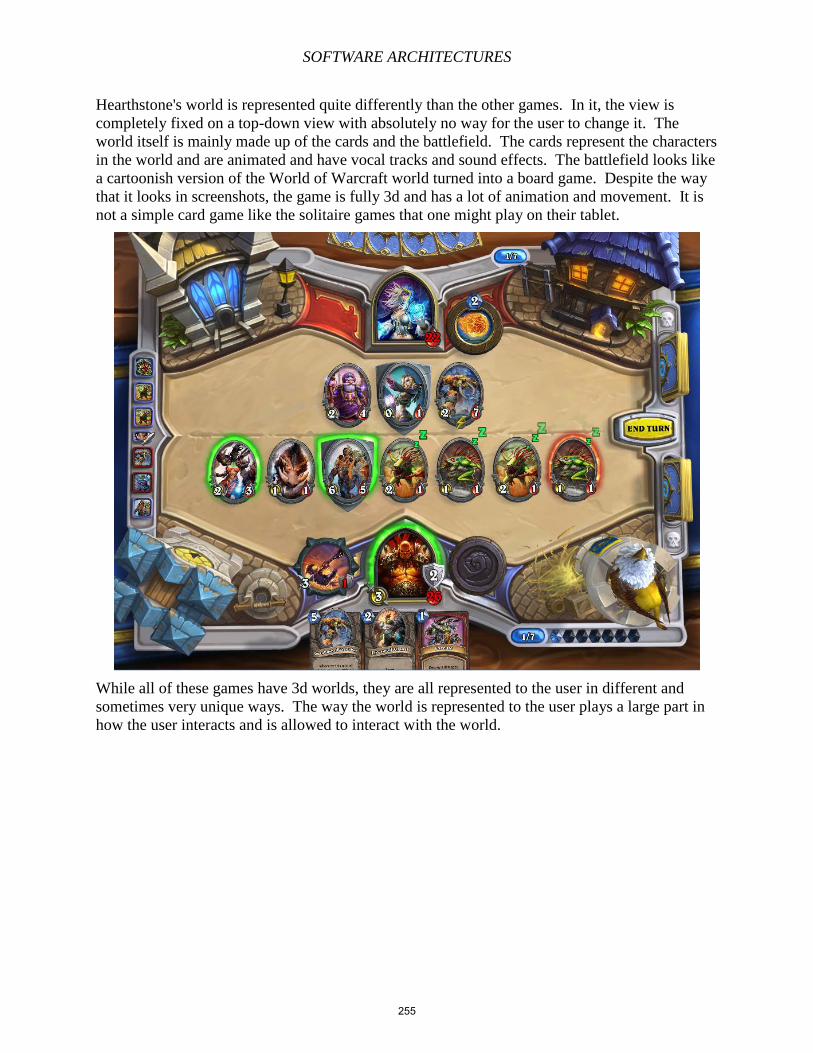
SOFTWARE ARCHITECTURES
Hearthstone's world is represented quite differently than the other games. In it, the view is
completely fixed on a top-down view with absolutely no way for the user to change it. The
world itself is mainly made up of the cards and the battlefield. The cards represent the characters
in the world and are animated and have vocal tracks and sound effects. The battlefield looks like
a cartoonish version of the World of Warcraft world turned into a board game. Despite the way
that it looks in screenshots, the game is fully 3d and has a lot of animation and movement. It is
not a simple card game like the solitaire games that one might play on their tablet.
While all of these games have 3d worlds, they are all represented to the user in different and
sometimes very unique ways. The way the world is represented to the user plays a large part in
how the user interacts and is allowed to interact with the world.
255
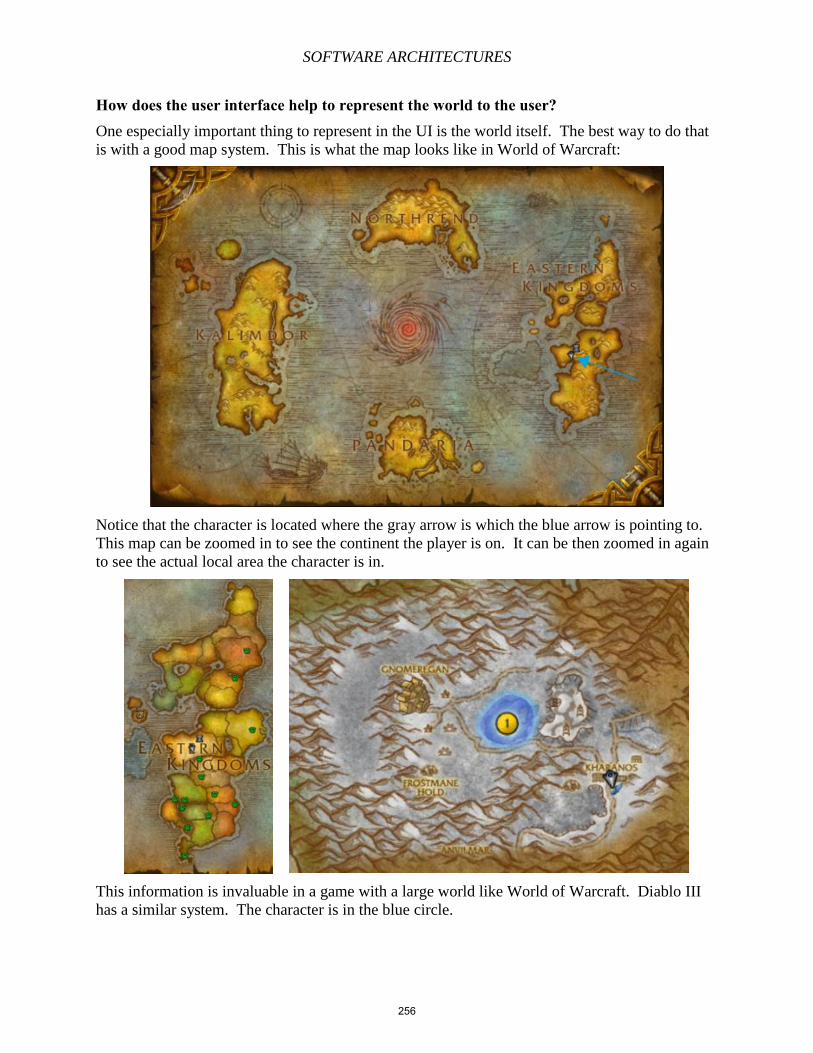
SOFTWARE ARCHITECTURES
How does the user interface help to represent the world to the user? One especially important thing to represent in the UI is the world itself. The best way to do that
is with a good map system. This is what the map looks like in World of Warcraft:
Notice that the character is located where the gray arrow is which the blue arrow is pointing to.
This map can be zoomed in to see the continent the player is on. It can be then zoomed in again
to see the actual local area the character is in.
This information is invaluable in a game with a large world like World of Warcraft. Diablo III
has a similar system. The character is in the blue circle.
256
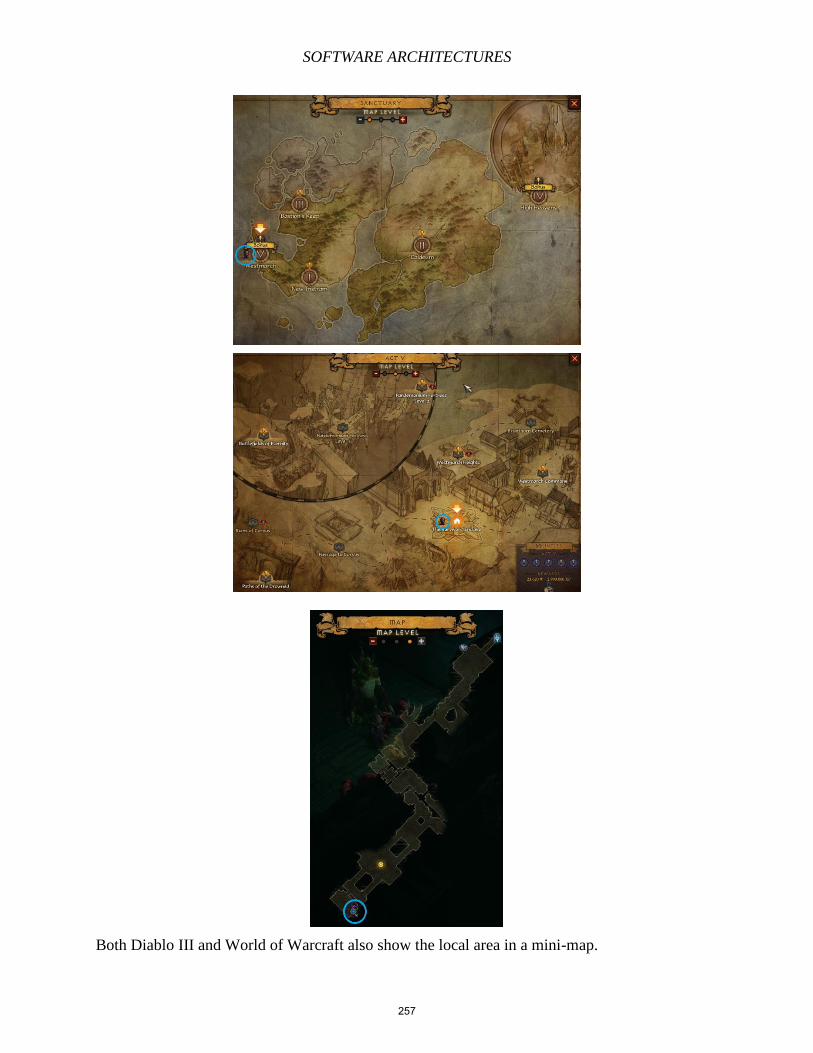
SOFTWARE ARCHITECTURES
Both Diablo III and World of Warcraft also show the local area in a mini-map.
257
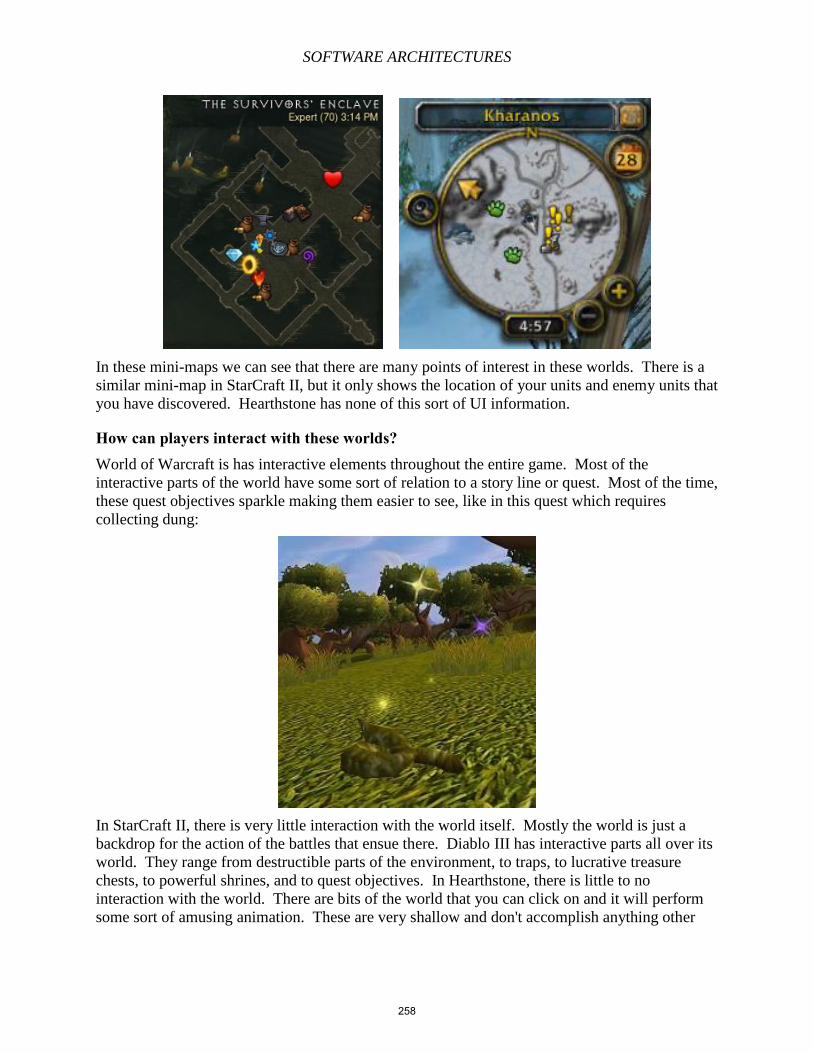
SOFTWARE ARCHITECTURES
In these mini-maps we can see that there are many points of interest in these worlds. There is a
similar mini-map in StarCraft II, but it only shows the location of your units and enemy units that
you have discovered. Hearthstone has none of this sort of UI information.
How can players interact with these worlds? World of Warcraft is has interactive elements throughout the entire game. Most of the
interactive parts of the world have some sort of relation to a story line or quest. Most of the time,
these quest objectives sparkle making them easier to see, like in this quest which requires
collecting dung:
In StarCraft II, there is very little interaction with the world itself. Mostly the world is just a
backdrop for the action of the battles that ensue there. Diablo III has interactive parts all over its
world. They range from destructible parts of the environment, to traps, to lucrative treasure
chests, to powerful shrines, and to quest objectives. In Hearthstone, there is little to no
interaction with the world. There are bits of the world that you can click on and it will perform
some sort of amusing animation. These are very shallow and don't accomplish anything other
258
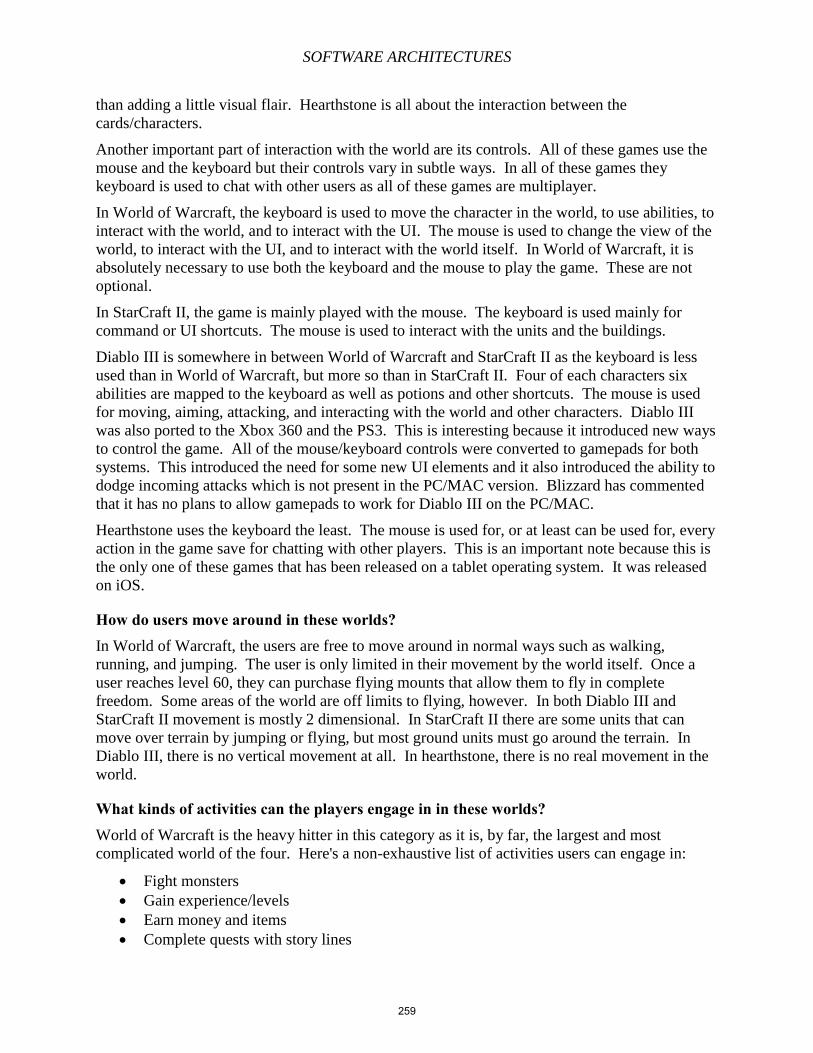
SOFTWARE ARCHITECTURES
than adding a little visual flair. Hearthstone is all about the interaction between the
cards/characters.
Another important part of interaction with the world are its controls. All of these games use the
mouse and the keyboard but their controls vary in subtle ways. In all of these games they
keyboard is used to chat with other users as all of these games are multiplayer.
In World of Warcraft, the keyboard is used to move the character in the world, to use abilities, to
interact with the world, and to interact with the UI. The mouse is used to change the view of the
world, to interact with the UI, and to interact with the world itself. In World of Warcraft, it is
absolutely necessary to use both the keyboard and the mouse to play the game. These are not
optional.
In StarCraft II, the game is mainly played with the mouse. The keyboard is used mainly for
command or UI shortcuts. The mouse is used to interact with the units and the buildings.
Diablo III is somewhere in between World of Warcraft and StarCraft II as the keyboard is less
used than in World of Warcraft, but more so than in StarCraft II. Four of each characters six
abilities are mapped to the keyboard as well as potions and other shortcuts. The mouse is used
for moving, aiming, attacking, and interacting with the world and other characters. Diablo III
was also ported to the Xbox 360 and the PS3. This is interesting because it introduced new ways
to control the game. All of the mouse/keyboard controls were converted to gamepads for both
systems. This introduced the need for some new UI elements and it also introduced the ability to
dodge incoming attacks which is not present in the PC/MAC version. Blizzard has commented
that it has no plans to allow gamepads to work for Diablo III on the PC/MAC.
Hearthstone uses the keyboard the least. The mouse is used for, or at least can be used for, every
action in the game save for chatting with other players. This is an important note because this is
the only one of these games that has been released on a tablet operating system. It was released
on iOS.
How do users move around in these worlds? In World of Warcraft, the users are free to move around in normal ways such as walking,
running, and jumping. The user is only limited in their movement by the world itself. Once a
user reaches level 60, they can purchase flying mounts that allow them to fly in complete
freedom. Some areas of the world are off limits to flying, however. In both Diablo III and
StarCraft II movement is mostly 2 dimensional. In StarCraft II there are some units that can
move over terrain by jumping or flying, but most ground units must go around the terrain. In
Diablo III, there is no vertical movement at all. In hearthstone, there is no real movement in the
world.
What kinds of activities can the players engage in in these worlds? World of Warcraft is the heavy hitter in this category as it is, by far, the largest and most
complicated world of the four. Here's a non-exhaustive list of activities users can engage in:
Fight monsters
Gain experience/levels
Earn money and items
Complete quests with story lines
259
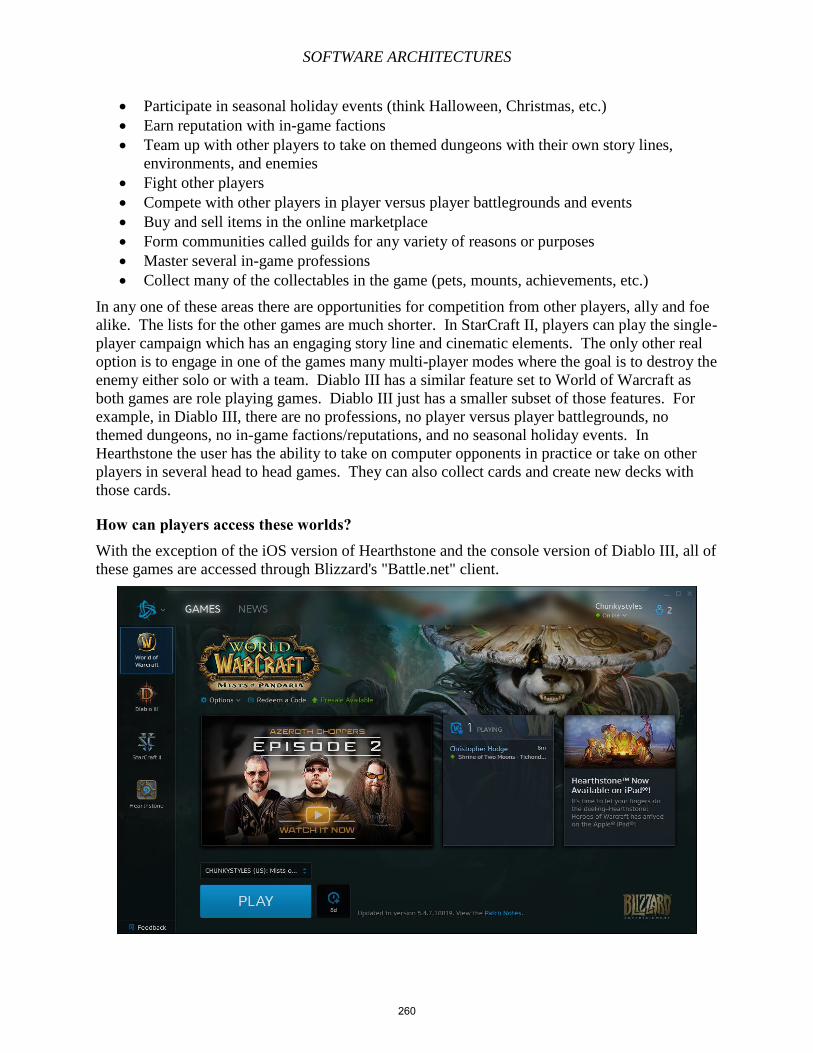
SOFTWARE ARCHITECTURES
Participate in seasonal holiday events (think Halloween, Christmas, etc.)
Earn reputation with in-game factions
Team up with other players to take on themed dungeons with their own story lines,
environments, and enemies
Fight other players
Compete with other players in player versus player battlegrounds and events
Buy and sell items in the online marketplace
Form communities called guilds for any variety of reasons or purposes
Master several in-game professions
Collect many of the collectables in the game (pets, mounts, achievements, etc.)
In any one of these areas there are opportunities for competition from other players, ally and foe
alike. The lists for the other games are much shorter. In StarCraft II, players can play the single-
player campaign which has an engaging story line and cinematic elements. The only other real
option is to engage in one of the games many multi-player modes where the goal is to destroy the
enemy either solo or with a team. Diablo III has a similar feature set to World of Warcraft as
both games are role playing games. Diablo III just has a smaller subset of those features. For
example, in Diablo III, there are no professions, no player versus player battlegrounds, no
themed dungeons, no in-game factions/reputations, and no seasonal holiday events. In
Hearthstone the user has the ability to take on computer opponents in practice or take on other
players in several head to head games. They can also collect cards and create new decks with
those cards.
How can players access these worlds? With the exception of the iOS version of Hearthstone and the console version of Diablo III, all of
these games are accessed through Blizzard's "Battle.net" client.
260
SOFTWARE ARCHITECTURES
In this client the user can download and install the games, purchase the games or subscriptions
for the games, buy items from the real money store, interact with their friends, or read news
about Blizzard and its games. It is interesting to note that to access these games, the player must
have an active internet connection. This allows Blizzard to keep all of the player's information
centrally so it is the same regardless of what machine the player logs in from. This is true for
both the iOS and the PC/MAC versions of Hearthstone. This does not work, currently, for the
PC/MAC and the console versions of Diablo III. Those game worlds are saved separately
creating 3 unconnected worlds.
What conclusions can we draw from all of this information? While we can't derive from this what makes a successful virtual world, we can at least examine
what common components these popular virtual worlds contain. While it could be argued that
these of these components are elementary, one company would disagree. Worlds INC is
currently in litigation with Blizzard over patents regarding virtual worlds[5]. Worlds INC has
already settled out of court with other companies that own virtual worlds. However, the outcome
of the case with Blizzard could be monumental given Blizzard's stature as having the most
successful virtual world.
Sources [1] Virtual World, http://en.wikipedia.org/wiki/Virtual_world, accessed: 4/27/2014
[2] World of Warcraft subscription numbers 2005-2013 | Statistic,
http://www.statista.com/statistics/276601/number-of-world-of-warcraft-subscribers-by-
quarter/, accessed: 4/27/2014
[3] Craig Glenday, Guinness World Records 2009, Random House, Location, 2009
[4] Beginner's Guide - Game Guide - World of Warcraft,
http://us.battle.net/wow/en/game/guide/, accessed: 4/24/2014
[5] Activision Blizzard sued over WOW, COD - Report - GameSpot,
http://www.gamespot.com/articles/activision-blizzard-sued-over-wow-cod-report/1100-
6371332/, accessed: 4/29/2014
261
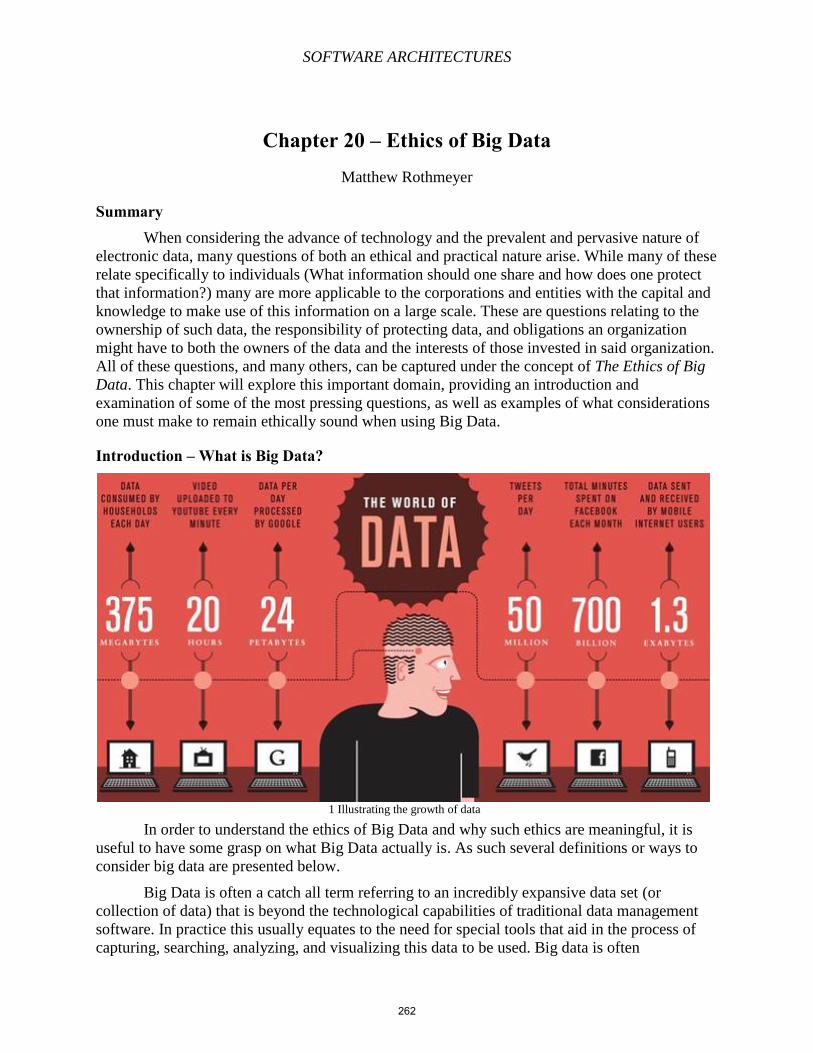
SOFTWARE ARCHITECTURES
Chapter 20 – Ethics of Big Data Matthew Rothmeyer
Summary When considering the advance of technology and the prevalent and pervasive nature of
electronic data, many questions of both an ethical and practical nature arise. While many of these
relate specifically to individuals (What information should one share and how does one protect
that information?) many are more applicable to the corporations and entities with the capital and
knowledge to make use of this information on a large scale. These are questions relating to the
ownership of such data, the responsibility of protecting data, and obligations an organization
might have to both the owners of the data and the interests of those invested in said organization.
All of these questions, and many others, can be captured under the concept of The Ethics of Big
Data. This chapter will explore this important domain, providing an introduction and
examination of some of the most pressing questions, as well as examples of what considerations
one must make to remain ethically sound when using Big Data.
Introduction – What is Big Data?
In order to understand the ethics of Big Data and why such ethics are meaningful, it is
useful to have some grasp on what Big Data actually is. As such several definitions or ways to
consider big data are presented below.
Big Data is often a catch all term referring to an incredibly expansive data set (or
collection of data) that is beyond the technological capabilities of traditional data management
software. In practice this usually equates to the need for special tools that aid in the process of
capturing, searching, analyzing, and visualizing this data to be used. Big data is often
1 Illustrating the growth of data
262
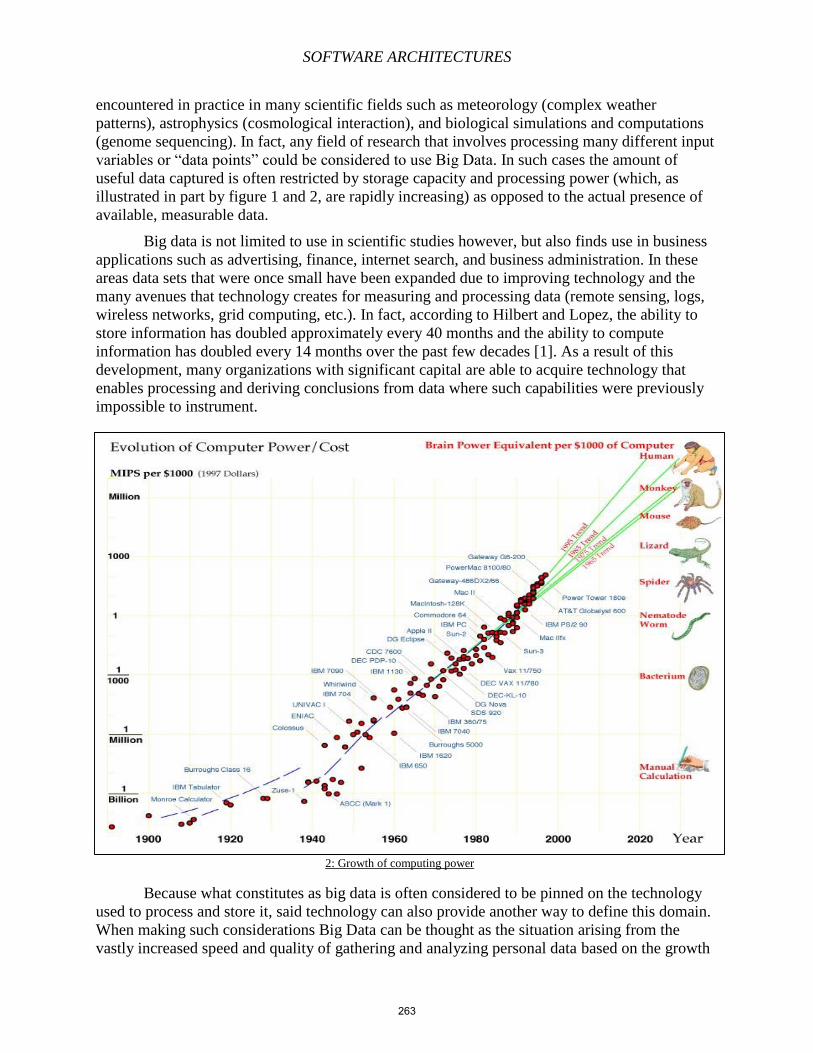
SOFTWARE ARCHITECTURES
encountered in practice in many scientific fields such as meteorology (complex weather
patterns), astrophysics (cosmological interaction), and biological simulations and computations
(genome sequencing). In fact, any field of research that involves processing many different input
variables or “data points” could be considered to use Big Data. In such cases the amount of
useful data captured is often restricted by storage capacity and processing power (which, as
illustrated in part by figure 1 and 2, are rapidly increasing) as opposed to the actual presence of
available, measurable data.
Big data is not limited to use in scientific studies however, but also finds use in business
applications such as advertising, finance, internet search, and business administration. In these
areas data sets that were once small have been expanded due to improving technology and the
many avenues that technology creates for measuring and processing data (remote sensing, logs,
wireless networks, grid computing, etc.). In fact, according to Hilbert and Lopez, the ability to
store information has doubled approximately every 40 months and the ability to compute
information has doubled every 14 months over the past few decades [1]. As a result of this
development, many organizations with significant capital are able to acquire technology that
enables processing and deriving conclusions from data where such capabilities were previously
impossible to instrument.
Because what constitutes as big data is often considered to be pinned on the technology
used to process and store it, said technology can also provide another way to define this domain.
When making such considerations Big Data can be thought as the situation arising from the
vastly increased speed and quality of gathering and analyzing personal data based on the growth
2: Growth of computing power
263
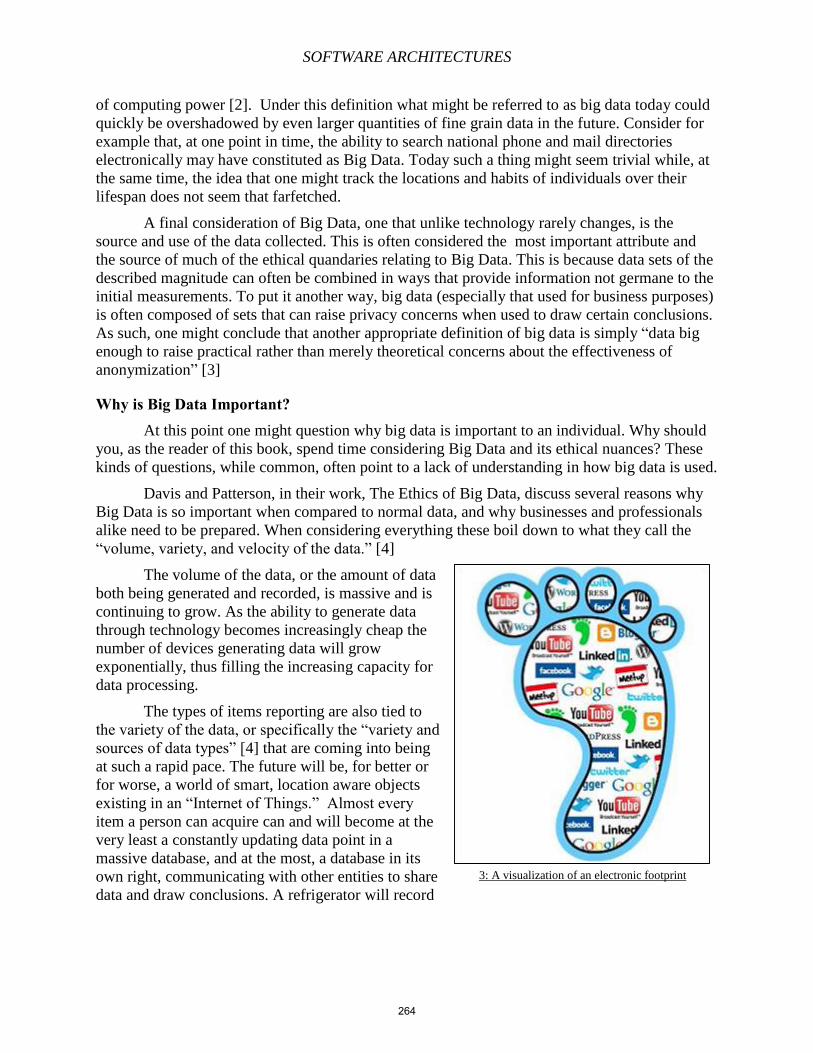
SOFTWARE ARCHITECTURES
of computing power [2]. Under this definition what might be referred to as big data today could
quickly be overshadowed by even larger quantities of fine grain data in the future. Consider for
example that, at one point in time, the ability to search national phone and mail directories
electronically may have constituted as Big Data. Today such a thing might seem trivial while, at
the same time, the idea that one might track the locations and habits of individuals over their
lifespan does not seem that farfetched.
A final consideration of Big Data, one that unlike technology rarely changes, is the
source and use of the data collected. This is often considered the most important attribute and
the source of much of the ethical quandaries relating to Big Data. This is because data sets of the
described magnitude can often be combined in ways that provide information not germane to the
initial measurements. To put it another way, big data (especially that used for business purposes)
is often composed of sets that can raise privacy concerns when used to draw certain conclusions.
As such, one might conclude that another appropriate definition of big data is simply “data big
enough to raise practical rather than merely theoretical concerns about the effectiveness of
anonymization” [3]
Why is Big Data Important? At this point one might question why big data is important to an individual. Why should
you, as the reader of this book, spend time considering Big Data and its ethical nuances? These
kinds of questions, while common, often point to a lack of understanding in how big data is used.
Davis and Patterson, in their work, The Ethics of Big Data, discuss several reasons why
Big Data is so important when compared to normal data, and why businesses and professionals
alike need to be prepared. When considering everything these boil down to what they call the
“volume, variety, and velocity of the data.” [4]
The volume of the data, or the amount of data
both being generated and recorded, is massive and is
continuing to grow. As the ability to generate data
through technology becomes increasingly cheap the
number of devices generating data will grow
exponentially, thus filling the increasing capacity for
data processing.
The types of items reporting are also tied to
the variety of the data, or specifically the “variety and
sources of data types” [4] that are coming into being
at such a rapid pace. The future will be, for better or
for worse, a world of smart, location aware objects
existing in an “Internet of Things.” Almost every
item a person can acquire can and will become at the
very least a constantly updating data point in a
massive database, and at the most, a database in its
own right, communicating with other entities to share
data and draw conclusions. A refrigerator will record
3: A visualization of an electronic footprint
264
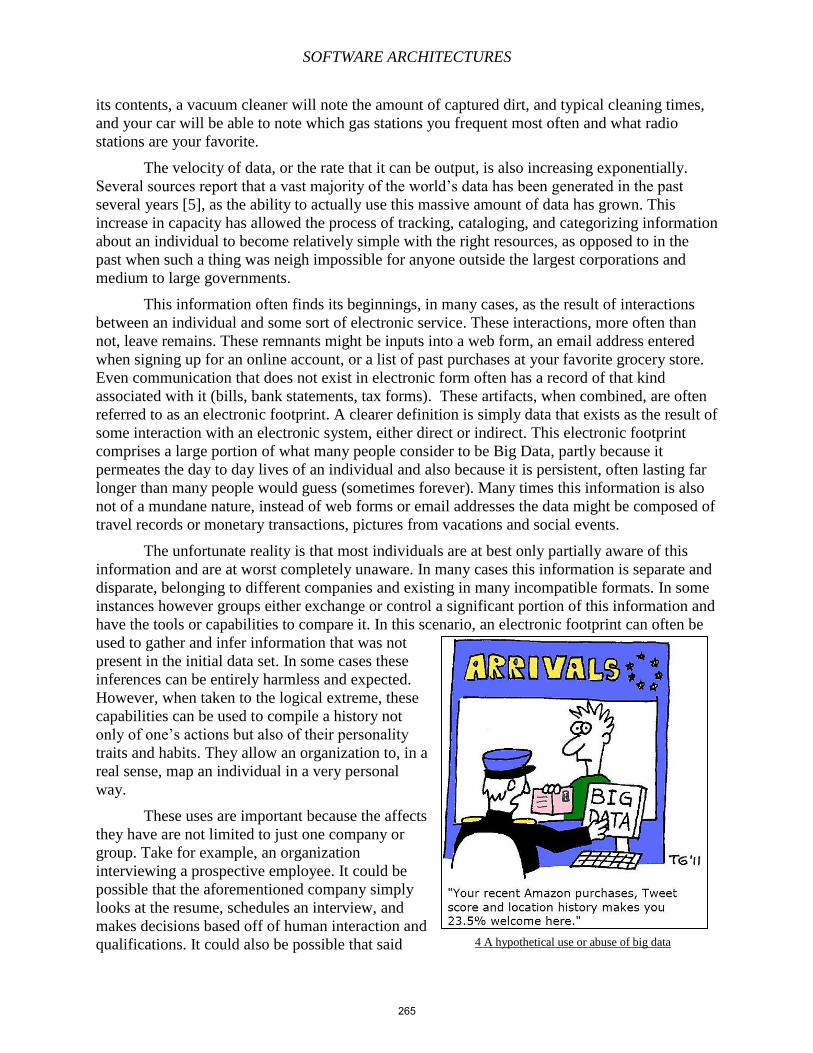
SOFTWARE ARCHITECTURES
its contents, a vacuum cleaner will note the amount of captured dirt, and typical cleaning times,
and your car will be able to note which gas stations you frequent most often and what radio
stations are your favorite.
The velocity of data, or the rate that it can be output, is also increasing exponentially.
Several sources report that a vast majority of the world’s data has been generated in the past
several years [5], as the ability to actually use this massive amount of data has grown. This
increase in capacity has allowed the process of tracking, cataloging, and categorizing information
about an individual to become relatively simple with the right resources, as opposed to in the
past when such a thing was neigh impossible for anyone outside the largest corporations and
medium to large governments.
This information often finds its beginnings, in many cases, as the result of interactions
between an individual and some sort of electronic service. These interactions, more often than
not, leave remains. These remnants might be inputs into a web form, an email address entered
when signing up for an online account, or a list of past purchases at your favorite grocery store.
Even communication that does not exist in electronic form often has a record of that kind
associated with it (bills, bank statements, tax forms). These artifacts, when combined, are often
referred to as an electronic footprint. A clearer definition is simply data that exists as the result of
some interaction with an electronic system, either direct or indirect. This electronic footprint
comprises a large portion of what many people consider to be Big Data, partly because it
permeates the day to day lives of an individual and also because it is persistent, often lasting far
longer than many people would guess (sometimes forever). Many times this information is also
not of a mundane nature, instead of web forms or email addresses the data might be composed of
travel records or monetary transactions, pictures from vacations and social events.
The unfortunate reality is that most individuals are at best only partially aware of this
information and are at worst completely unaware. In many cases this information is separate and
disparate, belonging to different companies and existing in many incompatible formats. In some
instances however groups either exchange or control a significant portion of this information and
have the tools or capabilities to compare it. In this scenario, an electronic footprint can often be
used to gather and infer information that was not
present in the initial data set. In some cases these
inferences can be entirely harmless and expected.
However, when taken to the logical extreme, these
capabilities can be used to compile a history not
only of one’s actions but also of their personality
traits and habits. They allow an organization to, in a
real sense, map an individual in a very personal
way.
These uses are important because the affects
they have are not limited to just one company or
group. Take for example, an organization
interviewing a prospective employee. It could be
possible that the aforementioned company simply
looks at the resume, schedules an interview, and
makes decisions based off of human interaction and
qualifications. It could also be possible that said 4 A hypothetical use or abuse of big data
265
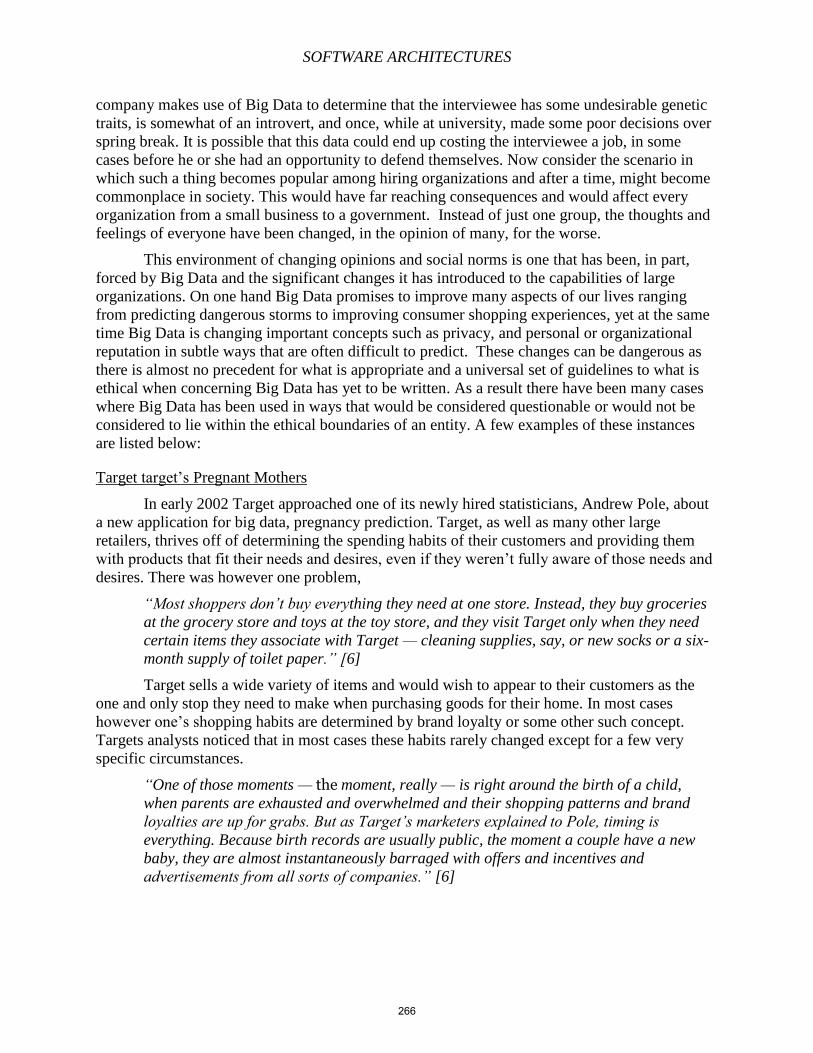
SOFTWARE ARCHITECTURES
company makes use of Big Data to determine that the interviewee has some undesirable genetic
traits, is somewhat of an introvert, and once, while at university, made some poor decisions over
spring break. It is possible that this data could end up costing the interviewee a job, in some
cases before he or she had an opportunity to defend themselves. Now consider the scenario in
which such a thing becomes popular among hiring organizations and after a time, might become
commonplace in society. This would have far reaching consequences and would affect every
organization from a small business to a government. Instead of just one group, the thoughts and
feelings of everyone have been changed, in the opinion of many, for the worse.
This environment of changing opinions and social norms is one that has been, in part,
forced by Big Data and the significant changes it has introduced to the capabilities of large
organizations. On one hand Big Data promises to improve many aspects of our lives ranging
from predicting dangerous storms to improving consumer shopping experiences, yet at the same
time Big Data is changing important concepts such as privacy, and personal or organizational
reputation in subtle ways that are often difficult to predict. These changes can be dangerous as
there is almost no precedent for what is appropriate and a universal set of guidelines to what is
ethical when concerning Big Data has yet to be written. As a result there have been many cases
where Big Data has been used in ways that would be considered questionable or would not be
considered to lie within the ethical boundaries of an entity. A few examples of these instances
are listed below:
Target target’s Pregnant Mothers
In early 2002 Target approached one of its newly hired statisticians, Andrew Pole, about
a new application for big data, pregnancy prediction. Target, as well as many other large
retailers, thrives off of determining the spending habits of their customers and providing them
with products that fit their needs and desires, even if they weren’t fully aware of those needs and
desires. There was however one problem,
“Most shoppers don’t buy everything they need at one store. Instead, they buy groceries
at the grocery store and toys at the toy store, and they visit Target only when they need
certain items they associate with Target — cleaning supplies, say, or new socks or a six-
month supply of toilet paper.” [6]
Target sells a wide variety of items and would wish to appear to their customers as the
one and only stop they need to make when purchasing goods for their home. In most cases
however one’s shopping habits are determined by brand loyalty or some other such concept.
Targets analysts noticed that in most cases these habits rarely changed except for a few very
specific circumstances.
“One of those moments — the moment, really — is right around the birth of a child,
when parents are exhausted and overwhelmed and their shopping patterns and brand
loyalties are up for grabs. But as Target’s marketers explained to Pole, timing is
everything. Because birth records are usually public, the moment a couple have a new
baby, they are almost instantaneously barraged with offers and incentives and
advertisements from all sorts of companies.” [6]
266
SOFTWARE ARCHITECTURES
After some research what Pole and many other mathematicians discovered was that,
given enough data about a particular topic (be it purchasing habits, spending frequency, the days
a person gets groceries), and the ability to process that data, one can determine almost anything
about an individual. What was unique about this discovery was that, more often than not, the
“particular topic” said data was centered around often did not need to be related to the object of
investigation. Pole eventually found that certain purchases, large quantities of lotion, vitamin
supplements, hand sanitizers, and scent free soaps were almost always associated with an
upcoming due date. Not only was this data correct, but in many cases it was very accurate. Pole
and others at Target were able to assign what they called a “pregnancy prediction score” to
shoppers that showed how likely a shopper was to be pregnant. In some cases Pole was even able
to pin the actual due date of a pregnancy to a small window of time. There was even a case in
Minneapolis where a father angrily complained about his daughter receiving coupons for baby
items only to later apologize after questioning his daughter and finding out that she was, in fact,
pregnant and that he had not been aware.
This case is important when examining the problems caused by big data for two reasons.
First, few if any of the customers had explicitly given Target (or in some cases anyone)
information about their pregnancy and yet Target was able to determine this fact with a high
degree of accuracy. This is important because it is an excellent example of how a large amount
of seemingly unrelated data points can be used to determine very specific pieces of information
about an individual, information that in many cases would be considered private. Second, an
organization using information in this way can end up damaging its own reputation. In this case
Target ended up being the center of an “onslaught of commentary and subsequent news” which
“raised numerous questions ranging from the legality of Target’s actions to the broader public
concern about private, personal information being made more public.” [4]
Apple Records More Than Music
In April of 2011 security researches Alasdair Allan and Pete Warden announced at the
Where 2.0 conference that several apple products, specifically the iphone and 3g iPad, had been
recording an individual’s location data to a secret and hidden file [13]. Not only was this data
being recorded but it was specifically being preserved through backups, restores, and even in
some cases device wipes.
267
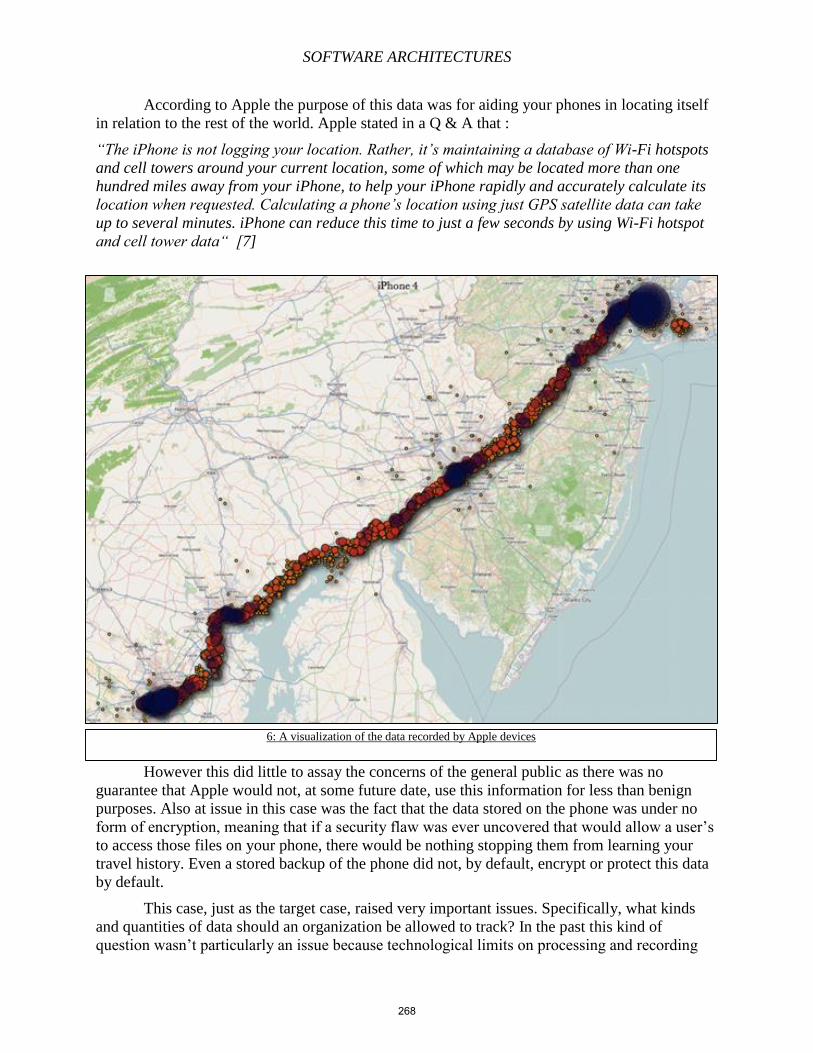
SOFTWARE ARCHITECTURES
According to Apple the purpose of this data was for aiding your phones in locating itself
in relation to the rest of the world. Apple stated in a Q & A that :
“The iPhone is not logging your location. Rather, it’s maintaining a database of Wi-Fi hotspots
and cell towers around your current location, some of which may be located more than one
hundred miles away from your iPhone, to help your iPhone rapidly and accurately calculate its
location when requested. Calculating a phone’s location using just GPS satellite data can take
up to several minutes. iPhone can reduce this time to just a few seconds by using Wi-Fi hotspot
and cell tower data“ [7]
However this did little to assay the concerns of the general public as there was no
guarantee that Apple would not, at some future date, use this information for less than benign
purposes. Also at issue in this case was the fact that the data stored on the phone was under no
form of encryption, meaning that if a security flaw was ever uncovered that would allow a user’s
to access those files on your phone, there would be nothing stopping them from learning your
travel history. Even a stored backup of the phone did not, by default, encrypt or protect this data
by default.
This case, just as the target case, raised very important issues. Specifically, what kinds
and quantities of data should an organization be allowed to track? In the past this kind of
question wasn’t particularly an issue because technological limits on processing and recording
6: A visualization of the data recorded by Apple devices
268
SOFTWARE ARCHITECTURES
capabilities minimized the utility that data could provide. Now however, the amount of data that
can be recorded is limited by the capital capabilities of the organization in question, and it seems
the trend is for said organizations to grab as much data as possible with the hopes that it will be
useful or profitable later. Apple, like target, also received a heavy amount of criticism from the
public and faced the prospect of a tarnished image
It’s Not All Bad
Though the above examples illustrate the
dangers of big data there have been several noted
cases of when using Big Data and tracking user
experiences has both been profitable and well
received by the Community. Netflix, a company
that provides on demand streaming of digital
media founded in ’97 has done well with its use of
Big Data. Boasting 194 million users [8] the
company has a wealth of personal data to work
with. It uses this data to create systems to
recommend movies based off of both past viewing
habits and user interaction with surveys. This data
also allows Netflix to view user interest trends in
both movies and television and adjust their
offerings accordingly. As an example Netflix
noted that a large number of people watched the
show Arrested Development (one which had been
prematurely cancelled), and in reaction backed a brand new season of the show. Reactions by
users were incredibly positive to both events, in part because Netflix gave them what they
wanted, but also because Netflix stayed firmly within accepted and expected business practices.
Google is another example of a company that
takes steps to use Big Data in ways that most people
find appropriate and beneficial. A prime example is the
spell checking utility found in Google’s web browser,
known as Google Chrome. The utility takes
misspellings and corrections and records them in a
database allowing the service to improve its overall
functionality with use over time. Google’s text to
speech works in a similar way, recording a user’s
speech to improve its ability to recognize specific
words and phrases. Though much of this information
seems private, Google takes two significant yet simple
(almost to the point of common sense) steps that help
ease concerns. First, Google always asks before it
records data in the above circumstances. This seems
like something small but it ends up having a large
impact. Many large organizations fail to take into account the fact that there is a significant
difference between giving up privacy voluntarily to help others, and having it taken from you
without your consent or knowledge. Second, Google informs you of the nature of the data its
8: Crome takes steps to make Big Data Ethical
7: Netflix Max uses Big Data to improve user experience
269
SOFTWARE ARCHITECTURES
taking and that it will take steps to make your data anonymous, further easing concerns of every
day individuals. Last, Google informs users of the benefits their data will give to themselves or
others, allowing users to make informed and conscious decisions and giving them perspective on
the usefulness of their contribution.
Why do we need Ethics for Big Data? The cases with target and apple both illustrate a lack of consensus on what is appropriate
for organizations to record and use for the purposes of monetary gain. Part of this problem
originates from the fact that Big Data is such a vast domain with a large variety of situations in
which the capabilities it provides could be abused. This lack of standard means that, in most
cases, individuals have to rely on their own personal code of ethics to make decisions regarding
what constitutes and acceptable use of Big Data. Unfortunately this often degrades to the “but
that’s creepy … / No, it’s not” [4] argument, which usually ends up helping no one.
The other part of the problem is how exciting and influential big data can be. That is not
to say that using Big Data is inherently wrong, but that the vast and lucrative applications of this
domain can often encourage a sort of recklessness in business decisions that can be unsafe. That
fact, coupled with the general wide reach associated with big data, creates a situation where a
single mistake or poor use of data can affect a very large number of people in a very short period
of time.
These questions involving how to use data about real people, and the atmosphere
currently permeating the field both lead to a single conclusion. That these questions are ethical in
nature, and that a code or system of ethics that would give system designers and architects a
frame of reference when deciding how to balance the risk of harm with the reward of innovation
is entirely necessary if we are to avoid the kinds of blunders made by apple and target. This
system would need to take into account the many different applications of ethics (personal,
professional, business, and societal). Before delving into what ethics for big data should look like
it is important to discuss some related key terms and concepts. In their work Davis and Patterson
describe several of these in detail, of which a brief summary is provided below.
Rights and Interests
In their book Davis and Patterson make the distinction between rights and interests when
discussing Big Data ethics. They point out the important distinction that the word right often
brings with it the context and presumption of an absolute right that is inviolable. Unfortunately
the use of data is so wide that the idea of an absolute right (absolute privacy for example) often
hinders the process of development. The idea that a right is absolute should be as they put it “an
outcome, not a presupposition.” The word right in itself is complicated because in many cases it
makes presuppositions about ethical views that shouldn’t exist in this context as there really are
no views to presuppose. They conclude that, in many cases, considering the interests of the client
or the providers of the data allows for a more objective viewpoint to be taken as opposed to
considering the “rights” of the client.
Personal Data
How one defines personal data is also important to nail down. This is largely due to the
fact that personal information or what is can be tagged to an individual, often has a lot to do with
available technology and can change rapidly. In the past only specific data (like a phone number)
270
SOFTWARE ARCHITECTURES
might be considered personal. In order for the ethics of Big Data to be sound it is important that
this term is wide reaching. As such it is suggested to consider any data that is generated by an
individual’s activities to be personal (because with enough effort that information could be used
to identify someone).
A Responsible Organization
Davis and Patterson note that there is a significant “difference between doing right and
doing what various people think is right” especially when relating to what is right for Big Data.
As mentioned earlier it is often the case that anyone from a software architect to a manager can
get caught up in all the “potential” of Big Data to the degree to which he or she might bend the
rules slightly or simply do what is accepted, rather than what moral or ethical obligations would
suggest. A responsible organization is not just concerned with how they are viewed in the eyes of
others but is also concerned with dealing with data in such a way that actions align with the
values of the company, and how those two concerns should interact.
What Does Big Data Ethics Look Like? After defining Big Data, considering its importance, and also addressing why Big Data
needs a code of ethics, we can come to a few conclusions. First, Big Data is not going anywhere
anytime soon. It is too useful and lucrative of a tool to be thrown out because of the challenge of
giving it ethical guidelines. Second, Big Data is both massive and diverse, and as such needs a
set of guidelines that take those things into account. Finally Big Data is forcing questions that
need to be answered should we all wish to avoid disaster. As Neil Richards and Jonathan King
point out “The problem is that our ability to reveal patterns and new knowledge from previously
unexamined troves of data is moving faster than our current legal and ethical guidelines can
manage.” [9] Given what we have learned from those before us we can make considerations of
our own in relation to the Ethics of Big Data and come up with a set of useful principles for
remaining ethically sound and for facilitating ethical discussion.
Be Clear and Concise
First, any set of ethical principles and their implementations should be clear and concise
as much as possible. This is an idea referred to by many sources as “Radical Transparency” [10].
This means letting the users know exactly what you or the system you architect does with their
data while making assumptions for the level of technical expertise for each user. “Users do
understand that nothing is for free; they just want to be told. Otherwise it would be like receiving
a free book from the local bookstore and finding out later that the store still charged your credit
card for it.” [10] There is almost nothing worse than being unable to explain to your users, in
context, the reasons why you are taking and using their personal data. This scenario almost
always plays out when a developer or security firm pours through one’s carefully architected
software and finds something suspicious or ominous that the users weren’t told about. In many
cases said finding is an artifact or a result of some entirely benign process or an unintended
fluke, but it is very hard to make that argument when you were not forward with your users to
begin with and are trying to play the damage control game. In order to avoid this scenario simply
tell the user everything that your software is doing and, in the best case, everything the company
has recorded or determined about them. This will not only build trust but will allow you to
explain and spin to some degree the reasons why you are collecting data, instead of responding
to an angry mob of customers who have already made up their minds as to who is in the wrong.
271
SOFTWARE ARCHITECTURES
Give Users Power Over their Data
After telling the users
everything that one’s
organization keeps records of,
give the users a chance to decide
what they wish to share and
make that tool or decision
simple. In an article on Big Data
Ethics Jeffrey F. Rayport
suggests that “One way to avoid
an Orwellian nightmare is to
give users a chance to figure out
for themselves what level of
privacy they really want.” [11]
This ties into the first point in
that a simple and concise
explanation and set of tools
prevents users from being
surprised and offended. Take for
example the gaming store who,
in 2010, added a clause to their
Terms of Service that granted
the company ownership of a
shopper’s eternal soul [12]. As humorous as that example might be, it highlights a common
problem, the trend of lengthy and complex privacy agreements. Even if an individual does give
up his or her rights through some sort of documentation, if the document deferring those rights is
complex or vague such that it is hard for a common person to understand, the owner of that
document will undoubtedly come under intense scrutiny for their actions. However, a simple and
uncomplicated agreement will, at the very least, pass the blame of ignorance from the
organization in question to the user who failed to read the 3 line description in the privacy
settings page. In many cases a simple agreement entirely avoids inciting the anger of users and
the public alike.
Communicate Value
Paired with a user’s understanding of privacy is their understanding of the inherent value
of their information In most cases, the more a company understands its clientele or user group,
the better its service and products are likely to be at serving that group. Sometimes this
understanding necessitates keeping user information that might be considered private. When an
organization doesn’t tell its users about the benefits of sharing this data, a user is likely to not
want to do so. Most organizations realize this and, in order to remain competitive, take this user
information without telling said users, a practice that has no ethical foundation. As such it is
important to inform a user about the value of their data. Users realize, or can be made to realize,
that everything comes at some cost. They are also often willing to pay that price as long as they
know what they are getting in return. Netflix and Google (see above), are prime examples of
companies that inform their users and have had great success. This form of transparency also
works to promote Big Data Ethics as it encourages accountability and good business practices.
9: TOS agreements are often incredibly complex and difficult to understand. This characteristic often draws criticism from the public.
272
SOFTWARE ARCHITECTURES
This partly because users will no longer feel that their trust was or might be violated (and will
continue to do business with said organization) but is also due to the fact that, as organizations
become more transparent with the use of big data, the ease of keeping them accountable will
increase.
The Importance of Security
Security, while not directly related to Big Data, is an important aspect of the related
ethics. An architect needs to very carefully define what personal or private data is necessary
(instead of desired), and how that might conflict with the interests of the owners of that data.
Once an architect has determined what data an application needs, it is important that he or she
build in security around that data. Often the data collected is valuable, and it is the organization
who lost that data that will take the blame, not those that took it. As such it is the ethical
responsibility of an organization to protect not only the input data, but also the inferences that
can be made with Big Data, from those who would obtain it illegally or without permission.
Building In Privacy
Another lesson to be learned is that the architect of an application should attempt to
include privacy within the design. Just as security is often difficult to build into a piece of
software after its completion so follows privacy. If an organization and designer considers the
privacy and interests of a user from the beginning they are far less likely to do something
ominous. Building privacy into applications also not only allows for one to differentiate their
application from others (and thus gain business), but promotes a society that values these
principles, instead of one that is consistently encouraged or tricked into giving them up.
Final Questions
After taking into account the above considerations one might find that there is some
choice or decision in implementation that is not captured by said principles. In those cases it is
important to fall back on pre-existing ethical perspectives as they provide questions that may rule
out whatever option one is considering. The questions to consider are the following:
1. How does this architectural choice affect my organization as a whole? Will this use of
Big Data hurt my organization if discovered either in the form of lost clients, public
backlash, or tarnished reputation?
2. How does this architectural choice fit into the view of personal ethics? Does this choice
violate a user’s privacy interests without any acceptable reason or benefit? Does this
action negatively impact the life of an individual? Does this action actively go against
the architect’s personal code of ethics?
3. How does this architectural choice fit into the view of Legal Ethics? Is this use of Big
Data and private information illegal in one’s country or location of residence? Would
this use inspire lawsuits or legal action that would be negative to the organization if
discovered?
4. How does this architectural choice fit into the view of Professional Ethics? Will this
decision or use of personal data affect how the public views Software Architects or
engineers? Will that view change be detrimental and hurt the opinion of the profession
as a whole.
273
SOFTWARE ARCHITECTURES
5. How does this architectural choice fit into the ethical views of society? Is this decision
socially acceptable? Will this use of data promote a change or changes in what society
views as acceptable that are harmful, especially if those affected by these changes are
not fully aware of the downsides when making their decision?
If the answers to any of these questions are negative and due to the nature of one’s use of
Big Data then it is important to reconsider the action to be taken or make changes such that there
are no violations of the above principles.
Big Data Ethics in Practice Now that we’ve seen guiding principles for Big Data Ethics, it is useful to look at real
world examples of its implementation. Big Data Ethics is, more often than not, the result of
communication and discussion within an organization about how best to implement the above
concepts. As such it is beneficial for the reader to see where the industry is at today. In their
work Davis and Patterson present their findings from several of the top fortune 500 companies
relating to several aspects of how big data is used.
What Companies Have Clear Policies
Obvious to any observer is the variation in policy statements between organizations. This
in many cases generates distrust in organizations as a lack of clear or consistent statements lead
users to believe that a company is hiding practices. Making policies clear and uniform makes it
simple for an Architect to align his work with company ethics and makes businesses accountable
for their actions (as users can see a clear picture of what they are or are not giving away).
Unfortunately this is still an area that needs significant work. Davis and Paterson found that,
almost “all of the policies surveyed made some type of distinction between ‘personally
identifying’ and ‘anonymized’ data. Nearly half of those, however, did not explain how they
defined the distinction—or exactly what protections were in place.” [4]
Defining these aspects of use is incredibly important because of how rapidly changes in
the capabilities of Big Data are changing. Something that might not be personally identifying
today may be that way tomorrow, and how a company has defined that information might allow
it to be used for such purposes. How a company defines data that is anonymized is important for
the same reason. Often this kind of data is open to use by the company because, at the current
time, it can’t be used to identify an individual. If that data is only anonymous because of
capabilities, and not because there is no way to correlate that data with an individual, problems
will arise.
What Companies Give Users Power Over their Data
Davis and Paterson also discovered that one of the most used methods for giving users
power over their data was allowing a user to “opt-out” of data being used in specific ways or
shared between organizations for business reasons. Unfortunately opting out meant not using a
product or not agreeing to a terms of service instead of providing the user a means to still benefit
from the product and not have their data taken. Also, while some organizations gave users the
opportunity to still use their products, the methods for opting out or restricting data were in many
cases difficult and/or complex, requiring signing and mailing several forms in some cases.
274
SOFTWARE ARCHITECTURES
It is easy to see why an organization might take these kinds of actions. In many cases
requiring a user to opt-in nets almost no benefit as it requires extra input from a user often
without any clear benefit. Fear of the unknown as Davis and Paterson put it, is also a problem, as
many customers will simply not opt-in (or would opt-out if the methods were easy) because they
did not understand and would not take the time to understand the benefits. The problem with this
kind of practice is that it is impossible to inform a user of what can be done with their data, as the
capabilities of Big Data are often changing. A person who didn’t opt out today might very well
have chosen to do so a year from now because of what information that data, when combined
with other data sets, might reveal.
Who Owns What?
It might be argued that, other than for scientific and educational purposes, Big Data exists
mainly to generate revenue. In many cases one must either own or license something to generate
revenue from that thing. This leads too many questions about the data that customers provide to
organizations and how control of those assets should be distributed between the user and said
organization. While many organizations, as will be discussed below, state explicitly that they
will not sell their users data, they make no attempts to assign ownership to any one entity. This
lack of exposition means that, as far as an organization is concerned, they can use the data in any
way that benefits their business, which is a frightening conclusion to be sure (though less so if
the companies inform users and allow them to opt out). Unfortunately there is no consensus
across organizations that have been found in regards to this topic, and as such this remains an
area that would benefit from further scrutiny. This scrutiny would hopefully result in agreements
between corporations and individuals that were explicit in stating what can and cannot be done
with data, instead of ones that make a few rules and leave everything not mentioned up to the
group that controls the data.
How is data bought and sold
In their research Davis and Patterson found that over 75% of interviewed companies said
explicitly they would not sell personal data. There were however, no companies that would make
concrete statements about their decision to or not to buy personal data. This leads to the
observation that this area, the decision to buy data, is something that needs to be challenged by
members of organizations as well as their customers. This is especially important because, more
often than not, those who have provided
personal data have no control over who buys it,
and the existence of buyers encourages
companies to sell data, with or without their
user’s knowledge.
Overall, if one draws anything from the
above investigation, it is that while many
companies are on the right track towards ethical
use of Big Data, there is still much work to be
done. In many cases companies and
organizations will only do what takes them out
of public scrutiny instead of what would be best
for everyone (not selling, but buying data), or
9: how user data is bought and sold 275
SOFTWARE ARCHITECTURES
only what is required by the rule of law. It will only be by applying the previously mentioned
principals to the current business climate that software architects will be able to change the
ethical practices of business involving Big Data for the better.
Privacy Erosion This chapter concludes with a short discussion on privacy erosion, a topic related to Big
Data and one to keep in mind when discussing its related ethics. As discussed earlier,
Information Technology changes how we as a society access, search, and make decisions
regarding data. As the rate of data generation and capture increases rapidly (from added sensing
capabilities and cheapening data storage), so do the inferences that can be made from said
captured data. Many times, these actions and transformations can reveal, intentionally or
unintentionally, data that would violate a person’s civil liberties (especially when considering
governments or large organizations). There might one day be a point when Big Data calls into
question the right to privacy that many governments give to their people (the 4th amendment in
the U.S. for example). Online surveillance is becoming the norm: ISP’s (internet service
providers) track and sell data about consumers, websites download cookies that can be used to
track information, and cellular companies can track the locations of users through cellular
towers.
The growing concern is that this erosion of privacy, or the difficulty in keeping one’s
information within one’s own control, is becoming the standard for the future. Society will, over
time, become more comfortable with the erosion of privacy we see today simply by the fact that,
generations from now, the expectation of privacy one grows up with will be entirely different
then what we have today, especially when considering that the erosion of privacy can be
beneficial when used in the proper way. It is important then, as a closing note, to consider how
the decisions of the reader as an Architect will affect future generations, as that type of foresight
is often absent from planning meetings or presentations in front of superiors.
References [1] Hilbert, Martin, and Priscila López. "The world’s technological capacity to store,
communicate, and compute information." Science 332.6025 (2011): 60-65.
[2] Mateosian, Richard. "Ethics of Big Data." IEEE Micro 33.2 (2013): 0060-61.
[3] Wen, Howard. "Big Ethics for Big Data." Data. O'Reilly, 11 June 2012. Web. 29 Apr. 2014.
<http://strata.oreilly.com/2012/06/ethics-big-data-business-decisions.html>.
[4] Davis, Kord. Ethics of big data. O'Reilly Media, Inc., 2012.
[5] Conway, Rob. "Where angels will tread." The Economist. 17 Nov. 2011. The Economist
Newspaper. 29 Apr. 2014 <http://www.economist.com/node/21537967>.
[6] Duhigg, Charles. "How Companies Learn Your Secrets." The New York Times. 18 Feb.
2012. The New York Times. 28 Apr. 2014
<http://www.nytimes.com/2012/02/19/magazine/shopping-
habits.html?pagewanted=all&_r=0>.
[7] "Apple - Press Info - Apple Q&A on Location Data." Apple - Press Info - Apple Q&A on
Location Data. 27 Apr. 2011. Apple. 29 Apr. 2014
<http://www.apple.com/pr/library/2011/04/27Apple-Q-A-on-Location-Data.html>.
[8] "Netflix." Wikipedia. 28 Apr. 2014. Wikimedia Foundation. 28 Apr. 2014
<http://en.wikipedia.org/wiki/Netflix>.
276
SOFTWARE ARCHITECTURES
[9] King, Jonathan H., and Neil M. Richards. "What's Up With Big Data Ethics?" Data. 21 Mar.
2014. O'Reilly. 29 Apr. 2014 <http://strata.oreilly.com/2014/03/whats-up-with-big-data-
ethics.html>.
[10] Rijmenam, Mark. "Big Data Ethics: 4 principles to follow by organisations."
BigDataStartups. 11 Mar. 2013. Big Data Startups. 29 Apr. 2014 <http://www.bigdata-
startups.com/big-data-ethics-4-principles-follow-organisations/>.
[11] Rayport, Jeffrey F. "What Big Data Needs: A Code of Ethical Practices | MIT Technology
Review." MIT Technology Review. 26 May 2011. MIT Technology Review. 29 Apr. 2014
<http://www.technologyreview.com/news/424104/what-big-data-needs-a-code-of-ethical-
practices/>.
[12] Bosker, Bianca. "7,500 Online Shoppers Accidentally Sold Their Souls To Gamestation."
The Huffington Post. 17 Apr. 2010. TheHuffingtonPost.com. 29 Apr. 2014
<http://www.huffingtonpost.com/2010/04/17/gamestation-grabs-souls-o_n_541549.html>.
[13] Allan, Alasdair, and Pete Warden. "Got an iPhone or 3G iPad? Apple is recording your
moves." OReilly Radar. 27 Apr. 2011. O'Reilly. 29 Apr. 2014
<http://radar.oreilly.com/2011/04/apple-location-tracking.html>.
Figures [1] O'Keefee, Anthony. "Blog." Big Data. 29 Apr. 2014 <http://www.lucidity.ie/blog/173-big-
data>
[2] "Moravec Robot book figure." Moravec Robot book figure. 29 Apr. 2014
<http://www.frc.ri.cmu.edu/~hpm/book98/fig.ch3/p060.html>.
[3] Melissa. "Safety: Protecting your digital footprint." Digital Family Summit. Digital Family
Summit. 29 Apr. 2014
<http%3A%2F%2Fwww.digitalfamilysummit.com%2F2012%2Fsafety-protecting-your-
digital-footprint%2F>.
[4] Gregorious, Thierry. Wikipedia,
http://commons.wikimedia.org/wiki/File:Big_data_cartoon_t_gregorius.jpg
[5] "Big Data: How Target Knows You Are Pregnant - Yu-kai Chou & Gamification." Yukai
Chou Gamification. 29 Apr. 2014 <http://www.yukaichou.com/loyalty/big-data-how-target-
knows-you-are-pregnant/>.
[6] Allan, Alasdair, and Pete Warden. "Got an iPhone or 3G iPad? Apple is recording your
moves." OReilly Radar. 27 Apr. 2011. O'Reilly. 29 Apr. 2014
<http://radar.oreilly.com/2011/04/apple-location-tracking.html>.
[7] http://www6.pcmag.com/media/images/391044-netflix-max.jpg?thumb=y
[8] http://www.logobird.com/wp-content/uploads/2011/03/new-google-chrome-logo.jpg
[9] Downey, Sarah A. "9 easy ways to beat identity thieves." Online Privacy Abine. 22 Jan.
2013. Online Privacy Blog. 29 Apr. 2014 <http://www.abine.com/blog/2013/beat-identity-
thieves/>.
[10] Tacma.net
277
SOFTWARE ARCHITECTURES
Chapter 21 – How Hardware Has Altered Software Architecture Thanh Nguyen
Summary As technologies have been growing rapidly, end-users always demand a much faster, capable
technology to fulfill their need. For that reason, companies have been compete for ages to design
and produce new hardware every couple months to meet user demand. With the new super-fast
and powerful hardware companies produced a lot of resources have been used to develop better
software. The old software architecture also need to evolve to adapt with the new hardware to
utilize these resources. Overall, hardware help software architecture evolve.
Introduction Over the last 50 years, technology has stepped a big step into changing the world. Because we
can do many tasks very quickly even in parallel thanks for the invention of multicore processors,
the technologies we have today now have a major influence on culture and economy. We would
not reach this far without the help of millions of developers around the world. Their ideas and
their way to use computers, to use technologies are the main reasons we’ve reached this far.
Those ideas are the core of software architecture [2]. Software architecture is like a blue print, a
well-documented idea of the software and the project developing it, defining the work
assignments that must be carried out by design and implementation team [1].
The ideas could be amazing. They could be life-changing idea but an idea is still an idea. Usually
to make a software, you come up with an idea, build a software architecture for it, and then code
it up. The technologies won’t be as amazing as it is today without the support of hardware behind
it. An example of this is smartphone. The smartphone we have today is really amazing. It is an
example of how far we have gotten since the last 10 to 20 years. We can do all sort of things with
the smartphone: from searching the net, browsing the social media site, listen to music or play
high end 3-D graphic games. The reason we can do these thing is because the smartphones we
have today have the latest hardware installed inside it: from sensor devices, touchscreen, quad-
core processors, high end graphic card. Without these devices, the software we have today won’t
work.
High Level Architecture As mentioned previously, no matter how detailed or well-documented a software architecture is,
without the hardware, the technologies supporting behind it, it won’t become a product. For
example if we run one of the high end 3-D graphic game on a machine running Windows 98 that
have 128MB RAM and does not even have a graphic card. The game won’t even load at all.
Software architecture is really helpful. It helps the developers understand how the system will
behave. A well-built software architecture can help developers identify risks and mitigate them
early in the development process. It can also help the developers to adapt and change the
architecture of their software to be able to utilize the power, the resources the new hardware have
that come out in the future. The main components of software architecture are: performance,
278
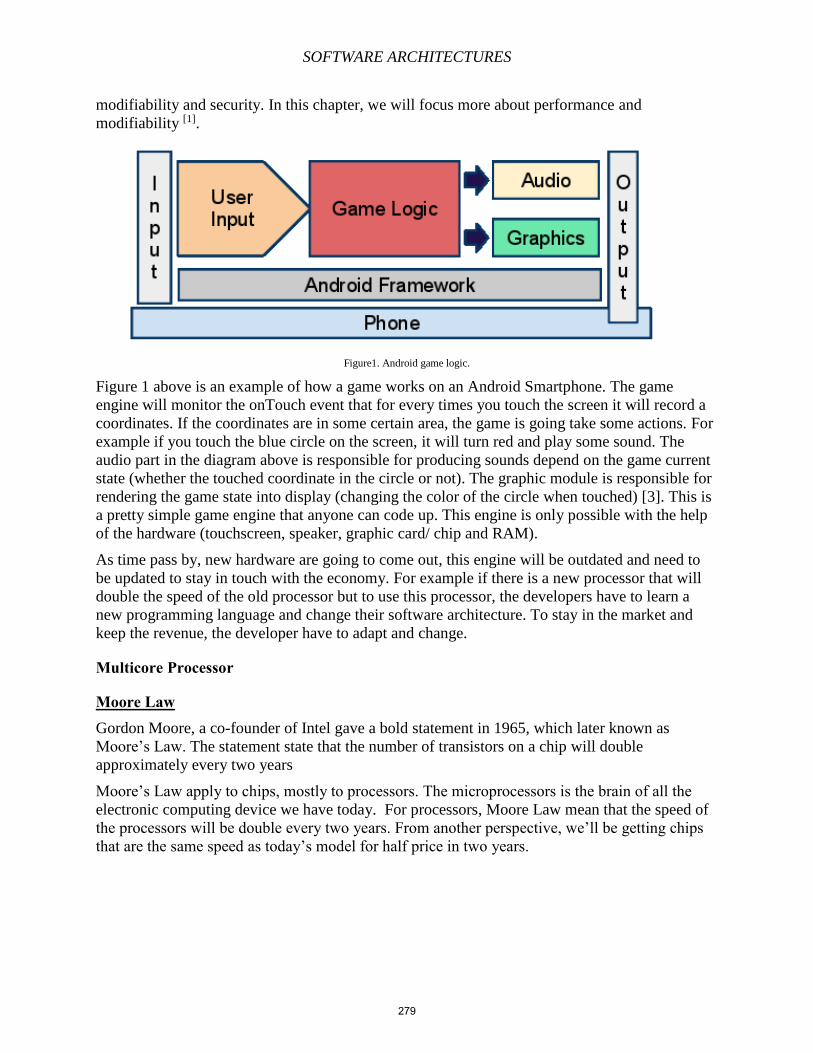
SOFTWARE ARCHITECTURES
modifiability and security. In this chapter, we will focus more about performance and
modifiability [1].
Figure1. Android game logic.
Figure 1 above is an example of how a game works on an Android Smartphone. The game
engine will monitor the onTouch event that for every times you touch the screen it will record a
coordinates. If the coordinates are in some certain area, the game is going take some actions. For
example if you touch the blue circle on the screen, it will turn red and play some sound. The
audio part in the diagram above is responsible for producing sounds depend on the game current
state (whether the touched coordinate in the circle or not). The graphic module is responsible for
rendering the game state into display (changing the color of the circle when touched) [3]. This is
a pretty simple game engine that anyone can code up. This engine is only possible with the help
of the hardware (touchscreen, speaker, graphic card/ chip and RAM).
As time pass by, new hardware are going to come out, this engine will be outdated and need to
be updated to stay in touch with the economy. For example if there is a new processor that will
double the speed of the old processor but to use this processor, the developers have to learn a
new programming language and change their software architecture. To stay in the market and
keep the revenue, the developer have to adapt and change.
Multicore Processor
Moore Law Gordon Moore, a co-founder of Intel gave a bold statement in 1965, which later known as
Moore’s Law. The statement state that the number of transistors on a chip will double
approximately every two years
Moore’s Law apply to chips, mostly to processors. The microprocessors is the brain of all the
electronic computing device we have today. For processors, Moore Law mean that the speed of
the processors will be double every two years. From another perspective, we’ll be getting chips
that are the same speed as today’s model for half price in two years.
279
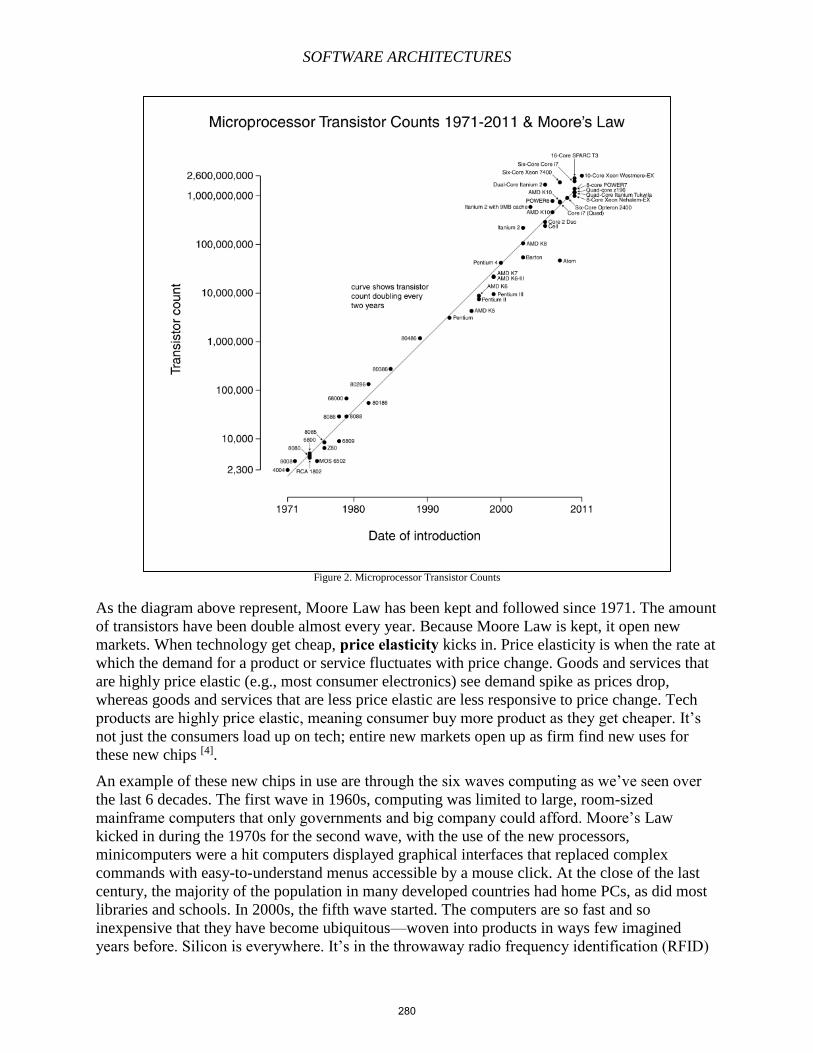
SOFTWARE ARCHITECTURES
Figure 2. Microprocessor Transistor Counts
As the diagram above represent, Moore Law has been kept and followed since 1971. The amount
of transistors have been double almost every year. Because Moore Law is kept, it open new
markets. When technology get cheap, price elasticity kicks in. Price elasticity is when the rate at
which the demand for a product or service fluctuates with price change. Goods and services that
are highly price elastic (e.g., most consumer electronics) see demand spike as prices drop,
whereas goods and services that are less price elastic are less responsive to price change. Tech
products are highly price elastic, meaning consumer buy more product as they get cheaper. It’s
not just the consumers load up on tech; entire new markets open up as firm find new uses for
these new chips [4].
An example of these new chips in use are through the six waves computing as we’ve seen over
the last 6 decades. The first wave in 1960s, computing was limited to large, room-sized
mainframe computers that only governments and big company could afford. Moore’s Law
kicked in during the 1970s for the second wave, with the use of the new processors,
minicomputers were a hit computers displayed graphical interfaces that replaced complex
commands with easy-to-understand menus accessible by a mouse click. At the close of the last
century, the majority of the population in many developed countries had home PCs, as did most
libraries and schools. In 2000s, the fifth wave started. The computers are so fast and so
inexpensive that they have become ubiquitous—woven into products in ways few imagined
years before. Silicon is everywhere. It’s in the throwaway radio frequency identification (RFID)
280
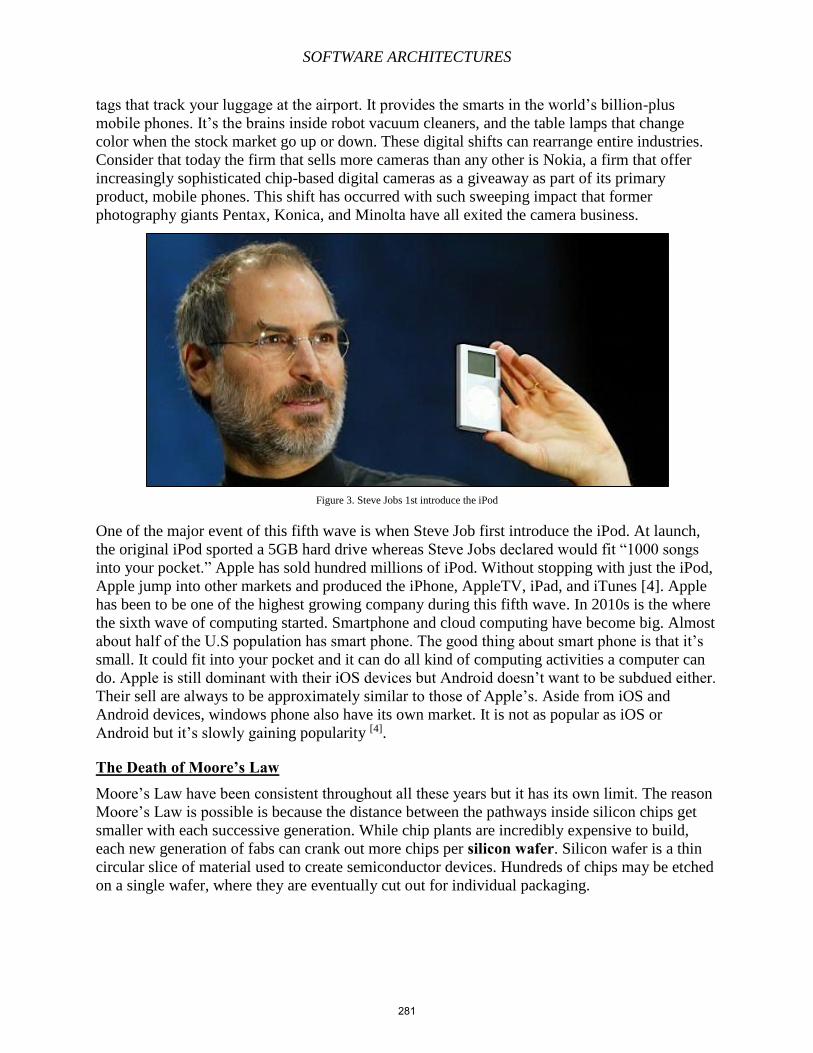
SOFTWARE ARCHITECTURES
tags that track your luggage at the airport. It provides the smarts in the world’s billion-plus
mobile phones. It’s the brains inside robot vacuum cleaners, and the table lamps that change
color when the stock market go up or down. These digital shifts can rearrange entire industries.
Consider that today the firm that sells more cameras than any other is Nokia, a firm that offer
increasingly sophisticated chip-based digital cameras as a giveaway as part of its primary
product, mobile phones. This shift has occurred with such sweeping impact that former
photography giants Pentax, Konica, and Minolta have all exited the camera business.
Figure 3. Steve Jobs 1st introduce the iPod
One of the major event of this fifth wave is when Steve Job first introduce the iPod. At launch,
the original iPod sported a 5GB hard drive whereas Steve Jobs declared would fit “1000 songs
into your pocket.” Apple has sold hundred millions of iPod. Without stopping with just the iPod,
Apple jump into other markets and produced the iPhone, AppleTV, iPad, and iTunes [4]. Apple
has been to be one of the highest growing company during this fifth wave. In 2010s is the where
the sixth wave of computing started. Smartphone and cloud computing have become big. Almost
about half of the U.S population has smart phone. The good thing about smart phone is that it’s
small. It could fit into your pocket and it can do all kind of computing activities a computer can
do. Apple is still dominant with their iOS devices but Android doesn’t want to be subdued either.
Their sell are always to be approximately similar to those of Apple’s. Aside from iOS and
Android devices, windows phone also have its own market. It is not as popular as iOS or
Android but it’s slowly gaining popularity [4].
The Death of Moore’s Law Moore’s Law have been consistent throughout all these years but it has its own limit. The reason
Moore’s Law is possible is because the distance between the pathways inside silicon chips get
smaller with each successive generation. While chip plants are incredibly expensive to build,
each new generation of fabs can crank out more chips per silicon wafer. Silicon wafer is a thin
circular slice of material used to create semiconductor devices. Hundreds of chips may be etched
on a single wafer, where they are eventually cut out for individual packaging.
281
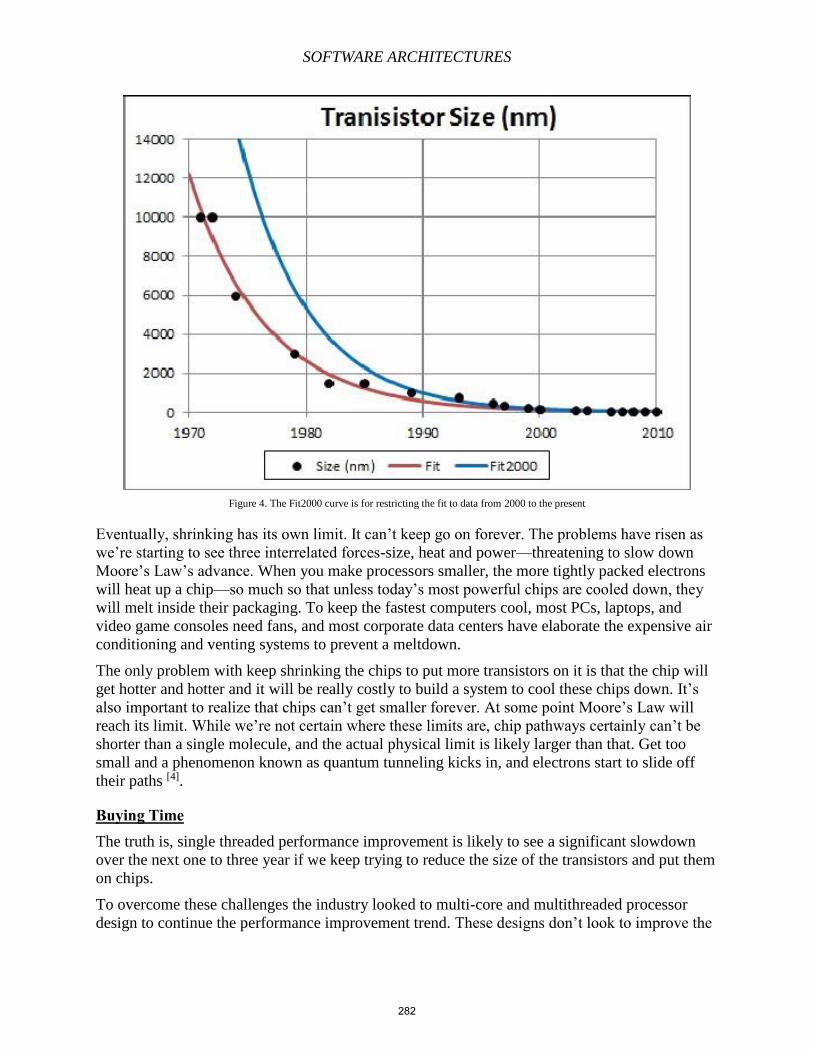
SOFTWARE ARCHITECTURES
Figure 4. The Fit2000 curve is for restricting the fit to data from 2000 to the present
Eventually, shrinking has its own limit. It can’t keep go on forever. The problems have risen as
we’re starting to see three interrelated forces-size, heat and power—threatening to slow down
Moore’s Law’s advance. When you make processors smaller, the more tightly packed electrons
will heat up a chip—so much so that unless today’s most powerful chips are cooled down, they
will melt inside their packaging. To keep the fastest computers cool, most PCs, laptops, and
video game consoles need fans, and most corporate data centers have elaborate the expensive air
conditioning and venting systems to prevent a meltdown.
The only problem with keep shrinking the chips to put more transistors on it is that the chip will
get hotter and hotter and it will be really costly to build a system to cool these chips down. It’s
also important to realize that chips can’t get smaller forever. At some point Moore’s Law will
reach its limit. While we’re not certain where these limits are, chip pathways certainly can’t be
shorter than a single molecule, and the actual physical limit is likely larger than that. Get too
small and a phenomenon known as quantum tunneling kicks in, and electrons start to slide off
their paths [4].
Buying Time The truth is, single threaded performance improvement is likely to see a significant slowdown
over the next one to three year if we keep trying to reduce the size of the transistors and put them
on chips.
To overcome these challenges the industry looked to multi-core and multithreaded processor
design to continue the performance improvement trend. These designs don’t look to improve the
282
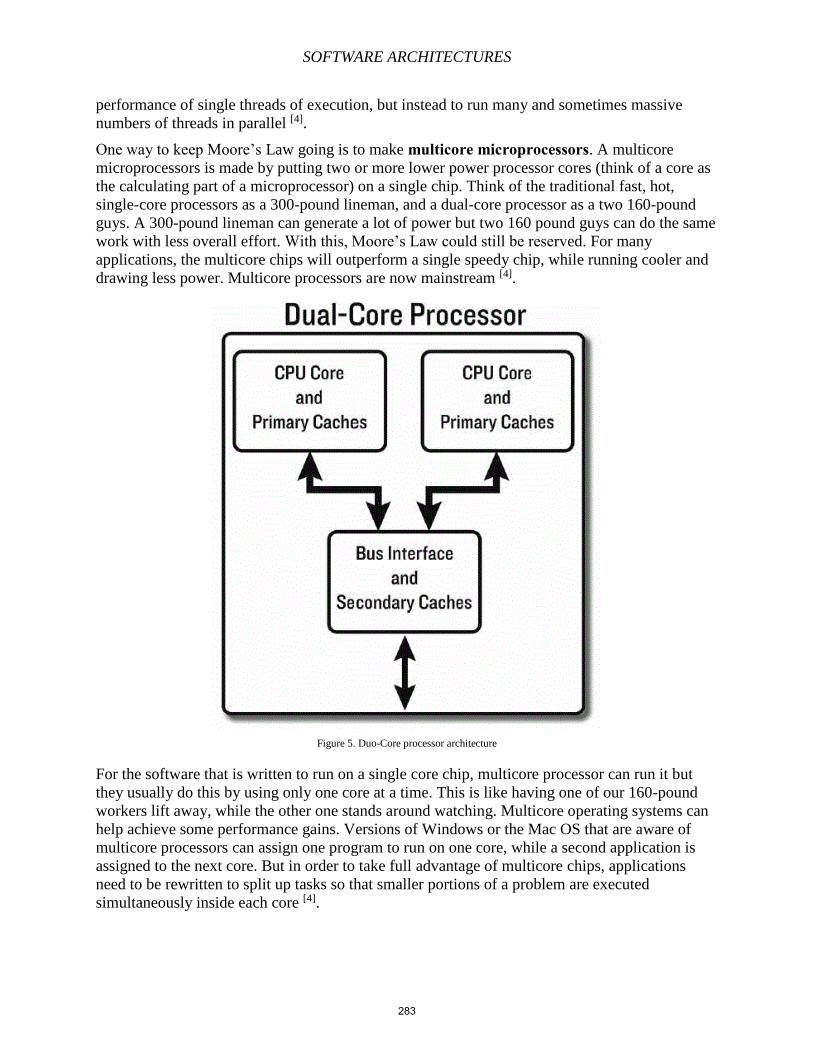
SOFTWARE ARCHITECTURES
performance of single threads of execution, but instead to run many and sometimes massive
numbers of threads in parallel [4].
One way to keep Moore’s Law going is to make multicore microprocessors. A multicore
microprocessors is made by putting two or more lower power processor cores (think of a core as
the calculating part of a microprocessor) on a single chip. Think of the traditional fast, hot,
single-core processors as a 300-pound lineman, and a dual-core processor as a two 160-pound
guys. A 300-pound lineman can generate a lot of power but two 160 pound guys can do the same
work with less overall effort. With this, Moore’s Law could still be reserved. For many
applications, the multicore chips will outperform a single speedy chip, while running cooler and
drawing less power. Multicore processors are now mainstream [4].
Figure 5. Duo-Core processor architecture
For the software that is written to run on a single core chip, multicore processor can run it but
they usually do this by using only one core at a time. This is like having one of our 160-pound
workers lift away, while the other one stands around watching. Multicore operating systems can
help achieve some performance gains. Versions of Windows or the Mac OS that are aware of
multicore processors can assign one program to run on one core, while a second application is
assigned to the next core. But in order to take full advantage of multicore chips, applications
need to be rewritten to split up tasks so that smaller portions of a problem are executed
simultaneously inside each core [4].
283
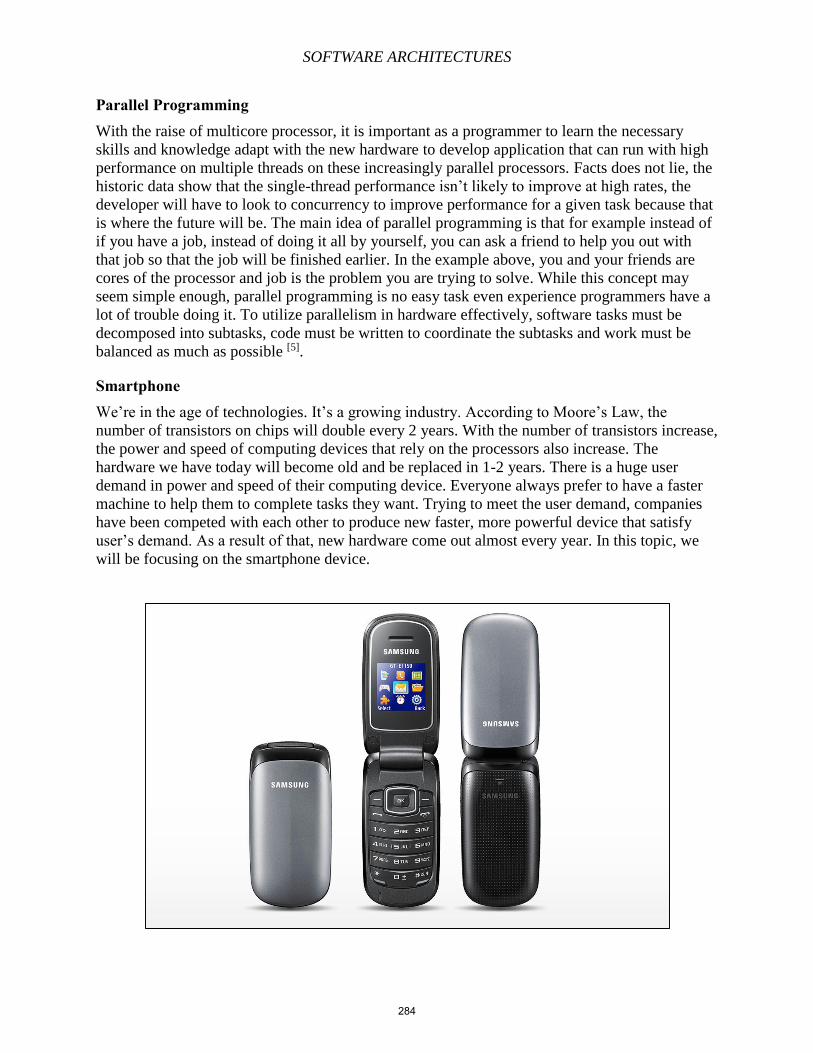
SOFTWARE ARCHITECTURES
Parallel Programming With the raise of multicore processor, it is important as a programmer to learn the necessary
skills and knowledge adapt with the new hardware to develop application that can run with high
performance on multiple threads on these increasingly parallel processors. Facts does not lie, the
historic data show that the single-thread performance isn’t likely to improve at high rates, the
developer will have to look to concurrency to improve performance for a given task because that
is where the future will be. The main idea of parallel programming is that for example instead of
if you have a job, instead of doing it all by yourself, you can ask a friend to help you out with
that job so that the job will be finished earlier. In the example above, you and your friends are
cores of the processor and job is the problem you are trying to solve. While this concept may
seem simple enough, parallel programming is no easy task even experience programmers have a
lot of trouble doing it. To utilize parallelism in hardware effectively, software tasks must be
decomposed into subtasks, code must be written to coordinate the subtasks and work must be
balanced as much as possible [5].
Smartphone We’re in the age of technologies. It’s a growing industry. According to Moore’s Law, the
number of transistors on chips will double every 2 years. With the number of transistors increase,
the power and speed of computing devices that rely on the processors also increase. The
hardware we have today will become old and be replaced in 1-2 years. There is a huge user
demand in power and speed of their computing device. Everyone always prefer to have a faster
machine to help them to complete tasks they want. Trying to meet the user demand, companies
have been competed with each other to produce new faster, more powerful device that satisfy
user’s demand. As a result of that, new hardware come out almost every year. In this topic, we
will be focusing on the smartphone device.
284
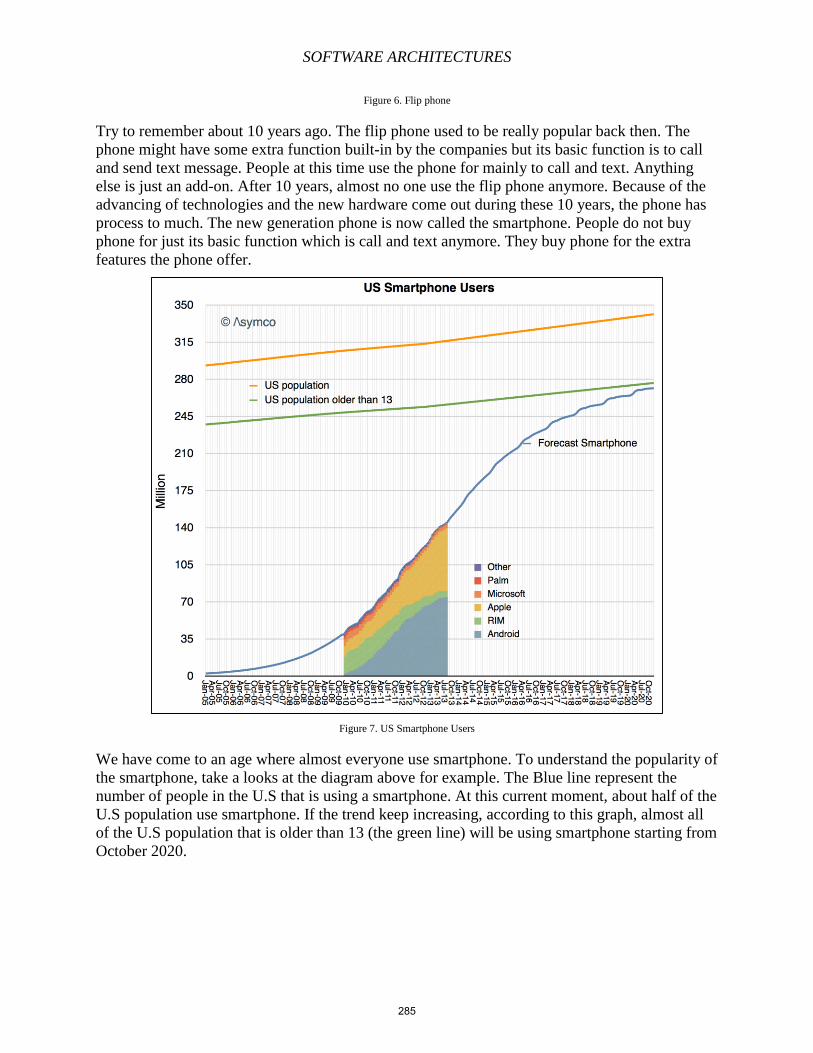
SOFTWARE ARCHITECTURES
Figure 6. Flip phone
Try to remember about 10 years ago. The flip phone used to be really popular back then. The
phone might have some extra function built-in by the companies but its basic function is to call
and send text message. People at this time use the phone for mainly to call and text. Anything
else is just an add-on. After 10 years, almost no one use the flip phone anymore. Because of the
advancing of technologies and the new hardware come out during these 10 years, the phone has
process to much. The new generation phone is now called the smartphone. People do not buy
phone for just its basic function which is call and text anymore. They buy phone for the extra
features the phone offer.
Figure 7. US Smartphone Users
We have come to an age where almost everyone use smartphone. To understand the popularity of
the smartphone, take a looks at the diagram above for example. The Blue line represent the
number of people in the U.S that is using a smartphone. At this current moment, about half of the
U.S population use smartphone. If the trend keep increasing, according to this graph, almost all
of the U.S population that is older than 13 (the green line) will be using smartphone starting from
October 2020.
285

SOFTWARE ARCHITECTURES
What is a smartphone?
Figure 8. Smartphones
What is a smartphone? What make it “smart”? Smartphone is just like any other original phone
you have. You can make phone call or send text message to your friends and family with it. Now
in this 21st century, you can do more with your smartphone than your original flip phone. It’s not
only the device to call and text but you can also use it for all sort of entertainment such as play
music, watch videos, take pictures, check emails, web browsing, and navigation system.
Unlike traditional cell phones, smartphone has large RAM and huge storage. It allows individual
users to install, configure and run all the applications that they want. Smartphone let the user
configure their phone to their like, to suite their taste and match their life style. The old flip
phone has limited application and does not give the users much freedom to configure their
phone. Almost all of the flip phone comes with pre-built-in application that forces their way on
to the users. It’s either the user have adapt and like the app or the app is just another couple un-
removable bit of storage. That is not the case with smartphone, with smartphone, the user can
install any applications they want and if they don’t like the app anymore, they can just remove it
anytime. [6].
Here is the list of the features smartphone have:
Manage your personal info including notes, calendar and to-do lists.
Communicate with laptop or desktop computers
Sync data with applications like Microsoft Outlook and Apple’s iCal calendar programs
Host applications such as word processing programs or video games
Scan a receipt
Cash a check
286
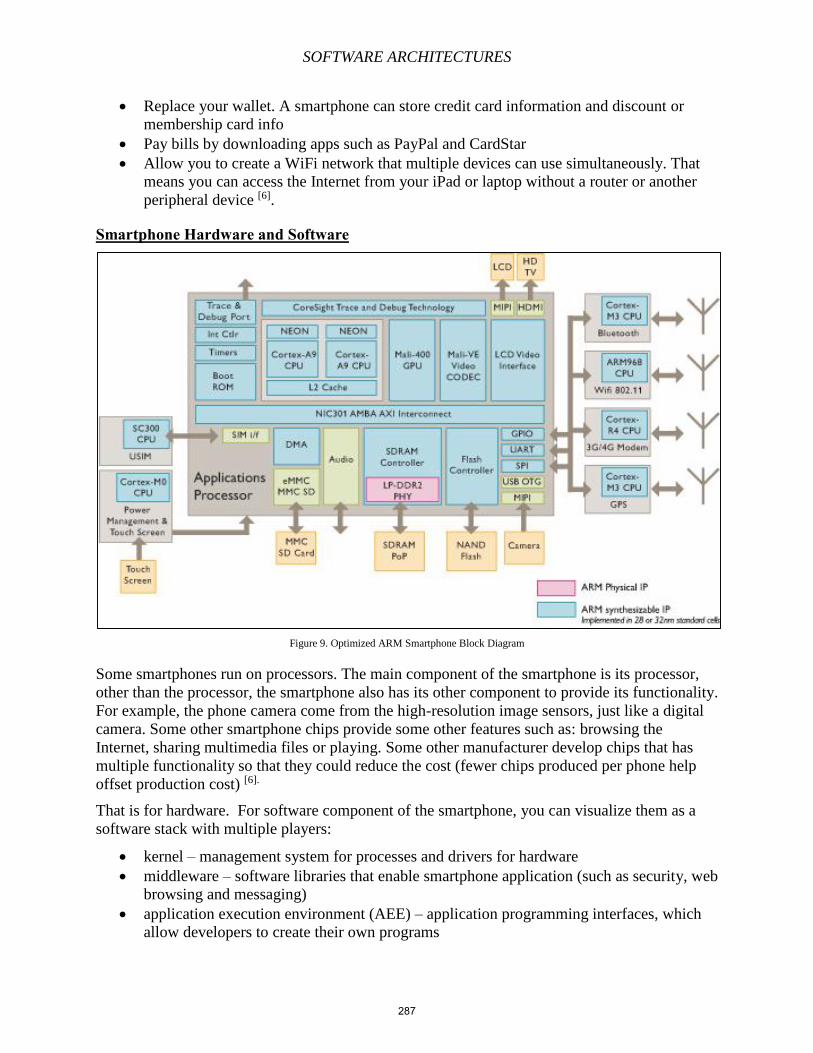
SOFTWARE ARCHITECTURES
Replace your wallet. A smartphone can store credit card information and discount or
membership card info
Pay bills by downloading apps such as PayPal and CardStar
Allow you to create a WiFi network that multiple devices can use simultaneously. That
means you can access the Internet from your iPad or laptop without a router or another
peripheral device [6].
Smartphone Hardware and Software
Figure 9. Optimized ARM Smartphone Block Diagram
Some smartphones run on processors. The main component of the smartphone is its processor,
other than the processor, the smartphone also has its other component to provide its functionality.
For example, the phone camera come from the high-resolution image sensors, just like a digital
camera. Some other smartphone chips provide some other features such as: browsing the
Internet, sharing multimedia files or playing. Some other manufacturer develop chips that has
multiple functionality so that they could reduce the cost (fewer chips produced per phone help
offset production cost) [6].
That is for hardware. For software component of the smartphone, you can visualize them as a
software stack with multiple players:
kernel – management system for processes and drivers for hardware
middleware – software libraries that enable smartphone application (such as security, web
browsing and messaging)
application execution environment (AEE) – application programming interfaces, which
allow developers to create their own programs
287
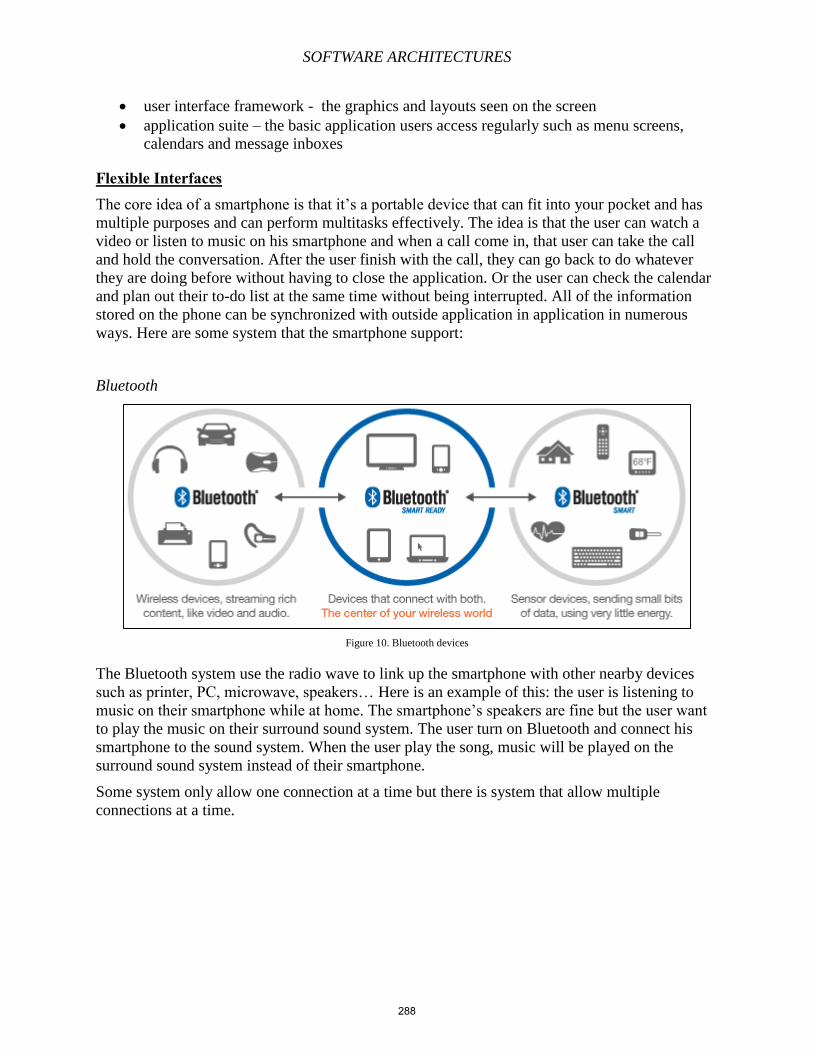
SOFTWARE ARCHITECTURES
user interface framework - the graphics and layouts seen on the screen
application suite – the basic application users access regularly such as menu screens,
calendars and message inboxes
Flexible Interfaces
The core idea of a smartphone is that it’s a portable device that can fit into your pocket and has
multiple purposes and can perform multitasks effectively. The idea is that the user can watch a
video or listen to music on his smartphone and when a call come in, that user can take the call
and hold the conversation. After the user finish with the call, they can go back to do whatever
they are doing before without having to close the application. Or the user can check the calendar
and plan out their to-do list at the same time without being interrupted. All of the information
stored on the phone can be synchronized with outside application in application in numerous
ways. Here are some system that the smartphone support:
Bluetooth
Figure 10. Bluetooth devices
The Bluetooth system use the radio wave to link up the smartphone with other nearby devices
such as printer, PC, microwave, speakers… Here is an example of this: the user is listening to
music on their smartphone while at home. The smartphone’s speakers are fine but the user want
to play the music on their surround sound system. The user turn on Bluetooth and connect his
smartphone to the sound system. When the user play the song, music will be played on the
surround sound system instead of their smartphone.
Some system only allow one connection at a time but there is system that allow multiple
connections at a time.
288
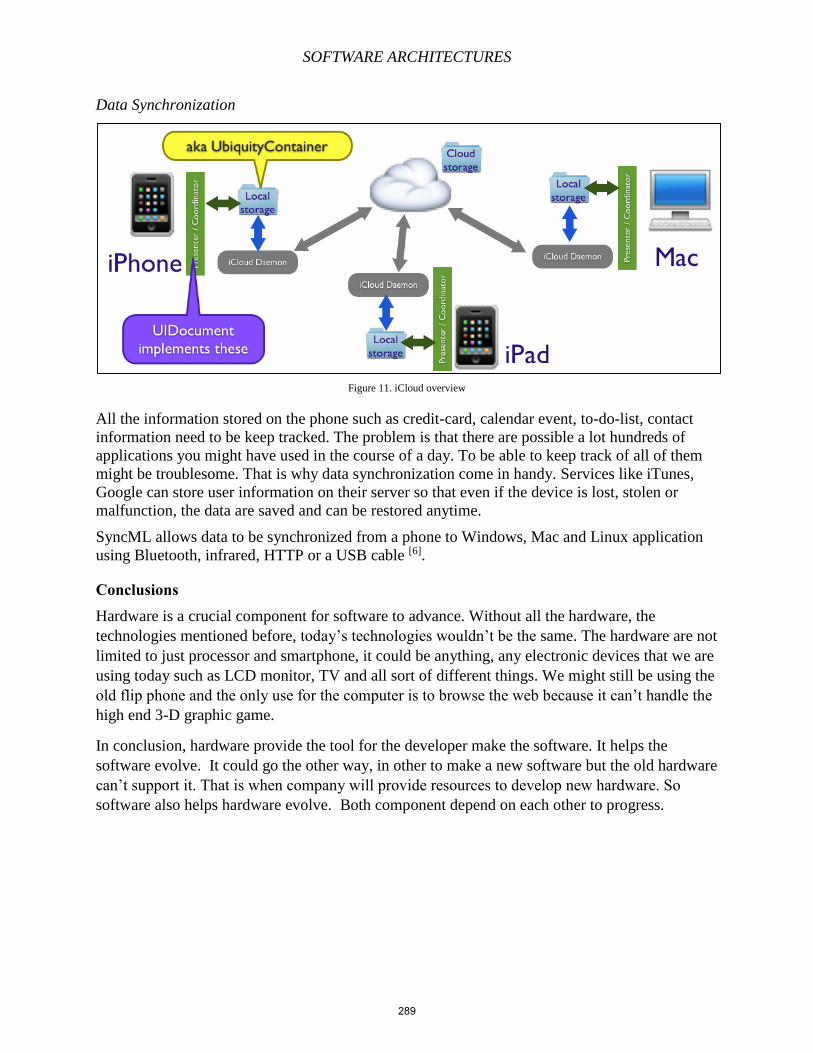
SOFTWARE ARCHITECTURES
Data Synchronization
Figure 11. iCloud overview
All the information stored on the phone such as credit-card, calendar event, to-do-list, contact
information need to be keep tracked. The problem is that there are possible a lot hundreds of
applications you might have used in the course of a day. To be able to keep track of all of them
might be troublesome. That is why data synchronization come in handy. Services like iTunes,
Google can store user information on their server so that even if the device is lost, stolen or
malfunction, the data are saved and can be restored anytime.
SyncML allows data to be synchronized from a phone to Windows, Mac and Linux application
using Bluetooth, infrared, HTTP or a USB cable [6].
Conclusions
Hardware is a crucial component for software to advance. Without all the hardware, the
technologies mentioned before, today’s technologies wouldn’t be the same. The hardware are not
limited to just processor and smartphone, it could be anything, any electronic devices that we are
using today such as LCD monitor, TV and all sort of different things. We might still be using the
old flip phone and the only use for the computer is to browse the web because it can’t handle the
high end 3-D graphic game.
In conclusion, hardware provide the tool for the developer make the software. It helps the
software evolve. It could go the other way, in other to make a new software but the old hardware
can’t support it. That is when company will provide resources to develop new hardware. So
software also helps hardware evolve. Both component depend on each other to progress.
289
SOFTWARE ARCHITECTURES
References [1] "Software Architecture." Software Engineering Institute. 29 Apr. 2014
<http://www.sei.cmu.edu/architecture/>.
[2] Impellizzeri, Angela. "Lesson 06: Software & Hardware Interaction." Prezi.com. 27 Oct.
2010. 29 Apr. 2014 <http://prezi.com/xxpetj52mvaa/lesson-06-software-hardware-
interaction/>.
[3] Jano, Tamas. "A Basic Game Architecture | Against the Grain – Game
Development." Against the Grain Game Development A Basic Game Architecture
Comments. 26 July 2010. 29 Apr. 2014 <http://obviam.net/index.php/2-1-a-little-about-
game-architecture/>.
[4] Gallaugher, John. "Chapter 5." Information Systems: A Manager's Guide to Harnessing
Technology. Nyack, NY: Flat World Knowledge, 2010. N. pag. Print.
[5] Stan Cox, J., Bob Blainey, and Vijay Saraswat. "Multi-Core and Massively Parallel
Processors." 27 Aug. 2007. 29 Apr. 2014 <http://java.sys-con.com/node/419716>.
[6] Coustan, Dave, Jonathan Strickland, and John Perritano. "HowStuffWorks "The Future of
Smartphones"" HowStuffWorks. 29 Apr. 2014
<http://electronics.howstuffworks.com/smartphone5.htm>
290


