Embed Size (px)
Citation preview

JKSimMetSoftware (windows &
buttons)
Split Engineering Chile Ltda.Eduardo Marquina #3937 oficina 1201Casilla 19158 - Correo 19 Vitacura - Santiago, CHILEFono: (56)-(2)-2064674Fax : (56)-(2)-2064668http://www.spliteng.cl
Split Engineering LLC.110 S. Church Avenue, Suite 8312 CP 85701Tucson Arizona, USAFono: (1)-(520)-3273773Fax : (1)-(520)-3267532http://www.spliteng.com
Review 1.2 of the 01-07-06
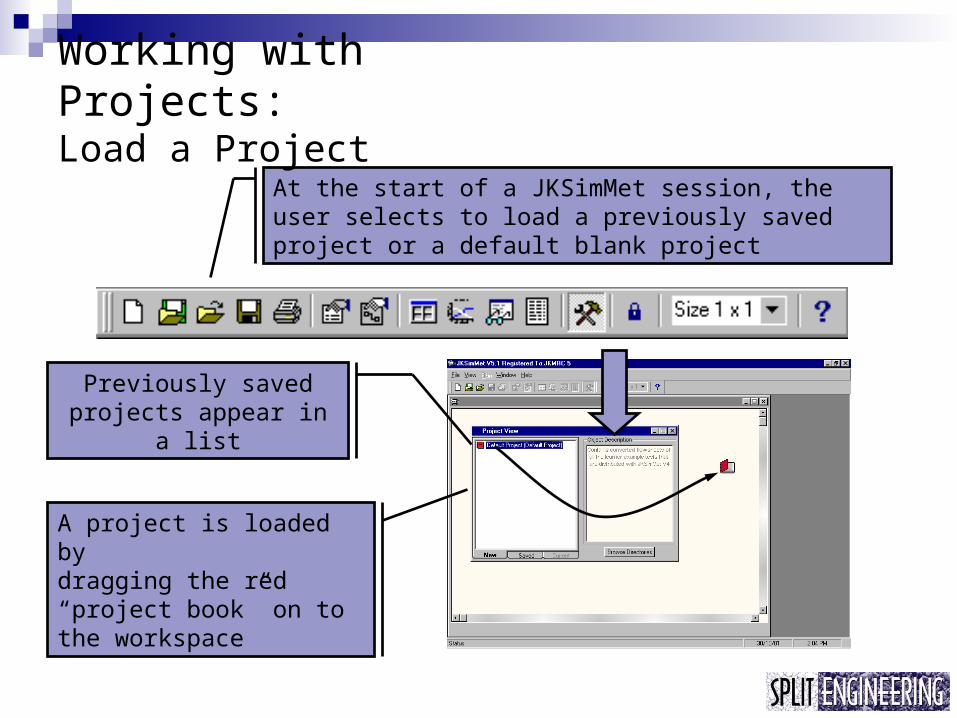
Previously saved projects appear in
a list
A project is loaded bydragging the red “project book” on to the workspace
At the start of a JKSimMet session, the user selects to load a previously saved project or a default blank project
Working with Projects: Load a Project
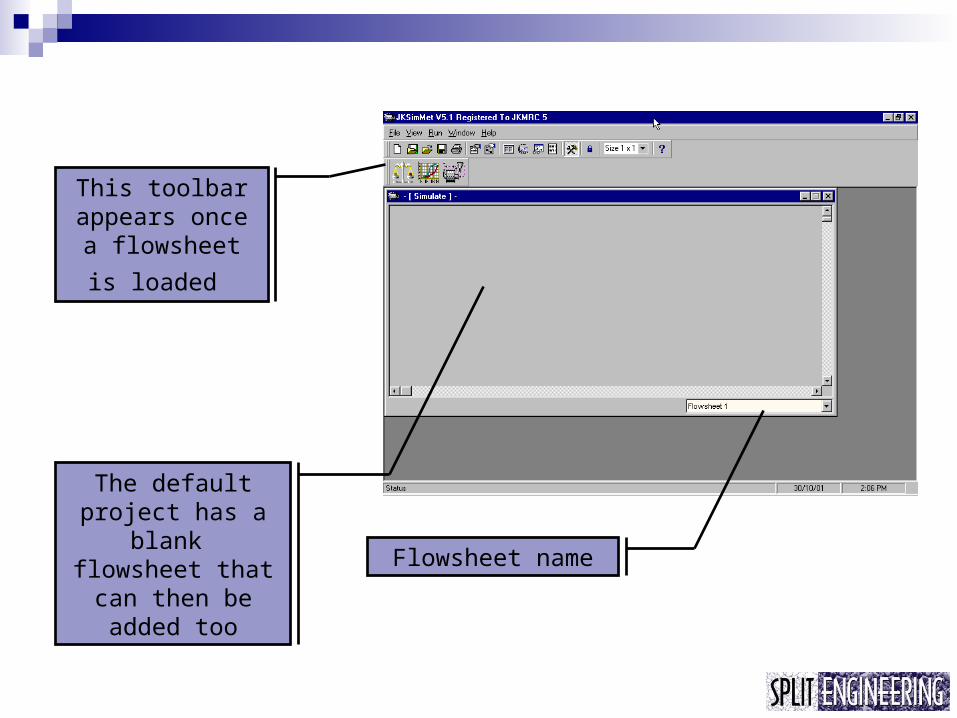
This toolbar appears once a flowsheet is loaded
The default project has a
blank flowsheet that can then be added too
Flowsheet name
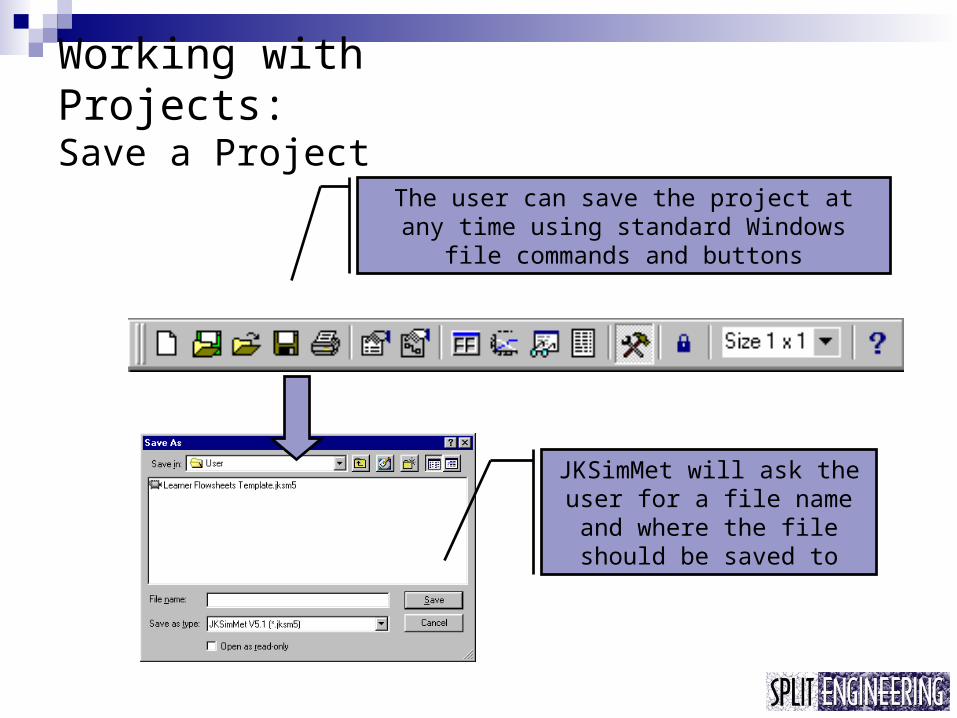
Working with Projects: Save a Project
The user can save the project at any time using standard Windows
file commands and buttons
JKSimMet will ask the user for a file name and where the file should be saved to
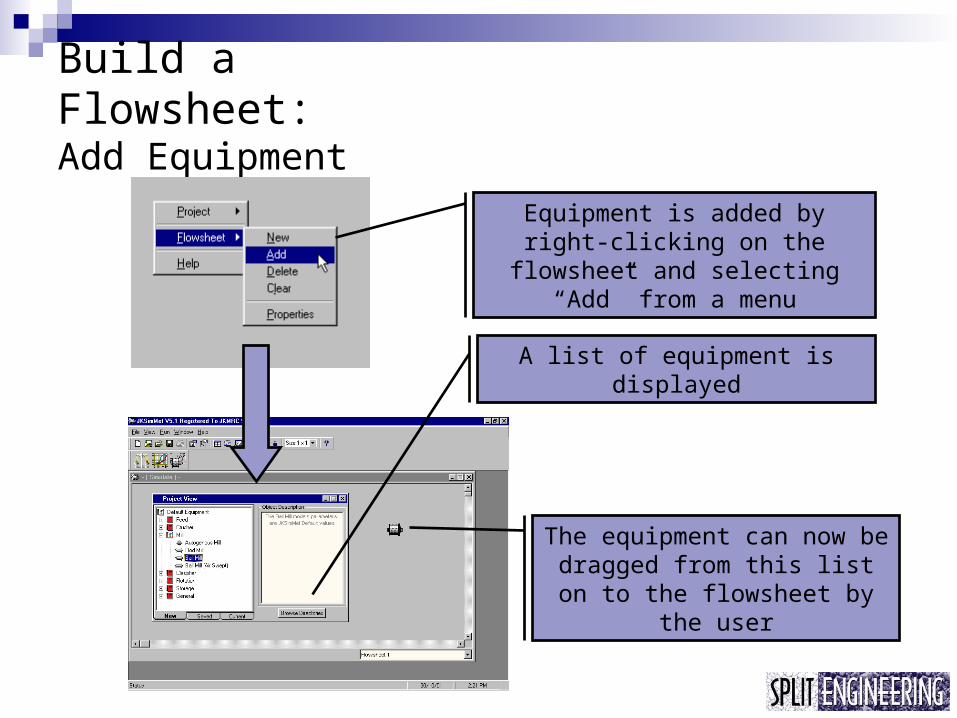
Build a Flowsheet: Add Equipment
Equipment is added by right-clicking on the flowsheet and selecting
“Add” from a menu
A list of equipment is displayed
The equipment can now be dragged from this list on to the flowsheet by
the user
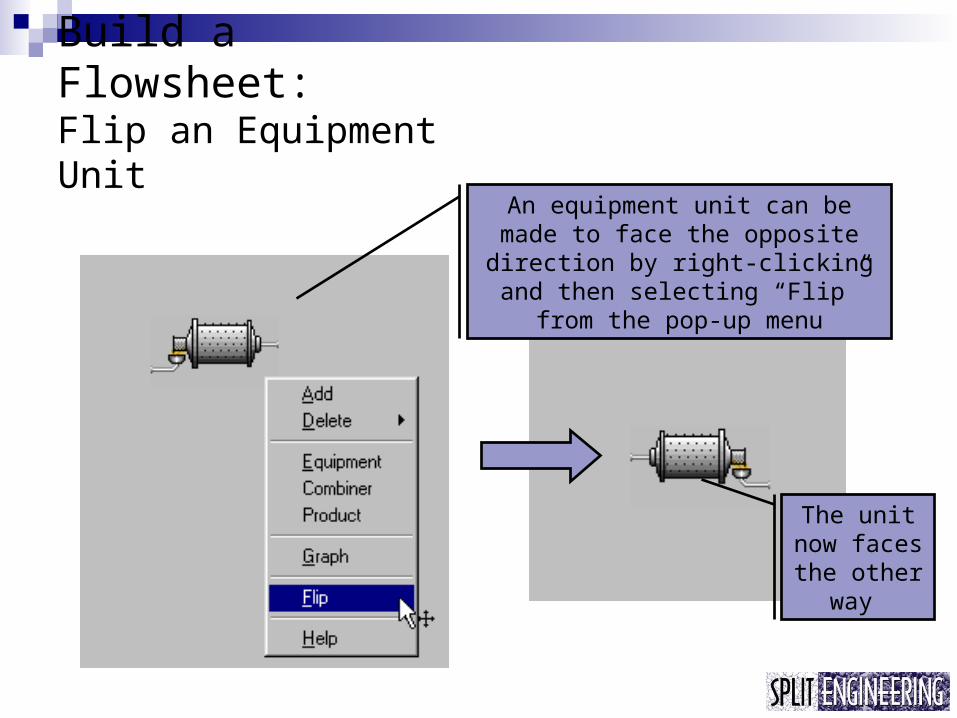
The unit now faces the other
way
An equipment unit can be made to face the opposite
direction by right-clicking and then selecting “Flip”
from the pop-up menu
Build a Flowsheet: Flip an Equipment Unit
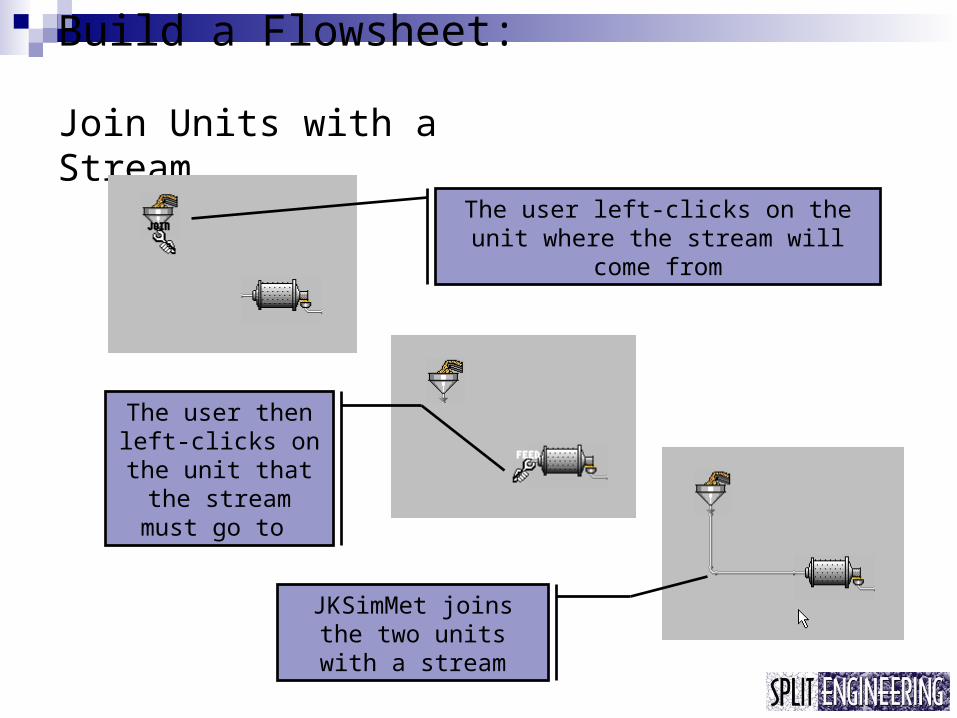
Build a Flowsheet:
Join Units with a Stream
The user left-clicks on the unit where the stream will
come from
The user then left-clicks on the unit that the stream must go to
JKSimMet joins the two units with a stream
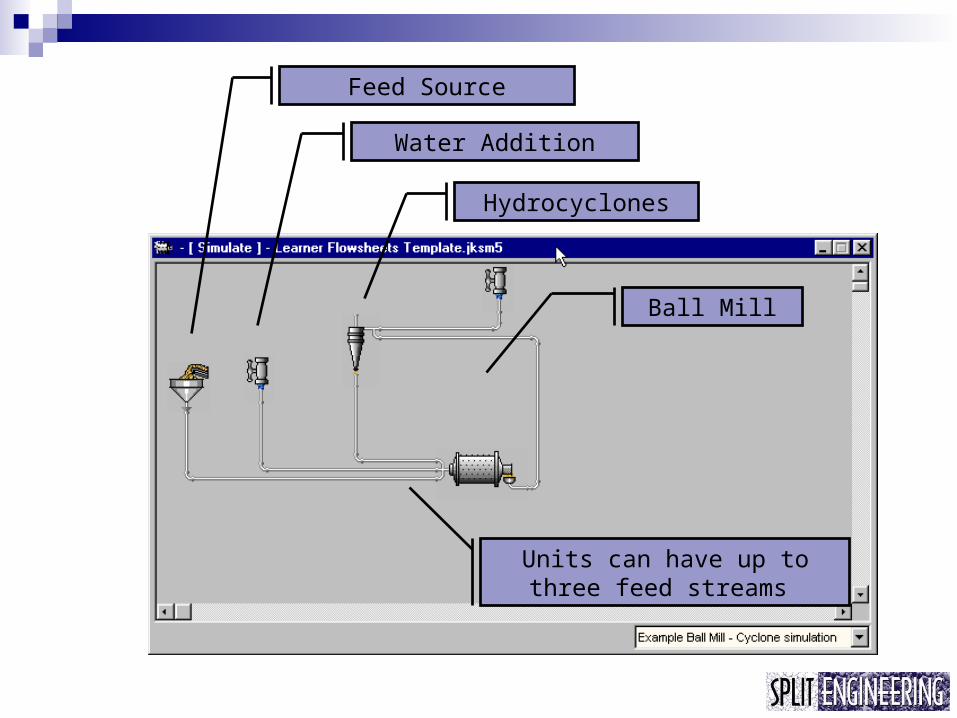
Feed Source
Water Addition
Hydrocyclones
Ball Mill
Units can have up to three feed streams
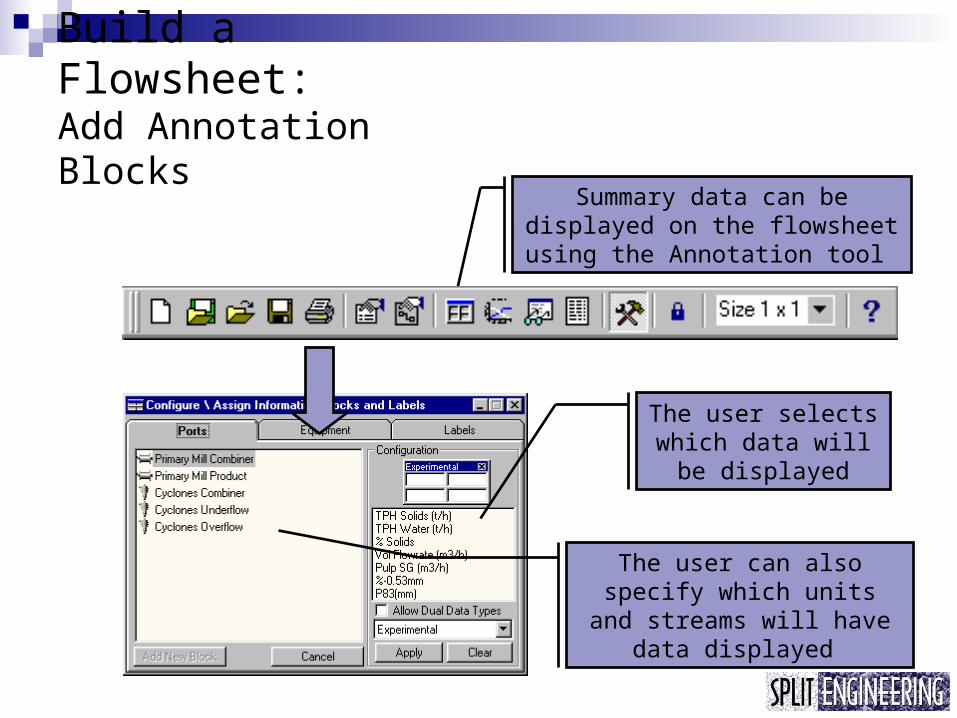
Build a Flowsheet: Add Annotation Blocks
Summary data can be displayed on the flowsheet using the Annotation tool
The user selects which data will be displayed
The user can also specify which units
and streams will have data displayed
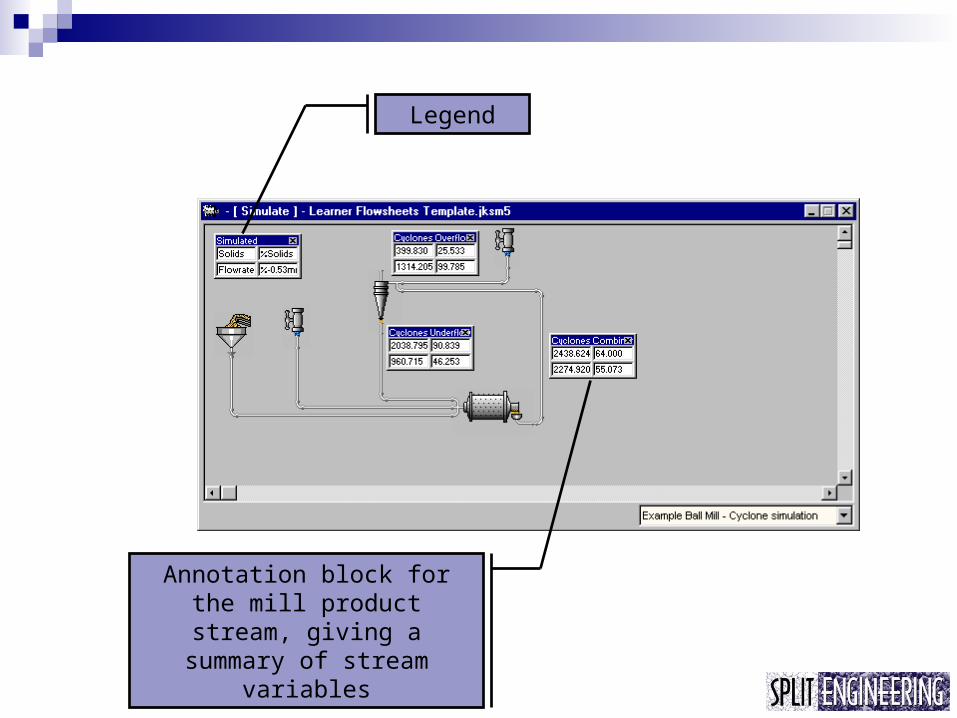
Legend
Annotation block for the mill product stream, giving a summary of stream
variables
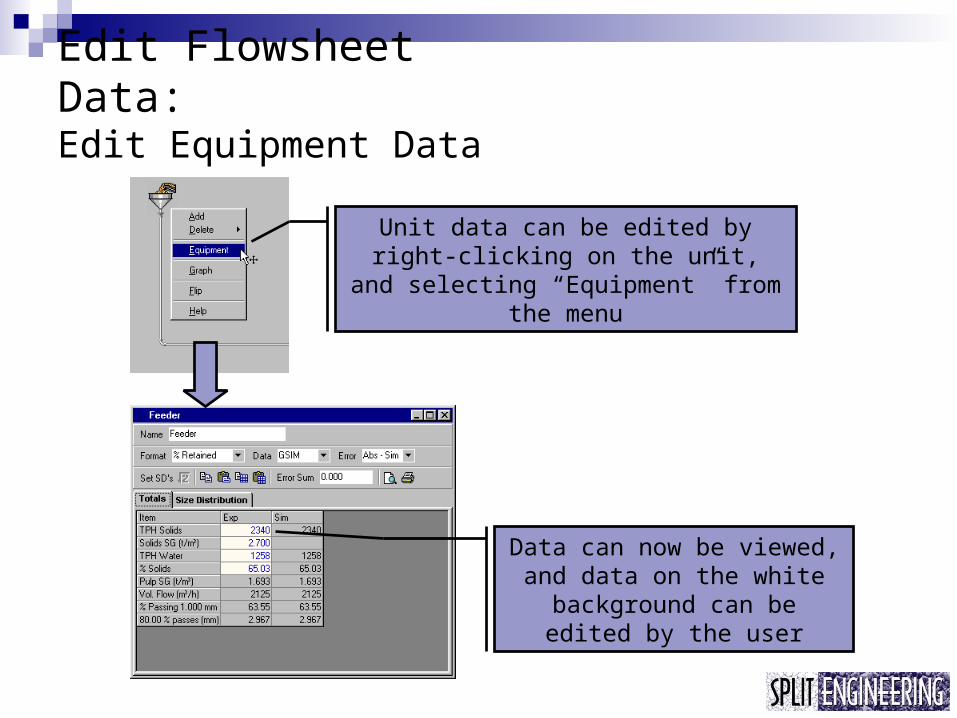
Edit Flowsheet Data: Edit Equipment Data
Unit data can be edited by right-clicking on the unit,
and selecting “Equipment” from the menu
Data can now be viewed, and data on the white
background can be edited by the user
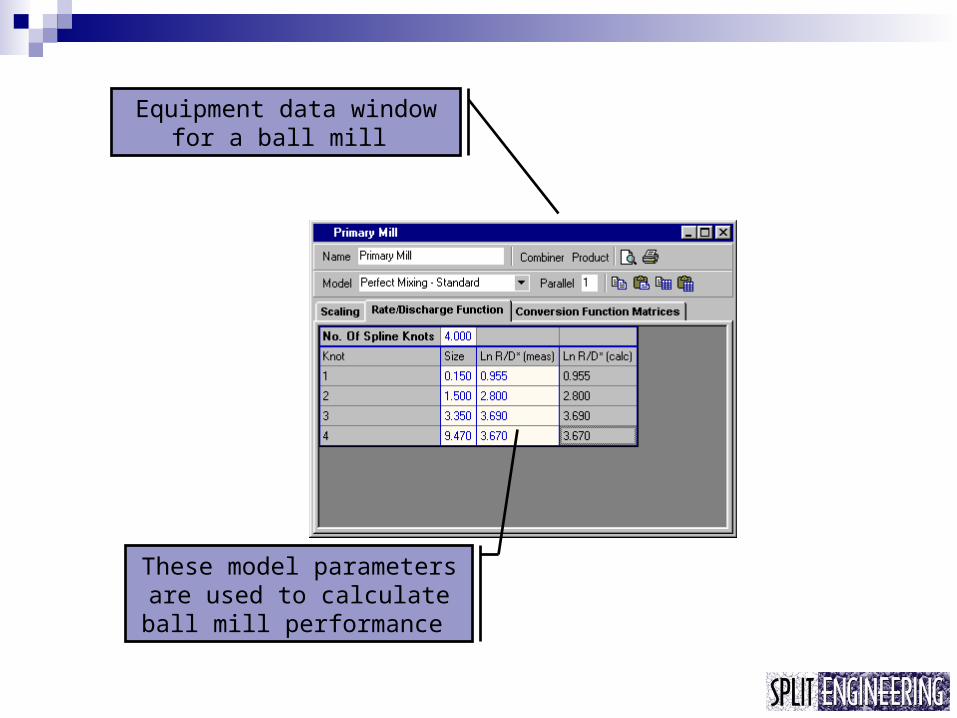
Equipment data window for a ball mill
These model parameters are used to calculate ball mill performance
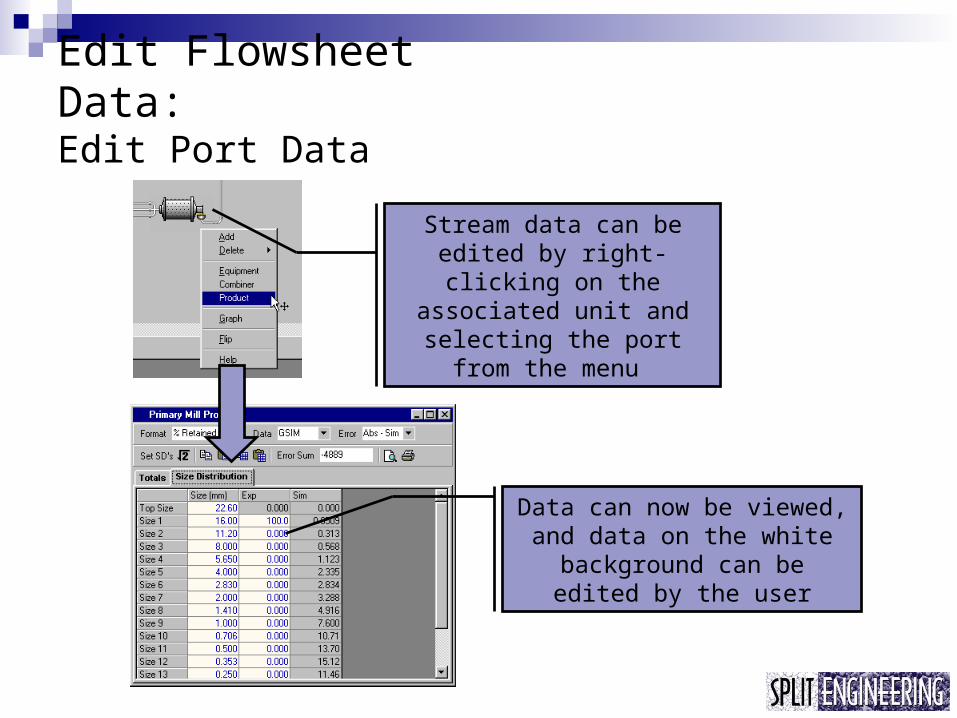
Edit Flowsheet Data: Edit Port Data
Stream data can be edited by right-clicking on the
associated unit and selecting the port
from the menu
Data can now be viewed, and data on the white
background can be edited by the user
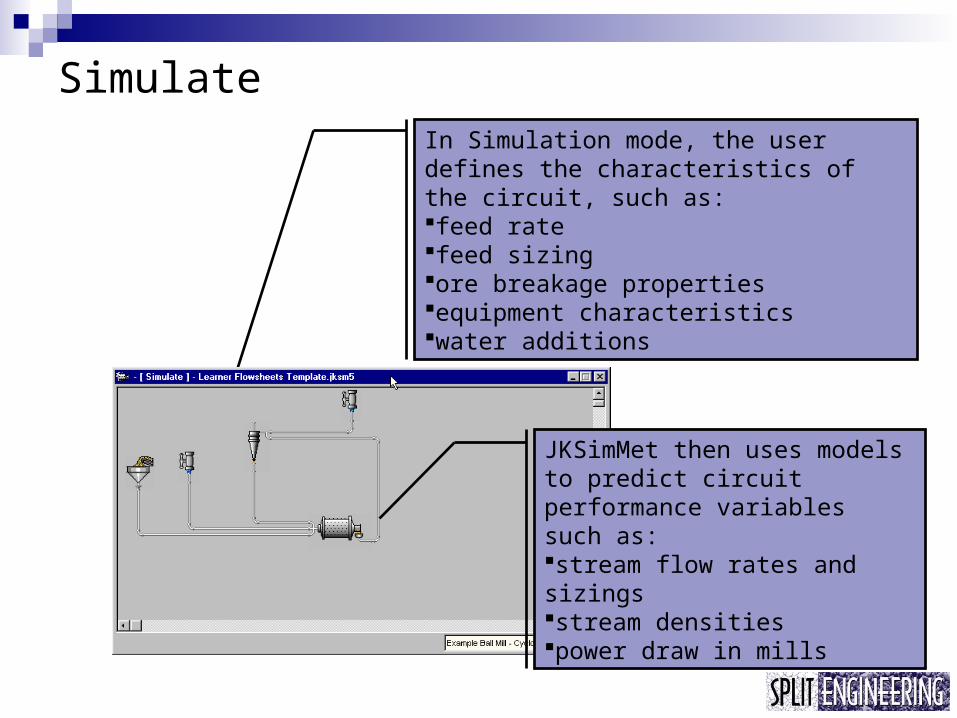
SimulateIn Simulation mode, the user defines the characteristics of the circuit, such as: feed rate feed sizing ore breakage properties equipment characteristics water additions
JKSimMet then uses models to predict circuit performance variables such as: stream flow rates and sizingsstream densities power draw in mills
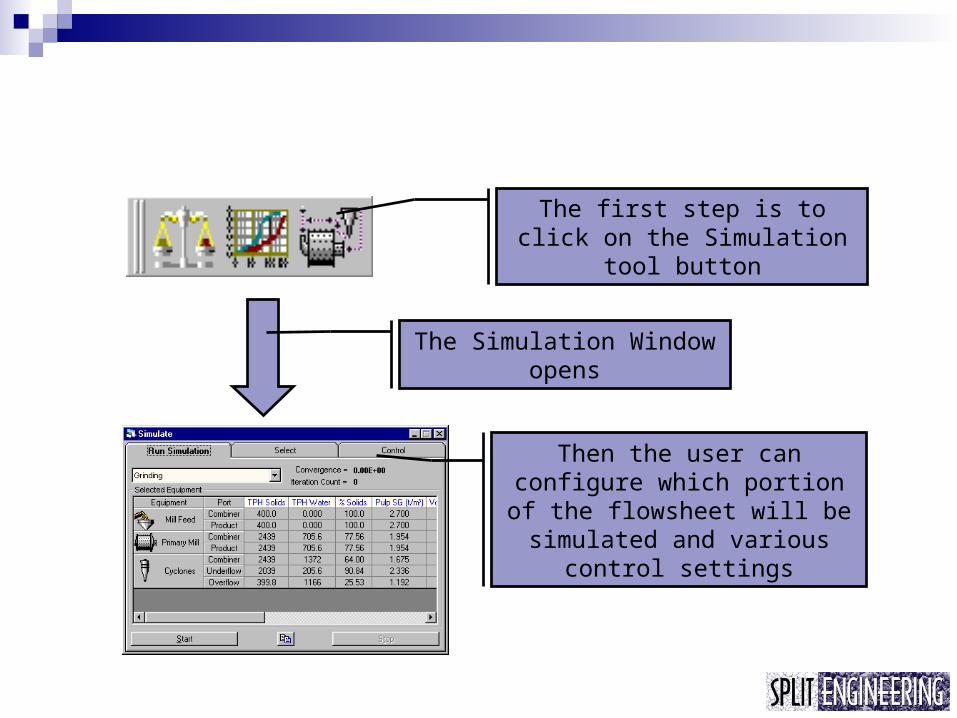
The first step is to click on the Simulation
tool button
The Simulation Window opens
Then the user can configure which portion of the flowsheet will be simulated and various
control settings
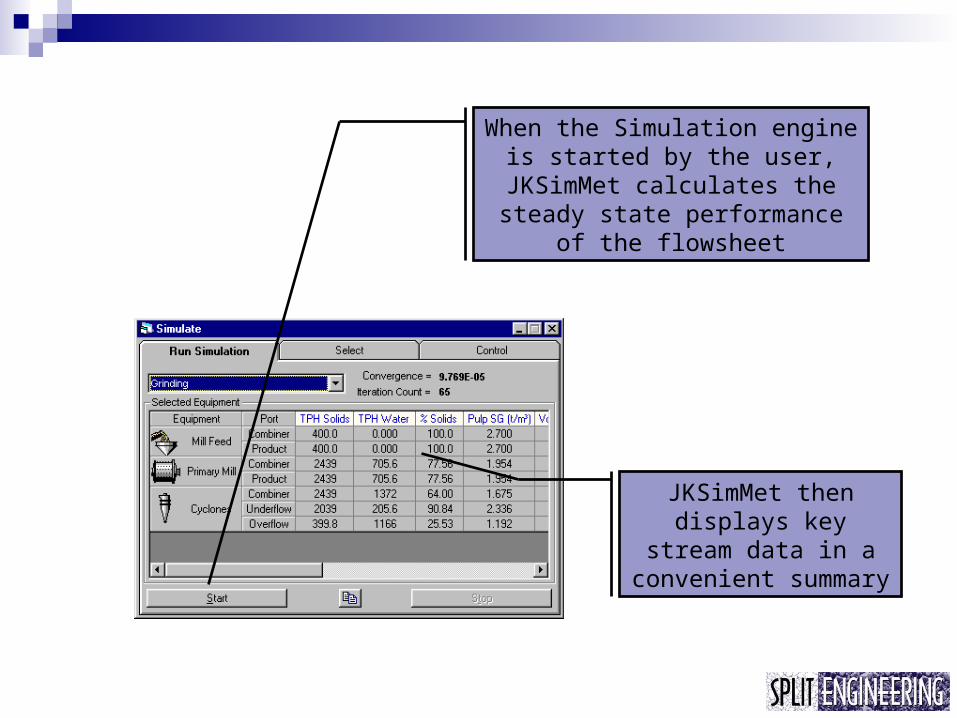
When the Simulation engine is started by the user, JKSimMet calculates the steady state performance
of the flowsheet
JKSimMet then displays key
stream data in a convenient summary
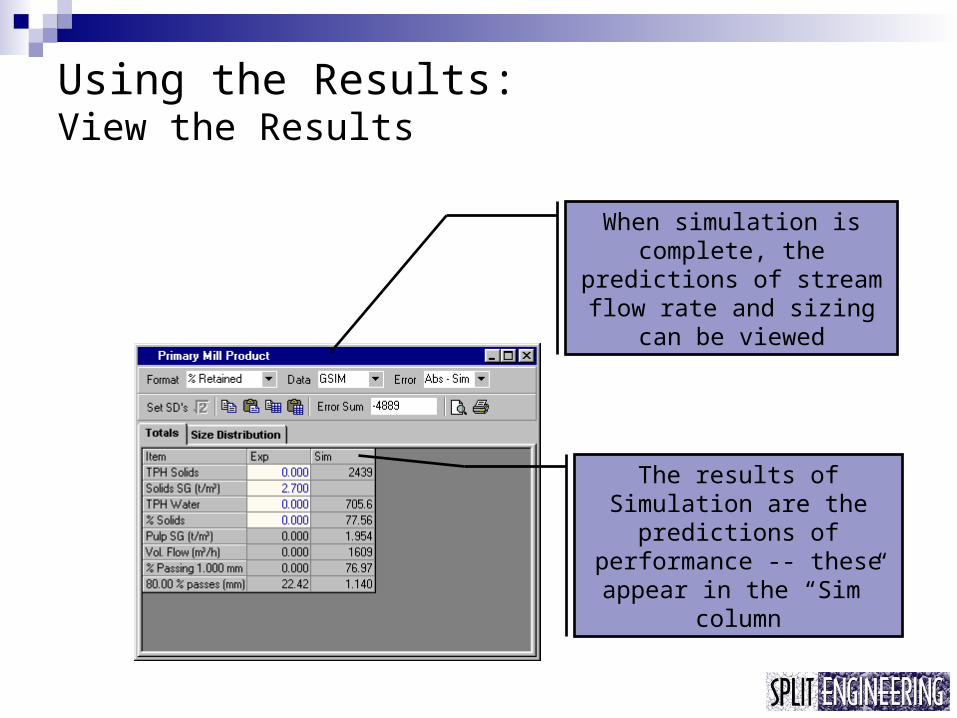
Using the Results:View the Results
When simulation is complete, the
predictions of stream flow rate and sizing
can be viewed
The results of Simulation are the
predictions of performance -- these appear in the “Sim”
column
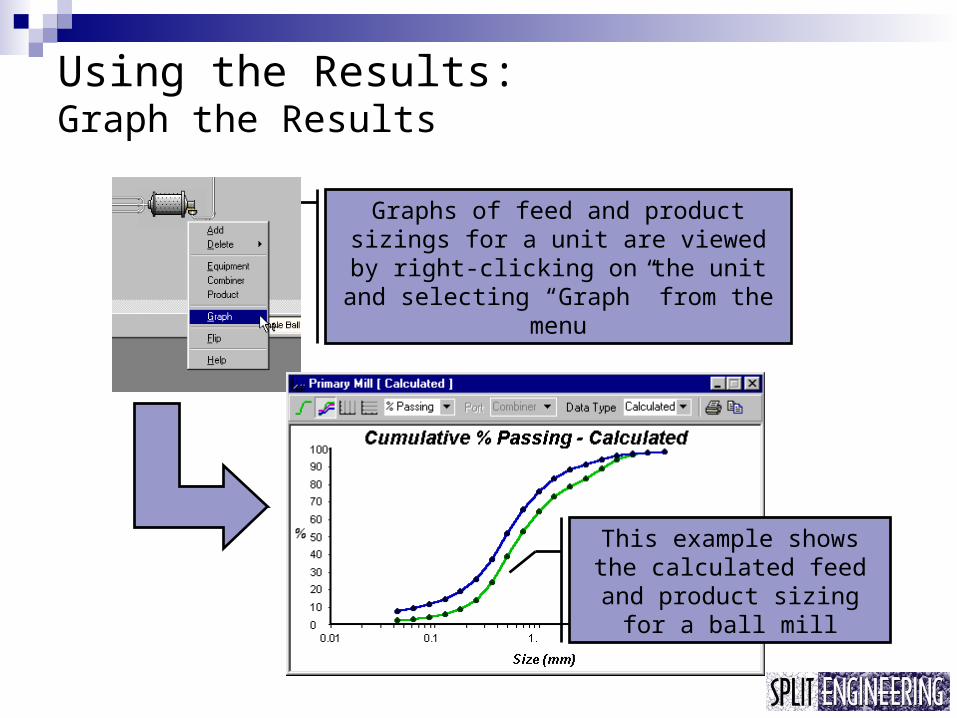
Using the Results:Graph the Results
Graphs of feed and product sizings for a unit are viewed by right-clicking on the unit and selecting “Graph” from the
menu
This example shows the calculated feed and product sizing for a ball mill
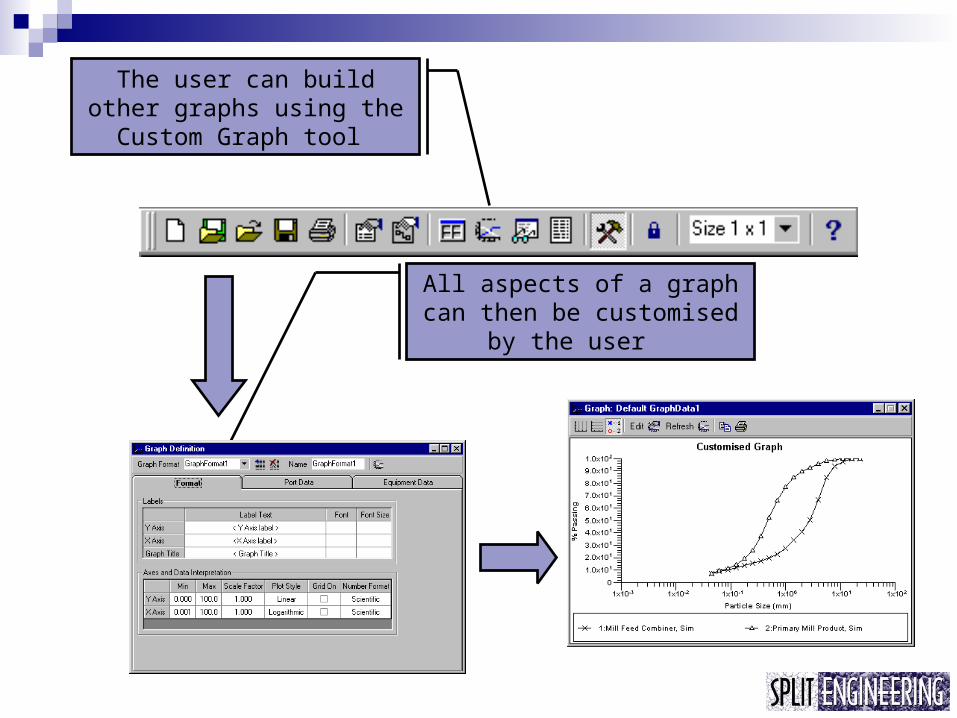
The user can build other graphs using the
Custom Graph tool
All aspects of a graph can then be customised
by the user
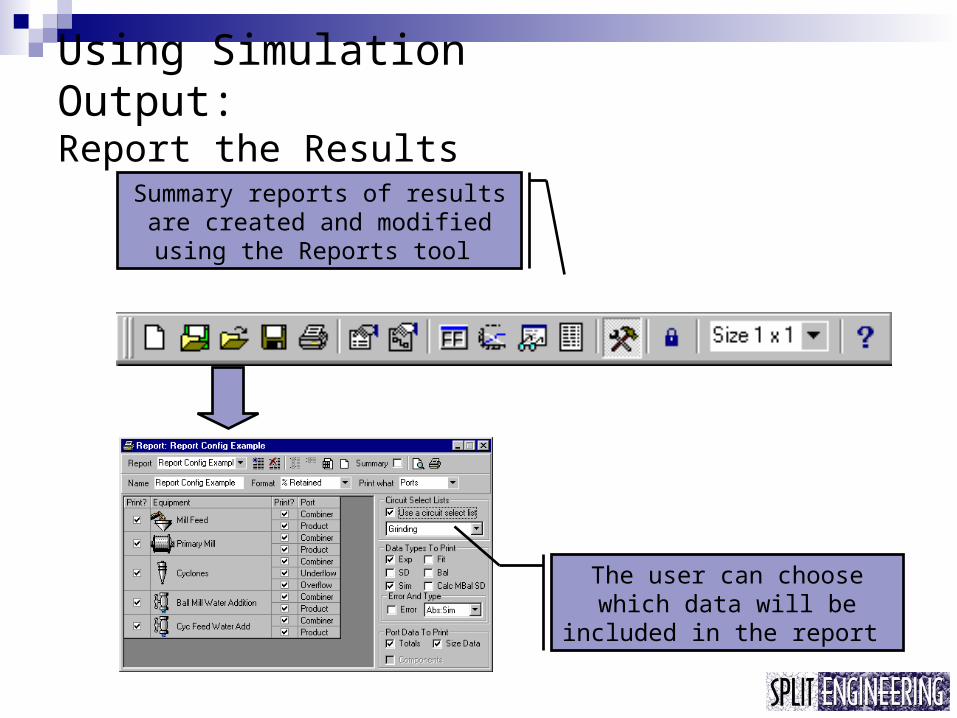
Using Simulation Output:Report the Results
Summary reports of results are created and modified using the Reports tool
The user can choose which data will be
included in the report
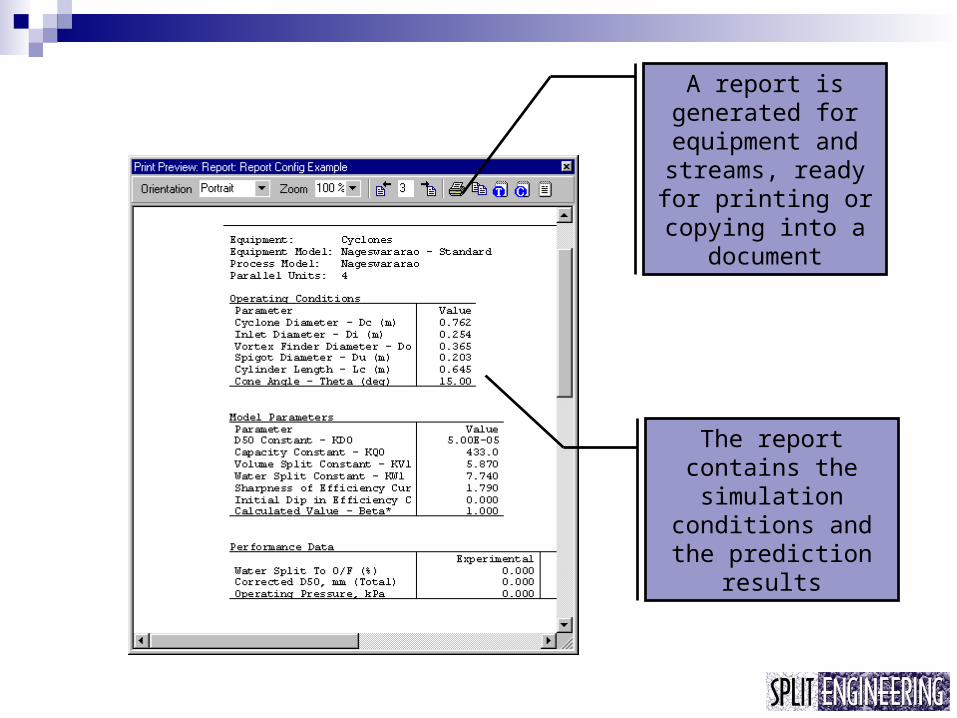
A report is generated for equipment and streams, ready for printing or copying into a
document
The report contains the simulation
conditions and the prediction
results
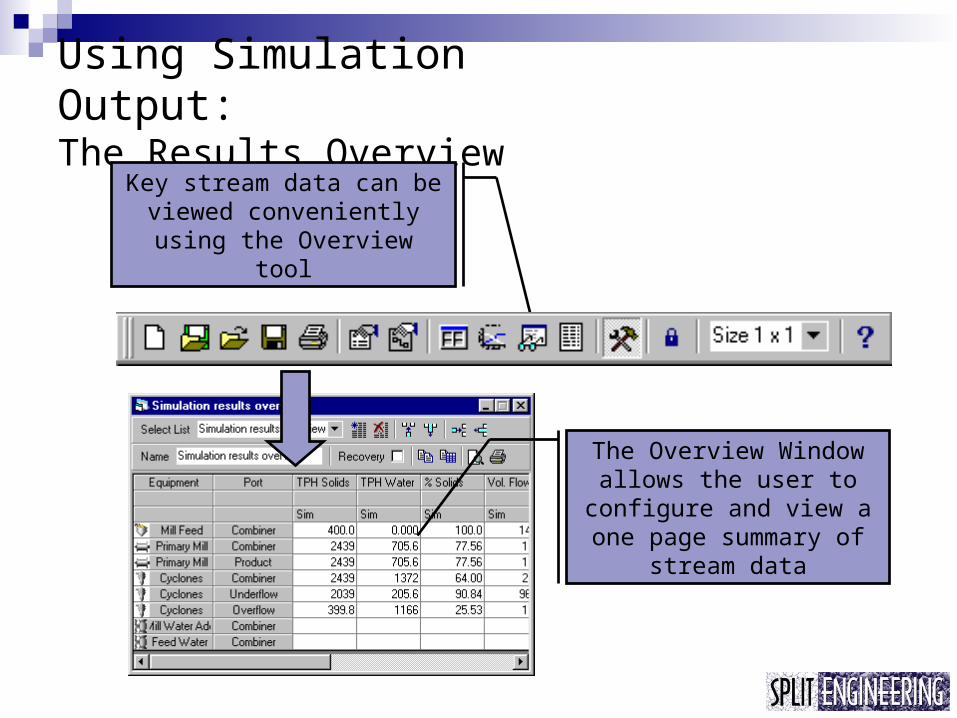
Using Simulation Output:The Results Overview
Key stream data can be viewed conveniently using the Overview
tool
The Overview Window allows the user to configure and view a one page summary of
stream data
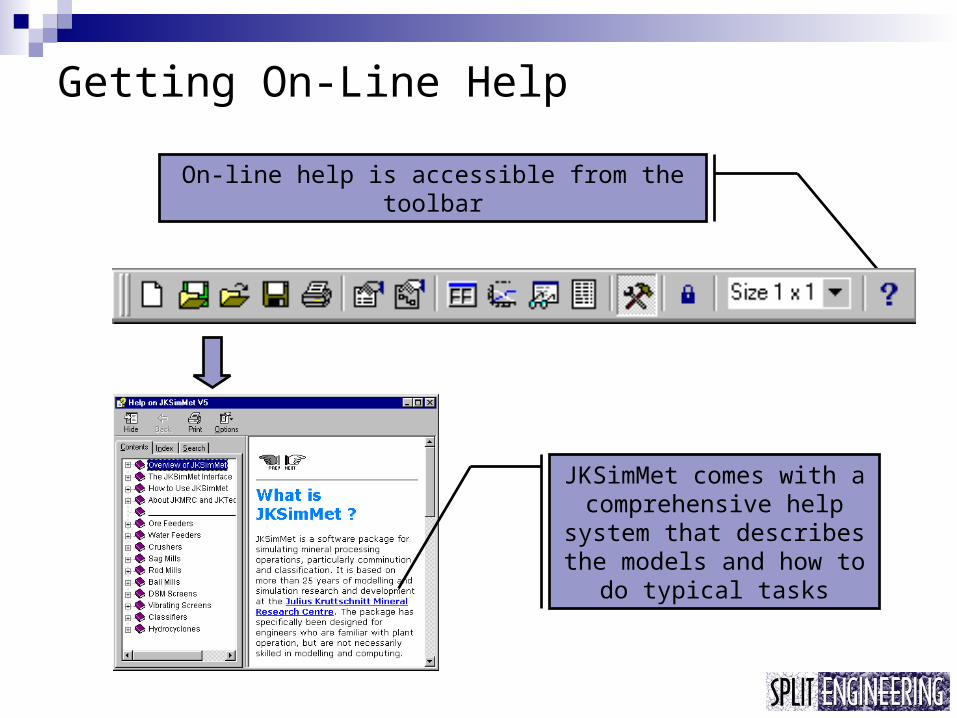
Getting On-Line Help
On-line help is accessible from the toolbar
JKSimMet comes with a comprehensive help
system that describes the models and how to
do typical tasks
Split Engineering Chile Limitada
• Teléfono : (56) (2) 2064674.• Fax : (56) (2)
2064668.• E-mail : [email protected]
• Web : www.spliteng.cl
Contacto
Para Mayor Información Comunicarse a: