Embed Size (px)
Citation preview
This article was downloaded by: [Ambachew Demessie]On: 31 August 2011, At: 01:55Publisher: Taylor & FrancisInforma Ltd Registered in England and Wales Registered Number: 1072954 Registeredoffice: Mortimer House, 37-41 Mortimer Street, London W1T 3JH, UK
Journal of Sustainable ForestryPublication details, including instructions for authors andsubscription information:http://www.tandfonline.com/loi/wjsf20
Soil Carbon and Nitrogen Stocks UnderPlantations in Gambo District, SouthernEthiopiaAmbachew Demessie a , Bal Ram Singh b & Rattan Lal ca Hawassa University, College of Agriculture, Hawassa, Ethiopiab Department of Plant and Environmental Science, NorwegianUniversity of Life Sciences (UMB), Ås, Norwayc Ohio State University, Carbon Management & Sequestration Center,Columbus, Ohio, USA
Available online: 30 Aug 2011
To cite this article: Ambachew Demessie, Bal Ram Singh & Rattan Lal (2011): Soil Carbon andNitrogen Stocks Under Plantations in Gambo District, Southern Ethiopia, Journal of SustainableForestry, 30:6, 496-517
To link to this article: http://dx.doi.org/10.1080/10549811.2010.550547
PLEASE SCROLL DOWN FOR ARTICLE
Full terms and conditions of use: http://www.tandfonline.com/page/terms-and-conditions
This article may be used for research, teaching and private study purposes. Anysubstantial or systematic reproduction, re-distribution, re-selling, loan, sub-licensing,systematic supply or distribution in any form to anyone is expressly forbidden.
The publisher does not give any warranty express or implied or make any representationthat the contents will be complete or accurate or up to date. The accuracy of anyinstructions, formulae and drug doses should be independently verified with primarysources. The publisher shall not be liable for any loss, actions, claims, proceedings,demand or costs or damages whatsoever or howsoever caused arising directly or indirectlyin connection with or arising out of the use of this material.
Journal of Sustainable Forestry, 30:496–517, 2011Copyright © Taylor & Francis Group, LLCISSN: 1054-9811 print/1540-756X onlineDOI: 10.1080/10549811.2010.550547
Soil Carbon and Nitrogen Stocks UnderPlantations in Gambo District,
Southern Ethiopia
AMBACHEW DEMESSIE1, BAL RAM SINGH2, and RATTAN LAL3
1Hawassa University, College of Agriculture, Hawassa, Ethiopia2Department of Plant and Environmental Science, Norwegian University of Life
Sciences (UMB), Ås, Norway3Ohio State University, Carbon Management & Sequestration Center,
Columbus, Ohio, USA
The effect of six plantation species in comparison to natural forest(NF) on soil organic carbon (SOC) and total nitrogen (TN) stocks,depth-wise distribution, biomass carbon (C), and N was investi-gated on plantations and cultivated lands on an Andic paleudalfsoil in Southern Ethiopia. The SOC, N, and bulk density weredetermined from samples taken in 4 replicates from 10-, 20-, 40-,60-, and 100-cm depth under each site. Similarly, the biomass Cand N of the plantation species and understory vegetation werealso determined. The SOC and N were concentrated in the 0- to10-cm depth and decreased progressively to the 1-m depth. Nextto the NF, Juniperous procera accrued higher SOC and N in alldepths than the corresponding plantations. No evidence of signifi-cant difference on SOC and N distribution among plantations wasobserved below the 10-cm depth with minor exceptions. The plan-tations accrue from 133.62 to 213.73 Mg ha–1 or 59.1 to 94.5%SOC, 230.4 to 497.3 Mg ha–1 or 6.9 to 14.9% TBC and 420.37 to672.80 Mg ha–1 or 12.5 to 20% total C-pool of that under the NF.The N stock under Juniperous procera was the highest, while the
The financial support to this study from NORAD to Hawassa University, Ethiopia isgratefully acknowledged. The authors would like to thank Line Tau Strand and Jan Mulderfor their comments on the manuscript and to Sheleme Beyene, Tesfaye Abebe, AbrahmWoldemichael, and Admasu Tsegaye for all support they provided during the fieldwork atHawassa, Ethiopia. The authors also thank Teramage Tesfaye for his enormous assistanceduring the entire period of data collection and fieldwork.
Address correspondence to Ambachew Demessie, Hawassa University, College ofAgriculture, P.O. Box 5, Hawassa, Ethiopia. E-mail: [email protected]
496
Dow
nloa
ded
by [
Am
bach
ew D
emes
sie]
at 0
1:55
31
Aug
ust 2
011
Soil Carbon and Nitrogen Stocks Under Plantations 497
lowest was under Eucalyptus globulus and Cupressus lusitanica.We suggest that SOC and N sequestration can be enhanced throughmixed cropping and because the performance of the native speciesJuniperous procera is encouraging, it should be planted to restockits habitat.
KEYWORDS soil organic carbon (SOC), soil nitrogen (N), naturalforest (NF), total biomass carbon (TBC), plantation forest, Ethiopia
INTRODUCTION
Land use changes, particularly conversion of natural forests (NF) into otherland uses, contribute to anthropogenic carbon emission (Kirby & Potvin,2007) and hence degradation of the physical, chemical, and biologicalqualities of soils. Deforestation is the major factor contributing to landdegradation by erosion agents (Teketay, 2001). In many tropical regions,environmental degradation through clearing of native forest is proceedingat an unprecedented rate impacting prospects for maintaining the soil qual-ity and conservation of biological diversity (Parrotta, 1992; Vagen, Lal, &Singh, 2005).
Soil carbon (C) loss may be elevated due to changes in the balancebetween biomass production and decomposition impacted by deforesta-tion. Decrease in plant productivity may lead to loss of soil fertility througherosion, reduction in soil C sequestration, and increase in net emission ofgreenhouse gases (GHGs). Conversely, if proper and sustainable use of for-est resources is practiced, C sequestration will be enhanced and the potentialto decrease the rate of enrichment of atmospheric concentration of CO2 willbe promoted (Resh, Binkley, & Parrotta, 2002; Malmer, 1996). The drasticenvironmental effect of deforestation—explicitly loss of soil organic carbon(SOC), total nitrogen (TN), soil fertility, and decline of ecosystem functions—in general can be reversed by rehabilitation of the degraded lands throughreforestation and/or allow the natural process of regeneration to take itscourse by reducing the anthropological perturbation on the already affectedlands. Basically, when reforestation through plantation is the choice to reha-bilitate degraded lands, meet the demand for wood products, sequestercarbon, and to improve an overall ecosystem function, then the choice ofplant material mostly leans toward those exotic species that are easy tomanage in nurseries and are fast growing once they are planted in the field.Montagnini and Nair (2004) argued that Eucalyptus, Acacia, Pinus, and otherconiferous species are the main medium-rotation utility species, and there isstrong variation in the carbon sequestration potential among them.
Nevertheless, irrespective of the forest type (plantation or natural), theircapacity to sequester carbon depends on complex interactions of climate,
Dow
nloa
ded
by [
Am
bach
ew D
emes
sie]
at 0
1:55
31
Aug
ust 2
011
498 A. Demessie et al.
soil type, management, characteristics and composition of the species (Paul,Polglase, Nyakuengama, & Khanna, 2002; Lal, 2005). In highly fertile andproductive soils, the species richness and diversity will be higher comparedto soils that have lost their intrinsic value through unchecked degradation(Sollins, 1998). Under similar soil and environmental characteristics, soil Cas well as above and below ground biomass accumulation vary due tothe influence of diverse plant species occupying the habitat. Chen (2006)reported that tree C storage varies for stands with the same species richnesswhile Montagnini & Porras (1998) argued that it increases with increasingtree species diversity. There is also a dilemma that pure stand fast grow-ing plantations can exhaust soil nutrients that may lead to the decline ofsite productivity. On the other hand, research findings have shown thatsome eucalyptus species grow better and produced higher biomass underprolonged water deficit compared to the indigenous species in Ethiopia(Gindaba, Rozanov, & Negash, 2005).
In Ethiopia, like many of the tropical regions, deforestation is very com-mon in the larger portion of the country (Allen & Barnes, 1985). Very highand still growing demands for grazing and arable land, fuelwood, and con-struction material are the major factors contributing to severe deforestation(Senbeta, Teketay, & Naslund, 2002; Darkoh, 1998; Taddese, 2001; Wubet,Kottke, Teketay, & Oberwinkler, 2003); and as a result, the native forestresources are severely reduced. This raises a serious concern that the rem-nant native forests will disappear if such trends continue unabated. Thescanty supply of forest products and the decline of soil productivity throughaccelerated soil erosion necessitated restoration of degraded lands and tothis effect forest tree plantations were started in the 1960s in many partsof the country, mainly with exotic tree species (Amare, Feyisa, & Belay,1990). In the Gambo District of Munessa-Shashemene area, plantations wereestablished by clearing the Podocarpus falcatus (Thunb.) R. Br. ex Mirband Hagenia abyssinica (Bruce) J.F. Gmel. dominated natural forest (Betre,Mamo, & Larsson, 2000). In the study sites of Leye and Ashoka of GamboDistrict, exotic coniferous and eucalyptus species were planted during estab-lishment that include: Cupressus lusitanica (Mill.), Pinus patula (Schiede &Deppe), Eucalyptus camaldulensis (Dehnh.), Eucalyptus globules (Labill.),Eucalyptus saligna (Smith), and Juniperous procera (Hochst. Ex Endl.)—theonly indigenous coniferous species plantation—was also established in 1978on 6.1 ha of primary forestland. The E. camaldulensis and E. globulus wereestablished on land that had been converted to farmland 16 yr prior, whilethe remaining species were planted on primary forestland after clearing theNF where dominant trees were selectively removed for lumber production(hereafter, primary forest).
In such perspective, the turnover of soil and biomass C and N is notwell understood in the designated study area. Lemenih, Lemma, and Teketay(2005) investigated the changes of soil C and N stalks under a C. lusitanica
Dow
nloa
ded
by [
Am
bach
ew D
emes
sie]
at 0
1:55
31
Aug
ust 2
011
Soil Carbon and Nitrogen Stocks Under Plantations 499
and E. saligna stand, which was established on previously cultivated land ina nearby site of the study area. However, our knowledge about the C and Nturnover of the entire species mentioned above in their respective mode ofplantation (on cultivated lands and on primary forest) is very limited. Little isknown about the status and the eventual contribution to the losses or gainsof organic C and N of the lower story vegetation under those extensivelyused plantation species. Furthermore, the performance of the indigenousconiferous species (J. procera) in sequestering C at an equal time footingwith those exotic plantation species commonly used in the study area hasnot yet been investigated.
It was hypothesized that the C and N stocks and the undergrowthbiomass of the extensively used plantation species established on previouslycultivated and primary forestland differ from the adjacent NF (considered asreference for the study), and the plantation species have different impactson soil and biomass C and N turnover and their distribution in the profile.Therefore, this study investigated the soil and vegetation pools of C and N,the rate of loss of SOC and TN under land use change, and their distributionin the soil profile (up to 1-m depth) under the extensively used five exoticand one indigenous plantation species of the study site.
MATERIAL AND METHODS
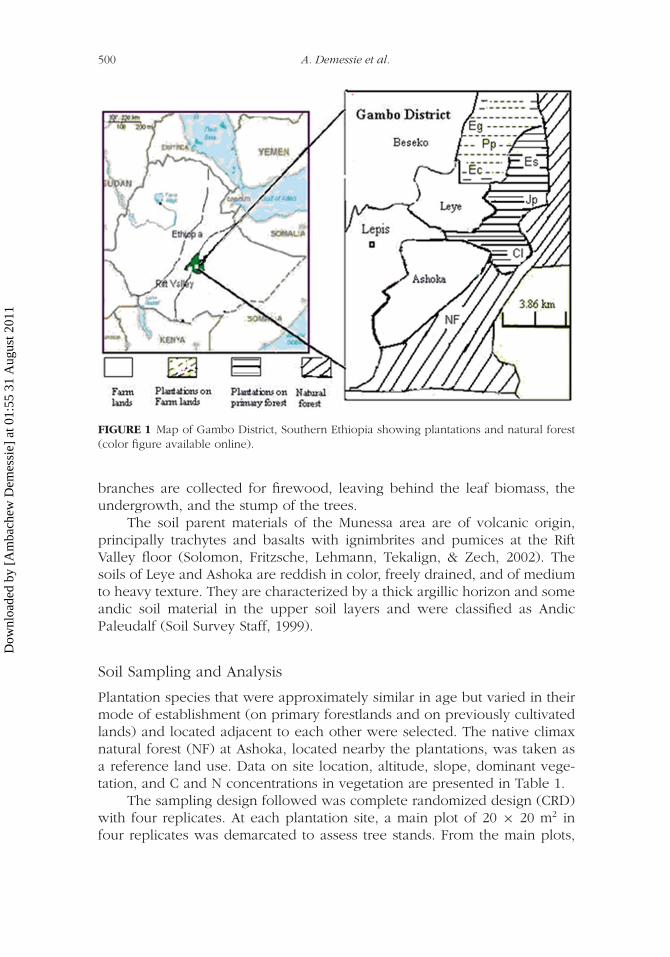
The study was conducted at Leye and Ashoka, sites in Gambo districtwhich are part of the Munessa Shashemene forest area of southern Ethiopia(Figure 1). It covers an area positioned on the lower fringe of the west-ern escarpment of the southeastern highlands. Leye and Ashoka sites liewithin 7◦17′ and 7◦19′ N, and 38◦48′ and 38◦49′ E. The altitude ranges from2,134 to 2,294 m a.s.l, and the slope from 3 to 18%. Rainfall is bimodalwith mean annual precipitation of 973 mm, most of it falling from July toSeptember. Temperature ranges between the maximum of 26.6◦C and min-imum of 10.4◦C across the study area for the period from 1999 to 2007.The more detailed description of the vegetation characteristics that includesthe NF area is presented elsewhere (Demessie, Singh, & Lal, 2009). Theplantations with J. procera, C.lusitanica, and E. saligna were establishedafter clearing the primary forestland in 1978, 1982, and 1985, respectively;and with E. globulus, E. camaldulensis, and P. patula were all establishedin 1985 on lands that had been converted for cultivation 16 yr prior. Theconiferous species were harvested in 25-yr rotation periods; but the euca-lyptus species were managed as coppice and were harvested every 7 to 10yr based on the type of product needed. J. procera has never been har-vested since its establishment, but it was subjected to silvicultural operationslike access pruning, second high pruning and second thinning. During har-vest, the logs are hauled off the site to the processing center while the
Dow
nloa
ded
by [
Am
bach
ew D
emes
sie]
at 0
1:55
31
Aug
ust 2
011
500 A. Demessie et al.
FIGURE 1 Map of Gambo District, Southern Ethiopia showing plantations and natural forest(color figure available online).
branches are collected for firewood, leaving behind the leaf biomass, theundergrowth, and the stump of the trees.
The soil parent materials of the Munessa area are of volcanic origin,principally trachytes and basalts with ignimbrites and pumices at the RiftValley floor (Solomon, Fritzsche, Lehmann, Tekalign, & Zech, 2002). Thesoils of Leye and Ashoka are reddish in color, freely drained, and of mediumto heavy texture. They are characterized by a thick argillic horizon and someandic soil material in the upper soil layers and were classified as AndicPaleudalf (Soil Survey Staff, 1999).
Soil Sampling and Analysis
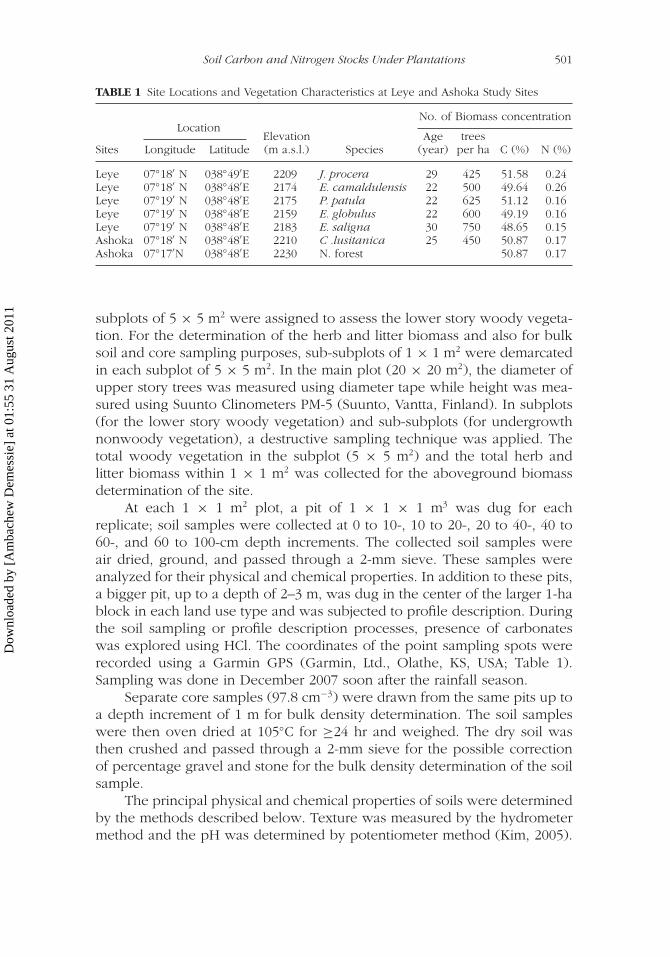
Plantation species that were approximately similar in age but varied in theirmode of establishment (on primary forestlands and on previously cultivatedlands) and located adjacent to each other were selected. The native climaxnatural forest (NF) at Ashoka, located nearby the plantations, was taken asa reference land use. Data on site location, altitude, slope, dominant vege-tation, and C and N concentrations in vegetation are presented in Table 1.
The sampling design followed was complete randomized design (CRD)with four replicates. At each plantation site, a main plot of 20 × 20 m2 infour replicates was demarcated to assess tree stands. From the main plots,
Dow
nloa
ded
by [
Am
bach
ew D
emes
sie]
at 0
1:55
31
Aug
ust 2
011
Soil Carbon and Nitrogen Stocks Under Plantations 501
TABLE 1 Site Locations and Vegetation Characteristics at Leye and Ashoka Study Sites
No. of Biomass concentrationLocation
Sites Longitude LatitudeElevation(m a.s.l.) Species
Age(year)
treesper ha C (%) N (%)
Leye 07◦18′ N 038◦49′E 2209 J. procera 29 425 51.58 0.24Leye 07◦18′ N 038◦48′E 2174 E. camaldulensis 22 500 49.64 0.26Leye 07◦19′ N 038◦48′E 2175 P. patula 22 625 51.12 0.16Leye 07◦19′ N 038◦48′E 2159 E. globulus 22 600 49.19 0.16Leye 07◦19′ N 038◦48′E 2183 E. saligna 30 750 48.65 0.15Ashoka 07◦18′ N 038◦48′E 2210 C .lusitanica 25 450 50.87 0.17Ashoka 07◦17′N 038◦48′E 2230 N. forest 50.87 0.17
subplots of 5 × 5 m2 were assigned to assess the lower story woody vegeta-tion. For the determination of the herb and litter biomass and also for bulksoil and core sampling purposes, sub-subplots of 1 × 1 m2 were demarcatedin each subplot of 5 × 5 m2. In the main plot (20 × 20 m2), the diameter ofupper story trees was measured using diameter tape while height was mea-sured using Suunto Clinometers PM-5 (Suunto, Vantta, Finland). In subplots(for the lower story woody vegetation) and sub-subplots (for undergrowthnonwoody vegetation), a destructive sampling technique was applied. Thetotal woody vegetation in the subplot (5 × 5 m2) and the total herb andlitter biomass within 1 × 1 m2 was collected for the aboveground biomassdetermination of the site.
At each 1 × 1 m2 plot, a pit of 1 × 1 × 1 m3 was dug for eachreplicate; soil samples were collected at 0 to 10-, 10 to 20-, 20 to 40-, 40 to60-, and 60 to 100-cm depth increments. The collected soil samples wereair dried, ground, and passed through a 2-mm sieve. These samples wereanalyzed for their physical and chemical properties. In addition to these pits,a bigger pit, up to a depth of 2–3 m, was dug in the center of the larger 1-hablock in each land use type and was subjected to profile description. Duringthe soil sampling or profile description processes, presence of carbonateswas explored using HCl. The coordinates of the point sampling spots wererecorded using a Garmin GPS (Garmin, Ltd., Olathe, KS, USA; Table 1).Sampling was done in December 2007 soon after the rainfall season.
Separate core samples (97.8 cm−3) were drawn from the same pits up toa depth increment of 1 m for bulk density determination. The soil sampleswere then oven dried at 105◦C for ≥24 hr and weighed. The dry soil wasthen crushed and passed through a 2-mm sieve for the possible correctionof percentage gravel and stone for the bulk density determination of the soilsample.
The principal physical and chemical properties of soils were determinedby the methods described below. Texture was measured by the hydrometermethod and the pH was determined by potentiometer method (Kim, 2005).
Dow
nloa
ded
by [
Am
bach
ew D
emes
sie]
at 0
1:55
31
Aug
ust 2
011
502 A. Demessie et al.
The concentrations of total carbon (TC) and total nitrogen (TN) weremeasured using a LECO CHN-1000 Carbon and Nitrogen Analyzer (LECOCorp., St, Joseph, MI, USA). Soil organic matter (SOM) was analyzed usingtitrimetric method (Walkley & Black, 1934). The soil organic C (SOC) is thenobtained by dividing the SOM concentration by a factor of 1.724 (Kim, 2005).
Measurements and Calculations
Soil C stock (kg m−2) in each depth was calculated by the following equationas in Wairiu and Lal (2003):
C stock (mg ha−1) = BD ∗ Cconc. ∗ T ∗ CF ∗ 10, (1)
where: Cconc. = carbon concentration (g 100 g−1), BD = bulk den-sity (kg m−3), T = depth thickness (m), and CF = correction factor:1 − (Gravel % + Stone %)/100).
The same equation (Equation 1) was also used for the calculation of TNstock in each depth (mg ha−1). The TC and TN stocks for the profile (1 m)were calculated by adding the stock of each depth. The rate of change TC,SOC, and TN stock over time was computed by subtracting the stocks ofplantation stands from that of natural forest and dividing it by the numberof years since the plantations were established.
Biomass Sampling and Calculations
Discs were taken using a power saw at different stem heights from a numberof harvested trees that represent those exotic and indigenous species usedextensively in the plantation sites. The disc samples were oven dried at70◦C and weighed for their dry weight determination. The volume (cm−3) ofeach disc was computed using the equation �d2/4 and the density of wood(g cm−3) was determined through multiplying the volume by the dry weightof the disc.
The understory vegetation biomass was determined by completelyremoving bushes and herbs from the sub and sub-subplots and, after weigh-ing and recording the total fresh weight, a small sample of known freshweight was oven dried at 70◦C for ≥ 48 hrs. until constant weight wasobtained. The total dry mater of understory vegetation was then calcu-lated. The oven-dried samples of litter, herb, and shrub and bush biomasswere crushed using a grinding mill. The samples were analyzed for theirtotal C and N concentrations by a LECO CHN-1000 Carbon and NitrogenAnalyzer. The biomass of plantation and natural forest was computed usingthe following equations:
Wb = v ∗ Wd, (2)
Dow
nloa
ded
by [
Am
bach
ew D
emes
sie]
at 0
1:55
31
Aug
ust 2
011
Soil Carbon and Nitrogen Stocks Under Plantations 503
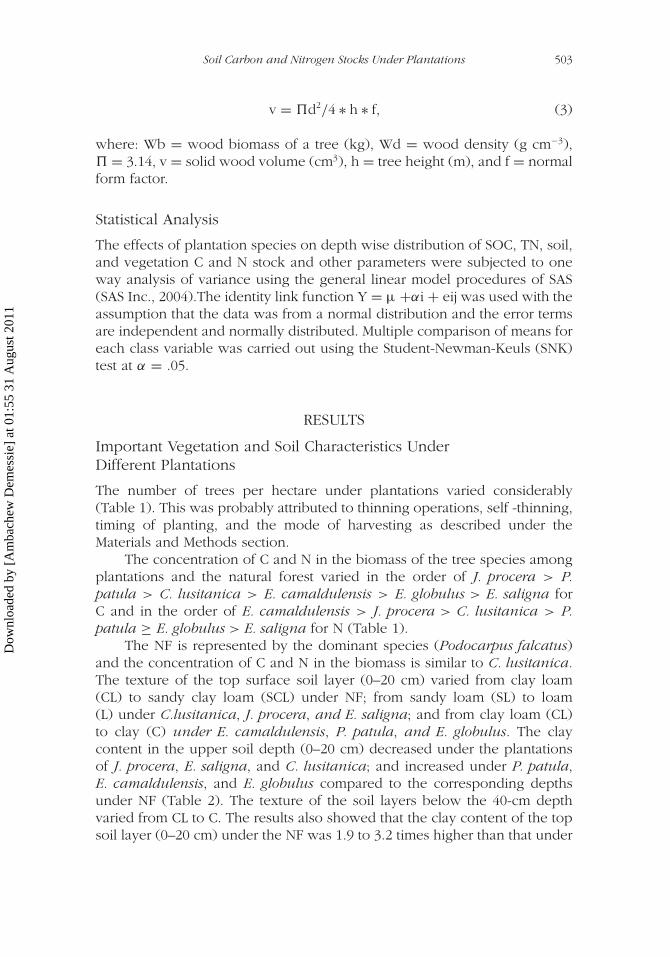
v = �d2/4 ∗ h ∗ f, (3)
where: Wb = wood biomass of a tree (kg), Wd = wood density (g cm−3),� = 3.14, v = solid wood volume (cm3), h = tree height (m), and f = normalform factor.
Statistical Analysis
The effects of plantation species on depth wise distribution of SOC, TN, soil,and vegetation C and N stock and other parameters were subjected to oneway analysis of variance using the general linear model procedures of SAS(SAS Inc., 2004).The identity link function Y = µ +αi + eij was used with theassumption that the data was from a normal distribution and the error termsare independent and normally distributed. Multiple comparison of means foreach class variable was carried out using the Student-Newman-Keuls (SNK)test at α = .05.
RESULTS
Important Vegetation and Soil Characteristics UnderDifferent Plantations
The number of trees per hectare under plantations varied considerably(Table 1). This was probably attributed to thinning operations, self -thinning,timing of planting, and the mode of harvesting as described under theMaterials and Methods section.
The concentration of C and N in the biomass of the tree species amongplantations and the natural forest varied in the order of J. procera > P.patula > C. lusitanica > E. camaldulensis > E. globulus > E. saligna forC and in the order of E. camaldulensis > J. procera > C. lusitanica > P.patula ≥ E. globulus > E. saligna for N (Table 1).
The NF is represented by the dominant species (Podocarpus falcatus)and the concentration of C and N in the biomass is similar to C. lusitanica.The texture of the top surface soil layer (0–20 cm) varied from clay loam(CL) to sandy clay loam (SCL) under NF; from sandy loam (SL) to loam(L) under C.lusitanica, J. procera, and E. saligna; and from clay loam (CL)to clay (C) under E. camaldulensis, P. patula, and E. globulus. The claycontent in the upper soil depth (0–20 cm) decreased under the plantationsof J. procera, E. saligna, and C. lusitanica; and increased under P. patula,E. camaldulensis, and E. globulus compared to the corresponding depthsunder NF (Table 2). The texture of the soil layers below the 40-cm depthvaried from CL to C. The results also showed that the clay content of the topsoil layer (0–20 cm) under the NF was 1.9 to 3.2 times higher than that under
Dow
nloa
ded
by [
Am
bach
ew D
emes
sie]
at 0
1:55
31
Aug
ust 2
011
504 A. Demessie et al.
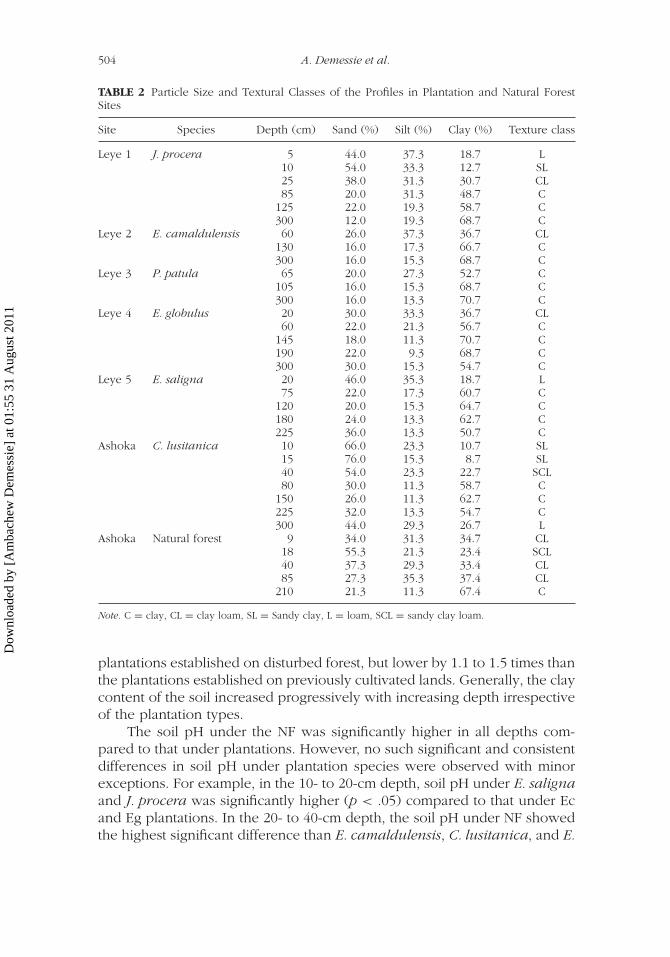
TABLE 2 Particle Size and Textural Classes of the Profiles in Plantation and Natural ForestSites
Site Species Depth (cm) Sand (%) Silt (%) Clay (%) Texture class
Leye 1 J. procera 5 44.0 37.3 18.7 L10 54.0 33.3 12.7 SL25 38.0 31.3 30.7 CL85 20.0 31.3 48.7 C
125 22.0 19.3 58.7 C300 12.0 19.3 68.7 C
Leye 2 E. camaldulensis 60 26.0 37.3 36.7 CL130 16.0 17.3 66.7 C300 16.0 15.3 68.7 C
Leye 3 P. patula 65 20.0 27.3 52.7 C105 16.0 15.3 68.7 C300 16.0 13.3 70.7 C
Leye 4 E. globulus 20 30.0 33.3 36.7 CL60 22.0 21.3 56.7 C
145 18.0 11.3 70.7 C190 22.0 9.3 68.7 C300 30.0 15.3 54.7 C
Leye 5 E. saligna 20 46.0 35.3 18.7 L75 22.0 17.3 60.7 C
120 20.0 15.3 64.7 C180 24.0 13.3 62.7 C225 36.0 13.3 50.7 C
Ashoka C. lusitanica 10 66.0 23.3 10.7 SL15 76.0 15.3 8.7 SL40 54.0 23.3 22.7 SCL80 30.0 11.3 58.7 C
150 26.0 11.3 62.7 C225 32.0 13.3 54.7 C300 44.0 29.3 26.7 L
Ashoka Natural forest 9 34.0 31.3 34.7 CL18 55.3 21.3 23.4 SCL40 37.3 29.3 33.4 CL85 27.3 35.3 37.4 CL
210 21.3 11.3 67.4 C
Note. C = clay, CL = clay loam, SL = Sandy clay, L = loam, SCL = sandy clay loam.
plantations established on disturbed forest, but lower by 1.1 to 1.5 times thanthe plantations established on previously cultivated lands. Generally, the claycontent of the soil increased progressively with increasing depth irrespectiveof the plantation types.
The soil pH under the NF was significantly higher in all depths com-pared to that under plantations. However, no such significant and consistentdifferences in soil pH under plantation species were observed with minorexceptions. For example, in the 10- to 20-cm depth, soil pH under E. salignaand J. procera was significantly higher (p < .05) compared to that under Ecand Eg plantations. In the 20- to 40-cm depth, the soil pH under NF showedthe highest significant difference than E. camaldulensis, C. lusitanica, and E.
Dow
nloa
ded
by [
Am
bach
ew D
emes
sie]
at 0
1:55
31
Aug
ust 2
011
Soil Carbon and Nitrogen Stocks Under Plantations 505
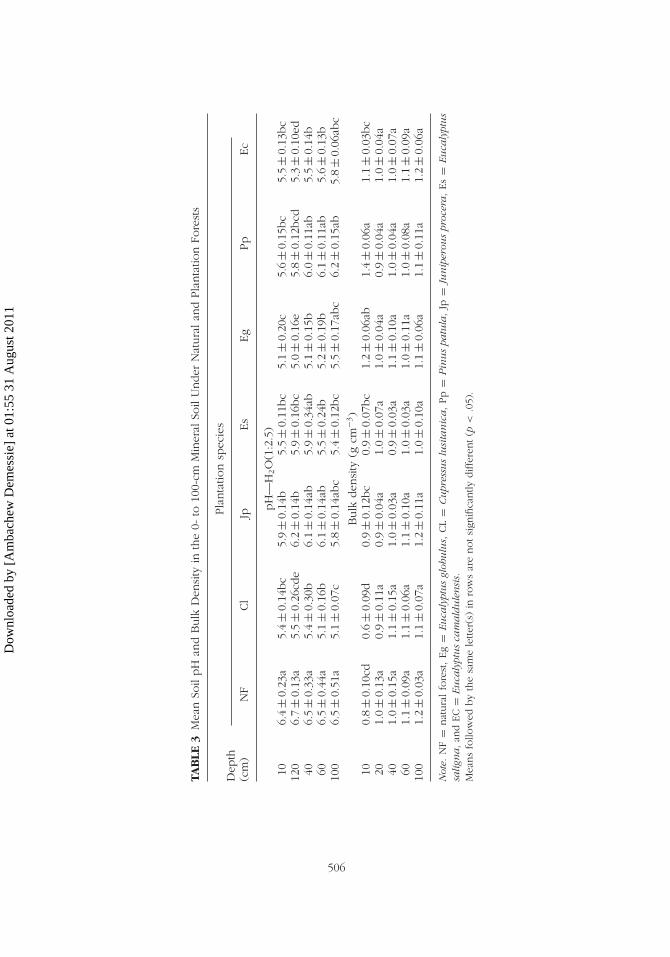
globulus plantations. The difference between plantation species and NF wereobserved only in the upper 0- to 40-cm depths (Table 3). Under Eucalyptusspecies the pH tended to be lower than that under coniferous plantations(J. procera and P. patula), but higher than that under C. lusitanica. In gen-eral, with minor exceptions, the pH under NF and the plantation speciesshowed an increasing trend with increasing soil depth.
The significantly lower soil bulk density (BD) was observed underC. lusitanica and NF compared to that under the remaining plantationspecies in the 0- to 10-cm depth (p < .0001). The BD observed underP. patula did not show significant difference with that under Eg, but wassignificantly higher than that under other plantation species. In the samedepth, the BD under E. globulus was only significantly different from thatunder NF and C. lusitanica. Similarly the BD under E. camaldulensis, E.saligna, and J. procera was significantly higher than that under C. lusitanicaand NF (p < .0001). No significant difference in BD was observed in soilsunder NF and plantation species below the 10-cm depth (Table 3). In gen-eral, the BD increased progressively with increasing depth in all cases up tothe 1-m depth.
Distribution of Total Carbon (TC), Soil Organic Carbon (SOC),and Total Nitrogen (TN) in Soil Profile (1-m Depth) UnderPlantations and Natural Forest (NF)
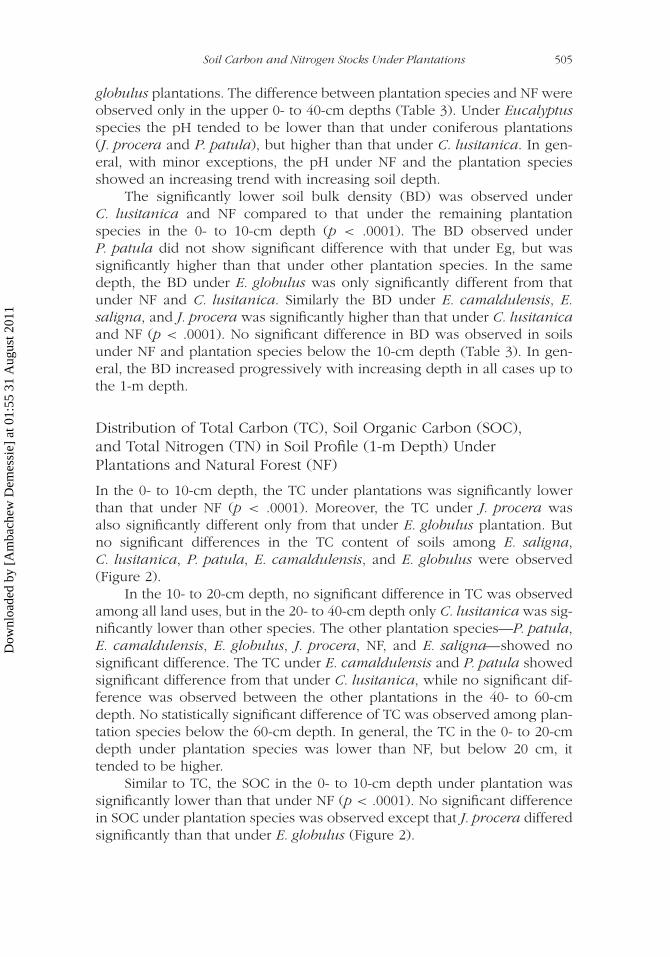
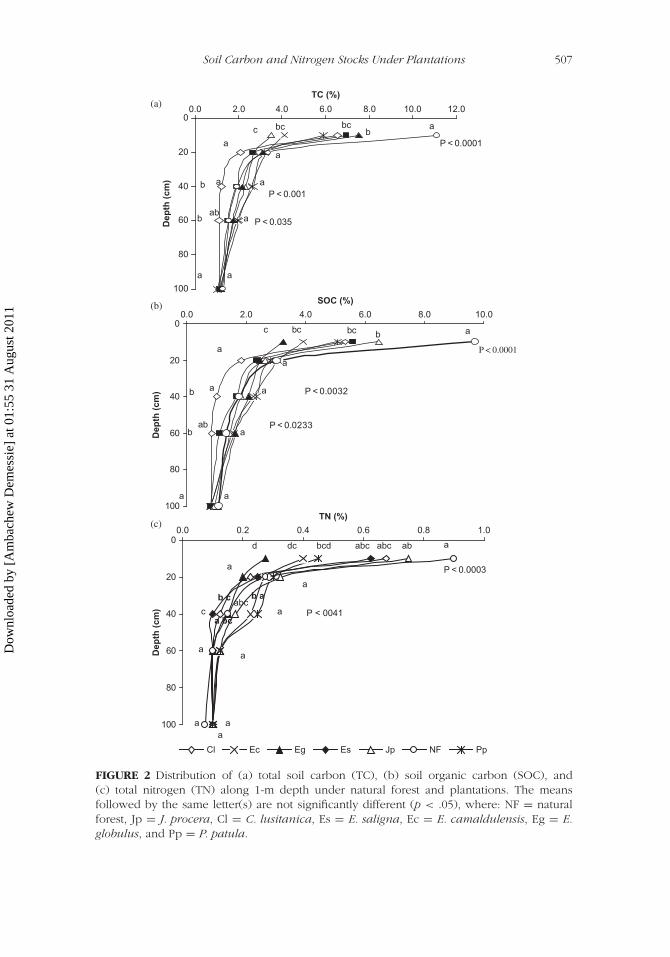
In the 0- to 10-cm depth, the TC under plantations was significantly lowerthan that under NF (p < .0001). Moreover, the TC under J. procera wasalso significantly different only from that under E. globulus plantation. Butno significant differences in the TC content of soils among E. saligna,C. lusitanica, P. patula, E. camaldulensis, and E. globulus were observed(Figure 2).
In the 10- to 20-cm depth, no significant difference in TC was observedamong all land uses, but in the 20- to 40-cm depth only C. lusitanica was sig-nificantly lower than other species. The other plantation species—P. patula,E. camaldulensis, E. globulus, J. procera, NF, and E. saligna—showed nosignificant difference. The TC under E. camaldulensis and P. patula showedsignificant difference from that under C. lusitanica, while no significant dif-ference was observed between the other plantations in the 40- to 60-cmdepth. No statistically significant difference of TC was observed among plan-tation species below the 60-cm depth. In general, the TC in the 0- to 20-cmdepth under plantation species was lower than NF, but below 20 cm, ittended to be higher.
Similar to TC, the SOC in the 0- to 10-cm depth under plantation wassignificantly lower than that under NF (p < .0001). No significant differencein SOC under plantation species was observed except that J. procera differedsignificantly than that under E. globulus (Figure 2).
Dow
nloa
ded
by [
Am
bach
ew D
emes
sie]
at 0
1:55
31
Aug
ust 2
011
TAB
LE3
Mea
nSo
ilpH
and
Bulk
Den
sity
inth
e0-
to10
0-cm
Min
eral
Soil
Under
Nat
ura
lan
dPla
nta
tion
Fore
sts
Pla
nta
tion
spec
ies
Dep
th(c
m)
NF
Cl
JpEs
Eg
Pp
Ec
pH
—H
2O
(1:2
.5)
106.
4±
0.23
a5.
4±
0.14
bc
5.9
±0.
14b
5.5
±0.
11bc
5.1
±0.
20c
5.6
±0.
15bc
5.5
±0.
13bc
120
6.7
±0.
13a
5.5
±0.
26cd
e6.
2±
0.14
b5.
9±
0.16
bc
5.0
±0.
16e
5.8
±0.
12bcd
5.3
±0.
10ed
406.
5±
0.33
a5.
4±
0.30
b6.
1±
0.14
ab5.
9±
0.34
ab5.
1±
0.15
b6.
0±
0.11
ab5.
5±
0.14
b60
6.5
±0.
44a
5.1
±0.
16b
6.1
±0.
14ab
5.5
±0.
24b
5.2
±0.
19b
6.1
±0.
11ab
5.6
±0.
13b
100
6.5
±0.
51a
5.1
±0.
07c
5.8
±0.
14ab
c5.
4±
0.12
bc
5.5
±0.
17ab
c6.
2±
0.15
ab5.
8±
0.06
abc
Bulk
den
sity
(gcm
−3)
100.
8±
0.10
cd0.
6±
0.09
d0.
9±
0.12
bc
0.9
±0.
07bc
1.2
±0.
06ab
1.4
±0.
06a
1.1
±0.
03bc
201.
0±
0.13
a0.
9±
0.11
a0.
9±
0.04
a1.
0±
0.07
a1.
0±
0.04
a0.
9±
0.04
a1.
0±
0.04
a40
1.0
±0.
15a
1.1
±0.
15a
1.0
±0.
03a
0.9
±0.
03a
1.1
±0.
10a
1.0
±0.
04a
1.0
±0.
07a
601.
1±
0.09
a1.
1±
0.06
a1.
1±
0.10
a1.
0±
0.03
a1.
0±
0.11
a1.
0±
0.08
a1.
1±
0.09
a10
01.
2±
0.03
a1.
1±
0.07
a1.
2±
0.11
a1.
0±
0.10
a1.
1±
0.06
a1.
1±
0.11
a1.
2±
0.06
a
Not
e.N
F=
nat
ura
lfo
rest
,Eg
=Eu
caly
ptu
sgl
obu
lus,
CL
=C
upr
essu
slu
sita
nic
a,Pp
=P
inu
spa
tula
,Jp
=Ju
nip
erou
spr
ocer
a,Es
=Eu
caly
ptu
ssa
lign
a,an
dEC
=Eu
caly
ptu
sca
ma
ldu
len
sis.
Mea
ns
follo
wed
by
the
sam
ele
tter
(s)
inro
ws
are
notsi
gnifi
cantly
diffe
rent(p
<.0
5).
506
Dow
nloa
ded
by [
Am
bach
ew D
emes
sie]
at 0
1:55
31
Aug
ust 2
011
Soil Carbon and Nitrogen Stocks Under Plantations 507
0
20
40
60
80
100
0.0 2.0 4.0 6.0 8.0 10.0 12.0
0.0 2.0 4.0 6.0 8.0 10.0
TC (%)
Dep
th (
cm)
ab
ab
bcc bc
aa
aab
ab
aa
(a)
P < 0.0001
P < 0.001
P < 0.035
0
20
40
60
80
100
SOC (%)
Dep
th (
cm)
0.0 0.2 0.4 0.6 0.8 1.00
20
40
60
80
100
Dep
th (
cm)
P < 0.0001
P < 0.0032
P < 0.0233
aa
abab
aab
a
a
abbcbcc
(b)
TN (%)
Cl Ec Eg Es Jp NF Pp
P < 0.0003
P < 0041a bc
aaa
aa
b a
a
b c
c
a
a
aababcabcbcddcd
abc
(c)
FIGURE 2 Distribution of (a) total soil carbon (TC), (b) soil organic carbon (SOC), and(c) total nitrogen (TN) along 1-m depth under natural forest and plantations. The meansfollowed by the same letter(s) are not significantly different (p < .05), where: NF = naturalforest, Jp = J. procera, Cl = C. lusitanica, Es = E. saligna, Ec = E. camaldulensis, Eg = E.globulus, and Pp = P. patula.
Dow
nloa
ded
by [
Am
bach
ew D
emes
sie]
at 0
1:55
31
Aug
ust 2
011
508 A. Demessie et al.
In the 10- to 100-cm depths, no significant difference of SOC concen-tration was observed among NF and plantations, except that SOC under C.lusitanica in the 20- to 60-cm depth was significantly lower than all otherspecies. Similar to TC, SOC under plantation species in the 0- to 20-cm depthwas lower than NF, but in all depths from 20 to 60 cm, it tended to be higherunder plantation species than NF, with minor exceptions within and belowthe 60-cm depth.
TN in the 0- to 10-cm depth, under P. patula, E. camaldulensis, andE. globulus plantations established on previously cultivated lands were sig-nificantly lower than under NF (p < .0001); but TN under J. procera,C. lusitanica, and E. saligna plantations, established on disturbed forest-lands, did not differ significantly with that under NF. Also, under plantationspecies, TN under J. procera was significantly higher than that under E.camaldulensis and E. globulus plantations, while under C. lusitanica and E.saligna it showed a significant difference to that under E. globulus plantation(Figure 2).
In the depths from 20–100 cm, no significant difference in TN concentra-tion was observed between plantation species and NF or among plantationspecies themselves. However, there were a few minor exceptions to this fact.For example, in the 20- to 40-cm depth, TN under P. patula was significantlydifferent from that under C. lusitanica and E. saligna. Also, the TN valuesunder E. camaldulensis differed significantly from that under E. saligna, butno such significant difference was observed between the other plantationspecies (Figure 2).
Generally, the data showed a decreasing trend of TC, SOC, and TNconcentrations from the surface down to the 1-m depth. The larger portionof the TC, SOC, and TN concentrations was confined in the upper 0- to20-cm depth invariably under all sites.
Carbon and Nitrogen Stocks Under Plantations and Natural Forest
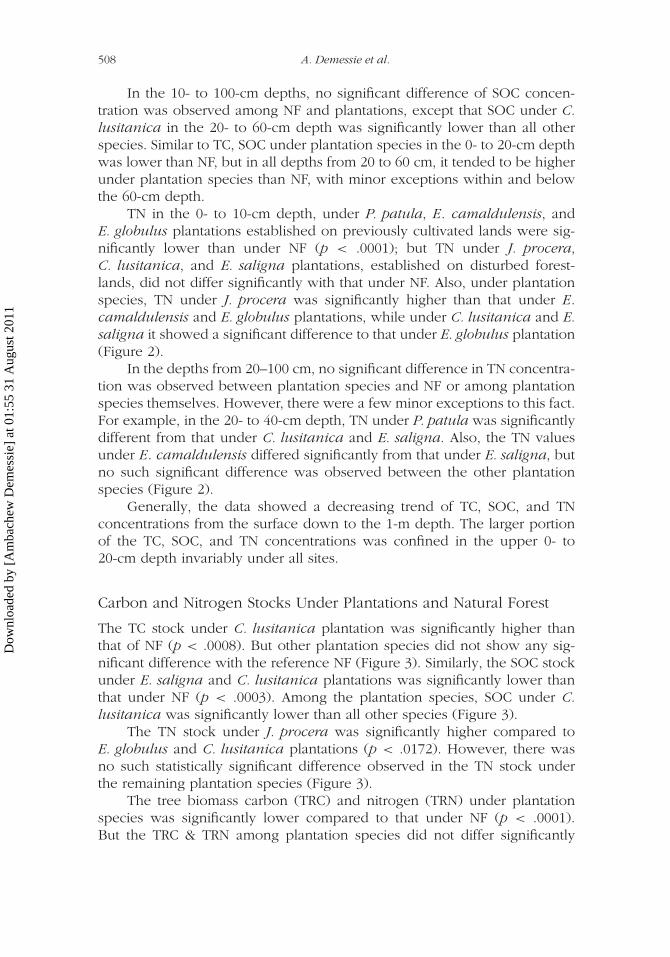
The TC stock under C. lusitanica plantation was significantly higher thanthat of NF (p < .0008). But other plantation species did not show any sig-nificant difference with the reference NF (Figure 3). Similarly, the SOC stockunder E. saligna and C. lusitanica plantations was significantly lower thanthat under NF (p < .0003). Among the plantation species, SOC under C.lusitanica was significantly lower than all other species (Figure 3).
The TN stock under J. procera was significantly higher compared toE. globulus and C. lusitanica plantations (p < .0172). However, there wasno such statistically significant difference observed in the TN stock underthe remaining plantation species (Figure 3).
The tree biomass carbon (TRC) and nitrogen (TRN) under plantationspecies was significantly lower compared to that under NF (p < .0001).But the TRC & TRN among plantation species did not differ significantly
Dow
nloa
ded
by [
Am
bach
ew D
emes
sie]
at 0
1:55
31
Aug
ust 2
011
Soil Carbon and Nitrogen Stocks Under Plantations 509
0.0
5.0
10.0
15.0
20.0
25.0
30.0
NF Cl Jp Es Ec Pp Eg
TC
(kg
m–2
)
aa
aa
a
a
b
(a)
SO
C (
kg m
–2)
0.0
5.0
10.0
15.0
20.0
25.0
NF Cl Jp Es Ec Pp Eg
aab
bcab
c
abab
(b)
NF Cl Jp Es Ec Pp Eg
TN
(kg
m–2
)
ab
0.0
0.5
1.0
1.5
2.0
2.5
NF Cl Jp Es Ec Pp Eg
Plantation species
b
a
ab ab
ab
b
(c)
FIGURE 3 Stocks of (a) total soil carbon (TC), (b) soil organic carbon (SOC), and (c) totalnitrogen (TN) under natural forest and plantations. The means followed by the same letter(s)are not significantly different (p < .05), where: NF = natural forest, Jp = J. procera, Cl = C.lusitanica, Es = E. saligna, Ec = E. camaldulensis, Eg = E. globulus, and Pp = P. patula.
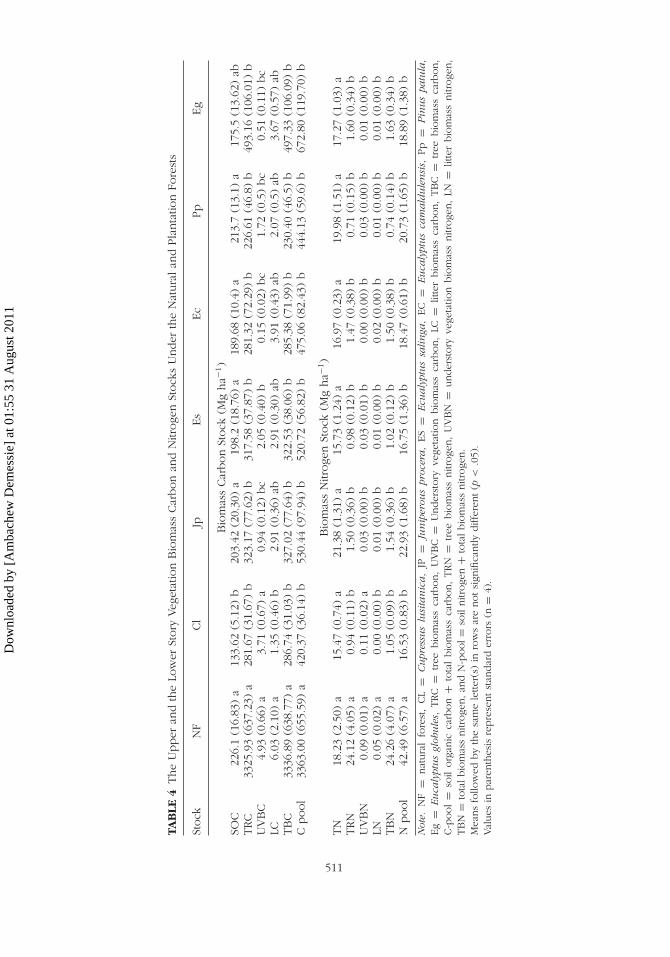
(Table 4). The understory vegetation biomass carbon (UVBC) under NF andC. lusitanica was significantly different compared to E. saligna, P. patula,J. procera, E. globulus, and E. camaldulensis (p < .0001). But there wasno significant difference observed in the UVBC under P. patula, J. procera,E. saligna, and E. camaldulensis plantations (Table 4). Moreover, the lit-ter biomass carbon (LC) under the NF was significantly higher only to that
Dow
nloa
ded
by [
Am
bach
ew D
emes
sie]
at 0
1:55
31
Aug
ust 2
011
510 A. Demessie et al.
under C. lusitanica plantation (p < .0362). No such significant differencewas observed in the litter carbon stock of the remaining plantations(Table 4).
Similar to the UVBC, the understory vegetation biomass nitrogen(UVBN) under C. lusitanica and NF was significantly higher than that underthe rest of plantations (p < .0001). However there was no such significantdifference observed in the UVBN under E. saligna, P. patula, J. procera,E. globulus, and E. camaldulensis plantations (Table 4). The litter biomassnitrogen (LN) under the NF was significantly different from that underthe plantations (p < .0119). The LN under plantations did not show anysignificant difference similar to LC explained above (Table 4).
The total biomass carbon (TBC) and total biomass nitrogen (TBN) underthe Natural Forest were significantly different from that under plantationstands (p < .0001). Total biomass carbon under the NF was nearly 2- to 3-fold higher than that under plantations, while the corresponding differencefor TBN varied from 7- to 10-fold. However, no such statistically signifi-cant difference in the TBC stock among plantation species was observed(Table 4). The TBC and TBN under E. globulus tend to be higher com-pared to the rest of plantations, but the difference was not significant. Themagnitude of TBC under plantations was in the order of E. globulus >
E. saligna > C. lusitanica > J. procera > E. camaldulensis > P. patula andthat of TBN was J. procera > E. globulus > E. camaldulensis > E. saligna >
P. patula > C. lusitanica. The total organic carbon pool (SOC + TBC) andthe total nitrogen pool (soil nitrogen + biomass nitrogen) under plantationspecies was significantly lower compared to the entire NF (p < .0001). Thecarbon pool under C. lusitanica showed the lowest significant differencecompared to P. patula, J. procera, E. saligna, and E. camaldulensis. Therewas no significant carbon pool difference observed between E. globulusand that under C.lusitanica. However, the magnitudes of the nitrogen poolsunder plantations were not significantly different (Table 4).
DISCUSSION
Important Soil Characteristics
The results show variations in the soil texture across the plantation and NFsites primarily in the upper layer. Since the depth of the upper layer in theprofile varies considerably (Table 2), it is difficult to compare the resultswithin plantation species and the natural forest. There is, however, sometendency for lower clay content in the upper layer under plantations estab-lished on previously cultivated soils than those established on disturbedforestlands. Loss of clay content through soil erosion and leaching on previ-ously cultivated (Celik, 2005; Erskine, Mahmoudzadeh, & Myers, 2002) anddisturbed forestlands (Islam & Weil, 2000) caused by the exposure of surface
Dow
nloa
ded
by [
Am
bach
ew D
emes
sie]
at 0
1:55
31
Aug
ust 2
011
TAB
LE4
The
Upper
and
the
Low
erSt
ory
Veg
etat
ion
Bio
mas
sCar
bon
and
Nitr
oge
nSt
ock
sU
nder
the
Nat
ura
lan
dPla
nta
tion
Fore
sts
Stock
NF
Cl
JpEs
Ec
Pp
Eg
Bio
mas
sCar
bon
Stock
(Mg
ha−
1)
SOC
226.
1(1
6.83
)a
133.
62(5
.12)
b20
3.42
(20.
30)
a19
8.2
(18.
76)
a18
9.68
(10.
4)a
213.
7(1
3.1)
a17
5.5
(13.
62)
abTRC
3325
.93
(637
.23)
a28
1.67
(31.
67)
b32
3.17
(77.
62)
b31
7.58
(37.
87)
b28
1.32
(72.
29)
b22
6.61
(46.
8)b
493.
16(1
06.0
1)b
UV
BC
4.93
(0.6
6)a
3.71
(0.6
7)a
0.94
(0.1
2)bc
2.05
(0.4
0)b
0.15
(0.0
2)bc
1.72
(0.5
)bc
0.51
(0.1
1)bc
LC6.
03(2
.10)
a1.
35(0
.46)
b2.
91(0
.36)
ab2.
91(0
.30)
ab3.
91(0
.43)
ab2.
07(0
.5)
ab3.
67(0
.57)
abTBC
3336
.89
(638
.77)
a28
6.74
(31.
03)
b32
7.02
(77.
64)
b32
2.53
(38.
06)
b28
5.38
(71.
99)
b23
0.40
(46.
5)b
497.
33(1
06.0
9)b
Cpool
3363
.00
(655
.59)
a42
0.37
(36.
14)
b53
0.44
(97.
94)
b52
0.72
(56.
82)
b47
5.06
(82.
43)
b44
4.13
(59.
6)b
672.
80(1
19.7
0)b
Bio
mas
sN
itroge
nSt
ock
(Mg
ha−
1)
TN
18.2
3(2
.50)
a15
.47
(0.7
4)a
21.3
8(1
.31)
a15
.73
(1.2
4)a
16.9
7(0
.23)
a19
.98
(1.5
1)a
17.2
7(1
.03)
aTRN
24.1
2(4
.05)
a0.
94(0
.11)
b1.
50(0
.36)
b0.
98(0
.12)
b1.
47(0
.38)
b0.
71(0
.15)
b1.
60(0
.34)
bU
VB
N0.
09(0
.01)
a0.
11(0
.02)
a0.
03(0
.00)
b0.
03(0
.01)
b0.
00(0
.00)
b0.
03(0
.00)
b0.
01(0
.00)
bLN
0.05
(0.0
2)a
0.00
(0.0
0)b
0.01
(0.0
0)b
0.01
(0.0
0)b
0.02
(0.0
0)b
0.01
(0.0
0)b
0.01
(0.0
0)b
TBN
24.2
6(4
.07)
a1.
05(0
.09)
b1.
54(0
.36)
b1.
02(0
.12)
b1.
50(0
.38)
b0.
74(0
.14)
b1.
63(0
.34)
bN
pool
42.4
9(6
.57)
a16
.53
(0.8
3)b
22.9
3(1
.68)
b16
.75
(1.3
6)b
18.4
7(0
.61)
b20
.73
(1.6
5)b
18.8
9(1
.38)
b
Not
e.N
F=
nat
ura
lfo
rest
,CL
=C
upr
essu
slu
sita
nic
a,
JP=
Jun
iper
ous
proc
era,
ES
=Ecu
aly
ptu
ssa
lin
ga,
EC
=Eu
caly
ptu
sca
ma
ldu
len
sis,
Pp
=P
inu
spa
tula
,Eg
=Eu
caly
ptu
sgl
obu
les,
TRC
=tree
bio
mas
sca
rbon,
UV
BC
=U
nder
story
vege
tatio
nbio
mas
sca
rbon,
LC=
litte
rbio
mas
sca
rbon,
TBC
=tree
bio
mas
sca
rbon,
C-p
ool
=so
ilorg
anic
carb
on
+to
tal
bio
mas
sca
rbon,
TRN
=tree
bio
mas
snitr
oge
n,
UV
BN
=under
story
vege
tatio
nbio
mas
snitr
oge
n,
LN=
litte
rbio
mas
snitr
oge
n,
TB
N=
tota
lbio
mas
snitr
oge
n,an
dN
-pool=
soil
nitr
oge
n+
tota
lbio
mas
snitr
oge
n.
Mea
ns
follo
wed
by
the
sam
ele
tter
(s)
inro
ws
are
notsi
gnifi
cantly
diffe
rent(p
<.0
5).
Val
ues
inpar
enth
esis
repre
sentst
andar
der
rors
(n=
4).
511
Dow
nloa
ded
by [
Am
bach
ew D
emes
sie]
at 0
1:55
31
Aug
ust 2
011
512 A. Demessie et al.
soils during the vegetation clearance (Edeso, Merino, Gonzalez, & Marauri,1999; Limbrey, 1978) could explain these variations.
Soil pH under plantation species was significantly lower than under NF,which could be attributed to either leaching of cations under preparationand establishment or there could be a lower supply of cations from themonoculture plantations as compared to diverse vegetation species underNF. Plantations acidify the soil by accumulating basic cations in the for-est biomass, increasing production of organic acids from decomposing litterand increasing leaching cations by organic acids (Nsabimana, Klemedtson,Kaplin, & Wallin, 2008). The presence of organic acids that have major rolein soil acidification mainly in surface soil horizon is a direct effect of the con-tinuous litter supply of the vegetation. Betre et al. (2000) reported that nativeforest had significantly (p < .05) higher pH than the plantation of C. lusitan-ica, P. patula, and Eucalyptus species in Ethiopia which is consistent withthe result obtained in this study. Also among plantation species, Eucalyptusspecies showed lower pH than coniferous J. procera or P. patula species(Table 3). Soil pH beneath Eucalyptus plantations has also been shown todecline from 5.9 to 5.0 in 8 yr in Hawaii (Rhoades & Binkley, 1996). UnderEucalyptus plantations in India, soil pH was lower because soils under suchplantations are subjected more to the action of environmental factors, wherethe oblong shape of the canopy leads the rain to form big drops of throughfall and enhance leaching of cations and hence lower pH (Balagoplan, Mary,Sankar, & Alexander, 1991). The lowest pH under conifer species P. patulamay be attributed to the acidifying effect caused by low molecular organicacids produced in the litter of softwood species, which inhibit the rate ofdecomposition (Lundgren, 1978).
Distribution of SOC and N at 1-m Depth Under Plantationsand Natural Forest
Our results show that the SOC and N under NF and plantations were invari-ably higher in the top 0- to 20-cm soil depth and decreased progressivelydownward to the 1-m depth. The results are consistent with those reportedfor the nearby site (Lemenih et al., 2005) and elsewhere (Christopher, Lal, &Mishra, 2009; Russell, Raich, Valverde-Barrantes, & Fisher, 2007). For exam-ple, in the nearby site of the study area, Lemenih et al. (2005) reported thatthe larger portion of C and N was confined to the 0- to 10- and 10- to 20-cmdepths. Similarly, as described by Christopher et al. (2009), the SOC and Nconcentrations were greater in the surface 0- to 5-cm soil in no till (NT)than under conventional tillage (CT) in the Midwestern United States. Also,Russell et al. (2007) argued that the larger portion of SOC and N was accu-mulated in the upper 0- to 15-cm soil layer following the planting of trees inan abandoned pasture at La Selva Biological Station, Costa Rica.
The higher SOC and N in the upper layers relative to the lower depthis attributed to the continuous supply of litter, reduced rate of disturbance,
Dow
nloa
ded
by [
Am
bach
ew D
emes
sie]
at 0
1:55
31
Aug
ust 2
011
Soil Carbon and Nitrogen Stocks Under Plantations 513
little erosion impact (Erskine et al., 2002), and lower temperature under thecanopy of the closed forest (Kirschbaum, 1995) that may reduce decom-position favoring an increase in residence time of soil organic matter.Temperature affects directly by promoting microbial activity and indirectlyby altering soil moisture and the quantity and quality of organic matterinputs to the soil (Chapin, Matson, & Mooney, 2002).The conditions con-ducive to rapid decomposition and mineralization that can be accompaniedby hydrologic factors responsible for removing soil organic nutrients (Qualls,2000) include soil moisture and good aeration (about 60 % of pore spacesfilled with water), and warm temperature (25 to 35◦C) and near neutral pH(Brady & Weil, 2004). However, this study indicates that the pH varied from5.1 under E. globulus to 6.4 under NF, which was slightly acidic in the uppersoil layer of 0- to 10-cm depth that may limit biochemical degradation oforganic matter through the activity of microorganisms.
The data showed that the soil organic carbon and total nitrogen con-centration under the natural forest was higher compared to the plantations.This can be explained by the contribution of the more diverse componentsof the vegetation, the relatively neutral soil pH, and the nonexistence of soildisturbance under the NF compared to the pure stands of plantations thatendure human interference. The decreased concentration of SOC and N inthe lower layers of the 1-m profile in both land uses (plantation and NF)can be explained by the reduced leaching and erosion in the forest floor.The plantation or the NF floor is well-shielded by the mulch that is contin-uously supplied with considerable amounts of litter and the closed canopyof the plantations and the vegetation in the NF. Nevertheless, our findingrevealed that the NF was superior in both understory vegetation stock andlitter biomass that may effectively intercept the through fall and reduce itseffect in leaching the dissolved carbon to a deeper depth and eventuallyremoving it from the ecosystem. Also, adsorption is more likely responsi-ble for maintaining DOC substrate concentrations in the mineral soil andpreventing its loss into streams (Qualls & Haines, 1992).
Carbon and Nitrogen Stocks Under Natural Forest and Plantations
The results of this study show that the C and N stocks under plantations weresignificantly lower than those under the NF. Soils under C. lusitanica exhibitthe lowest C and N stocks compared to the reference as well as the remain-ing plantation species. This may be partly ascribed to the lower clay contentand bulk density along the profile compared to the other plantation sites.Also, the Cupressus plantation was at the harvesting stage where the matureage has negatively influenced the quantity and quality of the stand’s litterproduction capability. This was manifested by the lower detritus mass andthe corresponding SOC and TN concentration along the depth. The data indi-cated that the quantity of SOC stock correlates to the amount of litter mass inthe forest floor (p < .05). Hence, this phenomenon among others—like age,
Dow
nloa
ded
by [
Am
bach
ew D
emes
sie]
at 0
1:55
31
Aug
ust 2
011
514 A. Demessie et al.
topography, and the nature of the species—may have negatively influencedthe SOC and TN stocks under C. lusitanica to be the lowest compared tothe reference and the other plantation species. Despite that no significantdifference existed in the C and N stocks sequestered between plantations(excluding C. lusitanica), there is a tendency that the coniferous species(P. patula and J. procera) accrue more stock compared to the Eucalyptusspecies. Among the Eucalyptus species, the C and N stocks under E. camal-dulensis were superior to those under E. globulus and E. saligna. The minordifference in the age of plantation and the mode of plantation establish-ment (on disturbed NF and on previously cultivated lands) showed littleeffect on the accrual of C and N stocks. The result was consistent withthat reported by Vesterdal, Ritter, and Gundersen (2002). They found thatQuercus robur sequestered 2 mg C ha−1, Picea abies sequestered approxi-mately 9 mg C ha−1 in forest floors over 29 yr, while the adjacent 200-yr-oldplantation sequestered 81 mg C ha−1 after establishment of these species onarable land.
The establishment of plantations on either the disturbed or previouslycultivated land had reduced the tree and total biomass carbon and nitro-gen compared to the reference NF. This may be due to the difference inthe species combination and higher age of trees under the NF relative tothe younger age and pure stands of plantations. However, all plantations,excluding C. lusitanica, sequestered more SOC than agroforestry and farm-land of 30 yr of cultivation (Demessie et al., 2009). Our finding showed thatthe understory vegetation biomass C and N under the reference NF and C.lusitanica plantation was higher than the remaining plantations. The higherunderstory vegetation biomass C under C. lusitanica was attributed to theeffect of thinning operations that reduce the number of trees with the aimof providing enough growing space before harvest. This resulted in wideopenings in the canopy similar to that of the NF that favors the growingof the understory vegetation. However, the understory biomass N under theremaining plantations was small, and hence its contribution to the C and Nstock is negligible. In addition to this, the plantations varied in their litterbiomass under the forest floor, the largest being under the NF. Litter biomassbecomes lower as trees mature, and this, coupled with the smaller num-ber of trees ha−1 at C. lusitanica stand, may explain the lower SOC stockunderneath.
CONCLUSION
The conversion of the NF to plantation reduced the SOC and TN stocks.But the difference in the stocks among plantation species was not statisti-cally significant. The results show that J. procera (the native species) and P.patula sequestered higher SOC than Eucalyptus species. Nevertheless, the
Dow
nloa
ded
by [
Am
bach
ew D
emes
sie]
at 0
1:55
31
Aug
ust 2
011
Soil Carbon and Nitrogen Stocks Under Plantations 515
Eucalyptus species did not negatively affect the SOC and TN stocks giventhe shorter rotation cycle, and the poor undergrowth emanated from poorlight penetration due to high canopy closure, especially at an early coppicingstage.
The concentration of SOC and TN was highest in the 0- to 10-cm depthand decreased progressively to the 1-m depth at all sites. Among the plan-tation species, J. procera showed higher SOC and TN in all depths than theother plantation species. However, the differences in SOC and TN distribu-tion among plantation species below the 10-cm depth were only minor.
Higher SOC sequestration under J. procera and P. patula suggests thatthese species could be used to reclaim degraded lands in this region orelsewhere with similar soil and climatic conditions and will rehabilitate thelosses of SOC and TN under abandoned lands.
REFERENCES
Allen, J. C., & Barnes, D. F. (1985). The causes of deforestation in developingcountries. Annals of the Association of American Geographers, 75, 163–184.
Amare, G., Feyisa, A., & Belay, G. (1990). A brief history of Forestry Research Center(FRC) and forestry research in Ethiopia. Addis Ababa, Ethiopia: FRC.
Balagoplan, M. T., Mary, T. P., Sankar, M. V., & Alexander, T. G. (1991). Soil prop-erties in teak, bomxax and eucalyptus plantation of Tichur Forest Division.Journal of Tropical Forest Sciences, 5, 26–34.
Betre, A., Mamo, T., & Larsson, R. (2000). Effects of natural forest conversion to plan-tation and secondary forests on soil chemical properties in Munessa montaneforest, Ethiopia. Ethiopian Journal of Natural Resources, 2, 165–187.
Brady, N. C., & Weil, R. R. (2004). Soil water characteristics and behavior. In N. C.Brady & R. R. Weil (Eds.), Elements of the nature and properties of soils (pp.134–161). Upper Saddle River, NJ: Pearson Prentice Hall.
Celik, I. (2005). Land-use effects on organic matter and physical properties of soilin a southern Mediterranean highland of Turkey. Soil & Tillage Research, 83,270–277.
Chapin, F. S., Matson, P. A., & Mooney, H. A. (2002). Principles of terrestrialecosystem ecology. New York, NY: Springer-Verlag.
Chen, X. (2006). Tree diversity, carbon storage, and soil nutrient in an old-growthforest at Changbai Mountain, Northeast China. Communications in Soil Scienceand Plant Analysis, 37 , 363–375.
Christopher, S. F., Lal, R., & Mishra, U. (2009). Regional study of no-till effects oncarbon sequestration in the Midwestern United States. Soil Science Society ofAmerica Journal, 73, 207.
Darkoh, M. B. K. (1998). The nature, causes and consequences of desertification inthe drylands of Africa. Land Degradation & Development, 9, 1–20.
Demessie, A., Singh, B. R., & Lal, R. (2009). Soil carbon and nitrogen stocks underchronosequence of land use change in Gambo district, southern Ethiopia.Manuscript submitted for publication.
Dow
nloa
ded
by [
Am
bach
ew D
emes
sie]
at 0
1:55
31
Aug
ust 2
011
516 A. Demessie et al.
Edeso, J. M., Merino, A., Gonzalez, M. J., & Marauri, P. (1999). Soil erosion underdifferent harvesting managements in steep forestlands from Northern Spain.Land Degradation & Development, 10, 79–88.
Erskine,W. D., Mahmoudzadeh, A., & Myers, C. (2002). Land use effects on sedimentyields and soil loss rates in small basins of Triassic sandstone near Sydney, NSW,Australia. Catena, 49, 271–287.
Gindaba, J., Rozanov, A., & Negash, L. (2005). Photosynthetic gas exchange, growthand biomass allocation of two Eucalyptus and three indigenous tree species ofEthiopia under moisture deficit. Forest Ecology and Management, 205, 127–138.
Islam, K. R., & Weil, R. R. (2000). Land use effects on soil quality in a tropical forestecosystem of Bangladesh. Agriculture, Ecosystems and Environment, 79, 9–16.
Kim, H. T. (2005). Soil sampling, preparation, and analysis (2nd ed.). Boca Raton,FL: Taylor & Francis Group.
Kirby, K. R., & Potvin, C. (2007). Variation in carbon storage among tree species:Implications for the management of a small-scale carbon sink project. ForestEcology and Management, 246 , 208–221.
Kirschbaum, M. U. F. (1995). The temperature dependence of soil organic matterdecomposition, and the effect of global warming on soil organic C storage. SoilBiology and Biochemistry, 27 , 753–760.
Lal, R. (2005). Forest soils and carbon sequestration. Forest Ecology andManagement, 220, 242–258.
Lemenih, M., Lemma, B., & Teketay, D. (2005). Changes in soil carbon and totalnitrogen following reforestation of previously cultivated land in the highlandsof Ethiopia. SINET: Ethiopian Journal of Science, 28, 99–108.
Limbrey, S. (1978). Changes in quality and distribution of the soils of lowlandBritain. In S. Limbrey & J. G. Evans (Eds.), The effect of man on the land-scape: The Lowland Zone (CBA Research Report No. 21, pp. 21–26). London,United Kingdom: Chameleon Press.
Lundgren, B. (1978). Soil conditions and nutrient cycling under natural and plan-tation forests in Tanzanian Highlands (Department of Soils Report No. 31).Uppsala, Sweden: Swedish University of Agricultural Sciences.
Malmer, A. (1996). Hydrological effects and nutrient losses of forest plantation estab-lishment on tropical rainforest land in Sabah, Malaysia. Journal of Hydrology,174, 129–148.
Montagnini, F., & Nair, P. K. R. (2004). Carbon sequestration: An underex-ploited environmental benefit of agroforestry systems. Agroforestry Systems, 61,281–295.
Montagnini, F., & Porras, C. 1998. Evaluating the role of plantations as carbon sinks:An example of an integrative approach from the humid tropics. EnvironmentalManagement, 22, 459–470.
Nsabimana, D., Klemedtson, L., Kaplin, B. A., & Wallin, G. (2008). Soil carbon andnutrient accumulation under forest plantations in southern Rwanda. AfricanJournal of Environmental Science and Technology, 2, 142–149.
Parrotta, A. (1992). The role of plantation forests in rehabilitating degraded tropicalecosystems. Agriculture, Ecosystems and Environment, 41, 115–133.
Paul, K. I., Polglase, P. J., Nyakuengama, J. G., & Khanna, P. K. (2002). Changein soil carbon following afforestation. Forest Ecology and Management, 168,241–257.
Dow
nloa
ded
by [
Am
bach
ew D
emes
sie]
at 0
1:55
31
Aug
ust 2
011
Soil Carbon and Nitrogen Stocks Under Plantations 517
Qualls, R. G. (2000). Comparison of the behavior of soluble organic and inorganicnutrients in forest soils. Forest Ecology and Management, 138, 29–50.
Qualls, R., & Haines, G. B. L. 1992. Biodegradability of dissolved organic matterin forest throughfall, soil solution, and stream water. Soil Science Society ofAmerica Journal, 56 , 578–586.
Resh, S. C., Binkley, D., & Parrotta, J. A. (2002). Greater soil carbon sequestrationunder nitrogen-fixing trees compared with Eucalyptus species. Ecosystems, 5,217–231.
Rhoades, C., & Binkley, D. (1996). Factors influencing decline in soil pH in HawaiianEucalyptus and Albizia plantations. Forest Ecology and Management, 80, 47–56.
Russell, A. E., Raich, J. W., Valverde-Barrantes, O. J., & Fisher, R. F. (2007). Treespecies effects on soil properties in experimental plantations in tropical moistforest. Soil Science Society of America Journal, 71, 1389.
SAS. (2004). SAS/Procedure Guide, Release SAS 9.1.3 Service Pack 1. Cary, NC: SASInstitute Inc.
Senbeta, F., Teketay, D, & Naslund, B.-A. (2002). Native woody species regenerationin exotic tree plantations at Munessa-Shashemene Forest, southern Ethiopia.New Forests, 24, 131–145.
Soil Survey Staff. (1999). Soil taxonomy: A basic system of soil classification formaking and interpreting soil surveys (2nd ed., United States Department ofAgriculture Handbook No. 436). Washington, DC: U.S. Government PrintingOffice.
Sollins, P. (1998). Factors influencing species composition in tropical lowland rainforest: Does the soil matter? Ecology, 79, 23–30.
Solomon, D., Fritzsche, F., Lehmann, J., Tekalign, M., & Zech, W. (2002). Soil organicmatter dynamics in the subhumid agroecosystems of the Ethiopian highlands:Evidence from natural C-13 abundance and particle-size fractionation. SoilScience Society of America Journal, 66 , 969–978.
Taddese, G. (2001). Land degradation:A challenge to Ethiopia. EnvironmentalManagement, 27 , 815–824 .
Teketay, D. (2001). Deforestation, wood famine, and environmental degradation inEthiopia’s highland ecosystems. Northeast African Studies, 8, 53–76.
Vagen, T. G., Lal, R., & Singh, B. R. (2005). Soil carbon sequestration in sub-SaharanAfrica: A review. Land Degradation & Development, 16 , 53–71.
Vesterdal, L., Ritter, E., & Gundersen, P. (2002). Change in soil organic carbon fol-lowing afforestation of former arable land. Forest Ecology and Management,169, 137–147.
Wairiu, M., & Lal, R. (2003). Soil organic carbon in relation to cultivation and topsoilremoval on sloping lands of Kolombangara, Solomon Islands. Soil & TillageResearch, 70, 19–27.
Walkley, A. I., & Black, A. (1934). An examination of the Degtjareff method fordetermining soil organic matter, and a proposed modification of the chromicacid titration method. Soil Science, 37 , 29.
Wubet, T., Kottke, I., Teketay, D., & Oberwinkler, F. (2003). Mycorrhizal status ofindigenous trees in dry Afromontane forests of Ethiopia. Forest Ecology andManagement, 179, 387–399.
Dow
nloa
ded
by [
Am
bach
ew D
emes
sie]
at 0
1:55
31
Aug
ust 2
011


