Embed Size (px)
Citation preview
_____________________________________________________________________________________________________ *Corresponding author: Email: [email protected];
Journal of Scientific Research & Reports 5(1): 32-46, 2015; Article no.JSRR.2015.072
ISSN: 2320-0227
SCIENCEDOMAIN international www.sciencedomain.org
Soil Fertility and Crop Yield Variability under Major Soil and Water Conservation Technologies in the
Usambara Mountains, Tanzania
S. B. Mwango1*, B. M. Msanya1, P. W. Mtakwa1, D. N. Kimaro2, J. Deckers3, J. Poesen3, J. L. Meliyo1 and S. Dondeyne3
1Department of Soil Science, Sokoine University of Agriculture, P.O.Box 3008 Chuo Kikuu, Morogoro,
Tanzania. 2Department of Agricultural Engineering and Land Planning, Sokoine University of Agriculture,
P.O.Box 3003 Chuo Kikuu, Morogoro, Tanzania. 3Department of Earth and Environmental Sciences, KU Leuven, Celestijnenlaan 200 E,
B-3001 Heverlee, Belgium.
Authors’ contributions
This work was carried out in collaboration between all authors. Author SBM designed the study, wrote
the protocol, conducted field work, performed statistical analysis, and wrote the first draft of the manuscript. Author BMM designed the study, conducted field work, managed the literature searches and edited drafts. Author PWM designed the study, conducted field work and edited drafts. Authors DNK, JD and JP designed the study and edited drafts. Author JLM conducted field work. Author SD
edited drafts. All authors read and approved the final manuscript.
Article Information
DOI: 10.9734/JSRR/2015/13692 Editor(s):
(1) Lesław Juszczak, University of Agriculture in Krakow, Poland. Reviewers:
(1) Tunira Bhadauria, Department of Zoology, Kanpur University, U .P, India. (2) Anélia Marais, Western Cape Department of Agriculture, Institute for Plant Production, Private Bag X1, Elsenburg 7607,
South Africa. (3) Anonymous, Kyushu University, Japan.
Complete Peer review History: http://www.sciencedomain.org/review-history.php?iid=747&id=22&aid=7188
Received 28th
August 2014 Accepted 17th October 2014
Published 15th
December 2014
ABSTRACT
Indigenous soil and water conservation (SWC) technologies such as miraba (rectangular grass strip bounds that do not necessarily follow contours) and micro ridges have been used widely in the Usambara Mountains, Tanzania. However, their strengths and limitations to crop productivity have not been investigated. This study aimed to determine soil fertility and crop yield variability under
Original Research Article
Mwango et al.; JSRR, 5(1): 32-46, 2015; Article no.JSRR.2015.072
33
miraba, micro ridges and bench terraces as a way to explore and compare these SWC technologies. A survey was carried out in Majulai watershed (with Acrisols as dominant soils) which is highly affected by soil degradation due to water erosion. Composite soil samples were collected from 0 - 30 cm depth in upper, middle and lower segments within bench terraces, micro ridges and miraba at the upper, mid and lower slopes of the watershed. Contents of most soil nutrients (e.g. available P, K
+, Ca
2+ and Mg
2+) and maize grain yields varied significantly (P=.05) between SWC
technologies, with the trend: bench terraces > micro ridges >miraba>control (fields with no SWC measures). Similarly under all SWC technologies soil fertility and maize grain yields varied significantly (P=.05) with slope position, showing the trend: lower slopes > mid slopes > upper slopes. Moreover, soil fertility and maize grain yields varied significantly (P=.05) between segments of the studied SWC technologies except for bench terraces. The trends for both soil fertility and maize grain yields were as follows: lower segments > middle segments > upper segments under micro ridges; lower segments > upper segments > middle segments under miraba. These observations call for management strategies and technological adjustments that would reduce pattern and magnitude of spatial variations of soil nutrients and crop yields under miraba and micro ridges for improved crop production in the Usambara Mountains.
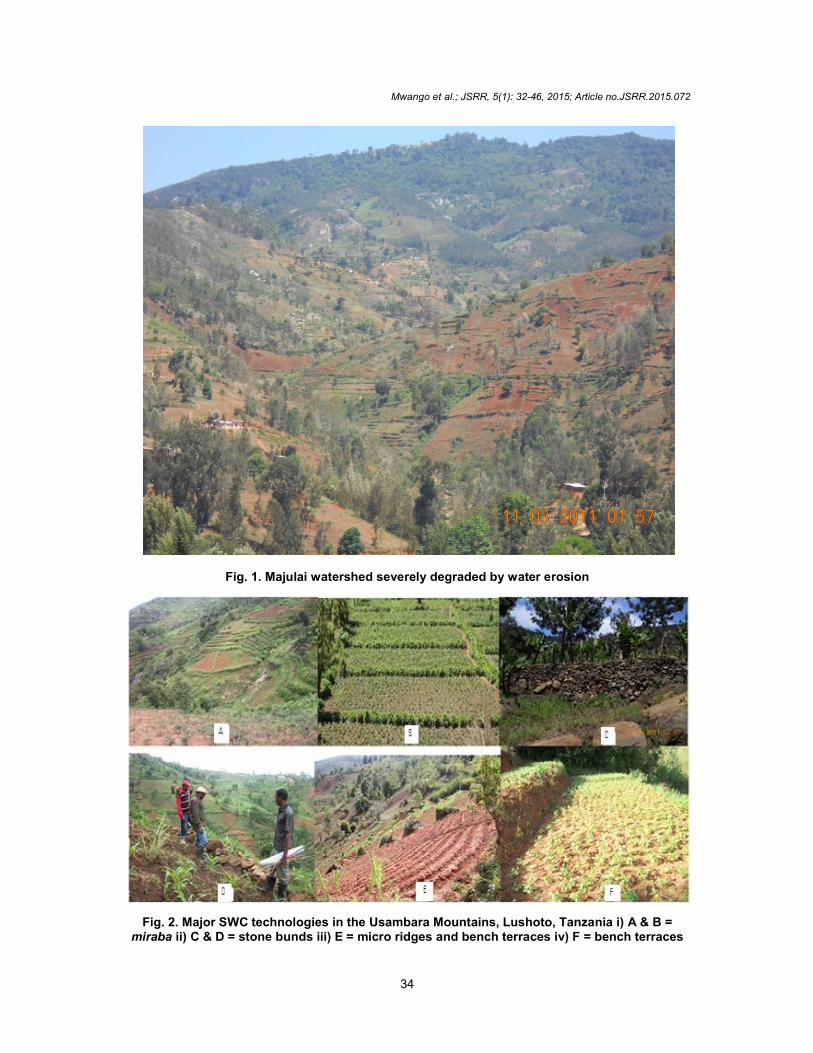
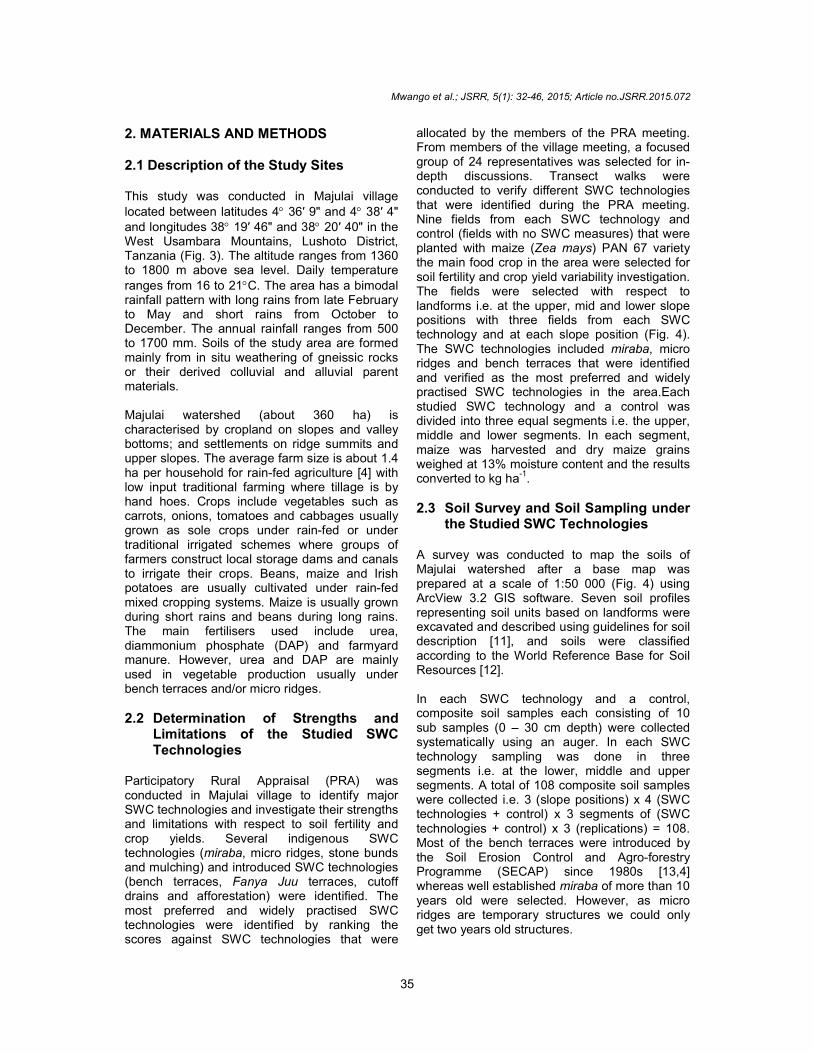
Keywords: Soil erosion; soil nutrients; bench terraces; micro ridges; miraba. 1. INTRODUCTION The Usambara Mountains which are located in north eastern Tanzania cover an area of about 2625 sq. km and have an altitude ranging from 1000 to 2270 m a.s.l. These mountains are highly dissected with moderately steep to very steep slopes, and are highly affected by land degradation [1]. Majulai village for example (Fig. 1) is typical of those villages most affected by different forms of soil erosion in the area [2] which is experiencing a decline in soil fertility, deterioration of soil quality and reduced soil productivity [3]. These have adverse impacts on economic and social development [4]. Local farmers have developed indigenous soil and water conservation (SWC) measures such as ‘miraba’ (rectangular grass stripbounds that do not necessarily follow contours), micro ridges and stone bunds (Fig. 2) as an integral part of their farming systems, while rejecting or minimally adopting introduced SWC technologies [5]. According to Msita [6], miraba are uniquely preferred and are widely practised in the Usambara Mountains. They are characterised by a wide spacing of grass strips across the slope. Usually the spacing depends on the size of farm plots. Micro ridges are small ridges of about 10 cm high and 10 cm wide constructed perpendicular to slope, with narrow furrows
between them. Their lengths depend on the size of farm plots.Despite of their wide application in the study area, the potential of their contribution to conservation agriculture i.e. “a concept for resource-saving agricultural crop production that strives to achieve acceptable profits together with high and sustained production levels while concurrently conserving the environment” [7], has not been fully exploited. Although grass strips and stone bunds have been documented to develop progressive terraces by accumulating sediment behind these structures [8,9], still some of these technologies have been criticized in some countries for triggering soil fertility variability which causes spatial and temporal variability of crop response to applied fertilisers [8,10]. This study aims to evaluate the variability of chemical soil fertility and crop yields under bench terraces, micro ridges and miraba in order to explore and compare their strengths and limitations in small holder farming conditions in Majulai village, West Usambara Mountains, Lushoto, Tanzania. The specific objectives were: i) to investigate farmers’ understanding of the mentioned SWC technologies ii) to determine the magnitude of soil fertility variability between and within the studied SWC technologies iii) to evaluate the influence of slope positions on soil fertility variability under the studied SWC technologies iv) to investigate crop performance within the studied SWC technologies.
Mwango et al.; JSRR, 5(1): 32-46, 2015; Article no.JSRR.2015.072
34
Fig. 1. Majulai watershed severely degraded by water erosion
Fig. 2. Major SWC technologies in the Usambara Mountains, Lushoto, Tanzania i) A & B = miraba ii) C & D = stone bunds iii) E = micro ridges and bench terraces iv) F = bench terraces
Mwango et al.; JSRR, 5(1): 32-46, 2015; Article no.JSRR.2015.072
35
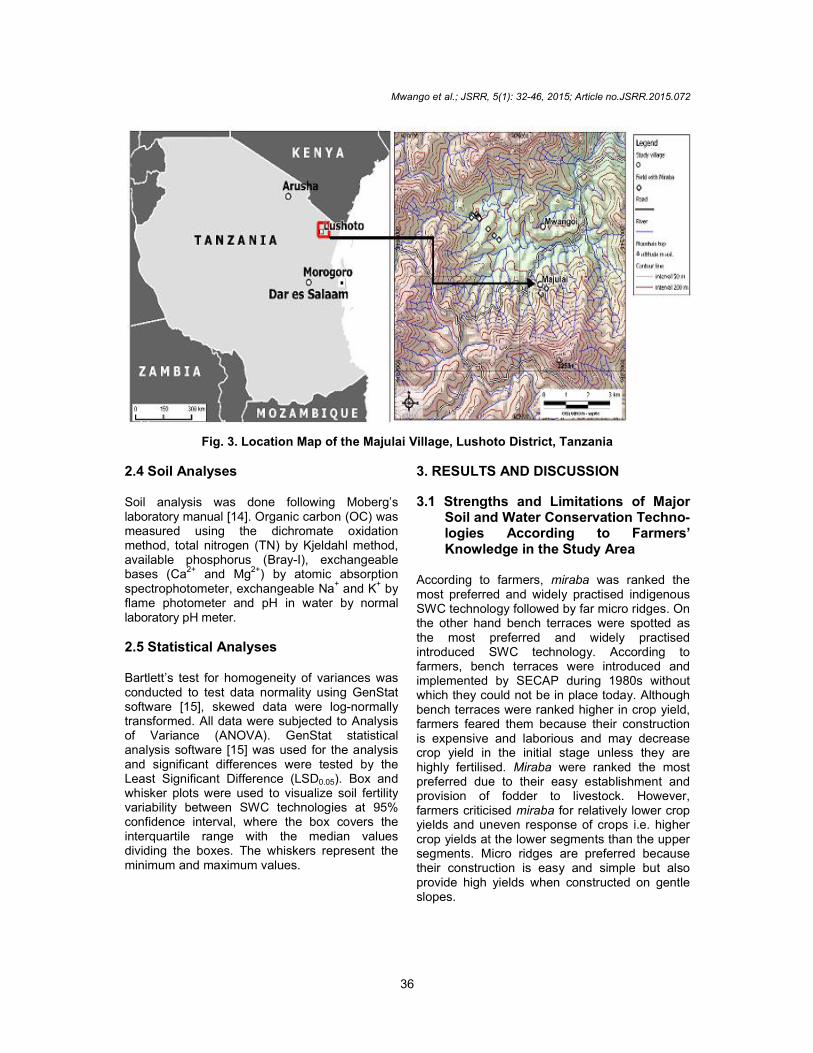
2. MATERIALS AND METHODS 2.1 Description of the Study Sites This study was conducted in Majulai village located between latitudes 4 36′ 9" and 4 38′ 4" and longitudes 38 19′ 46" and 38 20′ 40" in the West Usambara Mountains, Lushoto District, Tanzania (Fig. 3). The altitude ranges from 1360 to 1800 m above sea level. Daily temperature ranges from 16 to 21C. The area has a bimodal rainfall pattern with long rains from late February to May and short rains from October to December. The annual rainfall ranges from 500 to 1700 mm. Soils of the study area are formed mainly from in situ weathering of gneissic rocks or their derived colluvial and alluvial parent materials. Majulai watershed (about 360 ha) is characterised by cropland on slopes and valley bottoms; and settlements on ridge summits and upper slopes. The average farm size is about 1.4 ha per household for rain-fed agriculture [4] with low input traditional farming where tillage is by hand hoes. Crops include vegetables such as carrots, onions, tomatoes and cabbages usually grown as sole crops under rain-fed or under traditional irrigated schemes where groups of farmers construct local storage dams and canals to irrigate their crops. Beans, maize and Irish potatoes are usually cultivated under rain-fed mixed cropping systems. Maize is usually grown during short rains and beans during long rains. The main fertilisers used include urea, diammonium phosphate (DAP) and farmyard manure. However, urea and DAP are mainly used in vegetable production usually under bench terraces and/or micro ridges.
2.2 Determination of Strengths and Limitations of the Studied SWC Technologies
Participatory Rural Appraisal (PRA) was conducted in Majulai village to identify major SWC technologies and investigate their strengths and limitations with respect to soil fertility and crop yields. Several indigenous SWC technologies (miraba, micro ridges, stone bunds and mulching) and introduced SWC technologies (bench terraces, Fanya Juu terraces, cutoff drains and afforestation) were identified. The most preferred and widely practised SWC technologies were identified by ranking the scores against SWC technologies that were
allocated by the members of the PRA meeting. From members of the village meeting, a focused group of 24 representatives was selected for in-depth discussions. Transect walks were conducted to verify different SWC technologies that were identified during the PRA meeting. Nine fields from each SWC technology and control (fields with no SWC measures) that were planted with maize (Zea mays) PAN 67 variety the main food crop in the area were selected for soil fertility and crop yield variability investigation. The fields were selected with respect to landforms i.e. at the upper, mid and lower slope positions with three fields from each SWC technology and at each slope position (Fig. 4). The SWC technologies included miraba, micro ridges and bench terraces that were identified and verified as the most preferred and widely practised SWC technologies in the area.Each studied SWC technology and a control was divided into three equal segments i.e. the upper, middle and lower segments. In each segment, maize was harvested and dry maize grains weighed at 13% moisture content and the results converted to kg ha
-1.
2.3 Soil Survey and Soil Sampling under the Studied SWC Technologies
A survey was conducted to map the soils of Majulai watershed after a base map was prepared at a scale of 1:50 000 (Fig. 4) using ArcView 3.2 GIS software. Seven soil profiles representing soil units based on landforms were excavated and described using guidelines for soil description [11], and soils were classified according to the World Reference Base for Soil Resources [12]. In each SWC technology and a control, composite soil samples each consisting of 10 sub samples (0 – 30 cm depth) were collected systematically using an auger. In each SWC technology sampling was done in three segments i.e. at the lower, middle and upper segments. A total of 108 composite soil samples were collected i.e. 3 (slope positions) x 4 (SWC technologies + control) x 3 segments of (SWC technologies + control) x 3 (replications) = 108. Most of the bench terraces were introduced by the Soil Erosion Control and Agro-forestry Programme (SECAP) since 1980s [13,4] whereas well established miraba of more than 10 years old were selected. However, as micro ridges are temporary structures we could only get two years old structures.
Mwango et al.; JSRR, 5(1): 32-46, 2015; Article no.JSRR.2015.072
36
Fig. 3. Location Map of the Majulai Village, Lushoto District, Tanzania
2.4 Soil Analyses Soil analysis was done following Moberg’s laboratory manual [14]. Organic carbon (OC) was measured using the dichromate oxidation method, total nitrogen (TN) by Kjeldahl method, available phosphorus (Bray-I), exchangeable bases (Ca2+ and Mg2+) by atomic absorption spectrophotometer, exchangeable Na
+ and K
+ by
flame photometer and pH in water by normal laboratory pH meter.
2.5 Statistical Analyses Bartlett’s test for homogeneity of variances was conducted to test data normality using GenStat software [15], skewed data were log-normally transformed. All data were subjected to Analysis of Variance (ANOVA). GenStat statistical analysis software [15] was used for the analysis and significant differences were tested by the Least Significant Difference (LSD0.05). Box and whisker plots were used to visualize soil fertility variability between SWC technologies at 95% confidence interval, where the box covers the interquartile range with the median values dividing the boxes. The whiskers represent the minimum and maximum values.
3. RESULTS AND DISCUSSION 3.1 Strengths and Limitations of Major
Soil and Water Conservation Techno-logies According to Farmers’ Knowledge in the Study Area
According to farmers, miraba was ranked the most preferred and widely practised indigenous SWC technology followed by far micro ridges. On the other hand bench terraces were spotted as the most preferred and widely practised introduced SWC technology. According to farmers, bench terraces were introduced and implemented by SECAP during 1980s without which they could not be in place today. Although bench terraces were ranked higher in crop yield, farmers feared them because their construction is expensive and laborious and may decrease crop yield in the initial stage unless they are highly fertilised. Miraba were ranked the most preferred due to their easy establishment and provision of fodder to livestock. However, farmers criticised miraba for relatively lower crop yields and uneven response of crops i.e. higher crop yields at the lower segments than the upper segments. Micro ridges are preferred because their construction is easy and simple but also provide high yields when constructed on gentle slopes.
Mwango et al.; JSRR, 5(1): 32-46, 2015; Article no.JSRR.2015.072
37
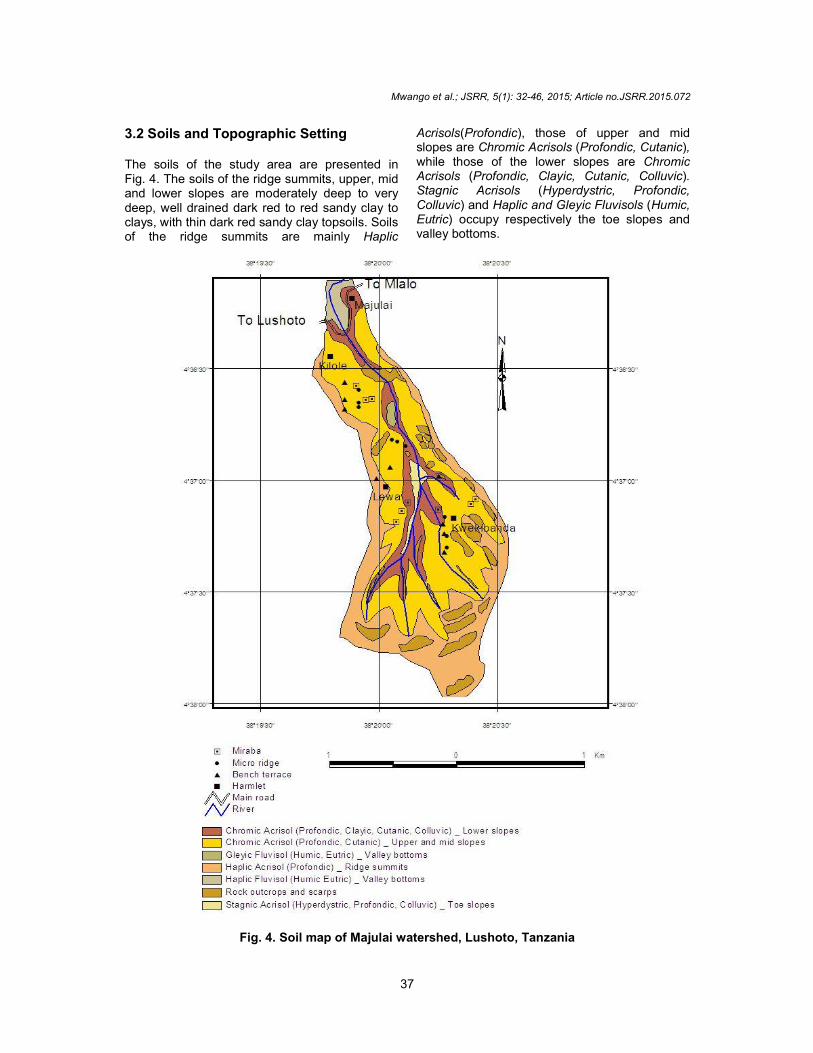
3.2 Soils and Topographic Setting The soils of the study area are presented in Fig. 4. The soils of the ridge summits, upper, mid and lower slopes are moderately deep to very deep, well drained dark red to red sandy clay to clays, with thin dark red sandy clay topsoils. Soils of the ridge summits are mainly Haplic
Acrisols(Profondic), those of upper and mid slopes are Chromic Acrisols (Profondic, Cutanic), while those of the lower slopes are Chromic Acrisols (Profondic, Clayic, Cutanic, Colluvic). Stagnic Acrisols (Hyperdystric, Profondic, Colluvic) and Haplic and Gleyic Fluvisols (Humic, Eutric) occupy respectively the toe slopes and valley bottoms.
Fig. 4. Soil map of Majulai watershed, Lushoto, Tanzania
Mwango et al.; JSRR, 5(1): 32-46, 2015; Article no.JSRR.2015.072
38
3.3 Soil Fertility Variability between the Studied SWC Technologies
Soil fertility levels in the studied SWC technologies are presented in Table 1. The soil fertility levels were significantly (P = .05) different between the studied SWC technologies. Higher pH was observed under bench terraces and micro ridges than under miraba and control; organic carbon was higher under miraba than under bench terraces, micro ridges and control; and total N content was higher under micro ridges than under control. The higher OC content under miraba can be explained by the presence of grass strips that form miraba which on decomposition contribute substantially to the OC content in the soil. P content was higher under bench terraces and micro ridges than under miraba and control while Ca2+ content was higher under bench terraces than under miraba and control and was higher under micro ridges than under the control. Mg
2+ content was higher under
bench terraces and miraba than under micro ridges and control. Generally, the soil fertility status in the studied SWC technologies followed the trend: bench terraces > micro ridges >miraba >control. This observation is strongly supported by Fig. 4 where the studied SWC technologies in each slope position were on the same soil type (Chromic Acrisol (Profondic, Cutanic)). Thus the observed differences in soil properties in Table 1 have developed as a result of the studied SWC technologies’ intervention. The higher contents of most of nutrients under bench terraces are probably due to the fact that bench terraces (Fig. 2F) are nearly level surfaces supported by grass barrier that prevents soil nutrients from being washed out by runoff. A similar observation was reported by Kyaruzi [16] where bench terraces influenced soil chemical
properties such as pH, total N, OC, CEC, Ca2+
and Mg2+. Micro ridges (Fig. 2E) are spaced closely together, and are too small to resist heavy runoff in areas with very steep slopes like the study area. However, the furrows associated with micro ridges act as reservoirs which prevent soil nutrients from being washed out by runoff. This observation is also supported by Kabanza et al. [17] who reported ridge furrows to effectively prevent runoff and soil losses. The higher soil fertility status under bench terraces and micro ridges when compared with miraba and control can partly be explained by land use and management practices where bench terraces and micro ridges are usually used for cultivation of vegetables in which fertilisers such as urea and DAP are frequently applied. The low soil fertility status under miraba can be explained by the fact that the surfaces under miraba are not leveled while also the wide spacing of grass strips (Fig. 2B) provide a running track that accelerate runoff velocity thereby washing away soil nutrients. This is strongly supported by Kaswamila [18] who hypothesised that grass strip spacing is an important aspect in soil conservation planning i.e. the closer the strips, the more effective they become and vice versa.
3.4 Effects of Topographic Slope Positions on Soil Fertility Variability under the Studied SWC Techno-logies
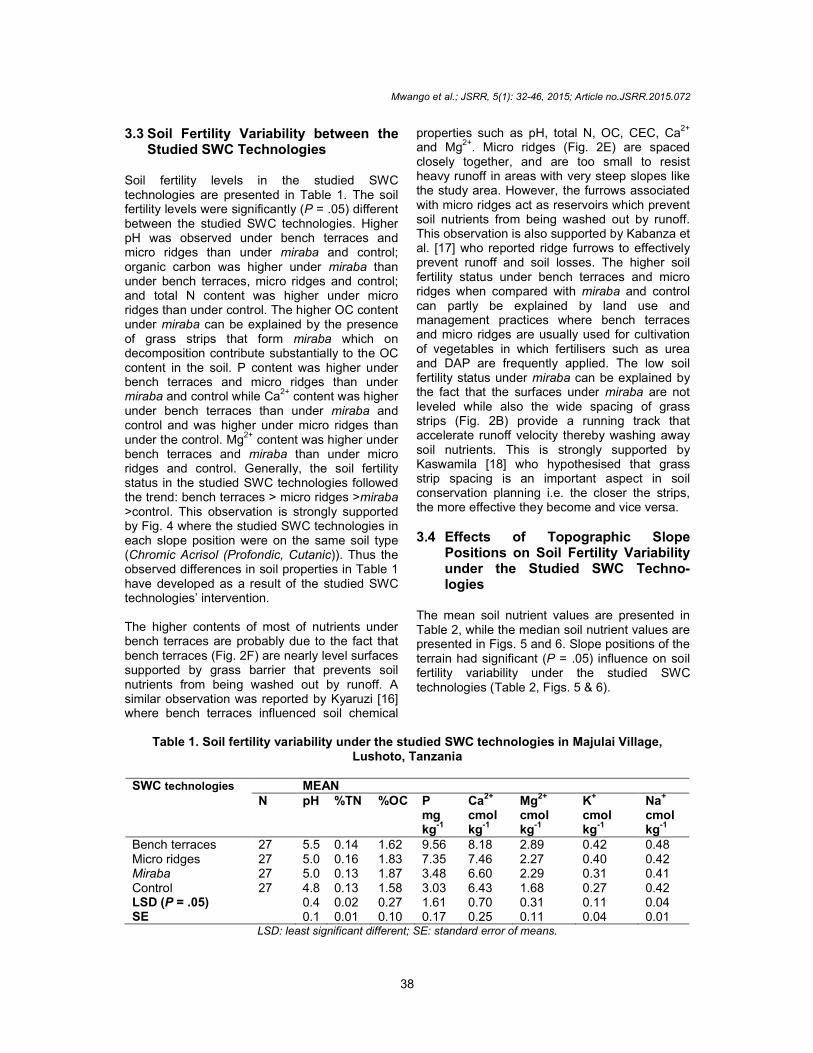
The mean soil nutrient values are presented in Table 2, while the median soil nutrient values are presented in Figs. 5 and 6. Slope positions of the terrain had significant (P = .05) influence on soil fertility variability under the studied SWC technologies (Table 2, Figs. 5 & 6).
Table 1. Soil fertility variability under the studied SWC technologies in Majulai Village,
Lushoto, Tanzania
SWC technologies MEAN N pH %TN %OC P
mg kg-1
Ca2+ cmol kg-1
Mg2+ cmol kg-1
K+ cmol kg-1
Na+ cmol kg-1
Bench terraces 27 5.5 0.14 1.62 9.56 8.18 2.89 0.42 0.48 Micro ridges 27 5.0 0.16 1.83 7.35 7.46 2.27 0.40 0.42 Miraba 27 5.0 0.13 1.87 3.48 6.60 2.29 0.31 0.41 Control 27 4.8 0.13 1.58 3.03 6.43 1.68 0.27 0.42 LSD (P = .05) 0.4 0.02 0.27 1.61 0.70 0.31 0.11 0.04 SE 0.1 0.01 0.10 0.17 0.25 0.11 0.04 0.01
LSD: least significant different; SE: standard error of means.
Mwango et al.; JSRR, 5(1): 32-46, 2015; Article no.JSRR.2015.072
39
Table 2. The effect of slope positions on soil fertility variability under the studied SWC technologies in Majulai Village, Lushoto, Tanzania
SWC technologies
N Slope position
Mean pH %
TN % OC
P mg kg-1
Ca2+ cmol kg-1
Mg2+ cmol kg-1
K+ cmol kg-1
Na+ cmol kg-1
Bench terraces 9 Upper slope 5.3 0.1 1.5 4.0 8.0 2.7 0.5 0.5 9 Mid slope 5.2 0.1 1.7 11.0 8.0 2.7 0.4 0.5 9 Lower slope 6.1 0.2 1.7 21.0 9.0 3.3 0.4 0.4 27 Mean 5.5 0.1 1.6 12.0 8.3 2.9 0.4 0.5
Micro ridges 9 Upper slope 5.1 0.2 1.9 5.0 8.0 2.1 0.4 0.5 9 Mid slope 4.9 0.1 1.8 6.0 7.0 2.1 0.4 0.4 9 Lower slope 4.9 0.2 1.9 13.0 8.0 2.6 0.4 0.4 27 Mean 5.0 0.2 1.9 8.0 7.7 2.3 0.4 0.4
Miraba 9 Upper slope 5.5 0.1 1.7 3.0 7.0 2.9 0.3 0.4 9 Mid slope 4.8 0.1 1.8 3.0 6.0 1.9 0.3 0.4 9 Lower slope 4.8 0.1 2.0 5.0 7.0 2.1 0.4 0.4 27 Mean 5.0 0.1 1.8 3.7 6.7 2.3 0.3 0.4
Control 9 Upper slope 4.9 0.1 1.6 2.0 7.0 1.6 0.3 0.5 9 Mid slope 4.5 0.1 1.4 3.0 6.0 1.5 0.3 0.4 9 Lower slope 5.1 0.2 1.8 5.0 7.0 2.0 0.3 0.4 27 Mean 4.8 0.1 1.6 3.3 6.7 1.7 0.3 0.4
LSD (P = .05) 0.6 0.03 0.5 2.3 1.2 0.5 0.2 0.1 SE 0.2 0.01 0.2 0.3 0.4 0.2 0.1 0.02
LSD: least significant different; SE: standard error of means
Fig. 5. The influence of slope positions (P = .05) on soil fertility variability under the studied SWC technologies in Majulai Village, Lushoto, Tanzania. (Key: CO, Control; MB, Miraba, MR,
Micro ridges and BT, Bench terraces; LS, Lower slope; MS, Mid slope; US, Upper slope)
6.0
MR
US
5.0
MR
MS
4.0
MR
LS
MB
US
MB
MS
MB
LS
CO
US
CO
MS
CO
LS
5.5
BT
US
BT
MS
BT
LS
4.5
6.5
Soil
pH
3.0
MR
US
2.0
MR
MS
1.0
MR
LS
MB
US
MB
MS
MB
LS
CO
US
CO
MS
CO
LS
2.5
BT
US
BT
MS
BT
LS
1.5
Org
an
ic C
arb
on
%
120
80
MR
US
40
MR
MS
0
MR
LS
MB
US
MB
MS
MB
LS
CO
US
CO
MS
CO
LS
60
BT
US
BT
MS
BT
LS
20
100
Ava
ilab
le P
ho
sph
oru
s m
g/k
g
0.22
0.17
MR
US
0.12
MR
MS
0.07
MR
LS
MB
US
MB
MS
MB
LS
CO
US
CO
MS
0.25
CO
LS
0.15
BT
US
BT
MS
BT
LS
0.10
0.20
To
tal N
itro
ge
n %
Mwango et al.; JSRR, 5(1): 32-46, 2015; Article no.JSRR.2015.072
40
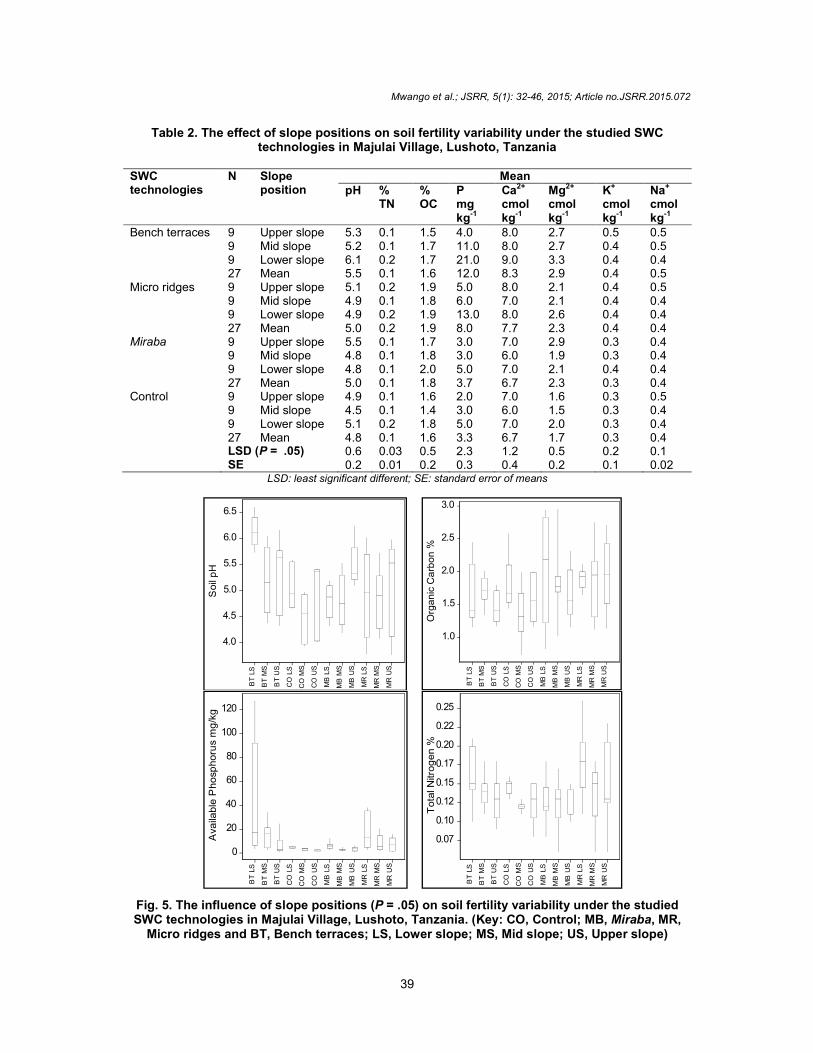
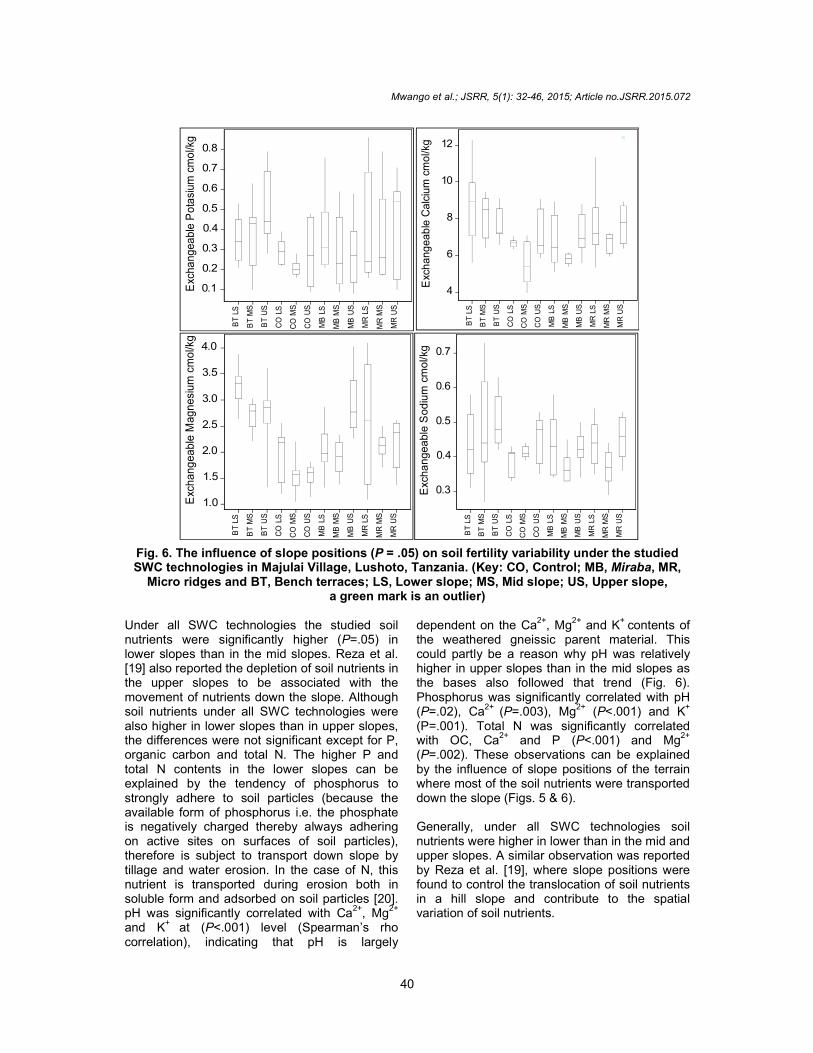
Fig. 6. The influence of slope positions (P = .05) on soil fertility variability under the studied SWC technologies in Majulai Village, Lushoto, Tanzania. (Key: CO, Control; MB, Miraba, MR,
Micro ridges and BT, Bench terraces; LS, Lower slope; MS, Mid slope; US, Upper slope, a green mark is an outlier)
Under all SWC technologies the studied soil nutrients were significantly higher (P=.05) in lower slopes than in the mid slopes. Reza et al. [19] also reported the depletion of soil nutrients in the upper slopes to be associated with the movement of nutrients down the slope. Although soil nutrients under all SWC technologies were also higher in lower slopes than in upper slopes, the differences were not significant except for P, organic carbon and total N. The higher P and total N contents in the lower slopes can be explained by the tendency of phosphorus to strongly adhere to soil particles (because the available form of phosphorus i.e. the phosphate is negatively charged thereby always adhering on active sites on surfaces of soil particles), therefore is subject to transport down slope by tillage and water erosion. In the case of N, this nutrient is transported during erosion both in soluble form and adsorbed on soil particles [20]. pH was significantly correlated with Ca
2+, Mg
2+
and K+ at (P<.001) level (Spearman’s rho correlation), indicating that pH is largely
dependent on the Ca2+
, Mg2+
and K+
contents of the weathered gneissic parent material. This could partly be a reason why pH was relatively higher in upper slopes than in the mid slopes as the bases also followed that trend (Fig. 6). Phosphorus was significantly correlated with pH (P=.02), Ca2+ (P=.003), Mg2+ (P<.001) and K+ (P=.001). Total N was significantly correlated with OC, Ca
2+ and P (P<.001) and Mg
2+
(P=.002). These observations can be explained by the influence of slope positions of the terrain where most of the soil nutrients were transported down the slope (Figs. 5 & 6). Generally, under all SWC technologies soil nutrients were higher in lower than in the mid and upper slopes. A similar observation was reported by Reza et al. [19], where slope positions were found to control the translocation of soil nutrients in a hill slope and contribute to the spatial variation of soil nutrients.
0.7
0.5
MR
US
0.3
MR
MS
0.1
MR
LS
MB
US
MB
MS
MB
LS
CO
US
CO
MS
0.8
CO
LS
0.4
BT
US
BT
MS
BT
LS
0.2
0.6E
xcha
ng
ea
ble
Pota
sium
cm
ol/k
g
MR
US
10
MR
MS
6
MR
LS
MB
US
MB
MS
MB
LS
CO
US
CO
MS
CO
LS
BT
US
8
BT
MS
BT
LS
12
4
Exc
ha
ng
ea
ble
Ca
lciu
m c
mo
l/kg
4.0
3.0M
R U
S
2.0
MR
MS
1.0
MR
LS
MB
US
MB
MS
MB
LS
CO
US
CO
MS
CO
LS
2.5
BT
US
BT
MS
BT
LS
1.5
3.5
Exc
ha
ng
ea
ble
Ma
gn
esi
um
cm
ol/k
g
0.7
MR
US
0.5
MR
MS
0.3
MR
LS
MB
US
MB
MS
MB
LS
CO
US
CO
MS
CO
LS
0.6
BT
US
BT
MS
BT
LS
0.4
Exc
ha
ng
ea
ble
So
diu
m c
mo
l/kg
Mwango et al.; JSRR, 5(1): 32-46, 2015; Article no.JSRR.2015.072
41
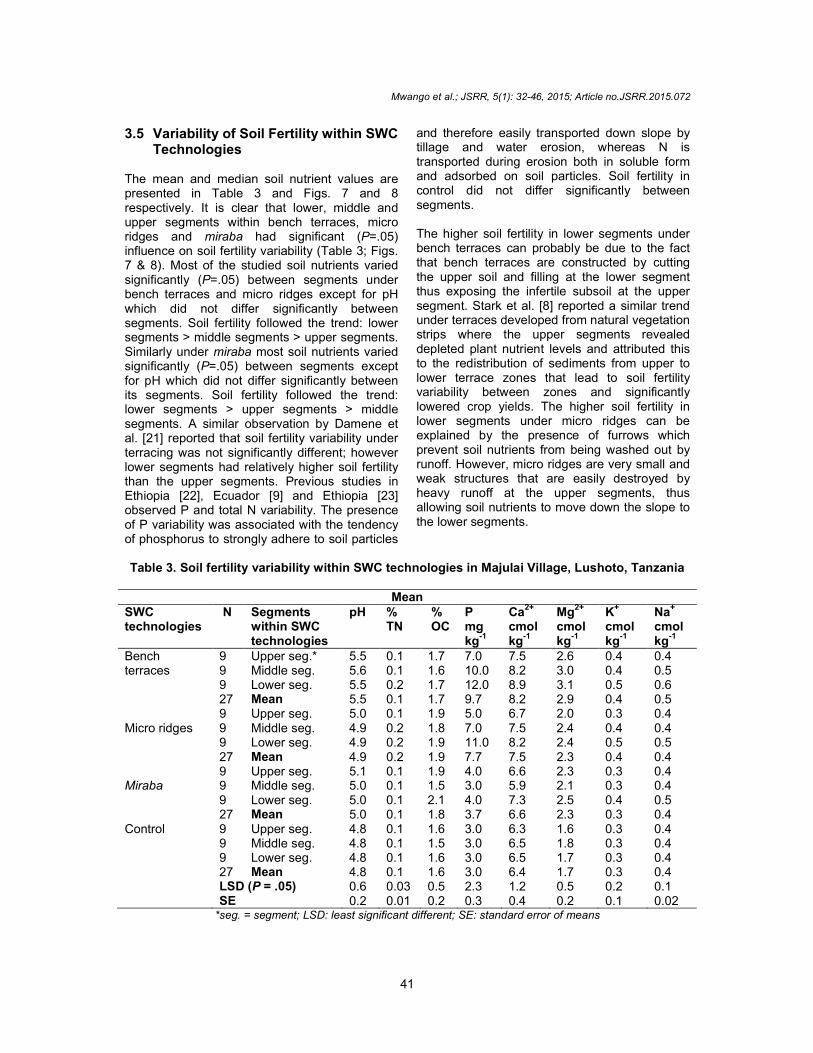
3.5 Variability of Soil Fertility within SWC Technologies
The mean and median soil nutrient values are presented in Table 3 and Figs. 7 and 8 respectively. It is clear that lower, middle and upper segments within bench terraces, micro ridges and miraba had significant (P=.05) influence on soil fertility variability (Table 3; Figs. 7 & 8). Most of the studied soil nutrients varied significantly (P=.05) between segments under bench terraces and micro ridges except for pH which did not differ significantly between segments. Soil fertility followed the trend: lower segments > middle segments > upper segments. Similarly under miraba most soil nutrients varied significantly (P=.05) between segments except for pH which did not differ significantly between its segments. Soil fertility followed the trend: lower segments > upper segments > middle segments. A similar observation by Damene et al. [21] reported that soil fertility variability under terracing was not significantly different; however lower segments had relatively higher soil fertility than the upper segments. Previous studies in Ethiopia [22], Ecuador [9] and Ethiopia [23] observed P and total N variability. The presence of P variability was associated with the tendency of phosphorus to strongly adhere to soil particles
and therefore easily transported down slope by tillage and water erosion, whereas N is transported during erosion both in soluble form and adsorbed on soil particles. Soil fertility in control did not differ significantly between segments. The higher soil fertility in lower segments under bench terraces can probably be due to the fact that bench terraces are constructed by cutting the upper soil and filling at the lower segment thus exposing the infertile subsoil at the upper segment. Stark et al. [8] reported a similar trend under terraces developed from natural vegetation strips where the upper segments revealed depleted plant nutrient levels and attributed this to the redistribution of sediments from upper to lower terrace zones that lead to soil fertility variability between zones and significantly lowered crop yields. The higher soil fertility in lower segments under micro ridges can be explained by the presence of furrows which prevent soil nutrients from being washed out by runoff. However, micro ridges are very small and weak structures that are easily destroyed by heavy runoff at the upper segments, thus allowing soil nutrients to move down the slope to the lower segments.
Table 3. Soil fertility variability within SWC technologies in Majulai Village, Lushoto, Tanzania
Mean
SWC technologies
N Segments within SWC technologies
pH % TN
% OC
P mg kg
-1
Ca2+
cmol kg
-1
Mg2+
cmol kg
-1
K+
cmol kg
-1
Na+
cmol kg
-1
Bench terraces
9 Upper seg.* 5.5 0.1 1.7 7.0 7.5 2.6 0.4 0.4 9 Middle seg. 5.6 0.1 1.6 10.0 8.2 3.0 0.4 0.5 9 Lower seg. 5.5 0.2 1.7 12.0 8.9 3.1 0.5 0.6 27 Mean 5.5 0.1 1.7 9.7 8.2 2.9 0.4 0.5
Micro ridges
9 Upper seg. 5.0 0.1 1.9 5.0 6.7 2.0 0.3 0.4 9 Middle seg. 4.9 0.2 1.8 7.0 7.5 2.4 0.4 0.4 9 Lower seg. 4.9 0.2 1.9 11.0 8.2 2.4 0.5 0.5 27 Mean 4.9 0.2 1.9 7.7 7.5 2.3 0.4 0.4
Miraba
9 Upper seg. 5.1 0.1 1.9 4.0 6.6 2.3 0.3 0.4 9 Middle seg. 5.0 0.1 1.5 3.0 5.9 2.1 0.3 0.4 9 Lower seg. 5.0 0.1 2.1 4.0 7.3 2.5 0.4 0.5
27 Mean 5.0 0.1 1.8 3.7 6.6 2.3 0.3 0.4 Control 9 Upper seg. 4.8 0.1 1.6 3.0 6.3 1.6 0.3 0.4 9 Middle seg. 4.8 0.1 1.5 3.0 6.5 1.8 0.3 0.4 9 Lower seg. 4.8 0.1 1.6 3.0 6.5 1.7 0.3 0.4 27 Mean 4.8 0.1 1.6 3.0 6.4 1.7 0.3 0.4 LSD (P = .05) 0.6 0.03 0.5 2.3 1.2 0.5 0.2 0.1 SE 0.2 0.01 0.2 0.3 0.4 0.2 0.1 0.02
*seg. = segment; LSD: least significant different; SE: standard error of means
Mwango et al.; JSRR, 5(1): 32-46, 2015; Article no.JSRR.2015.072
42
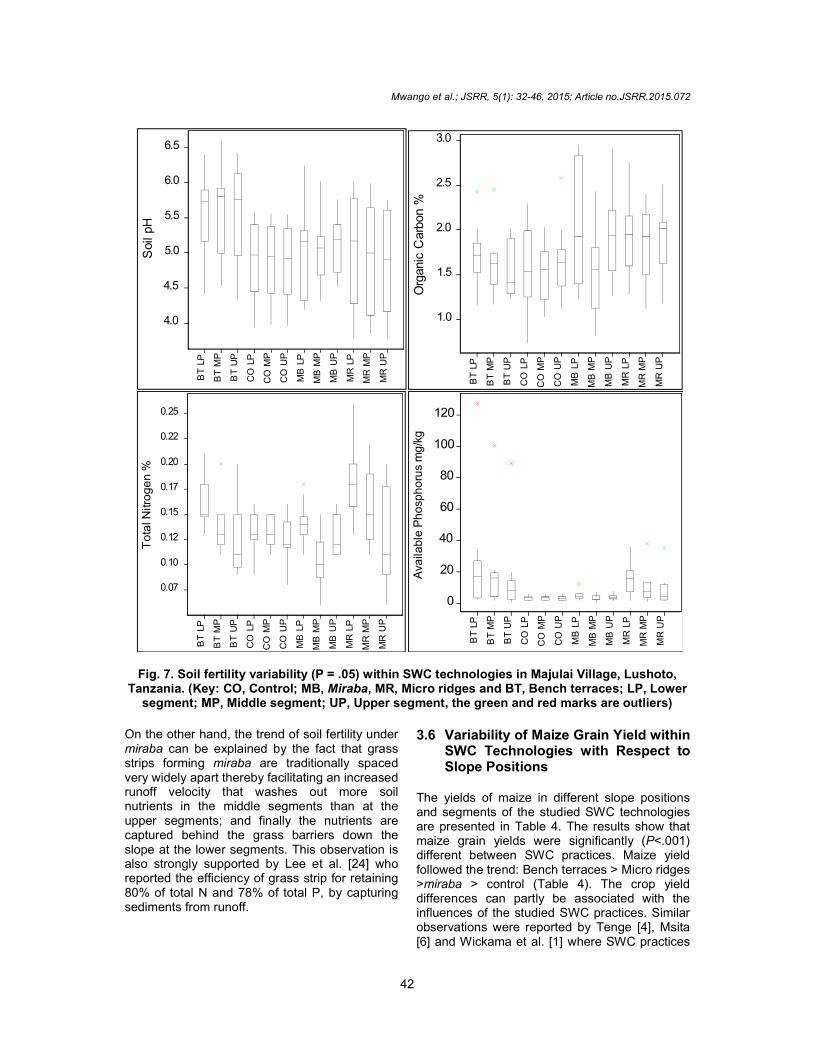
Fig. 7. Soil fertility variability (P = .05) within SWC technologies in Majulai Village, Lushoto, Tanzania. (Key: CO, Control; MB, Miraba, MR, Micro ridges and BT, Bench terraces; LP, Lower
segment; MP, Middle segment; UP, Upper segment, the green and red marks are outliers)
On the other hand, the trend of soil fertility under miraba can be explained by the fact that grass strips forming miraba are traditionally spaced very widely apart thereby facilitating an increased runoff velocity that washes out more soil nutrients in the middle segments than at the upper segments; and finally the nutrients are captured behind the grass barriers down the slope at the lower segments. This observation is also strongly supported by Lee et al. [24] who reported the efficiency of grass strip for retaining 80% of total N and 78% of total P, by capturing sediments from runoff.
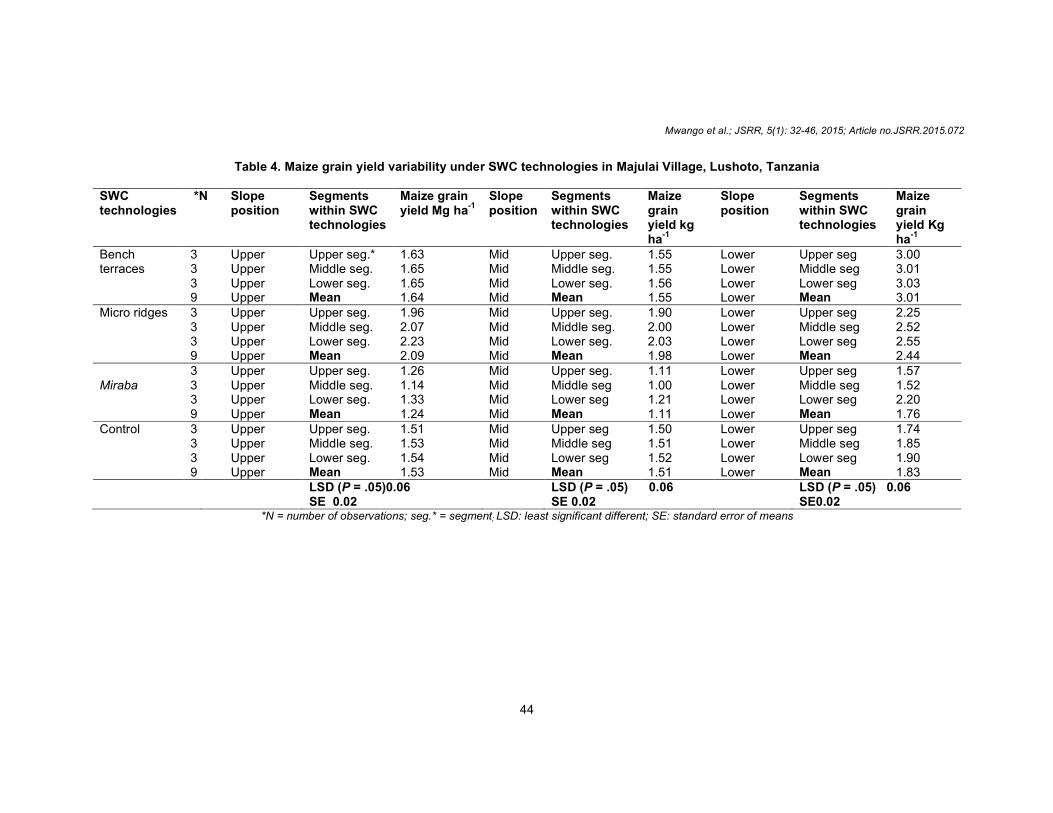
3.6 Variability of Maize Grain Yield within SWC Technologies with Respect to Slope Positions
The yields of maize in different slope positions and segments of the studied SWC technologies are presented in Table 4. The results show that maize grain yields were significantly (P<.001) different between SWC practices. Maize yield followed the trend: Bench terraces > Micro ridges >miraba > control (Table 4). The crop yield differences can partly be associated with the influences of the studied SWC practices. Similar observations were reported by Tenge [4], Msita [6] and Wickama et al. [1] where SWC practices
6.0
MR
UP
5.0
MR
MP
4.0
MR
LP
MB
UP
MB
MP
MB
LP
CO
UP
CO
MP
CO
LP
5.5
BT
UP
BT
MP
BT
LP
4.5
6.5 S
oil
pH
MR
UP
2.5
MR
MP
1.5
MR
LP
MB
UP
MB
MP
MB
LP
CO
UP
CO
MP
CO
LP
BT
UP
2.0
BT
MP
BT
LP
3.0
1.0
Org
anic
Carb
on %
0.25
0.20
MR
UP
0.15
MR
MP
0.10
MR
LP
MB
UP
MB
MP
MB
LP
CO
UP
CO
MP
CO
LP
0.22
BT
UP
0.12
BT
MP
BT
LP
0.17
0.07
To
tal N
itro
ge
n %
100
MR
UP
60
MR
MP
20
MR
LP
MB
UP
MB
MP
MB
LP
CO
UP
CO
MP
CO
LP
120
BT
UP
40
BT
MP
BT
LP
80
0
Ava
ilable
Ph
osp
ho
rus
mg
/kg
Mwango et al.; JSRR, 5(1): 32-46, 2015; Article no.JSRR.2015.072
43
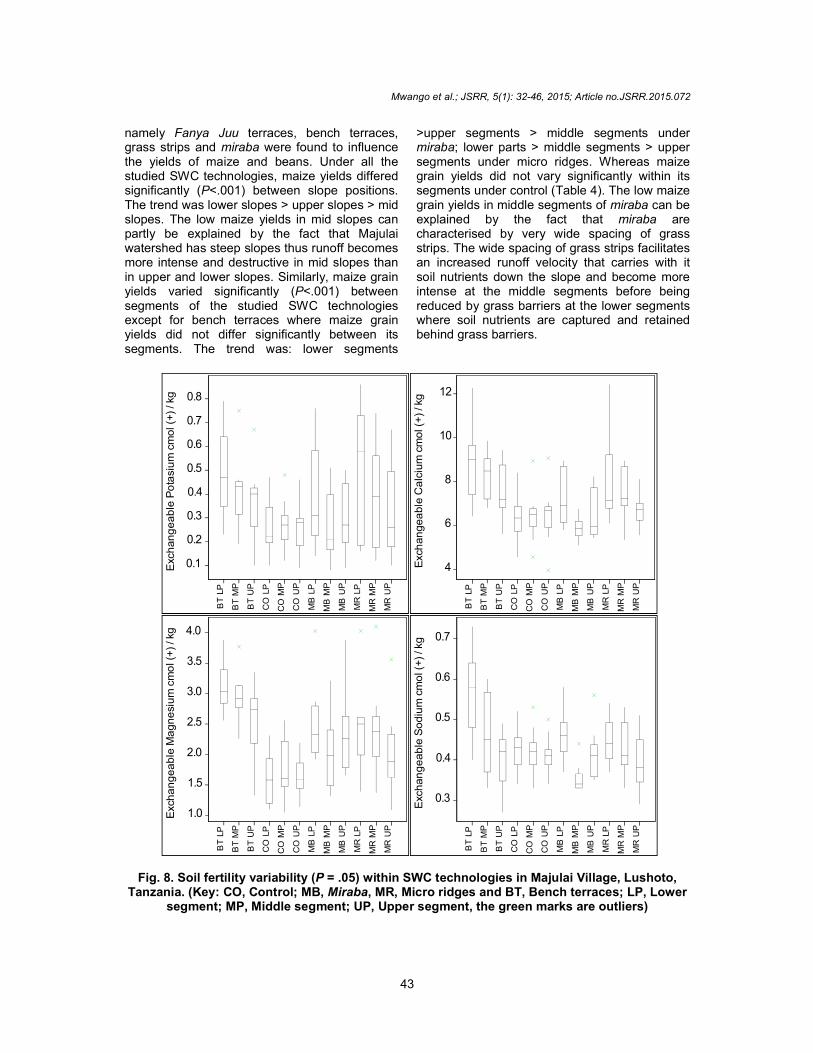
namely Fanya Juu terraces, bench terraces, grass strips and miraba were found to influence the yields of maize and beans. Under all the studied SWC technologies, maize yields differed significantly (P<.001) between slope positions. The trend was lower slopes > upper slopes > mid slopes. The low maize yields in mid slopes can partly be explained by the fact that Majulai watershed has steep slopes thus runoff becomes more intense and destructive in mid slopes than in upper and lower slopes. Similarly, maize grain yields varied significantly (P<.001) between segments of the studied SWC technologies except for bench terraces where maize grain yields did not differ significantly between its segments. The trend was: lower segments
>upper segments > middle segments under miraba; lower parts > middle segments > upper segments under micro ridges. Whereas maize grain yields did not vary significantly within its segments under control (Table 4). The low maize grain yields in middle segments of miraba can be explained by the fact that miraba are characterised by very wide spacing of grass strips. The wide spacing of grass strips facilitates an increased runoff velocity that carries with it soil nutrients down the slope and become more intense at the middle segments before being reduced by grass barriers at the lower segments where soil nutrients are captured and retained behind grass barriers.
Fig. 8. Soil fertility variability (P = .05) within SWC technologies in Majulai Village, Lushoto, Tanzania. (Key: CO, Control; MB, Miraba, MR, Micro ridges and BT, Bench terraces; LP, Lower
segment; MP, Middle segment; UP, Upper segment, the green marks are outliers)
0.8
0.6
MR
UP
0.4
MR
MP
0.2
MR
LP
MB
UP
MB
MP
MB
LP
CO
UP
CO
MP
CO
LP
0.7
BT
UP
0.3
BT
MP
BT
LP
0.5
0.1
Exc
han
ge
ab
le P
ota
siu
m c
mol (+
) / kg
MR
UP
MR
MP
10
MR
LP
6
MB
UP
MB
MP
MB
LP
CO
UP
CO
MP
CO
LP
BT
UP
BT
MP
12
BT
LP
4
8
Exch
an
ge
ab
le C
alc
ium
cm
ol (
+)
/ kg
3.5
MR
UP
2.5
MR
MP
1.5
MR
LP
MB
UP
MB
MP
MB
LP
CO
UP
CO
MP
CO
LP
4.0
BT
UP
2.0
BT
MP
BT
LP
3.0
1.0 Exch
an
ge
ab
le M
ag
ne
siu
m c
mo
l (+
) / kg
MR
UP
0.6
MR
MP
0.4
MR
LP
MB
UP
MB
MP
MB
LP
CO
UP
CO
MP
CO
LP
BT
UP
0.5
BT
MP
BT
LP
0.7
0.3
Exc
han
ge
ab
le S
od
ium
cm
ol (
+)
/ kg
Mwango et al.; JSRR, 5(1): 32-46, 2015; Article no.JSRR.2015.072
44
Table 4. Maize grain yield variability under SWC technologies in Majulai Village, Lushoto, Tanzania
SWC technologies
*N Slope position
Segments within SWC technologies
Maize grain yield Mg ha
-1
Slope position
Segments within SWC technologies
Maize grain yield kg ha
-1
Slope position
Segments within SWC technologies
Maize grain yield Kg ha
-1
Bench terraces
3 Upper Upper seg.* 1.63 Mid Upper seg. 1.55 Lower Upper seg 3.00 3 Upper Middle seg. 1.65 Mid Middle seg. 1.55 Lower Middle seg 3.01 3 Upper Lower seg. 1.65 Mid Lower seg. 1.56 Lower Lower seg 3.03 9 Upper Mean 1.64 Mid Mean 1.55 Lower Mean 3.01
Micro ridges 3 Upper Upper seg. 1.96 Mid Upper seg. 1.90 Lower Upper seg 2.25 3 Upper Middle seg. 2.07 Mid Middle seg. 2.00 Lower Middle seg 2.52 3 Upper Lower seg. 2.23 Mid Lower seg. 2.03 Lower Lower seg 2.55 9 Upper Mean 2.09 Mid Mean 1.98 Lower Mean 2.44
Miraba
3 Upper Upper seg. 1.26 Mid Upper seg. 1.11 Lower Upper seg 1.57 3 Upper Middle seg. 1.14 Mid Middle seg 1.00 Lower Middle seg 1.52 3 Upper Lower seg. 1.33 Mid Lower seg 1.21 Lower Lower seg 2.20
9 Upper Mean 1.24 Mid Mean 1.11 Lower Mean 1.76 Control 3 Upper Upper seg. 1.51 Mid Upper seg 1.50 Lower Upper seg 1.74 3 Upper Middle seg. 1.53 Mid Middle seg 1.51 Lower Middle seg 1.85 3 Upper Lower seg. 1.54 Mid Lower seg 1.52 Lower Lower seg 1.90 9 Upper Mean 1.53 Mid Mean 1.51 Lower Mean 1.83 LSD (P = .05)0.06 LSD (P = .05) 0.06 LSD (P = .05) 0.06 SE 0.02 SE 0.02 SE0.02
*N = number of observations; seg.* = segment; LSD: least significant different; SE: standard error of means
Mwango et al.; JSRR, 5(1): 32-46, 2015; Article no.JSRR.2015.072
45
4. CONCLUSION AND RECOMMENDATIONS
Soil fertility varied significantly between SWC technologies with the trend: bench terraces > micro ridges >miraba > control. Similar trend was observed for maize grain yields. Soil fertility varied significantly between slope positions under all the studied SWC technologies with the trend: lower slopes > upper slopes > mid slopes. Similar trend was observed for maize grain yields. On the other hand soil fertility varied significantly between segments of the studied SWC technologies. Maize grain yields varied significantly between segments of the studied SWC technologies, except under bench terraces. Both soil fertility and maize yields followed the trend: lower segments > upper segments >middle segments under miraba, while under micro ridges the trend was lower segments > middle segments > upper segments.
It is recommended that supportive SWC measures such as mulching should be tested and accompanied under mirabaand micro ridges as an effort on reducing the magnitude of soil fertility and crop yields variability within the aforementioned SWC technologies. It is further recommended that spacing of grass strip bounds that form miraba be reduced to minimise the speed and intensity of runoff which in turn will also minimise the magnitude of soil fertility and crop yield variability between segments under miraba.
ACKNOWLEDGEMENTS
The authors are grateful to the VLIR-UOS supported RIP-DSS SUA Project “Enhancing Indigenous Knowledge on Conservation Agriculture for Poverty Alleviation and Sustainable Livelihood, Usambara Mountains, Lushoto, Tanzania”, for providing financial and logistical assistance to the research. The first author is grateful to the Tanzania Commission of Science and Technology (COSTECH) for sponsoring PhD programme that contributed to the production of this paper.
COMPETING INTERESTS
Authors have declared that no competing interests exist.
REFERENCES
1. Wickama J, Okoba B, Sterk G. Effectiveness of sustainable land
management measures in West Usambara Highlands, Tanzania. Catena. 2014;118:91–102.
2. Vigiak O, Okoba BO, Sterk G, Stroosnijder L. Water erosion assessment using farmers indicators in the Western Usambara Mountains, Tanzania. CATENA. 2005;64 (2-3):307–320.
3. Wickama JM, Mwihomeke ST. The role of indigenous knowledge in combating soil infertility and poverty in the Usambara Mountains, Tanzania. Research Report. Mkuki na Nyota Publishers, DSM, Tanzania. 2006;19(06).
4. Tenge AJM. Participatory appraisal for farm-level soil and water conservation planning in West Usambara Highlands, Tanzania. Dissertation for Award of PhD Degree at Wageningen University, Netherlands. 2005;195.
5. Msita HB, Kimaro DN, Deckers J, Poesen J. Identification and assessment of indigenous soil erosion control measures in the Usambara Mountains, Tanzania. In:166 Earl T. Nardali (Ed.), No Till Farming:Effect on Soil, Pros and Cons and Potential. Nova Science Publishers, Hauppauge, New York. 2010;49-74.
6. Msita HB. Insights into indigenous soil and water conservation technologies in western Usambara Mountains, Tanzania. PhD dissertation KU Leuven Belgium. 2013;198.
7. FAO (Food and Agriculture Organization). Conservation agriculture in China and the democratic people’s republic of Korea. FAO Crops and Grassland Service Working Paper. 2007;24.
8. Stark M, Garrity DP, Jutz SC. Managing Soil Fertility on Terraces Forming Behind Vegetative Filter Strips: An assessment of farmers strategies. Poster presented at the first Asia-Pacific conference and exhibition on ground and water bioengineering for erosion control and slope stabilization, Manila, Philippines; 1999.
9. Dercon G, Deckers J, Govers G, Poesen J, Sanchez H, Vanegas R, Ramırez M, Loaiza G. Spatial variability in soil properties on slow forming terraces in the Andes region of Ecuador. Soil & Tillage Research. 2003;72:31–41.
10. Vanlauwe B, Tittonell P, Mukalama J. Within-Farm soil fertility gradient affect response of maize to fertilizer application in Western Kenya. Nutrient Cyclingin Agro Ecosystems. 2007;76:171-182.
Mwango et al.; JSRR, 5(1): 32-46, 2015; Article no.JSRR.2015.072
46
11. FAO (Food and Agriculture Organization). Guideline for soil description, FAO, Rome. 2006;97.
12. FAO (Food and Agriculture Organization). World reference base for soil resources. A framework for International classification, correlation and communication. World Soil Resources Reports 106 FAO, Rome, Italy. 2014;182.
13. Shelukindo H.Technical recommendations for soil and water conservation measures and agroforestry systems. SECAP and TIP, DALDO, Lushoto; 1995.
14. Moberg JP. Soil and plant analysis manual. The Royal Veterinary and Agricultural University, Chemistry Department, Copenhagen, Denmark. 2001;133.
15. Genstat. Introduction to genstat 14 for windows. Statistical service centre, University of Reading, UK. 2011;41.
16. Kyaruzi LA. Relationship between soil and land form derived land qualities and conservation agriculture practices in West Usambara Mountains, Tanzania. MSc Dissertation Sokoine University of Agriculture. 2013;140.
17. Kabanza AK, Dondeyne S, Kimaro DN, Kafiriti E, Poesen J, Deckers J. Effectiveness of soil conservation measures in two contrasting landscape units of South Eastern Tanzania. Zeitschriftfür Geomorphologie; 2013. DOI:10.1127/0372-8854/2013/0057-0102.
18. Kaswamila AL. Assessment of the effectiveness of soil erosion control measures using soil surface micro
topographic features in the West Usambara Mountains, Tanzania. International Journal of Marine, Atmospheric & Earth Sciences. 2013;1(2):68-80.
19. Reza SK, Baruah Utpal, Sarkar Dipak, Dutta DP. Influence of slope positions on soil fertility index, soil evaluation factor and microbial indices in acid soil of Humid Subtropical India. Indian Journal of Soil Conservation. 2011;39(1):44-49.
20. Brady NC, Weil RR. The nature and properties of soils, 12th ed. Prentice Hall, New Jersey. 1999;881.
21. Damene S, Vlek PLG, Tamene L. Performance of farmland terracing in maintaining soil fertility: A case of Lake Maybar watershed in Wello, Northern Highlands of Ethiopia. Journal of Life Science. 2012;6:1251-1261.
22. Vancampenhout K, Nyssen J, Desta Gebremichael, Deckers J, Poesen J, Mitiku Haile, Moeyersons J. Stone bunds for soil conservation in the northern Ethiopian highlands: Impacts on soil fertility and crop yield. Soil & Tillage Research. 2006;90:1-15.
23. Esser KB, Va° gen TG, Tilahun Y, Haile M. Soil conservation in Tigray, Ethiopia. Noragric report no. 5, Agricultural University of Norway. 2002;21.
24. Lee KH, Isenhart TM, Schultz RC. Sediment and nutrient removal in an established multi-species riparian buffer. Journal of Soil Water Conservation. 2003;58(1):1-8.
_______________________________________________________________________________ © 2015 Mwango et al.; This is an Open Access article distributed under the terms of the Creative Commons Attribution License (http://creativecommons.org/licenses/by/4.0), which permits unrestricted use, distribution, and reproduction in any medium, provided the original work is properly cited.
Peer-review history: The peer review history for this paper can be accessed here:
http://www.sciencedomain.org/review-history.php?iid=747&id=22&aid=7188


