Embed Size (px)
Citation preview

1
Title: 1
Soil microbiochemical properties as indicators for success of heathland restoration after 2
military disturbance 3
Short title: 4
microbiochemical properties of restored heathland 5
Authors: 6
Felix Heitkamp*1,2, Stephan Glatzel1,3, Beate Michalzik1, Elke Fischer1,4, Gerhard 7
Gerold1 8
*Corresponding author. Tel.: +49 5542 98-1629; fax +49 5542 98-1633; e-mail address: 9
1 Landscape Ecology Unit, Department of Geography, University of Göttingen, 11
Goldschmidtstr. 5, 37077 Göttingen, Germany 12
2 Now at: Environmental Chemistry Unit, Department of Organic Agriculture, 13
University of Kassel, Nordbahnhofstr. 1a, 37243 Witzenhausen, Germany 14
3 Now at: Landscape Ecology and Site Evaluation Unit, Institute for Management of 15
Rural Areas, University of Rostock, Justus-von-Liebig-Weg 6, 18059 Rostock, 16
Germany 17
4 Now at: Department of Geography, University of Hamburg, Bundesstr. 55, 20146 18
Hamburg, Germany 19
20

2
Abstract 21
Decline of heathlands in Central Europe raises the question of successful restoration of 22
degraded heathlands. We examined the impact of different restoration techniques on soil 23
microbial biomass carbon carbon (Cmic) and nitrogen (Nmic) and enzyme activity on an 24
abandoned military training site in the Lüneburger Heaths. The aim was to determine, 25
which technique resulted in typical heathland soil conditions. The training site was in 26
use for about 50 years. Vegetation and soils were degraded in large areas. Restoration 27
actions were: (1) spreading of heath plaggen (sods, containing the organic layer and a 28
few cm mineral soil) (2) spreading of heath plaggen and grass seeds (Festuca filiformis 29
Pourr.), (3) spreading of F. filiformis-seeds and (4) succession (episodical tree removal). 30
Ten years after restoration, we measured pH, bulk density, abundance of roots, organic 31
carbon (SOC), nitrogen (Nt), phosphorus (Pt), Cmic, Nmic, and acid phosphatase activity 32
(AcP) in the first 10 cm of the mineral soil. Four restoration treatments were compared 33
with one reference site. The reference site is heathland located near the training site, 34
where no military actions took place. 35
At all disturbed sites, bulk density and pH proved to be higher than on the reference 36
site. Relative to the reference site, SOC storage reached from 37 - 91 %, regeneration of 37
Nt was slightly lower. In contrast to the advanced development of SOC and Nt, the 38
regeneration of Cmic and Nmic was much lower (15 – 44 %). The succession site showed 39
a low pool of SOC, Nt, Cmic and Nmic, but microbial ratios indicated a less disturbed C- 40
and N-cycle. AcP pronounced differences in nutrient demand between disturbed sites 41
and reference. On this base, recommendations for restoration management were given. 42
Keywords: phosphatase activity, Calluna vulgaris, heathland restoration, microbial 43
biomass, military degradation 44

3
1. Introduction 45
Most heathlands in Central Europe developed because of anthropo-zoogenic utilisation 46
(Ellenberg, 1988). In the late 18th Century, large areas of Northwest Germany were 47
open, mainly heathland, landscapes. This ecosystem type declined markedly with the 48
abandonment of historical utilisation as pasture and source of cot-litter in the course of 49
succession, afforestation and industrial agriculture. Remaining heathland in Germany is 50
predominantly restricted to the “Lüneburger Heide” nature reserve and additionally on 51
some extensively used military training areas (Völksen, 1993). In the last decades, 52
conservation problems occurred with invasive graminaceae-species throughout the 53
semi-natural heathlands because of high atmospheric nitrogen (N) input (Steubing, 54
1993; review by Cunha et al., 2002). Therefore, the management, conservation and 55
restoration of heathland as an historical cultural landscape are important tasks for the 56
future. 57
The Lüneburger Heide encompasses an area of more than 6000 ha of semi-natural 58
heathland dominated by Calluna vulgaris (L.) Hull. Until 1994, about 50 % was 59
military training area for tanks and other vehicles (von der Lancken, 1997). In contrast 60
to other military training areas which are very valuable for conservation biology 61
because of their extensive usage (Wallschläger and Wiegleb, 2000), the so-called “Red 62
Area” was used to such an intensive degree that the formerly existing heathland was 63
degraded to bare ground. Concerning the large area of heathland in the Lüneburger 64
Heide, the restoration of the Red Area to the formerly existing Calluna-dominated 65
vegetation is an important contribution to a relatively unfragmentated area of heathland. 66
Recently, studies on heathland recreation from arable land have been published (Clarke 67
1997; Marrs et al., 1998; Owen and Marrs, 2000; Allison and Austin, 2004; Lawson et 68

4
al., 2004; Tibbett and Diaz 2005). These papers are dealing with problems of soil 69
melioration such as nutrient enrichment through fertilization and increased pH-values, 70
which impede heathland recreation. In the case of the reestablishment from coniferous 71
forest plantations (Pywell et al., 2002; Allison and Austin, 2006) the removal of the 72
humus layer can improve the success of heathland restoration. 73
The problems of heathland restoration on the Red Area are different. Here, we have to 74
deal with loss of topsoil, low cation exchange capacities, soil compaction, altered water 75
regime (Gerold, 1998) and an exhausted seed bank (Täuber, 1994). Ten years after the 76
restoration with multiple techniques (see 2.1 and table I), the vegetation recovered 77
successfully, but is still different from heathland nearby the Red Area (Kaiser and 78
Mertens, 2003) and its composition is influenced by the restoration technique. 79
Therefore, it is difficult to use plants as indicators for success of restoration. Another 80
problem lays in rather heterogeneous soil conditions, which are due to the military 81
usage and the restoration actions. That is why indicators were needed, which are 82
sensitive to environmental conditions, such as the amount and quality of soil organic 83
mater (SOM). Microbial biomass comply these conditions (Swift et al., 1979; Powlson 84
et al., 1987; Sparling, 1997). Additionally it is evident, that microbial biomass is 85
sensitive to gradients of military impact on sandy, acidic soils (Peacock et al., 2001) and 86
is of outstanding importance for nutrient cycling in heathlands (Røsberg et al., 1981). 87
As a parameter for microbial status (Aon et al., 2001) and as well as for physical and 88
chemical status of the soil (Sinsabaugh, 1994) enzyme activity is a striking indicator, 89
and is represented here via the activity of acid phosphatase. 90

5
The aim of restoration is to obtain conditions typical for the ecosystem which has to be 91
restored. Hence, the typical conditions have to be defined. This is possible, using 92
reference information of nearby, undisturbed areas (White and Walker, 1997). 93
We hypothesize, that the restoration with heather (Calluna vulgaris L.) in combination 94
with a pioneer grass (Festuc filiformis Pourr.) leads to the best approximation of the soil 95
conditions of the reference site. To test the hypothesis, microbial carbon (Cmic), 96
microbial biomass nitrogen (Nmic) and activity of acid phosphatase (AcP) and their 97
relationship with biochemical properties were measured on one reference site and on 98
four different types of restoration management. 99
2. Materials and methods 100
2.1. Site description and history 101
The nature reserve “Lüneburger Heide” is located near Schneverdingen in Northern 102
Germany (52°59’ N, 09°50’ E) and covers 234 km2. About 20 % of this area is still 103
heathland. The British Army has used nearly 3000 ha of the remaining heathland in the 104
nature reserve from 1945 until 1994 as a training area (“Red Area”) (Prüter and 105
Lütkepohl, 2002). About 263 vehicles, predominantly large and heavy tanks, passed 106
through the “Red Area” every day between 1980 and 1989 (Kreie et al., 1993). 107
The soils developed on a Weichselian outwash plain of the Drenthe (II) stadial. The 108
main soil type is a Haplic Podzol (IUSS Working Group WRB, 2006). The climate is 109
temperate humid with cool summers and a mean annual temperature of 8.4 °C and mean 110
annual precipitation is 811 mm (DWD, 2006; period from 1961 to 1990, station Soltau). 111
The potential natural vegetation type is assumed to be an acidic beech-oak-wood 112
(Luzulo-Fagetum) (Leuschner and Rode, 1999). 113
Consequences of military training action 114

6
The intensive military activities resulted in a large-scale vegetation destruction and soil 115
degradation. More than 50 % of the area was bare ground by the time the training area 116
was abandoned in 1994. Even the seed bank was nearly exhausted (Täuber, 1994). The 117
sandy Podsols were compacted, resulting in bulk densities from formerly 1.3 up to 1.8 g 118
cm-3 and heavily degraded soil horizons. Cation exchange capacity, content of soil 119
organic matter (SOM) and pore volume declined markedly, while pH was raised. Strong 120
aeolian and fluvial erosion occurred (Gerold, 1998). Until today, no organic layer exists. 121
Restoration management 122
The aim of restoration was to obtain a mainly open heathland. The overall concept was 123
to recreate the typical range of wet and dry habitats including a small-scale mosaic of 124
heath and acidic grassland. Material from heath management of surrounding areas was 125
spread onto the ground to replenish the exhausted seed bank (Täuber, 1994). The 126
material mainly used was plaggen material (sods, containing the organic layer and a few 127
cm mineral soil), followed by heather mowing and threshing material. On some 128
locations, the pioneer grass Festuca filiformis Pourret was sown alone or in combination 129
with heather material (Prüter and Lütkepohl, 2002). Kaiser and Mertens (2003) 130
appraised the restoration as successful from a floristic point of view. 131
Site selection 132
All sites had the same geology. Soils before degradation were classified as “Eisen-133
Humus-Podsol”, which equal Haplic Podzols. The greatest distance between sampling 134
points was about 2 km. Investigation plots (2500 m²) were selected using aerial 135
photographs from 1993. Plots had no or minimum vegetation coverage at this time and 136
were classified as heavily disturbed. Five variants were chosen (Table I): (1) restoration 137
with heath plaggen, (2) restoration with heath plaggen and Festuca filiformis, (3) 138

7
restoration with Festuca filiformis-seeds, (4) succession site with episodical tree 139
removal and, for comparison, (5) one reference site with no direct military impact. 140
The selection of reference site is of special importance because it has to be assured to 141
meet representative conditions. Therefore, it would be desirable to have as much 142
reference sites as possible. Due to our resources, we had to choose one site. We think 143
this site is representative due to the following reasons: The spatial distance to the 144
restored area is very low and the landscape is of the same geomorphology. Therefore, 145
the historical management and soil genesis is likely to be similar. The vegetation of the 146
reference site was in the mature stage, which is the succession stage with the most 147
stable conditions (Gimingham, 1972) and considered in general as “typical heathland”. 148
2.2. Sampling and standard soil characterization 149
Field sampling was done in late October 2004. To exclude seasonal or weather effects, 150
sampling was done within three days. From all variants, 10 soil samples were taken 151
randomly from the upper 10 cm of the mineral A-horizon. Samples were stored in PE-152
bags in a refrigator at 4 °C for a maximum of six weeks. Ross (1991) evaluated storage 153
effects on microbial biomass and found only minor effects even after 14 months. 154
Additionally, the samples were analysed randomly and therefore the comparatative 155
power between the treatments will sustain, even if minor changes in microbial biomass 156
or activity occurred. Samples were sieved < 2 mm. All laboratory work was conducted 157
at the Institute of Geography of the Georg-August-University Göttingen. 158
Bulk density and pH (0.01 M CaCl2) were determined using standard methods 159
(Schlichting et al., 1995). Soil organic carbon (SOC) and total N (Nt) were measured by 160
dry combustion (Leco CN 1000). Total P (Pt) was measured with KNO3/HF digestion 161

8
with inductive coupled plasma (ICP) (König and Fortmann 1999). Roots were extracted 162
with the soil core method (Böhm 1979). 163
2.3. Microbial properties 164
Cmic and Nmic were estimated by fumigation-extraction (Brookes et al., 1985; Vance et 165
al., 1987). Cmic was calculated according to Brookes et al. (1985) as EC/kEC, where EC 166
= (organic C extracted from fumigated soil) – (organic C extracted from unfumigated 167
soil) and kEC = 0.45. Nmic was calculated according to Wu et al. (1990) as EN/kEN, 168
where EN = (total N extracted from fumigated soil) – (total N extracted from 169
unfumigated soil) and kEN = 0.54. 170
The activity of acid phosphomonoesterase (AcP) was estimated by release of p-171
nitrophenol (Tabatabai and Bremner 1969; Grunda and Rejsek 1990). Latter procedure 172
is given in detail as there are many existing modifications of this method: 5 ml 173
succinate-borate buffer solution (pH 4.7) containing p-nitrophenylphosphate (500 µM) 174
as substrate and 1 g moist soil were incubated in the dark for 1 h at 37 °C. Enzyme 175
activity was stopped by adding 1.5 ml tri-chlor-acetic-acid (TCA, 10 %). As coagulant 1 176
ml CaCl2 (0.5 M) was added. After filtration solution was alkalized (2.5 ml 1 M KOH) 177
followed by second filtration (Schleicher and Schüll 585). The released p-nitrophenol 178
was measured spectrophotometrically at 400 nm (Perkin Elmer Lambda 40). Units are 179
expressed as pkat g-1 (SI-unit) which equals pmol p-nitrophenol g-1 s-1. 180
2.4. Data processing and statistics 181
All results are presented on an oven-dry basis (24 h at 105 °C). To allow valid 182
comparisons between the plots all data were recalculated from gravimetric into 183
volumetric based units (Reganold and Palmer, 1995). Significance of differences 184
between arithmetic means were tested by one-tailed heteroscedastic Student´s t-test after 185

9
performing the F-test. The Kolmogorov-Smirnov test proved the normal distribution for 186
logarithmic transformed datasets. A two-step cluster analysis with Schwarz´s Bayesian 187
Information Criterion (BIS) for optimal cluster numbers was chosen to classify groups 188
among the five variants at a confidence level of 0.95. Statistical analysis was performed 189
using SPSS 12.0 (SPSS Inc.). 190
3. Results 191
3.1. Physical and chemical properties 192
Mean pH-values ranged from 3.0 to 3.8, whereas the disturbed sites showed higher 193
values (figure 1). Bulk densities were significantly higher on the disturbed sites than on 194
the reference, except for the heath-plot. Root storage was highest (351 g m-2) at the 195
reference site, but not significantly differnt to the other plots (290 – 338 g m-2) except 196
for the heath site (107 g m-2). SOC and Nt stocks were highest at the reference site 197
(5480 g C m-2, 174 g N m-2) but not significantly different from the heath plot (4990 g C 198
m-2, 154 g N m-2). Significantly lowest C and N storage (2010 g C m-2, 64 g N m-2) was 199
found for the succession site. Storage of Pt on the succession site (14 g m-2) was 200
significantly lower as compared to all other plots (17 – 20 g m-2). Mean C/N ratios (31 - 201
32) were not significantly different to each other, except for the festuca site, which had 202
the highest ratio (36). In contrast, all C/P ratios differed significantly with the widest 203
ratio reported for the reference (308) and the narrowest value for the succession site 204
(138). 205
3.2. Soil microbiological properties 206
Cmic storage was highest (73.3 g m-2) in the reference soil (Figure 2). Storages in the 207
disturbed soils revealed markedly lower values (16.5 to 32.3 g m-2). The heath site 208
contained 44 %, the heath & festuca site 30 %, the succession site 25 % and the festuca 209

10
site 23 % Cmic of the value of the reference site (table III). The differences of Nmic 210
between reference (10.0 g m-2) and disturbed sites (1.5 to 2.4 g m-2) were even more 211
pronounced, but differences within the disturbed sites were less significant. The heath 212
site contained 24 %, the heath & festuca site 20 %, the festuca site 17 % and the 213
succession site 15 % Nmic of the amount of the reference. 214
The Cmic/SOC ratio is, as well as Cmic, highest on the reference site (1.4 %). In contrast, 215
the regenerated proportions of the Cmic/SOC ratios (0.4 – 1.0 %) from the disturbed soils 216
are higher than the regenerated proportions of Cmic. From the soils of the Red Area the 217
succession site showed a ratio of 75 % compared with the reference, followed by the 218
sites heath & festuca (54 %), heath (50 %) and festuca (32 %). In general, the same is 219
true for the Nmic/Nt ratios (reference: 5.8 %, Red Area: 1.6 – 2.3 %), but a different 220
ranking order on the disturbed sites occurred: the succession site showed 40 % of the 221
value of the reference ratio, the heath & festuca site 36 %, the heath site 29 % and the 222
festuca site 28 %, respectively. 223
AcP activity was significantly highest on the reference site (365 pkat g-1). An 224
insignificant difference was found for the festuca and the heath site with 39 % and 35 % 225
of the reference activity, respectively. The succession site revealed 21 % and the heath 226
& festuca site only 17 % of the phosphatase activity of the reference. 227
3.3. Relationship of soil properties 228
The cluster analysis (data not shown) divided the whole dataset into two clusters: the 229
reference site and all sites of the Red Area. In both clusters the microbiological 230
properties and pH of the soils were significant for cluster formation. In the reference 231
cluster also C/P ratio and N storage had parts in the cluster formation. Based on the 232
cluster classification the correlation analysis is divided into the two cluster groups. 233

11
Significant negative correlations existed between pH and Cmic, Nmic and acid 234
phosphatase activity (table II). Only the phosphatase activity was correlated 235
significantly with bulk density. On the reference site, root storage was correlated 236
negatively with Cmic and strongly negatively with Nmic, while on the “Red Area” sites 237
only Nmic/Nt showed a very weak dependence with root storage. SOC, Nt and Pt were 238
significantly correlated with microbial properties, except with the Cmic/Nmic ratio and 239
enzyme activity. In general, the degree of correlation was higher on the reference site 240
and correlations with Pt were less pronounced compared to SOC and Nt. Acid 241
phosphatase activity was positively correlated with SOC and Nt, but only on the 242
disturbed sites. On both sites, the C/N ratio was correlated negatively with Cmic/SOC 243
ratio. On the reference site correlation of the C/N ratio with enzyme activity was 244
negative, while it was positive on the “Red Area” sites. Positive relationships between 245
the C/P ratio and Cmic or Nmic existed on both sites, but were less pronounced on the 246
disturbed sites. On the degraded sites, the C/P ratio was negatively correlated with all 247
microbiological ratios. Phosphatase activity was positively correlated with C/P ratio, 248
while on the reference no relationship appears. 249
4. Discussion 250
4.1. Reference data 251
According to the classification developed by Machulla et al. (2001) our Cmic values are 252
within the classes “moderate” to “high” with a “medium” mean value. Jensen et al. 253
(2003) presented a study at Mol/ Denmark with a vegetation patchwork of Calluna 254
vulgaris and Deschampsia flexuosa (L.) Trin. Following correction for SOM to SOC 255
(factor 0.5) and for soil depth, the resulting microbial ratios are well within the range 256
measured for this study (1.0 – 1.6 % Cmic/SOC and 2.7 – 6.4 % Nmic/Nt). These 257

12
similarity suggest some representative value of our refence site. The Cmic storage (145 – 258
235 g m-2) and Nmic storage (20 – 40 g m-2) is higher than our values reported. This 259
might be due to the higher microbial biomass contents of the organic layer (Raubuch 260
and Beese, 2005), which was sampled by Jensen et al. (2003). 261
Jörgensen (1995) emphasises a disturbed resource turnover for microbial quotients 262
below a threshold of 1.2 % for Cmic/SOC. Only 25 % of the measured values were 263
below this treshold. For the Nmic/Nt ratio the treshold is set to 2.3 % and all values were 264
far above. Although in accordance with the study of Jensen et al. (2003), these data does 265
not indicate impeded decomposition, which should be characteristic for acidic heathland 266
soils (Gimingham 1972). 267
4.2. Restored and reference sites 268
The storages of Cmic and Nmic differed highly significantly between the reference and all 269
Red Area sites. Therefore, it is evident that heavy military disturbance leads to a serious 270
reduction of the microbial biomass, as already pointed out by Peacock et al. (2001). 271
Additionally, Garten et al. (2003) detected higher bulk density and less C and N on 272
heavily disturbed sites used by military vehicles. Here, this could not be shown for the 273
heath site. However, soil microbiological properties were still significantly lower 274
relative to the reference. This finding contrasts other results, proving that the response 275
of soil microbial biomass to changing conditions is much faster than responses of SOM 276
(Powlson et al., 1987; Sparling et al., 2003). One explanation might be the high 277
proportion of refractory SOM in heathland soils (Springob and Kirchmann, 2002. This 278
presumption is supported by the weaker correlation (table II and figure 3) of SOC and 279
Cmic on the Red Area sites (r = 0.57) relative to the reference site (r = 0.92). It is 280
additionally, underlined by very low Cmic/SOC ratios, which were significantly 281

13
negatively correlated with the SOC stocks (table II and figure 3). This signifies that an 282
increase in SOC only allows little growth of the microbial population (Wardle, 1992), 283
and indicate a poor quality of SOC resources. 284
There are some indications that the reference site is an area of high competition for N. 285
The Nt and the Nmic storages (table II and figure 3) were negatively correlated with the 286
root stocks. This seems to be unusual, since the rhizosphere supports high microbial 287
populations (Paterson, 2003). This general fact is supported by the high Nmic storage on 288
the reference site. Nevertheless, the rooting zone appeared as a depletion zone for N, 289
perhaps due to the high coverage of graminoids (table I) with opportunistic nutrient 290
acquisition (Michelsen et al., 1999). In the soils of the Red Area there is any relation to 291
the root stocks. The restored soils could be dominated by a more strategic type of 292
microorganisms which take up N at low rates (Kinzig and Harte, 1998). Plants have a 293
better access to N, which provides more biomass production (Paterson, 2003). In return, 294
plant biomass production provides more energy-rich root exudates promoting the 295
microbial population. These assumptions are supported by the wide Cmic/Nmic ratio on 296
the training area sites. 297
The activity of acid phosphatase is highest on the reference site, indicating the strongest 298
demand for P (McGill and Cole, 1981). This could be expected, since nearly the same 299
amount of P was analyzed for every site but bigger populations of plants and 300
microorganisms occurred at the reference site. Although there was little or no 301
correlation between acid phosphatase activity and total P and N stocks, there are some 302
remarkable relationships between the elements ratios (table II and figure 3). The C/N 303
and C/P ratios are rough indicators for the availability of these elements (Swift et al., 304
1979). On the reference site, there was no relationship between the C/P ratio and 305

14
phosphatase activity, but a negative correlation with the C/N ratio. This might indicate a 306
suppression of the enzyme synthesis via N limitation, which in turn points to a 307
limitation of P mineralization by N (Olander and Vitousek, 2000). The Red Area sites 308
showed a strong positive correlation with the C/P ratio and a weak positive correlation 309
with the C/N ratio. Therefore, enzyme production does not appear to be limited by N 310
availability and production of acid phosphatase is regulated by biotic P demand (McGill 311
and Cole, 1981). We expect, that the AcP will rise with growing demand of P of the 312
increasing vegetation coverage. If, or when, enzyme synthesis on the Red Areas will get 313
limited by N availability depends on the relationships between microbial fixation, 314
atmospheric input and demand of vegetation of both N and P. 315
4.3. Recultivation techniques 316
Between the restored sites, significant differences in the storage of SOC and Nt exist. 317
The lowest storage on the succession site is most likely due to the absence of 318
recultivation. Vegetation progressed slower than on recultivated sites. The regeneration 319
ratio after ten years (table III, 37 %) is well comparable to values given by Sparling et 320
al. (2003) for eroded and not recultivated sites. In contrast, the storages of SOC and Nt 321
on the heath site did not differ significantly to the reference. Reasons might be a less 322
pronounced degradation and, additionally a faster vegetation progression or unrecorded 323
differences in recultivation patterns. 324
Due to the differing SOC and Nt storages, Cmic/SOC or Nmic/Nt ratios are more striking 325
indicators between different sites (Sparling 1997). Microbial ratios are highest on the 326
succession site and lowest on the festuca site. Differences between the two other sites 327
are not significant. High microbial ratios indicate an input of easy degradable resources 328
(Jörgensen et al., 1995; Wardle, 2002; Dilly, 2004). On the succession site this may be a 329

15
result of the higher diversity of plant species (Stephan et al., 2000, Berg and 330
McClaugherty, 2003) or easy degradable birch litter (Smolander et al., 2005) which was 331
absent on the other sites. Additionally, the vegetation coverage is more dense (60 %) 332
than on the other sites. Lowest vegetation coverage occurred on the festuca site (20 %) 333
and the fine coarse litter is easily moved by aeolian transport. Consequently, on the 334
festuca site, aboveground litter input should be small. 335
Recultivation accelerated the regeneration of the C and N storage in the soil. Sparling et 336
al. (2003) observed a regeneration ratio of 60 % after 40 years, while in the present 337
study this was approximately the ratio of the festuca and heath & festuca sites. For Cmic 338
no acceleration occurred. While Sparling et al. (2003) reported a regeneration ratio for 339
Cmic of about 42 % after 10 years, this value was only shown for the heath site, which 340
had very high C and N storages. The Cmic/SOC ratio is lower on all sites compared to 341
the reference. This seems to be unusual because this ratio often exceeds the ratio of 342
undisturbed sites during regeneration (Ross et al., 1982, 1984; Sparling et al., 2003). For 343
this specific case, the conclusion of Sparling et al. (2003) that soil chemical properties 344
are as effective as more complicated biochemical measurements to monitor topsoil 345
recovery is not supported. There are important differences in regeneration patterns 346
between chemical and microbiological soil properties. 347
5. Conclusions 348
5.1. Reference data 349
The choice of the reference data is of essential importance in recovery studies (White 350
and Walker, 1997). The lack of comparable data is a general problem for the validation 351
of the study results. For the presented study, only data of Jensen et al. (2003) confirm 352
the range of values of Cmic and Nmic. For the activity of acid phosphatase no evaluation 353

16
is possible, but the activity of the reference site is relatively low (365 pkat g-1) compared 354
to the reported range (55 – 5800 pkat g-1) among several ecosystems (Olander and 355
Vitousek, 2000). 356
5.2. Restored and reference sites 357
After ten years, there are still big differences in the interplay of parameters, expressed as 358
linear correlation, between soil properties of the investigated sites. The most obvious 359
difference is the much weaker correlation between SOM (SOC and Nt) and microbial 360
biomass (Cmic and Nmic) as well as the less pronunced slope of the regression line for the 361
“Red Area” soils. Therefore, the carrying capacity of one unit SOM for microbial 362
biomass is smaller on the disturbed sites, indicating recalcitrant SOM. Nevertheless, 363
there are some indications for a more pronounced N-deficiency on the reference site. 364
First, the negative correlations between root- and Nt- or Nmic-storage on the reference 365
site, showing competitive interactions between microorganisms and plants. This 366
dependence is absent on the disturbed sites. Second, the synthesis of enzymes is 367
surpressed through N-deficiency on the refence site and stimulated through P-deficiency 368
on the disturbed sites. This might be a P-co-limitation due to the high N-demand on the 369
refence site. 370
5.3. Recultivation techniques 371
The Cmic/SOC or Nmic/Nt-ratios are indicators for the decomposability of SOM. 372
Additionally, the nutrient content of the microbial biomass is normalized to the nutrient 373
content of the soil. Therefore, these are the most striking indicators (Sparling, 1997) for 374
typical conditions of heathland soils. 375
The restoration of heathland only with F. filiformis is not recommendable from a soil 376
ecological point of view. Despite of high stocks of SOC and Nt, Cmic and Nmic stocks are 377

17
very low. That is why the Cmic/SOC and Nmic/Nt-ratios are far away from typical 378
heathland soil conditions. On the succession site, the stocks of Cmic and Nmic are 379
comparable low to the festuca site. Nevertheless, on the succession site this is also the 380
case for SOC and Nt. Thus, the Cmic/SOC and Nmic/Nt-ratios are closest to the reference 381
site. Concerning the C-cycle (Cmic/SOC-ratio), the sites heath and heath & festuca show 382
similar values. Nevertheless, there is some indication of a better recovery of the N-cycle 383
on the heath & festuca site, because of the slightly higher Nmic/Nt-ratio. However, the 384
differences of the mean values are not significant. 385
From this perspective, no recultivation action (succession) should be favoured, but there 386
are other reasons not to prefer succession. First, all sites had no or only minimum 387
inclination. On slopes, recultivation promoting the developement of vegetation coverage 388
is essential to avoid heavy water erosion on-site damage. Second, the convention of the 389
restoration aim has to be considered: if succession (with the restriction of tree-removal) 390
is allowed, the resulting vegetation is more of an acidic grassland character with A. 391
capillaris (table I). 392
The hypothesis, that the restoration with heath & festuca leads to the best approximation 393
of the soil conditions of the reference site is approved under the condition, that the aim 394
is Calluna-dominated heathland. 395
Acknowledgements 396
We would like to thank Dr. Johannes Prüter and Tobias Keienburg from the Alfred 397
Töpfer Akademie für Naturschutz (NNA), who supported us with enormous knowledge 398
and granted access to the research plots. We are also very thankful to Petra Voigt and 399
Anja Södje, who performed skilful laboratory analysis. 400
References 401

18
Allison, M., Austin, M., 2004. Successful use of topsoil removal and soil amelioration 402
to create heathland vegetation. Biological Conservation 120, 221-228. 403
Allison, M., Austin, M., 2006. Effects of removing litter and humic layers on heathland 404
establishment following plantation removal. Biological Conservation 127, 177-405
182. 406
Aon, M.A., Cabello, M.N., Sarena, D.E., Colaneri, A.C., Franco, M.G., Burgos, J.L., 407
Cortassa, S., 2001. I. Spatio-temporal patterns of soil microbial and enzymatic 408
activities in an agricultural soil. Applied Soil Ecology 18, 239–254. 409
Berg, B., McClaugherty, C. (2003): Plant litter: decomposition, humus formation, 410
carbon sequestration. Springer, Berlin, 286 pp. 411
Böhm, W. (1979). Methods of studying root systems. Springer, Berlin, 188 pp. 412
Brookes, P.C., Landmann, A., Pruden, G., Jenkinson, D.S., 1985. Chloroform 413
fumigation and the release of soil nitrogen: A rapid direct extraction method for 414
measuring microbial biomass nitrogen in soil. Soil Biology & Biochemistry 17, 415
837-842. 416
Clarke, C.T., 1997. Role of soils in determining sites for lowland heathland 417
reconstruction in England. Restoration Ecology 5, 256-264. 418
Cunha, A., Power, S.A., Ashmore, M.R., Green, P.R.S., Haworth, B.J., Bobbink, R., 419
2002. Whole ecosystem nitrogen manipulation: An updated review. JNCC-report 420
331, 126 pp. http://www.jncc.gov.uk/page-2344. Cited 21 April 2006. 421
Deutscher Wetterdienst (DWD), 2006. Mittelwerte der Periode 1961-1990, Station 422
Soltau. 423
http://www.dwd.de/de/FundE/Klima/KLIS/daten/online/nat/index_mittelwerte.ht424
m. Cited 21 April 2006. 425

19
Dilly, O., 2004. Effects of glucose, cellulose and humic acids on soil microbial eco-426
physiology. Journal of Plant Nutrition and Soil Science 167, 261-266. 427
Ellenberg, H., 1988. Vegetation ecology of Central Europe. Cambridge University 428
Press, Cambrigde, 731 pp. 429
Food and Agriculture Organization of the United Nations (FAO), 2001. Brief guide to 430
Köppen climate classification system. 431
http://www.fao.org/WAICENT/faoinfo/sustdev/EIdirect/climate/EIsp0066.htm. 432
Cited 29 November 2006. 433
Garten, C.T., Ashwood, T.T., Dale, V.H., 2003. Effect of military training on indicators 434
of soil quality at Fort Benning, Georgia. Ecological Indicators 3, 171-179. 435
Gerold, G., 1998. Landschaftsdegradation durch militärischen Übungsbetrieb auf 436
norddeutschen Heideflächen – pedoökologische Folgen und Probleme der 437
Renaturierung. Petermanns Geographische Mitteilungen 142, 413-426. 438
Gimingham, C.H., 1972. Ecology of heathlands. Chapman and Hall, London, 266 pp. 439
Grunda, B., Rejsek, K., 1990. Method for estimation of acid phosphatase in woodland 440
soils. Folia Microbiologica 35, 443-453. 441
Horn, R. 1990. Aggregate characterization as compared to soil bulk properties. Soil & 442
Tillage Research 17, 265–289. 443
IUSS Working Group WRB, 2006. World reference base for soil resources 2006. 2nd 444
edition. World Soil Resources Reports 103, FAO, Rome, 128 pp. 445
Jensen, K.D., Beier, C., Michelsen, A., Emmett, B.A., 2003. Effects of experimental 446
drought on microbial processes in two temperate heathlands at contrasting water 447
conditions. Applied Soil Ecology 24, 165-176. 448

20
Jörgensen, R.G., Anderson, T.-H., Wolters, V., 1995. Carbon and nitrogen relationships 449
in soil microbial biomass of soils in beech (Fagus sylvatica L.) forests. Biology 450
and Fertility of Soils 19, 141-147. 451
Kaiser, T., Mertens, D., 2003. Die Entwicklung der ehemaligen Roten Flächen im 452
Naturschutzgebiet Lüneburger Heide neun Jahre nach der Einstellung des 453
militärischen Übungsbetriebes. Jahrbuch Landkreis Soltau Fallingbostel, 186-194. 454
Kinzig, A.P., Harte, J., 1998. Selection of micro-organisms in a spatially explicit 455
environment and implications for plant access to nitrogen. Journal of Ecology 86, 456
841-853. 457
Kreie, B., Prüter, J., Vauk, G., 1993. Einer trage des anderen Last – 12782 Tage Soltau 458
Lüneburg Abkommen. Mitteilungen aus der NNA, Sonderheft. 459
König, N., Fortmann, H., 1999. Probenvorbereitungs-, Untersuchungs- und 460
Elementbestimmungs-Methoden des Umweltanalytik-Labors der Forstlichen 461
Versuchsanstalt. 1. Ergänzung: 1996-1998. Teil 3: Untersuchungs- und 462
Probenvorbereitungsmethoden, Gerätekurzanleitungen, Qualitätskontrolle, 463
Datenverarbeitung. Berichte des Forschungszentrum für Waldökosysteme der 464
Universität Göttingen, 200 pp. 465
Köppen, W., 1931: Grundriss der Klimakunde. De Gruyter, Berlin. 466
Lawson, C.S., Ford, M.A., Mitchley, J., Warren, J.M., 2004. The establishment of 467
heathland vegetaion on ex-arable land: the response of Calluna vulgaris to soil 468
acidification. Biological Conservation 116, 409-416. 469
Leuschner, C., Rode, M.W., 1999. The role of plant resources in forest succession: 470
changes in radiation, water and nutrient fluxes, and plant productivity over a 300-471

21
yr-long chronosequence in NW-Germany. Perspectives of Plant Ecology, 472
Evolution and Systematics 2, 103-147. 473
Marrs, R.H., Snow, C.S.R., Owen, K.M., Evans, C.E., 1998. Heathland and acid 474
grassland creation on arable soils at Minsmere: identification of potential 475
problems and a test of cropping to impoverish soils. Biological Conservation 85, 476
69-82. 477
McGill, W.B. & Cole, C.V., 1981. Comparative aspects of cycling of organic C, N, S 478
and P through soil organic matter. Geoderma 26, 267-286. 479
Michelsen, A., Graglia, E., Schmidt, I.K., Jonasson, S., Sleep, D., Quarmby, C., 1999. 480
Differential responses of grass and a dwarf shrub to long-term changes in soil 481
microbial biomass C, N and P following factorial addition of NPK fertilizer, 482
fungicide and labile carbon to a heath. New Phytologist 143, 523-528. 483
Olander, L.P., Vitousek, P.M., 2000. Regulation of soil phosphatase and chitinase 484
activity by N and P availability. Biogeochemistry 49, 175-190. 485
Owen, K.M., Marrs, R.H., 2000. Creation of Heathland on former arable land at 486
Minsmere, Suffolk, UK: the effects of soil acidification on the establishment of 487
Calluna and ruderal species. Biological Conservation 93, 9-18. 488
Paterson, E., 2003. Importance of rhizodeposition in the coupling of plant and microbial 489
productivity. European Journal of Soil Science 54, 741-750. 490
Peacock, A.D., Macnaughton, S.J, Cantu, J.M., Dale, V.H., White, D.C. ,2001. Soil 491
microbial biomass and community composition along an anthropogenic 492
disturbance gradient within a long-leaf pine habitat. Ecological Indicators 1, 113-493
121. 494

22
Powlson, D.S., Brookes, P.C., Christensen, B.T., 1987. Measurement of soil microbial 495
biomass provides an early indication of changes in total soil organic matter due to 496
straw incorporation. Soil Biology & Biochemistry 19, 159-164. 497
Prüter, J., Lütkepohl, M., 2002. Restoration of the Lüneburg Heaths. In: Underhill-Day, 498
J.C., Lily, D. (Ed.), Proceedings of the sixth national heathland conference. The 499
RSPB, Sandy, Beds, England, pp. 101-107. 500
Pywell, R.F., Pakeman, R.J., Allchin, E.A., Bourn, N.A.D., Warman, E.A. ,Walker, 501
K.J., 2002. The potential for lowland heath regeneration following plantation 502
removal. Biological Conservation 108, 247-258. 503
Raubuch, M., Beese, F., 2005. Influence of soil acidity on depth gradients of microbial 504
biomass in beech forest soils. European Jornal of Forest Research 124, 87-93. 505
Reganold, J.P., Palmer, A.S., 1995. Significance of gravimetric versus volumetric 506
measurements of soil quality under biodynamic, conventional, and continious 507
grass management. Journal of Soil and Water Conservation 50, 298-305. 508
Røsberg, I., Øvstedal, D.O., Seljelid, R., Schreiner, Ø. & Goksøyr, J., 1981. Estimation 509
of carbon flow in a Calluna heath system. Oikos 37, 295-305. 510
Ross, D.J., 1991. Microbial biomass in a stored soil: A comparison of different 511
estimation procedures. Soil Biology & Biochemistry 23, 1005-1007. 512
Ross, D.J., Speir, T.W., Tate, K.R., Cairns, A., Meyrick, K.F., Pansier, E.A., 1982. 513
Restoration of pasture after topsoil removal: effects on soil carbon and nitrogen 514
mineralization, microbial biomass and enzyme activities. Soil Biology & 515
Biochemistry 14, 575-581. 516

23
Ross, D.J., Speir, T.W., Tate, K.R., Cowling, J.C., Watts, H.M., 1984. Restoration of 517
pasture after topsoil removal: changes in soil biochemical properties over a 5-year 518
period – a note. New Zealand Journal of Soil Science 27, 419-422. 519
Schlichting, E., Blume, H.P., Stahr, K., 1995. Bodenkundliches Praktikum – Eine 520
Einführung in pedologisches Arbeiten für Ökologen, insbesondere Land- und 521
Forstwirte. 2. ed., Blackwell, Berlin. 295 pp. 522
Sinsabaugh, R.L., 1994. Enzymatic analysis of microbial pattern and process. Biology 523
and Fertility of Soils 17, 69–74. 524
Smolander, A., Loponen, J., Suominen, K., Kitunen, V., 2005. Organic matter 525
characteristics and C and N transformations in the humus layer under two tree 526
species, Betula pendula and Picea abies. Soil Biology & Biochemistry 37, 1309-527
1318. 528
Sparling, G.P., 1997. Soil microbial biomass, activity and nutrient cycling as indicator 529
of soil health. In: Pankhurst, C., Doube, B.M., Gupta, V.V.S.R. (Eds.): Biological 530
indicators of soil health, CAB international, Wallingford, pp. 97-120. 531
Sparling, G.P., Ross, D.J., Trustrum, N., Arnold, G., West, A., Speir, T.W. & Schipper, 532
L., 2003. Recovery of topsoil characteristics after landslip erosion in dry hill 533
country of New Zealand, and a test of the space-for-time hypothesis. Soil Biology 534
& Biochemistry 35, 1575-1586. 535
Springob, G., Kirchmann, H., 2002. C-rich sandy Ap-Horizons of specific historical 536
land-use contain large fractions of refractory organic matter. Soil Biology & 537
Biochemistry 34, 1571-1581. 538
Stephan, A., Meyer, A.H., Schmid, B., 2000. Plant diversity affects culturable bacteria 539
in experimental grassland communities. Journal of Ecology 88, 988-998. 540

24
Steubing, L., 1993. Der Eintrag von Schad- und Nährstoffen und deren Wirkung auf die 541
Vergrasung der Heide. Berichte der Reinhold-Tuexen Gesellschaft 5, 113-134. 542
Swift, M.J., Heal, O.W., Anderson, J.M., 1979. Decomposition in terrestial ecosystems. 543
Studies in Ecology 5. Blackwell Sientific Publications, Oxford. 372 pp. 544
Tabatabai, M.A., Bremner, J.M., 1969. Use of p-nitrophenyl phosphate for assay of soil 545
phosphatase activity. Soil Biology & Biochemistry 1, 301-307. 546
Täuber, T., 1994. Vegetationsuntersuchungen auf einem Panzerübungsgelände im 547
Naturschutzgebiet Lüneburger Heide. Tuexenia 14, 197-228. 548
Tibbett, M., Diaz, A., 2005. Are sulfurous soil Amendments (S0, Fe(II)SO4, Fe(III)SO4) an 549
effective tool in the restoration of heathland and acidic grassland after four 550
decades of rock phosphate fertilization? Restoration Ecology 13, 83-91. 551
Vance, E.D., Brookes, P.C., Jenkinson, D.S., 1987. An extraction method for measuring 552
soil microbial biomass C. Soil Biology & Biochemistry 19, 703-707. 553
Völksen, G., 1993. Die Entstehung der Kulturlandschaft Lüneburger Heide. NNA-554
Berichte 3, 4-9. 555
von der Lancken, H., Gries, F., Stolpe, H., Krob, L., 1997. Aktuelle Nutzungen. In: 556
Cordes, H., Kaiser, T., von der Lancken, H., Lütkepohl, M., Prüter, J. (Eds.), 557
Naturschutzgebiet Lüneburger Heide. Geschichte- Ökologie- Naturschutz. 558
Hauschild, Bremen, pp. 45-48. 559
Wallschläger, D., Wiegleb, G. (2000). Offenland-Management auf ehemaligen und in 560
Nutzung befindlichen Truppenübungsplätzen im pleistozänen Flachland 561
Norddeutschlands: Naturschutzfachliche Grundlagen und praktische 562
Anwendungen. Brandenburgische Umwelt Berichte 8, 121-131. 563

25
Wardle, D.A., 1992. A comparative assessment of factors which influence microbial 564
biomass carbon and nitrogen levels in soils. Biological Reviews 67, 321-358. 565
Wardle, D.A. (2002). Communities and Ecosystems – linking the aboveground and 566
belowground components. Monographs in population biology 34. Princeton Univ. 567
Press, Princeton, 392pp. 568
White, P.S., Walker, J.L., 1997. Approximating nature’s variation: selecting and using 569
reference information in restoration ecology. Restoration Ecology 5, 338-349. 570
Wu, J., Jörgensen, R.G., Pommering, B., Chaussod, R., Brookes, P.C., 1990. 571
Measurement of soil microbial biomass-C by fumigation extraction – an 572
automated procedure. Soil Biology & Biochemistry 22, 1167-1169. 573
574

26
Table I: Land cover and restoration characteristics of disturbed and restored heathlands 575 in Schneverdingen, Germany 576
No. research plot restoration management vegetation coverage (%)
dominant species (% coverage)
1 heath spreading of plaggen-material from 0,1 ha ha-1
45 C. vulgaris (40) A. capillaris (5)
2 heath & festuca combination of 1 and 3 45 C. vulgaris (30) F.filiformis (15)
3 festuca spreading of 30-50 kg seeds ha-1
20 F. filiformis (20)
4 succession episodical tree removal 60 A. capillaris (35) C. vulgaris (20) C. canescens (5)
5 reference - 100 C. vulgaris (60) D. flexuosa (40)
577

27
Table II: Pearsson correlation coefficients of chemical or physical with biochemical 578 properties of the Haplic Podzols (10 cm depth) of disturbed and restored heathlands in 579 Schneverdingen, Germany 580 Property Cmic Nmic Cmic/Nmic Cmic/SOC Nmic/Nt Acp
pH -0.65 -0.39
* **
-0.63 -0.43
* **
-0.26 0.06
0.24 0.01
0.09
-0.04
0.38 -0.45
**
Bulk density
0.37 0.07
0.38 0.07
0.10 0.01
-0.14 0.01
-0.01 0.03
-0.08 -0.33
*
Root storage
-0.55 -0.21
*
-0.70 -0.05
*
0.24 -0.25
0.07 0.10
0.10 0.27
*
-0.39 -0.22
SOC 0.92 0.57
*** ***
0.93 0.65
*** ***
0.29 -0.12
-0.52 -0.67
***
-0.69 -0.58
* ***
0.19 0.45
**
Total N 0.95 0.59
*** ***
0.98 0.66
*** ***
0.22 -0.10
-0.38 -0.63
***
-0.63 -0.58
* ***
0.35 0.42
**
Total P 0.71 0.45
* **
0.72 0.41
** **
0.20 0.06
-0.61 -0.59
* ***
-0.77 -0.60
** ***
0.21 0.18
C/N ratio 0.30 0.17
0.21 0.27
*
0.35 -0.14
-0.68 -0.50
* ***
-0.48 -0.25
-0.59 0.37
* **
C/P ratio 0.80 0.47
** **
0.80 0.65
** ***
0.28 -0.27
*
-0.20 -0.47
**
-0.31 -0.30
*
0.09 0.58
***
upper number: reference (n = 10); lower number Red Area (n = 40) 581 data log-normal distributed, level of significance: * p ≤ 0.05; ** p ≤ 0.01, *** p ≤ 0.001 582
583

28
Table III: recovery ratios (%) of disturbed sites after 10 years relative to the reference 584 site and comparison with data of eroded sites 585 Site Ld pH SOC Nt Pt C/N C/P Cmic Nmic Cmic/SOC Nmic/Nt AcP
*) 125 103 33 35 nd 94 nd 42 nd 124 nd 38
heath 106 114 91 88 111 103 86 44 24 50 29 34 heath & Festuca
118 124 59 58 98 103 59 29 20 54 36 17
Festuca 109 120 72 64 106 116 71 22 17 32 28 39
succession 112 125 37 37 80 100 45 25 15 75 40 21
*) after Sparling et al. (2003), partly recalculated; nd: not determined 586

Figure 1: Box plots of physical and chemical parameters of the soils (10 cm depth)
different letters indicate significant differences (p ≤ 0.05); n = 10 per site; solid bars:
interquartile range; dashed line: median; solid line: arithmetic mean
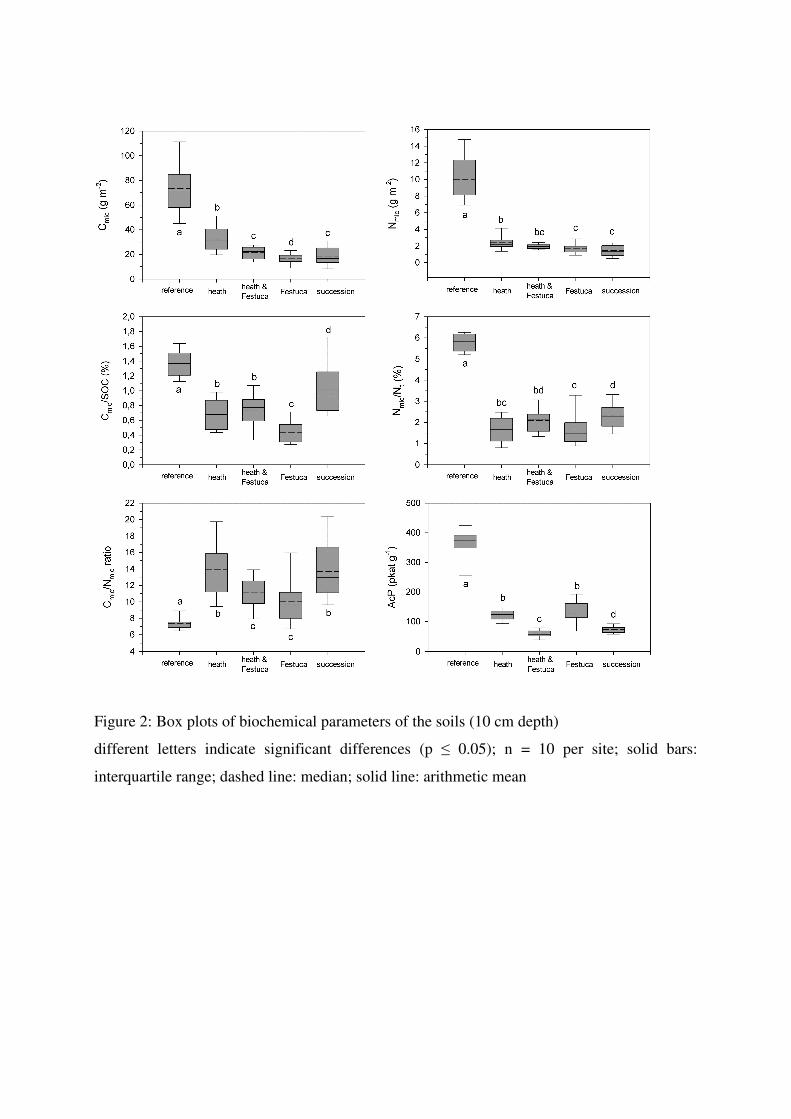
Figure 2: Box plots of biochemical parameters of the soils (10 cm depth)
different letters indicate significant differences (p ≤ 0.05); n = 10 per site; solid bars:
interquartile range; dashed line: median; solid line: arithmetic mean

Figure 3: Scatter plots with regression lines of selected properties. According to the cluster
analysis the data is classified into two groups: reference site (open circle, n = 10) and “Red
Area” group (full circle, n = 40). For correlation coefficients and level of significance see
table 5


