Embed Size (px)
Citation preview

This article appeared in a journal published by Elsevier. The attachedcopy is furnished to the author for internal non-commercial researchand education use, including for instruction at the authors institution
and sharing with colleagues.
Other uses, including reproduction and distribution, or selling orlicensing copies, or posting to personal, institutional or third party
websites are prohibited.
In most cases authors are permitted to post their version of thearticle (e.g. in Word or Tex form) to their personal website orinstitutional repository. Authors requiring further information
regarding Elsevier’s archiving and manuscript policies areencouraged to visit:
http://www.elsevier.com/copyright

Author's personal copy
Applied Catalysis B: Environmental 96 (2010) 314–322
Contents lists available at ScienceDirect
Applied Catalysis B: Environmental
journa l homepage: www.e lsev ier .com/ locate /apcatb
Solar photoactivity of nano-N-TiO2 from tertiary amine: role of defects andparamagnetic species
Francesca Spadavecchiaa, Giuseppe Cappelletti a,∗, Silvia Ardizzonea, Claudia L. Bianchia,Serena Cappelli a, Cesare Olivaa, Paolo Scardib, Matteo Leonib, Paola Fermoc
a Dipartimento di Chimica Fisica ed Elettrochimica, Università degli Studi di Milano, Via Golgi 19, 20133 Milano, Italyb Department of Materials Engineering and Industrial Technologies, University of Trento, 38050 Mesiano (TN), Italyc Dipartimento di Chimica Inorganica, Metallorganica ed Analitica, Università degli Studi di Milano, Via Venezian 21, 20133 Milano, Italy
a r t i c l e i n f o
Article history:Received 15 September 2009Received in revised form 15 February 2010Accepted 20 February 2010Available online 26 February 2010
Keywords:N-doped nanotitaniaSynchrotron radiation X-ray diffractionNOx degradationUnconventional methylene blue removalParamagnetic sites
a b s t r a c t
N-doped TiO2 nanocrystals were successfully synthesized by a controlled sol–gel reaction at pH 9 fol-lowed by calcinations at 400 ◦C. Triethylamine was used to modulate the N content of the samples. Thephotocatalytic activity was tested using a solar irradiation source with regard to two different pollu-tants: NOx (in the gas phase) and methylene blue (MB), deposited onto the oxide film. In the case of MBdegradation the disappearance of the (MB) blue colour was measured directly onto the solid, by meansof UV–vis-NIR diffuse reflectance spectroscopy. The final mineralization of the organic molecule wasassessed by COD determinations. All N-doped samples produce a better removal of both pollutants thanthe undoped and commercial samples. By coupling structural (by X-ray synchrotron radiation) and mor-phological (HRTEM, BET, granulometry) characterizations with spectroscopic analyses (EPR and XPS), thepresence of paramagnetic centers, defects, edge dislocations and surface states is appreciated and foundto affect the material photocatalytic behaviour.
© 2010 Elsevier B.V. All rights reserved.
1. Introduction
An enormous interest has been devoted, in recent years, to het-erogeneous photocatalysis using oxide semiconductors owing to itspotential applications to both environmental and energetic issues.Titanium dioxide, TiO2, is characterized by chemical and structuralstability, non-toxicity and cheapness, so that it represents one of themost important oxides employed in several fields of photochem-istry, e.g. in environmental remediation, photoelectrolysis of waterand in dye-sensitized solar cells [1–5]. With a 3.0–3.2 eV band-gap,TiO2 absorbs relatively little of the solar spectrum.
To shift the absorption edge to longer wavelength (>400 nm)doping of titania with metals (V, Mo, Ru, etc.) has been proposed,but often metal ions dopant may act as recombination centers ofe− and h+ [4]. Recently the anion-doped TiO2 has attracted con-siderable attention due to its reported activity in the visible light.The N-doped TiO2 seems to be the most promising among all theso-called second generation photocatalysts. Asahi et al. [6] first sug-gested that N doping reduces the band-gap due to the mixing of N2p with the O 2p states. Since then, there has been a great numberof publications describing enhanced visible light photochemistry inN-doped TiO2 although current debate on the fundamental under-
∗ Corresponding author. Tel.: +39 0250314228; fax: +39 0250314228.E-mail address: [email protected] (G. Cappelletti).
standing of the electronic and structural aspects of these materialsis wide open [7–12]. Some authors [10,11] proposed that elec-tronic transitions from localized nitrogen states (located close tothe valence band edge) to the conduction band of the metal oxidewere responsible for visible light response. Ihara et al. [12] andSerpone and co-workers [8,13] affirm, instead, that oxygen vacan-cies, stabilized by the presence of nitrogen as a result of chargecompensation, may act as colour centers, imparting visible lightresponse.
Recent results by Ohsawa et al. [9] show that N doping of bothTiO2 polymorphs results in a red shift in the optical absorptionspectrum which is interpreted as due to the generation of N 2pstates that extend the valence band into the visible. Bellardita etal. [14] very recently observed that N-doped samples with differ-ent light absorption and photocatalytic features could be obtained,depending on the preparation procedure and adopted TiO2precursor.
Also the structural localization of N species in the TiO2 lattice isa very debated aspect. Either substitutional or interstitial locationsare proposed in the literature also on the grounds of EPR and XPSspectroscopy data [13].
The above described results underline how a generalization ofthe relations between composition/structure and electronic struc-ture/photochemical properties is very difficult to obtain since slightvariations in the preparative procedure may lead to largely differentmaterials. These effects are so complex also due to the heteroge-
0926-3373/$ – see front matter © 2010 Elsevier B.V. All rights reserved.doi:10.1016/j.apcatb.2010.02.027

Author's personal copy
F. Spadavecchia et al. / Applied Catalysis B: Environmental 96 (2010) 314–322 315
neous, multiple orientation and defective nature of nanoparticleassemblies.
It is important to realize that frequently N-doped materialsare inactive in photo-oxidation, although absorbing visible light.Indeed, photogenerated charge carriers do not impart directly pho-toactivity since recombination phenomena might hinder them toreach the metal oxide surface.
Different methods are presented in the literature [13–17] toincorporate nitrogen in titanium dioxide; the most common pro-cedure implies the use of NH3 or of NH4Cl. Actually, in some cases,residual ammonium species may be trapped in the lattice at theend of calcination giving rise to spurious XPS signals [15].
On the grounds of what reported above, in this work triethy-lamine, in increasing amounts, is used as nitrogen source to obtaina series of N-doped TiO2 samples. The doping effect on the pho-toactivity is measured with respect to two different reactions:the degradation of NOx in the gas phase and the degradation MBdirectly onto the TiO2 film. In this latter case both discolorationand mineralization analyses of MB, deposited onto the oxide film,are performed. Structural characterization (by X-ray synchrotronradiation) and spectroscopic analyses (EPR and XPS), are used tointerpret the photocatalytic results.
2. Experimental
2.1. Synthesis of bare and nitrogen-doped TiO2 nanoparticles
Pure and doped titania samples were synthetized by sol–gelroute; titanium (IV) isopropoxide was used as the starting materialand triethylamine as nitrogen source. All reactants employed in thiswork were purchased by Aldrich and used without any other purifi-cation treatment; doubly distilled water passed through a Milli-Qapparatus was used to prepare solutions. Firstly, titanium precursor(30.7 mL) and 2-propanol (37.6 mL) were put into a 500 mL reac-tor with stirring for about 10 min to form a solution. A variableamount of triethylamine was used and then a KOH aqueous solution(180 mL) was added dropwise under vigorous stirring (300 rpm).The same stirring continued after the completion of addition. Atransparent fluid gel was formed for high N/Ti ratio. The molar-ity of the basic solution was adjusted to fix the pH around 9, whilethe water/alkoxide molar ratio was 100 and the water/2-propanolmolar ratio was 20.
The wet precursor was dried in oven as a xerogel (80 ◦Covernight) and subsequently calcined at 400 ◦C for 6 h under oxygenstream (9 NL/h).
As synthetized yellowish powders of nitrogen-doped titanium dioxide were denoted as TN x, withx = 0.01–0.05–0.10–0.20–0.40–0.50, because of the initial N/Timolar ratio. The undoped sample, prepared with the sameprocedure without triethylamine, was labelled as T.
Two different commercial samples were used to evaluatethe photocatalytic performances with respect to the home-madesamples: UV100 (by Sachtleben), pure anatase (〈D〉 = 10 nm), char-acterized by large surface area (SBET = 354 m2 g−1) and A 136 (AlfaAesar), pure anatase (〈D〉 = 18 nm), with surface area comparablewith the doped samples (SBET = 136 m2 g−1).
2.2. Sample characterization
X-ray diffraction measurements were conducted on the ID31high-resolution powder diffraction beamline at the European Syn-chrotron Radiation Facility (ESRF). Data were collected from 2◦ to75◦ 2� in Debye–Scherrer capillary geometry using a wavelength of0.3999284 Å at a speed of 2◦ 2�/min: the detector system includesa set of 9 silicon analyzers [18]. Wavelength was calibrated usingthe NIST SRM 640b Silicon standard, while the instrumental reso-
lution function was parameterised on the pattern of the NIST SRM660a Lanthanum hexaboride powder. The qualitative identificationof the phase composition was performed with the X’Pert Highscore2.2 software (PANAlytical b.v., Almelo, The Netherlands). The quan-tification conducted via the Rietveld method [19] as implementedin the TOPAS 4.2 software (Bruker AXS, Karlsruhe, Germany). TheWhole Powder Pattern Modelling (WPPM) method [20–22] wasemployed for the microstructural analysis of the powders. Theinstrumental contribution was obtained by parameterising a largeset of peak profiles from the NIST SRM 660a standard according tothe Caglioti et al. [23] relationship.
The BET surface area was determined by multipoint BET methodusing the adsorption data in the relative pressure (p/p0) range of0.05–0.3. Desorption isotherms were used to determine the poresize distribution using the Barret–Joyner–Halander (BJH) methodwith cylindrical pore size.
The particle populations of selected samples were analyzed bya BECKMAN COULTER N4 analyzer. The instrument uses PhotonCorrelation Spectroscopy (PCS), which determines particle size bymeasuring the rate of fluctuations in laser light intensity scatteredby particles as they diffuse through a fluid.
X-ray photoelectron spectra (XPS) were taken in an M-probe apparatus (Surface Science Instruments). The source wasmonochromatic Al K� radiation (1486.6 eV) as in Ref. [24]. Theaccuracy of the reported BE can be estimated to be ±0.2 eV.
HRTEM measurements were performed on a JEOL JEM-2100 URPmicroscope equipped with a Gatan Ultrascan 1000 CCD camera(2048 × 2048 pixels). Operating at 200 kV, the microscope reachesa point resolution of 0.19 nm and a line resolution of 0.14 nm:scale calibration was done on the Au (1 0 0) planes. Both dry andwet depositions were performed with ethanol and water as sol-vent. The best separation was obtained using water (micrographs ofwater dispersed powders are presented). Powders were depositedon carbon coated copper grids.
For the characterization of the light absorption features andband-gap determinations, diffuse reflectance spectra (DRS) of thepowders were measured on a UV–vis scanning spectrophotome-ter (Perkin-Elmer, Lambda 35), which was equipped with a diffusereflectance accessory. A TiO2 thin film was placed in the sampleholder on integrated sphere for the reflectance measurements. A“total white” Perkin-Elmer reference material was used as the ref-erence.
Electron paramagnetic resonance (EPR) spectra have beencollected at room temperature by means of a Bruker Elexsys spec-trometer at the working frequency of about 9.4 GHz. The spectralsimulations were obtained by the Bruker SimFonia programme[25].
2.3. Photocatalytic experiments
The photoactivity of the synthesized samples was tested withrespect to two different systems: (a) the degradation of NOx inthe gas phase, and (b) the degradation of MB on the “dry” TiO2film. In both cases the same irradiating source was adopted: a300 W solar lamp (Radium Sanolux HRC 300-280) emitting in the380–600 nm wavelength range (radiation intensity of I = 1.2 × 10⁻⁵
Einstein dm−3 s−1). TiO2 films were prepared by drop casting onglass supports (35 and 100 cm2 for NOx and MB, respectively) ofa fixed amount of the powder (20 and 40 mg for NOx and MB,respectively) dispersed in 2-propanol (5 mL) and by successiveevaporation of the solvent (40 ◦C). The powders were finely grindedbefore the deposition to improve the homogeneity of the final lay-ers.
(a) In the photocatalytic degradation of nitrogen oxides the immo-bilized photocatalyst was set into the pyrex reactor (with a
Author's personal copy
316 F. Spadavecchia et al. / Applied Catalysis B: Environmental 96 (2010) 314–322
volume of 50 L) and irradiated with the solar lamp describedabove at room temperature. The relative humidity was keptconstant in all the runs (50%). Air, NOx and N2 gas streamswere mixed to obtain the desired concentration (500 ppb),introduced inside the photoreactor and the photodegrada-tion products concentrations (NO and NO2) were continuouslymonitored by an on-line chemiluminescent analyzer (TeledyneInstruments M200E). Degradation time was limited at 120 mindue to the instrumental detection limit for NOx concentrationbelow 20 ppb. Blank tests in the dark and experiments in theabsence of photocatalyst were performed to assess the extentof NOx adsorption onto TiO2 layer (ca. 15% after 120 min) andof direct photolysis (<5% after 120 min).
(b) In the case of MB removal the TiO2 film was impregnatedby 500 �L of methylene blue (MB), giving a 60 ± 5 cm2 stain,in ethanol solution (0.02 M) and allowed to dry. The filmswere subsequently irradiated in air by the solar lamp for 7 hat room temperature; the position of the lamp (35 cm) wasselected such as to produce an irradiated area matching theMB stain one. The degradation of MB deposited onto the TiO2film was analyzed by following both the disappearance of theblue colour and also the final molecule mineralization. The dis-appearance of the MB blue colour was followed by analyzingdirectly the MB impregnated oxide by diffuse reflectance spec-tra acquired in the vis-NIR range from 350 to 1200 nm usinga JASCO/UV/vis/NIR spectrophotometer model V-570 equippedwith a barium sulphate integrating sphere. A block of mylarwas used as reference sample following a previously reportedprocedure [26]. The discoloration of MB was assessed on thegrounds of L*, a* and b* parameters adopting the procedurerecommended by the Commission Internationale de l’Eclairage(CIE) [26,27]. By this method the parameter L* represents thebrightness of a sample; a positive L* value stays for a light colourwhile a negative one corresponds to a dark colour; a* repre-sents the green (−) → red (+) axis and b* the blue (−) → yellow(+) axis.
COD (chemical oxygen demand) determinations were per-formed, after extraction of MB from the scratched powder witha fixed amount of HCl solution, to assess the amount of oxygenrequired to oxidize the organic compound to carbon dioxide andwater. COD values (reported as % mineralization) are normalizedwith respect both to the specific surface area of the oxide and tothe initial MB (non-irradiated) COD value (730 ± 10 mg/L).
3. Results and discussion
3.1. X-rays analysis
Synchrotron radiation X-ray diffraction was employed for thestructural/microstructural characterization of the powders. Withrespect to traditional laboratory instruments, the ID31 beamlineat the ESRF has a higher resolution, higher brilliance (necessary tooptimize the signal/noise ratio) and extremely low instrumentalcontribution to the diffraction pattern. The possibility of working
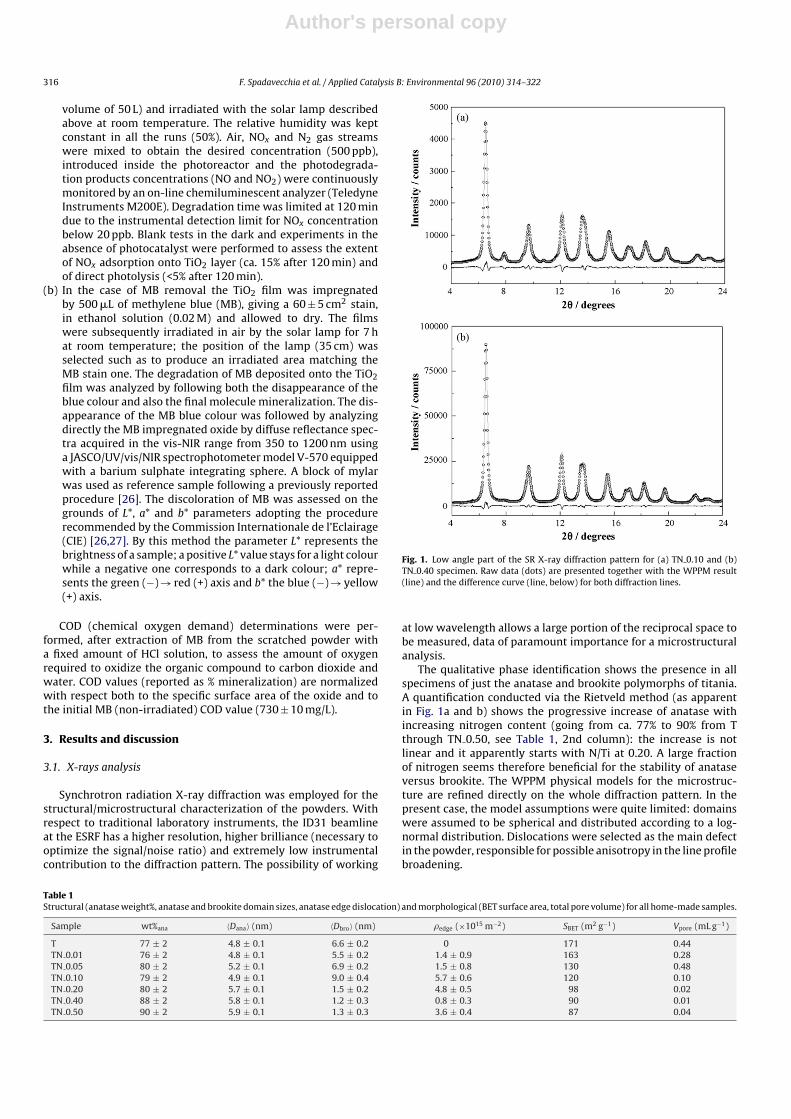
Fig. 1. Low angle part of the SR X-ray diffraction pattern for (a) TN 0.10 and (b)TN 0.40 specimen. Raw data (dots) are presented together with the WPPM result(line) and the difference curve (line, below) for both diffraction lines.
at low wavelength allows a large portion of the reciprocal space tobe measured, data of paramount importance for a microstructuralanalysis.
The qualitative phase identification shows the presence in allspecimens of just the anatase and brookite polymorphs of titania.A quantification conducted via the Rietveld method (as apparentin Fig. 1a and b) shows the progressive increase of anatase withincreasing nitrogen content (going from ca. 77% to 90% from Tthrough TN 0.50, see Table 1, 2nd column): the increase is notlinear and it apparently starts with N/Ti at 0.20. A large fractionof nitrogen seems therefore beneficial for the stability of anataseversus brookite. The WPPM physical models for the microstruc-ture are refined directly on the whole diffraction pattern. In thepresent case, the model assumptions were quite limited: domainswere assumed to be spherical and distributed according to a log-normal distribution. Dislocations were selected as the main defectin the powder, responsible for possible anisotropy in the line profilebroadening.
Table 1Structural (anatase weight%, anatase and brookite domain sizes, anatase edge dislocation) and morphological (BET surface area, total pore volume) for all home-made samples.
Sample wt%ana 〈Dana〉 (nm) 〈Dbro〉 (nm) �edge (×1015 m−2) SBET (m2 g−1) Vpore (mL g−1)
T 77 ± 2 4.8 ± 0.1 6.6 ± 0.2 0 171 0.44TN 0.01 76 ± 2 4.8 ± 0.1 5.5 ± 0.2 1.4 ± 0.9 163 0.28TN 0.05 80 ± 2 5.2 ± 0.1 6.9 ± 0.2 1.5 ± 0.8 130 0.48TN 0.10 79 ± 2 4.9 ± 0.1 9.0 ± 0.4 5.7 ± 0.6 120 0.10TN 0.20 80 ± 2 5.7 ± 0.1 1.5 ± 0.2 4.8 ± 0.5 98 0.02TN 0.40 88 ± 2 5.8 ± 0.1 1.2 ± 0.3 0.8 ± 0.3 90 0.01TN 0.50 90 ± 2 5.9 ± 0.1 1.3 ± 0.3 3.6 ± 0.4 87 0.04

Author's personal copy
F. Spadavecchia et al. / Applied Catalysis B: Environmental 96 (2010) 314–322 317
The microstructure analysis results, in terms of mean and vari-ance of the lognormal distribution, are shown in Table 1, 3rd and4th columns. A slight monotonic increase in the size of the anatasedomains 〈Dana〉 can be observed with increasing N/Ti molar ratios.In the case of brookite, instead, the maximum 〈Dbro〉 domain isobtained for N/Ti = 0.10, whereas for higher nitrogen concentra-tions (N/Ti > 0.20), a collapse of the brookite sizes is noted. The5th column of Table 1 reports the density of edge dislocationsappreciated in the N-doped samples: TN 0.10 shows the maximumcontent.
3.2. Morphological characterization
The specific surface areas and pore volumes of the home-madesamples are reported in Table 1 (columns 6th and 7th): both sur-face area and pore volume are shown to progressively decreasewith increasing the N content in the synthesis. These effects canbe related in part with the increase in the domain size observed byXRD, but possibly also with the progressive occurrence of sinter-ing phenomena, leading to larger aggregates for high N contents. Infact the distribution of the aggregate size 〈Dgran〉 by granulometryappears to be monomodal, centred around 500–300 nm for lowerN/Ti molar ratios, while for higher values the relevant presence ofmuch bigger aggregates (>10000 nm) can be appreciated.
The high-resolution transmission electron micrographs pre-sented in Fig. 2 confirm the XRD and BET results in terms ofapproximate average size and size uniformity. The tendency ofagglomeration, observed by granulometric measurements andindirectly by BET, is clear: it is quite difficult to observe isolated par-ticles in the powders, the tendency to high superposition increasingwith increasing nitrogen content. The various domains are wellcrystallised, but in some of them the effects of the deformationfield caused by the presence of dislocations can be observed.
3.3. XPS analyses
Survey XPS spectra were recorded for all samples. No significantpresence of impurities was observed, except for the ubiquitous car-bon contaminant. In the case of the latter element, only the C 1speak at 284.6 eV (due to –CH– species) was present, with averageTi/C atomic ratios always in the range 0.60–0.70.
The N/Ti atomic ratios of the present samples are reported inTable 2 (2nd column). These latter values are all lower (aroundone order of magnitude) than the starting molar ratios adoptedin the synthesis of the samples. Apparently an appreciable lossof N containing species occurs during calcination, as previouslyreported [7]. Further, XPS atomic ratios, which pertain to the sub-surface region, do not show an increasing trend with increasing theN amount adopted in the synthesis, but range around 0.02 for allsamples.
The peaks of Ti 2p are always regular showing the expected dou-blet with a binding energy (BE) of Ti 2p3/2 at 458.6 ± 0.2 eV whichis typical of Ti (IV) in the oxide [28,29].
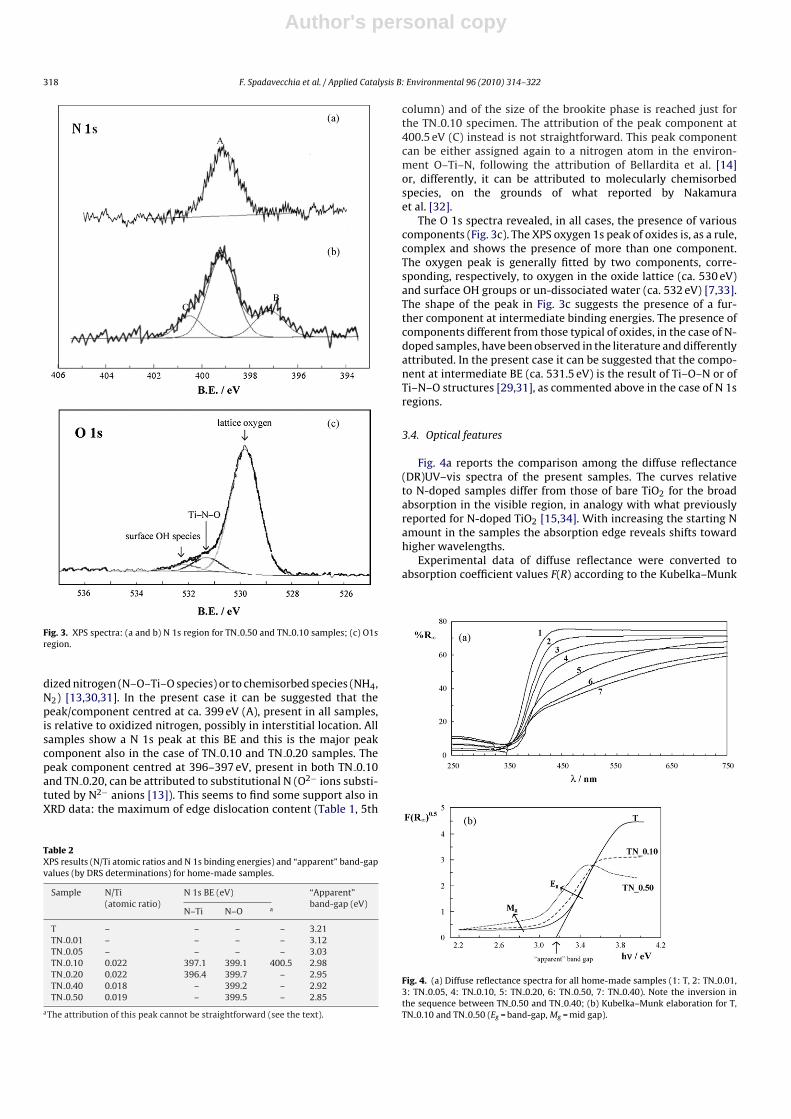
Fig. 3a and b reports the N 1s region of samples TN 0.50 (Fig. 3a)and TN 0.10 (Fig. 3b), respectively. The shape of the peak in Fig. 3ashows the presence of a single component, centred at 399.5 eV (A);the shape of the peak is common to the samples with the higherinitial content (TN 0.40 and TN 0.50). By contrast, the TN 0.10 andTN 0.20 samples show peaks which are broad and complex beingformed, respectively, by two or three components (see Table 2).The debate on the attribution of XPS N 1s peak components tospecific species or structures is definitely open and amply dis-cussed in the literature [13,30,31]. Peaks in the range (396–404 eV)were observed by several authors and variably attributed; gener-ally peaks at 396–397 eV were attributed to substitutional nitrogen(O–Ti–N linkages) while peaks at higher BE were attributed to oxi-
Fig. 2. HRTEM images of T, TN 0.10 and TN 0.50 samples.
Author's personal copy
318 F. Spadavecchia et al. / Applied Catalysis B: Environmental 96 (2010) 314–322
Fig. 3. XPS spectra: (a and b) N 1s region for TN 0.50 and TN 0.10 samples; (c) O1sregion.
dized nitrogen (N–O–Ti–O species) or to chemisorbed species (NH4,N2) [13,30,31]. In the present case it can be suggested that thepeak/component centred at ca. 399 eV (A), present in all samples,is relative to oxidized nitrogen, possibly in interstitial location. Allsamples show a N 1s peak at this BE and this is the major peakcomponent also in the case of TN 0.10 and TN 0.20 samples. Thepeak component centred at 396–397 eV, present in both TN 0.10and TN 0.20, can be attributed to substitutional N (O2− ions substi-tuted by N2− anions [13]). This seems to find some support also inXRD data: the maximum of edge dislocation content (Table 1, 5th
Table 2XPS results (N/Ti atomic ratios and N 1s binding energies) and “apparent” band-gapvalues (by DRS determinations) for home-made samples.
Sample N/Ti(atomic ratio)
N 1s BE (eV) “Apparent”band-gap (eV)
N–Ti N–O a
T – – – – 3.21TN 0.01 – – – – 3.12TN 0.05 – – – – 3.03TN 0.10 0.022 397.1 399.1 400.5 2.98TN 0.20 0.022 396.4 399.7 – 2.95TN 0.40 0.018 – 399.2 – 2.92TN 0.50 0.019 – 399.5 – 2.85
aThe attribution of this peak cannot be straightforward (see the text).
column) and of the size of the brookite phase is reached just forthe TN 0.10 specimen. The attribution of the peak component at400.5 eV (C) instead is not straightforward. This peak componentcan be either assigned again to a nitrogen atom in the environ-ment O–Ti–N, following the attribution of Bellardita et al. [14]or, differently, it can be attributed to molecularly chemisorbedspecies, on the grounds of what reported by Nakamuraet al. [32].
The O 1s spectra revealed, in all cases, the presence of variouscomponents (Fig. 3c). The XPS oxygen 1s peak of oxides is, as a rule,complex and shows the presence of more than one component.The oxygen peak is generally fitted by two components, corre-sponding, respectively, to oxygen in the oxide lattice (ca. 530 eV)and surface OH groups or un-dissociated water (ca. 532 eV) [7,33].The shape of the peak in Fig. 3c suggests the presence of a fur-ther component at intermediate binding energies. The presence ofcomponents different from those typical of oxides, in the case of N-doped samples, have been observed in the literature and differentlyattributed. In the present case it can be suggested that the compo-nent at intermediate BE (ca. 531.5 eV) is the result of Ti–O–N or ofTi–N–O structures [29,31], as commented above in the case of N 1sregions.
3.4. Optical features
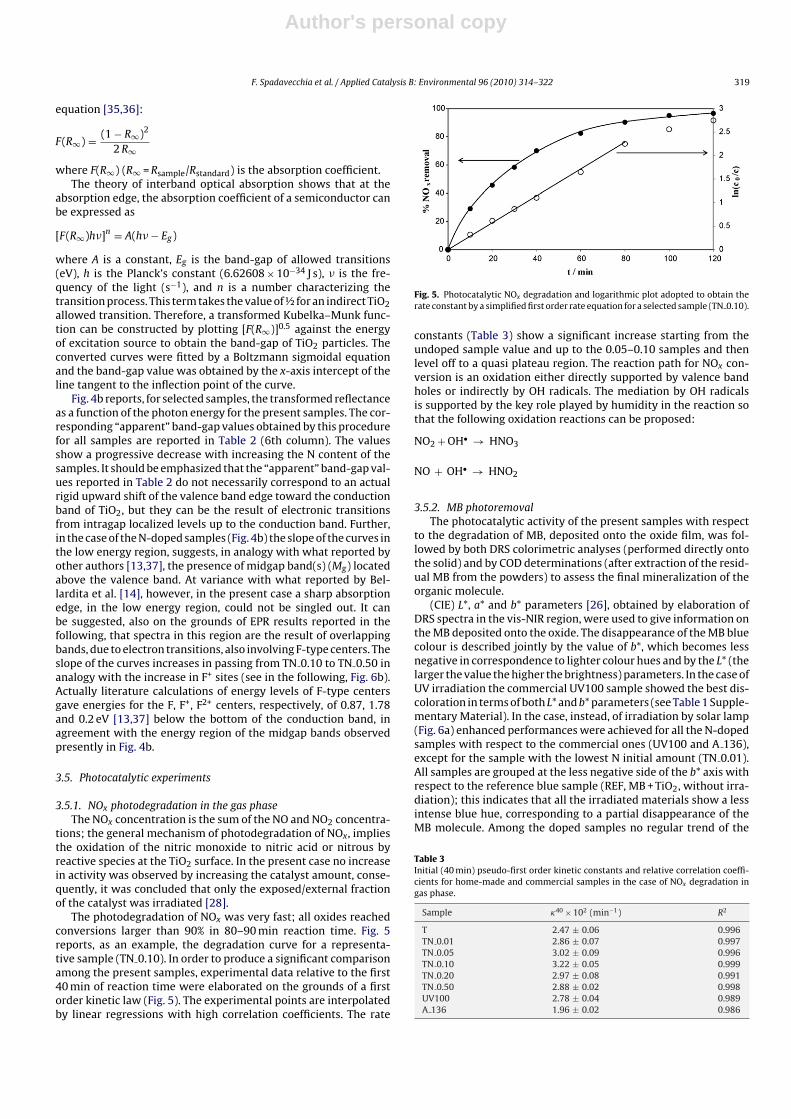
Fig. 4a reports the comparison among the diffuse reflectance(DR)UV–vis spectra of the present samples. The curves relativeto N-doped samples differ from those of bare TiO2 for the broadabsorption in the visible region, in analogy with what previouslyreported for N-doped TiO2 [15,34]. With increasing the starting Namount in the samples the absorption edge reveals shifts towardhigher wavelengths.
Experimental data of diffuse reflectance were converted toabsorption coefficient values F(R) according to the Kubelka–Munk
Fig. 4. (a) Diffuse reflectance spectra for all home-made samples (1: T, 2: TN 0.01,3: TN 0.05, 4: TN 0.10, 5: TN 0.20, 6: TN 0.50, 7: TN 0.40). Note the inversion inthe sequence between TN 0.50 and TN 0.40; (b) Kubelka–Munk elaboration for T,TN 0.10 and TN 0.50 (Eg = band-gap, Mg = mid gap).
Author's personal copy
F. Spadavecchia et al. / Applied Catalysis B: Environmental 96 (2010) 314–322 319
equation [35,36]:
F(R∞) = (1 − R∞)2
2 R∞
where F(R∞) (R∞ = Rsample/Rstandard) is the absorption coefficient.The theory of interband optical absorption shows that at the
absorption edge, the absorption coefficient of a semiconductor canbe expressed as
[F(R∞)h�]n = A(h� − Eg)
where A is a constant, Eg is the band-gap of allowed transitions(eV), h is the Planck’s constant (6.62608 × 10⁻³⁴ J s), � is the fre-quency of the light (s−1), and n is a number characterizing thetransition process. This term takes the value of ½ for an indirect TiO2allowed transition. Therefore, a transformed Kubelka–Munk func-tion can be constructed by plotting [F(R∞)]0.5 against the energyof excitation source to obtain the band-gap of TiO2 particles. Theconverted curves were fitted by a Boltzmann sigmoidal equationand the band-gap value was obtained by the x-axis intercept of theline tangent to the inflection point of the curve.
Fig. 4b reports, for selected samples, the transformed reflectanceas a function of the photon energy for the present samples. The cor-responding “apparent” band-gap values obtained by this procedurefor all samples are reported in Table 2 (6th column). The valuesshow a progressive decrease with increasing the N content of thesamples. It should be emphasized that the “apparent” band-gap val-ues reported in Table 2 do not necessarily correspond to an actualrigid upward shift of the valence band edge toward the conductionband of TiO2, but they can be the result of electronic transitionsfrom intragap localized levels up to the conduction band. Further,in the case of the N-doped samples (Fig. 4b) the slope of the curves inthe low energy region, suggests, in analogy with what reported byother authors [13,37], the presence of midgap band(s) (Mg) locatedabove the valence band. At variance with what reported by Bel-lardita et al. [14], however, in the present case a sharp absorptionedge, in the low energy region, could not be singled out. It canbe suggested, also on the grounds of EPR results reported in thefollowing, that spectra in this region are the result of overlappingbands, due to electron transitions, also involving F-type centers. Theslope of the curves increases in passing from TN 0.10 to TN 0.50 inanalogy with the increase in F+ sites (see in the following, Fig. 6b).Actually literature calculations of energy levels of F-type centersgave energies for the F, F+, F2+ centers, respectively, of 0.87, 1.78and 0.2 eV [13,37] below the bottom of the conduction band, inagreement with the energy region of the midgap bands observedpresently in Fig. 4b.
3.5. Photocatalytic experiments
3.5.1. NOx photodegradation in the gas phaseThe NOx concentration is the sum of the NO and NO2 concentra-
tions; the general mechanism of photodegradation of NOx, impliesthe oxidation of the nitric monoxide to nitric acid or nitrous byreactive species at the TiO2 surface. In the present case no increasein activity was observed by increasing the catalyst amount, conse-quently, it was concluded that only the exposed/external fractionof the catalyst was irradiated [28].
The photodegradation of NOx was very fast; all oxides reachedconversions larger than 90% in 80–90 min reaction time. Fig. 5reports, as an example, the degradation curve for a representa-tive sample (TN 0.10). In order to produce a significant comparisonamong the present samples, experimental data relative to the first40 min of reaction time were elaborated on the grounds of a firstorder kinetic law (Fig. 5). The experimental points are interpolatedby linear regressions with high correlation coefficients. The rate
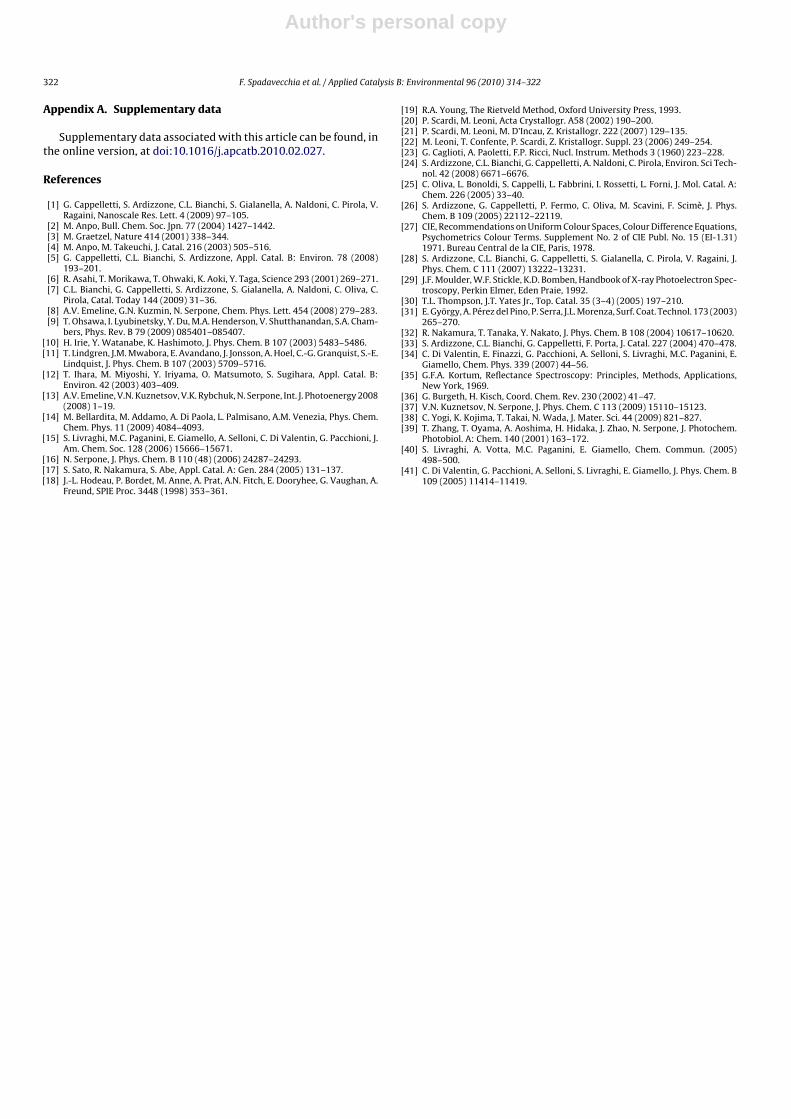
Fig. 5. Photocatalytic NOx degradation and logarithmic plot adopted to obtain therate constant by a simplified first order rate equation for a selected sample (TN 0.10).
constants (Table 3) show a significant increase starting from theundoped sample value and up to the 0.05–0.10 samples and thenlevel off to a quasi plateau region. The reaction path for NOx con-version is an oxidation either directly supported by valence bandholes or indirectly by OH radicals. The mediation by OH radicalsis supported by the key role played by humidity in the reaction sothat the following oxidation reactions can be proposed:
NO2 + OH• → HNO3
NO + OH• → HNO2
3.5.2. MB photoremovalThe photocatalytic activity of the present samples with respect
to the degradation of MB, deposited onto the oxide film, was fol-lowed by both DRS colorimetric analyses (performed directly ontothe solid) and by COD determinations (after extraction of the resid-ual MB from the powders) to assess the final mineralization of theorganic molecule.
(CIE) L*, a* and b* parameters [26], obtained by elaboration ofDRS spectra in the vis-NIR region, were used to give information onthe MB deposited onto the oxide. The disappearance of the MB bluecolour is described jointly by the value of b*, which becomes lessnegative in correspondence to lighter colour hues and by the L* (thelarger the value the higher the brightness) parameters. In the case ofUV irradiation the commercial UV100 sample showed the best dis-coloration in terms of both L* and b* parameters (see Table 1 Supple-mentary Material). In the case, instead, of irradiation by solar lamp(Fig. 6a) enhanced performances were achieved for all the N-dopedsamples with respect to the commercial ones (UV100 and A 136),except for the sample with the lowest N initial amount (TN 0.01).All samples are grouped at the less negative side of the b* axis withrespect to the reference blue sample (REF, MB + TiO2, without irra-diation); this indicates that all the irradiated materials show a lessintense blue hue, corresponding to a partial disappearance of theMB molecule. Among the doped samples no regular trend of the
Table 3Initial (40 min) pseudo-first order kinetic constants and relative correlation coeffi-cients for home-made and commercial samples in the case of NOx degradation ingas phase.
Sample �40 × 102 (min−1) R2
T 2.47 ± 0.06 0.996TN 0.01 2.86 ± 0.07 0.997TN 0.05 3.02 ± 0.09 0.996TN 0.10 3.22 ± 0.05 0.999TN 0.20 2.97 ± 0.08 0.991TN 0.50 2.88 ± 0.02 0.998UV100 2.78 ± 0.04 0.989A 136 1.96 ± 0.02 0.986

Author's personal copy
320 F. Spadavecchia et al. / Applied Catalysis B: Environmental 96 (2010) 314–322
Fig. 6. (a) Discoloration efficiency (L*a*b* parameters) and (b) relative % mineral-ization by COD determinations for all samples.
discoloration with the N initial amount is appreciable. It shouldbe considered that differences in the oxides surface area may alsoaffect the discoloration efficiency. TN 0.40 appears to be the mostactive oxide showing the largest L* and very negative b* values.
The discoloration of MB does not necessarily correspond to theoxidation and mineralization of the molecule; in fact there exists areduced form of MB (LMB, leuco) which is colourless [38]. Differentdegradative routes and intermediates are reported in the literatureto degrade MB [38,39]. To verify if the discoloration apparent inFig. 6a is the result of the formation of LMB or of the actual moleculemineralization, COD determinations were performed at the end ofthe reaction. Fig. 6b reports the oxygen demand as a function ofthe N amount in the TiO2 samples. All doped samples are moreactive than commercial and undoped ones. The performances pro-gressively increase with the N content up to an optimum for sampleTN 0.10 (10% initial N/Ti molar ratio) attaining lower values at evenhigher N/Ti molar ratios. It is interesting to note that the samplesproducing either best discoloration (TN 0.40) or best mineraliza-tion (TN 0.10) are not the same. Further, it can be recalled thatthe sample (TN 0.10) producing the best MB mineralization andNOx degradation shows the complex XPS pattern (Fig. 3b) with alsosubstitutional N sites and the largest content of edge dislocations.
The lack of coincidence between the best performing samples,with respect to either discoloration or mineralization, can be theresult of different routes followed by MB during irradiation.
Fig. 7. (a) EPR spectra obtained at room temperature: (1) TN 0.10, (2) TN 0.10 sim-ulation, (3) N/Ti ≥ 0.20 and (4) difference between curve 3 and 2 multiplied by 1.36;(b) F+/Nb
• ratio for samples with initial molar ratio N/Ti ≥ 0.20.
The molecule can be either transformed into LMB throughreduction by electrons in the conduction band or oxidized, by inter-actions with the valence band holes or native OH• species, startingwith a demethylation step to be finally mineralized. For long reac-tion times also LMB can be further degradated and mineralized.
3.6. EPR analyses
EPR measurements have been performed to analyze the param-agnetic species, induced in the samples by the N doping itself.
The EPR pattern of all the N-doped samples is characterizedby an intensity increasing with increasing the N/Ti starting ratio.Fig. 7a (curve 1) reports, as an example, the curve of TN 0.10.The spectral profile was simulated by hypothesizing an unpairedelectron with Zeeman energy parameters gx = 2.0066; gy = 2.0054;gz = 2.0040 and interacting with a nuclear magnetic momentI = 1 through the hyperfine coupling parameters Ax ≈ Ay ≈ 3 G andAz ≈ 32.2 G (Fig. 6a, curve 2). Similar patterns have been reportedin [40] and attributed to different species, located in the bulk of theN-TiO2 microcrystals. Furthermore, theoretical calculations [41]led to attribute features like these to Ns (substitutional) or to Ni(interstitial) doping nitrogen atoms, both giving very similar EPRpatterns, not resolvable from each other. Therefore these specieswill be simply indicated by Nb
•, i.e. as bulk nitrogen paramagneticdefects [15]. A second paramagnetic component appears in the EPRspectrum of samples with the N/Ti ≥ 0.20 (Fig. 7a, curve 3). In orderto single out the contribution of this latter component a subtractionprocedure between curve 3 and curve 2 (multiplied by 1.36) was

Author's personal copy
F. Spadavecchia et al. / Applied Catalysis B: Environmental 96 (2010) 314–322 321
performed. This line (Fig. 7a, curve 4) was Lorentzian-shaped, withg = 2.0023 and peak-to-peak width of 5 G. This feature is attributedto paramagnetic F+ centers, also on the grounds of the optical results(Fig. 7a and b). F centers can occur in oxides as the result of oxy-gen vacancies. In the case of N-doped TiO2 the formation of oxygenvacancies is supported by charge compensation mechanisms, ensu-ing the presence of N in the lattice. The following reactions, for theformation of F centers can be proposed:
VO•• + 2e− → VO(F)
VO•• + 1e− → VO
•(F+)
where VO•• is an electron-pair deficient oxygen vacancy (anion
vacancy, F++ center).It has been demonstrated that the fundamental level of F+ is
energetically lower than that of F centers [13].With increasing the N/Ti starting ratio the overall spectral inten-
sity of the samples increases, and, at the same time, also the F+/Nb•
ratio is observed to increase up to N/Ti = 0.4 and then to level off(Fig. 7b). The increase of the dopant N in TiO2 is reported to pro-duce a parallel increase in oxygen vacancies, due to the loweringof the energy threshold for their formation [15]; however, a trendcomparable to the one reported in Fig. 7b has not been reportedpreviously, to the authors best knowledge.
EPR characterizations can help to further interpret results fromthe photocatalytic activity of the samples. It can be proposed thatthe two different paramagnetic species present in the N-dopedTiO2 samples promote two reaction paths: (i) the oxidation andfinal mineralization of both NOx and MB are supported by Nb
• cen-ters, which are generally reported to behave as strong oxidizers;(ii) the reduction of MB to LMB, instead, may be promoted by F+
centers, able to donate one electron, giving the doubly charged F++
centers (anion vacancy). The TN 0.40 sample shows the best dis-coloration of MB (Fig. 6a), in accordance with its top content ofF+ centers. Indeed, the most efficient sample for both pollutantsmineralization is actually the TN 0.10 sample which contains themaximum amount of Nb
• centers, in the absence of F+ centers.Apparently the best performance for the oxidation reactions shownby TN 0.10 suggests that the concomitant presence of Nb
• and F+
centers reduces the photocatalytic activity, due to the occurrence ofrecombination processes. It is interesting to compare the best NOx
and MB mineralization efficiency of TN 0.10 with the dislocationcontent in anatase: the best mineralization is observed when themaximum of edge dislocations is achieved (TN 0.10, see Table 1,5th column).
Upon ageing, the EPR features of the samples undergo appre-ciable modifications, especially in the case of samples showing thepresence of F+ centers. By storing the prepared N-TiO2 samples, asdry powders in closed vessels for long time lengths (months), the
Fig. 8. F+/Nb• ratio for fresh, aged and regenerated TN 0.50 sample.
F+/Nb• is observed to increase leading to samples containing only
F+ paramagnetic centers. Upon heating the samples, in air, the ini-tial F+/Nb
• is almost restored. Fig. 8 reports, as an example, the caseof sample TN 0.50. The following forward reaction can be proposedto take place upon ageing:
Nb• + F � Nb
− + F+
The energetically favoured reduction of Nb• occurs upon stand-
ing in a poor oxygen containing environment, while the backwardreaction occurs by heating in oxidizing conditions.
4. Conclusions
A series of N-doped TiO2 samples were prepared by a sol–gelprocedure, from titanium (IV) isopropoxide, at pH 9, using tri-ethylamine as the nitrogen source. The calcination at 400 ◦Cpromoted the crystallization yielding anatase–brookite compositenanocrystals showing increasing anatase content with increasingthe starting N/Ti ratio. Larger nitrogen contents appear, therefore,to be beneficial for the stability of anatase versus brookite.
The starting N/Ti molar ratio appeared to affect also the nature ofthe paramagnetic species present in the samples: for N/Ti < 0.2 onlythe Nb
• paramagnetic species, already described in the literaturefor N-doped samples could be appreciated. For higher N/Ti atomicratios a second paramagnetic species was observed which, also onthe grounds of optical determinations, was interpreted as a colourF+ center. The F+/Nb
• increases reaching a maximum for N/Ti = 0.40.The balance between the two different paramagnetic species wasaffected also by ageing the dry powders for long times (months):the F+/Nb
• was observed to increase leading to samples containingonly F+ paramagnetic centers. Upon heating the samples in air theinitial F+/Nb
• was almost restored. Such effect was not previouslyreported in the literature.
The photoactivity was tested with respect to the NOx degrada-tion in gas phase and to the “dry” degradation of methylene bluedeposited onto the oxide film. This latter experiment are unconven-tional for photocatalysis, since dyes are, as a rule, photodegradatedin solution. A further distinctive aspect of this procedure lies in thedirect evaluation of the disappearance of the blue colour directlyon the film by means of C–L*a*b* elaboration of diffuse reflectancespectroscopy data. The final mineralization of the dye molecule wasalso, independently, verified by COD determinations. For both pol-lutant reactions, under solar irradiation, the N-doped samples weremore active than the corresponding bare TiO2 and the two com-mercial samples, probably due to their greater photon absorption.The sample showing the best NOx degradation and MB mineral-ization is the one showing the top content of Nb
• species in theabsence of F+ centers. Instead the best MB discoloration is producedby the sample showing the largest F+/Nb
• ratio. To the authors bestknowledge no similar finding is present in the literature. It can besuggested that F+ centers, able to donate one electron to give thedoubly charged F++ center (anion vacancy) may reduce MB to LMB.
The best oxidation/mineralization efficiency is presented by asample having both interstitial and substitutional N species andalso showing the maximum content of edge dislocations. It canbe suggested that the active Nb
• centers correspond to nitrogentrapped on the edge dislocation line (and dragged by it) and inter-acting with the deformation field of the dislocation.
Acknowledgements
The authors wish to thank Dr. Emmanuel Garnier of Universitède Poitiers for the HRTEM determinations. This research has beensupported by the University of Milan Research Funds (FIRST, PUR).
Author's personal copy
322 F. Spadavecchia et al. / Applied Catalysis B: Environmental 96 (2010) 314–322
Appendix A. Supplementary data
Supplementary data associated with this article can be found, inthe online version, at doi:10.1016/j.apcatb.2010.02.027.
References
[1] G. Cappelletti, S. Ardizzone, C.L. Bianchi, S. Gialanella, A. Naldoni, C. Pirola, V.Ragaini, Nanoscale Res. Lett. 4 (2009) 97–105.
[2] M. Anpo, Bull. Chem. Soc. Jpn. 77 (2004) 1427–1442.[3] M. Graetzel, Nature 414 (2001) 338–344.[4] M. Anpo, M. Takeuchi, J. Catal. 216 (2003) 505–516.[5] G. Cappelletti, C.L. Bianchi, S. Ardizzone, Appl. Catal. B: Environ. 78 (2008)
193–201.[6] R. Asahi, T. Morikawa, T. Ohwaki, K. Aoki, Y. Taga, Science 293 (2001) 269–271.[7] C.L. Bianchi, G. Cappelletti, S. Ardizzone, S. Gialanella, A. Naldoni, C. Oliva, C.
Pirola, Catal. Today 144 (2009) 31–36.[8] A.V. Emeline, G.N. Kuzmin, N. Serpone, Chem. Phys. Lett. 454 (2008) 279–283.[9] T. Ohsawa, I. Lyubinetsky, Y. Du, M.A. Henderson, V. Shutthanandan, S.A. Cham-
bers, Phys. Rev. B 79 (2009) 085401–085407.[10] H. Irie, Y. Watanabe, K. Hashimoto, J. Phys. Chem. B 107 (2003) 5483–5486.[11] T. Lindgren, J.M. Mwabora, E. Avandano, J. Jonsson, A. Hoel, C.-G. Granquist, S.-E.
Lindquist, J. Phys. Chem. B 107 (2003) 5709–5716.[12] T. Ihara, M. Miyoshi, Y. Iriyama, O. Matsumoto, S. Sugihara, Appl. Catal. B:
Environ. 42 (2003) 403–409.[13] A.V. Emeline, V.N. Kuznetsov, V.K. Rybchuk, N. Serpone, Int. J. Photoenergy 2008
(2008) 1–19.[14] M. Bellardita, M. Addamo, A. Di Paola, L. Palmisano, A.M. Venezia, Phys. Chem.
Chem. Phys. 11 (2009) 4084–4093.[15] S. Livraghi, M.C. Paganini, E. Giamello, A. Selloni, C. Di Valentin, G. Pacchioni, J.
Am. Chem. Soc. 128 (2006) 15666–15671.[16] N. Serpone, J. Phys. Chem. B 110 (48) (2006) 24287–24293.[17] S. Sato, R. Nakamura, S. Abe, Appl. Catal. A: Gen. 284 (2005) 131–137.[18] J.-L. Hodeau, P. Bordet, M. Anne, A. Prat, A.N. Fitch, E. Dooryhee, G. Vaughan, A.
Freund, SPIE Proc. 3448 (1998) 353–361.
[19] R.A. Young, The Rietveld Method, Oxford University Press, 1993.[20] P. Scardi, M. Leoni, Acta Crystallogr. A58 (2002) 190–200.[21] P. Scardi, M. Leoni, M. D’Incau, Z. Kristallogr. 222 (2007) 129–135.[22] M. Leoni, T. Confente, P. Scardi, Z. Kristallogr. Suppl. 23 (2006) 249–254.[23] G. Caglioti, A. Paoletti, F.P. Ricci, Nucl. Instrum. Methods 3 (1960) 223–228.[24] S. Ardizzone, C.L. Bianchi, G. Cappelletti, A. Naldoni, C. Pirola, Environ. Sci Tech-
nol. 42 (2008) 6671–6676.[25] C. Oliva, L. Bonoldi, S. Cappelli, L. Fabbrini, I. Rossetti, L. Forni, J. Mol. Catal. A:
Chem. 226 (2005) 33–40.[26] S. Ardizzone, G. Cappelletti, P. Fermo, C. Oliva, M. Scavini, F. Scimè, J. Phys.
Chem. B 109 (2005) 22112–22119.[27] CIE, Recommendations on Uniform Colour Spaces, Colour Difference Equations,
Psychometrics Colour Terms. Supplement No. 2 of CIE Publ. No. 15 (EI-1.31)1971. Bureau Central de la CIE, Paris, 1978.
[28] S. Ardizzone, C.L. Bianchi, G. Cappelletti, S. Gialanella, C. Pirola, V. Ragaini, J.Phys. Chem. C 111 (2007) 13222–13231.
[29] J.F. Moulder, W.F. Stickle, K.D. Bomben, Handbook of X-ray Photoelectron Spec-troscopy, Perkin Elmer, Eden Praie, 1992.
[30] T.L. Thompson, J.T. Yates Jr., Top. Catal. 35 (3–4) (2005) 197–210.[31] E. György, A. Pérez del Pino, P. Serra, J.L. Morenza, Surf. Coat. Technol. 173 (2003)
265–270.[32] R. Nakamura, T. Tanaka, Y. Nakato, J. Phys. Chem. B 108 (2004) 10617–10620.[33] S. Ardizzone, C.L. Bianchi, G. Cappelletti, F. Porta, J. Catal. 227 (2004) 470–478.[34] C. Di Valentin, E. Finazzi, G. Pacchioni, A. Selloni, S. Livraghi, M.C. Paganini, E.
Giamello, Chem. Phys. 339 (2007) 44–56.[35] G.F.A. Kortum, Reflectance Spectroscopy: Principles, Methods, Applications,
New York, 1969.[36] G. Burgeth, H. Kisch, Coord. Chem. Rev. 230 (2002) 41–47.[37] V.N. Kuznetsov, N. Serpone, J. Phys. Chem. C 113 (2009) 15110–15123.[38] C. Yogi, K. Kojima, T. Takai, N. Wada, J. Mater. Sci. 44 (2009) 821–827.[39] T. Zhang, T. Oyama, A. Aoshima, H. Hidaka, J. Zhao, N. Serpone, J. Photochem.
Photobiol. A: Chem. 140 (2001) 163–172.[40] S. Livraghi, A. Votta, M.C. Paganini, E. Giamello, Chem. Commun. (2005)
498–500.[41] C. Di Valentin, G. Pacchioni, A. Selloni, S. Livraghi, E. Giamello, J. Phys. Chem. B
109 (2005) 11414–11419.