Embed Size (px)
Citation preview

Biophysical Journal Volume 65 July 1993 469-491
Solutions for Transients in Arbitrarily Branching Cables:Ill. Voltage Clamp Problems
Guy MajorUniversity Laboratory of Physiology, Oxford, OX1 3PT, United Kingdom
ABSTRACT Branched cable voltage recording and voltage clamp analytical solutions derived in two previous papers are usedto explore practical issues concerning voltage clamp. Single exponentials can be fitted reasonably well to the decay phase ofclamped synaptic currents, although they contain many underlying components. The effective time constant depends on thefit interval. The smoothing effects on synaptic clamp currents of dendritic cables and series resistance are explored with a singlecylinder + soma model, for inputs with different time courses. "Soma" and "cable" charging currents cannot be separated easilywhen the soma is much smaller than the dendrites. Subtractive soma capacitance compensation and series resistance com-
pensation are discussed. In a hippocampal CAl pyramidal neurone model, voltage control at most dendritic sites is extremelypoor. Parameter dependencies are illustrated. The effects of series resistance compound those of dendritic cables and dependon the "effective capacitance" of the cell. Plausible combinations of parameters can cause order-of-magnitude distortions toclamp current waveform measures of simulated Schaeffer collateral inputs. These voltage clamp problems are unlikely to besolved by the use of switch clamp methods.
INTRODUCTION
Analytical solutions for voltage transients in branched cablestructures have been presented in Paper I (1) and Paper 11 (2)of this series. In this paper, the solutions are used to exploresome practical problems of space clamp and imperfect volt-age clamp. A number of important biological points will bemade using two example models: (i) a single cylinder +soma model based on the "basal" half of the layer III corticalpyramidal cell from Paper I, and (ii) the hippocampal CAlpyramidal cell from Paper I. As in Paper II, two basic voltageclamp scenarios are considered: Case I, synaptic inputs andclamp to zero; and Case II, voltage commands in the absenceof synaptic inputs.The simple geometry of Example 1 will be used to illus-
trate general points first, before more specific details areconsidered using the complex geometry ofExample 2. Build-ing on the examples in Paper II, further explorations arecarried out of: (a) the effects of dendritic cables and seriesresistance on the rise times, peak currents and apparent decaytime constants of synaptic clamp currents, (b) some resultspresented recently by Jackson (3), (c) the degree of voltageclamp control of subsynaptic voltage swings, (d) parameterdependence, and (e) propagation of voltage commands downdendritic trees.The examples are intended primarily to be illustrative, and
the explorations are by no means exhaustive. Neverthelesssome of the conclusions are likely to be robust, in particularthe demonstrations of the inadequacy of voltage clamp formany purposes. For Lists of Symbols, see Papers I and II.
Received for publication 22 October 1992 and in final form 26 February1993.Address reprint requests to Guy Major at the University Laboratory of Phys-iology, Parks Rd., Oxford, OXI 3PT, United Kingdom.C 1993 by the Biophysical Society0006-3495/93/07/469/23 $2.00
EXAMPLE 1: SINGLE CYLINDER + SOMA MODEL
Two different aspects of voltage clamp, a and b above, areinvestigated in this section, using a single cylinder + somamodel.
The model
The model has the following "raw" morphological and elec-trical parameters: length 1 = 1000 ,um, diameter d = 10 ,um,soma diameter ds = 20 ,um, specific membrane capacitanceCm = 1 ,uFcm-2, specific membrane resistance Rm = 50,000fkm2, cytoplasmic resistivity Ri = 250 fQcm, gshunt = 0 nS.With these parameters, the electrotonic length L = 0.4472,the soma membrane resistance Rsm = 3.98 Gfl and the somacapacitance c, = 12.57 pF. The dimensions of the cylinderare the same as those of the "basal" part (i.e., basal + apicaloblique dendrites collapsed together) of the two-cylinder +soma model used in Papers I and II (based on a typical ratlayer III visual cortical pyramidal cell). The electrical pa-rameters are also well within the biological range of interest(e.g., Refs. 4 and 5).
Case 1: Distortion of synaptic currents by thedendritic cable and series resistance
Both dendritic cables and series resistance can slow and at-tenuate synaptic currents measured using voltage clamp(e.g., Paper II, Example 2). Rall and Segev (6) and Johnstonand Brown (7) concluded that space clamp problems becomeworse the faster the input time course and that it is thereforeimportant to consider the frequency-dependent electricalgeometry of the cell as well as the steady-state electrotonicdistance of the input site from the clamp point (see also Ref.8). It is important to re-emphasize these conclusions givenmounting evidence that some synaptic conductances may beextremely rapid. Rise times of the order of a few hundredmicroseconds have been reported (e.g., Refs. 9-15).
469

Volume 65 July 1993
Waveform measures
A number of waveform measures are commonly used to char-acterize experimental synaptic clamp currents, for example:peak current, rise time (20-80% or 10-90%), half-width,decay time constant, and half decay time. In general, 20-80%rise times are about 2/3 as long as 10-90% rise times and areprobably easier to measure when the waveforms are noisy.Examples of both are given below.The clamp current waveforms produced by the analytical
solution contain a number of exponential components in theirdecay phases, particularly when the neuronal geometry iscomplex (e.g., Paper II, Table 2). Included in these are com-ponents with time constants associated with the inputs (seePaper I, Responses to Other Inputs section). Despite this,when only one receptor type is activated, the decay phasesof both experimental and simulated synaptic clamp currentsare often reasonably well fitted by single exponentials (e.g.,Refs. 15-18, Ref. 5 (Chapters 5 and 6); also see next section).
Spruston et al. (8), by contrast, found that single expo-nentials are often inadequate and prefer to use half decaytimes instead. Decisions about the acceptability of single ex-ponential fits are very dependent on the criteria used. Thepresence of noise in experimental traces may obscure thepresence of multiple time constants. Fits that appear accept-able using a linear voltage axis are often revealed to be in-adequate when a logarithmic voltage axis is used: see thediscussion on "slow bends" in the Paper I, which appliesequally well to clamp currents. Apparent time constantsslower than To can result when fitting starts too soon after thepeak, particularly in the case of distal inputs. These caveatsapply equally well to compartmental model simulations us-ing synaptic conductances as opposed to currents, particu-larly when the conductance is relatively small compared withthe input conductance of the cell, and when it is brief com-pared with To.Few studies appear to use statistical criteria in the assess-
ment of fits, but see Refs. 5 and 19 for discussions of"fit standard deviations" (fit S.D.s), defined below, and"goodness-of-fit" (G.O.F.) scores between target and fitwaveforms; also see Ref. 5 for a method based on confidenceintervals around waveforms. Many studies do not specify thefit intervals used, or whether the time constants vary sig-nificantly with changes in interval.
Using the analytical solution waveform generator pro-grams, single exponential currents with total charge 1 pC andvarious decay time constants Tsy were injected into the singlecylinder + soma model at various locations. The soma wasclamped to zero (rest) via various series resistances Rser, andthe clamp currents were recorded. Peak currents and 20-80%rise times (t2080) were measured.
Given that experimenters do regularly quote decay timeconstants, some compromises are necessary in order to gainmodelling insights into this waveform measure. Apparent(effective) decay time constants Teff were estimated follow-ing the standardized procedure in Ref. 15: each clamp currentwaveform was fitted with a single exponential betweentpeak + 0.7 and tpeak + 20 ms, using peeling (20), and two
fitting programs, one based on the Levenberg-Marquardt andthe other on the simplex algorithm (Ref. 21, Chapter 10).These fit intervals are somewhat arbitrary, but seemed towork reasonably well for this model, the CAl pyramidal cellmodel described in the next section, and for a CA3 pyramidalcell model (Refs. 5 (Chapter 6) and 15). Obviously the in-tervals would have to be adjusted in cases where the mem-brane time constants were much slower or faster than the 50ms used here. In the future, to allow easier comparison be-tween studies, it may be helpful if experimenters and mod-ellers estimate T7525 (the effective time constant over theinterval t75 to t25) or t7327 (t27 - t73), as discussed in PaperII. The warnings in Paper I are repeated here: the time con-stants obtained can be very sensitive to the exact intervalchosen!The fit S.D. is calculated as
i2 1/2
S.D. = Y(Di- Fj)2 In 1)
\i=il(1)
where iI and i2 are the indices of the first and last points inthe fit interval, n = i2 - il + 1, Di is the ith data value, andFi is the value of the ith point in the fit waveform. The fitwith the smallest S.D. from the target was selected (in mostcases all three methods gave very similar results). Here, fitswith an S.D. > 0.003 appeared unacceptable by eye, andwere rejected. Fits with an S.D. < 0.0003 appeared very goodby eye. It must be emphasized that these criteria apply onlyto this situation: changes in the input or the model, or theaddition of noise, could make a quantitative difference. Forthe current waveforms produced by the single cylinder +soma model, most of the optimal single exponential S.D.values were around 0.001-0.003, i.e., the fits were far fromperfect, but were plausible when inspected using a linearcurrent axis. When the current was inverted and a logarithmiccurrent axis was used, however, it was obvious in many cases(particularly for the more distal inputs) that the intervalspanned an upwardly convex portion of the waveform: theapparent time constant was slower than T. Many of the moreproximal inputs showed the opposite behavior: the apparenttime constant was faster than To, because the fit interval oc-curred during an upwardly concave part of the waveform, orslow bend (see Paper I). In all cases Teff was slower than sy.
These points are illustrated in Fig. 1. The top two panelsshow waveforms plotted with linear current axes, the lowertwo show the same transients using logarithmic current axes.In the left-hand panels, a single exponential current with adecay time constant Tsy of 2 ms and a total charge Q of 1 pCis injected into the model at one of four locations (the soma,and z = 100, 200, and 1000 ,um). The soma is perfectlyclamped to zero. The resulting clamp current waveforms inFig. 1 A (dotted lines) demonstrate the filtering effect of thedendritic cable: the clamp current becomes progressivelymore smoothed, and its peak becomes more attenuated as theinput site is moved away from the soma. The solid lines arethe optimal single exponential fits to each response: althoughthe fits are not perfect, it is easy to imagine that with the
470 Biophysical Journal

Analytical Solutions: Voltage Clamp Problems
Voltage Clamp of Synaptic Inputs
Dendritic Location:A: Linear Plots
Q = 1 pCIT = 2ms
perfect clamp to 0
Series Resistance:C: Linear Plots
Q= I pC;y= 2 ms
clamp to 0
0 5 10 15 20 25 0 5 10 15Time [ms] Time [ms]
B: Semi-log Plots
Tff 4.83-sd 0.0012
D: Semi-log Plots
0.1:
-
-6
ctCD0Cu1
0
0 5 10 15Time [ms]
0.001
0.0005
1;¢ff 2sd 0.00\00\
20 25 0 5 10 15Time [ms]
FIGURE 1 Single cylinder + soma model, I = 1000, d = 10, d, = 20 ,um, Cm =1 .LFcm-2, Rm = 50,000 f1cm2, R, = 250 Qlcm, gshunt = 0. Synapticclamp currents in response to single exponential inputs, with decay time constant Try = 2 ms and total charge Q = 1 pC. Top panels, linear current axis;bottom panels, -I x current plotted with logarithmic current axis. Dotted lines, model responses; solid lines, optimal fits, plotted only for duration of fitinterval or until current < 0.5 pA. In lower panels, fit S.D. values (sd) and effective time constants Teff (in milliseconds) are written alongside the correspondingwaveforms. (A and B) effect of distance from soma z: four input sites at 0, 100, 200, and 1000 ,um from soma. Soma perfectly clamped to zero. (C andD) effects of series resistance (Rser) on the somatic input. Clamp to zero via four values of Rser (0, 2, 10, and 50 Mfl), indicated alongside relevant response.Increasing both z and series resistance causes smoothing of the responses, decreasing the peak current and increasing the rise time and Teff.
addition of some noise they would appear acceptable. In Fig.1 B, the use of a logarithmic current axis gives a worse im-pression of the fits, but it is important to remember that anynoise would also be more evident at the tails of the plots: thegraphs span 3 log units (a factor of 1000). The fit S.D. valuesare written alongside each waveform, together with the ap-parent time constant Teff. It can be seen that Teff increases asthe injection site is moved away from the soma.
In the right-hand panels of Fig. 1 are shown the effects offour different series resistances upon the somatic input'sclamp current. It can be seen that increasing Rser also smoothsthe waveforms and attenuates the peaks (C, dotted lines). Thesingle exponential fits (solid lines) also appear adequate,although when re-examined with a semi-log plot (D), it isobvious that more than one exponential component makes a
significant contribution during the fit interval (except for the
Major
0.0
-0.1
471
20 25
0.5-
0.1:_F-"
6-.
U0.01.-1=I
0.001:
0.0005
sd
20 25
B . w w . w w w w -I I II I~~~~~~~~~~~~~~~~~~~~~~~~~~~~~~~~~~~~~
I
I
I

Volume 65 July 1993
perfect clamp case). The imperfect clamp responses dem-onstrate clear slow bends analogous to those seen in PaperI, Example 2. Again, Teff grows with RserCompared with the single cylinder + soma model, the
more complicated geometry of the CAl pyramidal all in thenext example produced a larger number of exponential com-ponents making significant contributions to a given responsewaveform over the fit interval. The larger number of timeconstants produced smoother and slower changes in the over-all effective time constant, allowing better single exponentialfits. This phenomenon, coupled with noise, may explain whysingle exponential fits of experimental "clamped" synapticcurrents (resulting from activation of one receptor type) areso frequently found to be acceptable. It is still urged, how-ever, that these time constants should be termed "apparent"or "effective" time constants, because of the large number of"real" time constants underlying them.
Systematic explorations of synaptic location, Rser and TsyThe results of many single cylinder + soma model simula-tions are summarized in Figs. 2 and 3. These figures areintended to convey the effects of varying three model pa-rameters: input location z, series resistance Rser, and synaptictime constant sy. The morphology and electrical parametersare held constant throughout.
In Fig. 2, sy is fixed at 2 ms. Instead of three-dimensionalplots of each waveform measure versus Rser and z, the samedata are plotted twice, once versus z for several values of Rser(A-C on the left) and again versus Rser for several values ofz (D-F on the right).
In Fig. 2 A it can be seen that the peak current "efficacy,"i.e., the peak measured current (peak iciamp) divided by thepeak actual input current (peak i,yn) falls off with z. Most ofthe decrease is over the proximal part of the dendrite. Thereis little change in efficacy over the distal half of the cylinder(a so-called "end effect"). Increasing the series resistancedecreases the efficacy at all locations, but also reduces theproximal-to-distal fall-off. The same data is replotted againstRser in Fig. 2 D; increasing Rser strongly filters the peakierproximal inputs but has less effect on the more distal inputswhich are already appreciably smoothed by the cable.The 20-80% rise times increase with z, at first approxi-
mately linearly, then more steeply, and finally, near the distalend (800-1000 ,gm), they level off (Fig. 2, B and E). The"correct" value of 0 ms (for an instantly rising single expo-nential input) is shown by the arrow. Increasing series re-sistance causes further slowing. The effect is slightly morepronounced for the more distal inputs and diminishes withincreasing Rser.
Similarly, effective decay time constants appear to in-crease approximately linearly over the initial part of the ca-ble, and then level off for most of the distal half (Fig. 2 C).The Teff values increase approximately linearly with Rser upto about 50 Mfl (Fig. 2 F). The rate of increase is slightlygreater for distal than for proximal inputs (the lines diverge
slightly). These straight line relationships are discussed inPaper II (Parameter Dependence of Imperfect Clamp Im-pulse Response section). The correct synaptic current timeconstant of 2 ms is indicated by an arrow.The effects on the peak current of the series resistance and
the distance z of the input from the soma are less than ad-ditive. To a good approximation however, the effects of z andRserare additive for the t2080 and Teff values. An increase inRser produces a nearly constant vertical offset in the plotsagainst z (Fig. 2, B and C). The magnitude of the offsetdecreases for larger Rser values. Likewise, increases in z pro-duce nearly constant vertical offsets in the plots against Rser(Fig. 2, E and F). The additional changes diminish as z nears1000 ,um.The effects of changing the input current decay time con-
stant are explored in Fig. 3. A range of Ty values are tested,from 0 (i.e., an impulse or 6 function) to 10 ms. In the left-hand panels, the waveform measures are plotted against lo-cation for a model with Rser = 0, for a number of differentTsr values. The right-hand panels illustrate the combined ef-fects of z, Ty, and RSer on the Teff values.As shown in a number of studies (e.g., Refs. 6-8), the
fall-off in peak current efficacy becomes steeper as the inputbecomes faster (Fig. 3 A). All the plots show end effects. Thedecrement with z for a constant current input is also shownfor reference. Because of the reciprocity relations discussedin Paper II, these plots are the same as the decrement withx, the recording position, of equivalent voltage commands atthe clamp point (also see Ref. 6). The clamp current inresponse to a constant input at the distal end of the cable(L = 0.447) is about 91% of the actual input current. With-sy =1Ims, however, the peak clamp current is only 14% ofthe peak input current, underlining how misleading electro-tonic distance alone is as a guide to the effects of cables ontransients.
Fig. 3 B shows that rise times increase with sy, and thisincrease is more pronounced for the more distal inputs. Endeffects like those in Fig. 2 B can also be seen.
In Fig. 3 C it can be seen that effective decay time con-stants increase with sy. The different lines are separated byalmost constant offsets. The end effects become more pro-nounced for slower inputs. Replotting the same data againstTsy (Fig. 3 D), shows that (except for very fast distal inputs),Teff is approximately linearly dependent on T,y A number ofpoints on these two plots are missing: the corresponding fitsappeared unacceptable and had S.D. values > 0.003. Thefractional errors in Teff are smaller for the slower inputs: forexample, for the tip inputs (z = 1000), Teff/Tsy is 4.08 whenTsy =1Ims, but only 1.3 when sy = 10 ms.The additional influence of series resistance is illustrated
in Fig. 3 E. The lines for the soma and tip (z = 1000) inputsfrom the previous panel (R,er = 0) are shown, together withequivalent data from models with Rser = 20 and 50 MQ.Increasing series resistance increases both the initial offsetand the rate of increase of Teff with T,y. The rate of increaseis steepened more for the somatic than for the tip input. For
472 Biophysical Journal

Analytical Solutions: Voltage Clamp Problems
ICt= 2 msSy
A: Peak Currents vs. Input Site100 RtR, =0MQ
a 802
60
4) 0
020co, 20 f ~ _ =n: = =
FIGURE 2 Single cylinder + somamodel: clamp current waveform meas-ures from responses to a single exponen-tial input with a decay time constant Tyof 2 ms. Other parameters as before."Correct" values (i.e., those of synapticinput itself) are indicated by arrows. Pan-els on left (A-C), measures versus syn-aptic location z. Different lines are la-beled with the Rser used. Panels on right(D-F), measures versus Rser. Differentlines are marked with the input locationused (symbols given in key in D). (A andD) peak current efficacy, i.e., measuredpeak clamp current (iclamp) real peaksynaptic current (isyn). (B and E) 20-80%rise times (t2080 values). (C and F) ef-fective decay time constants Teff: optimalfits from peak + 0.7 ms to peak + 20 ms.
0 200 400 600 800 1000Synaptic Location [gm]
B: 20-80 Rise Times vs. Input Site2.5 i R,1, [MCI]
1.0e-
0.5
_0.0
2.5
2.0
-1.5s
a
°1.0.
0.5
_0.0*# .0--
-
0 200 400 600 800 1000Synaptic Location [gim]
C: Effective Decay t's vs. Input Site16- R. [Mil]4 -5014-
12-
EnlA-
8-
" 6-
4-
0-
0
U---i -ii. 0 1
if I*A .k.......0..... 02if-. . _ _ .0e 'r _a_. I- - ---
0 200 400 600 800 1000Synaptic Location [jm]
D: Peak Currents vs. Rsersynapticlocation:* somaa 200a 400* 600* 800* 1000
[Aim]
0 10 20 30 40 50Series Resistance [Mi]
E: 20-80 Rise Times vs. Rser
00... ... ..' 00
__--- 400
° ~~~~~soma
0 10 20 30 40 50Series Resistance [MD]
F: Effective Decay 'es16-
14 -
12-
10 -
-E 8 -
,: 6 -
4-
02 -
0-
vs. RScr1000
40
,/oo
0 10 20 30 40Series Resistance [MD]
50
Rser> 0, the somatic and tip effective decay time constantsconverge for the slower inputs. This convergence is morerapid the higher Rser, because filtering by the series resistancebegins to dominate filtering by the dendritic cable. The in-fluence of Tsy on the increases in Teff with series resistanceare shown in Fig. 3 F. The proximal-distal differences shrinkwith large Rser and Ty (since the cable is relatively less im-portant). The initial intercepts increase with Ty as would bepredicted from Fig. 3 D. The rates of increase with R,e, alsosteepen as Ty grows. The fractional errors in Teff, however,
are smaller for the slower inputs. For example, for the so-matic input and Rser = 50 Mf, Teff/Tsy is 5.1 whenT,sy = 2ms, and only 2.9 when sy = 10 ms.
In summary, this simple model shows that serious errorsin all three clamp current waveform measures can occur be-cause of filtering by the dendritic cable and by the seriesresistance. For a single exponential input, the fractional er-rors in peak measured current and apparent synaptic decaytime constant Treff become smaller as the input time constantTsy is slowed. The Teff values are approximately linearly de-
.
Major 473
u
2.0-
I q
I

Volume 65 July 1993
Effects of changing t,yA: Peak Currents vs. Input SiteI100 It--- (Rier = 0)
FIGURE 3 Single cylinder + somamodel: clamp current waveform meas-ures from responses to single expo-nential inputs with different decaytime constants Tsy Other parametersas before. Panels on left (A-C), meas-ures versus synaptic location z, Rser =0. Different lines are labeled with theTr,,y used. 8 = instantaneous chargeimpulse (i.e., Try = 0). (C-F), effec-tive decay time constants T4ff: optimalsingle exponential fits from peak +0.7 ms to peak + 20 ms. Points cor-responding to unacceptable fits areomitted in C-E. (A) peak current ef-ficacy, i.e., measured peak clamp cur-rent (icjamp) - real peak synaptic cur-rent (isyn). D.C. steady-state responsealso shown. (B), 20-80% rise timesversus location. (C), T4ff values versuslocation. (D) Teff values versus TY,Rse, = 0. Lines labeled with synapticlocations. Note that the lines for z =600 to 1000 ,um superimpose almostexactly, and the 400 ,um line con-verges with them when Ty is large. (E)Teff values versus Ty, for three valuesof Rser (indicated on right). Data fortwo input locations, soma and tip(1000 ,um), are plotted at each Rser.The lower pair of lines correspond tothe outermost lines in D. (F) Teff val-ues versus Rser, for three values of Ty(indicated on right). Data for somaand tip inputs are plotted at each Rser
a 80
'as.-60-
S40.
co
2040
0
- r^s<\>;;;> x,y [ms]10
.,. .'~....... ......5&
-'- -. -.2.05
0 200 400 600 800 1000Synaptic Location [gm]
B: 20-80 Rise Times vs. Input Site2.5 (R.er = 0) ;x [ms]
: ,,-- @104.-
2.0 7I. ~~~~5
_ 1.5 - , 3
I .
0.5 /. . A. 0.5
~0.0
0 200 400 600 800 1000Synaptic Location [rm]
C: Effective Decay t's vs. Input Site16 -
14 -
12-
10 -
8-
6-
4-
2-
0-1
D: Effective Decay T's vs. r,y16] i(Rser = 0)
E: Effective Decay T's vs. r,y30
25
20 -
E-=. 15 -
t.I:
IU.
0-
,a 50.. 1000 gm
soma
20
0 2 4 6 8 10Synaptic Time Constant [ms]
F: Effective Decay T's vs. Rser30-
25
20
(Rser = 0);y [ms]
10
.... ... 7
.4 ~~~~~~~~~5
3
* . _---- - _30_.
E 15
P 10
5
00 200 400 600 800 1000
Synaptic Location [jlmr]0 10 20 30 40 50
Series Resistance [M!Q]
pendent on both T,,y and Rser, and their dependence on z isroughly linear for proximal inputs, flattening off as the tip isapproached.
Although the errors will depend on the precise morpho-logical and electrical parameters of the model, the broadtrends illustrated here will hold for a wide range of models.A similar analysis is performed as part of the next example,with additional explorations of the effects of changing theelectrical parameters.
Case II: Voltage steps-exploration of Jackson'sresults
In a recent paper on cable analysis with the whole cell patchclamp technique (3), Jackson presented an approximateseparation of variables solution for the clamp current into asingle cylinder + soma model with a voltage step imposedvia a series resistance. This study established a number ofresults of considerable practical importance to experimenters
474 Biophysical Journal
i
I

Analytical Solutions: Voltage Clamp Problems
attempting to voltage clamp neurones. In all cases it wasassumed that R = Rsm/Rser> 100 (i.e., the series resistancewas less than 1% of the soma membrane resistance Rsm). Anexploration of these results provides an interesting oppor-tunity to illustrate the single-cylinder + soma special casesof the analytical solutions presented in Paper II, (11.33) and(II.48).
Particular results considered
The results in Ref. 3 included:1) One waveform component in the solution, with a =
aR, has a time constant TR: RserCs, the charging time con-stant, via the series resistance, of the soma with the dendritesstripped away.
2) The other time constants, associated with "cable charg-ing," should be virtually insensitive to Rser. Only aR (and TR)should vary with Rser.
3) If the ratio of the two slowest time constants exceeds9, this is evidence that no equivalent cylinder can account forthe observed transient.
4) The amplitude of the TR ("soma charging") term ismuch larger than the other amplitudes of the other compo-nents. The soma charging and cable charging currents cantherefore be distinguished on a practical basis.
5) The soma capacitance can be compensated by "bal-ancing out" the "fast" part of the current transient in the"routine" way for amplifiers such as the EPC-7 (List), usingthe G-series and C-slow dials (or their equivalent). Followingthis, the clamp current can be "sharpened-up" by means ofseries resistance compensation.
Likely values of p.
Jackson noted that his approximations generally becomepoorer for larger p0. = googsm (ratio of input conductance ofinfinitely extended cylinder to soma membrane conduc-tance). Note that his definition of p0. does not include anysomatic shunt gshunt. When his solution was tested using amodel with a soma that was very large compared to the den-drite (ds = 20 ,um, d = 1.08 ,um, 1 = 385.6 ,um, "raw"9electrical parameters as in the section titled "The Model"above), the approximation was found to be a good one (notillustrated). However, p0. for this model was only 2.
In the no-shunt case (i.e., gser finite but gshunt = 0), p. canbe written
d3/2p= 2Nd Rm/Ri. (2)2s
It can be seen that p. is the product of two terms, one purelymorphological (d312/2d2), the other purely electrical\IR7m7). This "root resistivity ratio" or "morphoelectric fac-tor" was introduced in Ref. 22. With a d3/2 of 22 tLm3/2, basedon the average of the initial values for rat visual cortical layerII/III and layerV pyramidal cells (22, Fig. 2), and a d, of 18.5,um (the mean soma (height + width + width)/3 over all
three classes of cell in Table I of Ref. 23, d312/2d2 = 32.1m-12. Since, for these cells, Rm is unlikely to be below10,000 flcm2 and Rj may be as high as 400 flcm (see Refs.4, 5, and 24), the morphoelectric factor is probably largerthan 0.5 Min2. When dendritic spines, which account forabout half the surface area of the cells, are included using a"folding factor" F (see Paper I, Fig. 2 legend), where
area including spinesFa=
area without spines (3)
(22), d3/2 must be multiplied by another factor of F112 whichis approximately \/2 here. Thus the minimum value for p0.is 32.1 X \/_ X 0.5 = 22.7. A more likely value for themorphoelectric factor is 1.414 m112 (parameters above: Rm =50,000 flcm2, Ri = 250 Qlcm; see Ref. 5 for justification)giving a p0. of 64.2. For comparison, the mean dendritic area(including spines) + soma area over all three classes of py-ramidal cell was 31.9 (from figures in Table 2 of Ref. 22).The single cylinder + soma model introduced in the pre-
vious section has a p0. of 55.9, probably not atypical forcortical pyramidal cells. This figure is an order of magnitudehigher than the values tested in Ref. 3. It is interesting to seehow well Jackson's assertions perform for this model, whichhas, arguably, a more "realistic" p0. than those he considered.
Testing results 1-4 with the high p0. model
Using the analytical solutions in the previous two papers, andthe model described above (The Model section), a 1-mV stepcommand was imposed on the soma via various series re-sistances, and the time constants and clamp current ampli-tudes and waveforms were generated. In all cases the wave-forms agreed extremely closely with those obtained fromequivalent compartmental model simulations. With the pa-rameters specified above, the electrotonic length L = 0.4472,the soma membrane resistance Rsm = 3.98 Gfl, and the somacapacitance c5 = 12.57 pF. The discussion in this section islimited to models with Rser < 40 MQl (i.e., R 2 100). It shouldbe noted that Jackson quotes a stricter criterion for his ap-proximations to hold: R > 121/L2, in this case R > 605, i.e.,Rser < 6.6 Mfl.
Selected time constants and amplitudes from the model areplotted against series resistance in Fig. 4. The time constantsare shown in Fig. 4 A. The hypothetical soma-alone chargingtime constant RserCs is also plotted against Rser: it can be seenthat, within the range of series resistances on the graph, itcrosses the lines for all of the time constants with an indexgreater than 1. By choosing an appropriate Rser, it is possibleto obtain an Rsercs approximately midway between any pairof neighboring time constants with n > 1 (e.g., when Rser =2, 30, and 40 Mfl: see Table 2). This finding weakens Result1, although RserCs is never "far" from one of the T values.
It can be seen from Fig. 4 A that T0 increases almost lin-early with Rser: the solid line is the value of T predicted by
Major 475

Volume 65 July 1993
A: Time Constants vs. Series Resistance
prediction
....... .................. ....................n ,
* *------~--r Rsercs- ----*-----oI I .-- I .I
0 5 10 15 20 25 30 35 40R,er [Mil]
B: Clamp Current Amplitudes vs. Rser0.16 -
0.14 -
0.12 -
0.10 -
0.08 -
0.06 -
0.04-
0.02 -
0.00-
n=0
.. ~ ~ ~ ~ ~ ~ ~ ~ ~ ~ ~ ~ ~ ~ ~ ~ .........
n=2' n=l . 0
.. ~ ~~ ~ ~ ~ ~ ~ ~ ~ ~ ~ ......
.. ....
0 5 10 15 20 25 30 35 40Rser (Mfa
FIGURE 4 Single cylinder + soma model: imperfect voltage clamp.Clamp current for a 1 mV step command to the soma via various seriesresistances Rser. (A) changes in the time constants TO, T1, T2, and T10 withseries resistance (dotted lines). All the time constants increase with RS,r, butthe faster ones level off more quickly. T0 increases linearly with series re-sistances up to 40 Mfl. The solid line is the increase predicted by Eq. II.58.The "soma alone" charging time constant RserCs is also plotted (long dashedline), for reference. (B) changes in the clamp current amplitude terms withincreasing Rer. Points joined by dotted lines correspond to amplitudes withthe same index (written alongside). All except n = 0 show an initial increase,then decrease with Rser.
the linear approximation (II.58),1 the filled circles are theactual values calculated from the analytical solution. A sim-ilar linear approximation, with 3i replacing ff, (except forone of the ir values in the slope numerator) holds for Tr for
' Notation for equations used in this series of three accompanying papers(1, 2). "II.58" refers to Eq. 58 of Paper II.
Rser < 15 MQl (error < 10%). Equivalent approximations forthe faster time constants break down at progressively smallervalues of Rser.The slower time constants show large fractional changes
with Rser, although the changes decrease as the time constantsbecome faster. The ratios of the values of the time constantswith Rser = 40 to their values under perfect clamp are:To: 3.3, T1: 2.08, T2: 1.62, T*io: 1.16. For Rser < 40, T, andT, are never the time constants closest to RserCs, and yet theyshow dramatic changes with Rser; therefore for this model,Result 2 is clearly incorrect.
In Table 1, the two slowest time constants To and T, andtheir ratio R. are listed for models with a number of differentRser values, along with approximate values of R = Rsm/Rser,It can be seen that two of the models with R > 100 result inTo/l > 9. However, these models do not satisfy the strictercriterion R > 121/L2, so Result 3 appears to hold for thismodel. (Note the indexing convention: n starts from 0 here,and from 1 in Ref. 3.) The value ofL for the model, estimatedfrom Eq. 8 in Ref. 3 is in error by more than 20% for Rser' 10 Mfl, but by "only" 11% for the Rser = 5 MQl case whichsatisfies the stricter criterion. The equation gives meaning-less answers for Rser above about 20 Mfl, for this model.The amplitude terms show a complicated dependence on
Rser' illustrated in Fig. 4 B. The 0th amplitude appears todecrease with Rser for all the cases examined. However, allthe other amplitudes show an initial increase followed by adecrease as Rser grows. The peak amplitude is both larger andoccurs at a smaller value of Rser as n, the index of the com-ponent, increases.
For each model, the Tn closest to Rsercs is denoted as TR.This model time constant TR, according to Result 4, shouldhave a much larger associated clamp current amplitude (de-noted as AR here) than both its flanking neighbors TR- 1 andTR+,1 Examination of Table 2 shows that this is clearly notthe case. For example, with Rser = 5 Mfl (satisfies Jackson'sstricter criterion), subscript R = 4, A3 = 0.023 nA, A4 =
0.015 nA, and A5 = 0.010 nA. To reinforce this point, in Fig.5 each amplitude is plotted against its corresponding timeconstant using log-log axes, for eight values of Rser. The large
TABLE 1 Single cylinder + soma model: Time constant ratios
Rser R* TO T1 To/Ti LesttMQl ms ms
0 00 3.749 0.446 8.41 0.4470.5 8000 3.859 0.461 8.37 0.4561 4000 3.970 0.475 8.36 0.4642 2000 4.195 0.505 8.31 0.4845 800 4.891 0.591 8.28 0.496
10 400 6.069 0.703 8.63 0.343§20 200 8.349 0.825 10.121 complex§30 133 10.45 0.888 11.771 complex§40 100 12.37 0.926 13.36 complex§
* RsmIRser; should be > 605 by Jackson's strict criterion (R > 121/L2). Thelower four models fail this test.t L estimated from L = (ir/2)\/(j9- RT)/(RT- 15), where RT = To/Ti.§ in error by more than 20% from true value of 0.447 space constants.¶ Ratios exceeding 9 where R > 100.
14
12
10
8-Si
h. .
Pc 6
4'
2
0
0-
10
:34-.--
a
0.4
as
:3
. . . . ...0
Biophysical Journal476

Analytical Solutions: Voltage Clamp Problems
TABLE 2 Single cylinder + soma model: Amplitudes of soma charging and adjacent components
Rser Rser Cs it TR- I R- TRR
TR+I AR+ I
MQ ms ms nA ms nA ms nA1 0.013 9 T80.016 A8 0.086 T90.013 A9 0.074 T100.010 A10 0.0582 0.025 6 T5 0.039 A5 0.050 T6 0.028 A6 0.041 T7 0.021 A8 0.0315 0.063 4 T3 0.106 A3 0.023 T4 0.063 A4 0.015 T5 0.042 A5 0.010
10 0.126 3 T20.235 A20.013 T30.113 A30.007 T40.066 A40.00420 0.251 2 T1 0.825 Ai 0.010 T2 0.252 A2 0.004 T3 0.117 A3 0.00230 0.377 2? T1 0.888 A1 0.005 T20.258 A20.002 T30.118 A3 0.00140 0.503 1? TO 12.37 AO0.015 T1 0.926 A1 0.003 T20.262 A2 0.001* Subscript R, index n of time constant T, closest to RserCs, the "soma-alone" charging time constant. Not to be confused with R = Rsm/Rser. (? indicates>40% error between TR and RserCs).t AR Corresponding clamp current amplitude term (in response to a 1-mV somatic voltage command). First three models satisfy Jackson's "strict" criterionR > 121/L.
solid triangles are AR plotted against Rsercs. The Rser valuecorresponding to each of these is the same as that of thenearest dotted line. It can be seen that in every case shown,rather than standing clearly above its neighbors, as suggestedby Jackson's results, AR actually falls between AR- andAR+1. During an experiment it would be hard to distinguishthe soma charging component of the response of a cell likethe one modelled. Because the soma is much smaller than thedendrites in this case, perhaps this problem is not as seriousas it may at first seem. A more thorough assessment shouldinvolve fits to noisy waveforms from similar models.The clamp current waveforms corresponding to the com-
ponents plotted in Fig. 5 A are shown in Fig. 5 B. Thesetransients were obtained by summing the first 34 components(down to Trn < 1 pts) and the steady-state current given in(II.48). The waveforms with Rser s 2 Mfl superimpose well.However, as Rser increases much above 5 Mfl, the early partsof the transients become visibly reduced. The series resis-tance at which the current begins to deviate substantiallyfrom the perfect clamp case is about the same as the 6.6 Mflpredicted by Jackson's stricter criterion (R > 121/L2) for thebreak-down in his approximation.
Slow capacitance compensation
It is also suggested (Result 5) that slow capacitance com-pensation and series resistance compensation can be per-formed in the "routine" way for amplifiers such as the EPC-7(List, Darmstadt, Germany). For the purposes of the ensuingdiscussion, it is assumed that any pipette capacitance is neg-ligible or has been accurately compensated. The slow ca-pacitance compensation circuitry of EPC-7-like amplifiers(e.g., Ref. 25, Fig. 1.14)) is designed to cancel the currentcharging the lumped membrane capacitance of an isopoten-tial cell. For a step voltage command, this is an exponentiallydecaying current with amplitude Vstep/Rser and time constantRserCcell, where Ccell is the cell capacitance. By adding anamplified, single RC low-pass filtered version of the com-mand voltage, via a capacitor, to the current injected into thepipette, such circuitry effectively subtracts a single expo-nentially decaying component from the clamp current, whenthe voltage command is a step. The amplitude of the sub-tracted current is VstepGseries, where Gsenies is the setting of
the G-series dial on the amplifier. The time constant of thesubtracted current is Cs1ow/Gseries. where Cslow is the settingof the C-slow dial (Ref. 26, pp. 45-46).
According to Ref. 26, the fast transient cancellation pro-cedure is:
(i) Starting with C-slow set at a non-zero value, increasethe G-series dial until there is no "jump" between the baselineand the initial current. This ensures that Gseries = gser-
(ii) Adjust C-slow "to reduce the overall size of the tran-sient" (presumably avoiding "undershoot").
(iii) Turn up the %-COMPensation control, possibly finetuning the C-slow and G-series settings.
It is also suggested that it is a good idea to observe thetransients at "high time resolution," perhaps with 10-kHzfiltering.
Simulations of the first two stages of the process are de-picted in Fig. 6, for the model with Rser = 5 MQl. Panel Ashows the responses plotted at a reasonably fast time base,with a sample interval of 0.1 ms (sample rate, 10 kHz). Theuncompensated model response is the dotted line labeled "0."The other waveforms are obtained by subtracting from thisa single exponential component with amplitude 0.2 nA (cor-rect G8 = 200 nS) and time constant RserCsiow, for anumber of values of Csiow. Cslw = 100 pF produces obviousundershoot at early times, and is therefore clearly an over-compensation of the soma capacitance.As C-slow is decreased, the first waveform demonstrating
no obvious undershoot is the one with C.,,. = 40 pF. Un-fortunately, this is approximately three times the correctsoma capacitance of 12.57 pF. Closer examination of theCsl.w = 40 waveform reveals a kink right at the start: perhapsgrounds for rejection. If C-slow is decreased still further, thefirst waveform not showing a kink is the one with Cslo =30 pF, still too high.
These overestimates in c, are potentially serious, not leastbecause they will lead to underestimates of the soma resis-tance Rsm ( = Tm/cs) and hence p, the soma-to-dendritic re-sistance ratio. This may be one explanation for the surpris-ingly low p of only 1.6 quoted in Fig. 3 of Ref. 3 for ahippocampal CAl pyramidal cell. The c, quoted for this cellwas 14.9 pF, whereas that of the CAl pyramidal cell modelused below and in the two previous papers was only 6.4 pF.
Major 477

Volume 65 July 1993
A: Time Constants and Ai
4)r
a0
Rser10.1 0.5Slo,
1
1 -4
2
2
1o3
5
14o
1o
&l-Z-4\-*i-..w h ..h..I........
1111*12
,=13
20
401.9"8n=10
0.01
B:
0.20 -
0.18 -
0.16 -
S 0.14-
< 0.12
0.10
v0.08 -
,~0.06
0.04-
0.02 -
0.00 -
0
1*'-
66
*R5rc5 ampliti
0.1
T,, [ms]
Clamp Current Wave
Rser [M0 .
0.5
1.
2
5 A
10 A
20
30 o40 a
5 10Time [ms]
FIGURE 5 Single cylinder + soma model (impeirameters as before: responses to 1 mV step commz
amplitude versus time constant plot (note logarithrcurrent amplitude term is plotted against its timevalues of Rser. Points corresponding to the same wavedifferent Rser values are joined with solid lines (thponent appearing below, in small type). To guide 1
ponents from the same waveform are joined withresistance M[Q appearing to the left (in large type).the amplitude of the component with the time constis plotted against Rse,c, (large black triangles), withMfl point, where the amplitude is set to be the averag(
RserCs appears to be mid-way between T1 and T2). Thieach of these is the same as that of the nearest dottlRser cause the amplitudes of components with interrto increase above those of the perfect clamp case.
decrease with Rser and with n. In no case is the am]larger than the amplitudes of the flanking terms (Bforms of the same models. The transients from thelowest Rser values superimpose extremely well. Asearly parts of the waveforms diminish in size, theclamp becoming obvious for Rser> 5 Mfl. Note tl
mV/Rser,
mplitudes Other explanations may include dendritic amputations due toslicing, the young age of the rats (1 week), incorrect as-sumption of cylindrical morphology (see PaperI, Fig. 2), orproblems associated with fit nonuniqueness (e.g., Refs. 4and 5).
Over-estimating c, could have other unfortunate conse-
quences. In Fig. 6 A, the peak current with Cs,,, = 40 occursat 0.6 ms, whereas the peak for Cs,,, = 12.57 is earlier, at0.2ms. Whether or not additional series resistance compen-sation is carried out, the Csl,w = 40 peak will always be afterthe Csl,0w = 12.57 peak. When attempts are made to fit modelresponses or multiple exponentials to experimental data, adecision has to be reached about when to start the fit interval.
If direct fitting of model responses to the data is beingattempted, it is necessary to start at the peak, or just after
ude of nearest ; (e.g., when the waveforms have positive early componentsas judged from semi-log plots), because in response to pos-
10 itive step commands, all the amplitude terms in the clampcurrent analytical solution are positive (see Paper II, com-
forms ments below Eq. 11.47). Failure to do this may result in se-rious errors in the estimated model parameters as the fit pro-gram attempts to "drag down" the early parts of the modelresponse.
At first sight it should be possible to circumvent this prob-lem by fitting exponentials to some or all of the time courseof the transient, allowing negative amplitudes. If, however,as with the Rser = 2 model considered above (see Table 2),Rsercs is roughly midway between two Tn values, the slowcapacitance compensation procedure will have contributedanother distinct (negative) exponential component to thewaveform. At best, all a good exponential fitter can do is to"uncompensate" such target waveforms: if it correctly ex-tracts one time constant of CsiowRser (where Rse, is the re-maining, uncompensated series resistance) and a correspond-ing amplitude of - Vstep/IRser, then little will have been
15 20 accomplished by the slow capacitance compensation. Atworst, the fitter might misleadingly combine a number ofcomponents which should really be distinct.
rfect clamp), same pa- For the above reasons, it seems prudent to use intervalsand. (A) clamp current after the peak with both direct and multiexponential fits. Itmnic axes). Each clampconstant, for different follows that accidentally setting C-slow too high will lead to-form component using later intervals than with the correct setting, and hence lessieindex n of the com- waveform information to constrain the fit.the reader's eye, com- It is possible that the overestimation of cs in Fig. 6 A wasdotted lines, the seriesFortea vlune oe Rseries a result of not using a fast enough time base. The bandwidth
ant 'R nearest to RserCs of the EPC-7 is 100 kHz (see Ref. 26, preliminary specifi-the exception of the 40 cation at end). The simulations were repeated, sampling at;eofA1 andA2 (because 200 kHz and slow capacitance compensation was carried oute value of R,r used for as before. The first 0.2 ms of selected waveforms are plottedeid line. Low values ofedittime. onstantesof in Fig. 6 B. At this extremely fast time base, it can be seenmediate time constantsOtherwise, amplitudes that the Cslow = 30 waveform actually does demonstrateplitude AR of TR much undershoot after all, but the current is already positive byclamp current wave- t = 0.04 ms. The first nonundershooting waveform now isfour models with the with Cslw = 15 pF, only a 20% overestimate of the correctRser increases, so thedeviation from perfect value.hat initial current = I Providing the fastest possible time base is used, overes-
timation of csmay largely be avoidable. However, given the
-M4 --
. .
.
478 Biophysical Journal
I

Analytical Solutions: Voltage Clamp Problems
A: Sample Rate 10 kHz
series= Rser = 200 nS
o.
0.5 1.0Time [ms]
1.5 2.0
B: Sample Rate 200 kHz
12.57 _
lo . C,LOWM 30 pF
......7 7.
existence of an exact analytical solution for this situation,incorporating both soma capacitance and series resistance,perhaps it would be better to adopt a different approach: thatof direct fitting without slow capacitance compensation. Itmay still be advantageous, however, to perform series re-sistance compensation. In order to do this without C-slowcompensation on an EPC-7, the G-series dial must be setcorrectly, and then C-slow must be turned down as low aspossible before turning up the %COMPensation dial.
It is not surprising, on purely theoretical grounds, that theapproach advocated by Jackson should run into trouble insome cases. As discussed in Paper II, the components of thecell linked in parallel at the end of the series resistance canbe separated. Each component can be individually subjectedto the voltage command step. When Rser >0, the sum of theirclamp currents is not equal to the clamp current into the intactcell. Because of this nonsumming interaction, it is not pos-sible to compensate for one cell component (e.g., the somacapacitance) by a purely subtractive procedure like that con-sidered above.
Attempts to separate the soma capacitance from the prox-imal dendritic capacitance may be inappropriate for anotherreason: it is quite often difficult to define precisely where the"soma"9 ends in many classes of neurone, for example,"thick" layer V visual cortical pyramidal cells (23) and CA3pyramidal cells in rats (Refs. 5 (Chapter 6) and 15). More-over, as discussed in Paper II (Parameter Dependence ofImperfect Clamp Impulse Response section), the distortingeffect of Rser depends on the electrical and morphologicalparameters of the model, being worse when more dendriticcapacitance is electrically "close" to the soma, e.g., when Riis relatively low. "Effective" (soma + proximal dendritic)capacitance blends imperceptibly into "shielded" (distal den-dritic) capacitance in a way that depends on the model pa-rameters, and the time course and location of the input (Ref.5, Chapter 6).
0.00 0.05 0.10 0.15 0.20Time [ms]
FIGURE 6 Subtractive capacitance compensation illustrated for thesingle cylinder + soma model with a series resistance of 5 Mfl. Theeffects of adjusting the G-series and C-slow dials on an amplifier such as
the EPC-7 are simulated, for a step command, by subtracting from the clampcurrent response a single exponential, with amplitude VstepGseries and timeconstant Csiow/Gseries. Each trace is marked with the Cs0ow used. The un-
compensated response is the dotted line marked "0": its initial current isVsiep/Rser = 0.2 nA. (A) sample rate of 10 kHz. The correct setting, with Csiow= Cs = 12.57 pF, is the dot-dashed line. Turning C-slow up to 100 pF (lowerdotted line) causes an obvious undershoot in the response, suggesting over-
compensation. Without prior knowledge of cs it is hard to say what thecorrect adjustment is: the setting which just avoids undershoot at this samplerate (10 kHz) is 40 pF (solid line), although there is a slight kink in the risingphase. The slight undershoot with 50 pF might be missed with a slowersample rate. (B) Sample rate of 200 kHz. Note expanded time axis. TheC-slow setting just avoiding undershoot is now C5Iow = 15 pF (solid line).Cslow = 20 pF shows slight undershoot (long dashed line: first sample pointonly) and undershoot can now be seen clearly with C510w = 30 pF (lowerdotted line).
Other problems
The methods in Ref. 3 suffer from serious additional prob-lems offit nonuniqueness, common to all techniques involv-ing the matching of noisy experimental transients to a modelwaveform (e.g., Ref. 5, Paper I). This fit nonuniqueness isparticularly bad with unconstrained exponential fitting, a
technique in common use in the field of passive neurone
modelling. When no additional constraints are imposed on
the values that the amplitudes and time constants can take,a range of "acceptable" fits can be obtained with L takingvalues anywhere between 0 and oo (G. Major, unpublishedobservations). To some extent this problem is overcome byimposing other constraints such as plausible limits on theparameters (e.g., Ref. 5) or amplitude and time constant ra-
tios (see Paper II). In addition, recourse to direct fitting can
build in all the constraints inherent in a particular model,and hence can restrict the range of acceptable parametersconsiderably.
0.20-
0.15
1
-0.050.0
0.20 -
0.15
aa.-j
$l 0.10Q
co
u 0.05
0.001
, ,, ,, ,, ,, .,I I r I
I
II
Major 479
j

Volume 65 July 1993
FIGURE 7 CAl Pyramidal cell. Thecamera lucida drawing from Paper I,Fig. 2, is reproduced here, with theseven input sites in Table 3 marked ap-proximately (segment numbers in pa-rentheses as follows). L, apical tuft(110); *, apical trunk (149); *, apicaloblique (146); *, apical trunk (137);A, apical trunk (68); E proximal basal(16); 0 mid basal (44). Only the fullgeometry was considered (with allspines collapsed). The electrical pa-rameters were as in Paper I: Cm = 0.7,uFcm -2, Rm = 10,000 flcm2, Ri =200 [cm and gshun, = 15 nS. The inputcurrent was the same as in Paper I, Fig.6: total charge 0.1 pC, double expo-nential function, T;y = 0.1 ms, Tr'2 =2 ms. To obtain each waveform, thiscurrent was injected into the indicatedsite, and the voltage at the same pointwas recorded, either with somatic volt-age recording or with the soma per-fectly voltage clamped to zero. (A) in-put site voltage transients at the somaand at three positions on thin dendrites.The early parts of the dendritic tran-sients are virtually unaffected byclamping. (B) the same waveforms outto later times, with the voltage axis ex-panded. At late times, return to base-line is more rapid with voltage clamp.(C) input site voltage transients at threepositions along the apical trunk (a rel-atively thick structure) compared withthat from the apical tuft. Again, clamp-ing hardly affects the peaks, but doesspeed the return to baseline. An excep-tion is the response in segment 68which is only 0.019 A from the soma:it is so close electrically that undervoltage recording, the response is vir-tually the same as the somatic responseto a somatic input (shown in A and B).
A
z20
0.
n0
A.
I tuft
soma condition:
-voltage recording
....... voltage clamp
CAl Pyramid Full ModelVoltage Transients at Input Sites
B
tuft
soma condition:
voltage recording
.............. voltage clamp
Tinte Imsn Time imsl
C
E-I
oI
D
E
0 tO 20 30 40
Time imsl
In summary, the procedure outlined by Jackson (3) shouldbe adopted with some caution, as stated by that author, whenit is suspected that p. is high. Values of the order of 50 ormore are likely to cause problems with most pyramidal cells,although a more systematic assessment needs to be per-formed.
EXAMPLE 2: HIPPOCAMPAL CAl PYRAMIDALCELL
In this section, the hippocampal CAl pyramidal cell intro-duced in Paper I is modelled using the voltage clamp andvoltage recording waveform generator programs, to explorefurther the following issues: (a) voltage clamp control ofsubsynaptic voltage swings, (b) cable and series resistanceeffects on synaptic clamp currents, (c) parameter depen-dence, and (d) propagation of voltage commands.
The morphology of the cell is shown in Paper I, Figs. 2(full model) and 4 (cartoon representation). The default elec-trical parameters are (as before): Cm = 0.7 guFcm-2, Rm =
100, 000 flcm2, Ri = 200 [1cm, 9shunt = 15 nS (loosely basedon fitting the model to the real cell's short pulse response: seePaper I).
Case 1: Clamping synaptic inputs
Causes for concern
Because of the interest in long-term potentiation, a largenumber of voltage "clamp" studies have been undertaken onthe Schaeffer collateral inputs onto hippocampal CAI py-ramidal cells (for example, see Refs. 17, 27-32). Preliminarysimulations of mossy fiber synaptic conductances onto aCA3 pyramidal cell from a 19-day-old rat (Refs. 5 (Chapter6) and 15) have shown that even these relatively proximal
480 Biophysical Journal
Analytical Solutions: Voltage Clamp Problems
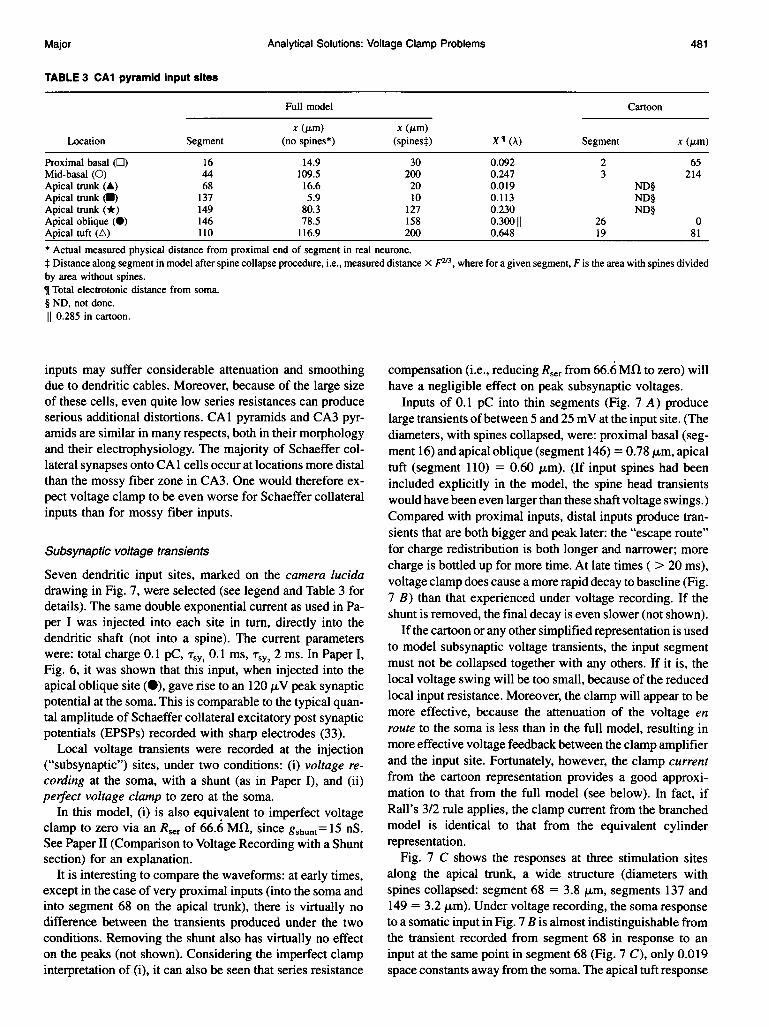
TABLE 3 CAI pyramid Input sites
Full model Cartoon
x (Am) x (Jim)Location Segment (no spines*) (spinest) X1 (A) Segment x (gm)
Proximal basal ([1) 16 14.9 30 0.092 2 65Mid-basal (0) 44 109.5 200 0.247 3 214Apical trunk (A) 68 16.6 20 0.019 ND§Apical trunk (-) 137 5.9 10 0.113 ND§Apical trunk (*) 149 80.3 127 0.230 ND§Apical oblique (0) 146 78.5 158 0.30011 26 0Apical tuft (A) 110 116.9 200 0.648 19 81* Actual measured physical distance from proximal end of segment in real neurone.: Distance along segment in model after spine collapse procedure, i.e., measured distance X F2'3, where for a given segment, F is the area with spines dividedby area without spines.¶ Total electrotonic distance from soma.
§ ND, not done.11 0.285 in cartoon.
inputs may suffer considerable attenuation and smoothingdue to dendritic cables. Moreover, because of the large sizeof these cells, even quite low series resistances can produceserious additional distortions. CAl pyramids and CA3 pyr-amids are similar in many respects, both in their morphologyand their electrophysiology. The majority of Schaeffer col-lateral synapses onto CA 1 cells occur at locations more distalthan the mossy fiber zone in CA3. One would therefore ex-
pect voltage clamp to be even worse for Schaeffer collateralinputs than for mossy fiber inputs.
Subsynaptic voltage transients
Seven dendritic input sites, marked on the camera lucidadrawing in Fig. 7, were selected (see legend and Table 3 fordetails). The same double exponential current as used in Pa-per I was injected into each site in turn, directly into thedendritic shaft (not into a spine). The current parameterswere: total charge 0.1 pC, Tsyr 0.1Ims, T'y2 2 ms. In Paper I,
Fig. 6, it was shown that this input, when injected into theapical oblique site (0), gave rise to an 120 ,gV peak synapticpotential at the soma. This is comparable to the typical quan-tal amplitude of Schaeffer collateral excitatory post synapticpotentials (EPSPs) recorded with sharp electrodes (33).
Local voltage transients were recorded at the injection("subsynaptic") sites, under two conditions: (i) voltage re-
cording at the soma, with a shunt (as in Paper I), and (ii)perfect voltage clamp to zero at the soma.
In this model, (i) is also equivalent to imperfect voltageclamp to zero via an Rser of 66.6 MQl, since gshunt= 15 nS.See Paper II (Comparison to Voltage Recording with a Shuntsection) for an explanation.
It is interesting to compare the waveforms: at early times,except in the case of very proximal inputs (into the soma andinto segment 68 on the apical trunk), there is virtually no
difference between the transients produced under the twoconditions. Removing the shunt also has virtually no effecton the peaks (not shown). Considering the imperfect clampinterpretation of (i), it can also be seen that series resistance
compensation (i.e., reducing Rser from 66.6 Mfl to zero) willhave a negligible effect on peak subsynaptic voltages.
Inputs of 0.1 pC into thin segments (Fig. 7 A) producelarge transients ofbetween 5 and 25 mV at the input site. (Thediameters, with spines collapsed, were: proximal basal (seg-ment 16) and apical oblique (segment 146) = 0.78 ,gm, apicaltuft (segment 110) = 0.60 ,um). (If input spines had beenincluded explicitly in the model, the spine head transientswould have been even larger than these shaft voltage swings.)Compared with proximal inputs, distal inputs produce tran-sients that are both bigger and peak later: the "escape route"for charge redistribution is both longer and narrower; morecharge is bottled up for more time. At late times ( > 20 ms),voltage clamp does cause a more rapid decay to baseline (Fig.7 B) than that experienced under voltage recording. If theshunt is removed, the final decay is even slower (not shown).
If the cartoon or any other simplified representation is usedto model subsynaptic voltage transients, the input segmentmust not be collapsed together with any others. If it is, thelocal voltage swing will be too small, because of the reducedlocal input resistance. Moreover, the clamp will appear to bemore effective, because the attenuation of the voltage enroute to the soma is less than in the full model, resulting inmore effective voltage feedback between the clamp amplifierand the input site. Fortunately, however, the clamp currentfrom the cartoon representation provides a good approxi-mation to that from the full model (see below). In fact, ifRall's 3/2 rule applies, the clamp current from the branchedmodel is identical to that from the equivalent cylinderrepresentation.
Fig. 7 C shows the responses at three stimulation sitesalong the apical trunk, a wide structure (diameters withspines collapsed: segment 68 = 3.8 ,um, segments 137 and149 = 3.2 ,um). Under voltage recording, the soma responseto a somatic input in Fig. 7 B is almost indistinguishable fromthe transient recorded from segment 68 in response to aninput at the same point in segment 68 (Fig. 7 C), only 0.019space constants away from the soma. The apical tuft response
Major 481

TABLE 4 CAI pyramid waveform measures (full model only)Input site Vpeak* Efficacy tpeak fl Vdt Efficacy tioso Half-width
,uV % ms mVms % ms msA. Postsynaptic potentials (somatic voltage recording with shunt)Soma 385 100 1.0 4.80 100 0.5 5.4Proximal basal (D) 220 96 2.9 4.62 96 1.3 13.5Mid-basal (0) 191 50 5.6 4.50 94 2.9 16.0Apical oblique (0) 123 32 9.6 4.15 86 4.9 26.5Apical tuft (AL) 75 19 20.4 3.55 74 10.1 40.9
Input site ipeak Efficacy tpeak Charge: Efficacy tlo9o Half-width
pA % ms pC % ms msB. Voltage clamp currentsSoma 42.7 100 0.3 0.100 100 0.2 1.8Proximal basal (O) 17.2 40 1.2 0.096 96 0.6 4.4Mid-basal (0) 11.9 28 3.4 0.094 94 1.8 6.7Apical oblique (0) 6.3 15 5.5 0.086 86 2.8 11.4Apical tuft (A) 2.9 7 12.1 0.074 74 6.0 22.1
* Glossary: Vpeak, peak soma voltage; ipeak, peak clamp current; tpeak, time to peak; t1ogo, 10 to 90% rise time; half-width, width at half maximum amplitude.t Charge transferred to soma = time integral of current waveform.
from Fig. 7 B is also included for comparison. Only segment68 shows a marked difference in its peak response betweenvoltage recording and voltage clamp. The other trunk seg-ments, although producing smaller transients than the thinnersegments in Fig. 7 A, show the same pattern: again the peakvoltage swing is virtually unaltered by the clamp, but at latetimes decay to baseline is more rapid.
In order to achieve good agreement between analyticalsolution and compartmental model waveforms, extremelyfine compartmentalization was required in the latter. This isbecause voltage transients travelling along a cable attenuatevery steeply when one end is clamped. An intuitive expla-nation is that the clamp condition maximizes the degree ofcharge redistribution, and hence the extent to which the cableis "experienced" by the transient.The important conclusion to be drawn from these simu-
lations is that with fast synaptic currents, voltage clamp issurprisingly ineffective at controlling the local membranepotential at most input sites, except those extremely close tothe clamp point. This conclusion is robust with respect to theelectrical parameters (see below).
Synaptic potentials and "synaptic" clamp currents
In Fig. 8, the waveforms at the soma resulting from thesomatic and non-trunk inputs are compared for voltagerecording (with a shunt, see above) and perfect somatic volt-age clamp. Along with the waveforms from the full modelare those from the cartoon, with injection sites as in PaperI, Fig. 4, at points electrically equivalent to those in the fullmodel (i.e., at the same electrotonic distance from the soma,except for the input into the uncollapsed apical oblique,whose origin has been shifted slightly toward the soma in thecartoon). In Fig. 8 A are shown synaptic potentials obtainedfrom the models under voltage recording. The correspondingclamp currents, with the soma voltage perfectly clamped tozero, are shown in Fig. 8 B. Notice the expanded time scalein B: the clamp currents are appreciably faster than the syn-aptic potentials.
It can be seen that there is close agreement between thewaveforms generated by the two models, although the car-toon output (except the somatic EPSP) is slightly larger andpeakier, as if the inputs were a little closer in electrical termsto the soma. The transients are virtually identical to equiv-alent compartmental model output (with 99 compartments/space constant). As in Paper I, the cartoon ran faster than thefull model, by a factor of over 200.
With these electrical and morphological parameters, thedendritic trees are capable of substantial smoothing and at-tenuation of the synaptic inputs. Table 4 lists the followingwaveform measures for the different full model transients:peak voltages and currents, time integrals (i.e., charge trans-fer in the case of the currents), relative efficacies (these val-ues, divided by the corresponding measure for a somaticinput), 10-90% rise times and half-widths. In the most ex-treme case, the apical tuft input, the 10-90% rise time of thecurrent has been slowed from 0.2 to 6.0 ms, the peak currentis reduced to 7% of its original value at the synapse, and thecharge transferred to 74% of that of a somatic input. For thecorresponding synaptic potential in the voltage recordingcase, the 10-90% rise time is slowed from 0.5 ms (somaticinput) to 10.1Ims, and the peak voltage efficacy is 19%. Thetime integral relative efficacies are the same under voltageclamp and simple voltage recording, and are identical to thesteady-state relative efficacy (e.g., see Ref. 34, pp. 779-780,and Paper I, Appendix 3, Eq. I.111). However, the peak volt-age efficacies with voltage recording are always greater thanthe peak current efficacies under voltage clamp: as explainedabove, the filtering effects of the cable are experienced morestrongly with voltage clamp than with voltage recording.
Parameter dependencies of subsynaptic voltage and clampcurrents
The results in Paper II, (Parameter Dependence (PerfectClamp) section) suggest that the conclusions in the previoustwo sections will depend only weakly upon the parameter
482 Biophysical Journal Volume 65 July 1993

Analytical Solutions: Voltage Clamp Problems
A
0.40-
0.30-
S
O 0.20-
D
~0s
0
2 O. 10-
O-
CAl Pyramid Model
Synaptic Potentials(voltage recording, with shunt, at soma)
Q = 0.1 pc
Iobl
model:
cartoon
full
lique
!! ic..apical tuft
Time [ms]
B 'Synaptic' Currents(somatic voltage clamp)
U
0G_I.
basal
Q = 0.1 pC
10Time lms]
Ioblique
model:
full
cartoon
15
FIGURE 8 CAl pyramidal cell, full model and cartoon compared: re-sponses at the soma to currents injected at the soma or at the non-trunklocations in Table 3, under voltage recording with a 15-nS shunt (A), andperfect voltage clamp to zero (B). For the cartoon representation, the sitesof the non-trunk inputs are marked with the same symbols as in Table 3 andPaper I, Fig. 4. Note faster time scale in B. As before, total charge = 0.1pC, double exponential function, Ty, = 0.1 Ims, Tsy2 = 2 ms. Waveformparameters are listed in Table 4. With the electrical parameters used (seeprevious figure legend), the dendritic cables have a marked attenuating andsmoothing effect on the inputs. The clamp current transients are both brieferthan the corresponding synaptic potentials under voltage recording, andhave lower peak efficacy. Note that the clamp current transients under im-perfect clamp with gser = 15 nS (Rser = 66.6 MQ) would be the same asthe waveforms in A multiplied by -15 nS.
to changes in Rm (see also Refs. 35 and 36 (pp. 41-42)): boththe peak subsynaptic voltage swing and the peak clamp cur-rent are virtually unchanged. This suggests that maneuversintended to increase Rm to improve the efficacy of voltageclamp are likely to be of limited success (as pointed out inRef. 8).
Halving Ri to a more "traditional" value of 100 flcm re-duces the peak voltage swing and increases the peak clampcurrent. Both waveforms are also appreciably faster (as ex-pected). However, the cable still has an appreciable filteringeffect (compare the clamp current with the actual synapticcurrent in Fig. 8 B, marked "soma"). Again, voltage clamphardly reduces the peak subsynaptic voltage swing whencompared with voltage recording (not shown). A doubling ofCm also produces qualitatively the effects predicted from theimpulse response dependencies: reduced amplitudes andslower waveforms.2 Changes in gshunt of course have no ef-fect, because the soma is perfectly clamped to zero. Withvoltage recording at the soma, however, changes in gshuntalter the final decay (but not the early parts) of the subsyn-aptic waveforms: for example, see Fig. 7, where in effect theshunt is varied between 15 nS and infinity (perfect voltageclamp).The parameters selected span much of the biological range
of interest (e.g., Refs. 4, 5, and 15), and the conclusions aboutthe inadequacy of voltage clamp apply in every case. It isquite possible that Ri is even higher than the 200 Qlcm usedas a default here (e.g., Refs. 4, 5, 24, and 37). A higher Riwould lead to more cable smoothing of the clamp current andto less effective clamping of dendritic input sites.
Effects of series resistance on measured clamp currents
As discussed in Paper II, and in Example 1 above, cableeffects and series resistance effects compound one another,and are dependent on: (i) the detailed morphology, (ii) theelectrical parameters, (iii) the input kinetics, and (iv) theinput location (see also Ref. 5 (Chapter 6)). Because of this,detailed models ofeach particular experimental system needto be made in order to assess the likely errors introduced bythe combination of poor space clamp and imperfect voltageclamp.
Rm: all of the time constants and amplitudes of the fast ex-ponential components in the synaptic voltage swing are rel-atively insensitive to Rm, even after inclusion of the extrafactors resulting from convolution with the input function.The faster time constants are roughly proportional to Ri, soalthough the impulse response amplitudes are independent ofRi, the double exponential response amplitudes are not: thisis clear from inspection of Eq. 1.52.The results of making 2-fold changes to each of the elec-
trical parameters in turn are illustrated in Fig. 9 for the apicaloblique input under perfect somatic voltage clamp. The plotsconfirm that the early parts of the responses are insensitive
2 Interestingly, the first millisecond or so of the subsynaptic voltage wave-forms from two of the models, that with Cm = 1.4 and that with R, = 100,superimpose exactly. Both models have the same R, /Cm ratio. At very earlytimes, virtually no charge has reached either end of the input segment, soit can be approximated by an infinite cable. Rearranging Eq. 3.48 of Ref.36, which gives the charge impulse response of an infinite cable, settingX = 0 (stimulating site = recording site) and Q = I (unit charge), we obtain
R1/2V C 3/2d3/2r3/2t l/12 e
When t << Tm, the exponential term simplifies to 1. It can be seen that modelswith the same R I/Cm ratio will give the same sub-synaptic voltage responseover these times, and this will also be true after convolution with the inputfunction used here.
483Major
(4)

Volume 65 July 1993
10
-
.c 6
0
0
04
2
r-
.0
0
A: Sub-synaptic Voltage Transients(Somatic Voltage Clamp)
| \ Defaults:
1 Cm= 0.7 gFcm 2
] Rm= 100,000 Qcm2
4] o\ R1= 200 Qcm
....... Rm= 50,000 (cm2
s". Cm= 1.4 glFcm2
I _is
0 5 10Time [ms]
15 20
B: Clamp Currents0.000o
-0.002
: -0.004
-0.006
S -0.008u
-0.010
-0.012
0 5 10Time [ms]
15 20
FIGURE 9 CAl pyramidal cell full model: illustration of the parameterdependence of the apical oblique responses from the previous figures, underperfect somatic voltage clamp. Four models are compared: the "default"model (solid line) with the electrical parameters shown in A, and three othermodels, each with one parameter altered by a factor of 2 from the default:Rm halved (dotted line), R, halved (dashed line), Cm doubled (dot-dash line).(A) voltage transients at input site (segment 146: 158 pAm). (B) clamp cur-
rents recorded at the soma. Changing Rm has virtually no effect on thewaveforms. Halving R, speeds both responses, reducing the peak voltageswing and increasing the peak clamp current. Doubling Cm slows and at-tenuates both responses. Interestingly, the very early parts of the Cm = 1.4and the Ri = 100 voltage responses in A are nearly identical (see Footnote2 for explanation).
A preliminary attempt at this has been carried out for sim-ulated Schaeffer collateral inputs into the CAl cell model.Two input sites were selected: a very proximal location on
the apical trunk (segment 68: Fig. 7, A), and the apical ob-lique site in previous figures (half way along segment146: 0). The first is closer to the soma than the vast majorityof probable Schaeffer synapses, and is intended to representthe best plausible case for space clamping. The second isintended to represent a typical Schaeffer collateral input.
Many other Schaeffer inputs arrive even further (electrically)from the soma, and will consequently suffer even more cabledistortion.The input current parameters were as above: slower cur-
rents would lead to less severe and faster currents to moresevere distortions (see Example 1). The default electricalparameters were those used above, except that gshunt was setto zero, instead of 15 nS, to mimic more closely the probablesituation with whole-cell recording (e.g., Refs. 5 (Chapter 6),38-40). A range of values of series resistance between 0 and100 Mfl were explored. In addition, a model with a more"traditional" value of Ri of 70 flcm was tested, as well asone with a lower Rm of 40,000 flcm2. The latter model hada Tm of 28 ms which is consistent with those recordedfrom adult guinea pig CAl neurones at rest using the nystatinpatch method (40). It can be seen from Fig. 9 B that raisingCm from 0.7 ,uFcm -2 would lead to increased distortion ofthe clamp currents with perfect clamp. In addition, the seriesresistance effects would become worse (see Paper II, Pa-rameter Dependence of Imperfect Clamp Impulse Responsesection).The results of the simulations are summarized in Fig. 10.
In Fig. 10 A the clamp current waveforms for the two inputlocations with the default electrical parameters are comparedto the actual input current ("Soma" measurement) for threesample values of series resistance: 0 (perfect clamp), 2 MfQ,achievable with whole cell recording using the cleaningmethod (e.g., Refs. 15 and 38), and 20 MQl, which can beachieved routinely with the "blind" method (e.g., Refs. 18and 41) or the perforated patch method with partial seriesresistance compensation (based on series resistances in Refs.32 and 40). The clamp current waveforms from both den-dritic inputs are seriously smoothed and attenuated by thecable alone (in agreement with the previous simulations).Any series resistance worsens the distortions, particularly forthe less smoothed proximal input.The other three panels of Fig. 10 summarize waveform
measures for all three models over the full range of seriesresistances investigated. The relative peak current "efficacy"(measured . actual) is shown in Fig. 10 B. The efficacy isworse for the midoblique input than for the trunk input (14.7vs. 72%, default model with Rser = 0, falling to 8.5 and26.1%, respectively, with Rser = 20 MQ). The proximal tomidoblique difference is smaller for the low Ri model.Changing Rm has virtually no effect (consistent with resultsabove). The fall-off with increasing series resistance is worsefor the trunk input than the oblique input. The fall-off is alsoworst for the low Ri model, because more of the dendriticcapacitance is "exposed to" the clamp amplifier. These sim-ulations suggest that the Schaeffer collateral quantal con-ductances measured experimentally (e.g., Refs. 27-32, 42),which typically are in the range 30-70 pS, may be seriousunderestimates of the true conductances, perhaps by as muchas an order of magnitude.
Fig. 10 C shows the 20-80% rise times of the clamp cur-rents, compared with the 0.11-ms rise time of the input cur-
I I I I
I -s r
484 Biophysical Joumal

485Analytical Solutions: Voltage Clamp Problems
Effects of Dendritic Cable and Series ResistanceDefault: Cm 0.7 gFcm -2 Rm 1 00,000 Q cm2 Ri 200 Q cm
Lpical Oblique 70seg. 146) 0
c 60
f 40
R5er [MQ] ~,,
20 0
._
.............. 2 X 20co
n 91 .fl
B: Peak Current "Efficacy"
Oblique Trunk(seg. 146) (seg. 68)
-+-- -A- Default
....0o ....& R,70Qcm
- ^- - - o- - Rm40 kQcm2
0 5 10 15 2Time (ms]
C: 20% - 80% Rise Times4.0
3.5
3.0- ,4.
2.5-
1..012.0
I.Os
0.5 : . z . ................
11--A. .......
0.0J0 20 40 60 80
Series Resistance [MO]
20 0 20 40 60 80Series Resistance [MCI]
D: Effective Decay Time Consts.
100 0 20 40 60 80Series Resistance [MQ]
FIGURE 10 CAl pyramidal cell, full model: the combined filtering effects of the dendritic cable and the series resistance on the clamp currents recordedin response to simulated Schaeffer collateral inputs. The current parameters and model morphology were as specified in the legend of Fig. 7. Two of theinput locations shown in Fig. 7 were selected, the proximal apical trunk site (filled triangles, segment 68, an "optimistic" position for a Schaeffer collateralinput) and the slightly distal-of-mid apical oblique site (filled circles, segment 146, half way along, a typical likely position). Three models were tested,all with Cm = 0.7 ,uFcm -2 and gshunl = 0 nS. The default Rm and R, were 100,000 kcm2 and 200 flcm, respectively. (A) clamp current waveforms icla"mpfrom the default model, compared to the actual input current isyn (marked "Soma"), for three values of series resistance 0 (solid line), 2 MQ1 (dotted line),and 20 Mfl (dashed line). (B-D) clamp current waveform measures versus series resistance, for all three models. Default, grey symbols; Ri = 70 Qlcm,open symbols; Rn = 40, 000 kcm2, black filled symbols. Circles correspond to the the oblique input, and triangles to the trunk input. (B) peak currentefficacy (i.e., measured clamp current/actual synaptic current): notice that the efficacies of the trunk input superimpose almost exactly for the default andRm = 40, 000 models. (C) 20-80% rise times. Again the default and Rm = 40, 000 models' trunk inputs superimpose. The actual t2080 of the synaptic currentis arrowed. (D) effective decay time constants, fitted between peak + 0.7 ms and peak + 20 ms. The actual decay time constant Ty2 = 2 ms of the synapticcurrent is indicated by the arrow.
Major
A: Clamp Current Waveforms
I .-,
Apical Trunk(seg. 68) A
0.0001
-0.005 -
-0.010 -
i -0.015
i -0.020-
-0.025-u
-0.030-coU- -0.035-
-0.040-
-0.045s100
Cac
O.
100
1- I I Ir I
w
I a-
.......v

Volume 65 July1993
Clamp Curren(somatic recording)
step command = 10 m
6 10
Time [ms]
B Voltage Transie
0 20 40Time [ms]
FIGURE 11 CAl pyramidal cell, perfect vo
parison of full model and cartoon responses to acommand. (A) Clamp current recorded at son
redistribution. (B) Local voltage responses at ;
Table 3 for precise locations). Notice that the c
of the speed of response, and the steady-state leithe case of the apical tuft site.
ts resistance of only 2 MQl, the default model proximal inputhas its t2080 slowed by a factor of 1.55, to 0.17 ms, but theoblique input has its t2080 slowed to 2.1 ms, by a factor ofnearly 20. With a series resistance of 50 Mfl, the obliqueinput's t2080 is 3.2 ms. Again, changes in Rm have little effecton the proximal input. With small series resistances, changes
v in Rm also have little effect on the oblique input. DecreasingRm reduces the oblique rise times and, perhaps counterin-
model: tuitively, the proximal to midoblique separation of rise times(despite the increase in the electrotonic distance of the inputfrom the soma). The reduction is more severe when Rser islarge. Decreasing Ri reduces the proximal to midoblique sep-aration but accentuates the series resistance effects (as withthe peak currents).
full It is interesting to compare the rise times above with someof those reported experimentally for the clamp currents ofthe AMPA components of Schaeffer collateral inputs:
-stead e.g., around 1-4 ms (Ref. 17), t1ogo values measured, whichsteady state tend to be about 50% longer than t2080 values, Rser around
7 Mfl) and around 4.8 ms (Ref. 43, pipette resistances3-8 Mfl, Rser possibly around three times as high, e.g., see20 30Ref. 41).
Fig. 10 D shows the effective decay time constants (Teff
fts recording values) of the clamp currents, when a single exponential was
site: fitted (using a simplex algorithm) between tpe + 0.7 andsoma b tpeak + 20 ms, where tpeak is the time at which the peakmid basal current occurred (following Ref. 15). Although the clampapical currents were actually composed of many different compo-oblique nents with different time constants over the fit interval, in allapical cases the optimal single exponential fit appeared acceptable~~:~~~tuft by eye, when examined with a linear current axis. Every fitmodel: S.D. (see Waveform Measures section above) was less than
0.0004. As emphasized in Paper I (Example 2) and above, the................cartoon effective time constants change with the fit interval chosen,
so it is important for experimenters to adopt a clearly spec-ified convention.3
full It can be seen from Fig. 10 D that Teff increases approx-imately linearly with low series resistances (less than about20 Mfl), as was shown above for the effective time constantsof a single cylinder + soma model. The more distal the inputlocation, the larger the intercept at Rser = 0. The lines for theproximal and midoblique locations run approximately par-allel to begin with, then diverge at higher Rser values as the
60 80 100 'Teff of first the proximal, then the midoblique response beginsto increase more slowly. The slopes of these lines are in-
ltage clamp, Case II: com- creased by lowering Ri or raising Rm: both changes bring10-mV somatic voltage step more dendritic capacitance electrically "near" to the clampna. Notice the slow charge point, and exacerbate the series resistance effects (see Paperselected dendritic sites (see-lamp is poor, both in terms I Influence of Electrical Parameters on Effect of Rser sec-vels attained, particularly in
rent. The dendritic cable alone is capable of producing a more
than 10-fold slowing in the case of the oblique input in allthree models. Series resistances of 100 Mfl can produce a
further approximate doubling of the rise times. With a series
3The example in Paper I was for voltage transients measured in a model witha 100-nS shunt. As discussed in Paper II (under the Comparison to VoltageRecording with a Shunt section) the clamp currents with imperfect clampare an upside-down version of the soma-recorded waveforms scaled by g&,where gseris set equal to the voltage recording gshunt.The same argumentstherefore apply to the clamp current waveforms as apply to the somaticvoltage transients.
A
1.5-
1.0-
6-
4)0~c
.V 0.5-u
0.0-
10-
8
6-
4-
2-
s
c
4)004L)
1.0S04)
OJ
I I
486 Biophysical Journal

Analytical Solutions: Voltage Clamp Problems
tion). Interestingly, the proximal input's slope is more sen-sitive to Ri and the midoblique input's slope is more sensitiveto Rm, reflecting the progressive increase in importance of themembrane resistance in shaping slower events. Again, theproximal to midoblique separation is decreased by loweringRi or (perhaps counterintuitively) Rm.
With perfect clamp, the default model produced a prox-imal Teff of 2.53 ms, an increase by a factor of only 1.26 fromthe actual decay time constant of 2 ms. The midoblique inputresulted in a Teff of 9.11 ms, an increase by a factor of over4.5 due to the cable alone. With a series resistance of 50 Mfl,the midoblique input's Teff was 23.8 ms, an increase by overan order of magnitude. Some experimental values of decaytime constants for comparison are: around 7.3 ms (mainlyAMPA component; shortest 3.2 ms (27)), 40 ms (AMPAcomponent (43)), and about 4-15 ms (AMPA component(17)). The discrepancies between some of these figures maywell be caused by differences in fit intervals as well as bydifferences in experimental conditions.
It is worth re-emphasizing that, for a given Rser) increasingRm: (i) has virtually no effect on the peak current attenuationsor proximal rise times, (ii) slows distal inputs' rise times, and(iii) slows effective decay time constants.
Rather than improving the clamp of transient inputs, de-liberately increasing Rm with channel blockers such as Cs'will actually worsen the distortions which occur (assuminga purely passive membrane).Much of the plausible range of biological parameters is
covered in Fig. 10. Cm could well be higher, leading to evengreater distortions. Ri values higher than 200 flcm are pos-sible (e.g., Refs. 4 and 5): they would lead to stronger cablebut weaker series resistance effects. To be complete, a rangeof input kinetics and a larger range of electrical parametersand input locations should be explored for more than one cell.In addition, the results should be confirmed using compart-mental models and conductance inputs into explicitly mod-elled spines (e.g., Refs. 5 and 15), to allow for reductions indriving force. This nonlinearity will further distort wave-forms. Finally, the effects of dendritic active conductancesshould be investigated. The basic conclusion, however, islikely to stand: the majority of Schaeffer collateral inputsonto CAl cells are extremely poorly clamped, and the re-corded clamp currents are heavily attenuated and slowed,by up to an order of magnitude with reasonable parametervalues.
Case II: Responses to voltage command steps
Responses to a 10 mV voltage command step at the soma areshown in Fig. 11 for both the full model and the cartoon,under perfect clamp. The default electrical parameters aboveare used, including gshunt = 15 nS. The clamp currents areplotted in A: notice that there is significant charge redistri-bution occurring as late as 20 ms. As with the synaptic clampcurrents above, there is good (but not perfect) agreementbetween the currents required by the two representations. The
those on the apical trunk, are shown in Fig. 11 B. Again, thereis reasonable agreement between the two representations,except possibly at the apical tuft. All sites are remarkablybadly clamped: even the proximal basal site requires about15 ms to approach the steady state. The apical tuft requiresover 80 ms to reach a steady-state level of about 70% of thecommand step. As mentioned above, Cm and Ri values higherthan those actually used are entirely plausible: clamp per-
formance would then be even worse. A full exploration ofparameter dependencies is not included, for reasons of space,but as with the subsynaptic voltage swings, voltage controlis poor over a wide range of plausible electrical parameters.Naturally, any series resistance will make control even
worse, since the soma voltage no longer tracks the commandpotential (see Paper II, Example 2).
DISCUSSION
Effective decay time constants
As in Paper I, it is possible to fit many transients over rea-
sonably long intervals with a single exponential, despite thefact that they are in reality composed of many componentswith different time constants. The time constant of the op-
timum fit, termed the effective or apparent time constant
Teff, depends on the interval chosen. Fits are often better whenthe model has a complex geometry and generates many
closely spaced time constants Tn. Experimenters are urged toinspect semi-log plots and to adopt clearly specified con-
ventions for fit intervals and numbers of components, whenattempting to measure the "time constant(s)" of clamp cur-
rent waveforms.
Cable effects and poor space clamp
The examples above demonstrate the difficulties of voltageclamping neurones with significant cable properties, as
suggested by the combination of morphological and elec-trical parameters used here and in other studies (e.g., Refs.4, 5, and 7). In Case I, the clamp of synaptic inputs, even
fairly proximal synaptic inputs may be smoothed and atten-uated before reaching the soma, and the recorded clampcurrents may be strongly filtered versions of the true synapticcurrents injected into the dendrites. Voltage control downthe dendrites is also likely to be extremely poor, with themajor part of the dendritic voltage swing (which is dominatedby charge redistribution) hardly being affected by voltageclamping. If voltage-dependent conductances are presentin the dendrites (e.g., Ref. 44), somatic voltage clampingmay not be sufficient to prevent these being activated bysynaptic inputs. In Case II, dendritic responses will be se-
riously delayed and attenuated versions of the command volt-age imposed at the soma. This will complicate the interpre-tation of voltage clamp experiments on dendritic activeconductances, especially those with rapid kinetics and distal
voltage responses at the sites specified above, excluding
Major 487
locations.
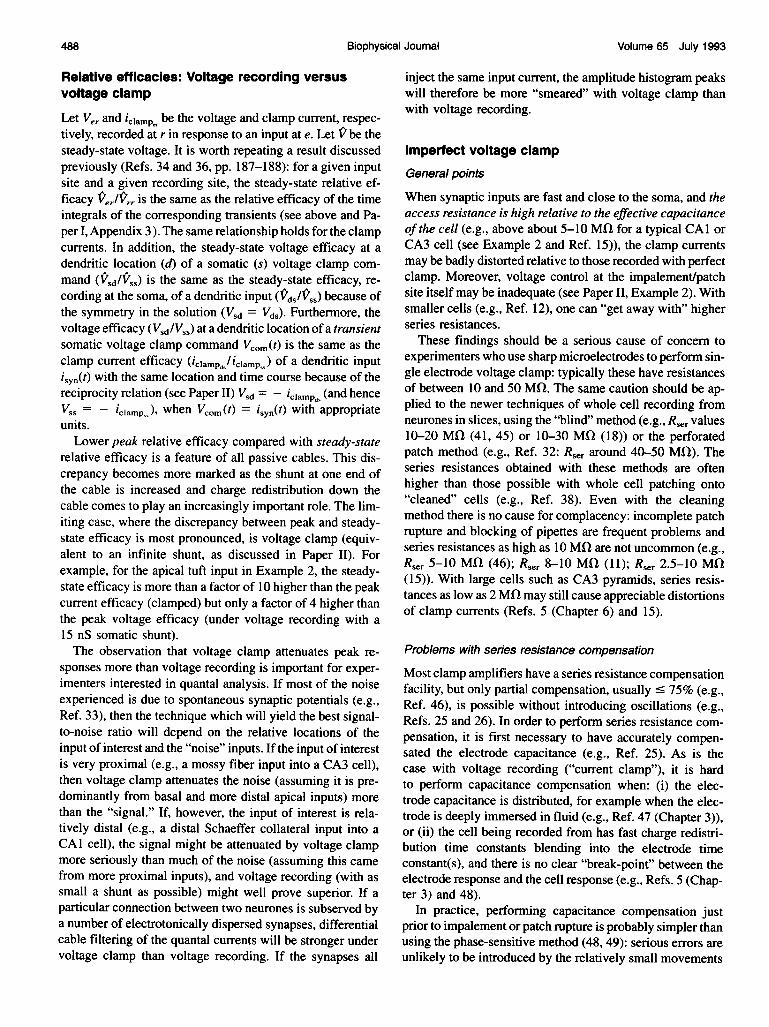
Volume 65 July 1993
Relative efficacies: Voltage recording versusvoltage clamp
Let Ver and iclamp,, be the voltage and clamp current, respec-tively, recorded at r in response to an input at e. Let 1V be thesteady-state voltage. It is worth repeating a result discussedpreviously (Refs. 34 and 36, pp. 187-188): for a given inputsite and a given recording site, the steady-state relative ef-ficacy Ver/Vrr is the same as the relative efficacy of the timeintegrals of the corresponding transients (see above and Pa-per I, Appendix 3). The same relationship holds for the clampcurrents. In addition, the steady-state voltage efficacy at adendritic location (d) of a somatic (s) voltage clamp com-mand (Vsd/Vss) is the same as the steady-state efficacy, re-cording at the soma, of a dendritic input (Vds/Vss) because ofthe symmetry in the solution (Vsd = VdS). Furthermore, thevoltage efficacy (Vsd/VsS) at a dendritic location of a transientsomatic voltage clamp command Vcom(t) is the same as theclamp current efficacy (Uclampd /iclampS) of a dendritic inputisyn(t) with the same location and time course because of thereciprocity relation (see Paper II) VSd = -iclampdS (and henceVss = - iclamp,), when Vcom (t) = isyn(t) with appropriateunits.Lower peak relative efficacy compared with steady-state
relative efficacy is a feature of all passive cables. This dis-crepancy becomes more marked as the shunt at one end ofthe cable is increased and charge redistribution down thecable comes to play an increasingly important role. The lim-iting case, where the discrepancy between peak and steady-state efficacy is most pronounced, is voltage clamp (equiv-alent to an infinite shunt, as discussed in Paper II). Forexample, for the apical tuft input in Example 2, the steady-state efficacy is more than a factor of 10 higher than the peakcurrent efficacy (clamped) but only a factor of 4 higher thanthe peak voltage efficacy (under voltage recording with a15 nS somatic shunt).The observation that voltage clamp attenuates peak re-
sponses more than voltage recording is important for exper-imenters interested in quantal analysis. If most of the noiseexperienced is due to spontaneous synaptic potentials (e.g.,Ref. 33), then the technique which will yield the best signal-to-noise ratio will depend on the relative locations of theinput of interest and the "noise" inputs. If the input of interestis very proximal (e.g., a mossy fiber input into a CA3 cell),then voltage clamp attenuates the noise (assuming it is pre-dominantly from basal and more distal apical inputs) morethan the "signal." If, however, the input of interest is rela-tively distal (e.g., a distal Schaeffer collateral input into aCAl cell), the signal might be attenuated by voltage clampmore seriously than much of the noise (assuming this camefrom more proximal inputs), and voltage recording (with assmall a shunt as possible) might well prove superior. If aparticular connection between two neurones is subserved bya number of electrotonically dispersed synapses, differentialcable filtering of the quantal currents will be stronger under
inject the same input current, the amplitude histogram peakswill therefore be more "smeared" with voltage clamp thanwith voltage recording.
Imperfect voltage clampGeneral points
When synaptic inputs are fast and close to the soma, and theaccess resistance is high relative to the effective capacitanceof the cell (e.g., above about 5-10 Mfl for a typical CAl orCA3 cell (see Example 2 and Ref. 15)), the clamp currentsmay be badly distorted relative to those recorded with perfectclamp. Moreover, voltage control at the impalement/patchsite itself may be inadequate (see Paper II, Example 2). Withsmaller cells (e.g., Ref. 12), one can "get away with" higherseries resistances.
These findings should be a serious cause of concern toexperimenters who use sharp microelectrodes to perform sin-gle electrode voltage clamp: typically these have resistancesof between 10 and 50 Mfl. The same caution should be ap-plied to the newer techniques of whole cell recording fromneurones in slices, using the "blind" method (e.g., Rser values10-20 MQl (41, 45) or 10-30 MQl (18)) or the perforatedpatch method (e.g., Ref. 32: Rser around 40-50 MQl). Theseries resistances obtained with these methods are oftenhigher than those possible with whole cell patching onto"cleaned" cells (e.g., Ref. 38). Even with the cleaningmethod there is no cause for complacency: incomplete patchrupture and blocking of pipettes are frequent problems andseries resistances as high as 10 MQl are not uncommon (e.g.,Rser 5-10 MQl (46); Rser 8-10 MQl (11); Rser 2.5-10 MQl(15)). With large cells such as CA3 pyramids, series resis-tances as low as 2 MQl may still cause appreciable distortionsof clamp currents (Refs. 5 (Chapter 6) and 15).
Problems with series resistance compensation
Most clamp amplifiers have a series resistance compensationfacility, but only partial compensation, usually ' 75% (e.g.,Ref. 46), is possible without introducing oscillations (e.g.,Refs. 25 and 26). In order to perform series resistance com-pensation, it is first necessary to have accurately compen-sated the electrode capacitance (e.g., Ref. 25). As is thecase with voltage recording ("current clamp"), it is hardto perform capacitance compensation when: (i) the elec-trode capacitance is distributed, for example when the elec-trode is deeply immersed in fluid (e.g., Ref. 47 (Chapter 3)),or (ii) the cell being recorded from has fast charge redistri-bution time constants blending into the electrode timeconstant(s), and there is no clear "break-point" between theelectrode response and the cell response (e.g., Refs. 5 (Chap-ter 3) and 48).
In practice, performing capacitance compensation justprior to impalement or patch rupture is probably simpler thanusing the phase-sensitive method (48, 49): serious errors are
voltage clamp than voltage recording. If the synapses all
488 Biophysical Journal
unlikely to be introduced by the relatively small movements

Analytical Solutions: Voltage Clamp Problems
associated with impalement or patch rupture. Further prob-lems are caused when electrodes display additional nonca-pacitative artifacts (e.g., Refs. 5 (Chapter 3), 47, 50), al-though some amplifiers have additional facilities forcompensating these (e.g., the Cp setting of the C-slow dialon the EPC-7).
Contrary to previous results (3), there is often no easy wayto separate soma charging currents from cable charging cur-rents. However, series resistance compensation can still beperformed (depending on the amplifier) by sharpening up theclamp current resulting from a voltage step command, so-dium currents or fast post-synaptic currents, until the pointat which oscillations just fail to occur. There is a danger,however, of "over-sharpening" caused by undetected "ring-ing." Better methods might be to estimate the series resis-tance first from the initial height of the unfiltered clampcurrent transient in response to a voltage step, or by the "nojump" transient balancing method described above for theEPC-7. In the latter case, the G-series dial should be set tothe correct gser (which may be hard if there is substantialnoise or overfiltering), the C-slow dial should be turned rightdown to avoid miscompensating the soma capacitance, andthe %COMPensation dial should be turned up until just be-fore ringing occurs.
Since, in practical situations there will always be someresidual series resistance, the results presented in the twoexamples above will always apply to some degree. The prob-lems will be compounded if the series resistance is changingover time. For these reasons, rather than compensating seriesresistance, it may be better to monitor then model it: this issueneeds to be explored more carefully.
Series resistance can also be estimated by performingbridge balance in current clamp mode. This latter technique,however, also suffers from the "no break-point" problem.More accurate but time-consuming measurements of Rsercould also be performed under current clamp using the phase-sensitive technique (48).
Problems with switch clamp
At first sight, the use of discontinuous voltage clamp (e.g.,Ref. 50) might offer a way of by-passing series resistancealtogether. However, as discussed by Wilson and Park (48),switch clamp in a cell with dendritic cables suffers from theno break-point problem afflicting the continuous methods(see above). To quote them:"The use of switching amplifiers .., is therefore not a panacea for the prob-lems of amplifier alignment in intracellular recording."
The optimal switching rate cannot be determined intrac-ellularly in a nonisopotential cell, because there is no roughly"flat portion" of the cell's voltage response (and therefore ofthe headstage waveform) after the electrode artifact. Nor canit be determined extracellularly, because of the following.
(i) Series resistances (and hence electrode time constants)are often 2-6-fold higher than the original pipette resistanceswhen whole-cell recording with the "blind" (e.g., Ref. 41),standard whole cell or perforated patch methods (51);
(ii) Rser may be unstable over time;(iii) what counts is the electrode artifact relative to the
cell's response: it is "safe" to sample the membrane potentialonce the artifact has fallen to less than 1%, say, of the cell'sresponse; and
(iv) there is a "nonsumming interaction" between the elec-trode and the cell: for a given Rser, the duration of the in-tracellular artifact is longer than that of the extracellular ar-tifact (Ref. 5 (Chapter 3)). This is analogous to thenonsumming interaction between different components ofthe cell when Rser> 0, discussed in Paper II (Example 2).
See the Appendix for a possible (and untested) ad hoc wayout of this dilemma.Of course, switch clamp can do nothing to alleviate cable
effects. However, with somatic inputs, low series resistances(a few MQl) and careful capacitance compensation, it doesseem possible to record fast synaptic currents (e.g., Ref. 9).Even so, there can be significant voltage escape at the soma(e.g., Ref. 9 (Fig. 3)), analogous to that which would occurwith uncompensated series resistance.A more thorough theoretical and practical exploration of
switch clamp in neurones with dendrites is required.
Combined effects of dendritic cables and series resistance
The results above suggest that the filtering effects of den-dritic cables and series resistance compound one anotherin a less than additive way for peak clamp currents, andin a roughly additive way for rise times and apparent decaytime constants (depending on the input time constants). Botheffects are worse for faster inputs. Decreasing Ri reducescable effects. Increasing Rm hardly changes the cable effects.Both manipulations worsen the smoothing caused by anyseries resistance, by improving charge transfer between theclamp amplifier and dendritic membrane capacitance. Thepreliminary "realistic" simulations above of Schaeffer col-lateral inputs into a CAl cell (Example 2) demonstrate thatwith plausible combinations of parameters, all current wave-form measures can be distorted by up to an order of mag-nitude.To assess quantitatively cable and series resistance effects
on recorded clamp currents, it will be necessary to makefairly specific models of the particular experimental systemof interest, exploring the likely ranges of current kinetics,morphologies, electrical parameters, input locations, and se-ries resistances (e.g., see Refs. 5 and 15). Using model cellswith the inappropriate shapes or sizes, or incorrect electricalor input parameters could lead to misleading conclusions,particularly where those conclusions are optimistic, i.e., "theclamp works well enough." (For example, with reference tothe clamp currents from mossy fiber inputs onto CA3 py-ramidal cells, contrast the conclusions of Johnston andBrown (7) with those of Jonas et al. (15). The first of thesetwo studies assumed slower synaptic inputs than the secondand concluded that the clamp currents were probably notsmoothed significantly. In the latter study, in the worst plau-sible cases, significant distortions could occur.)
Major 489

490 Biophysical Journal Volume 65 July 1993
OverviewThe two examples above illustrate a number of importantpractical problems concerning the experimental procedure ofvoltage clamping neurones with extensive dendritic trees. Itis hoped that the relative ineffectiveness of voltage clampdemonstrated for the CAI pyramidal cell model will provokemore thorough modelling studies by other investigators andmore caution by experimenters in the interpretation of theirresults.
SUMMARY AND CONCLUSIONS1) It is possible to approximate the decay phases of noisy
synaptic clamp currents with single exponentials over inter-vals when they are in reality composed of many exponentialcomponents. More complex neuronal geometries, which pro-duce more closely spaced time constants, allow better fits.Semi-log plots should be used to inspect fits. The effectivetime constant Teff varies with the fit interval, so it is importantto specify clearly the convention being adopted.
2) Synaptic clamp current waveform parameters dependon distance from the soma z, series resistance Rser, and thetime course of the synaptic current. Peak currents decreasewith increasing z and Rser. The effects are stronger for fasterinputs. Rise times and effective decay time constants increasewith z, Rser, and Tsys the decay time constant of the synapticcurrent. The Teff values increase almost linearly with both Rserand T,,y The rates of increase of all measures slow down neardendritic tips and with high enough series resistances.
3) Many of Jackson's approximations (3) break down (asnoted by that author) if the ratio of the dendritic (infinitelyextended) to somatic input conductance (without a shunt),p., is high. This is demonstrated for an example with p. ofthe order of 50, a plausible value for many pyramidal cells.When a voltage step is applied, soma and cable chargingcurrents cannot easily be separated for such models.
4) "Subtractive" capacitance compensation techniquesmay seriously overestimate the true soma capacitance if ex-tremely fast time bases (>100 kHz sampling) are not used.This can lead to other modelling errors. In such cases it maybe better to perform series resistance compensation withoutsoma capacitance compensation and to make use of the im-perfect clamp solutions (or compartmental models) to fit theexperimental data.
5) In a CAl pyramidal cell model with biologically plau-sible electrical parameters, imposing perfect somatic voltageclamp hardly changes the peak voltage swings at synapticinput sites. The transients are insensitive to changes in spe-cific membrane resistivity Rm, except at late times.
6) Under perfect clamp, synaptic clamp currents are muchbriefer than the corresponding synaptic potentials under volt-age recording, and show more rapid fall-off in peak relativeefficacy as the input site is moved away from the clamp point.Time integral relative efficacies for both voltage clamp andvoltage recording are the same as the corresponding steady-state relative efficacies. With the electrical parameters used,dendritic trees based on the morphologies of real pyramidalcells can cause significant attenuation and smoothing of syn-
aptic inputs. Again, the early parts of the transients are in-sensitive to Rm.
7) The effects of series resistance and dendritic cablescompound one another, less than additively for peak currents,and roughly additively for rise times and effective decay timeconstants. Plausible combinations of parameters can lead toattenuation and smoothing of the clamp currents fromSchaeffer collateral inputs into a CAl cell model by up to anorder of magnitude.
8) With plausible parameters, dendritic voltages resultingfrom a somatic voltage command step can show significantdelays (15-80 ms) before reaching steady state.
9) The space clamp and voltage clamp problems outlinedabove are unlikely to be solved by the application of switchclamp: fundamental limitations are imposed by the electricalgeometry of the cell being clamped and the properties of theelectrode used.
10) The example models presented here are intended toillustrate the analytical solutions of the previous two papers,to alarm experimenters attempting to voltage clamp neuroneswith extensive dendritic trees, and to encourage more de-tailed modelling of each experimental situation.
APPENDIX: OPTIMAL SWITCH CLAMP RATESFOR NEURONESProblems arise when attempting to determine the optimal switching rate fordiscontinuous voltage clamp of neurones with nonisopotential dendrites.Suppose all the cells of a given class have similar voltage responses to briefcurrent pulses (e.g., of 10-gs duration). A new electrode's extracellular ar-tifact, with optimal capacitance compensation, following the pulse could becompared to a "typical" cell's response (with its own electrode control sub-tracted). The time t1 taken for the new electrode's artifact to fall to 1% ofthe cell's response could be measured. There is a further complication: theresponse of the combined electrode-cell system is greater than the sum ofthe responses of electrode and cell alone (Ref. 5, Chapter 3). The presenceof the cell slows the capacitative artifact of the electrode by a factor of about3, since it is no longer discharging directly to earth. (The exact factor willdepend on the electrode, the cell, and the criterion adopted for the "end" ofthe artifact.) The effective artifact will therefore have a duration of about3t,. With a 33% duty cycle, this gives a sample interval of 3/2 X 3t,, i.e., a"safe" switch rate of 0.22/tI. If the series resistance and hence electrode timeconstant increase by a factor of FR following establishment of the recordingfrom the cell, then the "safe" switch rate is slowed to roughly 0.22/FRti.Voltage transients much faster than this will not be adequately clamped, andthe clamp currents will be slower than the real currents. Note that the du-ration of the original current pulse tested should be similar to the durationof the current injection phase of the switch cycle. Approximate series re-sistance should be monitored periodically by one of the methods describedabove, and adjustments to the switch rate should be made accordingly.
I would like to thank Nelson Spruston, Ken Stratford, Mike Hausser, GregStuart, Peter Jonas, and Bert Sakmann for helpful discussions and criticisms,and Julian Jack, Alan Larkman, and Jonathan Evans for indispensable sup-port and advice. I am grateful to the Wellcome Trust for financial support(see Paper I (1)).
REFERENCES1. Major, G., J. D. Evans, and J. J. B. Jack. 1993. Solutions for transients
in arbitrarily branching cables: I. Voltage recording with a somaticshunt. Biophys J., 65:423-449.
2. Major, G., J. D. Evans, and J. J. B. Jack. 1993. Solutions for transients

Major Analytical Solutions: Voltage Clamp Problems 491
in arbitrarily branching cables: II. Voltage clamp theory. Biophys J.,65:450-468.
3. Jackson, M. B. 1992. Cable analysis with the whole-cell patch clamp.Theory and experiment. Biophys. J. 61:756-766.
4. Stratford, K. J., A. J. R. Mason, A. U. Larkman, G. Major, and J. J. B.Jack. 1989. The modelling of pyramidal neurones in the visual cortex.In The Computing Neurone. R. Durbin, C. Miall, and G. Mitchison,editors. Addison-Wesley, Reading, UK. 296-321.
5. Major, G. 1992. The physiology, morphology and modelling of corticalpyramidal neurones. D.Phil. thesis. Laboratory of Physiology, OxfordUniversity. 275 pp.
6. Rall, W., and I. Segev 1985. Space-clamp problems when voltageclamping branched neurons with intracellular microelectrodes. In Volt-age and Patch Clamping with Microelectrodes. T. G. Smith Jr., H. Lecar,S. J. Redman, and P. Gage, editors. American Physiological Society,Bethesda, MD. 191-215.
7. Johnston, D., and T. H. Brown. 1983. Interpretation of voltage-clampmeasurements in hippocampal neurons. J. Neurophysiol. 50:464-486.
8. Spruston, N., D. B. Jaffe, S. H. Williams, and D. Johnston. 1993. Voltageand space clamp errors associated with the measurement of electro-tonically remote synaptic events. J. Neurophysiol. In press.
9. Finkel, A. S., and S. J. Redman. 1983. The synaptic current evoked incat spinal motoneurones by impulses in single group la axons. J. Phys-iol. 342:615-632.
10. Edwards, F. A., A. Konnerth, and B. Sakmann, with an appendix by C.Busch. 1990. Quantal analysis of inhibitory synaptic transmission in thedentate gyrus of rat hippocampal slices: a patch-clamp study. J. Physiol.430:213-249.
11. Keller, B. U., A. Konnerth, and Y. Yaari. 1991. Patch clamp analysis ofexcitatory synaptic currents in granule cells of rat hippocampus. J. Phys-iol. 435:275-293.
12. Silver, R. A., S. F. Traynelis, and S. G. Cull-Candy. 1992. Rapid-time-course miniature and evoked excitatory currents at cerebellar synapsesin situ. Nature. 355:163-166.
13. Colquhoun, D., P. Jonas, and B. Sakmann. 1992. Action of brief pulsesof glutamate on AMPA/kainate receptors in patches from different neu-rones of rat hippocampal slices. J. Physiol. 458:261-287.
14. Stem, P., F. A. Edwards, and B. Sakmann. 1992. Fast and slow com-ponents of unitary EPSCs on stellate cells elicited by focal stimulationin slices of rat visual cortex. J. Physiol. 449:247-278.
15. Jonas, P., G. Major, and B. Sakmann. 1993. Quantal analysis of unitaryEPSCs at the mossy fiber synapse on CA3 pyramidal cells of rat hip-pocampus. J. Physiol. In press.
16. Nelson, P. G., R. Y. K. Pun, and G. L. Westbrook. 1986. Synapticexcitation in cultures of mouse spinal cord neurones: receptor phar-macology and behavior of synaptic currents. J. Physiol. 372:169-190.
17. Hestrin, S., R. A. Nicoll, D. J. Perkel, and P. Sah. 1990. Analysis ofexcitatory synaptic action in pyramidal cells using whole-cell recordingfrom rat hippocampal slices. J. Physiol. 422:203-225.
18. McBain, C., and R. Dingledine. 1992. Dual-component miniature ex-citatory synaptic currents in rat hippocampal CA3 pyramidal neurones.J. Neurophysiol. 68:16-27.
19. Clements, J. D., and S. J. Redman. 1989. Cable properties of cat spinalmotoneurons measured by combining voltage clamp, current clamp andintracellular staining. J. Physiol. 409:63-87.
20. Rall, W. 1969. Time constants and electrotonic length of membranecylinders and neurons. Biophys. J. 9:1483-1508.
21. Press, W. H., B. P. Flannery, S. A. Teukolsky, and W. T. Vetterling. 1988.Numerical Recipes in C: The Art of Scientific Computing. CambridgeUniversity Press, Cambridge, UK. 735 pp.
22. Larkman, A. U., G. Major, K. J. Stratford, and J. J. B. Jack. 1992.Dendritic morphology of pyramidal neurones of the visual cortex of therat: IV. Electrical geometry. J. Comp. Neurol. 323:153-166.
23. Larkman, A., and A. Mason. 1990. Correlations between morphologyand electrophysiology of pyramidal neurons in slices of rat visual cor-tex. I. Establishment of cell classes. J. Neurosci. 10:1407-1414.
24. Major, G., A. U. Larkman, and J. J. B. Jack. 1990. Constraining non-uniqueness in passive electrical models of cortical pyramidal neurones.J. Physiol. 430:23P.
25. Sigworth, F. J. 1983. Electronic design of the patch clamp. In Single-Channel Recording. B. Sakmann, and E. Neher, editors. Plenum Press,New York. 3-35.
26. Sigworth, F. J. 1985. EPC-7 User's Manual. List-electronic, Darmstadt,Germany. 74 pp.
27. Bekkers, J. M., G. B. Richerson, and C. F. Stevens. 1990. Origin ofvariability in quantal size in cultured hippocampal neurons and in hip-pocampal slices. Proc. Natl. Acad. Sci. USA. 87:5359-5362.
28. Malinow, R., and R. W. Tsien. 1990. Presynaptic enhancement shownby whole-cell recordings of long-term potentiation in hippocampal slic-es. Nature 346:177-180.
29. Randall, A. D., J. G. Schofield, and G. L. Collingridge. 1991. Patch-clamp recordings of spontaneous and evoked minimal synaptic currentsfrom CAl neurones of rat hippocampal slices. J. Physiol. 438:256P.
30. Malinow, R. 1991. Transmission between pairs of hippocampal sliceneurons: quantal levels, oscillations, and LTP. Science. 252:722-725.
31. Manabe, T., P. Renner, and R. A. Nicoll. 1992. Postsynaptic contributionto long-term potentiation revealed by the analysis of miniature synapticcurrents. Nature. 355:50-55.
32. Kullman, D. M., and R. A. Nicoll. 1992. Long-term potentiation isassociated with increases in quantal content and quantal amplitude.Nature. 357:240-244.
33. Larkman A., K. Stratford and J. Jack. 1991. Quantal analysis of exci-tatory synaptic action and depression in hippocampal slices. Nature.350:344-347.
34. Rinzel, J., and W. Rall. 1974. Transient response in a dendritic neuronmodel for current injected at one branch. Biophys. J. 14:759-790.
35. Abbott, L. F. 1992. Simple diagrammatic rules for solving dendriticcable problems. Physica A. 185:343-356.
36. Jack, J. J. B., D. Noble, and R. W. Tsien. 1975. Electric Current Flowin Excitable Cells. Oxford: Oxford University Press, Oxford, UK. 502PP.
37. Shelton, D. P. 1985. Membrane resistivity estimated for the Purkinjeneuron by means of a passive computer model. Neuroscience. 14:111-131.
38. Edwards, F. A., A. Konnerth, B. Sakmann, and T. Takahashi. 1989. Athin slice preparation for patch clamp recordings from neurones of themammalian central nervous system. Pflugers Arch. 414:600-612.
39. Pongracz, F., S. Firestein, and G. M. Shepherd. 1991. Electrotonic struc-ture of olfactory sensory neurons analyzed by intracellular and wholecell patch techniques. J. Neurophysiol. 65:747-758.
40. Spruston, N., and D. Johnston. 1992. Perforated patch-clamp analysisof the passive membrane properties of three classes of hippocampalneurons. J. Neurophysiol. 67:503-529.
41. Staley, K. J., T. S. Otis, and I. Mody. 1992. Membrane properties ofdentate gyrus granule cells: comparison of sharp microelectrode andwhole-cell recordings. J. Neurophysiol. 67:1346-58.
42. Liao, D., A. Jones, and R. Malinow. 1992. Direct measurement of quan-tal changes underlying long-term potentiation in CAl hippocampus.Neuron. 9:1089-1097.
43. Randall, A. D., and G. L. Collingridge. 1990. Kinetic properties ofNMDA and AMPA receptor-mediated EPSCs recorded from rat hip-pocampal slices under whole-cell voltage clamp. J. Physiol. 431:41P.
44. Hounsgaard, J., and J. Midtgaard. 1989. Dendrite processing in moreways than one. Trends Neurosci. 12:313-315.
45. Blanton, M. G., J. J. Lo Turco, and A. R. Kriegstein. 1989. Whole cellrecording from neurons in slices of reptilian and mammalian cerebralcortex. J. Neurosci. Meth. 30:203-210.
46. Llano, I., A. Marty, C.M. Armstrong, and A. Konnerth. 1991. Synaptic-and agonist-induced excitatory currents of Purkinje cells in rat cere-bellar slices. J. Physiol. 434:183-213.
47. Purves R. D. 1981. Microelectrode Methods for Intracellular Recordingand Iontophoresis. Academic Press, London, UK. 146 pp.
48. Wilson, C. J., and M. R. Park. 1989. Capacitance compensation andbridge balance adjustment in intracellular recording from dendritic neu-rons. J. Neurosci. Meth. 27:51-75.
49. Park, M. R., H. Kita, M. R. Klee, and Y. Oomura. 1983. Bridge balancein intracellular recording; introduction of the phase-sensitive method.J. Neurosci. Meth. 8:105-125.
50. Finkel, A. S., and S. J. Redman. 1984. Theory and operation of a singlemicroelectrode voltage clamp. J. Neurosci. Meth. 11:101-127.
51. Korn, S. J. and R. Horn. 1989. Influence of sodium-calcium exchangeon calcium current rundown and the duration of calcium-dependentchloride currents in pituitary cells, studies with whole cell and perfo-rated patch recording. J. Gen. Physiol. 94:789-812.