Embed Size (px)
Citation preview

1
Bangladesh J. Agric. Econ., XI, 2 (December 1988)
SOME ASPECTS OF UNEMPLOYMENT, MIGRATION AND
INCOME IN THE BANGLADESH RURAL LABOUR MARKET
M.A. Jabbar1
ABSTRACT
Two questions are raised about the accuracy of the rates of disguised unemployment in
rural Bangladesh estimated on the basis of farm surveys using ‘labour utilization’ or
‘gainful work’ approach. One is the possible exclusion of migratory labour use from
labour utilization data. The other is the adequacy of ‘work duration’ as the sole basis for
measuring employment. Results of a large survey throughout the country show that
seasonal migration of rural labour is a more common phenomena than is ordinarily
recognized and it needs to be explicitly considered in labour utilization/unemployment
estimation. Another survey in eight villages show that work duration has little
relationship with income, so on its own, it may not be an adequate criteria for measuring
unemployment.
I. INTRODUCTION
Like many less developed countries, open unemployment is very small in rural
Bangladesh but there is a high degree of disguised unemployment. Census and national
labour force surveys conducted during the 1970s and 1980s reported open unemployment
of 1.26 to 2.31 percent (see GOB 1977; GOB 1980; GOB 1981; GOB 1984; GOB 1986)
but studies using ‘gainful work’ or ‘labour utilization’ or ‘labour requirement’ approach
reported disguised unemployment of 21 to over 50 percent (see for example, Muqtada
1975; Masum 1979; Clay and Khan 1977; Ahmed 1978; Chowdhury 1981; Mujeri and
Alauddin 1984; Rahman 1984; Murshed et al. 1984; World Bank 1983; Rahman and
Islam 1986). The estimated rates of disguised unemployment vary so widely because of
a number of reasons including the size and location of the samples, whether rural or
agricultural unemployment has been measured, assumptions with respect to participation
rates for civilian and agricultural labour force, labour coefficient for various activities and
full employment norms. Even if the relevant assumptions were standardized, the
difference between open and disguised unemployment rates would remain very high to
cause concern among researchers and planers alike. This is reflected in the fact that
______________ 1 The Author is an Associate Professor Department of Agricultural Economics, Bangladesh Agricultural University, Mymensingh.
The auther is grateful to The Winrock International and the Ford Foundation for financial assistance to conduct surveys reported in the
article. Usual disclaimer applies.

2
along with GDP growth, creation of employment and provision of basic needs,
particularly in the rural areas, have been accepted as explicit planning goals in the
successive development plans of Bangladesh (see GOB 1973; GOB 1978; GOB 1980;
GOB 1985).
Without underestimating the seriousness of the problem, two issues are raised in this
article about unemployment in rural Bangladesh. First, in the labour utilization approach,
unemployment is defined as the difference between available labour and actual gainful
work during a period of time. For any rural household, gainful work may be structurally
shown as:
On farm work Off-farm work
- Agricultural - Agricultural
- Own labour - Within locality
- Hired labour - Outside locality (migration)
- Local - Non-agricultural
- Outside (in-migration) - Within locality
- Non-agricultural - Outside locality (migration)
- Own labour
- Hired labour
- Local
- Outside (in-migration)
The empirical studies mentioned earlier have shown gainful work in the aggregate or
have divided it into farm and non-farm work or into agricultural and non-agricultural
work (sometimes using these two types of classification inter-changeably thereby adding
to confusion). None of these studies made it clear whether, and how, labour use outside
one’s own locality i.e., migratory labour, has been treated in the labour availability and
utilization equations. Rahman and Islam (1986) mentioned the importance of labour
mobility and creation of non-farm employment to overcome seasonal labour bottlenecks
but in the empirical part of their work they sidetracked and subsumed the issue under
oversimplified assumptions. Since off-farm, non-farm and non-agriculture do not mean
the samething, it is highly doubtful whether migratory labour use (and corresponding
earnings) has been properly and adequately included in any of the empirical studies.
There is, therefore, a possibility that the disguised unemployment rates have been over-
estimated. The degree of over estimation may be substantial because the results of a
recent survey to be discussed in section II, show that rural-rural migration of seasonal
labour is a much more common phenomena than is ordinarily recognized. Explicit
consideration of seasonal migration in labour demand-supply equations or in
employment-unemployment measurement is required both for obtaining accurate
estimates of these categories and for devising appropriate strategies for solving
unemployment related problems.
The second question is whether, with or without adjustment of seasonal migration, work
duration as such should be considered an adequate indicator of the dimension of the

3
unemployment problem in Bangladesh. This question is raised because according to
Myrdal (1968), labour utilization consists of three elements; participation rate, actual
work in hours or days and efficiency or productivity of the work done. Using these
elements Edwards (1974) distinguished five forms of underutilization of labour: open
unemployment, underemployment, the visibly active but underutilized (which includes
disguised unemployment, hidden unemployment, prematurely retired), the impaired and
the unproductive. The first three forms of underutilization are generally covered in the
labour utilization approach to measure unemployment but in the Bangladesh context the
question of efficiency and productivity are equally important because many people may
work full-time but their intensity of work may be poor due to malnutrition or poor health
while others, malnourished or not, may struggle long hours with inadequate
complementary resources to produce, and earn very little. Thus, maximum work duration
may not ensure adequate income and welfare which are the ultimate objectives of human
activity. Some evidence in this regard will be presented in section III.
II. ASPECTS OF SEASONAL MIGRATION
During 1985-86, a countrywide survey was conducted to understand the characteristics of
seasonal migration of rural labour. First, 600 randomly selected students of Bangladesh
Agricultural University were requested to fill in a questionnaire which included questions
about the migration characteristics of the students’ own villages. A total of 549 students
representing 59 out of 64 districts and 255 out of 495 Upzilas returned answers; the
remaining students either did not respond or did not have a village home, so had nothing
to say. Secondly, 10 percent (55) of the 549 villages were selected at random in order to
interview migrant labourers for in-depth information1. In all 420 labourers from 52
villages responded, 4-16 labourers from each village. The results of this survey are
summarized below.
Out of the 549 villages, 23.5 percent had only in-migration in the survey year, 10.4
percent had only out-migration of some labour, 64.6 percent had both in and out
migration and 1.5 percent had neither in nor out-migration. Thus 88.1 percent of the
villages had in-migration but 75.0 percent had out-migration2 . Looking at the history of
seasonal migration in these villages, it appears that most of the villages reporting in
migration has a long history of using migratory labour but villages reporting out-
migration show a pattern which indicates that more and more villages have recently
started sending labour elsewhere for work (Table 1). Migration history of the migrant
labourers also indicate that seasonal migration has a long tradition. However, the
regularity/irregularity of migration by the migrants and the villages receiving/sending
such labour could not be explained by availability of irrigation, population density,
proximity to urban centers etc. It possibly indicates that the labour demand-supply
1 This part of the survey was conducted with financial assistance from the Ford Foundation
2 The unemployment studies reviewed earlier covered no more than 20 villages in total. If these villages
had no migration or had only in-migration, migration would remain out of consideration of the researchers
inadvertently.

4
balance of a particular village/locality may fluctuate from year to year due to a variety of
reasons which needs to be clearly established. In a normal year, one of the main factors
influencing migration would be differences in wage rate (see below). In an abnormal
year, lack of local work may induce migration.
Table 1. Distribution of villages and migrant labourers according to the history of
migration
History of
migration
% villages reporting
in-migration
N=430
% villages reporting
out-migration
N=375
% migrants
N=420
Regular, longtime
Irregular, longtime
Regula, 5-10 yrs.
Irregular, 5-10 yrs.
Rcent,<5yrs.
59.8
17.2
15.6
4.2
3.3
33.6
24.5
11.5
16.8
13.6
52.4
22.3
13.2
8.7
3.4
All 100.0 100.0 100.0
Source: Field survey.
An attempt for mapping the migration path of the migrants turned out to be difficult to
implement because migration took place within and between upazilas and also within and
between districts. Both short and long distance migrations were reported and migrants
went to rural and/or urban areas. In general, labourers appeared to travel long distances
in search of work and development in transportation facilities have increased the mobility
of labourers both in terms of the nmber of labourers and the frequency of their
movement. The survey revealed that about 80 percent of the villages reporting in-
migration received more than 10 migrants at a particular time in the survey year while 70
percent of the villages reporting out-migration sent over 10 labourers at a particular time.
It was found that during the year, 29 percent of the migrant labourers had gone away for
work once, 45 percent had gone twice and 26 percent had gone thrice or more. On
average, each labourer had gone 1.94 times and stayed away 51 days during the reference
year.
The timing of in/out migration indicates that a particular village may receive or send
labour one or more times in a year depending on its cropping pattern and labour demand-
supply balance but, taken the country as a whole, migration is a year-round phenomenon
(Table 2). This is also a reflection of the fact that although agricultural operations in
Bangladesh are seasonal with peaks and troughs in labour demand, the peaks do not
occur quite at the same time everywhere. Rather, the peak times vary across regions, so
as to allow adequate labour mobility to overcome local labour bottlenecks3. This is
evidenced by the findings of a number of studies which show that HYV-irrigation
technology not only flattens the traditional peaks in labour demand but it also creates new
peaks at other-wise slack periods and these slack periods have some degree of location
specificity (see, for example Clay, 1977; Mandal, 1979; Rahman and Islam, 1986).
3 Jabbar et al (1982) found in Munshiganj area that power tiller owners completed preparation of potato
fields in the north and gradually moved south for selling tiller power where flood water recedes later, thus
maximizing tiller use.

5
Table 2. Distribution of villages and migrants according to time of migration
Month of
migration
% villages reporting
in-migration
N=470
% villages reporting
out-migration
N=366
% migrants
N=420
April-May (Baishakh)*
May-June (Jaistha)
June-July
July-August
August-September
September-October
October-November
November-December
December-January
January-February
February-March
March-April
26.6
22.3
37.4
31.9
20.2
10.4
22.6
49.6
24.6
11.5
10.9
11.9
25.1
13.9
22.7
16.1
13.1
12.3
19.1
23.8
19.7
15.0
16.1
26.8
22.6
31.5
22.4
30.2
13.6
15.4
25.2
54.8
32.7
9.4
8.1
19.3
Percentages do not add up to 100 because a particular village/migrant may enter in more
than one month.
Source: Field survey.
*April-May corresponds to Bengali month, Baishak and May-June corresponds to
‘Jaistha’
Both village level and migrant labourers’ response show that most migrations take place
at the time of Aman paddy harvest and Boro paddy transplanting and harvest (Table 3).
These activities correspond to the months in which most migrations were reported.
Among non-agricultural activities food for works projects in the rural areas appear to
attract more migrant labourers than construction related jobs in the urban areas. Such a
phenomenon seems realistic because migrant labourers reported that quite often they
were recruited by agents for working in specific food for works project and living cost
was lower in the rural areas. On the other hand, nominal wages in the urban areas were
generally higher but the net expected benefits would be lower due to higher
transportation and living costs and lower probability of getting a job in the urban areas4.
Higher transportation and living costs in the urban areas imply that migrants to urban
areas have to stay away longer in order to minimize cost, but long absence appear to
cause suffering for the family members left behind because adequate money or provisions
could not be arranged beforehand.
The survey of migrants revealed that the average duration of migration was 66 days for
those who migrated to only urban or both urban and rural areas compared to 44 days for
those who migrated to only rural areas.
4 These reported migration behaviour fits Todaro (1971) type model of rural-urban migration. However, we
did not have adequate quantitative information to estimate the coefficients of such a model.

6
Table 3. Distribution of villages and migrant labourers according to the type of work
done
Type of work
% village reporting
in-migration
N=345
% village reporting
out-migration
N=271
% migrants
N=312
Agricultural
Aman paddy harvesting
Aman paddy transplanting
Aus paddy harvesting
Aus paddy/Jute weeding
Jute harvest/stripping
Boro paddy harvesting
Boro paddy transplanting
Others
Non-agriculture
Food for works
Construction helper
Carpenter
60.3
38.0
29.0
16.5
26.1
22.9
20.9
18.8
-
-
2.3
47.2
21.4
16.2
5.2
10.3
42.4
11.8
12.5
55.3
29.1
27.7
63.4
29.4
21.6
10.1
9.3
41.7
22.8
23.5
51.8
31.4
3.2
Source: Field survey.
Thirteen percent of the total migrants went away without leaving any money or food
provision for the members of their families, other 87 percent left an average of Tk. 330
per family which was equivalent to Tk. 3.05 per adult man-unit of absence per day. Sixty
one percent had no other male earning member in the family. Others had one or more
earning members. Thus, the members of most migrant labour families lived almost in a
starving situation unless the female members begged, borrowed or found some work in
the village. In fact forty one percent of the migrants left money/provisions out of their
own earnings but 59 percent had to partly or fully borrow at high interest rates. They had
to repay the loan on return from work and were left with little or nothing to maintain the
family, so had to borrow again before migrating. Cumulative debt compelled some of
them to disinvest assets. For example, the migrant families owned only 0.20 acres of
cultivable land at the time of the survey (31 percent owned nothing at all) but they owned
0.32 acres five years earlier, i.e., they lost one-third of their meager holdings within five
years.
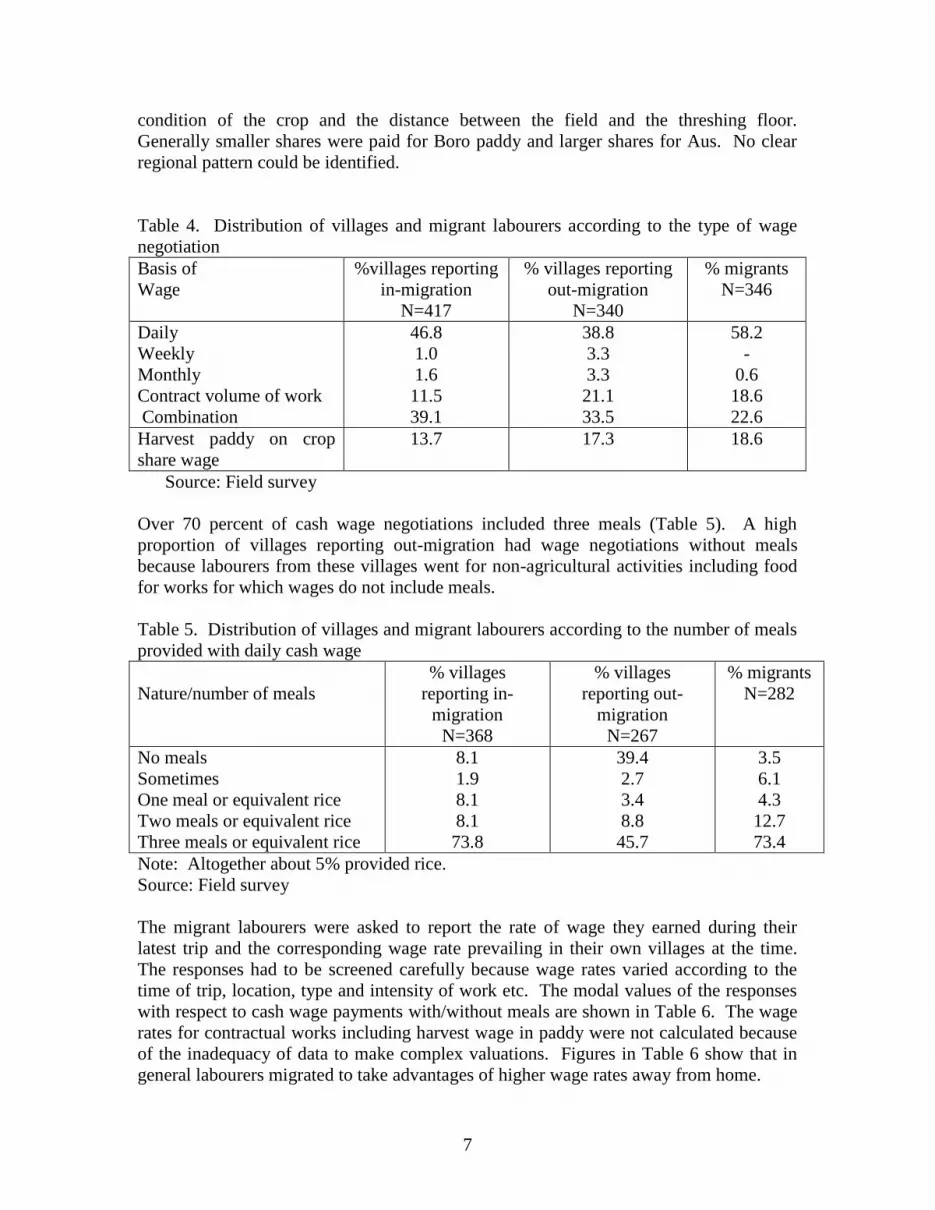
Clay (1976) reported that for a variety of reasons direct cash payments were replacing
traditional mode of wage payment in the rural areas, particularly the provision of meals
with cash and crop-share as harvest wage. In the present study we found that although
most migratory labourers negotiated work on a daily basis, a substantial amount of works
were done on a contract basis which included agricultural works for cash and harvesting
paddy for a share of crop as wage and FFW for wheat (Table 4). Crop share as wage may
be actually practiced in a lot more villages where only labour is used. The wage for
harvesting reportedly varied from ½th to 1/14 th of paddy depending on the type of paddy,
7
condition of the crop and the distance between the field and the threshing floor.
Generally smaller shares were paid for Boro paddy and larger shares for Aus. No clear
regional pattern could be identified.
Table 4. Distribution of villages and migrant labourers according to the type of wage
negotiation
Basis of
Wage
%villages reporting
in-migration
N=417
% villages reporting
out-migration
N=340
% migrants
N=346
Daily
Weekly
Monthly
Contract volume of work
Combination
46.8
1.0
1.6
11.5
39.1
38.8
3.3
3.3
21.1
33.5
58.2
-
0.6
18.6
22.6
Harvest paddy on crop
share wage
13.7 17.3 18.6
Source: Field survey
Over 70 percent of cash wage negotiations included three meals (Table 5). A high
proportion of villages reporting out-migration had wage negotiations without meals
because labourers from these villages went for non-agricultural activities including food
for works for which wages do not include meals.
Table 5. Distribution of villages and migrant labourers according to the number of meals
provided with daily cash wage
Nature/number of meals
% villages
reporting in-
migration
N=368
% villages
reporting out-
migration
N=267
% migrants
N=282
No meals
Sometimes
One meal or equivalent rice
Two meals or equivalent rice
Three meals or equivalent rice
8.1
1.9
8.1
8.1
73.8
39.4
2.7
3.4
8.8
45.7
3.5
6.1
4.3
12.7
73.4
Note: Altogether about 5% provided rice.
Source: Field survey
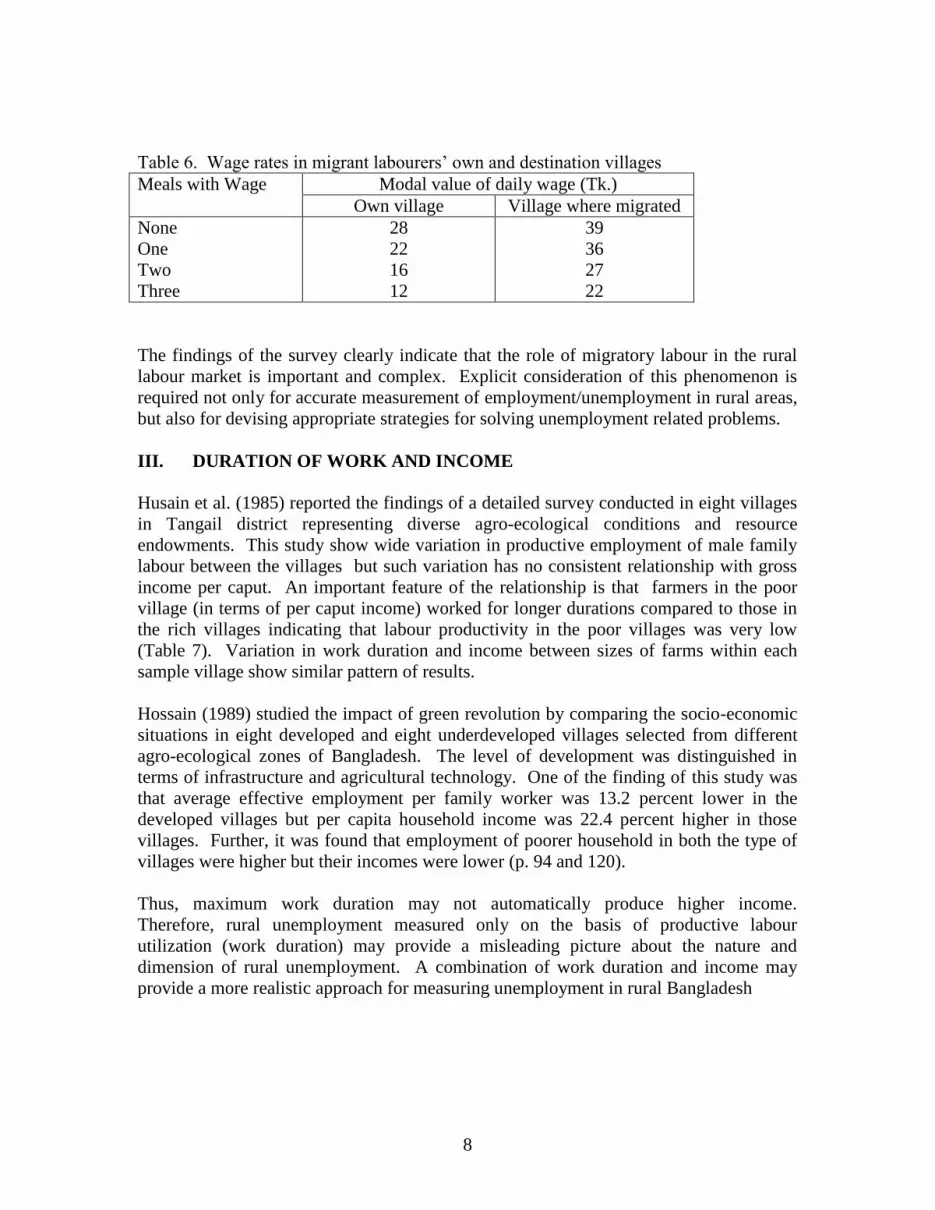
The migrant labourers were asked to report the rate of wage they earned during their
latest trip and the corresponding wage rate prevailing in their own villages at the time.
The responses had to be screened carefully because wage rates varied according to the
time of trip, location, type and intensity of work etc. The modal values of the responses
with respect to cash wage payments with/without meals are shown in Table 6. The wage
rates for contractual works including harvest wage in paddy were not calculated because
of the inadequacy of data to make complex valuations. Figures in Table 6 show that in
general labourers migrated to take advantages of higher wage rates away from home.
8
Table 6. Wage rates in migrant labourers’ own and destination villages
Meals with Wage Modal value of daily wage (Tk.)
Own village Village where migrated
None
One
Two
Three
28
22
16
12
39
36
27
22
The findings of the survey clearly indicate that the role of migratory labour in the rural
labour market is important and complex. Explicit consideration of this phenomenon is
required not only for accurate measurement of employment/unemployment in rural areas,
but also for devising appropriate strategies for solving unemployment related problems.
III. DURATION OF WORK AND INCOME
Husain et al. (1985) reported the findings of a detailed survey conducted in eight villages
in Tangail district representing diverse agro-ecological conditions and resource
endowments. This study show wide variation in productive employment of male family
labour between the villages but such variation has no consistent relationship with gross
income per caput. An important feature of the relationship is that farmers in the poor
village (in terms of per caput income) worked for longer durations compared to those in
the rich villages indicating that labour productivity in the poor villages was very low
(Table 7). Variation in work duration and income between sizes of farms within each
sample village show similar pattern of results.
Hossain (1989) studied the impact of green revolution by comparing the socio-economic
situations in eight developed and eight underdeveloped villages selected from different
agro-ecological zones of Bangladesh. The level of development was distinguished in
terms of infrastructure and agricultural technology. One of the finding of this study was
that average effective employment per family worker was 13.2 percent lower in the
developed villages but per capita household income was 22.4 percent higher in those
villages. Further, it was found that employment of poorer household in both the type of
villages were higher but their incomes were lower (p. 94 and 120).
Thus, maximum work duration may not automatically produce higher income.
Therefore, rural unemployment measured only on the basis of productive labour
utilization (work duration) may provide a misleading picture about the nature and
dimension of rural unemployment. A combination of work duration and income may
provide a more realistic approach for measuring unemployment in rural Bangladesh

9
Table 7. Annual work duration and gross income per caput in eight villages in Tangail
district. 1984/85.
Village
Annual gross
income per caput,
Tk
Annual work per man-unit,
man-days
Inat Kha Chala
Fulmali Chala
Egarokshonia
Habla Bilpara
Bara Chowna
Pirojpur
Baramedhar
Shapiachala
2003
2260
2323
2343
2566
2890
3088
4435
265
255
308
237
193
261
179
219
Source: Husain, et al. (1985)
Note: Annual work refers to only male family members including annual hired labour.
REFERENCES
Ahmed, Iqbal (1978): “Unemployment and Under-employment in Bangladesh
Agriculture”, World Development, 11-12 (Nov-Dec.).
Chowdhury, R.H. (1981): “Labour Absorption in Bangladesh Agriculture – A District
Level Analysis”, The Bangladesh Journal of Political Economy, 5(1), 77-90.
Clay, E.J. (1976): “Institutional Change and Agricultural Wage in Bangladesh”, The
Bangladesh Development studies, 4, 4 (October).
Clay, E.J. (1981). “Seasonal Pattern of Agricultural Labour in Bangladesh” in R.
Chambers et, al. (eds) Seasonal Dimension to Rural Poverty, London: Frances
Printers.
Clay, E.J. and Khan, Sekandar (1977): Agricultural Employment and Unemployment
in Bangladesh. The Next Decade. AERSS paper No, 4. Dhaka: BARC.
Edwards, Edgar O. (1974). Employment in Developing Countries. Report on a Ford
Foundation Study, New York: Columbia University Press.
GOB (1977): Bangladesh Population Census Report 1974. National Volume, Dhaka:
Bangladesh Bureau of Statistics.
GOB (1980). The Pilot Manpower Survey, 1979, Dhaka: Bangladesh Bureau of
Statistics.
GOB (1981): Manpower Stituation in Contemporary Bangladesh. Dhaka:
Bangladesh Bureau of Statistics.
GOB (1984): Bangladesh Population Census, 1981. Analytical Findings and National
Tables. Dhaka: Bangladesh Bureau of Statistics.
GOB (1986): Labour Force Survey 1983-84. Final Report. Dhaka: Bangladesh
Bureau of Statistics.
Hossain, Mahabub (1989): Green Revolution in Bangladesh. Impact on Growth and
Distribution of income, Dhaka: University Press Ltd.

10
Husain, A.M.M., Jabbar, M.A., Mandal, M.A.S., and Jaim, W.M.H. (1985):
Socioeconomic Factors Related to Farm production and Income in Selected
Villages in Tangail District. Report prepared for the German Agency for
Technical Cooperation (GTZ), Dhaka.
Masum, M. (1979): “Unemployment and Under-employment in Bangladesh
Agriculture: A Micro- Study”, The Bangladesh Development studies, 7, 2,
(Summer).
Mujeri, M.K. and Alauddin, M. (1984): “Agricultural Under employment in
Bangladesh. A District Level Analysis”, The Journal of Management, Business
and Economics, 10, 1 (April).
Muqtada, M. (1975): “The Seed-Fertilizer Technology and Surplus Labour in
Bangladesh Agriculture” The Bangladesh Development Studies, 3, 4 (October).
Murshed, S.M.M., Jabbar, M.A. and Mandal, M.A.S. (1984): Crop Sector Output and
Employment Growth in Bangladesh Agriculture, 1967-70 to 1979-80.
Unpublished Report Prepared for the North-South Institute, Ottawa, Canada.
Myrdal, Gunnar (1968): Asian Drama. London: Penguin Books.
Rahman, M. Akhlakur (1984): “Rural Manpower and Unemployment in
Bangladesh”, Jahangirnager Economic Review, 2, 1 (April).
Rahman, Atiq and Islam, Rizwanul (1986): Pattern and Determinants of labour use
in Rural Bangladesh, Working paper, Dhaka: Bangladesh Institute of
Development Studies.
Todaro, Michael P. (1971): “Income Expectations, Rural-Urban Migration and
Employment in Africa”. International Labour Review, 104(3).


