Embed Size (px)
Citation preview
Sonography for assessment of haemophilic arthropathy inchildren: a systematic protocol
K. ZUKOTYNSKI,§ J. JARRIN,* P. S. BABYN,*§ M. CARCAO,�� J. PAZMINO-CANIZARES,�A. M. STAIN� and A. S. DORIA*�§
*Departments of Diagnostic Imaging and �Pediatrics, Division of Hematology/Oncology; �Research Institute, The
Hospital for Sick Children, Toronto, Ontario, Canada and §Department of Medical Imaging, University of Toronto,
Toronto, Ontario, Canada
Summary. Radiological imaging of joints in chil-dren with haemophilia is important to detect abnor-malities, grade their severity and monitor the effects oftreatment. Scoring systems for staging haemophilicarthropathy have been developed based on plain filmor magnetic resonance imaging (MRI) findings. Radi-ographs alone may be inadequate for evaluating jointdisease in children with haemophilia on prophylaxiswhile MRI may be difficult to access and require thechild to be sedated. Sonography can be a usefulcomplementary modality in the evaluation of haemo-philic arthropathy that is readily available and doesnot require the child to be sedated. In this paper, webriefly review the current imaging scales available forthe assessment of haemophilic arthropathy and pre-sent a systematic protocol for sonographic assessment
of the knee and ankle in haemophilic children alongwith examples of findings in joint effusion/hemarth-rosis, synovial hypertrophy and cartilage loss. Also,we correlate the ultrasound findings with the corres-ponding MRI images demonstrating the anatomicplanes used for imaging acquisition. Sonography is apromising technique for the assessment of soft tissuechanges which are the earliest findings in haemophilicarthropathy. Further investigation is required forevaluation of osteochondral changes given limitationsof sonography in this regard and in minimizingoperator dependency, especially if applied in multi-centric clinical trials.
Keywords: effusion, hemophilia, joint disease, pedi-atric, scoring system, ultrasound
Introduction
Haemophilia is a sex-linked recessive genetic disorderthat may result in severe bleeding episodes through-out life [1]. Haemophilic arthropathy is caused byrecurrent bleeding into a joint resulting in progressivejoint damage. The first bleed usually occurs between 1and 3 years of age and the rate of disease progressionis governed mainly by the number of episodes ofhaemarthrosis [1–3]. Up to two-thirds of patientswith haemophilia experience haemorrhage into thejoints, commonly the knees, ankles and elbows [1,4].Haemarthrosis may occur spontaneously or be sec-ondary to minor trauma with age of onset andfrequency determined by the level of factor deficiency,
which can be severe (factor VIII or IX baselineactivity <1%), moderate (residual activity 1–5%) ormild (residual activity >5%) [4–6]. Breakdown ofextravasated blood from synovial vessels ultimatelyleads to the changes of haemophilic arthropathywith synovitis, cartilage loss and subchondral boneirregularity. Results in the literature suggest thatthe earliest effects of haemarthrosis involve thesynovium [6,7].
Imaging of joints in children with haemophilia isimportant in detecting abnormalities, staging theirseverity and following the effects of treatment. Radi-ographic changes depend on the age of the patient atthe time of the bleed, the site of the bleed and theacuteness or chronicity of the disease. Deposition ofiron in the synovium may lead to increased soft tissuedensity around joints. Associated articular changesinclude: osteopenia, subchondral cysts and joint spaceloss. In children, epiphyseal overgrowth, widening ofthe femoral intracondylar notch, squaring of theinferior patella and enlargement of the proximal
Correspondence: Andrea S. Doria, Department of Diagnostic
Imaging, The Hospital for Sick Children, 555 University Avenue,
Toronto, ON M5G 1X8, Canada.Tel.: 416 813 6079; fax: 416 813 7591;
e-mail: [email protected]
Accepted after revision 24 October 2006
Haemophilia (2007), 13, 293–304 DOI: 10.1111/j.1365-2516.2006.01414.x
� 2007 The Authors
Journal compilation � 2007 Blackwell Publishing Ltd 293
radius at the elbow may be seen [2,6]. Sonographymay be useful in evaluating joint fluid, synovialhyperemia and cartilage in children with hemophilia[8–10]. Magnetic resonance imaging (MRI) has beenshown to be effective in identifying bone and softtissue changes including effusions, haemarthrosis andsynovial and cartilage abnormalities [11–13].
In this paper, we briefly review the currentimaging scales available for assessment of haemo-philic arthropathy and present a systematic protocolfor ultrasound assessment of the knee and ankle inhaemophilic children along with sonographic exam-ples of findings in joint effusion/haemarthrosis,synovial hypertrophy and cartilage loss. Also, wecorrelate the sonographic findings with the corres-ponding MR images demonstrating the anatomicplanes used for imaging acquisition.
Overview of imaging scales for assessment ofhaemophilic arthropathy
In order to follow progression of joint disease moresystematically, two classification systems were devel-oped in the 1970s for imaging characteristics onplain films in children with haemophilic arthropathy.The Arnold-Hilgartner scale is a progressive metricin which the stage of the disease is given according tothe worst findings in the joint [6]. The Petterssonscale is an additive metric in which the presence ofdifferent radiographic findings are weighted andadded to form a final sum which represents the stageof the disease [14].
Although the Arnold-Hilgartner and the Petterssonradiographic scales are among the most extensivelyused methods for radiological assessment of haemo-philic arthropathy, improved therapy has led to theneed for more sensitive tools. MRI allows improvedsoft tissue visualization and has quickly gainedwidespread use in diagnosing, staging and followingtreatment of children with haemophilia. Joint effu-sions may be clearly seen, typically with high signalintensity on T2-weighted images and low signalintensity on T1-weighted images [7]. The appearanceof blood is variable on T1- and T2-weighted imagesdepending on the acuity of haemorrhage [15].Gradient echo images are more sensitive and specificfor the presence of haemosiderin, demonstrating anintensely dark signal secondary to magnetic suscep-tibility artefact [11]. Inflamed, thickened synoviumshows intermediate signal intensity on T1-weightedimages, intermediate to bright signal intensity onT2-weighted images and brisk enhancement withgadolinium contrast [11,16,17]. Synovitis may bedistinguished from effusion by a slightly higher
signal intensity on T1-weighted images and a lowersignal intensity on heavily T2-weighted images [18].The use of contrast material for assessment ofhaemophilic arthropathy in children is controversial.In spite of the advantages of contrast enhancementfor assessment of synovitis, some advocate that theuse of an intravenous contrast agent is invasive andthat synovial hypertrophy may be identified withoutthe use of contrast material. In haemophilic arthro-pathy, haemosiderin deposits are commonly foundwithin the hypertrophic synovium making the assess-ment of the synovial membrane itself difficult [7].This is in contrast to what is noted in many otherinflammatory processes such as rheumatoid arthritis.As a result, some haemophilia treating centres do notuse gadolinium contrast enhancement on a routinebasis [3,7,19,20], except for specific clinical indica-tions. Synovial hypertrophy may be assessedalthough exact quantitative measurements are diffi-cult [7]. Subchondral cysts are thought to developwhen synovium insinuates through fissures in thearticular cartilage. Subchondral cysts may be bright(high signal intensity) on T2-weighted images secon-dary to the presence of fluid or present with lowsignal intensity on T2-weighted images if normalsynovium rather than fluid is seen [7]. Out of severalMRI scales [12,21–23], two classification systemshave been widely used in the last years to stagedisease by MRI in children with haemophilic arthro-pathy [3,24]. The Denver MRI scale is a progressivemetric in which the most severe change in the jointdetermines the score, mirroring the Arnold-Hilgart-ner radiographic scale. The European MRI scoringscheme gives a final score in the shape of fournumerical values where each value is based on aprogressive metric specific to one aspect of thedisease. More recently, the international MRI expertworking group of the International ProphylaxisStudy Group (IPSG) has presented a scoring methodthat includes a 10-step progressive scale and a 20-step additive scale, encompassing both the progres-sive and additive concepts, in an effort to facilitateinternational comparison of data [19,20].
Results in the literature suggest that MRI has highsensitivity for the detection of osteochondral and softtissue changes [7,12,19]. Concerns with this modal-ity remain. These include high operational cost, needfor sedation in young children and limited availab-ility. Sonography may provide a useful, more readilyavailable, complementary modality in evaluatingmusculoskeletal involvement of joints in childrenwith haemophilia [8]. Furthermore, ultrasound doesnot require sedation. It is also sensitive for soft tissuechanges such as effusions and synovial hyperplasia.
294 K. ZUKOTYNSKI et al.
� 2007 The AuthorsHaemophilia (2007), 13, 293–304 Journal compilation � 2007 Blackwell Publishing Ltd
Unfortunately, it is user-dependent. Previous studieshave evaluated sonographic images of joints ofhaemophilic children with regard to the imagingfeatures [9,10], degree of severity of arthropathy [8]and responsiveness to treatment [25] and have showna potential role of ultrasound for assessment ofhaemophilic arthropathy, most notably in its earlystage. To our knowledge, however, no previousstudy has developed a systematic standardized pro-tocol for ultrasound imaging in the assessment ofhaemophilic arthropathy. Standardization of theacquisition technique for an operator-dependentimaging modality, such as ultrasound, is necessaryfor reproducibility of the technique and is imperativefor the development of a future scoring system. Wetherefore undertook to develop a standardizedapproach to ultrasound imaging of the knees andankles of children with haemophilia.
A systematic protocol for ultrasound assessmentof haemophilic arthropathy
Technical parameters
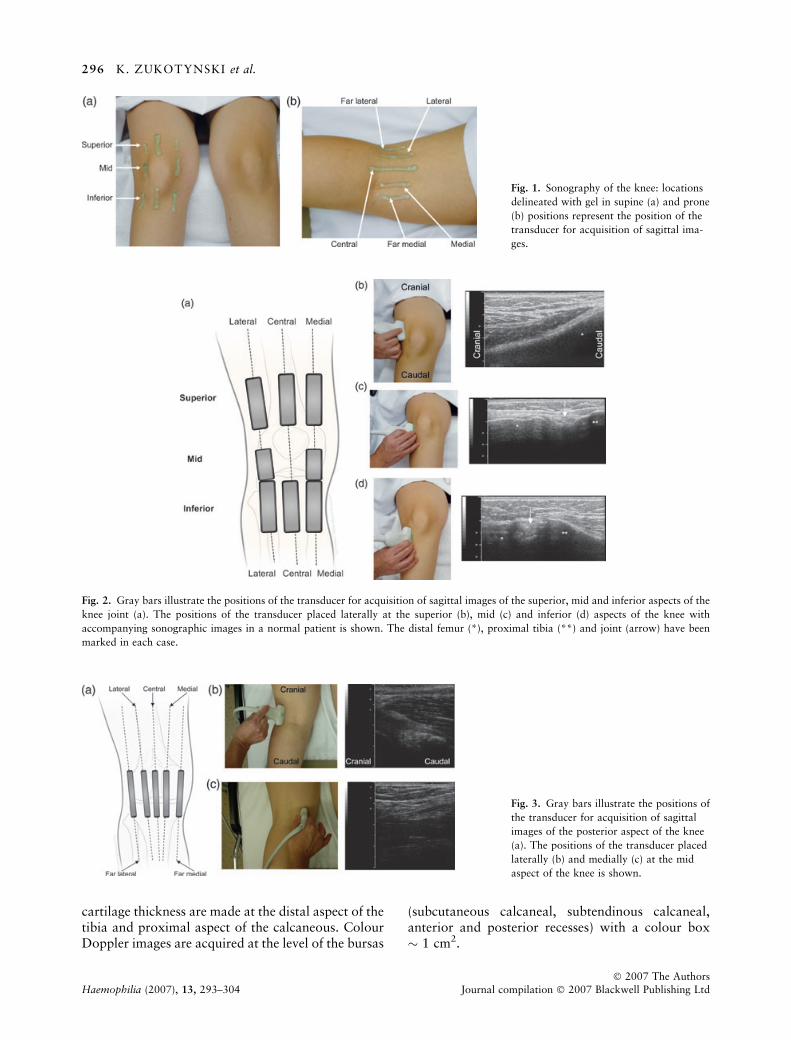
To image the knee and ankle joints comprehensively,ultrasound images from several different planes insupine (Fig. 1a) and prone (Fig. 1b) positions shouldbe obtained in grey-scale and with colour Doppler.The images shown on this paper were obtained withan Acuson (Sequoia Systems, Mountain View, CA,USA) sonographic scanner with a 13-MHz linear-array transducer and with a 1.5 T GE Signa LX MRunit (General Electric Systems, Milwaukee, WI,USA) with the use of head coils for evaluation ofankles and cardiac or torso phase array coils forevaluation of knees. The ultrasound protocol inclu-ded sagittal and axial grey-scale images obtainedwith depth and gain adjustable to the patient’s bodyhabitus and colour Doppler images acquired withlow filter, 700 Hz of pulse repetition frequency and80% intensity. The duration of the ultrasoundexamination on this study was approximately30 min per joint. Either a full or a minimum MRIprotocol can be applied for acquiring data onhaemophilic joints. The minimum protocol employ-ing a gradient-recalled (MPGR) technique (TR/TE450–650/20 ms; flip angle, 200; slice thickness/gap,4/0 mm; FOV, 140–180 mm; matrix, 192 · 256)with two planes (sagittal and coronal) for each jointwas used in this study. The minimum protocolenables scanning multiple joints of a child on thesame visit given the short scanning time for eachjoint. The duration of this minimum MRI protocol isapproximately 20 min per joint. The full MRI
protocol includes sagittal spin-echo (SE) T1-weigh-ted (TR/TE, 418/12 ms; slice thickness/, 30 mm;FOV, 100 mm; matrix, 184 · 256; two acquisi-tions), sagittal turbo SE T2-weighted (TR/TE,4200/96 ms; echo train, 7; slice thicknes gap,30 mm; FOV, 100 mm; matrix, 154 · 256; twoacquisitions), sagittal fat suppressed three-dimen-sional gradient echo (TR/TE, 50/11 ms, flip angle,200; slice thickness gap, 1.50 mm; FOV, 100 mm;matrix, 228 · 256; one acquisition) and coronalshort tau inversion recovery (STIR) (TI 150 ms; TR/TE, 4500/60 ms; slice thickness gap, 40 mm; FOV,113 mm; matrix, 198 · 256; three acquisitions)images. The duration of this full MRI protocol,which is usually applied when a single joint isscanned, is approximately 40 min per joint.
Ultrasound acquisition technique for knees
Table 1 summarizes the transducer positions scannedin the sagittal plane. Specific attention is given to thedetection of fluid, synovial hypertrophy and haemo-siderin deposition. Figures 2 and 3 illustrate theplacement of the ultrasound transducer in the sagittalplane to scan the anterior [superior, mid, inferior(Fig. 2)] and posterior (Fig. 3) aspects of the knee.
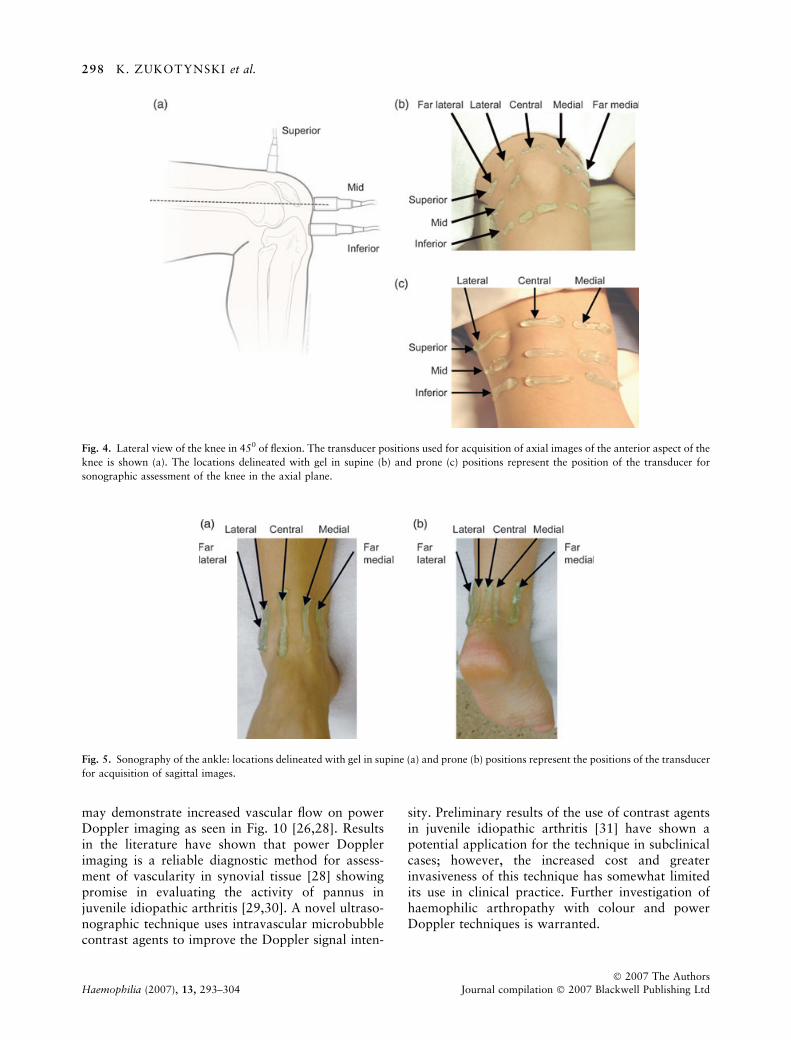
Table 2 summarizes the transducer positionsscanned in the axial plane. In addition to thedetection of the fluid, synovial hypertrophy andhaemosiderin deposition, cartilage thickness, erosionand subchondral cysts may be seen in the axial plane.Measurements of cartilage thickness can be madeapproximately 1 cm from the central plane laterallyat each condyle. Colour Doppler images can beacquired at the level of the bursas (supra-patellar,infra-patellar, iliotibial tract, biceps femoris, fibularcollateral ligament, semimembranous, semitendin-ous, gracilis, sartorius, medial and lateral heads ofgastrocnemius muscles) with a colour box of 1 cm2.Figure 4 illustrates the placement of the ultrasoundtransducer in the axial plane for scanning the knee insupine and prone positions.
Ultrasound acquisition technique for ankles
Table 3 summarizes the transducer positions scannedin the sagittal plane. Figures 5–7 illustrate the anter-ior (Figs 5a and 6) and posterior (Figs 5b and 7)placement of the ultrasound transducer in the sagittalplane for scanning the ankle. Table 4 summarizes thetransducer positions scanned in the axial plane.Figure 8 illustrates the anterior approach for theassessment of the ankle joint axially with the patientin the supine position. Measurements of the articular
SYSTEMATIC SONOGRAPHIC PROTOCOL FOR HEMOPHILIC ARTHROPATHY 295
� 2007 The AuthorsJournal compilation � 2007 Blackwell Publishing Ltd Haemophilia (2007), 13, 293–304
cartilage thickness are made at the distal aspect of thetibia and proximal aspect of the calcaneous. ColourDoppler images are acquired at the level of the bursas
(subcutaneous calcaneal, subtendinous calcaneal,anterior and posterior recesses) with a colour box� 1 cm2.
Fig. 1. Sonography of the knee: locations
delineated with gel in supine (a) and prone
(b) positions represent the position of the
transducer for acquisition of sagittal ima-
ges.
Fig. 2. Gray bars illustrate the positions of the transducer for acquisition of sagittal images of the superior, mid and inferior aspects of the
knee joint (a). The positions of the transducer placed laterally at the superior (b), mid (c) and inferior (d) aspects of the knee with
accompanying sonographic images in a normal patient is shown. The distal femur (*), proximal tibia (**) and joint (arrow) have been
marked in each case.
Fig. 3. Gray bars illustrate the positions of
the transducer for acquisition of sagittal
images of the posterior aspect of the knee
(a). The positions of the transducer placed
laterally (b) and medially (c) at the mid
aspect of the knee is shown.
296 K. ZUKOTYNSKI et al.
� 2007 The AuthorsHaemophilia (2007), 13, 293–304 Journal compilation � 2007 Blackwell Publishing Ltd
Findings on haemophilic arthropathy of the knee andankle
The following images illustrate specific findings ofhaemophilic arthropathy for the knee and ankle onultrasound and MRI. These include: joint effusion/haemarthrosis (Figs 9 and 10), synovial hyperplasia(Fig. 10) and haemosiderin deposition (Fig. 11).Most joint effusions appear hypoechoic (dark) onsonographic images [26] as illustrated in Fig. 9.Haemarthrosis may present with different signalintensities on sonography and on MRI dependingon the stage of the blood products [15,26]. Intracel-lular met-haemoglobin seen in early subacute bleeds(2–7 days) presents with high (bright) signal on
T1-weighted images and low (dark) signal onT2-weighted images. Extracellular met-haemoglobinnoted in late subacute bleeds (1–4 weeks) presentswith high signal on both T1- and T2-weightedimages (Fig. 10) [27]. Haemosiderin identified inchronic joints after previous bleeds presents with lowsignal on both T1- and T2-weighted images and�blooms� on gradient echo images as a result ofmagnetic susceptibility (Fig. 11c) [15]. Normal syn-ovium appears as a thin membrane that is barelyseen on grey-scale ultrasound. Inflamed, thickenedsynovium may be identified as diffuse or nodularthickening of the membrane which is typicallyisoechoic or hyperechoic in relation to the adjacentmusculature on grey-scale ultrasound images and
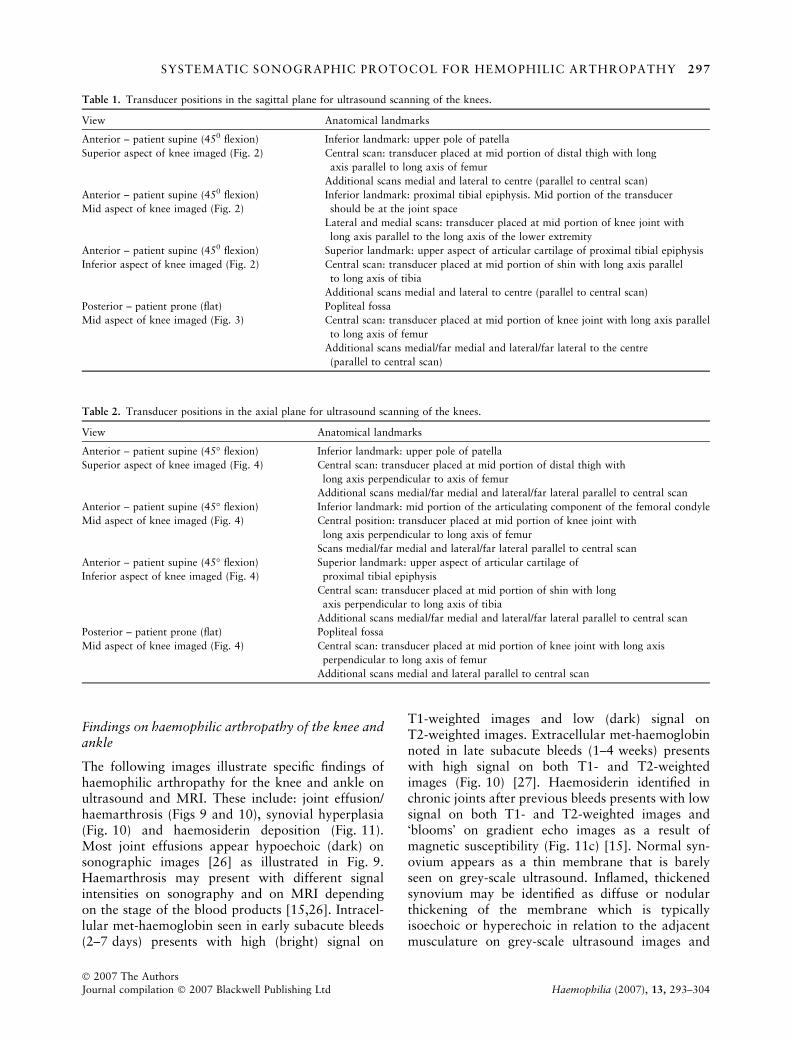
Table 1. Transducer positions in the sagittal plane for ultrasound scanning of the knees.
View Anatomical landmarks
Anterior – patient supine (450 flexion)
Superior aspect of knee imaged (Fig. 2)
Inferior landmark: upper pole of patella
Central scan: transducer placed at mid portion of distal thigh with long
axis parallel to long axis of femur
Additional scans medial and lateral to centre (parallel to central scan)
Anterior – patient supine (450 flexion)
Mid aspect of knee imaged (Fig. 2)
Inferior landmark: proximal tibial epiphysis. Mid portion of the transducer
should be at the joint space
Lateral and medial scans: transducer placed at mid portion of knee joint with
long axis parallel to the long axis of the lower extremity
Anterior – patient supine (450 flexion)
Inferior aspect of knee imaged (Fig. 2)
Superior landmark: upper aspect of articular cartilage of proximal tibial epiphysis
Central scan: transducer placed at mid portion of shin with long axis parallel
to long axis of tibia
Additional scans medial and lateral to centre (parallel to central scan)
Posterior – patient prone (flat)
Mid aspect of knee imaged (Fig. 3)
Popliteal fossa
Central scan: transducer placed at mid portion of knee joint with long axis parallel
to long axis of femur
Additional scans medial/far medial and lateral/far lateral to the centre
(parallel to central scan)
Table 2. Transducer positions in the axial plane for ultrasound scanning of the knees.
View Anatomical landmarks
Anterior – patient supine (45� flexion)
Superior aspect of knee imaged (Fig. 4)
Inferior landmark: upper pole of patella
Central scan: transducer placed at mid portion of distal thigh with
long axis perpendicular to axis of femur
Additional scans medial/far medial and lateral/far lateral parallel to central scan
Anterior – patient supine (45� flexion)
Mid aspect of knee imaged (Fig. 4)
Inferior landmark: mid portion of the articulating component of the femoral condyle
Central position: transducer placed at mid portion of knee joint with
long axis perpendicular to long axis of femur
Scans medial/far medial and lateral/far lateral parallel to central scan
Anterior – patient supine (45� flexion)
Inferior aspect of knee imaged (Fig. 4)
Superior landmark: upper aspect of articular cartilage of
proximal tibial epiphysis
Central scan: transducer placed at mid portion of shin with long
axis perpendicular to long axis of tibia
Additional scans medial/far medial and lateral/far lateral parallel to central scan
Posterior – patient prone (flat)
Mid aspect of knee imaged (Fig. 4)
Popliteal fossa
Central scan: transducer placed at mid portion of knee joint with long axis
perpendicular to long axis of femur
Additional scans medial and lateral parallel to central scan
SYSTEMATIC SONOGRAPHIC PROTOCOL FOR HEMOPHILIC ARTHROPATHY 297
� 2007 The AuthorsJournal compilation � 2007 Blackwell Publishing Ltd Haemophilia (2007), 13, 293–304
may demonstrate increased vascular flow on powerDoppler imaging as seen in Fig. 10 [26,28]. Resultsin the literature have shown that power Dopplerimaging is a reliable diagnostic method for assess-ment of vascularity in synovial tissue [28] showingpromise in evaluating the activity of pannus injuvenile idiopathic arthritis [29,30]. A novel ultraso-nographic technique uses intravascular microbubblecontrast agents to improve the Doppler signal inten-
sity. Preliminary results of the use of contrast agentsin juvenile idiopathic arthritis [31] have shown apotential application for the technique in subclinicalcases; however, the increased cost and greaterinvasiveness of this technique has somewhat limitedits use in clinical practice. Further investigation ofhaemophilic arthropathy with colour and powerDoppler techniques is warranted.
Fig. 4. Lateral view of the knee in 450 of flexion. The transducer positions used for acquisition of axial images of the anterior aspect of the
knee is shown (a). The locations delineated with gel in supine (b) and prone (c) positions represent the position of the transducer for
sonographic assessment of the knee in the axial plane.
Fig. 5. Sonography of the ankle: locations delineated with gel in supine (a) and prone (b) positions represent the positions of the transducer
for acquisition of sagittal images.
298 K. ZUKOTYNSKI et al.
� 2007 The AuthorsHaemophilia (2007), 13, 293–304 Journal compilation � 2007 Blackwell Publishing Ltd
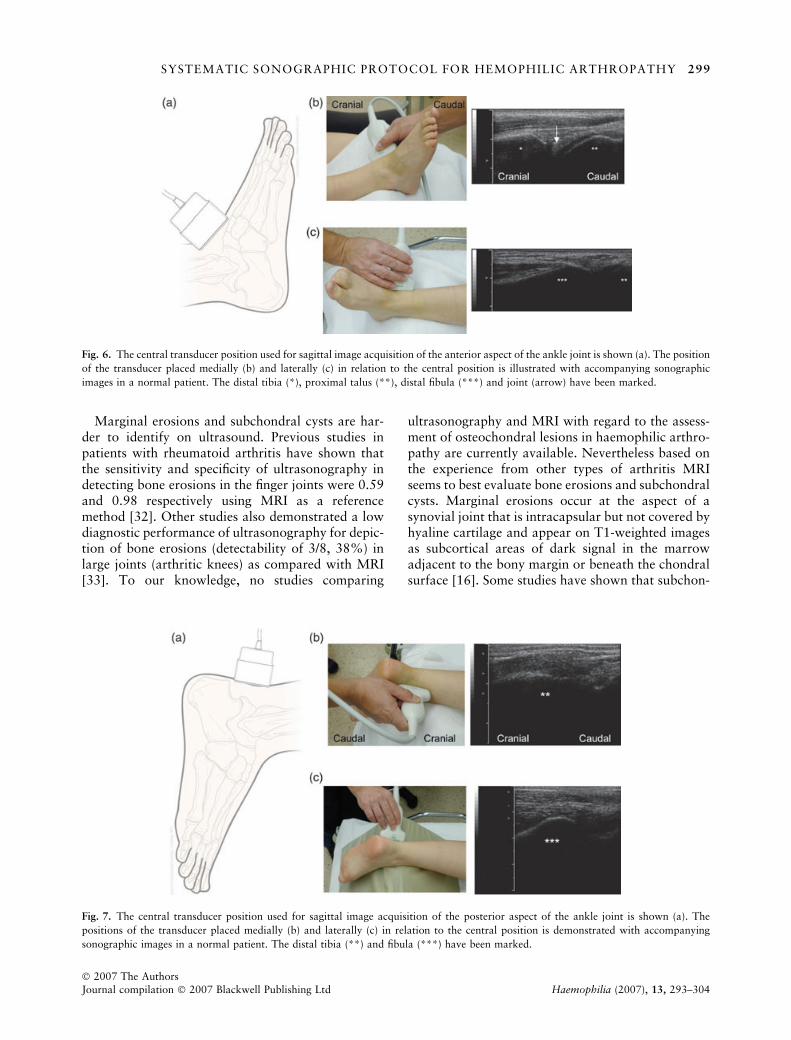
Marginal erosions and subchondral cysts are har-der to identify on ultrasound. Previous studies inpatients with rheumatoid arthritis have shown thatthe sensitivity and specificity of ultrasonography indetecting bone erosions in the finger joints were 0.59and 0.98 respectively using MRI as a referencemethod [32]. Other studies also demonstrated a lowdiagnostic performance of ultrasonography for depic-tion of bone erosions (detectability of 3/8, 38%) inlarge joints (arthritic knees) as compared with MRI[33]. To our knowledge, no studies comparing
ultrasonography and MRI with regard to the assess-ment of osteochondral lesions in haemophilic arthro-pathy are currently available. Nevertheless based onthe experience from other types of arthritis MRIseems to best evaluate bone erosions and subchondralcysts. Marginal erosions occur at the aspect of asynovial joint that is intracapsular but not covered byhyaline cartilage and appear on T1-weighted imagesas subcortical areas of dark signal in the marrowadjacent to the bony margin or beneath the chondralsurface [16]. Some studies have shown that subchon-
Fig. 7. The central transducer position used for sagittal image acquisition of the posterior aspect of the ankle joint is shown (a). The
positions of the transducer placed medially (b) and laterally (c) in relation to the central position is demonstrated with accompanying
sonographic images in a normal patient. The distal tibia (**) and fibula (***) have been marked.
Fig. 6. The central transducer position used for sagittal image acquisition of the anterior aspect of the ankle joint is shown (a). The position
of the transducer placed medially (b) and laterally (c) in relation to the central position is illustrated with accompanying sonographic
images in a normal patient. The distal tibia (*), proximal talus (**), distal fibula (***) and joint (arrow) have been marked.
SYSTEMATIC SONOGRAPHIC PROTOCOL FOR HEMOPHILIC ARTHROPATHY 299
� 2007 The AuthorsJournal compilation � 2007 Blackwell Publishing Ltd Haemophilia (2007), 13, 293–304
dral cysts may arise primarily in bone rather than asextensions from the joint [34]. T1- and T2-weightedimages show the contents of erosions and subchon-
dral cysts to present either with intermediate signal onboth sequences or with bright signal on T2-weightedimages [16].
Articular cartilage loss is very difficult to charac-terize accurately with ultrasound as small differencesin transducer angulation can give highly differentresults. This is illustrated in Fig. 12.
Discussion
Tables 1 through 4 and Figs 1 through 8 present astandardized protocol for ultrasound imaging of theknee and ankle in haemophiliac children. The posi-tions of the transducer as described have been chosento facilitate reproducibility between examinations. Itis hoped that as experience in the field accumulates,the sonographic examination may be tailored totarget the specific clinical concern. In the mean time,this protocol can facilitate uniform assessment ofarthropathies and form a base for the development ofa scoring scale for use in the determination of diseaseprogression and the effect of treatment.
In terms of practical issues, rapid accurate patientpositioning was facilitated through the use of padsshaped to allow correct joint placement. An ultra-
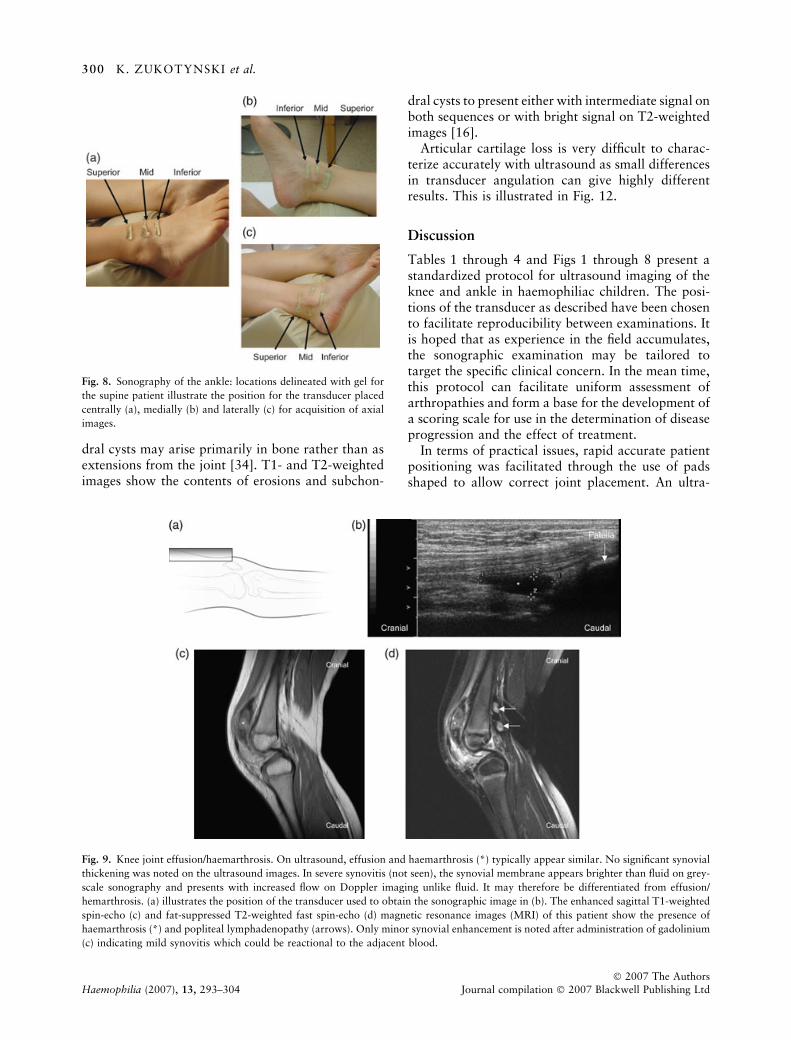
Fig. 8. Sonography of the ankle: locations delineated with gel for
the supine patient illustrate the position for the transducer placed
centrally (a), medially (b) and laterally (c) for acquisition of axial
images.
Fig. 9. Knee joint effusion/haemarthrosis. On ultrasound, effusion and haemarthrosis (*) typically appear similar. No significant synovial
thickening was noted on the ultrasound images. In severe synovitis (not seen), the synovial membrane appears brighter than fluid on grey-
scale sonography and presents with increased flow on Doppler imaging unlike fluid. It may therefore be differentiated from effusion/
hemarthrosis. (a) illustrates the position of the transducer used to obtain the sonographic image in (b). The enhanced sagittal T1-weighted
spin-echo (c) and fat-suppressed T2-weighted fast spin-echo (d) magnetic resonance images (MRI) of this patient show the presence of
haemarthrosis (*) and popliteal lymphadenopathy (arrows). Only minor synovial enhancement is noted after administration of gadolinium
(c) indicating mild synovitis which could be reactional to the adjacent blood.
300 K. ZUKOTYNSKI et al.
� 2007 The AuthorsHaemophilia (2007), 13, 293–304 Journal compilation � 2007 Blackwell Publishing Ltd
sound examination of one joint was typically longerthan the most basic corresponding MRI protocolbut shorter than the corresponding full MRI proto-col and certainly within the same time frame as anMRI examination. Of note, the total time for an
MRI scan depended on the scan itself as well as theinitial time spent positioning the patient in accord-ance with the protocol and acquisition of localizersequences. A second practical issue was that in theevent of an acute bleed, pain could be engendered
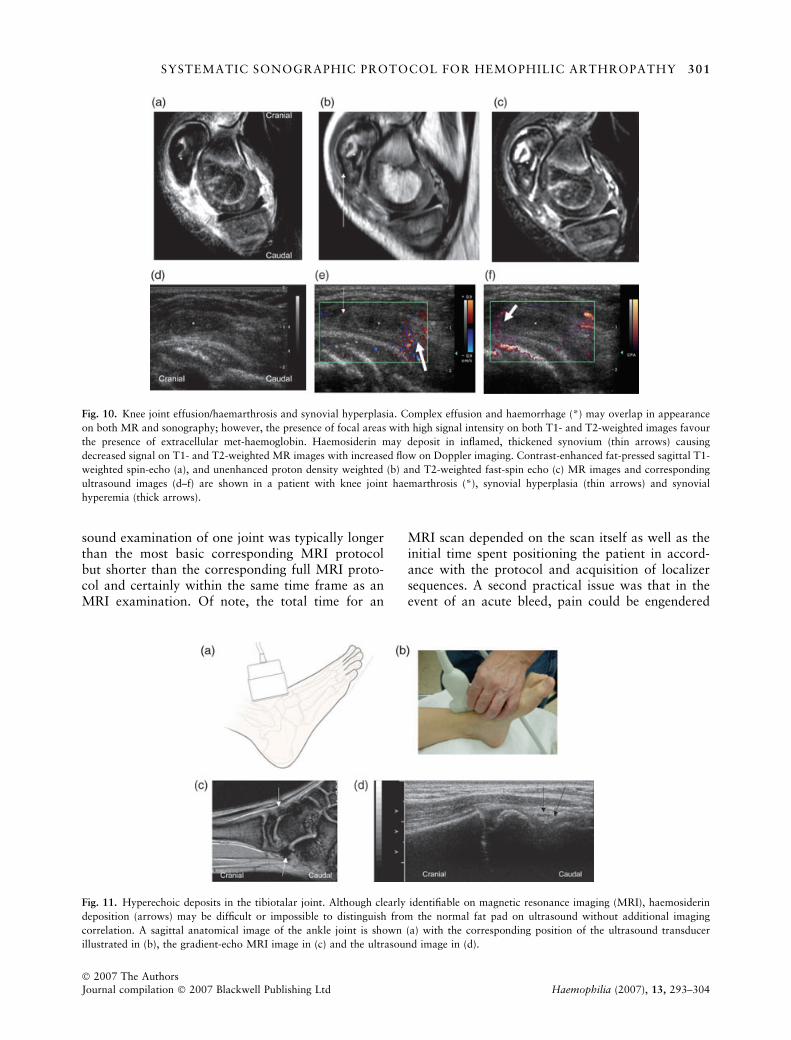
Fig. 10. Knee joint effusion/haemarthrosis and synovial hyperplasia. Complex effusion and haemorrhage (*) may overlap in appearance
on both MR and sonography; however, the presence of focal areas with high signal intensity on both T1- and T2-weighted images favour
the presence of extracellular met-haemoglobin. Haemosiderin may deposit in inflamed, thickened synovium (thin arrows) causing
decreased signal on T1- and T2-weighted MR images with increased flow on Doppler imaging. Contrast-enhanced fat-pressed sagittal T1-
weighted spin-echo (a), and unenhanced proton density weighted (b) and T2-weighted fast-spin echo (c) MR images and corresponding
ultrasound images (d–f) are shown in a patient with knee joint haemarthrosis (*), synovial hyperplasia (thin arrows) and synovial
hyperemia (thick arrows).
Fig. 11. Hyperechoic deposits in the tibiotalar joint. Although clearly identifiable on magnetic resonance imaging (MRI), haemosiderin
deposition (arrows) may be difficult or impossible to distinguish from the normal fat pad on ultrasound without additional imaging
correlation. A sagittal anatomical image of the ankle joint is shown (a) with the corresponding position of the ultrasound transducer
illustrated in (b), the gradient-echo MRI image in (c) and the ultrasound image in (d).
SYSTEMATIC SONOGRAPHIC PROTOCOL FOR HEMOPHILIC ARTHROPATHY 301
� 2007 The AuthorsJournal compilation � 2007 Blackwell Publishing Ltd Haemophilia (2007), 13, 293–304
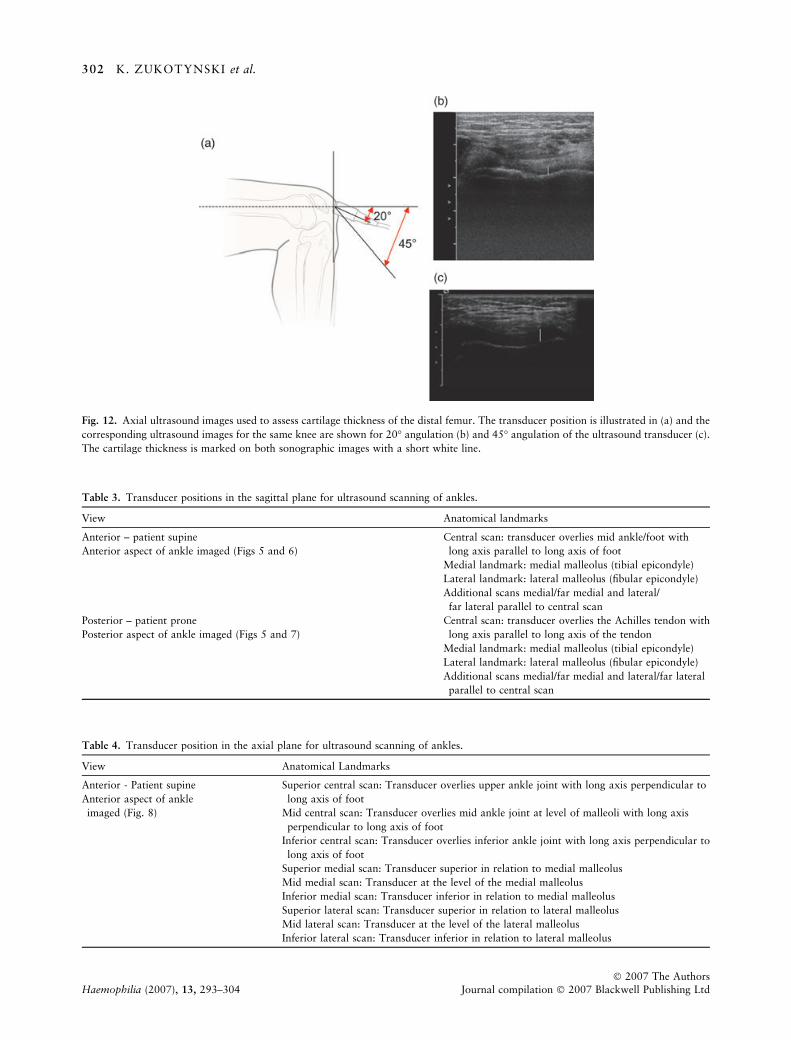
Fig. 12. Axial ultrasound images used to assess cartilage thickness of the distal femur. The transducer position is illustrated in (a) and the
corresponding ultrasound images for the same knee are shown for 20� angulation (b) and 45� angulation of the ultrasound transducer (c).
The cartilage thickness is marked on both sonographic images with a short white line.
Table 3. Transducer positions in the sagittal plane for ultrasound scanning of ankles.
View Anatomical landmarks
Anterior – patient supine
Anterior aspect of ankle imaged (Figs 5 and 6)
Central scan: transducer overlies mid ankle/foot with
long axis parallel to long axis of foot
Medial landmark: medial malleolus (tibial epicondyle)
Lateral landmark: lateral malleolus (fibular epicondyle)
Additional scans medial/far medial and lateral/
far lateral parallel to central scan
Posterior – patient prone
Posterior aspect of ankle imaged (Figs 5 and 7)
Central scan: transducer overlies the Achilles tendon with
long axis parallel to long axis of the tendon
Medial landmark: medial malleolus (tibial epicondyle)
Lateral landmark: lateral malleolus (fibular epicondyle)
Additional scans medial/far medial and lateral/far lateral
parallel to central scan
Table 4. Transducer position in the axial plane for ultrasound scanning of ankles.
View Anatomical Landmarks
Anterior - Patient supine
Anterior aspect of ankle
imaged (Fig. 8)
Superior central scan: Transducer overlies upper ankle joint with long axis perpendicular to
long axis of foot
Mid central scan: Transducer overlies mid ankle joint at level of malleoli with long axis
perpendicular to long axis of foot
Inferior central scan: Transducer overlies inferior ankle joint with long axis perpendicular to
long axis of foot
Superior medial scan: Transducer superior in relation to medial malleolus
Mid medial scan: Transducer at the level of the medial malleolus
Inferior medial scan: Transducer inferior in relation to medial malleolus
Superior lateral scan: Transducer superior in relation to lateral malleolus
Mid lateral scan: Transducer at the level of the lateral malleolus
Inferior lateral scan: Transducer inferior in relation to lateral malleolus
302 K. ZUKOTYNSKI et al.
� 2007 The AuthorsHaemophilia (2007), 13, 293–304 Journal compilation � 2007 Blackwell Publishing Ltd
by pressure of the ultrasound transducer over thejoint surface. This could be mitigated throughprophylactic administration of analgesic medicationand concentration factors prior to the ultrasoundscan to decrease pain and avoid further intra-articular bleeding.
Further work in measuring inter- and intrareaderreliability of articular cartilage measurements and indetermining the diagnostic performance of ultra-sound in comparison with MRI is needed forcharacterization of an accurate standardized proto-col in this regard. Investigation is also necessary toestablish the criterion validity of pathologic findingssuch as volume of joint effusion, sonographic char-acterization of haemosiderin deposition and quanti-fication of synovial proliferation in an animal modelof haemophilic arthropathy as compared with thecorresponding postmortem specimens. Once we havea better understanding of the validity of ultrasoundmeasurements we may be able to further simplify thisprotocol.
In conclusion, sonography is an accessible, inex-pensive imaging modality that does not requiresedation for imaging children with haemophilicarthropathy. It is a promising technique for theassessment of soft tissue changes which are theearliest findings in haemophilic arthropathy and itmay be used as a complementary imaging modalityin following disease progression and the effects oftreatment. Further investigation is required for eval-uation of osteochondral changes, articular cartilagethickness and haemosiderin deposition given limita-tions of sonography in this regard and in minimizingoperator dependency, especially if applied in multi-centric clinical trials. We hope that by outlining astandardized approach to sonography of the kneeand ankle the dependence of outcome measures onoperator experience may be limited and the potentialfor development of an ultrasound scoring system inthe assessment of children with haemophilic arthro-pathy may be facilitated. As the experience in usingultrasound as an imaging measurement tool is gainedsimplification of the protocol may be achieved.
Acknowledgement
We would like to acknowledge Lori Waters for herhelp in creating the illustrations for this manuscript.
References
1 Gilliland B. Relapsing polychondritis and otherarthritides. In: Fauci A, Braunwald E, Isselbacher K
et al. eds. Harrison’s Principles of Internal Medicine,14th edn. McGraw-Hill: New York, NY, 1998: 1959.
2 Brower A, Flemming D. Arthritis in Black and White,2nd edn. W.B. Saunders Company: Philadelphia, PAW.B. Saunders Company, 1997: 405–18.
3 Lund B, Pettersson H, Ljung R. A new magnetic res-onance imaging scoring method for assessment ofhaemophilic arthropathy. Hemophilia 2004; 10: 383–9.
4 Klippel J. Primer on the Rheumatic Diseases, 12th edn.Philadelphia, PA: Arthritis Foundation, 2001: 431–2.
5 Handin R. Disorders of coagulation and thrombosis.In: Fauci A, Braunwald E, Isselbacher K et al., eds.Harrison’s Principles of Internal Medicine, 14th edn.McGraw-Hill: New York, NY 1998: 736–43.
6 Arnold WD, Hilgartner MW. Hemophilic arthropathy.Current concepts of pathogenesis and management.J Bone Joint Surg 1977; 59A: 287–305.
7 Kilcoyne RF, Nuss R. Radiological assessment ofhemophilic arthropathy with emphasis on MRI find-ings. Hemophilia 2003; 9: 57–64.
8 Klukowska A, Czyrny Z, Laguna P, Brzewski M,Serafin-Krol MA, Rokicka-Milewska R. Correlationbetween clinical, radiological and ultrasonographicalimage of knee joints in children with haemophilia.Hemophilia 2001; 7: 286–92.
9 Hermann G, Gilbert MS, Abdelwahab IF. Hemophilia:evaluation of musculoskeletal involvement with CT,sonography, and MR imaging. AJR 1992; 158: 119–23.
10 R-Merchan EC, De Orbe A, Gago J. Ultrasound in thediagnosis of the early stages of hemophilic arthropathyof the knee. Acta Orthop Belg 1992; 58: 122–5.
11 Rand T, Trattnig S, Male C et al. Magnetic resonanceimaging in hemophilic children: value of gradient echoand contrast-enhanced imaging. MRI 1999; 17: 199–205.
12 Dobon M, Lucia JF, Aguilar C et al. Value of magneticresonance imaging for the diagnosis and follow-up ofhaemophilic arthropathy. Hemophilia 2003; 9: 76–85.
13 Nuss R, Kilcoyne RF, Rivard GE, Murphy J. Lateclinical, plain X-ray and magnetic resonance imagingfindings in haemophilic joints treated with radiosy-noviorthesis. Hemophilia 2000; 6: 658–63.
14 Pettersson H, Ahlberg A, Nilsson IM. A radiologicclassification of hemophilic arthropathy. Clin Orthop1980; 149: 153–9.
15 Bush CH. The magnetic resonance imaging of muscu-loskeletal hemorrhage. Skeletal Radiol 2000; 29: 1–9.
16 Winalski CS, Palmer WE, Rosenthal DI, WeissmanBN. Magnetic resonance imaging of rheumatoid arth-ritis. Radiol Clin N Am 1996; 34: 243–58.
17 Clement JP, Kassarjian A, Palmer WE. Synovialinflammatory processes in the hand. Eur J Radiol 2005;56: 307–18.
18 Rand T, Imhof H, Czerny C et al. Discriminationbetween fluid, synovium, and cartilage in patients withrheumatoid arthritis: contrast enhanced spin echo ver-
SYSTEMATIC SONOGRAPHIC PROTOCOL FOR HEMOPHILIC ARTHROPATHY 303
� 2007 The AuthorsJournal compilation � 2007 Blackwell Publishing Ltd Haemophilia (2007), 13, 293–304
sus non-contrast-enhanced fat suppressed gradientecho MR imaging. Clin Radiol 1999; 54: 107–10.
19 Lundin A, Babyn P, Doria AS et al. Compatible scalesfor progressive and additive MRI assessments of hae-mophilic arthropathy. Haemophilia 2005; 11: 107–8.
20 Doria AS, Lundin B, Kilcoyne RF et al. Reliability ofprogressive and additive MRI scoring systems forevaluation of hemophilic arthropathy in children:expert MRI Working Group of the International Pro-phylaxis Study Group. Hemophilia 2005; 11: 245–53.
21 Mathew P, Talbut DC, Frogameni A et al. Isotopicsynovectomy with P-32 in paediatric patients withhaemophilia. Haemophilia 2000; 6: 547–55.
22 Funk MB, Schmidt H, Becker S et al. Modified magneticresonance imaging score compared with orthopaedicand radiological scores for the evaluation of haemophilicarthropathy. Haemophilia 2002; 8: 98–103.
23 Soler R, Lopez-Fernandez F, Rodriguez E, Marini M.Hemophilic arthropathy. A scoring system for mag-netic resonance imaging. Eur Radiol 2002; 12: 836–43.
24 Nuss R, Kilcoyne RF, Geraghty S et al. MRI findings inhemophilic joints treated with radiosynoviorthesis withdevelopment of an MRI scale of joint damage.Haemophilia 2000; 6: 162–9.
25 Wallny T, Brackmann HH, Semper H et al. Intra-arti-cular hyaluronic acid in the treatment of haemophilicarthropathy of the knee. Clinical, radiological and son-ographical assessment. Haemophilia 2000; 6: 566–70.
26 Grisson LE, Harcke HT. Pediatric musculoskeletalultrasound. In: Rumack CM, Wilson SR, CharbonneauJW, eds. Diagnostic Ultrasound, 3rd edn. Mosby:Elsevier, 2005: 2035–57.
27 Weissleder R, Wittenberg J, Harisinghani MG. Primerof Diagnostic Imaging, 3rd edn. Mosby-Year Books:St. Louis, Missouri, 2003: 497.
28 Walther M, Harms H, Krenn V et al. Correlation ofpower Doppler sonography with vascularity of thesynovial tissue of the knee joint in patients withosteoarthritis and rheumatoid arthritis. ArthritisRheumatism 2001; 44: 331–8.
29 Lamer S, Sebag GH. MRI and ultrasound in childrenwith juvenile chronic arthritis. Eur J Radiol 2000; 33:85–93.
30 Newman JS, Laing TJ, McCarthy CJ, Adler RS. PowerDoppler sonography of synovitis: assessment of thera-peutic response – preliminary observations. Radiology1996; 198: 582–4.
31 Doria AS, Kiss MH, Lotito AP et al. Juvenile rheumatoidarthritis of the knee: evaluation with contrast-enhancedcolor Doppler ultrasound. Pediatr Radiol 2001; 31:524–31.
32 Szkudlarek M, Klarlund M, Narvestad E et al.Ultrasonography of the metacarpophalangeal andproximal interphalangeal joints in rheumatoid arthri-tis: a comparison with magnetic resonance imaging,conventional radiography and clinical examination.Arthritis Res Ther 2006; 8: R52.
33 Ostergaard M, Court-Payen M, Gideon P et al.Ultrasonography in arthritis of the knee. Acta Radiol1995; 36: 19–26.
34 Cooke TD, Li J, Scudamore RA. Radiographic assess-ment of bony contributions to knee deformity. OrthopClin N Am 1994; 25: 387–93.
304 K. ZUKOTYNSKI et al.
� 2007 The AuthorsHaemophilia (2007), 13, 293–304 Journal compilation � 2007 Blackwell Publishing Ltd