Embed Size (px)
Citation preview
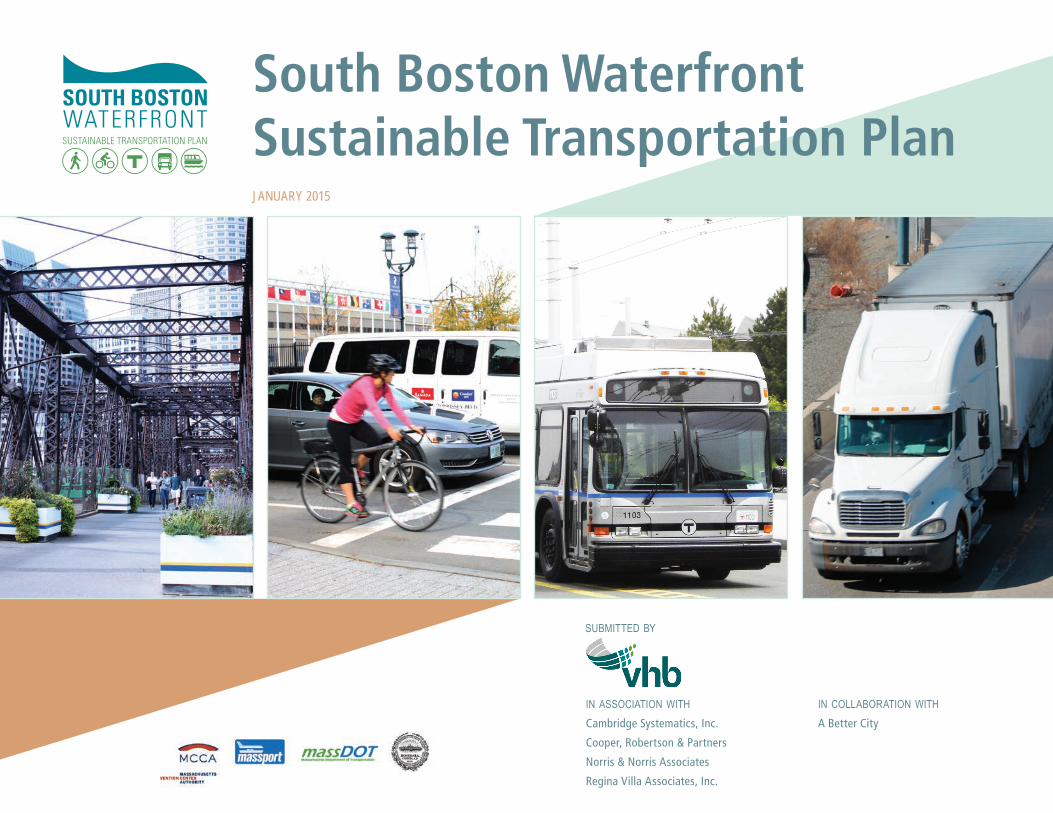
South Boston Waterfront Sustainable Transportation Plan january 2015
submitted by
in association with Cambridge Systematics, Inc.
Cooper, Robertson & Partners
Norris & Norris Associates
Regina Villa Associates, Inc.
in collaboration with A Better City
South Boston Waterfront Sustainable Transportation Plan | Final Report 1 www.sbwaterfrontmobility.org
Table Of Contents ExECuTivE SummaRy ..............................................................................................4
Introduction ......................................................................................................................4 Vision and Plan Goals ...................................................................................................5 Study and Impact Area .................................................................................................7 Planning Process ............................................................................................................. 7 Waterfront Today ............................................................................................................9 Waterfront Tomorrow ................................................................................................. 10 Plan Recommendations ...............................................................................................11 Plan Implementation and Next Steps ....................................................................27
inTROduCTiOn ........................................................................................................28 Vision, Goals, and Objectives .................................................................................. 29 Study and Impact Area .............................................................................................. 30 Overview of Plan Development ............................................................................... 31 Planning Process .......................................................................................................... 34 Public Engagement ..................................................................................................... 35 Progress During Plan Development ...................................................................... 36
lOOking BaCk ..........................................................................................................37 Status of Recommendations of 2000 Study ........................................................37 Land Use Transformation .......................................................................................... 40 Population and Employment Growth ................................................................... 42
SOuTH BOSTOn WaTERFROnT TOday ..........................................................43 Live Here ........................................................................................................................ 43 Work Here ...................................................................................................................... 46 Convene Here ............................................................................................................... 50 Play Here ......................................................................................................................... 51 Waterfront Access and Mobility ............................................................................. 53
Waterfront Public Realm ............................................................................................73
SOuTH BOSTOn WaTERFROnT TOmORROW ..............................................80
Future Waterfront Land Use .................................................................................... 80
Future Waterfront Access and Mobility ................................................................87
Planned Improvements ............................................................................................100
WaTERFROnT iSSuES, nEEdS, and OPPORTuniTiES ...........................102
Improve Regional Access .........................................................................................102
Expand Community Connections .......................................................................... 112
Address Internal Circulation and Mobility ...........................................................117
Enhance Public Realm ...............................................................................................124
Plan for Resiliency ......................................................................................................128
RECOmmEndaTiOnS ..........................................................................................131
Alternatives Assessment and Development of Recommendations ........... 131
Recommendations ..................................................................................................... 131
Improve Regional Access .........................................................................................133
Expand Community Connections ........................................................................ 141
Enhance Internal Waterfront Mobility .................................................................149
Advance Public Realm ..............................................................................................156
Implement Supportive Management Strategies and Policies ........................166
Ensure State of Good Repair ..................................................................................168
Next Steps .....................................................................................................................168
aCknOWlEdgEmEnTS .......................................................................................171
Study Participants ........................................................................................................171
Private Contributors ................................................................................................... 173
liST OF aCROnymS .............................................................................................174
2 South Boston Waterfront Sustainable Transportation Plan | Final Report www.sbwaterfrontmobility.org
Exhibits Summary ExECuTivE SummaRy ..............................................................................................4
Exhibit ES-1: Study and Impact Areas ......................................................................8
Exhibit ES-2: Projected Growth – South Boston Waterfront ............................9
Exhibit ES-3: Forecasted Peak Period Person-Trips by Mode ........................ 10
Exhibit ES-4: Existing and Forecasted Person-Trips by Mode ........................11
Exhibit ES-5: Recommendations to Improve Regional Access ...................... 13
Exhibit ES-6: Recommendations to Expand Community Connections ....... 17
Exhibit ES-7: Recommendations to Enhance Waterfront Mobility ............... 21
Exhibit ES-8: Trip Generation (Per 1,000 Square Feet) Urban Residential vs. Office Uses .............................................................................................................. 24
inTROduCTiOn ........................................................................................................28
Exhibit 1: Locus Map .................................................................................................... 31
Exhibit 2: Study Area ................................................................................................... 31
Exhibit 3: Transportation Planning Process for the South Boston Waterfront Sustainable Transportation Plan....................................................... 34
lOOking BaCk ..........................................................................................................37
Exhibit 4: South Boston Waterfront Transformation ........................................ 38
Exhibit 5: 2000 Plan Recommendation Status ................................................... 39
Exhibit 6: Land Use Comparison by Building Square Footage ..................... 40
Exhibit 7: 2013 Land Use ............................................................................................ 41
Exhibit 8: Demographic Changes Since 2000 .................................................... 42
SOuTH BOSTOn WaTERFROnT TOday ..........................................................43
Exhibit 9: 2013 Population Density in the Study Area ..................................... 44
Exhibit 10: Employment Location of South Boston Waterfront Residents ...... 45
Exhibit 11: Residential Location of South Boston Waterfront Employees ..... 46
Exhibit 12: Growth in Maritime Activities – Twenty Foot Equivalent Units ...... 47
Exhibit 13: Freight Generating/Consuming Facilities in the South Boston Waterfront .......................................................................................... 48
Exhibit 14: Current and Planned Truck Routes in the South Boston Waterfront .......................................................................................... 49
Exhibit 15: 2013 BCEC Events by Type................................................................... 50
Exhibit 16: Key Visitor Attractions ............................................................................ 51
Exhibit 17: Annual Visitation at Key Attractions ................................................. 52
Exhibit 18: Existing Restaurant Locations ............................................................. 52
Exhibit 19: South Boston Waterfront Transit Service Peak Headways ........ 53
Exhibit 20: MBTA Transit Service Access .............................................................. 54
Exhibit 21: Peak Hour Peak Direction Transit Capacity .................................... 55
Exhibit 22: Morning Peak Hour Cordon Demand Analysis ............................ 56
Exhibit 23: Evening Peak Hour Cordon Demand Analysis ..............................57
Exhibit 24: Private Shuttle Service Routing ......................................................... 58
Exhibit 25: South Boston Waterfront Private Shuttle Frequency ................. 59
Exhibit 26: Existing Water Transit Services .......................................................... 60
Exhibit 27: Key Gateways and Corridors .............................................................. 63
Exhibit 28: Supply and Demand Entering South Boston (AM) ..................... 64
Exhibit 29: Supply and Demand Exiting South Boston (PM) ......................... 65
Exhibit 30: Peak Hour Pedestrian Volume by Intersection ..............................67
Exhibit 31: South Boston Waterfront Bicycle Accommodations ................... 68
Exhibit 32: South Boston Waterfront Hubway Station Locations ................ 69
Exhibit 33: Historic Truck Volume (Peak Hour) Comparison ......................... 69
Exhibit 34: Existing Parking Supply (2013) ............................................................ 71
Exhibit 35: Existing Parking Demand......................................................................72
Exhibit 36: Neighborhood Scale Comparison – Downtown Boston ........... 74
Exhibit 37: Pedestrian Access to Silver Line Stations – Challenges ..............78
SOuTH BOSTOn WaTERFROnT TOmORROW ..............................................80
Exhibit 38: Future Demographics ............................................................................ 81
Exhibit 39: Future Land Use Comparison ............................................................ 82
Exhibit 40: Build-out Population Density in the Study Area .......................... 84
Exhibit 41: Build-out Employment Heat Map ..................................................... 85
Exhibit 42: South Boston Waterfront Forecasted Person-Trip Growth .......87
South Boston Waterfront Sustainable Transportation Plan | Final Report 3 www.sbwaterfrontmobility.org
Exhibit 43: South Boston Waterfront Forecasted Person-Trip by Mode and Mode Share ....................................................................................... 88
Exhibit 44: Future Regional Gateway Growth in Peak Period Transit ......... 89
Exhibit 45: Peak Hour Peak Direction Transit Capacity with Anticipated Transit Growth .............................................................................................................. 90
Exhibit 46: Projected 2035 Private Shuttle Demands ...................................... 90
Exhibit 47: Vehicle-Trip Growth on Key Study Area Corridors ...................... 92
Exhibit 48: Vehicle-Trip Growth on Key Impact Area Corridors ................... 92
Exhibit 49: 2013 Existing and 2035 Base Weekday Morning Vehicle Operations ...................................................................................................... 94
Exhibit 50: 2013 Existing and 2035 Base Weekday Evening Vehicle Operations ...................................................................................................... 95
Exhibit 51: Projected 2035 Peak Period Pedestrian Volumes (Typical Weekday) .........................................................................................................97
Exhibit 52: Projected Truck Volume (Peak Hour) Comparison ...................... 98
Exhibit 53: Dedicated Freight Corridor ................................................................. 99
Exhibit 54: Currently Planned/Committed Projects ......................................... 101
WaTERFROnT iSSuES, nEEdS, and OPPS ..................................................102
Exhibit 55: Regional Subareas ................................................................................103
Exhibit 56: Modeled Distribution of Existing and Forecasted Study Area Person-Trips (AM and PM Peak Periods) .....................................103
Exhibit 57: Downtown vs. South Boston Waterfront Transit Seat Comparison (Capacity per Peak Hour) ................................................................104
Exhibit 58: Existing and Future Silver Line Peak Hour Demand and Existing Capacity ................................................................................................105
Exhibit 59: Existing Geographic Distribution of Transit Trips and Mode Share (2013) .....................................................................................................107
Exhibit 60: AM and PM Peak Period Private Shuttle Bus Ridership ...........108
Exhibit 61: Candidate Congress Street Consolidated Shuttle Route ..........108
Exhibit 62: Water Transportation Catchment Areas ........................................109
Exhibit 63: Local Transit Services ........................................................................... 112
Exhibit 64: A Street/South Station Candidate Consolidated Shuttle Route ............................................................................................................... 113
Exhibit 65: Potential Shuttle Route Between Andrew Station and the Waterfront Route (space) Shuttle Route ..................................................... 113
Exhibit 66: Forecasted (2035) Internal Study Area Person-Trips ..................117
Exhibit 67: Opportunities to Improve Access to Transit ................................120
Exhibit 68: South Boston Internal Transit Circulation Needs and Opportunities ............................................................................................................... 121
RECOmmEndaTiOnS ..........................................................................................131
Exhibit 69-a: Recommendations to Improve Regional Access ....................134
Exhibit 69-b: Improve Regional Access – Underway and Short-Term Recommendations (0-3 years) ........................................................139
Exhibit 69-c: Improve Regional Access – Medium and Long-Term Recommendations (3-10+ years) ..........................................................................140
Exhibit 70-a: Recommendations to Expand Community Connections .....142
Exhibit 70-b: Expand Community Connections – Underway and Short-Term Recommendations (0-3 years) ........................................................147
Exhibit 70-c: Expand Community Connections – Medium and Long-Term Recommendations (3-10+ years) ....................................................148
Exhibit 71-a: Recommendations to Enhance Internal Waterfront Mobility .... 150
Exhibit 71-b: Enhance Internal Waterfront Mobility – Underway and Short-Term Recommendations (0-3 years) ........................................................154
Exhibit 71-c: Enhance Internal Waterfront Mobility – Medium and Long-Term Recommendations (3-10+ years) ....................................................155
Exhibit 72: Current and Planned Subarea Plans for the South Boston Waterfront Mobility ........................................................................158
Exhibit 73: Existing and Future Open Space and Open Space Connectors .. 160
Exhibit 74: Key Gateways to the South Boston Waterfront ..........................162
Exhibit 75: Key Transformational Projects ...........................................................164
Exhibit 76: Trip Generation (Per 1,000 Square Feet) for Urban Residential vs. Office Uses (Unadjusted for Mode Choice) ................................................166
Exhibit 77: SOGR Cost Summary ...........................................................................168
4 South Boston Waterfront Sustainable Transportation Plan | Final Report www.sbwaterfrontmobility.org
ExEC
UTI
VE S
UM
MAR
y
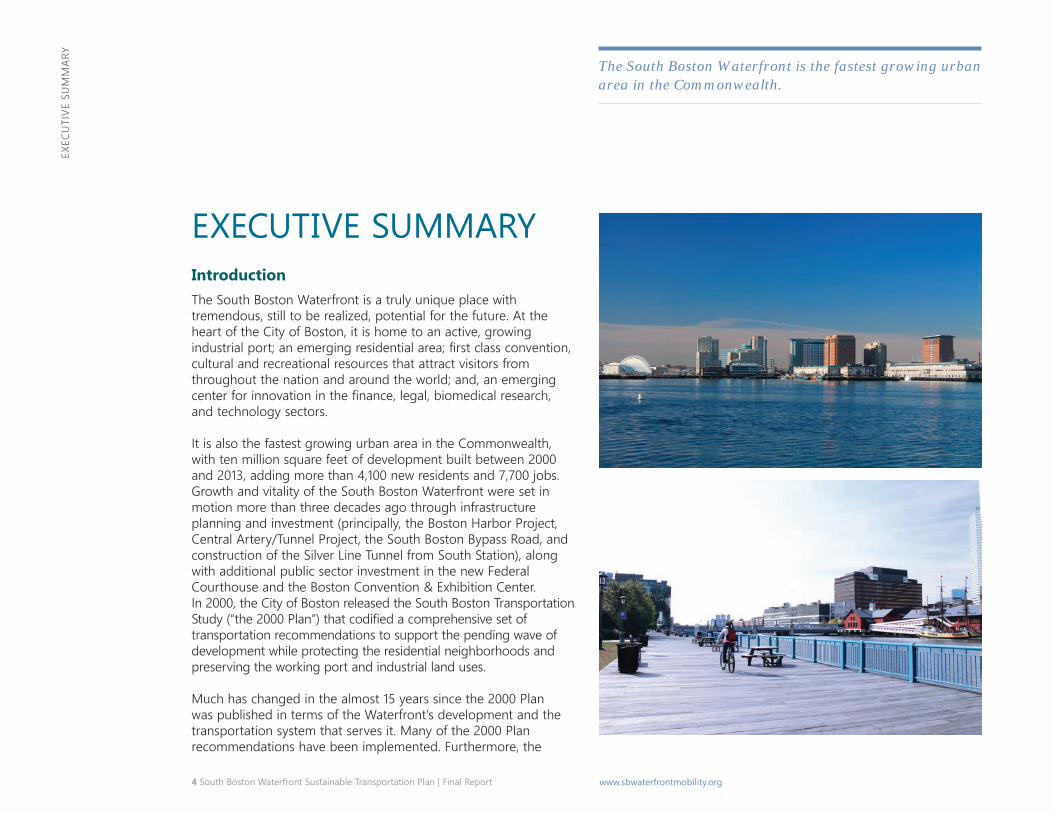
ExECuTivE SummaRy Introduction The South Boston Waterfront is a truly unique place with tremendous, still to be realized, potential for the future. At the heart of the City of Boston, it is home to an active, growing industrial port; an emerging residential area; first class convention, cultural and recreational resources that attract visitors from throughout the nation and around the world; and, an emerging center for innovation in the finance, legal, biomedical research, and technology sectors.
It is also the fastest growing urban area in the Commonwealth, with ten million square feet of development built between 2000 and 2013, adding more than 4,100 new residents and 7,700 jobs. Growth and vitality of the South Boston Waterfront were set in motion more than three decades ago through infrastructure planning and investment (principally, the Boston Harbor Project, Central Artery/Tunnel Project, the South Boston Bypass Road, and construction of the Silver Line Tunnel from South Station), along with additional public sector investment in the new Federal Courthouse and the Boston Convention & Exhibition Center. In 2000, the City of Boston released the South Boston Transportation Study (“the 2000 Plan”) that codified a comprehensive set of transportation recommendations to support the pending wave of development while protecting the residential neighborhoods and preserving the working port and industrial land uses.
Much has changed in the almost 15 years since the 2000 Plan was published in terms of the Waterfront’s development and the transportation system that serves it. Many of the 2000 Plan recommendations have been implemented. Furthermore, the
The South Boston Waterfront is the fastest growing urban area in the Commonwealth.
South Boston Waterfront Sustainable Transportation Plan | Final Report 5 www.sbwaterfrontmobility.org
ExEC
UTI
VE S
UM
MAR
y
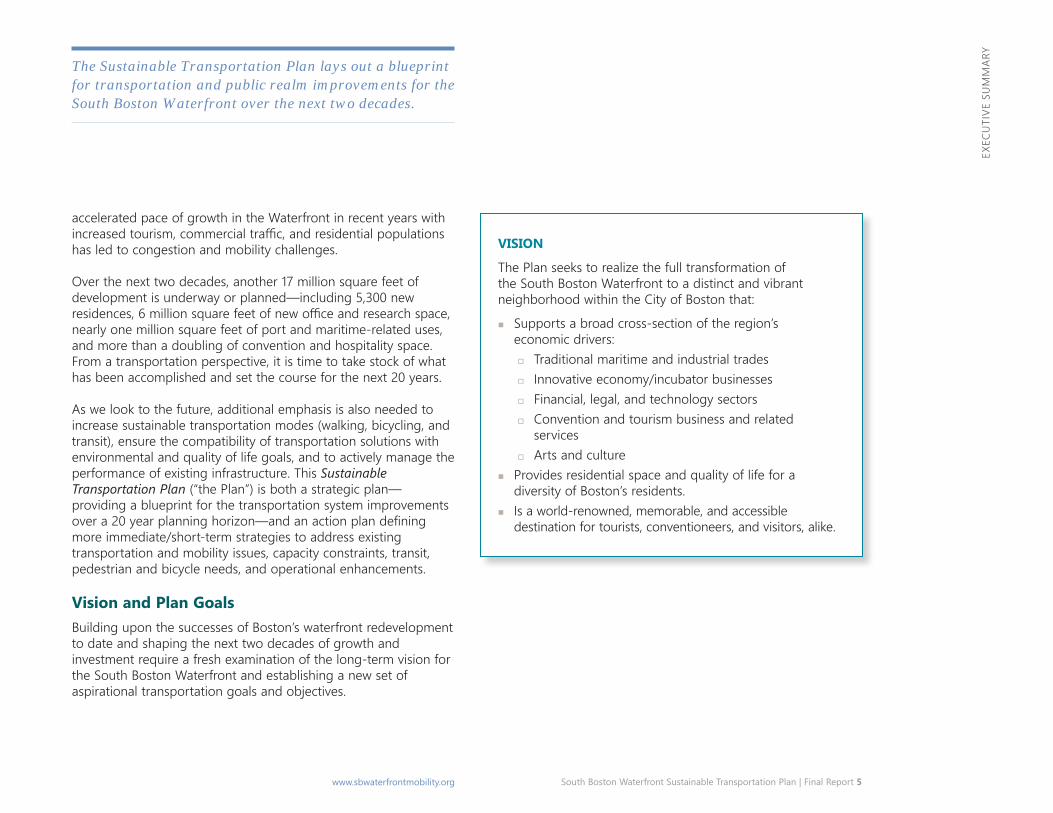
accelerated pace of growth in the Waterfront in recent years with increased tourism, commercial traffic, and residential populations has led to congestion and mobility challenges.
The Sustainable Transportation Plan lays out a blueprint for transportation and public realm improvements for the South Boston Waterfront over the next two decades.
Over the next two decades, another 17 million square feet of development is underway or planned—including 5,300 new residences, 6 million square feet of new office and research space, nearly one million square feet of port and maritime-related uses, and more than a doubling of convention and hospitality space. From a transportation perspective, it is time to take stock of what has been accomplished and set the course for the next 20 years.
As we look to the future, additional emphasis is also needed to increase sustainable transportation modes (walking, bicycling, and transit), ensure the compatibility of transportation solutions with environmental and quality of life goals, and to actively manage the performance of existing infrastructure. This Sustainable Transportation Plan (“the Plan”) is both a strategic plan— providing a blueprint for the transportation system improvements over a 20 year planning horizon—and an action plan defining more immediate/short-term strategies to address existing transportation and mobility issues, capacity constraints, transit, pedestrian and bicycle needs, and operational enhancements.
Vision and Plan Goals Building upon the successes of Boston’s waterfront redevelopment to date and shaping the next two decades of growth and investment require a fresh examination of the long-term vision for the South Boston Waterfront and establishing a new set of aspirational transportation goals and objectives.
VISION
The Plan seeks to realize the full transformation of the South Boston Waterfront to a distinct and vibrant neighborhood within the City of Boston that:
� Supports a broad cross-section of the region’s economic drivers: � Traditional maritime and industrial trades � Innovative economy/incubator businesses � Financial, legal, and technology sectors � Convention and tourism business and related
services � Arts and culture
� Provides residential space and quality of life for a diversity of Boston’s residents.
� Is a world-renowned, memorable, and accessible destination for tourists, conventioneers, and visitors, alike.
6 South Boston Waterfront Sustainable Transportation Plan | Final Report www.sbwaterfrontmobility.org
ExEC
UTI
VE S
UM
MAR
y
Goals
There is broad consensus that this transportation plan—that supports the 21st Century South Boston Waterfront area, defines and prioritizes transportation system investments, seeks to influence people’s travel behaviors, and improves the public realm —is a major step forward to ensure the full potential of this area and achieve the vision. This Plan seeks to:
Improve Access and Mobility for All – Improve multimodal access to/from/through and mobility within the South Boston Waterfront for residents, workers, maritime-related commerce, and visitors.
Support Economic Growth and Vitality – Deliver the transportation infrastructure needed to support a world-class economy.
Reinforce Sustainable Policies and Programs – Align programs and policies to support more sustainable transportation choices and demand management to and within the South Boston Waterfront.
Enhance the Public Realm – Contribute to enhancing the attractiveness and quality of the urban character through ongoing transportation investment.
Contribute Environmental and Health Benefits – Realize the positive environmental effects and health benefits that result from a more sustainable transportation plan.
Invest Smartly for the Future – Advance strategic investment in the South Boston Waterfront to ensure the long-term financial and operational sustainability of its transportation system.
Critical to turning this Sustainable Transportation Plan into action and realizing the needed improvements in transportation and mobility requires: (1) establishing the organizational structure and capacity to implement the Plan and, (2) establishing mechanisms to monitor and evaluate the effectiveness of implemented improvements across transportation, environment, social, and cost metrics. This assessment has to be consistent with stated performance management goals.
South Boston Waterfront Sustainable Transportation Plan | Final Report 7 www.sbwaterfrontmobility.org
ExEC
UTI
VE S
UM
MAR
y
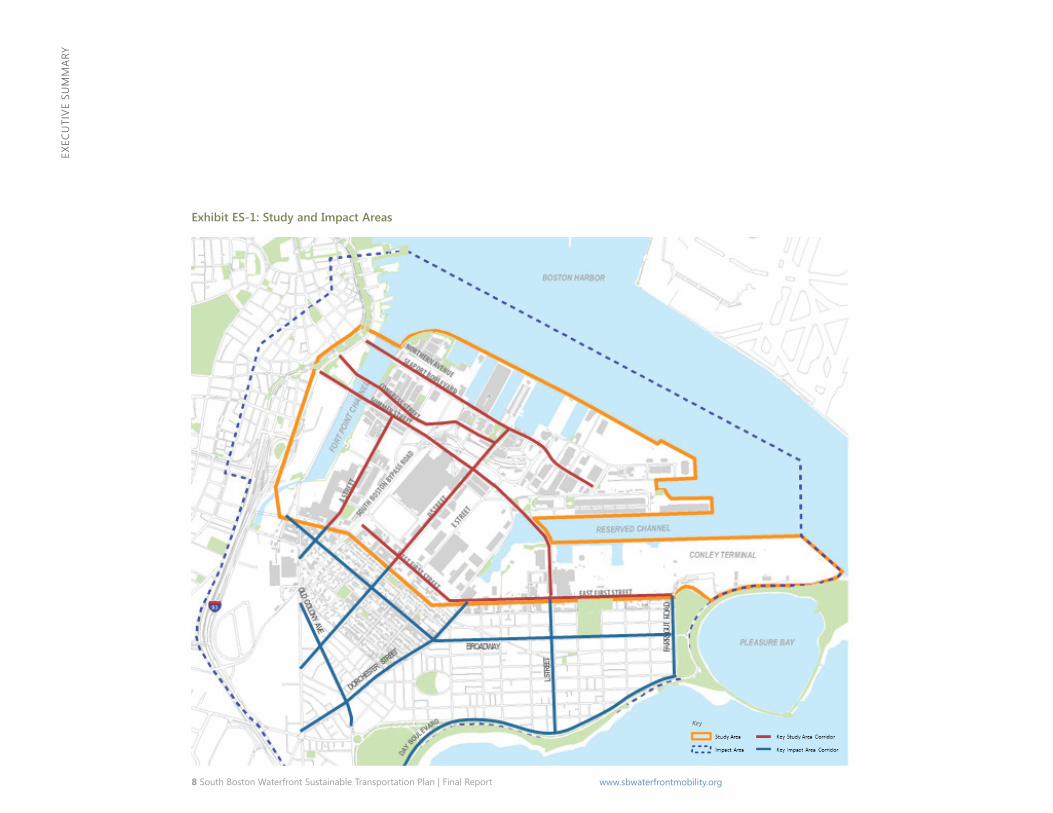
Study and Impact Area The area known as the South Boston Waterfront is located southeast of Downtown Boston and across the Inner Harbor from East Boston and comprises land bound by East and West First Streets to the south, Boston Harbor to the east, and the Fort Point Channel area to the west, as shown within the orange boundary in Exhibit ES-1. The attractiveness of the South Boston Waterfront is in large part due to its strategic location abutting historic Boston Harbor, adjacent to Boston’s financial district and Logan International Airport, and at the nexus of two major interstate highways (I-90 and I-93). It also features the largest supply of centrally located, undeveloped land in the City of Boston. As the South Boston Waterfront is located on a peninsula, proximate to the Downtown and many of the City’s oldest neighborhoods, it cannot be studied in isolation. Accordingly, the Plan also considers the impact area surrounding the Waterfront as outlined by the dashed blue line in Exhibit ES-1.
Planning Process The South Boston Waterfront transportation plan development, kicked off in December of 2013, engaged the many and diverse stakeholders in the Study Area and adjacent neighborhoods from its inception, and involved a unique partnership among all of the sponsoring agencies.
Multi-Agency Collaboration
Plan development was overseen by a Steering Committee comprising senior leadership from the Massachusetts Convention Center Authority, Massachusetts Port Authority, Massachusetts Department of Transportation, and the City of Boston. The project was managed by A Better City and supported by generous donations from area businesses. The Steering Committee met monthly over the 12-month planning process. In addition, an
Interagency Working Group (IWG) was established at the outset of this initiative to guide the technical elements of plan development. The IWG met weekly to share information, review all technical documents, and provide direct input on plan alternatives and recommendations. Most importantly, the IWG helped foster interagency cooperation and consensus on the study findings.
The framing of study area and neighborhood transportation issues, opportunities, and needs evolved from a thorough review of data and the compilation of concerns and desired outcomes identified by key project stakeholders, with more than 50 outreach meetings over the planning process.
Public Engagement
A major component of this planning effort involved stakeholder engagement guided by a comprehensive Public Involvement Plan developed as part of the first task in the process. The planning team initiated public dialogue early in the process to acknowledge the issues and opportunities facing the South Boston Waterfront, and involve many communities of interest, including residents; employers and employees; maritime and industrial businesses; agencies; advocacy groups; neighborhood associations; and the public. Public input was solicited through individual outreach meetings and broad community gatherings. An online survey (in four languages) was also distributed to employees in visitor and tourism industries to gather their input. Five public meetings were held at key plan milestones to solicit broader input to the study. Public review of the draft recommendations was solicited through presentations and via email and the Plan website. In total, more than 50 outreach meetings were held over the 12-month planning process, garnering input from hundreds of individuals.
The agencies and the planning team mapped the transportation issues and needs to candidate solutions or strategies. The candidate strategies were then analyzed—under the framework provided by the Vision, Goals and Objectives of the Plan—vetted within the agencies and with the public, and screened to determine the most promising options for incorporation into the plan recommendations.
8 South Boston Waterfront Sustainable Transportation Plan | Final Report www.sbwaterfrontmobility.org
ExEC
UTI
VE S
UM
MAR
y
Exhibit ES-1: Study and Impact Areas
South Boston Waterfront Sustainable Transportation Plan | Final Report 9 www.sbwaterfrontmobility.org
ExEC
UTI
VE S
UM
MAR
y
Projected Growth in the Waterfront
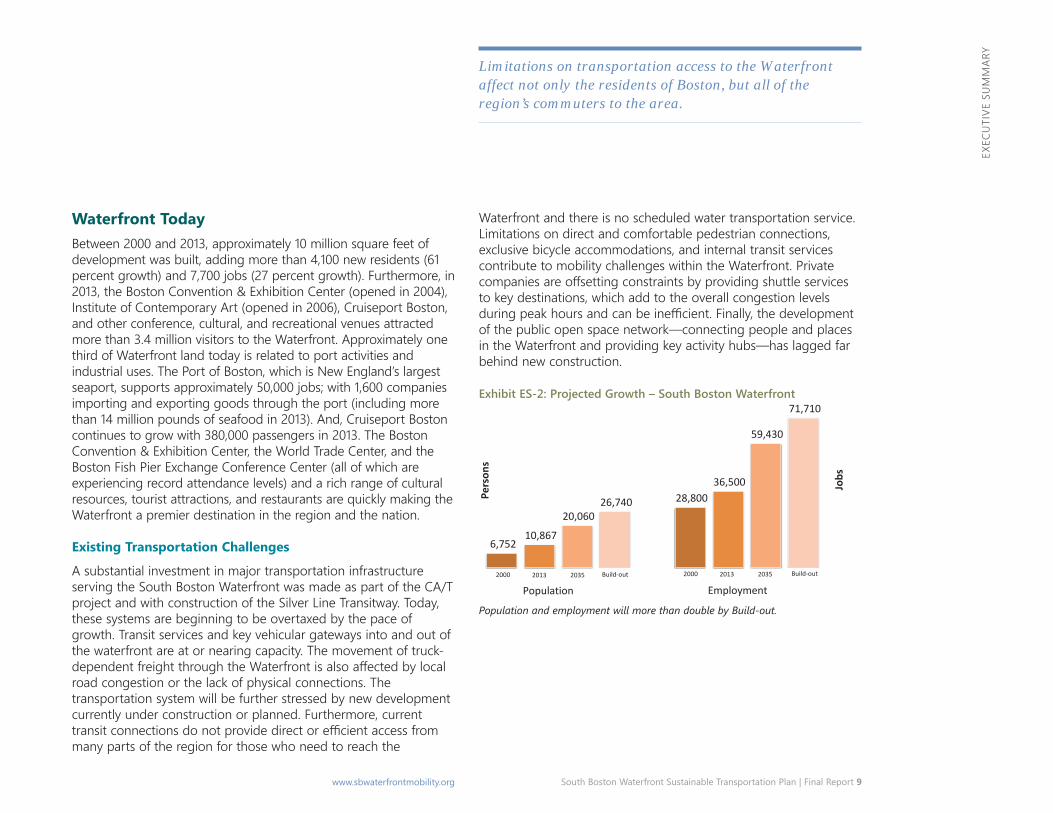
Waterfront Today Between 2000 and 2013, approximately 10 million square feet of development was built, adding more than 4,100 new residents (61 percent growth) and 7,700 jobs (27 percent growth). Furthermore, in 2013, the Boston Convention & Exhibition Center (opened in 2004), Institute of Contemporary Art (opened in 2006), Cruiseport Boston, and other conference, cultural, and recreational venues attracted more than 3.4 million visitors to the Waterfront. Approximately one third of Waterfront land today is related to port activities and industrial uses. The Port of Boston, which is New England’s largest seaport, supports approximately 50,000 jobs; with 1,600 companies importing and exporting goods through the port (including more than 14 million pounds of seafood in 2013). And, Cruiseport Boston continues to grow with 380,000 passengers in 2013. The Boston Convention & Exhibition Center, the World Trade Center, and the Boston Fish Pier Exchange Conference Center (all of which are experiencing record attendance levels) and a rich range of cultural resources, tourist attractions, and restaurants are quickly making the Waterfront a premier destination in the region and the nation.
Existing Transportation Challenges
A substantial investment in major transportation infrastructure serving the South Boston Waterfront was made as part of the CA/T project and with construction of the Silver Line Transitway. Today, these systems are beginning to be overtaxed by the pace of growth. Transit services and key vehicular gateways into and out of the waterfront are at or nearing capacity. The movement of truck-dependent freight through the Waterfront is also affected by local road congestion or the lack of physical connections. The transportation system will be further stressed by new development currently under construction or planned. Furthermore, current transit connections do not provide direct or efficient access from many parts of the region for those who need to reach the
Waterfront and there is no scheduled water transportation service. Limitations on direct and comfortable pedestrian connections, exclusive bicycle accommodations, and internal transit services contribute to mobility challenges within the Waterfront. Private companies are offsetting constraints by providing shuttle services to key destinations, which add to the overall congestion levels during peak hours and can be inefficient. Finally, the development of the public open space network—connecting people and places in the Waterfront and providing key activity hubs—has lagged far behind new construction.
Limitations on transportation access to the Waterfront affect not only the residents of Boston, but all of the region’s commuters to the area.
Exhibit ES-2: Projected Growth – South Boston Waterfront
Population and employment will more than double by Build-out.
6,752
28,800
10,867
36,500
20,060
59,430
26,740
71,710
Pers
ons
Jobs
2000 2013 2035 Build-out 2000 2013 2035 Build-out
Population Employment
10 South Boston Waterfront Sustainable Transportation Plan | Final Report www.sbwaterfrontmobility.org
ExEC
UTI
VE S
UM
MAR
y
Waterfront Tomorrow City building in the South Boston Waterfront district continues to evolve today. Much of the future development in the South Boston Waterfront area already has been defined through local and state permitting processes. Defined development and redevelopment projects are anticipated to add more than 17 million square feet in the Waterfront by 2035, a 72 percent increase over existing conditions (Exhibit ES-2). About another 10 million square feet of development are projected by the full Build-out, more than doubling land use over today. The substantial land use growth projected for the South Boston Waterfront translates to approximately 9,200 new residents and 22,900 new jobs in the Waterfront by 2035. In addition, growth in the traditional port activity at Conley Terminal is projected to more than double over the next decade and the expansion of the Boston Convention & Exhibition Center and new hotel development will sustain continued growth in the visitor and tourism industries.
Future Transportation Challenges
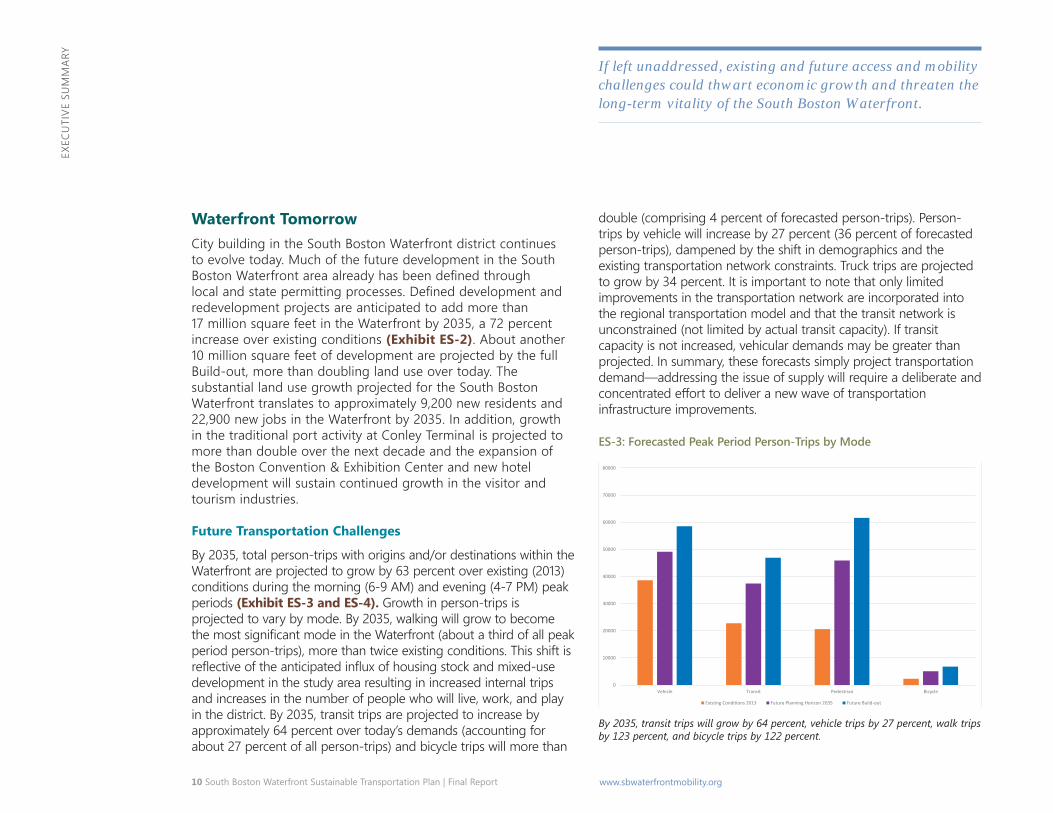
By 2035, total person-trips with origins and/or destinations within the Waterfront are projected to grow by 63 percent over existing (2013) conditions during the morning (6-9 AM) and evening (4-7 PM) peak periods (Exhibit ES-3 and ES-4). Growth in person-trips is projected to vary by mode. By 2035, walking will grow to become the most significant mode in the Waterfront (about a third of all peak period person-trips), more than twice existing conditions. This shift is reflective of the anticipated influx of housing stock and mixed-use development in the study area resulting in increased internal trips and increases in the number of people who will live, work, and play in the district. By 2035, transit trips are projected to increase by approximately 64 percent over today’s demands (accounting for about 27 percent of all person-trips) and bicycle trips will more than
double (comprising 4 percent of forecasted person-trips). Person-trips by vehicle will increase by 27 percent (36 percent of forecasted person-trips), dampened by the shift in demographics and the existing transportation network constraints. Truck trips are projected to grow by 34 percent. It is important to note that only limited improvements in the transportation network are incorporated into the regional transportation model and that the transit network is unconstrained (not limited by actual transit capacity). If transit capacity is not increased, vehicular demands may be greater than projected. In summary, these forecasts simply project transportation demand—addressing the issue of supply will require a deliberate and concentrated effort to deliver a new wave of transportation infrastructure improvements.
If left unaddressed, existing and future access and mobility challenges could thwart economic growth and threaten the long-term vitality of the South Boston Waterfront.
ES-3: Forecasted Peak Period Person-Trips by Mode
By 2035, transit trips will grow by 64 percent, vehicle trips by 27 percent, walk trips by 123 percent, and bicycle trips by 122 percent.
0
10000
20000
30000
40000
50000
60000
70000
80000
Vehicle Transit Pedestrian Bicycle
Existing Conditions 2013 Future Planning Horizon 2035 Future Build-out
South Boston Waterfront Sustainable Transportation Plan | Final Report 11 www.sbwaterfrontmobility.org
ExEC
UTI
VE S
UM
MAR
y
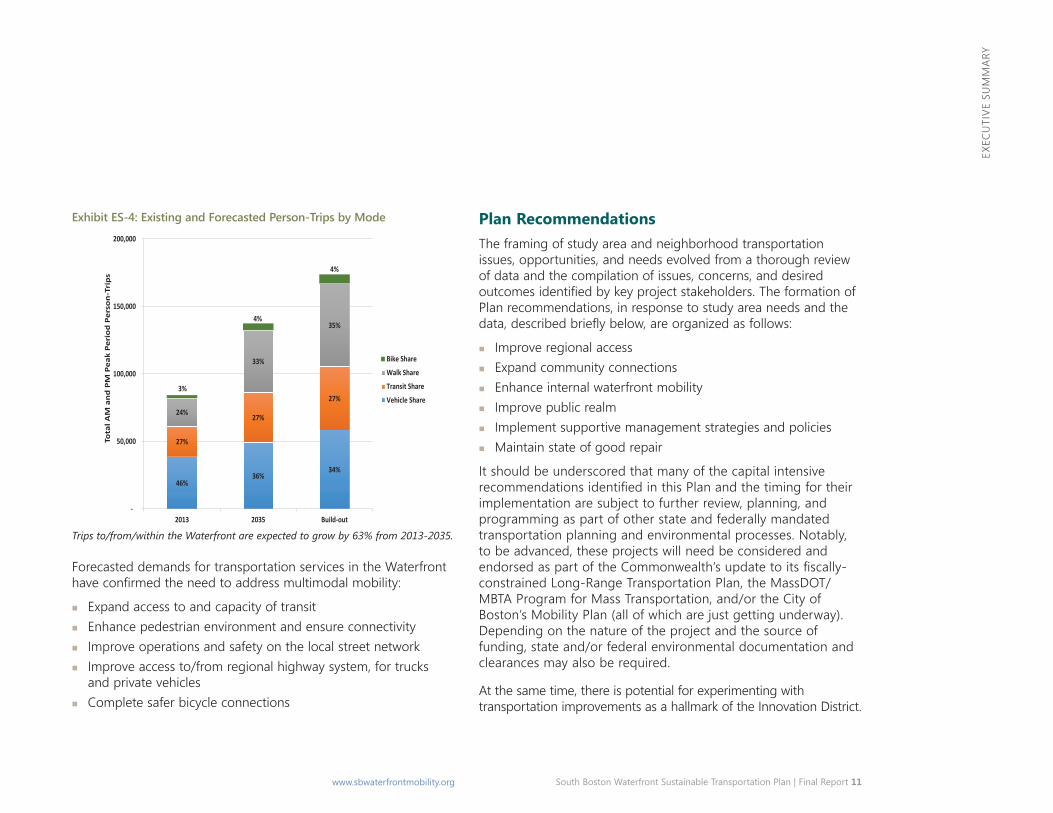
Exhibit ES-4: Existing and Forecasted Person-Trips by Mode
Trips to/from/within the Waterfront are expected to grow by 63% from 2013-2035.
Forecasted demands for transportation services in the Waterfront have confirmed the need to address multimodal mobility:
� Expand access to and capacity of transit � Enhance pedestrian environment and ensure connectivity � Improve operations and safety on the local street network � Improve access to/from regional highway system, for trucks
and private vehicles � Complete safer bicycle connections
Plan Recommendations The framing of study area and neighborhood transportation issues, opportunities, and needs evolved from a thorough review of data and the compilation of issues, concerns, and desired outcomes identified by key project stakeholders. The formation of Plan recommendations, in response to study area needs and the data, described briefly below, are organized as follows:
� Improve regional access � Expand community connections � Enhance internal waterfront mobility � Improve public realm � Implement supportive management strategies and policies � Maintain state of good repair
It should be underscored that many of the capital intensive recommendations identified in this Plan and the timing for their implementation are subject to further review, planning, and programming as part of other state and federally mandated transportation planning and environmental processes. Notably, to be advanced, these projects will need be considered and endorsed as part of the Commonwealth’s update to its fiscally-constrained Long-Range Transportation Plan, the MassDOT/ MBTA Program for Mass Transportation, and/or the City of Boston’s Mobility Plan (all of which are just getting underway). Depending on the nature of the project and the source of funding, state and/or federal environmental documentation and clearances may also be required.
At the same time, there is potential for experimenting with transportation improvements as a hallmark of the Innovation District.
46%36%
34%
27%
27%
27%
24%
33%
35%
3%
4%
4%
-
50,000
100,000
150,000
200,000
2013 2035 Build-out
Tota
l AM
an
d P
M P
eak
Per
iod
Per
son
-Tri
ps
Bike Share
Walk Share
Transit Share
Vehicle Share
12 South Boston Waterfront Sustainable Transportation Plan | Final Report www.sbwaterfrontmobility.org
ExEC
UTI
VE S
UM
MAR
yKey regional access recommendations are intended to: improve Silver Line operations and capacity; expand transit access to the North; provide new transit connections to the Waterfront, including ferry services; and, improve access/egress at gateways for both trucks and private vehicles.
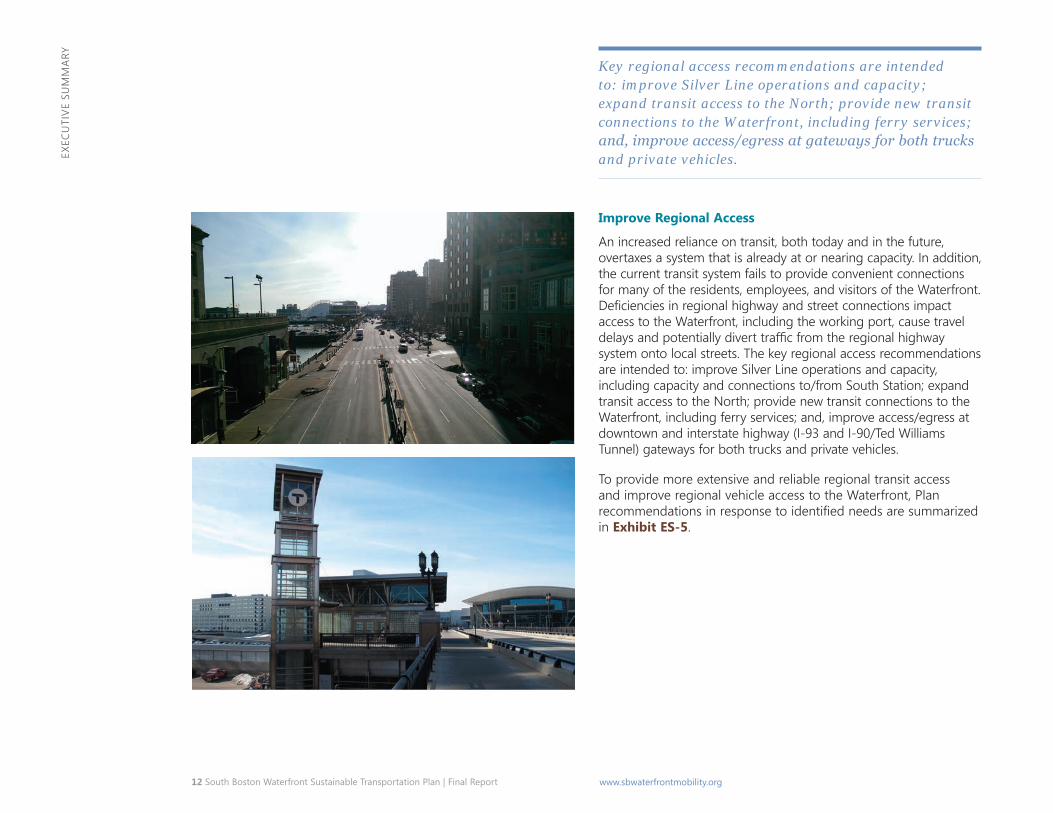
Improve Regional Access
An increased reliance on transit, both today and in the future, overtaxes a system that is already at or nearing capacity. In addition, the current transit system fails to provide convenient connections for many of the residents, employees, and visitors of the Waterfront. Deficiencies in regional highway and street connections impact access to the Waterfront, including the working port, cause travel delays and potentially divert traffic from the regional highway system onto local streets. The key regional access recommendations are intended to: improve Silver Line operations and capacity, including capacity and connections to/from South Station; expand transit access to the North; provide new transit connections to the Waterfront, including ferry services; and, improve access/egress at downtown and interstate highway (I-93 and I-90/Ted Williams Tunnel) gateways for both trucks and private vehicles.
To provide more extensive and reliable regional transit access and improve regional vehicle access to the Waterfront, Plan recommendations in response to identified needs are summarized in Exhibit ES-5.
South Boston Waterfront Sustainable Transportation Plan | Final Report 13 www.sbwaterfrontmobility.org
ExEC
UTI
VE S
UM
MAR
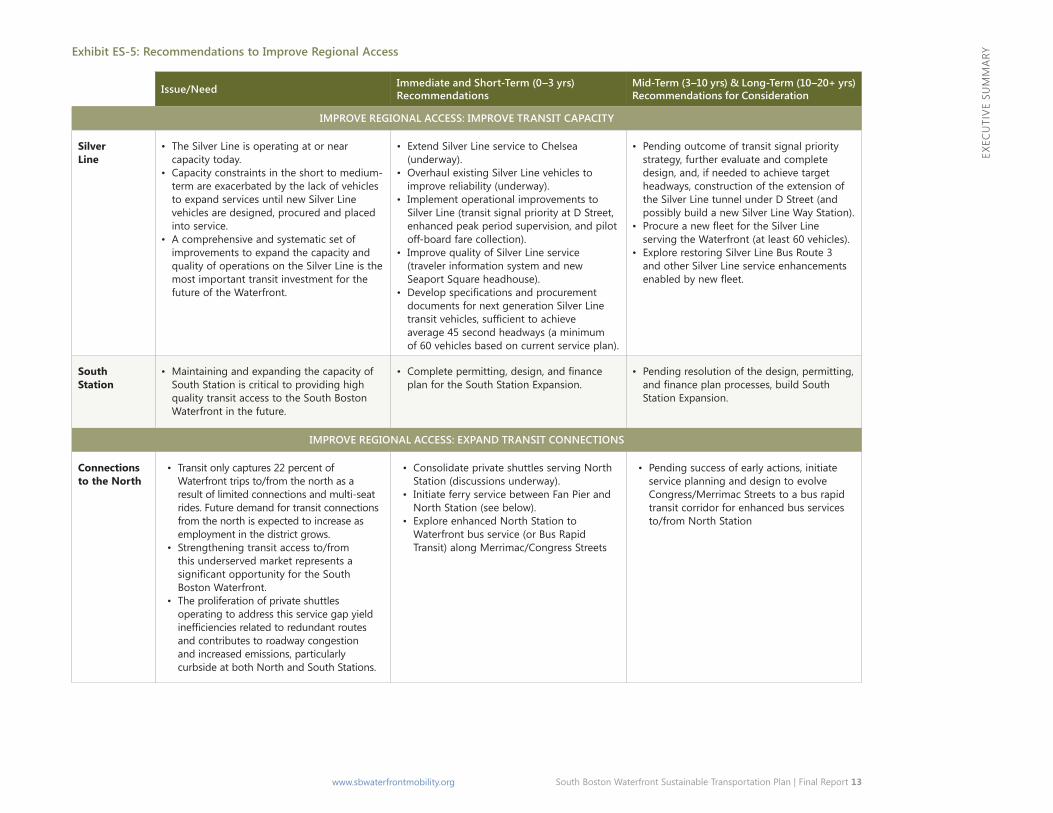
yExhibit ES-5: Recommendations to Improve Regional Access
Issue/Need Immediate and Short-Term (0–3 yrs) Recommendations
Mid-Term (3–10 yrs) & Long-Term (10–20+ yrs) Recommendations for Consideration
IMPRovE REGIoNAL ACCESS: IMPRovE TRANSIT CAPACITy
Silver Line
• The Silver line is operating at or near capacity today.
• Capacity constraints in the short to medium-term are exacerbated by the lack of vehicles to expand services until new Silver line vehicles are designed, procured and placed into service.
• a comprehensive and systematic set of improvements to expand the capacity and quality of operations on the Silver line is the most important transit investment for the future of the Waterfront.
• Extend Silver line service to Chelsea (underway).
• Overhaul existing Silver line vehicles to improve reliability (underway).
• implement operational improvements to Silver line (transit signal priority at d Street, enhanced peak period supervision, and pilot off-board fare collection).
• improve quality of Silver line service (traveler information system and new Seaport Square headhouse).
• Developspecificationsandprocurement documents for next generation Silver line transitvehicles,sufficienttoachieve average 45 second headways (a minimum of 60 vehicles based on current service plan).
• Pending outcome of transit signal priority strategy, further evaluate and complete design, and, if needed to achieve target headways, construction of the extension of the Silver line tunnel under d Street (and possibly build a new Silver line Way Station).
• ProcureanewfleetfortheSilverLine serving the Waterfront (at least 60 vehicles).
• Explore restoring Silver line Bus Route 3 and other Silver line service enhancements enabledbynewfleet.
South Station
• maintaining and expanding the capacity of South Station is critical to providing high quality transit access to the South Boston Waterfront in the future.
• Completepermitting,design,andfinanceplan for the South Station Expansion.
• Pending resolution of the design, permitting, andfinanceplanprocesses,buildSouth Station Expansion.
IMPRovE REGIoNAL ACCESS: ExPANd TRANSIT CoNNECTIoNS
Connections to the North
• Transit only captures 22 percent of Waterfront trips to/from the north as a result of limited connections and multi-seat rides. Future demand for transit connections from the north is expected to increase as employment in the district grows.
• Strengthening transit access to/from this underserved market represents a significantopportunityfortheSouth Boston Waterfront.
• The proliferation of private shuttles operating to address this service gap yield inefficienciesrelatedtoredundantroutes and contributes to roadway congestion and increased emissions, particularly curbside at both north and South Stations.
• Consolidate private shuttles serving north Station (discussions underway).
• initiate ferry service between Fan Pier and north Station (see below).
• Explore enhanced north Station to Waterfront bus service (or Bus Rapid Transit) along merrimac/Congress Streets
• Pending success of early actions, initiate service planning and design to evolve Congress/merrimac Streets to a bus rapid transit corridor for enhanced bus services to/from north Station
14 South Boston Waterfront Sustainable Transportation Plan | Final Report www.sbwaterfrontmobility.org
ExEC
UTI
VE S
UM
MAR
yIssue/Need Immediate and Short-Term (0–3 yrs)
RecommendationsMid-Term (3–10 yrs) & Long-Term (10–20+ yrs) Recommendations for Consideration
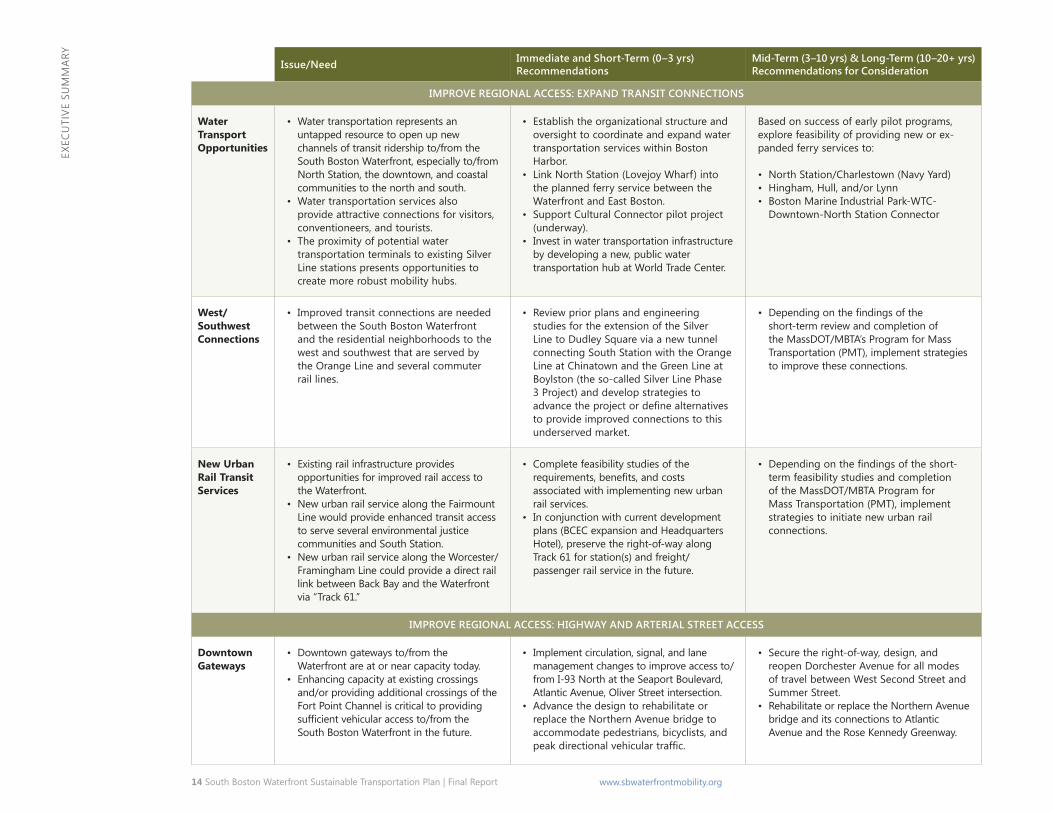
IMPRovE REGIoNAL ACCESS: ExPANd TRANSIT CoNNECTIoNS
Water Transport Opportunities
• Water transportation represents an untapped resource to open up new channels of transit ridership to/from the South Boston Waterfront, especially to/from north Station, the downtown, and coastal communities to the north and south.
• Water transportation services also provide attractive connections for visitors, conventioneers, and tourists.
• The proximity of potential water transportation terminals to existing Silver line stations presents opportunities to create more robust mobility hubs.
• Establish the organizational structure and oversight to coordinate and expand water transportation services within Boston Harbor.
• link north Station (lovejoy Wharf) into the planned ferry service between the Waterfront and East Boston.
• Support Cultural Connector pilot project (underway).
• invest in water transportation infrastructure by developing a new, public water transportation hub at World Trade Center.
Based on success of early pilot programs, explore feasibility of providing new or ex-panded ferry services to:
• north Station/Charlestown (navy yard) • Hingham, Hull, and/or lynn • Boston marine industrial Park-WTC-
downtown-north Station Connector
West/ Southwest Connections
• improved transit connections are needed between the South Boston Waterfront and the residential neighborhoods to the west and southwest that are served by the Orange line and several commuter rail lines.
• Review prior plans and engineering studies for the extension of the Silver line to dudley Square via a new tunnel connecting South Station with the Orange line at Chinatown and the green line at Boylston (the so-called Silver line Phase 3 Project) and develop strategies to advancetheprojectordefinealternatives to provide improved connections to this underserved market.
• Dependingonthefindingsofthe short-term review and completion of the massdOT/mBTa’s Program for mass Transportation (PmT), implement strategies to improve these connections.
New Urban Rail Transit Services
• Existing rail infrastructure provides opportunities for improved rail access to the Waterfront.
• new urban rail service along the Fairmount line would provide enhanced transit access to serve several environmental justice communities and South Station.
• new urban rail service along the Worcester/ Framingham line could provide a direct rail link between Back Bay and the Waterfront via “Track 61.”
• Complete feasibility studies of the requirements,benefits,andcosts associated with implementing new urban rail services.
• in conjunction with current development plans (BCEC expansion and Headquarters Hotel), preserve the right-of-way along Track 61 for station(s) and freight/ passenger rail service in the future.
• Dependingonthefindingsoftheshort-term feasibility studies and completion of the massdOT/mBTa Program for mass Transportation (PmT), implement strategies to initiate new urban rail connections.
IMPRovE REGIoNAL ACCESS: HIGHWAy ANd ARTERIAL STREET ACCESS
Downtown Gateways
• downtown gateways to/from the Waterfront are at or near capacity today.
• Enhancing capacity at existing crossings and/or providing additional crossings of the Fort Point Channel is critical to providing sufficientvehicularaccessto/fromthe South Boston Waterfront in the future.
• implement circulation, signal, and lane management changes to improve access to/ from i-93 north at the Seaport Boulevard, atlantic avenue, Oliver Street intersection.
• advance the design to rehabilitate or replace the northern avenue bridge to accommodate pedestrians, bicyclists, and peakdirectionalvehiculartraffic.
• Secure the right-of-way, design, and reopen dorchester avenue for all modes of travel between West Second Street and Summer Street.
• Rehabilitate or replace the northern avenue bridge and its connections to atlantic avenue and the Rose kennedy greenway.
South Boston Waterfront Sustainable Transportation Plan | Final Report 15 www.sbwaterfrontmobility.org
ExEC
UTI
VE S
UM
MAR
y
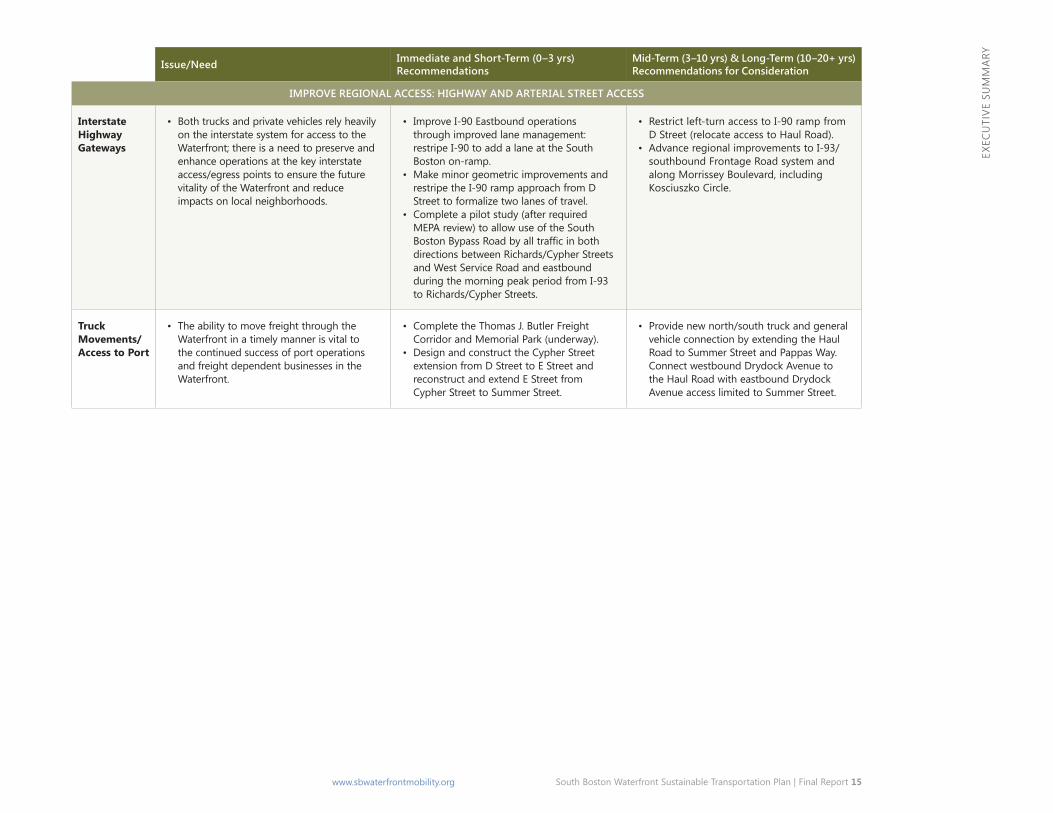
Issue/Need Immediate and Short-Term (0–3 yrs) Recommendations
Mid-Term (3–10 yrs) & Long-Term (10–20+ yrs) Recommendations for Consideration
IMPRovE REGIoNAL ACCESS: HIGHWAy ANd ARTERIAL STREET ACCESS
Interstate Highway Gateways
• Both trucks and private vehicles rely heavily on the interstate system for access to the Waterfront; there is a need to preserve and enhance operations at the key interstate access/egress points to ensure the future vitality of the Waterfront and reduce impacts on local neighborhoods.
• improve i-90 Eastbound operations through improved lane management: restripe i-90 to add a lane at the South Boston on-ramp.
• make minor geometric improvements and restripe the i-90 ramp approach from d Street to formalize two lanes of travel.
• Complete a pilot study (after required mEPa review) to allow use of the South BostonBypassRoadbyalltrafficinboth directions between Richards/Cypher Streets and West Service Road and eastbound during the morning peak period from i-93 to Richards/Cypher Streets.
• Restrict left-turn access to i-90 ramp from d Street (relocate access to Haul Road).
• advance regional improvements to i-93/ southbound Frontage Road system and along morrissey Boulevard, including kosciuszko Circle.
Truck Movements/ Access to Port
• The ability to move freight through the Waterfront in a timely manner is vital to the continued success of port operations and freight dependent businesses in the Waterfront.
• Complete the Thomas J. Butler Freight Corridor and memorial Park (underway).
• design and construct the Cypher Street extension from d Street to E Street and reconstruct and extend E Street from Cypher Street to Summer Street.
• Provide new north/south truck and general vehicle connection by extending the Haul Road to Summer Street and Pappas Way. Connect westbound drydock avenue to the Haul Road with eastbound drydock avenue access limited to Summer Street.
16 South Boston Waterfront Sustainable Transportation Plan | Final Report www.sbwaterfrontmobility.org
ExEC
UTI
VE S
UM
MAR
yThe community consistently expressed a desire to see connections to/from the Waterfront expanded while seeking to protect the neighborhood from the intrusion of unwanted, cut through traffic or additional parking demands.
Expand Community Connections
Through the course of this planning process, a broad outreach effort was carried out to better understand the transportation needs of the community and seek input on the plan’s direction and recommendations. Concerns were primarily focused on pedestrian safety, local bus service, bicycle connections, and local street operations. Infrastructure and poor aesthetics are barriers to making walking a desired and viable mode to key activity centers in the Waterfront. Local bus routes and services in South Boston have not responded to the growing residential populations and employment opportunities in the Waterfront and bicycle accommodations do not yet provide network continuity along key corridors. Improved walking, transit, and bicycling connections were all emphasized as desired outcomes of the South Boston Waterfront Plan. Improvements to vehicular travel should focus on improving the highway and arterial access (as previously discussed) and discourage travel on local streets and through the more established neighborhoods. Accordingly, the efforts to expand community connections to the Waterfront are focused on improving pedestrian, local transit, and bicycle connections, and safety and operational improvements on the local street network, as described below.
To improve multimodal community connections to the Waterfront and address needs on the local street system in South Boston, the key Plan recommendations are summarized in Exhibit ES-6.
South Boston Waterfront Sustainable Transportation Plan | Final Report 17 www.sbwaterfrontmobility.org
ExEC
UTI
VE S
UM
MAR
yExhibit ES-6: Recommendations to Expand Community Connections
Issue/Need Immediate and Short-Term (0–3 yrs) Recommendations
Mid-Term (3–10 yrs) & Long-Term (10–20+ yrs) Recommendations for Consideration
ExPANd CoMMuNITy CoNNECTIoNS: LoCAL TRANSIT
Local Bus Service
• Trips with origins or destinations in the South Boston neighborhood currently account for 9% of all peak period trips to/ from the Waterfront and are projected to grow by 58% by 2035.
• Transit connections between the South Boston Waterfront and the South Boston residential neighborhoods have not kept pace with Waterfront land use growth and demand for access to these areas.
• Throughout the outreach process, stakeholders stressed the need to improve local bus services and/or supplement them with additional services between the community and the Waterfront.
• Consolidate private shuttles along a Street and extend route to include connection to Broadway Station (discussions underway).
• Complete district-wide planning and operations review of local bus services and assess level of service needs with the anticipated outcomes to include: » Route 7 bus service enhancements; » Route 9 bus services enhancements; » Route 11 bus services enhancements; and, » new bus route between andrew Station
and the Waterfront via d Street.
• Perform d Street “circuit breaker” study to examine allowing two-way access for buses only or all vehicles between W. First and Second Streets and at Old Colony avenue.
• implement corridor-level improvements along day Boulevard from i Street to Farragut Road and Columbia Road from g Street to i Street.
• Improveintersectiongeometryandtraffic control at the intersections of East/West First Street and East/West First Street at Pappas Way.
• monitor and periodically address intersection operations in the Waterfront and adjacent neighborhoods through signal technologyupgrades,timingmodifications, restriping, etc., improvements to maintain or enhance vehicular and freight mobility (every 2 to 3 years).
Red Line Access
• Enhancing bus connections between the South, Broadway, and andrew Stations is essential to supplement transit access to the Waterfront prior to the procurement and arrival of a new and expanded Silver Linefleet.
• Pedestrian connections along key corridors between Red line stations and the Waterfrontlackwayfinding,consistent and accessible sidewalk connections and a hospitable walking environment. Bicycle connections to/from transit are inhibited by the lack of network continuity.
• Supplement bus access from Broadway and andrew Stations to the Waterfront, as definedabove.
• improve visibility, accessibility and walking connections from Broadway Station to a Street and d Street.
• Reopen dorchester avenue between West Second Street and Summer Street for all modes of travel.
• Complete bicycle network connections along a, d, and West Second and Third Streets.
18 South Boston Waterfront Sustainable Transportation Plan | Final Report www.sbwaterfrontmobility.org
ExEC
UTI
VE S
UM
MAR
yIssue/Need Immediate and Short-Term (0–3 yrs)
RecommendationsMid-Term (3–10 yrs) & Long-Term (10–20+ yrs) Recommendations for Consideration
ExPANd CoMMuNITy CoNNECTIoNS: LoCAL STREETS
Local Streets • maintaining a balance between vehicular mobility and protecting the adjacent South Boston neighborhood from cut through trafficisakeyobjectiveofthisplan.
• Reducing congestion along key South Boston corridors is critical to maintaining vehicular mobility for neighborhood residents and businesses.
• Calmingtrafficalongkeycorridors,likeDay Boulevard and l Street, improves pedestrian safety and makes these routes less desirable for commuters.
• Perform Roadway Safety audit (RSa) along day Boulevard.
• InstallnewtrafficsignalatDayBoulevard/L Street/Columbia Road and make pedestrian safety improvements.
• implement lane management, restriping, pedestrian, and signal improvements along the l Street corridor.
• UpgradetrafficsignalatAStreet/West Second Street.
• Extend melcher Street to West Service Road. • InstallnewtrafficsignalatAStreet/
Binford Street. • address local operations and pedestrian
safety at 8 South Boston neighborhood intersections along East/West Broadway, dorchester avenue, and Old Colony avenue.
• design and construct the Cypher Street extension from d Street to E Street and reconstruct and extend E Street from Cypher Street to Summer Street.
• implement corridor-level improvements along day Boulevard from i Street to Farragut Road and Columbia Road from g Street to i Street.
• Improveintersectiongeometryandtraffic control at the intersections of East/West First Street and East/West First Street at Pappas Way.
• monitor and periodically address intersection operations in the Waterfront and adjacent neighborhoods through signal technologyupgrades,timingmodifications, restriping, etc. improvements to maintain or enhance vehicular and freight mobility (every 2 to 3 years).
• Provide a new Summer Street north/south connection to both northern avenue/ Haul Road/drydock avenue and simplify access to the Boston marine industrial Park.
ExPANd CoMMuNITy CoNNECTIoNS: PEdESTRIAN ACCESS
Network Scale and Connections
• lack of network continuity, missing connections, and limited pedestrian-scalewayfindingsignageareprevalent throughout the district.
• Reducing block scale in applicable areas of the district, minimizing the width of streets andintersections,calmingtraffic,improving trafficcontrols,andengagingthelanduses between activity nodes are critical needs to improve the walkability of the South Boston Waterfront.
• design and implement pedestrian wayfindingsignageimprovementsfrom community gateways to and throughout the Waterfront.
• Completethepedestrianaccessandtraffic control improvements, including improving crosswalk visibility and accessibility at local intersectionsdefinedpreviously.
• improve pedestrian connections to/from Broadway Station.
• Complete design of multimodal accommodations along Summer Street and implement.
• Complete pedestrian enhancements along the d Street corridor.
• Consider several new above-grade pedestrian crossings over Track 61 and the South Boston Bypass Road to connect the BCEC to the Fort Point neighborhood.
• Consider a new pedestrian/bicycle bridge across the Fort Point Channel with the reopening of dorchester avenue.
• Improveaccessibilityandwayfindingfor persons with disabilities throughout the Waterfront as part of the City’s commitment to universal design and inclusion.
South Boston Waterfront Sustainable Transportation Plan | Final Report 19 www.sbwaterfrontmobility.org
ExEC
UTI
VE S
UM
MAR
y
Issue/Need Immediate and Short-Term (0–3 yrs) Recommendations
Mid-Term (3–10 yrs) & Long-Term (10–20+ yrs) Recommendations for Consideration
ExPANd CoMMuNITy CoNNECTIoNS: PEdESTRIAN ACCESS
Quality of Pedestrian Environment
• There are needs to both improve the street network and take advantage of paths, the Harborwalk, and private ways to improve the conditions for walking to the Waterfront from the neighborhoods.
• Several corridors offer major opportunities toaddressdeficienciesinthepedestrian connections to the community.
• Complete the Thomas Butler memorial Park incorporating a shared-use path.
• improve pedestrian accommodations from Pappas Way along East First Street to Thomas Butler memorial Park.
• as development and infrastructure projects present themselves, seek opportunities to engage land uses and provide pedestrian amenities along key pedestrian corridors that connect adjacent neighborhoods with the Waterfront.
• With roadway improvements planned at Summer Street/Pappas Way/Haul Road/ dydock avenue, complete pedestrian connection from the shared use path along Pappas Way to harbor at northern avenue.
ExPANd CoMMuNITy CoNNECTIoNS: BICyCLE CoNNECTIoNS
Network Continuity
• To facilitate and encourage bicycle travel, there is a need to complete the bicycle network with focused attention on continuous and quality accommodations along the major east/west and north/south area corridors.
• Complete/improve east-west connections along Seaport Boulevard, northern avenue, Summer Street, and East First, and West Second and Third Streets.
• Complete/improve north-south connections along a Street, d Street, and between Pappas Way and northern avenue.
• improve north-south connections by re-opening dorchester avenue with bicycle accommodations.
20 South Boston Waterfront Sustainable Transportation Plan | Final Report www.sbwaterfrontmobility.org
ExEC
UTI
VE S
UM
MAR
y
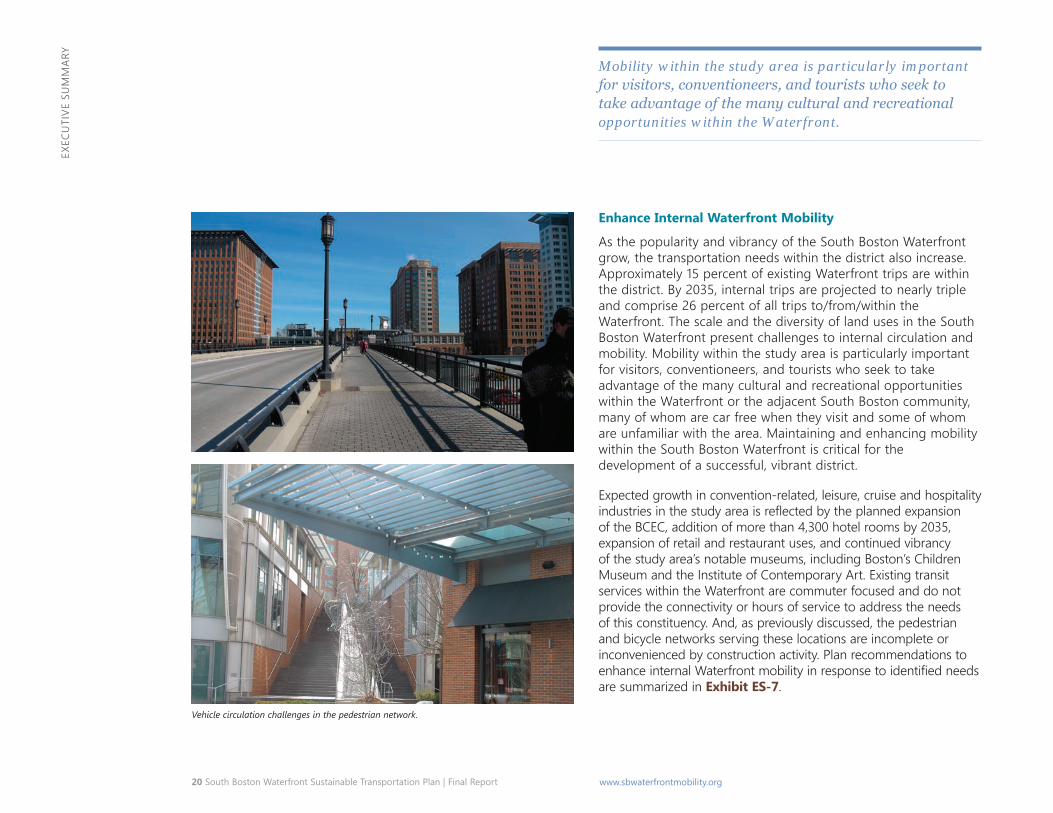
Vehicle circulation challenges in the pedestrian network.
Mobility within the study area is particularly important for visitors, conventioneers, and tourists who seek to take advantage of the many cultural and recreational opportunities within the Waterfront.
Enhance Internal Waterfront Mobility
As the popularity and vibrancy of the South Boston Waterfront grow, the transportation needs within the district also increase. Approximately 15 percent of existing Waterfront trips are within the district. By 2035, internal trips are projected to nearly triple and comprise 26 percent of all trips to/from/within the Waterfront. The scale and the diversity of land uses in the South Boston Waterfront present challenges to internal circulation and mobility. Mobility within the study area is particularly important for visitors, conventioneers, and tourists who seek to take advantage of the many cultural and recreational opportunities within the Waterfront or the adjacent South Boston community, many of whom are car free when they visit and some of whom are unfamiliar with the area. Maintaining and enhancing mobility within the South Boston Waterfront is critical for the development of a successful, vibrant district.
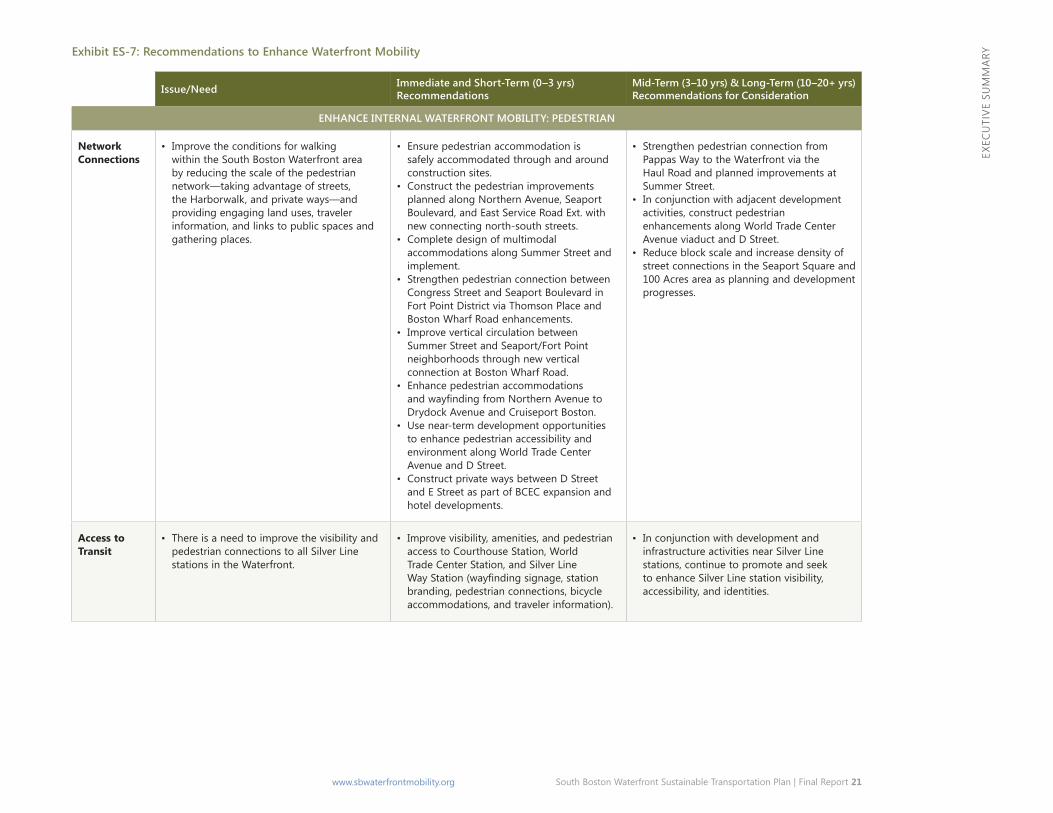
Expected growth in convention-related, leisure, cruise and hospitality industries in the study area is reflected by the planned expansion of the BCEC, addition of more than 4,300 hotel rooms by 2035, expansion of retail and restaurant uses, and continued vibrancy of the study area’s notable museums, including Boston’s Children Museum and the Institute of Contemporary Art. Existing transit services within the Waterfront are commuter focused and do not provide the connectivity or hours of service to address the needs of this constituency. And, as previously discussed, the pedestrian and bicycle networks serving these locations are incomplete or inconvenienced by construction activity. Plan recommendations to enhance internal Waterfront mobility in response to identified needs are summarized in Exhibit ES-7.
South Boston Waterfront Sustainable Transportation Plan | Final Report 21 www.sbwaterfrontmobility.org
ExEC
UTI
VE S
UM
MAR
yExhibit ES-7: Recommendations to Enhance Waterfront Mobility
Issue/Need Immediate and Short-Term (0–3 yrs) Recommendations
Mid-Term (3–10 yrs) & Long-Term (10–20+ yrs) Recommendations for Consideration
ENHANCE INTERNAL WATERFRoNT MoBILITy: PEdESTRIAN
Network Connections
• improve the conditions for walking within the South Boston Waterfront area by reducing the scale of the pedestrian network—taking advantage of streets, the Harborwalk, and private ways—and providing engaging land uses, traveler information, and links to public spaces and gathering places.
• Ensure pedestrian accommodation is safely accommodated through and around construction sites.
• Construct the pedestrian improvements planned along northern avenue, Seaport Boulevard, and East Service Road Ext. with new connecting north-south streets.
• Complete design of multimodal accommodations along Summer Street and implement.
• Strengthen pedestrian connection between Congress Street and Seaport Boulevard in Fort Point district via Thomson Place and Boston Wharf Road enhancements.
• improve vertical circulation between Summer Street and Seaport/Fort Point neighborhoods through new vertical connection at Boston Wharf Road.
• Enhance pedestrian accommodations andwayfindingfromNorthernAvenueto drydock avenue and Cruiseport Boston.
• use near-term development opportunities to enhance pedestrian accessibility and environment along World Trade Center avenue and d Street.
• Construct private ways between d Street and E Street as part of BCEC expansion and hotel developments.
• Strengthen pedestrian connection from Pappas Way to the Waterfront via the Haul Road and planned improvements at Summer Street.
• in conjunction with adjacent development activities, construct pedestrian enhancements along World Trade Center avenue viaduct and d Street.
• Reduce block scale and increase density of street connections in the Seaport Square and 100 acres area as planning and development progresses.
Access to Transit
• There is a need to improve the visibility and pedestrian connections to all Silver line stations in the Waterfront.
• improve visibility, amenities, and pedestrian access to Courthouse Station, World Trade Center Station, and Silver line WayStation(wayfindingsignage,station branding, pedestrian connections, bicycle accommodations, and traveler information).
• in conjunction with development and infrastructure activities near Silver line stations, continue to promote and seek to enhance Silver line station visibility, accessibility, and identities.
22 South Boston Waterfront Sustainable Transportation Plan | Final Report www.sbwaterfrontmobility.org
ExEC
UTI
VE S
UM
MAR
yIssue/Need Immediate and Short-Term (0–3 yrs)
RecommendationsMid-Term (3–10 yrs) & Long-Term (10–20+ yrs) Recommendations for Consideration
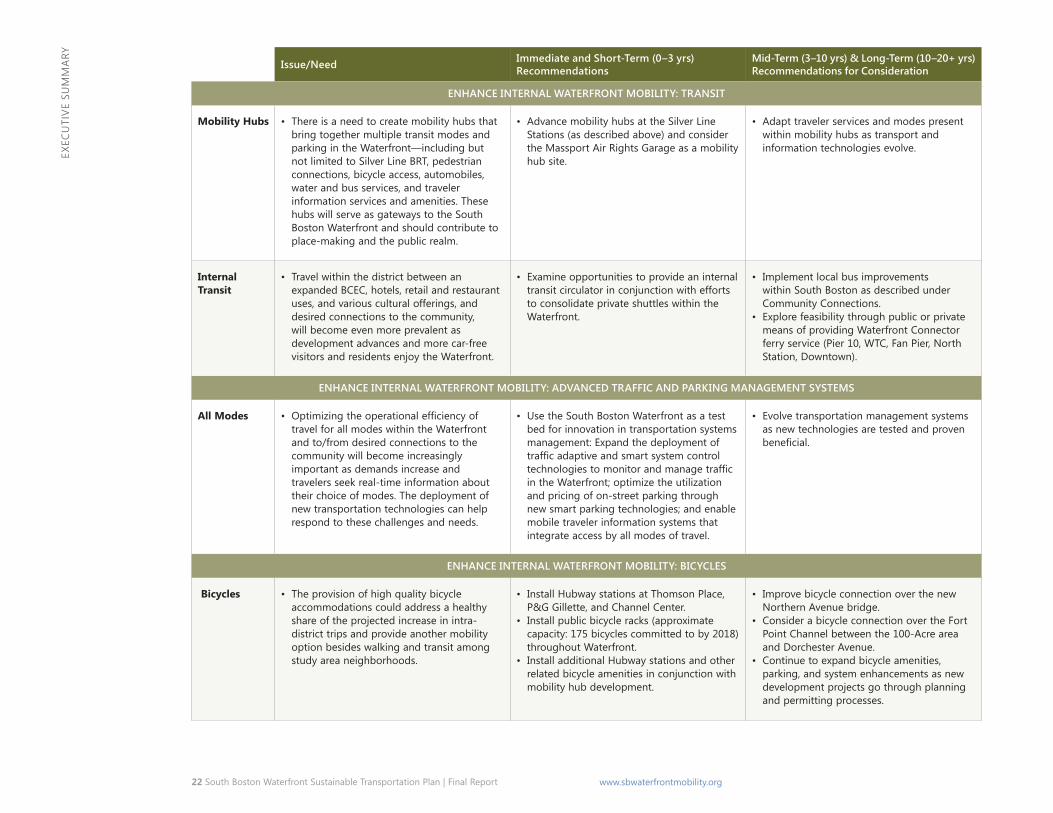
ENHANCE INTERNAL WATERFRoNT MoBILITy: TRANSIT
Mobility Hubs • There is a need to create mobility hubs that bring together multiple transit modes and parking in the Waterfront—including but not limited to Silver line BRT, pedestrian connections, bicycle access, automobiles, water and bus services, and traveler information services and amenities. These hubs will serve as gateways to the South Boston Waterfront and should contribute to place-making and the public realm.
• advance mobility hubs at the Silver line Stations (as described above) and consider the massport air Rights garage as a mobility hub site.
• adapt traveler services and modes present within mobility hubs as transport and information technologies evolve.
Internal Transit
• Travel within the district between an expanded BCEC, hotels, retail and restaurant uses, and various cultural offerings, and desired connections to the community, will become even more prevalent as development advances and more car-free visitors and residents enjoy the Waterfront.
• Examine opportunities to provide an internal transit circulator in conjunction with efforts to consolidate private shuttles within the Waterfront.
• implement local bus improvements within South Boston as described under Community Connections.
• Explore feasibility through public or private means of providing Waterfront Connector ferry service (Pier 10, WTC, Fan Pier, north Station, downtown).
ENHANCE INTERNAL WATERFRoNT MoBILITy: AdvANCEd TRAFFIC ANd PARkING MANAGEMENT SySTEMS
All Modes • Optimizingtheoperationalefficiencyof travel for all modes within the Waterfront and to/from desired connections to the community will become increasingly important as demands increase and travelers seek real-time information about their choice of modes. The deployment of new transportation technologies can help respond to these challenges and needs.
• use the South Boston Waterfront as a test bed for innovation in transportation systems management: Expand the deployment of trafficadaptiveandsmartsystemcontrol technologiestomonitorandmanagetraffic in the Waterfront; optimize the utilization and pricing of on-street parking through new smart parking technologies; and enable mobile traveler information systems that integrate access by all modes of travel.
• Evolve transportation management systems as new technologies are tested and proven beneficial.
ENHANCE INTERNAL WATERFRoNT MoBILITy: BICyCLES
Bicycles • The provision of high quality bicycle accommodations could address a healthy share of the projected increase in intra-district trips and provide another mobility option besides walking and transit among study area neighborhoods.
• install Hubway stations at Thomson Place, P&g gillette, and Channel Center.
• install public bicycle racks (approximate capacity: 175 bicycles committed to by 2018) throughout Waterfront.
• install additional Hubway stations and other related bicycle amenities in conjunction with mobility hub development.
• improve bicycle connection over the new northern avenue bridge.
• Consider a bicycle connection over the Fort Point Channel between the 100-acre area and dorchester avenue.
• Continue to expand bicycle amenities, parking, and system enhancements as new development projects go through planning and permitting processes.
South Boston Waterfront Sustainable Transportation Plan | Final Report 23 www.sbwaterfrontmobility.org
ExEC
UTI
VE S
UM
MAR
y
A primary goal is to create a high quality public realm that connects to Downtown Boston yet reflects the unique scale and emerging character of the South Boston Waterfront.
Advance Public Realm
City building within the South Boston Waterfront began in earnest two decades ago and continues to evolve today. The ultimate goal is to achieve a world-class live, work, play city within the City. It is important to reflect on how the mix of development, location of densities, changing patterns, planned projects, and quality of the public realm influence this goal today.
A primary goal is to create a high quality public realm that connects to Downtown Boston yet reflects the unique scale and emerging character of the South Boston Waterfront. The ‘public realm’ includes all aspects of the physical environment that are visible and accessible to the public —including str eets and sidewalks, parks and open spaces; greenways, promenades and bikeways; view corridors; and public transit. It also encompasses areas held in private ownership that are truly public in terms of their function, impact on the streetscape, or historic context.
The creation of the public realm in the Seaport involves expanding upon the existing street grid to provide the framework within which new development would be located.
This process involves a layering of elements, moving in degree from one level to the next: (1) an activated and publicly accessible waterfront, (2) a street and block plan that control development, (3) view corridors and pedestrian ways that bring people to the water, (4) Harborwalk and an open space network that connect different neighborhoods, (5) the creation of mixed use neighborhoods that would sustain themselves and bring 24 hour life to the district, and (6) the retention of a maritime industry.
Primary Public Realm Elements � An Integrated Street & Block Plan promoting the physical, visual
and functional integration of the South Boston Waterfront with Downtown and adjacent neighborhoods.
� Primary Streets: Three principal east/west streets (Summer Street, Congress Street, Seaport Boulevard) and continuous north/south streets.
� A network of smaller scale streets and open spaces to create an integrated, walkable district.
� Extended Harborwalk, activated Waterfront, and access to the water. � Special Places to anchor each neighborhood or sub-district
in the South Boston Waterfront and give them unique identity and sense of place.
� Reinforce view corridors to the water.
Implement Supportive Management Strategies and Policies
Enhancing existing policies related to overall transportation demand management (TDM), parking and traffic systems management (TSM), and establishing the organizational capacity to plan, implement, and monitor recommendations and outcomes will reinforce the immediate and long-term success of this Sustainable Transportation Plan.
Transportation Demand Management
The sponsoring agencies of this plan should continue to support educational, outreach, and regulatory programs that reduce the transportation impacts of development activity and/or reduce single occupant vehicle use for commuters. Considerations to affect these changes might include:
� TDM Ordinance – At the City and/or state level, consider adopting a parking and transportation demand management (PTDM) ordinance, similar to the model provided by the city of
24 South Boston Waterfront Sustainable Transportation Plan | Final Report www.sbwaterfrontmobility.org
ExEC
UTI
VE S
UM
MAR
y
Cambridge, to improve mobility and access, reduce congestion and air pollution, and increase safety by promoting walking, bicycling, public transit, carsharing, and other sustainable modes.
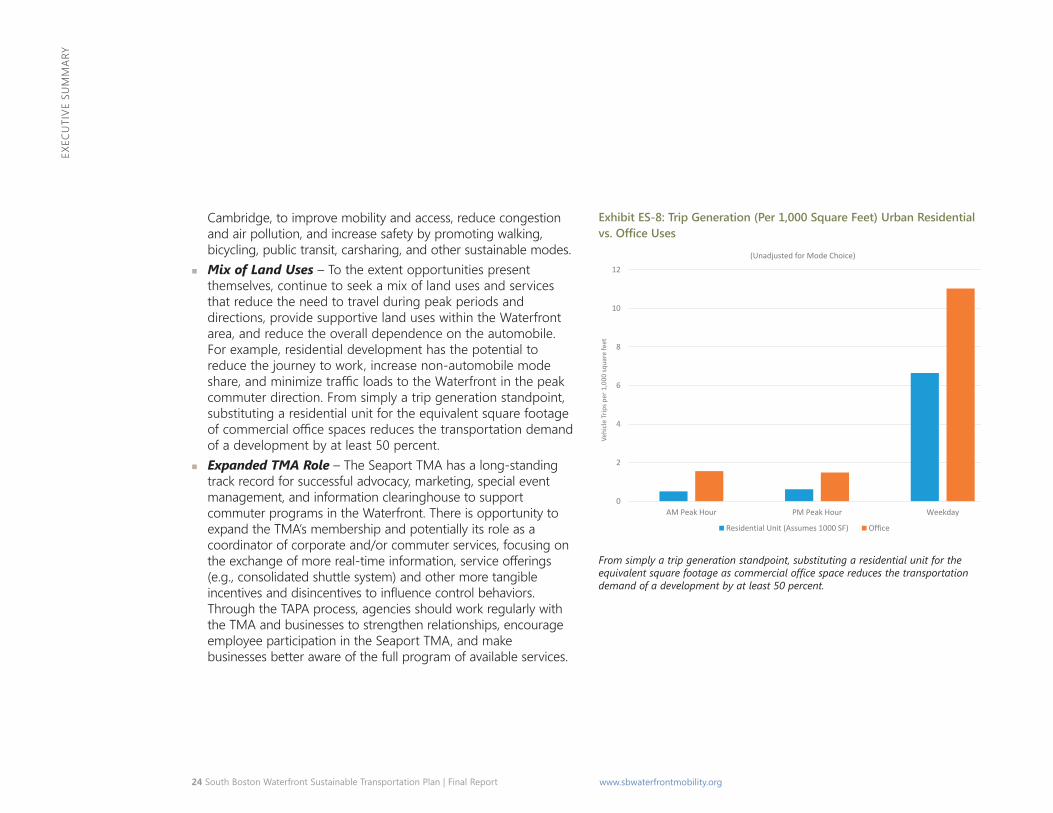
� Mix of Land Uses – To the extent opportunities present themselves, continue to seek a mix of land uses and services that reduce the need to travel during peak periods and directions, provide supportive land uses within the Waterfront area, and reduce the overall dependence on the automobile. For example, residential development has the potential to reduce the journey to work, increase non-automobile mode share, and minimize traffic loads to the Waterfront in the peak commuter direction. From simply a trip generation standpoint, substituting a residential unit for the equivalent square footage of commercial office spaces reduces the transportation demand of a development by at least 50 percent.
� Expanded TMA Role – The Seaport TMA has a long-standing track record for successful advocacy, marketing, special event management, and information clearinghouse to support commuter programs in the Waterfront. There is opportunity to expand the TMA’s membership and potentially its role as a coordinator of corporate and/or commuter services, focusing on the exchange of more real-time information, service offerings (e.g., consolidated shuttle system) and other more tangible incentives and disincentives to influence control behaviors. Through the TAPA process, agencies should work regularly with the TMA and businesses to strengthen relationships, encourage employee participation in the Seaport TMA, and make businesses better aware of the full program of available services.
Exhibit ES-8: Trip Generation (Per 1,000 Square Feet) urban Residential vs. Office Uses
From simply a trip generation standpoint, substituting a residential unit for the equivalent square footage as commercial office space reduces the transportation demand of a development by at least 50 percent.
0
2
4
6
8
10
12
AM Peak Hour PM Peak Hour Weekday
Vehi
cle
Trip
s per
1,0
00 sq
uare
feet
(Unadjusted for Mode Choice)
Residential Unit (Assumes 1000 SF) Office
Trip Generation (per 1000 square feet) for Urban Residential vs. Office Uses
South Boston Waterfront Sustainable Transportation Plan | Final Report 25 www.sbwaterfrontmobility.org
ExEC
UTI
VE S
UM
MAR
y
Transportation Systems Management (TSM)
Maximizing the efficiency of existing transportation systems is critically important to optimize areawide operations, reduce delays and traveler inconveniences, and contribute to the sustainability of the transportation resources in the Waterfront.
� Districtwide Shared Parking Management Strategy – Parking remains one of the most powerful and pervasive tools to influence travel demands and patterns, and the traffic impacts on area streets and highways. A districtwide parking management plan is needed to keep pace with near-term changes and issues associated with parking, as well as implement longer-term parking management strategies. Districtwide activities defined by this plan could include encouraging shared parking between compatible land uses (office and restaurant/cinema/cultural uses, etc.); wayfinding and real-time guidance systems to available parking and exiting garages for “best way” to interstate system; and demand based or performance based pricing. Shared-parking facilities can also reduce the amount of on-site parking needed for individual development projects in the district, thereby reducing development costs and keeping residential and commercial rents lower. Furthermore, by combining a centralized shared-parking facility with an excellent pedestrian network and a mobility hub (which could provide protected bicycle parking, electric vehicle charging stations, bikeshare and carshare parking spaces), travel demand within the district could shift from vehicle-oriented to more pedestrian- and bike-oriented. Thus, shared parking may simultaneously advance the Plan’s goals related to internal circulation and mobility, economic vitality, and public realm.
Candidate employer and landlord actions encouraged by this plan could include: limiting parking spaces on site and reduce or eliminate free parking; providing priority parking for bicycles, car-share vehicles, vanpools, and low/clean emissions vehicles; implementing Commuter Options programs, such as parking cash outs; parking reservation systems and demand based or congestion pricing; and unbundling the price of parking from leases. The Seaport TMA can assist employers who are members through a suite of programs currently offered to implement new incentive programs.
The Districtwide Parking Management Strategy also needs to address the protection of short-term, nearby, and appropriately priced parking for visitors to museums and cultural offerings in the Waterfront.
� Traffic Management – Use the South Boston Waterfront as a test bed for innovation in transportation systems management: expand the deployment of traffic adaptive and smart system control technologies to monitor and manage traffic in the Waterfront; optimize the utilization and pricing of on-street parking through new smart parking technologies; and enable mobile traveler information systems that integrate access by all modes of travel. Monitor and periodically address intersection operations in the Waterfront and adjacent neighborhoods through signal technology upgrades, timing modifications, restriping, etc., improvements to maintain or enhance vehicular and freight mobility (every 2 to 3 years).
� Coordinated Traffic Management and Enforcement – Consistent enforcement and coordination among multiple traffic control jurisdictions are critical to ensuring safe and efficient traffic management at all times.
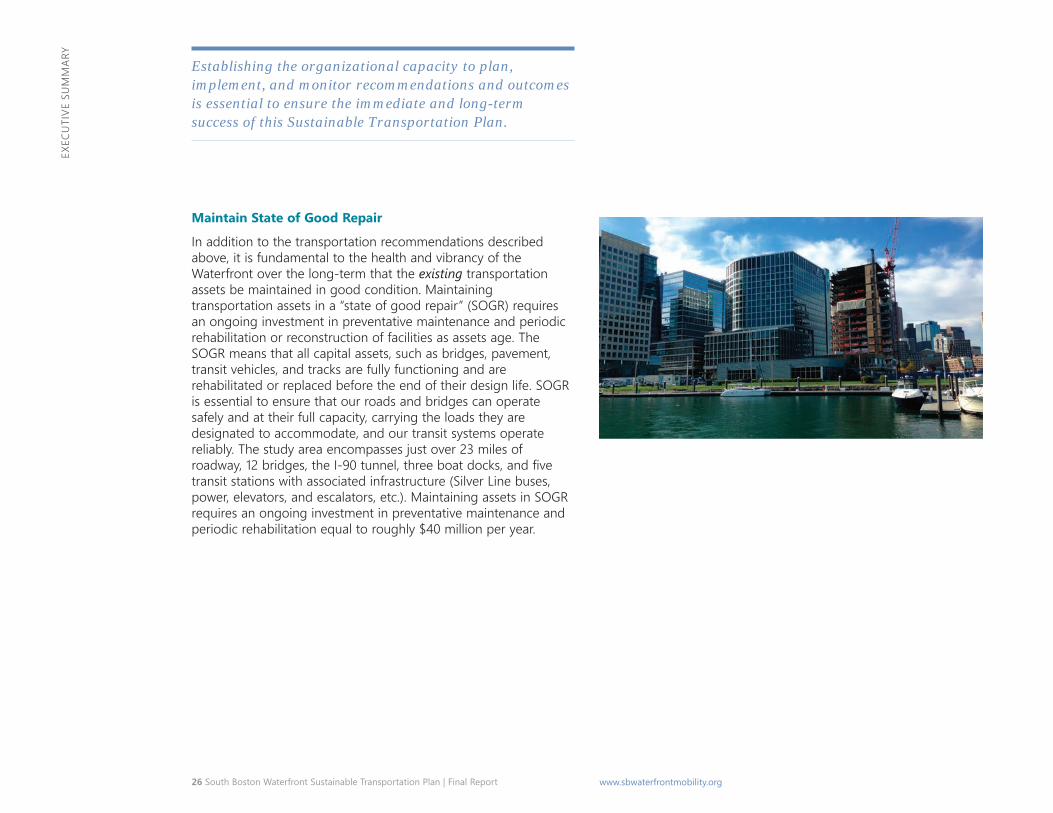
26 South Boston Waterfront Sustainable Transportation Plan | Final Report www.sbwaterfrontmobility.org
ExEC
UTI
VE S
UM
MAR
yEstablishing the organizational capacity to plan, implement, and monitor recommendations and outcomes is essential to ensure the immediate and long-term success of this Sustainable Transportation Plan.
Maintain State of Good Repair
In addition to the transportation recommendations described above, it is fundamental to the health and vibrancy of the Waterfront over the long-term that the existing transportation assets be maintained in good condition. Maintaining transportation assets in a “state of good repair” (SOGR) requires an ongoing investment in preventative maintenance and periodic rehabilitation or reconstruction of facilities as assets age. The SOGR means that all capital assets, such as bridges, pavement, transit vehicles, and tracks are fully functioning and are rehabilitated or replaced before the end of their design life. SOGR is essential to ensure that our roads and bridges can operate safely and at their full capacity, carrying the loads they are designated to accommodate, and our transit systems operate reliably. The study area encompasses just over 23 miles of roadway, 12 bridges, the I-90 tunnel, three boat docks, and five transit stations with associated infrastructure (Silver Line buses, power, elevators, and escalators, etc.). Maintaining assets in SOGR requires an ongoing investment in preventative maintenance and periodic rehabilitation equal to roughly $40 million per year.
South Boston Waterfront Sustainable Transportation Plan | Final Report 27 www.sbwaterfrontmobility.org
ExEC
UTI
VE S
UM
MAR
y
Plan Implementation and Next Steps The completion of this Sustainable Transportation Plan with its articulated goals, objectives, and recommendations, marks the first step towards fulfilling the long-term vision for the South Boston Waterfront. Implementing the Plan will begin with its endorsement by sponsoring agencies. Refining Plan recommendations, defining a prioritization and finance plan that supports the phased implementation of these recommendations, advocating for and executing the improvements, and monitoring progress requires a consistent, committed, and cooperative interagency structure.
A critical next step in turning this sustainable transportation plan into action and realizing improvements in transportation and mobility is establishing the organizational structure and capacity to implement the Plan. This structure would provide timely review and decision-making for project development, funding, and implementation, as well as focus on issues such as:
� Implement a series of immediate improvements within the next six months to alleviate congestion.
� Advocating for funding and public-private partnerships for the design, construction, and maintenance of the South Boston Waterfront Sustainable Transportation Plan.
� Establishing important near and long-term considerations in planning for resiliency in the South Boston Waterfront.
� Articulating a more sequential phasing plan that reinforces transportation improvements and placemaking strategies for the District.
� Ensuring that the current infrastructure is adequately funded to be maintained in a state of good repair.
� Incorporating state of the practice management strategies and routine operational improvements to optimize transportation systems efficiencies and interoperability.
� Ensuring a coordinated, comprehensive, and tested emergency response plan is in place for the Waterfront.
� Educating and informing the diverse stakeholders regularly on initiatives, procedures, and responsibilities.
Immediate (within 6 months) Actions: � Consolidate private shuttles � Signal priority for Silver Line at D Street � Silver Line real time arrival information � Design 1-93 access improvements at Purchase Street � Geometric improvements to D Street on ramp to I-90 � Initiate construction of streetscape, circulation, pedestrian and
bicycle enhancements on Northern Avenue and East Service Road, including new north-south connecting streets
� Pilot expanded use of South Boston Bypass Road: � From Richards to West Service Road (full access, 24/7) � From I-93 to Richards Street (eastbound only, AM peak)
� Pilot access for all vehicles on northbound HOV from I-93 to TWT � Pedestrian enhancements at Seaport Park (by private developer) � Local pedestrian and intersection improvements (3 to 5 locations) � New Hubway stations � Determine process for developing bicycle accommodations � D Street Circuit Breaker community process � Improved traffic and parking enforcement � Implement new technology for on-street short term parking � Massport Dedicated Freight Corridor and Thomas J. Butler
Memorial Park under construction � Continued review of circulation changes within the Waterfront
and BMIP
28 South Boston Waterfront Sustainable Transportation Plan | Final Report www.sbwaterfrontmobility.org
INTR
OD
UCT
ION
INTRODUCTION The South Boston Waterfront is the fastest growing urban area in the Commonwealth. Between 2000 and 2013, approximately 10 million square feet of development were built, adding more than 4,100 new residents and 7,700 jobs. Furthermore, in 2013, the Boston Convention & Exhibition Center (opened in 2004), Institute of Contemporary Art (opened in 2006), Cruiseport Boston, World Trade Center, and other conference, cultural, and recreational venues attracted more than 3.4 million visitors to the Waterfront. Over the next two decades, another 17 million square feet are underway or planned—including 5,300 new residences, 6 million square feet of new office and research space, continued investment in port and maritime-related uses, and more than a doubling of convention and hospitality space.
It has been almost 15 years since completion of the South Boston Transportation Plan (2000)—a comprehensive review of the Waterfront and its short, medium, and long-term transportation needs. It is time to take stock of what has been accomplished and set the course for the next 20 years; hence, the need for this South Boston Waterfront Sustainable Transportation Plan (“the Plan”). Addressing current mobility deficiencies and planning for long-term Waterfront growth is vital to building a vibrant community within the City of Boston and maximizing its potential to unlock economic opportunities for the Commonwealth. To accomplish this vision, there must be sustained coordination and collaboration among Waterfront stakeholders through the execution of the Plan.
The Sustainable Transportation Plan is both a strategic plan— providing a blueprint for the transportation system improvements over a 20 year planning horizon—and an action plan defining more immediate strategies to address existing transportation and
mobility issues, capacity constraints, transit, pedestrian and bicycle needs, and operational enhancements. Recommendations are subject to further review, planning, and programming as part of other state and federally mandated transportation and environmental processes.
The Plan is organized into six sections:
Introduction: Establishes the Vision, Goals, and Objectives of the Plan and the study and impact areas; outlines the state and local policies that shaped Plan development; and summarizes the planning process including public engagement.
Looking Back: Reviews the transformation of the Waterfront from 2000 to today (since the last transportation plan was completed).
South Boston Waterfront Today: Discusses the rich mix of land uses in the district today; evaluates current multimodal access and mobility to and within the district; and provides public realm context.
South Boston Waterfront Tomorrow: Develops 2035 and Build-out land use conditions in the Waterfront; forecasts future transportation demands; and, assesses future multimodal access and mobility conditions absent further infrastructure investments.
Waterfront Issues, Needs, and Opportunities: Compiles and organizes the results of the existing and future evaluations and public input into five themes: improve regional access; expand community connections; address internal circulation and mobility; enhance public realm; and plan for resiliency.
Recommendations: Discusses the development and evaluation of discrete alternatives and presents a series of immediate, short, medium, and long-term recommendations to enhance multimodal access and mobility to, from, and within the Waterfront; improve
South Boston Waterfront Sustainable Transportation Plan | Final Report 29 www.sbwaterfrontmobility.org
INTR
OD
UCT
ION
the public realm; implement supportive management strategies and policies; and, maintain transportation infrastructure in a state of good repair.
The Sustainable Transportation Plan seeks to realize the full transformation of the South Boston Waterfront into a distinct and vibrant neighborhood within the City of Boston.
Vision, Goals, and Objectives Building upon the successes of Boston’s waterfront redevelopment to date and shaping the next two decades of growth and investment require a fresh examination of the long-term vision for the South Boston Waterfront and establishing a new set of aspirational transportation goals and objectives.
Vision
The Sustainable Transportation Plan seeks to realize the full transformation of the South Boston Waterfront into a distinct and vibrant neighborhood within the City of Boston. A neighborhood that:
� Supports a broad cross-section of the region’s economic drivers: � Traditional maritime and industrial trades � Innovative economy/incubator businesses � Financial, legal, and technology sectors � Convention and tourism business and related-services � Arts and culture
� Provides residential space and quality of life for a diversity of Boston’s residents.
� Is a world-renowned, memorable, and accessible destination for tourists, conventioneers, and other visitors, alike.
Goals and Objectives
There is broad consensus that a Sustainable Transportation Plan that supports the 21st Century South Boston Waterfront area, defines and prioritizes transportation system investments,
influences people’s travel behaviors, and improves the public realm is needed to unleash the full potential of this area and achieve the vision. This Plan seeks to:
Improve Access and Mobility for All – Improve multimodal access to/from/through and within the South Boston Waterfront for residents, workers, maritime-related commerce, and visitors.
� Enhance the capacity, safety, security, and accessibility of the transportation system for all users.
� Improve the transit, water transportation, pedestrian, and bicycle systems to equitably serve the diversity of constituents within the South Boston Waterfront and effect a shift to more sustainable modes of transportation.
� Seek to appropriately allocate the limited roadway rights-of-way to minimize delays for people and goods movement.
� Effectively integrate new technologies for traffic, parking, and transit management to improve operations and inform users to support good travel choices and improve the overall customer experience.
Support Economic Growth and Vitality – Deliver the transportation infrastructure needed to support a world-class economy.
� Provide connectivity and multimodal transportation capacity to maximize growth and development opportunities within the South Boston Waterfront area.
� Ensure a future transportation system that works to support commuters and commercial/service-related traffic.
� Manage assets wisely: constantly improve and maintain the condition of the transportation infrastructure required to serve the South Boston Waterfront.
30 South Boston Waterfront Sustainable Transportation Plan | Final Report www.sbwaterfrontmobility.org
INTR
OD
UCT
ION
Reinforce Sustainable Policies and Programs – Align programs and policies to support more sustainable transportation choices and demand management to and within the South Boston Waterfront.
� Advance transportation demand management, technologies, commuter mobility programs, and land/water use policies that foster a less car-dependent lifestyle in emerging neighborhoods.
� Use “best practices” in sustainable and smart transportation planning and design to develop Complete Streets and green infrastructure to accommodate all users, provide universal access, manage storm water, conserve energy, address seasonality, and improve resiliency of the transportation system.
� Take care to protect and preserve adjacent residential neighborhoods from negative impacts associated with the anticipated growth in transportation demands to/from the South Boston Waterfront.
Enhance the Public Realm – Contribute to enhancing the attractiveness and quality of the urban character through ongoing transportation investment.
� Engage the live, work, and play spaces with the waterfront and the City through improved pedestrian connections, view corridors, lively gathering spots, and enhanced public places.
� Use “Complete Streets” as a means to restructure, redesign and redistribute public spaces.
� Provide strategies to strengthen the identity of the overall Waterfront neighborhood and the great destinations/places within the neighborhood for residents, employees, and visitors.
Contribute Environmental and Health Benefits – Realize the positive environmental effects and health benefits that result from a more sustainable transportation plan.
� Reduce air and noise pollution, greenhouse gas emissions, and energy consumption.
� Use the sustainable urban mobility recommendations of this plan to advance the environmental, green, and climate change initiatives of its proponents.
� Provide options that enable access to key destinations and services by healthy transportation modes.
Invest Smartly for the Future – Advance strategic investment in the South Boston Waterfront to ensure the long-term financial and operational sustainability of its transportation system.
� Improve the identification and prioritization of capital, operations, and maintenance projects to address short, medium, and long term needs.
� Leverage regional, community, and public/private partnerships to help finance improvements.
� Establish organizational capacity to design, implement, and monitor the plan recommendations.
Study and Impact Area The area known as the South Boston Waterfront is located southeast of Downtown Boston and across the Inner Harbor from East Boston (Exhibit 1). The area that comprises the South Boston Waterfront is bound by East and West First Streets to the south, Boston Harbor to the east, and the Fort Point Channel area to the west, as shown in Exhibit 2 within the orange boundary. Because the area cannot be studied in isolation, the Plan further considers the impact area surrounding the Waterfront and outlined in blue.
The attractiveness of the South Boston Waterfront is in large part due to its strategic location abutting historic Boston Harbor, adjacent to Boston’s financial district and Logan International Airport, and at the nexus of two major interstate highways (I-90 and I-93). It also features the largest supply of centrally located, undeveloped land in the City of Boston and is home to an active, growing industrial port.
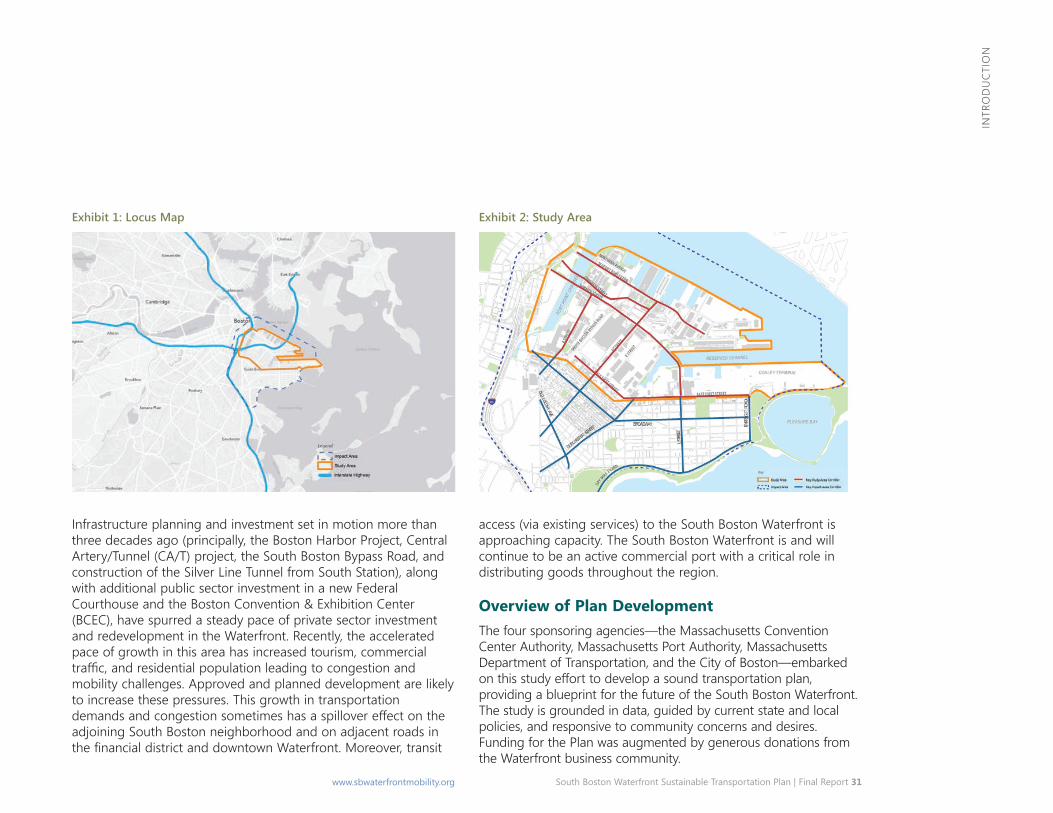
South Boston Waterfront Sustainable Transportation Plan | Final Report 31 www.sbwaterfrontmobility.org
INTR
OD
UCT
ION
Exhibit 1: Locus Map
Infrastructure planning and investment set in motion more than three decades ago (principally, the Boston Harbor Project, Central Artery/Tunnel (CA/T) project, the South Boston Bypass Road, and construction of the Silver Line Tunnel from South Station), along with additional public sector investment in a new Federal Courthouse and the Boston Convention & Exhibition Center (BCEC), have spurred a steady pace of private sector investment and redevelopment in the Waterfront. Recently, the accelerated pace of growth in this area has increased tourism, commercial traffic, and residential population leading to congestion and mobility challenges. Approved and planned development are likely to increase these pressures. This growth in transportation demands and congestion sometimes has a spillover effect on the adjoining South Boston neighborhood and on adjacent roads in the financial district and downtown Waterfront. Moreover, transit
access (via existing services) to the South Boston Waterfront is approaching capacity. The South Boston Waterfront is and will continue to be an active commercial port with a critical role in distributing goods throughout the region.
Exhibit 2: Study Area
Overview of Plan Development The four sponsoring agencies—the Massachusetts Convention Center Authority, Massachusetts Port Authority, Massachusetts Department of Transportation, and the City of Boston—embarked on this study effort to develop a sound transportation plan, providing a blueprint for the future of the South Boston Waterfront. The study is grounded in data, guided by current state and local policies, and responsive to community concerns and desires. Funding for the Plan was augmented by generous donations from the Waterfront business community.
32 South Boston Waterfront Sustainable Transportation Plan | Final Report www.sbwaterfrontmobility.org
INTR
OD
UCT
ION
The team engaged in a comprehensive planning process to formulate this Plan.
State and Local Policies Shaping Plan Development Key Policy Guidance
There are a number of important policies that provided guidance to the development and screening of alternatives as part of this Sustainable Transportation Plan and, more importantly, influenced the formation of Plan recommendations. These policies, organized by the Goals of the Plan, include:
Goal 1: Improve Access and Mobility for All
MassDOT weMove Massachusetts (2013), Healthy Communities Directive (2013), and GreenDOT Policy Directive (2010) and Implementation Plan (2012)
� Makes public and employee safety the top priority. � Emphasizes preserving existing capital facilities in a state of
good repair. � Ensures all projects incorporate healthy transportation options
(walking, bicycling, and transit), as appropriate. � Prioritizes decisions that balance the needs of users, support
healthy communities, underpin a strong economy, and contribute to our quality of life.
� Supports Complete Streets projects. � Seeks to triple the miles traveled by healthy modes.
Boston Complete Streets Guidelines (2013)
� Provides guidelines on how to design streets for pedestrians of all ages and abilities, bicyclists, transit users and motor vehicle drivers.
� Places pedestrians, bicyclists, and transit users on equal footing with motor vehicles users in the allocation of space within the right-of-way.
� Emphasizes use of technologies to better manage existing infrastructure, support use of alternative modes, and provide real-time traveler information.
Recently, the accelerated pace of growth in the Waterfront has increased tourism, commercial traffic, and residential population leading to congestion and mobility challenges.
Goal 2: Support Economic Growth and Vitality
MassDOT weMove Massachusetts (2013), Healthy Communities Directive (2013), and GreenDOT Policy Directive (2010) and Implementation Plan (2012)
� Underscores the role of transportation to create jobs, grow our economy, and support economic activity.
� Supports smart growth development. � Responds to evolving customer needs (age, geographies, and
economic conditions).
Boston Complete Streets Guidelines (2013)
� Advocates for “great streets” to engage the live, work, and play spaces and contribute to the character of neighborhoods.
� Emphasizes context in street design. � Highlights features to activate sidewalks, improve aesthetics,
and provide for user amenities. � Encourages “mobility hubs” to facilitate multimodal travel and
provide traveler information.
Goal 3: Reinforce Sustainable Policies and Programs
MassDOT weMove Massachusetts (2013), Healthy Communities Directive (2013), and GreenDOT Policy Directive (2010) and Implementation Plan (2012)
� Ensures all projects incorporate healthy transportation options (walking, bicycling, and transit), as appropriate.
South Boston Waterfront Sustainable Transportation Plan | Final Report 33 www.sbwaterfrontmobility.org
INTR
OD
UCT
ION
� Prioritizes decisions that balance the needs of users, support healthy communities, underpin a strong economy, and contribute to our quality of life.
� Seeks to triple the miles traveled by healthy modes. � Calls on transportation investments to contribute to statewide
greenhouse gas emissions reduction goals. � Calls for adapting facilities for climate change resilience.
MA DEP Rideshare Regulation requires larger businesses and academic institutions to develop plans and set goals to reduce commuter drive alone trips by 25%.
MA Global Warming Solutions Act (2008) requires all sectors of the economy to reach a target of a 25% reduction of Greenhouse Gas (GHG) emissions by 2020 and an 80% reduction by 2050.
A Climate of Progress: City of Boston Climate Action Plan Update (2011)
� Adopted greenhouse gas reduction goals of 25% by 2020 and 80% by 2050 below 2005 levels.
� Calls for reducing vehicle miles traveled by 7.5% below 2010 levels.
Goal 4: Enhance the Public Realm
Boston Complete Streets Guidelines (2013)
� Advocates for “great streets” to engage the live, work, and play spaces and contribute to the character of neighborhoods.
� Emphasizes context in street design. � Highlights features to activate sidewalks, improve aesthetics,
and provide for user amenities. � Encourages “mobility hubs” to facilitate multimodal travel and
provide traveler information.
Goal 5: Contribute Environmental and Health Benefits
National Environmental Policy Act (NEPA)
� Safeguards the environment in conjunction with federal investments to improve transportation.
Massachusetts Environmental Policy Act (MEPA)
� Safeguards the environment in conjunction with state and private sector infrastructure and development activities.
GreenDOT Policy Directive (2010) and Implementation Plan (2012)
� Reinforces transportation investments as a means to improve statewide air quality, consume less energy, and reduce reliance on fossil fuels.
� Promotes healthy transportation and livable communities: � Increase delivery of Complete Streets projects � Increase bicycle parking and access to transit � Increase total miles and connectivity of pedestrian and
bicycle facilities � Improve traffic controls to reduce vehicle emissions and
support walking and biking � Improve transit system performance � Expand commuter options programs � Promote transit oriented development
� Improves ecological function of water systems related to transportation: � Minimize impacts to wetlands, enhance wetlands, and
address impaired waters � Minimize impacts of rights-of-way and bridges on
fluvial processes
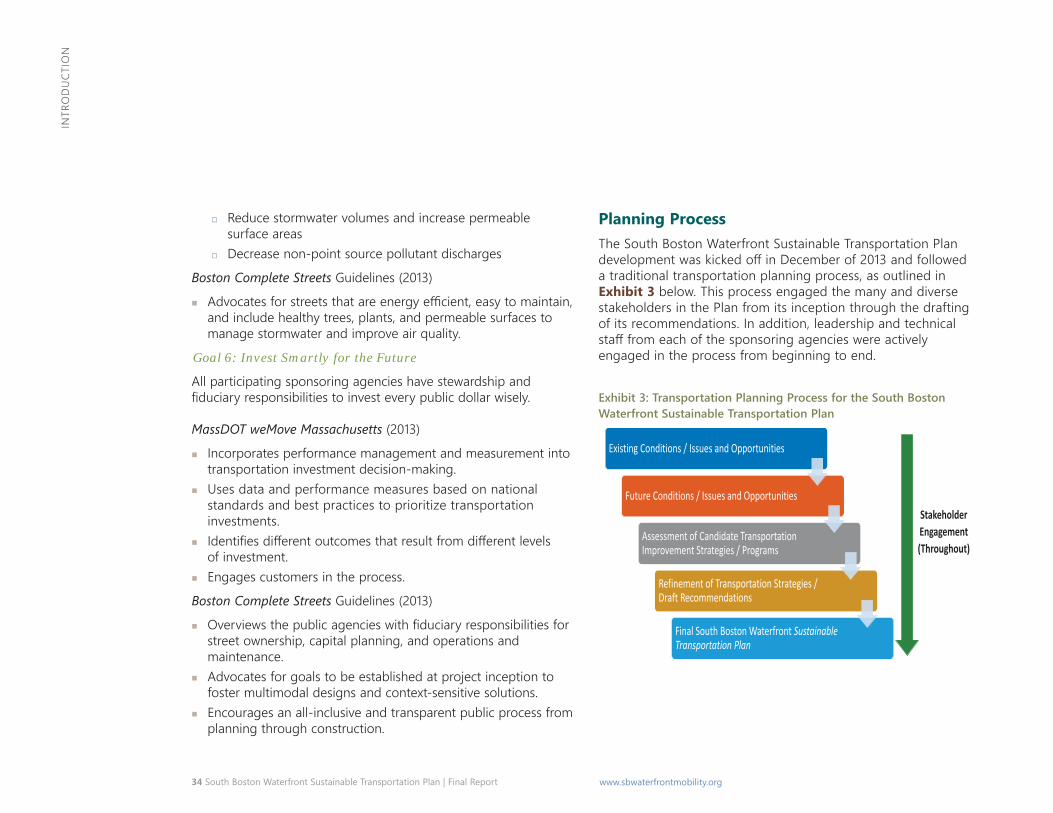
34 South Boston Waterfront Sustainable Transportation Plan | Final Report www.sbwaterfrontmobility.org
INTR
OD
UCT
ION
� Reduce stormwater volumes and increase permeable surface areas
� Decrease non-point source pollutant discharges
Boston Complete Streets Guidelines (2013)
� Advocates for streets that are energy efficient, easy to maintain, and include healthy trees, plants, and permeable surfaces to manage stormwater and improve air quality.
Goal 6: Invest Smartly for the Future
All participating sponsoring agencies have stewardship and fiduciary responsibilities to invest every public dollar wisely.
MassDOT weMove Massachusetts (2013)
� Incorporates performance management and measurement into transportation investment decision-making.
� Uses data and performance measures based on national standards and best practices to prioritize transportation investments.
� Identifies different outcomes that result from different levels of investment.
� Engages customers in the process.
Boston Complete Streets Guidelines (2013)
� Overviews the public agencies with fiduciary responsibilities for street ownership, capital planning, and operations and maintenance.
� Advocates for goals to be established at project inception to foster multimodal designs and context-sensitive solutions.
� Encourages an all-inclusive and transparent public process from planning through construction.
Planning Process The South Boston Waterfront Sustainable Transportation Plan development was kicked off in December of 2013 and followed a traditional transportation planning process, as outlined in Exhibit 3 below. This process engaged the many and diverse stakeholders in the Plan from its inception through the drafting of its recommendations. In addition, leadership and technical staff from each of the sponsoring agencies were actively engaged in the process from beginning to end.
Exhibit 3: Transportation Planning Process for the South Boston Waterfront Sustainable Transportation Plan
Existing Conditions / Issues and Opportunities
Future Conditions / Issues and Opportunities
Assessment of Candidate Transportation Improvement Strategies / Programs
Refinement of Transportation Strategies / Draft Recommendations
Final South Boston Waterfront Sustainable Transportation Plan
Stakeholder Engagement (Throughout)
South Boston Waterfront Sustainable Transportation Plan | Final Report 35 www.sbwaterfrontmobility.org
INTR
OD
UCT
ION
The Plan development was managed by A Better City and was overseen by a Steering Committee (SC) comprised of senior leadership from each of the sponsoring agencies. The Steering Committee met monthly over the 12-month planning process. In addition, an Interagency Working Group (IWG) was established at the outset of this initiative to guide the technical elements of Plan development. The IWG met weekly over the course of planning process to share information, review all technical documents, and provide direct input on plan alternatives and recommendations. Most importantly, the IWG helped foster interagency cooperation and consensus on the study findings.
Public Engagement A major component of this study involved stakeholder engagement guided by a comprehensive Public Involvement Plan (PIP) developed as part of the first task. The planning team initiated public dialogue early in the planning process to acknowledge the issues and opportunities facing the South Boston Waterfront, and involve many communities of interest, including residents; employers and employees; maritime and industrial businesses; agencies; advocacy groups; neighborhood associations; convention and hospitality groups; cultural centers; and the public. The effort was supported by generous donations from area businesses. Briefings with local officials and the current and former Mayors of Boston also occurred at key points throughout the project timeline. In brainstorming possible futures, discussions with interested stakeholders focused on issues and priorities as they relate to:
� Transit enhancements � Pedestrian and bicycle improvements � Livability and quality of life � Traffic management, travel routes, safety and parking � Safe and attractive streets—serving as great places for all
The framing of study area and neighborhood transportation issues, opportunities, and needs evolved from a thorough review of data and the compilation of concerns and desired outcomes identified by key project stakeholders.
The framing of study area and neighborhood transportation issues, opportunities, and needs evolved from a thorough review of data and the compilation of concerns and desired outcomes identified by key project stakeholders. Next, the agencies and the planning team mapped the transportation issues and needs to candidate solutions or strategies. The candidate strategies were then analyzed—under the framework provided by the Vision, Goals and Objectives of the Plan—vetted within the agencies and with the public, and screened to determine the most promising options for incorporation into plan recommendations.
Public input was solicited through individual outreach meetings and broad community gatherings. In total, more than 50 outreach meetings were held over the 12-month planning process, garnering input from hundreds of individuals. Local outreach meetings held at key stages in the study process were targeted meetings with key stakeholders to discuss specific issues and the viability of solutions. An online survey (available in four languages) was distributed to visitor and tourism employees. The planning team developed and frequently updated a project website to keep stakeholders apprised of plan progress and solicit their feedback. Team members were also available for briefings with participant and advocacy organizations, neighborhood groups, and business organizations, as requested. Midway through the plan development, the planning team and sponsoring agencies held a “Futures Technical Session” that drew upon transportation, land use, and economic experts to overview trends and innovations in transportation throughout the U.S. and Europe that may have application in Boston.
Five public meetings were also held to solicit broader input to the study:
� One at the outset of plan development to overview the process and solicit input on transportation issues, needs, and opportunities for improvements.
36 South Boston Waterfront Sustainable Transportation Plan | Final Report www.sbwaterfrontmobility.org
INTR
OD
UCT
ION
� Two midway through the study to overview existing and future conditions and preview alternatives under consideration.
� Two toward the end of the planning process to present the draft plan recommendations.
Each public informational meeting was held in an accessible meeting room, and conducted in the early evenings to accommodate work schedules and to encourage attendance. These meetings were publicized extensively and scheduled well in advance to provide early notice to the public. Review comments were solicited from the public at meetings and via emails and the website.
Progress During Plan Development Over the past year and during the development of this Plan, each sponsoring agency was able to progress immediate improvements (or begin planning or design of longer-term improvements) to the transportation system in the Waterfront in response to identified needs. Improvements completed include:
� City of Boston: � “Don’t Block the Box” striping at key intersections � Restriping Moakley Bridge � Installation of “Time to Destination” variable message boards � Signal improvements (including retiming) � Pilot of smart parking technologies using on-street sensors
and Parker App � Richards Street/A Street Improvements � New Hubway Stations at Watermark and Channel Center
� MassDOT/MBTA: � Peak period service improvements to #7 Bus
Updated route maps on Silver Line
� Massport: � Pappas Way upgrade
� Massachusetts Convention Center Authority: � Installation of new open space at “Lawn on D”
Additional improvements currently underway include:
� City of Boston: � Installation of an additional 175 bicycle parking spaces in
the Waterfront � Planning/design for new water service from Fan Pier to
North Station and East Boston � Design of Summer Street CrossRoads improvements � Installation of temporary wayfinding signage to the Institute
of Contemporary Arts (ICA) � Design of Northern Avenue/Seaport Boulevard/East Service
Drive improvements � MassDOT/MBTA
� Overhaul of Silver Line vehicles � Real time arrival departure information on Silver Line
� Massport: � Construction of the Thomas Butler Dedicated Freight Corridor
with new traffic signal at the Summer Street intersection � Massachusetts Convention Center Authority:
� D Street improvements to enhance multimodal accommodations
� Seaport TMA: � Facilitating review of shuttle consolidation � Traffic construction advisories (to TMA members)
South Boston Waterfront Sustainable Transportation Plan | Final Report 37 www.sbwaterfrontmobility.org
LOO
KIN
G BA
CK
LOOKING BACK In July 2000, the City of Boston released the 2000 South Boston Transportation Study, a planning study that documented a vision for the South Boston Waterfront on the heels of the CA/T project. The 2000 study goals were to:
� Protect the residential neighborhood � Preserve the working port and industrial land uses � Support appropriate development
Much has changed in the almost 15 years since the 2000 Plan was published, both in terms of the Waterfront’s development and in the transportation system that serves it (Exhibit 4).
Status of Recommendations of 2000 Study Exhibit 5 presents the status of the recommended actions from the 2000 Study. We have also evolved as to how we plan for transportation needs (i.e., encouraging the use of high occupant vehicle transportation modes, improving access for pedestrians and bicycles, a growing desire to transition to a live-work culture, and the transportation tools and technologies available today). The changes are significant enough to commence a new look at the Waterfront and shape new recommendations moving forward.
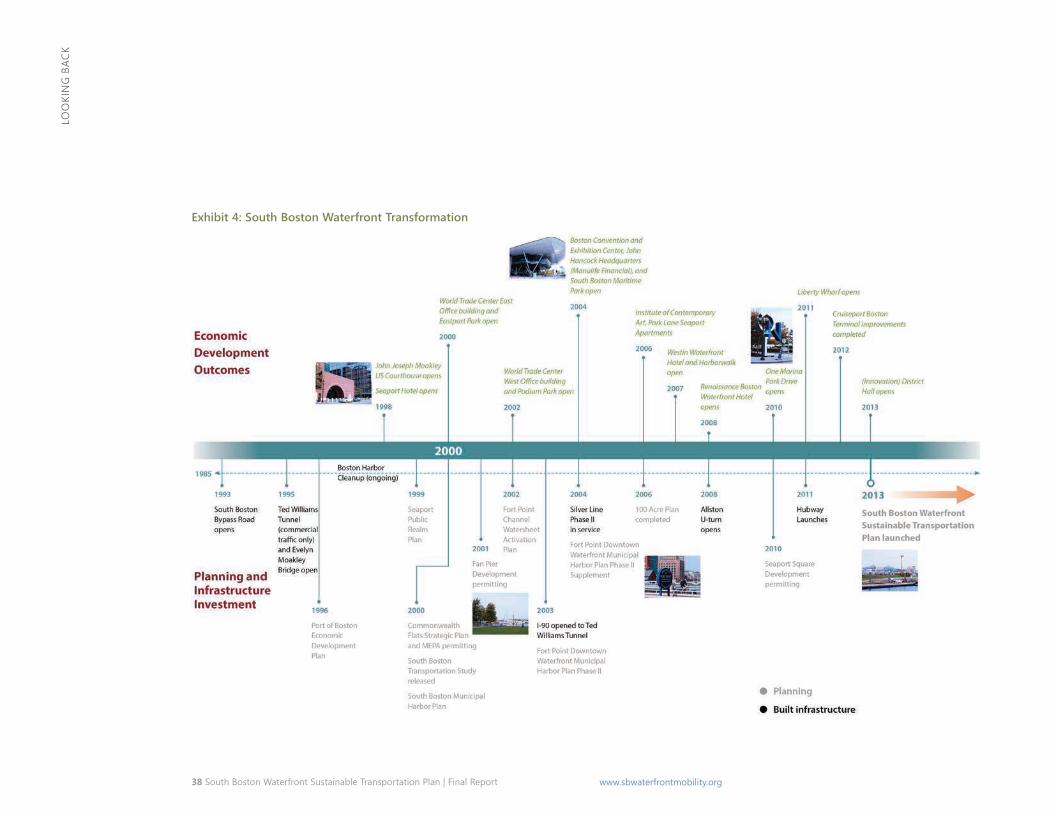
38 South Boston Waterfront Sustainable Transportation Plan | Final Report www.sbwaterfrontmobility.org
LOO
KIN
G BA
CK
Exhibit 4: South Boston Waterfront Transformation
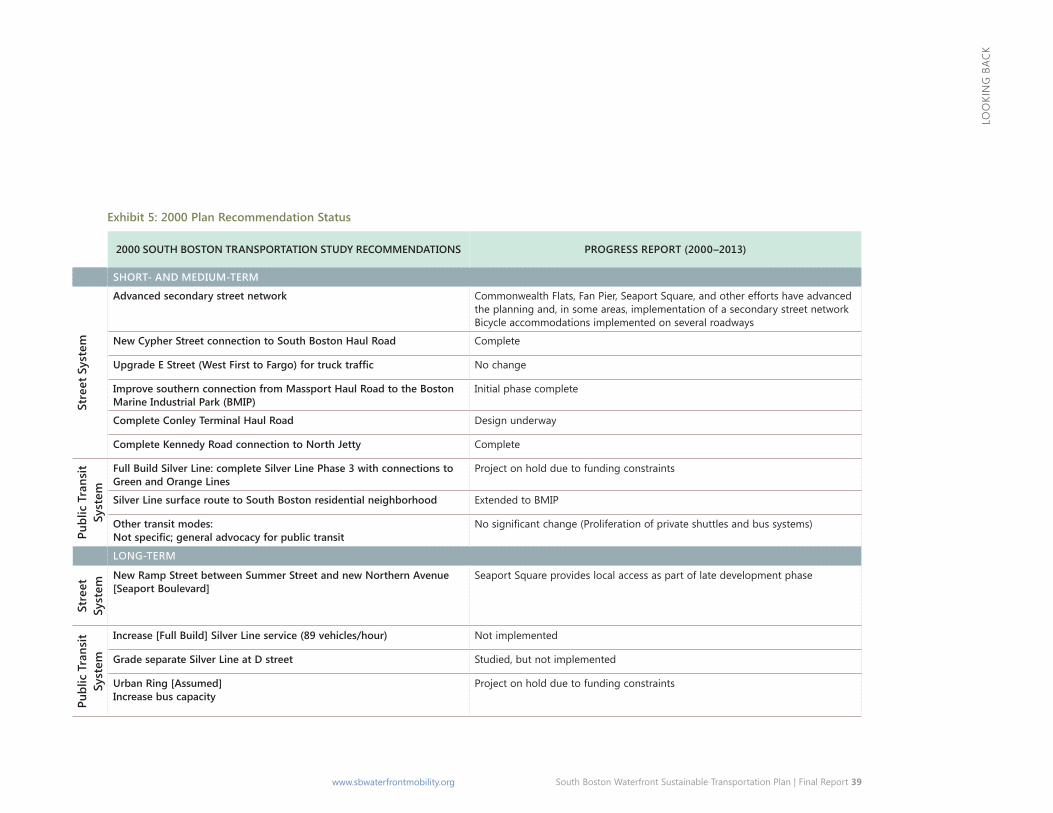
South Boston Waterfront Sustainable Transportation Plan | Final Report 39 www.sbwaterfrontmobility.org
LOO
KIN
G BA
CK
Exhibit 5: 2000 plan recommendation Status
2000 SouTh BoSTon TranSporTaTion STudy rEcommEndaTionS progrESS rEporT (2000–2013)
ShorT- and mEdium-TErm
Stre
et S
yste
m
advanced secondary street network Commonwealth Flats, Fan Pier, Seaport Square, and other efforts have advanced the planning and, in some areas, implementation of a secondary street network Bicycle accommodations implemented on several roadways
new cypher Street connection to South Boston haul road Complete
Upgrade E Street (West First to Fargo) for truck traffic No change
improve southern connection from massport haul road to the Boston marine industrial park (Bmip)
Initial phase complete
complete conley Terminal haul road Design underway
complete Kennedy road connection to north Jetty Complete
publ
ic T
rans
it Sy
stem
Full Build Silver Line: complete Silver Line phase 3 with connections to green and orange Lines
Project on hold due to funding constraints
Silver Line surface route to South Boston residential neighborhood Extended to BMIP
other transit modes: Not specific; general advocacy for public transit
No significant change (Proliferation of private shuttles and bus systems)
Long-term
Stre
et
Syst
em new ramp Street between Summer Street and new northern avenue
[Seaport Boulevard] Seaport Square provides local access as part of late development phase
publ
ic T
rans
it Sy
stem
increase [Full Build] Silver Line service (89 vehicles/hour) Not implemented
grade separate Silver Line at d street Studied, but not implemented
urban ring [assumed] increase bus capacity
Project on hold due to funding constraints
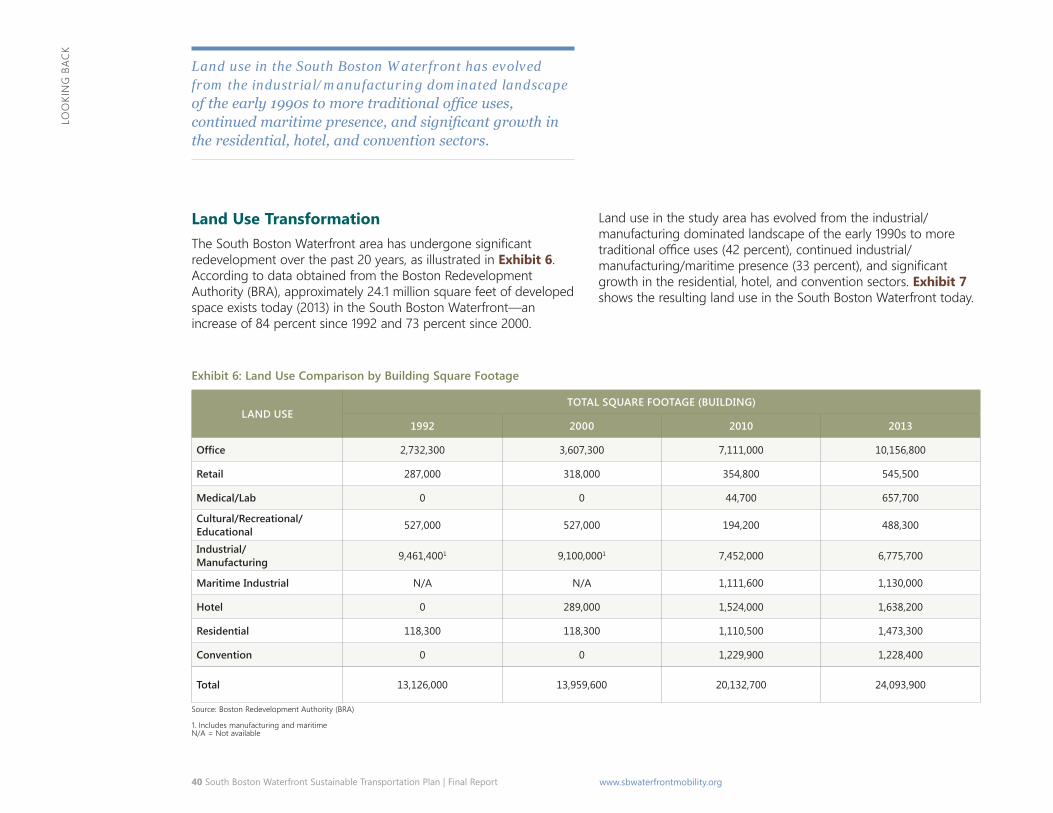
40 South Boston Waterfront Sustainable Transportation Plan | Final Report www.sbwaterfrontmobility.org
LOO
KIN
G BA
CKLand use in the South Boston Waterfront has evolved from the industrial/manufacturing dominated landscape of the early 1990s to more traditional office uses, continued maritime presence, and significant growth in the residential, hotel, and convention sectors.
Land Use Transformation The South Boston Waterfront area has undergone significant redevelopment over the past 20 years, as illustrated in Exhibit 6. According to data obtained from the Boston Redevelopment Authority (BRA), approximately 24.1 million square feet of developed space exists today (2013) in the South Boston Waterfront—an increase of 84 percent since 1992 and 73 percent since 2000.
Land use in the study area has evolved from the industrial/ manufacturing dominated landscape of the early 1990s to more traditional office uses (42 percent), continued industrial/ manufacturing/maritime presence (33 percent), and significant growth in the residential, hotel, and convention sectors. Exhibit 7 shows the resulting land use in the South Boston Waterfront today.
Exhibit 6: Land use comparison by Building Square Footage
Land uSE ToTaL SquarE FooTagE (BuiLding)
1992 2000 2010 2013
Office 2,732,300 3,607,300 7,111,000 10,156,800
retail 287,000 318,000 354,800 545,500
medical/Lab 0 0 44,700 657,700
cultural/recreational/ Educational 527,000 527,000 194,200 488,300
industrial/ manufacturing 9,461,4001 9,100,0001 7,452,000 6,775,700
maritime industrial N/A N/A 1,111,600 1,130,000
hotel 0 289,000 1,524,000 1,638,200
residential 118,300 118,300 1,110,500 1,473,300
convention 0 0 1,229,900 1,228,400
Total 13,126,000 13,959,600 20,132,700 24,093,900
1. Includes manufacturing and maritime
Source: Boston Redevelopment Authority (BRA)
N/A = Not available
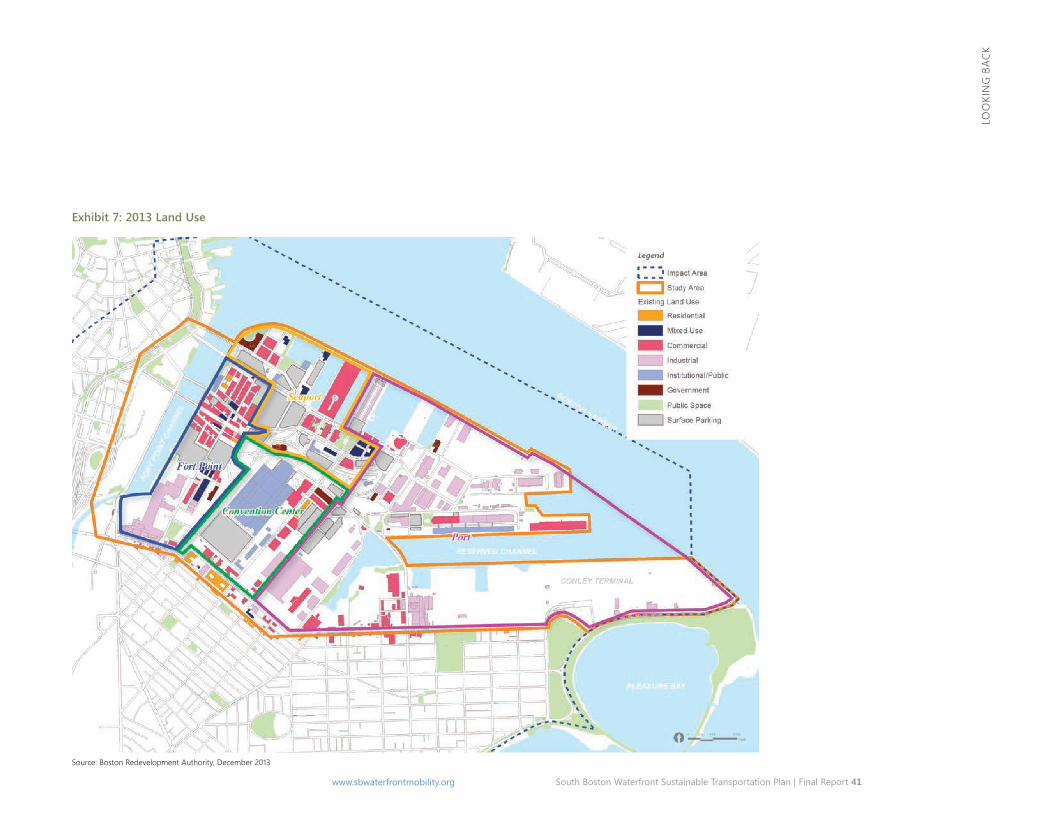
South Boston Waterfront Sustainable Transportation Plan | Final Report 41 www.sbwaterfrontmobility.org
LOO
KIN
G BA
CK
Exhibit 7: 2013 Land use
Source: Boston Redevelopment Authority, December 2013
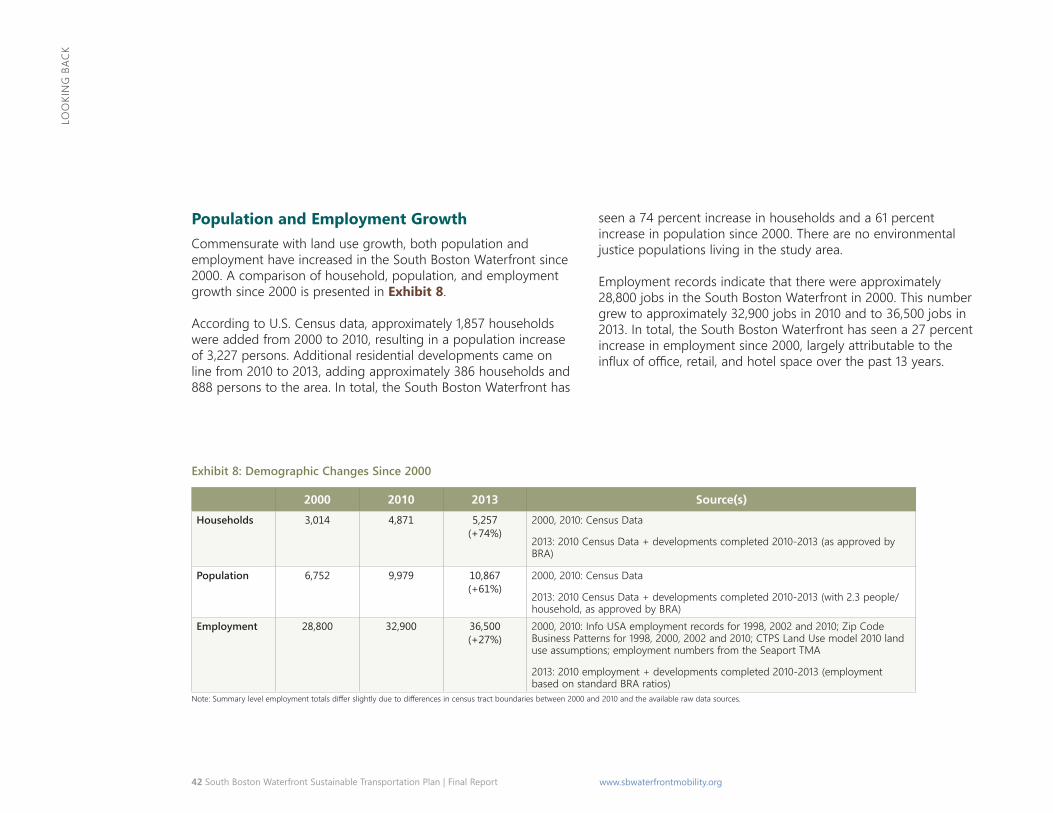
42 South Boston Waterfront Sustainable Transportation Plan | Final Report www.sbwaterfrontmobility.org
LOO
KIN
G BA
CK
Population and Employment Growth Commensurate with land use growth, both population and employment have increased in the South Boston Waterfront since 2000. A comparison of household, population, and employment growth since 2000 is presented in Exhibit 8.
According to U.S. Census data, approximately 1,857 households were added from 2000 to 2010, resulting in a population increase of 3,227 persons. Additional residential developments came on line from 2010 to 2013, adding approximately 386 households and 888 persons to the area. In total, the South Boston Waterfront has
seen a 74 percent increase in households and a 61 percent increase in population since 2000. There are no environmental justice populations living in the study area.
Employment records indicate that there were approximately 28,800 jobs in the South Boston Waterfront in 2000. This number grew to approximately 32,900 jobs in 2010 and to 36,500 jobs in 2013. In total, the South Boston Waterfront has seen a 27 percent increase in employment since 2000, largely attributable to the influx of office, retail, and hotel space over the past 13 years.
Exhibit 8: demographic changes Since 2000
2000 2010 2013 Source(s)
households 3,014 4,871 5,257 (+74%)
2000, 2010: Census Data
2013: 2010 Census Data + developments completed 2010-2013 (as approved by BRA)
population 6,752 9,979 10,867 (+61%)
2000, 2010: Census Data
2013: 2010 Census Data + developments completed 2010-2013 (with 2.3 people/ household, as approved by BRA)
Employment 28,800 32,900 36,500 (+27%)
2000, 2010: Info USA employment records for 1998, 2002 and 2010; Zip Code Business Patterns for 1998, 2000, 2002 and 2010; CTPS Land Use model 2010 land use assumptions; employment numbers from the Seaport TMA
2013: 2010 employment + developments completed 2010-2013 (employment based on standard BRA ratios)
Note: Summary level employment totals differ slightly due to differences in census tract boundaries between 2000 and 2010 and the available raw data sources.
South Boston Waterfront Sustainable Transportation Plan | Final Report 43www.sbwaterfrontmobility.org
Sou
th B
oSt
oN
wat
erfr
oN
t to
DaY
SouTh BoSToN WaTeRFRoNT ToDaY the South Boston waterfront has a rich mix of land uses and serves a diverse set of residents, employees, visitors, and convention attendees; each has a specific set of transportation access needs. the following sections explore the characteristics of these groups and their transportation needs.
Live Here The South Boston Waterfront has seen significant residential development over the past 15 years and today is home to 10,867 residents. as shown in Exhibit 9, denser residential areas are evolving in the district in the Seaport/fan Pier area, in the world trade Center area, and in the fort Point area.
Waterfront Residents
the South Boston waterfront housing stock has trended towards micro-unit (approximately 400 square feet), studio, one- and two-bedroom apartments and condominiums with robust on-site amenities such as fitness centers, media rooms, and outdoor common spaces. This evolving neighborhood differs from the traditional South Boston residential neighborhood to the south, which is predominantly composed of single- and multi-family homes on larger lots.
the composition of households in the South Boston waterfront speaks to the population type residing in the area—namely young professionals who are single and without dependents. according to census data, approximately 37 percent of South Boston waterfront
households are families while the remaining 63 percent are categorized as non-family households. about 15 percent of households in the district include people under the age of 18 (i.e., dependents). By way of comparison, approximately 46 percent of households in the City of Boston contain families and 20 percent include people under the age of 18. this trend is also evident in the age distribution in the South Boston waterfront with 44 percent of district residents between the ages of 25 and 40 (as compared with 27 percent in the age range for other areas of Boston).
The South Boston Waterfront has a rich mix of land uses and serves a diverse set of residents, employees, visitors, and convention attendees; each has a specific set of transportation access needs.
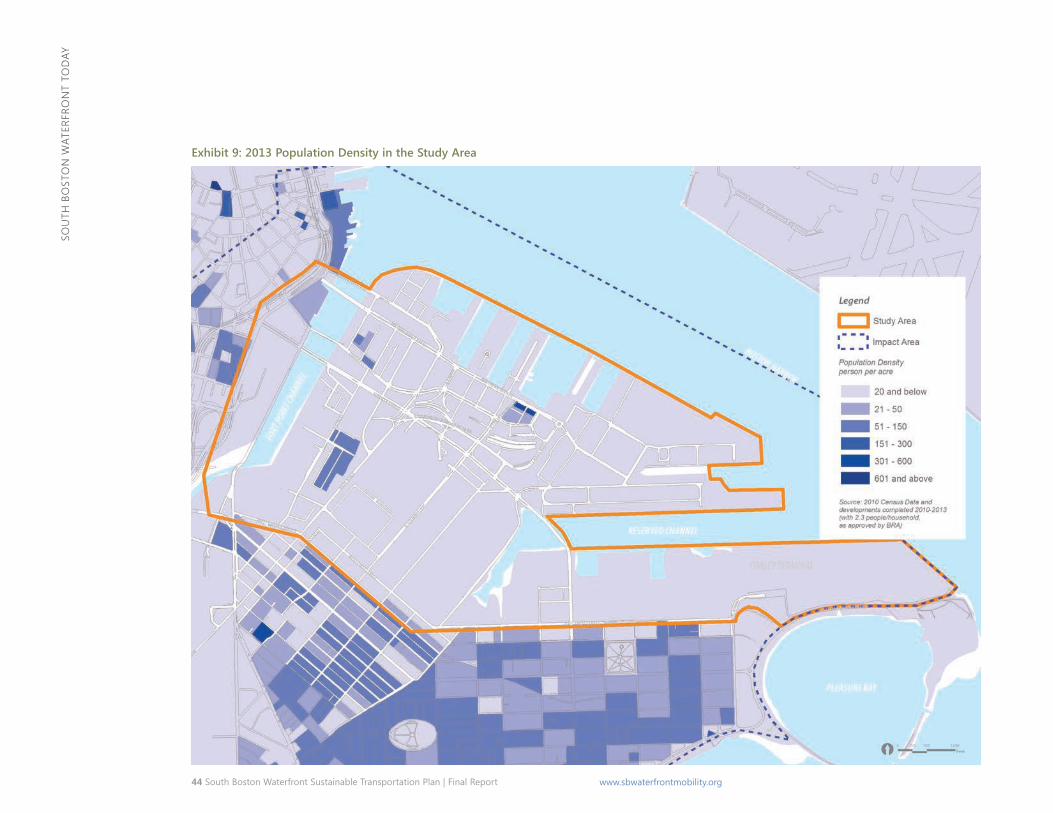
44 South Boston Waterfront Sustainable Transportation Plan | Final Report www.sbwaterfrontmobility.org
Sou
th B
oSt
oN
wat
erfr
oN
t to
DaY
Exhibit 9: 2013 Population Density in the Study Area
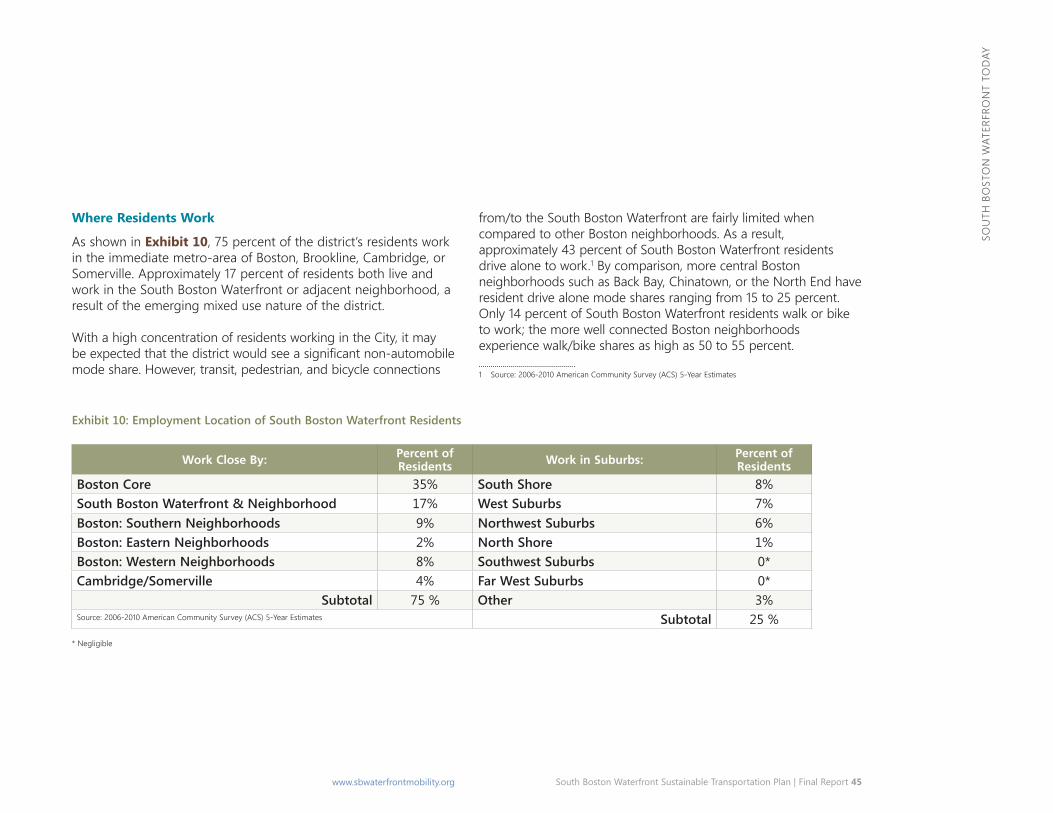
South Boston Waterfront Sustainable Transportation Plan | Final Report 45www.sbwaterfrontmobility.org
Sou
th B
oSt
oN
wat
erfr
oN
t to
DaY
Where Residents Work
as shown in Exhibit 10, 75 percent of the district’s residents work in the immediate metro-area of Boston, Brookline, Cambridge, or Somerville. approximately 17 percent of residents both live and work in the South Boston waterfront or adjacent neighborhood, a result of the emerging mixed use nature of the district.
with a high concentration of residents working in the City, it may be expected that the district would see a significant non-automobile mode share. however, transit, pedestrian, and bicycle connections
from/to the South Boston waterfront are fairly limited when compared to other Boston neighborhoods. as a result, approximately 43 percent of South Boston waterfront residents drive alone to work.1 By comparison, more central Boston neighborhoods such as Back Bay, Chinatown, or the North end have resident drive alone mode shares ranging from 15 to 25 percent. only 14 percent of South Boston waterfront residents walk or bike to work; the more well connected Boston neighborhoods experience walk/bike shares as high as 50 to 55 percent.
1 Source: 2006-2010 american Community Survey (aCS) 5-Year estimates
Exhibit 10: Employment Location of South Boston Waterfront Residents
Work Close By: Percent of Residents
Boston Core 35% South Boston Waterfront & Neighborhood 17% Boston: Southern Neighborhoods 9% Boston: Eastern Neighborhoods 2% Boston: Western Neighborhoods 8% Cambridge/Somerville 4%
Subtotal 75 %
Work in Suburbs: Percent of Residents
South Shore 8% West Suburbs 7% Northwest Suburbs 6% North Shore 1% Southwest Suburbs 0*Far West Suburbs 0*Other 3%
Subtotal 25 %
* Negligible
Source: 2006-2010 american Community Survey (aCS) 5-Year estimates
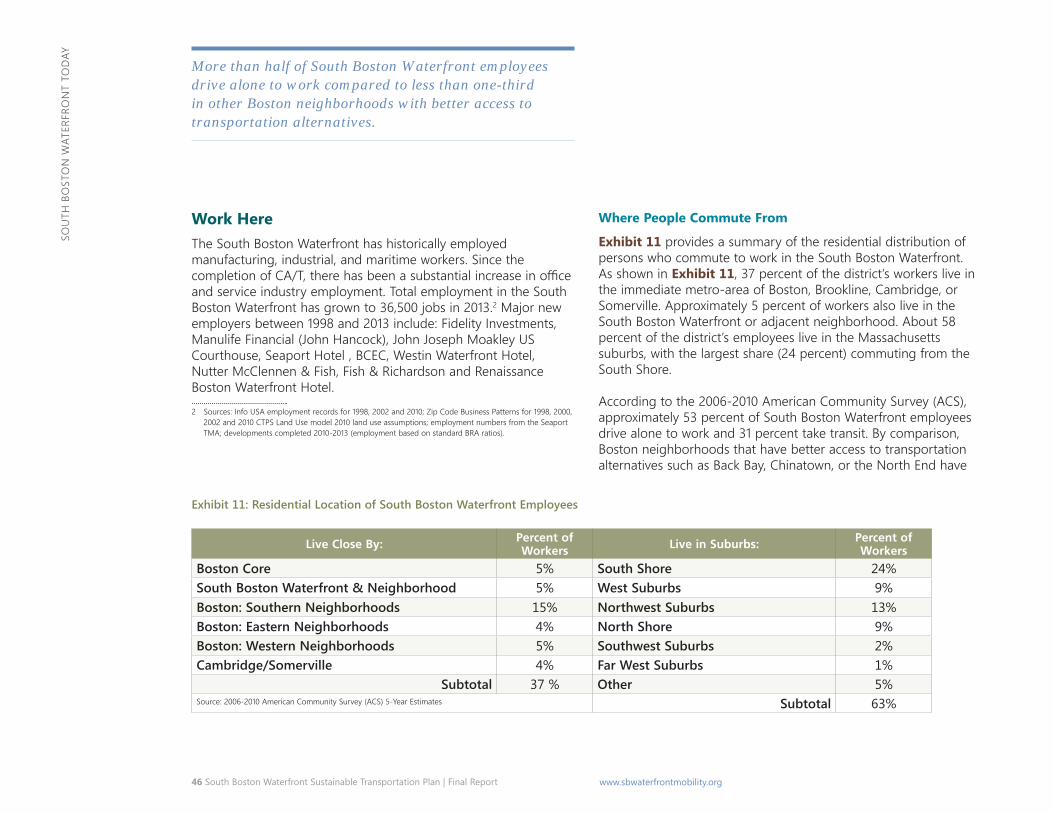
46 South Boston Waterfront Sustainable Transportation Plan | Final Report www.sbwaterfrontmobility.org
Sou
th B
oSt
oN
wat
erfr
oN
t to
DaY
More than half of South Boston Waterfront employees drive alone to work compared to less than one-third in other Boston neighborhoods with better access to transportation alternatives.
Work Here the South Boston waterfront has historically employed manufacturing, industrial, and maritime workers. Since the completion of CA/T, there has been a substantial increase in office and service industry employment. total employment in the South Boston waterfront has grown to 36,500 jobs in 2013.2 Major new employers between 1998 and 2013 include: fidelity Investments, Manulife financial (John hancock), John Joseph Moakley uS Courthouse, Seaport hotel , BCeC, westin waterfront hotel, Nutter McClennen & fish, fish & richardson and renaissance Boston waterfront hotel. 2 Sources: Info uSa employment records for 1998, 2002 and 2010; Zip Code Business Patterns for 1998, 2000,
2002 and 2010 CtPS Land use model 2010 land use assumptions; employment numbers from the Seaport tMa; developments completed 2010-2013 (employment based on standard Bra ratios).
Where People Commute From
Exhibit 11 provides a summary of the residential distribution of persons who commute to work in the South Boston waterfront. as shown in Exhibit 11, 37 percent of the district’s workers live in the immediate metro-area of Boston, Brookline, Cambridge, or Somerville. approximately 5 percent of workers also live in the South Boston waterfront or adjacent neighborhood. about 58 percent of the district’s employees live in the Massachusetts suburbs, with the largest share (24 percent) commuting from the South Shore.
according to the 2006-2010 american Community Survey (aCS), approximately 53 percent of South Boston waterfront employees drive alone to work and 31 percent take transit. By comparison, Boston neighborhoods that have better access to transportation alternatives such as Back Bay, Chinatown, or the North end have
Exhibit 11: Residential Location of South Boston Waterfront Employees
Live Close By: Percent of Workers
Boston Core 5% South Boston Waterfront & Neighborhood 5% Boston: Southern Neighborhoods 15% Boston: Eastern Neighborhoods 4% Boston: Western Neighborhoods 5% Cambridge/Somerville 4%
Subtotal 37 %
Live in Suburbs: Percent of Workers
South Shore 24% West Suburbs 9% Northwest Suburbs 13% North Shore 9% Southwest Suburbs 2% Far West Suburbs 1% Other 5%
Subtotal 63%Source: 2006-2010 american Community Survey (aCS) 5-Year estimates
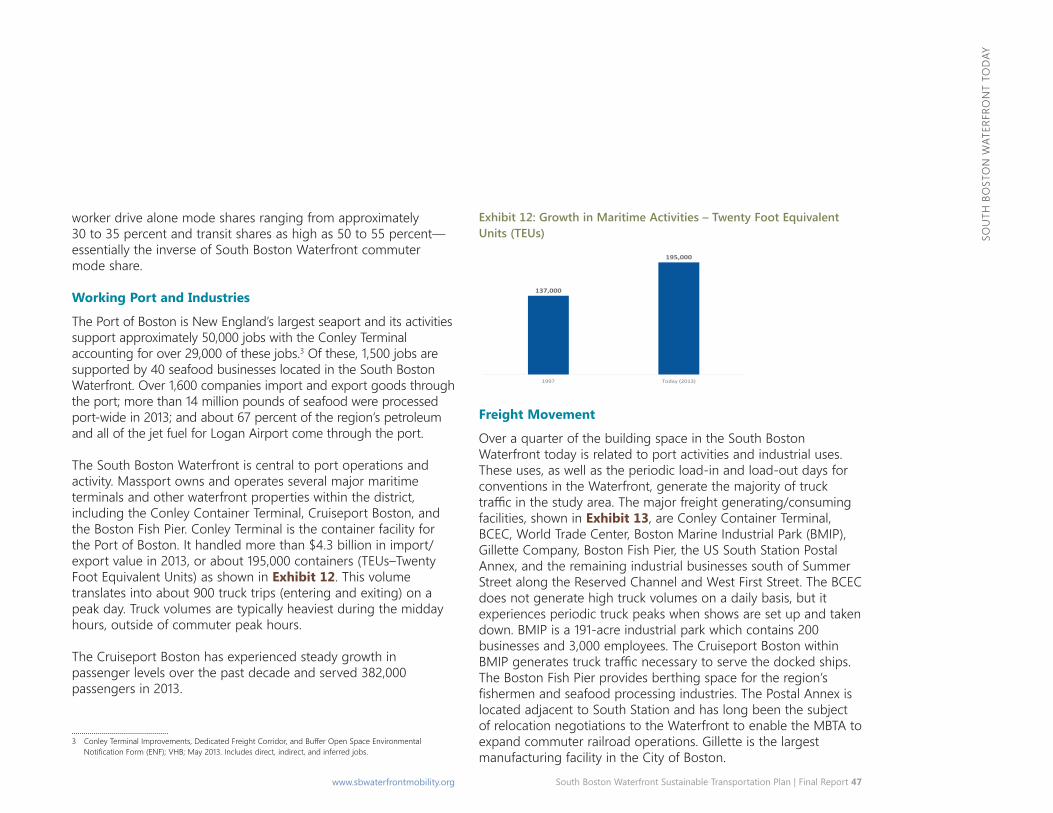
South Boston Waterfront Sustainable Transportation Plan | Final Report 47www.sbwaterfrontmobility.org
Sou
th B
oSt
oN
wat
erfr
oN
t to
DaY
worker drive alone mode shares ranging from approximately 30 to 35 percent and transit shares as high as 50 to 55 percent— essentially the inverse of South Boston waterfront commuter mode share.
Working Port and Industries
the Port of Boston is New england’s largest seaport and its activities support approximately 50,000 jobs with the Conley terminal accounting for over 29,000 of these jobs.3 of these, 1,500 jobs are supported by 40 seafood businesses located in the South Boston waterfront. over 1,600 companies import and export goods through the port; more than 14 million pounds of seafood were processed port-wide in 2013; and about 67 percent of the region’s petroleum and all of the jet fuel for Logan airport come through the port.
3 Conley Terminal Improvements, Dedicated Freight Corridor, and Buffer Open Space Environmental Notification Form (ENF); VHB; May 2013. Includes direct, indirect, and inferred jobs.
the South Boston waterfront is central to port operations and activity. Massport owns and operates several major maritime terminals and other waterfront properties within the district, including the Conley Container terminal, Cruiseport Boston, and the Boston fish Pier. Conley terminal is the container facility for the Port of Boston. It handled more than $4.3 billion in import/ export value in 2013, or about 195,000 containers (teus–twenty foot equivalent units) as shown in Exhibit 12. this volume translates into about 900 truck trips (entering and exiting) on a peak day. truck volumes are typically heaviest during the midday hours, outside of commuter peak hours.
the Cruiseport Boston has experienced steady growth in passenger levels over the past decade and served 382,000 passengers in 2013.
Exhibit 12: Growth in Maritime Activities – Twenty Foot Equivalent Units (TEUs)
Freight Movement
over a quarter of the building space in the South Boston waterfront today is related to port activities and industrial uses. these uses, as well as the periodic load-in and load-out days for conventions in the waterfront, generate the majority of truck traffic in the study area. The major freight generating/consuming facilities, shown in Exhibit 13, are Conley Container terminal, BCeC, world trade Center, Boston Marine Industrial Park (BMIP), Gillette Company, Boston fish Pier, the uS South Station Postal annex, and the remaining industrial businesses south of Summer Street along the reserved Channel and west first Street. the BCeC does not generate high truck volumes on a daily basis, but it experiences periodic truck peaks when shows are set up and taken down. BMIP is a 191-acre industrial park which contains 200 businesses and 3,000 employees. the Cruiseport Boston within BMIP generates truck traffic necessary to serve the docked ships. the Boston fish Pier provides berthing space for the region’s fishermen and seafood processing industries. The Postal Annex is located adjacent to South Station and has long been the subject of relocation negotiations to the waterfront to enable the MBta to expand commuter railroad operations. Gillette is the largest manufacturing facility in the City of Boston.
137,000
195,000
1997 Today (2013)
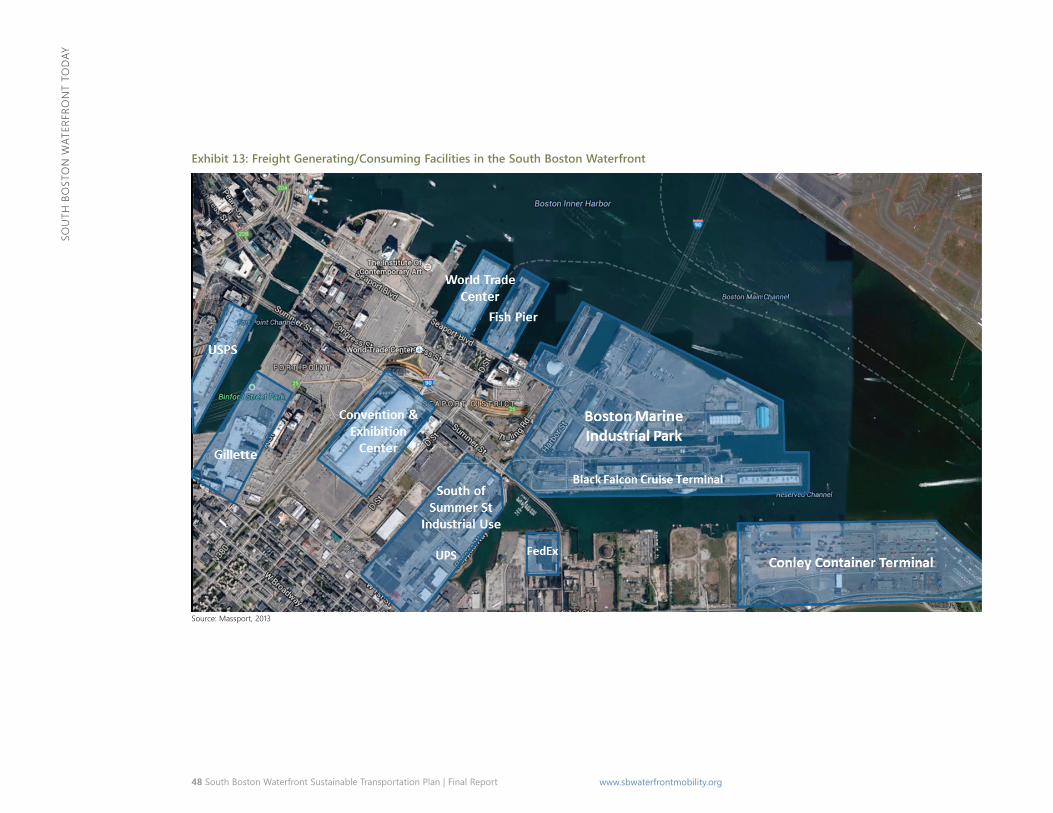
48 South Boston Waterfront Sustainable Transportation Plan | Final Report www.sbwaterfrontmobility.org
Sou
th B
oSt
oN
wat
erfr
oN
t to
DaY
Exhibit 13: Freight Generating/Consuming Facilities in the South Boston Waterfront
Source: Massport, 2013
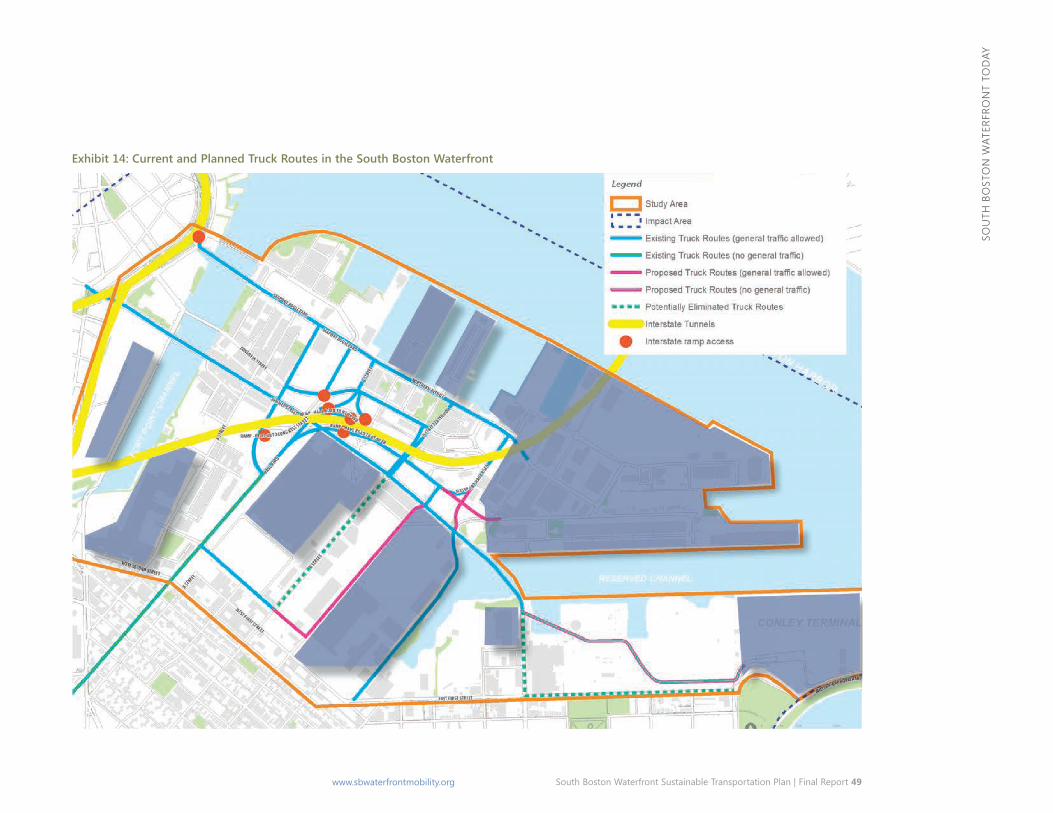
South Boston Waterfront Sustainable Transportation Plan | Final Report 49www.sbwaterfrontmobility.org
Sou
th B
oSt
oN
wat
erfr
oN
t to
DaY
Exhibit 14: Current and Planned Truck Routes in the South Boston Waterfront
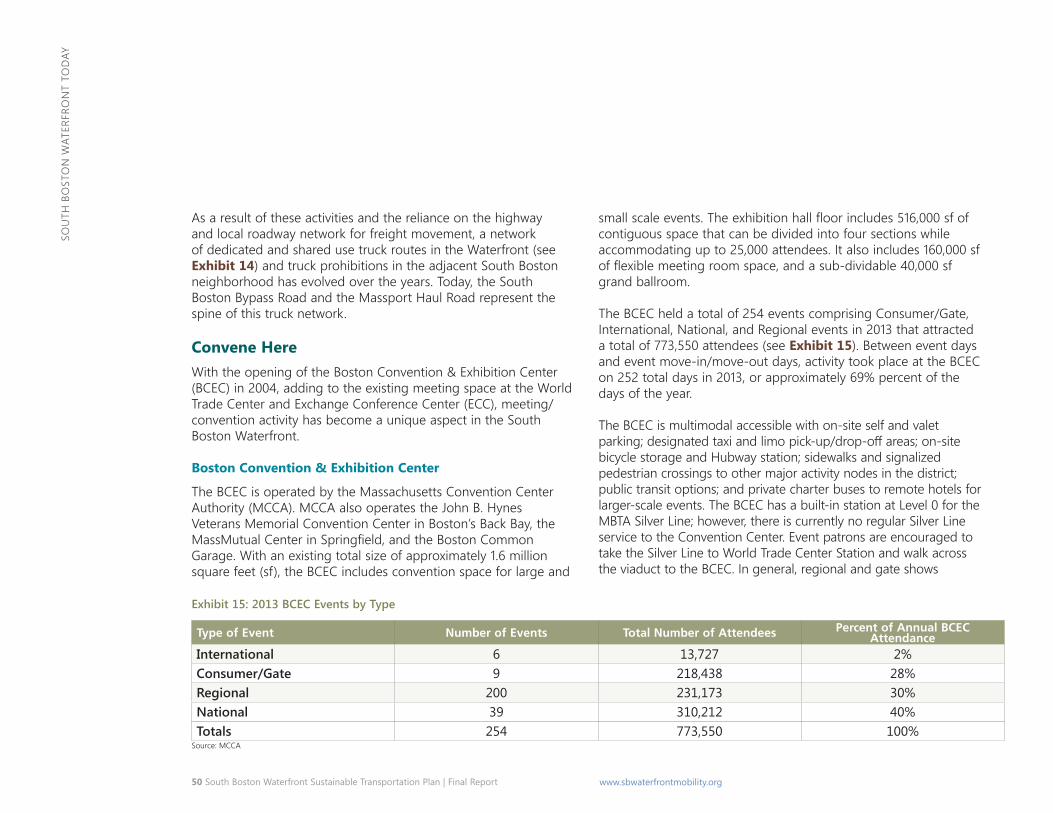
50 South Boston Waterfront Sustainable Transportation Plan | Final Report www.sbwaterfrontmobility.org
Sou
th B
oSt
oN
wat
erfr
oN
t to
DaY
as a result of these activities and the reliance on the highway and local roadway network for freight movement, a network of dedicated and shared use truck routes in the waterfront (see Exhibit 14) and truck prohibitions in the adjacent South Boston neighborhood has evolved over the years. today, the South Boston Bypass road and the Massport haul road represent the spine of this truck network.
Convene Here with the opening of the Boston Convention & exhibition Center (BCeC) in 2004, adding to the existing meeting space at the world trade Center and exchange Conference Center (eCC), meeting/ convention activity has become a unique aspect in the South Boston waterfront.
Boston Convention & Exhibition Center
the BCeC is operated by the Massachusetts Convention Center authority (MCCa). MCCa also operates the John B. hynes Veterans Memorial Convention Center in Boston’s Back Bay, the MassMutual Center in Springfield, and the Boston Common Garage. with an existing total size of approximately 1.6 million square feet (sf), the BCeC includes convention space for large and
small scale events. The exhibition hall floor includes 516,000 sf of contiguous space that can be divided into four sections while accommodating up to 25,000 attendees. It also includes 160,000 sf of flexible meeting room space, and a sub-dividable 40,000 sf grand ballroom.
the BCeC held a total of 254 events comprising Consumer/Gate, International, National, and regional events in 2013 that attracted a total of 773,550 attendees (see Exhibit 15). Between event days and event move-in/move-out days, activity took place at the BCeC on 252 total days in 2013, or approximately 69% percent of the days of the year.
the BCeC is multimodal accessible with on-site self and valet parking; designated taxi and limo pick-up/drop-off areas; on-site bicycle storage and hubway station; sidewalks and signalized pedestrian crossings to other major activity nodes in the district; public transit options; and private charter buses to remote hotels for larger-scale events. the BCeC has a built-in station at Level 0 for the MBta Silver Line; however, there is currently no regular Silver Line service to the Convention Center. event patrons are encouraged to take the Silver Line to world trade Center Station and walk across the viaduct to the BCeC. In general, regional and gate shows
Exhibit 15: 2013 BCEC Events by Type
Type of Event Number of Events Total Number of Attendees Percent of Annual BCEC Attendance
International 6 13,727 2% Consumer/Gate 9 218,438 28% Regional 200 231,173 30% National 39 310,212 40% Totals 254 773,550 100%
Source: MCCa
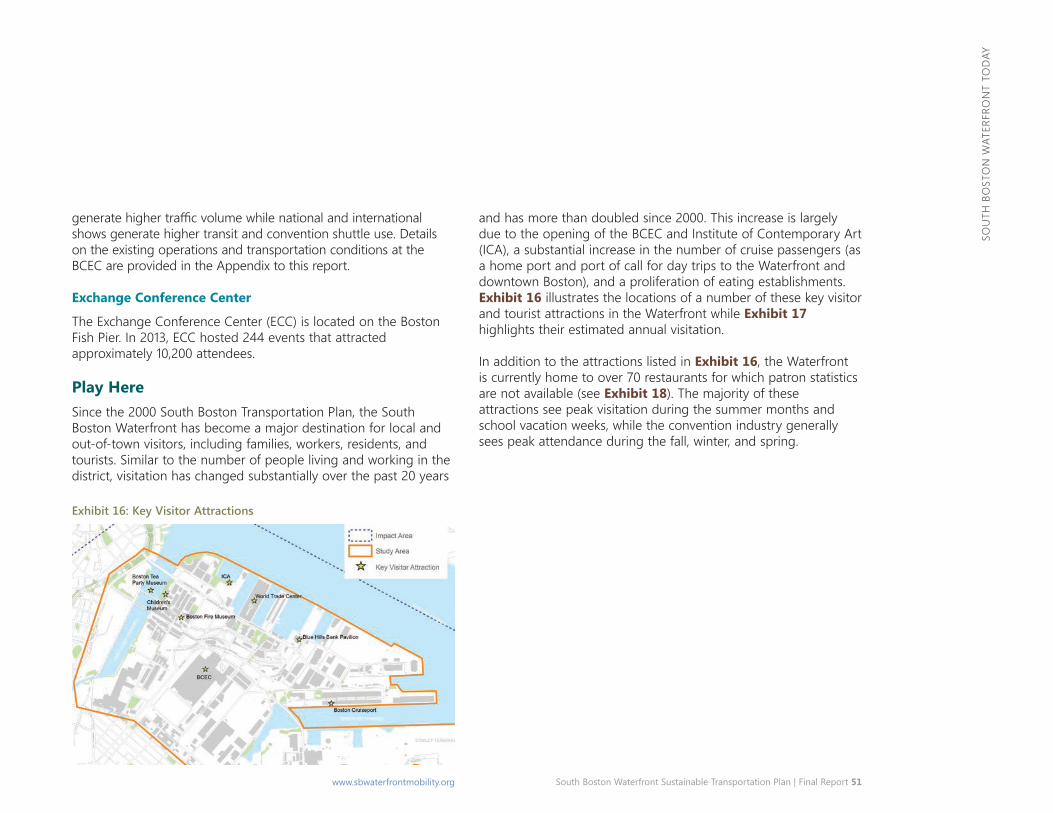
South Boston Waterfront Sustainable Transportation Plan | Final Report 51www.sbwaterfrontmobility.org
Sou
th B
oSt
oN
wat
erfr
oN
t to
DaY
generate higher traffic volume while national and international shows generate higher transit and convention shuttle use. Details on the existing operations and transportation conditions at the BCeC are provided in the appendix to this report.
Exchange Conference Center
the exchange Conference Center (eCC) is located on the Boston fish Pier. In 2013, eCC hosted 244 events that attracted approximately 10,200 attendees.
Play Here Since the 2000 South Boston transportation Plan, the South Boston waterfront has become a major destination for local and out-of-town visitors, including families, workers, residents, and tourists. Similar to the number of people living and working in the district, visitation has changed substantially over the past 20 years
and has more than doubled since 2000. this increase is largely due to the opening of the BCeC and Institute of Contemporary art (ICa), a substantial increase in the number of cruise passengers (as a home port and port of call for day trips to the waterfront and downtown Boston), and a proliferation of eating establishments. Exhibit 16 illustrates the locations of a number of these key visitor and tourist attractions in the waterfront while Exhibit 17 highlights their estimated annual visitation.
In addition to the attractions listed in Exhibit 16, the waterfront is currently home to over 70 restaurants for which patron statistics are not available (see Exhibit 18). the majority of these attractions see peak visitation during the summer months and school vacation weeks, while the convention industry generally sees peak attendance during the fall, winter, and spring.
Exhibit 16: Key Visitor Attractions
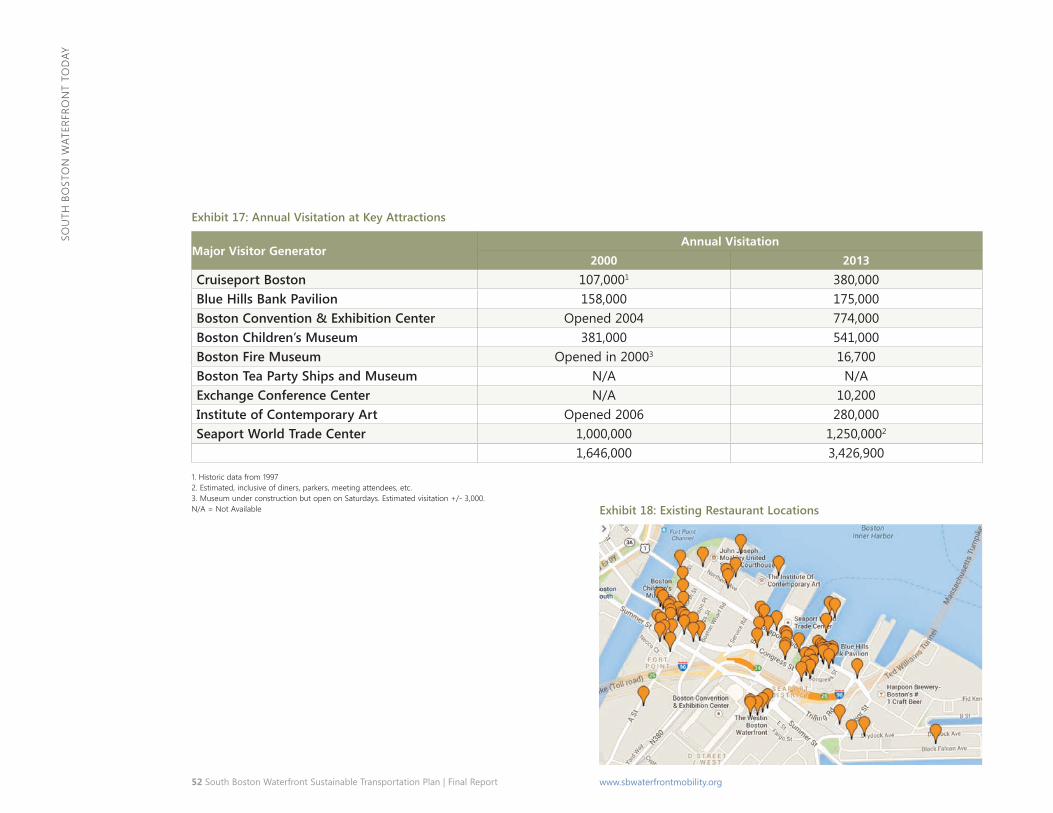
52 South Boston Waterfront Sustainable Transportation Plan | Final Report www.sbwaterfrontmobility.org
Sou
th B
oSt
oN
wat
erfr
oN
t to
DaY
Exhibit 17: Annual Visitation at Key Attractions
Major Visitor Generator Annual Visitation
2000 2013
Cruiseport Boston 107,0001 380,000 Blue Hills Bank Pavilion 158,000 175,000 Boston Convention & Exhibition Center opened 2004 774,000 Boston Children’s Museum 381,000 541,000 Boston Fire Museum opened in 20003 16,700 Boston Tea Party Ships and Museum N/a N/a Exchange Conference Center N/a 10,200 Institute of Contemporary Art opened 2006 280,000 Seaport World Trade Center 1,000,000 1,250,0002
1,646,000 3,426,900
1. historic data from 1997 2. estimated, inclusive of diners, parkers, meeting attendees, etc. 3. Museum under construction but open on Saturdays. estimated visitation +/- 3,000. N/a = Not available Exhibit 18: Existing Restaurant Locations
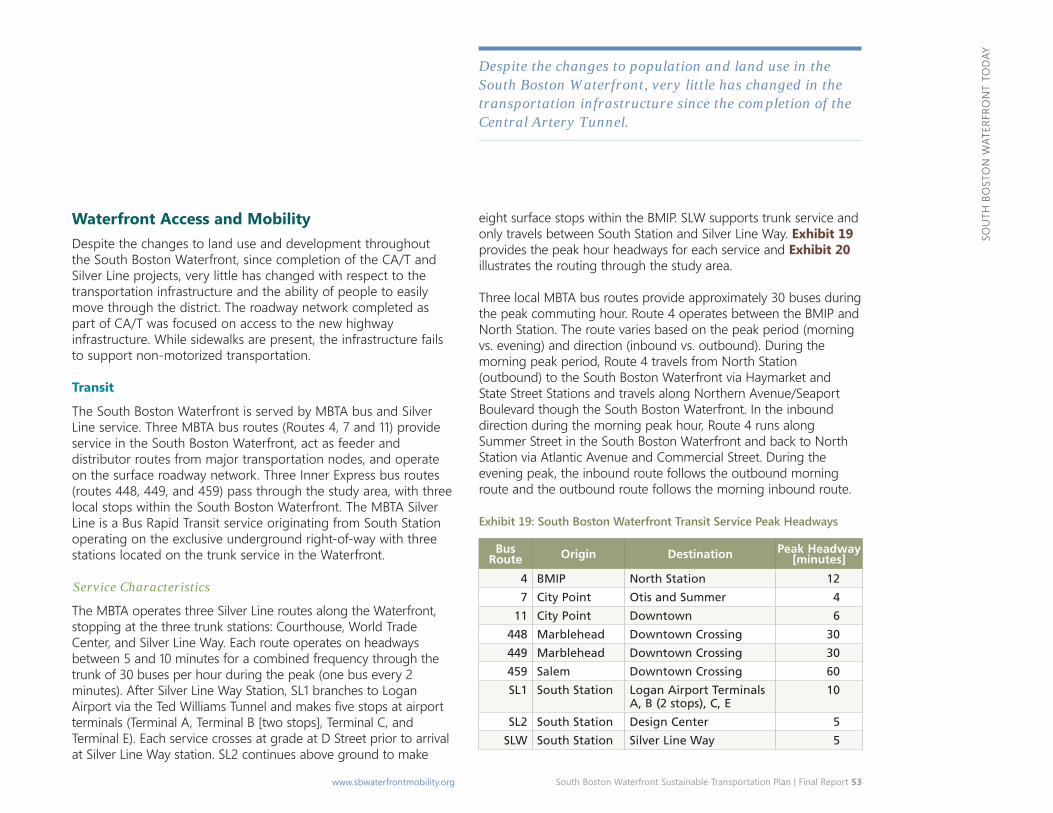
South Boston Waterfront Sustainable Transportation Plan | Final Report 53www.sbwaterfrontmobility.org
Sou
th B
oSt
oN
wat
erfr
oN
t to
DaY
Waterfront Access and Mobility Despite the changes to land use and development throughout the South Boston waterfront, since completion of the Ca/t and Silver Line projects, very little has changed with respect to the transportation infrastructure and the ability of people to easily move through the district. the roadway network completed as part of Ca/t was focused on access to the new highway infrastructure. while sidewalks are present, the infrastructure fails to support non-motorized transportation.
Transit
the South Boston waterfront is served by MBta bus and Silver Line service. three MBta bus routes (routes 4, 7 and 11) provide service in the South Boston waterfront, act as feeder and distributor routes from major transportation nodes, and operate on the surface roadway network. three Inner express bus routes (routes 448, 449, and 459) pass through the study area, with three local stops within the South Boston waterfront. the MBta Silver Line is a Bus rapid transit service originating from South Station operating on the exclusive underground right-of-way with three stations located on the trunk service in the waterfront.
Service Characteristics
the MBta operates three Silver Line routes along the waterfront, stopping at the three trunk stations: Courthouse, world trade Center, and Silver Line way. each route operates on headways between 5 and 10 minutes for a combined frequency through the trunk of 30 buses per hour during the peak (one bus every 2 minutes). after Silver Line way Station, SL1 branches to Logan Airport via the Ted Williams Tunnel and makes five stops at airport terminals (terminal a, terminal B [two stops], terminal C, and terminal e). each service crosses at grade at D Street prior to arrival at Silver Line way station. SL2 continues above ground to make
eight surface stops within the BMIP. SLw supports trunk service and only travels between South Station and Silver Line way. Exhibit 19 provides the peak hour headways for each service and Exhibit 20 illustrates the routing through the study area.
Despite the changes to population and land use in the South Boston Waterfront, very little has changed in the transportation infrastructure since the completion of the Central Artery Tunnel.
three local MBta bus routes provide approximately 30 buses during the peak commuting hour. route 4 operates between the BMIP and North Station. the route varies based on the peak period (morning vs. evening) and direction (inbound vs. outbound). During the morning peak period, route 4 travels from North Station (outbound) to the South Boston waterfront via haymarket and State Street Stations and travels along Northern avenue/Seaport Boulevard though the South Boston waterfront. In the inbound direction during the morning peak hour, route 4 runs along Summer Street in the South Boston waterfront and back to North Station via atlantic avenue and Commercial Street. During the evening peak, the inbound route follows the outbound morning route and the outbound route follows the morning inbound route.
Exhibit 19: South Boston Waterfront Transit Service Peak Headways
Bus Route Origin Destination Peak Headway
[minutes]
4 BMIP North Station 12
7 City Point Otis and Summer 4
11 City Point Downtown 6
448 Marblehead Downtown Crossing 30
449 Marblehead Downtown Crossing 30
459 Salem Downtown Crossing 60
SL1 South Station Logan Airport Terminals A, B (2 stops), C, E
10
SL2 South Station Design Center 5
SLW South Station Silver Line Way 5
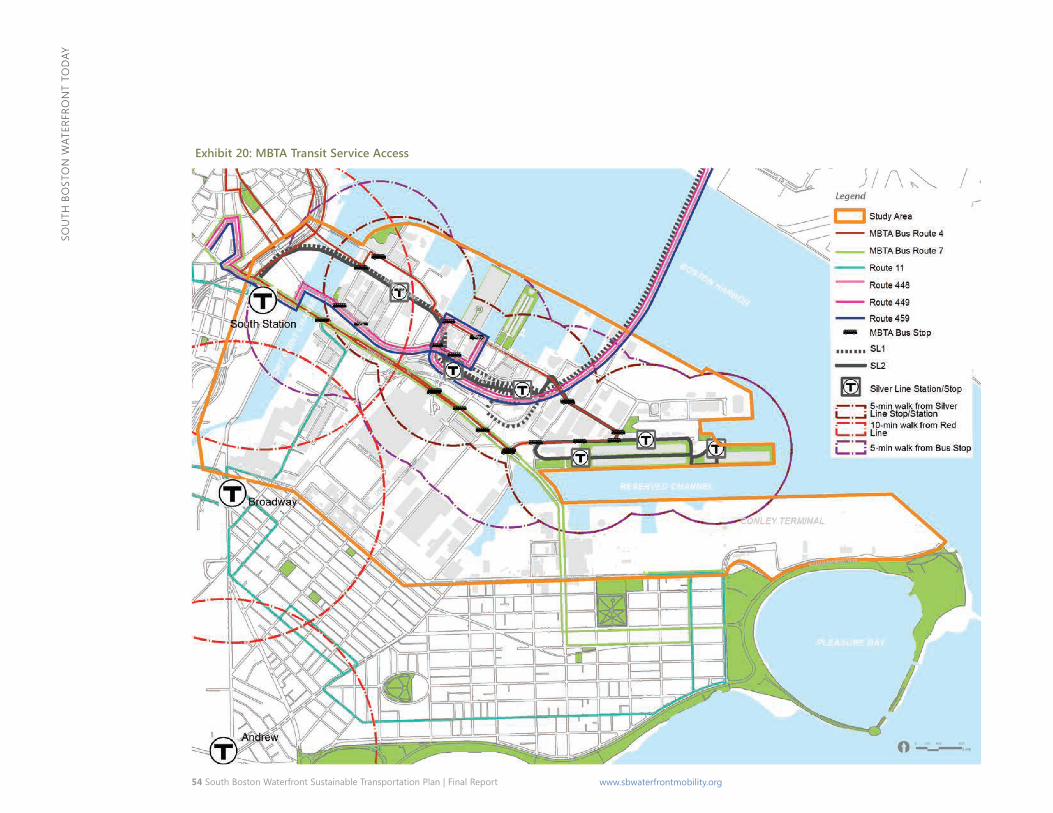
54 South Boston Waterfront Sustainable Transportation Plan | Final Report www.sbwaterfrontmobility.org
Sou
th B
oSt
oN
wat
erfr
oN
t to
DaY
Exhibit 20: MBTA Transit Service Access
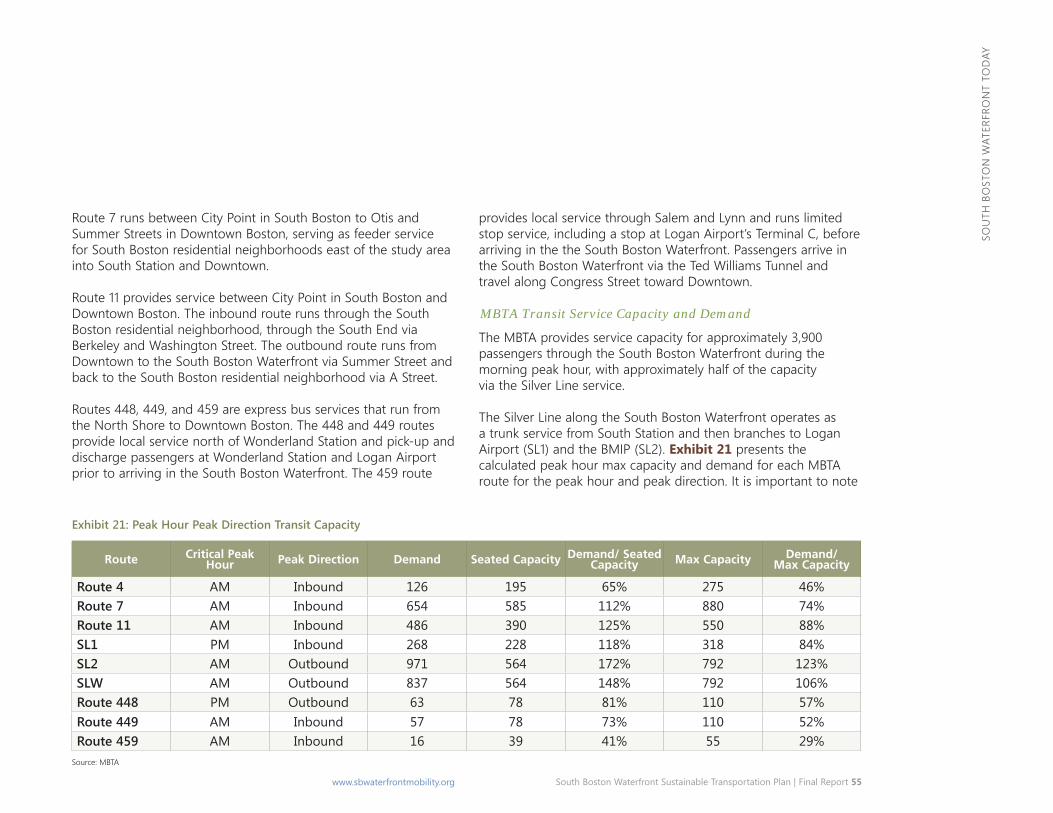
South Boston Waterfront Sustainable Transportation Plan | Final Report 55www.sbwaterfrontmobility.org
Sou
th B
oSt
oN
wat
erfr
oN
t to
DaY
route 7 runs between City Point in South Boston to otis and Summer Streets in Downtown Boston, serving as feeder service for South Boston residential neighborhoods east of the study area into South Station and Downtown.
route 11 provides service between City Point in South Boston and Downtown Boston. the inbound route runs through the South Boston residential neighborhood, through the South end via Berkeley and washington Street. the outbound route runs from Downtown to the South Boston waterfront via Summer Street and back to the South Boston residential neighborhood via a Street.
routes 448, 449, and 459 are express bus services that run from the North Shore to Downtown Boston. the 448 and 449 routes provide local service north of wonderland Station and pick-up and discharge passengers at wonderland Station and Logan airport prior to arriving in the South Boston waterfront. the 459 route
provides local service through Salem and Lynn and runs limited stop service, including a stop at Logan airport’s terminal C, before arriving in the the South Boston waterfront. Passengers arrive in the South Boston waterfront via the ted williams tunnel and travel along Congress Street toward Downtown.
MBTA Transit Service Capacity and Demand
the MBta provides service capacity for approximately 3,900 passengers through the South Boston waterfront during the morning peak hour, with approximately half of the capacity via the Silver Line service.
the Silver Line along the South Boston waterfront operates as a trunk service from South Station and then branches to Logan airport (SL1) and the BMIP (SL2). Exhibit 21 presents the calculated peak hour max capacity and demand for each MBta route for the peak hour and peak direction. It is important to note
Exhibit 21: Peak Hour Peak Direction Transit Capacity
Route Critical Peak Hour Peak Direction Demand Seated Capacity Demand/ Seated
Capacity Max Capacity Demand/ Max Capacity
Route 4 aM Inbound 126 195 65% 275 46% Route 7 aM Inbound 654 585 112% 880 74% Route 11 aM Inbound 486 390 125% 550 88% SL1 PM Inbound 268 228 118% 318 84% SL2 aM outbound 971 564 172% 792 123% SLW aM outbound 837 564 148% 792 106% Route 448 PM outbound 63 78 81% 110 57% Route 449 aM Inbound 57 78 73% 110 52% Route 459 aM Inbound 16 39 41% 55 29%
Source: MBta
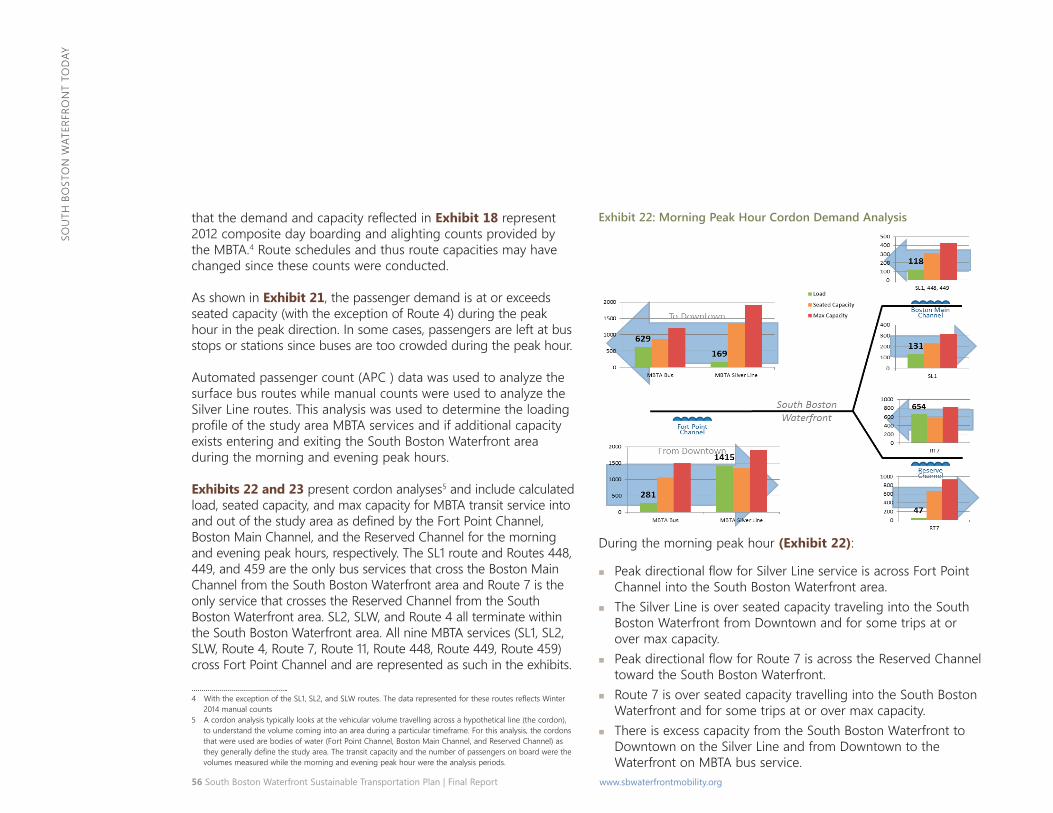
56 South Boston Waterfront Sustainable Transportation Plan | Final Report www.sbwaterfrontmobility.org
Sou
th B
oSt
oN
wat
erfr
oN
t to
DaY
that the demand and capacity reflected in Exhibit 18 represent 2012 composite day boarding and alighting counts provided by the MBta.4 route schedules and thus route capacities may have changed since these counts were conducted.
4 With the exception of the SL1, SL2, and SLW routes. The data represented for these routes reflects Winter 2014 manual counts
as shown in Exhibit 21, the passenger demand is at or exceeds seated capacity (with the exception of route 4) during the peak hour in the peak direction. In some cases, passengers are left at bus stops or stations since buses are too crowded during the peak hour.
automated passenger count (aPC ) data was used to analyze the surface bus routes while manual counts were used to analyze the Silver Line routes. this analysis was used to determine the loading profile of the study area MBTA services and if additional capacity exists entering and exiting the South Boston waterfront area during the morning and evening peak hours.
Exhibits 22 and 23 present cordon analyses5 and include calculated load, seated capacity, and max capacity for MBta transit service into and out of the study area as defined by the Fort Point Channel, Boston Main Channel, and the reserved Channel for the morning and evening peak hours, respectively. the SL1 route and routes 448, 449, and 459 are the only bus services that cross the Boston Main Channel from the South Boston waterfront area and route 7 is the only service that crosses the reserved Channel from the South Boston waterfront area. SL2, SLw, and route 4 all terminate within the South Boston waterfront area. all nine MBta services (SL1, SL2, SLw, route 4, route 7, route 11, route 448, route 449, route 459) cross fort Point Channel and are represented as such in the exhibits.
5 a cordon analysis typically looks at the vehicular volume travelling across a hypothetical line (the cordon), to understand the volume coming into an area during a particular timeframe. for this analysis, the cordons that were used are bodies of water (fort Point Channel, Boston Main Channel, and reserved Channel) as they generally define the study area. The transit capacity and the number of passengers on board were the volumes measured while the morning and evening peak hour were the analysis periods.
Exhibit 22: Morning Peak Hour Cordon Demand Analysis
During the morning peak hour (Exhibit 22):
� Peak directional flow for Silver Line service is across Fort Point Channel into the South Boston waterfront area.
� the Silver Line is over seated capacity traveling into the South Boston waterfront from Downtown and for some trips at or over max capacity.
� Peak directional flow for Route 7 is across the Reserved Channel toward the South Boston waterfront.
� route 7 is over seated capacity travelling into the South Boston waterfront and for some trips at or over max capacity.
� there is excess capacity from the South Boston waterfront to Downtown on the Silver Line and from Downtown to the waterfront on MBta bus service.
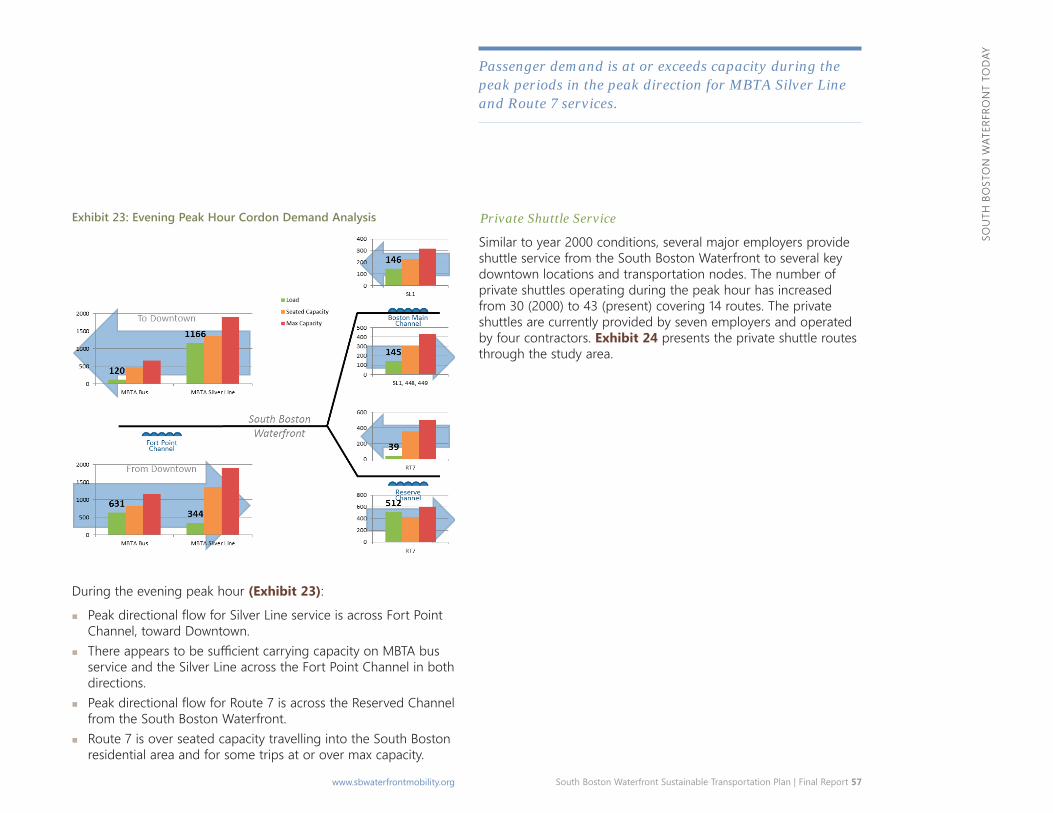
South Boston Waterfront Sustainable Transportation Plan | Final Report 57www.sbwaterfrontmobility.org
Sou
th B
oSt
oN
wat
erfr
oN
t to
DaY
Exhibit 23: Evening Peak Hour Cordon Demand Analysis
During the evening peak hour (Exhibit 23):
� Peak directional flow for Silver Line service is across Fort Point Channel, toward Downtown.
� There appears to be sufficient carrying capacity on MBTA bus service and the Silver Line across the fort Point Channel in both directions.
� Peak directional flow for Route 7 is across the Reserved Channel from the South Boston waterfront.
� route 7 is over seated capacity travelling into the South Boston residential area and for some trips at or over max capacity.
Passenger demand is at or exceeds capacity during the peak periods in the peak direction for MBTA Silver Line and Route 7 services.
Private Shuttle Service
Similar to year 2000 conditions, several major employers provide shuttle service from the South Boston waterfront to several key downtown locations and transportation nodes. the number of private shuttles operating during the peak hour has increased from 30 (2000) to 43 (present) covering 14 routes. the private shuttles are currently provided by seven employers and operated by four contractors. Exhibit 24 presents the private shuttle routes through the study area.
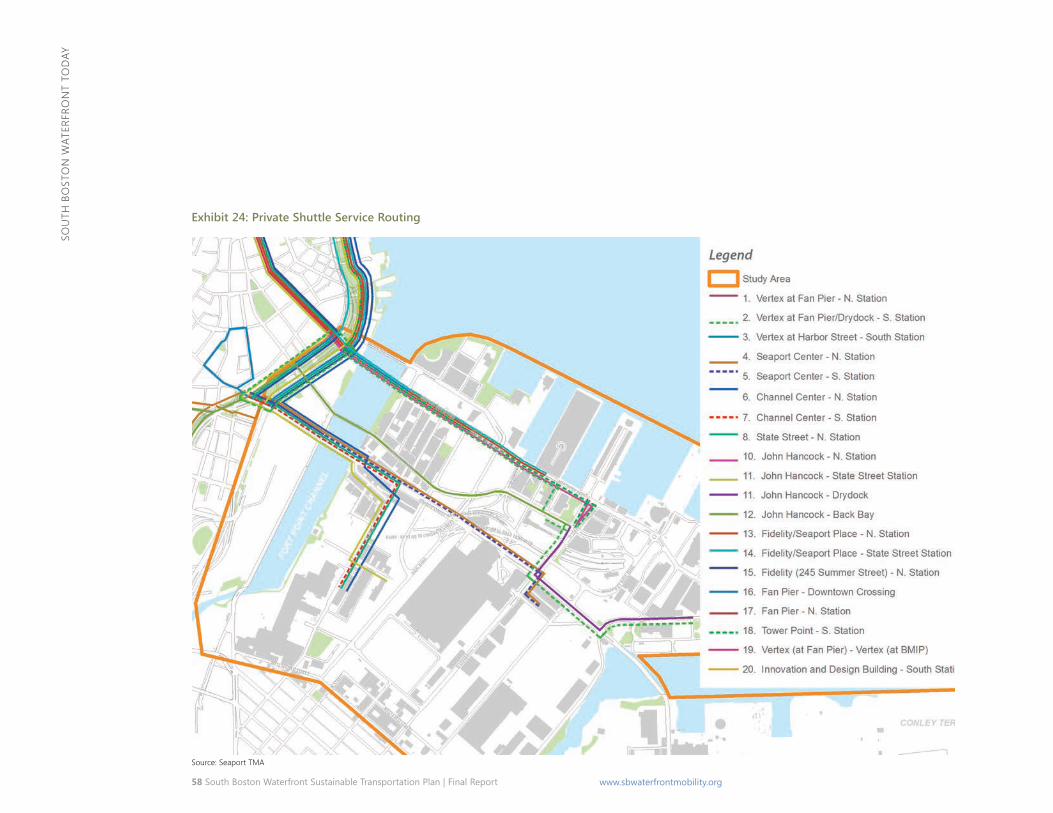
58 South Boston Waterfront Sustainable Transportation Plan | Final Report www.sbwaterfrontmobility.org
Sou
th B
oSt
oN
wat
erfr
oN
t to
DaY
Exhibit 24: Private Shuttle Service Routing
Source: Seaport tMa
South Boston Waterfront Sustainable Transportation Plan | Final Report 59www.sbwaterfrontmobility.org
Sou
th B
oSt
oN
wat
erfr
oN
t to
DaY
a table with the number of routes and their frequency, organized by destination, is presented in Exhibit 25. under current conditions, the private shuttles operating in the South Boston waterfront provide as much total peak hour capacity as MBta bus service in the district.
Exhibit 25: South Boston Waterfront Private Shuttle Frequency
Destination # Routes Peak Hour Frequency [shuttles/hour]
North Station 7 21 South Station 4 14 Downtown 3 8 Total 14 43
Source: Seaport tMa, MCCa
Water Transportation
there are currently three water transit terminals on the South Boston waterfront suitable for scheduled passenger water transit services:
� federal Courthouse: Currently there are no scheduled ferry services to the federal Courthouse landing.
� fan Pier: the recently completed (2013) terminal is owned and managed by the fallon Company. the seasonal Cultural Connector Loop operates from this landing.
world trade Center (west): there are several interconnected ferry transit landings under different management. The WTC landing has been used in the past for scheduled MBta ferry transit, but does not currently serve any routes. to the north of the public landing is the Baystate Cruise Company terminal for its Provincetown services.
the South Boston waterfront is served by three seasonal ferry operations (see Exhibit 26):
� Inner harbor Cultural Connector Loop (fan Pier): Seasonal service operated by Boston harbor Cruises from the fan Pier terminal to the Children’s Museum in South Boston with a link to the New england aquarium at Central wharf. the service is focused primarily on visitor use.
� South Boston (world trade Center) to Provincetown: Both fast and conventional seasonal ferry service operated by Baystate Cruise Company connect the world trade Center to MacMillan wharf in Provincetown.
� South Boston (Cruise terminal) to thompson’s Island: Seasonal service is provided to thompson’s Island of the Boston harbor Islands, departing from the eDIC Landing at Cruiseport Boston in the reserved Channel.
there are also multiple active ferry routes which pass by the South Boston waterfront and have potential for future service to a variety of destinations, including Spectacle and Georges Islands, Logan airport, and the communities of Salem, hull, and hingham.
In addition to scheduled transit ferries, there is also a network of water taxis/landings serving South Boston which supplement the scheduled water transit operations with both year round and seasonal on-call, point-to-point services. the Boston harbor vessels are relatively small, priced to match land taxi rates, and not aDa accessible.
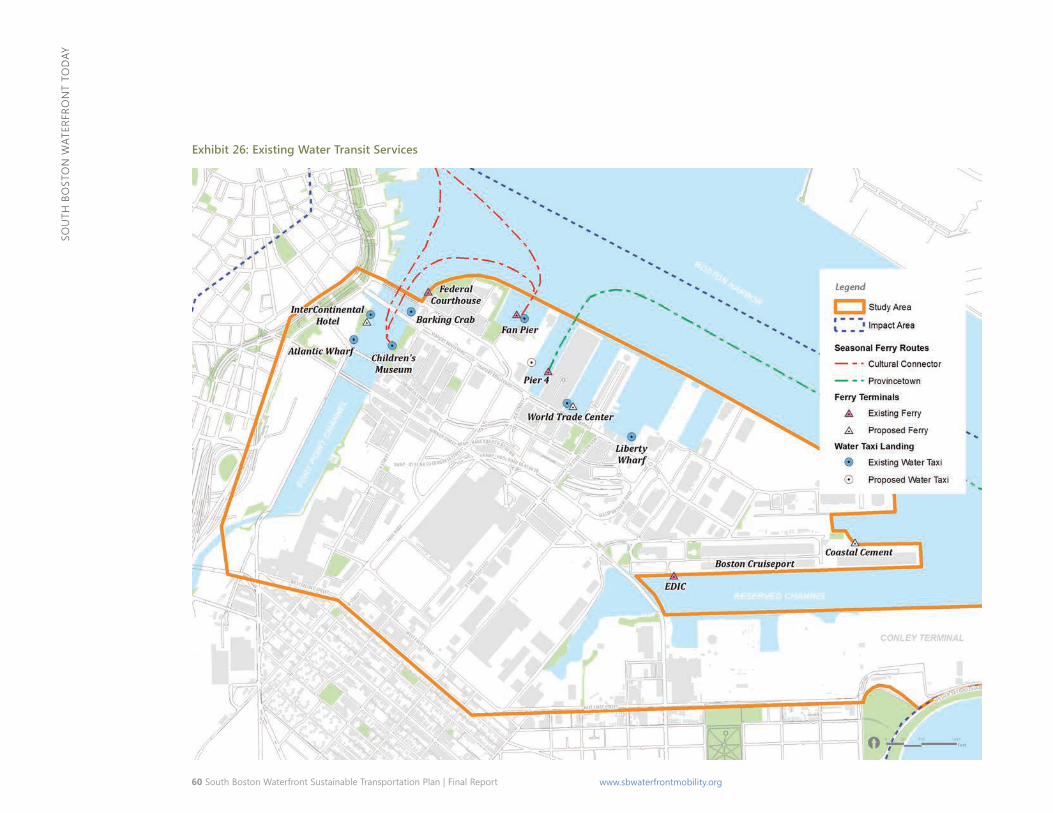
60 South Boston Waterfront Sustainable Transportation Plan | Final Report www.sbwaterfrontmobility.org
Sou
th B
oSt
oN
wat
erfr
oN
t to
DaY
Exhibit 26: Existing Water Transit Services
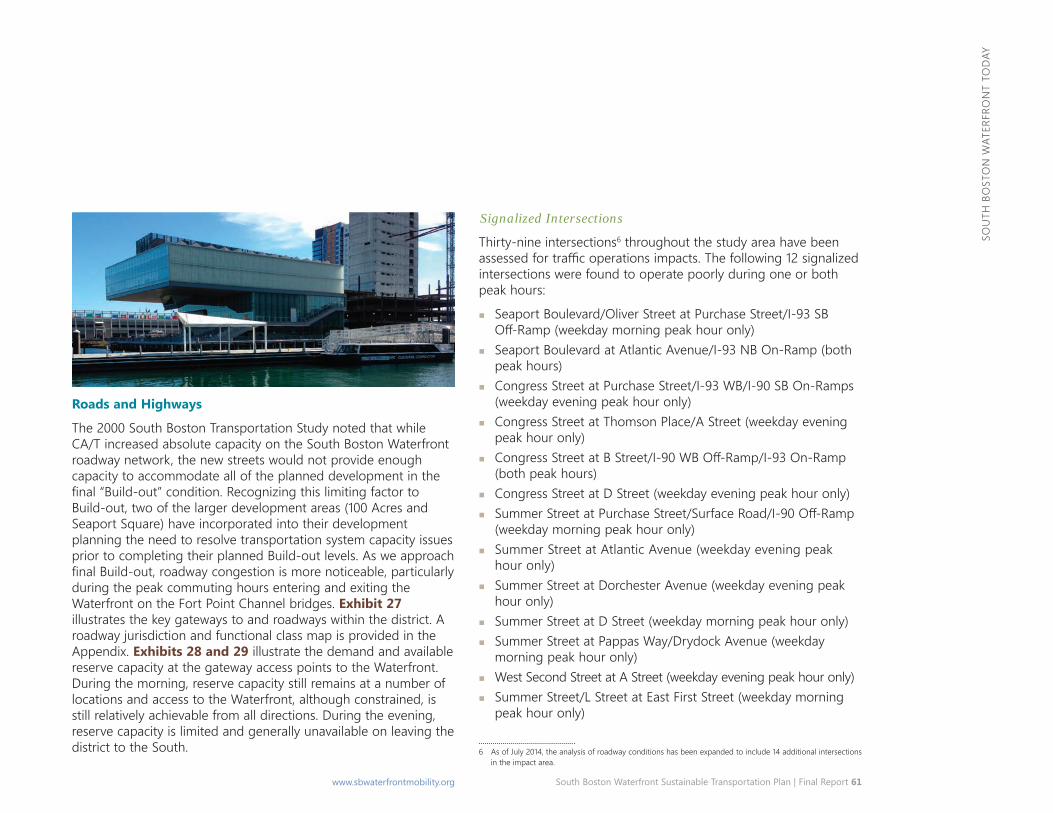
South Boston Waterfront Sustainable Transportation Plan | Final Report 61www.sbwaterfrontmobility.org
Sou
th B
oSt
oN
wat
erfr
oN
t to
DaY
Roads and Highways
the 2000 South Boston transportation Study noted that while Ca/t increased absolute capacity on the South Boston waterfront roadway network, the new streets would not provide enough capacity to accommodate all of the planned development in the final “Build-out” condition. Recognizing this limiting factor to Build-out, two of the larger development areas (100 acres and Seaport Square) have incorporated into their development planning the need to resolve transportation system capacity issues prior to completing their planned Build-out levels. as we approach final Build-out, roadway congestion is more noticeable, particularly during the peak commuting hours entering and exiting the waterfront on the fort Point Channel bridges. Exhibit 27 illustrates the key gateways to and roadways within the district. a roadway jurisdiction and functional class map is provided in the appendix. Exhibits 28 and 29 illustrate the demand and available reserve capacity at the gateway access points to the waterfront. During the morning, reserve capacity still remains at a number of locations and access to the waterfront, although constrained, is still relatively achievable from all directions. During the evening, reserve capacity is limited and generally unavailable on leaving the district to the South.
Signalized Intersections
thirty-nine intersections6 throughout the study area have been assessed for traffic operations impacts. The following 12 signalized intersections were found to operate poorly during one or both peak hours:
6 as of July 2014, the analysis of roadway conditions has been expanded to include 14 additional intersections in the impact area.
� Seaport Boulevard/oliver Street at Purchase Street/I-93 SB Off-Ramp (weekday morning peak hour only)
� Seaport Boulevard at atlantic avenue/I-93 NB on-ramp (both peak hours)
� Congress Street at Purchase Street/I-93 wB/I-90 SB on-ramps (weekday evening peak hour only)
� Congress Street at thomson Place/a Street (weekday evening peak hour only)
� Congress Street at B Street/I-90 WB Off-Ramp/I-93 On-Ramp (both peak hours)
� Congress Street at D Street (weekday evening peak hour only) � Summer Street at Purchase Street/Surface Road/I-90 Off-Ramp
(weekday morning peak hour only) � Summer Street at atlantic avenue (weekday evening peak
hour only) � Summer Street at Dorchester avenue (weekday evening peak
hour only) � Summer Street at D Street (weekday morning peak hour only) � Summer Street at Pappas way/Drydock avenue (weekday
morning peak hour only) � west Second Street at a Street (weekday evening peak hour only) � Summer Street/L Street at east first Street (weekday morning
peak hour only)
62 South Boston Waterfront Sustainable Transportation Plan | Final Report www.sbwaterfrontmobility.org
Sou
th B
oSt
oN
wat
erfr
oN
t to
DaY
The quality, accessibility, and consistency of pedestrian accommodations vary widely throughout the Waterfront.
Unsignalized Intersections
In general, at unsignalized study area intersections, side street traffic experiences some delay exiting onto the main roadway. a Street at Binford Street is the only unsignalized location studied that shows excessive delay during peak periods. these delays occur during both the weekday morning and weekday evening peak hours.
Pedestrian
the quality, accessibility, and consistency of pedestrian accommodations vary widely throughout the waterfront. Sidewalks that were reconstructed as part of the Ca/t project are generally in good condition and of adequate width and slope to meet the requirements of the americans with Disabilities act (aDa) and architectural access Board (aaB). however, the connectivity along these sidewalks between key destinations is poor and many users note they often feel you “can’t get there from here.” Some additional observations:
� while east-west streets such as Summer Street, Congress Street, and Seaport Boulevard connect to downtown Boston, the north-south streets are generally discontinuous and do not reach the water.
� a Street, D Street, and Summer/L Streets provide good access from the traditional South Boston neighborhood to the waterfront. however, of these, only D Street reaches the northern edge of the waterfront.
� In the fort Point area, sidewalks have slowly been reconstructed over time, as new developments come online. Sidewalks in this area of the waterfront are narrower, in some cases (such as on Summer Street) slope severely and do not meet aDa/aaB guidelines.
� Pedestrian scale wayfinding is largely absent throughout the district.
The Harborwalk provides off-road pedestrian access between the fan Pier area and across the fort Point Channel on its southern end (when complete, the harborwalk will connect Dorchester to east Boston). Vertical connections to/from Summer Street consist of two steep metal staircases. these staircases create safety/security issues and potential pinch points in the system, as accessible connections are only provided at Congress Street. Prior to its closing, the old Northern Avenue bridge provided off-road access between the financial District and fan Pier, linking the waterfront with the rose Kennedy Greenway. the City is currently assessing the structural integrity of the bridge and is considering a plan to rehabilitate it, potentially reviving vehicular access. finally, a newly constructed path was recently completed along Pappas way, running along the reserved Channel from Summer Street to first Street.
of note through the outreach process, users described two primary crossing locations as problematic. The first location includes all crossings of Seaport Boulevard from B Street to Congress Street. although not related to the infrastructure design, there have been pedestrian fatalities recorded along Seaport Boulevard in the past and complaints range from difficulty understanding right-of-way to poor plowing and maintenance making crossing a hazard, particularly during the winter. the second location is pedestrian accommodation along the previous C Street corridor—roughly under the world trade Center avenue viaduct. this corridor is used as pedestrian access between the Silver Line to Level Zero of the convention center and the westin hotel. Many employees walk from the station to their workplace. however, this path requires crossing the entrance to the Massachusetts turnpike (I-90) and no formal pedestrian crossing accommodations are provided.
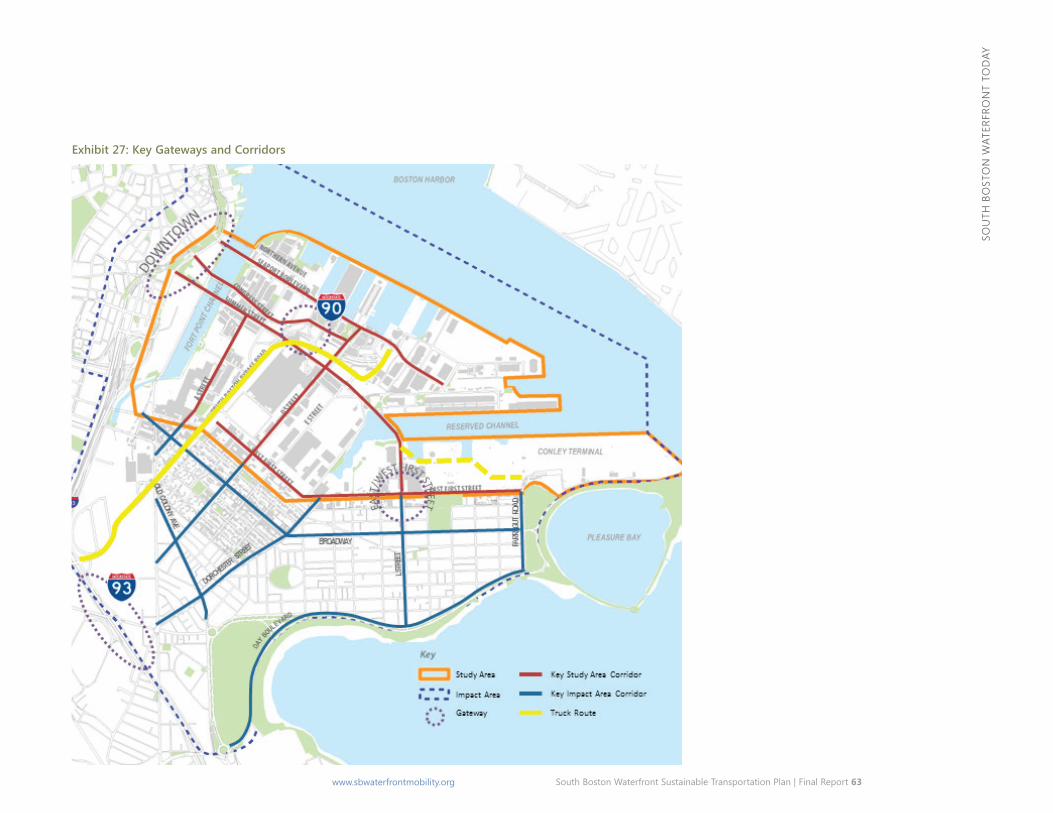
South Boston Waterfront Sustainable Transportation Plan | Final Report 63www.sbwaterfrontmobility.org
Sou
th B
oSt
oN
wat
erfr
oN
t to
DaY
Exhibit 27: Key Gateways and Corridors
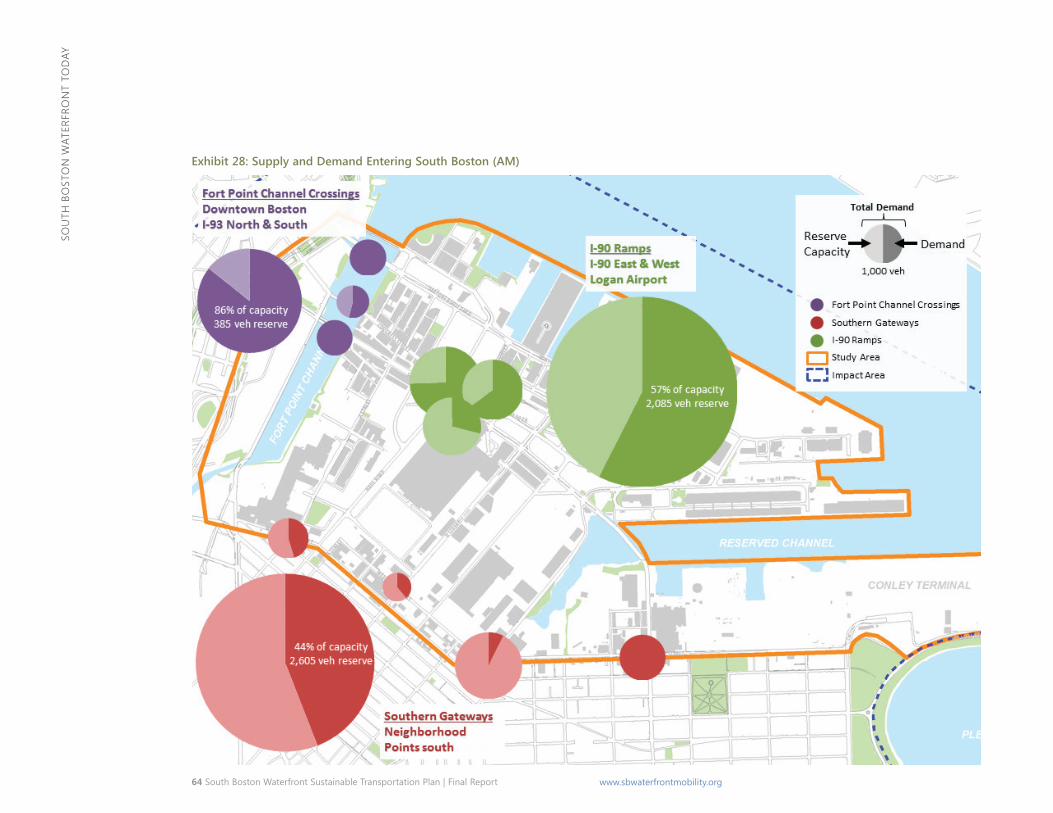
64 South Boston Waterfront Sustainable Transportation Plan | Final Report www.sbwaterfrontmobility.org
Sou
th B
oSt
oN
wat
erfr
oN
t to
DaY
Exhibit 28: Supply and Demand Entering South Boston (AM)
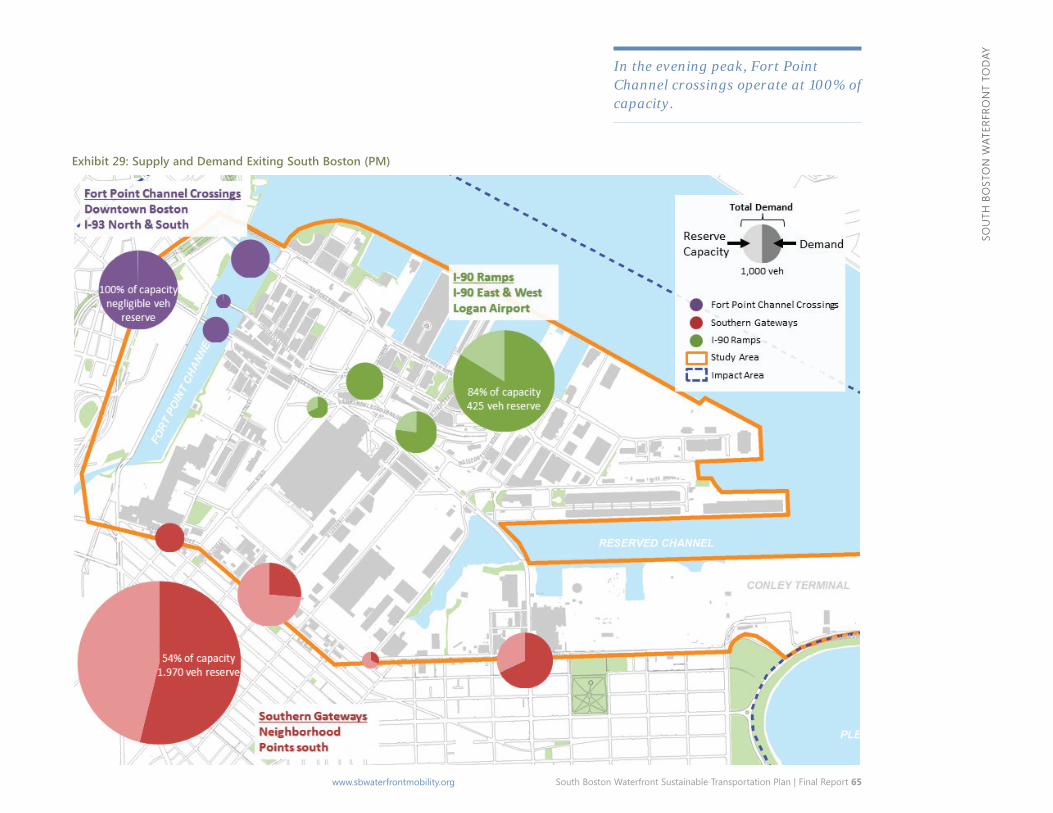
South Boston Waterfront Sustainable Transportation Plan | Final Report 65www.sbwaterfrontmobility.org
Sou
th B
oSt
oN
wat
erfr
oN
t to
DaY
In the evening peak, Fort Point Channel crossings operate at 100% of capacity.
Exhibit 29: Supply and Demand Exiting South Boston (PM)
66 South Boston Waterfront Sustainable Transportation Plan | Final Report www.sbwaterfrontmobility.org
Sou
th B
oSt
oN
wat
erfr
oN
t to
DaY
the City of Boston’s planned improvements to the Summer Street corridor will address the cross-slope problems along Summer Street and improve the pedestrian accommodations on this link of the pedestrian network.
Pedestrian volumes within the study area vary greatly. Exhibit 30 shows pedestrian activity by study area intersection location. as shown, the heaviest pedestrian activity occurs in the area near South Station and along atlantic and Purchase Streets.
Bicycle
the South Boston waterfront currently has a limited network of bicycle accommodations which are illustrated in Exhibit 31. there are approximately three miles of shared-use path and on-road exclusive bicycle accommodations contained within the study area. While bicycles are permitted on all roads, they “share the road” on the majority of streets in the study area. Limited public bicycle parking is provided, primarily in the fort Point and BMIP area. Bicycle accommodations within the study area include:
� the Boston harborwalk provides a shared-use path along the fort Point Channel, fan Pier, and around the world trade Center. Given its location and routing, the harborwalk is mostly used for recreational purposes.
� a bicycle lane is located on a Street between Dorchester avenue to the south and Congress Street to the north. the a Street corridor currently provides a good north-south connection with bicycle accommodations between the South Boston waterfront, the South Boston residential community to the south, and the bicycle accommodations along Dorchester avenue.
� In fall of 2013, the City of Boston installed bicycle lanes on D Street between Broadway to the south and Congress Street to the north. This corridor includes a contra-flow bicycle lane between first and Second Streets.
� the Seaport Boulevard corridor provides a continuous bicycle lane between fort Point Channel to the roundabout in front of the Blue hills Bank Pavilion, with a short break in continuity in front of the world trade Center. It has been observed that restaurant-related pick-up/drop-off activity creates conflict along portions of the bike lane during the evening. this corridor currently provides the only east-west connection with bicycle accommodations within the study area. It also connects to the Moakley Bridge, the only vehicular bridge with bicycle accommodations spanning the fort Point Channel.
� Seasonally, nine hubway stations are located throughout the study area (see Exhibit 31). Exhibit 32 provides the location of the hubway stations and the capacity (bicycle docking stations).
� the City provides approximately 100 public use, on-street bike racks in the waterfront. additional public use, on-street bike racks are provided by Massport.
� It is anticipated the City of Boston will pursue the highest level of bicycle accommodations along Summer Street in the near future.
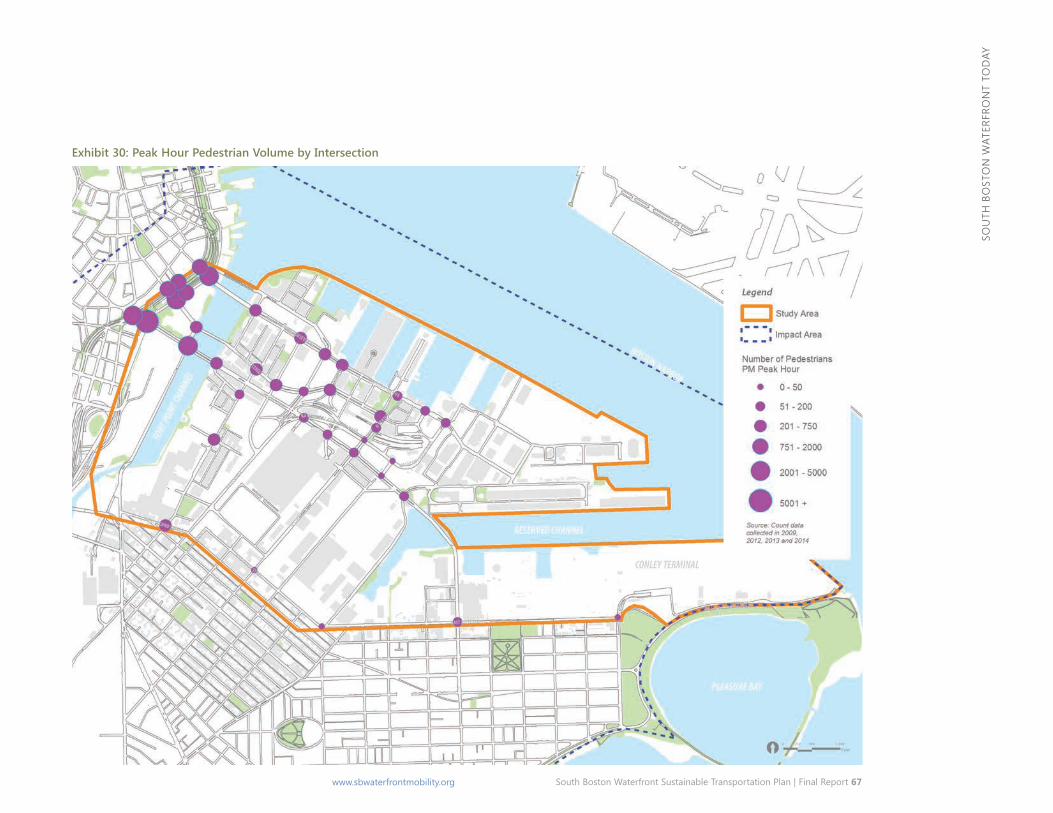
South Boston Waterfront Sustainable Transportation Plan | Final Report 67www.sbwaterfrontmobility.org
Sou
th B
oSt
oN
wat
erfr
oN
t to
DaY
Exhibit 30: Peak Hour Pedestrian Volume by Intersection
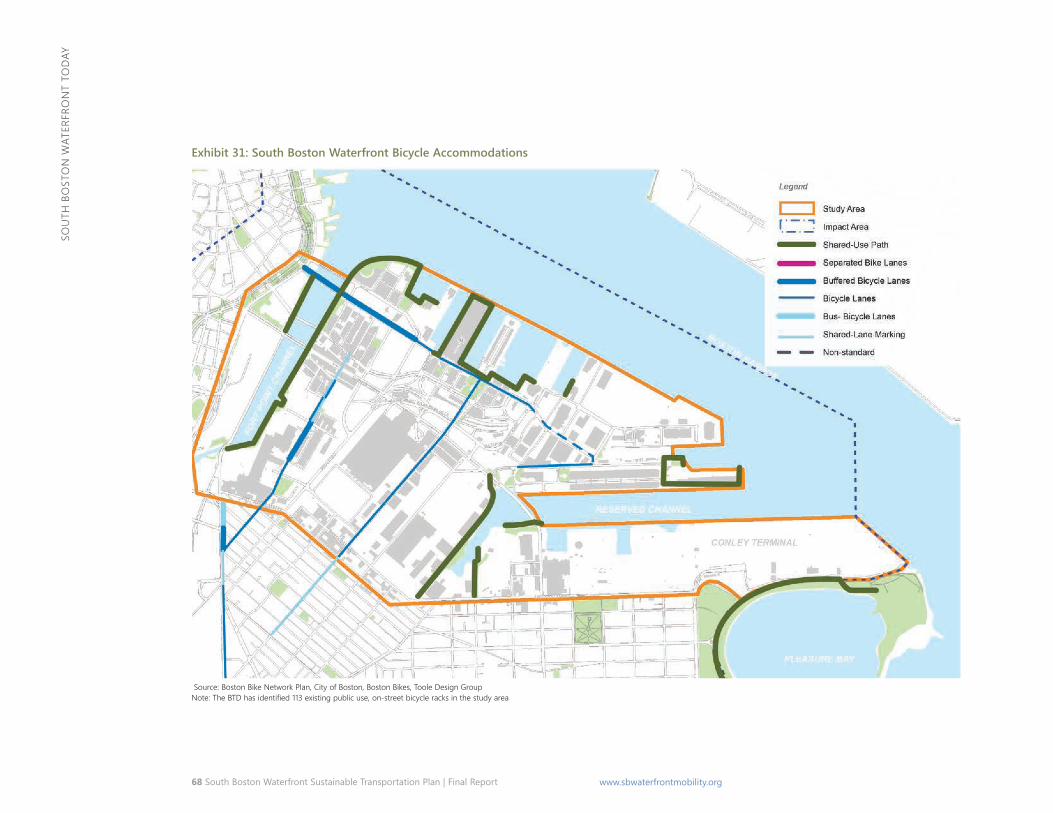
68 South Boston Waterfront Sustainable Transportation Plan | Final Report www.sbwaterfrontmobility.org
Sou
th B
oSt
oN
wat
erfr
oN
t to
DaY
Exhibit 31: South Boston Waterfront Bicycle Accommodations
Source: Boston Bike Network Plan, City of Boston, Boston Bikes, toole Design Group Note: The BTD has identified 113 existing public use, on-street bicycle racks in the study area
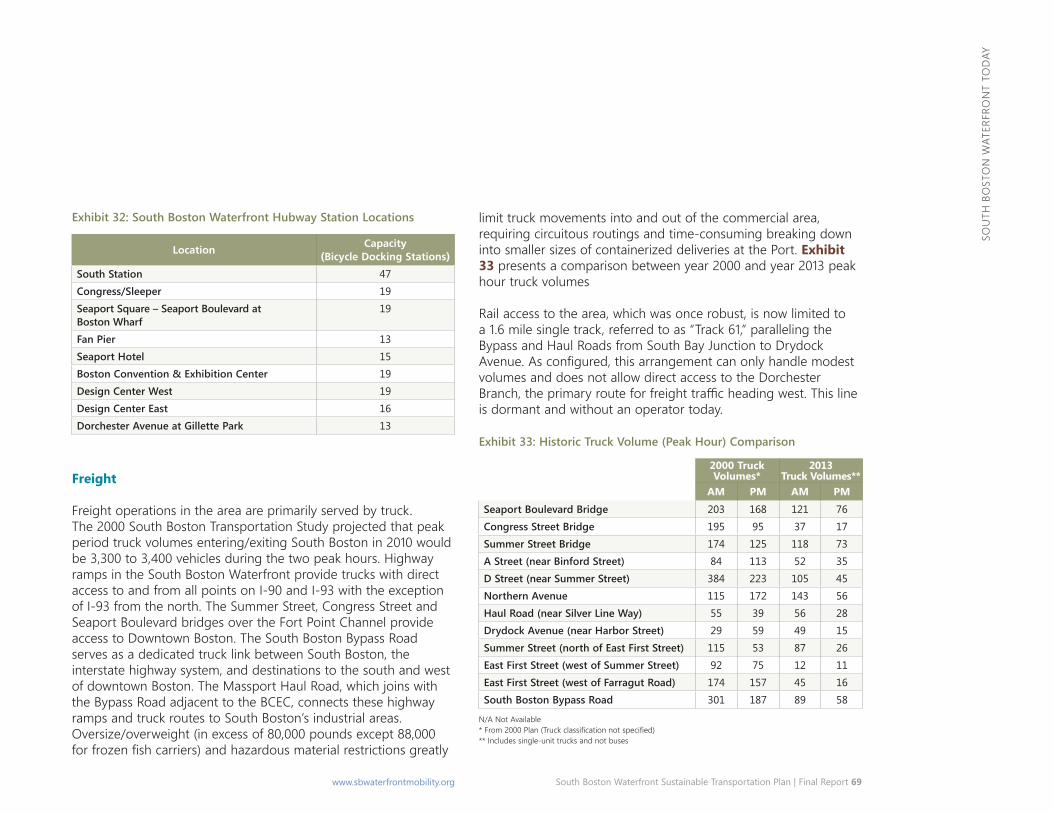
South Boston Waterfront Sustainable Transportation Plan | Final Report 69www.sbwaterfrontmobility.org
Sou
th B
oSt
oN
wat
erfr
oN
t to
DaY
Exhibit 32: South Boston Waterfront Hubway Station Locations
Location Capacity
(Bicycle Docking Stations)
South Station 47
Congress/Sleeper 19
Seaport Square – Seaport Boulevard at Boston Wharf
19
Fan Pier 13
Seaport Hotel 15
Boston Convention & Exhibition Center 19
Design Center West 19
Design Center East 16
Dorchester Avenue at Gillette Park 13
Freight
freight operations in the area are primarily served by truck. the 2000 South Boston transportation Study projected that peak period truck volumes entering/exiting South Boston in 2010 would be 3,300 to 3,400 vehicles during the two peak hours. highway ramps in the South Boston waterfront provide trucks with direct access to and from all points on I-90 and I-93 with the exception of I-93 from the north. the Summer Street, Congress Street and Seaport Boulevard bridges over the fort Point Channel provide access to Downtown Boston. the South Boston Bypass road serves as a dedicated truck link between South Boston, the interstate highway system, and destinations to the south and west of downtown Boston. the Massport haul road, which joins with the Bypass road adjacent to the BCeC, connects these highway ramps and truck routes to South Boston’s industrial areas. oversize/overweight (in excess of 80,000 pounds except 88,000 for frozen fish carriers) and hazardous material restrictions greatly
limit truck movements into and out of the commercial area, requiring circuitous routings and time-consuming breaking down into smaller sizes of containerized deliveries at the Port. Exhibit 33 presents a comparison between year 2000 and year 2013 peak hour truck volumes
rail access to the area, which was once robust, is now limited to a 1.6 mile single track, referred to as “Track 61,” paralleling the Bypass and haul roads from South Bay Junction to Drydock Avenue. As configured, this arrangement can only handle modest volumes and does not allow direct access to the Dorchester Branch, the primary route for freight traffic heading west. This line is dormant and without an operator today.
Exhibit 33: Historic Truck Volume (Peak Hour) Comparison
2000 Truck Volumes*
2013 Truck Volumes**
AM PM AM PM
Seaport Boulevard Bridge 203 168 121 76
Congress Street Bridge 195 95 37 17
Summer Street Bridge 174 125 118 73
A Street (near Binford Street) 84 113 52 35
D Street (near Summer Street) 384 223 105 45
Northern Avenue 115 172 143 56
Haul Road (near Silver Line Way) 55 39 56 28
Drydock Avenue (near Harbor Street) 29 59 49 15
Summer Street (north of East First Street) 115 53 87 26
East First Street (west of Summer Street) 92 75 12 11
East First Street (west of Farragut Road) 174 157 45 16
South Boston Bypass Road 301 187 89 58
* From 2000 Plan (Truck classification not specified) ** Includes single-unit trucks and not buses
N/a Not available
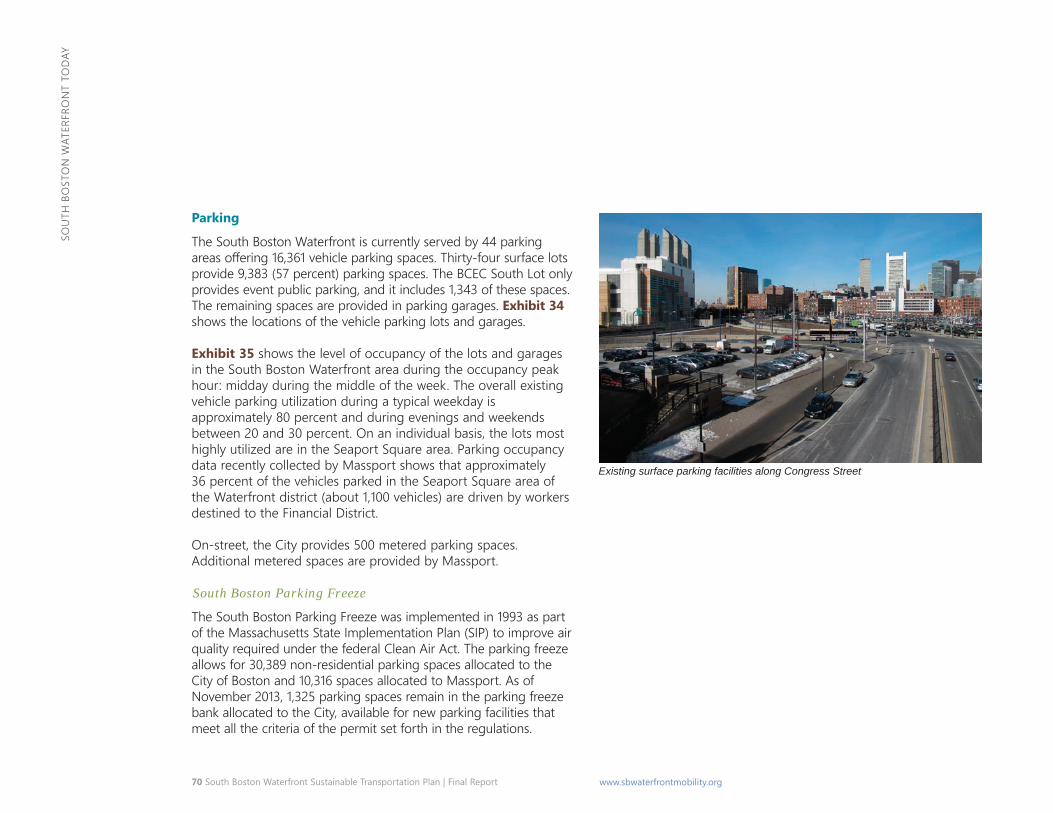
70 South Boston Waterfront Sustainable Transportation Plan | Final Report www.sbwaterfrontmobility.org
Sou
th B
oSt
oN
wat
erfr
oN
t to
DaY
Parking
the South Boston waterfront is currently served by 44 parking areas offering 16,361 vehicle parking spaces. Thirty-four surface lots provide 9,383 (57 percent) parking spaces. the BCeC South Lot only provides event public parking, and it includes 1,343 of these spaces. the remaining spaces are provided in parking garages. Exhibit 34 shows the locations of the vehicle parking lots and garages.
Exhibit 35 shows the level of occupancy of the lots and garages in the South Boston waterfront area during the occupancy peak hour: midday during the middle of the week. the overall existing vehicle parking utilization during a typical weekday is approximately 80 percent and during evenings and weekends between 20 and 30 percent. on an individual basis, the lots most highly utilized are in the Seaport Square area. Parking occupancy data recently collected by Massport shows that approximately 36 percent of the vehicles parked in the Seaport Square area of the waterfront district (about 1,100 vehicles) are driven by workers destined to the financial District.
on-street, the City provides 500 metered parking spaces. additional metered spaces are provided by Massport.
South Boston Parking Freeze
the South Boston Parking freeze was implemented in 1993 as part of the Massachusetts State Implementation Plan (SIP) to improve air quality required under the federal Clean air act. the parking freeze allows for 30,389 non-residential parking spaces allocated to the City of Boston and 10,316 spaces allocated to Massport. as of November 2013, 1,325 parking spaces remain in the parking freeze bank allocated to the City, available for new parking facilities that meet all the criteria of the permit set forth in the regulations.
Existing surface parking facilities along Congress Street
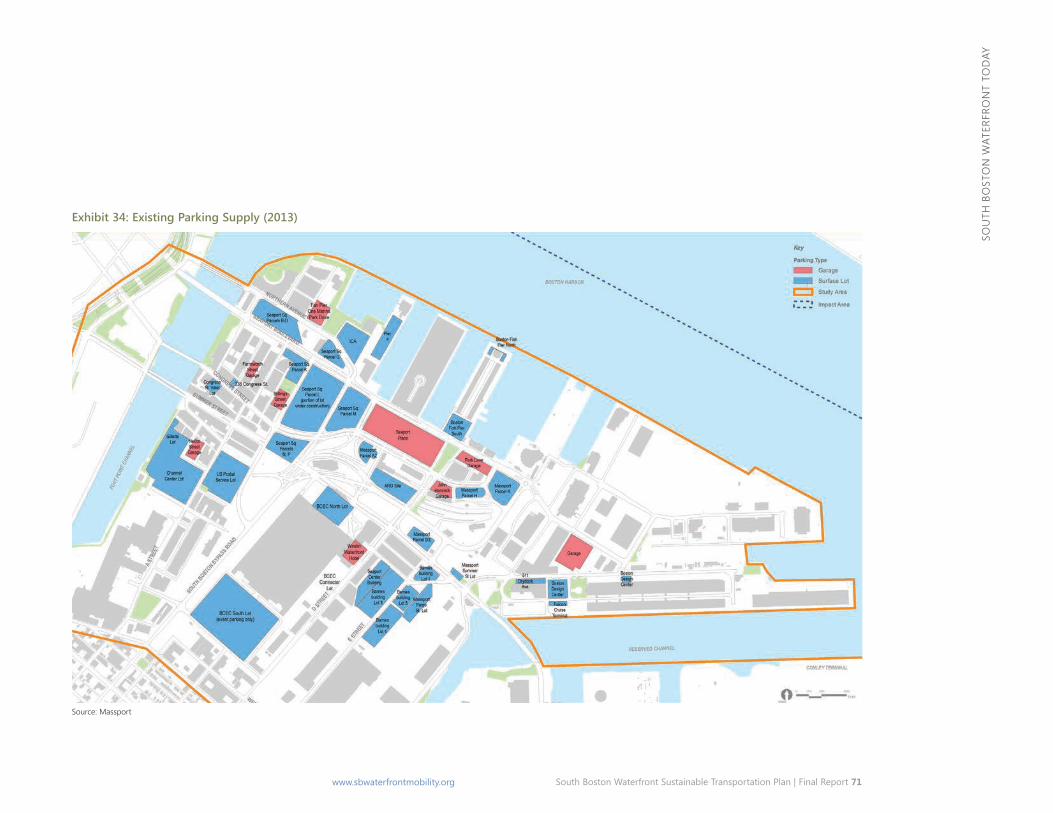
South Boston Waterfront Sustainable Transportation Plan | Final Report 71www.sbwaterfrontmobility.org
Sou
th B
oSt
oN
wat
erfr
oN
t to
DaY
Exhibit 34: Existing Parking Supply (2013)
Source: Massport
72 South Boston Waterfront Sustainable Transportation Plan | Final Report www.sbwaterfrontmobility.org
Sou
th B
oSt
oN
wat
erfr
oN
t to
DaY
*
Exhibit 35: Existing Parking Demand
Source: Massport
South Boston Waterfront Sustainable Transportation Plan | Final Report 73www.sbwaterfrontmobility.org
Sou
th B
oSt
oN
wat
erfr
oN
t to
DaY
Waterfront Public Realm the South Boston waterfront is large in scale and diverse in nature; these qualities present challenges to defining neighborhoods and developing a legible urban environment that establishes a sense of place. By comparison, almost all of the well established neighborhoods in Boston’s Downtown core area, from North Station to South Station and from the Downtown waterfront to the eastern edge of Back Bay, would fit in the South Boston Waterfront study area (see Exhibit 36). Given the scale of the South Boston waterfront as Downtown Boston expands beyond its core, it is critical for the next phases of the waterfront development to be perceived as a collection of mixed-use neighborhoods and districts, each with its own character, yet part of the whole.
the South Boston waterfront Sustainable transportation Plan focuses on access, mobility, connections, and integrated multimodal approaches to transportation and land use planning for short, middle and longer-term improvements, but the proper integration and interplay of transportation, land use, density and intensity of use, environmental, streetscape planning, and design strategies must be kept in mind to help create a successful and memorable public realm.
the City’s 1999 Seaport Public realm Plan for the South Boston waterfront established the intent and framework for streets, blocks, open space and building form to ensure an integrated public realm environment of distinctive character and lasting quality, executed in a consistent manner. Since then, the area has experienced intensive construction; new projects are coming online, or are now in detailed planning phases. Developers and City planners have used this plan as a framework for project development and review. as the transportation plans for the South Boston waterfront are updated, there is an opportunity to review and revise the Seaport Public realm Plan to better support the evolving urban environment.
74 South Boston Waterfront Sustainable Transportation Plan | Final Report www.sbwaterfrontmobility.org
Sou
th B
oSt
oN
wat
erfr
oN
t to
DaY
Given the scale of the South Boston Waterfront, it is critical that the next phases of development define a collection of mixed-use neighborhoods, each with its own character, yet part of the whole.
Exhibit 36: Neighborhood Scale Comparison – Downtown Boston
14 Neighborhoods/Sub-districts
South Boston Waterfront Sustainable Transportation Plan | Final Report 75www.sbwaterfrontmobility.org
Sou
th B
oSt
oN
wat
erfr
oN
t to
DaY
The varying street and block patterns of the Waterfront can provide a design strategy to organize a series of smaller neighborhoods, each with a distinctive character.
an initial review of the public realm, as it is evolving, reveals the issues and design opportunities as follows:
Streets and Blocks � the street and block patterns (size, shape, orientation and
resulting building form) as the plan builds out vary greatly across the District. this pattern can be used as a design strategy to organize the South Boston waterfront as a series of smaller sub-districts or neighborhoods, each with its own design character and iconic public place or street.
� the City’s adopted Complete Streets guidelines, as well as design guidelines for specific districts, will guide future design in this area.
� there is not yet a clear designation or distinction of streets as to their level of importance, role, function, or design character.
� the secondary street network is beginning to evolve on a project by project basis, but has yet to sum to a coherent, interconnected network.
� accommodation of the full range of users, including automobiles, buses, trucks (where appropriate), bicycles, as well as pedestrians, is inconsistent across the South Boston Waterfront and offers significant opportunity for improvement.
� Summer Street’s upper level viaduct and world trade Center avenue provide important connections but are not well integrated with the at-grade street network.
� the street network, to date, has not maximized access to the water; nor developed a coherent interconnected framework of secondary streets and public ways that lead to the water.
� the zone around the Convention Center and over the highway infrastructure is currently a barrier to circulation.
� there is a lack of connectivity between the elevated bridge on Summer Street and a Street.
Seaport Boulevard
Congress Street
Summer Street
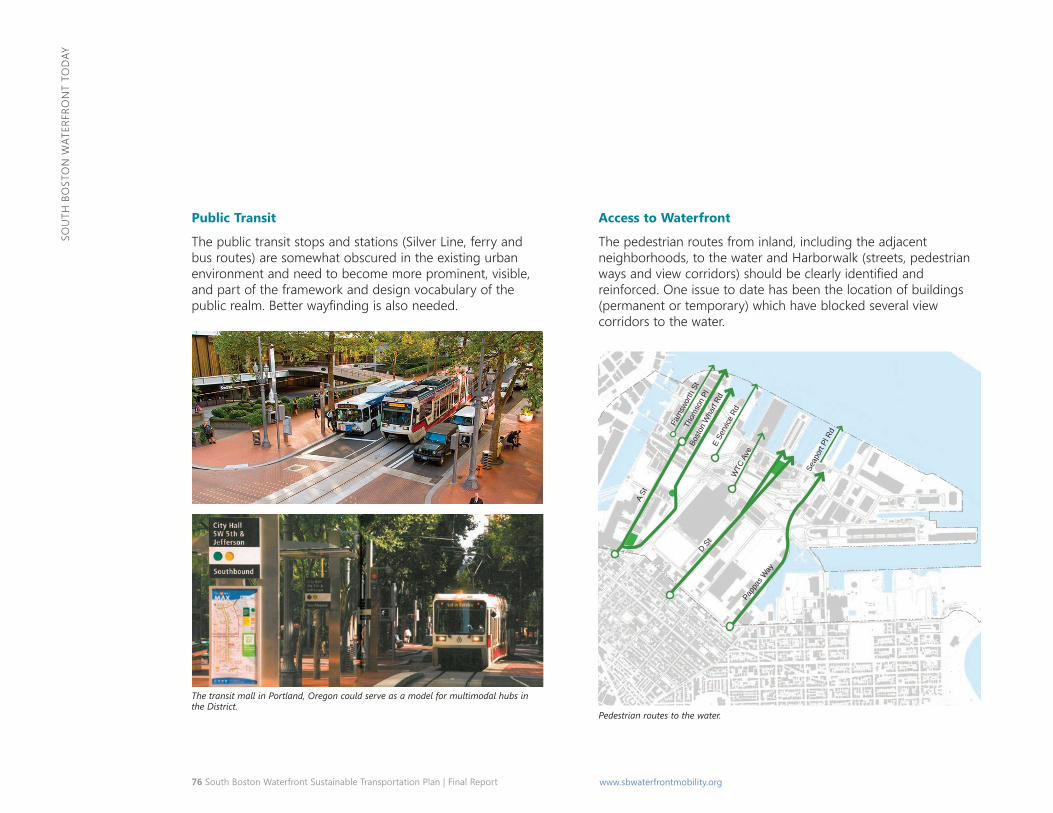
76 South Boston Waterfront Sustainable Transportation Plan | Final Report www.sbwaterfrontmobility.org
Sou
th B
oSt
oN
wat
erfr
oN
t to
DaY
Page 17
North-South Streets
Public Transit
the public transit stops and stations (Silver Line, ferry and bus routes) are somewhat obscured in the existing urban environment and need to become more prominent, visible, and part of the framework and design vocabulary of the public realm. Better wayfinding is also needed.
The transit mall in Portland, Oregon could serve as a model for multimodal hubs in the District.
Access to Waterfront
the pedestrian routes from inland, including the adjacent neighborhoods, to the water and harborwalk (streets, pedestrian ways and view corridors) should be clearly identified and reinforced. one issue to date has been the location of buildings (permanent or temporary) which have blocked several view corridors to the water.
Pedestrian routes to the water.
A St
Thom
son
Pl
Farn
swor
th S
t
E Se
rvice
Rd
WTC
Ave
Bost
on W
harf
Rd
Pappa
s Way
Seap
ort P
l Rd
D St
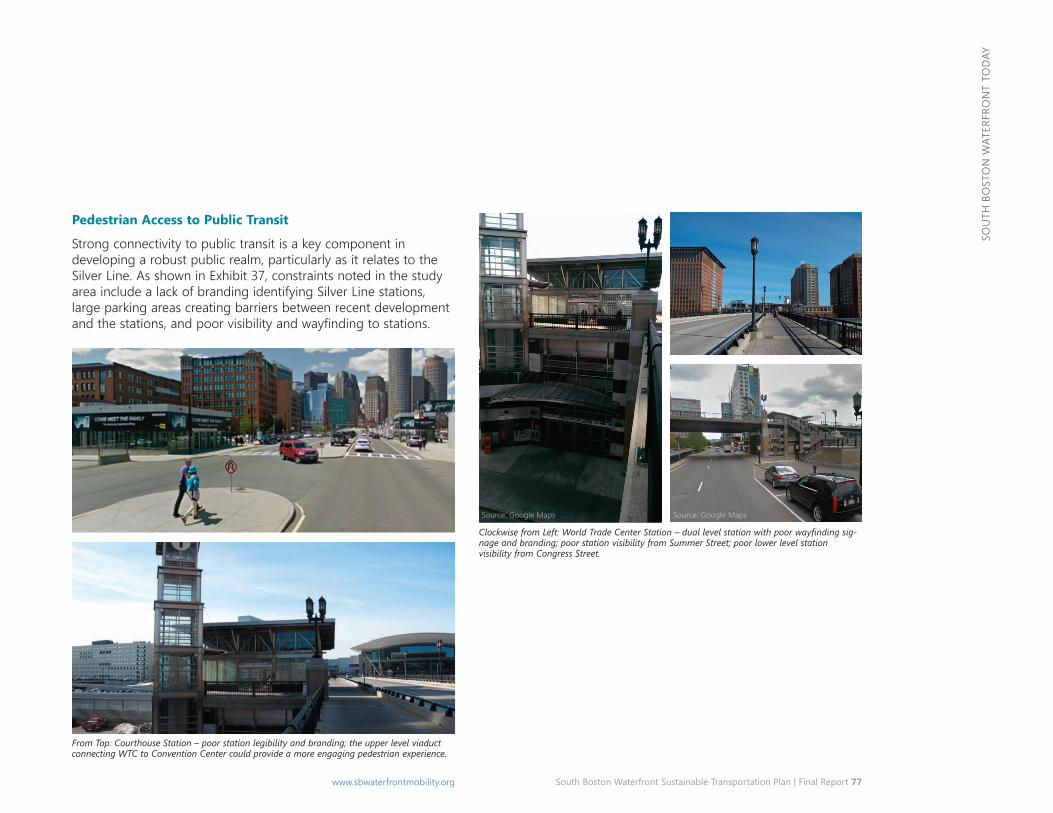
South Boston Waterfront Sustainable Transportation Plan | Final Report 77www.sbwaterfrontmobility.org
Sou
th B
oSt
oN
wat
erfr
oN
t to
DaY
Pedestrian Access to Public Transit
Strong connectivity to public transit is a key component in developing a robust public realm, particularly as it relates to the Silver Line. as shown in exhibit 37, constraints noted in the study area include a lack of branding identifying Silver Line stations, large parking areas creating barriers between recent development and the stations, and poor visibility and wayfinding to stations.
From Top: Courthouse Station – poor station legibility and branding; the upper level viaduct connecting WTC to Convention Center could provide a more engaging pedestrian experience.
Source: Google Maps
Clockwise from Left: World Trade Center Station – dual level station with poor wayfinding sig-nage and branding; poor station visibility from Summer Street; poor lower level station visibility from Congress Street.
Source: Google Maps
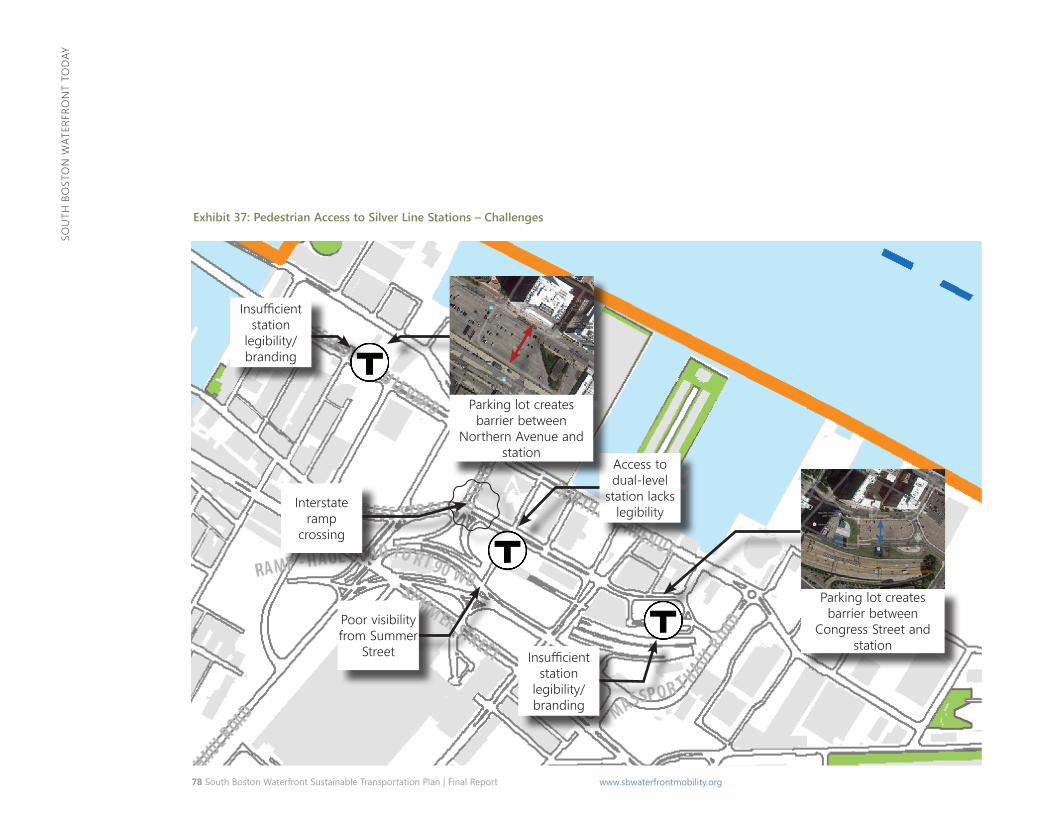
78 South Boston Waterfront Sustainable Transportation Plan | Final Report www.sbwaterfrontmobility.org
Sou
th B
oSt
oN
wat
erfr
oN
t to
DaY
Exhibit 37: Pedestrian Access to Silver Line Stations – Challenges
Insufficient station
legibility/branding
access to dual-level
station lacks legibility
Parking lot creates barrier between
Northern avenue and station
Parking lot creates barrier between
Congress Street and station
Insufficient station
legibility/branding
Poor visibility from Summer
Street
Interstate ramp
crossing
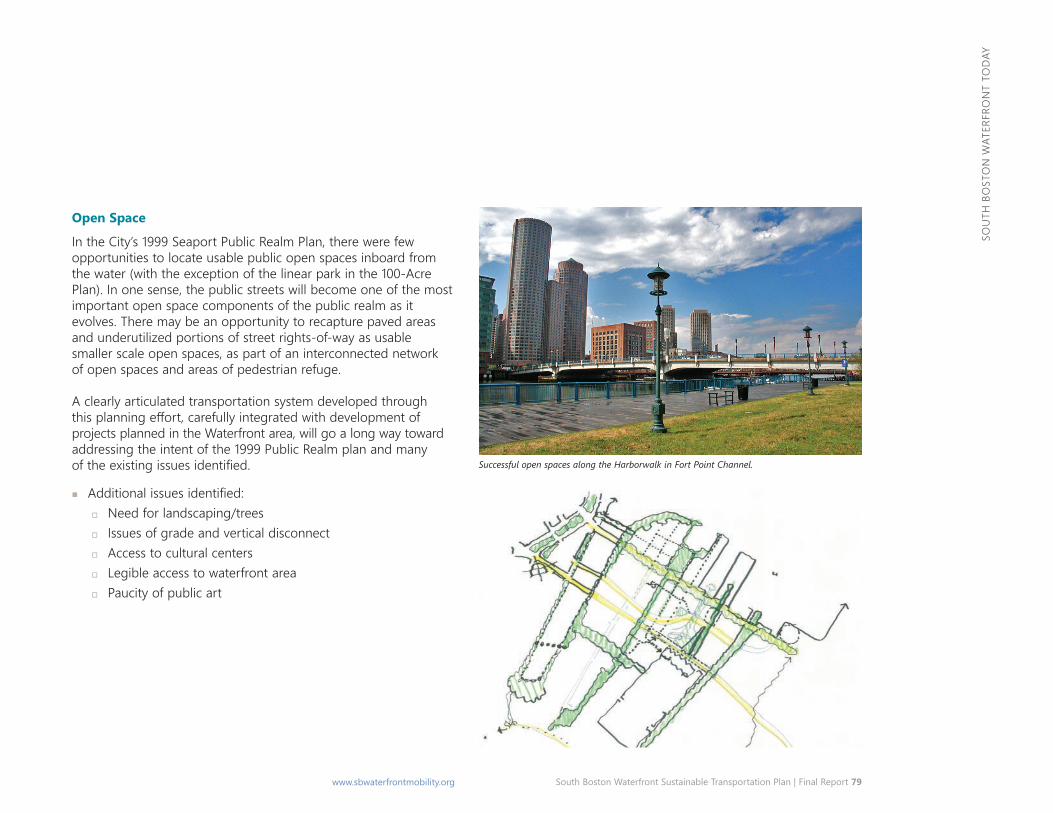
South Boston Waterfront Sustainable Transportation Plan | Final Report 79www.sbwaterfrontmobility.org
Sou
th B
oSt
oN
wat
erfr
oN
t to
DaY
Open Space
In the City’s 1999 Seaport Public realm Plan, there were few opportunities to locate usable public open spaces inboard from the water (with the exception of the linear park in the 100-acre Plan). In one sense, the public streets will become one of the most important open space components of the public realm as it evolves. there may be an opportunity to recapture paved areas and underutilized portions of street rights-of-way as usable smaller scale open spaces, as part of an interconnected network of open spaces and areas of pedestrian refuge.
a clearly articulated transportation system developed through this planning effort, carefully integrated with development of projects planned in the waterfront area, will go a long way toward addressing the intent of the 1999 Public realm plan and many of the existing issues identified.
� Additional issues identified: � Need for landscaping/trees � Issues of grade and vertical disconnect � access to cultural centers � Legible access to waterfront area � Paucity of public art
Successful open spaces along the Harborwalk in Fort Point Channel.
80 South Boston Waterfront Sustainable Transportation Plan | Final Report www.sbwaterfrontmobility.org
Sou
th B
oSt
oN
wat
erfr
oN
t t
oM
orr
ow
SouTh BoSToN WaTeRFRoNT ToMoRRoW City building in the South Boston waterfront district began in earnest two decades ago and continues to evolve today. while the vibrant port and maritime activities anchor the district, much of the land around the port and east of the fort Point Channel has been or is planned for redevelopment. a comprehensive plan for additional transportation infrastructure to serve this growing and dynamic part of the city has been largely uncharted.
to understand future transportation needs, it is important to reflect on how the mix of development, location of densities, changing patterns, and planned projects influence and impact travel demands on the transportation infrastructure. Much of the future development in the South Boston waterfront area has been defined through local and state permitting processes, although some development plans are more speculative than others and there are limitations on the pace of development space absorption in the marketplace. working closely with the City of Boston and other sponsoring agencies, the team identified a 20-year (2035) and “full Build-out” land use scenarios on which to forecast transportation demands and test future transportation alternatives.
Future Waterfront Land Use Future land use assumptions were developed for a 2035 condition and for a Build-out condition of the South Boston Waterfront study area, using the Boston Redevelopment Authority (BRA) project pipeline as a starting point. the Bra tracks all
development projects underway by neighborhood from the initial letter of intent filing through board approval and construction. additional insight on development potential and likely use for other properties in the study area were provided by the City and Massport for other properties in the study area. Population and employment by type were estimated based on average household size and use-specific employment density ratios approved by the BRA. Most long-term transportation plans examine a 20-year planning horizon; hence, the South Boston waterfront Sustainable Transportation Plan focuses on a future build year of 2035. To develop land use assumptions corresponding to the 2035 condition, recent absorption trends in the study area (between 2010 and 2013) were analyzed and annualized growth rates in residential units and commercial square footage were developed and applied to the pipeline of projects. The resultant 2035 land use forecast is shown in Exhibit 39.
The Build-out condition represents the balance of projects or portions of projects identified for future development in the study area, albeit with some level of uncertainty regarding the schedule of project construction. recognizing that the entirety of the pipeline of projects and resulting evolution of land uses in the Waterfront will not be complete by 2035, the balance of the pipeline projects was assumed to constitute a beyond 2035, or “Build-out condition” for the study area (Exhibit 40). It should be noted that the future Build-out of the Waterfront is dependent upon market conditions and cycles, making it impossible to predict the pace of development with full certainty.
the approach used for this study provides a more current estimate of 2035 conditions than would the use of the Boston Metropolitan Planning Organization’s Regional Transportation Plan (RTP) demographic forecasts, as is commonly done for projects of this type. Since the most recent RTP was approved in 2011, significant developments have occurred which were not fully accounted for in
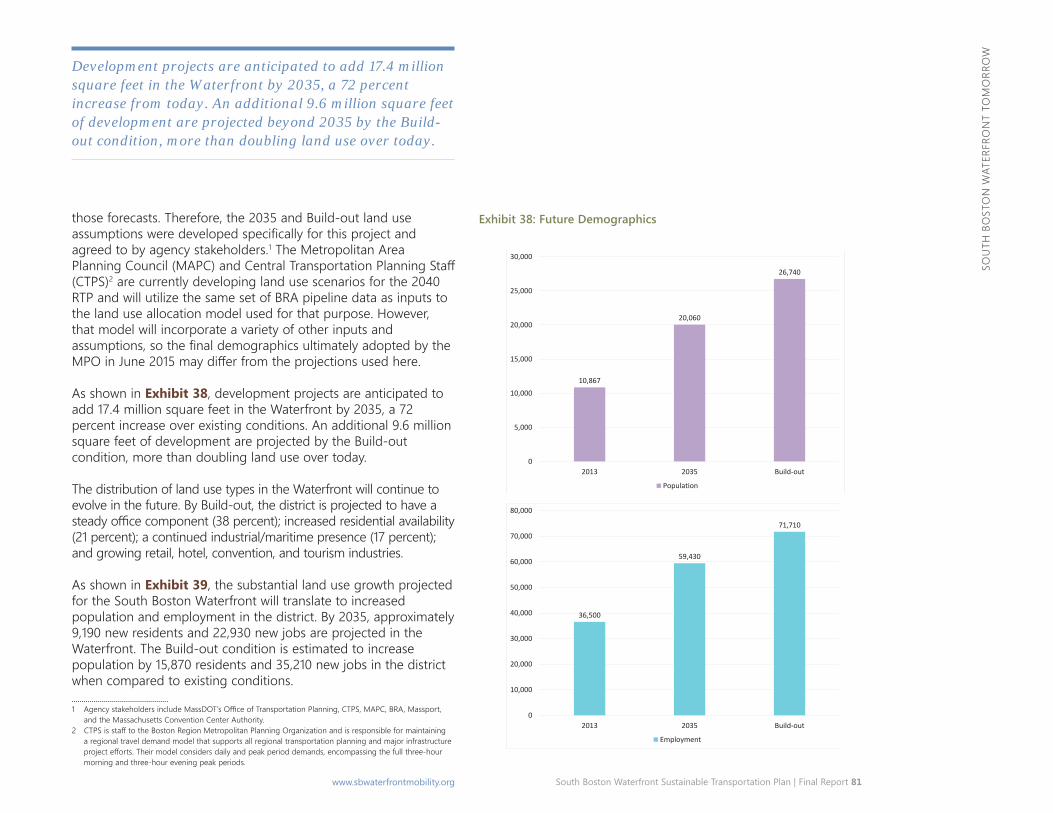
South Boston Waterfront Sustainable Transportation Plan | Final Report 81 www.sbwaterfrontmobility.org
Sou
th B
oSt
oN
wat
erfr
oN
t to
Mo
rro
w
those forecasts. Therefore, the 2035 and Build-out land use assumptions were developed specifically for this project and agreed to by agency stakeholders.1 the Metropolitan area Planning Council (MAPC) and Central Transportation Planning Staff (CTPS)2 are currently developing land use scenarios for the 2040 rtP and will utilize the same set of Bra pipeline data as inputs to the land use allocation model used for that purpose. however, that model will incorporate a variety of other inputs and assumptions, so the final demographics ultimately adopted by the MPO in June 2015 may differ from the projections used here.
1 Agency stakeholders include MassDOT’s Office of Transportation Planning, CTPS, MAPC, BRA, Massport, and the Massachusetts Convention Center authority.
2 CTPS is staff to the Boston Region Metropolitan Planning Organization and is responsible for maintaining a regional travel demand model that supports all regional transportation planning and major infrastructure project efforts. Their model considers daily and peak period demands, encompassing the full three-hour morning and three-hour evening peak periods.
Development projects are anticipated to add 17.4 million square feet in the Waterfront by 2035, a 72 percent increase from today. An additional 9.6 million square feet of development are projected beyond 2035 by the Build-out condition, more than doubling land use over today.
as shown in Exhibit 38, development projects are anticipated to add 17.4 million square feet in the Waterfront by 2035, a 72 percent increase over existing conditions. An additional 9.6 million square feet of development are projected by the Build-out condition, more than doubling land use over today.
the distribution of land use types in the waterfront will continue to evolve in the future. By Build-out, the district is projected to have a steady office component (38 percent); increased residential availability (21 percent); a continued industrial/maritime presence (17 percent); and growing retail, hotel, convention, and tourism industries.
as shown in Exhibit 39, the substantial land use growth projected for the South Boston waterfront will translate to increased population and employment in the district. By 2035, approximately 9,190 new residents and 22,930 new jobs are projected in the Waterfront. The Build-out condition is estimated to increase population by 15,870 residents and 35,210 new jobs in the district when compared to existing conditions.
Exhibit 38: Future Demographics
10,867
20,060
26,740
0
5,000
10,000
15,000
20,000
25,000
30,000
2013 2035 Build-out
Population
36,500
59,430
71,710
0
10,000
20,000
30,000
40,000
50,000
60,000
70,000
80,000
2013 2035 Build-out
Employment
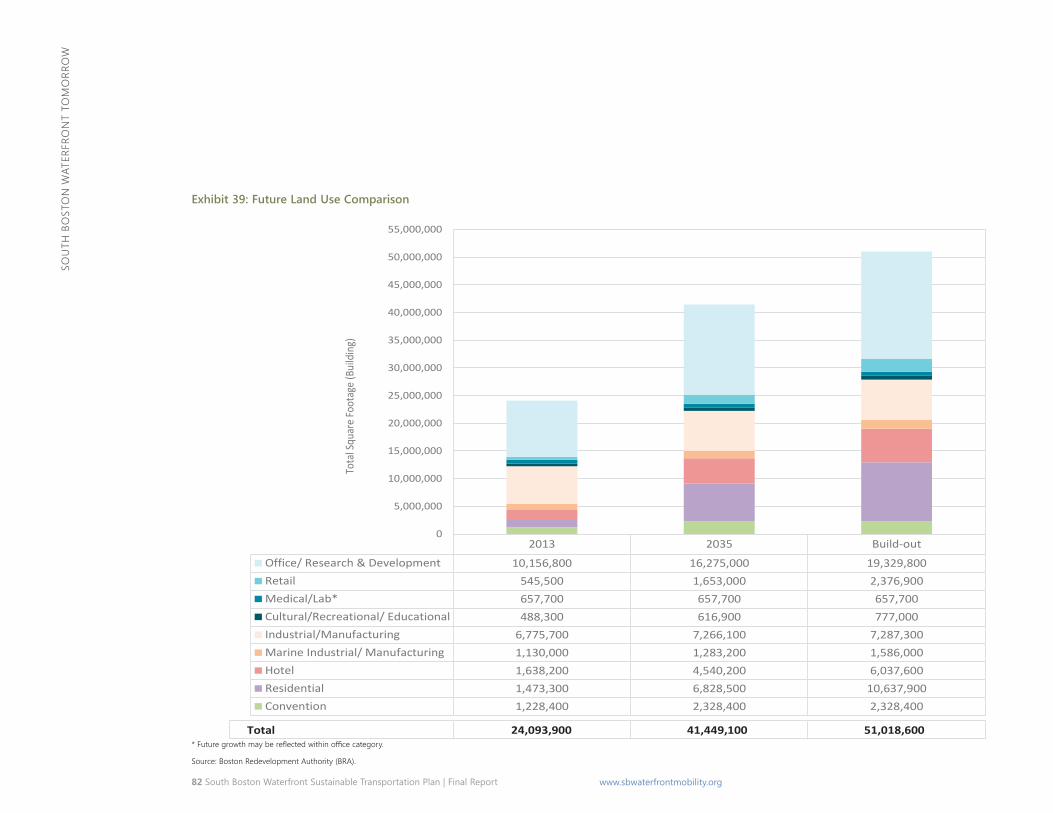
82 South Boston Waterfront Sustainable Transportation Plan | Final Report www.sbwaterfrontmobility.org
Sou
th B
oSt
oN
wat
erfr
oN
t to
Mo
rro
w
Exhibit 39: Future Land Use Comparison
0
5,000,000
10,000,000
15,000,000
20,000,000
25,000,000
30,000,000
35,000,000
40,000,000
45,000,000
50,000,000
55,000,000
Tota
l Squ
are
Foot
age
(Bui
ldin
g)
2013 2035 Build-out
Office/ Research & Development 10,156,800 16,275,000 19,329,800 Retail 545,500 1,653,000 2,376,900 Medical/Lab* 657,700 657,700 657,700 Cultural/Recreational/ Educational 488,300 616,900 777,000 Industrial/Manufacturing 6,775,700 7,266,100 7,287,300 Marine Industrial/ Manufacturing 1,130,000 1,283,200 1,586,000 Hotel 1,638,200 4,540,200 6,037,600 Residential 1,473,300 6,828,500 10,637,900 Convention 1,228,400 2,328,400 2,328,400
Total 24,093,900 41,449,100 51,018,600 * Future growth may be reflected within office category.
Source: Boston Redevelopment Authority (BRA).
South Boston Waterfront Sustainable Transportation Plan | Final Report 83 www.sbwaterfrontmobility.org
Sou
th B
oSt
oN
wat
erfr
oN
t to
Mo
rro
w
By 2035, projects in the Waterfront are anticipated to add approximately 5.4 million square feet of residential space—essentially doubling housing stock in the district over existing conditions.
Live Here
By 2035, projects in the Waterfront are anticipated to add approximately 5.4 million square feet of residential space with 5,310 units and nearly 9,190 residents—essentially doubling housing stock in the district over existing conditions. Over 50 percent of this growth is projected to occur in the Seaport area due in large part to projects such as Waterside Place, Pier 4, Fan Pier, and Seaport Square.
Nearly 4,100 additional residential units—housing approximately 6,680 persons—are anticipated by the Build-out condition. In total, this represents a 179 percent growth in residential units and a 146 percent growth in population from existing conditions to the Build-out condition. This additional residential development is largely distributed between the Seaport and fort Point areas as the Fan Pier/Seaport Square and 100 Acres near completion.
as shown in Exhibit 40, the projected residential growth in the South Boston waterfront results in dense residential blocks along Seaport Boulevard/Congress Street and A Street that are comparable to population density in the traditional South Boston neighborhood and some blocks that are significantly denser due to the height of the residential building.
Work Here
Office, research and development (R&D) projects are projected to add over 6.1 million square feet and approximately 15,570 jobs to the Waterfront by 2035. This growth constitutes a 60 percent increase in office/medical/lab square footage over existing conditions. Vertex Pharmaceuticals (Fan Pier Parcels A/B) was occupied in early 2014 and comprises 1.1 million square feet of this total. other large developments contributing to the projected growth include additional fan Pier parcels, Seaport Square, Channel Center, Innovation Square at Northern Avenue, Pier 4, development
of several additional Massport parcels, and the steady development of parcels within 100 Acres (the southwestern area of the district).
By the Build-out condition, an additional 3.1 million square feet of office and R&D space creating approximately 8,750 new jobs are projected. In total, office/medical/lab space in the district is anticipated to grow by 90 percent.
as shown in Exhibit 41, Build-out developments are projected to fill in many of the existing gaps in employment throughout the study area with significant growth anticipated along the primary study area corridors of Seaport Boulevard, Congress Street, Summer Street, A Street, and D Street.
Working Port and Industries
In addition to traditional office and R&D growth, general and maritime industrial/manufacturing land use are projected to grow by approximately 8 percent by 2035 and an additional 4 percent under the Build-out condition. Industrial growth in the South Boston waterfront is largely attributed to the anticipated relocation of the United States Postal Service (USPS) general mail facility and expansion of the BMIP/Boston Cargo Terminal. In total, approximately 967,600 square feet and 1,950 new industrial jobs are projected.
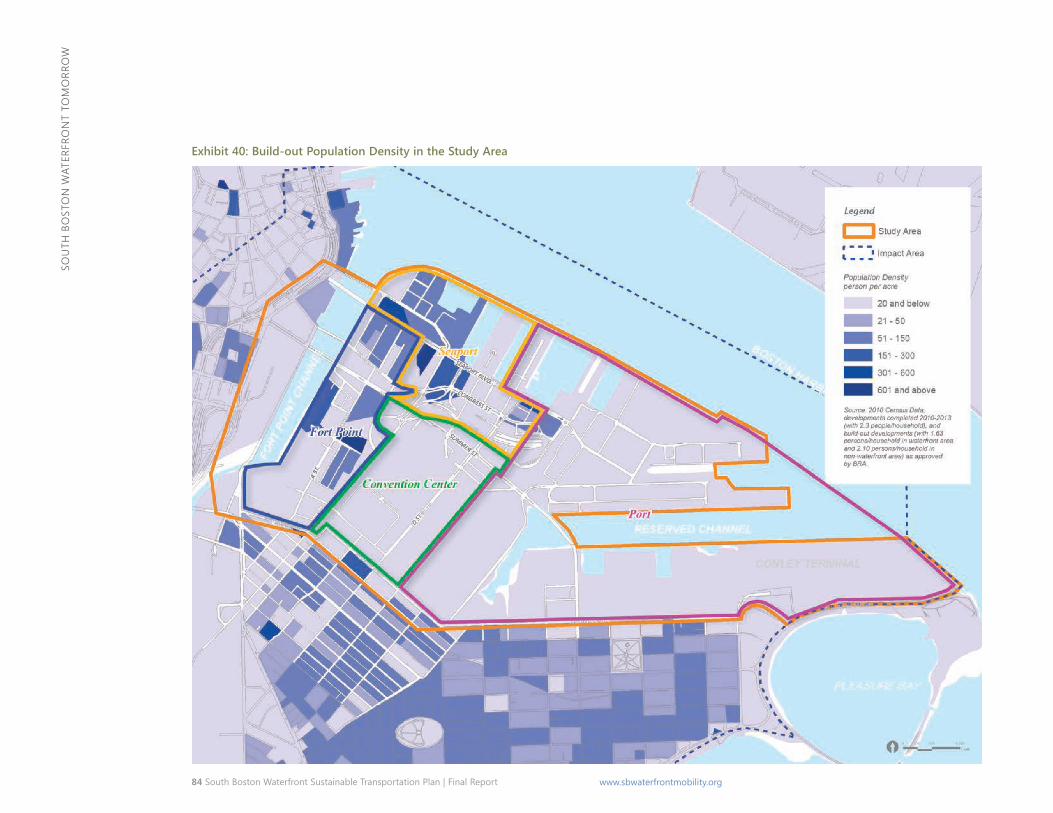
84 South Boston Waterfront Sustainable Transportation Plan | Final Report www.sbwaterfrontmobility.org
Sou
th B
oSt
oN
wat
erfr
oN
t to
Mo
rro
w
Exhibit 40: Build-out Population Density in the Study Area
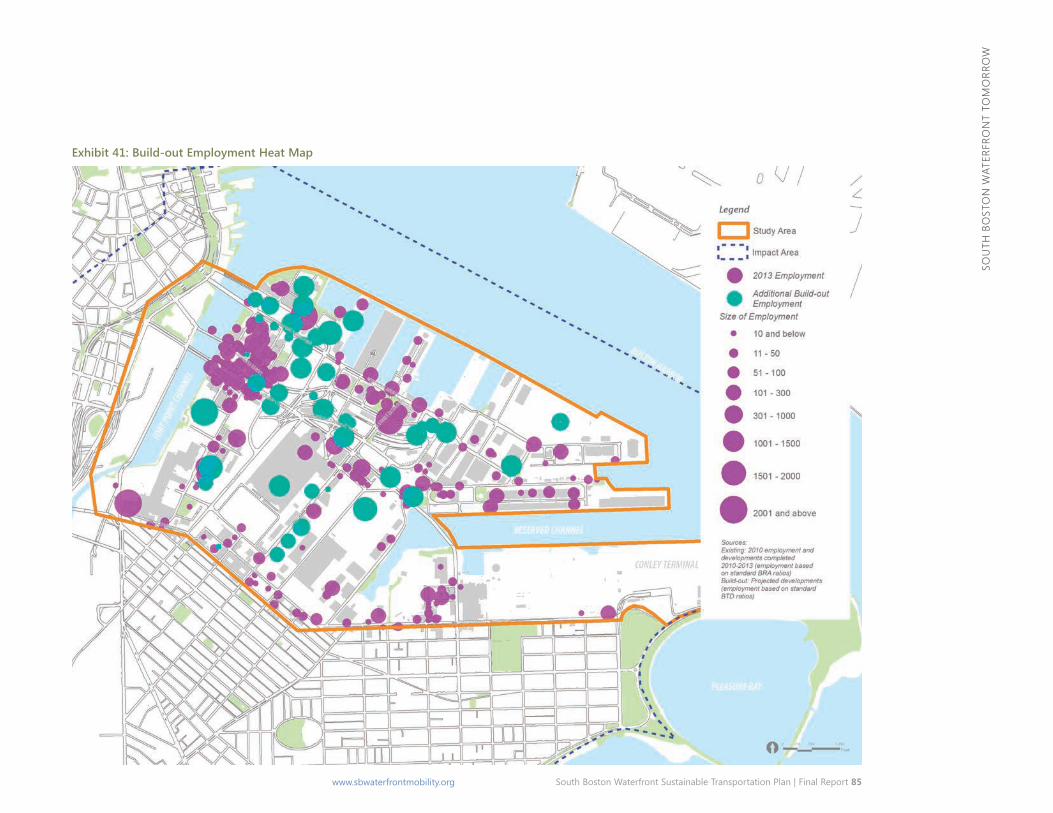
South Boston Waterfront Sustainable Transportation Plan | Final Report 85 www.sbwaterfrontmobility.org
Sou
th B
oSt
oN
wat
erfr
oN
t to
Mo
rro
w
Exhibit 41: Build-out Employment Heat Map
86 South Boston Waterfront Sustainable Transportation Plan | Final Report www.sbwaterfrontmobility.org
Sou
th B
oSt
oN
wat
erfr
oN
t to
Mo
rro
w
Convene Here
Since the Boston Convention & Exhibition Center (BCEC) opened in 2004, the Massachusetts Convention Center Authority (MCCA) has hosted 2,400 events, welcomed 7.2 million attendees to Boston, and generated 5.2 million hotel room nights. This activity has supported more than 5,300 jobs a year and produced $5.3 billion in economic impact for the Commonwealth.
On July 29, 2014, Massachusetts Governor Deval L. Patrick signed legislation that authorized the MCCa to move forward with an expansion of the BCEC. With the BCEC expansion, the MCCA predicts a 44 percent increase in major events, a 47 percent increase in hotel room nights, and a 21 percent increase in attendees annually at the BCEC. The BCEC expansion is included in the 2035 condition3 and is expected to nearly double the size of the current facility by adding:
3 The BCEC expansion is just getting underway with its own State and City environmental review and permitting processes.
� 335,000 square feet of exhibit space (new total of 850,000 square feet)
� 100,000 square feet of meeting space (new total of 260,000 square feet in 121 meeting rooms)
� An additional ballroom of 75,000 square feet (existing ballroom is 40,000 square feet)
� A second headquarters hotel with a minimum of 1,200 rooms, as well as approximately 100,000 square feet of meeting/ function space (two hotels totaling 510 rooms are currently under construction)
The expansion will allow the BCEC to host overlapping, multiple and larger-scale events. The MCCA has projected that with expansion the BCEC will host 15-20 more major events per year and generate an additional $184 million in economic impact
annually.4 The BCEC Expansion will be located on the existing South Parking Lot. Access to this new expansion will be provided via a new arrival plaza on D Street. Parking displaced as a result of the expansion will be moved to two proposed parking garages on land owned by the MCCA between D Street and E Street (together, the “MCCA Garages”).
4 Press release from the Massachusetts Convention Center Authority, July 30, 2014.
The MCCA has projected that an expanded BCEC will host 15-20 more major events per year and generate an additional $184 million in economic impact annually.
In addition to the direct convention-related opportunities that the BCEC expansion will provide, employment in the leisure and hospitality industry in Boston in general is forecast to grow by 1.2 percent per year in the foreseeable future.5 this growth will continue to fuel 24/7 transportation demands in the South Boston waterfront.
5 The Massachusetts Industry-Occupation Employment Matrix, 2012-2022 which reflects the unique mix of 670 occupations and 80 industries in Massachusetts Massachusetts Executive Office of Labor and Workforce Development.
Play Here
as land use in the district continues to evolve in the future, growth in retail, hotel and cultural space will further enhance the South Boston waterfront as a major destination for local and out-of-town visitors. Many proposed developments in the district are mixed-use in nature and include ground-floor retail components. By 2035, over 1.1 million square feet of retail are proposed in the Waterfront—tripling the space that is available now. An additional 723,900 square feet of retail are envisioned by the Build-out condition. In addition to improving the visitor experience and providing amenities to Waterfront residents, retail space is anticipated to add approximately 2,730 jobs to the district by the Build-out condition.
The addition of approximately 4,310 hotel rooms is proposed in the Waterfront by 2035—more than tripling the available rooms currently in the study area. three of the proposed hotels are
South Boston Waterfront Sustainable Transportation Plan | Final Report 87 www.sbwaterfrontmobility.org
Sou
th B
oSt
oN
wat
erfr
oN
t to
Mo
rro
w
currently under construction: Aloft and Element along D Street and envoy in the Seaport Square development area. the proposed Headquarters Hotel (1,200 rooms), Westin Hotel expansion, and several other private developments will also contribute to hotel growth in the Waterfront. An additional 2,210 hotel rooms are envisioned by Build-out of the district; including existing hotels, the Build-out capacity is estimated at 8,330 hotel rooms. The proposed hotel developments are anticipated to add approximately 4,910 jobs to the district.
By 2035, over 1.1 million square feet of retail is proposed in the Waterfront—tripling the space that is available now.
Several projects, including portions of Pier 4 and Seaport Square, will further enhance the visitor appeal of the South Boston Waterfront by adding a total of 128,600 square feet of civic/ cultural space (non-profit, community, educational space available for public use) by 2035 and an additional 160,100 square feet by Build-out of the district. In total, cultural space in the Waterfront is projected to increase by 59 percent over existing conditions.
Future Waterfront Access and Mobility understanding the impact of study area land use growth on multimodal transportation demands is critical to ensure that any transportation infrastructure investments recommended in this study anticipate future needs and provide long-term benefits for the City and the region. to translate the anticipated land use growth into multimodal transportation demands, CtPS regional travel demand model was utilized. The CTPS model, a traditional four-step travel demand forecasting tool (trip generation, trip distribution, mode choice, and trip assignment), estimates daily and peak period transportation demands by mode based on forecasts of study area demographics, transportation characteristics, and highway and transit network availability. the model factors highway congestion into its mode choice and assignment processes. transit capacity on existing services is unconstrained in that the model assumes that additional trains or buses can be added to meet demands. More
detail regarding model methodology and assumptions is provided in the Appendix to this report.
CTPS ran the model for the 2013 Existing and 2035 Base conditions (assuming no improvements to infrastructure beyond those included in the Long Range Plan) using land use assumptions detailed above. VhB completed a qualitative assessment of the Waterfront Build-out condition using the balance of the BRA pipeline projects. This analysis resulted in projected person-trip6 growth by mode. these forecasts will be the basis for testing future transportation improvements under consideration in the study area.
6 A trip by one person in any mode of transportation.
By 2035, total peak period person-trips with origins and/or destinations within the Waterfront are projected to grow by 58 to 67 percent over Existing (2013) Conditions (see Exhibit 42). By the Build-out of the district, total person-trips are anticipated to more than double over existing conditions.
Exhibit 42: South Boston Waterfront Forecasted Person-Trip Growth
Existing Conditions 20131 Future Base 20351 Future
Build-out2
AM Peak Period 36,600 57,700 (+58%)
73,500 (+ 101%)
PM Peak Period 47,700 79,800 (+67%)
100,300 (+110%)
1. Total three hour peak period based on CTPS regional travel demand model output. 2. Estimated by VHB based on 2035 CTPS regional travel demand model output with balance of the BRA pipeline land use projections (i.e. beyond 2035) added on (see Technical Appendix for details of Travel Demand Modeling methodology).
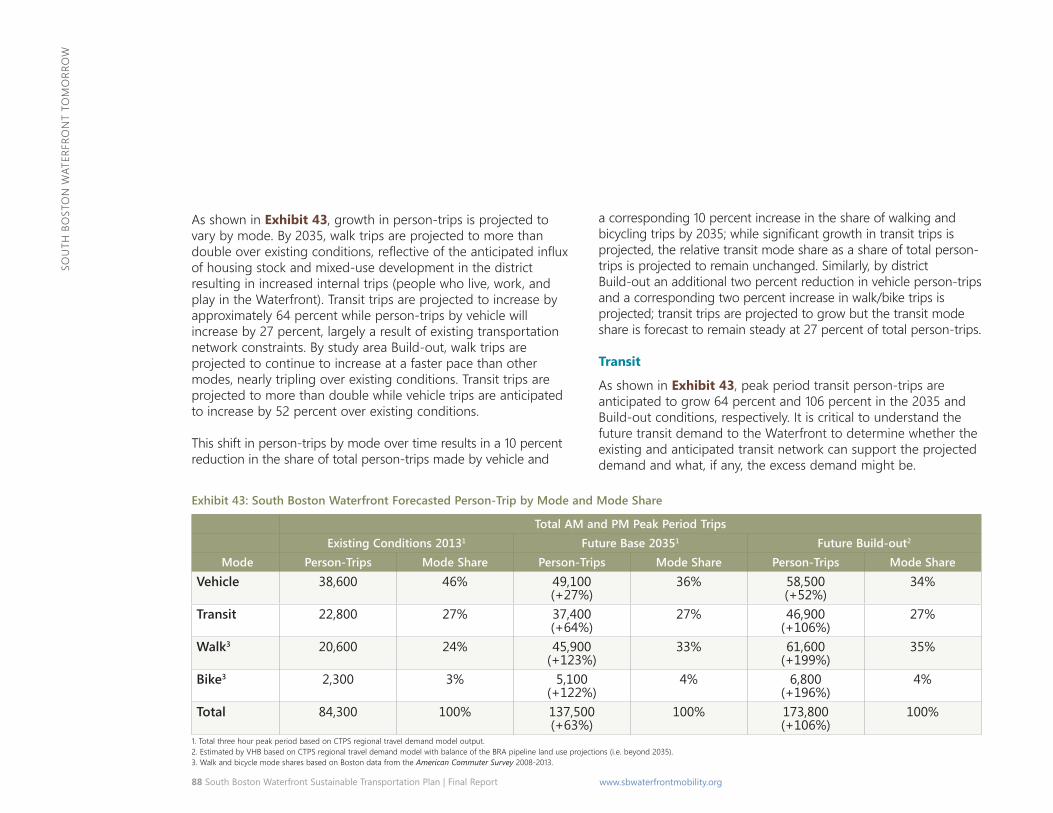
88 South Boston Waterfront Sustainable Transportation Plan | Final Report www.sbwaterfrontmobility.org
Sou
th B
oSt
oN
wat
erfr
oN
t to
Mo
rro
w
as shown in Exhibit 43, growth in person-trips is projected to vary by mode. By 2035, walk trips are projected to more than double over existing conditions, reflective of the anticipated influx of housing stock and mixed-use development in the district resulting in increased internal trips (people who live, work, and play in the Waterfront). Transit trips are projected to increase by approximately 64 percent while person-trips by vehicle will increase by 27 percent, largely a result of existing transportation network constraints. By study area Build-out, walk trips are projected to continue to increase at a faster pace than other modes, nearly tripling over existing conditions. Transit trips are projected to more than double while vehicle trips are anticipated to increase by 52 percent over existing conditions.
This shift in person-trips by mode over time results in a 10 percent reduction in the share of total person-trips made by vehicle and
a corresponding 10 percent increase in the share of walking and bicycling trips by 2035; while significant growth in transit trips is projected, the relative transit mode share as a share of total person-trips is projected to remain unchanged. Similarly, by district Build-out an additional two percent reduction in vehicle person-trips and a corresponding two percent increase in walk/bike trips is projected; transit trips are projected to grow but the transit mode share is forecast to remain steady at 27 percent of total person-trips.
Transit
as shown in Exhibit 43, peak period transit person-trips are anticipated to grow 64 percent and 106 percent in the 2035 and Build-out conditions, respectively. It is critical to understand the future transit demand to the waterfront to determine whether the existing and anticipated transit network can support the projected demand and what, if any, the excess demand might be.
Exhibit 43: South Boston Waterfront Forecasted Person-Trip by Mode and Mode Share
Total AM and PM Peak Period Trips Existing Conditions 20131 Future Base 20351 Future Build-out2
Mode Person-Trips Mode Share Person-Trips Mode Share Person-Trips Mode Share
Vehicle 38,600 46% 49,100 (+27%)
36% 58,500 (+52%)
34%
Transit 22,800 27% 37,400 (+64%)
27% 46,900 (+106%)
27%
Walk3 20,600 24% 45,900 (+123%)
33% 61,600 (+199%)
35%
Bike3 2,300 3% 5,100 (+122%)
4% 6,800 (+196%)
4%
Total 84,300 100% 137,500 (+63%)
100% 173,800 (+106%)
100%
1. Total three hour peak period based on CTPS regional travel demand model output. 2. Estimated by VHB based on CTPS regional travel demand model with balance of the BRA pipeline land use projections (i.e. beyond 2035). 3. Walk and bicycle mode shares based on Boston data from the American Commuter Survey 2008-2013.
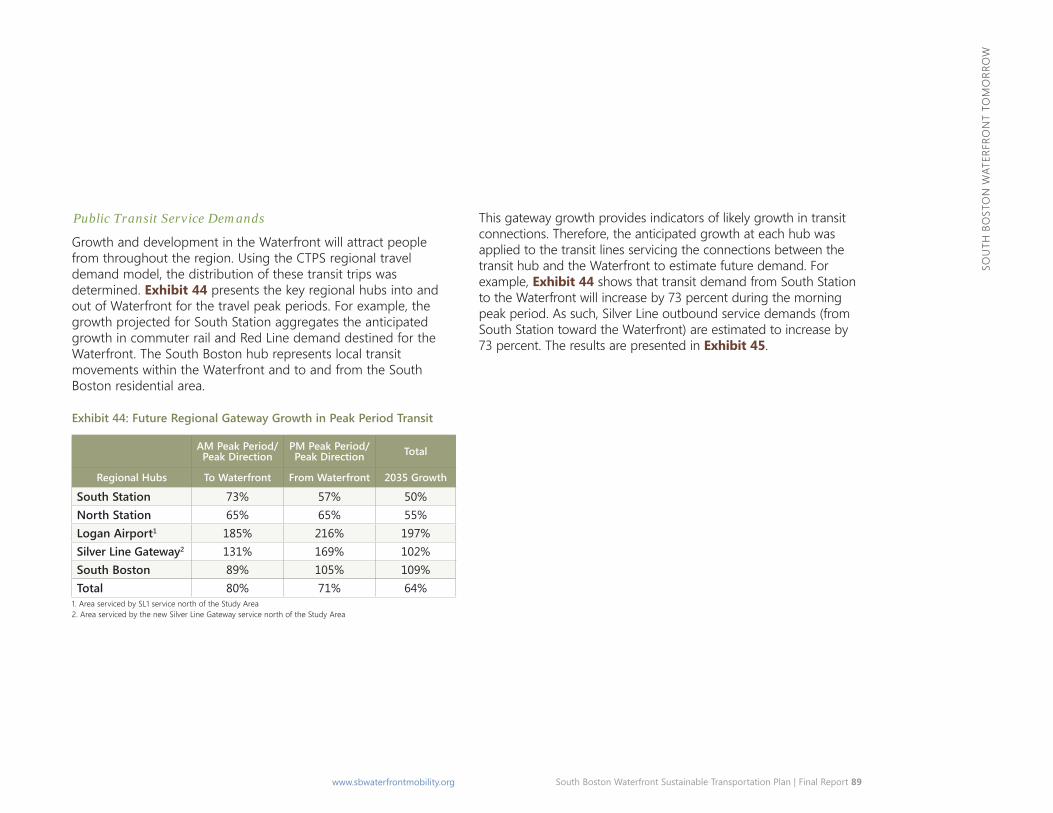
South Boston Waterfront Sustainable Transportation Plan | Final Report 89 www.sbwaterfrontmobility.org
Sou
th B
oSt
oN
wat
erfr
oN
t to
Mo
rro
w
Public Transit Service Demands
Growth and development in the waterfront will attract people from throughout the region. using the CtPS regional travel demand model, the distribution of these transit trips was determined. Exhibit 44 presents the key regional hubs into and out of Waterfront for the travel peak periods. For example, the growth projected for South Station aggregates the anticipated growth in commuter rail and red Line demand destined for the waterfront. the South Boston hub represents local transit movements within the waterfront and to and from the South Boston residential area.
Exhibit 44: Future Regional Gateway Growth in Peak Period Transit
AM Peak Period/ Peak Direction
PM Peak Period/ Peak Direction Total
Regional Hubs To Waterfront From Waterfront 2035 Growth
South Station 73% 57% 50% North Station 65% 65% 55% Logan Airport1 185% 216% 197% Silver Line Gateway2 131% 169% 102% South Boston 89% 105% 109% Total 80% 71% 64%
1. Area serviced by SL1 service north of the Study Area 2. Area serviced by the new Silver Line Gateway service north of the Study Area
this gateway growth provides indicators of likely growth in transit connections. therefore, the anticipated growth at each hub was applied to the transit lines servicing the connections between the transit hub and the waterfront to estimate future demand. for example, Exhibit 44 shows that transit demand from South Station to the Waterfront will increase by 73 percent during the morning peak period. As such, Silver Line outbound service demands (from South Station toward the Waterfront) are estimated to increase by 73 percent. The results are presented in Exhibit 45.

90 South Boston Waterfront Sustainable Transportation Plan | Final Report www.sbwaterfrontmobility.org
Sou
th B
oSt
oN
wat
erfr
oN
t to
Mo
rro
w
All transit route demands are near or above maximum capacity under 2035 conditions.
Exhibit 45: Peak Hour Peak Direction Transit Capacity with Anticipated Transit Growth
Route Critical Peak Hour Peak Direction1 Existing (2013) Demand Seated Capacity Max. Capacity 2035 Growth Estimated
Demand Demand/ Max Cap
Route 4 aM Inbound 126 195 275 114% 270 98% Route 7 aM Inbound 654 585 880 26%2 826 94% Route 11 aM Inbound 486 390 550 29%2 629 114% Silver Line 1 (741)3
PM Inbound 269 228 318 53% 412 140%
Silver Line 2 (742)3
aM outbound 971 564 792 73% 1,670 211%
Silver Line Way (746)3
aM outbound 837 564 792 73% 1,448 183%
1. Per MBTA directionality (i.e., Inbound is typically toward downtown) 2. Based on CTPS regional growth model; growth for individual routes based on daily trip ends 3. Potentially additional Silver Line trunk service capacity with introduction of Silver Line Gateway
as shown in Exhibit 46, without expanding the capacity of existing services or adding new transit services, all transit route demands are near or above maximum capacity under 2035 conditions. It is important to note that the introduction of Silver Line Gateway service may add additional capacity along the trunk of the Silver Line service.
Exhibit 46: Projected 2035 Private Shuttle Demands
Morning Peak (7AM to 10AM) Evening Peak (4 PM to 7 PM)
Existing1 Growth2 Projected 2035 Existing Growth2 Projected
2035
North Station
625 65% 1,031 518 65% 855
South Station
228 73% 394 288 57% 452
1. Existing ridership based on counts conducted by VHB on June 19, 2014. 2. Based on CTPS regional travel demand model.
Although there are no existing or planned year round water transportation routes providing services to the waterfront, water transportation may prove to be part of the solution in meeting these demands or diverting others away from driving to the study area. these options will be fully studied as part of the future alternatives to be considered as part of the next step in this planning effort.
Planned Public Transit Improvements
There are several anticipated public transit improvements affecting waterfront transit service.
Silver Line Vehicles – the MBta is in the process of performing a mid-life overhaul of its dual mode articulated (DMA) Silver Line fleet. The mid-life overhaul will extend the useful life of each vehicle by approximately 8 years. Toward the end of the useful life of the Silver Line vehicles, the MBta will start the procurement process to
South Boston Waterfront Sustainable Transportation Plan | Final Report 91 www.sbwaterfrontmobility.org
Sou
th B
oSt
oN
wat
erfr
oN
t to
Mo
rro
w
acquire new Silver Line vehicles to run in the South Boston waterfront transitway tunnel. Vehicles that run on the Silver Line transitway are required to run without generating emissions.
Silver Line Gateway – the Silver Line Gateway project, included in the future base condition, will follow the existing Silver Line route in the Seaport District, before providing a new connection to east Boston at the Blue Line airport Station. In Chelsea, the Silver Line Gateway will operate in a new dedicated busway built in the former Grand Junction railroad right of way (now owned by the Commonwealth). There will be four new stations built along the busway—Eastern Avenue, Box District, Downtown Chelsea, and Mystic Mall. In addition to the Grand Junction, the Silver Line Gateway is able to leverage other recent public infrastructure investments, such as the Chelsea Street Bridge, Massport’s Coughlin Bypass road, and the new airport Blue Line Station.
While beneficial, neither of these planned service enhancements addresses the projected transit capacity shortfall.
Private Shuttle Service
the CtPS model forecasts the anticipated growth in public transportation on existing and committed transit services. Under the future baseline, without changes in current transit services to the South Boston waterfront, some of this demand is projected to transfer to private shuttle to access the study area. future demand for private shuttle service was estimated from two primary nodes, North Station and South Station, and is expected to increase as employment in the district grows. It is anticipated that this growth will be commensurate with growth in Waterfront-based transit trips forecasted to these nodes as well as for person trips within walking distances of these stations that are destined to the waterfront. the CtPS model indicates that private shuttle demand from North Station to the Waterfront could grow by 65 percent and demand
from South Station could grow by 73 percent during the morning peak period. Private shuttle demand during the evening peak period could increase by 65 percent toward North Station and 57 percent toward South Station from the waterfront. Exhibit 46 summarizes the potential 2035 private shuttle demands from these two primary nodes to the South Boston waterfront.
Traffic growth in the Waterfront is projected at more than twice that of the region as a whole.
Roads and Highways
2035 No-Build traffic volumes at the study area intersections were projected using output from the CtPS model. Based on the model, total vehicular peak period traffic demand at the study area gateways is projected to grow by approximately 24 percent over existing conditions. This rate of growth is more than twice that of the region as a whole.
Exhibit 47 summarizes projected growth in traffic demand on key study corridors internal to the study area. As shown, growth differs along the corridors due to varying concentrations of projected future developments, parking locations, and available reserve capacity. In the morning peak hour, 33 to 36 percent growth along the key east-west study area corridors is projected over existing conditions. D Street is also projected to grow significantly (45 percent over existing conditions) in the morning peak hour. Projected vehicle trip growth in the evening peak hour is generally lower due in part to the existing level of congestion. Congress Street, Summer Street and D Street are anticipated to grow between 20 and 30 percent during this peak hour.
Exhibit 48 summarizes projected growth in demand along key corridors within the impact area. As shown, traffic volume growth in the impact area is projected to be lower than in the study area and is generally more in line with regional traffic volume growth. Traffic demands on key corridors in South Boston that provide access to the Waterfront are forecast to increase 10 to 16 percent
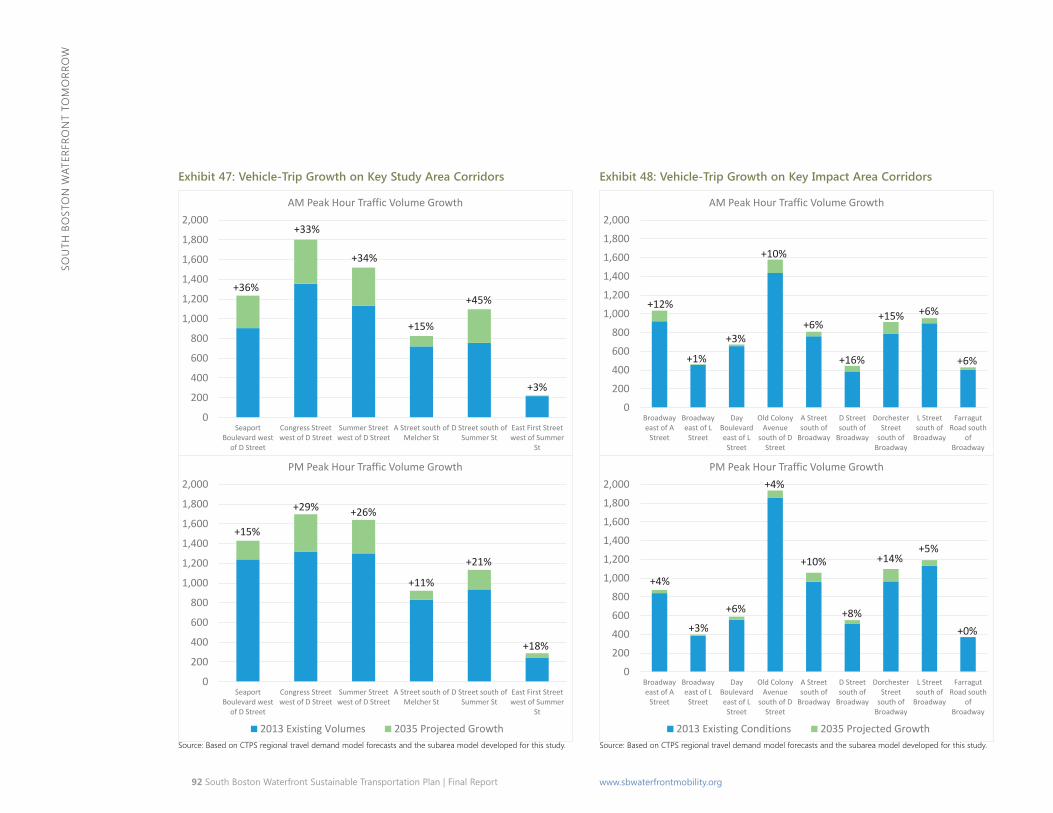
92 South Boston Waterfront Sustainable Transportation Plan | Final Report www.sbwaterfrontmobility.org
Sou
th B
oSt
oN
wat
erfr
oN
t to
Mo
rro
w
2013 Existing Volumes 2035 Projected Volumes 2013 Existing Volumes 2035 Projected Growth
Exhibit 47: Vehicle-Trip Growth on Key Study Area Corridors
AM Peak Hour Traffic Volume Growth
PM Peak Hour Traffic Volume Growth
Source: Based on CtPS regional travel demand model forecasts and the subarea model developed for this study.
Exhibit 48: Vehicle-Trip Growth on Key Impact Area Corridors
AM Peak Hour Traffic Volume Growth
PM Peak Hour Traffic Volume Growth
Source: Based on CtPS regional travel demand model forecasts and the subarea model developed for this study.
0
200
400
600
800
1,000
1,200
1,400
1,600
1,800
2,000
SeaportBoulevard west
of D Street
Congress Streetwest of D Street
Summer Streetwest of D Street
A Street south ofMelcher St
D Street south ofSummer St
East First Streetwest of Summer
St
+36%
+33%
+34%
+15%
+45%
+3%
0
200
400
600
800
1,000
1,200
1,400
1,600
1,800
2,000
SeaportBoulevard west
of D Street
Congress Streetwest of D Street
Summer Streetwest of D Street
A Street south ofMelcher St
D Street south ofSummer St
East First Streetwest of Summer
St
2013 Existing Volumes 2035 Projected Growth
+15%
+29% +26%
+11%
+21%
+18%
0
200
400
600
800
1,000
1,200
1,400
1,600
1,800
2,000
Broadwayeast of A
Street
Broadwayeast of L
Street
DayBoulevardeast of L
Street
Old ColonyAvenue
south of DStreet
A Streetsouth of
Broadway
D Streetsouth of
Broadway
DorchesterStreet
south ofBroadway
L Streetsouth of
Broadway
FarragutRoad south
ofBroadway
+12%
+1%
+3%
+10%
+16% +6%
+6%+15% +6%
0
200
400
600
800
1,000
1,200
1,400
1,600
1,800
2,000
Broadwayeast of A
Street
Broadwayeast of L
Street
DayBoulevardeast of L
Street
Old ColonyAvenue
south of DStreet
A Streetsouth of
Broadway
D Streetsouth of
Broadway
DorchesterStreet
south ofBroadway
L Streetsouth of
Broadway
FarragutRoad south
ofBroadway
2013 Existing Conditions 2035 Projected Growth
+4%
+3%
+6%
+4%
+8%+0%
+10% +14%+5%
South Boston Waterfront Sustainable Transportation Plan | Final Report 93 www.sbwaterfrontmobility.org
Sou
th B
oSt
oN
wat
erfr
oN
t to
Mo
rro
w
by 2035, depending on the location and time period. Again, the projected vehicle trip growth in the evening peak hour is generally lower due to generally heavier existing demands and congestion.
Projected vehicular traffic growth along study area corridors was translated to the intersection level to understand the localized operational impacts of projected land use growth in the waterfront. The 39 intersections7 throughout the study area assessed under existing conditions were also analyzed under 2035 No-Build conditions. as shown in Exhibits 49 and 50 on the following pages, 23 of the 39 study area intersections are projected to operate poorly and have capacity constraints (level of service E or F) under 2035 No-Build conditions during at least one peak hour. This represents a degradation of level of service at 11 additional intersections compared to the 2013 existing conditions analyses.
7 As of July 2014, the analysis of roadway conditions was expanded to include 14 additional intersections in the impact area. these locations are being analyzed and reported on in a supplemental memorandum to this report.
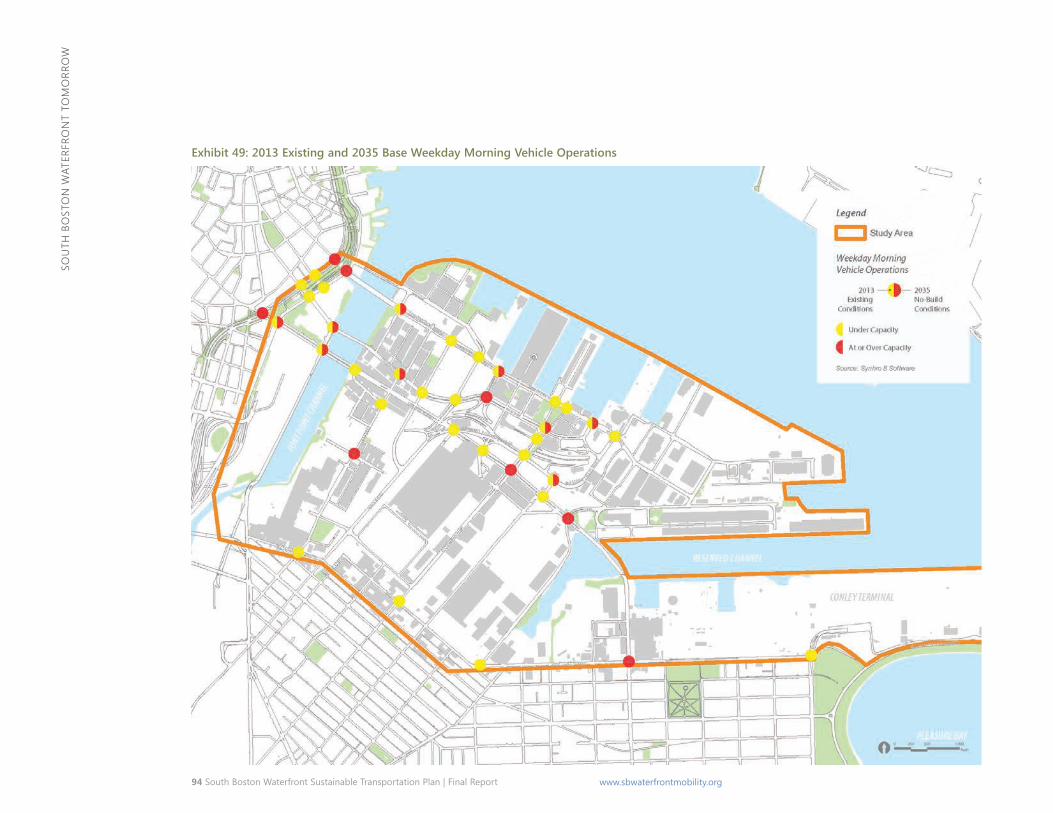
94 South Boston Waterfront Sustainable Transportation Plan | Final Report www.sbwaterfrontmobility.org
Sou
th B
oSt
oN
wat
erfr
oN
t to
Mo
rro
w
Exhibit 49: 2013 Existing and 2035 Base Weekday Morning Vehicle Operations
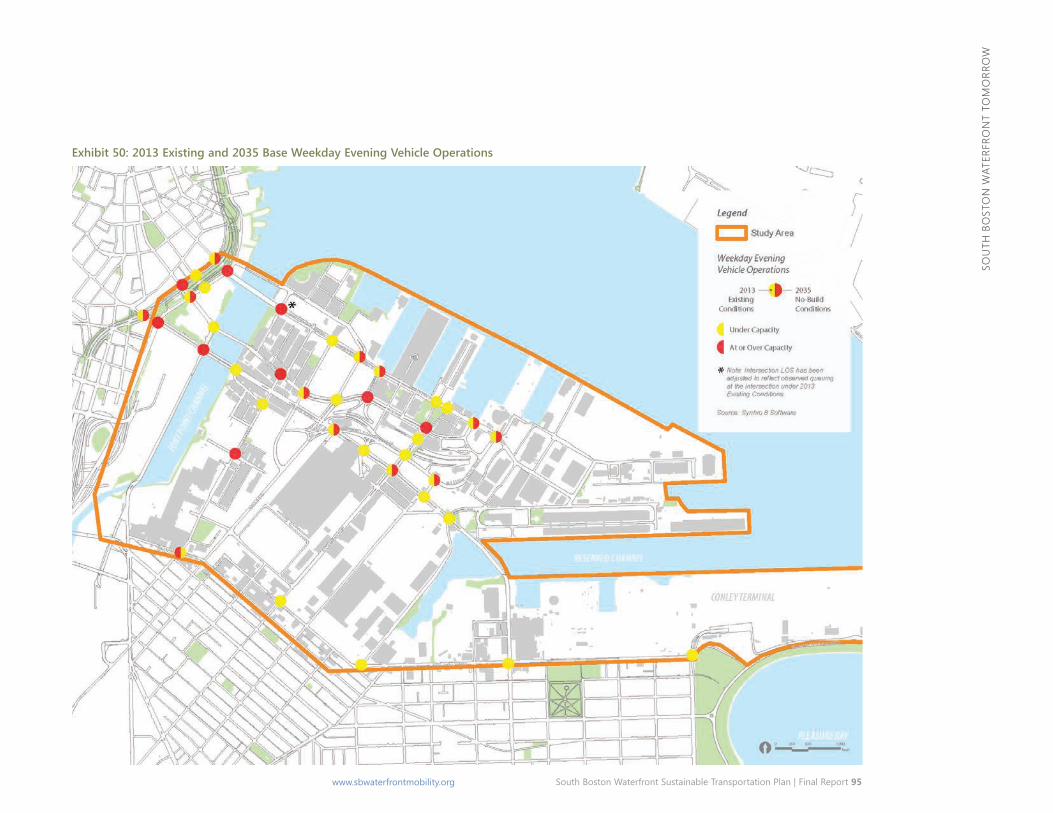
South Boston Waterfront Sustainable Transportation Plan | Final Report 95 www.sbwaterfrontmobility.org
Sou
th B
oSt
oN
wat
erfr
oN
t to
Mo
rro
w
Exhibit 50: 2013 Existing and 2035 Base Weekday Evening Vehicle Operations
96 South Boston Waterfront Sustainable Transportation Plan | Final Report www.sbwaterfrontmobility.org
Sou
th B
oSt
oN
wat
erfr
oN
t to
Mo
rro
w
Twenty-three of the 39 study area intersections are projected to operate with congestion and have capacity constraints in 2035 during at least one peak hour.
Pedestrian
By 2035, the pedestrian will represent the most important transportation mode in the South Boston waterfront with walk trips comprising approximately 33 percent of the total peak period person-trips, a 9 percent mode share increase over today. These demands do not include the pedestrian trip between transit stop and ultimate waterfront destination, and the return trip, which represents an additional 27 percent of the future person-trips that rely on the pedestrian network for some part of their journey each day. Growth in pedestrian demands relates closely to the location of future development and aligns with the forecasted growth in key corridors within the study area, as well as radiating out from the growth projected at the important transit stops serving the study area. Exhibit 51 highlights the forecasted growth in peak period pedestrian demands along key corridors in the study area.
Bicycle
Bicycle activity in the South Boston Waterfront is expected to continue to grow as development occurs due to the City and State’s commitment to advance green transportation modes. this demand is, in part, dependent on the quality of the future bicycle network and bicycle amenities provided. as part of the Boston Transportation Department’s Transportation Access Plan Agreement (TAPA) process, a number of Hubway and bicycle parking commitments have been identified. Area developers have committed to install six additional Hubway stations by 2016 at locations on Thomson Place, P&G Gillette, Channel Center and 3 locations to be determined. this would bring the total number of Hubway stations in the study area to 13. A review of TAPA agreements also identifies an additional 175 public bicycle parking racks to be provided throughout the study area over the next 3 years, largely planned for implementation upon occupancy of major developments.
Freight
In 2035, freight operations in the area will continue to be served primarily by truck. the CtPS model indicates that study area truck volumes are projected to grow at a comparable rate to general vehicular traffic demands. As such, the growth along key corridors was applied to the existing (2013) truck volumes to develop projected 2035 peak hour truck demands (Exhibit 52). overall, truck demands along key corridors are projected to increase by approximately 34 percent over existing conditions during both peak hours. Significant growth is projected along the Haul Road, D Street, Northern Avenue and the South Boston Bypass Road— many of the primary trucking routes in the district. It is important to note that the heaviest truck demands occur outside of the traditional weekday morning and evening peak hours which are not reflected in the demands shown in Exhibit 52.
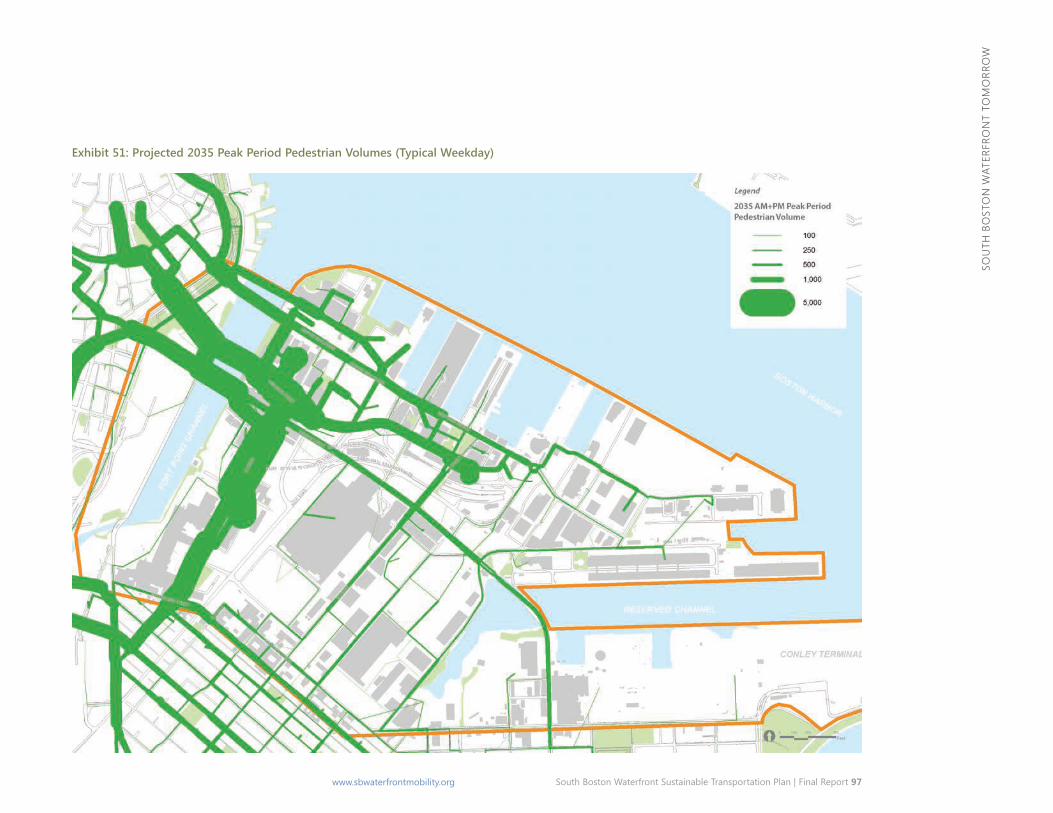
South Boston Waterfront Sustainable Transportation Plan | Final Report 97 www.sbwaterfrontmobility.org
Sou
th B
oSt
oN
wat
erfr
oN
t to
Mo
rro
w
Exhibit 51: Projected 2035 Peak Period Pedestrian Volumes (Typical Weekday)
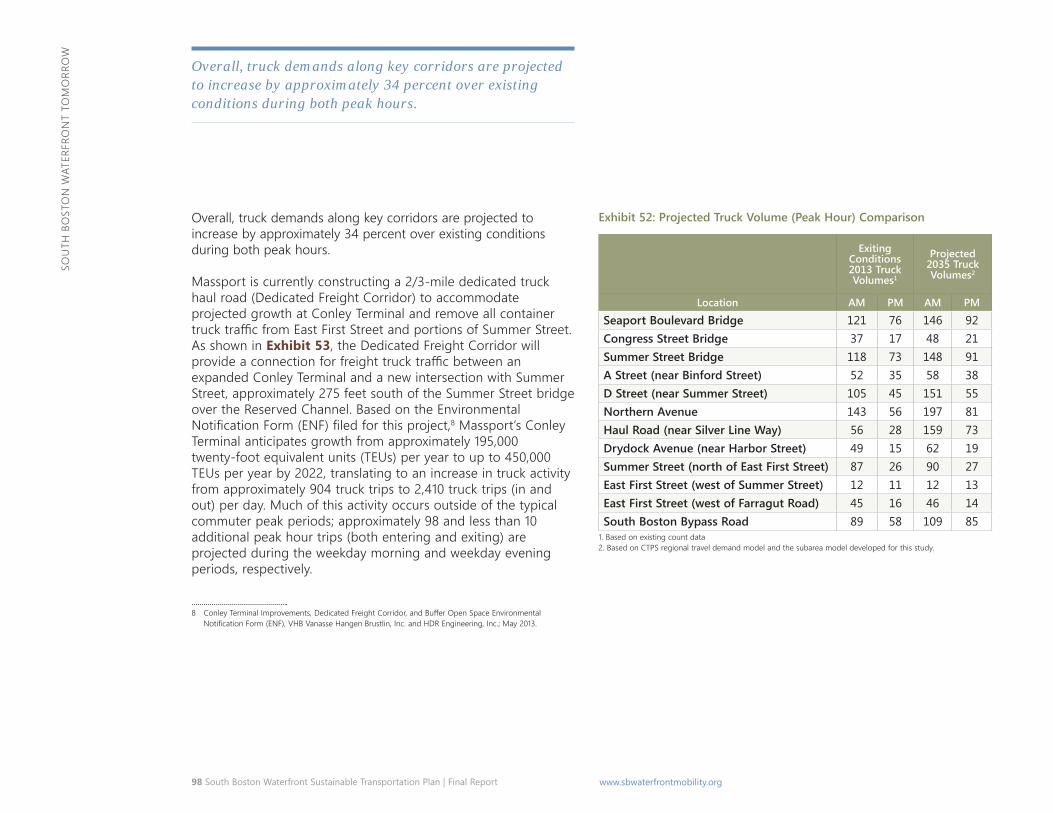
98 South Boston Waterfront Sustainable Transportation Plan | Final Report www.sbwaterfrontmobility.org
Sou
th B
oSt
oN
wat
erfr
oN
t to
Mo
rro
w
Overall, truck demands along key corridors are projected to increase by approximately 34 percent over existing conditions during both peak hours.
overall, truck demands along key corridors are projected to increase by approximately 34 percent over existing conditions during both peak hours.
Massport is currently constructing a 2/3-mile dedicated truck haul road (Dedicated Freight Corridor) to accommodate projected growth at Conley terminal and remove all container truck traffic from East First Street and portions of Summer Street. as shown in Exhibit 53, the Dedicated Freight Corridor will provide a connection for freight truck traffic between an expanded Conley Terminal and a new intersection with Summer Street, approximately 275 feet south of the Summer Street bridge over the reserved Channel. Based on the environmental Notification Form (ENF) filed for this project,8 Massport’s Conley Terminal anticipates growth from approximately 195,000 twenty-foot equivalent units (TEUs) per year to up to 450,000 TEUs per year by 2022, translating to an increase in truck activity from approximately 904 truck trips to 2,410 truck trips (in and out) per day. Much of this activity occurs outside of the typical commuter peak periods; approximately 98 and less than 10 additional peak hour trips (both entering and exiting) are projected during the weekday morning and weekday evening periods, respectively.
8 Conley Terminal Improvements, Dedicated Freight Corridor, and Buffer Open Space Environmental Notification Form (ENF), VHB Vanasse Hangen Brustlin, Inc. and HDR Engineering, Inc.; May 2013.
Exhibit 52: Projected Truck Volume (Peak Hour) Comparison
Exiting Conditions 2013 Truck Volumes1
Projected 2035 Truck Volumes2
Location AM PM AM PM
Seaport Boulevard Bridge 121 76 146 92 Congress Street Bridge 37 17 48 21 Summer Street Bridge 118 73 148 91 A Street (near Binford Street) 52 35 58 38 D Street (near Summer Street) 105 45 151 55 Northern Avenue 143 56 197 81 Haul Road (near Silver Line Way) 56 28 159 73 Drydock Avenue (near Harbor Street) 49 15 62 19 Summer Street (north of East First Street) 87 26 90 27 East First Street (west of Summer Street) 12 11 12 13 East First Street (west of Farragut Road) 45 16 46 14 South Boston Bypass Road 89 58 109 85
1. Based on existing count data 2. Based on CTPS regional travel demand model and the subarea model developed for this study.
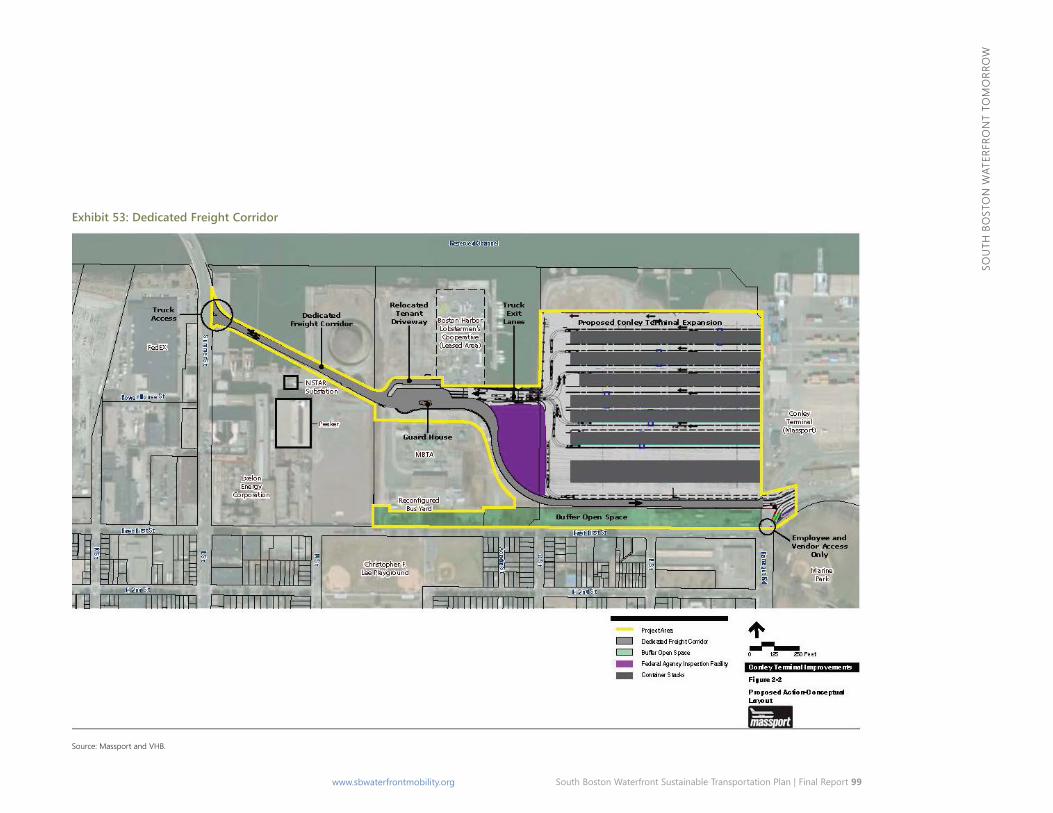
South Boston Waterfront Sustainable Transportation Plan | Final Report 99 www.sbwaterfrontmobility.org
Sou
th B
oSt
oN
wat
erfr
oN
t to
Mo
rro
w
Exhibit 53: Dedicated Freight Corridor
Source: Massport and VhB.
100 South Boston Waterfront Sustainable Transportation Plan | Final Report www.sbwaterfrontmobility.org
Sou
th B
oSt
oN
wat
erfr
oN
t to
Mo
rro
w
Parking
Based on development proposals, the South Boston waterfront will be served by 54 parking lots and garages offering approximately 26,115 vehicle parking spaces (approximately 22,445 commercial spaces and 3,670 residential spaces)—an increase of approximately 9,750 spaces over existing conditions. Thirty-four garages, both existing and as planned, will provide the vast majority (about 22,300 spaces) of the future parking supply in the South Boston waterfront. the remaining spaces will be provided in surface parking lots.
Parking demand for 2035 Base condition was based on the following methodology: Seaport Square9 specific parking ratios were applied to parcels within this development; and parking demand for the remaining 2035 developments was estimated assuming ratios documented in the Massport air rights Garage10 evaluation. In total, additional peak demand (midday during the middle of the week) is projected to be approximately 12,830; this represents additional demand from 2035 condition developments for a total parking demand of approximately 24,000 spaces in the study area. this parking demand methodology does not quantify the potential for shared parking among uses in the district, which will reduce the overall peak demand for spaces.
9 Seaport Square Final Environmental Impact Report (FEIR), Epsilon Associates, Inc. with traffic by Howard/ Stein-Hudson, Inc.; June 30, 2010.
10 Massport Air Rights Garage Preliminary Financial Analysis, Walker Parking Consultants; November 10, 2013.
Planned Improvements Prior to identifying and testing a wide range of multimodal transportation alternatives, as well as demand management strategies, to address both the existing and forecasted transportation needs of the South Boston waterfront, it was important to consider projects currently planned and committed as part of the future transportation system to be constructed by public and private sector entities over the next zero to five years. Projects are identified in Exhibit 54.
South Boston Waterfront Sustainable Transportation Plan | Final Report 101 www.sbwaterfrontmobility.org
Sou
th B
oSt
oN
wat
erfr
oN
t to
Mo
rro
w
Exhibit 54: Currently Planned/Committed Projects
Improvement Responsibility
Completion of dedicated freight corridor with new traffic signal on Summer Street Massport Summer Street CrossRoads Improvements BRa in conjunction with BTD and PWD Extension of Bullock Street from D Street to E Street MCCa/hotel developer Extension of Anchor Street from D Street to Butler Street MCCa/hotel developer Extension of Danby Street from D Street to Butler Street MCCa/hotel developer D Street streetscape improvements MCCa/hotel developer Butler Street from Bullock Street to Cypher Street MCCa/hotel developer Extension of Cypher Street from D Street to E Street MassDoT New pedestrian crossing on Summer Street bridge over A Street BRa in conjunction with BTD and PWD Water Shuttle – East Boston to Fan Pier Cove BRa Realignment of Northern Avenue at East Service Road Private developer with BTD/BRa overview/approval Extension of Fan Pier Boulevard from Northern Avenue to Seaport Boulevard Private developer with BTD/BRa overview/approval Extension of Pier Street from Northern Avenue to Seaport Boulevard Private developer with BTD/BRa overview/approval Extension of Harbor Shore Drive from Northern Avenue to Seaport Boulevard Private developer with BTD/BRa overview/approval Installation of traffic signal at Seaport Boulevard and Thomson Place Private developer with BTD/BRa overview/approval New traffic signal at A Street and West Second Street BTD Improved traffic signal systems throughout the study area BTD and private developers through TaPa process Construction of E Street public garage MCCa Construction of D Street public garage MCCa Melcher Street Extension Private developer with BTD/BRa overview/approval New traffic signal at Binford Street/A Street Private developer with BTD/BRa overview/approval Thomson Place Hubway Station Private developer with BTD/BRa overview/approval P&G Gillette Hubway Station Private developer with BTD/BRa overview/approval Channel Center Hubway Station Private developer with BTD/BRa overview/approval 3 additional Hubway Stations – locations TBD Private developer with BTD/BRa overview/approval Additional 175 public bicycle racks by 2018 Private developer with BTD/BRa overview/approval
102 South Boston Waterfront Sustainable Transportation Plan | Final Report www.sbwaterfrontmobility.org
WAT
ERFR
ON
T IS
SUES
, NEE
DS,
AN
D O
PPO
RTU
NIT
IES
WATERFRONT ISSUES, NEEDS, AND OPPORTUNITIES The framing of study area and neighborhood transportation issues, opportunities, and needs evolved from a thorough review of data and the compilation of issues, concerns, and desired outcomes identified by key project stakeholders. This chapter organizes these issues, needs, and opportunities around five fundamental themes:
� Improve regional access � Expand community connections � Address internal circulation and mobility � Enhance public realm, and � Plan for resiliency
Improve Regional Access Providing more reliable transit and vehicle access between the region and the Waterfront are critical components to sustaining growth in the district and protecting the neighborhoods from cut-through traffic.
Understanding Regional Trip Patterns
To improve regional access to the Waterfront requires an understanding of the geographic distribution and magnitude of transportation demands. The region was aggregated into subareas to more fully evaluate trip patterns and needs (Exhibit 55). From this analysis, it was found that approximately 62 percent of
existing person-trips to/from the South Boston Waterfront for all trip purposes are regional in nature—originating outside of the study area, adjacent South Boston neighborhood or Boston Core (Exhibit 56). By 2035, regional trips are projected to grow by approximately 34 percent and still comprise more than half of all trips to/from and within the district.
There are concentrations of regional trips that can be targeted for access improvements. For example, regional trips to/from the Waterfront are more heavily weighted towards Boston’s southern neighborhoods and the South Shore, both today (29 percent) and in the future (25 percent). Approximately 19 percent of all existing and 15 percent of all future trips originate north of the study area in Cambridge, Somerville, Charlestown and the suburbs north of Boston. Finally, trips between the traditional South Boston neighborhood and the Waterfront comprise 9 percent of all trips both today and by 2035.
Issue and Need: Providing high quality access for regional trips to the district, which comprise more than half of all trips today and by 2035, is necessary for the sustained vitality of the Waterfront
Opportunity: Tailor regional multimodal access solutions to existing and forecasted trip patterns and demands.
Transit Access
An increased reliance on transit, both today and in the future, taxes a system that is nearing capacity. In addition, the current transit system fails to provide convenient connections for many of the residents, employees, and visitors of the Waterfront.
South Boston Waterfront Sustainable Transportation Plan | Final Report 103 www.sbwaterfrontmobility.org
WAT
ERFR
ON
T IS
SUES
, NEE
DS,
AN
D O
PPO
RTU
NIT
IES Exhibit 55: Regional Subareas
Exhibit 56: Modeled Distribution of Existing and Forecasted Study Area Person-Trips (AM and PM Peak Periods) Trip Origin/Destination Existing (2013) 2035 Growth
Trips Distribution Trips Distribution (2013-2035)
Local Study Area 12,730 15% 35,770 26% 181% Boston Core (Including Chelsea and East Boston) 11,770 14% 19,480 14% 66% Other South Boston 7,480 9% 11,820 9% 58% Subtotal 31,980 38% 67,070 49% 110%
Regional Cambridge/Somerville/Charlestown 3,830 5% 5,520 4% 44% Boston Southern Neighborhoods 11,220 13% 14,460 11% 29% Boston Western Neighborhoods & Brookline 6,030 7% 7,370 5% 22% North Shore 4,830 6% 6,410 5% 33% North 6,700 8% 8,610 6% 29% South 13,790 16% 19,620 14% 42% West 5,940 7% 8,390 6% 41% Subtotal 52,340 62% 70,380 51% 34% Total 84,320 100% 137,450 100% 63%
104 South Boston Waterfront Sustainable Transportation Plan | Final Report www.sbwaterfrontmobility.org
WAT
ERFR
ON
T IS
SUES
, NEE
DS,
AN
D O
PPO
RTU
NIT
IES
The South Boston Waterfront is underserved by transit today and will continue to be underserved in the future without significant capacity increases.
Improve Transit Capacity
The South Boston Waterfront is large in scale; almost all of the well-established neighborhoods in Boston’s Downtown core area would fit in the South Boston Waterfront study area (see Exhibit 36). And yet, as shown in Exhibit 57, the Silver Line is the only direct, high capacity transit line serving the Waterfront, and provides about 5 percent of the peak period transit seats available to residents and workers of the downtown. Even with the limited new services planned (notably the Green Line Extension to Medford and Silver Line Extension to Chelsea), transit demands to/ from the Waterfront are forecasted to grow by 64 percent between today and 2035, and will overtax the transit system without further intervention.
Issue: The South Boston Waterfront is underserved by transit today and will continue to be underserved in the future without significant capacity increases.
Need: There is a need to scale up transit services and capacities over time to be commensurate with the geography and development densities of the Waterfront.
Silver Line Capacity
Exhibit 58 summarizes peak period demands on the Silver Line for Existing (2013) and forecasted (2035) conditions, which includes the extension of service to Chelsea. Silver Line demands are
Exhibit 57: Downtown vs. South Boston Waterfront Transit Seat Comparison (Capacity per Peak Hour)
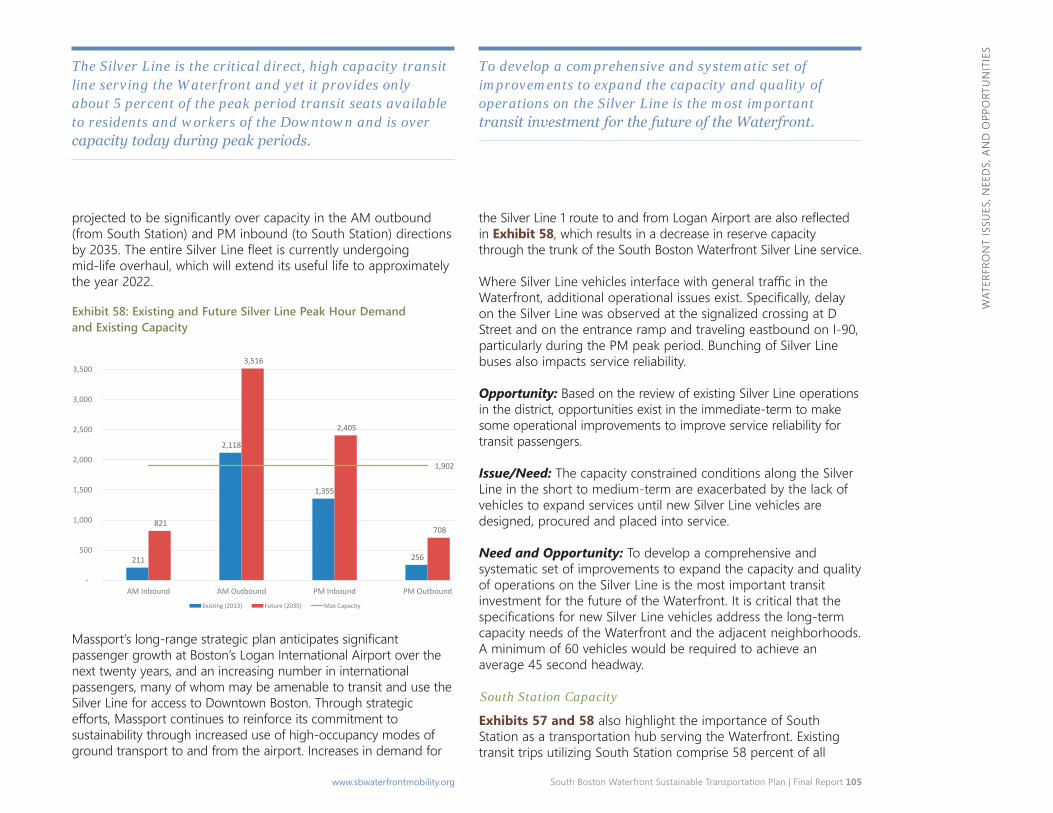
South Boston Waterfront Sustainable Transportation Plan | Final Report 105 www.sbwaterfrontmobility.org
WAT
ERFR
ON
T IS
SUES
, NEE
DS,
AN
D O
PPO
RTU
NIT
IES
4,000
Existing and Future Peak Hour Demand and Capacity
projected to be significantly over capacity in the AM outbound (from South Station) and PM inbound (to South Station) directions by 2035. The entire Silver Line fleet is currently undergoing mid-life overhaul, which will extend its useful life to approximately the year 2022.
The Silver Line is the critical direct, high capacity transit line serving the Waterfront and yet it provides only about 5 percent of the peak period transit seats available to residents and workers of the Downtown and is over capacity today during peak periods.
Exhibit 58: Existing and Future Silver Line Peak Hour Demand and Existing Capacity
Massport’s long-range strategic plan anticipates significant passenger growth at Boston’s Logan International Airport over the next twenty years, and an increasing number in international passengers, many of whom may be amenable to transit and use the Silver Line for access to Downtown Boston. Through strategic efforts, Massport continues to reinforce its commitment to sustainability through increased use of high-occupancy modes of ground transport to and from the airport. Increases in demand for
the Silver Line 1 route to and from Logan Airport are also reflected in Exhibit 58, which results in a decrease in reserve capacity through the trunk of the South Boston Waterfront Silver Line service.
To develop a comprehensive and systematic set of improvements to expand the capacity and quality of operations on the Silver Line is the most important transit investment for the future of the Waterfront.
Where Silver Line vehicles interface with general traffic in the Waterfront, additional operational issues exist. Specifically, delay on the Silver Line was observed at the signalized crossing at D Street and on the entrance ramp and traveling eastbound on I-90, particularly during the PM peak period. Bunching of Silver Line buses also impacts service reliability.
Opportunity: Based on the review of existing Silver Line operations in the district, opportunities exist in the immediate-term to make some operational improvements to improve service reliability for transit passengers.
Issue/Need: The capacity constrained conditions along the Silver Line in the short to medium-term are exacerbated by the lack of vehicles to expand services until new Silver Line vehicles are designed, procured and placed into service.
Need and Opportunity: To develop a comprehensive and systematic set of improvements to expand the capacity and quality of operations on the Silver Line is the most important transit investment for the future of the Waterfront. It is critical that the specifications for new Silver Line vehicles address the long-term capacity needs of the Waterfront and the adjacent neighborhoods. A minimum of 60 vehicles would be required to achieve an average 45 second headway.
South Station Capacity
Exhibits 57 and 58 also highlight the importance of South Station as a transportation hub serving the Waterfront. Existing transit trips utilizing South Station comprise 58 percent of all
211
2,118
1,355
256
821
3,516
2,405
708
1,902
-
500
1,000
1,500
2,000
2,500
3,000
3,500
AM Inbound AM Outbound PM Inbound PM Outbound
Existing (2013) Future (2035) Max Capacity
106 South Boston Waterfront Sustainable Transportation Plan | Final Report www.sbwaterfrontmobility.org
WAT
ERFR
ON
T IS
SUES
, NEE
DS,
AN
D O
PPO
RTU
NIT
IES
transit trips to the district, an aggregate of commuter rail and Red Line demand destined for the Waterfront. By 2035, transit demand in markets served by South Station is projected to grow by over 60 percent—reinforcing the importance of this gateway.
Transit access between North Station and the South Boston Waterfront currently requires a multi-seat ride from north side Commuter Rail lines (4 seats) and the Orange and Green Lines (3 seats).
Need and Opportunity: Maintaining and expanding the capacity of South Station are critical to providing high quality transit access to the South Boston Waterfront in the future.
Expand Transit Connections
Regional use of transit to the Waterfront reflects the quality and convenience of current access options. As shown in Exhibit 59, existing transit mode shares for trips from/to the Waterfront vary widely throughout the region. Those locations that are fairly well served by transit—including East Boston, Chelsea, and markets served directly by the Silver Line and Red Line—have the highest existing transit mode shares to the district. Regions with limited service to the Waterfront generally have lower transit mode shares (in the 20 to 25 percent range).
Issue: Service and capacity constraints limit the viability of transit as the preferred mode choice for many existing and future travelers to the Waterfront.
Opportunities: There are several opportunities to improve transit connections—in particular to/from North Station, the inner southwest Boston neighborhoods, the southeast and southwest suburbs, and the adjacent South Boston community (see later under Community Connections). Creating better transit connections to these underserved markets would improve the overall transit mode share, reduce vehicle traffic, and improve the environmental consequences of travel to/from the Waterfront.
Connections to the North
Approximately 16 percent of existing South Boston Waterfront trips are from markets served by North Station. Located roughly 1.5 miles from the World Trade Center and over 2.5 miles from the traditional South Boston neighborhood, walking from/to North Station is not a desirable travel option for many and bicycling is made more difficult by the lack of exclusive bicycle facilities.
Transit access between North Station and the South Boston Waterfront currently requires a multi-seat ride from north side Commuter Rail lines (4 seats) and the Orange and Green Lines (3 seats). While MBTA Bus Route 4 serves both the Waterfront and North Station, service is provided only during weekday peak hours and frequency is less than desired.
Private shuttles supplement the MBTA transit services from North Station, serving approximately 1,150 riders on over 170 private shuttle trips during morning and evening peak periods.
Issue: As a result of limited connections and multi-seat rides, transit only captures 22 percent of Waterfront trips to/from the north.
Need and Opportunity: With nearly 4,850 peak period transit trips from North Station projected by 2035 (an increase of 1,750 trips), strengthening access to this currently underserved node— though priority bus routes, new water transportation services, and/or private shuttle consolidation—represents a significant opportunity for the South Boston Waterfront.
Private Shuttle Consolidation
In response to the transportation needs of employees, many of whom moved to the Waterfront from areas better served by public transit, businesses have implemented point-to-point shuttle
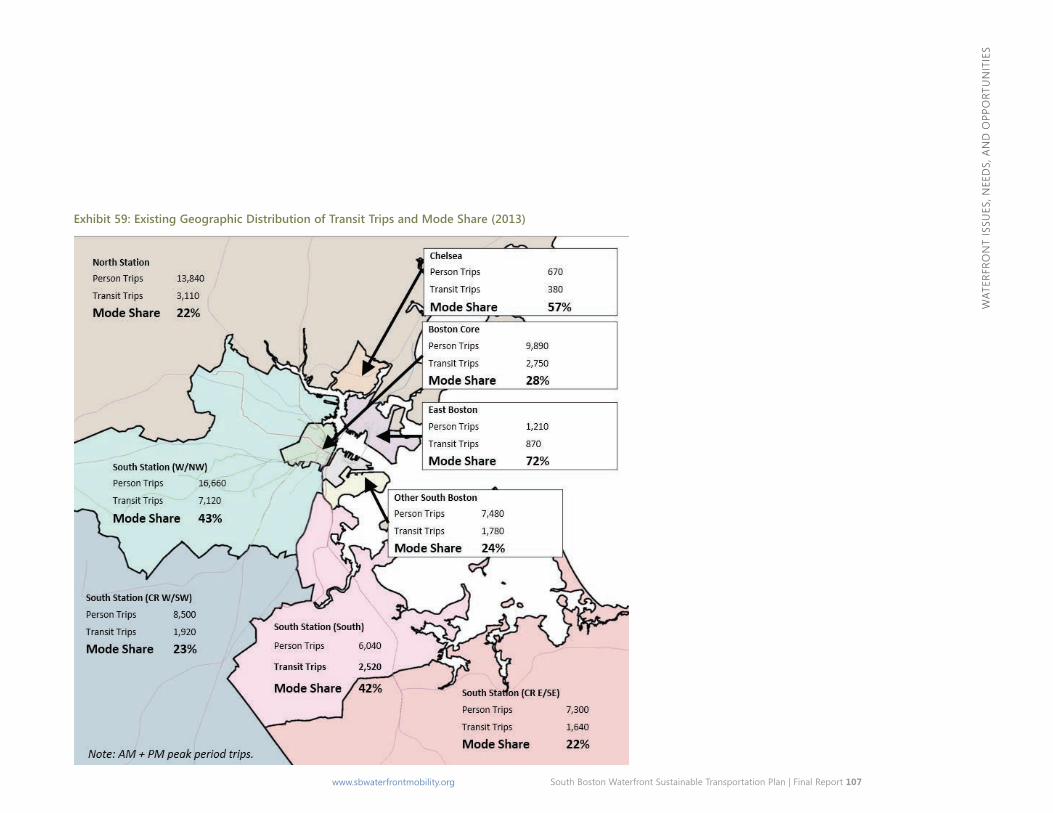
South Boston Waterfront Sustainable Transportation Plan | Final Report 107 www.sbwaterfrontmobility.org
WAT
ERFR
ON
T IS
SUES
, NEE
DS,
AN
D O
PPO
RTU
NIT
IES
Exhibit 59: Existing Geographic Distribution of Transit Trips and Mode Share (2013)
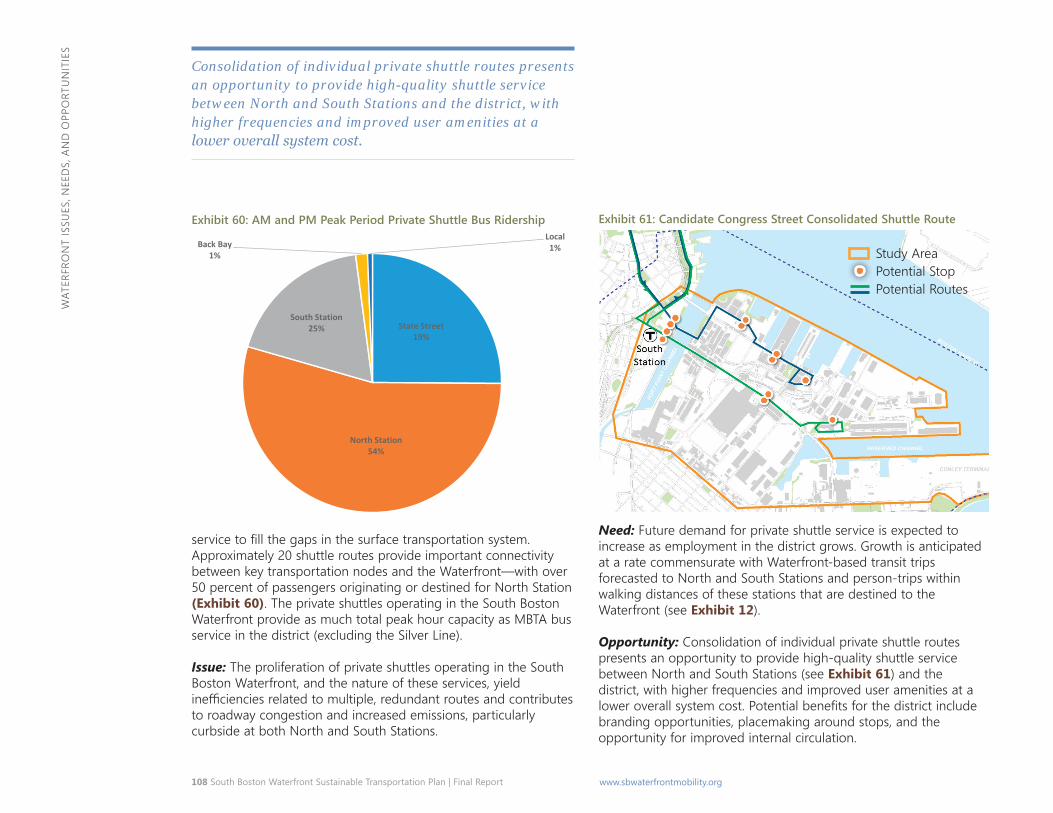
108 South Boston Waterfront Sustainable Transportation Plan | Final Report www.sbwaterfrontmobility.org
WAT
ERFR
ON
T IS
SUES
, NEE
DS,
AN
D O
PPO
RTU
NIT
IES
service to fill the gaps in the surface transportation system. Approximately 20 shuttle routes provide important connectivity between key transportation nodes and the Waterfront—with over 50 percent of passengers originating or destined for North Station (Exhibit 60). The private shuttles operating in the South Boston Waterfront provide as much total peak hour capacity as MBTA bus service in the district (excluding the Silver Line).
Consolidation of individual private shuttle routes presents an opportunity to provide high-quality shuttle service between North and South Stations and the district, with higher frequencies and improved user amenities at a lower overall system cost.
Exhibit 60: AM and PM Peak Period Private Shuttle Bus Ridership
Issue: The proliferation of private shuttles operating in the South Boston Waterfront, and the nature of these services, yield inefficiencies related to multiple, redundant routes and contributes to roadway congestion and increased emissions, particularly curbside at both North and South Stations.
Exhibit 61: Candidate Congress Street Consolidated Shuttle Route
Need: Future demand for private shuttle service is expected to increase as employment in the district grows. Growth is anticipated at a rate commensurate with Waterfront-based transit trips forecasted to North and South Stations and person-trips within walking distances of these stations that are destined to the Waterfront (see Exhibit 12).
Opportunity: Consolidation of individual private shuttle routes presents an opportunity to provide high-quality shuttle service between North and South Stations (see Exhibit 61) and the district, with higher frequencies and improved user amenities at a lower overall system cost. Potential benefits for the district include branding opportunities, placemaking around stops, and the opportunity for improved internal circulation.
South Station25%
North Station54%
State Street19%
Back Bay1%
Local1% Study Area
Potential StopPotential Routes
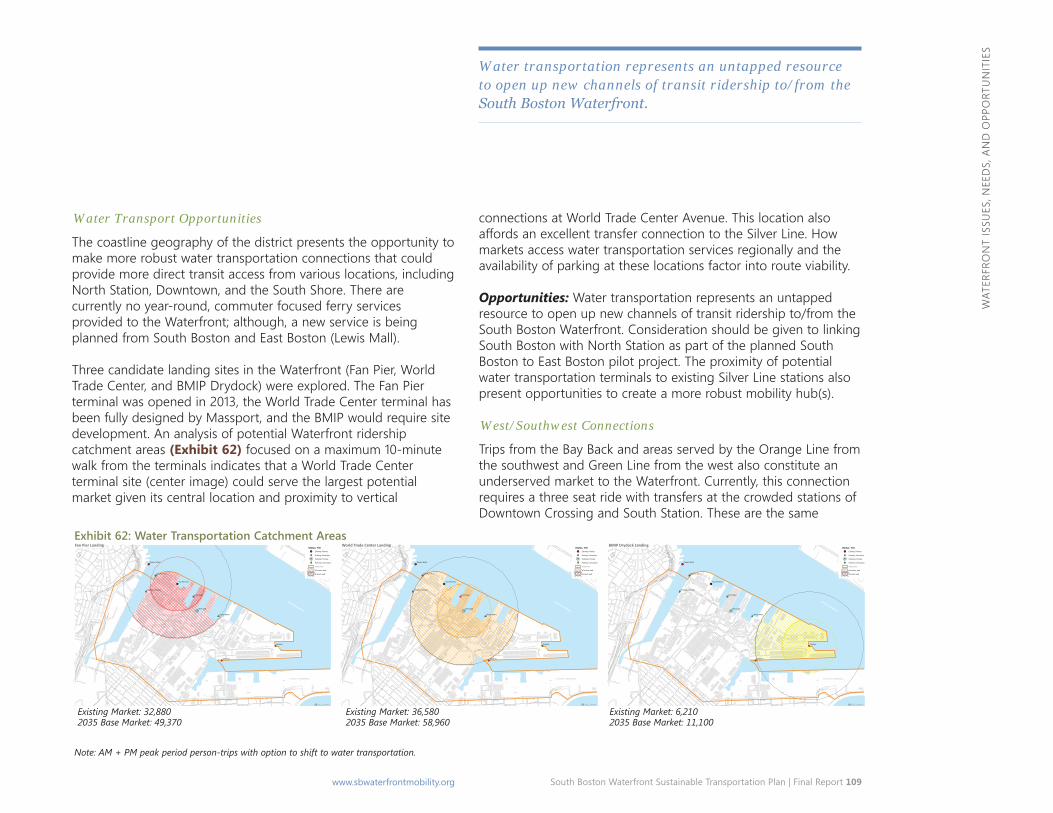
South Boston Waterfront Sustainable Transportation Plan | Final Report 109 www.sbwaterfrontmobility.org
WAT
ERFR
ON
T IS
SUES
, NEE
DS,
AN
D O
PPO
RTU
NIT
IES
LegendLegend Legend
Water Transport Opportunities
The coastline geography of the district presents the opportunity to make more robust water transportation connections that could provide more direct transit access from various locations, including North Station, Downtown, and the South Shore. There are currently no year-round, commuter focused ferry services provided to the Waterfront; although, a new service is being planned from South Boston and East Boston (Lewis Mall).
Three candidate landing sites in the Waterfront (Fan Pier, World Trade Center, and BMIP Drydock) were explored. The Fan Pier terminal was opened in 2013, the World Trade Center terminal has been fully designed by Massport, and the BMIP would require site development. An analysis of potential Waterfront ridership catchment areas (Exhibit 62) focused on a maximum 10-minute walk from the terminals indicates that a World Trade Center terminal site (center image) could serve the largest potential market given its central location and proximity to vertical
connections at World Trade Center Avenue. This location also affords an excellent transfer connection to the Silver Line. How markets access water transportation services regionally and the availability of parking at these locations factor into route viability.
Water transportation represents an untapped resource to open up new channels of transit ridership to/from the South Boston Waterfront.
Opportunities: Water transportation represents an untapped resource to open up new channels of transit ridership to/from the South Boston Waterfront. Consideration should be given to linking South Boston with North Station as part of the planned South Boston to East Boston pilot project. The proximity of potential water transportation terminals to existing Silver Line stations also present opportunities to create a more robust mobility hub(s).
West/Southwest Connections
Trips from the Bay Back and areas served by the Orange Line from the southwest and Green Line from the west also constitute an underserved market to the Waterfront. Currently, this connection requires a three seat ride with transfers at the crowded stations of Downtown Crossing and South Station. These are the same
Exhibit 62: Water Transportation Catchment AreasFan Pier Landing
Existing Market: 32,880 2035 Base Market: 49,370
World Trade Center Landing
Existing Market: 36,580 2035 Base Market: 58,960
BMIP Drydock Landing
Existing Market: 6,210 2035 Base Market: 11,100
Note: AM + PM peak period person-trips with option to shift to water transportation.
BOSTON HARBOR
CONLEY TERMINAL
Drydock
WTC West
WTC East
Wharf 10
Rowes Wharf
Fan Pier West
Fan Pier East
Liberty Wharf
Childrens Museum
D STREET
SUMMER STREET
A STR
EET
EAST FIRST STREET
HAUL ROAD
CONGRESS STREET
WEST FIRST STREET
NORTHERN AVENUE
SEAPORT BOULEVARD
MASSPORT H
AUL ROAD
WEST SECOND STREET
B STR
EET
RAMP - HAUL ROAD TO RT 90 EB
RAMP - HAUL ROAD TO RT 90 WB
WILLIAM DAY BOULEVARD
RAMP - RT 93 NB TO CONG RESS STR EET
D STREET EXTENSION
RAMP - RT 90 EB TO HAUL ROAD & CONGRESS STREET
RAMP - MASSPORT HAUL ROAD TO RT 90 EB
SEAPORT BOULEVARD
B STREET
[0 270 540135
Feet
Status, TierExisting, Primary
Existing, Secondary
Potential, Primary
Potential, Secondary
Study Area
10 minute walk
5 minute walk
110 South Boston Waterfront Sustainable Transportation Plan | Final Report www.sbwaterfrontmobility.org
WAT
ERFR
ON
T IS
SUES
, NEE
DS,
AN
D O
PPO
RTU
NIT
IES
markets targeted by the proposed Silver Line extension tunnel to Dudley Square with a new tunnel between South Station and Boylston Station with connections at Chinatown Station (so-called Silver Line Phase 3).
Issue/Need: Improved transit connections are needed between the South Boston Waterfront and the residential neighborhoods to the west and southwest.
Opportunities: Revisiting the Silver Line Phase 3 project and/or new local bus connections to improve cross town transit access is warranted to respond to the increasing demands from these areas to the Waterfront.
New Urban Rail Transit Services
The MBTA is looking to initiate urban rail transit service along the Fairmount branch alignment of the Commuter Rail to South Station as the first phase of a more comprehensive plan to enhance passenger rail services. The alignment of the Fairmount line parallels the Red Line (further inland to the west), south of downtown Boston. Introduction of urban rail service to the Fairmount Line will shift service from a traditional scheduled commuter rail service to a “walk-up” service with future headways anticipated to be shorter than those of the current commuter rail service. This allows better, more frequent transit services between South Station and disadvantaged populations along the rail line.
Need/Opportunity: New service would provide enhanced transit access to serve several communities with low-income residents and minorities and could provide a direct link between Back Bay and the Waterfront via “Track 61” over the medium to long-term.
Fort Point Channel crossings are at or nearing capacity in the peak direction during both peak hours today.
Road and Highway Access
Total vehicular peak period demand at the study area gateways is projected to grow by approximately 24 percent over existing conditions—a growth rate about twice that of the region as a whole. As the South Boston Waterfront is located on a peninsula, managing gateway access/egress is critical, now and for the future. Deficiencies in regional highway and street connections impact access to the Waterfront, including the working port, cause travel delays and potentially divert traffic from the regional highway system onto local streets. Further, modeling of future demands assumes unconstrained capacity on transit connections; if transit capacity demands are not addressed, vehicular congestion may be greater than forecasted.
Downtown Gateways
Fort Point Channel crossings are at or nearing capacity in the peak direction during both peak hours today. With relatively balanced directional traffic volumes across the Summer Street, Congress Street, and Seaport Boulevard bridges during both peak hours, limited opportunities exist to consider reallocation of travel lanes or lane management alternatives. Additionally, congestion along the Atlantic Avenue and Purchase Street surface artery corridors contributes to congestion in the Waterfront.
Issue: Limited reserve capacity for vehicular access to and egress from the South Boston Waterfront exists today (see Exhibits 28 and 29) and is projected to continue to diminish as Build-out of the district advances.
Need and Opportunity: The need to enhance capacity at the existing crossings and/or provide additional crossings of the Fort Point Channel is evident and critical to providing sufficient vehicular access to/from the South Boston Waterfront in the future.
South Boston Waterfront Sustainable Transportation Plan | Final Report 111 www.sbwaterfrontmobility.org
WAT
ERFR
ON
T IS
SUES
, NEE
DS,
AN
D O
PPO
RTU
NIT
IES
Interstate Highway Gateways
Capacity constraints along the interstates and connecting ramps can induce congestion in the district and can result in traffic cutting through the neighborhoods. The I-93/Southeast Expressway corridor experiences peak period congestion on a regular basis. To avoid surface artery/ramp congestion during the morning, some vehicles use the I-93 and I-90 ramps to cut-through the Waterfront and access downtown Boston via the Fort Point Channel bridges. During the evening peak period, surface artery congestion coupled with back-ups on the I-93 ramps results in queuing onto Waterfront roadways on a regular basis. Traffic congestion in the Ted Williams Tunnel and at the I-90 interchange also leads to back-ups today in the district and can impact Silver Line transit service. Eastbound congestion in the tunnel can impact traffic operations along D Street, particularly during the evenings. Congestion at Kosciuszko Circle (Columbia Road/Morrissey Boulevard) was also noted during study outreach efforts. Capacity constraints at this location cause a further dispersion of traffic on South Boston neighborhood streets.
Need: Both trucks and private vehicles rely heavily on the interstate system for access to the Waterfront; there is a need to preserve and enhance operations at the key interstate access/ egress points to ensure the future vitality of the Waterfront and reduce impacts on local neighborhoods.
Opportunities: Prioritizing improvements to interstate access and major arterials serving the Waterfront could discourage vehicles from using the adjacent South Boston residential neighborhood during peak times. With better dynamic directional signage, reserve capacity at the B Street ramps from/to I-90 and I-93 could help to alleviate pressures on the surface artery ramps.
The ability to move freight through the Waterfront in a timely manner is vital to the continued success of port operations and freight dependent businesses in the Waterfront.
Truck Movements/Access to Port
By 2035, truck demands along key corridors are projected to increase by approximately 34 percent over existing conditions during both peak hours—underscoring the need to focus on efficient freight movement and access to the Port and other industrial, commercial, and convention-related facilities. Congestion at gateways to the I-93 and I-90 interstate ramp systems (discussed above) also impedes truck movements.
Need: The ability to move freight through the Waterfront in a timely manner is vital to the continued success of port operations and freight dependent businesses in the Waterfront.
Opportunity: An opportunity exists to improve Waterfront access and further define existing truck routes within the district by providing more direct roadway connections at strategic locations including connecting Cypher Street to E Street, E Street to Summer Street (opposite Pumphouse Road), Haul Road to Drydock Avenue, and Pappas Way to Haul Road.
Traffic Management and Operations
“Don’t Block the Box” strategies were implemented in Spring of 2014 by the City of Boston at three Downtown gateway intersections: Atlantic Avenue/Seaport Boulevard, Seaport Boulevard/Sleeper Street, and Atlantic Avenue/Summer Street. When police details are present to enforce “Don’t Block the Box” and enhance progression through the system, this has been an effective strategy to minimize gridlock.
Opportunity: Consistent enforcement and coordination among multiple traffic control jurisdictions are critical to ensuring safe and efficient traffic management at all times.
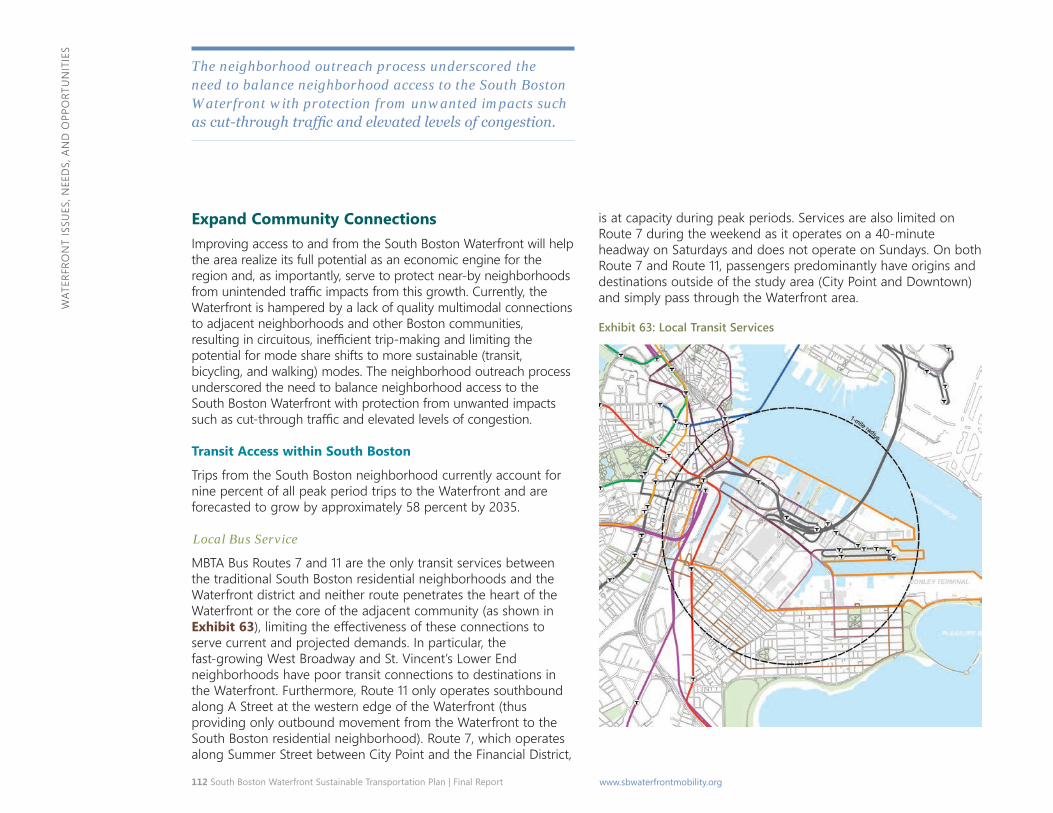
112 South Boston Waterfront Sustainable Transportation Plan | Final Report www.sbwaterfrontmobility.org
WAT
ERFR
ON
T IS
SUES
, NEE
DS,
AN
D O
PPO
RTU
NIT
IES
The neighborhood outreach process underscored the need to balance neighborhood access to the South Boston Waterfront with protection from unwanted impacts such as cut-through traffic and elevated levels of congestion.
Expand Community Connections Improving access to and from the South Boston Waterfront will help the area realize its full potential as an economic engine for the region and, as importantly, serve to protect near-by neighborhoods from unintended traffic impacts from this growth. Currently, the Waterfront is hampered by a lack of quality multimodal connections to adjacent neighborhoods and other Boston communities, resulting in circuitous, inefficient trip-making and limiting the potential for mode share shifts to more sustainable (transit, bicycling, and walking) modes. The neighborhood outreach process underscored the need to balance neighborhood access to the South Boston Waterfront with protection from unwanted impacts such as cut-through traffic and elevated levels of congestion.
Transit Access within South Boston
Trips from the South Boston neighborhood currently account for nine percent of all peak period trips to the Waterfront and are forecasted to grow by approximately 58 percent by 2035.
Local Bus Service
MBTA Bus Routes 7 and 11 are the only transit services between the traditional South Boston residential neighborhoods and the Waterfront district and neither route penetrates the heart of the Waterfront or the core of the adjacent community (as shown in Exhibit 63), limiting the effectiveness of these connections to serve current and projected demands. In particular, the fast-growing West Broadway and St. Vincent’s Lower End neighborhoods have poor transit connections to destinations in the Waterfront. Furthermore, Route 11 only operates southbound along A Street at the western edge of the Waterfront (thus providing only outbound movement from the Waterfront to the South Boston residential neighborhood). Route 7, which operates along Summer Street between City Point and the Financial District,
is at capacity during peak periods. Services are also limited on Route 7 during the weekend as it operates on a 40-minute headway on Saturdays and does not operate on Sundays. On both Route 7 and Route 11, passengers predominantly have origins and destinations outside of the study area (City Point and Downtown) and simply pass through the Waterfront area.
Exhibit 63: Local Transit Services
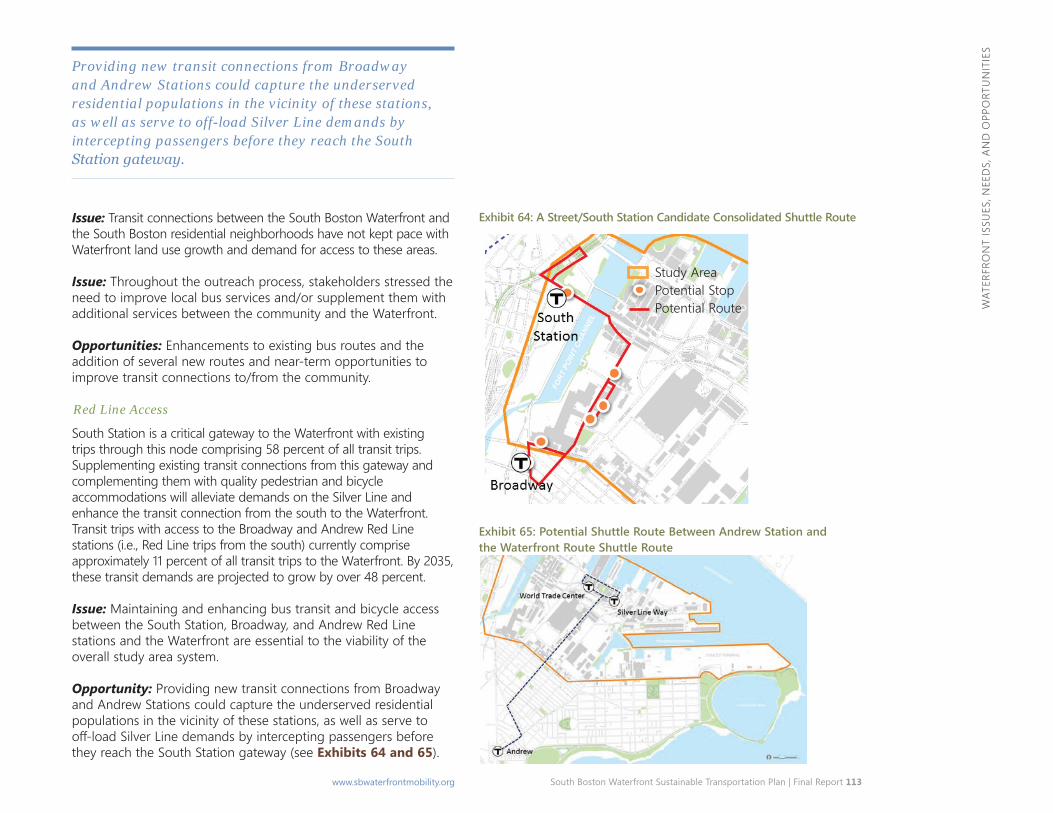
South Boston Waterfront Sustainable Transportation Plan | Final Report 113 www.sbwaterfrontmobility.org
WAT
ERFR
ON
T IS
SUES
, NEE
DS,
AN
D O
PPO
RTU
NIT
IES
Providing new transit connections from Broadway and Andrew Stations could capture the underserved residential populations in the vicinity of these stations, as well as serve to off-load Silver Line demands by intercepting passengers before they reach the South Station gateway.
Issue: Transit connections between the South Boston Waterfront and the South Boston residential neighborhoods have not kept pace with Waterfront land use growth and demand for access to these areas.
Issue: Throughout the outreach process, stakeholders stressed the need to improve local bus services and/or supplement them with additional services between the community and the Waterfront.
Opportunities: Enhancements to existing bus routes and the addition of several new routes and near-term opportunities to improve transit connections to/from the community.
Red Line Access
South Station is a critical gateway to the Waterfront with existing trips through this node comprising 58 percent of all transit trips. Supplementing existing transit connections from this gateway and complementing them with quality pedestrian and bicycle accommodations will alleviate demands on the Silver Line and enhance the transit connection from the south to the Waterfront. Transit trips with access to the Broadway and Andrew Red Line stations (i.e., Red Line trips from the south) currently comprise approximately 11 percent of all transit trips to the Waterfront. By 2035, these transit demands are projected to grow by over 48 percent.
Issue: Maintaining and enhancing bus transit and bicycle access between the South Station, Broadway, and Andrew Red Line stations and the Waterfront are essential to the viability of the overall study area system.
Opportunity: Providing new transit connections from Broadway and Andrew Stations could capture the underserved residential populations in the vicinity of these stations, as well as serve to off-load Silver Line demands by intercepting passengers before they reach the South Station gateway (see Exhibits 64 and 65).
Exhibit 64: A Street/South Station Candidate Consolidated Shuttle Route
Exhibit 65: Potential Shuttle Route Between Andrew Station and the Waterfront Route Shuttle Route
Study AreaPotential StopPotential Route
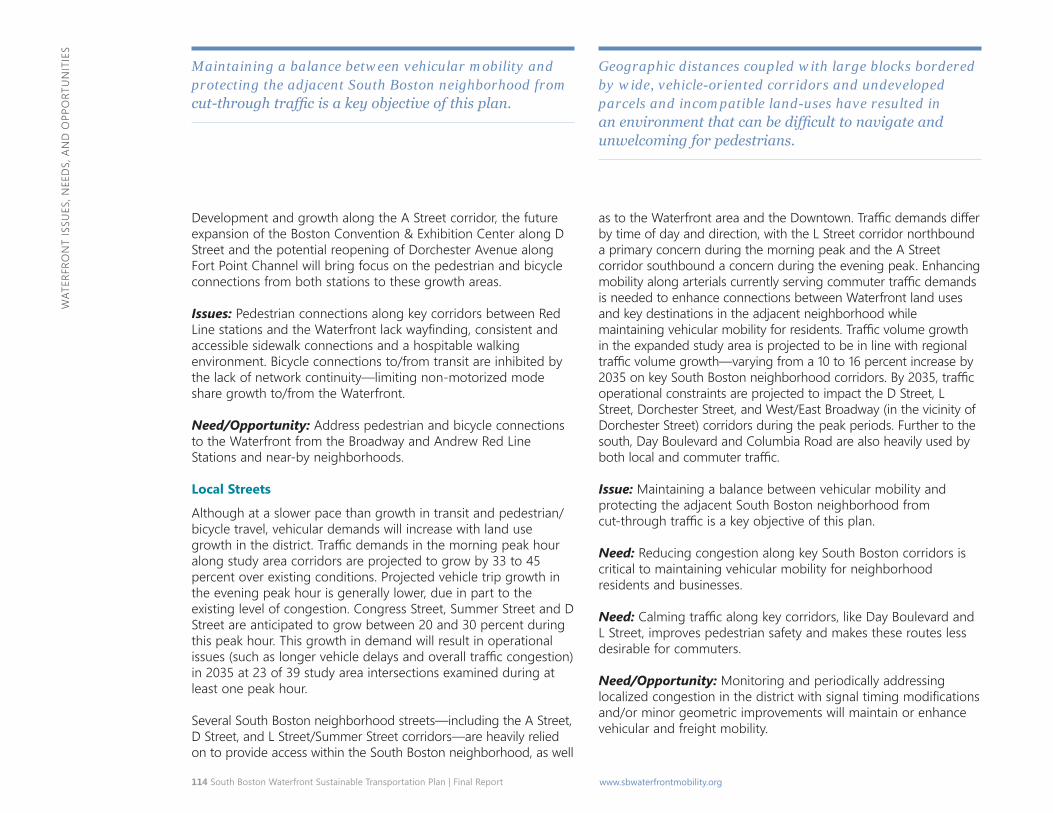
114 South Boston Waterfront Sustainable Transportation Plan | Final Report www.sbwaterfrontmobility.org
WAT
ERFR
ON
T IS
SUES
, NEE
DS,
AN
D O
PPO
RTU
NIT
IES
Maintaining a balance between vehicular mobility and protecting the adjacent South Boston neighborhood from cut-through traffic is a key objective of this plan.
Development and growth along the A Street corridor, the future expansion of the Boston Convention & Exhibition Center along D Street and the potential reopening of Dorchester Avenue along Fort Point Channel will bring focus on the pedestrian and bicycle connections from both stations to these growth areas.
Issues: Pedestrian connections along key corridors between Red Line stations and the Waterfront lack wayfinding, consistent and accessible sidewalk connections and a hospitable walking environment. Bicycle connections to/from transit are inhibited by the lack of network continuity—limiting non-motorized mode share growth to/from the Waterfront.
Need/Opportunity: Address pedestrian and bicycle connections to the Waterfront from the Broadway and Andrew Red Line Stations and near-by neighborhoods.
Local Streets
Although at a slower pace than growth in transit and pedestrian/ bicycle travel, vehicular demands will increase with land use growth in the district. Traffic demands in the morning peak hour along study area corridors are projected to grow by 33 to 45 percent over existing conditions. Projected vehicle trip growth in the evening peak hour is generally lower, due in part to the existing level of congestion. Congress Street, Summer Street and D Street are anticipated to grow between 20 and 30 percent during this peak hour. This growth in demand will result in operational issues (such as longer vehicle delays and overall traffic congestion) in 2035 at 23 of 39 study area intersections examined during at least one peak hour.
Several South Boston neighborhood streets—including the A Street, D Street, and L Street/Summer Street corridors—are heavily relied on to provide access within the South Boston neighborhood, as well
as to the Waterfront area and the Downtown. Traffic demands differ by time of day and direction, with the L Street corridor northbound a primary concern during the morning peak and the A Street corridor southbound a concern during the evening peak. Enhancing mobility along arterials currently serving commuter traffic demands is needed to enhance connections between Waterfront land uses and key destinations in the adjacent neighborhood while maintaining vehicular mobility for residents. Traffic volume growth in the expanded study area is projected to be in line with regional traffic volume growth—varying from a 10 to 16 percent increase by 2035 on key South Boston neighborhood corridors. By 2035, traffic operational constraints are projected to impact the D Street, L Street, Dorchester Street, and West/East Broadway (in the vicinity of Dorchester Street) corridors during the peak periods. Further to the south, Day Boulevard and Columbia Road are also heavily used by both local and commuter traffic.
Geographic distances coupled with large blocks bordered by wide, vehicle-oriented corridors and undeveloped parcels and incompatible land-uses have resulted in an environment that can be difficult to navigate and unwelcoming for pedestrians.
Issue: Maintaining a balance between vehicular mobility and protecting the adjacent South Boston neighborhood from cut-through traffic is a key objective of this plan.
Need: Reducing congestion along key South Boston corridors is critical to maintaining vehicular mobility for neighborhood residents and businesses.
Need: Calming traffic along key corridors, like Day Boulevard and L Street, improves pedestrian safety and makes these routes less desirable for commuters.
Need/Opportunity: Monitoring and periodically addressing localized congestion in the district with signal timing modifications and/or minor geometric improvements will maintain or enhance vehicular and freight mobility.
South Boston Waterfront Sustainable Transportation Plan | Final Report 115 www.sbwaterfrontmobility.org
WAT
ERFR
ON
T IS
SUES
, NEE
DS,
AN
D O
PPO
RTU
NIT
IES
Opportunity: Prioritizing and maximizing throughput along the interstate highway system and at the Waterfront gateways keeps commuter traffic on the corridors built to accommodate it and protects local streets from increased travel demands (i.e., “cut-through” traffic).
Pedestrians
Non-motorized trips (walk/bike) currently constitute 24 percent of all trips to/from/within the South Boston Waterfront and are projected to more than double in number and represent about a third of all trips by 2035.1 These numbers do not include the walk trips between transit stops (South Station and Silver Line stations included) and Waterfront destinations, which represent an additional 27 percent of the person-trips that rely on the pedestrian network for some part of their journey each day. In other words, more than half (51%) of all existing trips to, from, and within the Waterfront today—and about 60 % in the future—involve walking.
1 Estimated based on CTPS model outputs and Boston data from American Commuter Survey Reports 2008-2012.
Network Scale and Connections
The scale of the South Boston Waterfront provides a unique challenge for pedestrian movements through the area. For example, the walk from east to west across the study area (from the intersection of L Street and E First Street to Dorchester Avenue at Summer Street) is approximately 30 minutes. The street network in the Waterfront to provide the grid of connectivity (ideally spaced every 300 to 500 feet for pedestrians) is still evolving. Large blocks of under or undeveloped land present barriers to pedestrians. The Fort Point Channel and Reserved Channel further limit connectivity from the south and west and underscore the importance of existing connections at Northern Avenue, Seaport Boulevard, Congress and Summer Streets from the west; and A, D, and L Streets, and Pappas way from the south.
Issues: Evolving network continuity, missing connections, accessibility for users of all abilities, and limited pedestrian-scale wayfinding signage are challenges to pedestrian accommodations to and within the district.
Needs: Reducing block scale in applicable areas of the district, minimizing the width of streets and intersections, calming traffic, and improving traffic controls are critical needs to improve the walkability of the South Boston Waterfront. This should include context responsive landscaping and amenities.
Need/Opportunity: Enhancing the primary east-west and north-south corridors that provide access to the Waterfront with a continuous, well-connected sidewalk network is critical to achieving a dynamic and walkable pedestrian environment. This should include context responsive landscaping and amenities.
Quality of Pedestrian Environment
Exacerbating the scale is the quality of the pedestrian connections within the Waterfront and between the district and adjacent communities. Geographic distances coupled with large blocks bordered by wide, vehicle-oriented corridors and undeveloped parcels have resulted in an environment that can be difficult to navigate and unwelcoming for pedestrians. Development and redevelopment efforts that are slowly engaging land uses between activity nodes and improving pedestrian amenities have lagged behind the demands and desires for pedestrian connections to the Waterfront. These factors have unintended effect of discouraging walking as the preferred mode of travel.
Needs: There are needs to both improve the street network and take advantage of paths, the Harborwalk, and existing and future private ways to improve the conditions for walking to the Waterfront from the neighborhoods.
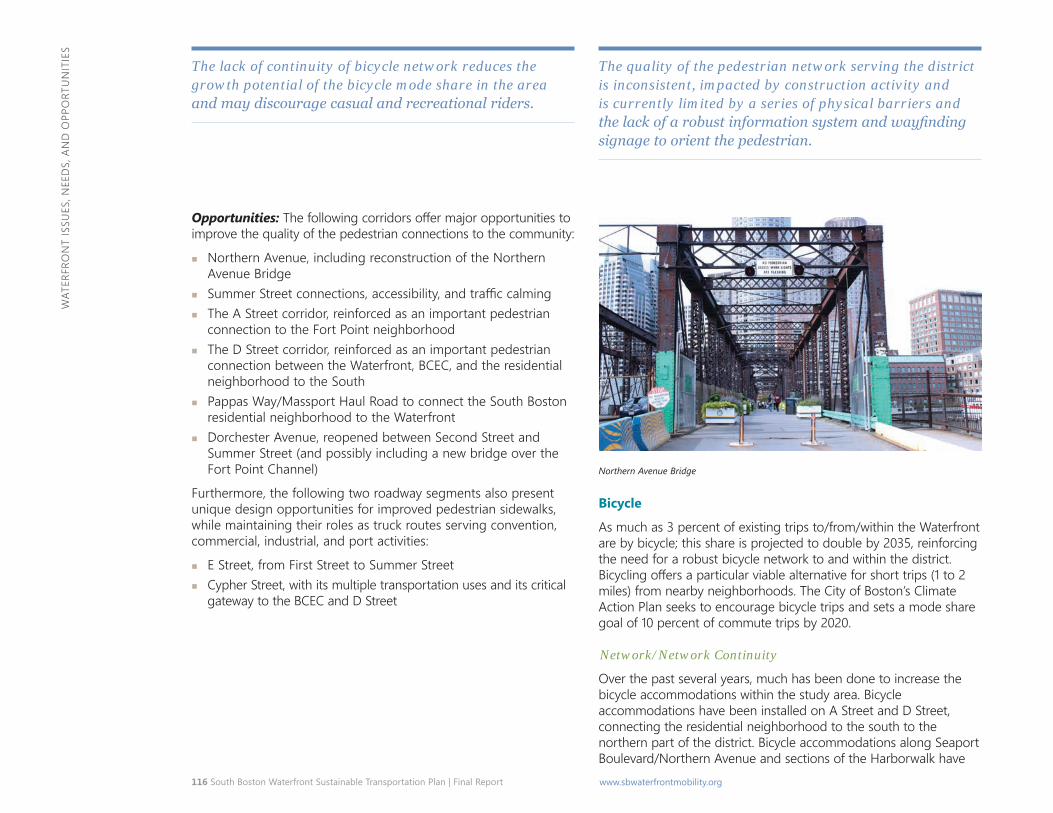
116 South Boston Waterfront Sustainable Transportation Plan | Final Report www.sbwaterfrontmobility.org
WAT
ERFR
ON
T IS
SUES
, NEE
DS,
AN
D O
PPO
RTU
NIT
IES
The lack of continuity of bicycle network reduces the growth potential of the bicycle mode share in the area and may discourage casual and recreational riders.
Opportunities: The following corridors offer major opportunities to improve the quality of the pedestrian connections to the community:
� Northern Avenue, including reconstruction of the Northern Avenue Bridge
� Summer Street connections, accessibility, and traffic calming � The A Street corridor, reinforced as an important pedestrian
connection to the Fort Point neighborhood � The D Street corridor, reinforced as an important pedestrian
connection between the Waterfront, BCEC, and the residential neighborhood to the South
� Pappas Way/Massport Haul Road to connect the South Boston residential neighborhood to the Waterfront
� Dorchester Avenue, reopened between Second Street and Summer Street (and possibly including a new bridge over the Fort Point Channel)
Furthermore, the following two roadway segments also present unique design opportunities for improved pedestrian sidewalks, while maintaining their roles as truck routes serving convention, commercial, industrial, and port activities:
� E Street, from First Street to Summer Street � Cypher Street, with its multiple transportation uses and its critical
gateway to the BCEC and D Street
The quality of the pedestrian network serving the district is inconsistent, impacted by construction activity and is currently limited by a series of physical barriers and the lack of a robust information system and wayfinding signage to orient the pedestrian.
Northern Avenue Bridge
Bicycle
As much as 3 percent of existing trips to/from/within the Waterfront are by bicycle; this share is projected to double by 2035, reinforcing the need for a robust bicycle network to and within the district. Bicycling offers a particular viable alternative for short trips (1 to 2 miles) from nearby neighborhoods. The City of Boston’s Climate Action Plan seeks to encourage bicycle trips and sets a mode share goal of 10 percent of commute trips by 2020.
Network/Network Continuity
Over the past several years, much has been done to increase the bicycle accommodations within the study area. Bicycle accommodations have been installed on A Street and D Street, connecting the residential neighborhood to the south to the northern part of the district. Bicycle accommodations along Seaport Boulevard/Northern Avenue and sections of the Harborwalk have
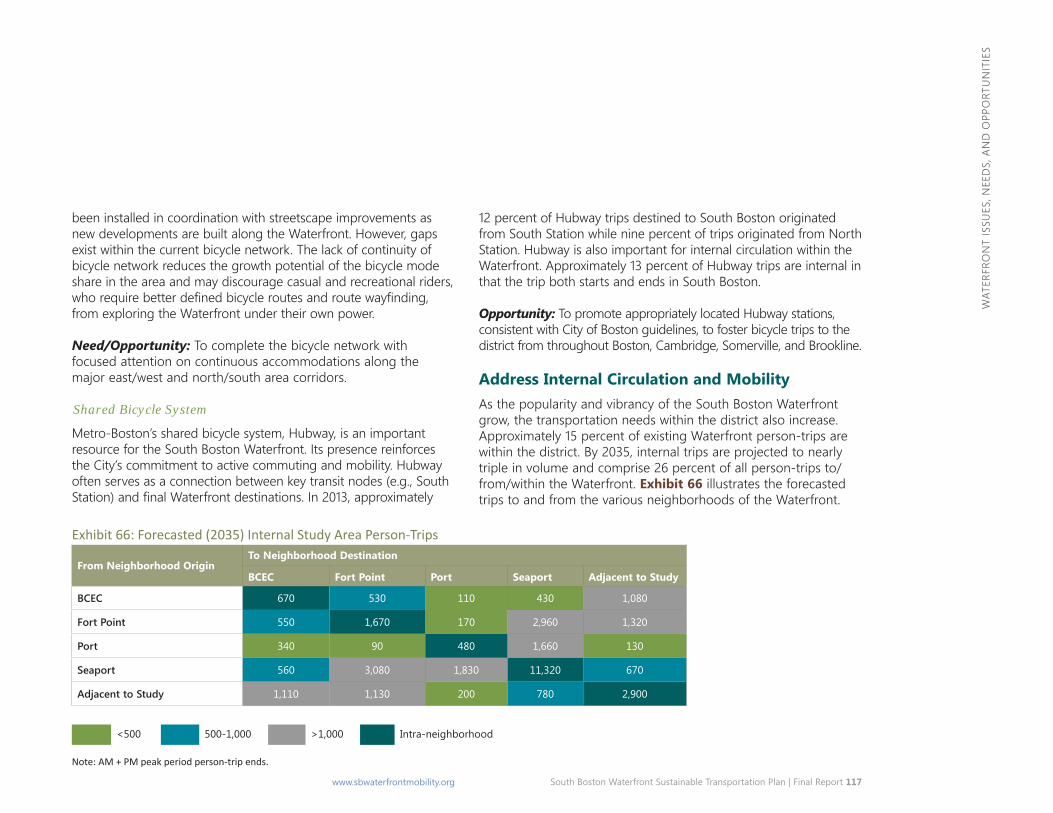
South Boston Waterfront Sustainable Transportation Plan | Final Report 117 www.sbwaterfrontmobility.org
WAT
ERFR
ON
T IS
SUES
, NEE
DS,
AN
D O
PPO
RTU
NIT
IES
<500 500-1,000 >1,000 Intra-neighborhood
been installed in coordination with streetscape improvements as new developments are built along the Waterfront. However, gaps exist within the current bicycle network. The lack of continuity of bicycle network reduces the growth potential of the bicycle mode share in the area and may discourage casual and recreational riders, who require better defined bicycle routes and route wayfinding, from exploring the Waterfront under their own power.
Need/Opportunity: To complete the bicycle network with focused attention on continuous accommodations along the major east/west and north/south area corridors.
Shared Bicycle System
Metro-Boston’s shared bicycle system, Hubway, is an important resource for the South Boston Waterfront. Its presence reinforces the City’s commitment to active commuting and mobility. Hubway often serves as a connection between key transit nodes (e.g., South Station) and final Waterfront destinations. In 2013, approximately
12 percent of Hubway trips destined to South Boston originated from South Station while nine percent of trips originated from North Station. Hubway is also important for internal circulation within the Waterfront. Approximately 13 percent of Hubway trips are internal in that the trip both starts and ends in South Boston.
Opportunity: To promote appropriately located Hubway stations, consistent with City of Boston guidelines, to foster bicycle trips to the district from throughout Boston, Cambridge, Somerville, and Brookline.
Address Internal Circulation and Mobility As the popularity and vibrancy of the South Boston Waterfront grow, the transportation needs within the district also increase. Approximately 15 percent of existing Waterfront person-trips are within the district. By 2035, internal trips are projected to nearly triple in volume and comprise 26 percent of all person-trips to/ from/within the Waterfront. Exhibit 66 illustrates the forecasted trips to and from the various neighborhoods of the Waterfront.
Exhibit 66: Forecasted (2035) Internal Study Area Person-Trips
From Neighborhood Origin To Neighborhood Destination
BCEC Fort Point Port Seaport Adjacent to Study
BCEC 670 530 110 430 1,080
Fort Point 550 1,670 170 2,960 1,320
Port 340 90 480 1,660 130
Seaport 560 3,080 1,830 11,320 670
Adjacent to Study 1,110 1,130 200 780 2,900
Note: AM + PM peak period person-trip ends.
118 South Boston Waterfront Sustainable Transportation Plan | Final Report www.sbwaterfrontmobility.org
WAT
ERFR
ON
T IS
SUES
, NEE
DS,
AN
D O
PPO
RTU
NIT
IES
The unintuitive roadway network and lack of wayfinding signs present barriers for visitors between the transit opportunities and the Cruiseport Boston Terminal.
The nature, density, and scale of land uses across the Waterfront will contribute to a diversity of activities within and between neighborhoods. By 2035, over 50 percent of residential growth will have occurred in the Seaport area due to projects such as Waterside Place, Pier 4, Fan Pier, and Seaport Square. General office and research and development space is projected to grow throughout the district while industrial growth is largely attributed to the anticipated relocation of the United States Postal Service (USPS) general mail facility and expansion of the BMIP/Boston Cargo Terminal. The BCEC expansion and growth in retail, hotel and cultural space primarily focused within the Seaport and BCEC areas will further enhance the Waterfront’s viability as a major destination for local and out-of-town visitors. The evolution of development will create a truly mixed use district and foster internal trip-making that underscores the need to improve the pedestrian environment, enhance transit access, and provide for bicycle connections.
Need: Maintaining and enhancing mobility within the South Boston Waterfront are critical for the development of a successful, vibrant district.
Internal Pedestrian Access
Significant growth is projected in walk trips within the Waterfront and from nearby transit, as discussed previously. The heaviest pedestrian demands within the study area are along the major east-west and north-south corridors, weighed heavily to the west across the Fort Point Channel. Generally, the quality of the pedestrian network serving the district is inconsistent, impacted by construction activity and is currently limited by a series of physical barriers and the lack of a robust information system and wayfinding signage to orient the pedestrian.
Network Connections
The pedestrian network within the Waterfront was largely developed following the alignment of the street network. As a result, movement of vehicles throughout the district has been a priority while movement of other modes such as pedestrians, bicycles, and transit considered secondary. Within the last ten years, regional and local efforts have been made to emphasize the multimodal nature of many streets, in particularly within urban areas, and to prioritize pedestrian accommodations. The City of Boston, Massport and private developers have also made a concerted effort to improve conditions for pedestrians within the study area through studies, guidance documents, and development agreements. As a result, most study area streets have adjacent sidewalks; however, the characteristics and condition of the pedestrian amenities are inconsistent. The pedestrian network also suffers from vertical circulation challenges, particularly along the Summer Street and World Trade Center viaducts.
The topography of the district with water on three sides also creates unique challenges for a pedestrian. While connections across the Fort Point Channel are adequate to the Seaport area, the Fort Point neighborhood and A Street corridor are underserved. The elevation difference between Summer Street, World Trade Center Avenue, and the rest of the Waterfront adds confusion and presents significant challenges for accessibility. Vertical connections are available only at discrete locations and create safety/security issues and potential pinch points in the system. The intersections of the interstate ramp system with the Waterfront street network increase pedestrian crossing distance and present a challenging environment along Congress Street. The South Boston Bypass Road and BCEC create barriers that impede efficient east-west pedestrian flow south of Summer Street. Improving mobility between the A Street and D Street corridors will be important as they continue to evolve. The unintuitive roadway network and lack of wayfinding signs present barriers for visitors between the transit opportunities and the Cruiseport Boston Terminal.
South Boston Waterfront Sustainable Transportation Plan | Final Report 119 www.sbwaterfrontmobility.org
WAT
ERFR
ON
T IS
SUES
, NEE
DS,
AN
D O
PPO
RTU
NIT
IES
Needs: There are needs to improve the street network—taking advantage of streets, the Harborwalk, and private ways—and provide engaging land uses, traveler information, and public spaces to improve the conditions for walking within the South Boston Waterfront area.
Opportunities: Within the Waterfront, there are several significant opportunities to improve the pedestrian network:
� Complete the street network between Northern Avenue and Seaport Boulevard in the Seaport area and Northern Avenue and Summer Street in the Port area
� Reinforce the pedestrian environment along A Street/Thomson Place and Boston Wharf Road
� Calm traffic and improve Summer Street for all modes � Strengthen pedestrian connections and wayfinding along
Northern Avenue and Drydock Avenue in the Port area and to the Boston Cruiseport
� Complete the street network between D Street and E Street as part of the BCEC expansion and hotel development
Access to Transit
Increased visibility of the three study area Silver Line stations is an important component of improving access to transit in the district, particularly since many transit users are visitors (e.g., tourists, conventioneers, cruise passengers) and may not be familiar with the transportation network. The branding at each station is inconsistent and pedestrian-scale wayfinding is lacking at all stations and within their respective surrounding areas. Courthouse Station does not have clearly marked “T” signs on the headhouses, which would make its presence as a transit station clear. While the City is currently planning to improve the pedestrian connections between Northern Avenue and Seaport Boulevard, wayfinding signage directing people between Fan Pier/Northern Avenue and
Courthouse Station could be improved in the near-term, particularly as development adjacent to Fan Pier is built out and sightlines to the headhouses become limited. World Trade Center Station can be accessed from two levels, at-grade from the south side of Congress Street and above grade from the World Trade Center viaduct. Its visibility from Seaport Boulevard is limited and the lack of wayfinding signs compound this problem. Silver Line Way Station is tucked in south of Congress Street, lacking visibility from all directions, and its markings are limited. This station would benefit from much improved pedestrian connections and pedestrian-scale signage from all directions.
Mobility hubs located at transit stations or within parking garages can improve mobility and internal circulation within the Waterfront.
Access to transit within the study area is also impeded by similar barriers as other Waterfront destinations, including the lack of a Complete Street network and need to cross interstate ramp systems along the Congress Street corridor.
Needs/Opportunities: Specific opportunities to improve pedestrian conditions within a 5-minute walk of each Silver Line station are highlighted in Exhibit 67.
Mobility Hubs
Access to and mobility within the Waterfront will often require the use of multiple modes of transportation. Traveler orientation and mobility is often hindered by the lack of traveler information and poor interface between modes. “Mobility hubs” located at transit stations, within public parking garages, or in close proximity to major trip generators (large scale developments, convention facilities, hotels, and cultural attractions), can address these challenges and improve mobility and internal circulation for both the regular and uninitiated visitor to the Waterfront. Mobility hubs are centers of activity that bring together alternative transportation modes, virtual trip planning, and place making at key locations. They co-locate transit stations and bus stops,
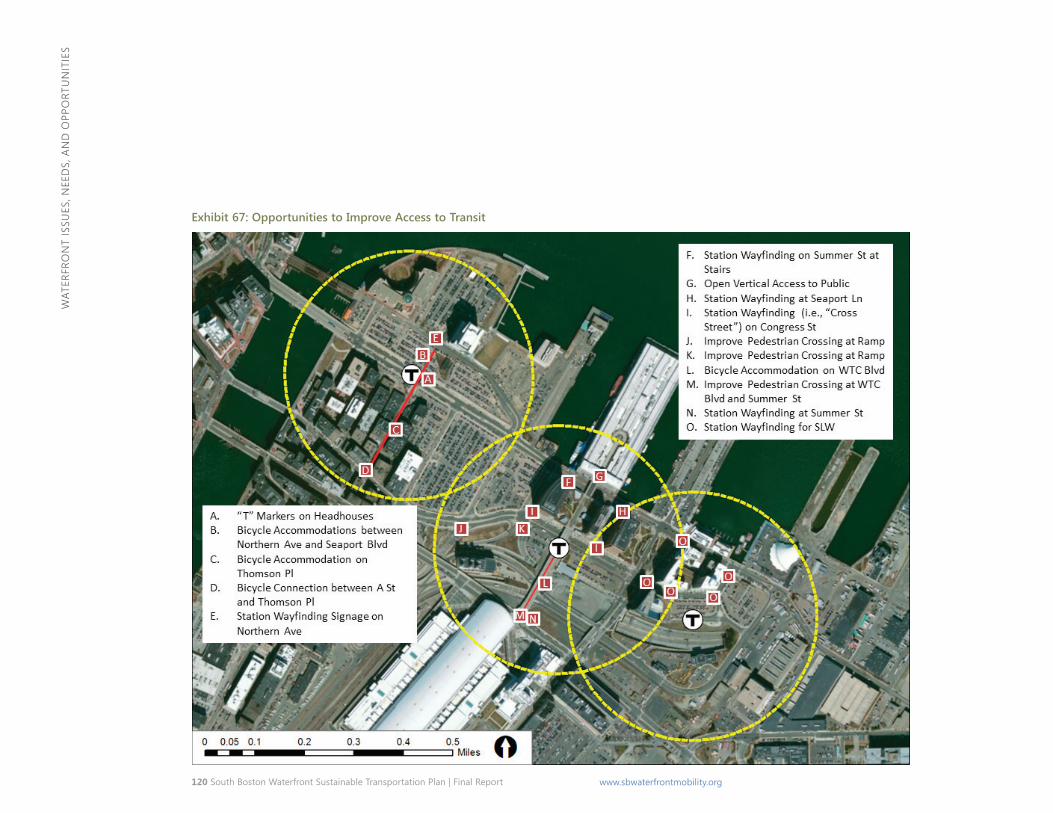
120 South Boston Waterfront Sustainable Transportation Plan | Final Report www.sbwaterfrontmobility.org
WAT
ERFR
ON
T IS
SUES
, NEE
DS,
AN
D O
PPO
RTU
NIT
IES
Exhibit 67: Opportunities to Improve Access to Transit
South Boston Waterfront Sustainable Transportation Plan | Final Report 121 www.sbwaterfrontmobility.org
WAT
ERFR
ON
T IS
SUES
, NEE
DS,
AN
D O
PPO
RTU
NIT
IES
Exhibit 68: South Boston Internal Transit Circulation Needs and Opportunities
122 South Boston Waterfront Sustainable Transportation Plan | Final Report www.sbwaterfrontmobility.org
WAT
ERFR
ON
T IS
SUES
, NEE
DS,
AN
D O
PPO
RTU
NIT
IES
car and bikeshare parking, clean-fuel charging stations, real-time travel information screens, pedestrian wayfinding maps, etc.
Ensuring that bicycle parking and amenity commitments are honored will underpin the viability of bicycling as a mode choice.
Need: There is a need to create mobility hubs that bring together multiple transit modes and parking in the Waterfront—including but not limited to Silver Line BRT, pedestrian connections, bicycle access, automobiles, water and bus services, and traveler information services and amenities. These hubs will serve as gateways to the South Boston Waterfront and should contribute to place-making and the public realm.
Opportunities: Opportunities to create meaningful mobility hubs exist around the Courthouse Station/Seaport Park/District Hall area; along the World Trade Center Viaduct (possibly within the planned Air-Rights Garage), between Summer Street and Seaport Boulevard with Silver Line, bus, water, pedestrian, and bicycle connections; and at Silver Line Way with important connections to the port area.
Transit
Existing transit services within the Waterfront are commuter focused and do not provide the internal connectivity or hours of service to address the needs of the growing tourism and hospitality industries, or the needs of the growing residential population.
Need: Travel within the district between an expanded BCEC, hotels, retail and restaurant uses, and various cultural offerings will become even more prevalent as development projects advance, particularly since many of these visitors do not have access to a car.
Opportunity: As shown in Exhibit 68, provision of a transit service to provide east-west connectivity within the district could serve many of the existing and future activity generators.
Bicycle
The Waterfront bicycle network is supportive of travel for both commuter and recreational uses along Seaport Boulevard and Northern Avenue. Recreational use is largely supported by the Harborwalk. Recent bicycle accommodation additions on A and D Street provide good connections to the South Boston residential neighborhood west of Dorchester Street. The provision of a robust bicycle network and accommodations (including bicycle parking and wayfinding) is likely to increase bicycling as a viable modal choice for a variety of trip purposes.
There are approximately 100 public use, on-street bike racks in the Waterfront today; Transportation Access Plan Agreements (TAPA) with BTD identify an additional 175 public bicycle parking racks to be provided over the next 3 years, largely planned for implementation upon occupancy of major developments. The City of Boston Bicycle Parking Guidelines also set standards for secure/covered bicycle parking, bike-share stations and shower facilities for any project subject to TAPA review. Ensuring that bicycle parking and amenity commitments are honored will underpin the viability of the bicycling as a mode choice.
Need: The provision of high quality bicycle accommodations could address a healthy share of the projected increase in intra-district trips and provide another mobility option besides walking and transit among study area neighborhoods.
Opportunities: The bicycle network could benefit from additional east-west connections along Summer Street and north south connections that penetrate the heart of the district. A robust bicycle network requires:
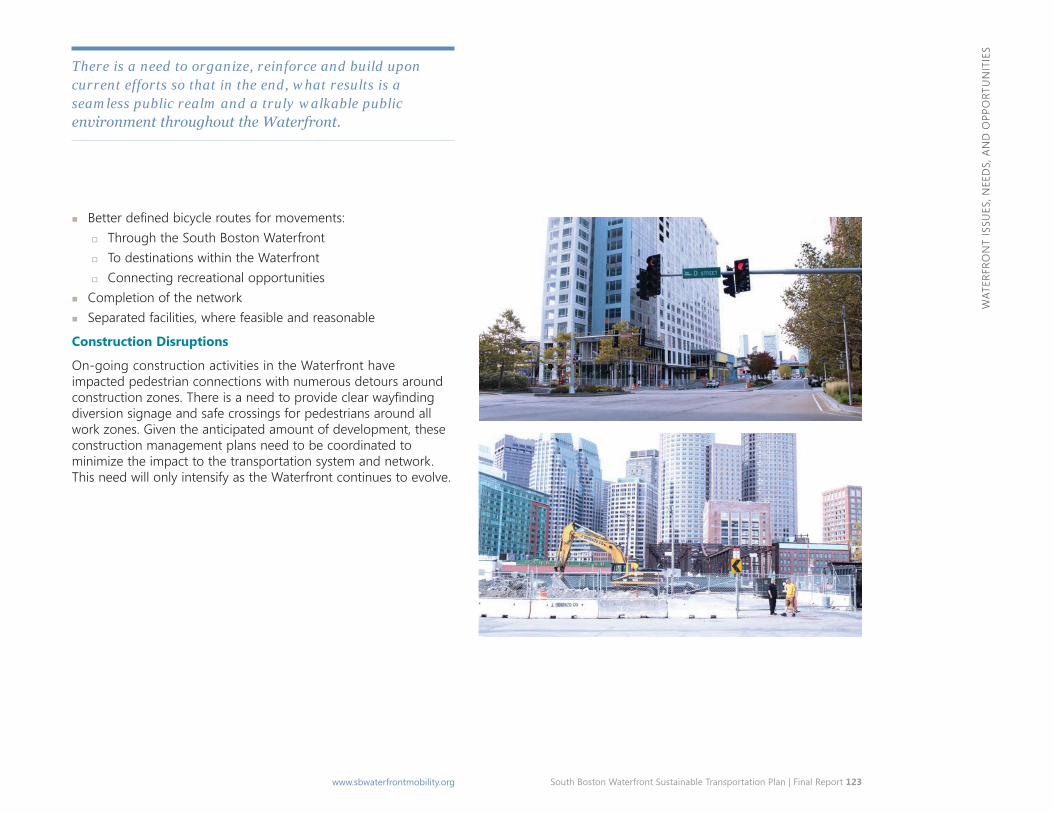
South Boston Waterfront Sustainable Transportation Plan | Final Report 123 www.sbwaterfrontmobility.org
WAT
ERFR
ON
T IS
SUES
, NEE
DS,
AN
D O
PPO
RTU
NIT
IES
There is a need to organize, reinforce and build upon current efforts so that in the end, what results is a seamless public realm and a truly walkable public environment throughout the Waterfront.
� Better defined bicycle routes for movements: � Through the South Boston Waterfront � To destinations within the Waterfront � Connecting recreational opportunities
� Completion of the network � Separated facilities, where feasible and reasonable
Construction Disruptions
On-going construction activities in the Waterfront have impacted pedestrian connections with numerous detours around construction zones. There is a need to provide clear wayfinding diversion signage and safe crossings for pedestrians around all work zones. Given the anticipated amount of development, these construction management plans need to be coordinated to minimize the impact to the transportation system and network. This need will only intensify as the Waterfront continues to evolve.
124 South Boston Waterfront Sustainable Transportation Plan | Final Report www.sbwaterfrontmobility.org
WAT
ERFR
ON
T IS
SUES
, NEE
DS,
AN
D O
PPO
RTU
NIT
IES
Enhance Public Realm City building within the South Boston Waterfront began in earnest two decades ago and continues to evolve today. The vision for a world-class live, work, play Waterfront neighborhood will still take decades more to achieve; however, it is important to reflect on how the mix of development, location of densities, changing patterns, planned projects, and quality of the public realm bear influence today on this goal, impact on travel demands, and what interim and short-term interventions might be possible to sustain an economically vibrant, livable Waterfront district.
Where We Are Today
The Waterfront is well under construction. There are many pieces to a complex puzzle underway, initiated by City, State and Regional Agencies, private developers, major landowners, many private institutions, and public/community interest groups. Many jurisdictions come together in sometimes unplanned ways.
Prior to the Seaport Square development (and recent additions and initiatives within Fan Pier and Pier 4), the streets/buildings/ open space fabric was a series of isolated pieces of contrasting neighborhood fabric and character (i.e., Historic Fort Point District vs. Courthouse vs. ICA and Fan Pier development vs. the historic piers, and the new Convention Center) as well as the contrasting characteristics of each of the primary east-west streets added up to a disconnected public realm in the making.
This is changing with the completion of Fan Pier District, and first phases of Seaport Square and their associated street and block layouts. The completion of Northern Avenue, Seaport Boulevard and integration of the secondary street and block networks of Fan Pier, Seaport Square, Pier 4 and Historic Fort Point is on its way to establishing a seamless public realm for the entire northwest quadrant of the South Boston Waterfront.
The elevated viaduct portion (including World Trade Center Avenue) could become a very special pedestrian environment.
Need: There is a need to organize, reinforce and build upon all these best efforts so that in the end, what results is a seamless public realm and a truly walkable public environment throughout the Waterfront. One particular area of focus is to identify the gaps, disconnects, inconsistencies and unrecognized design potential where these development projects come together with the task at hand of stitching together more effectively the evolving and expanding public realm.
Opportunity: The execution of a seamless pedestrian environment on critical east-west and north-south streets could provide continuity, connections, and plan making opportunities for the District as a whole.
Where We Go From Here
Streets and Blocks
The street and block patterns (size, shape, orientation and resulting building form) as the plan builds out vary greatly across the District. As Fan Pier and Seaport Square near completion, an interconnected fabric of streets and blocks will take shape. However, some areas may not take shape for some time due to development timing. This pattern can be used as a design strategy to organize the South Boston Waterfront as a series of smaller sub-districts or neighborhoods, each with its own design character and iconic public place or streets. The challenge will be to integrate different street and block patterns across the study area.
Street Design, Street Types and Hierarchy
The streets today vary in right-of-way width along their length, vary in their treatment and definition, and most intersections favor vehicular movements. There is not yet a clear designation or distinction of streets as to their level of importance, role, type, or design character. The creation of mixed-use Complete Streets as
South Boston Waterfront Sustainable Transportation Plan | Final Report 125 www.sbwaterfrontmobility.org
WAT
ERFR
ON
T IS
SUES
, NEE
DS,
AN
D O
PPO
RTU
NIT
IES
illustrated in Boston Complete Streets manual should be a key design strategy with the purpose of expanding the quantity and quality of the public realm in the District. That is now happening at Fan Pier and Seaport Square.
Seaport Boulevard
Seaport Boulevard has the opportunity to become the iconic street and identity for the entire South Boston Waterfront, as distinguished from Summer and Congress Streets. The redesign of Seaport Boulevard could provide the model for all other streets in the District, in terms of sidewalks, lighting, tree planting, street furniture, signage and materials.
Summer Street and World Trade Center Avenue
Summer Street needs a design focus as a major city-wide downtown commercial street type and the front door of an expanding Convention Center sub-district. The elevated viaduct portion of Summer Street (including World Trade Center Avenue) should become a special pedestrian environment, providing additional pedestrian and vehicular connections to the Silver Line, and below to Congress and Seaport Boulevard, as well as providing a more attractive route to the water. (e.g., NYC’s High Line Park). At the moment World Trade Center Avenue is unprotected and is too wide, lacking clear pedestrian termination points.
Congress Street
Congress Street’s role in the district is not clearly defined. It suffers from multiple characters as it transitions from a major downtown commercial street type like Summer Street and Seaport Boulevard west of Boston Wharf Road to a major transportation connector, back to a downtown commercial street. Future development along Congress Street, and its potential as a dedicated bus corridor, may help to redefine its character.
However, maintaining its critical role as an access point into the district from I-90 will remain a design challenge.
The Secondary Streets
The secondary street network is being constructed in Fan Pier and Seaport Square, but does not yet add up to a coherent, interconnected network. (i.e., South of Summer and East of East Service Road). Secondary streets (existing and proposed) provide the opportunity to introduce a smaller scale, interconnected, pedestrian-oriented design character in contrast to the major east-west corridors; and could also enhance and/or accentuate design variety and character within each neighborhood. For example, should the streetscape design elements being incorporated within the Fan Pier and Seaport Square area become standardized throughout? Or, does each neighborhood establish its own secondary streetscape vocabulary?
Need: There is a need to “complete the streets” for all modes of travel recognizing that there are differing requirements for functionality and access depending on the hierarchy of streets and differing land uses that each serves. Use of the City of Boston’s Complete Streets Manual and Design Guidelines will guide the creation of walkable, multi-functional, streets and streetscape environment.
Need: The pedestrian routes from inland to the water and Harborwalk (streets, pedestrian ways and view corridors) should be clearly identified and reinforced. They are just beginning to evolve.
Opportunities: As streets are completed and renewed, capitalize on opportunities to make them more efficient and memorable:
� Ensure that Summer Street, Seaport Boulevard, Congress Street, and D Street can accommodate a full range of users, including: pedestrians, bicycles, buses, automobiles, and trucks.
126 South Boston Waterfront Sustainable Transportation Plan | Final Report www.sbwaterfrontmobility.org
WAT
ERFR
ON
T IS
SUES
, NEE
DS,
AN
D O
PPO
RTU
NIT
IES
� Incorporate enhanced bus treatments into the design of streets (particularly along Congress Street) which can provide the distinctive character to the District, which is lacking at present (i.e., San Francisco or Portland streetcar expansions are offered as examples).
� Develop a street hierarchy, and use Boston’s Complete Street guidelines to identify streets by type from a design vocabulary point of view. Streets that take pedestrians to Harborwalk and the water can take on a contrasting design character.
� Explore reducing the size and scale of the paved areas in some of the larger right of way sections, so that streets become more balanced with respect to pedestrian access, scale and feel. There may be opportunities to expand the amounts of usable open space (i.e., wider sidewalks, plazas, pocket parks, bulb outs) by re-capturing paved areas of some of these streets (i.e., NYC Broadway and Street Righting programs).
� Consider additional designated pedestrian or bike routes on the edge of, or through the BMIP, to destinations such as Blue Hills Bank Pavilion, Dry Dock, Black Falcon Terminal, and historic South Boston neighborhood via Northern Avenue, Pappas Way or L Street.
� Explore what elements of the streetscape design can provide consistency vs. diversity and variety throughout the South Boston Waterfront. There is a fine balance between achieving design continuity versus an overly uniform and too repetitive public environment.
Opportunity: As a public realm strategy, “Green Streets” may be able to collect open spaces from within the neighborhoods and provide greenways to the water. “Green” streets incorporate more innovative design performance standards and design standards for storm management/bio-filtration/ ecological strategies (as per Boston Seaport Streets manual). Opportunities to incorporate elements of green treatments and reinforce greenways to the
water include A Street/Thomson Place to Fan Pier; Boston Wharf Road/West Service Road; Pappas Way to Blue Hills Bank Pavilion; Wormwood to Fort Point Channel; and D Street to the Fish Pier.
Strategic Urbanism
In the 1999 Seaport Public Realm Plan, there were few opportunities to locate usable public open spaces inboard from the water (with the exception of the linear park in the 100-Acre Plan). In that sense, the public streets will become one of the most important open space components of a walkable public realm as it evolves.
The phasing of current development in the District is generally from west to east and north to south. The “dividing lines” where districts come together in less than ideal ways include Boston Wharf Road/East Service Road; B Street; the area south and west of Melcher (Necco Court/Piers Way); and along the eastern end of the Massport Haul Road (Pumphouse Road to Northern Avenue).
Issue: Critical street and pedestrian connections may require additional focus to ensure a seamless public environment over the next five to eight years.
Opportunities: Advancing, as short-term action items, more affirmative urban design strategies could accelerate the public realm aspirations in the Waterfront, such as:
� The Complete Streets treatment of A Street or Boston Wharf Road/West Service Road
� Improving the pedestrian environment and engaging street level land uses along Summer, World Trade Center Avenue and D Street through the design and construction of the Headquarters Hotel, Air-rights Garage, and Waterside Place Phase 2 developments
South Boston Waterfront Sustainable Transportation Plan | Final Report 127 www.sbwaterfrontmobility.org
WAT
ERFR
ON
T IS
SUES
, NEE
DS,
AN
D O
PPO
RTU
NIT
IES
� Making neighborhood gateways to the district at A Street, D Street and Pappas Way
� Reopen Dorchester Avenue
Opportunity: There may be an opportunity to recapture paved areas and under-utilized portions of street rights-of-way’s as usable smaller scale open spaces (“parklets”), as part of an interconnected network of open spaces and areas of pedestrian refuge.
Public Transit
Another critical public realm issue, as previously discussed, would be to advance implementation of clear connections to transit stops, particularly Silver Line, potential enhanced bus service on Congress Street, and ferry intermodal stops from targeted public streets.
The public transit stops and stations (Silver Line, ferry and bus routes) need to become more prominent, more visible, and become part of the armature and design vocabulary of the public realm. Design elements of designated public transit corridors and station stops (as identified in Boston’s Coordinated Furniture Program) which can provide continuity throughout the district need to be defined with attention to elements that will provide diversity and character to each of the sub-districts. (e.g., San Francisco and Portland light rail expansions). The potential of intermodal stops (Silver Line, Bus, BRT, ferry), or mobility hubs, needs a design focus.
Summer Street Viaduct/World Trade Center Avenue
There should be further study to better integrate Summer Street’s upper level viaduct and World Trade Center Avenue with the at street grade network via additional streets and/or pedestrian ways. As previously mentioned, the design and construction of the Headquarters Hotel, Air-rights Garage, and Waterside Place Phase 2 developments provide an opportunity to better tie these areas
together in the short-term. Plazas, widened sidewalks, weather protected walks, and private development should all be part of the mix. Future opportunities to improve the public realm and reduce the impact that the highway and tunnel create in the middle of the District will be realized through the later phases of the Seaport Square development and development of the so-called sausage parcel on the southwest quadrant of the I-90/I93 interchange at Congress Street.
The BRA now requires that preparedness and resiliency strategies are incorporated into all relevant components of a project, including transportation, infrastructure systems, and urban design.
Need/Opportunity: Capitalize on every development opportunity to improve the pedestrian access to transit and the public realm in and around transit/mobility hubs.
Additional Design Issues and Opportunities:
� Consider additional pedestrian and/or transit crossings of Fort Point Channel to better integrate South Station with the South Boston Waterfront.
� Consider pedestrian crossing over SBBR, connecting Fort Point with BCEC.
� Take into consideration the ability to extend the transit and public realm armature with potential re-connections to Dorchester Avenue and the Rose Kennedy Greenway.
� Articulate a more sequential development phasing plan that reinforces transportation improvements and placemaking strategies for the District.
� Consider an administrative structure to better oversee the design, construction, and maintenance of the overall public realm of the South Boston Waterfront.
128 South Boston Waterfront Sustainable Transportation Plan | Final Report www.sbwaterfrontmobility.org
WAT
ERFR
ON
T IS
SUES
, NEE
DS,
AN
D O
PPO
RTU
NIT
IES
Plan for Resiliency The ability of the City and the South Boston Waterfront to plan for a more resilient future, recover (“bounce back”) more quickly and relatively inexpensively from flooding or other stresses, respond to natural disasters and severe weather, and be prepared for national and local emergencies like terrorism, hazardous material spills, and major transportation infrastructure impacts influences a broad range of planning, design, construction, and operational activities. The Waterfront is particularly vulnerable due to its low elevation, waterfront exposure, and the transportation resources that are below ground (most notably the Silver Line and the I-90 tunnel). The City, MassDOT, Massport, the Massachusetts Convention Center Authority, the private sector and others, are all currently forming policies and procedures that define their own resiliency requirements. Given its vulnerability to the impacts of climate change, the City of Boston is also nearing completion of a comprehensive update of its Climate Action Plan, which focuses on ways in which the City can reduce the citywide carbon footprint, but also prepare for the impacts of climate change by building more resiliency into its infrastructure, buildings, and operations.
Resiliency Planning Initiatives and Resources
According to a recent review by the Boston Harbor Association2, Boston has implemented a series of resiliency measures in response to climate change since the 1990s. Most recently, the following actions have been taken by the City:
2 Preparing for the Rising Tide, Boston Harbor Association, 2013.
� The Boston Water and Sewer Commission is incorporating the effects of sea level rise and more intense precipitation into its new 25-year capital plan for the storm and waste water system.
� The Boston Redevelopment Authority approved a broader preparedness questionnaire that all large projects under review are required to complete.
� The Office of Emergency Management included climate change concerns in the city’s natural hazards mitigation plan, which is updated every five years.
� The Boston Conservation Commission asks applicants to consider the effects of sea-level rise in their projects.
� The Parks and Recreation Department has expanded the Grow Boston Greener tree planting program.
� The Boston Transportation Department’s Complete Streets Guidelines include green infrastructure and other measures.
� The Boston Public Health Commission has made climate change impacts a component in all project and policy review.
The City is currently taking steps to integrate policies together and prioritize specific actions based on the following:
� Identifying the elevation at which flood-prone buildings and infrastructure are at risk.
� Identifying property-specific vulnerability. � Developing cost-effective measures to increase vulnerable
property resilience. � Pursuing an integrated strategy to maximize the resilience of
Boston’s most sensitive populations, neighborhoods and infrastructure.
Development Activities
For development projects, the BRA is taking the lead on resiliency. The agency currently requires project proponents to complete and submit a climate change preparedness and resiliency checklist with a project notification form (PNF) filing. The checklist requires projects to consider the impacts of future climate conditions over the expected life of the project and to describe planning, design, and construction strategies that could mitigate any identified adverse impacts. The BRA now requires that preparedness and resiliency strategies are incorporated into all relevant components
South Boston Waterfront Sustainable Transportation Plan | Final Report 129 www.sbwaterfrontmobility.org
WAT
ERFR
ON
T IS
SUES
, NEE
DS,
AN
D O
PPO
RTU
NIT
IES
of a project, including transportation, infrastructure systems, and urban design. These strategies are reviewed by the Boston Interagency Green Building Committee (IGBC) and the proponent must submit updated final checklists and responses based on any comments received by IGBC. Final design approval/Article 80 documents are only authorized once the preparedness and resiliency checklists and strategies are approved.
Infrastructure
In addition to the City’s activities highlighted above, MassDOT and Massport are also focused on resiliency. MassDOT is currently undertaking a Federal Highway Administration (FHWA) Pilot Project to evaluate Climate Change and Extreme Weather Vulnerability Assessments and Adaptation Options of the Central Artery. In addition, it has established an internal working group to advise on next steps and work with stakeholders to complete a statewide vulnerability assessment for all facilities and adopt Climate Adaptation Plans by 2015. Similarly, the Department of Conservation and Recreation (DCR), which also owns and operates a number of historic parkways and roadways—including Day and Morrissey Boulevards-- that are particularly vulnerable to flooding and sea level rise, will conduct an assessment to determine and quantify the levels of exposure and susceptibility that DCR’s parkways and roadways face.
For its maritime properties, Massport recognizes possible impacts related to major facility and equipment loss, the potential for long-term closure, and the potential losses to cruise and container business. Massport is currently finalizing its resiliency framework to address both short and long-term resiliency of critical buildings and infrastructure on its property. The plan includes preparing existing infrastructure for future storms by employing flood protection barriers, moving electrical and mechanical equipment to higher ground (where practical), focusing on restoring services
quickly, using water resistant materials, and building green infrastructure where appropriate to slow storm surge. The plan also includes reducing impacts through sustainability by reducing greenhouse gas emissions, developing a sustainability management plan and design guidelines, ensuring MEPA/NEPA compliance and project mitigation, and collaborating with other agencies and institutions.
130 South Boston Waterfront Sustainable Transportation Plan | Final Report www.sbwaterfrontmobility.org
WAT
ERFR
ON
T IS
SUES
, NEE
DS,
AN
D O
PPO
RTU
NIT
IES
South Boston Waterfront Resiliency
The majority of planning thus far is focused on resiliency as it relates to natural disasters and embedding protective strategies into new buildings and infrastructure projects. Although research is catching up on responsiveness to man-made disasters, resiliency for these types of events is currently focused on orderly and immediate evacuations. The state, through the mass.gov website, has launched Ready Massachusetts and MA 2-1-1 initiatives to help families with natural and man-made disaster preparedness which mirrors the federal ready.gov initiative. In addition, there are multi-jurisdictional efforts underway currently to formalize a comprehensive emergency evacuation plan that would address the needs of the Waterfront.
Need: The need to further incorporate resiliency strategies in preparation of natural and man-made events is critical to the future vitality of the Waterfront and area transportation and mobility.
Opportunities: Important near and long-term considerations in planning for resiliency in the South Boston Waterfront include:
� Continue to work to reduce the carbon footprint of activities in the South Boston Waterfront through energy management strategies and programs, efforts to reduce single-occupant automobile use, and promotion of transit, walking, and biking
� Provide a mix of land uses and services that reduce the need to travel
� Keep the current infrastructure in a state of good repair � Incorporate protective strategies into on-going development
and new and renewed infrastructure design and construction
� Add redundancies into street and transit systems (including water transportation) to provide options in the event of service interruptions
� Establish a multi-agency organization and process for prioritizing investment needs and decision-making
� Ensure a coordinated, comprehensive, and tested emergency response plan is in place
� Educate and inform the diverse stakeholders regularly on initiatives, procedures, and responsibilities
South Boston Waterfront Sustainable Transportation Plan | Final Report 131 www.sbwaterfrontmobility.org
Reco
mm
end
atio
ns
More than 100 discrete transit, water transportation, pedestrian, roadway, and bicycle alternatives were developed and evaluated.
RecommendaTionS Alternatives Assessment and Development of Recommendations through public outreach, agency input, and the development of existing and forecasted transportation issues and opportunities, more than 100 discrete transit, water transportation, pedestrian, roadway, and bicycle alternatives were developed and evaluated. together, these alternatives include a breadth of options to improve regional access, expand community connections, enhance internal waterfront mobility, and improve the public realm.
each of the discrete transit and water transportation alternatives was defined by service route, characteristics, market served, and potential benefit to the market. These alternatives were analyzed using a “mode-share sketch model,” which leverages the Central Transportation Planning Staff (CTPS) regional travel demand model to produce ridership estimates between the study area and the rest of the Greater Boston region. Targeted market information obtained from the CTPS model was used with the sketch model to determine the potential for new riders, and annual travel time and user cost savings. each alternative was also reviewed for feasibility from a conceptual engineering standpoint. alternatives were then evaluated and screened based on their ease of implementation, ability to increase ridership, improve transportation experience, and provide a measurable benefit for a relative cost.
Each of the discrete roadway alternatives was defined by the nature of the improvement and whether it provided a regional or local benefit. Regional strategies were tested with the regional travel demand subarea model developed in conjunction with this Plan. Local strategies were tested using traffic operations analysis
software. similar to transit alternatives, each roadway alternative was analyzed to determine annual travel time and user cost savings, conceptual costs, and engineering feasibility. alternatives were evaluated based on their ability to improve roadway congestion, reduce impacts felt on adjacent communities, and improve access to the working port and freight-dependent businesses.
Public realm recommendations were developed in the context of community suggestions and through discussions with the Interagency Working Group.
alternatives that showed merit were retained for further consideration, in some cases refined, and incorporated into the Plan as a short (0 to 3 year), medium (3 to 10 year), or long (10 to 20 year) term recommendation. Where applicable, advance planning and design efforts needed to support a particular medium to long-term improvement are also included in the recommendations. alternatives dismissed from further consideration generally fell into three categories: infeasible due to physical construction; poor benefit/cost ratio; or because the benefits were able to be achieved as part of a lower cost alternative. For alternatives dismissed, consideration was given to whether the discrete alternative could be combined with other alternatives to create a more robust option and analyzed further as needed. each stage of the alternatives analysis screening and drafting of Plan recommendations was reviewed by the iWG.
Recommendations Growth and vitality of the existing south Boston Waterfront were set in motion more than three decades ago through infrastructure planning and investment (principally, the Boston Harbor Project, Central Artery/Tunnel Project, the South Boston Bypass Road, the development of commonwealth Flats, and construction of the Silver Line Transitway Tunnel from South Station), along with additional public sector investment in the new Federal courthouse
132 South Boston Waterfront Sustainable Transportation Plan | Final Report www.sbwaterfrontmobility.org
Reco
mm
end
atio
ns
and the Boston Convention and Exhibition Center. In 2000, the city of Boston released the south Boston transportation study (“the 2000 Plan”) that codified a comprehensive set of transportation recommendations to support the pending wave of development while protecting the residential neighborhood and preserving the working port and industrial land uses.
The Sustainable Transportation Plan lays out a blueprint for transportation systems and public realm improvement for the South Boston Waterfront over the next two decades.
Much has changed in the almost 15 years since the 2000 Plan was published in terms of the Waterfront’s development and in the transportation system that serves it—since many of the 2000 Plan recommendations were subsequently implemented. As we look to the future, additional emphasis at the state and local levels is also being placed on increasing sustainable transportation modes (walking, bicycling, and transit), ensuring the compatibility of transportation solutions with environmental and quality of life goals, and actively managing the performance of existing infrastructure. With this context, this sustainable transportation Plan lays out a blueprint for transportation systems and public realm improvements for the south Boston Waterfront over the next two decades. included in these recommendations are activities currently underway as well as immediate and short-term actions to address existing transportation mobility issues.
The recommendations proposed by this plan are organized by their principal objectives, as follows:
� Improve Regional Access – improvements to connectivity to the regional highway system that could reduce travel delays and the number of vehicles that divert from the regional highway system to the local street network.
� Expand Community Connections – improvements to the connectivity between the Waterfront and adjacent communities such as the traditional south Boston neighborhood and the south end.
� Enhance Internal Waterfront Mobility – improvements to the connectivity of key destinations within the Waterfront.
� Improve Public Realm – improvements to the physical environment visible and accessible to the public throughout the Waterfront.
� Implement Supportive Management Strategies and Policies – improvements to strategy and policy decisions that affect transportation infrastructure within the Waterfront.
� Maintain a State of Good Repair – ensuring all capital assets are fully functioning and are rehabilitated or replaced before the end of their design life.
The tables that follow are organized by these categories and include a brief description on the recommendation, the timeframe for implementation, and agencies responsible for overview of their implementation.
it should be underscored that many of the capital intensive recommendations identified in this Plan and the timing for their implementation, are subject to further review, planning, and programming as part of other state and federally mandated transportation planning and environmental processes. notably, to be advanced, these projects will need be considered and endorsed as part of the Boston Metropolitan Organization’s update to its fiscally-constrained Long-Range Transportation Plan, the MassDOT/MBTA Program for Mass Transportation, and/or the City of Boston’s Mobility Plan (all of which are just getting underway). Depending on the nature of the project and the source of funding, state and/or federal environmental documentation and clearances may also be required.
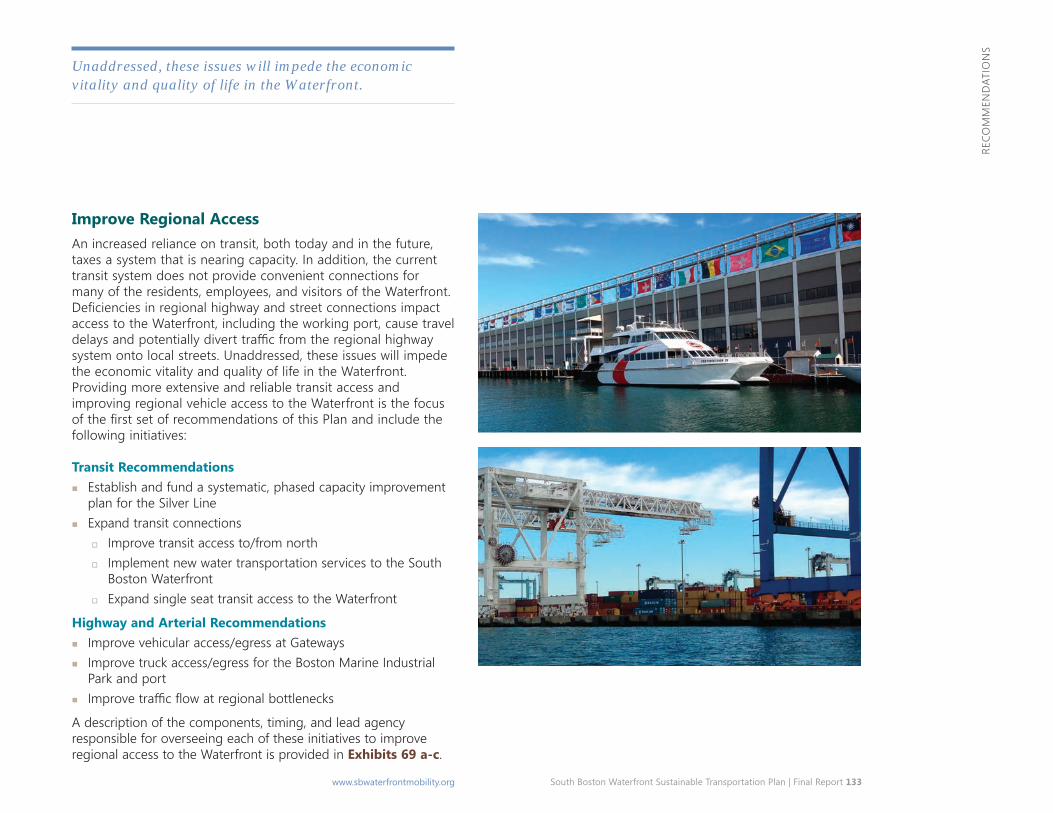
South Boston Waterfront Sustainable Transportation Plan | Final Report 133 www.sbwaterfrontmobility.org
Reco
mm
end
atio
ns
Unaddressed, these issues will impede the economic vitality and quality of life in the Waterfront.
Improve Regional Access an increased reliance on transit, both today and in the future, taxes a system that is nearing capacity. in addition, the current transit system does not provide convenient connections for many of the residents, employees, and visitors of the Waterfront. Deficiencies in regional highway and street connections impact access to the Waterfront, including the working port, cause travel delays and potentially divert traffic from the regional highway system onto local streets. Unaddressed, these issues will impede the economic vitality and quality of life in the Waterfront. Providing more extensive and reliable transit access and improving regional vehicle access to the Waterfront is the focus of the first set of recommendations of this Plan and include the following initiatives:
Transit Recommendations � establish and fund a systematic, phased capacity improvement
plan for the silver Line � expand transit connections
� Improve transit access to/from north � implement new water transportation services to the south
Boston Waterfront � expand single seat transit access to the Waterfront
Highway and Arterial Recommendations � Improve vehicular access/egress at Gateways � Improve truck access/egress for the Boston Marine Industrial
Park and port � Improve traffic flow at regional bottlenecks
a description of the components, timing, and lead agency responsible for overseeing each of these initiatives to improve regional access to the Waterfront is provided in Exhibits 69 a-c.
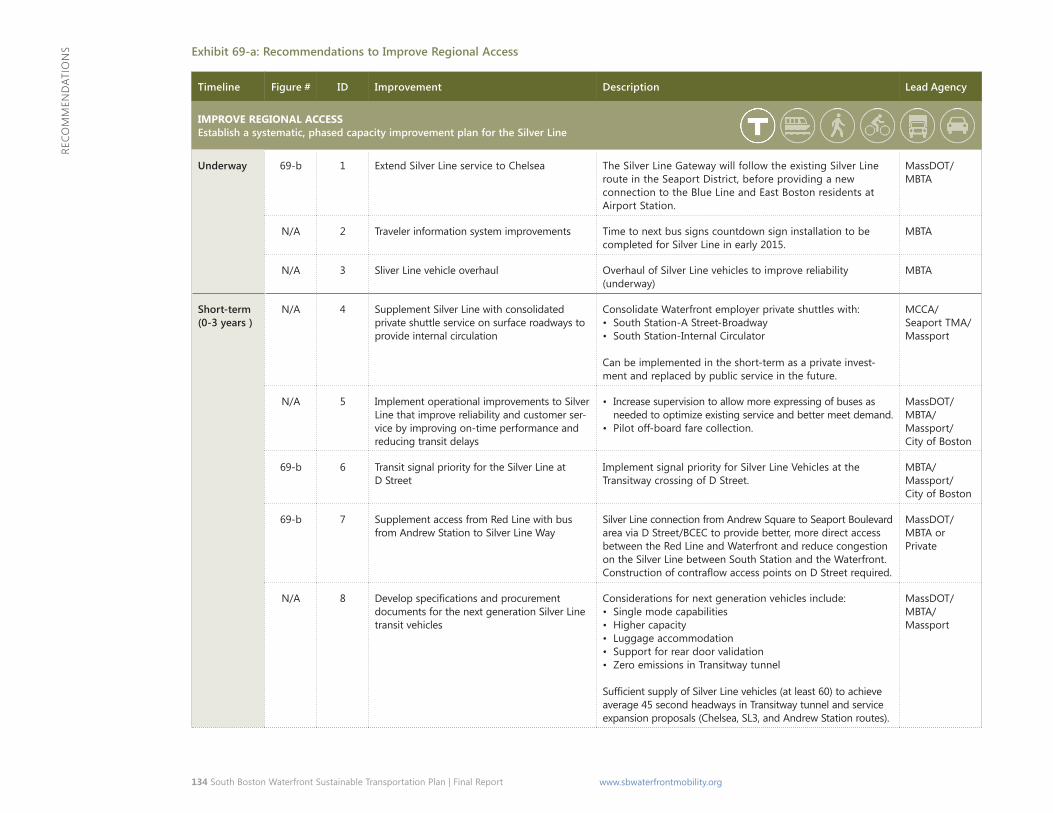
134 South Boston Waterfront Sustainable Transportation Plan | Final Report www.sbwaterfrontmobility.org
Reco
mm
end
atio
ns Exhibit 69-a: Recommendations to Improve Regional Access
Timeline Figure # ID Improvement Description Lead Agency
ImpRovE REgIonAl AccEss Establish a systematic, phased capacity improvement plan for the Silver Line
Underway 69-b 1 extend Silver Line service to chelsea The Silver Line Gateway will follow the existing Silver Line route in the Seaport district, before providing a new connection to the Blue Line and east Boston residents at airport Station.
massdoT/ mBTa
n/a 2 Traveler information system improvements Time to next bus signs countdown sign installation to be completed for Silver Line in early 2015.
mBTa
n/a 3 Sliver Line vehicle overhaul overhaul of Silver Line vehicles to improve reliability (underway)
mBTa
Short-term (0-3 years )
n/a 4 Supplement Silver Line with consolidated private shuttle service on surface roadways to provide internal circulation
consolidate Waterfront employer private shuttles with: • South Station-a Street-Broadway • South Station-internal circulator
can be implemented in the short-term as a private invest-ment and replaced by public service in the future.
mcca/ Seaport Tma/ massport
n/a 5 implement operational improvements to Silver Line that improve reliability and customer ser-vice by improving on-time performance and reducing transit delays
• increase supervision to allow more expressing of buses as needed to optimize existing service and better meet demand.
• Pilot off-board fare collection.
massdoT/ mBTa/ massport/ city of Boston
69-b 6 Transit signal priority for the Silver Line at d Street
implement signal priority for Silver Line Vehicles at the Transitway crossing of d Street.
mBTa/ massport/ city of Boston
69-b 7 Supplement access from Red Line with bus from andrew Station to Silver Line Way
Silver Line connection from andrew Square to Seaport Boulevard area via d Street/Bcec to provide better, more direct access between the Red Line and Waterfront and reduce congestion on the Silver Line between South Station and the Waterfront. ConstructionofcontraflowaccesspointsonDStreetrequired.
massdoT/ mBTa or Private
n/a 8 Developspecificationsandprocurement documents for the next generation Silver Line transit vehicles
considerations for next generation vehicles include: • Single mode capabilities • Higher capacity • Luggage accommodation • Support for rear door validation • Zero emissions in Transitway tunnel
SufficientsupplyofSilverLinevehicles(atleast60)toachieve average 45 second headways in Transitway tunnel and service expansion proposals (chelsea, SL3, and andrew Station routes).
massdoT/ mBTa/ massport
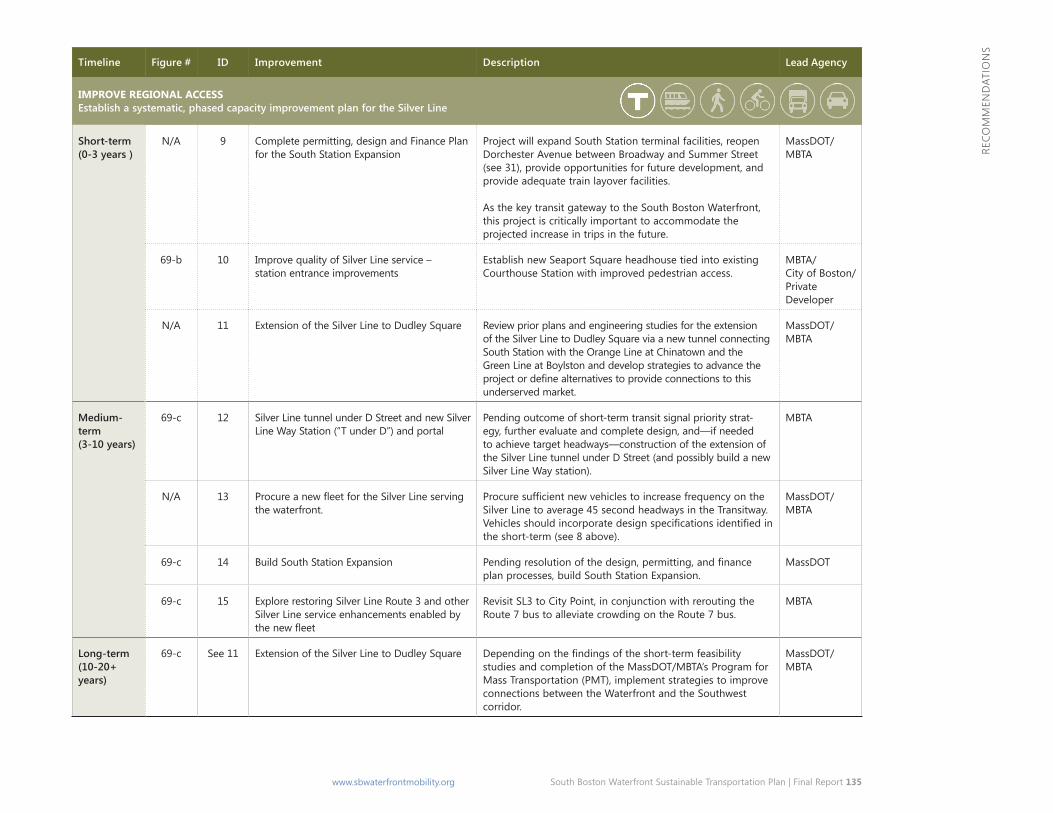
South Boston Waterfront Sustainable Transportation Plan | Final Report 135 www.sbwaterfrontmobility.org
Reco
mm
end
atio
ns
Timeline Figure # ID Improvement Description Lead Agency
ImpRovE REgIonAl AccEss Establish a systematic, phased capacity improvement plan for the Silver Line
Short-term (0-3 years )
n/a 9 complete permitting, design and Finance Plan for the South Station expansion
Project will expand South Station terminal facilities, reopen dorchester avenue between Broadway and Summer Street (see 31), provide opportunities for future development, and provide adequate train layover facilities.
as the key transit gateway to the South Boston Waterfront, this project is critically important to accommodate the projected increase in trips in the future.
massdoT/ mBTa
69-b 10 improve quality of Silver Line service – station entrance improvements
establish new Seaport Square headhouse tied into existing courthouse Station with improved pedestrian access.
mBTa/ city of Boston/ Private developer
n/a 11 extension of the Silver Line to dudley Square Review prior plans and engineering studies for the extension of the Silver Line to dudley Square via a new tunnel connecting South Station with the orange Line at chinatown and the Green Line at Boylston and develop strategies to advance the projectordefinealternativestoprovideconnectionstothis underserved market.
massdoT/ mBTa
Medium-term (3-10 years)
69-c 12 Silver Line tunnel under d Street and new Silver Line Way Station (“T under d”) and portal
Pending outcome of short-term transit signal priority strat-egy, further evaluate and complete design, and—if needed to achieve target headways—construction of the extension of the Silver Line tunnel under d Street (and possibly build a new Silver Line Way station).
mBTa
n/a 13 ProcureanewfleetfortheSilverLineserving the waterfront.
Procuresufficientnewvehiclestoincreasefrequencyonthe Silver Line to average 45 second headways in the Transitway. Vehiclesshouldincorporatedesignspecificationsidentifiedin the short-term (see 8 above).
massdoT/ mBTa
69-c 14 Build South Station expansion Pendingresolutionofthedesign,permitting,andfinance plan processes, build South Station expansion.
massdoT
69-c 15 explore restoring Silver Line Route 3 and other Silver Line service enhancements enabled by thenewfleet
Revisit SL3 to city Point, in conjunction with rerouting the Route 7 bus to alleviate crowding on the Route 7 bus.
mBTa
Long-term (10-20+ years)
69-c See 11 extension of the Silver Line to dudley Square Dependingonthefindingsoftheshort-termfeasibility studies and completion of the massdoT/mBTa’s Program for mass Transportation (PmT), implement strategies to improve connections between the Waterfront and the Southwest corridor.
massdoT/ mBTa
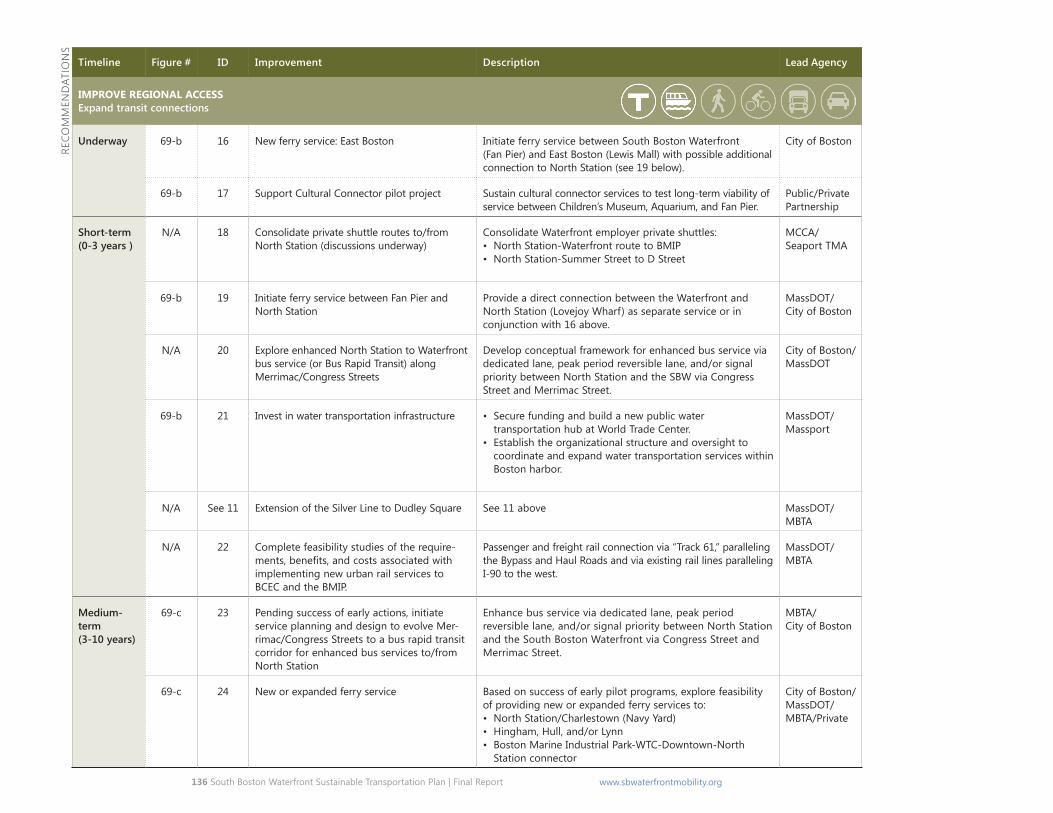
136 South Boston Waterfront Sustainable Transportation Plan | Final Report www.sbwaterfrontmobility.org
Reco
mm
end
atio
ns
Timeline Figure # ID Improvement Description Lead Agency
ImpRovE REgIonAl AccEss Expand transit connections
Underway 69-b 16 new ferry service: east Boston initiate ferry service between South Boston Waterfront (Fan Pier) and east Boston (Lewis mall) with possible additional connection to north Station (see 19 below).
city of Boston
69-b 17 Support cultural connector pilot project Sustain cultural connector services to test long-term viability of service between children’s museum, aquarium, and Fan Pier.
Public/Private Partnership
Short-term (0-3 years )
n/a 18 consolidate private shuttle routes to/from north Station (discussions underway)
consolidate Waterfront employer private shuttles: • north Station-Waterfront route to BmiP • north Station-Summer Street to d Street
mcca/ Seaport Tma
69-b 19 initiate ferry service between Fan Pier and north Station
Provide a direct connection between the Waterfront and north Station (Lovejoy Wharf) as separate service or in conjunction with 16 above.
massdoT/ city of Boston
n/a 20 explore enhanced north Station to Waterfront bus service (or Bus Rapid Transit) along merrimac/congress Streets
develop conceptual framework for enhanced bus service via dedicated lane, peak period reversible lane, and/or signal priority between north Station and the SBW via congress Street and merrimac Street.
city of Boston/ massdoT
69-b 21 invest in water transportation infrastructure • Secure funding and build a new public water transportation hub at World Trade center.
• establish the organizational structure and oversight to coordinate and expand water transportation services within Boston harbor.
massdoT/ massport
n/a See 11 extension of the Silver Line to dudley Square See 11 above massdoT/ mBTa
n/a 22 complete feasibility studies of the require-ments,benefits,andcostsassociatedwith implementing new urban rail services to Bcec and the BmiP.
Passenger and freight rail connection via “Track 61,” paralleling the Bypass and Haul Roads and via existing rail lines paralleling i-90 to the west.
massdoT/ mBTa
Medium-term (3-10 years)
69-c 23 Pending success of early actions, initiate service planning and design to evolve mer-rimac/congress Streets to a bus rapid transit corridor for enhanced bus services to/from north Station
enhance bus service via dedicated lane, peak period reversible lane, and/or signal priority between north Station and the South Boston Waterfront via congress Street and merrimac Street.
mBTa/ city of Boston
69-c 24 new or expanded ferry service Based on success of early pilot programs, explore feasibility of providing new or expanded ferry services to: • north Station/charlestown (navy Yard) • Hingham, Hull, and/or Lynn • Boston marine industrial Park-WTc-downtown-north
Station connector
city of Boston/ massdoT/ mBTa/Private
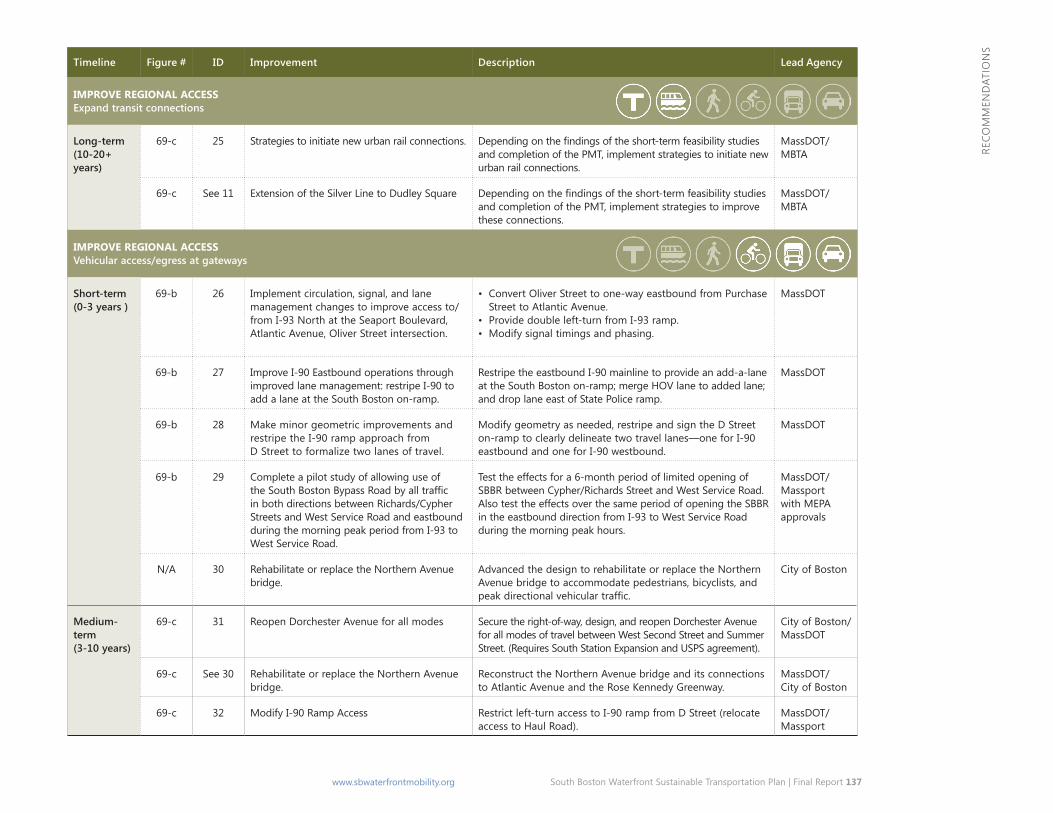
South Boston Waterfront Sustainable Transportation Plan | Final Report 137 www.sbwaterfrontmobility.org
sn
oitad
nm
me
oceR
Timeline Figure # ID Improvement Description Lead Agency
ImpRovE REgIonAl AccEss Expand transit connections
Long-term (10-20+ years)
69-c 25 Strategies to initiate new urban rail connections. Dependingonthefindingsoftheshort-termfeasibilitystudies and completion of the PmT, implement strategies to initiate new urban rail connections.
massdoT/ mBTa
69-c See 11 extension of the Silver Line to dudley Square Dependingonthefindingsoftheshort-termfeasibilitystudies and completion of the PmT, implement strategies to improve these connections.
massdoT/ mBTa
ImpRovE REgIonAl AccEss Vehicular access/egress at gateways
Short-term (0-3 years )
69-b 26 implement circulation, signal, and lane management changes to improve access to/ from i-93 north at the Seaport Boulevard, atlantic avenue, oliver Street intersection.
• convert oliver Street to one-way eastbound from Purchase Street to atlantic avenue.
• Provide double left-turn from i-93 ramp. • modify signal timings and phasing.
massdoT
69-b 27 improve i-90 eastbound operations through improved lane management: restripe i-90 to add a lane at the South Boston on-ramp.
Restripe the eastbound i-90 mainline to provide an add-a-lane at the South Boston on-ramp; merge HoV lane to added lane; and drop lane east of State Police ramp.
massdoT
69-b 28 make minor geometric improvements and restripe the i-90 ramp approach from d Street to formalize two lanes of travel.
modify geometry as needed, restripe and sign the d Street on-ramp to clearly delineate two travel lanes—one for i-90 eastbound and one for i-90 westbound.
massdoT
69-b 29 complete a pilot study of allowing use of theSouthBostonBypassRoadbyalltraffic in both directions between Richards/cypher Streets and West Service Road and eastbound during the morning peak period from i-93 to West Service Road.
Test the effects for a 6-month period of limited opening of SBBR between cypher/Richards Street and West Service Road. also test the effects over the same period of opening the SBBR in the eastbound direction from i-93 to West Service Road during the morning peak hours.
massdoT/ massport with mePa approvals
n/a 30 Rehabilitate or replace the northern avenue bridge.
advanced the design to rehabilitate or replace the northern avenue bridge to accommodate pedestrians, bicyclists, and peakdirectionalvehiculartraffic.
city of Boston
Medium-term (3-10 years)
69-c 31 Reopen dorchester avenue for all modes Secure the right-of-way, design, and reopen dorchester avenue for all modes of travel between West Second Street and Summer Street. (Requires South Station expansion and USPS agreement).
city of Boston/ massdoT
69-c See 30 Rehabilitate or replace the northern avenue bridge.
Reconstruct the northern avenue bridge and its connections to atlantic avenue and the Rose Kennedy Greenway.
massdoT/ city of Boston
69-c 32 modify i-90 Ramp access Restrict left-turn access to i-90 ramp from d Street (relocate access to Haul Road).
massdoT/ massport
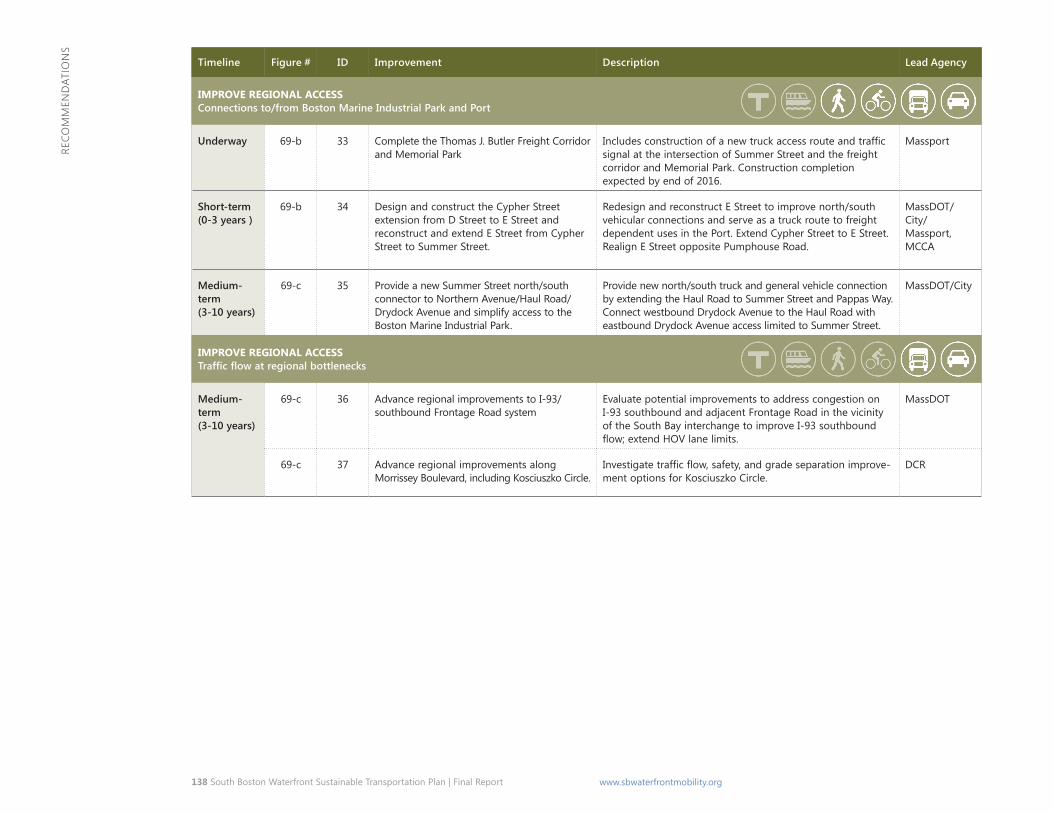
138 South Boston Waterfront Sustainable Transportation Plan | Final Report www.sbwaterfrontmobility.org
Reco
mm
end
atio
ns
Timeline Figure # ID Improvement Description Lead Agency
ImpRovE REgIonAl AccEss Connections to/from Boston Marine Industrial Park and Port
Underway 69-b 33 complete the Thomas J. Butler Freight corridor and memorial Park
Includesconstructionofanewtruckaccessrouteandtraffic signal at the intersection of Summer Street and the freight corridor and memorial Park. construction completion expected by end of 2016.
massport
Short-term (0-3 years )
69-b 34 design and construct the cypher Street extension from d Street to e Street and reconstruct and extend e Street from cypher Street to Summer Street.
Redesign and reconstruct e Street to improve north/south vehicular connections and serve as a truck route to freight dependent uses in the Port. extend cypher Street to e Street. Realign e Street opposite Pumphouse Road.
massdoT/ city/ massport, mcca
Medium-term (3-10 years)
69-c 35 Provide a new Summer Street north/south connector to northern avenue/Haul Road/ drydock avenue and simplify access to the Boston marine industrial Park.
Provide new north/south truck and general vehicle connection by extending the Haul Road to Summer Street and Pappas Way. connect westbound drydock avenue to the Haul Road with eastbound drydock avenue access limited to Summer Street.
massdoT/city
ImpRovE REgIonAl AccEss Traffic flow at regional bottlenecks
Medium-term (3-10 years)
69-c 36 advance regional improvements to i-93/ southbound Frontage Road system
evaluate potential improvements to address congestion on i-93 southbound and adjacent Frontage Road in the vicinity of the South Bay interchange to improve i-93 southbound flow;extendHOVlanelimits.
massdoT
69-c 37 advance regional improvements along morrissey Boulevard, including Kosciuszko circle.
Investigatetrafficflow,safety,andgradeseparationimprove-ment options for Kosciuszko circle.
dcR
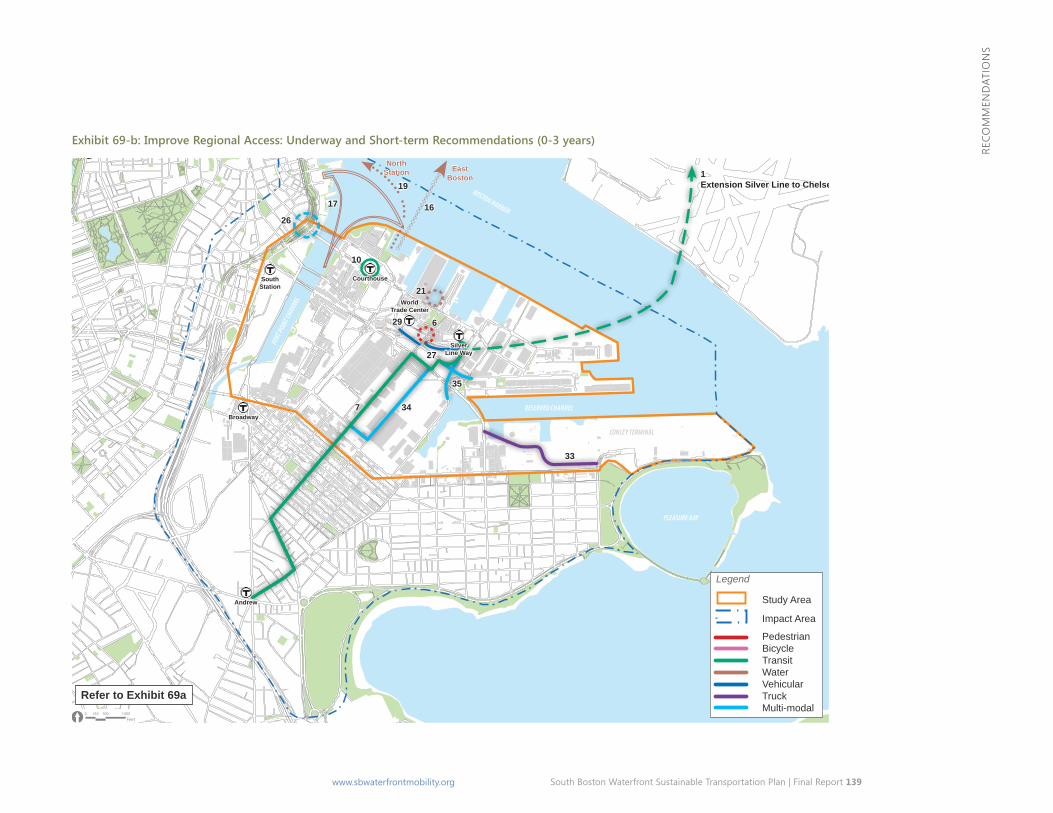
South Boston Waterfront Sustainable Transportation Plan | Final Report 139 www.sbwaterfrontmobility.org
Reco
mm
end
atio
ns
Exhibit 69-b: Improve Regional Access: Underway and Short-term Recommendations (0-3 years)
BOSTON HARBOR
RESERVED CHANNEL
PLEASURE BAY
FORT
POIN
T CHAN
NEL
CONLEY TERMINAL
D STREET
SUMMER STREETA S
TREE
T
EAST FIRST STREET
HAUL ROAD
CONGRESS STREET
WEST FIRST STREET
NORTHERN AVENUE
SEAPORT BOULEVARD
MASSPO R T HAUL ROADWILLIAM DAY BOULEVARD
WEST SECOND STREET
B STR
EET
RAMP - HAUL ROAD TO RT 90 EB
D STREET EXTENSION
B STREET
[0 500 1,000250
Feet
BOSTON HARBOR
RESERVED CHANNEL
PLEASURE BAY
FORT
POIN
T CHAN
NEL
CONLEY TERMINALD STREET
SUMMER STREET
A STR
EET
EAST FIRST STREET
HAUL ROAD
CONGRESS STREET
WEST FIRST STREET
NORTHERN AVENUE
SEAPORT BOULEVARD
MASSPO R T HAUL ROAD
WILLIAM DAY BOULEVARD
WEST SECOND STREET
B STR
EET
RAMP - HAUL ROAD TO RT 90 EB
D STREET EXTENSION
B STREET
[0 500 1,000250
Feet
Legend
Study Area
Impact Area
PedestrianBicycleTransitWaterVehicularTruckMulti-modal
Refer to Exhibit 69a
Regional Access Short TermEast
Boston
North Station
South Station
Broadway
Andrew
World Trade Center
Courthouse
SilverLine Way
1617
7
10
21
26
34
33
35
191Extension Silver Line to Chelsea
6
27
29
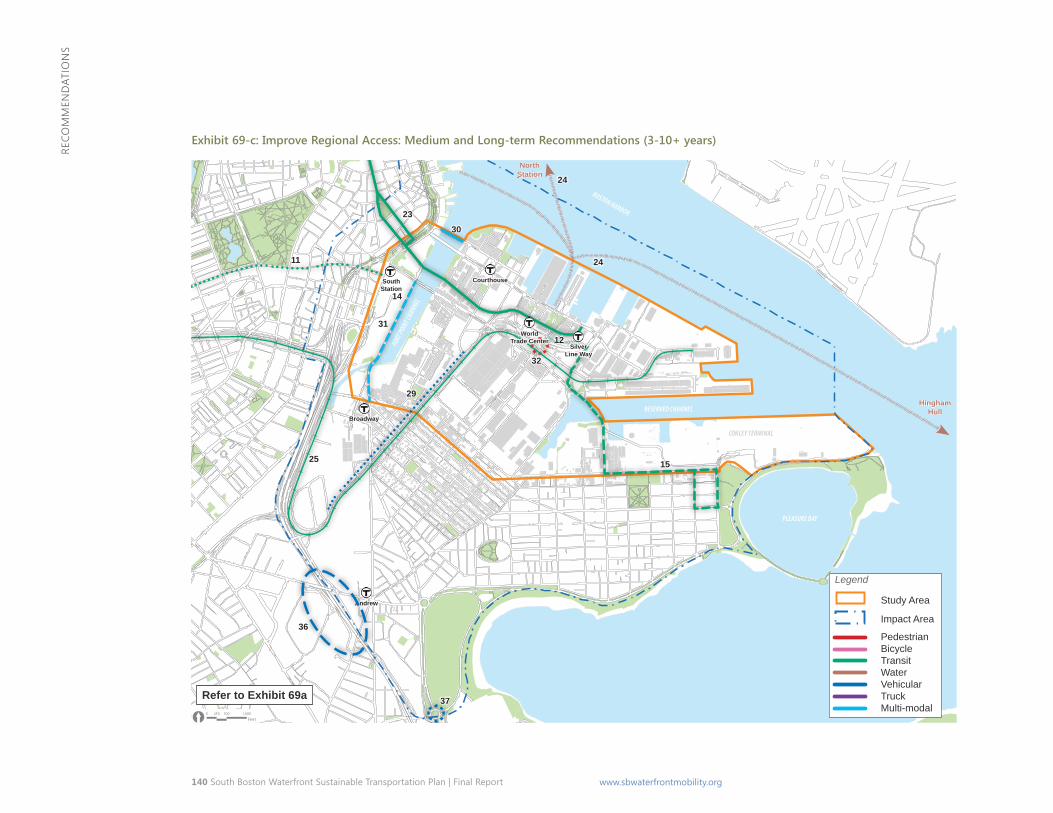
140 South Boston Waterfront Sustainable Transportation Plan | Final Report www.sbwaterfrontmobility.org
Reco
mm
end
atio
ns
Exhibit 69-c: Improve Regional Access: Medium and Long-term Recommendations (3-10+ years)
BOSTON HARBOR
RESERVED CHANNEL
PLEASURE BAY
FORT
POIN
T CHAN
NEL
CONLEY TERMINAL
D STREET
SUMMER STREET
A STR
EET
EAST FIRST STREET
HAUL ROAD
CONGRESS STREET
WEST FIRST STREET
NORTHERN AVENUE
SEAPORT BOULEVARD
HAUL ROAD
WILLIAM DAY BOULEVARD
WEST SECOND STREET
B STR
EET
RAMP - HAUL ROAD TO RT 90 EB
D STREET EXTENSION
B STREET
[0 500 1,000250
Feet
BOSTON HARBOR
RESERVED CHANNEL
PLEASURE BAY
FORT
POIN
T CHAN
NEL
CONLEY TERMINAL
D STREET
SUMMER STREET
A STR
EET
EAST FIRST STREET
HAUL ROAD
CONGRESS STREET
WEST FIRST STREET
NORTHERN AVENUE
SEAPORT BOULEVARD
MASSPO R T HAUL ROAD
WILLIAM DAY BOULEVARD
WEST SECOND STREET
B STR
EET
RAMP - HAUL ROAD TO RT 90 EB
D STREET EXTENSION
B STREET
[0 500 1,000250
Feet
Legend
Study Area
Impact Area
PedestrianBicycleTransitWaterVehicularTruckMulti-modal
Refer to Exhibit 69a
North Station
Hingham Hull
South Station
Broadway
Andrew
World Trade Center
Courthouse
SilverLine Way
11
29
23
31
24
12
24
14
25
37
36
30
15
32
South Boston Waterfront Sustainable Transportation Plan | Final Report 141 www.sbwaterfrontmobility.org
Reco
mm
end
atio
ns
The community consistently expressed a desire to see connections to/from the Waterfront expanded while seeking to protect the neighborhood from the intrusion of unwanted, cut-through traffic or additional parking demands.
Expand community connections throughout the course of this planning process, a broad outreach effort was carried out to better understand the transportation needs of the community and seek input on the plan’s direction and recommendations. the community consistently expressed a desire to see connections to/from the Waterfront expanded while seeking to protect the neighborhood from the intrusion of unwanted, cut-through traffic or additional parking demands. More specifically, local bus routes and services in South Boston have not responded to the growing residential populations and employment opportunities in the Waterfront and bicycle accommodations do not yet provide network continuity along key corridors. Barriers exist in both the physical infrastructure and aesthetics for making walking a desired and viable mode to key activity centers in the Waterfront. Improved walking, bicycling, and transit connections were all emphasized as desired outcomes of the south Boston Waterfront plan. advocates suggested that improvements to vehicular travel should focus on improving the highway and arterial access (as previously discussed) and discourage travel on local streets and through the more established neighborhoods. Accordingly, the efforts to expand community connections to the waterfront on pedestrian, bicycle, and local transit improvements as described below.
Transit Recommendations � expand local bus connections
local street Recommendations � Improve operations and safety on the local Street network
pedestrian Recommendations � Complete and improve the pedestrian network to establish and
maintain safer and more desirable walking connections � improve visibility, amenities, and access to transit stations
Bicycle Recommendations � implement improvements to increase capacity and provide
continuous connections to the Waterfront from the citywide and regional bike networks
� Support bicycle parking and increased bicycle infrastructure throughout the Waterfront
a description of the components, timing, lead agency, and conceptual costs of each of the initiatives to expand community connections to/from the Waterfront is provided in Exhibits 70 a-c.
142 South Boston Waterfront Sustainable Transportation Plan | Final Report www.sbwaterfrontmobility.org
Reco
mm
end
atio
ns Exhibit 70-a: Recommendations to Expand Community Connections
Timeline Figure # ID Improvement Description Lead Agency
ExpAnD communITy connEcTIons Expand local bus connections
Short-term (0-3 years)
n/a 38 consolidate private shuttle routes to/from South/Broadway Stations (discussions underway)
consolidate Waterfront employer private shuttles: • South Station-Broadway via a Street
mcca/ Seaport Tma
n/a 39 complete districtwide planning and operations review of local bus services
assess level of service needs with the anticipated outcomes to include: • Route 7 bus service enhancements • Route 9 bus services enhancements • Route 11 bus services enhancements • new bus route between andrew Station and the
Waterfront via d Street
mBTa/ city of Boston
n/a 40 Perform d Street “circuit breaker” study initiate study to examine allowing two-way access for buses only or all vehicles between West First and Second Streets and at old colony avenue.
city of Boston
Medium-term (3-10 years)
70-c 41 South Station bus service via Summer- BmiP-northern
Bus service via dedicated lane, peak period reversible lane, and/or signal priority between South Station and BmiP via Seaport Boulevard and Summer Street.
mBTa/ city of Boston
70-c 42 Reroute the Route 7 bus consider modifying the Route 7 bus to run along Broadway and a Street, in conjunction with restoring the SL3 route to city Point.
mBTa/ city of Boston
ExpAnD communITy connEcTIons Improve operations and safety on the local street network
Short-term (0-3 years)
n/a 43 day Boulevard Roadway Safety audit Facilitate a Roadway Safety audit along day Boulevard from Babe Ruth Park drive to Farragut Road.
dcR/ massdoT
n/a 44 day Boulevard from i Street to L Street Cross-sectionalmodificationsformalizingwestboundon-street parking and transitioning from two to one lane eastbound.
dcR
70-b 45 day Boulevard from L Street to Farragut Road consider “road diet”—one lane per direction with parking. Reconstruct intersections as necessary, including installation of neckdowns at pedestrian crossings.
dcR
n/a 46 columbia Road – G Street to i Street Considermodificationtothemedianorconversiontoa one-way street to increase amount of available on-street resident parking.
dcR
n/a 47 day Boulevard – corridor-wide Pedestrian phasing changes, higher visibility crosswalks, advance warning and accessibility enhancements.
dcR
South Boston Waterfront Sustainable Transportation Plan | Final Report 143 www.sbwaterfrontmobility.org
Reco
mm
end
atio
ns
Timeline Figure # ID Improvement Description Lead Agency
ExpAnD communITy connEcTIons Improve operations and safety on the local street network
Short-term (0-3 years)
70-b 48 day Boulevard at G Street Modifyintersectiongeometryandexistingtrafficsignal timing/phasing. enhance pedestrian accommodations.
dcR
70-b 49 day Boulevard at i Street add crosswalk to eastbound approach and consider incor-poratingColumbiaRoadintotrafficsignal.Begintonarrow day Boulevard eastbound to one travel lane.
dcR
70-b 50 day Boulevard at L Street Installfullyoperationaltrafficsignal.Formalizewestbound parking for off-peak periods. install neckdowns.
dcR
70-b 51 day Boulevard at o Street Geometricandstripingmodifications.Shortenpedestrian crossings and improve sight lines.
dcR
70-b 52 day Boulevard at Farragut Road Geometricandstripingmodifications.Shortenpedestrian crossings and improve sight lines.
dcR
70-b 53 Farragut Road at east Broadway Shorten pedestrian crossings and improve sight lines. con-sider high visibility crosswalks and advance warning signage. consider bicycle accommodations along Farragut Road.
city of Boston
70-b 54 east Broadway at L Street Geometricandstripingmodifications.Considerneckdowns and concurrent pedestrian phasing where appropriate.
city of Boston
70-b 55 east/West Broadway and dorchester Street Clarifyintersectiongeometryandrevisetrafficsignaltiming and phasing.
city of Boston
70-b 56 West Broadway at d Street Formalizeintersectiongeometryandmodifytrafficsignal timing/phasing.
city of Boston
70-b 57 West Broadway at a Street consider opportunities for neckdowns and enhanced bicycle accommodation on West Broadway.
city of Boston
70-b 58 dorchester avenue at a Street/West Fifth Street
modify intersection geometry and signal timing/phasing. convert West Fifth street to one-way away from intersection between dorchester avenue and B Street.
city of Boston
70-b 59 old colony avenue at d Street consider opportunities for neckdowns. address sight line issue to crosswalk across northbound d Street approach. implement concurrent phasing on old colony avenue.
city of Boston
70-b 60 old colony avenue at dorchester Street Relocate center median, modify intersection geometry and pedestrianoperationsattrafficsignal.
city of Boston
144 South Boston Waterfront Sustainable Transportation Plan | Final Report www.sbwaterfrontmobility.org
Reco
mm
end
atio
ns
Timeline Figure # ID Improvement Description Lead Agency
ExpAnD communITy connEcTIons Complete and improve the pedestrian network to establish and maintain safer and more desirable walking connections
Throughout all time frames
n/a 61 new and (where appropriate) wider sidewalks and crosswalks
Improveaccessibilityandwayfindingforpersonswith disabilities throughout the Waterfront as part of city’s ongoing commitment to universal design and inclusion.
massdoT/ massport/ city of Boston/ mcca
n/a 62 Landscaping and pedestrian amenities Seek opportunities through every infrastructure and development project to improve the urban landscape and provide additional pedestrian amenities.
massdoT/ massport/ city of Boston/ mcca
Underway n/a 63 complete Thomas Butler memorial Park incorporate planned shared-use path as part of massport’s conley Terminal improvements and open space buffer.
massport
Short-term (0-3 years)
70-b 64 new pedestrian crossing Provide a new pedestrian crossing across Summer Street over a Street.
city of Boston
70-b 65 improve east-west connections – east/West First Street
improve pedestrian accommodations from Pappas Way along east First Street to Farragut Road.
city of Boston/ massport
70-b 66 Pedestrian connections to/from Broadway Station
Reinforce pedestrian connection between Broadway Station and dorchester avenue, a Street, and cypher Street via Second Street.
city of Boston
Medium-term (3-10 years)
70-c See 31 Reopen dorchester avenue for all modes Secure the right-of-way, design, and reopen dorchester avenue for all modes of travel between West Second Street and Summer Street (requires South Station expansion and USPS agreement).
city of Boston/ massdoT
70-c 67 improve geometry of Pappas Way, east First Street, West First Street, and dorchester Street
improve geometry to better connect Pappas Way with dorchester Street and east First Street pedestrian and bicycle accommodations.
city of Boston/ massport
70-c 68 above-grade crossing over Track 61 and Bypass Road to connect to Fort Point area
consider new above-grade crossing over Track 61 and the South Boston Bypass Road to connect the Bcec to the Fort Point neighborhood.
mcca
70-c 69 new Fort Point channel crossing consider a new pedestrian/bicycle bridge across the Fort Point channel with the reopening of dorchester avenue.
city of Boston
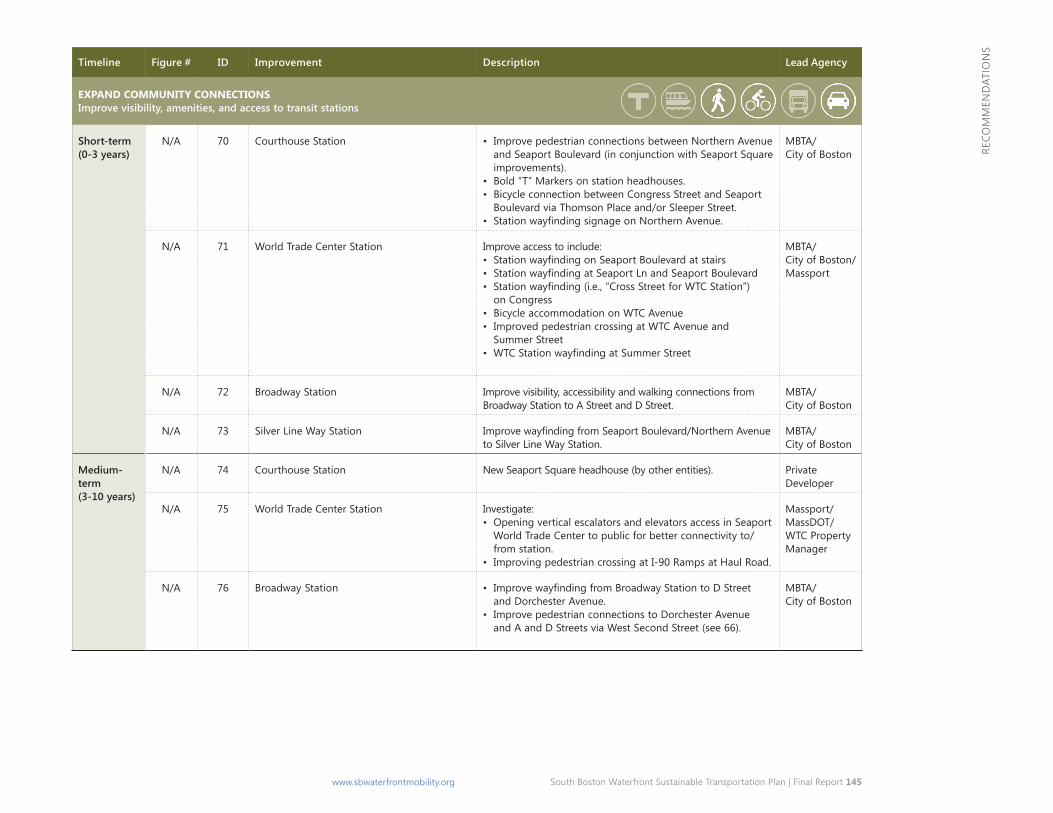
South Boston Waterfront Sustainable Transportation Plan | Final Report 145 www.sbwaterfrontmobility.org
Reco
mm
end
atio
ns
Timeline Figure # ID Improvement Description Lead Agency
ExpAnD communITy connEcTIons Improve visibility, amenities, and access to transit stations
Short-term (0-3 years)
n/a 70 courthouse Station • improve pedestrian connections between northern avenue and Seaport Boulevard (in conjunction with Seaport Square improvements).
• Bold “T” markers on station headhouses. • Bicycle connection between congress Street and Seaport
Boulevard via Thomson Place and/or Sleeper Street. • StationwayfindingsignageonNorthernAvenue.
mBTa/ city of Boston
n/a 71 World Trade center Station improve access to include: • StationwayfindingonSeaportBoulevardatstairs • StationwayfindingatSeaportLnandSeaportBoulevard • Stationwayfinding(i.e.,“CrossStreetforWTCStation”)
on congress • Bicycle accommodation on WTc avenue • improved pedestrian crossing at WTc avenue and
Summer Street • WTCStationwayfindingatSummerStreet
mBTa/ city of Boston/ massport
n/a 72 Broadway Station improve visibility, accessibility and walking connections from Broadway Station to a Street and d Street.
mBTa/ city of Boston
n/a 73 Silver Line Way Station ImprovewayfindingfromSeaportBoulevard/NorthernAvenue to Silver Line Way Station.
mBTa/ city of Boston
Medium-term (3-10 years)
n/a 74 courthouse Station new Seaport Square headhouse (by other entities). Private developer
n/a 75 World Trade center Station investigate: • opening vertical escalators and elevators access in Seaport
World Trade center to public for better connectivity to/ from station.
• improving pedestrian crossing at i-90 Ramps at Haul Road.
massport/ massdoT/ WTc Property manager
n/a 76 Broadway Station • ImprovewayfindingfromBroadwayStationtoDStreet and dorchester avenue.
• improve pedestrian connections to dorchester avenue and a and d Streets via West Second Street (see 66).
mBTa/ city of Boston
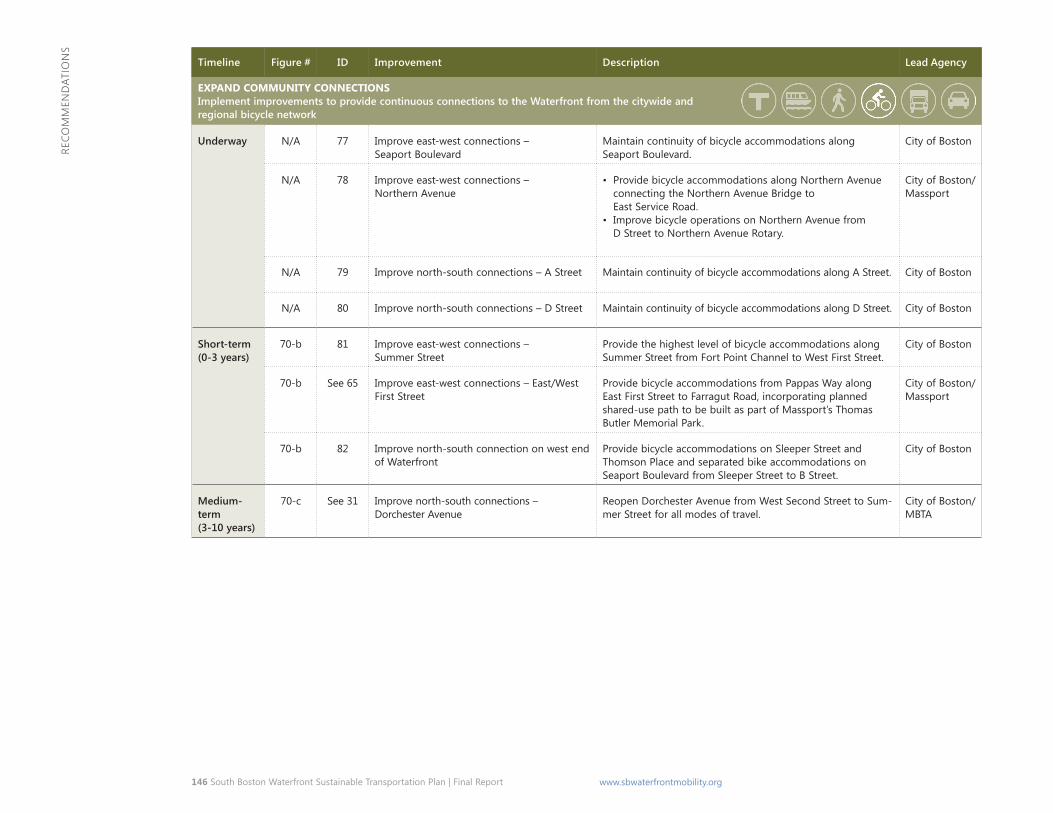
146 South Boston Waterfront Sustainable Transportation Plan | Final Report www.sbwaterfrontmobility.org
Reco
mm
end
atio
ns
Timeline Figure # ID Improvement Description Lead Agency
ExpAnD communITy connEcTIons Implement improvements to provide continuous connections to the Waterfront from the citywide and regional bicycle network
Underway n/a 77 improve east-west connections – Seaport Boulevard
maintain continuity of bicycle accommodations along Seaport Boulevard.
city of Boston
n/a 78 improve east-west connections – northern avenue
• Provide bicycle accommodations along northern avenue connecting the northern avenue Bridge to east Service Road.
• improve bicycle operations on northern avenue from d Street to northern avenue Rotary.
city of Boston/ massport
n/a 79 improve north-south connections – a Street maintain continuity of bicycle accommodations along a Street. city of Boston
n/a 80 improve north-south connections – d Street maintain continuity of bicycle accommodations along d Street. city of Boston
Short-term (0-3 years)
70-b 81 improve east-west connections – Summer Street
Provide the highest level of bicycle accommodations along Summer Street from Fort Point channel to West First Street.
city of Boston
70-b See 65 improve east-west connections – east/West First Street
Provide bicycle accommodations from Pappas Way along east First Street to Farragut Road, incorporating planned shared-use path to be built as part of massport’s Thomas Butler memorial Park.
city of Boston/ massport
70-b 82 improve north-south connection on west end of Waterfront
Provide bicycle accommodations on Sleeper Street and Thomson Place and separated bike accommodations on Seaport Boulevard from Sleeper Street to B Street.
city of Boston
Medium-term (3-10 years)
70-c See 31 improve north-south connections – dorchester avenue
Reopen dorchester avenue from West Second Street to Sum-mer Street for all modes of travel.
city of Boston/ mBTa
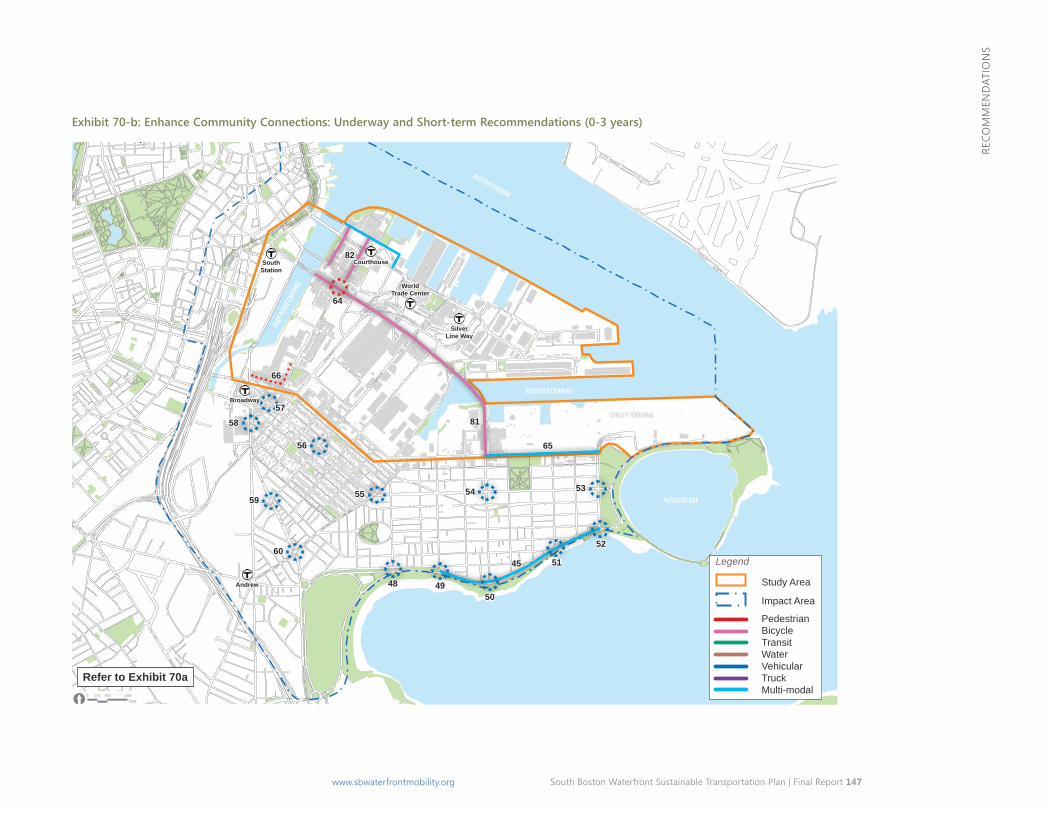
South Boston Waterfront Sustainable Transportation Plan | Final Report 147 www.sbwaterfrontmobility.org
Reco
mm
end
atio
ns
Exhibit 70-b: Enhance Community Connections: Underway and Short-term Recommendations (0-3 years)
BOSTON HARBOR
RESERVED CHANNEL
PLEASURE BAY
FORT
POIN
T CHAN
NEL
CONLEY TERMINAL
D STREET
SUMMER STREET
A STR
EET
EAST FIRST STREET
HAUL ROAD
CONGRESS STREET
WEST FIRST STREET
NORTHERN AVENUE
SEAPORT BOULEVARD
MASSPO R T HAUL ROAD
WILLIAM DAY BOULEVARD
WEST SECOND STREET
B STR
EET
RAMP - HAUL ROAD TO RT 90 EB
D STREET EXTENSION
B STREET
[0 500 1,000250
Feet
Legend
Study Area
Impact Area
PedestrianBicycleTransitWaterVehicularTruckMulti-modal
Refer to Exhibit 70a
Community Connection Short Term
South Station
Broadway
Andrew
World Trade Center
Courthouse
SilverLine Way
82
64
81
65
5857
56
5955 54 53
52
5160
48 4950
45
66
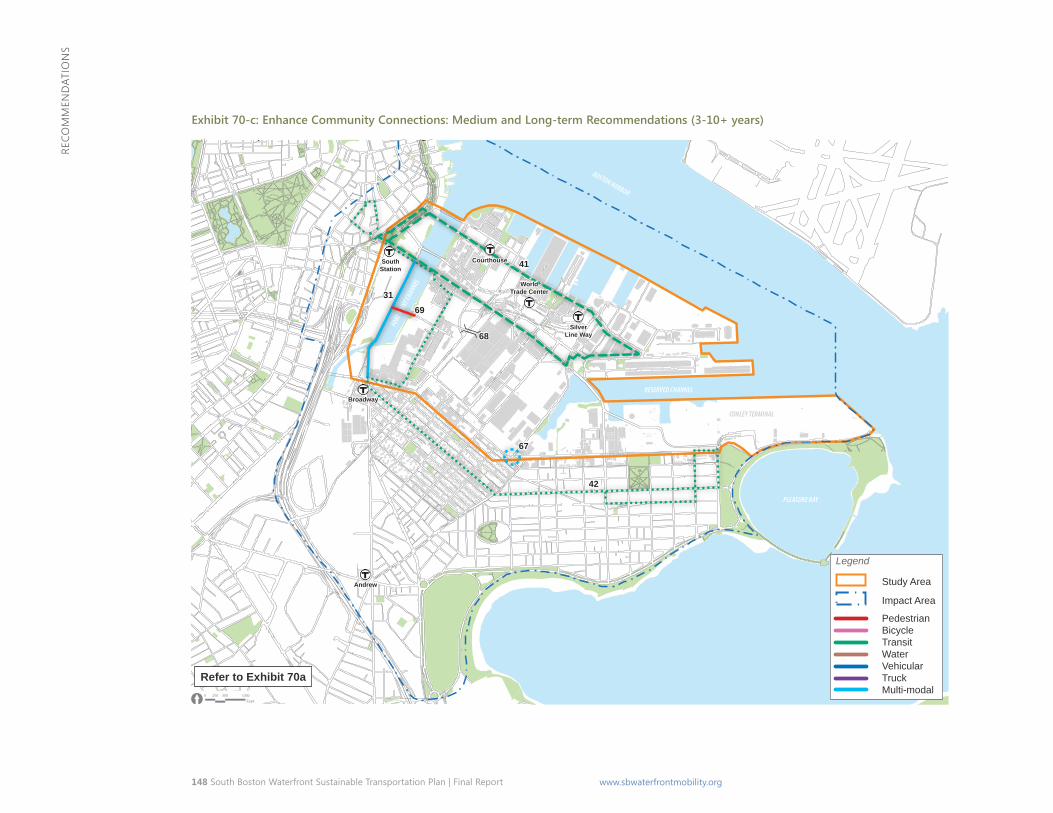
148 South Boston Waterfront Sustainable Transportation Plan | Final Report www.sbwaterfrontmobility.org
Reco
mm
end
atio
ns
Exhibit 70-c: Enhance Community Connections: Medium and Long-term Recommendations (3-10+ years)
BOSTON HARBOR
RESERVED CHANNEL
PLEASURE BAY
FORT
POIN
T CHAN
NELCONLEY TERMINAL
D STREET
SUMMER STREET
A STR
EET
EAST FIRST STREET
HAUL ROAD
CONGRESS STREET
WEST FIRST STREET
NORTHERN AVENUE
SEAPORT BOULEVARD
HAUL ROAD
WILLIAM DAY BOULEVARD
WEST SECOND STREET
B STR
EET
RAMP - HAUL ROAD TO RT 90 EB
D STREET EXTENSION
B STREET
[0 500 1,000250
Feet
BOSTON HARBOR
RESERVED CHANNEL
PLEASURE BAY
FORT
POIN
T CHAN
NEL
CONLEY TERMINAL
D STREET
SUMMER STREET
A STR
EET
EAST FIRST STREET
HAUL ROAD
CONGRESS STREET
WEST FIRST STREET
NORTHERN AVENUE
SEAPORT BOULEVARD
MASSPO R T HAUL ROAD
WILLIAM DAY BOULEVARD
WEST SECOND STREET
B STR
EET
RAMP - HAUL ROAD TO RT 90 EB
D STREET EXTENSION
B STREET
[0 500 1,000250
Feet
Legend
Study Area
Impact Area
PedestrianBicycleTransitWaterVehicularTruckMulti-modal
Refer to Exhibit 70a
Community Connection Mid and Long Term
South Station
Broadway
Andrew
World Trade Center
Courthouse
SilverLine Way
31
41
42
67
68
69
South Boston Waterfront Sustainable Transportation Plan | Final Report 149 www.sbwaterfrontmobility.org
Reco
mm
end
atio
ns
The scale and the diversity of land uses in the South Boston Waterfront present challenges to internal circulation and mobility.
Enhance Internal Waterfront mobility the area referred to as the south Boston Waterfront is large enough to consume the entirety of downtown Boston from north to south stations and from the downtown waterfront to the Boston common. this scale and the diversity of land uses in the south Boston Waterfront present challenges to internal circulation and mobility. mobility within the study area is particularly important for visitors, conventioneers, and tourists who seek to take advantage of the many cultural and recreational opportunities within the Waterfront or the adjacent south Boston community, many of whom are car free when they visit and some of whom are unfamiliar with the area.
expected growth in convention-related, leisure, cruise and hospitality industries in the study area is reflected by the planned expansion of the BCEC, addition of more than 4,300 hotel rooms by 2035, expansion of retail and restaurant uses, and continued vibrancy of the study area’s notable museums, including Boston’s children museum and the institute of contemporary art. this growth presents an opportunity to utilize well-sited mobility hubs as a way to connect visitors, residents, and employees with convenient access to multiple transit modes. mobility hubs that bring together multiple transit modes and parking, including but not limited to silver Line BRt, bicycles, automobiles, circulator shuttle, other bus/transit lines, and convenient walking routes, should be sited in proximity to major trip generators (employers, BCEC, hotels, residential development, etc.). The mobility hubs should be “connectors” of and to the public realm and should contribute to place-making in the South Boston Waterfront.
existing transit services within the Waterfront are commuter focused and do not provide the connectivity or hours of service to address the needs of this constituency. and, as previously discussed, the pedestrian and bicycle networks serving these
locations are incomplete or inconvenienced by construction activity. actions to enhance internal Waterfront mobility include:
pedestrian Recommendations � Complete the local street and sidewalk network � Reduce block scale and increase density of street connections
to improve pedestrian connections and internal circulation: � along northern avenue, seaport Boulevard, and east
service Road in the vicinity of the Fan Pier, seaport square, and Pier 4 developments
� north-south from the Fort Point neighborhood to seaport Boulevard
� along World trade center avenue, summer street, and d Street through near-term development of the Headquarters Hotel, and Air Rights Garage development
� Between the cruiseport and northern avenue
Bicycle Recommendations � support increased bicycle infrastructure and amenities
throughout the Waterfront
Transit Recommendations � Provide shuttle bus circulator system and water transportation
connections
local streets and parking Recommendations � Implement improvements to local intersections and use parking
as an effective transportation demand management tool � identify locations for and provide centrally located mobility hubs
a description of the components, timing, lead agency, and conceptual costs of each of the initiatives to expand community connections to/from the Waterfront is provided in Exhibits 71 a-c.
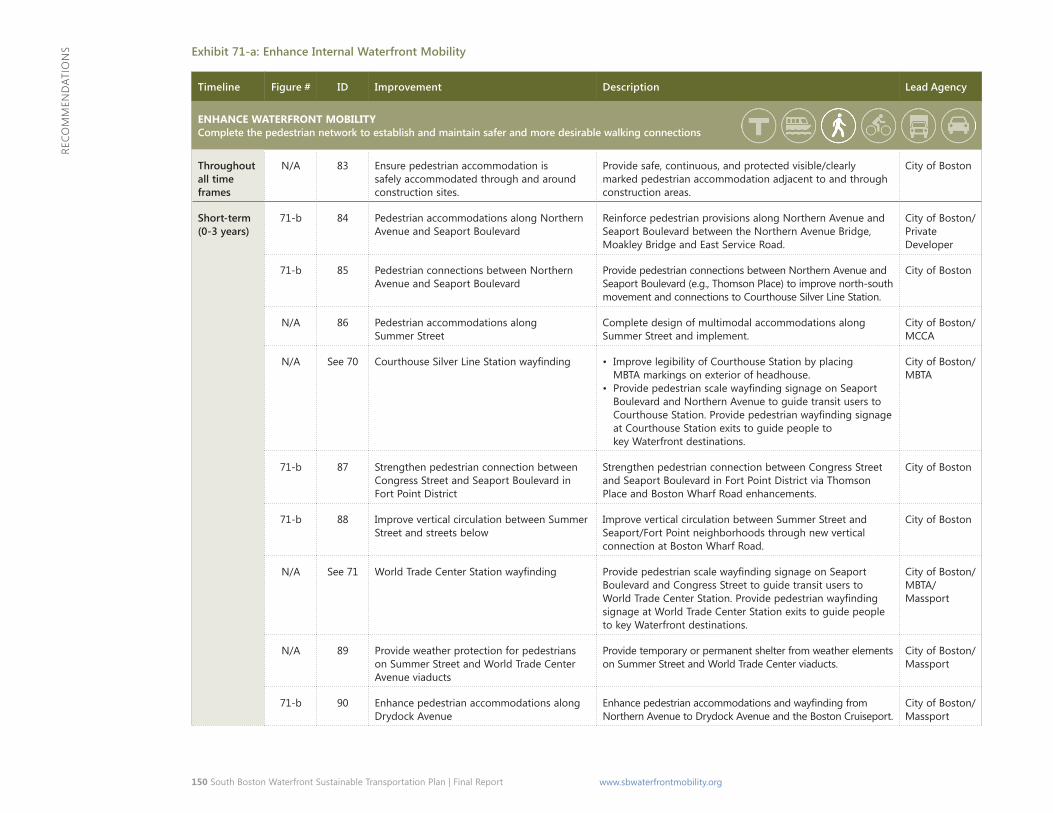
150 South Boston Waterfront Sustainable Transportation Plan | Final Report www.sbwaterfrontmobility.org
Reco
mm
end
atio
ns Exhibit 71-a: Enhance Internal Waterfront Mobility
Timeline Figure # ID Improvement Description Lead Agency
EnHAncE WATERFRonT moBIlITy Complete the pedestrian network to establish and maintain safer and more desirable walking connections
Throughout all time frames
n/a 83 ensure pedestrian accommodation is safely accommodated through and around construction sites.
Provide safe, continuous, and protected visible/clearly marked pedestrian accommodation adjacent to and through construction areas.
city of Boston
Short-term (0-3 years)
71-b 84 Pedestrian accommodations along northern avenue and Seaport Boulevard
Reinforce pedestrian provisions along northern avenue and Seaport Boulevard between the northern avenue Bridge, moakley Bridge and east Service Road.
city of Boston/ Private developer
71-b 85 Pedestrian connections between northern avenue and Seaport Boulevard
Provide pedestrian connections between northern avenue and Seaport Boulevard (e.g., Thomson Place) to improve north-south movement and connections to courthouse Silver Line Station.
city of Boston
n/a 86 Pedestrian accommodations along Summer Street
complete design of multimodal accommodations along Summer Street and implement.
city of Boston/ mcca
n/a See 70 CourthouseSilverLineStationwayfinding • improve legibility of courthouse Station by placing mBTa markings on exterior of headhouse.
• ProvidepedestrianscalewayfindingsignageonSeaport Boulevard and northern avenue to guide transit users to CourthouseStation.Providepedestrianwayfindingsignage at courthouse Station exits to guide people to key Waterfront destinations.
city of Boston/ mBTa
71-b 87 Strengthen pedestrian connection between congress Street and Seaport Boulevard in Fort Point district
Strengthen pedestrian connection between congress Street and Seaport Boulevard in Fort Point district via Thomson Place and Boston Wharf Road enhancements.
city of Boston
71-b 88 improve vertical circulation between Summer Street and streets below
improve vertical circulation between Summer Street and Seaport/Fort Point neighborhoods through new vertical connection at Boston Wharf Road.
city of Boston
n/a See 71 WorldTradeCenterStationwayfinding ProvidepedestrianscalewayfindingsignageonSeaport Boulevard and congress Street to guide transit users to WorldTradeCenterStation.Providepedestrianwayfinding signage at World Trade center Station exits to guide people to key Waterfront destinations.
city of Boston/ mBTa/ massport
n/a 89 Provide weather protection for pedestrians on Summer Street and World Trade center avenue viaducts
Provide temporary or permanent shelter from weather elements on Summer Street and World Trade center viaducts.
city of Boston/ massport
71-b 90 enhance pedestrian accommodations along drydock avenue
Enhancepedestrianaccommodationsandwayfindingfrom northern avenue to drydock avenue and the Boston cruiseport.
city of Boston/ massport
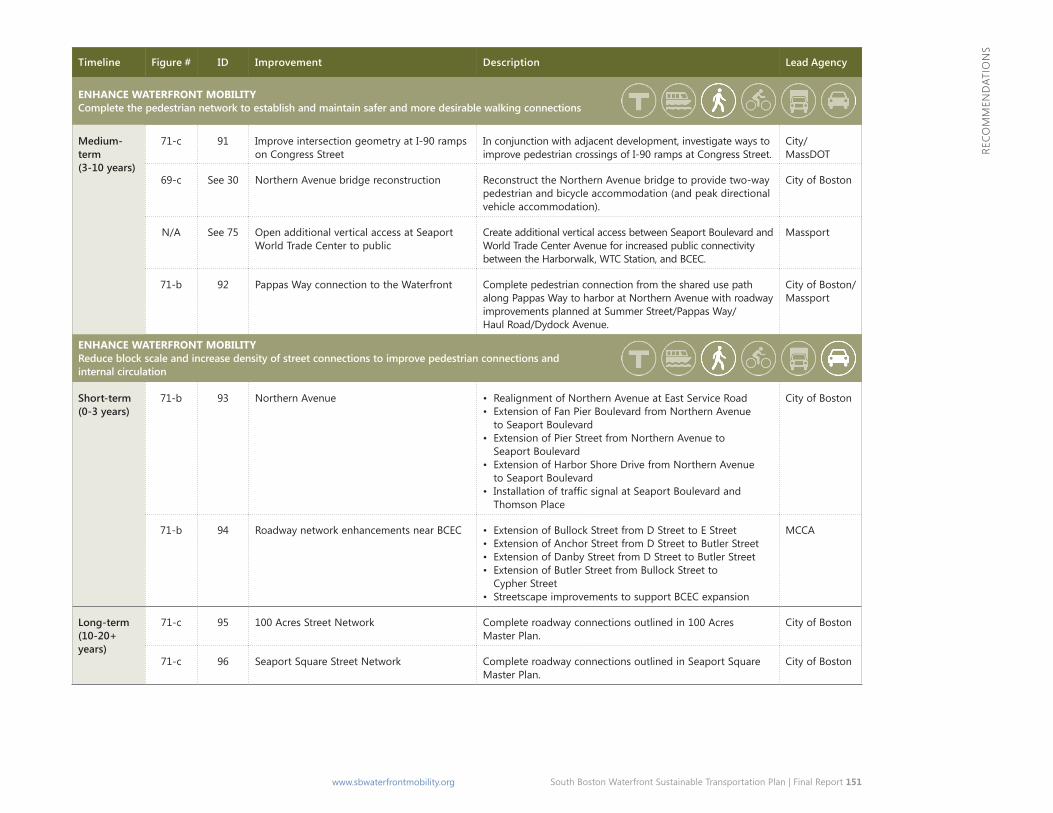
South Boston Waterfront Sustainable Transportation Plan | Final Report 151 www.sbwaterfrontmobility.org
sn
oitad
nm
me
oceR
Timeline Figure # ID Improvement Description Lead Agency
EnHAncE WATERFRonT moBIlITy Complete the pedestrian network to establish and maintain safer and more desirable walking connections
Medium-term (3-10 years)
71-c 91 improve intersection geometry at i-90 ramps on congress Street
in conjunction with adjacent development, investigate ways to improve pedestrian crossings of i-90 ramps at congress Street.
city/ massdoT
69-c See 30 northern avenue bridge reconstruction Reconstruct the northern avenue bridge to provide two-way pedestrian and bicycle accommodation (and peak directional vehicle accommodation).
city of Boston
n/a See 75 open additional vertical access at Seaport World Trade center to public
create additional vertical access between Seaport Boulevard and World Trade center avenue for increased public connectivity between the Harborwalk, WTc Station, and Bcec.
massport
71-b 92 Pappas Way connection to the Waterfront complete pedestrian connection from the shared use path along Pappas Way to harbor at northern avenue with roadway improvements planned at Summer Street/Pappas Way/ Haul Road/dydock avenue.
city of Boston/ massport
EnHAncE WATERFRonT moBIlITy Reduce block scale and increase density of street connections to improve pedestrian connections and internal circulation
Short-term (0-3 years)
71-b 93 northern avenue • Realignment of northern avenue at east Service Road • extension of Fan Pier Boulevard from northern avenue
to Seaport Boulevard • extension of Pier Street from northern avenue to
Seaport Boulevard • extension of Harbor Shore drive from northern avenue
to Seaport Boulevard • InstallationoftrafficsignalatSeaportBoulevardand
Thomson Place
city of Boston
71-b 94 Roadway network enhancements near Bcec • extension of Bullock Street from d Street to e Street • extension of anchor Street from d Street to Butler Street • extension of danby Street from d Street to Butler Street • extension of Butler Street from Bullock Street to
cypher Street • Streetscape improvements to support Bcec expansion
mcca
Long-term (10-20+ years)
71-c 95 100 acres Street network complete roadway connections outlined in 100 acres master Plan.
city of Boston
71-c 96 Seaport Square Street network complete roadway connections outlined in Seaport Square master Plan.
city of Boston
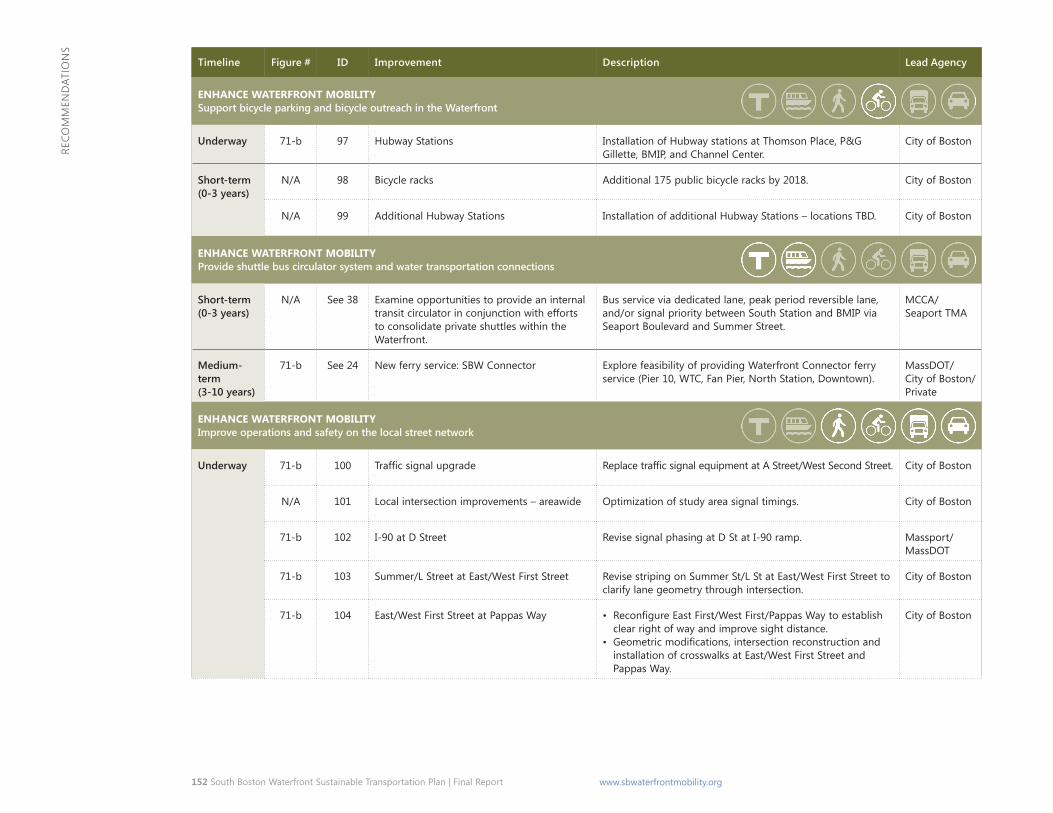
152 South Boston Waterfront Sustainable Transportation Plan | Final Report www.sbwaterfrontmobility.org
Reco
mm
end
atio
ns
Timeline Figure # ID Improvement Description Lead Agency
EnHAncE WATERFRonT moBIlITy Support bicycle parking and bicycle outreach in the Waterfront
Underway 71-b 97 Hubway Stations installation of Hubway stations at Thomson Place, P&G Gillette, BmiP, and channel center.
city of Boston
Short-term (0-3 years)
n/a 98 Bicycle racks additional 175 public bicycle racks by 2018. city of Boston
n/a 99 additional Hubway Stations installation of additional Hubway Stations – locations TBd. city of Boston
EnHAncE WATERFRonT moBIlITy Provide shuttle bus circulator system and water transportation connections
Short-term (0-3 years)
n/a See 38 examine opportunities to provide an internal transit circulator in conjunction with efforts to consolidate private shuttles within the Waterfront.
Bus service via dedicated lane, peak period reversible lane, and/or signal priority between South Station and BmiP via Seaport Boulevard and Summer Street.
mcca/ Seaport Tma
Medium-term (3-10 years)
71-b See 24 new ferry service: SBW connector explore feasibility of providing Waterfront connector ferry service (Pier 10, WTc, Fan Pier, north Station, downtown).
massdoT/ city of Boston/ Private
EnHAncE WATERFRonT moBIlITy Improve operations and safety on the local street network
Underway 71-b 100 Trafficsignalupgrade ReplacetrafficsignalequipmentatAStreet/WestSecondStreet. city of Boston
n/a 101 Local intersection improvements – areawide optimization of study area signal timings. city of Boston
71-b 102 i-90 at d Street Revise signal phasing at d St at i-90 ramp. massport/ massdoT
71-b 103 Summer/L Street at east/West First Street Revise striping on Summer St/L St at east/West First Street to clarify lane geometry through intersection.
city of Boston
71-b 104 east/West First Street at Pappas Way • ReconfigureEastFirst/WestFirst/PappasWaytoestablish clear right of way and improve sight distance.
• Geometricmodifications,intersectionreconstructionand installation of crosswalks at east/West First Street and Pappas Way.
city of Boston
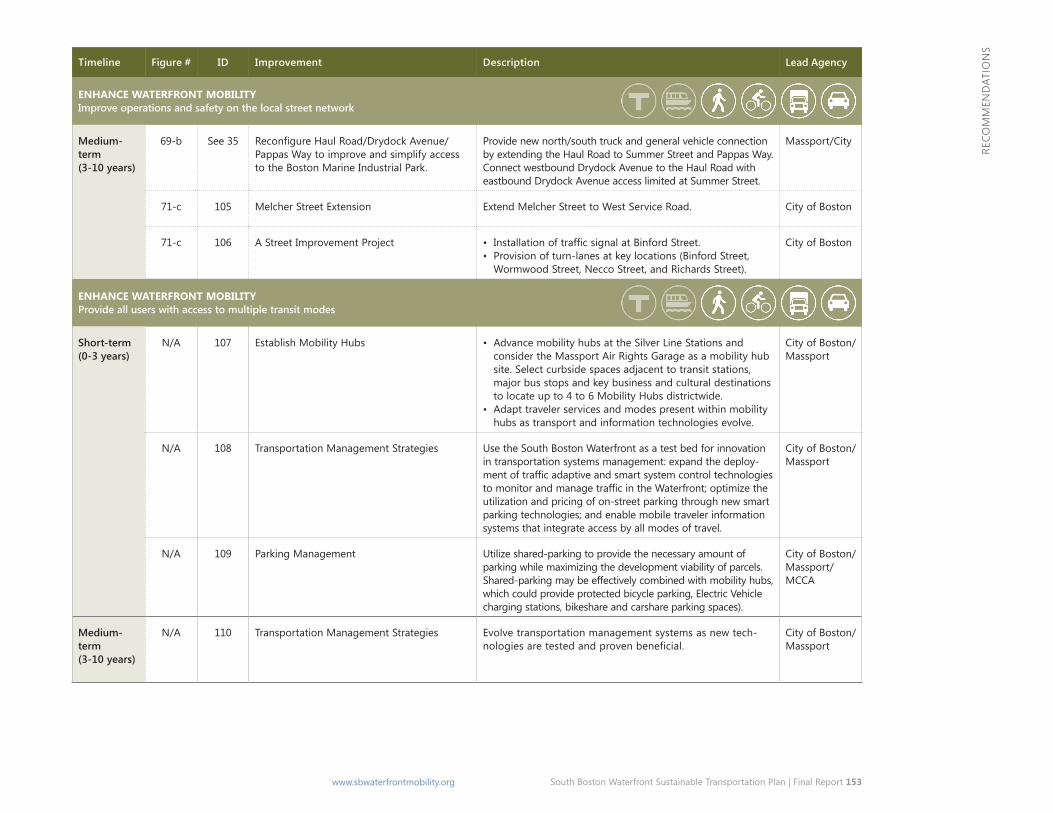
South Boston Waterfront Sustainable Transportation Plan | Final Report 153 www.sbwaterfrontmobility.org
Reco
mm
end
atio
ns
Timeline Figure # ID Improvement Description Lead Agency
EnHAncE WATERFRonT moBIlITy Improve operations and safety on the local street network
Medium-term (3-10 years)
69-b See 35 ReconfigureHaulRoad/DrydockAvenue/ Pappas Way to improve and simplify access to the Boston marine industrial Park.
Provide new north/south truck and general vehicle connection by extending the Haul Road to Summer Street and Pappas Way. connect westbound drydock avenue to the Haul Road with eastbound drydock avenue access limited at Summer Street.
massport/city
71-c 105 melcher Street extension extend melcher Street to West Service Road. city of Boston
71-c 106 a Street improvement Project • InstallationoftrafficsignalatBinfordStreet. • Provision of turn-lanes at key locations (Binford Street,
Wormwood Street, necco Street, and Richards Street).
city of Boston
EnHAncE WATERFRonT moBIlITy Provide all users with access to multiple transit modes
Short-term (0-3 years)
n/a 107 establish mobility Hubs • advance mobility hubs at the Silver Line Stations and consider the massport air Rights Garage as a mobility hub site. Select curbside spaces adjacent to transit stations, major bus stops and key business and cultural destinations to locate up to 4 to 6 mobility Hubs districtwide.
• adapt traveler services and modes present within mobility hubs as transport and information technologies evolve.
city of Boston/ massport
n/a 108 Transportation management Strategies Use the South Boston Waterfront as a test bed for innovation in transportation systems management: expand the deploy-mentoftrafficadaptiveandsmartsystemcontroltechnologies tomonitorandmanagetrafficintheWaterfront;optimizethe utilization and pricing of on-street parking through new smart parking technologies; and enable mobile traveler information systems that integrate access by all modes of travel.
city of Boston/ massport
n/a 109 Parking management Utilize shared-parking to provide the necessary amount of parking while maximizing the development viability of parcels. Shared-parking may be effectively combined with mobility hubs, which could provide protected bicycle parking, electric Vehicle charging stations, bikeshare and carshare parking spaces).
city of Boston/ massport/ mcca
Medium-term (3-10 years)
n/a 110 Transportation management Strategies evolve transportation management systems as new tech-nologiesaretestedandprovenbeneficial.
city of Boston/ massport
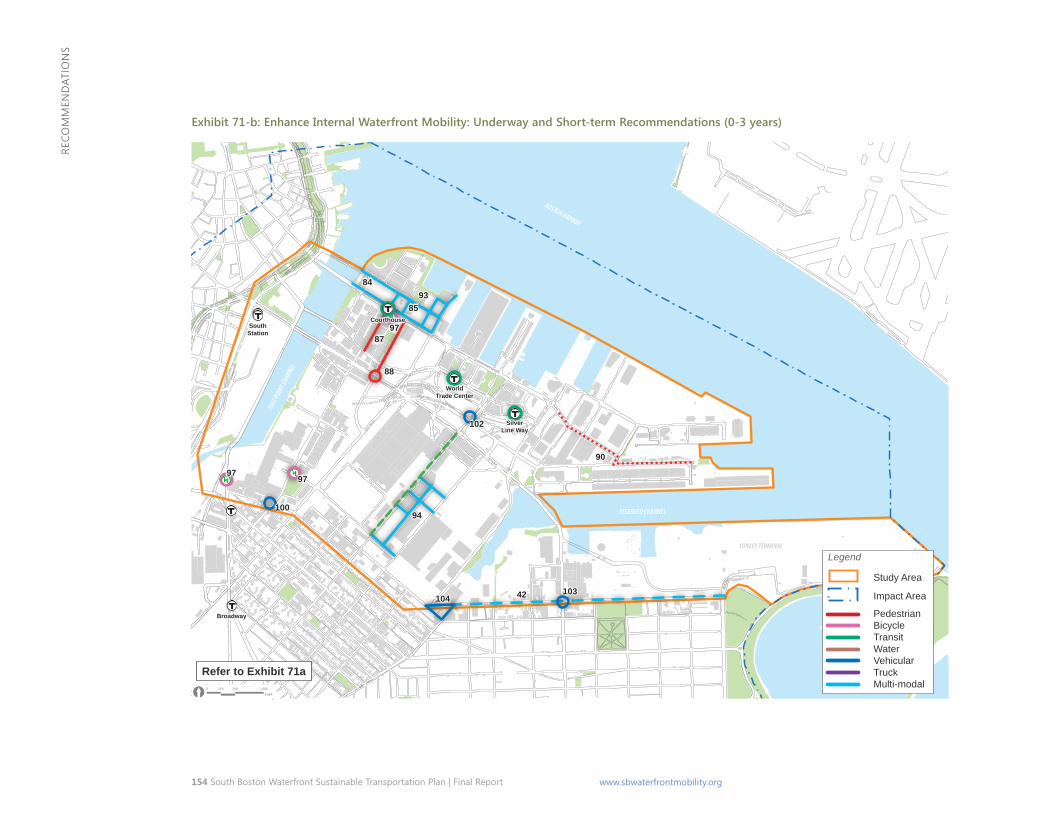
154 South Boston Waterfront Sustainable Transportation Plan | Final Report www.sbwaterfrontmobility.org
Reco
mm
end
atio
ns
Exhibit 71-b: Enhance Internal Waterfront Mobility: Underway and Short-term Recommendations (0-3 years)
BOSTON HARBOR
RESERVED CHANNEL
PLEASURE
BAY
FORT
POIN
T CHAN
NEL
CONLEY TERMINAL
D STREET
SUMMER STREET
A STR
EET
EAST FIRST STREET
HAUL ROAD
CONGRESS STREET
WEST FIRST STREET
NORTHERN AVENUE
SEAPORT BOULEVARD
MASSPORT H
AUL ROAD
WILLIAM DAY BOULEVARD
WEST SECOND STREET
B STR
EET
RAMP - HAUL ROAD TO RT 90 EB
RAMP - HAUL ROAD TO RT 90 WB
RAMP - RT 93 NB TO CON GR ESS STREE T
D STREET EXTENSION
RAMP - MASSPORT HAUL ROA D TO RT 90 EB
SEAPORT BOULEVARD
B STREET
[0 500 1,000250
Feet
BOSTON HARBOR
RESERVED CHANNEL
PLEASURE
BAY
FORT
POIN
T CHAN
NEL
CONLEY TERMINALD STREET
SUMMER STREET
A STR
EET
EAST FIRST STREET
HAUL ROAD
CONGRESS STREET
WEST FIRST STREET
NORTHERN AVENUE
SEAPORT BOULEVARD
MASSPORT H
AUL ROAD
WILLIAM DAY BOULEVARD
WEST SECOND STREETB S
TREE
T
RAMP - HAUL ROAD TO RT 90 EB
RAMP - HAUL ROAD TO RT 90 WB
RAMP - RT 93 NB TO CON GR ESS STREE T
D STREET EXTENSION
RAMP - MASSPORT HAUL ROA D TO RT 90 EB
SEAPORT BOULEVARD
B STREET
[0 500 1,000250
Feet
Legend
Study Area
Impact Area
PedestrianBicycleTransitWaterVehicularTruckMulti-modal
Refer to Exhibit 71a
South Station
Broadway
World Trade Center
Courthouse
SilverLine Way
84
85
87
88
90
42
94
93
97
97
97
100
102
103104
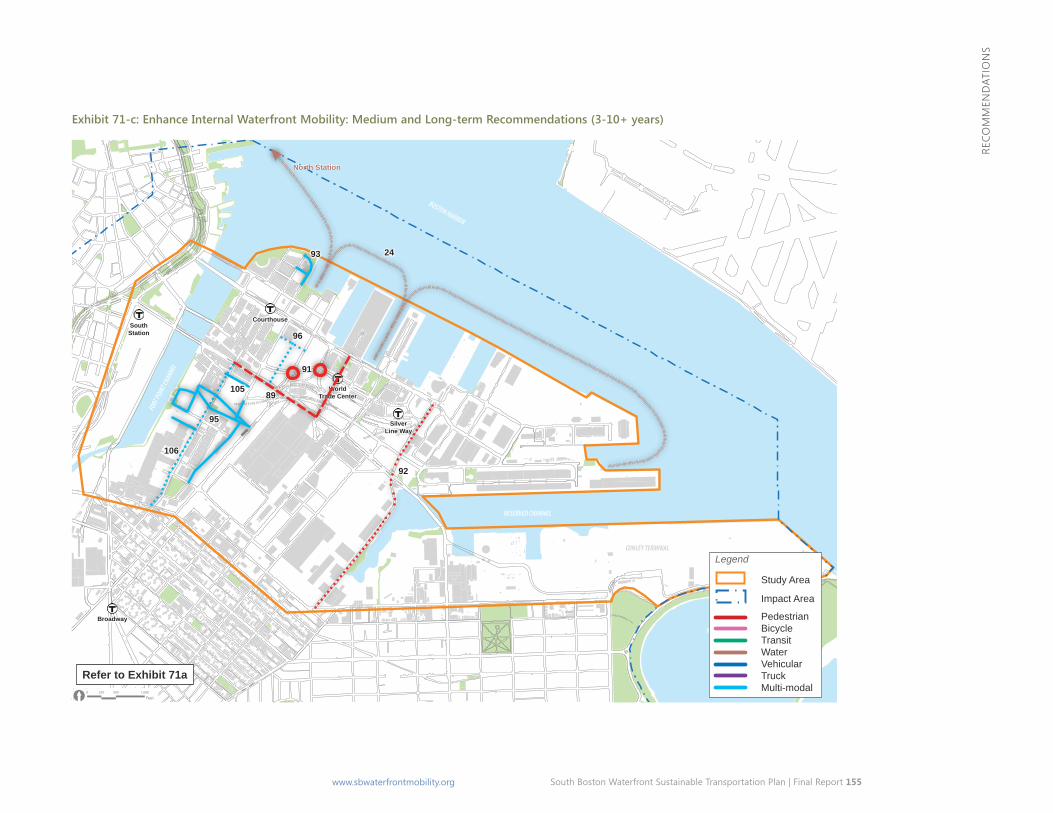
South Boston Waterfront Sustainable Transportation Plan | Final Report 155 www.sbwaterfrontmobility.org
Reco
mm
end
atio
ns
Exhibit 71-c: Enhance Internal Waterfront Mobility: Medium and Long-term Recommendations (3-10+ years)
BOSTON HARBOR
RESERVED CHANNEL
PLEASURE
BAY
FORT
POIN
T CHAN
NEL
CONLEY TERMINAL
D STREET
SUMMER STREET
A STR
EET
EAST FIRST STREET
HAUL ROAD
CONGRESS STREET
WEST FIRST STREET
NORTHERN AVENUE
SEAPORT BOULEVARD
MASSPORT H
AUL ROAD
WILLIAM DAY BOULEVARD
WEST SECOND STREET
B STR
EET
RAMP - HAUL ROAD TO RT 90 EB
RAMP - HAUL ROAD TO RT 90 WB
RAMP - RT 93 NB TO CON GR ESS STREE T
D STREET EXTENSION
RAMP - MASSPORT HAUL ROA D TO RT 90 EB
SEAPORT BOULEVARD
B STREET
[0 500 1,000250
Feet
BOSTON HARBOR
RESERVED CHANNEL
PLEASURE
BAY
FORT
POIN
T CHAN
NEL
CONLEY TERMINAL
D STREET
SUMMER STREET
A STR
EET
EAST FIRST STREET
HAUL ROAD
CONGRESS STREET
WEST FIRST STREET
NORTHERN AVENUE
SEAPORT BOULEVARD
MASSPORT H
AUL ROAD
WILLIAM DAY BOULEVARD
WEST SECOND STREET
B STR
EET
RAMP - HAUL ROAD TO RT 90 EB
RAMP - HAUL ROAD TO RT 90 WB
RAMP - RT 93 NB TO CON GR ESS STREE T
D STREET EXTENSION
RAMP - MASSPORT HAUL ROA D TO RT 90 EB
SEAPORT BOULEVARD
B STREET
[0 500 1,000250
Feet
Legend
Study Area
Impact Area
PedestrianBicycleTransitWaterVehicularTruckMulti-modal
Refer to Exhibit 71a
Mid to Long Term Internal Mobility
North Station
106
105
South Station
Broadway
World Trade Center
Courthouse
SilverLine Way
91
24
92
89
93
96
95
156 South Boston Waterfront Sustainable Transportation Plan | Final Report www.sbwaterfrontmobility.org
Reco
mm
end
atio
ns
A primary goal of the Public Realm strategies is to create a high-quality public realm that connects to Downtown Boston and reflects the unique scale and emerging character of the South Boston Seaport.
Advance public Realm a primary goal of the Public Realm strategy is to create a high-quality public realm that connects to downtown Boston yet reflects the unique scale and emerging character of the South Boston Waterfront. The “public realm” includes all those aspects of the physical environment that are visible and accessible to the public—including streets and sidewalks, parks and open spaces; the Harborwalk, promenades and bikeways; view corridors; and public transit. Privately owned areas may still be “public” in terms of their functional and perceptual impacts on the space of the street, and therefore are included in an understanding of the public realm. Though much work has been done since the last transportation plan, the creation of additional public streets is necessary to establish a flexible urban framework that supports future development while providing increased connectivity. moreover, given the myriad planning studies and guidelines that coexist within the bounds of the study area, attention to “smoothing the seams” between them should be prioritized in order to ensure public realm continuity.
There are many layers to a vibrant public realm: (1) an active and publicly accessible waterfront, (2) a street and block configuration that supports development and diverse land uses, (3) view corridors and pedestrian paths that bring people to the water, (4) a continuous Harborwalk and an open space network, (5) the creation of mixed use neighborhoods that sustain themselves and bring 24 hour/7 days per week life to the district, and (6) the retention of a maritime industry.
Desired public Realm objectives � An Integrated Street & Block Plan promoting the physical, visual
and functional integration of the south Boston Waterfront with downtown and adjacent neighborhoods.
� Street Hierarchy: Three principal east/west streets and continuous north/south streets.
� A network of smaller scale streets and open spaces to create an integrated, accessible, and walkable district.
� Extended Harborwalk and active Waterfront. � Public realm strategies that anchor each neighborhood or
sub-district in the south Boston Waterfront, preserving or enhancing their unique identities and scale.
� Reinforced view corridors to harbor.
The study recognizes that this review of current conditions and the general approach suggested in these recommendations are just a first step in developing a complete and cohesive public realm in the south Boston Waterfront. it is clear that further study and coordination between state and local agencies, property owners and the general public is necessary to recognize and realize the district’s full potential. Boston’s Complete Streets Guidelines, Massport’s Commonwealth Flats design Guidelines, and the more detailed guidelines for seaport square are an excellent streetscape foundation for the district, but there are many areas which require further definition and coordination as the Waterfront undergoes increased development pressures in the near-term. the public realm recommendations for the south Boston Waterfront include:
� Establish organizational structure and capacity to execute a Public Realm study.
� complete a comprehensive Public Realm study for the Waterfront. � Vet and pursue key transformative projects as early actions,
including—as an example—improved pedestrian wayfinding district-wide.
important contextual considerations for the Public Realm in the south Boston Waterfront are highlighted in the following sections of this report.
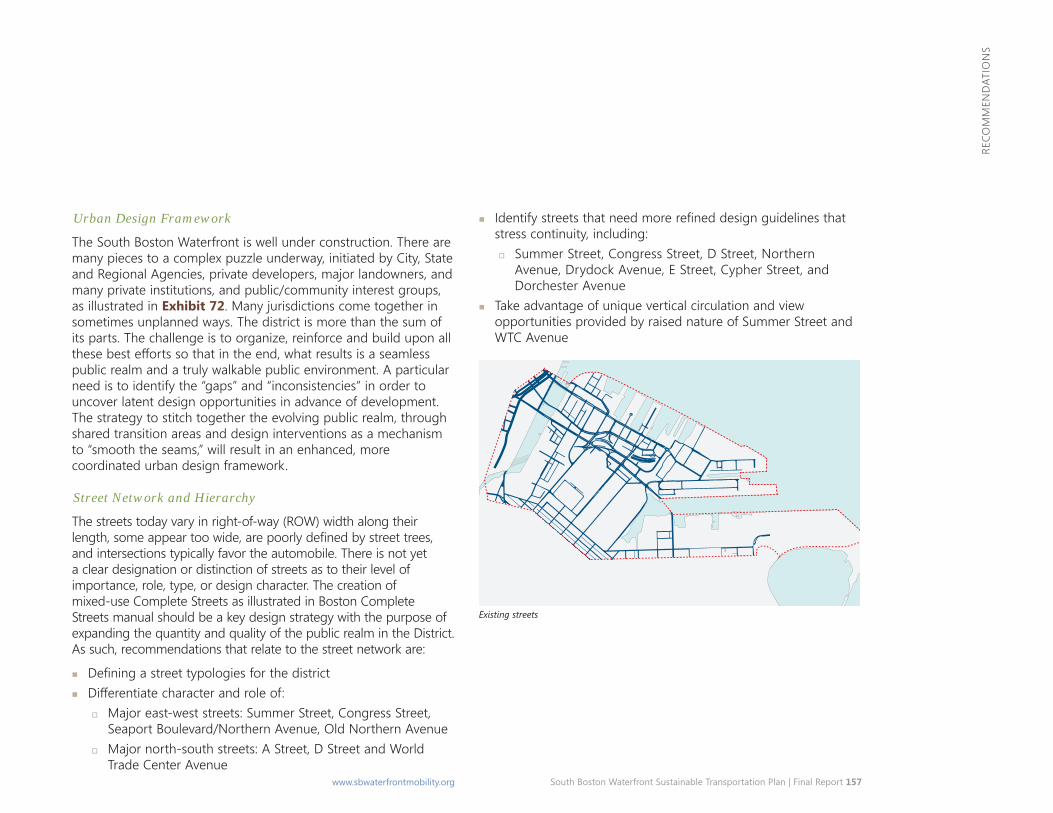
South Boston Waterfront Sustainable Transportation Plan | Final Report 157 www.sbwaterfrontmobility.org
Reco
mm
end
atio
ns
Urban Design Framework
the south Boston Waterfront is well under construction. there are many pieces to a complex puzzle underway, initiated by City, State and Regional agencies, private developers, major landowners, and many private institutions, and public/community interest groups, as illustrated in Exhibit 72. many jurisdictions come together in sometimes unplanned ways. the district is more than the sum of its parts. The challenge is to organize, reinforce and build upon all these best efforts so that in the end, what results is a seamless public realm and a truly walkable public environment. A particular need is to identify the “gaps” and “inconsistencies” in order to uncover latent design opportunities in advance of development. the strategy to stitch together the evolving public realm, through shared transition areas and design interventions as a mechanism to “smooth the seams,” will result in an enhanced, more coordinated urban design framework.
Street Network and Hierarchy
The streets today vary in right-of-way (ROW) width along their length, some appear too wide, are poorly defined by street trees, and intersections typically favor the automobile. there is not yet a clear designation or distinction of streets as to their level of importance, role, type, or design character. the creation of mixed-use complete streets as illustrated in Boston complete Streets manual should be a key design strategy with the purpose of expanding the quantity and quality of the public realm in the district. As such, recommendations that relate to the street network are:
� Defining a street typologies for the district � Differentiate character and role of:
� major east-west streets: summer street, congress street, Seaport Boulevard/Northern Avenue, Old Northern Avenue
� major north-south streets: a street, d street and World trade center avenue
� Identify streets that need more refined design guidelines that stress continuity, including: � summer street, congress street, d street, northern
Avenue, Drydock Avenue, E Street, Cypher Street, and dorchester avenue
� Take advantage of unique vertical circulation and view opportunities provided by raised nature of summer street and Wtc avenue
Existing streets
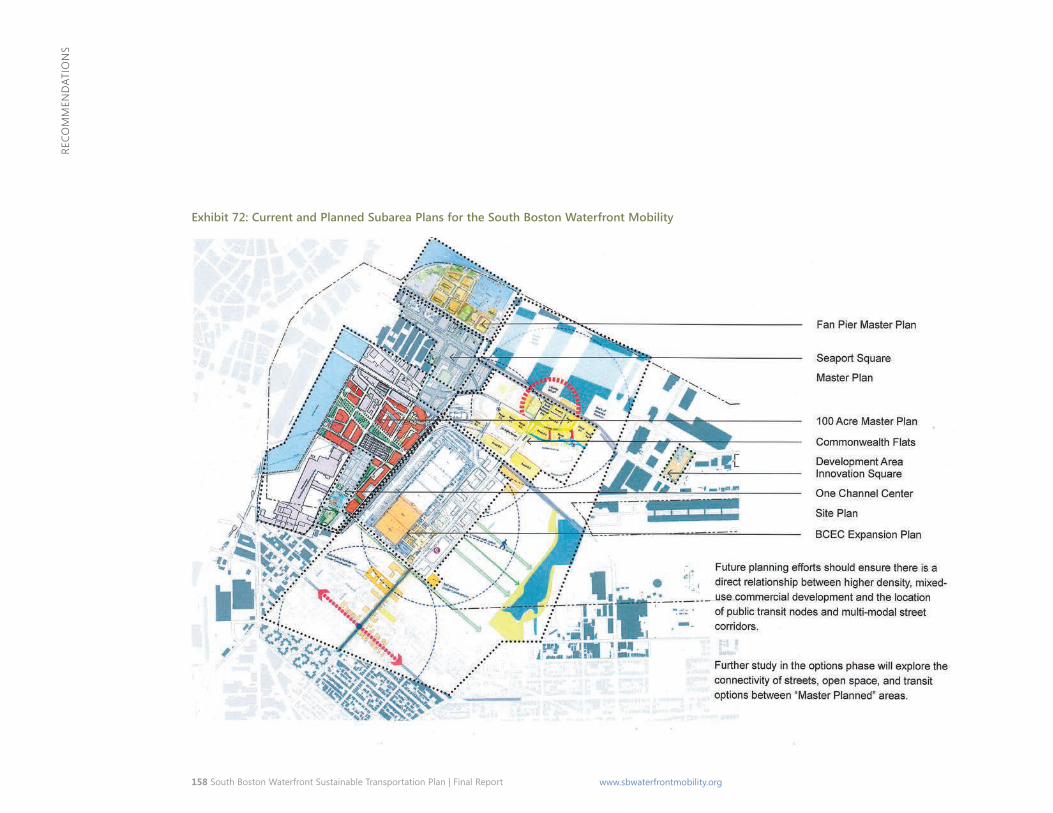
158 South Boston Waterfront Sustainable Transportation Plan | Final Report www.sbwaterfrontmobility.org
Reco
mm
end
atio
ns
Exhibit 72: Current and Planned Subarea Plans for the South Boston Waterfront Mobility
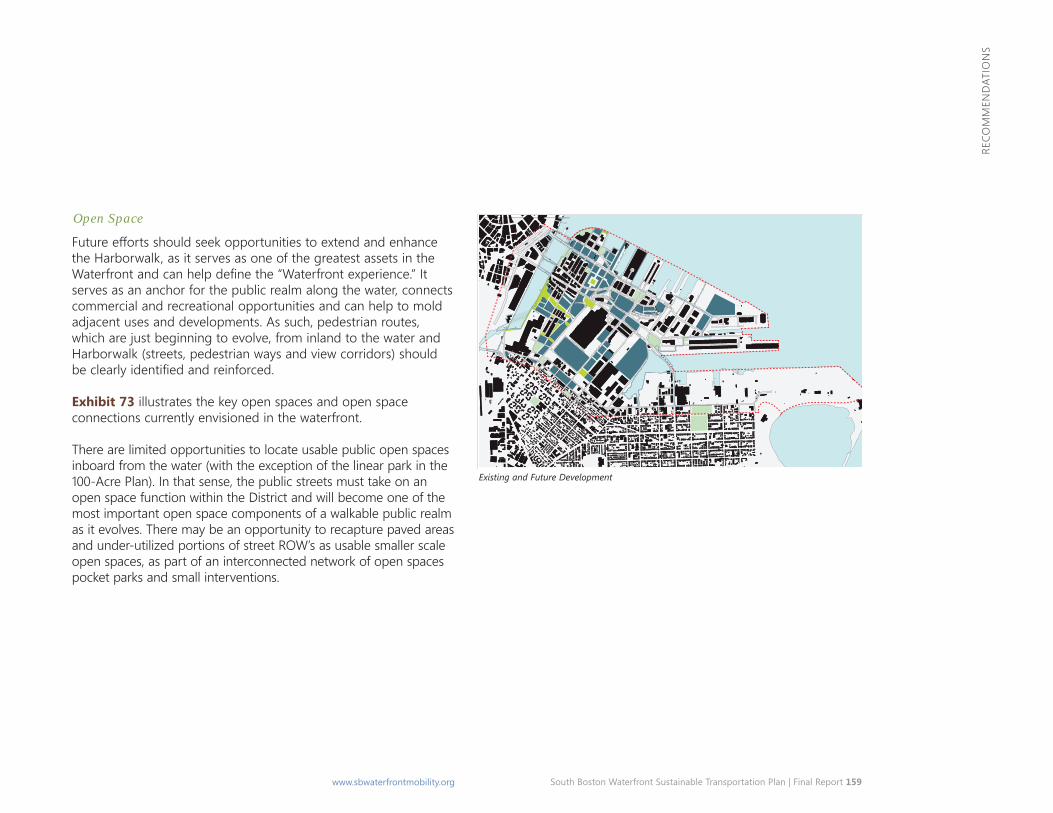
South Boston Waterfront Sustainable Transportation Plan | Final Report 159 www.sbwaterfrontmobility.org
Reco
mm
end
atio
ns
Open Space
Future efforts should seek opportunities to extend and enhance the Harborwalk, as it serves as one of the greatest assets in the Waterfront and can help define the “Waterfront experience.” It serves as an anchor for the public realm along the water, connects commercial and recreational opportunities and can help to mold adjacent uses and developments. as such, pedestrian routes, which are just beginning to evolve, from inland to the water and Harborwalk (streets, pedestrian ways and view corridors) should be clearly identified and reinforced.
Exhibit 73 illustrates the key open spaces and open space connections currently envisioned in the waterfront.
there are limited opportunities to locate usable public open spaces inboard from the water (with the exception of the linear park in the 100-Acre Plan). In that sense, the public streets must take on an open space function within the district and will become one of the most important open space components of a walkable public realm as it evolves. there may be an opportunity to recapture paved areas and under-utilized portions of street ROW’s as usable smaller scale open spaces, as part of an interconnected network of open spaces pocket parks and small interventions.
Existing and Future Development
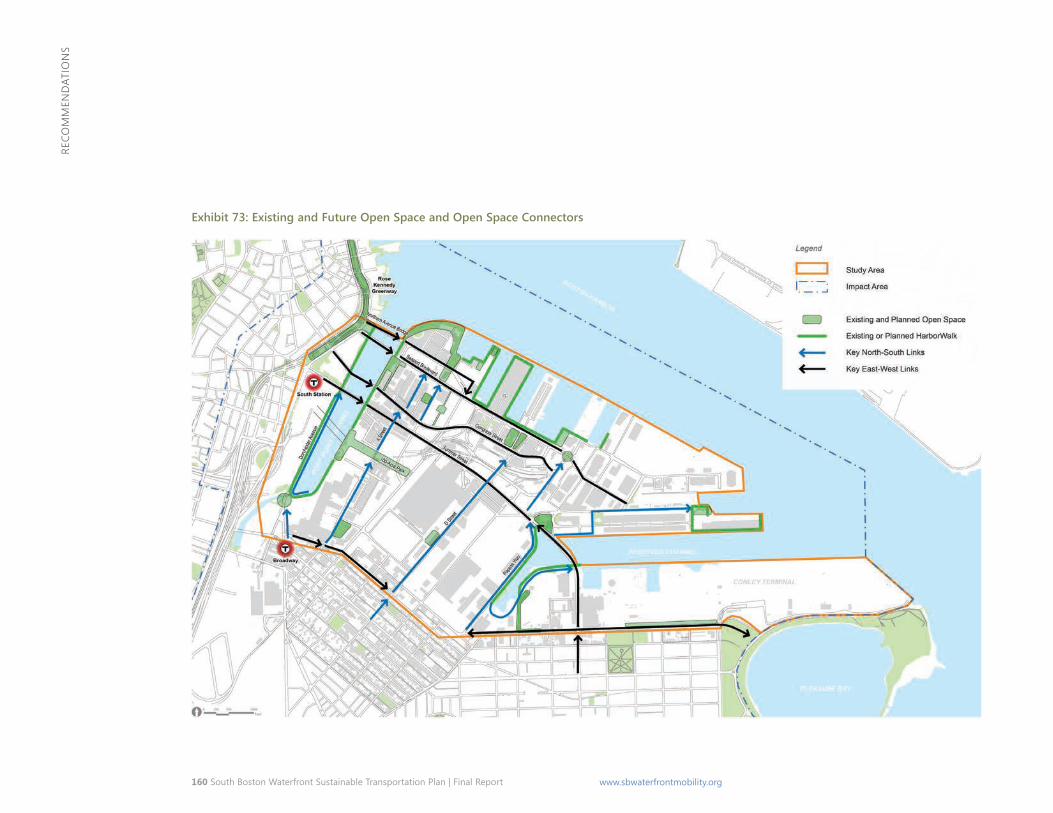
160 South Boston Waterfront Sustainable Transportation Plan | Final Report www.sbwaterfrontmobility.org
Reco
mm
end
atio
ns
Exhibit 73: Existing and Future Open Space and Open Space Connectors
South Boston Waterfront Sustainable Transportation Plan | Final Report 161 www.sbwaterfrontmobility.org
Reco
mm
end
atio
ns
these would include:
� Northern Avenue Bridge as a pedestrian/Harborwalk connection to Fan Pier
� Northern portion of Children’s Museum Park and Seaport Boulevard
� North/South streets linking inboard to the water: � A Street/Thomson Place � Old Wharf Road/East Service Road; � Proposed N/S Street within Seaport Square Development � Expanded Harborwalk from B Street to Massport Haul Road � d street � Pappas Way and summer street
� Reopening of Dorchester Avenue and Harborwalk extension from Broadway station to south station
� 100 Acre east/west park with potential links to BCEC and new bridge crossing at Fort Point channel
Gateways
Gateways typically function as an introduction to the public realm, setting the tone for urban experience as one moves into and through the district. Gateways to the south Boston Waterfront can be understood by water body crossings (e.g., over the Fort Point or Reserved Channels), as roadways transition from residential neighborhoods to activity centers and commercial areas, and as moments of arrival at transit stops. Exhibit 74 illustrates the key gateways (transit stops, intersections, bridges, etc.) into and out of the Seaport, and acknowledges the need for public realm improvements and design interventions at these critical locations. Public realm enhancements that allow for the accommodation of all modes are necessary for both the functional success of these gateways and a sustainable transportation network for the district.
most critical are the connections between transit stations and the Waterfront, the downtown and the Waterfront, and transitions to/ from the adjacent neighborhoods.
Key Gateways: � Northern Avenue Bridge, linking the Greenway with old
northern avenue � Summer Street Bridges (Fort Point and Reserve Channel) � silver Line stations � Broadway station � cruiseport and Water transportation nodes � Existing and future ferry/boat terminals at Seaport Boulevard � d street at West First and cypher street � Potential Fort Point crossing south of summer street from
south station � Reopened dorchester avenue
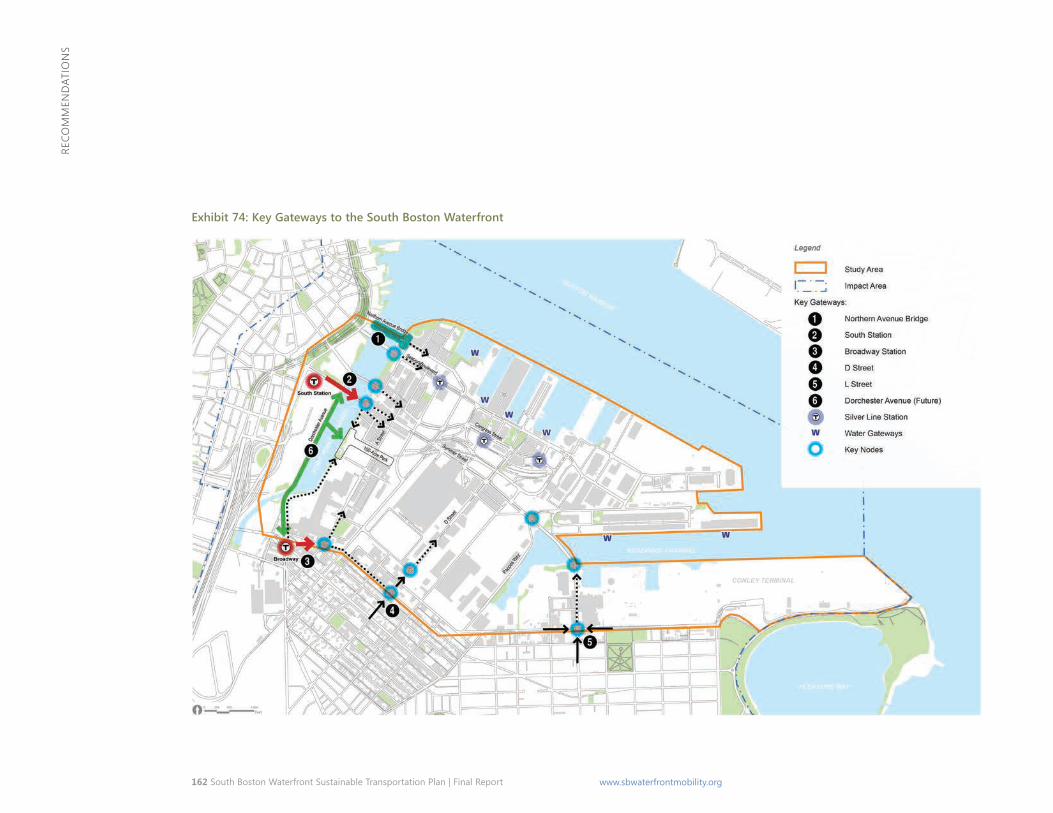
162 South Boston Waterfront Sustainable Transportation Plan | Final Report www.sbwaterfrontmobility.org
Reco
mm
end
atio
ns
Exhibit 74: Key Gateways to the South Boston Waterfront
South Boston Waterfront Sustainable Transportation Plan | Final Report 163 www.sbwaterfrontmobility.org
Reco
mm
end
atio
ns
Transformational Projects
Exhibit 75 captures key ideas that are specific to this particular planning effort and lend further support to the transportation recommendations that emerged out of a rigorous, data-driven process (e.g., leveraging the WTC viaduct infrastructure to strengthen the multimodal hub from BCEC’s Summer Street “front door” to the proposed new ferry hub at Seaport Boulevard). This includes the bundling of long-standing ideas from individual planning studies into a coordinated package of public realm concepts (e.g., South Station expansion, opening of Dorchester Avenue, a new pedestrian/bicycle connection across Fort Point Channel, and improved streetscape and wayfinding from the Broadway station to proximate growth areas). Some examples of projects that would help jump start the emerging Public Realm and create key transportation, neighborhood and waterfront linkages include:
� the reopening of dorchester avenue coupled with south station expansion and an additional crossing of Fort Point channel.
� Broadway station and pedestrian improvements to major gateways at a, and d streets.
� Preparing congress street as a BRt corridor from north station through the Waterfront to BMIP (coordinated with Silver Line stops along the way).
� Capitalizing on near-term development along Summer Street, Wtc avenue, and d street to create a memorable pedestrian link between BCEC and Summer Street; to Congress and the Wtc silver Line station; and on to seaport Boulevard and the planned new ferry terminal.
Wayfinding/Connections to Transit
The public transit stops and stations (Silver Line, ferry and bus routes) need to become more prominent, more visible, and become part of the armature and design vocabulary of the public realm. What are the design elements of designated public transit corridors and station stops (as identified in Boston’s Coordinated Furniture Program) which can provide continuity throughout the district; and what elements will provide diversity and character to each of the sub-districts?
Broadway station is an important gateway into the district and its importance will increase as developments such as the Bcec expansion are constructed. As such, integrating wayfinding to connect between Broadway station, potentially re-opened dorchester avenue, a street and d street will become necessary in the near future.
Enhanced pedestrian connections and wayfinding are also critical for special generators such as the cruiseport and Bcec. Visitors and conventioneers are often unfamiliar with the area and are typically transit dependent. Public realm improvements such as wayfinding signs and pedestrian kiosks with maps are necessary to help orient visitors and highlight destinations and activities.
There is also a need to locate “Mobility Hubs” to facilitate travel within the district and complement regional connections. Mobility Hubs are centers of activity that bring together alternative transportation modes, virtual trip planning and place making at key locations. They co-locate transit stations and bus stops, car and bike-share parking, clean-fuel charging stations, real-time travel information screens, pedestrian way-finding maps, cafes and food trucks.
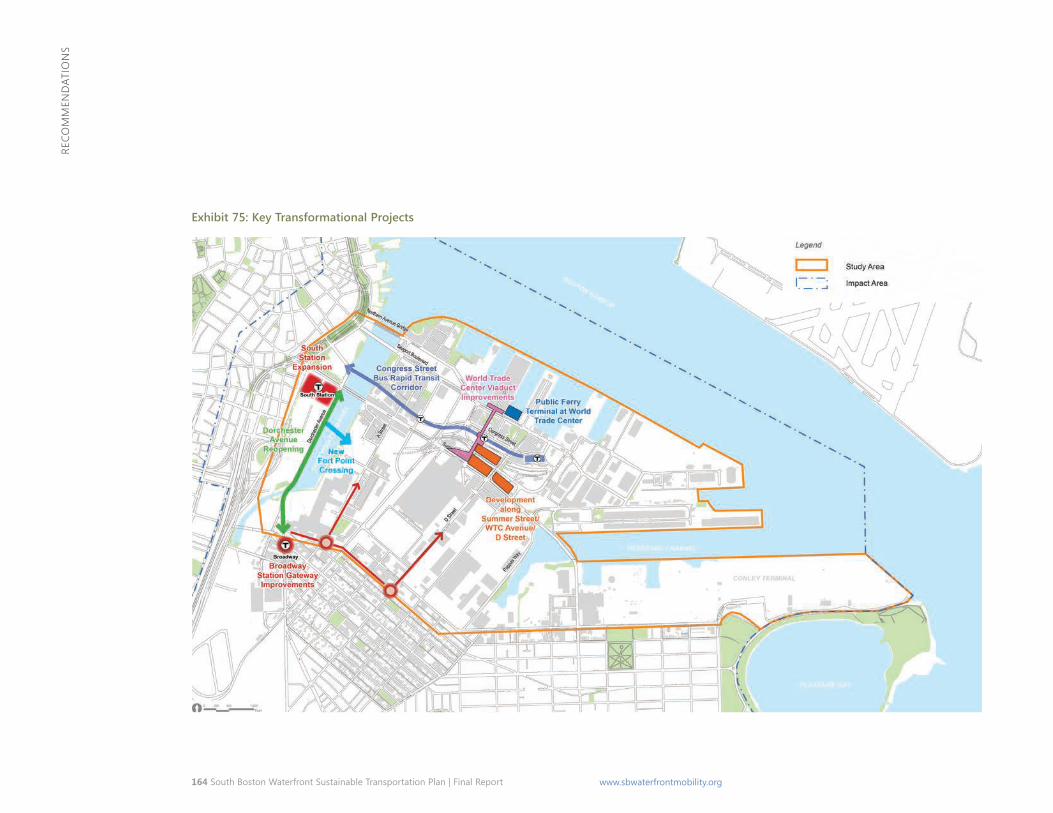
164 South Boston Waterfront Sustainable Transportation Plan | Final Report www.sbwaterfrontmobility.org
Reco
mm
end
atio
ns
Exhibit 75: Key Transformational Projects
South Boston Waterfront Sustainable Transportation Plan | Final Report 165 www.sbwaterfrontmobility.org
Reco
mm
end
atio
ns
The District’s Silver Line Stations (Courthouse, World Trade Center, and Silver Line Way) and the planned Air-Rights Garage projects offer excellent near-term locations for mobility hubs. The World trade center hub would also help to integrate silver Line station with the proposed BRt stop on congress street, and the planned water transportation hub on seaport Boulevard. select curbside spaces at major bus stops and key business and cultural destinations could serve as 4 to 6 additional Mobility Hubs districtwide. consideration should also be given to a clean-fuel grid in relation to energy grids in the south Boston Waterfront.
Tactical Urbanism
The District’s vibrancy and development timeline offer the ability to seek opportunities to test changes to the public realm using low-cost materials and temporary installations. Where appropriate, the public agencies and developers can form partnerships to undertake temporary and pop-up programming, such as converts and art. Potential tactical urbanism opportunities:
� Interim landscapes, such as the successful “Lawn on D” � design opportunities
� Viaduct pedestrian bridges (Summer Street and WTC Avenue) � Weather-protected walk (west side of WTC Avenue) � old northern avenue Bridge i.e., streetscape, lighting,
wayfinding as an iconic element and extension of the Rose Kennedy Greenway to Fan Pier
� improve vertical circulation � Artist Collaborations on key streets or pedestrian ways, small
parks and plazas that terminate at Harborwalk
Examples of Tactical Urbanism
166 South Boston Waterfront Sustainable Transportation Plan | Final Report www.sbwaterfrontmobility.org
Reco
mm
end
atio
ns
Trip Generation (per 1000 square feet) for Urban Residential vs. Office Uses
Substituting a residential unit for the equivalent square footage of commercial office spaces reduces the transportation demand of a development by at least 50 percent.
Implement supportive management strategies and policies enhancing existing policies related to overall transportation demand management (TDM), parking and traffic systems management (TSM), and establishing the organizational capacity to plan, implement, and monitor recommendations and outcomes will reinforce the immediate and long-term success of this sustainable transportation Plan.
Transportation Demand management
the sponsoring agencies of this plan should continue to support educational, outreach, and regulatory programs that reduce the transportation impacts of development activity and/or reduce single occupant vehicle use for commuters. considerations to affect these changes might include:
� TDM Ordinance – At the City and/or state level, consider adopting a parking and transportation demand management (PTDM) ordinance, similar to the model provided by the city of cambridge, to improve mobility and access, reduce congestion and air pollution, and increase safety by promoting walking, bicycling, public transit, carsharing, and other sustainable modes.
� Mix of Land Uses – to the extent opportunities present themselves, continue to seek a mix of land uses and services that reduce the need to travel during peak periods and directions, provide supportive land uses within the Waterfront area, and reduce the overall dependence on the automobile. For example, residential development has the potential to reduce the journey to work, increase non-automobile mode share, and minimize traffic loads to the Waterfront in the peak commuter direction. From simply a trip generation standpoint, substituting a residential unit for the equivalent square footage of commercial office spaces reduces the transportation demand of a development by at least 50 percent.
� Expanded TMA Role – the seaport tma has a long-standing track record for successful advocacy, marketing, special event management, and information clearinghouse to support commuter programs in the Waterfront. there is opportunity to expand the TMA’s membership and potentially its role as a coordinator of corporate and/or commuter services, focusing on the exchange of more real-time information, service offerings (e.g., consolidated shuttle system) and other more tangible incentives and disincentives to influence control behaviors. Through the TAPA process, agencies should work regularly with the tma and businesses to strengthen relationships, encourage employee participation in the Seaport TMA, and make businesses better aware of the full program of available services.
Exhibit 76: Trip Generation (Per 1,000 Square Feet) for Urban Residential vs. Office Uses (Unadjusted for Mode Choice)
0
2
4
6
8
10
12
AM Peak Hour PM Peak Hour Weekday
Vehi
cle
Trip
s per
1,0
00 sq
uare
feet
(Unadjusted for Mode Choice)
Residential Unit (Assumes 1000 SF) Office
South Boston Waterfront Sustainable Transportation Plan | Final Report 167 www.sbwaterfrontmobility.org
Reco
mm
end
atio
ns
Transportation systems management (Tsm)
Maximizing the efficiency of existing transportation systems is critically important to optimize areawide operations, reduce delays and traveler inconveniences, and contribute to the sustainability of the transportation resources in the Waterfront.
� Districtwide Shared Parking Management Strategy – Parking remains one of the most powerful and pervasive tools to influence travel demands and patterns, and the traffic impacts on area streets and highways. A districtwide parking management plan is needed to keep pace with near-term changes and issues associated with parking, as well as implement longer-term parking management strategies. Districtwide activities defined by this plan could include encouraging shared parking between compatible land uses (office and restaurant/cinema/cultural uses, etc.); wayfinding and real-time guidance systems to available parking and exiting garages for “best way” to interstate system; and demand based or performance based pricing. Shared-parking facilities can also reduce the amount of on-site parking needed for individual development projects in the district, thereby reducing development costs and keeping residential and commercial rents lower. Furthermore, by combining a centralized shared-parking facility with an excellent pedestrian network and a mobility hub (which could provide protected bicycle parking, electric vehicle charging stations, bikeshare and carshare parking spaces), travel demand within the district could shift from vehicle-oriented to more pedestrian- and bike-oriented. Thus, shared parking may simultaneously advance the Plan’s goals related to internal circulation and mobility, economic vitality, and public realm.
candidate employer and landlord actions encouraged by this plan could include: limiting parking spaces on site and reduce or eliminate free parking; providing priority parking for bicycles, car-share
vehicles, vanpools, and low/clean emissions vehicles; implementing Commuter Options programs, such as parking cash outs; parking reservation systems and demand based or congestion pricing; and unbundling the price of parking from leases. The Seaport TMA can assist employers who are members through a suite of new programs to implement new incentive programs.
The Districtwide Parking Management Strategy also needs to address the protection of short-term, nearby, and appropriately priced parking for visitors to museums and cultural offerings in the Waterfront.
� Traffic Management – Use the south Boston Waterfront as a test bed for innovation in transportation systems management: expand the deployment of traffic adaptive and smart system control technologies to monitor and manage traffic in the Waterfront; optimize the utilization and pricing of on-street parking through new smart parking technologies; and enable mobile traveler information systems that integrate access by all modes of travel. monitor and periodically address intersection operations in the Waterfront and adjacent neighborhoods through signal technology upgrades, timing modifications, restriping, etc., improvements to maintain or enhance vehicular and freight mobility (every 2 to 3 years).
� Coordinated Traffic Management and Enforcement – consistent enforcement and coordination among multiple traffic control jurisdictions are critical to ensuring safe and efficient traffic management at all times.
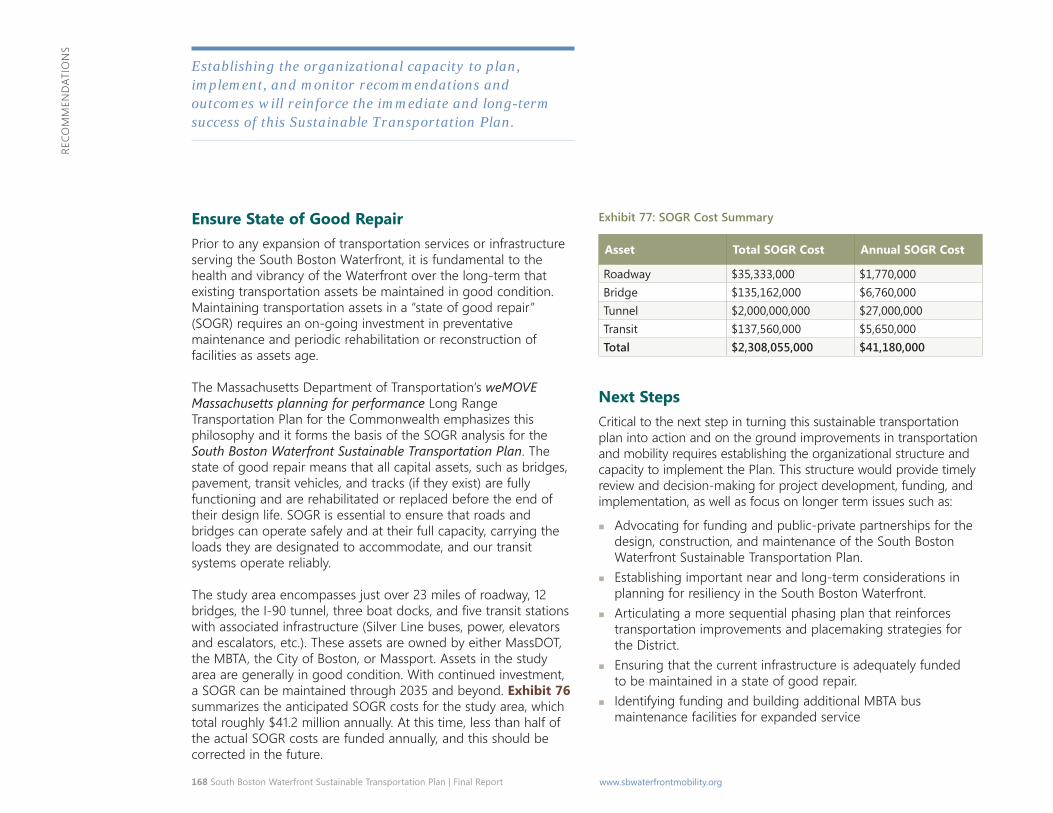
168 South Boston Waterfront Sustainable Transportation Plan | Final Report www.sbwaterfrontmobility.org
Reco
mm
end
atio
ns
Establishing the organizational capacity to plan, implement, and monitor recommendations and outcomes will reinforce the immediate and long-term success of this Sustainable Transportation Plan.
Ensure state of good Repair Prior to any expansion of transportation services or infrastructure serving the south Boston Waterfront, it is fundamental to the health and vibrancy of the Waterfront over the long-term that existing transportation assets be maintained in good condition. Maintaining transportation assets in a “state of good repair” (SOGR) requires an on-going investment in preventative maintenance and periodic rehabilitation or reconstruction of facilities as assets age.
The Massachusetts Department of Transportation’s weMOVE Massachusetts planning for performance Long Range Transportation Plan for the Commonwealth emphasizes this philosophy and it forms the basis of the soGR analysis for the South Boston Waterfront Sustainable Transportation Plan. the state of good repair means that all capital assets, such as bridges, pavement, transit vehicles, and tracks (if they exist) are fully functioning and are rehabilitated or replaced before the end of their design life. soGR is essential to ensure that roads and bridges can operate safely and at their full capacity, carrying the loads they are designated to accommodate, and our transit systems operate reliably.
The study area encompasses just over 23 miles of roadway, 12 bridges, the I-90 tunnel, three boat docks, and five transit stations with associated infrastructure (Silver Line buses, power, elevators and escalators, etc.). These assets are owned by either MassDOT, the mBta, the city of Boston, or massport. assets in the study area are generally in good condition. With continued investment, a SOGR can be maintained through 2035 and beyond. Exhibit 76 summarizes the anticipated SOGR costs for the study area, which total roughly $41.2 million annually. At this time, less than half of the actual soGR costs are funded annually, and this should be corrected in the future.
Exhibit 77: SOGR Cost Summary
Asset Total sogR cost Annual sogR cost
Roadway $35,333,000 $1,770,000 Bridge $135,162,000 $6,760,000 Tunnel $2,000,000,000 $27,000,000 Transit $137,560,000 $5,650,000 Total $2,308,055,000 $41,180,000
next steps critical to the next step in turning this sustainable transportation plan into action and on the ground improvements in transportation and mobility requires establishing the organizational structure and capacity to implement the Plan. this structure would provide timely review and decision-making for project development, funding, and implementation, as well as focus on longer term issues such as:
� advocating for funding and public-private partnerships for the design, construction, and maintenance of the south Boston Waterfront sustainable transportation Plan.
� establishing important near and long-term considerations in planning for resiliency in the south Boston Waterfront.
� articulating a more sequential phasing plan that reinforces transportation improvements and placemaking strategies for the district.
� ensuring that the current infrastructure is adequately funded to be maintained in a state of good repair.
� identifying funding and building additional mBta bus maintenance facilities for expanded service
South Boston Waterfront Sustainable Transportation Plan | Final Report 169 www.sbwaterfrontmobility.org
Reco
mm
end
atio
ns
� incorporating state of the practice management strategies and routine operational improvements are made to optimize transportation systems efficiencies and interoperability.
� ensuring a coordinated, comprehensive, and tested emergency response plan is in place for the Waterfront, and,
� Educating and informing the diverse stakeholders regularly on initiatives, procedures, and responsibilities.
Establish the organizational structure and capacity to Implement the plan
Refining Plan recommendations, defining a finance plan that supports the phased implementation of these recommendations, advocating for and executing the improvements, and monitoring progress requires a consistent, committed, and cooperative interagency structure. the completion of this sustainable transportation Plan with its articulated goals, objectives, and recommendations, marks the first step towards fulfilling the long-term vision for the south Boston Waterfront. the process to begin implementing the plan is initiated upon the Plan’s endorsement by sponsoring agencies. a brief outline of the next steps anticipated in the process are highlighted below.
Development of Implementation and Finance plan
an important next step in Plan implementation is to develop a Finance Plan for the recommendations. this plan will examine potential revenue mechanisms and innovative financing tools that could be used to fund the proposed transportation improvements. In general, potential revenue and financing options applicable to transportation investments may include, but are not limited to:
� Existing transportation user fees (direct and indirect), such as motor fuel taxes, tolls, vehicle fees, fare revenues, parking fees, and others.
� special taxes and fees, whether considered at the state or local levels (e.g., sales, income, property, hotel taxes).
� Value capture, such as impact fees, development exactions, tax increment financing (TIF), and special assessment districts. Given the anticipated growth and development in the south Boston Waterfront area, it seems appropriate to examine carefully the potential of applying value capture to support transportation investments.
� Federal funding, including transit capital grants, if applicable (i.e., Section 5309 New Starts and Small Starts) and FHWA flexible funds.
� Tolling and pricing strategies, including HOT lanes (perhaps for cars using the South Boston Haul Road), and congestion pricing.
� Federal innovative financing for major projects (e.g., TIFIA, Private Activity Bonds, GARVEE bonds).
� Public-private partnerships (P3s), including the availability payment model for projects that cannot generate sufficient (or any) revenue to repay debt and equity. In recent years, there has been an increase in private equity investment in surface transportation through P3, with financing packages that combine public and private debt, equity, and public funding.
It should be noted that innovative finance tools and P3s do not generate new revenues, but allow leveraging of existing resources to accelerate the construction of projects. the use of innovative finance and P3s requires identifying funding sources for repayment. Potential revenue and innovative financing tools will be evaluated against a set of common criteria that are employed to evaluate advantages and disadvantages of each source. these criteria may be used as a guide when determining if these sources and innovative financing tools apply to proposed investments.
170 South Boston Waterfront Sustainable Transportation Plan | Final Report www.sbwaterfrontmobility.org
Reco
mm
end
atio
ns
For the south Boston Waterfront sustainable transportation Plan, the benefit of developing a Finance Plan and exploring innovative financing options as opposed to “pay-as-you-go” is to advance projects and realize mobility and economic benefits (e.g., travel-time savings; enhanced safety; accessibility to jobs, suppliers, customers, and intermodal terminals; job creation; expanded tax base; etc.) by having infrastructure in place earlier.
consistency with other state/local planning processes
South Boston Waterfront stakeholders are reminded that many of the capital intensive recommendations identified in this Plan and the timing for their implementation are subject to further review, planning, and programming as part of other state and federally mandated transportation planning and environmental processes. notably, to be advanced, these projects will need be considered and endorsed as part of the Commonwealth’s update to its fiscally-constrained Long-Range Transportation Plan, the MassDOT/MBTA Program for Mass Transportation, and/or the City of Boston’s Mobility Plan (all of which are just getting underway). depending on the nature of the project and the source of funding, state and/or federal environmental documentation and clearances may also be required.
conceptual Design and Implementation
As the funding outlook gets resolved, the next step in the process involves moving selected recommendations to preliminary conceptual design and articulating a project phasing for recommended improvements that is aligned with the pace and location of the projected Build-out of the south Boston Waterfront.
performance monitoring and measurement
Finally, in the category of “what gets measured gets managed” it will be essential to develop mechanisms to monitor and evaluate the effectiveness of the improvements and forecast their outcomes across transportation, environment, social, and cost metrics. the metrics should be consistent with stated performance management goals. It is envisioned that this work will draw and expand upon the metrics, alternatives evaluation, and screening process used to formulate the Plan.
South Boston Waterfront Sustainable Transportation Plan | Final Report 171 www.sbwaterfrontmobility.org
Ackn
ow
led
gem
ents
AcknoWledgemenTS Study Participants The South Boston Waterfront Transportation Plan has benefitted from the active participation and dedication of a large group of elected officials and agency representatives. We wish to thank all the participants who have given generously of their time.
Elected Officials
governor Charles Baker Mayor Martin Walsh Former Mayor Thomas Menino Congressman Michael Capuano Congressman Stephen Lynch senator Linda Dorcena Forry senator Thomas McGee Representative Nick Collins Representative William Straus City council President Bill Linehan councilor Michael Flaherty
Steering Committee
A Better City Rick Dimino, President and CEO
Boston Department of Public Works Michael Dennehy, Interim commissioner
Boston Redevelopment Authority Kairos Shen, Director of Planning
Boston Transportation Department James Gillooly, Interim commissioner
District Court of Massachusetts Richard Stearns, Judge, U. S. District Court, District of Massachusetts
Massachusetts Convention Center Authority James Rooney, executive director
Massachusetts Department of Transportation Richard Davey, Former Secretary and Chief Executive Officer Frank DePaola, Acting Secretary and Chief Executive Officer Thomas J. Tinlin Chief of Operations and Maintenance
Massport James Doolin, Chief Development Officer Thomas Glynn, Chief Executive Officer
MBTA Beverly Scott, Ph.D., General Manager and MassDOT Rail & Transit Administrator
Seaport TMA Lauren Grymek, executive director
172 South Boston Waterfront Sustainable Transportation Plan | Final Report www.sbwaterfrontmobility.org
Ackn
ow
led
gem
ents
Working Group
Boston Redevelopment Authority dan Berez chris Busch michael christopher James Fitzgerald Bryan Glascock Jonathan Greeley Jeong-Jun Ju Mary Knasas Richard McGuinness Lara Mérida Ted Schwartzberg Corey Zehngebot
Boston Transportation Department Vineet gupta Patrick Hoey
Department of Conservation and Recreation Ken Kirwin
Federal Court Marsha Zierk
MBTA Charles Planck Greg Strangeways
Massachusetts Convention Center Authority Howard Davis James Folk Geoff Lewis Fred Peterson Robert o’shea Jong Wai Tommee
Massachusetts Department of Transportation clinton Bench Ethan Britland Neil Boudreau
Massport lourenço dantas laura gilmore o’connor Craig Leiner Stephanie Pollack Beth Rubenstein
Seaport TMA Alexandra Smith
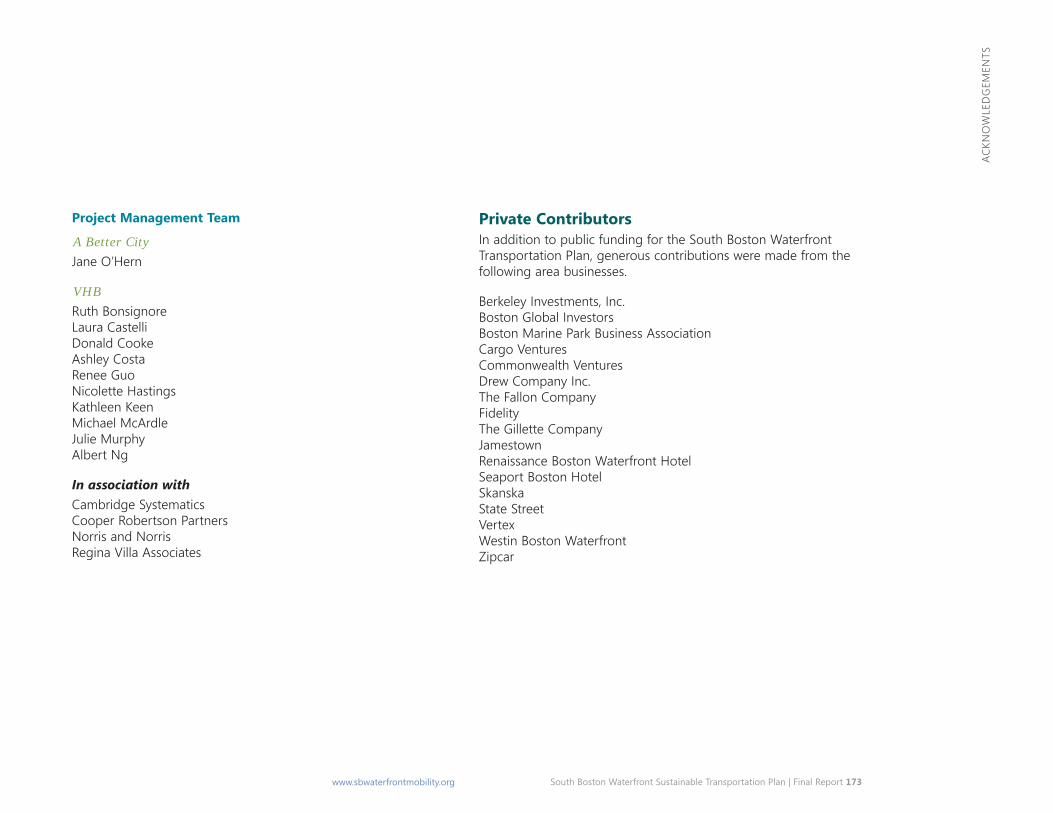
South Boston Waterfront Sustainable Transportation Plan | Final Report 173 www.sbwaterfrontmobility.org
Ackn
ow
led
gem
ents
Project Management Team
A Better City Jane o’Hern
VHB Ruth Bonsignore laura castelli Donald Cooke Ashley Costa Renee guo Nicolette Hastings kathleen keen Michael McArdle Julie Murphy Albert Ng
In association with Cambridge Systematics cooper Robertson Partners Norris and Norris Regina Villa Associates
Private Contributors In addition to public funding for the South Boston Waterfront Transportation Plan, generous contributions were made from the following area businesses.
Berkeley Investments, Inc. Boston global Investors Boston Marine Park Business Association Cargo Ventures Commonwealth Ventures Drew Company Inc. The Fallon Company Fidelity The Gillette Company Jamestown Renaissance Boston waterfront Hotel seaport Boston Hotel Skanska state street Vertex westin Boston waterfront Zipcar
174 South Boston Waterfront Sustainable Transportation Plan | Final Report www.sbwaterfrontmobility.org
lIst
of
AcRo
nym
s
liST oF AcRonymS AAB Architectural Access Board
ACS American Community Survey
ADA Americans with Disabilities Act
APC Automated Passenger Count
BCEC Boston convention & exhibition center
BMIP Boston Marine Industrial Park
BRA Boston Redevelopment Authority
BTD Boston transportation department
CA/T Central Artery/Tunnel
CTPS Central Transportation Planning Staff
DMA Dual-Mode Articulated [bus]
EB Eastbound
ECC Exchange Conference Center
EDIC Economic Development Industrial Corporation
ENF Environmental Notification Form
FEIR final environmental Impact Report
HOV High Occupancy Vehicle
ICA Institute of Contemporary Art
ksf kilo-square foot (feet)
LOS level of service
MAPC Metropolitan Area Planning Council
MBTA Massachusetts Bay Transportation Authority
MCCA Massachusetts Convention Center Authority
MEPA Massachusetts Environmental Policy Act
MPO Metropolitan Planning Organization
N/A not Available
NB Northbound
P&G Procter & gamble
PWD Public Works Department
R&D Research & development
RTP Regional Transportation Plan
SB Southbound (not defined, page 31)
SBBR South Boston Bypass Road
sf square foot (feet)
SIP state Implementation Plan
SLW Silver Line Way
SOV Single Occupant Vehicle
TAPA Transportation Access Plan Agreement
TBD To Be Determined
TDM Transportation Demand Management
TEUs Twenty Foot Equivalent Units
TMA Transportation Management Association
UPS United Parcel Service
USPS United States Postal Service
WB Westbound
WTC World Trade Center


