Embed Size (px)
Citation preview

Spark New Zealand Limited ARBN 050 611 277 Spark City, 167 Victoria Street West, Private Bag 92028, Auckland, New Zealand
MARKET RELEASE 26 August 2020
Spark New Zealand Limited H2 FY20 Results In accordance with the NZX Listing Rules, Spark New Zealand releases the following to the market in relation to Spark New Zealand Limited’s H2 FY20 results:
1. Market Release 2. Results Announcement 3. Distribution Notice 4. Annual Report 5. Investor presentation 6. Detailed financial information 7. Annual Corporate Governance Statement 8. Dividend Reinvestment Plan Offer document (to be reinstated for H2 FY20
dividend) 9. Dividend Reinvestment Plan Participation Notice.
Spark New Zealand’s Chief Executive, Jolie Hodson, and Chief Financial Officer, Stefan Knight, will discuss the H2 FY20 Results at 10:00am New Zealand time today. ASX Appendix 3A.1 will follow this release. Authorised by: Alastair White GM Capital Markets
- ENDS –
For media queries, please contact: Leela Gantman Corporate Relations Director +64 (0) 27 541 6338 For investor relations queries, please contact: Alastair White GM Capital Markets +64 (0) 21 228 3855
For
per
sona
l use
onl
y

Spark New Zealand Limited ARBN 050 611 277 Spark City, 167 Victoria Street West, Private Bag 92028, Auckland, New Zealand
MARKET RELEASE 26 August 2020
Spark New Zealand delivers to guidance with strong performance in key markets and rapid response to COVID-19
• FY20 EBITDAI1 guidance and dividend delivered – rapid response to COVID-19 and the associated impacts materialising in the last quarter moderated FY20 impact
• Return to top-line growth, following two years of flat revenues
• Earnings growth underpinned by Spark’s market momentum and focus on cost discipline
• Mobile service revenue growth outperformed the market2
Spark New Zealand (Spark) today announced revenue growth of 2.5% to $3,623 million for the year ending 30 June 2020. Following a strong performance in the first half, Spark maintained its momentum to achieve mobile service revenue growth of 3.9%, and double-digit growth in cloud, security and service management revenue, which increased 10.8%. In a year that was enormously challenging for all New Zealanders, Spark moved quickly to mitigate COVID-19 impacts as much as possible, while maintaining essential services to keep the country connected. Impacts included the loss of international roaming revenues, retail revenue reductions from store closures, the removal of data overage charges, and an increase in bad debt provisioning as a result of the economic impact of COVID-19 on Spark’s customers. Some benefits were also realised from increased demand for collaboration products to support remote working. Overall COVID-19 had a total negative EBITDAI impact of approximately $25 million in FY20. Operating expenses increased as the benefit of cost-out activities were reinvested to fund growth in key markets and labour capitalisation reduced in some areas. Spark’s strong performance in key markets, continued focus on cost discipline and the timing of COVID-19 impacts materialising in the last quarter, resulted in EBITDAI growth of 2.1% to $1,113 million, placing the result in the mid-range of guidance. Net profit after tax increased 4.4% to $427 million, primarily driven by growth in EBITDAI and lower tax expense3. Spark announced an H2 FY20 total dividend per share of 12.5c per share, 100% imputed, bringing the total FY20 dividend to 25c per share. Spark Chair Justine Smyth said: “FY20 marks the completion of our 3-year plan, which has transformed Spark from a traditional telco to an end-to-end digital services company and delivered compound annual growth in shareholder returns of 13%4.
1 Earnings before interest, tax, depreciation, amortisation, and investment income 2 Market share estimates sourced from IDC 3 Lower tax expense due to depreciation allowances being reintroduced for commercial building as part of the Government COVID-19 assistance package and a higher proportion of non-taxable gains 4 Total shareholder return compound annual growth rate for the three years from 1 July 2017 to 30 June 2020
For
per
sona
l use
onl
y
Spark New Zealand Limited ARBN 050 611 277 Spark City, 167 Victoria Street West, Private Bag 92028, Auckland, New Zealand
“Agile ways-of-working have improved our speed to market and customer focus, and we have seen a significant increase in both customer and people engagement during this time. Our sustained network investment has underpinned our ability to innovate and grow and provided secure connectivity for our country during COVID-19. “It is a credit to Spark’s people that we have delivered such a strong result, with growth on nearly all key metrics, despite the impact of COVID-19 in the final quarter. “We are now faced with a more uncertain economic climate, and we will continue to be challenged as a country, as a business and as individuals to adapt to the challenges COVID-19 brings. Our long term focus on simplifying and digitising our customer experiences, supporting digital transformation in the business community, and transitioning New Zealand off legacy systems to modern technologies, is more relevant now than ever before and we are ready to play our role in supporting New Zealand’s economic recovery.” Spark moved quickly to mitigate the impacts of COVID-19 while maintaining its strong market momentum coming out of the first half. Spark CEO Jolie Hodson said: “It is fair to say this will be a year remembered more for the last quarter than the first three, and it is a testament to the agility and commitment of our people that we were able to adapt quickly, support our customers and deliver what we said we would in a challenging environment. “Our customers were quick to take up our new Endless data mobile plans, which contributed to mobile service revenue growth that outperformed the market. We grew wireless broadband connections by 16,000, however our aspirations are higher – and with the continued strong performance of our network during COVID-19 we have the confidence to accelerate this further in FY21. “At a time when having an internet connection is more essential than ever before, we have leaned in and accelerated the rollout of our not-for-profit broadband product Skinny Jump – connecting more than 4,500 additional homes since COVID-19 hit. “We are now entering a more challenging period as a country, and we expect the impact of COVID-19 to be more material in FY21. The recent return to Alert Level three in Auckland and Alert Level two more broadly has reminded us that this challenge is not behind us, and we moved quickly to lift broadband data caps for our customers once again. We know it is vital for New Zealand that we continue to invest in smart infrastructure during this time, and we are focussing our FY21 capital expenditure on supporting New Zealand’s economic recovery, including through the rollout of 5G and investment in rural connectivity. “We will continue to take a disciplined approach to cost management, ensuring we have the flexibility to respond as economic conditions change.” Spark confirmed FY21 EBITDAI guidance of $1,090 million to $1,130 million and a FY21 dividend of 23-25c per share, 100% imputed. The details of Spark’s next three-year strategy will be shared at an Investor Briefing on 16 September 2020. The evolved strategy will build on the momentum and foundational capabilities Spark has established through the successful execution of its current strategy.
For
per
sona
l use
onl
y

Spark New Zealand Limited ARBN 050 611 277 Spark City, 167 Victoria Street West, Private Bag 92028, Auckland, New Zealand
Authorised by: Alastair White GM Capital Markets
- ENDS –
Media queries: Investor queries: Leela Gantman Alastair White Corporate Relations Director GM Capital Markets +64 (0) 27 541 6338 +64 (0) 21 228 3855
For
per
sona
l use
onl
y

Results announcement (for Equity Security issuer/Equity and Debt Security issuer)
Results for announcement to the market
Name of issuer Spark New Zealand Limited
Reporting Period 12 months to 30 June 2020
Previous Reporting Period 12 months to 30 June 2019
Currency NZD – New Zealand Dollar
Amount (000s) Percentage change
Revenue from continuing operations
$3,623,000 2.5%
Total Revenue $3,623,000 2.5%
Net profit/(loss) from continuing operations
$427,000 4.4%
Total net profit/(loss) $427,000 4.4%
Final Dividend
Amount per Quoted Equity Security
NZD$0.12500000 (comprised only of an ordinary dividend)
Imputed amount per Quoted Equity Security
NZD$0.04861111
Record Date 18 September 2020
Dividend Payment Date 2 October 2020
Current period Prior comparable period
Net tangible assets per Quoted Equity Security
As at 30 June 2020
NZD$0.29
As at 30 June 2019
NZD$0.26
A brief explanation of any of the figures above necessary to enable the figures to be understood
The change in Spark’s earnings before finance income and
expense, income tax, depreciation, amortisation and net
investment income (EBITDAI) is provided in the addendum.
Authority for this announcement
Name of person authorised to make this announcement
Stefan Knight, Finance Director (CFO)
Contact person for this announcement
Alastair White, GM Capital Markets
Contact phone number +64 (0) 21 228 3855
Contact email address [email protected]
Date of release through MAP 26 August 2020
Audited financial statements accompany this announcement.
For
per
sona
l use
onl
y

Addendum:
Amount (000s) Percentage change
Earnings before finance income and expense, income tax, depreciation, amortisation and net investment income (EBITDAI)
NZD$1,113,000 2.1%
For
per
sona
l use
onl
y

Distribution Notice
Section 1: Issuer information
Name of issuer Spark New Zealand Limited
Financial product name/description Ordinary shares
NZX ticker code SPK
ISIN (If unknown, check on NZX website)
NZ TELE0001S4
Type of distribution
(Please mark with an X in the
relevant box/es)
Full Year X Quarterly
Half Year Special
DRP applies Yes
Record date 18 September 2020
Ex-Date (one business day before the Record Date)
17 September 2020
Payment date (and allotment date for DRP)
2 October 2020 AUST & NZ;
13 October 2020 USA
Total monies associated with the distribution
NZD $229,630,618
(1,837,044,943 shares @ $0.125 per share)
Source of distribution (for example, retained earnings)
Retained earnings
Currency NZD – New Zealand Dollar
Section 2: Distribution amounts per financial product
Gross distribution NZD$0.17361111
Gross taxable amount NZD$0.17361111
Total cash distribution NZD$0.12500000
Excluded amount (applicable to listed PIEs)
N/A
Supplementary distribution amount NZD$0.02205882
Section 3: Imputation credits and Resident Withholding Tax
Is the distribution imputed Fully imputed
Partial imputation
No imputation
If fully or partially imputed, please state imputation rate as % applied
28%
Imputation tax credits per financial product
NZD$0.04861111
Resident Withholding Tax per financial product
NZD$0.00868056
For
per
sona
l use
onl
y

Section 4: Distribution re-investment plan
DRP % discount (if any) 2%
Start date and end date for determining market price for DRP
17 September 2020 23 September 2020
Date strike price to be announced (if not available at this time)
23 September 2020
Specify source of financial products to be issued under DRP programme (new issue or to be bought on market)
New Issue
DRP strike price per financial product
Last date to submit a participation notice for this distribution in accordance with DRP participation terms
21 September 2020
Section 5: Authority for this announcement
Name of person authorised to make this announcement
Stefan Knight, Finance Director (CFO)
Contact person for this announcement
Alastair White, GM Capital Markets
Contact phone number +64 (0) 21 228 3855
Contact email address [email protected]
Date of release through MAP 26 August 2020
For
per
sona
l use
onl
y

Annual Report 2020
Now more than ever.
For
per
sona
l use
onl
y

COVID-19 has challenged so much of what Kiwis have always held dear. This year, suddenly separated from the daily interactions that we treasure, we did what we’ve never done before: we discovered new and powerful ways to stay connected digitally with those who matter to us. We kept our distance, and yet we seemed more together as a nation than many other parts of the world.
Spark New Zealand Annual Report 2020 Connections matter
Helping Kiwis stay connected during COVID-19.
For
per
sona
l use
onl
y

1
During lockdown we have been reminded that as a ‘lifeline utility’ the role we play in keeping people connected is incredibly important. For most Kiwis, almost every interaction with the outside world has been enabled by a phone or internet connection. COVID-19 has been the biggest test of our infrastructure as Kiwis moved to work, learn and be entertained at home. Years of sustained investment to build capacity into our network has meant that New Zealand has been well served at a time when telecommunications services truly became an essential service.
1Connections matterSpark New Zealand Annual Report 2020
For
per
sona
l use
onl
y

As New Zealand went into lockdown our wireless broadband network traffic increased by
40%with more than 17,000 terabytes of data used in total. Calling volumes on mobile increased by 60% at peak, and Kiwis benefited from over 7,200 terabytes of free data to work, learn and connect from home.
We worked with our business and enterprise customers to
rapIDly expanDand enable secure remote working capability through IT solutions and collaboration tools.
We helped our customers
stay COnneCteDby removing data limits on capped broadband plans, waiving late payment fees and not terminating services for those experiencing financial hardship.
2
Spark New Zealand Annual Report 2020 Connections matter
For
per
sona
l use
onl
y

To meet customer needs we
aDDeD extra CapaCIty to 14 cell sites around the country and deployed six ‘cell sites on wheels’ (COWs) to further expand capacity in locations that were experiencing high network loading. These efforts resulted in speed increases of between 70% and 160% for these locations.
Our teams adapted quickly to repurpose 39 retail stores as Emergency Distribution Centres to provide hardware to customers with urgent needs.
1,000retail, call centre and Business Hub team members were set up with ‘at-home kits’ to help our customers remotely.
Over
We’ve been doing our bit to help bridge the digital divide since 2016, when we first launched
JUMpour ‘not-for-profit’ broadband service. Since the relaunch of the programme in March 2020 the reach of Jump has almost doubled to connect 9,559 homes by the end of FY20. This was achieved during COVID-19 by working in partnership with community organisations, and with the Ministry of Education to connect households with school-aged children around the country who didn’t have an internet connection at home to ensure as many kids could participate in distance learning as possible.
3Connections matterSpark New Zealand Annual Report 2020
For
per
sona
l use
onl
y
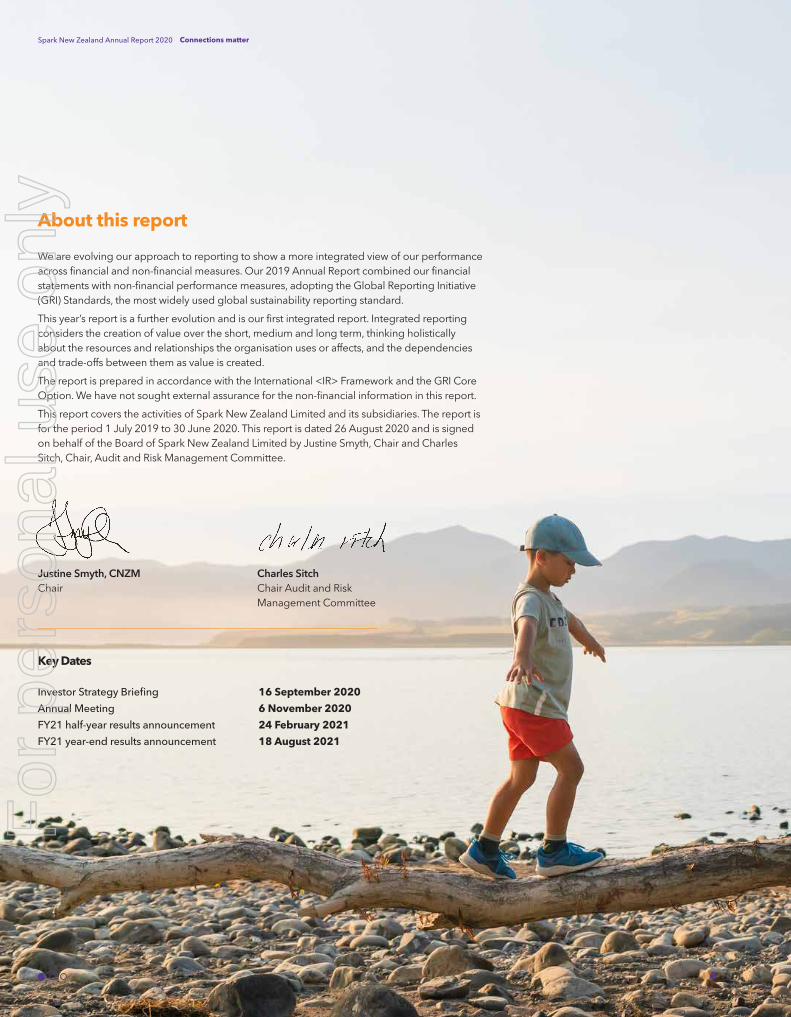
We are evolving our approach to reporting to show a more integrated view of our performance across financial and non-financial measures. Our 2019 Annual Report combined our financial statements with non-financial performance measures, adopting the Global Reporting Initiative (GRI) Standards, the most widely used global sustainability reporting standard.
This year’s report is a further evolution and is our first integrated report. Integrated reporting considers the creation of value over the short, medium and long term, thinking holistically about the resources and relationships the organisation uses or affects, and the dependencies and trade-offs between them as value is created.
The report is prepared in accordance with the International <IR> Framework and the GRI Core Option. We have not sought external assurance for the non-financial information in this report.
This report covers the activities of Spark New Zealand Limited and its subsidiaries. The report is for the period 1 July 2019 to 30 June 2020. This report is dated 26 August 2020 and is signed on behalf of the Board of Spark New Zealand Limited by Justine Smyth, Chair and Charles Sitch, Chair, Audit and Risk Management Committee.
Key Dates
Investor Strategy Briefing 16 September 2020
Annual Meeting 6 November 2020
FY21 half-year results announcement 24 February 2021
FY21 year-end results announcement 18 August 2021
About this report
Justine Smyth, CNZM Chair
Charles Sitch Chair Audit and Risk Management Committee
Spark New Zealand Annual Report 2020
4
Connections matter
For
per
sona
l use
onl
y

Connections matterHow we create value 6
About Spark 8
Spark performance snapshot FY20 9
Chair and CEO review 10
Our performance 14
Our customers 16
Our network and technology 22
Our people 26
Our environment 32
Our communities 36
Our Board 40
Our Leadership Squad 44
Our governance and risk management 46
Our suppliers 49
Leadership and Board remuneration 50
Financial statementsFinancial statements 53
Notes to the financial statements 58
Independent auditor’s report 98
Other informationCorporate governance disclosures 103
Managing risk framework roles and responsibilities 112
External initiatives and membership of associations 113
Material issues 114
Global Reporting Initiative (GRI) content index 115
Glossary 117
Contact details 118
Contents
5Connections matterSpark New Zealand Annual Report 2020
For
per
sona
l use
onl
y

How we create value
WHAT WE RELY ON
Social capital
Our customersConsumers and organisations that are enabled by our products and services
A culture that develops and empowers
our people
OUR BUSINESS MODEL
Āwhinatia ngā tāngata katoa o Aotearoa kia matomato te tipu i te ao matihiko.
TO HELP
WIN BIG IN A DIGITAL WORLD
Our ValuesWhakamana, We Empower
Matomato, We Succeed TogetherTūhono, We Connect
Māia, We are Bold
Financial capital
Financial capitalEquity, debt and cash generated through our operations
Manufactured + intellectual capital
Our network and technologyOur mobile sites, data networks, systems, processes and digital services capability
Human + intellectual capital
Our peopleSkilled, specialised and diverse workforce that is the heart of our business
Natural capital
Our environmentEnergy, materials and impacts of our operations
Social + human capital
Our communitiesOur communities around New Zealand and the communities across our global supply chain
6
Spark New Zealand Annual Report 2020 How we create value
For
per
sona
l use
onl
y

OUTPUTS FY20
OUTCOMES ON PAGES 8, 9 AND 13
Investment in resilient, adaptable infrastructure for New Zealand’s future
Innovation to create value for Spark and
our customers
Providing leading products and services that connect and
enable New Zealanders
Enhanced network and technology• Resilient network through COVID-19• 40% increase in wireless broadband traffic• 60% increase in mobile calling at peak• 5G rollout under way
Supporting our customers’ own business models and their value creation for New Zealand
Connected customers• 2.519 million mobile connections• 709,000 broadband connections• Increase in customer interaction Net
Promoter Score• Customers supported to adapt to COVID-19
Financial returns• $3,623 million operating revenues and other gains• $427 million net earnings• 25 cents per share dividend
Engaged workforce• Positive growth in employee
Net Promoter Score• 50/50 gender split on Board and
Leadership Squad• Investment in training
Environmental impact• Net emissions 26.9 kilotonnes CO2 -e• 501 tonnes e-waste recovered• 24,900 mobiles re-used/recycled
Supported communities• Skinny Jump reaching 9,559
high-need households• 501 employee volunteer days
7Connections matterSpark New Zealand Annual Report 2020
For
per
sona
l use
onl
y

Spark New Zealand Annual Report 2020
Spark is New Zealand’s largest telecommunications and digital services company. Our customers range from consumers and households to small businesses, government and large enterprises. Across all our services – mobile, broadband, cloud services, digital services and entertainment – we have relevance for almost every New Zealander.
98%of New Zealanders reached by our 4G network
709Kbroadband connections
2.519Mmobile connections
5,224New Zealand employees
66Retail Stores
26Regional Business Hubs
Brands and businesses
Fibre Transport Network
Data Centres
Earth Station Satellite Link
Corporate Offices
Tasman Global Access Cable
Connections to Australia
Connection to USA
Southern Cross Cable
IT infrastructure and cloud services
Business telecommunications
provider
Big-data analytics business
Pre-pay mobile and broadband
Cloud consulting and Business
Transformation
Sports streaming service
Digital trust and verifiable data
About Spark
8
Spark New Zealand Annual Report 2020 About Spark
For
per
sona
l use
onl
y

1 Earnings before finance income and expense, income tax, depreciation, amortisation and net investment income (EBITDAI) and capital expenditure are non-Generally Accepted Accounting Practice (non-GAAP) measures. These measures are defined and reconciled in note 2.5 of the financial statements. Capital expenditure excludes spectrum additions of $13 million.
2 Interaction Net Promoter Score, a measure of customer engagement.3 Net Promoter Score, a measure of employee engagement.
Spark performance snapshot FY20
Operating revenues and other gains
$3,623M 2.5%
EBITDAI1
$1,113M 2.1%
Net earnings
$427M 4.4%
Mobile revenue
$1,288M 1.3%
Broadband revenue
$680M -0.7%
Cloud security and service management revenue
$443M 10.8%
Voice revenue
$391M -11.3%
Capital expenditure1
$374M -10.3%
Employee NPS3
+66 25 points
Consumer and small business iNPS2
+33 10 points
9Connections matterSpark New Zealand Annual Report 2020
For
per
sona
l use
onl
y

We got off to a fast start, delivering the strongest first half results in recent years. Revenues increased 4.0%, and we had a standout performance in mobile – capturing 90% of total market growth in high-margin service revenue, an increase of 5.5% on the prior year. Revenues also benefited from cloud, security and service management growth, the introduction of Spark Sport and a moderation in the rate of legacy voice declines as fixed-line voice becomes a smaller part of the business.
It is fair to say, however, that this year will be remembered more for the last quarter than the first three. When our country first faced one of the greatest health and economic challenges of our lifetimes, the way New Zealanders work, learn and connect changed dramatically overnight. For Spark, COVID-19 highlighted more than ever before the importance of our purpose – to help all New Zealanders win big in a digital world. At a time when a phone or internet connection is a lifeline to the outside world, and a pre-requisite to continue working and studying, we have been reminded just how much connections matter, and of the critical importance of the services we provide for our customers and our country.
Responding to COVID-19Like many businesses we had to walk two paths simultaneously – responding to the situation in front of us, protecting our people and mitigating the immediate impact on our business, while planning for multiple potential futures.
The health and safety of our people was paramount, and we moved early to put in place appropriate protocols to reduce people movement, adhere to physical distancing requirements and to uphold strict hygiene standards. We identified team members who were more vulnerable to COVID-19 and worked with them to keep them safe.
As a lifeline utility we must maintain critical services during emergency situations, including all COVID-19 alert levels. To ensure we were able to do this we put additional protections in place to keep our critical services team members separated from our broader workforce, including our 111 team and Network Operations Centre. Our technology team monitored our network continually and increased capacity wherever it was needed – including 14 cell-site upgrades and the deployment of six ‘cell sites on wheels’ (COWs). Following years of sustained investment our network performed exceptionally well, despite our wireless broadband network traffic increasing by 40% and calling volumes on mobile increasing by 60% at peak during the lockdown.
We moved quickly to support our customers and communities, recognising how important our services were during these exceptional circumstances.
To ensure customers could stay connected we removed data limits on capped broadband plans, waived late payment fees, suspended disconnections, and put in place special measures for customers experiencing financial hardship. Our customers benefited from over 7,200 terabytes of free data to work, learn and connect from home.
Tēnā koutou.
We started FY20 with a clear focus – delivering what we said we would in the final year of our three-year strategy and setting a path for the next three years, to take Spark into the future.
Connections matter
10
Spark New Zealand Annual Report 2020 Chair and CEO Review
For
per
sona
l use
onl
y

We also set up Emergency Distribution Centres to support customers with essential equipment needs, repurposing 39 retail stores across the country. Over 1,000 of our retail, call centre and Business Hub team members transitioned rapidly to new ways of working by supporting our customers from home. We worked in partnership with our business and enterprise customers to enable them to make the same shift, expanding and enabling secure remote working capability through IT solutions and collaboration tools.
The rapid shift from physical to digital also highlighted issues of digital equity and inclusion, one of our long-term focus areas. Since we launched Jump, our not-for-profit broadband service, in 2016, it had grown through our network of community partners to support 5,000 households across New Zealand. Since COVID-19 hit we have almost doubled the reach of Jump to connect another 4,500 homes. This included working with the Ministry of Education to support homes with school-aged children around the country who didn't have an internet connection, ensuring they could continue to participate as schools switched to digital learning.
A strong FY20 result in a challenging contextOur focus on delivery and execution of our strategy, our strong half-year performance, and the timing of COVID-19 impacts in the last quarter of the financial year meant we were well placed to adapt and respond to the impact of the pandemic on our business.
Justine Smyth, Chair and Jolie Hodson, Chief Executive
As a result, we delivered earnings above the mid-point of our financial guidance range and continued to pay shareholders a dividend.
Operating revenues and other gains grew 2.5%, or $90 million, with standout performances in mobile service revenue, and cloud, security and service management. Coupled with our continued focus on cost management, this resulted in a 2.1% growth in EBITDAI to $1,113 million.
The effects of COVID-19 did have an impact on our financial performance, predominantly through the loss of higher-margin roaming revenues, retail revenue reductions due to store closures, removing broadband data overage charges, and our Spark Sport platform being offered free of charge while live sport was suspended globally. At the same time we saw an increase in the demand for collaboration products to support the shift to working from home. Overall COVID-19 had a total negative EBITDAI impact of approximately $25 million in FY20.
A continued focus on tight cost management mitigated these impacts and enabled us to invest in current and future growth initiatives, which ultimately saw our total operating costs increase by $67 million or 2.7%. In FY20 these investments included the launch of cloud and business transformation consultancy Leaven, the growth of Spark Sport, the acquisition of NOW Consulting as part of data analytics business Qrious and the launch of emerging technology business, Mattr.
Over the year we also tightened our focus on our core business by completing the divestment of Lightbox and CCL’s network assets and the successful integration of our cloud and ICT businesses Revera and CCL.
Our EBITDAI growth was partly offset by higher interest costs due to increased debt and lower investment income as Southern Cross dividends ceased. Our taxation expense reduced by $20 million (11.8%) due to the Government reinstatement of tax depreciation deductions on buildings and a higher portion of non-taxable other gains. As a result, net earnings were $427 million, up 4.4%.
11Connections matterSpark New Zealand Annual Report 2020
For
per
sona
l use
onl
y

Closing out our three-year strategyThis year marks the completion of our three-year strategy. This was a bold strategy to transform our business. We moved to Agile ways-of-working, which has improved our speed to market and customer focus, and our employee Net Promoter Score, which measures engagement, has risen year on year. We have grown market share and mobile services revenues while maintaining our focus on cost discipline. And we have diversified our business from traditional telecommunications services to operate as an end-to-end digital services company.
This hard work has translated into improved customer experiences. Our customer engagement scores for consumers and small businesses, measured in interaction NPS, rose 10 points over the year. This is supported by a reduction in the number of customers needing to contact us to troubleshoot issues, and an increase in the use of online support channels.
We invested in our network and our technology, re-engineering our IT stack and investing for capacity over a sustained period, which has built a point of competitive advantage. We launched 5G wireless broadband services in heartland New Zealand, and we are poised for a
national rollout of both wireless broadband and mobile 5G services, enabled by the allocation of 5G spectrum announced in May 2020.
The rollout of 5G will support wireless broadband uptake, as the network delivers greater capacity and speeds over time. 5G will be a big part of how we will continue to create a wireless future for New Zealand.
Looking to the future – our next three-year strategyWe were due to launch our next three-year strategy to the market in April. However given the COVID-19 situation we needed to pause and review. We will now share our strategy on 16 September 2020.
Trends that have shaped our thinking for some time now are accelerating due to the disruption of COVID-19, including the acceleration of consumer services from physical to digital, the increasing pace of business transformation and digitisation, the exponential customer demand for data, and the greater emphasis being placed on connectivity as a basic social need. The recent return to Alert-Level 3 in Auckland, and Alert-Level 2 for the rest of the country, has reminded us that the immediate challenge of COVID-19 is not behind us. However, there is also a longer-term opportunity for
New Zealand to accelerate its own digital transformation, and rebuild for a future that is more connected, productive and sustainable.
While we are operating in more uncertain times and preparing for a more challenging year ahead of us, we believe we are well positioned for the ‘new normal’ we find ourselves in. We have a strong balance sheet, a leading network, a diversified business and an agile team.
Our next three-year strategy will be an evolution of our current direction, building on the momentum of the prior three years and the evolving trends shaping our markets. It will be focused on a set of core capabilities that will underpin our continued strong performance in our key markets and in new markets where we see significant opportunity for growth, such as digital health and the Internet of Things (IoT).
Sustainability and our role in economic recoveryAs New Zealand responds to COVID-19 sustainability will remain a core focus for our business. Rebuilding our economy will take concerted and coordinated effort. The country will be looking for leadership from businesses with the scale to make a difference.
As such we have reviewed and refined our approach to sustainability and updated our
Macro trends are accelerating
A seismic shift of business and society from physical to digital.
An unprecedented recessionary event requiring a period of nation
building and a focus on affordability.
Exponential growth in data – data is the future currency.
Increasing pace of technology disruption and business transformation.
Greater emphasis on connectivity as a basic social need.
Explosion of connected devices.
$
12
Spark New Zealand Annual Report 2020 Chair and CEO Review
For
per
sona
l use
onl
y

framework to reflect this new context and opportunity. A key focus is on our own sustainability, so that we can then support New Zealand’s recovery and economic transformation. The principle of equity is at the heart of our approach, and we remain committed to working in partnership to make a positive contribution to digital equity and to continue our focus on diversity and inclusion.
Sustainability will be integrated into our new strategy as a key pillar, A positive digital future for all of New Zealand. This sits alongside the work of the Spark Foundation and Te Korowai Tupo – our Māori strategy. We recognise that how we work will be critical. We will work in partnerships based around shared values, underpinned by the principles of kaitiakitanga and manaakitanga.
Thank youWe are both personally very proud of how Spark has responded to the challenges of FY20 and, most importantly, how we have focused on supporting our customers at a time when connections mattered more than ever. This would not have been possible without the dedication and hard work of our own team of five thousand, who modelled our values and never lost sight of our purpose under challenging circumstances.
We would also like to thank our investors, customers and partners for their continued support of Spark.
Noho ora mai
We will work alongside New Zealand to harness the power of technology and create a positive digital future for all.
• Invest in the capabilities of our people, equipping them to thrive in a digital future
• Reduce our footprint and meet our emissions target of -25% by 2025, investing in our fleet and infrastructure
• Be responsible, transparent and accountable for our social and environmental performance
• Focus our infrastructure investment on supporting New Zealand’s recovery and transformation
• Support Kiwi businesses to adapt to become more productive, resilient and sustainable through technology
• Support New Zealanders to upskill and adapt to new ways of working
• Extend the reach of Skinny Jump target to benefit more households – 20,000 by June 2021
• Partner alongside the Spark Foundation to address barriers to digital equity, including access, skills, trust and motivation
• Champion diversity and inclusion in our business and our communities
FOR ALL OFA POSITIVE
DIGITAL FUTURE
Be bold in our business to have a positive impact on our communities and the environment.
Create a Sustainable Spark
Economic Recovery and Transformation
Help New Zealand transform to a high-productivity, low-carbon economy.
Champion Digital Equity
Champion digital equity so all New Zealanders have the opportunity to thrive in a digital future.
Our new sustainability framework
Justine Smyth, CNZM Chair
Jolie Hodson Chief Executive
13Connections matterSpark New Zealand Annual Report 2020
For
per
sona
l use
onl
y

Our performance
Operating revenues and other gains
• Mobile service revenue growth of $32 million, or 3.9%, was driven by strong pay-monthly connection growth, up 79,000, or 6.3%, combined with increased adoption rates of our Endless plans2. Strong mobile service revenue growth in H1 FY20 of $22 million, or 5.5%, moderated in H2 FY20 to $10 million, or 2.4%, as a result of COVID-19 impacts, such as reduced roaming revenues.
• Cloud, security and service management revenue growth of $43 million, or 10.8%, was due to increased penetration of core cloud services and the ongoing shift of customers to more flexible and future-proofed cloud-based IT models, combined with the onboarding of new contracts.
• Procurement and partners revenue growth of $43 million, or 11.8%, was due to strong sales of software and hardware.
• Voice revenue declines due to a combination of connection loss and substitution moderated in FY20 to $50 million, or 11.3%, as voice revenue becomes a smaller part of the business, combined with increased conferencing and 0800 calling during the COVID-19 lockdown period.
• Other operating revenue grew $16 million, or 14.0%, largely due to strong contributions in our Spark Sport and Qrious growth businesses.
$ M
ILLI
ON
MO
BIL
E
BR
OA
DB
AN
D
VO
ICE
CLO
UD
, SE
CU
RIT
YA
ND
SE
RV
ICE
MA
NA
GE
ME
NT
PR
OC
UR
EM
EN
T A
ND
PA
RTN
ER
S
MA
NA
GE
D D
ATA
,N
ETW
OR
KS
AN
D S
ER
VIC
ES
OTH
ER
OP
ER
ATI
NG
RE
VE
NU
ES
AN
D O
THE
R G
AIN
S
FY20FY19
400
600
800
1,000
1,200
1,400
200
0
500
1,000
1,500
2,000
$ M
ILLI
ON
FY20FY19
PRODUCTCOSTS
LABOUR OTHER
Operating expenses
• Product costs increased $33 million, or 2.1%, broadly in line with revenue trends, with higher costs associated with cloud, security and service management, procurement and partners and Spark Sport content, being partly offset by lower mobile handset costs and voice product costs.
• Labour costs have increased $36 million, or 7.6%, due to increased investment in support of revenue growth in areas such as Cloud, and wage inflation. The portion of labour costs expensed following a shift in focus to optimising existing products instead of large capital programmes also drove an increase. The increase was partly offset by reduced labour costs in other parts of the business as legacy products shrink and interactions move to digital.
• Other operating expenses were broadly flat year-on-year, with lower marketing expenses being largely offset by an increase in bad debt provision levels, as a result of the economic impact of COVID-19.
Other
• Net investment income was $13 million lower largely due to no Southern Cross dividends in FY20 as expected.
• Depreciation and amortisation was $15 million lower for property, plant and equipment and intangibles and $17 million higher for right-of-use assets and leased customer equipment assets.
• Net finance expense increased by $10 million due to the increase in average debt during the year.
• Tax expense decreased by $20 million primarily due to depreciation allowances being reintroduced for commercial building structures, as part of the assistance package offered by the Government on 25 March 2020 and a higher proportion of non-taxable gains.
1 EBITDAI is a non-Generally Accepted Accounting Practice (non-GAAP) measure and is not comparable to the New Zealand Equivalents to International Financial Reporting Standards (NZ IFRS) measures. This measure is defined in note 2.5 of the financial statements.
2 Endless plans are Spark’s mobile plans with unlimited calling minutes, unlimited SMS and an allowance of data to use at the maximum available speed, after which they are able to continue using mobile data but at a reduced speed.
0
100
200
300
400
500
NET INVESTMENTINCOME
DEPRECIATION AND AMORTISATION
NET FINANCEEXPENSE
TAXEXPENSE
$ M
ILLI
ON
FY20FY19
EBITDAI1
$1,113M 2.1%
$3,623M up 2.5% year-on-year
$2,510M up 2.7% year-on-year
Net earnings
$427M 4.4%
• Other gains of $35 million, up $20 million from FY19, were generated from the divestments of CCL’s network asset business and Lightbox, the sale of surplus mobile network equipment and a fair value gain on exchange of spectrum.
14
Spark New Zealand Annual Report 2020 Our performance
For
per
sona
l use
onl
y

1 Capital expenditure is a non-GAAP measure and is defined in note 2.5 of the financial statements.
Cash flows Operating cash flows
• Operating cash flows increased by $126 million primarily due to higher receipts from customers, which is consistent with operating revenues and other gains for FY20 offset slightly by no Southern Cross dividend receipts in FY20.
• Investing cash outflows were relatively consistent with the prior year.
• Financing cash outflows increased by $141 million as less borrowing was required to support the dividend payments.
Key capital expenditure projects for the year included:
• Continued mobile network investment, including the deployment of 5G technology, increased capacity and coverage for wireless broadband and the introduction of Spark’s sports streaming offering;
• IT systems investment included lifecycle investment and licensing for internal IT systems, enhancements to products and IT systems to improve customer experience and the implementation of the Spark Sport platform;
• Plant, fixed network and core sustain included investment in the fibre build programme, Optical Transport Network (OTN), fixed network broadband and Carrier Ethernet expansions to meet customer demand for services and traffic growth across the network (including the impact of introducing sports streaming). Various investments in Spark properties were also carried out, including the fit-out of Spark Square in Christchurch; and
• Continued investment in the converged communication network (CCN), which will replace the legacy PSTN network, and will enable us to deliver IP-based voice services in the future.
This excludes non-cash spectrum additions of $13 million.
750770790810830850870890910930950970
$ M
ILLI
ON
RE
CE
IPTS
FRO
M C
UST
OM
ER
S
FY1
9
RE
CE
IPTS
FRO
M IN
TER
EST
RE
CE
IPTS
FR
OM
DIV
IDE
ND
S
PAY
ME
NTS
TO
SUP
PLI
ER
S A
ND
EM
PLO
YE
ES
PAY
ME
NTS
FO
RIN
CO
ME
TA
X
PAY
ME
NTS
FO
RIN
TER
EST
ON
DE
BT
PAY
ME
NTS
FO
RIN
TER
EST
ON
LE
ASE
S
PAY
ME
NTS
FO
R IN
TER
EST
ON
LE
ASE
D C
UST
OM
ER
EQ
UIP
ME
NT
ASS
ETS
FY2
0
$903M up 16.2%
Dividends per share
25.0 centsNo change
Earnings per share
23.2 cents 4.0%
$374M down 10.3% 10.3% (FY19 11.8%)
Capital expenditure1 Capital expenditure to operating revenues
CLOUD CCNCABLE AND CAPACITYIT SYSTEMSMOBILE NETWORKSPLANT, FIXED NETWORK AND CORE SUSTAINOTHER
$65M
$11M $24M $18M $11M
$116M
$129
M
2020 2019
YEAR ENDED 30 JUNE $M $M
Net cash flows from operating activities 903 777
Net cash flows from investing activities (411) (426)
Net cash flows from financing activities (493) (352)
Net cash flows (1) (1)
CLOUD CCNCABLE AND CAPACITYIT SYSTEMSMOBILE NETWORKSPLANT, FIXED NETWORK AND CORE SUSTAINOTHER
$65M
$11M $24M $18M $11M
$116M
$129
M
15Connections matterSpark New Zealand Annual Report 2020
For
per
sona
l use
onl
y

Our customers
+33 pOIntsConsumer and small business interaction Net Promoter Score (iNPS)
We have supported our customers through COVID-19 by setting up our
retail teams with at-home kits to work virtually from their own homes.
As New Zealand’s largest telecommunications and digital services company, we have relevance for almost every New Zealander. From mobile, broadband, cloud services, security, digital services and live sports streaming, we have customers ranging from individuals and households through to small businesses, government and large enterprises. We know that as we respond to COVID-19 and Kiwis embark on the journey to recovery, the essential services that we provide are more important than ever to support our customers to create value for themselves and others. This is a responsibility that we take seriously.
We want to help New Zealand recover from COVID-19 and transform to a high-productivity, low-carbon economy. Through the products and services we provide we connect, empower and support our customers to adapt and become more sustainable through technology.
Customer experienceOver the course of FY20 we continued our strategy of shifting customers towards digital self-service interactions to improve customer experience by making queries simpler and easier to resolve online. This has seen an 18% increase in the use of chat interactions, including the MySpark App, online chat and our chatbot Ivy. In the last 12 months the amount of interactions resolved through Ivy without being redirected to our customer care team (deflection rate) has grown by 10% and currently sits at 53% of all incoming chat requests – a great result from a bot that was originally pitched to deliver 27% deflection. A combination of initiatives has reduced our monthly care volumes (inbound calls and chat) from 330,000 to 237,000 interactions, a 28% reduction.
18%increase in the use of chat interactions, including the MySpark App, online chat and our chatbot Ivy.
We have increased our use of digital tools to keep customers informed throughout their customer journey while addressing complex issues. Through a focus on staffing and cross-skilling we have seen our call abandon rates more than halve. Calls being answered in a timely manner and having queries owned through to conclusion has helped deliver an increase of 10 points in iNPS (interaction Net Promoter Score – based on rating and feedback from customers after interaction with our team members) from consumer and small business customers in the last 12 months.
We continue to invest in our in-store experience with the opening of new stores in Dunedin and Whangarei and our Halo store in Newmarket. We look forward to our new Commercial Bay store opening in FY21.
16
Spark New Zealand Annual Report 2020 Our customers
For
per
sona
l use
onl
y

Spark delivers Rugby World Cup 2019 for New Zealand
In September, we brought Rugby World Cup 2019 (RWC) to New Zealand through streaming.
To prepare for the tournament we made significant upgrades to our infrastructure, to ensure we had the capacity in our network to deliver a great viewing experience. We recognised that many Kiwis were new to streaming, so we undertook a nationwide education campaign to get New Zealand ‘match fit’, including partnerships with local retailers to facilitate in-home set ups. We also extended access to the game beyond our online platform by setting up ‘Spark Sport for Schools’ in rural areas – a programme that provided free RWC Tournament Passes to schools to hold viewings for their local communities – and by providing all RWC matches via pubs and clubs across the country.
Not all New Zealanders were able to stream on-line. Our partnership with TVNZ enabled those customers to watch broadcast delayed covereage of every All Blacks game on TVNZ One, as well as other key matches live. We also worked with TVNZ on our contingency plan in the event of any technical difficulties.
This plan was activated when we experienced a technical issue during the first All Blacks match resulting in the game being simulcast on TVNZ Duke. An urgent investigation
identified the issue and our team worked to put a fix in place immediately. We apologised to our customers for the issue and provided a full or partial refund for those who were impacted. Our customer care teams also worked one-on-one with customers who were having issues with their in-home set-up, and in many instances conducted in-home visits to help resolve issues.
Introducing a new technology on a large scale brings its challenges – but as sports streaming is increasingly becoming the way sport and entertainment is delivered globally, we are pleased to have helped New Zealand to start the journey. And it’s fair to say we learnt a few things along the way ourselves.
We celebrated several milestones during RWC 2019:
• The All Blacks vs Ireland Quarter Final was the largest streamed sports event in New Zealand.
• The Wales vs France Quarter Final on 20 October set new Spark and Chorus data traffic records for each of their networks (a 40% increase on pre-RWC Sunday night traffic).
• New Zealanders had taken up just over 200,000 RWC subscriptions.
• Spark Sport streamed nearly six million hours of RWC content.
In June, in response to the disruption caused to our retail stores due to COVID-19, we launched New Zealand’s first virtual shopping experience providing a similar customer journey to a retail store. We also launched ‘Spark Studio’ – an innovative take on virtual appointments that redesigns our retail experience to allow our customers to connect with our expert team remotely. This is currently being concept tested and we hope to roll it out nationwide soon.
We continued to make significant strides towards a ‘unified frontline’ – where our customer care and retail teams can easily be cross-skilled and move between different channels depending on where our customer demand lies. This is good for our customers, and also builds the skills and capabilities of our team members. The onset of COVID-19 accelerated our pace when it impacted our call centre in the Philippines. In response our retail teams were set up to help with inbound voice and chat enquiries from their own homes – with 589 retail team members receiving at-home kits to help our customers virtually. They joined our call centre and Business Hub teams to create a team of over 1,000. Over the long term this approach will build teams that are skilled at supporting our customers through a number of face-to-face and virtual channels, building diversity in our business and the speed at which we can support our customers.
17Connections matterSpark New Zealand Annual Report 2020
For
per
sona
l use
onl
y

aggregator that manages these messages, and the relationship with the content provider, to block the messages. We also block access to the URL featured in the scam text to prevent customers inadvertently clicking on the link. We are working with the industry to strengthen our processes and further reduce the likelihood of our customers receiving such messages.
The most effective way to keep our customers safe is through education and awareness. We take any opportunity to empower our customers to be vigilant when it comes to scams and keeping their personal information safe. This includes providing comprehensive information about scamming on our website: www.spark.co.nz/help/scams-safety
We have also partnered with Netsafe to produce an educational scam call brochure to distribute to organisations such as Age Concern and retirement villages. We include reminders to stay vigilant in direct customer communications and share alerts to widespread scams on our social media channels. During the Alert-Level 4 lockdown we created a factsheet with tips on how to avoid scams while working from home, which we shared across our website and social media channels.
Cyber security
Cyber security is an important issue and we invest heavily in managing risks to protect our customers’ and our own data. We have one of New Zealand’s largest security teams made
up of qualified and experienced people working across engineering, analyst, operations and security assurance roles. Spark also provides security services for small, medium and enterprise organisations, including carrying out vulnerability assessments and providing managed security. We regularly test our systems and security capabilities and hold a number of industry recognised certifications that provide assurance to our customers on the strength and capability of our security abilities.
Products to support seniors
With over a million New Zealanders predicted to be aged 65 plus by 2032, it makes sense for Spark to provide solutions to address the needs of older customers. In July 2019, we announced two new products, Spark Gold Plans and Call Screen.
Spark Gold Plans
We introduced two pay-monthly mobile plans designed to meet the needs of those aged 65 years and over. Spark Gold Plans are only available to seniors, with a focus on excellent voice calling value over data, making one of the plans the most affordable advertised pay monthly mobile plan in the country at just $12.99 a month. More information on Spark’s Gold plans can be found on our website: www.spark.co.nz/shop/mobile-plans/gold-plans
Call Screen
The number of phone scam victims in New Zealand has continued to grow. Many are still losing thousands of dollars after falling victim to scammers. And as frequent landline users, many of those who have fallen victim have been seniors. In the past year we launched New Zealand’s first home phone with nuisance call blocking technology, Call Screen. Users can decide who they talk to by screening incoming calls, reducing the fear of becoming a victim of scammers. Most of the time scammers use robo-dialling software that automatically calls a series of numbers. An actual human scammer won’t be prompted until a person answers one of the calls. A scammer’s robo-dialling system isn’t sophisticated enough to leave a name, a requirement of the Call Screen technology. That means the call won’t connect and the home phone won’t ring in the first place.
Customer safetyProtecting customers from scams
Phone and email scams are an ongoing problem as scammers continue to evolve their approach in an effort to defraud Kiwis. We saw scammers use COVID-19 to take advantage of people while they worked from home.
We play an active role in limiting the amount of scam calls being received by our customers by monitoring unusual calling activity and having offending numbers blocked, as well as blocking those reported to us by customers. Where possible, our security and fraud teams work with law enforcement to identify and shut down scamming operations, but this is challenging when they are located offshore.
We are a member of the NZ Telecommunications Forum’s (TCF) Scam Prevention Code, which improves the process for the telecommunications industry to identify and share scamming information. Offending numbers are shared with members to be blocked across all networks. These measures make a scammer’s job more difficult and could deter them, however, sometimes they will continue using a different number.
We also work with the TCF to prevent customers receiving scam text messages. These are usually from four-digit numbers called ‘short codes’. When we identify illegitimate activity we work with the
We empower our customers to be
vigilant when it comes to online safety and
include comprehensive information and
education about scams on our website.
18
Spark New Zealand Annual Report 2020 Our customers
For
per
sona
l use
onl
y

Marketing and legal complianceUnder our Code of Ethics all Spark people are responsible for ensuring we behave ethically and comply fully with all applicable laws and regulations. Spark’s Legal and Compliance Policy sets out the specific accountabilities that our people have for complying with the law. Spark’s people leaders make sure their people have the information and training necessary to meet these standards, and our Legal and Digital Trust teams support our people with comprehensive frameworks, tools, training and advice. Every employee is required to complete online training modules on the Code of Ethics and how to apply it, and we reinforce this training through regular one-on-one and broader internal communication across the business. See: www.sparknz.co.nz/about/governance
Spark continues to engage constructively with the Commerce Commission as appropriate, both proactively and reactively, on a case-by-case basis. Spark did not receive any formal sanction by the Commerce Commission in FY20. We also had no complaints upheld by the Advertising Standards Authority over the past year.
Product recall
In August 2019 we announced a product recall of a power back-up device that had been issued to approximately 14,000 wireless landline phone customers during the previous four months. The power back-up had been included to ensure that wireless landlines would continue working for up to four hours in a power cut. The recall followed the discovery of a manufacturing fault in some power back-ups that could cause the
unit to overheat, leading to a fire risk. While we are unaware of any harm caused to our customers due to this issue, we made the decision to recall the device as our customers’ safety is paramount. In issuing the recall, we contacted all affected customers and took comprehensive steps to arrange alternative technology for them as required. Spark sent ongoing recall reminders to customers throughout the remainder of 2019 and has observed a very high return rate of the recalled units.
Customer privacy
Our customers, along with all New Zealanders, value their privacy and they trust that we will protect and manage information about them in a way that aligns with their expectations. We are committed to respecting customer privacy and the personal information entrusted to us by customers. It is also Spark’s focus to enable our customers to safely and easily manage their personal information. Providing transparency to customers about how we use and collect personal information is a key part of this.
Spark’s Privacy Policy sets out our commitment to our customers when it comes to handling their information. The policy sets out transparently what data we collect and how we use that data. In our policy we commit to handling all personal information appropriately in compliance with the Privacy Act 1993 and our customers’ expectations. We also set out customers’ rights and choices in respect to their personal information. See: www.spark.co.nz/help/other/terms/policies/privacy-policy
We are committed to respecting our customers’
privacy and the personal information they share with us.
All of our people are required to complete online privacy training and to treat customer information consistently with Spark’s Privacy Policy. This includes following Spark’s data governance processes and standards for the collection, use and disclosure of personal information and engaging with Spark’s privacy and security teams. We are reviewing our systems, processes and training to ensure compliance with the Privacy Act 2020 when it comes into force in December 2020.
In FY20 there were no complaints from the Office of the Privacy Commissioner, however it raised two minor operational matters that Spark is addressing.
We are implementing reporting capability that will enable us to report on substantiated complaints received from customers in the future. There were no significant customer data breach incidents in FY20 but in line with Spark’s commitment to transparency Spark did notify some data incidents to a small number of impacted customers as well as the Office of the Privacy Commissioner.
Customer terms and conditions
In FY20 we simplified our terms and conditions to make them easier for customers to understand. While the rights and obligations of Spark and our customers stayed the same, we restructured our terms and used clearer language. Spark customers were notified about the new terms and conditions on their bills throughout November 2019 and prepaid customers were sent an SMS with a link to the new terms and conditions. See: www.spark.co.nz/help/other/terms
19Connections matterSpark New Zealand Annual Report 2020
For
per
sona
l use
onl
y

We continued our affiliation with Pride Month through our documentary-style video fronted by gender non-conforming performer Gabriel, also
known as Princess, who demonstrated some of the employment challenges that members of the
LGBTQIA+ community faced.
We had our biggest ever Summer of Music, supporting some of the best and most exciting shows around the country, including Six60, Splore and Laneways. At Bay Dreams we launched Fan Studio, our photographic platform that gives Spark customers the chance to win prizes, which now sits outside Spark Arena. When COVID-19 decimated the local live music industry, we created content platforms for our customers through Spark Sessions, bringing Kiwis the best of New Zealand’s music scene straight into their living rooms.
Play by Spark was our initiative to help parents and kids find balance in their screen time usage. The advertisement campaign featured a heart-warming ‘breaking-up’ conversation between a young boy and his gaming avatar, that generated much-needed conversations online about striking the right balance between playtime and screen time.
Join Aleisha on a brand run by Kiwis,
for Kiwis.
For low-cost mobile and broadband
COL_SKI1123_ALEISKIWI_MAX_AK0009_03.indd 1COL_SKI1123_ALEISKIWI_MAX_AK0009_03.indd 1 17/03/20 6:21 PM17/03/20 6:21 PM
Spark had a huge year for brand and customer campaigns that continue to build an emotional connection with Kiwis.
Skinny had another busy year. After 18 months, the
successful ‘Famous Names’ brand campaign
came out of market. Utilising the brand’s
advocacy as a key strength, it was replaced
with a new platform called Skinny Friend-vertising.
This campaign was driven out of the insight that
everyone in New Zealand is connected to each other and aims to reach all Kiwis with an advertisement for
Skinny fronted by a person they know.
Bringing our brand to life
LITTLE CAN BE HUGE
PLAYTIME
BALANCE WITHSCREEN TIME
Get involved at spark.co.nz/play
SPK0995_Spark Play_OOH_4x6m AT10PC_v2.indd 1 24/10/19 2:09 PM
20
Spark New Zealand Annual Report 2020 Our customers
For
per
sona
l use
onl
y

Supporting New Zealand businessesThe Spark group had a busy year supporting our business partners and customers as they navigated an unprecedented year of disruption and recovery. Through our digital services expertise and network technology we helped them create value for their people and customers.
Wholesale
Our wholesale business continued to make progress in our growth products category. We continued to invest in new product capabilities across the Tasman Global Access (TGA) and Southern Cross (SX) cables, as well as corporate satellite, setting us up for future growth opportunities. We’ve also supported global Content Delivery Networks (CDNs) and cloud providers with their New Zealand co-location and connectivity requirements. During the Alert-Level 4 lockdown we supported our Service Providers (who were experiencing increased internet usage by their customers), by providing burstable domestic IP data free of charge. We also lifted data caps on wireless broadband plans resold by our Wireless Broadband partners.
Internet of Things (IoT)
In March we teamed up with Vector as the energy company moves to modernise the way energy consumption is measured in Kiwi homes and businesses. This deal has seen a significant number of Vector’s New Zealand-based advanced meters connected to Spark’s 4G-supported CAT M1 Internet of Things (IoT) network, with the ability to shift on to 5G connectivity as part of a multi-year rollout. While today’s networks have limits on the number of simultaneous connections, the capacity and reliability of 5G technology will see it underpin mass deployment of IoT. 5G is designed to support connected device densities of up to 1 million devices per square kilometre on a continual basis.
Leaven
In August we announced the launch of Leaven, a new cloud and digital transformation consultancy built to help organisations make the shift to new and more digital ways of working.
As the world transitions to a digital era, organisations are looking for smarter ways to turn their aspirations for digital transformation into action, embracing the capabilities of public cloud services to become more efficient, reduce cost and create new services. This was accelerated with COVID-19, where businesses looked to cloud-based offerings to help them scale, work flexibly and have remote access to their technology services.
Leaven focuses on cloud adoption, digital innovation and business transformation, and empowers its clients to embrace public cloud technology and new ways of working, supported by all-important governance and compliance requirements.
Since its launch, Leaven has delivered its portfolio of services to a growing number of clients, ranging from large corporate and public sector to smaller organisations looking to maximise the value they get from the cloud.
Qrious
Qrious, our data, analytics and AI business, has continued helping New Zealand organisations navigate the changing business environment, using data and critical insight. It’s been a huge year for Qrious, with the acquisition of NOW Consulting, being awarded ISO 27001 security certification, recognition by Inland Revenue (IRD) as an Approved Research Provider, as well as receiving the Snowflake 2020 Solution Partner of the Year (APAC) award. Qrious also launched its summer intern programme, which gave eight university students a rare opportunity to extend their skill-base and develop solutions for real-world problems through work experience in its Q.Lab Research Division.
CCL
Computer Concepts Limited (CCL) divested the operational parts of its network services division to a new business called Cello, formerly known as Octave. The decision is consistent with CCL’s shift to a simpler operating model following the brand merger with Spark’s wholly owned cloud business, Revera. CCL received the Strategic Partner of the Year award, recognising joint initiatives with CTP and Leaven at the Hewlett Packard
Enterprise (HPE) annual partner awards where Revera, now operating under the CCL brand, was also awarded Service Provider of the Year. In March, CCL and Microsoft announced a three-year strategic partnership to drive New Zealand business and public sector migration to Microsoft Azure cloud technologies.
Streaming servicesSpark Sport
Spark Sport kicked off with the start of the 2019-20 Premier League season in August, then, six months after launch, we brought New Zealand the Rugby World Cup 2019 via streaming.
Spark Sport also announced a six-year partnership with New Zealand Cricket as the official production and broadcast partner for all Blackcaps and White Ferns matches played in New Zealand.
When COVID-19 hit, major sports bodies were forced to cancel or postpone sporting events. As a result, we offered Spark Sport for no charge from mid-March until the end of June. While COVID-19 created challenges for all broadcasters carrying live sport it also significantly accelerated streaming connectivity in New Zealand homes. We now have a range of sports available on the platform, including rugby, football, cricket, tennis, motorsports, basketball, MMA, racing, boxing, golf, hockey, e-sports and athletics.
Lightbox
In December Spark announced it had entered an agreement for Sky Network Television Limited (Sky) to purchase its entertainment streaming business, Lightbox. This sale was completed in February and in June, Sky announced it was merging Lightbox with its Neon streaming service. Spark customers on selected broadband and Pay Monthly mobile plans continued to receive Lightbox “on us” until July 2020. Following this, Spark announced a partnership with Neon that allowed customers to trial the new service for three weeks and add Neon to their plans for a discounted rate of $9.95 per month.
21Connections matterSpark New Zealand Annual Report 2020
For
per
sona
l use
onl
y

Our network and technology
Our network and technology underpins our ability to help New Zealanders grow and stand strong in a digital world. This includes our mobile sites, data centres, networks, systems, processes and digital services capability. We create value for ourselves, our customers and our communities by investing in resilient, adaptable infrastructure for New Zealand’s future and the products and services that connect and empower New Zealanders.
Investing in our network infrastructure
Digital technology is becoming ever-more essential to how we work, learn and connect, and New Zealanders rely on it every day. We see significant year-on-year growth in data usage on our mobile network. Over the past two years we have invested heavily, enhancing capacity by approximately 80%. This included building over 150 new cell sites and the extensive rollout of 4.5G, which
significantly enhances network performance and capacity relative to conventional 4G.
COVID-19 was a test of the adaptability and resilience of our networks. During New Zealand’s 33-day Alert-Level 4 lockdown data usage on Spark’s broadband network resembled a seven-day weekend. Data usage each weekday was double the norm, and weekend peak usage was elevated further again. Even with volumes increasing to levels not seen before in New Zealand, the network performed very well.
Rolling out 5G
We launched our first 5G service in September 2019, with a number of business and consumer customers invited to trial high-speed 5G mobile broadband in Alexandra in Central Otago. We chose Alexandra as it has one of the highest uptake rates in the country for Spark’s existing wireless broadband product. In November
November 20195G wireless broadband live in Westport, Clyde, Twizel, Tekapo and Hokitika
The history of our network investment:
November 2013 Launch of 4G
June 2016Launch of 4.5G in Christchurch - 1.2Gbps
July 2016Launch of Wireless Broadband
June 20184.5G live in Queenstown
March 2018Outdoor trial of 5G in Wellington
April 2018Indoor demo of 5G reaching speeds of 18Gbps
December 2018 4.5G live in Taupo
June 201920% of Spark’s Broadband base wireless
August 20194.5G live in Spark sites across the country
September 2019 5G wireless broadband live in Alexandra November 2019
Spark 5G live on the water in Auckland Harbour for Emirates Team New Zealand
November 2019Announcement of Spark’s 5G rollout plans and network vendors
July 2020Start of wider 5G rollout commencing in Palmerston North
June 2020100th Rural Connectivity Group tower live
May 2020Announcement of allocation of 3.5 GHz spectrum to enable accelerated 5G rollout
22
Spark New Zealand Annual Report 2020 Our network and technology
For
per
sona
l use
onl
y

2019, we launched New Zealand’s first commercial 5G wireless broadband service into selected areas of five heartland communities – Westport, Clyde, Twizel, Tekapo and Hokitika.
In May 2020 the New Zealand Government offered Spark the management rights to 60 MHz of 3.5 GHz (or C Band) spectrum until 31 October 2022. The spectrum allocation was completed in July 2020 and enables a significant investment by Spark in 5G infrastructure across the country over the coming year, which will play a critical role in New Zealand’s response to, and recovery from, COVID-19.
The 3.5 GHz spectrum is crucial for the rollout of a full suite of 5G services. We plan to switch on 5G sites in a number of major centres and regions across the North and South islands over the next year. To maintain this momentum, we are keen to work with Government to accelerate the timeline for the longer-term spectrum auction, which is currently scheduled for November 2022.
We have continued with our multi-vendor strategy for our 5G rollout, using Nokia for our initial rollouts in Auckland and Palmerston North. We maintain an ongoing relationship with both Samsung and Huawei.
Electromagnetic fields (EMF) and health concerns
The rollout of 5G technology has raised community interest in electromagnetic fields (EMF) or radio waves and health. Misinformation across social media has caused confusion over the safety of the next-generation technology, resulting in the spread of dangerous and false theories linking 5G technology to COVID-19.
During the Alert-Level 4 lockdown there were a number of incidents of wilful damage to
5G starter fund
With the Government’s 5G spectrum allocation announced and businesses now operating in a changed world, Spark reshaped and relaunched its 5G Starter Fund with an added focus on transforming health and wellness for all New Zealanders.
The Fund was initially launched in March with a prize pool of $500,000 but was put on hold due to COVID-19. The Fund was relaunched at the end of May with an increased prize of $625,000 for up to four Kiwi businesses to develop 5G applications that can help to support New Zealand’s economic recovery. All winners will receive business and tech mentoring from industry leaders, as well as access to technology and equipment to test and build on Spark’s 5G network.
“New Zealand is in a unique position – its size, cultural make-up and creativity means Kiwi businesses have a global edge.
“It’s important, now more than ever, for companies to embrace the impact they can have in their own backyard, and on the world. As New Zealand responds to COVID-19 Kiwi entrepreneurs have an opportunity to use 5G to make a real difference to our future – those who will be successful will be passionate and willing to take a leap of faith, believing that their idea is the next big thing for New Zealand.”
Ido Leffler, Spark director and 5G Starter Fund panellist
New Zealand’s mobile networks, including several Spark cell towers. The vandalism resulted in damage to critical communications infrastructure during a time of national emergency, and in some cases resulted in short-term, localised outages.
Ensuring public confidence in the safety of mobile technology is important, and is potentially material to our capacity to invest and roll out improved network infrastructure.
We work individually and as an industry via the Telecommunications Forum (TCF) to help ensure information about 5G and safety is available to the public should they have any concerns. The New Zealand Ministry of Health and the Prime Minister’s Chief Science Advisor have developed resources we frequently share with interested parties. Thousands of studies have been performed over the years into whether there is any health impact from radio waves, and to date no adverse health effect has been causally linked with exposures to wireless technologies that comply with the New Zealand limits, including 5G.
5G will initially use radio frequencies very similar to 3G and 4G, and while eventually it will use radio frequencies at higher levels (i.e. millimetre waves), this doesn’t result in higher or more intense exposure. Exposure levels will remain well below limits set by the New Zealand Government in NZS2772.
To check that we meet our obligation to comply with national limits, Spark has commissioned independent monitoring of exposures to radio waves around our cell sites. You can read more about this programme here: www.health.govt.nz/our-work/radiation-safety/non-ionising-radiation/independent-cellsite-monitoring
23Connections matterSpark New Zealand Annual Report 2020
For
per
sona
l use
onl
y

integrated services to these rural communities from just one cell site.
Network resilience
We recognise how important telecommunications and digital connectivity is to millions of New Zealanders and New Zealand businesses. We place great emphasis on the resilience and diversity of our networks.
We expanded our mobile network in the lead up to Rugby World Cup, this included the deployment of the single radio access network (SRAN) and Long-Term Evolution (LTE) sites, as well as significantly increasing capacity and coverage for wireless broadband.
We continued our work on Spark’s fibre build programme, Optical Transport Network (OTN) and Carrier Ethernet expansion to meet customer demand for services and traffic growth across the network.
Investment also continued into the converged communication network (CCN) that will replace the legacy PSTN network and enable us to deliver IP-based voice services in the future.
During COVID-19 Alert-Level 4 there was a significant growth in daytime traffic, as well as increases to the peak evening load, as the whole country worked or learnt from home. The network had sufficient capacity to carry the load and was very stable across fixed and wireless broadband and mobile voice despite the increase in usage. Spark expanded capacity where needed with ‘cell sites on wheels’ (COWs), or by adding additional capacity onto individual cell sites.
Flooding in the South Island in December 2019 caused damage to both Spark’s western and eastern fibre routes and resulted in outages to landline, mobile and broadband
Expanding rural broadband coverageWe work in collaboration with Vodafone, 2Degrees and Crown Infrastructure Partners (CIP) to build essential broadband and mobile services for rural New Zealand via the Rural Connectivity Group (RCG). The RCG is a joint venture between Spark, Vodafone and 2degrees, and has been contracted by CIP to deliver the Government’s Rural Broadband Initiative Phase 2 (RBI2) and Mobile Black Spot Fund programmes.
The aim of the RCG project is to deliver new or improved mobile and wireless broadband coverage to over 30,000 rural homes and businesses. It also aims to provide further mobile coverage to over 1,000 kilometres of state highways and provide connectivity to over 100 New Zealand tourist destinations by December 2022. This means it will build over 400 cell sites across rural New Zealand delivering essential broadband and mobile services.
The connectivity is much needed to bridge the digital divide for rural communities and help the rural sector remain competitive. Bringing together the investment from Spark, Vodafone and 2degrees, along with the Government’s RBI2 funding, has been the key to providing service into more challenging and remote areas of New Zealand.
To date, the RCG has built over 100 sites, delivering high-speed wireless broadband and quality mobile coverage to more than 8,121 homes and businesses, as well as 343km of state highway, improving safety on our roads and making them easier to access by emergency services.
The RCG network uses Nokia 4G Multi Operator Core Network (MOCN) which allows all three mobile networks to provide
We got 5G out on the water with our Emirates
Team New Zealand campaign.
Spark 5G helping Emirates Team New Zealand make the boat go faster
In November 2019 we started trialling a 5G service on the water for Emirates Team New Zealand, delivering on our promise to help make the boat go faster in the bid to defend the America’s Cup.
The 5G service covers parts of Auckland Harbour, off Milford and Takapuna, where Emirates Team New Zealand do some of their test sailing. The faster speeds and higher bandwidth of 5G means the team can livestream data and video back to engineers and designers at the base straight off the AC75 boat, Te Aihe, while it’s sailing. Real-time access to the data gives Emirates Team New Zealand a design advantage in preparing for the America’s Cup racing.
“Before the team had access to 5G they had to get a hard disk with all the data off the sailing boat, then the chase boat took it back to the base, and a team member would run the hard disk up to the data server at the base. Design work using the data couldn’t happen until well after the boat had docked.
“Now we have 5G on the water, there are hundreds of real-time data streams such as boat speed, ride height, and hydraulic pressure coming off the water and back to our design team at the base. Our team can do progressive design and development work during the day while the boat is sailing allowing our design-thinking to evolve much faster. We were never able to do this before 5G.” Dan Bernasconi, Head of Design for Emirates Team New Zealand.
24
Spark New Zealand Annual Report 2020 Our network and technology
For
per
sona
l use
onl
y

services to customers in the lower South Island (although 111 calls were maintained as they were automatically rerouted onto other networks which were still operating). The Minister of Broadcasting, Communications and Digital Media, Kris Faafoi, subsequently announced plans for a new fibre optic route on the West Coast.
We recognise that an increase in extreme weather events is likely to increase as a climate-related risk. To learn more about our approach to risk, including climate-related risk, see page 48.
PSTN decommissioning: upgrading landline calling
Over the past year we have continued our programme to close the legacy PSTN (public switched telephone network) and transition
to the new, IP-based CCN (converged communications network). We have now decommissioned 232 telephone exchange switches, which is 33% of the Spark PSTN.
Customers continue to move to wireless and fibre voice services, which are supported by the CCN technology. In the past financial year over 140,000 more customers have moved away from the PSTN. In July Spark announced the next phase of the PSTN closures project, which will begin in early FY21. In September 2020 Spark will launch a pilot project in Devonport, Auckland and Miramar, Wellington to move all customers off the local PSTN switches and over to the CCN. Once all customers have moved, the local PSTN switches will be decommissioned. The change will impact less than 1,000 customers
Rural Connectivity Group (RCG) cell tower at Whangarei Heads.
We have continued our programme to close the legacy PSTN (public switched telephone network).
across these two suburbs combined, and we will be working with our customers to ensure they have everything they need to stay connected before we make the switch.
The PSTN is nearing end-of-life, its components have not been manufactured since 2003, and the people with the skills needed to maintain this technology are also becoming scarce.
Spark will work closely with customers during the pilot project in Devonport and Miramar to test and learn how it can best guide customers through the process. We will take what we’ve learnt to inform our plans to make this same change, using an area-by-area approach, across New Zealand over the coming years.
4G voice services
We have activated 4G HD Voice on our network, otherwise known as Voice over LTE or VoLTE. Most phones we launch are now VoLTE capable, and we are progressing turning this on for capable handsets already in market. While 3G will continue to be a primary means of voice delivery in the immediate future, 4G voice provides fast call set up time and improved call quality, and will enable voice services for cell sites rolled out as part of the Rural Broadband Initiative 2 (RBI2), the majority of which are 4G only.
Agreements signed for build of new Southern Cross NEXT cable
Southern Cross Cable Network and its shareholders have signed agreements and gained the regulatory approvals needed to move into the construction phase for the NEXT cable between Australia and New Zealand to the United States. The cable is set for completion by early 2022 and will span Sydney to Los Angeles, via Auckland, Fiji, Tokelau, and Kiribati.
Alcatel Submarine Networks will build the cable that Southern Cross believes will have the lowest latency between Australia and New Zealand and the US. Telstra has bought a 25% stake in Southern Cross, reducing Spark’s holding to around 40%. The other shareholders of Southern Cross are Singapore’s Singtel and US communications technology company Verizon.
25Connections matterSpark New Zealand Annual Report 2020
For
per
sona
l use
onl
y

Our people
Our approach is to employ the best people we can and to invest in them to bring out their full potential. We aim to provide an employee experience aligned with our purpose, which enables our people to move fast, progress and focus on what matters for our customers.
We provide experiences and opportunities for our people to continuously learn. This will build the growth mindsets, behaviours and capabilities that will differentiate Spark’s culture and support sustainable competitive advantage.
The outcome is fulfilling and rewarding employment which equips our people for a positive future of work, building human capital in Spark and New Zealand.
Spark Contribution ModelsThe Spark Contribution Models define the skills, knowledge, experience, behavioural and mindset requirements for people working in different teams across Spark. The models guide our people on what Spark values, giving a clear description of how they can progress their careers at Spark. The models also give our leaders a tool to help coach, review and support our people to grow their skills.
Equality and objectivity are important elements of the contribution models. This is linked to our adoption of an Agile model that encourages flat organisational structures, valuing and growing people’s individual ‘craft’ over traditional titles and hierarchy.
Continuous learning and developmentSpark’s development philosophy is based upon the 70/20/10 principle, where 70% is through on-the-job experiences, 20% through building and maintaining relationships with others, and 10% through formal development opportunities.
We operate formal development programmes for people in key roles. Our Leading Agility Foundations programme is targeted at Chapter Leads and Product Owners. The programme runs over three months, and combines self-directed learning with structured learning in cohorts of peers, with applied learning opportunities. In the past year 120 of our people completed the programme.
Our Agile Adaptive Leaders programme is for people in key leadership roles and individuals identified for development and succession planning. The programme runs over six months in cohort groups of up to 12 people, with diverse groups from across Spark coming together to learn via facilitated learning and exposure to leading-edge performance, visionary and thought leaders. This approach is to build a strong and cohesive leadership community within Spark.
Coaching is a core focus of the programme, with an objective to increase the capacity of
Our team of talented and diverse people are the heart of our business. Our business model relies on human and intellectual capital in our workforce and in our communities.
Employee Net Promoter Score (eNPS)
+66 25 points from FY19
26
Spark New Zealand Annual Report 2020 Our people
For
per
sona
l use
onl
y

our leaders to coach and be coached. Experimentation is also part of the programme, where we give our leaders opportunities to apply their leadership insight and learnings to build and deliver a meaningful initiative that brings Spark’s purpose to life.
To date five cohorts, and a total of 60 Leaders, have completed the programme. The success of the programme means we will continue to roll it out in FY21.
Spark Hauora – Health and WellbeingThe health and wellbeing of our people is something we take very seriously. Over the past three years we have built up a volunteer wellbeing community of around 650 employees. In the past year we launched Spark Hauora, a Health and Wellbeing programme to encourage our people to lead healthy lifestyles, to care for themselves and others and to help them bring their best version of themselves to Spark and their families.
Almost 60% of staff now engage with our mental health community and related content. In the past year we were recognised
for our mental health and wellbeing efforts by being named as a finalist in the Emerging Diversity and Inclusion Category at the 2019 Diversity Awards NZ, which honours a diversity and inclusion initiative that is less than two years old.
We recently signed the ‘WorkWell Pledge’, a wellbeing agreement to work collaboratively with Toi Te Ora Public Health, an organisation regarded as one of the leading health and wellbeing experts in New Zealand. In partnership with Toi Te Ora Public Health and Spark’s own Health, Safety and Wellbeing ambassadors, we strive to continuously work with our people to evolve our wellbeing focus and maturity.
Supporting our people through COVID-19The focus of our response to COVID-19 has been to keep our people safe and keep our business running as a critical lifeline utility. We have robust business continuity plans in place to ensure we can continue to provide services to our customers and New Zealand.
We activated our Business Continuity Plan in February 2020, well ahead of the New Zealand Alert-Level 4 lockdown. This meant stepping up preparations with our
people, systems, customers and industry colleagues. Not all of our people were able to transition to working from home. A big focus was to protect our frontline teams who would have to keep working on site, such as those in network operations, data centres, exchanges and 111 operations.
Teams were split into three or four to ensure if the virus affected employees in one team the other teams could carry on. At an early stage, we also stopped visits by other people to those critical sites. We implemented rigorous cleaning, hygiene and social distancing controls in our workspaces, which were maintained as employees began to return as lockdown restrictions lifted.
To support our people in their transition to working from home we provided a number of set-up guides, and kept up regular communication from our leaders throughout lockdown. Topics included how to create the perfect space for home working, workstation ergonomics and tips for taking care of the health and wellbeing of themselves and others. We also shared guidance on scheduling days to create a routine with a clear start and end to the working day. This included a clear time to switch-off and keep a clear line between work and home life.
Our people celebrate Diwali at Spark City.
27Connections matterSpark New Zealand Annual Report 2020
For
per
sona
l use
onl
y

We recognised the importance of individuals and teams staying connected, with our people making a smooth transition to online meeting and collaboration tools. People were encouraged to schedule regular chats with colleagues that replicated normal day-to-day contact in the workplace. We also promoted our network of support service providers for employees needing additional support.
Within the business we acted early to reduce potential long-term impacts of COVID-19 on our workforce. In April we announced that there will be no annual salary review increases for the next year for all Spark people, including the Leadership Squad and fees for the Board of Directors. We also put on hold external recruitment across the Spark group. Over the April 2020 Easter period we asked all of our people working in non-essential roles to take four days of annual leave.
As with many of our customers, the mass shift to home working forced a rapid adoption of online meeting and collaboration tools enabled by our technology. We will look to continue this discipline, to make these temporary habits permanent, to best use our technology and in turn reduce the cost and environmental impact of business travel.
Health and safetySpark has well established Health and Safety (H&S) systems. These include processes for risk assessment, audit and employee training. We focus on continuous improvement of our
performance through our H&S strategy, which is built around the four pillars of our Gold Standard:
• a strong health and safety management framework
• a proactive ‘owners’ approach to health and safety the management of critical hazards and associated risks
• a culture of empowerment at every level of the organisation
• a commitment by the business to ensuring the resources and capability are in place to deliver the health and safety strategy.
In FY20 we continued to take a detailed approach to applying good risk management practice and control for our most critical hazards and risks. This has seen H&S plans developed and implemented at all our office and exchange buildings, along with improved physical controls for working at height, confined spaces, and hazardous substances. We have also made Asbestos Management Plans available at relevant buildings for people working on-site. We are in the process of removing asbestos from some of our older sites.
Through employee consultation and participation, our most at-risk business areas – Critical Environments, Retail, Network Development and Technical Services – have
1 We have restated the FY19 TRIFR reported last year from 3.46 to 4.64 as we have shifted reporting to a rolling 12-month average.
built H&S Roadmaps to be implemented in the year ahead.
We also developed a new Supplier Consultation Process with our partners IMPAC. Together we developed a new online tool to deliver an interactive onboarding process for high-risk projects with our suppliers. This tool will be rolled out across our most at-risk business areas during FY21.
No Spark employees or contractors suffered work-related serious injury or death over the year, and our TRIFR (Total Recordable Incident Frequency Rate) was 3.58 for FY20, compared to 4.64 in FY191. Our target for FY21 is to reduce our TRIFR to 3.0.
Another key measure of performance is our participation in the Accident Compensation Corporation’s accredited employer programme. We achieved Tertiary level again in FY20, and reported our lowest number of claims and lowest costs relating to employee injury management of approximately $14,000, less than half the costs from previous years.
In FY21 we will continue our focus on improving systems around Spark’s critical health and safety risks. We plan to implement our ‘SparkSafe’ capital programme for working at heights at problematic sites with access to mobile towers and continue to work across the business to ensure continuous improvement in our performance.
To support our people working from home we provided set-up
guides and kept up regular communication from our
leaders throughout lockdown.
28
Spark New Zealand Annual Report 2020 Our people
For
per
sona
l use
onl
y

Diversity and inclusionSpark’s Māori Strategy
Our Māori Strategy is about cultural transformation, finding the shared space between Te Ao Māori and the corporate world. It aims to build deeper more authentic partnerships with our communities, our customers and our people. More information is included in our community section on page 39.
Blue Heart programme
Our Blue Heart programme supports Spark’s focus on a ‘heart-led’ approach to diversity and inclusion. It has evolved to be an icon for our wider approach to an inclusive and heart-led culture and our move to an Agile way of operating has helped us accelerate this shift. This approach has been instrumental in bringing together multi-functional squads across diverse cultural, ethnic and professional backgrounds.
Spark Pride
As a Rainbow Tick accredited company, we are incredibly proud of our ongoing commitment to the Rainbow community. We continued our support of the Rainbow community over the year, signing up as a major partner of Auckland Pride 2020 and launching the Pride & Spark Empowerment Initiative. The Initiative helped connect and resource Auckland’s diverse rainbow communities by supporting those producing events for the festival. Support includes workshops, access to mentors and funding.
We also continued our ongoing support of OUTLine NZ, a national charity that offers a free support line for members of the LGBTQIA+ community and their friends and family. As part of the partnership we launched a new film focusing on recruitment of those within the LGBTQIA+ whānau. The film is a reminder for employers that individuality is a strength that should be welcomed, and that resources are available to support people foster more inclusive workplaces: www.outline.org.nz/workplace In March 500 of our Christchurch employees moved into Spark Square,
our new building in the city’s Cathedral Square. Spark Square is the first new building completed by private developers in Cathedral Square since the earthquakes, and reflects our commitment to supporting the rejuvenation of Christchurch’s central business district.
New Christchurch office
29Connections matterSpark New Zealand Annual Report 2020
For
per
sona
l use
onl
y

Gender diversity and gender pay gapOver the past year we have seen positive improvements in our gender diversity and gender pay ratio measures. Our target for Board and leadership diversity is a 40:40:20 ratio. This refers to 40% men, 40% women, 20% of any gender.
The current composition of our Board is 50% female and 50% male, and FY20 changes to our Leadership Squad means this team is also comprised of 50% female and 50% male. We have also seen an increase in females in other senior roles, up 4% to 39%. Spark is the first large NZX-listed business to have both a female Chair and female CEO. Our Diversity and Inclusion Policy1 sets out our framework in this area.
Spark’s overall pay ratio of average female to average male pay for all employees is -17%. This is a slight improvement from our FY19 ratio of -18%. This is the first year we have reported the overall pay ratio of median female to median male pay, making Spark one of the first New Zealand companies to do so. For FY20 this figure is -26%.
The Spark Contribution Models are used to set salaries based on areas of expertise. This ensures that people assessed to make an equal contribution receive equal pay. A major contributor to this pay ratio differential is the make up of New Zealand’s technology sector having a significantly higher proportion of males in technology roles. Spark has sought to reduce this ratio over time with initiatives such as Women in Technology scholarships and partnering with external technology educators, designed to proactively build a New Zealand-wide pipeline of female technology qualified employees.
Gender pay ratioCategory Number of
employees in category
Pay Ratio: Average1
Pay Ratio: Median2
Leadership:
Spark’s wider leadership group, including the Leadership Squad
57 2% -2%
Technology:
Employees that work in technology-focused areas of the business
2,296 -18% -26%
Customer Channels:
People primarily employed within our contact centres and retail operations
1,138 0% 0%
Rest of Spark3:
including corporate, product, marketing and customer units
1,733 -15% -21%
Total 5,224 -17% -26%
1 Pay Ratio = (average female salary – average male salary) / average male salary.2 Pay Ratio = (median female salary – median male salary) / median male salary.3 In future reporting we will provide more detail on the ‘Rest of Spark’ category, to understand our performance
and inform actions to drive change over the medium term.
Calculated using hourly On Target Earnings or Total Base Remuneration plus Short Term Incentive Target values.
Parental leaveSpark provides a parental leave policy for eligible employees, regardless of gender, sexuality, age or whether the employee is giving birth or adopting a child. If an employee has been employed by Spark for a minimum of 12 months then Spark will top up the Government’s parental leave payments so the employee receives 80% of their salary. In line with Government changes we have extended this period from 22 weeks to 26 weeks from 1 July 2020. As a guaranteed minimum, Spark ensures that the total amount someone receives, less any Government paid primary carer's payments, will not be less than the equivalent of six weeks of ordinary salary.
Eligibility for Parental Leave is in accordance with Government legislation.
Female Male1
Employees that took parental leave 94 3
Employees that returned to work after taking parental leave 71 3
Employees that returned to work after taking parental leave that remain employed 12 months after their return to work
41 2
Return to work rate2 93% 100%
Retention rate3 66% 100%
1 Males that took less than 30 days paternity leave have been excluded.2 Return to work rate = Total number of employees that did return to work after parental leave divided by the
total number of employees due to return to work after taking parental leave.3 Retention rate = Total number of employees retained 12 months after returning to work following a period of
parental leave divided by the total number of employees returning from parental leave in the prior reporting period.
1 https://www.sparknz.co.nz/content/dam/telecomcms/sparknz/content/governance/Diversity-Policy.pdf
50/50Male/female ratio for our Board and Leadership Squad
7%
7%
30
Spark New Zealand Annual Report 2020 Our people
For
per
sona
l use
onl
y

Demographics of our workforceIncluding permanent and fixed-term employees of Spark and its directors, as at 30 June 2020.
Gender Age
Number of people
(year-on-year change)
Female %
(year- on-year change)
Female # Male %
(year- on-year change)
Male # Under 30 years old
(year-on-year change)
30 – 50 years old
(year-on-year change)
Over 50 years old
(year-on-year change)
Directors1 8
(no change)
50%
(+7%)
FY20: 4
FY19: 3
50%
(-7%)
FY20: 4
FY19: 4
0%
(no change)
25%
(11%)
75%
(-11%)
Leadership Squad2 8
(+1)
50%
(+7%)
FY20: 4
FY19: 3
50%
(-7%)
FY20: 4
FY19: 4
0%
(no change)
100%
(14%)
0%
(-14%)
Other leadership roles3
57
(+3)
39%
(+4%)
FY20: 22
FY19: 18
61%
(-4%)
FY20: 35
FY19: 33
0%
(no change)
79%
(-1%)
21%
(1%)
Permanent starters 729
(-367)
35%
(-3%)
FY20: 258
FY19: 419
65%
(3%)
FY20: 471
FY19: 677
41%
(-5%)
51%
(2%)
8%
(3%)
Permanent leavers 944
(-320)
43%
(1%)
FY20: 402
FY19: 531
57%
(-1%)
FY20: 542
FY19: 733
33%
(no change)
54%
(1%)
13%
(-1%)
Total4 5,231
(-148)
34%
(-2%)
FY20: 1,769
FY19: 1,917
66%
(2%)
FY20: 3,462
FY19: 3,467
21%
(-2%)
57%
(no change)
22%
(2%)
1 Mr Bray and Ms Hodson commenced as directors on 23 September 2019.2 Excludes the CEO (for FY20) and former Managing Director (for FY19) as they are included as directors in the line above. The Leadership Squad is considered ‘senior
managers’ for the purposes of the Financial Markets Conduct Act 2013 and ’senior executives’ for the purposes of the ASX Corporate Governance Council’s Principles and Recommendations.
3 Substantive roles that report directly to members of the Leadership Squad.4 Includes non-executive directors. Spark’s employee headcount, including our CEO, is reported as 5,224.
5,224Total number of employees
2,296Employees that work in technology focused areas of the business
UNDER 30 YEARS OLD30 – 50 YEARS OLDOVER 50 YEARS OLD
22% 21%
57%
80%Spark tops up Government parental leave payments to 80% of salary
93%Return to work rate of female employees after taking parental leave
UNDER 30 YEARS OLD30 – 50 YEARS OLDOVER 50 YEARS OLD
21%
57%
22%
Age of permanent and fixed-term employees of Spark as at 30 June 2020
31Connections matterSpark New Zealand Annual Report 2020
For
per
sona
l use
onl
y

Our environment
Our approach is to operate our business efficiently and responsibly, and account for the indirect environmental impacts of our products and services. This includes the opportunity to use technology to improve efficiency and address environmental challenges.
Maturing our approach to environmental management is an area of focus. We have strong processes in place to manage many of our environmental impacts. However, we recognise we need to make improvements in some areas, including our policies and our reporting.
Our approach to climate-related risk is also maturing. We have considered the requirements of the Taskforce on Climate-related Financial Disclosures (TCFD) in this year’s report. See pages 46-48 to understand our approach to risk, including climate-related risk.
Our climate change commitmentAs a founding member of the Climate Leaders Coalition (CLC) we are committed to business leadership and collective action when it comes to addressing climate change.
In 2016 we set a target to reduce our emissions by 25% by 2025 against FY16 baseline. This is a credible and ambitious target. However, it is not aligned with the latest science-based targets which typically set more ambitious reduction goals over a longer period of time in order to contribute to limiting warming to 1.5 degrees.
We have recently committed to the 2019 CLC pledge that raises our ambition. This requires us to set a target grounded in science that will
deliver substantial emissions reductions to contribute to New Zealand being carbon neutral by 2050.
In practice this will mean a more ambitious target, over a longer period to 2030 and beyond. We remain committed to our current target. By setting a new target, and creating a pathway towards it, we will also accelerate our progress towards our 2025 reduction target, which will require significant work to achieve. We will also improve our external climate change reporting by seeking independent verification of our emissions.
Reducing our network emissionsOur main source of emissions is our use of electricity. We consume the most electricity in powering our networks and technology, including data centres and switches.
Traffic over our networks increases significantly each year. To keep up with demand we have been investing in expanding coverage and increasing capacity in our core networks, including adding 150 new mobile sites over the past two years. It’s important that we meet our customers’ needs for digital connectivity. However, we recognise that we must invest and expand our network in a way that also reduces its footprint.
Global consultancy Bell Labs conducted an independent review of our efficiency, which found our data centre and network building power usage effectiveness (PUE) to be “very good” and our traffic-vs-power growth-ratio vs industry standards to be “outstanding” when measured against our international peers.
One way to reduce electricity consumption is to migrate to more efficient systems. Many
Our environment refers to natural capital, the resources that make up and power our network and technology, and the physical environment and hazards that it operates within.
32
Spark New Zealand Annual Report 2020 Our environment
For
per
sona
l use
onl
y

Kiwis have already made the switch to get their landline and broadband delivered over newer technologies like fibre or wireless broadband, or have simply dropped their landline completely in favour of using their mobile. However, in many areas of New Zealand our landline voice calling is still running on the legacy public switched telephone network (PSTN) that is nearing the end of its life.
Since 2017 more than half a million Kiwis have moved over to the newer Converged Communications Network (CCN). The CCN is a more resilient and fully digital technology that handles all the different services our customers will expect and demand – fixed, mobile, video, collaboration, Voice over LTE (VoLTE) and future services like Voice over WiFi.
In the year ahead we plan to step up our work to move customers over to the CCN. We will take an area-by-area approach. For most customers the change will be a very simple process. We will support customers to make an informed choice about what service they would like to move to, and we have put in place a team of support people who can find solutions for those with more complex needs.
At the end of FY20 232 PSTN switches had been retired across New Zealand, which accounts for 33% of PSTN switches. Decommissioning the PSTN switches results
in significant reduction in electricity usage. We save around 60,000kWh each year in a typical urban PSTN exchange building or as much as 1 GWh each year in our largest exchanges, around 16 times more. This year we’ve achieved further annual savings of around 3 GWh through these energy efficiency improvements, totalling 3% in the past two years.
Our FY20 emissionsOver the past year our gross carbon emissions were unchanged from FY19. Electricity emissions increased this year due to higher carbon intensity in the national grid, offset in part by electricity efficiency improvements achieved in the network. Travel emissions reduced by 26%. Refrigerant leakage increased 4% this year, and emissions from diesel for generators were unchanged. Waste reduced 16% in FY20 with fewer people going to the office.
Spark is now offsetting travel emissions by purchasing carbon credits through Air New Zealand’s FlyNeutral programme. We are including these in our emissions reporting for the first time, covering flights for the FY19 and FY20 period. Including these offsets, our FY20 net emissions were around the same level as the FY16 base year, with the carbon credits offsetting growth in other areas of the business.
GREENHOUSE GAS EMISSIONS
Kilotonnes-CO2-equivalentsFY16 BASE FY17 FY18 FY19 FY20
CHANGE FY16 – FY20
Direct Emissions (Scope 1)1 3.4 3.6 3.6 3.5 3.6 +7%
Electricity Emissions (Scope 2) 16.6 13.4 16.2 16.8 17.5 +5%
Value Chain Emissions (Scope 3)2 6.9 6.9 8.3 5.7 5.7 -17%
Gross Emissions 27.0 23.9 28.1 28.4 28.2 +5%
Carbon Offsets (2.4) (1.3)
Net emissions 27.0 23.9 28.1 26.03 26.9 0%1 We have applied higher default refrigerant leakage estimates this year and restated Scope 1 refrigerant emissions for prior years following the same methodology2 This year we have applied significantly lower emission factors for New Zealand domestic air travel, based on new Government guidance following a 2016 Ministry of
Transport study of aviation fuel consumption in New Zealand3 Adjusted from previously reported figure to include offsetting
0
50
100
150
200
FY20FY19FY18FY17FY16
OFFICEDATA CENTRESNETWORK
ELECTRICITY CONSUMPTION
Gig
awat
t Ho
urs
(GW
h)
0FY20FY19FY18FY17FY16
OTHERTRAVELREFRIGERANTFLEETDIESELELECTRICITY
GREENHOUSE GAS EMISSIONS BY SOURCE
Tonn
es-C
O2e
10,000
20,000
30,000
In collecting activity data to calculate scope 1 and scope 2 emissions Spark has used ISO 14064-1, New Zealand Guidance for Voluntary, Corporate Greenhouse Gas Reporting and The Greenhouse Gas Protocol: A Corporate Accounting and Reporting Standard (Revised Edition).
Electricity emissions are calculated based on grid electricity consumption and the transmission and distribution losses emission factor as described in: Ministry for the Environment Measuring Emissions: A Guide for Organisations: 2019 detailed guide. Wellington: Ministry for the Environment.
33Connections matterSpark New Zealand Annual Report 2020
For
per
sona
l use
onl
y

Air travelIn FY20 the COVID-19 alert levels had a significant impact on our emissions. We stopped all international air travel, and domestic travel has been significantly reduced.
We want to embed the good practices we adopted through lockdown, which forced many of our teams, and many of our interactions with customers and other stakeholders, online. For FY21 we have put tighter controls in place over air travel and are aiming to significantly reduce our flight spend compared to pre-lockdown patterns.
Our fleetSpark has a core fleet of around 240 vehicles operating across New Zealand, and a further 214 vehicles assigned to subsidiaries and business partners. Our fleet emissions are around 6% of our total emissions. This means we have an important opportunity to make meaningful reductions in emissions by changing the composition of our fleet and our usage patterns.
We have a long-term focus on increasing fleet efficiency. We introduced 47 hybrid vehicles into our fleet in 2015, and in 2016 we made a commitment to convert 30% of our core fleet to PHEV (Plug in Hybrid Electric Vehicles) or fully electric vehicles. We achieved this target in FY20, having replaced 86 vehicles with PHEVs, representing 32% of our core fleet.
The majority of these vehicles were Mini Countrymen PHEVs. When compared to pure EVs, PHEVs are higher-emitting. However, they are the most practical solution for Spark currently because many of our sales and service staff using the vehicles are required to travel large distances in areas where charging infrastructure is not yet fully available.
We want to continue this momentum and we will use what we have learned from the roll out of PHEVs to support change across our broader fleet. We are committed to increasing the number of EVs and higher-range PHEVs in our fleet over time and to reporting transparently on this. At the end of FY20 19% of our broader fleet was PHEV or EV. Our long-term target is 30%.
Health and safety is another priority in our fleet management, with vehicle safety a key element in our vehicle choice. In FY20 we rolled out GPS systems across our fleet. These systems inform us immediately if any drivers have been involved in an accident (if the vehicle has rolled or flipped), if our vehicles have any unusual speeding or deceleration activity and if the device has been removed. Another advantage is that data from the GPS is enabling us to better understand the distances that each vehicle covers. This data is helping to determine future buying decisions, such as where to deploy EV or PHEV vehicles in each location.
E-waste and network recyclingSpark has a comprehensive programme for managing end-of-life network equipment and technology. This is separated into different waste streams – such as mobile phones, printed circuit boards, copper cables, lead batteries and all types of metals. The different items are sorted, processed by our recycling partners and then some components are sent overseas for recycling, reselling or reusing.
In FY20 we recovered a total of 501 tonnes of e-waste, an increase of 36% on last year. Of this, 198 tonnes was network e-waste (up 420% on FY19), and 303 tonnes was metals, cables and batteries (down 8%). The increase in network e-waste is due to network projects,
In FY20 we added Mini Countrymen PHEVs to our core fleet.
34
Spark New Zealand Annual Report 2020 Our environment
For
per
sona
l use
onl
y

such as the decommissioning of our PSTN network. To improve collection we have focused on education within Spark, and we have begun to work with some of our larger customers to support them to responsibly recycle their surplus equipment.
Mobile phone recyclingSpark is a member of the Telecommunication Forum’s (TCF) RE:MOBILE product stewardship scheme. The scheme takes unused mobile phones, and either refurbishes and on-sells them in overseas markets or recycles them. Any profits from the scheme are donated to the charity Sustainable Coastlines.
In FY20, 24,900 mobile phones or other devices were reused or recycled through this scheme. This has increased from 17,500 in FY19.
To support this scheme we have recycling bins in our stores and offices around New Zealand. We are working with our industry partners and the TCF to boost the awareness of the scheme and overcoming the barriers consumers feel in recycling their devices. In the past year this included promoting the scheme to our mobile customers by mailing out 80,000 RE:MOBILE recycling envelopes, and raising awareness with our retail staff. The programme also signed Olympic pole-vaulter Eliza McCartney as brand ambassador for RE:MOBILE.
Packaging and consumer wasteReducing the environmental impact of our products and packaging is a long-term focus. This includes making decisions that reduce packaging bulk, use recycled or recyclable materials and avoid the use of plastics. The environmental impacts of these decisions are
considered against packaging function, branding requirements and cost. We recognise that this is an area of growing interest to our customers, and that we have the opportunity to do more.
We work with our third-party suppliers to reduce packaging and the use of plastics in our products. We have recently created our first environmentally friendly packaging for our 5G modems, which use recycled paper and a design that reduces the amount of bleaching in the production processes.
In November we introduced new environmentally friendly shopping bags at our stores. The new bags are made from recycled paper and are fully recyclable. We chose a bag made from 100% recycled paper because it has a low impact in its production as well as a low end-of-life impact. The bags use vegetable-based inks and are free from any plastics.
We introduced environmentally friendly
shopping bags made from 100% recycled paper at our stores.
35Connections matterSpark New Zealand Annual Report 2020
For
per
sona
l use
onl
y

Our communities
Our products and services help our communities to stay connected and enable the provision of community services. Beyond the direct impacts of our products we want to reach out to play a role in building healthy, connected, and equitable communities. This is how we create value and build social and human capital.
We know that the impact of COVID-19 will be felt across New Zealand and that some communities will be more impacted than others. The role of digital technology in New Zealand’s recovery and transformation brings the issue of digital equity into the spotlight. We want a positive digital future in which every Kiwi has the opportunity to thrive.
Digital equitySpark works alongside the Spark Foundation to address barriers to digital equity. The Government’s Digital Inclusion Blueprint1 identifies four elements essential to digital equity:
• Access: for everyone to be able to enjoy the benefits of the digital world we need to ensure connectivity, affordability and accessibility
• Motivation: people need to understand the benefits of the digital world to have a meaningful reason to engage with it
• Skills: the know-how to use the internet and digital technology in ways that are appropriate and beneficial
• Trust: having trust in the internet and online services and the digital literacy to manage personal information and avoid potential harm
Spark Foundation
1 Available at https://www.digital.govt.nz/assets/Documents/113Digital-Inclusion-BlueprintTe-Mahere-mo-te-Whakaurunga-Matihiko.pdf
We work alongside New Zealand to harness the power of technology for a positive digital future for all.
Spark Foundation is the charitable organisation supported by Spark New Zealand, taking the lead in delivering Spark’s community work. The Foundation’s vision is that no New Zealander is left behind in a digital world. Its mission is to accelerate towards digital equity, including access, skills, capabilities and wellbeing in the digital age.
Spark Foundation supports the delivery of Skinny Jump, managing the partnerships that deliver the programme in the community. Spark Foundation also allocates funding for programmes through a strategic partnership approach, focusing on partnering with
organisations whose work is aligned to its strategy.
In FY20 Spark Foundation sold the Givealittle crowd funding platform. Spark Foundation acquired Givealittle in 2012 with the aim of growing a generosity platform that would make a difference to New Zealand. Over that time donations through the platform grew from $650,000 to $33 million in FY19.
The decision to sell Givealittle was taken after a review of Spark Foundation’s strategy, to help ensure Givealittle’s continued growth and better enable Spark Foundation’s resources to invest in accelerating digital equity in New Zealand.
Spark Foundation’s partnership with The Electric Garden mixes growing food with digital technology to support learning.
36
Spark New Zealand Annual Report 2020 Our communities
For
per
sona
l use
onl
y

Accelerating digital equity through Skinny JumpCensus data estimates that around 211,000 New Zealand homes don’t have access to broadband. Research from Internet NZ indicates that cost is the biggest barrier to this access.
To help bridge the digital divide Spark Foundation launched Jump in 2016, providing internet access to those who go without. Jump was first targeted at families with school-aged children.
In March 2020 Jump was relaunched as Skinny Jump, as Jump runs on the Skinny mobile broadband network. Eligibility for Skinny Jump was extended to include job seekers, senior citizens, refugees, new migrants, people recently released from prison, people with disabilities and people living in social housing.
With the launch of the new Skinny Jump the cost was also halved, to $5 for 30GB of data, with the option to renew up to five times a month. The service is entirely prepaid, so there are no long-term contracts or credit checks needed, and all it takes to get set up is registering through a partner and plugging in the modem.
Skinny Jump is available through a community partner network, which is overseen by Digital Inclusion Alliance Aotearoa (DIAA) and includes 176 local partners nationwide spanning community libraries and community hubs amongst others.
Since the relaunch in March the Skinny Jump customer base has nearly doubled to reach 9,559 by the end of FY20. The aspiration is to reach 20,000 homes by the end of FY21.
In response to COVID-19 Skinny Jump also worked in partnership with the Ministry of Education and AUT to connect school and university students in need of broadband at home free of charge.
See: www.skinny.co.nz/jump
“Digital equity is a critical issue in New Zealand, but something most of us take for granted. If you can’t get online, then you’re already ten steps behind the person who can – so it’s exciting to see Skinny Jump being offered to more groups of Kiwis who are currently missing out. We’ve witnessed first-hand the incredible difference that Jump has made to the lives of the school-aged families who’ve been on the programme and can’t wait to see the impact it will have on the lives of so many other New Zealanders.”
Sue Kini, Digital Inclusion Alliance Aotearoa (DIAA)
“Jump has been absolutely life-changing for me and my whānau. We live rurally and once we got our modem, we were able to plug in and get online straight away. My kids are smart but without access to the internet at home I was worried that they would fall behind in their schoolwork. It’s been such a fantastic tool for my whānau that I promote it to other Kiwis, just like us, who might be struggling to afford an internet connection at home. No one should miss out on having access to the internet because of the cost.”
Shona Te Huki, a Taranaki mother with school-aged kids who has been on the Jump programme since 2018.
37Connections matterSpark New Zealand Annual Report 2020
For
per
sona
l use
onl
y

Emergency Phone programme for victims of domestic violence At the start of Alert-Level 4 lockdown, Spark was approached by Shine and Women’s Refuge NZ to provide mobile phones loaded with prepaid credit for individuals who were fleeing domestic violence during lockdown. As part of this, 40 mobile phones with prepaid credit were sent to Women’s Refuge centres around the country.
Spark Foundation has now set up an ongoing Emergency Phone programme to support domestic violence groups across New Zealand. The programme is a joint venture between Spark Foundation and 100 domestic violence support organisations. As part of the new initiative, 570 Skinny Tahi Phones with $20 Skinny prepaid credit will be made available to support our most at-risk New Zealanders.
Employee donations
$269,328(FY19: $481k)
Spark’s matching
$172,692(FY19: $221k)
Number of employees participating
488(FY19: 735)
Spark Give results for the year
Total staff eligible for volunteering1
4,383Total employee participation
501(2019: 806)
% of employee participation
11%(2019: 18%)
Employee volunteering for the year
Spark Give
Our payroll giving programme, Spark Give, enables our people to donate to schools and charities via their pay, with benefits for doing so. Spark Foundation matches the amount employees donate dollar-for-dollar up to $500 per employee per annual year. Since this programme was established in July 2011 over $6 million has been donated to
Volunteering and Payroll GivingOur approach to staff volunteering
Spark employees are able to take one volunteer day each year. The Spark Foundation encourages skills and mission-based volunteering. Skill-based volunteering means our people focus on opportunities that take advantage of their specialised skills and talents to assist not-for-profits. Mission-based volunteering means volunteering with organisations whose work aligns with the purpose of Spark – to help all of New Zealand win big in a digital world.
The Spark Foundation works with our people to help them find an appropriate skill or mission-based volunteering opportunities. The Foundation works with two partners, Helptank and Voluntari.ly, to help drive greater uptake of the Spark volunteer day and also greater impact from the volunteering our people do.
COVID-19 was a catalyst for many of our employees to consider what they could do to support their communities. Many employees were seconded to volunteer to support the expanded Skinny Jump. However, our decision to put our volunteer programme on hold in lockdown between March and June has contributed to a drop in employee participation.
We are also working to align digital equity work with employee volunteering to offer support to seniors and other groups. We are piloting a digital mentoring programme to match our employees with seniors who are new Skinny Jump customers who request support making the most of the digital world.
New Zealand schools and charities. We are currently reviewing how the Spark Give programme aligns to Spark Foundation’s new strategy and digital equity focus. Because of this we haven’t actively promoted payroll giving to our employees in FY20, and we have seen our employee giving reduced compared to FY19.
1 Excludes selected subsidiaries and fixed-term employees.
38
Spark New Zealand Annual Report 2020 Our communities
For
per
sona
l use
onl
y

Spark’s Māori StrategyOur Māori Strategy is about cultural transformation, finding the shared space between Te Ao Māori and the corporate world. It aims to build deeper more authentic partnerships with our communities, our customers and our people.
Spark’s first Māori Business Strategy, Te Pou Arataki, was launched in 2017. A key focus was ‘Kanohi Kitea’– for our people to be seen, empowered and connected. Over the past three years the strategy has been successful in driving change across Spark through programmes such as our Te Reo Māori Plan, providing cultural responsiveness training to key Spark people, and delivering a self-directed Māori Made Easy programme to 75 tauira (students). Spark has also formed partnership to support our communities, including the Marae Digital Connectivity project, and supporting Kapa Haka, Matariki and Te wiki o Te Reo Māori.
In the year ahead our focus is moving to further growth by developing strategic partnerships with Māori, supporting the development of, and unleashing, the Māori economy. To do so we are evolving Spark’s
Māori Strategy. We have taken Te Pou Arataki and reimagined Te Korowai Tupu o Kora Aotearoa, the cloak of growth of Spark New Zealand. Te Korowai Tupu is inspired, driven, and led by kawa (protocol), tikanga (process) and kaupapa Māori and takes the threads of a tangata whenua world view that can be woven across Kora Aotearoa, into our strategic pillars, business strategies, Spark values and shared Māori values to embrace the physical and spiritual nature of te ao Māori. Our success will be measured through authentic partnerships delivering great outcomes for Māori and Aotearoa.
Te Korowai Tupu has three key threads (hukahuka) within the strategy. Toitū – sustainability, Te Tiriti o Waitangi – The Treaty of Waitangi, and Mana Taurite – Equity. We aim to work in partnership with Māori to effect change to unleash the potential of Māori Business and all New Zealanders as a driver for economic, cultural, environmental and social growth.
Spark’s role in the Marae Digital Connectivity initiative
We are working with the Government to bring our broadband and technology
capabilities to the Marae Digital Connectivity initiative as a key connectivity partner.
A Digital Marae is a marae with reliable digital connectivity that allows communities to be more connected than ever before, providing pathways to digital health, economic, social and educational services. Technology can enable stronger, safer, more connected communities, even in the most remote rural areas.
Spark has taken an approach guided by tikanga Māori to deliver this programme alongside Crown Infrastructure Partners (CIP) and Te Puni Kōkiri.
Kupu 2.0 to support Te Reo Māori in the classroom
Spark’s Kupu is a breakthrough mobile app that helps people learn Te Reo Māori by translating photos of objects around them. In the past year we’ve launched an improved version that can now be used across more schools in Aotearoa, thanks to the launch of a new version for use on tablets and desktops.
Kupu is a free and easy app for teachers to use. It is powered by Google cloud vision technology, combining with Te Aka Māori Dictionary translations.
We launched an updated version of ‘Kupu’ for use on tablets and desktops.
We celebrate Matariki to recognise our unique Māori identity and continue building our inclusive Blue Heart culture.
39Connections matterSpark New Zealand Annual Report 2020
For
per
sona
l use
onl
y

Our Board1. Justine Smyth, CNZMChair
Justine joined the Board of Spark New Zealand in December 2011 and became Chair in 2017. She has extensive experience in governance, mergers and acquisitions, taxation and financial performance of large corporate enterprises, as well as actively investing in small and medium enterprises (SMEs). Her background is in finance and business management, having been a Partner with Deloitte and Group Finance Director at Lion Nathan. She is currently a director of Auckland International Airport Limited, and Chair of The Breast Cancer Foundation New Zealand. Justine has a Bachelor of Commerce from the University of Auckland and is a Fellow of Chartered Accountants of Australia and New Zealand and a Chartered Fellow of the Institute of Directors. In 2020 Justine was appointed a Companion of the New Zealand Order of Merit for services to governance and women.
2. Alison BarrassNon-executive Director
Alison joined the Board in September 2016. She brings a broad range of skills, including knowledge and expertise in the fast-moving consumer goods (FMCG) sector and in governance, leadership and marketing-led innovation. Her background includes 30 years experience at major international FMCG companies, including PepsiCo, Kimberley-Clark, Goodman Fielder and Griffins Foods. She is currently a director with GWA Group, Heilala Vanilla, Lewis Road Creamery, Rockit Global and is Chair of Tom & Luke. Alison was previously Chair of Methven Ltd, Chair of the Breast Cancer Research Trust and a director of The Parenting Place. Alison has a Bachelor of Science from the University of Southampton and a Business Diploma in Marketing from the University of Auckland.
1.
3.
5.
7.
4.
6.
8.
2.
40
Spark New Zealand Annual Report 2020 Our Board
For
per
sona
l use
onl
y

3. Paul BerrimanNon-executive Director
Paul joined the Board in December 2011, bringing over 35 years of international experience in telecommunications, media and convergence. Since 2002 he has been Group Chief Technology Officer of the HKT Trust, where he’s responsible for leading the group’s product and technology roadmap and strategic development. Prior to this he was Managing Director of management consultancy Arthur D. Little in Hong Kong and he has held roles in Reuters and several major Hong Kong service providers. In 2009 Paul was recognised by the IPTV World Forum with its Special Merit Award for Outstanding Industry Contribution and in 2008 he was listed as one of the Global Telecoms Business Magazine’s top 100 “most influential persons in telecoms”. He is a Chartered Engineer who holds a Bachelor of Science in electro-acoustics from the University of Salford (UK) and a Masters in Business Administration from the University of Hong Kong. Paul is a Director of Rain Networks in South Africa, and the global Next Generation Mobile Networks Alliance of mobile network operators.
4. Warwick Bray Non-executive Director
Warwick joined the Board in September 2019. He brings over four decades of experience in the international telecommunications, technology and media sectors, most recently in senior executive roles at Telstra. During his nine years at Telstra up until 2018, his executive roles comprised Chief Financial Officer, Group Managing Director Product, Executive Director Mobile and Head of Corporate Strategy. Earlier in his career, he was a managing director at JP Morgan (London) and Dresdner Kleinwort Wasserstein (London) in telecommunications equity research. He also worked at McKinsey & Company in Europe, advising telecommunications companies on strategy, regulation and operational improvement, and
as a network systems engineer at Hewlett Packard. Warwick has served on the GSMA strategy committee, the boards of Hong Kong mobile business CSL and Australian pay TV operator Foxtel and as Chairman of the Australian Mobile Telecommunications Association. He holds a Bachelor of Science (Hons) and a Masters in Business Administration from the University of Melbourne.
5. Pip GreenwoodNon-executive Director
Pip joined the Spark Board in April 2018, bringing significant experience in capital markets, mergers and acquisitions, telecommunications and governance. She was formerly interim CEO of Russell McVeagh and a senior partner at the firm, with over ten years experience on the firm’s Board including time as its Chair. Over the years Pip has advised on many high-profile New Zealand corporate transactions that have changed the face of industries. She was a member of the New Zealand Takeovers Panel from 2007 to 2011 and is a current director of Fisher & Paykel Healthcare, Westpac New Zealand, The a2 Milk Company and a trustee of the Auckland Writers Festival. Pip has a Bachelor of Laws from the University of Canterbury.
6. Jolie HodsonChief Executive and Executive Director
Jolie joined the Board in September 2019. As Chief Executive Officer Jolie is responsible for ensuring Spark has a sound strategy and applies her leadership to delivering on that strategy, while building a leadership team around her and a business that is able to adapt to the fast-changing world of digital services. Jolie became CEO on 1 July 2019. Prior to that she was Spark’s Customer Director. Jolie joined Spark in 2013 as CFO before becoming CEO Spark Digital in October 2016 – and in both roles played a pivotal part in transforming Spark from a
legacy telco to a growing digital service company. Prior to this, she worked for 20 years in a range of senior finance roles for the Lion Group and Deloitte. She has a Bachelor of Commerce from the University of Auckland, and is a Fellow of Chartered Accountants of Australia and New Zealand.
7. Ido LefflerNon-executive Director
Ido joined the Board in June 2014. He brings experience in developing digital brands and extensive networks in the start-up communities of Silicon Valley and Australasia. Ido is the co-founder and Chief Executive Officer at Yoobi, a US based school supplies company that engages kids through bright colours, cool designs and, most importantly, cause. He is also Co-founder of Yes To Inc – a leading global natural beauty brand, and the Co-Founder of Beach House Group – a global consumer products solutions house. He has a Bachelor of Business from the University of Technology in Sydney.
8. Charles SitchNon-executive Director
Charles joined the Board in December 2011. He has more than 20 years experience in driving business strategy, having worked for McKinsey & Company from 1987, where he became senior director in 2010, primarily working with CEOs and boards on strategy and operations turnarounds, before retiring in 2010. Since 2006 he has been involved in various new business ventures. Charles is Chairman of the Board of Trinity College at the University of Melbourne. He holds a Masters in Business Administration from Columbia Business School and a Bachelor of Laws and a Bachelor of Commerce from Melbourne University. He is also a Graduate of the Australian Institute of Company Directors.
41Connections matterSpark New Zealand Annual Report 2020
For
per
sona
l use
onl
y

Strategic role of the BoardSpark’s Board plays a critical role in helping to guide and test company strategy, by engaging in an ongoing conversation with the Leadership Squad around key strategic decisions. These decisions are in relation to the long-term strategic planning and direction of the business, including non-financial performance and our ability to create value in the medium and long term. This includes customer experience, environmental, social and governance measures.
During FY20 the Board provided oversight and strategic support to assess the impacts of COVID-19 on Spark’s business. Regular briefing calls were held with management to discuss Spark’s response, including steps taken to protect our people and keep our business running as a critical lifeline utility. As the body elected by shareholders to protect and enhance the value of Spark’s assets, the Board has oversight of Spark’s financials and the annual and three-year planning
processes. Board members engage in robust discussions with management around the strategic direction of the business to test and ensure investment is going towards the things that will deliver the best outcomes for the company and shareholders. This flows through to Spark’s remuneration policies where there is Board involvement in setting targets and hurdles for short-term and long-term incentives.
The Spark Board has a strong focus on improving diversity and inclusion across Spark – and in particular improving a balanced gender representation at senior levels. This has been led by Justine Smyth in her previous role as Chair of the HRCC and more recently in her current role as Board Chair. Justine and her fellow Board members have ensured diversity and gender equality are true priorities at Spark, have challenged the business to set stretch targets in this regard and have helped lay the foundations for the culture of diversity and inclusion that is now flourishing across the business.
Board changes
The Board appointed Warwick Bray, as a non-executive director, and Chief Executive Jolie Hodson, as an executive director, to the Board effective from 23 September 2019.
Future Director
Spark also supports the Future Directors programme and appointed its second Future Director Ana Wight effective 1 February 2020 for a period of 12 months.
Board succession
Spark’s Board has an appropriate mix of tenure, skills, diversity and experience. This allows the Board to be ambitious and to deliver on those ambitions and to enable Spark to tackle the challenges and opportunities of the digital era.
The Board skills matrix on the following page outlines the qualifications, capabilities, geographical location, tenure and gender of each member of the Board.
There is an ongoing Board succession programme, which is focused on finding new directors with relevant skills and experience that complement the diverse perspectives already represented around the table.
Our Spark City building in Auckland.
42
Spark New Zealand Annual Report 2020 Our Board
For
per
sona
l use
onl
y
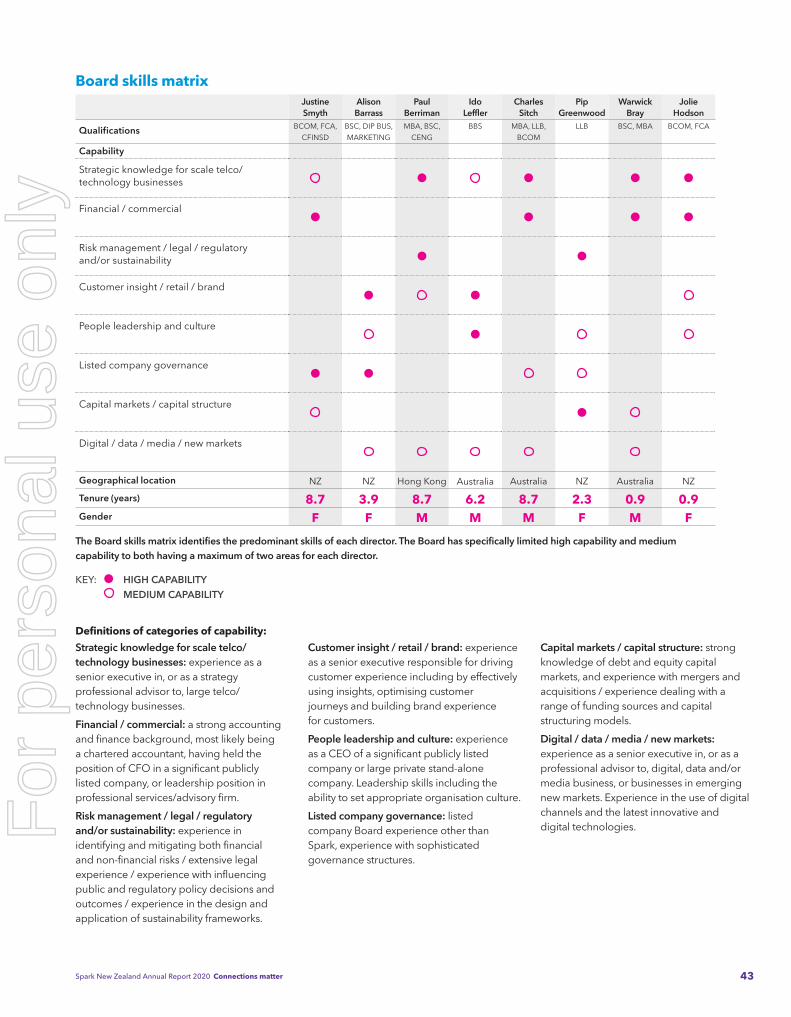
Board skills matrixJustine Smyth
Alison Barrass
Paul Berriman
Ido Leffler
Charles Sitch
Pip Greenwood
Warwick Bray
Jolie Hodson
Qualifications BCOM, FCA,
CFINSD
BSC, DIP BUS,
MARKETING
MBA, BSC,
CENG
BBS MBA, LLB,
BCOM
LLB BSC, MBA BCOM, FCA
Capability
Strategic knowledge for scale telco/technology businesses
Financial / commercial
Risk management / legal / regulatory and/or sustainability
Customer insight / retail / brand
People leadership and culture
Listed company governance
Capital markets / capital structure
Digital / data / media / new markets
Geographical location NZ NZ Hong Kong Australia Australia NZ Australia NZ
Tenure (years) 8.7 3.9 8.7 6.2 8.7 2.3 0.9 0.9Gender F F M M M F M F
The Board skills matrix identifies the predominant skills of each director. The Board has specifically limited high capability and medium capability to both having a maximum of two areas for each director.
KEY: HIGH CAPABILITY MEDIUM CAPABILITY
Definitions of categories of capability:
Strategic knowledge for scale telco/technology businesses: experience as a senior executive in, or as a strategy professional advisor to, large telco/technology businesses.
Financial / commercial: a strong accounting and finance background, most likely being a chartered accountant, having held the position of CFO in a significant publicly listed company, or leadership position in professional services/advisory firm.
Risk management / legal / regulatory and/or sustainability: experience in identifying and mitigating both financial and non-financial risks / extensive legal experience / experience with influencing public and regulatory policy decisions and outcomes / experience in the design and application of sustainability frameworks.
Customer insight / retail / brand: experience as a senior executive responsible for driving customer experience including by effectively using insights, optimising customer journeys and building brand experience for customers.
People leadership and culture: experience as a CEO of a significant publicly listed company or large private stand-alone company. Leadership skills including the ability to set appropriate organisation culture.
Listed company governance: listed company Board experience other than Spark, experience with sophisticated governance structures.
Capital markets / capital structure: strong knowledge of debt and equity capital markets, and experience with mergers and acquisitions / experience dealing with a range of funding sources and capital structuring models.
Digital / data / media / new markets: experience as a senior executive in, or as a professional advisor to, digital, data and/or media business, or businesses in emerging new markets. Experience in the use of digital channels and the latest innovative and digital technologies.
43Connections matterSpark New Zealand Annual Report 2020
For
per
sona
l use
onl
y

Our Leadership Squad1. Melissa AnastasiouGeneral Counsel
As General Counsel, Melissa leads Spark’s legal and compliance functions, providing Spark with strategic legal and commercial guidance, ensuring the business acts lawfully and with the utmost integrity. She has also played a pivotal role in leading out Spark’s diversity and inclusion programme. Melissa joined Spark in 2009 and undertook a range of legal roles across the organisation before being appointed as Group General Counsel in 2012. Prior to joining Spark Melissa spent a number of years as a Senior Legal Counsel for UK mobile provider Telefonica O2. She also has extensive experience working for leading corporate law firms in Auckland and the UK. Melissa has a Bachelor of Laws from Victoria University of Wellington.
2. Matt BainMarketing Director
As Marketing Director Matt brings his outstanding digital marketing and customer experience skills to place the customer right at the centre of Spark’s thinking and actions. Matt was previously based in Amsterdam as European Managing Director for agency AKQA – one of the world’s leading innovation and brand experience agencies, with responsibility for 500+ employees across five countries. Over an 18-year career Matt has built an impeccable international reputation with some of the world’s greatest brands – Nike, Heineken, Mini, Rolls Royce, Siemens, EA Sports, Audi, Phillips, Tommy Hilfiger and KLM amongst others. He holds a Masters of Commerce from the University of Auckland.
1.
3.
5.
7.
2.
4.
6.
8.
44
Spark New Zealand Annual Report 2020 Our Leadership Squad
For
per
sona
l use
onl
y
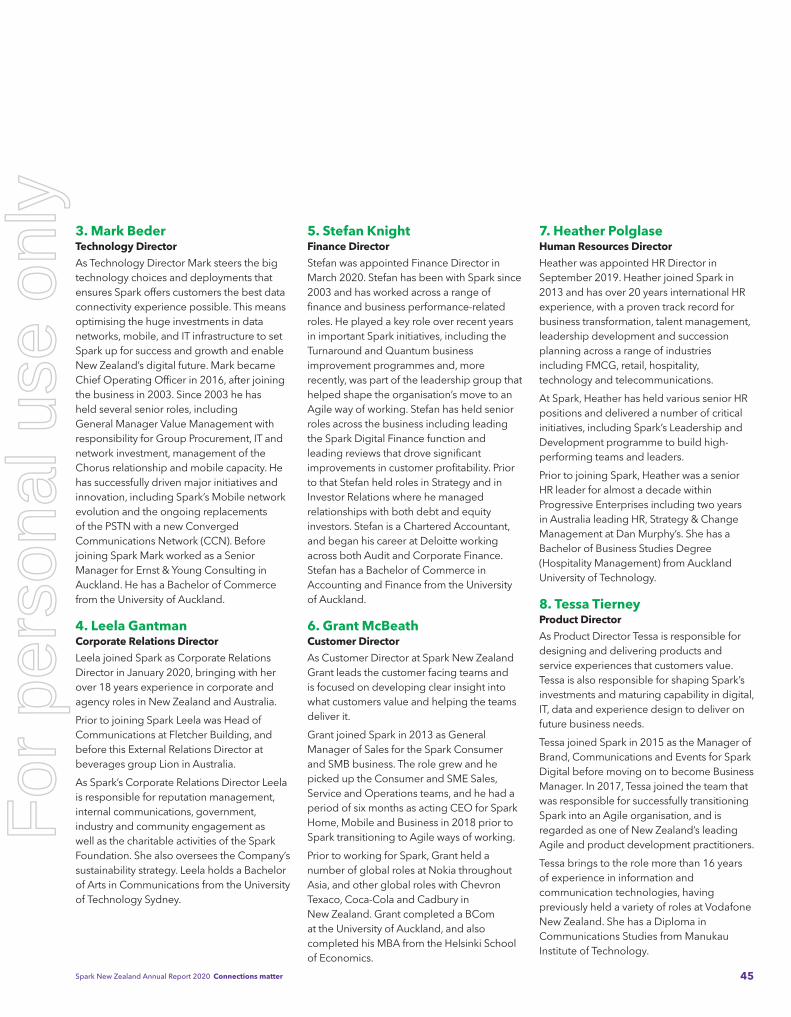
3. Mark BederTechnology Director
As Technology Director Mark steers the big technology choices and deployments that ensures Spark offers customers the best data connectivity experience possible. This means optimising the huge investments in data networks, mobile, and IT infrastructure to set Spark up for success and growth and enable New Zealand’s digital future. Mark became Chief Operating Officer in 2016, after joining the business in 2003. Since 2003 he has held several senior roles, including General Manager Value Management with responsibility for Group Procurement, IT and network investment, management of the Chorus relationship and mobile capacity. He has successfully driven major initiatives and innovation, including Spark’s Mobile network evolution and the ongoing replacements of the PSTN with a new Converged Communications Network (CCN). Before joining Spark Mark worked as a Senior Manager for Ernst & Young Consulting in Auckland. He has a Bachelor of Commerce from the University of Auckland.
4. Leela GantmanCorporate Relations Director
Leela joined Spark as Corporate Relations Director in January 2020, bringing with her over 18 years experience in corporate and agency roles in New Zealand and Australia.
Prior to joining Spark Leela was Head of Communications at Fletcher Building, and before this External Relations Director at beverages group Lion in Australia.
As Spark’s Corporate Relations Director Leela is responsible for reputation management, internal communications, government, industry and community engagement as well as the charitable activities of the Spark Foundation. She also oversees the Company’s sustainability strategy. Leela holds a Bachelor of Arts in Communications from the University of Technology Sydney.
5. Stefan KnightFinance Director
Stefan was appointed Finance Director in March 2020. Stefan has been with Spark since 2003 and has worked across a range of finance and business performance-related roles. He played a key role over recent years in important Spark initiatives, including the Turnaround and Quantum business improvement programmes and, more recently, was part of the leadership group that helped shape the organisation’s move to an Agile way of working. Stefan has held senior roles across the business including leading the Spark Digital Finance function and leading reviews that drove significant improvements in customer profitability. Prior to that Stefan held roles in Strategy and in Investor Relations where he managed relationships with both debt and equity investors. Stefan is a Chartered Accountant, and began his career at Deloitte working across both Audit and Corporate Finance. Stefan has a Bachelor of Commerce in Accounting and Finance from the University of Auckland.
6. Grant McBeathCustomer Director
As Customer Director at Spark New Zealand Grant leads the customer facing teams and is focused on developing clear insight into what customers value and helping the teams deliver it.
Grant joined Spark in 2013 as General Manager of Sales for the Spark Consumer and SMB business. The role grew and he picked up the Consumer and SME Sales, Service and Operations teams, and he had a period of six months as acting CEO for Spark Home, Mobile and Business in 2018 prior to Spark transitioning to Agile ways of working.
Prior to working for Spark, Grant held a number of global roles at Nokia throughout Asia, and other global roles with Chevron Texaco, Coca-Cola and Cadbury in New Zealand. Grant completed a BCom at the University of Auckland, and also completed his MBA from the Helsinki School of Economics.
7. Heather PolglaseHuman Resources Director
Heather was appointed HR Director in September 2019. Heather joined Spark in 2013 and has over 20 years international HR experience, with a proven track record for business transformation, talent management, leadership development and succession planning across a range of industries including FMCG, retail, hospitality, technology and telecommunications.
At Spark, Heather has held various senior HR positions and delivered a number of critical initiatives, including Spark’s Leadership and Development programme to build high-performing teams and leaders.
Prior to joining Spark, Heather was a senior HR leader for almost a decade within Progressive Enterprises including two years in Australia leading HR, Strategy & Change Management at Dan Murphy’s. She has a Bachelor of Business Studies Degree (Hospitality Management) from Auckland University of Technology.
8. Tessa TierneyProduct Director
As Product Director Tessa is responsible for designing and delivering products and service experiences that customers value. Tessa is also responsible for shaping Spark’s investments and maturing capability in digital, IT, data and experience design to deliver on future business needs.
Tessa joined Spark in 2015 as the Manager of Brand, Communications and Events for Spark Digital before moving on to become Business Manager. In 2017, Tessa joined the team that was responsible for successfully transitioning Spark into an Agile organisation, and is regarded as one of New Zealand’s leading Agile and product development practitioners.
Tessa brings to the role more than 16 years of experience in information and communication technologies, having previously held a variety of roles at Vodafone New Zealand. She has a Diploma in Communications Studies from Manukau Institute of Technology.
45Connections matterSpark New Zealand Annual Report 2020
For
per
sona
l use
onl
y

Our governance and risk management
Maintaining high standards of corporate governanceThe Board regularly reviews and assesses Spark’s governance structures and processes to ensure that they are consistent with international best practice, in both form and substance.
Spark has complied with the recommendations of the NZX Corporate Governance Code and substantially complied with the principles and recommendations of the ASX Corporate Governance Councils Principles and Recommendations (4th Edition) for the FY20 reporting period. You can read about how we have complied with these recommendations and principles in Spark’s Annual Corporate Governance Statement 2020 at: https://www.sparknz.co.nz/about/governance
Copies of, and details about, Spark’s corporate governance policies, practices and processes can be found on our website at: https://www.sparknz.co.nz/ about/governance
Non-financial performance and reportingIn addition to our focus on strong corporate governance, Spark seeks to present a clear and transparent assessment of our environmental and social performance over the year. In FY19 we integrated elements of the GRI Standards into our annual report. In FY20 we strengthened this by adopting elements of the Integrated Reporting International <IR> Framework.
The Spark Board has endorsed this progressive approach to building our non-financial reporting. Members of the Board have been involved in developing our approach to adopting the Integrated Reporting International <IR> Framework, and have approved the content of this report. As we mature our reporting approach we will include a formal statement regarding the Board’s involvement in the preparation and presentation of the report in accordance with the Integrated Reporting International <IR> Framework.
Managing riskOur managing risk policy and framework helps people to manage uncertainty and challenges as they pursue Spark’s strategy and business objectives.
The policy, overseen by the Audit and Risk Management Committee (ARMC), confirms the objectives for identifying and managing risks that can impact Spark’s organisational performance. For clarity, organisational performance includes all stated objectives and targets in Spark’s strategy and business plans. The policy also includes a confirmed set of roles and responsibilities to clarify what activities need to be undertaken by each function.
The policy and framework are benchmarked to COSO ERM 2017 (COSO), a leading practice risk management standard. Spark has used this standard since July 2018 when we transitioned to the Agile Operating Model.
To achieve our purpose, Spark must successfully execute our business strategy while maintaining high standards of operational performance and corporate governance.
46
Spark New Zealand Annual Report 2020 Our governance and risk management
For
per
sona
l use
onl
y

Spark’s framework is structured into five risk management domains:
• Governance and Culture
This domain reinforces the importance of risk management and influences how people apply the framework. Examples include the policy and the defined governance structure that supports its application across Spark.
• Strategy and Objective Setting
This domain focuses on integrating risk management into strategy setting and business planning. Examples include timing the collation of risk information so that it is considered by the Leadership Squad when they are considering opportunities, analysing performance and allocating resources.
• Performance
This domain involves maintaining a portfolio view of risks under active management. Examples include the principal risk profile that is maintained and used by the Leadership Squad and the ARMC to understand relevant risks and how they are being managed.
• Review and Revision
This domain involves identifying and implementing opportunities to continuously improve risk management practices. Examples include regular assessments of the policy and framework.
• Information, Reporting and Communication
This domain focuses on guiding Spark on how to use the policy and framework.
Examples include information pages, access to support channels and education sessions.
All five domains working together enables a robust system for risk management at Spark. More information on the roles and responsibilities are included in the table on page 112.
The policy and framework are assessed annually, and externally every three years to ensure they remain effective. All assessment results and agreed actions are shared with the ARMC to ensure they remain informed about the status of the policy and framework.
Spark’s principal business risksA principal risk update was completed in June 2020. The principal risks identified were:
Estimating impacts and responding with balanced judgement to COVID-19
Estimating the impacts that COVID-19 will have on the New Zealand economy and Spark is challenging. Risk factors include over or under-estimating the revenue impacts and not taking advantage of opportunities and preserving the health and safety of our people. Examples include maintaining momentum in core segments and managing customer financial hardship issues and leading with health and safety policies that effectively balance the needs of all stakeholders. To mitigate this risk, Spark has identified probable scenarios and response plans, and tuned its performance monitoring to track measures that indicate if anticipated impacts are arriving so that we have early
warning signals and response options. Continuous investment into maturing Spark’s health and safety framework ensures that people are at the centre of decision making at all levels within the business.
Executing simplification projects
Spark is planning to simplify its portfolio of products and migrate customers to new plans. This objective introduces revenue and customer experience risks because execution requires cooperation by a complex set of stakeholders (e.g. customers, regulatory bodies, suppliers and internal teams) and retiring legacy products is challenging. Mitigations include further investment in Agile maturity, and structured governance and delivery methods for simplification projects.
Delivering technology and network leadership within constraints
Proven delivery methods for large projects such as the 5G transition help de-risk new delivery and sustain existing technology. With a high share of operational cost, the Technology Units will also have to continue executing net-cost reduction while maintaining operational standards. In addition to cost optimisation mitigations, technology units have strengthened operational risk management to ensure visibility and coordinate risk response actions.
Maintaining customer trust in our information security and privacy controls
Evolving external threats, internal changes, changing legislation and high expectations from customers and stakeholders may create delivery challenges. Security and Privacy
47Connections matterSpark New Zealand Annual Report 2020
For
per
sona
l use
onl
y

Managing climate-related risk
Climate change has potential to disrupt business operations and our customers. We have considered the requirements of the Taskforce on Climate-related Financial Disclosures (TCFD) in this year’s report.
Short-term risks include impacts on energy costs, the cost of achieving our emissions reduction targets and one-off impacts of extreme weather events. Longer-term risks include increasing frequency and severity of extreme weather events, climate-related impact on network demand and usage patterns, including land-use change and sea level rise.
Managing the risk of network outage and availability of services is core to Spark’s business. Our risk and business continuity plans incorporate the impacts of weather-related events which we expect to be the biggest risk to our business from climate change.
Climate-related regulatory risks are evaluated in our business planning process. We do not directly participate in the NZ Emissions Trading Scheme. However, we are exposed to a carbon price through our supply chain purchasing, mainly through electricity and fuel.
Spark also has an opportunity to create climate-related financial value which potentially could materially increase our revenue. This would be through the provision of digital services to support customers to mitigate and adapt to climate change. We plan to evaluate revenue opportunities as compared to adaptation costs in future.
Information on our network efficiency and energy consumption is included on page 33. Information on network resilience is included on page 24.
roadmaps jointly created with Agile Units and strong governance involving the Leadership Squad help to ensure that significant risks are managed. The Security Tribe is responsible for critical operational controls to ensure standards and compliance are upheld. Our Digital Trust team sets privacy frameworks and standards that Agile Units need to apply to maintain appropriate operational controls for privacy.
Cost optimisation while maintaining operational standards
While executing net cost reduction is a strength for Spark, it needs to be done safely so that operational delivery standards for customers are maintained. Inherent risks include unintended consequences from initiatives, brand reputation damage and accelerated regulatory intervention. To mitigate this risk, the Leadership Squad has established a formal delivery structure. This structure includes strong governance and all initiatives using road-tested execution methodologies. Trajectory toward targets is measured, which in turn enables intervention and course corrections when required.
Business continuity and crisis managementThe Business Continuity and Crisis Management Policy protects customers from the impact of disruptive events, ensures value generating activities are resilient and complies with relevant external standards, for example Civil Defence and 111 obligations.
Spark’s framework is benchmarked to ISO22301 and ISO22313, which are acknowledged as leading practice standards for business continuity. The core elements of the framework are crisis management, incident and problem management, business continuity plans, network and technology disaster recovery plans, work area recovery sites and readiness and assurance activities.
Spark’s business continuity framework performed well when called upon in the COVID-19 pandemic. The Leadership Squad supported by the business were able to navigate the rapidly evolving situation and take steps to protect people and continue supporting customer delivery. Pandemic management continues to occur as discussed in the risk section above.
48
Spark New Zealand Annual Report 2020 Our governance and risk management
For
per
sona
l use
onl
y
Our supply chain is complex, as our direct suppliers often have suppliers of their own. We work hard to ensure integrity in our supply chain, using our Supplier Code of Conduct and regular business reviews with key suppliers.
We also recognise the importance of doing the right thing by our suppliers, particularly our smaller, local suppliers. That includes paying suppliers in a timely fashion. Our standard payment terms are the 20th of the month following the month of the invoice date.
We manage supplier relationships based on the strategic importance to Spark and our customers. This is split across two management frameworks – Strategic Partnership Management and Strategic Supplier Management. Our Strategic Partnership Management framework is how we partner with suppliers that directly impact our customers. The primary goal is to maintain, grow and seek out partnerships that enable beneficial growth in new and existing markets and provide value-added services to customers.
Our Strategic Supplier Management framework allows us to focus on key relationships by building and maintaining world-class services with cost leadership and resilience as a significant focus.
Spark’s Supplier Code of Conduct
Spark is committed to sourcing our products and services from suppliers that provide safe working conditions, treat workers with respect and dignity and conduct business in an environmentally and socially responsible manner. Our Supplier Code of Conduct sets out the minimum standards we expect from all of our suppliers across labour and human
rights, health and safety, environmental sustainability and ethical business practices. See: www.sparknz.co.nz/suppliers/
All new suppliers are requested to sign up to the Code as part of their onboarding process. In FY20 the only suppliers who did not sign up to Spark’s Code were either global suppliers that have their own code of conduct which Spark deemed equivalent to the Spark Code, or suppliers deemed low-risk based on the services provided and the nature of the supplier.
If a supplier is unable to meet the requirements of the Code, we work with them to implement our process of remediation plans and timeframes. We have ongoing conversations with suppliers that are managed in our framework. In FY20 we recorded no serious breaches of the Code.
The Supplier Code of Conduct was introduced in FY18. To embed the Code we worked with our top 100 suppliers by contract value to ensure they were signed up to the Code or could demonstrate they are adhering to an existing equivalent code of practice. We also used the Code as a basis for four comprehensive audits of large, offshore-based suppliers. These were significant suppliers operating in high-risk locations, according to FTSE4Good criteria.
In last year’s report we had committed to four further ‘deep dive’ audits in FY20. These were not completed. Our focus instead was on incorporating environmental, social and ethical considerations into our supplier selection processes. From FY20 onwards we are now including a scored section in our Request for Proposal (RFP) process where we seek information from suppliers on their non-financial performance and credentials.
Our suppliers
Our business relies on over 2,000 local and global suppliers. Each year we spend over $2 billion to support our business and meet our customers’ needs.
49Connections matterSpark New Zealand Annual Report 2020
For
per
sona
l use
onl
y

Leadership and Board remuneration
In April 2020 we announced that due to COVID-19 there will be no annual salary review increases for all Spark people, including the Leadership Squad and fees for the Board of Directors.
Leadership Squad remunerationRemuneration mix
The table below shows the standard FY20 remuneration mix for the majority of the Leadership Squad expressed as a percentage of fixed remuneration. The Short-Term Incentive (STI) scheme, is expressed at target, which is 50% of the maximum opportunity, and the Long-Term Incentive scheme (LTI) values represent the maximum LTI value.
Leadership Squad remuneration
Long-Term Incentive 40% of base
Short-Term Incentive 50% of base
Salary Base
Fixed remuneration
All Spark employee packages – including the CEO and Leadership Squad – include a fixed remuneration component that is set based on contribution, experience and market relativities. Fixed remuneration supports the attraction, motivation and retention of highly skilled executives.
Fixed remuneration generally consists of base salary. KiwiSaver sits outside fixed remuneration and as such, KiwiSavers receive employer contributions on top of base salary
and cash incentives. A number of Spark-funded benefits, including medical and life insurances, are also available to eligible employees on top of fixed remuneration.
Short-term Incentive schemes
Spark operates a small number of short-term incentive schemes, from monthly and quarterly commission and sales incentive plans, to annual cash-based short-term incentives. Employees in specific sales positions may have a component of their remuneration subject to individual or divisional sales performance targets, such that their total remuneration potential is directly linked to the acquisition and retention of profitable business for Spark.
For senior leaders, including the Leadership Squad, a component of their remuneration package is at risk in the form of an annual cash-based short-term incentive. Spark’s STI scheme rewards senior leaders for the achievement of annual performance objectives, with payments awarded from a fixed cash pool that is set based on overall Spark performance against financial and/or non-financial annual performance objectives. The actual payment to individuals is at the sole discretion of Spark and takes into account contributing factors such as performance and the performance of individual parts of the business. The Board will assess performance at the end of the financial year to determine the actual payment, which will be in the range of 0% to 200% of the target.
Spark seeks to remunerate our people with competitive salaries, paying in line with the market so we can recruit and retain the best talent. In keeping with our focus on customer experience, we incorporate customer satisfaction measures into our performance incentives.
50
Spark New Zealand Annual Report 2020 Leadership and Board remuneration
For
per
sona
l use
onl
y

Eligibility to participate in the STI scheme is at the discretion of the company and is targeted at individuals in senior roles who play a significant role in driving the overall performance of Spark.
The STI scheme rules contain a clawback provision that allows Spark to clawback any payments made under the STI scheme, for a period of 12 months following the payment, in the event of a material financial misstatement or should it be found that the participant committed an act of fraud that affected the eligibility to, and amount of, the payment.
FY20 Short-term Incentive scheme outcomes
For FY20 substantively all STI participants shared the same Spark Group targets comprising of EBITDAI, and Customer Experience measures, as well as an additional measure based on Spark Sport – RWC performance.
The FY20 Group performance outcome, as approved by the Board is summarised as follows:
Performance metric % Outcome Result
Group EBITDAI 50% 41.25%Threshold
met
Customer Experience 30% 41.75%
Above target
Spark Sport – RWC 20% 0.00%
Threshold not met
Total 100% 83%
Based on the above result, the total available funding pool for all eligible STI participants across Spark for FY20 was $4.25 million. Total payments cannot exceed $4.25 million.
FY21 Short-term Incentive scheme target
The mechanics of the FY21 STI will be similar to FY20. Group results will be the main determinate of the STI pool, with substantially all participants sharing the same Group measures. The FY21 Group measures will be a combination of EBITDAI and Customer Experience as in FY20, and an additional measure based on our three-year strategy.
Long-term Incentive schemes
Spark believes that senior leaders should have part of their remuneration linked to the
long-term performance of the company, so for the Leadership Squad and a select group of senior leaders, a long-term incentive forms part of their remuneration package. In FY20, the company operated one main scheme: the Spark New Zealand Long Term Incentive Scheme.
FY20 / FY21 Long-term Incentive scheme
For FY20, members of the Leadership Squad (including the CEO) and selected senior leaders were granted options under the Spark Long-Term Incentive Scheme. Under the scheme, participants were granted options at the start of the three-year vesting period. The number of options granted equalled the gross LTI value divided by the volume weighted average price of Spark New Zealand shares for the 20 days prior to the grant date. Subject to satisfaction of the performance hurdle and continued employment, at vesting each option converts to a Spark share based on a zero exercise price. If the target is not met (or the participant leaves) then the options simply lapse.
For FY21, members of the Leadership Squad (including the CEO) and selected senior leaders will be granted options under the same scheme as FY20.
FY20 and FY21 Long-term Incentive performance measure
Vesting of the FY20 LTI grant (September 2019 grant) is contingent on participants’ continued employment with Spark through to September 2022 and the company achieving a Total Shareholder Return (TSR) performance hurdle. TSR is a measure of share price appreciation and dividends paid over the three-year period of the grant. The target for this hurdle is Spark’s cost of equity plus 1% compounding annually.
For FY21, the Long-term Incentive performance measure remains unchanged from FY20.
Performance evaluation
The CEO annually reviews the performance of her direct reports. The evaluation is undertaken using criteria set by the CEO, including the performance of the business, the accomplishment of strategic and operational objectives and other non-
quantitative objectives agreed with the HRCC at the beginning of each financial year. The last Leadership Squad evaluations were undertaken during June 2020. Spark undertakes appropriate checks before appointing someone onto the Leadership Squad.
CEO remunerationRemuneration policy, strategy and governance
CEO Jolie Hodson’s remuneration package reflects the scope and complexity of her role and is set by the Board with reference to the remuneration of CEOs of similarly sized organisations.
CEO Remuneration FY20
For FY20 the CEO’s remuneration package comprised of a fixed cash component, an at-risk short-term incentive, and an at-risk long-term incentive (to be awarded under the Spark Long-term Incentive Scheme). The construct of the CEO’s remuneration package is such that 60% of her remuneration package is at risk. The table below shows the at target remuneration mix:
Long-term Incentive 75% of base
Short-term Incentive 75% of base
Salary Base
The CEO is also expected to maintain a holding of Spark shares as set out on page 104 of this report.
Remuneration components
Short-term Incentive scheme
The CEO is a participant in the Spark STI scheme, an annual cash-based short-term incentive, subject to the achievement of specific performance objectives set by the Board based on Spark’s strategy and business plan for the respective financial year. These objectives will be a combination of financial and non-financial measures. For FY20 the performance objectives and the outcomes achieved are described earlier in this section.
Long-term Incentive scheme
For FY20 the CEO’s annual LTI was granted as share options under the Spark Long Term Incentive Scheme. Under the scheme participants are granted options at the start of the three-year vesting period. The number of
51Connections matterSpark New Zealand Annual Report 2020
For
per
sona
l use
onl
y

options granted equals the gross LTI value divided by the volume weighted average price of Spark shares for the 20 days prior to the grant date. Subject to satisfaction of the performance hurdle and continued employment, at vesting each option converts to a Spark share based on a zero exercise price. If the target is not met (or the participant leaves) then the rights simply lapse.
The LTI component of the CEO’s remuneration package is designed to link part of her remuneration to the long-term performance of Spark, and align her interests with those of shareholders, through the grant of options with a post-allocation performance hurdle.
Performance hurdle
A performance hurdle applies to long-term incentives made to the CEO. This hurdle is agreed by the Board and sets a minimum level of performance that is required to be achieved over the period of each grant, for the LTI to be eligible to vest. For FY20, a performance hurdle of Spark’s TSR applies. The target for this hurdle is Spark’s cost of equity plus 1% compounding annually.
Spark’s TSR must meet or exceed this target over the period of the grant (from the date the options are granted to the date three years after that date) for the options to vest. If Spark’s TSR does not meet this target, all of the options will lapse. Testing to determine whether the TSR performance hurdle has been met will occur at the end of the vesting period of the grant. The Board will receive independent advice to the effect that the performance hurdle has been met, or not met, in determining whether the CEO can exercise the options or whether the options will lapse.
CEO termination
Spark may terminate the CEO’s employment with three months notice. A payment of nine months base remuneration will be made, plus entitlements for annual performance incentives and long-term incentives subject to
the rules relating to these incentives, in the case of termination by Spark, other than for termination for cause.
If there is a change of control that results in the CEO no longer being the CEO of a publicly listed company then she will be able to terminate her employment with three months’ notice and receive payment as if Spark had terminated her employment.
Spark may also terminate the CEO’s employment without notice for defined causes, in which case she will receive no further entitlement to any remuneration.
Board remunerationRemuneration and strategy
The remuneration of directors is reviewed annually by the Human Resources and Compensation Committee (HRCC) – taking account of the company’s size and complexity and the responsibilities, skills, performance and experience of the directors – with recommendations made to the Board for approval. Specialist independent consultants may be engaged from time to time to provide advice and ensure that the remuneration of Spark’s directors is appropriate and
comparable to that of similar companies in New Zealand and, as relevant, Australia.
Apart from the CEO, no director of Spark receives compensation in the form of share options or restricted shares nor do they participate in any bonus or profit-sharing plan. That said, non-executive directors are expected to maintain a holding of Spark shares as set out on page 110 of this report. As is the case for employees, directors are required to comply with the Insider Trading Policy when buying or selling Spark shares and any such transactions are disclosed to the market.
Remuneration components
No superannuation or retirement allowance was paid to any Spark director during FY20. Spark does not have service contracts with any director (apart from the CEO) that provide for any benefits or remuneration in the event that a director’s service with Spark is terminated. New Zealand-based non-executive directors are eligible for Spark-funded medical insurance, and all non-executive directors are also eligible for Spark-funded life insurance.
Our team of talented and diverse people are the heart of our business.
52
Spark New Zealand Annual Report 2020 Leadership and Board remuneration
For
per
sona
l use
onl
y

Section 4: Liabilities and equity4.1 Payables, accruals and provisions 79
4.2 Lease liabilities 80
4.3 Debt 82
4.4 Capital risk management 83
4.5 Equity and dividends 84
Section 5: Financial instruments5.1 Derivatives and hedge accounting 86
5.2 Financial risk management 90
Section 6: Other information6.1 Income tax 93
6.2 Employee share schemes 94
6.3 Related party transactions 95
6.4 Subsidiaries 96
6.5 Reconciliation of net earnings to net cash flows
from operating activities
97
6.6 Commitments and contingencies 97
Independent auditor’s report 98
Financial statements 54
Notes to the financial statements 58
Section 1: General information1.1 About this report 58
1.2 Key estimates and assumptions 58
1.3 Significant transactions and events in the
financial year
59
Section 2: Financial performance information2.1 Segment information 61
2.2 Operating revenues and other gains 62
2.3 Operating expenses 65
2.4 Finance income, finance expense, depreciation,
amortisation and net investment income
66
2.5 Non-GAAP measures 67
Section 3: Assets3.1 Receivables and prepayments 68
3.2 Inventories 71
3.3 Long-term investments 72
3.4 Right-of-use assets 73
3.5 Leased customer equipment assets 74
3.6 Property, plant and equipment 75
3.7 Intangible assets 77
3.8 Net tangible assets 78
Financial statements
53Connections matterSpark New Zealand Annual Report 2020
For
per
sona
l use
onl
y

Statement of profit or loss and other comprehensive incomeYEAR ENDED 30 JUNE
2020 2019NOTES $M $M
Operating revenues and other gains 2.2 3,623 3,533
Operating expenses 2.3 (2,510) (2,443)
Earnings before finance income and expense, income tax, depreciation, amortisation and net investment income (EBITDAI) 1,113 1,090
Finance income 2.4 36 37
Finance expense 2.4 (94) (85)
Depreciation and amortisation 2.4 (479) (477)
Net investment income 2.4 1 14
Net earnings before income tax 577 579
Income tax expense 6.1 (150) (170)
Net earnings 427 409
Other comprehensive income
Items that will not be reclassified to profit or loss:
Revaluation of long-term investments designated at fair value through other comprehensive income 3.3 91 87
Items that may be reclassified to profit or loss:
Cash flow hedges net of tax 5.1 (35) (59)
Other comprehensive income 56 28
Total comprehensive income 483 437
Earnings per share
Basic and diluted earnings per share (cents) 23.2 22.3
Weighted average ordinary shares (millions) 1,837 1,836
Weighted average ordinary shares and options (millions) 1,838 1,836
See accompanying notes to the financial statements.
Financial statements
54
Spark New Zealand Annual Report 2020 Financial statements
For
per
sona
l use
onl
y

Statement of financial position
AS AT30 JUNE 2020
AS AT30 JUNE 2019
NOTES $M $M
Current assets
Cash 53 54
Short-term receivables and prepayments 3.1 777 755
Short-term derivative assets 5.1 1 2
Inventories 3.2 96 100
Taxation recoverable 1 –
Total current assets 928 911
Non-current assets
Long-term receivables and prepayments 3.1 284 291
Long-term derivative assets 5.1 60 32
Long-term investments 3.3 308 182
Right-of-use assets 3.4 698 625
Leased customer equipment assets 3.5 86 55
Property, plant and equipment 3.6 1,015 1,012
Intangible assets 3.7 968 987
Total non-current assets 3,419 3,184
Total assets 4,347 4,095
Current liabilities
Short-term payables, accruals and provisions 4.1 463 447
Taxation payable 44 19
Short-term derivative liabilities 5.1 5 14
Short-term lease liabilities 4.2 41 31
Debt due within one year 4.3 228 433
Total current liabilities 781 944
Non-current liabilities
Long-term payables, accruals and provisions 4.1 81 68
Long-term derivative liabilities 5.1 156 111
Long-term lease liabilities 4.2 531 459
Long-term debt 4.3 1,244 962
Deferred tax liabilities 6.1 61 86
Total non-current liabilities 2,073 1,686
Total liabilities 2,854 2,630
Equity
Share capital 949 945
Reserves (353) (409)
Retained earnings 897 929
Total equity 1,493 1,465
Total liabilities and equity 4,347 4,095
See accompanying notes to the financial statements.
On behalf of the Board
Justine Smyth, CNZM Jolie Hodson Chair Chief ExecutiveAuthorised for issue on 26 August 2020
55Connections matterSpark New Zealand Annual Report 2020
For
per
sona
l use
onl
y

Statement of changes in equity
SHARE CAPITAL
RETAINED EARNINGS
HEDGE RESERVE
SHARE-BASED COMPEN-
SATION RESERVE
REVALUATION RESERVE
FOREIGN CURRENCY
TRANSLATION RESERVE TOTAL
YEAR ENDED 30 JUNE 2020 NOTE $M $M $M $M $M $M $M
Balance at 1 July 2019 945 929 (85) 2 (303) (23) 1,465
Net earnings - 427 – – – – 427
Other comprehensive income/(loss) - – (35) – 91 – 56
Total comprehensive income/(loss) - 427 (35) – 91 – 483
Contributions by, and distributions to, owners:
Dividends 4.5 - (459) – – – – (459)
Supplementary dividends - (39) – – – – (39)
Tax credit on supplementary dividends - 39 – – – – 39
Issuance of shares under share schemes 4 – – – – – 4
Total transactions with owners 4 (459) – – – – (455)
Balance at 30 June 2020 949 897 (120) 2 (212) (23) 1,493
SHARE CAPITAL
RETAINED EARNINGS
HEDGE RESERVE
SHARE-BASED COMPEN-
SATION RESERVE
REVALUATION RESERVE
FOREIGN CURRENCY
TRANSLATION RESERVE TOTAL
YEAR ENDED 30 JUNE 2019 NOTE $M $M $M $M $M $M $M
Balance at 1 July 2018 941 979 (26) 2 (390) (23) 1,483
Net earnings – 409 – – – – 409
Other comprehensive income/(loss) – – (59) – 87 – 28
Total comprehensive income/(loss) – 409 (59) – 87 – 437
Contributions by, and distributions to, owners:
Dividends 4.5 – (459) – – – – (459)
Supplementary dividends – (42) – – – – (42)
Tax credit on supplementary dividends – 42 – – – – 42
Issuance of shares under share schemes 4 – – – – – 4
Total transactions with owners 4 (459) – – – – (455)
Balance at 30 June 2019 945 929 (85) 2 (303) (23) 1,465
See accompanying notes to the financial statements.
56
Spark New Zealand Annual Report 2020 Financial statements
For
per
sona
l use
onl
y

Statement of cash flowsYEAR ENDED 30 JUNE
2020 2019NOTES $M $M
Cash flows from operating activities
Receipts from customers 3,594 3,424
Receipts from interest 34 35
Receipts from dividends – 15
Payments to suppliers and employees (2,497) (2,483)
Payments for income tax (140) (135)
Payments for interest on debt (52) (45)
Payments for interest on leases (30) (30)
Payments for interest on leased customer equipment assets (6) (4)
Net cash flows from operating activities 6.5 903 777
Cash flows from investing activities
Proceeds from sale of property, plant and equipment 13 1
Proceeds from sale of business 23 –
Proceeds from long-term investments – 2
Payments for purchase of business (11) –
Payments for, and advances to, long-term investments (35) (6)
Payments for purchase of property, plant and equipment, intangibles and capacity (393) (415)
Payments for capitalised interest (8) (8)
Net cash flows from investing activities (411) (426)
Cash flows from financing activities
Net proceeds from debt 4.4 30 154
Receipts from finance leases 6 6
Payments for dividends (459) (459)
Payments for leases (42) (36)
Payments for leased customer equipment assets (28) (17)
Net cash flows from financing activities (493) (352)
Net cash flows (1) (1)
Opening cash position 54 55
Closing cash position 53 54
See accompanying notes to the financial statements.
57Connections matterSpark New Zealand Annual Report 2020
For
per
sona
l use
onl
y
Notes to the financial statements: General informationNotes to the financial statements: General information
Section 1 General information
1.1 About this report
Reporting entityThese financial statements are for Spark New Zealand Limited (the Company) and its subsidiaries (together ‘Spark’ or ‘the Group’).
Spark is a major supplier of telecommunications and digital services in New Zealand. Spark provides a full range of telecommunications, information technology, media and other digital products and services, including: mobile services; voice services; broadband services; internet TV; cloud, security and service management services; procurement and partner services and managed data, networks and services.
The Company is incorporated and domiciled in New Zealand, registered under the Companies Act 1993 and is an FMC reporting entity under the Financial Markets Conduct Act 2013. The Company is listed on the New Zealand Main Board equity security market and the Australian Securities Exchange and the address of its registered office is Spark City, 167 Victoria Street West, Auckland 1010, New Zealand.
Basis of preparationThe financial statements have been prepared in accordance with Generally Accepted Accounting Practice in New Zealand (‘NZ GAAP’). They comply with New Zealand equivalents to International Financial Reporting Standards (‘NZ IFRS’) and other applicable Financial Reporting Standards, as appropriate for profit-oriented entities. The financial statements also comply with International Financial Reporting Standards (‘IFRS’).
The measurement basis adopted in the preparation of these financial statements is historical cost, modified by the revaluation of certain investments and financial instruments, as identified in the accompanying notes. These financial statements are expressed in New Zealand dollars, which is Spark’s functional and presentation currency. All financial information has been rounded to the nearest million, unless otherwise stated. Certain comparative information has been updated to conform with the current year’s presentation.
The principal accounting policies applied in the preparation of these financial statements are set out in the accompanying notes where an accounting policy choice is provided by NZ IFRS. A policy is also included when it is new, has changed, is specific to Spark’s operations, is significant or is material. Where NZ IFRS does not provide an accounting policy choice, Spark has applied the requirements of NZ IFRS but a detailed accounting policy is not included.
New and amended standards adopted by SparkEarly adoption of Definition of Material (Amendments to NZ IAS 1 and NZ IAS 8)Spark early adopted amendments to NZ IAS 1 Presentation of Financial Statements and NZ IAS 8 Accounting Policies, Changes in Accounting Estimates and Errors from the year ended 30 June 2019. The amendments clarify the definition of ‘material’ in respect of information in the financial statements and notes that information is material if omitting, misstating or obscuring it could reasonably be expected to influence decisions that the primary users of general-purpose financial statements make on the basis of those financial statements, which provide financial information about a specific reporting entity. Spark has used this amended definition of material in determining the disclosures to be included within these financial statements.
1.2 Key estimates and assumptions
The preparation of these financial statements requires management to make estimates and assumptions. These affect the amounts of reported revenues and expenses and the measurement of assets and liabilities as at 30 June. Actual results could differ from these estimates.
The principal areas of judgement and estimation for Spark in preparing these financial statements are found in the following notes:
• Note 2.2 Operating revenues and other gains
• Note 3.1 Receivables and prepayments
• Note 3.4 Right-of-use assets
• Note 3.6 Property, plant and equipment
• Note 3.7 Intangible assets
• Note 4.2 Lease liabilities.
58
Spark New Zealand Annual Report 2020 Notes to the financial statements
For
per
sona
l use
onl
y

11.3 Significant transactions and events in the financial year
The following significant transactions and events affected the financial performance and financial position of Spark for the year ended 30 June 2020:
Debt programme (see note 4.3)• On 18 September 2019 Spark issued A$125 million of unsecured
and unsubordinated fixed-rate bonds with a coupon rate of 2.60% maturing on 18 March 2030.
• On 25 October 2019, $250 million of unsecured fixed-rate bonds with a coupon rate of 5.25% matured.
• On 2 April 2020 Spark established two new committed revolving bank facilities; $75 million with Westpac New Zealand Limited and $75 million with ANZ Bank New Zealand Limited. These facilities will mature on 2 October 2021.
• On 6 April 2020, GBP18 million of unsecured and unsubordinated fixed-rate medium term notes with a coupon rate of 5.75% matured.
• On 5 June 2020 Spark issued A$100 million of unsecured and unsubordinated fixed-rate bonds with a coupon rate of 1.90% maturing on 5 June 2026.
Other payables (see note 4.1) • On 24 June 2020 Spark entered into a repurchase arrangement
whereby $25 million of network equipment was sold to a third party and immediately repurchased at the sale price plus a fee on deferred payment terms over 18 months.
Long-term investments (see note 3.3)• On 30 June 2020, TPG Telecom Limited (formerly Vodafone
Hutchinson Australia) announced that it has been admitted to the Australian Stock Exchange (ASX) and that on 13 July 2020 it will merge with TPG Corporation Limited (formerly TPG Telecom Limited). As at 30 June 2020 the fair value of Spark’s investment was $247 million and the increase of $91 million during the year has been recognised within other comprehensive income.
• Spark’s net earnings for the year includes $1 million from our share of the net profits of associates and joint ventures.
Capital expenditure (see notes 2.5, 3.4, 3.6 and 3.7)• Spark’s additions to property, plant and equipment, intangible
assets (excluding spectrum) and capacity right-of-use assets were $374 million, details of which are provided in notes 3.4, 3.6 and 3.7 and on page 15 of this annual report.
Dividends (see note 4.5)• Dividends paid during the year ended 30 June 2020 in relation
to the H2 FY19 second-half dividend (ordinary dividend of 11 cents per share and special dividend of 1.5 cents per share) and H1 FY20 first-half dividend (ordinary dividend of 12.5 cents per share) totalled $459 million or 25.0 cents per share.
Divestments (see note 2.2)• On 31 January 2020 Spark sold its entertainment streaming
business Lightbox New Zealand Limited (Lightbox) to Sky Network Television Limited.
• On 31 January 2020 Computer Concepts Limited (CCL), Spark’s wholly owned provider of cloud and ICT services, completed the transaction to divest the operational parts of its network services division (which were duplicated elsewhere in the Group).
Acquisitions (see note 3.7) • On 5 September 2019 Spark’s subsidiary Qrious Limited
completed the acquisition of NOW Consulting, the New Zealand-based data consulting division of WhereScape Software, which gives a unique data and analytics offering in the New Zealand market.
Southern Cross NEXT Cable (see note 3.3)• On 1 October 2019 Spark announced that agreements had been
signed and regulatory approvals received for the build of the Southern Cross NEXT undersea data cable (SX NEXT) and the introduction of Telstra as a 25% shareholder of Southern Cross and anchor customer of SX NEXT. SX NEXT has been developed as an extension of the existing Southern Cross cable ecosystem. When completed it is expected to be the lowest latency path from Australia and New Zealand to the United States.
• Spark’s shareholding in Southern Cross has reduced from 50% to approximately 40% as a result of Telstra becoming a shareholder.
• The SX NEXT build commenced during FY20, although progress has been interrupted due to the COVID-19 pandemic.
• Spark contributed $22 million of equity during FY20 and may need to contribute additional equity depending on the level of SX NEXT pre-sales that are secured. No further equity contributions are expected to be made in FY21.
• No dividends were received from Southern Cross during FY20. Dividends have been suspended for the duration of the SX NEXT build phase and are not expected to resume until FY23.
Changes in segments (see note 2.1)• Spark has reclassified the comparative segment results to reflect
minor changes in the management of videoconferencing and other collaboration services from voice to managed data, networks and services.
59Connections matterSpark New Zealand Annual Report 2020
For
per
sona
l use
onl
y

Notes to the financial statements: General information
Impact of COVID-19 On 11 March 2020 the World Health Organisation declared a global pandemic due to the outbreak of COVID-19. On 25 March 2020 New Zealand entered Government-directed Alert-Level 4 lockdown resulting in the shut down in all but essential services until 27 April 2020. The supply of telecommunications and digital services is considered an essential service therefore Spark was able to continue trading throughout all alert levels, with restrictions around retail stores.
The table below provides an assessment of the impact of COVID-19 on Spark’s statement of financial position.
ITEM COVID-19 ASSESSMENT NOTE
Cash No impact to the carrying value held.
Receivables and prepayments
Spark has recognised an additional $6 million expected credit loss provision primarily driven by the additional risk arising from forecasts in future economic conditions. Contract assets have been reviewed for impairment in respect of contracts that may become onerous as a result of COVID-19 and none have been identified.
3.1
Inventories Content rights in relation to events postponed due to COVID-19 and goods held for resale are not considered to be impaired at balance date.
3.2
Long-term investments Where investments are accounted for at fair value the carrying value reflects the share price at balance date. All remaining investments are equity accounted for. No investments are considered impaired as a result of COVID-19.
3.3
Property, plant and equipment
Spark’s assets are held at cost less accumulated depreciation. Spark has not identified any indicators that these assets are impaired as a result of COVID-19.
3.6
Intangible assets Spark has performed an impairment assessment of goodwill using a COVID-19 adjusted forecast. No impairment was recognised following this assessment.
3.7
Lease liabilities As a result of COVID-19 Spark received a number of rent concessions. Spark has elected, as a practical expedient under NZ IFRS 16, not to assess whether particular rent concessions occurring as a direct consequence of COVID-19 are lease modifications and instead accounted for those rent concessions directly in the statement of profit or loss.
4.2
Debt Debt is held at amortised cost plus, for hedged liabilities that are in a fair value hedging relationship, adjustments for fair value changes attributable to the risk being hedged. Interest rates and foreign exchange rates have been impacted by COVID-19 and reflected in the carrying value at balance date.
4.3
Derivative financial instruments
COVID-19 has impacted interest rates, foreign exchange rates and electricity prices. Derivatives are recorded at fair value; the carrying value reflects these changes at balance date.
5.1
Taxation The reintroduction of depreciation allowances for commercial building structures impacts deferred tax assets and tax expense estimates for future periods.
6.1
1.3 Significant transactions and events in the financial year (continued)
60
Spark New Zealand Annual Report 2020 Notes to the financial statements
For
per
sona
l use
onl
y

2
Section 2 Financial performance information
2.1 Segment information
The segment results disclosed are based on those reported to the Chief Executive and are how Spark reviews its performance.
Spark’s segments are measured based on product margin, which includes product operating revenues and direct product costs. The segment result excludes other gains, labour, operating expenses, depreciation and amortisation, net investment income, finance income and expense and income tax expense, as these are assessed at an overall Group level by the Chief Executive.
Comparative segment resultsSpark has reclassified the comparative segment results to reflect minor changes in the management of videoconferencing and other collaboration services from voice to managed data, networks and services. There is no change to the overall Spark reported result because of these changes.
2020 2019OPERATING
REVENUES PRODUCT COSTSPRODUCT
MARGINOPERATING
REVENUES PRODUCT COSTSPRODUCT
MARGIN
YEAR ENDED 30 JUNE $M $M $M $M $M $M
Mobile 1,288 (459) 829 1,271 (496) 775
Voice 391 (146) 245 441 (159) 282
Broadband 680 (339) 341 685 (341) 344
Cloud, security and service management 443 (90) 353 400 (73) 327
Procurement and partners 408 (362) 46 365 (322) 43
Managed data, networks and services 248 (119) 129 242 (110) 132
Other operating revenues 130 (82) 48 114 (63) 51
Segment result 3,588 (1,597) 1,991 3,518 (1,564) 1,954
Reconciliation from segment product margin to consolidated net earnings before income tax2020 2019
YEAR ENDED 30 JUNE $M $M
Segment product margin 1,991 1,954
Other gains 35 15
Labour (511) (475)
Other operating expenses (note 2.3) (402) (404)
Earnings before finance income and expense, income tax, depreciation, amortisation and net investment income (EBITDAI) 1,113 1,090
Finance income 36 37
Finance expense (94) (85)
Depreciation and amortisation (479) (477)
Net investment income 1 14
Net earnings before income tax 577 579
Notes to the financial statements: Financial performance information
61Connections matterSpark New Zealand Annual Report 2020
For
per
sona
l use
onl
y

Notes to the financial statements: Financial performance information
2.2 Operating revenues and other gains
The accounting policies specific to Spark’s operating revenues are outlined below:
Contracts with customersSpark records revenue from contracts with customers in accordance with the five steps in NZ IFRS 15:
1. Identify the contract with a customer;
2. Identify the performance obligations in the contract;
3. Determine the transaction price, which is the total consideration provided by the customer;
4. Allocate the transaction price amount to the performance obligations in the contract based on their relative stand-alone selling prices; and
5. Recognise revenue when or as the performance obligation is satisfied.
Spark often provides products and services in bundled arrangements (for example, a broadband modem together with a broadband service). Where multiple products or services are sold in a single arrangement, revenue is recognised in relation to each distinct good or service. A product or service is distinct where, amongst other criteria, a customer can benefit from it on its own or together with other resources that are readily available. Revenue is allocated to each distinct product or service in proportion to its stand-alone selling price and recognised when, or as, control is transferred to the customer.
Where contracts require the customer to commit to a minimum level of service or a minimum monthly payment amount that cannot be decreased without terminating the contract, revenue is allocated to performance obligations using the minimum enforceable rights and obligations and any excess amount is recognised as revenue as it is earned.
Generally, control for products is transferred and revenue recognised at the point in time it is delivered to the customer and for services, control is transferred, and revenue recognised, over time as the service is provided. These services are typically provided, and thus recognised, on a monthly basis. Control of products is typically transferred when the customer has physical possession of the goods. The nature of the various performance obligations in our contracts with customers and when revenue is recognised is outlined below:
PERFORMANCE OBLIGATIONS FROM CONTRACTS WITH CUSTOMERS
TIMING OF SATISFACTION OF THE PERFORMANCE OBLIGATION AND PAYMENT
Mobile services, broadband services, media services, cloud, security and service management services, managed data services and rental of equipment
As the service is provided (usually monthly). Generally billed and paid on a monthly basis.
Usage, other optional or non-subscription services, and pay-per-use services
As the service is provided. Generally billed and paid on a monthly basis.
Fixed modems, mobile handsets and other distinct goods When control is passed to the customer, generally when the customer takes possession of the goods. For goods sold in packages or on interest-free terms, customers usually pay in equal instalments over 6 to 36 months.
Installation or set-up services (where distinct) As the service is provided. Generally billed and paid following the provision of the service.
Performance obligations, where Spark acts as an agent, includes some third-party media services and certain cloud, security and service management contracts. Contracts with significant payment terms include those that have goods that were purchased on interest-free payment terms of greater than 12 months.
62
Spark New Zealand Annual Report 2020 Notes to the financial statements
For
per
sona
l use
onl
y

2
2020 2019
YEAR ENDED 30 JUNE $M $M
Operating revenues
Mobile 1,288 1,271
Voice 391 441
Broadband 680 685
Cloud, security and service management 443 400
Procurement and partners 408 365
Managed data, networks and services 248 242
Other operating revenues 130 114
3,588 3,518
Other gains
Net gain on sale of long-term investments/businesses 5 2
Gain on sale and exchange of property, plant and equipment and intangibles 28 11
Gain on lease modifications and terminations 2 2
35 15
Total operating revenues and other gains 3,623 3,533
Other gainsIn the year ended 30 June 2020 other gains includes a net $5 million gain from the sale of the operational parts of the network services division of Computer Concepts Limited (CCL) Spark’s wholly owned subsidiary and the sale of Spark’s entertainment streaming business Lightbox, $16 million from the sale of property, plant and equipment (primarily in relation to mobile network equipment), $12 million gain on exchange of intangible assets (primarily spectrum assets) and gains from lease modifications and terminations of $2 million.
In the year ended 30 June 2019 other gains comprised a $2 million gain from the sale of Feenix Communications Limited, $11 million from the sale of property, plant and equipment (primarily in relation to mobile network equipment) and gains from lease modifications and terminations of $2 million.
2.2 Operating revenues and other gains (continued)
63Connections matterSpark New Zealand Annual Report 2020
For
per
sona
l use
onl
y

Notes to the financial statements: Financial performance information
Key estimates and assumptions Determining the transaction price Determining the transaction price of Spark’s contracts requires judgement in estimating the amount of revenue we expect to be entitled to for delivering the performance obligations within a contract. The transaction price is the amount of consideration that is enforceable and to which we expect to be entitled in exchange for the goods and services we have promised to our customer. We determine the transaction price by considering the terms of the contract and business practices that are customary within that product, as well as adjusting the transaction price for estimated variable consideration and for any effects of the time value of money. The expected value or most likely amount methods are used to determine variable consideration and any amount where it is determined that it is highly probable a revenue reversal will not subsequently occur is included in the transaction price. In making this determination, consideration is given to the likelihood and potential magnitude of the revenue reversal, as well as factors outside of Spark’s influence, the time when the uncertainty is expected to be resolved and Spark’s experience with similar types of contracts. Judgement is required to determine the discount rate underlying any time value of money calculations, as well as whether the financing component in a contract is significant. Discounts, rebates, refunds, credits, price concessions, incentives, penalties and other similar items are reflected in the transaction price at contract inception.
Determining the stand-alone selling price and the allocation of the transaction price Determining the stand-alone selling price of performance obligations and the allocation of the transaction price between performance obligations involves judgement. The transaction price is allocated to performance obligations based on the relative stand-alone selling prices of the distinct goods or services in the contract. The best evidence of a stand-alone selling price is the observable price of a good or service when the entity sells that good or service separately in similar circumstances and to similar customers. If a stand-alone selling price is not directly observable, we estimate the stand-alone selling price taking into account reasonably available information relating to the market conditions, entity-specific factors and the class of customer. In determining the stand-alone selling price, we allocate revenue between performance obligations based on expected minimum enforceable amounts to which Spark is entitled. Any amounts above the minimum enforceable amounts are recognised as revenue as they are earned.
Distinct goods and services We make judgements in determining whether a promise to deliver goods or services is considered distinct. We account for individual products and services separately if they are distinct (i.e. if a product or service is separately identifiable from other items in the bundled package and if the customer can benefit from it). The consideration is allocated between separate products and services in a bundle based on their stand-alone selling prices.
Timing of satisfaction of performance obligationsWe make judgements in determining whether performance obligations are satisfied over time or at a point in time, as well as the methods used for measuring progress towards completed satisfaction of performance obligations. Revenue for performance obligations satisfied over time is recognised using the resources consumed by customers method or the time-elapsed method, as these best depict the transfer of goods or services to customers. Revenue for performance obligations satisfied at a point in time is recognised when control of the good or service is transferred to the customer, which is typically when the customer takes possession of the good.
2.2 Operating revenues and other gains (continued)
64
Spark New Zealand Annual Report 2020 Notes to the financial statements
For
per
sona
l use
onl
y

2
2.3 Operating expenses
2020 2019YEAR ENDED 30 JUNE $M $M
Product costs 1,597 1,564
Labour 511 475
Other operating expenses
Network support costs 65 61
Computer costs 98 93
Accommodation costs 63 67
Advertising, promotions and communication 78 87
Bad debts 17 12
Impairment expense 2 3
Other 79 81
Total other operating expenses 402 404
Total operating expenses 2,510 2,443
Cost of inventories recognised as an expense The cost of inventories recognised as an expense in relation to broadband modems, mobile devices and other accessories was $353 million (30 June 2019: $391 million).
Lease expensesExpenses relating to short-term leases and leases of low-value assets were $8 million (30 June 2019: $6 million). Rent concessions of $2 million were received as a result of COVID-19 and treated as a reduction of expenses.
DonationsDonations for the year ended 30 June 2020 were $2,306,000, comprised of Spark’s donation to Spark Foundation of $2,249,000 and other donations of $57,000 (30 June 2019: $2,246,000, comprised of Spark’s donation to the Spark Foundation of $2,207,000 and other donations of $39,000). Spark made no donations to political parties in the years ended 30 June 2020 or 30 June 2019.
Auditor’s remuneration2020 2019
YEAR ENDED 30 JUNE $’000 $’000
Audit of financial statements
Audit and review of financial statements1 1,096 1,085
Other services
Regulatory audit work2 65 54
Other assurance services3 – 121
Other non-assurance services4 10 –
Total fees paid to auditor 1,171 1,260
1 The audit fee includes fees for both the annual audit of the financial statements and the review of the interim financial statements.2 Regulatory audit work consists of the audit of telecommunications-related regulatory disclosures and reporting on trust deed requirements and solvency returns.3 Other assurance services relate to reporting on other compliance services.4 Other non-assurance services relate to tax services.
65Connections matterSpark New Zealand Annual Report 2020
For
per
sona
l use
onl
y

Notes to the financial statements: Financial performance information
2.4 Finance income, finance expense, depreciation, amortisation and net investment income
2020 2019YEAR ENDED 30 JUNE NOTES $M $M
Finance income
Finance lease interest income 13 14
Other interest income 23 23
36 37
Finance expense
Finance expense on long-term debt1 (53) (48)
Lease interest expense 4.2 (31) (30)
Leased customer equipment interest expense (6) (4)
Other interest and finance expenses (12) (11)
(102) (93)
Plus: interest capitalised2 8 8
(94) (85)
Depreciation and amortisation expense
Depreciation - property, plant and equipment 3.6 (233) (246)
Depreciation - right-of-use assets 3.4 (64) (56)
Depreciation - leased customer equipment assets 3.5 (27) (18)
Amortisation - intangible assets 3.7 (155) (157)
(479) (477)
Net investment income
Dividend income – 15
Share of associates’ and joint ventures’ net losses 3.3 1 (1)
1 14
1 Includes $8 million transferred from the cash flow hedge reserve for the year ended 30 June 2020 (30 June 2019: $3 million).2 Interest was capitalised on property, plant and equipment and intangible assets under development for the year ended 30 June 2020 at an annualised rate
of 4.4% (30 June 2019: 4.2%).
66
Spark New Zealand Annual Report 2020 Notes to the financial statements
For
per
sona
l use
onl
y

2
2.5 Non-GAAP measures
Spark uses non-GAAP financial measures that are not prepared in accordance with New Zealand Equivalents to International Financial Reporting Standards (‘NZ IFRS’). Spark believes that these non-GAAP financial measures provide useful information to readers to assist in the understanding of the financial performance, financial position or returns of Spark. These measures are also used internally to evaluate performance of products, to analyse trends in cash-based expenses, to establish operational goals and allocate resources. However, they should not be viewed in isolation, nor considered as a substitute for measures reported in accordance with NZ IFRS, as they are not uniformly defined or utilised by all companies in New Zealand or the telecommunications industry.
Spark’s policy is to present ‘adjusted EBITDAI’ and ‘adjusted net earnings’ when a financial year includes significant items (such as gains, expenses and impairments) greater than $25 million. There are no adjusting items for the years ended 30 June 2020 or 30 June 2019.
Earnings before finance income and expense, income tax, depreciation, amortisation and net investment income (EBITDAI)Spark calculates EBITDAI by adding back depreciation and amortisation, finance expense and income tax expense and subtracting finance income and net investment income (which includes dividend income and Spark’s share of net profits or losses from associates and joint ventures) to net earnings. A reconciliation of Spark’s EBITDAI is provided below and based on amounts taken from, and consistent with, those presented in these financial statements.
2020 2019YEAR ENDED 30 JUNE $M $M
Net earnings reported under NZ IFRS 427 409
Less: finance income (36) (37)
Add back: finance expense 94 85
Add back: depreciation and amortisation 479 477
Less: net investment income (1) (14)
Add back: income tax expense 150 170
EBITDAI 1,113 1,090
Capital expenditureCapital expenditure is the additions to property, plant and equipment and intangible assets (excluding goodwill, acquisitions and other non-cash additions that may be required by NZ IFRS, such as decommissioning costs) and additions to capacity right-of-use assets where such additions are paid up front.
2020 2019YEAR ENDED 30 JUNE NOTES $M $M
Additions to property, plant and equipment 3.6 242 217
Additions to intangible assets 3.7 134 189
Additions to capacity right-of-use assets 3.4 11 11
Capital expenditure including spectrum 387 417
Less spectrum additions 3.7 (13) –
Capital expenditure excluding spectrum 374 417
67Connections matterSpark New Zealand Annual Report 2020
For
per
sona
l use
onl
y

Notes to the financial statements: Assets
Section 3 Assets
3.1 Receivables and prepayments
2020 2019AS AT 30 JUNE $M $M
Short-term receivables and prepayments
Trade receivables 289 335
Prepayments 140 93
Short-term unbilled revenue 231 234
Short-term contract assets 11 15
Short-term contract costs 47 47
Short-term finance lease receivables 16 12
Other short-term receivables 43 19
777 755
Long-term receivables and prepayments
Long-term unbilled revenue 52 50
Long-term contract costs 66 81
Long-term finance lease receivables 144 144
Other long-term receivables 22 16
284 291
Amounts are stated at their net carrying value, including expected credit loss allowance provisions. The fair value of finance lease receivables is estimated to be $163 million (30 June 2019: $255 million) and the carrying amount of all other receivables, measured at amortised cost, are approximately equivalent to their fair value because of the short term to maturity.
Contract assetsContract assets primarily relate to Spark’s rights to consideration for performance obligations delivered but not billed at the reporting date. Contract assets are transferred to receivables when the rights become unconditional. The following summarises significant changes in those balances:
2020 2019YEAR ENDED 30 JUNE $M $M
Opening balance as at 1 July 15 29
Additions from new contracts with customers, net of terminations and renewals 17 26
Transfer of contract assets to trade receivables (21) (40)
Closing balance as at 30 June 11 15
68
Spark New Zealand Annual Report 2020 Notes to the financial statements
For
per
sona
l use
onl
y

3
Contract costsContract costs include costs to obtain a contract (such as commission costs) and costs to fulfil a contract. These costs are expected to be recovered and are therefore initially deferred and then recognised within operating expenses on a systematic basis that is consistent with the transfer to the customer of the goods or services to which the asset relates. The following summarises significant changes in those balances:
2020 2019COSTS TO OBTAIN A
CONTRACT
COSTS TO FULFIL A
CONTRACT TOTAL
COSTS TO OBTAIN A
CONTRACT
COSTS TO FULFIL A
CONTRACT TOTAL
YEAR ENDED 30 JUNE $M $M $M $M $M $M
Opening balance as at 1 July 37 91 128 41 80 121
Additions 12 25 37 17 37 54
Amortisation recognised in operating expenses (21) (31) (52) (21) (26) (47)
Closing balance as at 30 June 28 85 113 37 91 128
Short-term contract costs 15 32 47 18 29 47
Long-term contract costs 13 53 66 19 62 81
Key estimates and assumptionsDetermining the costs we incur to obtain or fulfil a contract that meet the deferral criteria within NZ IFRS 15 requires us to make significant judgements. Further, where such costs can be deferred, determining the appropriate amortisation period to recognise the costs within operating expenses requires management judgement, including assessing the expected average customer tenure for consumer customers and the expected contract term for enterprise customers.
Expected credit loss allowance provisionMovements in the loss allowance provision are as follows:
2020 2019YEAR ENDED 30 JUNE $M $M
Opening balance as at 1 July 30 31
Charged to costs and expenses1 24 19
Bad debts recovered (4) (5)
Utilised (19) (15)
Closing balance as at 30 June 31 30
1 Includes $6 million reflecting increased expected credit losses above our standard provisioning policies primarily as a result of COVID-19.
3.1 Receivables and prepayments (continued)
69Connections matterSpark New Zealand Annual Report 2020
For
per
sona
l use
onl
y

Notes to the financial statements: Assets
Spark has applied the simplified approach to providing for expected credit losses, which requires the recognition of a lifetime expected loss provision for trade receivables, unbilled revenue, contract assets, contract costs, finance lease receivables and other receivables. The calculation of the allowance provision incorporates forward-looking information, such as forecasted economic conditions.
The expected credit loss allowance provision has been determined as follows:
CURRENT ≤ 1 MONTH > 1 MONTH TOTAL
AS AT 30 JUNE 2020 $M $M $M $M
Expected loss rate 2.9% 2.6% 13.5% 3.3%
Gross carrying amount 876 39 37 952
Expected credit loss allowance provision 25 1 5 31
Short-term loss allowance provision 20 1 5 26
Long-term loss allowance provision 5 – – 5
The expected credit loss provision prior to assessing the impacts of COVID-19 reduced by $5 million to $25 million due to lower receivable balances which in turn reduced the provision level required. At 30 June 2020 an additional $6 million expected credit loss provision was recognised primarily due to forecasted changes in unemployment rates and gross domestic product in New Zealand resulting from COVID-19. As a result, the expected credit loss provision increased by a net $1 million during the year to $31 million.
AS AT 30 JUNE 2019 $M $M $M $M
Expected loss rate 2.4% 5.4% 22.7% 3.1%
Gross carrying amount 905 56 22 983
Expected credit loss allowance provision 22 3 5 30
Short-term loss allowance provision 14 3 5 22
Long-term loss allowance provision 8 – – 8
The composition of the credit loss allowance provision between receivable types is as follows:
2020 2019AS AT 30 JUNE $M $M
Trade receivables 13 13
Unbilled revenue 13 10
Contract assets and contract costs 3 2
Finance lease receivables 2 5
Expected credit loss allowance provision 31 30
The gross carrying amount of a financial asset is written off (either partially or in full) to the extent that there is no realistic prospect of recovery. This is generally the case when the Group determines that the debtor does not have assets or sources of income that could generate sufficient cash flows to repay the amounts subject to the write-off. However, financial assets that are written off could still be subject to enforcement activities to comply with the Group’s procedures for recovery of amounts due.
Key estimates and assumptionsThe expected credit loss allowance provision is determined based on assumptions about the risk of default and expected loss rates of customers and other counterparties. Spark uses judgement in making these assumptions and selecting the inputs to the impairment calculation based on Spark’s past collection history, existing market conditions, as well as forward-looking estimates at the end of the reporting period. Forward-looking estimates include assessment of forecasted changes to interest rates, unemployment rates and gross domestic product in New Zealand.
3.1 Receivables and prepayments (continued)
70
Spark New Zealand Annual Report 2020 Notes to the financial statements
For
per
sona
l use
onl
y

3
Finance lease receivablesSpark has a number of leases for space in exchange buildings, including as a lessor for space in Spark exchanges and a lessee for space in Chorus exchanges. These leases include a legal right of offset, as Spark and Chorus settle the payments on a net basis and are therefore shown as a net finance lease receivable on the statement of financial position.
In addition, Spark sub-leases a number of office building floors. Where sub-leases are for the whole of the remaining non-cancellable term of the head lease, these are classified as a finance lease.
The profile of lease net receipts is set out below:
2020 2019UNDISCOUNTED DISCOUNTED UNDISCOUNTED DISCOUNTED
AS AT 30 JUNE $M $M $M $M
Less than one year 17 16 13 12
Between one and five years 66 52 67 52
More than five years 309 92 322 92
Finance lease receivables 392 160 402 156
Less unearned finance income (232) – (246) –
Present value of finance lease receivables 160 160 156 156
Short-term finance lease receivables 16 12
Long-term finance lease receivables 144 144
The leases with Chorus have multiple rights of renewal and the full lease terms have been used in the calculation of the net financial lease receivable, as it is likely that due to the specialised nature of the buildings, the leases will be renewed to the maximum terms.
3.2 Inventories
2020 2019AS AT 30 JUNE $M $M
Goods held for resale 86 63
Content rights inventory 8 35
Maintenance materials and consumables 2 2
Total inventories 96 100
Content rights inventorySpark enters into contracts for the right to stream digital content for sport and previously to subscribers of Lightbox. Content rights are stated at the lower of cost and net realisable value, less accumulated amortisation and includes prepaid content that is not yet available for broadcast.
The amortisation of content rights is recognised within operating expenses on a straight-line basis over their licence periods or, for live sports content, over its broadcast period. The content rights amortisation charge for the year ended 30 June 2020 was $40 million (30 June 2019: $24 million).
3.1 Receivables and prepayments (continued)
71Connections matterSpark New Zealand Annual Report 2020
For
per
sona
l use
onl
y

Notes to the financial statements: Assets
3.3 Long-term investments
2020 2019AS AT 30 JUNE $M $M
Shares in Hutchison 247 156
Investment in associates and joint ventures 54 21
Other long-term investments 7 5
308 182
Spark holds a 10% interest in Hutchison Telecommunications Australia Limited (Hutchison) which is quoted on the Australian Securities Exchange (ASX) and its fair value is measured using the observable market share price as quoted on the ASX, classified as being within level one of the fair value hierarchy. As at 30 June 2020 the quoted price of Hutchison’s shares on the ASX was AUD$0.170 (30 June 2019: AUD$0.110). The increase in fair value of $91 million is recognised in other comprehensive income (30 June 2019: $87 million increase).
Investment in associates and joint venturesSpark’s investment in associates and joint ventures at 30 June 2020 consists of the following:
NAME TYPE COUNTRY OWNERSHIP PRINCIPAL ACTIVITY
Connect 8 Limited Joint Venture New Zealand 50% Fibre network construction
Flok Limited Associate New Zealand 38% Hardware and software development
Lightbox Sport General Partner Limited Joint Venture New Zealand 50% A holding company
NOW New Zealand Limited Associate New Zealand 36% Internet service provider
Pacific Carriage Holdings Limited Associate Bermuda 38% A holding company
Pacific Carriage Holdings Limited Inc Associate United States 35% A holding company
PropertyNZ Limited (homes.co.nz) Associate New Zealand 22% Property data website
Rural Connectivity Group Limited Joint Venture New Zealand 33% Rural broadband
Southern Cross Cables Holdings Limited Associate Bermuda 35% A holding company
TNAS Limited Joint Venture New Zealand 50% Telecommunications development
All investments in associates and joint ventures are measured using the equity method and none are considered to be individually material. Changes in the aggregate carrying amount of Spark’s investment in associates and joint ventures was as follows:
2020 2019ASSOCIATES JOINT VENTURES TOTAL ASSOCIATES JOINT VENTURES TOTAL
YEAR ENDED 30 JUNE $M $M $M $M $M $M
Opening balance as at 1 July 9 12 21 10 11 21
Opening value on transfer to equity method – – – – – –
Additional investment during the year 22 10 32 2 1 3
Disposals – – – (2) – (2)
Share of net profits/(losses) – 1 1 (1) – (1)
Closing balance as at 30 June 31 23 54 9 12 21
Spark has suspended equity accounting for Pacific Carriage Holdings Limited and Southern Cross Cables Holdings Limited (together ‘Southern Cross’) as their carrying values were reduced to nil. Spark has no obligation to fund Southern Cross’ deficits or repay dividends. For the year ended 30 June 2020 Spark’s share of Southern Cross profits not recognised due to the existence of historic cumulative Southern Cross deficits was $51 million (30 June 2019: $57 million).
72
Spark New Zealand Annual Report 2020 Notes to the financial statements
For
per
sona
l use
onl
y

3
3.4 Right-of-use assets
Spark is a lessee for a large number of leases, including:
• Property – Spark leases a number of office buildings and retail stores. These leases generally have rights of renewal that are reasonably certain to be exercised and therefore may have long effective lease terms;
• Capacity arrangements – Spark enters into a number of indefeasible right of use capacity arrangements for cable capacity;
• Mobile sites – Spark has entered into a number of agreements to allow the operation of mobile network infrastructure throughout New Zealand;
• Motor vehicles – Spark leases motor vehicles for use in sales, field operations and maintenance of infrastructure equipment; and
• Other – Spark leases equipment that is held at Spark premises and used to provide services to customers.
Movements in right-of-use assets are summarised below:
PROPERTY CAPACITYMOBILE
SITESMOTOR
VEHICLES OTHER TOTAL
YEAR ENDED 30 JUNE 2020 $M $M $M $M $M $M
Opening net book value 287 243 94 1 – 625
Additions 79 11 13 2 33 138
Disposals (8) – – – – (8)
Remeasurements 2 – 5 – – 7
Depreciation charge (27) (21) (10) (1) (5) (64)
Closing net book value 333 233 102 2 28 698
PROPERTY CAPACITYMOBILE
SITESMOTOR
VEHICLES OTHER TOTAL
YEAR ENDED 30 JUNE 2019 $M $M $M $M $M
Opening net book value 306 254 65 2 – 627
Additions 5 11 28 – – 44
Remeasurements 2 – 8 – – 10
Depreciation charge (26) (22) (7) (1) – (56)
Closing net book value 287 243 94 1 – 625
All capacity additions for the year ended 30 June 2020 were fully paid on control being obtained and therefore deemed capital expenditure as reconciled in note 2.5 (30 June 2019: all fully paid and deemed capital expenditure).
Income from sub-leasing right-of-use assets for the year ended 30 June 2020 was $1 million (30 June 2019: $3 million).
73Connections matterSpark New Zealand Annual Report 2020
For
per
sona
l use
onl
y

Notes to the financial statements: Assets
Key estimates and assumptionsAt inception of a contract Spark assesses whether a contract is, or contains, a lease. A contract is, or contains, a lease if the contract conveys the right to control the use of an identified asset for a period of time in exchange for consideration. To assess whether a contract conveys the right to control the use of an identified asset, Spark assesses whether:
• The contract involves the use of an identified asset;
• Spark has the right to obtain substantially all of the economic benefits from use of the asset throughout the period of use; and
• Spark has the right to direct the use of the asset.
At inception or on reassessment of a contract that contains a lease component, Spark allocates the consideration in the contract to each lease component on the basis of their relative stand-alone prices. Spark recognises a right-of-use asset at the lease commencement date. The right-of-use asset is initially measured at cost, which comprises the initial amount of the lease liability adjusted for any lease payments made at or before the commencement date, plus any initial direct costs incurred and an estimate of costs to dismantle and remove the underlying asset or to restore the underlying asset or the site on which it is located, less any lease incentives received.
The right-of-use asset is subsequently depreciated using the straight-line method from the commencement date to the earlier of the end of the useful life of the right-of-use asset or the end of the lease term. The estimated useful lives of right-of-use assets are determined on the same basis as those of property and equipment. In addition, the right-of-use asset is periodically assessed for impairment losses and adjusted for certain remeasurements of the lease liability.
3.5 Leased customer equipment assets
Spark acts as the intermediate party (as a lessee and a lessor) in a number of back-to-back lease arrangements for customer premises equipment. Such arrangements may also include an initial sale and leaseback transaction. A sale and leaseback transaction contains a genuine sale if control of an asset is transferred under NZ IFRS 15. For Spark’s back-to-back lease arrangements we have assessed that a sale does not occur as control over the equipment remains with Spark instead of passing to the buyer-lessor.
Spark as the seller-lessee continues to recognise the leased customer equipment asset, which is initially measured at cost. The asset is subsequently depreciated using the straight-line method based on the expected lease term. Movements in leased customer equipment assets are summarised below:
2020 2019YEAR ENDED 30 JUNE $M $M
Opening net book value 55 31
Additions 61 42
Disposals (3) –
Depreciation charge (27) (18)
Closing net book value 86 55
2020 2019AS AT 30 JUNE $M $M
Cost 158 100
Accumulated depreciation and impairment losses (72) (45)
Closing net book value 86 55
Leased customer equipment assets are on-leased to customers under operating leases. Amounts recovered from customers for the year ended 30 June 2020 were $31 million (30 June 2019: $19 million).
3.4 Right-of-use assets (continued)
74
Spark New Zealand Annual Report 2020 Notes to the financial statements
For
per
sona
l use
onl
y

3
3.6 Property, plant and equipment
TELECOMMUNI- CATIONS
EQUIPMENT AND PLANT FREEHOLD LAND BUILDINGS OTHER ASSETS
WORK IN PROGRESS TOTAL
YEAR ENDED 30 JUNE 2020 $M $M $M $M $M $M
Opening net book value 623 60 199 125 5 1,012
Additions – – 29 – 213 242
Transfers 166 – 1 49 (216) –
Disposals – – – (6) – (6)
Depreciation charge (148) – (31) (54) – (233)
Closing net book value 641 60 198 114 2 1,015
AS AT 30 JUNE 2020
Cost 3,818 60 562 569 2 5,011
Accumulated depreciation and impairment losses (3,177) – (364) (455) – (3,996)
Closing net book value 641 60 198 114 2 1,015
TELECOMMUNI- CATIONS
EQUIPMENT AND PLANT FREEHOLD LAND BUILDINGS OTHER ASSETS
WORK IN PROGRESS TOTAL
YEAR ENDED 30 JUNE 2019 $M $M $M $M $M $M
Opening net book value 638 60 208 126 7 1,039
Additions – – 21 – 196 217
Transfers 146 – – 52 (198) –
Impairments – – 2 – – 2
Depreciation charge (161) – (32) (53) – (246)
Closing net book value 623 60 199 125 5 1,012
AS AT 30 JUNE 2019
Cost 4,035 60 561 649 5 5,310
Accumulated depreciation and impairment losses (3,412) – (362) (524) – (4,298)
Closing net book value 623 60 199 125 5 1,012
75Connections matterSpark New Zealand Annual Report 2020
For
per
sona
l use
onl
y

Notes to the financial statements: Assets
Joint arrangementSpark has entered into a joint arrangement in relation to the construction and operation of the Tasman Global Access fibre-optic submarine cable between Australia and New Zealand. As at 30 June 2020 the carrying value of Spark’s share of property, plant and equipment and intangible assets in the joint operation was $31 million (30 June 2019: $33 million).
Key estimates and assumptionsSpark’s property, plant and equipment is measured at cost and depreciation is charged on a straight-line basis over the assets’ estimated useful lives. Determining the appropriate useful life of property, plant and equipment requires management judgement, including the expected period of service potential, the likelihood technological advances will make the asset obsolete, the likelihood of Spark ceasing to use it and the effect of government regulation.
The estimated useful lives of Spark’s property, plant and equipment is as follows:
Telecommunications equipment and plantJunctions and trunk transmission systems 10 – 50 years
Switching equipment 5 – 12 years
Customer premises equipment 3 – 5 years
Airconditioning equipment 10 – 20 years
Network management systems 2 – 5 years
Batteries 5 – 15 years
Power and building equipment 10 – 25 years
Buildings 9 – 50 years
Other assets Motor vehicles 6 years
Furniture and fittings 2 – 25 years
Computer equipment 3 – 5 years
The assessment of assets for impairment is based on a large number of factors, such as changes in current competitive conditions, expectations of growth in the telecommunications industry, the discontinuance of services, the expected future cash flows an asset is expected to generate and other changes in circumstances that indicate an impairment exists. Key judgements include rates of expected revenue growth or decline, expected future margins and the selection of an appropriate discount rate for valuing future cash flows.
3.6 Property, plant and equipment (continued)
76
Spark New Zealand Annual Report 2020 Notes to the financial statements
For
per
sona
l use
onl
y

3
3.7 Intangible assets
SOFTWARESPECTRUM
LICENCESOTHER
INTANGIBLES GOODWILLWORK IN
PROGRESS TOTAL
YEAR ENDED 30 JUNE 2020 $M $M $M $M $M $M
Opening net book value 312 163 78 213 221 987
Additions1 – 13 – – 121 134
Transfers 173 – 10 – (183) –
Acquisitions – – 1 9 – 10
Disposals (5) (1) – – – (6)
Impairments (2) – – – – (2)
Amortisation charge (127) (17) (11) – – (155)
Closing net book value 351 158 78 222 159 968
AS AT 30 JUNE 2020
Cost 1,985 282 141 270 159 2,837
Accumulated amortisation and impairment losses (1,634) (124) (63) (48) – (1,869)
Closing net book value 351 158 78 222 159 968
1 Total software capitalised in the year ended 30 June 2020 includes $42 million of internally generated assets. Other software capitalised in the year includes software licenses and externally supplied labour.
SOFTWARESPECTRUM
LICENCESOTHER
INTANGIBLES GOODWILLWORK IN
PROGRESS TOTAL
YEAR ENDED 30 JUNE 2019 $M $M $M $M $M $M
Opening net book value 314 179 82 213 168 956
Additions1 – – – – 189 189
Transfers 132 – 4 – (136) –
Disposals (1) – – – – (1)
Amortisation charge (133) (16) (8) – – (157)
Closing net book value 312 163 78 213 221 987
AS AT 30 JUNE 2019
Cost 2,071 271 131 261 221 2,955
Accumulated amortisation and impairment losses (1,759) (108) (53) (48) – (1,968)
Closing net book value 312 163 78 213 221 987
1 Total software capitalised in the year ended 30 June 2019 includes $19 million of internally generated assets. Other software capitalised in the year includes software licenses and externally supplied labour.
Key estimates and assumptionsIntangible assets are amortised over their useful lives on a straight-line basis, except goodwill, which is tested for impairment annually. Determining the appropriate useful life of an intangible asset requires management judgement, including assessing the expected period of service potential, the likelihood technological advances will make it obsolete and the likelihood of Spark ceasing to use it.
The estimated useful lives of Spark intangible assets is as follows:
Software 2 – 8 years
Spectrum licences 17 – 20 years
Other intangible assetsCustomer contracts and brands 5 – 10 years
Other intangible assets 5 – 80 years
77Connections matterSpark New Zealand Annual Report 2020
For
per
sona
l use
onl
y

Notes to the financial statements: Assets
GoodwillGoodwill by cash-generating unit (CGU) is presented below:
2020 2019AS AT 30 JUNE $M $M
Mobile 28 28
Cloud, security and service management 167 167
Qrious 14 5
Digital Island 13 13
222 213
During the years ended 30 June 2020 and 30 June 2019 no impairment arose as a result of the assessment of goodwill. Headroom currently exists in each CGU and, based on sensitivity analysis performed, no reasonably possible changes in the assumptions, including anticipated COVID-19 impact, would cause the carrying amount of the CGUs to exceed their recoverable amounts.
Key estimates and assumptionsGoodwill is assessed annually for impairment by estimating the future cash flows, based on Board-approved business plans, which reflect the anticipated impact of COVID-19, with key assumptions being forecast earnings and capital expenditure for each CGU. The forecast financial information is based on both past experience and future expectations of CGU performance. The major inputs and assumptions used in performing an impairment assessment that require judgement include revenue forecasts, operating cost projections, customer numbers and customer churn, discount rates, growth rates and future technology paths.
Nil terminal growth was applied to all CGUs and a pre-tax discount rate of 8.8% was utilised for the year ended 30 June 2020 (30 June 2019: 10.1%).
3.8 Net tangible assets
The calculation of Spark’s net tangible assets per share and its reconciliation to the statement of financial position is presented below:
2020 2019AS AT 30 JUNE $M $M
Total assets 4,347 4,095
Less intangible assets (968) (987)
Less total liabilities (2,854) (2,630)
Net tangible assets 525 478
Number of shares outstanding (in millions) 1,837 1,836
Net tangible assets per share $0.29 $0.26
Net tangible assets per share is a non-GAAP financial measure that is not defined in NZ IFRS. Total assets includes right-of-use assets and total liabilities includes lease liabilities.
3.7 Intangible assets (continued)
78
Spark New Zealand Annual Report 2020 Notes to the financial statements
For
per
sona
l use
onl
y

4
Section 4 Liabilities and equity
4.1 Payables, accruals and provisions
2020 2019AS AT 30 JUNE $M $M
Short–term payables, accruals and provisions
Trade accounts payable 237 258
Revenue billed in advance 74 84
Accrued personnel costs 38 45
Accrued interest 2 4
GST payable 37 35
Short–term sale and leaseback liabilities 31 14
Short–term provisions 6 3
Other short–term payables and accruals 38 4
463 447
Long–term payables, accruals and provisions
Long–term sale and leaseback liabilities 58 43
Long–term provisions 5 4
Other long–term payables & accruals 18 21
81 68
Trade accounts payable and sale and leaseback liabilities are financial instruments and held at amortised cost.
ProvisionsTotal provisions as at 30 June 2020 were $11 million (30 June 2019: $7 million). New provisions of $7 million were made during the year (30 June 2019: $3 million) and provisions of $3 million were utilised or released (30 June 2019: $15 million).
The largest portion of the provisions relate to make-good provisions of $7 million (30 June 2019: $4 million).
Notes to the financial statements: Liabilities and equity
79Connections matterSpark New Zealand Annual Report 2020
For
per
sona
l use
onl
y

Notes to the financial statements: Liabilities and equity
4.2 Lease liabilities
PROPERTY CAPACITYMOBILE
SITESMOTOR
VEHICLES OTHER TOTAL
YEAR ENDED 30 JUNE 2020 $M $M $M $M $M $M
Opening lease liability balance 394 2 93 1 – 490
Leases entered into during the year 77 – 9 2 31 119
Disposals (9) – – – – (9)
Interest expense 24 – 6 – 1 31
Principal repayments (46) – (14) (1) (6) (67)
Remeasurements 3 – 5 – – 8
Closing lease liability balance 443 2 99 2 26 572
Short–term lease liabilities 25 – 8 1 7 41
Long–term lease liabilities 418 2 91 1 19 531
Lease liabilities – non–cancellable commitments1 198 2 13 2 26 241
PROPERTY CAPACITYMOBILE
SITESMOTOR
VEHICLES OTHER TOTAL
YEAR ENDED 30 JUNE 2019 $M $M $M $M $M $M
Opening lease liability balance 406 2 64 2 – 474
Leases entered into during the year 5 – 28 – – 33
Interest expense 25 – 5 – – 30
Principal repayments (44) – (11) (1) – (56)
Remeasurements 2 – 7 – – 9
Closing lease liability balance 394 2 93 1 – 490
Short–term lease liabilities 23 – 7 1 – 31
Long–term lease liabilities 371 2 86 – – 459
Lease liabilities – non–cancellable commitments1 189 2 37 1 – 229
1 Relates to the discounted lease liability for future minimum rental commitments for non–cancellable periods of leases, excluding rights of renewal, which are at Spark’s option.
80
Spark New Zealand Annual Report 2020 Notes to the financial statements
For
per
sona
l use
onl
y

4
Key estimates and assumptionsSpark recognises a lease liability at the lease commencement date. The lease liability is initially measured at the present value of the lease payments that are not paid at the commencement date, discounted using the interest rate implicit in the lease or, if that rate cannot be readily determined, Spark’s incremental borrowing rate. Generally, Spark uses its incremental borrowing rate as the discount rate, with adjustments for the type and term of the lease.
Lease payments included in the measurement of the lease liability comprise:
• Fixed payments, including in–substance fixed payments;
• Variable lease payments that depend on an index or a rate, initially measured using the index or rate as at the commencement date;
• Amounts expected to be payable under a residual value guarantee;
• The exercise price under a purchase option that Spark is reasonably certain to exercise; and
• Lease payments in an optional renewal period if Spark is reasonably certain to exercise an extension option.
The lease liability is measured at amortised cost using the effective interest method. It is remeasured when there is a change in future lease payments arising from a change in an index or rate, if there is a change in Spark’s estimate of the amount expected to be payable under a residual value guarantee or if Spark changes its assessment of whether it will exercise a purchase or extension option.
When the lease liability is remeasured in this way, a corresponding adjustment is made to the carrying amount of the right–of–use asset or is recorded in profit or loss if the carrying amount of the right–of–use asset has been reduced to zero.
Spark has elected not to recognise right–of–use assets and lease liabilities for short–term leases that have lease terms of 12 months or less and leases of low–value assets. Spark recognises the lease payments associated with these leases within operating expenses on a straight–line basis over their lease terms.
4.2 Lease liabilities (continued)
81Connections matterSpark New Zealand Annual Report 2020
For
per
sona
l use
onl
y

Notes to the financial statements: Liabilities and equity
4.3 Debt
Debt is recognised initially at fair value less attributable transaction costs. Subsequent to initial recognition, debt is classified and measured at amortised cost plus, for hedged liabilities that are in a fair value hedging relationship, adjustments for fair value changes attributable to the risk being hedged. Any difference between cost and redemption value (including fair value changes) is recognised in the statement of profit or loss over the period of the borrowings, using the effective interest rate method.
2020 2019AS AT 30 JUNE $M $M
FACE VALUE FACILITY COUPON RATE MATURITY
Short–term debt
Commercial paper Variable < 5 months 228 150
228 150
Bank funding
The Hongkong and Shanghai Banking Corporation Limited 100 million NZD Variable 30/11/2021 50 40
MUFG Bank, Ltd 125 million NZD Variable 30/11/2022 100 100
150 140
Domestic notes
250 million NZD 5.25% 25/10/2019 – 250
100 million NZD 4.50% 25/03/2022 103 103
100 million NZD 4.51% 10/03/2023 108 107
125 million NZD 3.37% 07/03/2024 135 130
125 million NZD 3.94% 07/09/2026 140 131
486 721
Foreign currency Medium Term Notes
Euro Medium Term Notes – 18 million GBP1 5.75% 06/04/2020 – 33
Australian Medium Term Notes – 100 million AUD 1.90% 05/06/2026 107 –
Australian Medium Term Notes – 150 million AUD 4.00% 20/10/2027 185 173
Australian Medium Term Notes – 125 million AUD 2.60% 18/03/2030 139 –
Norwegian Medium Term Notes – 1 billion NOK2 3.07% 19/03/2029 177 178
608 384
1,472 1,395
Debt due within one year 228 433
Long–term debt 1,244 962
1 British pounds sterling.2 Norwegian krone.
None of Spark’s debt is secured and all debt ranks equally with other liabilities. There are no financial covenants over Spark’s debt, however, there are certain triggers in the event of default, as defined in the various debt agreements. There have been no events of default over Spark’s debt in the years ended 30 June 2020 and 30 June 2019.
The fair value of long–term debt, including long-term debt due within one year, (calculated based on the present value of future principal and interest cash flows, discounted at market interest rates at balance date) was $1,254 million compared to a carrying value of $1,244 million as at 30 June 2020 (30 June 2019: fair value of $1,258 million compared to a carrying value of $1,245 million).
2020 2019AS AT 30 JUNE $M $M
Total debt 1,472 1,395
Less short-term debt (228) (150)
Total long-term debt (including long-term debt due within one year) 1,244 1,245
82
Spark New Zealand Annual Report 2020 Notes to the financial statements
For
per
sona
l use
onl
y

4
4.4 Capital risk management
Spark manages its capital considering shareholders’ interests, the value of Spark’s assets and the Company’s credit rating. The Board continues to be committed to the Company maintaining a single ‘A Band’ credit rating and its capital management policies are designed to ensure this objective is met. As part of this commitment Spark manages its debt levels to ensure that the ratio of net debt at hedged rates (being inclusive of associated derivatives) to EBITDAI does not materially exceed 1.4 times on a long–run basis, which, for credit rating agency purposes, Spark estimates equates approximately to adjusted debt to EBITDA of 1.7 times. The difference between these two ratios is primarily due to the credit rating agency making adjustments for leases and captive finance operations.
As at 30 June 2020 the Company’s Standard & Poor’s credit ratings for long–term and short–term debt was A– and A–2 respectively, with outlook stable (30 June 2019: same).
Net debtNet debt at hedged rates, the primary net debt measure Spark monitors, includes long–term debt at the value of hedged cash flows due to arise on maturity, plus short–term debt, less any cash. Net debt at carrying value includes the non–cash impact of fair value hedge adjustments and any unamortised discount.
Net debt at hedged rates is a non–GAAP measure and is not defined in accordance with NZ IFRS but is a measure used by management. A reconciliation of net debt at hedged rates and net debt at carrying value is provided below:
2020 2019AS AT 30 JUNE $M $M
Cash (53) (54)
Short–term debt at face value 228 150
Long–term debt at face value 1,162 1,205
Net debt at face value 1,337 1,301
To retranslate debt balances at swap rates where hedged by currency swaps 12 15
Net debt at hedged rates1 1,349 1,316
Non–cash adjustments
Impact of fair value hedge adjustments2 48 31
Unamortised discount – –
Net debt at carrying value 1,397 1,347
1 Net debt at the value of hedged cash flows due to arise on maturity and includes adjustment to state principal of foreign currency medium term notes at the hedged currency rate.
2 Fair value hedge adjustments arise on domestic notes in fair value hedges and foreign currency medium term notes in dual fair value and cash flow hedges. These have no impact on the cash flows to arise on maturity.
A reconciliation of movements in net debt is provided below:
CASH FLOWS NON–CASH MOVEMENTS
YEAR ENDED 30 JUNE 2020
AS AT 1 JULY 2019
$MPROCEEDS
$MPAYMENTS
$M
INTEREST AMORTISATION
$M
FAIR VALUE CHANGES
$M
FOREIGN EXCHANGE
MOVEMENT$M
OTHER$M
AS AT 30 JUNE 2020
$M
Cash (54) (6,945) 6,946 – – – – (53)
Short–term debt 150 1,150 (1,075) 3 – – – 228
Long–term debt 1,245 1,847 (1,882) – 44 (9) (1) 1,244
Derivatives 6 278 (288) – (27) 9 – (22)
Net debt 1,347 (3,670) 3,701 3 17 – (1) 1,397
CASH FLOWS NON–CASH MOVEMENTS
YEAR ENDED 30 JUNE 2019
AS AT 1 JULY 2018
$MPROCEEDS
$MPAYMENTS
$M
INTEREST AMORTISATION
$M
FAIR VALUE CHANGES
$M
FOREIGN EXCHANGE
MOVEMENT$M
OTHER$M
AS AT 30 JUNE 2019
$M
Cash (55) (7,049) 7,050 – – – – (54)
Short–term debt 149 1,358 (1,361) 4 – – – 150
Long–term debt 1,048 2,039 (1,880) 2 38 (1) (1) 1,245
Derivatives 14 169 (171) – (9) 3 – 6
Net debt 1,156 (3,483) 3,638 6 29 2 (1) 1,347
83Connections matterSpark New Zealand Annual Report 2020
For
per
sona
l use
onl
y

Notes to the financial statements: Liabilities and equity
4.5 Equity and dividends
Share capitalMovements in the Company’s issued ordinary shares were as follows:
2020 2019YEAR ENDED 30 JUNE NUMBER NUMBER
Shares at the beginning of the year 1,836,191,581 1,835,390,783
Issuance of shares under share schemes and other transfers 853,362 800,798
Shares at the end of the year 1,837,044,943 1,836,191,581
All issued shares are fully paid and have no par value. Shareholders of ordinary shares have the right to vote at any general meeting of the Company.
Dividends declared and paid2020 2019
YEAR ENDED 30 JUNECENTS
PER SHARE $MCENTS
PER SHARE $M
Previous year second half–year dividend paid 12.5 230 12.5 229
First half–year dividend paid 12.5 229 12.5 230
Total dividends paid in the year 25.0 459 25.0 459
Second half–year dividend declared subsequent to balance date not provided for 12.5 230 12.5 230
Events after balance dateOn 26 August 2020 the Board approved the payment of a second-half ordinary dividend of 12.5 cents per share or approximately $230 million. This ordinary dividend will be 100% imputed. In addition, supplementary dividends totalling approximately $26 million will be payable to shareholders who are not resident in New Zealand. In accordance with the Income Tax Act 2007, Spark will receive a tax credit from Inland Revenue equivalent to the amount of supplementary dividends paid.
84
Spark New Zealand Annual Report 2020 Notes to the financial statements
For
per
sona
l use
onl
y

4
4.5 Equity and dividends (continued)
H1 FY20 H2 FY20 ORDINARY DIVIDENDS ORDINARY DIVIDENDS
Dividends declared
Ordinary shares 12.5 cents 12.5 cents
American Depositary Shares1 36.69 US cents 41.03 US cents
Imputation
Percentage imputed 75% 100%
Imputation credits per share 3.6458 cents 4.8611 cents
Supplementary dividend per share2 1.6544 cents 2.2059 cents
‘Ex’ dividend dates
New Zealand Stock Exchange 12/03/20 17/09/2020
Australian Securities Exchange 12/03/20 17/09/2020
American Depositary Shares 12/03/20 17/09/2020
Record dates
New Zealand Stock Exchange 13/03/20 18/09/2020
Australian Securities Exchange 13/03/20 18/09/2020
American Depositary Shares 13/03/20 18/09/2020
Payment dates
New Zealand and Australia 3/04/20 2/10/2020
American Depositary Shares 17/04/20 13/10/2020
1 For H2 FY20 these are based on the exchange rate at 20 August 2020 of NZ$1 to US$0.6564 and a ratio of five ordinary shares per one American Depositary Share. The actual exchange rate used for conversion is determined in the week prior to payment when the Bank of New York performs the physical currency conversion.
2 Supplementary dividends are paid to non–resident shareholders.
Dividend Reinvestment PlanThe dividend reinvestment plan has been reinstated for the H2 FY20 dividend after being suspended in 2015. Shares issued under the dividend reinvestment plan will be issued at a 2% discount to the prevailing market price around the time of issue. The last date for shareholders to elect to participate in the dividend reinvestment plan for the H2 FY20 dividend is 21 September 2020.
If shareholders previously participated in the dividend reinvestment plan they will need to re-elect to participate. Previous elections have not been retained.
Spark’s Dividend Reinvestment Plan Offer Document and Participation Notice can be found on Spark’s Investor Centre Website: investors.sparknz.co.nz.
85Connections matterSpark New Zealand Annual Report 2020
For
per
sona
l use
onl
y

Notes to the financial statements: Financial instruments
Section 5 Financial instruments
5.1 Derivatives and hedge accounting
2020 2019DERIVATIVE
ASSETSDERIVATIVE LIABILITIES
DERIVATIVE ASSETS
DERIVATIVE LIABILITIES
AS AT 30 JUNE $M $M $M $M
Designated in a cash flow hedge 1 (155) 4 (119)
Designated in a fair value hedge 35 – 21 –
Designated in a dual fair value and cash flow hedge 22 – 6 –
Other 3 (6) 3 (6)
61 (161) 34 (125)
Short-term derivatives 1 (5) 2 (14)
Long-term derivatives 60 (156) 32 (111)
Spark’s derivatives are held at fair value, calculated using discounted cash flow models and observable market rates of interest and foreign exchange and electricity prices. This represents a level two measurement under the fair value measurement hierarchy, being inputs other than quoted prices included within level one that are observable for the asset or liability. As at 30 June 2020 and 30 June 2019 no derivative financial assets or derivative financial liabilities have been offset in the statement of financial position. The potential for offsetting of any derivative financial instruments is $39 million (30 June 2019: was deemed immaterial).
Hedge accountingDerivatives are hedge accounted when they are designated into an effective hedge relationship as a hedging instrument. The nature and the effectiveness of the hedge accounting relationship will determine where the gains and losses on remeasurement are recognised. Derivatives are designated:
• Fair value hedges, where the derivative is used to manage interest rate risk in relation to debt;
• Cash flow hedges, where the derivative is used to manage the variability in cash flows of highly probable forecast transactions; and
• Dual fair value and cash flow hedges, where the derivative is used to hedge the interest rate risk on foreign debt and the variability in cash flows due to movements in foreign exchange rates.
At inception, each hedge relationship is formalised in hedge documentation. Hedge accounting is discontinued when the hedge instrument expires or is sold, terminated, exercised or no longer qualifies for hedge accounting. Spark determines the existence of an economic relationship between the hedging instrument and the hedged item based on the currency, amount and timing of respective cash flows, reference interest rates, tenors (time to maturity), repricing dates, maturities and notional amounts. Spark assesses whether the derivative designated in each hedging relationship is expected to be, and has been, effective in offsetting the changes in cash flows of the hedged item using the hypothetical derivative method.
Derivatives in hedge relationships are designated based on a hedge ratio of 1:1. In these hedge relationships the main source of ineffectiveness is the effect of the counterparty and Spark’s own credit risk on the fair value of the derivatives, which is not reflected in the change in the fair value of the hedged item attributable to changes in foreign exchange and interest rates.
Cash flow hedgesCross-currency interest rate swaps and interest rate swaps are jointly designated in cash flow hedges to manage interest and foreign exchange rate risk on debt. The hedged cash flows will affect Spark’s statement of profit or loss and other comprehensive income as interest and principal amounts are repaid over the remaining term of the debt.
Interest rate swaps are designated in cash flow hedges to manage the interest rate exposure of highly probable forecast variable rate debt and aggregate variable interest rate exposures created by swapping local or foreign currency fixed-rate debt into variable rate debt.
Electricity hedge contracts are designated in cash flow hedges to reduce electricity price risk from price fluctuations. These hedge contracts establish the price at which future specified quantities of electricity are purchased and settled. Any resulting differential to be paid or received is recognised as a component of electricity costs through the term of the contracts.
Spark also enters into forward exchange contracts to hedge forecast foreign currency purchases, the majority expected to be made within 12 months. The related cash flows are recognised in the statement of profit or loss and other comprehensive income over this period.
86
Spark New Zealand Annual Report 2020 Notes to the financial statements
For
per
sona
l use
onl
y

5
A reconciliation of movements in the cash flow hedge reserve, net of tax, is outlined below:
2020 2019YEAR ENDED 30 JUNE $M $M
Opening balance as at 1 July (85) (26)
Loss recognised in other comprehensive income (49) (63)
Amount reclassified to finance expense 8 3
Amount reclassified to property, plant and equipment/intangible assets and inventory 6 1
Total movements to other comprehensive loss (35) (59)
Closing balance as at 30 June (120) (85)
Other amounts deferred in equity will be transferred to the statement of profit or loss over the next five years (30 June 2019: six years). As at 30 June 2020 the cost of hedging reserve was $2 million (30 June 2019: $1 million). The movement in the hedge reserves includes $49 million in the change in fair value of interest rate swaps less $14 million associated deferred tax.
Fair value hedgesInterest rate swaps are designated in a fair value hedge to manage interest rate risk in relation to debt. The gain or loss from remeasuring the interest rate swaps and debt at fair value is recognised in the statement of profit or loss and other comprehensive income. During the year ended 30 June 2020 there has been no material ineffectiveness on fair value hedging relationships (30 June 2019: no material ineffectiveness).
Dual fair value and cash flow hedgesSpark has Australian dollar (AUD) and Norwegian Krone (NOK) denominated debt. As part of Spark’s risk management policy, cross-currency interest rate swaps (CCIRSs) are entered into to convert all of the proceeds of the debt issuances to New Zealand dollars and convert the foreign currency fixed rate of the debt issuance to a New Zealand dollar floating rate. To mitigate profit or loss volatility, the CCIRSs were designated into a dual fair value and cash flow hedge relationship. The foreign currency basis element of the CCIRSs are excluded from the designation and are separately recognised in other comprehensive income in a cost of hedging reserve.
For fair value hedges, the gain or loss from remeasuring the CCIRSs and debt at fair value is recognised in the statement of profit or loss and other comprehensive income. For cash flow hedges, gains or losses deferred in the cash flow hedge reserve will be reclassified to Spark’s statement of profit or loss and other comprehensive income as interest and principal amounts are repaid over the remaining term of the debt.
The change in fair value of the hedging instruments relating to the foreign currency basis component of the CCIRS is recognised in other comprehensive income and accumulated in a cost of hedging equity reserve. Subsequently, the cumulative amount is transferred to profit or loss at the same time as the hedged item impacts profit or loss.
5.1 Derivatives and hedge accounting (continued)
87Connections matterSpark New Zealand Annual Report 2020
For
per
sona
l use
onl
y
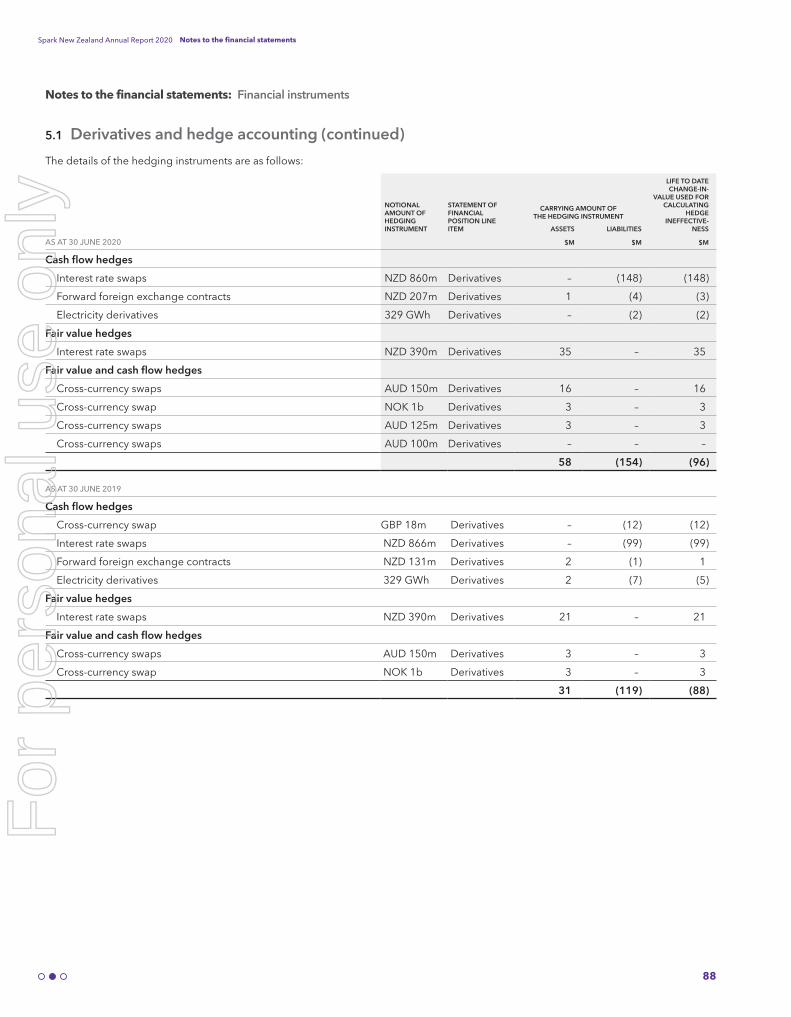
Notes to the financial statements: Financial instruments
The details of the hedging instruments are as follows:
NOTIONAL AMOUNT OF HEDGING INSTRUMENT
STATEMENT OF FINANCIAL POSITION LINE ITEM
CARRYING AMOUNT OF THE HEDGING INSTRUMENT
LIFE TO DATE CHANGE-IN-
VALUE USED FOR CALCULATING
HEDGE INEFFECTIVE-
NESSASSETS LIABILITIES
AS AT 30 JUNE 2020 $M $M $M
Cash flow hedges
Interest rate swaps NZD 860m Derivatives – (148) (148)
Forward foreign exchange contracts NZD 207m Derivatives 1 (4) (3)
Electricity derivatives 329 GWh Derivatives – (2) (2)
Fair value hedges
Interest rate swaps NZD 390m Derivatives 35 – 35
Fair value and cash flow hedges
Cross-currency swaps AUD 150m Derivatives 16 – 16
Cross-currency swap NOK 1b Derivatives 3 – 3
Cross-currency swaps AUD 125m Derivatives 3 – 3
Cross-currency swaps AUD 100m Derivatives – – –
58 (154) (96)
AS AT 30 JUNE 2019
Cash flow hedges
Cross-currency swap GBP 18m Derivatives – (12) (12)
Interest rate swaps NZD 866m Derivatives – (99) (99)
Forward foreign exchange contracts NZD 131m Derivatives 2 (1) 1
Electricity derivatives 329 GWh Derivatives 2 (7) (5)
Fair value hedges
Interest rate swaps NZD 390m Derivatives 21 – 21
Fair value and cash flow hedges
Cross-currency swaps AUD 150m Derivatives 3 – 3
Cross-currency swap NOK 1b Derivatives 3 – 3
31 (119) (88)
5.1 Derivatives and hedge accounting (continued)
88
Spark New Zealand Annual Report 2020 Notes to the financial statements
For
per
sona
l use
onl
y

5
The details of hedged items are as follows:
STATEMENT OF FINANCIAL POSITION
LINE ITEM
CARRYING AMOUNT OF THE HEDGED ITEM
ACCUMULATED AMOUNT OF FAIR VALUE HEDGE ADJUSTMENTS ON THE HEDGED ITEM INCLUDED
IN THE CARRYING AMOUNT OF THE HEDGED ITEM
LIFE TO DATE CHANGE-IN-
VALUE USED FOR CALCULATING
HEDGE INEFFECTIVE-
NESS
ASSETS LIABILITIES ASSETS LIABILITIES
AS AT 30 JUNE 2020 $M $M $M $M $M
Cash flow hedges
Aggregated variable interest rate exposure – – – – – 138
Highly probable forecast variable rate debt – – – – – 10
Committed foreign exchange transactions – – – – – 3
Highly probable forecast purchases of electricity – – – – – 2
Fair value hedges
Domestic Notes Long–term debt – (426) – (36) (35)
Fair value and cash flow hedges
Australian Medium Term Note (AUD 150m) Long–term debt – (185) – (26) (16)
Norwegian Medium Term Note (NOK 1b) Long–term debt – (178) – (17) (3)
Australian Medium Term Note (AUD 125m) Long–term debt – (139) – (6) (3)
Australian Medium Term Note (AUD 100m) Long–term debt – (107) – – –
– (1,035) – (85) 96
AS AT 30 JUNE 2019
Cash flow hedges
Euro Medium Term Note (GBP 18m) Long–term debt – (33) – – 12
Aggregated variable interest rate exposure – – – – – 58
Highly probable forecast variable rate debt – – – – – 41
Committed foreign exchange transactions – – – – – (1)
Highly probable forecast purchases of electricity – – – – – 5
Fair value hedges
Domestic Notes Long–term debt – (411) – (21) (21)
Fair value and cash flow hedges
Australian Medium Term Note (AUD 150m) Long–term debt – (173) – (18) (3)
Norwegian Medium Term Note (NOK 1b) Long–term debt – (178) – (3) (3)
– (795) – (42) 88
5.1 Derivatives and hedge accounting (continued)
89Connections matterSpark New Zealand Annual Report 2020
For
per
sona
l use
onl
y

Notes to the financial statements: Financial instruments
5.2 Financial risk management
a) Market riskSpark is exposed to market risk primarily from changes in foreign currency exchange rates, interest rates and electricity prices. Spark employs risk management strategies, including the use of derivative financial instruments, to manage these exposures through a Board-approved treasury policy, which provides the framework within which treasury-related activities are conducted.
Spark manages the concentration of exposures using well-defined market and credit risk limits and through timely reporting to senior management. All contracts have been entered into with high-credit quality financial institutions, except electricity hedge contracts, which are generally settled monthly. The risk associated with these transactions is that the fair value or cash flows of financial instruments will change due to movements in market rates or, in the case of default by a counterparty, through the cost of replacement at the current market rates.
Currency riskNature of the riskCurrency risk is the risk that eventual New Zealand dollar net cash flows from transactions undertaken by Spark will be adversely affected by changes in foreign currency exchange rates.
Exposure and risk managementSpark’s total net exposure (from non-derivative financial instruments) to foreign currency as at 30 June 2020 is $605 million (30 June 2019: $362 million). This includes $161 million long-term debt principal denominated in NOK (30 June 2019: $175 million) and $400 million long-term debt principal denominated in AUD (30 June 2019: $157 million). The remaining exposure is primarily trade payables and other receivables denominated in United States dollars (USD).
Spark manages currency risk arising from foreign-currency debt through hedging. Spark’s long-term debt issued in NOK and AUD is fully hedged using cross-currency interest rate swaps to convert foreign-currency cashflows into floating-rate New Zealand dollar exposures.
Currency risk from capital and operational expenditure in foreign currencies (and related trade payables) has been substantially hedged by entering into forward exchange contracts.
Sensitivity to foreign currency movementsAs at 30 June 2020 a movement of 10% in the New Zealand dollar would (after hedging) impact the statement of profit or loss by less than $3 million (30 June 2019: less than $1 million) and the statement of changes in equity by less than $19 million (30 June 2019: less than $16 million). This analysis assumes a movement in the New Zealand dollar across all currencies and only includes the effect of foreign exchange movements on monetary financial instruments.
Interest rate riskNature of the riskInterest rate risk is the risk that fluctuations in interest rates impact Spark’s cash flows, financial performance or the fair value of its holdings of financial instruments.
Exposure and risk managementSpark is exposed to interest rate risk from its financing activities, which primarily include loans and debt issuance either at fixed or floating rates. For floating-rate exposures, Spark employs the use of derivative financial instruments to reduce its exposure to fluctuations in interest rates, with the objective to minimise the cost of net borrowings and to minimise the impact of interest rate movements on interest expense and net earnings.
Cross-currency interest rate swaps are used to convert foreign currency debt into floating-rate New Zealand dollar exposures. Interest rate swaps are used to convert floating-rate exposures into fixed-rate exposures and vice versa. As a result Spark’s interest rate exposure is limited to New Zealand only.
Sensitivity to interest rate movementsAs at 30 June 2020 a movement in interest rates of 25 basis points would (after hedging) impact the statement of profit or loss by less than $1 million (30 June 2019: less than $1 million for a movement of 100 basis points) and statement of changes in equity by less than $3 million (30 June 2019: less than $59 million for a movement of 100 basis points).
Electricity price riskNature of the riskElectricity price risk is the risk that fluctuations in spot electricity prices will impact Spark’s financial performance.
Exposure and risk managementSpark is a large consumer of electricity, which exposes the Group to fluctuations in the market spot price. To reduce its exposure to electricity price risk, Spark has entered into electricity hedge contracts. These contracts establish a fixed price for Spark, with the counterparty topping up or retaining the difference between the spot price and the fixed price over the term of the contract.
Sensitivity to electricity price movementsAs at 30 June 2020 a movement of 10% in forward electricity prices would impact the statement of profit or loss and statement of changes in equity (after hedging) by less than $3 million (30 June 2019: less than $3 million).
90
Spark New Zealand Annual Report 2020 Notes to the financial statements
For
per
sona
l use
onl
y

5
b) Credit riskNature of the riskCredit risk arises in the normal course of Spark’s business on cash, receivables and derivative financial instruments if a counterparty fails to meet its contractual obligations.
Exposure and risk managementSpark is exposed to credit risk if customers and counterparties fail to make payments in respect of:
• Payment of trade and other receivables as they fall due; and
• Contractual cash flows of derivative assets held at fair value.
Spark’s assets subject to credit risk as at 30 June 2020 were $1,035 million (30 June 2019: $1,041 million).
Spark considers the probability of default upon initial recognition of cash, receivables and derivative assets and whether there has been a significant and ongoing increase in credit risk at the end of each reporting period. To assess this Spark compares the risk of default occurring on these assets at the reporting date, with the risk of default at the date of initial recognition. Available, reasonable and supportive forward-looking information is considered, especially the following indicators:
• External credit rating (as far as available);
• Actual or expected significant adverse changes in business, financial or economic conditions that are expected to cause a significant change to the customer or counterparty’s ability to meet their obligations; and
• Significant changes in the value of the collateral supporting the obligation or in the quality of third-party guarantees or credit enhancements.
Spark manages its exposure using a credit policy that includes limits on exposures with significant counterparties that have been set and approved by the Board and are monitored on a regular basis. Spark places its cash and derivative financial instruments with high-credit quality financial institutions and does not have significant concentration of risk with any single party. Concentration of credit risk for trade and other receivables is limited due to Spark’s large customer base.
Spark has certain derivative and debt arrangements that are subject to bilateral credit support agreements that require Spark or its counterparties to post collateral funds to support the value of certain derivatives subject to certain agreed threshold amounts. As at 30 June 2020 no collateral was posted (30 June 2019: nil). Letters of credit and guarantees may also be held over some receivable amounts. The carrying amounts of financial assets represent the maximum credit exposure.
At balance date there has been no material deterioration in Spark’s or counterparty’s credit risk resulting from COVID-19, however, within the market there have been minor changes in the outlook for some banks, further deterioration could impact Spark in FY21.
5.2 Financial risk management (continued) c) Liquidity riskNature of the riskLiquidity risk represents Spark’s ability to meet its contractual obligations as they fall due.
Exposure and risk managementSpark uses cash and derivative financial instruments to manage liquidity and evaluates its liquidity requirements on an ongoing basis. In general, Spark generates sufficient cash flows from its operating activities to meet its financial liabilities. As at 30 June 2020 current assets of $928 million were greater than current liabilities of $781 million (30 June 2019: current liabilities of $944 million were greater than current assets of $911 million). Positive operating cash flows enable working capital to be managed to meet short-term liabilities as they fall due.
In the event of any shortfalls Spark has the following financing programmes:
• An undrawn committed standby facility of $200 million with a number of creditworthy banks (30 June 2019: $200 million);
• Committed bank facilities of $575 million with $150 million drawn as at 30 June 2020 (30 June 2019: $425 million facility with $140 million drawn); and
• Committed bank overdraft facilities of $15 million with New Zealand banks (30 June 2019: $15 million).
There are no compensating balance requirements associated with these facilities.
Spark’s liquidity policy is to maintain unutilised committed facilities of at least 110% of the next 12 months’ forecast peak net funding requirements. Spark’s funding policy requires that the maximum amount of long-term debt, excluding short-term debt such as commercial paper, maturing in any 12-month period is not to exceed $300 million, which has been met.
91Connections matterSpark New Zealand Annual Report 2020
For
per
sona
l use
onl
y
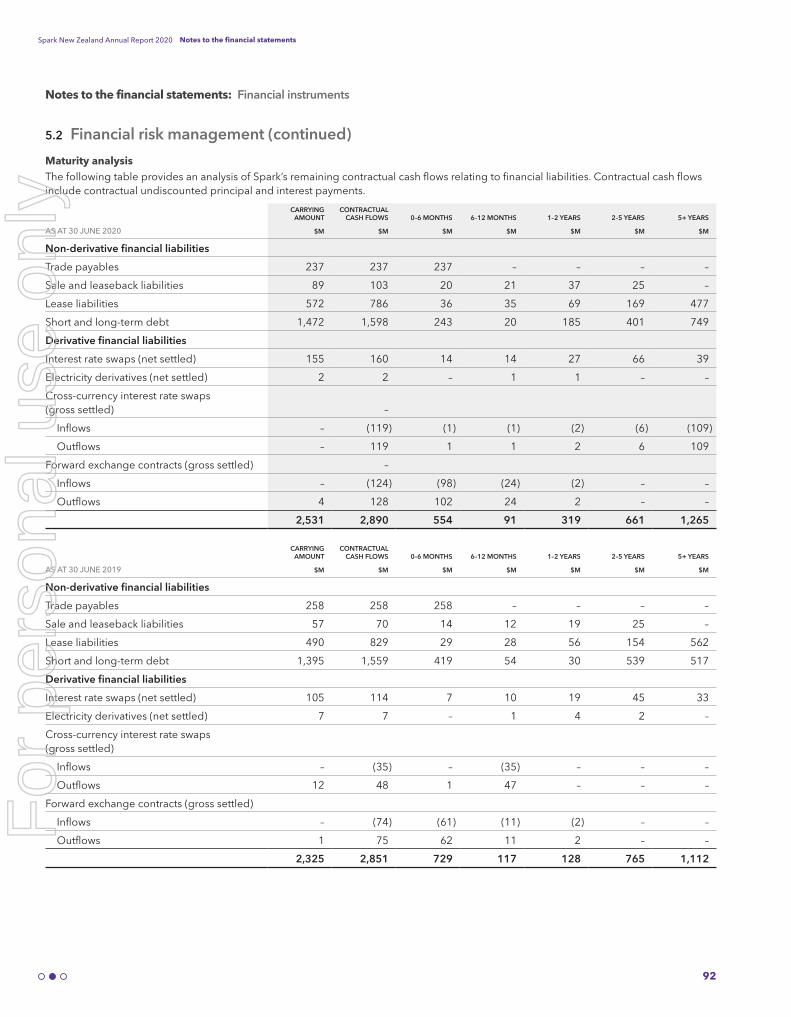
Notes to the financial statements: Financial instruments
Maturity analysisThe following table provides an analysis of Spark’s remaining contractual cash flows relating to financial liabilities. Contractual cash flows include contractual undiscounted principal and interest payments.
CARRYING AMOUNT
CONTRACTUAL CASH FLOWS 0–6 MONTHS 6–12 MONTHS 1–2 YEARS 2–5 YEARS 5+ YEARS
AS AT 30 JUNE 2020 $M $M $M $M $M $M $M
Non-derivative financial liabilities
Trade payables 237 237 237 – – – –
Sale and leaseback liabilities 89 103 20 21 37 25 –
Lease liabilities 572 786 36 35 69 169 477
Short and long-term debt 1,472 1,598 243 20 185 401 749
Derivative financial liabilities
Interest rate swaps (net settled) 155 160 14 14 27 66 39
Electricity derivatives (net settled) 2 2 – 1 1 – –
Cross-currency interest rate swaps (gross settled) –
Inflows – (119) (1) (1) (2) (6) (109)
Outflows – 119 1 1 2 6 109
Forward exchange contracts (gross settled) –
Inflows – (124) (98) (24) (2) – –
Outflows 4 128 102 24 2 – –
2,531 2,890 554 91 319 661 1,265
CARRYING AMOUNT
CONTRACTUAL CASH FLOWS 0–6 MONTHS 6–12 MONTHS 1–2 YEARS 2–5 YEARS 5+ YEARS
AS AT 30 JUNE 2019 $M $M $M $M $M $M $M
Non-derivative financial liabilities
Trade payables 258 258 258 – – – –
Sale and leaseback liabilities 57 70 14 12 19 25 –
Lease liabilities 490 829 29 28 56 154 562
Short and long-term debt 1,395 1,559 419 54 30 539 517
Derivative financial liabilities
Interest rate swaps (net settled) 105 114 7 10 19 45 33
Electricity derivatives (net settled) 7 7 – 1 4 2 –
Cross-currency interest rate swaps (gross settled)
Inflows – (35) – (35) – – –
Outflows 12 48 1 47 – – –
Forward exchange contracts (gross settled)
Inflows – (74) (61) (11) (2) – –
Outflows 1 75 62 11 2 – –
2,325 2,851 729 117 128 765 1,112
5.2 Financial risk management (continued)
92
Spark New Zealand Annual Report 2020 Notes to the financial statements
For
per
sona
l use
onl
y

6
Notes to the financial statements: Other information
Section 6 Other information
6.1 Income tax
Income tax expenseThe income tax expense is determined as follows:
2020 2019YEAR ENDED 30 JUNE $M $M
Statement of profit or loss
Current income tax
Current year income tax expense (175) (170)
Adjustments in respect of prior periods 13 2
Deferred income tax
Depreciation, provisions, accruals, tax losses and other 8 1
Reintroduction of tax depreciation on buildings 10 –
Adjustments in respect of prior periods (6) (3)
Income tax expense recognised in the statement of profit or loss (150) (170)
Reconciliation of income tax expense 2020 2019
YEAR ENDED 30 JUNE $M $M
Net earnings before income tax 577 579
Tax at current rate of 28% (162) (162)
Adjustments to taxation
Non-assessable gains on sale 7 1
Other non-assessable items 1 (2)
Tax effects of non-New Zealand profits (9) (6)
Taxes paid in foreign jurisdictions (4) –
Reintroduction of tax depreciation on buildings 10 –
Adjustments in respect of prior periods 7 (1)
Total income tax expense (150) (170)
Tax depreciation on buildingsOn 25 March 2020 the Government enacted legislation to reintroduce tax depreciation on commercial and industrial buildings, effective from 1 July 2020. This increases the tax base of building assets because depreciation can be claimed from FY21 onwards (previously the tax base for building assets was zero). As deferred tax is calculated on the difference between the carrying amount of an asset and its tax base, the increase in tax base has reduced Spark’s deferred tax liability by $10 million. This also results in a one-off decrease in tax expense of $10 million.
93Connections matterSpark New Zealand Annual Report 2020
For
per
sona
l use
onl
y

Notes to the financial statements: Other information
Deferred tax assets and liabilitiesDeferred tax assets and liabilities are offset in the statement of financial position and presented as a net deferred tax liability. The movement in the deferred tax assets and liabilities is provided below:
FIXED ASSETS LEASESPROVISIONS &
ACCRUALS OTHER TOTAL
ASSETS/(LIABILITIES) $M $M $M $M $M
Opening balance as at 30 June 2019 (133) 26 (3) 24 (86)
Amounts recognised in statement of profit or loss
Relating to the current period 1 1 4 2 8
Reintroduction of tax depreciation on buildings 10 – – – 10
Adjustments in respect of prior periods (5) – (1) – (6)
Amounts recognised in equity relating to the current year – – – 13 13
Closing balance as at 30 June 2020 (127) 27 – 39 (61)
Opening balance as at 1 July 2018 (133) 24 – – (109)
Amounts recognised in statement of profit or loss
Relating to the current period 1 2 (4) 2 1
Adjustments in respect of prior periods – – (2) (1) (3)
Amounts recognised in equity relating to the current year (1) – 3 23 25
Closing balance as at 30 June 2019 (133) 26 (3) 24 (86)
Spark has not recognised the tax effect of accumulated unrestricted losses and temporary differences amounting to AUD$461 million at 30 June 2020 based on the relevant corporation tax rate of Australia (30 June 2019: AUD$461 million). These losses and temporary differences may be available to be carried forward to offset against future taxable income. However, utilisation is contingent on the production of taxable profits over a significant period of time and is subject to compliance with the relevant taxation authority requirements.
Spark has a nil imputation credit account as at 30 June 2020 (30 June 2019: $21 million negative balance). The imputation credit account had a positive balance as at 31 March 2020 and 31 March 2019.
6.2 Employee share schemes
Spark operates share-based compensation plans that are equity settled as outlined below.
Restricted share schemes (RSS)A restricted share scheme was initially introduced for selected employees in September 2001. For new allocations after August 2015 these were replaced by two new restricted share schemes:
• Spark New Zealand Long-Term Incentive Scheme; and
• Spark New Zealand Managing Director Long-Term Incentive Scheme.
The Spark New Zealand Long-Term Incentive Scheme is for the Leadership Squad and senior leaders and delivers one scheme with the same set of rules under one long-term incentive, with a performance hurdle in place. The Spark New Zealand Managing Director Long-Term Incentive Scheme related to the previous Managing Director, Simon Moutter.
Under these restricted share schemes ordinary shares in the Company are issued to Spark Trustee Limited. Participants purchase shares from Spark Trustee Limited with funds lent to them by the Company and which are held on their behalf by Spark Trustee Limited. If the individual is still employed by Spark at the end of the vesting period (generally three years) and applicable performance hurdles are met, the employee is provided a cash bonus, which must be used to repay the loan and the shares are then transferred to the individual. The target for this hurdle is the Company’s cost of equity plus 1% compounding annually.
6.1 Income tax (continued)
94
Spark New Zealand Annual Report 2020 Notes to the financial statements
For
per
sona
l use
onl
y
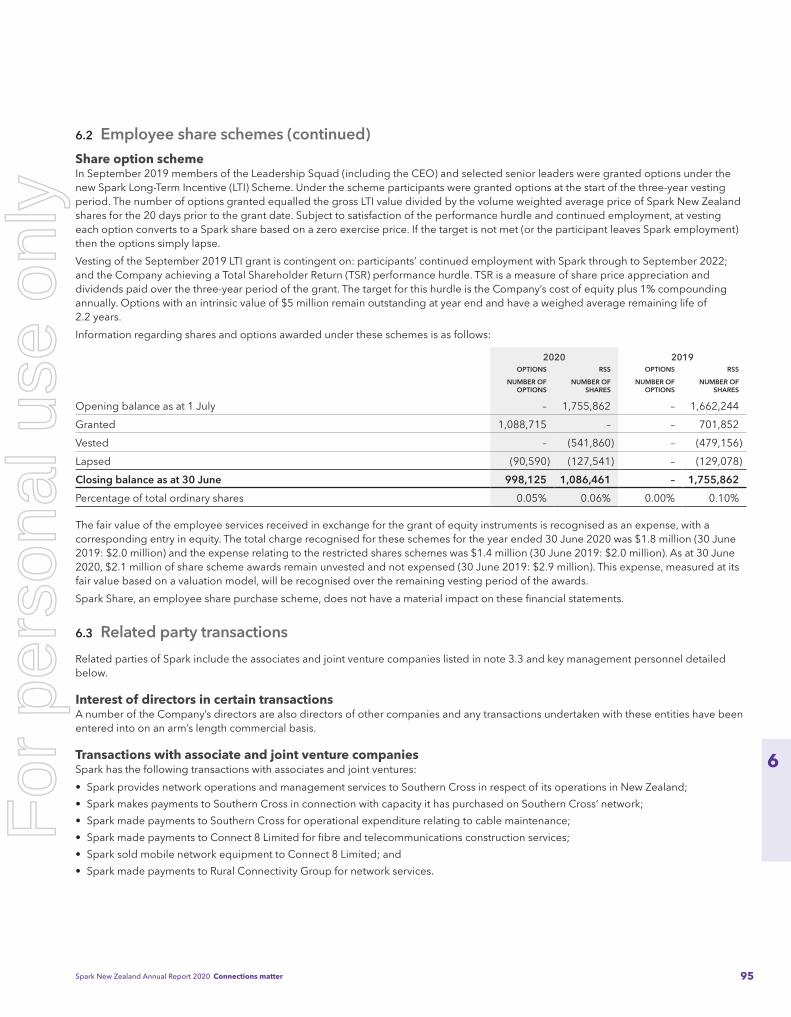
6
Share option scheme In September 2019 members of the Leadership Squad (including the CEO) and selected senior leaders were granted options under the new Spark Long-Term Incentive (LTI) Scheme. Under the scheme participants were granted options at the start of the three-year vesting period. The number of options granted equalled the gross LTI value divided by the volume weighted average price of Spark New Zealand shares for the 20 days prior to the grant date. Subject to satisfaction of the performance hurdle and continued employment, at vesting each option converts to a Spark share based on a zero exercise price. If the target is not met (or the participant leaves Spark employment) then the options simply lapse.
Vesting of the September 2019 LTI grant is contingent on: participants’ continued employment with Spark through to September 2022; and the Company achieving a Total Shareholder Return (TSR) performance hurdle. TSR is a measure of share price appreciation and dividends paid over the three-year period of the grant. The target for this hurdle is the Company’s cost of equity plus 1% compounding annually. Options with an intrinsic value of $5 million remain outstanding at year end and have a weighed average remaining life of 2.2 years.
Information regarding shares and options awarded under these schemes is as follows:
2020 2019OPTIONS RSS OPTIONS RSS
NUMBER OF OPTIONS
NUMBER OF SHARES
NUMBER OF OPTIONS
NUMBER OF SHARES
Opening balance as at 1 July – 1,755,862 – 1,662,244
Granted 1,088,715 – – 701,852
Vested – (541,860) – (479,156)
Lapsed (90,590) (127,541) – (129,078)
Closing balance as at 30 June 998,125 1,086,461 – 1,755,862
Percentage of total ordinary shares 0.05% 0.06% 0.00% 0.10%
The fair value of the employee services received in exchange for the grant of equity instruments is recognised as an expense, with a corresponding entry in equity. The total charge recognised for these schemes for the year ended 30 June 2020 was $1.8 million (30 June 2019: $2.0 million) and the expense relating to the restricted shares schemes was $1.4 million (30 June 2019: $2.0 million). As at 30 June 2020, $2.1 million of share scheme awards remain unvested and not expensed (30 June 2019: $2.9 million). This expense, measured at its fair value based on a valuation model, will be recognised over the remaining vesting period of the awards.
Spark Share, an employee share purchase scheme, does not have a material impact on these financial statements.
6.3 Related party transactions
Related parties of Spark include the associates and joint venture companies listed in note 3.3 and key management personnel detailed below.
Interest of directors in certain transactionsA number of the Company’s directors are also directors of other companies and any transactions undertaken with these entities have been entered into on an arm’s length commercial basis.
Transactions with associate and joint venture companiesSpark has the following transactions with associates and joint ventures:
• Spark provides network operations and management services to Southern Cross in respect of its operations in New Zealand;
• Spark makes payments to Southern Cross in connection with capacity it has purchased on Southern Cross’ network;
• Spark made payments to Southern Cross for operational expenditure relating to cable maintenance;
• Spark made payments to Connect 8 Limited for fibre and telecommunications construction services;
• Spark sold mobile network equipment to Connect 8 Limited; and
• Spark made payments to Rural Connectivity Group for network services.
6.2 Employee share schemes (continued)
95Connections matterSpark New Zealand Annual Report 2020
For
per
sona
l use
onl
y

Notes to the financial statements: Other information
Balances and amounts in respect of these transactions with associate and joint venture companies are set out in the table below:
2020 2019AS AT AND FOR THE YEAR ENDED 30 JUNE $M $M
Operating revenues1 11 37
Operating expenses 9 9
Capacity acquired and other capital expenditure2 59 29
Receivables 15 33
Payables (2) –
1 This does not include any dividend income from Southern Cross for the year ended 30 June 2020 (30 June 2019: $15 million).2 As at 30 June 2020 Spark has committed to purchases of $62 million for cable capacity from Southern Cross (30 June 2019: $33 million).
Key management personnel compensation2020 2019
YEAR ENDED 30 JUNE $’000 $’000
Directors’ remuneration1 1,349 1,342
Salary and other short-term benefits2 7,686 8,520
Long-term incentives and share-based compensation3 901 2,191
9,936 12,053
1 Excludes Chief Executive remuneration.2 Includes short-term benefits paid on termination.3 Includes $776,000 share-based compensation and $125,000 other long-term incentives (30 June 2019: $1,941,000 share-based compensation and $250,000 other
long-term incentives).
The table above includes remuneration of the Chief Executive and the other members of the Leadership Squad, including amounts paid to members of the Leadership Squad who left during the year ended 30 June or were in acting Leadership Squad positions. Like other Spark employees, members of the Leadership Squad also receive product and service concessions. In addition, where members of the Leadership Squad are KiwiSaver members, they receive contributions towards their KiwiSaver schemes.
6.4 Subsidiaries
Subsidiaries are all entities over which Spark has control. The significant subsidiary companies of Spark and their activities are as follows:
NAME COUNTRY OWNERSHIP PRINCIPAL ACTIVITY
Computer Concepts Limited New Zealand 100% IT infrastructure and business cloud services
Digital Island Limited New Zealand 100% Business telecommunications provider
Gen-i Australia Pty Limited Australia 100% Provides outsourced telecommunications services
Mattr Limited New Zealand 100% Software company focused on decentralised identity and verifiable data
Qrious Limited New Zealand 100% Big data analytics business
Revera Limited New Zealand 100% IT infrastructure and data centre provider
Spark Finance Limited New Zealand 100% A Group finance company
Spark New Zealand Trading Limited New Zealand 100% Provides local, national and international telephone and data services
Spark Retail Holdings Limited New Zealand 100% Retailer of telecommunications products and services
TCNZ (Bermuda) Limited New Zealand 100% A holding company
Teleco Insurance Limited Bermuda 100% A Group insurance company
Telecom New Zealand USA Limited United States 100% Provides international wholesale telecommunications services
Telecom Southern Cross Limited New Zealand 100% A holding company
Telegistics Limited New Zealand 100% Mobile phone repair and equipment distribution
The financial year end of all significant subsidiaries is 30 June.
6.3 Related party transactions (continued)
96
Spark New Zealand Annual Report 2020 Notes to the financial statements
For
per
sona
l use
onl
y

6
6.5 Reconciliation of net earnings to net cash flows from operating activities
2020 2019YEAR ENDED 30 JUNE $M $M
Net earnings for the year 427 409
Adjustments to reconcile net earnings to net cash flows from operating activities
Depreciation and amortisation 479 477
Bad and doubtful accounts 21 17
Deferred income tax (11) –
Share of associates’ and joint ventures’ net losses (1) 1
Impairments 2 3
Other gains (35) (15)
Other 18 7
Changes in assets and liabilities net of effects of non-cash and investing and financing activities
Movement in receivables and related items 26 (122)
Movement in inventories (10) (21)
Movement in current taxation 21 35
Movement in payables and related items (34) (14)
Net cash flows from operating activities 903 777
6.6 Commitments and contingencies
Capital and other commitmentsAs at 30 June 2020 capital expenditure contracted for, but not yet incurred, was $246 million (30 June 2019: $249 million) with $149 million due in the year ending 30 June 2021. Commitments principally relate to telecommunications network equipment, spectrum rights and cable capacity.
As at 30 June 2020 Spark had other supplier commitments of $760 million (30 June 2019: $264 million), with $425 million due in the year ending 30 June 2021. Commitments include mobile handsets, modems, licenses and content rights.
ContingenciesNo ongoing claims, investigations and inquiries are expected to have a significant effect on Spark’s financial position or profitability.
97Connections matterSpark New Zealand Annual Report 2020
For
per
sona
l use
onl
y
© 2020 KPMG, a New Zealand partnership and a member firm of the KPMG network of independent member firms affiliated with KPMG International Cooperative (“KPMG International”), a Swiss entity.
Independent Auditor’s Report To the shareholders of Spark New Zealand Limited
Report on the audit of the consolidated financial statements
Opinion In our opinion, the accompanying consolidated financial statements of Spark New Zealand Limited (the company) and its subsidiaries (the group) on pages 54 to 97:
i. present fairly in all material respects the group’s financial position as at 30 June 2020 and its financial performance and cash flows for the year ended on that date; and
ii. comply with New Zealand Equivalents to International Financial Reporting Standards and International Financial Reporting Standards.
We have audited the accompanying consolidated financial statements which comprise:
— the consolidated statement of financial position as at 30 June 2020;
— the consolidated statements of profit and loss and other comprehensive income, changes in equity and cash flows for the year then ended; and
— notes, including a summary of significant accounting policies and other explanatory information.
Basis for opinion
We conducted our audit in accordance with International Standards on Auditing (New Zealand) (‘ISAs (NZ)’). We believe that the audit evidence we have obtained is sufficient and appropriate to provide a basis for our opinion.
We are independent of the group in accordance with Professional and Ethical Standard 1 International Code of Ethics for Assurance Practitioners (Including International Independence Standards) (New Zealand) issued by the New Zealand Auditing and Assurance Standards Board and the International Ethics Standards Board for Accountants’ International Code of Ethics for Professional Accountants (including International Independence Standards) (‘IESBA Code’), and we have fulfilled our other ethical responsibilities in accordance with these requirements and the IESBA Code.
Our responsibilities under ISAs (NZ) are further described in the auditor’s responsibilities for the audit of the consolidated financial statements section of our report.
Our firm has also provided other services to the group in relation to regulatory audit, other assurance-related services (such as trustee reporting) and taxation consulting services. Subject to certain restrictions, partners and employees of our firm may also deal with the group on normal terms within the ordinary course of trading activities of the business of the group. These matters have not impaired our independence as auditor of the group. The firm has no other relationship with, or interest in, the group.
Independent auditor’s report
98
Spark New Zealand Annual Report 2020 Independent auditor’s report
For
per
sona
l use
onl
y

Materiality
The scope of our audit was influenced by our application of materiality. Materiality helped us to determine the nature, timing and extent of our audit procedures and to evaluate the effect of misstatements, both individually and on the consolidated financial statements as a whole. The materiality for the consolidated financial statements as a whole was set at $26 million determined with reference to a benchmark of group earnings before income tax. We chose the benchmark because, in our view, this is a key measure of the group's performance.
Key audit matters
Key audit matters are those matters that, in our professional judgement, were of most significance in our audit of the consolidated financial statements in the current period. We summarise below those matters and our key audit procedures to address those matters in order that the shareholders as a body may better understand the process by which we arrived at our audit opinion. Our procedures were undertaken in the context of and solely for the purpose of our statutory audit opinion on the consolidated financial statements as a whole and we do not express discrete opinions on separate elements of the consolidated financial statements.
Key changes in the assessment of audit risks
COVID-19
The COVID-19 pandemic has created additional risks across a number of areas of the business, particularly the recoverability of receivables. All forward-looking assumptions are inherently more uncertain during these unprecedented times. While the key audit matter "Revenue recognition" detailed below, is unchanged from last year, the underlying audit risk has increased which impacted the extent and nature of audit evidence that we had to gather. We also draw attention to Note 1.3 of the consolidated financial statements which describes the impact of the COVID-19 on the business.
The key audit matter How the matter was addressed in our audit
Revenue recognition
Refer to note 2.2 to the financial statements which discloses total revenues of $3,623 million (2019: $3,533 million) including:
- Mobile $1,288 million (2019: $1,271 million)
- Broadband $680 million (2019: $685 million)
- Voice $391 million (2019: $441 million)
- Cloud, security and service management $443 million (2019: $400 million)
Revenue recognition is considered to be a key audit matter due to the complexity of the revenue recognition accounting standards as applied to the telecommunications industry.
The adoption of this accounting standard involves key judgements and estimates, principally surrounding:
Revenue arrangements with multiple goods and/or services:
Our audit procedures included:
For Mobile, Broadband and Voice products bundled into a single offer:
- reviewing a sample of customer contracts to understand each of the performance obligations in the bundled offering;
- challenging the group’s assessment for each performance obligation about whether the customer can benefit from the product or service on its own or together with readily available resources;
- assessing the allocation of the transaction price to the performance obligations by comparing the stand-alone selling price assigned to observed market prices or estimated prices;
- examining the stages at which revenue for each performance obligation is recognised;
99Connections matterSpark New Zealand Annual Report 2020
For
per
sona
l use
onl
y

The key audit matter How the matter was addressed in our audit
- assessing the length of the contractual term with customers that have a material impact on the timing of revenue and cost recognition;
- identifying the separate performance obligations of bundled arrangements and determining whether they are distinct;
- allocating the transaction price to the performance obligations in bundled arrangements; and
- examining contracts to determine whether Spark is the principal or agent which will impact the reporting of revenue and costs on a gross or net basis.
Contractual arrangements for Cloud, Security and Service Management services offered, involving the design, build and offering of ongoing Information Technology solutions, including ‘as a service’ offerings:
- identifying the separate performance obligations of bundled transactions and whether those performance obligations are distinct;
- assessing whether the performance obligations are satisfied at a point in time or over time; and
- determining the quantum and timing of contract profit. The latter includes assessing the assumptions underpinning the individual project profitability forecasts over the life of the contract and the recoverability of contract specific assets.
- assessing the recognition and timing of costs to acquire and costs to fulfil customer contracts; and
- in light of COVID-19, assessing the basis for the calculation of the expected credit loss provision.
For the bundled offerings, we identified no errors with the assessment of each performance obligation in the bundled offerings and reasonable assumptions were used to reflect the stand-alone selling price allocated to each performance obligation.
For contractual arrangements for Cloud, Security and Service Management product offers:
- reviewing a sample of contracts to understand the services the group has contracted to deliver;
- agreeing revenue recognised to a sample of customer contracts and agreed customer contract variations;
- evaluating the timing of revenue recognition applied for each contract reviewed by discussing with and challenging of the project managers, reviewing project summary reports, customer correspondence and historical customer profitability analyses; and
- evaluating the status of implementation of each contract, through discussion with project managers and reviewing project summary reports.
For the Spark Cloud, Security and Service Management contracts, we consider the estimates of projected revenue and costs or the assessments of the stage of completion of the projects to be balanced.
We identified no errors with revenue recognition.
Impact of changes in technology and the group’s network strategy on the carrying value of property, plant & equipment and intangible assets
Refer to notes 3.6 and 3.7 to the financial statements.
The group has property, plant & equipment and intangible assets of $1,983 million (2019: $1,999 million) with additions during the year of $376 million (2019: $406 million). The capitalisation and carrying value of property, plant & equipment and intangible assets is considered to be a key audit matter due to the significance of the assets to the group’s statement of financial position, and due to the level of
Our audit procedures included:
- examining controls surrounding application of accounting policies to capitalise or expense project spend;
- assessing the capitalisation of costs incurred on capital projects, by examining a sample of additions to identify if the spend meets the definition of an asset as per the applicable accounting standards;
- assessing the allocated useful economic lives, by comparing to industry benchmarks
100
Spark New Zealand Annual Report 2020 Independent auditor’s report
For
per
sona
l use
onl
y

The key audit matter How the matter was addressed in our audit
judgement involved in determining the carrying value of these assets, principally:
- the capitalisation or expensing of costs;
- the useful economic lives assigned to the assets capitalised;
- the impact of planned or unexpected replacement technology on the carrying value of property, plant & equipment and intangible assets; and
- accounting for software as a service contracts.
and our knowledge of the business and its operations and the technology life-cycles anticipated;
- assessing the need for accelerated depreciation or impairment of assets, by considering the impact of developments in technology and changes to the group’s technology transformation strategy; and
- reviewing a sample of software as a service contracts to determine whether the licensing and delivery model provided by the contracts have been expensed or capitalised as appropriate depending on the terms of each contract.
We found no issues as a result of our audit procedures over the amounts capitalised to property, plant & equipment and intangible assets.
We found asset useful lives used by the group were within an acceptable range when compared to those commonly used in the industry, and appropriately reflected technological developments within the group’s intended capital roadmap. We considered the impact of developments in technology and changes to the group’s technology transformation strategy on useful lives and carrying value and considered the carrying value to be appropriate.
Other information
The Directors, on behalf of the group, are responsible for the other information included in the entity’s Annual Report. Other information includes the 'Connections matter' section which includes the Chair and CEO review, and 'Other information' section which includes corporate governance disclosures. Our opinion on the consolidated financial statements does not cover any other information and we do not express any form of assurance conclusion thereon.
In connection with our audit of the consolidated financial statements our responsibility is to read the other information and, in doing so, consider whether the other information is materially inconsistent with the consolidated financial statements or our knowledge obtained in the audit or otherwise appears materially misstated. If, based on the work we have performed, we conclude that there is a material misstatement of this other information, we are required to report that fact. We have nothing to report in this regard.
Use of this independent auditor’s report
This independent auditor’s report is made solely to the shareholders as a body. Our audit work has been undertaken so that we might state to the shareholders those matters we are required to state to them in the independent auditor’s report and for no other purpose. To the fullest extent permitted by law, we do not accept or assume responsibility to anyone other than the shareholders as a body for our audit work, this independent auditor’s report, or any of the opinions we have formed.
101Connections matterSpark New Zealand Annual Report 2020
For
per
sona
l use
onl
y

Responsibilities of the Directors for the consolidated financial
statements The Directors, on behalf of the group, are responsible for:
— the preparation and fair presentation of the consolidated financial statements in accordance with generally accepted accounting practice in New Zealand (being New Zealand Equivalents to International Financial Reporting Standards) and International Financial Reporting Standards;
— implementing necessary internal control to enable the preparation of a set of consolidated financial statements that is fairly presented and free from material misstatement, whether due to fraud or error; and
— assessing the ability to continue as a going concern. This includes disclosing, as applicable, matters related to going concern and using the going concern basis of accounting unless they either intend to liquidate or to cease operations, or have no realistic alternative but to do so.
Auditor’s responsibilities for the audit of the consolidated financial statements
Our objective is:
— to obtain reasonable assurance about whether the consolidated financial statements as a whole are free from material misstatement, whether due to fraud or error; and
— to issue an independent auditor’s report that includes our opinion.
Reasonable assurance is a high level of assurance, but is not a guarantee that an audit conducted in accordance with ISAs NZ will always detect a material misstatement when it exists.
Misstatements can arise from fraud or error. They are considered material if, individually or in the aggregate, they could reasonably be expected to influence the economic decisions of users taken on the basis of these consolidated financial statements.
A further description of our responsibilities for the audit of these consolidated financial statements is located at the External Reporting Board (XRB) website at:
http://www.xrb.govt.nz/standards-for-assurance-practitioners/auditors-responsibilities/audit-report-1/
This description forms part of our independent auditor’s report.
The engagement partner on the audit resulting in this independent auditor's report is David Gates.
For and on behalf of
KPMG Wellington
26 August 2020
102
Spark New Zealand Annual Report 2020 Independent auditor’s report
For
per
sona
l use
onl
y

Corporate governance disclosures
Stock exchange listingsSpark’s ordinary shares are listed on the NZX and ASX. Spark is admitted to the Official List of ASX as a foreign exempt issuer. As an NZX listed issuer and ASX foreign exempt issuer, Spark complies with NZX Listing Rules and applicable ASX Listing Rules.
Spark’s American Depositary Shares, each representing five ordinary Spark shares and evidenced by American Depositary Receipts (ADRs), are traded over-the-counter in the United States. This is a Level 1 ADR programme that is sponsored by Bank of New York Mellon.
Spark Finance Limited, a wholly owned subsidiary of Spark New Zealand Limited, has debt securities listed on the NZX. Details of debt securities issued by Spark Finance Limited can be found in Spark Finance Limited’s reports at: https://investors.sparknz.co.nz/Investor-Centre
Director remuneration The total remuneration available to non-executive directors is fixed by shareholders. The current annual remuneration limit is $1,630,000 that was approved at the annual meeting held in November 2017.
The fees payable to non-executive directors during FY20 were:
BOARD/COMMITTEE CHAIR1 MEMBER2
Board of Directors $368,700 $145,200
Audit and Risk Management Committee (ARMC) $39,100 $19,000
Human Resources and Compensation Committee (HRCC) $33,500 $16,800
Nominations and Corporate Governance Committee (NOMs) – –
1 Committee chair and member fees were not payable to the Chair of the Board. Committee member fees were not payable to committee Chairs.2 Member fees were payable for each committee.
Committee membership as at 30 June 2020 was as follows:
HUMAN RESOURCES AND COMPENSATION COMMITTEE
AUDIT AND RISK MANAGEMENT COMMITTEE
NOMINATIONS AND CORPORATE GOVERNANCE COMMITTEE
Alison Barrass (Chair)Ido LefflerJustine Smyth
Charles Sitch (Chair)Paul BerrimanWarwick BrayPip GreenwoodJustine Smyth (ex officio)
Justine Smyth (Chair)Alison BarrassPaul BerrimanWarwick BrayPip GreenwoodIdo LefflerCharles Sitch
The total remuneration received by non-executive directors of Spark during FY20 was as follows:1
NAME OF DIRECTOR BOARD FEES
AUDIT & RISK MANAGEMENT
COMMITTEE FEES
NOMINATIONS & CORPORATE
GOVERNANCE COMMITTEE FEES
HUMAN RESOURCES AND COMPENSATION
COMMITTEE FEESTOTAL
REMUNERATION2
Justine Smyth $368,700 – – – $368,700
Alison Barrass $145,200 – – $33,500 $178,700
Paul Berriman $145,200 $19,000 – – $164,200
Warwick Bray3 $112,056 $14,663 $126,719
Pip Greenwood $145,200 $19,000 – – $164,200
Ido Leffler $145,200 – – $16,800 $162,000
Charles Sitch $145,200 $39,100 – – $184,300
Total $1,206,756 $91,763 $50,300 $1,348,819
1 The figures shown are gross amounts and exclude GST (where applicable) and are rounded to the nearest dollar. 2 This table excludes contributions towards medical and life insurance of a total of $7,090. Spark meets costs incurred by directors that are incidental to the performance of their duties.
This includes providing New Zealand-based directors with mobile phones and $120 per month home phone account credits and overseas-based directors with $400 per month phone allowances. Spark also meets the costs of directors’ Spark-related travel. As these costs are incurred by Spark to enable directors to perform their duties, no value is attributable to them as benefits to directors for the purposes of the above table.
3 Mr Bray was appointed as a director and a member of the ARMC from 23 September 2019.
103Connections matterSpark New Zealand Annual Report 2020
For
per
sona
l use
onl
y

Former Managing Director remunerationThe total remuneration earned by or paid to the former Managing Director, Simon Moutter, for FY20 is as follows:
PERIOD SHORT-TERM INCENTIVE1 EQUITY INCENTIVE2
FY20 actual remuneration NZ$974,925 NZ$779,940
1 FY19 actual STI was earned in FY19 and was paid in FY20.2 FY19 actual equity incentive was earned in FY19 and was awarded in FY20 in the form of redeemable ordinary shares that will reclassify as ordinary shares in September 2021.
The following former Managing Director long-term incentives vested in FY20:
GRANT YEAR SECURITIESPERFORMANCE PERIOD
PERFORMANCE MEASURE
VESTING OUTCOME
SHARES TRANSFERRED
VALUE TRANSFERRED1
FY17 Restricted Shares September 2016 - September 2019
Absolute TSR, hurdle – Spark’s annual cost of equity + 1% compounding
100% - 3 year TSR result was 48% compared with a 37% target
177,151 NZ$781,236
Total NZ$781,236
1 Represents the NZX listed price of Spark shares on the exercise/transfer date multiplied by the number of shares transferred.
Additionally, Mr Moutter’s FY17 Equity Incentive (essentially a deferred STI) vested on 19 September 2019, as the service condition was satisfied. Accordingly, 91,958 redeemable ordinary shares converted to ordinary shares.
CEO remuneration The total remuneration earned or paid in FY20, and anticipated target remuneration expected to be earned or paid in FY21, by and to the CEO, Jolie Hodson is as follows:
PERIOD BASE SALARY1 SHORT-TERM INCENTIVE2 LONG-TERM INCENTIVE3
FY20 actual remuneration NZ$1,200,000 NZ$747,000 NZ$900,000 in the form of share options
FY21 anticipated target remuneration NZ$1,200,000 NZ$900,000 NZ$900,000 in the form of share options
1 Base salary excludes employer contributions towards KiwiSaver and is not at risk. 2 FY20 actual short-term incentive was earned in FY20 and will be paid in FY21. The gross amount earned in FY19 and paid in FY20 was $458,500. FY21 anticipated short-term
incentive will be earned in FY21 and paid in FY22.3 FY20 long-term incentive was granted in FY20 and, subject to performance hurdles, will vest in September 2022. FY21 anticipated target long-term incentive will be granted in FY21
and, subject to performance hurdles, will vest in September 2023.
The following CEO long-term incentives vested in FY20:
GRANT YEAR SECURITIESPERFORMANCE PERIOD
PERFORMANCE MEASURE
VESTING OUTCOME
SHARES TRANSFERRED
VALUE TRANSFERRED1
FY17 Restricted Shares September 2016 - September 2019
Absolute TSR, hurdle – Spark’s annual cost of equity + 1% compounding
100% - 3 year TSR result was 48% compared with a 37% target
45,351 NZ$199,998
Total NZ$199,998
1 Represents the NZX listed price of Spark shares on the exercise/transfer date multiplied by the number of shares transferred.
The CEO is expected to acquire and hold shares that are at least equivalent in value to 25% of the CEO’s base salary but ideally would increase this shareholding to 100% of base salary subject to the vesting of shares under any Long-Term Incentive schemes. To fulfil this expectation shares are to be acquired within a four-year period from 1 July 2019.
104
Spark New Zealand Annual Report 2020 Corporate governance disclosures
For
per
sona
l use
onl
y

Other directors’ feesMr Richard Quince received a director’s fee of NZ$10,000 (excluding GST) for acting as a director of Teleco Insurance (NZ) Limited. Ocorian Services (Bermuda) Limited received directors’ fees of US$2,590 in relation to Ms Alison Dyer-Fagundo acting as a director of TCNZ (Bermuda) Limited while it was a company incorporated under the laws of the Islands of Bermuda, and US$2,900 in relation to Ms Alison Dyer-Fagundo acting as a director of Teleco Insurance Limited.
Board and committee meeting attendance for FY20The Board held nine formal meetings during FY20. The table below shows director attendance at these Board meetings and committee member attendance at committee meetings. Sub-committees of the Board also met regularly throughout the year to consider matters of special importance.
BOARD ARMC HRCC NOMS
Total number of meetings held 9 7 5 2
Alison Barrass 9 – 5 2
Paul Berriman 9 7 – 2
Warwick Bray1 8 5 – 2
Pip Greenwood 9 7 – 2
Jolie Hodson2 8 – – –
Ido Leffler 9 – 5 2
Charles Sitch 9 7 – 2
Justine Smyth3 9 6 5 2
1 Mr Bray was appointed as a director on 23 September 2019.2 Ms Hodson was appointed as a director on 23 September 2019.3 Ms Smyth attended ARMC meetings in an ex officio capacity.
During FY20 the Board provided oversight and strategic support to assess the impacts of COVID-19 on Spark’s business. In addition to the meetings noted in the table above, regular briefing calls were held with management to discuss Spark’s response, including steps taken to protect our people and keep our business running as a critical lifeline utility.
105Connections matterSpark New Zealand Annual Report 2020
For
per
sona
l use
onl
y

Director independenceThe Board has determined, based on information provided by directors regarding their interests, that at 30 June 2020 Ms Barrass, Mr Berriman, Mr Bray, Ms Greenwood, Mr Leffler, Mr Sitch and Ms Smyth were independent. The Board determined that Ms Hodson was not independent due to her position as CEO.
The criteria for determining director independence and conflict of interest may be found in the Board Charter at: https://www.sparknz.co.nz/about/governance
Director interestsDirectors made the following entries in the interests register for FY20:
• Directors disclosed, pursuant to section 140 of the Companies Act 1993, interests in the following entities during FY20:
DIRECTOR ENTITY RELATIONSHIP
Paul Berriman Lynx Analytics Pte Limited Ceased to be a director
Pip Greenwood Vulcan Steel Limited Director
Ido Leffler Brandless (Dhosi)Lux Group LimitedBeach House Group
Ceased to be a Board memberDirector1
Ceased to be a director2
Jolie Hodson Lightbox Sport General Partner LimitedMattr LimitedNZ Telecommunications Forum Incorporated
Appointed and ceased to be a director3
DirectorBoard member
Justine Smyth Pushpay Holdings Limited Appointed and ceased to be a director4
1 Appointment effective 24 July 2020.2 Cessation effective 10 August 2020.3 Cessation effective 6 August 2020.4 Cessation effective 18 July 2020.
• Directors disclosed, pursuant to section 148 of the Companies Act 1993, the following acquisitions and disposals of relevant interests in Spark shares during FY20:
NAME DATE NATURE OF TRANSACTION CONSIDERATION NUMBER OF SHARES
Alison Barrass 20 February 2020 Purchase of ordinary shares $2,585 516
Pip Greenwood 19 September 2019 Purchase of ordinary shares $30,073 6,750
14 November 2019 Purchase of ordinary shares $59,562 13,575
4 June 2020 Purchase of ordinary shares $58,669 13,000
Jolie Hodson 19 September 2019 Issue of options Services to Spark 203,317
26 September 2019 Unrestricting of restricted ordinary shares
Services to Spark 45,351
Ido Leffler 5 March 2020 Purchase of ordinary shares AUD$102,872 22,000
Charles Sitch 18 June 2020 Purchase of ordinary shares AUD$78,241 18,795
Justine Smyth 3 June 2020 Purchase of ordinary shares $112,220 25,000
• Directors disclosed, for the purposes of section 162 of the Companies Act 1993, that insurance was renewed for Spark’s directors and senior managers for the 12-month period from 1 June 2020 and deeds of indemnity provided to all directors and specified senior managers of Spark.
106
Spark New Zealand Annual Report 2020 Corporate governance disclosures
For
per
sona
l use
onl
y

Benefits provided to full-time employees that are not provided to temporary or part-time employees The following table sets out benefits provided to full-time employees during FY20 that are not provided to temporary or part-time employees1:
FULL-TIME PERMANENT EMPLOYEES
PART-TIME PERMANENT EMPLOYEES
FIXED-TERM / CASUAL EMPLOYEES
Parental Leave Yes Yes Yes2
Insurance cover:• Medical
• Life & Terminal Illness
• Income Protection
• Trauma
Yes Yes3 No
Spark Account Credit4 Yes Yes No
Ability to participate in Spark Share5
Yes Yes No
Volunteer Day6 Yes Yes No
Spark Give7 Yes Yes No8
Eligibility to join Marram9 Yes Yes No
Eligible for Purchased Leave10 Yes Yes No
1 Excludes benefits offered to some subsidiaries, which differ from Spark’s overall benefits suite.2 Eligibility for Parental Leave is in accordance with Government legislation. 3 Employees must work at least 15 hours a week to be eligible.4 Employees with a Spark account will receive a monthly credit of $120 which can be used towards Spark products or services.5 Spark’s employee share purchase scheme.6 The opportunity for Spark employees to take a day of paid volunteer leave. 7 If an employee donates to a charity or to a school directly from their pay then Spark will match the amount dollar-for-dollar, up to a $500 annual matching cap.8 Casual employees are ineligible.9 Marram Trust offers access to accommodation across New Zealand for discounted rates, as well as providing a basic level of healthcare cover.10 The ability to purchase additional annual leave via a deduction of base salary.
107Connections matterSpark New Zealand Annual Report 2020
For
per
sona
l use
onl
y

Employee remunerationThe table below shows the number of employees and former employees, not being directors of Spark, who, in their capacity as employees, received remuneration and other benefits during FY20 totalling NZ$100,000 or more1.
RANGE CURRENT FORMER TOTAL RANGE CURRENT FORMER TOTAL
$100,000 - $110,000 336 17 353 $360,001 - $370,000 5 2 7
$110,001 - $120,000 364 7 371 $370,001 - $380,000 2 0 2
$120,001 - $130,000 271 13 284 $380,001 - $390,000 2 2 4
$130,001 - $140,000 210 5 215 $390,001 - $400,000 1 0 1
$140,001 - $150,000 187 6 193 $400,001 - $410,000 1 0 1
$150,001 - $160,000 138 5 143 $410,001 - $420,000 2 1 3
$160,001 - $170,000 77 2 79 $420,001 - $430,000 1 0 1
$170,001 - $180,000 78 0 78 $430,001 - $440,000 1 0 1
$180,001 - $190,000 53 2 55 $460,001 - $470,000 1 0 1
$190,001 - $200,000 45 1 46 $470,001 - $480,000 2 0 2
$200,001 - $210,000 31 0 31 $480,001 - $490,000 2 0 2
$210,001 - $220,000 31 0 31 $490,001 - $500,000 1 0 1
$220,001 - $230,000 20 5 25 $510,001 - $520,000 1 0 1
$230,001 - $240,000 10 3 13 $520,001 - $530,000 1 0 1
$240,001 - $250,000 8 0 8 $530,001 - $540,000 2 0 2
$250,001 - $260,000 10 0 10 $550,001 - $560,000 1 0 1
$260,001 - $270,000 9 3 12 $560,001 - $570,000 2 0 2
$270,001 - $280,000 5 0 5 $800,001 - $810,000 2 0 2
$280,001 - $290,000 3 2 5 $860,001 - $870,000 1 1 2
$290,001 - $300,000 3 0 3 $910,001 - $920,000 0 1 1
$300,001 - $310,000 6 1 7 $970,001 - $980,000 1 0 1
$310,001 - $320,000 1 0 1 $1,040,001 - $1,050,000 1 0 1
$320,001 - $330,000 7 0 7 $1,070,001 - $1,080,000 1 0 1
$330,001 - $340,000 3 0 3 $1,090,001 - $1,100,000 0 1 1
$350,001 - $360,000 2 0 2 $1,200,001 - $1,210,000 0 1 1
Total 1,942 81 2,023
1 The table includes base salaries, short-term incentives and vested long-term incentives. The table does not include: amounts paid after 30 June 2020 relating to FY20; long-term incentives that have been granted and have yet to vest (based on grant values, the total value of which was NZ$9.03 million as at 30 June 2020); product and service concessions received by employees; contributions paid towards health and other insurances; contributions paid to the Government Superannuation Fund (a legacy benefit provided to a small number of employees); and, if the individual is a KiwiSaver member, contributions of 3% of gross earnings towards that individual’s KiwiSaver scheme.
108
Spark New Zealand Annual Report 2020 Corporate governance disclosures
For
per
sona
l use
onl
y

ShareholdingsAs at 30 June 2020 there were 1,837,044,943 Spark ordinary shares on issue, each conferring to the registered holder the right to one vote on a poll at a meeting of shareholders on any resolution, held as follows:
SIZE OF HOLDING NUMBER OF HOLDERS1 % NUMBER OF SHARES %
1-1,000 12,793 30.69 6,628,337 0.36
1,001-5,000 17,679 42.40 46,242,144 2.52
5,001-10,000 6,014 14.43 44,528,969 2.42
10,001-100,000 4,992 11.97 113,437,733 6.18
100,001 and over 214 0.51 1,626,207,760 88.52
Total 41,692 100.00 1,837,044,943 100.00
1 Includes 1,214,002 shares on issue held by Spark Trustee Limited on behalf of 41 holders for the Spark Long-Term Incentive Plan (as further described in note 6.2 of the financial statements). There are 1,190,024 shares on issue held by Spark Trustee Limited on behalf of 1,111 holders for Spark Share.
As at 30 June 2020 there was an additional class of 210,061 redeemable ordinary shares on issue all held by Mr Simon Moutter (the former Managing Director). Redeemable ordinary shares have the same voting rights as ordinary shares (but are subject to restrictions regarding disposal).
The 20 largest registered holders of Spark shares at 30 June 2020 were:
NAME1 NUMBER OF SHARES %
1. HSBC Nominees (New Zealand) Limited2 365,556,764 19.90
2. HSBC Nominees (New Zealand) Limited2 215,304,356 11.72
3. JP Morgan Chase Bank 204,779,718 11.15
4. Citibank Nominees (NZ) Limited 140,240,358 7.63
5. HSBC Custody Nominees (Australia) Limited 76,382,894 4.16
6. National Nominees New Zealand Limited 54,934,765 2.99
7. Accident Compensation Corporation 51,721,457 2.82
8. New Zealand Superannuation Fund Nominees Limited 39,063,460 2.13
9. Cogent Nominees Limited 37,963,457 2.07
10. BNP Paribas Nominees NZ Limited3 35,123,205 1.91
11. JP Morgan Nominees Australia Pty Limited 33,670,489 1.83
12. Citicorp Nominees Pty Limited 29,602,031 1.61
13. FNZ Custodians Limited 23,288,905 1.27
14. National Nominees Limited 22,448,004 1.22
15. BNP Paribas Nominees NZ Limited3 22,240,159 1.21
16. Premier Nominees Limited 21,453,501 1.17
17. Tea Custodians Limited 21,189,263 1.15
18. Forsyth Barr Custodians Limited 20,865,292 1.14
19. JB Were (NZ) Nominees Limited 16,492,453 0.90
20. New Zealand Depository Nominee 15,340,790 0.84
1 The shareholding of New Zealand Central Securities Depository Limited (custodian for members trading through NZClear) has been reallocated to the applicable members.2 Has a different holder identification number to the other HSBC Nominees (New Zealand) Limited entry.3 Has a different holder identification number to the other BNP Paribas Nominees NZ Limited entry.
109Connections matterSpark New Zealand Annual Report 2020
For
per
sona
l use
onl
y

According to substantial holder notices as at 30 June 2020 the substantial holders in Spark were as follows:
NAME NUMBER OF ORDINARY SHARES % OF ORDINARY SHARES ON ISSUE1
Blackrock Investment Management (Australia) Limited 137,946,771 7.51
The Vanguard Group, Inc 95,668,054 5.21
1 Based on issued share capital of 1,837,044,943 as at 30 June 2020.
As at 30 June 2020 directors, or entities related to them, held relevant interests (as defined in the Financial Markets Conduct Act 2013) in Spark shares as follows:
NAME
RELEVANT INTEREST IN SPARK SHARES AT 30 JUNE 2020
NUMBER %1
Alison Barrass 37,716 0.0021
Paul Berriman 20,000 0.0011
Warwick Bray – –
Pip Greenwood 33,3252 0.0018
Jolie Hodson 347,4743 0.0189
Ido Leffler 32,0004 0.0017
Charles Sitch 32,7295 0.0018
Justine Smyth 375,2016 0.0204
1 Each percentage stated has been rounded to the nearest 1/1000th of a percent.2 Relevant interest in beneficial ownership of 33,325 ordinary shares held by Custodial Services Limited as custodian for Rakino Trust.3 Includes 52,018 ordinary shares, 203,317 options and 92,139 restricted shares.4 Relevant interest in beneficial ownership of 32,000 ordinary shares held by DJL International Pty Limited as trustee of the Maxim Trust.5 Relevant interest in beneficial ownership of 32,729 ordinary shares held by Sitch Superannuation Pty Limited.6 Relevant interest in beneficial ownership of 375,201 ordinary shares held by Miksha Trust.
All non-executive directors are expected to hold Spark shares. Subject to personal circumstances (that should be discussed with the Chair or, in the case of personal circumstances of the Chair, with the Chair of the ARMC, as appropriate), there is an expectation that each non-executive director will purchase and hold an amount of shares that are at least equivalent in value to the non-executive director base member fee as at the date of their appointment or, in the case of directors appointed before 1 July 2017, as at 1 July 2017. Shares are to be purchased within a three-year period from the date of appointment or, in the case of directors appointed before 1 July 2017, within a three-year period from that date. To assess whether this expectation has been met, the aggregate purchase price for all shares acquired, less the aggregate sale price for all shares disposed (if any), is used to calculate value.
110
Spark New Zealand Annual Report 2020 Corporate governance disclosures
For
per
sona
l use
onl
y

Subsidiary company directorsThe following people held office as directors of subsidiary companies at 30 June 2020. Alternate directors are indicated with an (A).
SUBSIDIARY COMPANY PRINCIPAL ACTIVITY CURRENT DIRECTORS DIRECTORS WHO RETIRED DURING THE YEAR
Computer Concepts Limited IT infrastructure and Cloud services M Anastasiou, G McBeath, S Knight D Chalmers, J Hodson
Digilife New Zealand Limited Home security M Stribling, M Sheppard D Werder
Digital Island Limited Business telecommunications provider S Knight, G McBeath D Chalmers, J Hodson
Gen-i Australia Pty Limited Provides outsourced telecommunications services
F Evett, I Hopkins
Gen-i Limited Holding company S Knight, G McBeath J Hodson
Mattr Limited Software company focused on decentralised identity and verifiable data
C Barber, J Hodson
Qrious Limited Big-data analytics business N Morris, S Knight D Chalmers
Qrious Consulting Limited Data consulting company N Morris, S Knight
Revera Limited IT infrastructure and data centre provider
M Anastasiou, G McBeath, S Knight D Chalmers, J Hodson
Spark Finance Limited Group finance company M Anastasiou, M Sheppard, S Knight, A White
D Chalmers, D Werder
Spark New Zealand Cables Limited Investment company M Sheppard, C Fraser
Spark New Zealand LS Limited Lightbox Sport Limited partnership G McBeath, S Knight D Chalmers, J Hodson
Spark New Zealand Trading Limited Provides local, national and international telephone and data services
M Anastasiou, S Knight, M Beder D Chalmers, J Hodson
Spark Retail Holdings Limited Retailer of telecommunications products and services
M Anastasiou, S Knight D Chalmers
Spark Trustee Limited Trustee company M Anastasiou, S Knight D Chalmers
TCNZ Australia Investments Pty Limited
Holding company F Evett, I Hopkins
TCNZ (Bermuda) Limited Holding company D Havercroft, J Wesley-Smith A Dyer-Fagundo, A Pirie (A), M Stribling (A)
TCNZ Financial Services Limited Investment company M Anastasiou, F Evett
TCNZ (United Kingdom) Securities Limited
Holding/investment company F Evett, M Palmer, J Reader
Teleco Insurance Limited Group insurance company M Beder, A Dyer-Fagundo, A White, M Anastasiou (A), F Evett (A)
D Werder
Teleco Insurance (NZ) Limited Mobile phone insurance A White, R Quince D Werder
Telecom Capacity Limited Holding company S Knight, J Wong D Chalmers
Telecom Enterprises Limited Investment company M Anastasiou, S Knight D Chalmers
Telecom New Zealand (UK) Enterprises Limited
Holding/investment company F Evett, M Sheppard
Telecom New Zealand USA Limited Provides international wholesale telecommunications services
D Reeve, J Wong D Werder
Telecom Pacific Limited Holding company M Anastasiou, M Sheppard
Telecom Southern Cross Limited Holding company M Anastasiou, S Knight D Chalmers
Telecom Wellington Investments Limited
Investment company M Anastasiou, F Evett
Telegistics Limited Mobile phone repair and equipment distribution
R Singh, D Reeve, C Fletcher, R Adams
111Connections matterSpark New Zealand Annual Report 2020
For
per
sona
l use
onl
y

Managing risk framework roles and responsibilities
ACTIVITY PERFORMEDBOARD & ARMC
LEADER-SHIP
SQUAD RISK
LEGAL (DIGITAL TRUST)
ORG UNIT
LEADS
CENTRE OF EXCELLENCE
LEADSPOLICY
OWNERS
ALL SPARK
PEOPLE
Approves the Managing Risk Policy ✔
Monitors the managing risk framework ✔
Reviews principal risk updates ✔
Performs other items from its charter ✔
Prepares strategy and annual plan ✔
Runs QBR process and determines priorities ✔
Coaches and guides Leads ✔
Assigned as owners of identified principal risks ✔
Designs and continuously improves the managing risk framework ✔
Helps the business apply the framework ✔
Prepares principal risk updates for the LS and ARMC ✔
Helps Leads to capture their risks for the QBR content ✔
Executes Internal Audit plan (objective assurance) ✔
Designs and continuously improves the empowerment framework ✔
Creates empowerment & and functional guidance kits ✔
Oversees essential policies and webpage ✔
Creates and delivers training modules ✔
Use the Empowerment and Managing Risk Frameworks ✔
Understand and adhere with the essential policies ✔
Maintain view of risks for OKRs and fill in QBR Memo ✔
Provide input into principal risk process ✔
Escalate risks to LS or Risk Team (if required) ✔
Review risk sections in QBR packs across Spark ✔
Maintain view of risks for their OKRs and fill in QBR ✔
Support Leads to manage identified risks ✔
Provide input into principal risks ✔
Maintain policy and guidance material ✔
Complete assessments of effectiveness ✔
Participate in policy owner working groups ✔
Follow this framework and the essential policies ✔
Make informed decisions after assessing the benefits and risks ✔
112
Spark New Zealand Annual Report 2020 Corporate governance disclosures
For
per
sona
l use
onl
y

External initiatives and membership of associationsStakeholder engagement
Spark engages with a broad range of stakeholders as detailed in the table below. We have also engaged a small number of stakeholders specifically for the purposes of developing and improving our non-financial reporting, and as part of our reporting materiality process. In selecting the stakeholders we engaged with, we are guided by the definition set out in GRI 101: “entities or individuals that can reasonably be expected to be significantly affected by the organisation’s activities, products, or services; or whose actions can reasonably be expected to affect the ability of the organisation to implement its strategies or achieve its objectives.”
STAKEHOLDER GROUP HOW WE ENGAGE
Spark employees • Regular engagement through eNPS (employee net promotor score) methodology and newly launched Joyous real-time employee feedback tool
• Comprehensive programme of internal communication and engagement from Leadership Squad (through roadshows and online channels)
• Engagement with cross-section of employees in the preparation of this report
Shareholders Regular engagement with investors including:
• Semi-annual earnings announcements, together with semi-annual post result investor briefings
• Semi-annual shareholder newsletters
• Annual meeting that allows shareholders a chance to ask questions directly of the Spark Board
• Regular investor roadshows
• Periodic investor strategy briefings
Suppliers • Ongoing conversations with our suppliers – both informal and formal
Customers • Regular feedback from customers on their experiences with us and their views of Spark through our Net Promotor Score methodology and our Voice of the Customer programme
Government • Engagement with central Government on issues related to the telecommunications industry, competition, infrastructure investment and digital equity
• Engagement with local government to manage the process and impacts of infrastructure investment
Media • Responding to media enquiries and through a proactive programme of engagement with key members of New Zealand’s media
Local communities • Engagement with local communities affected by our activities, in particular where we are building new network infrastructure
Community partners • Spark Foundation works in partnership with, and engages, our community partners on an ongoing basis
Industry organisations • Engagement with a number of industry organisations representing the technology community, telecommunications users and the New Zealand business community
External initiatives Spark subscribes to or endorses
• Spark is a founding member of the Climate Leaders Coalition (CLC). The CLC is a group of CEOs who have collectively committed to voluntary action on climate change, measuring and publicly reporting on their emissions, and setting an absolute target for reducing emissions in line with the Paris Agreement. See page 33.
• Spark has committed to a government-accredited voluntary Product Stewardship scheme for mobile phones, which is actioned by the Re:Mobile initiative. See page 35.
Spark was an active member of the following associations in FY20:
New Zealand Internet Task Force
International Telecommunication Union (Radiocommunication Sector membership)
NZTech (Including Internet of Things Alliance and AI Industry Forum)
BusinessNZ
Sustainable Business Council
Aotearoa Circle
Global Women
New Zealand Telecommunications Forum (TCF)
GSM Association (GSMA)
Champions for Change
113Connections matterSpark New Zealand Annual Report 2020
For
per
sona
l use
onl
y

Material issuesTo prioritise Spark’s reporting on sustainability topics we have followed GRI’s materiality principle (set out in GRI 101) to identify and prioritise topics which substantively influence the assessments and decisions of stakeholders or have a significant environmental, social or economic impact.
Our assessment of material topics includes analysis of stakeholder feedback, review of industry peers and interviews with external stakeholders. Internally we consult with a range of employees, including members of our strategy, finance, community, corporate relations, risk, legal and HR teams, to determine Spark’s view of topics meeting the GRI materiality principle criteria.
In FY20 we have reviewed and updated our list of material impacts, taking into account new and emerging issues particularly related to the impact of COVID-19. This has prioritised our role to support economic recovery, and highlighted the importance of investment in resilient and adaptable infrastructure. We have also followed the materiality principles of the Integrated Reporting International <IR> Framework, considering whether a matter could substantively affect Spark’s ability to create value in the short, medium or long term.
• Customer experience and support
• Data privacy and security
• Digital equity
• Equipping people for the future of work
• Operational excellence and financial performance
• Building partnerships for a strong Aotearoa
• Resilient, adaptable network infrastructure
• Supporting business customers through partnership
• Competition and regulation
• Diversity and Inclusion
• Ethical behaviour
• Ethical supply chain and procurement practices
• Adaptation to physical risk from climate change
• Disaster and crisis response
• Heath, Safety and Wellbeing
• Investment in innovation
• Leveraging services for community and environmental outcomes
• Product stewardship
• Responsible and fair use of our products and services
• Community investment
• Infrastructure impact
• Operational efficiency, emissions and waste
• Responsible employment practices
• Tax
SIGNIFICANCE OF ECONOMIC, ENVIRONMENTAL AND SOCIAL IMPACTS
INFL
UE
NC
E O
N S
TAK
EH
OLD
ER
ASS
ESS
ME
NTS
AN
D D
EC
ISIO
NS
114
Spark New Zealand Annual Report 2020 Corporate governance disclosures
For
per
sona
l use
onl
y

Global Reporting Initiative (GRI) content indexOur disclosure against each material topic includes our management approach, considering the requirements of GRI 103: Management Approach.
Note: CGS refers to Spark’s Annual Corporate Governance Statement, which may be found here: https://www.sparknz.co.nz/about/governance
Indicator Disclosure Page number / reference
GRI 102: General disclosures 2016102-1 Name of the organisation 4102-2 Activities, brands, products and services 8102-3 Location of headquarters 118102-4 Location of operations 8102-5 Ownership and legal form 103, 109102-6 Markets served 8102-7 Scale of the organisation 8-9, 84, 109102-8 Information on employees and other workers 31102-9 Supply chain 49102-10 Significant changes to the organisation and its supply chain 59102-11 Precautionary principle or approach 46-47102-12 External initiatives 113102-13 Membership of associations 113102-14 Statement from senior decision-maker 10-13102-16 Values, principles, standards and norms of behaviour 6, 19, 46, CGS Principle 1102-18 Governance structure 42-43, 46, CGS Principles 2, 3 and 4102-40 List of stakeholder groups 113102-41 Collective bargaining agreements <1% of Spark employees in FY20102-42 Identifying and selecting stakeholders 113102-43 Approach to stakeholder engagement 113102-44 Key topics and concerns raised 114102-45 Entities included in the consolidated financial statements 58, 111102-46 Defining report content and topic boundaries 113-114102-47 List of material topics 114102-48 Restatements of information 33 (Emissions reporting)102-49 Changes in reporting N/A102-50 Reporting period 4102-51 Date of most recent report Spark’s FY19 Annual Report was
published on 21 August 2019102-52 Reporting cycle Spark reports annually. Our financial
year is 1 July – 30 June102-53 Contact point for questions relating to the report 118102-54 Claims of reporting in accordance with GRI standards 4102-55 GRI content index 115-116102-56 External assurance 98-102GRI 200 Economic Standard Series 201-2 Financial implications and other risks and opportunities due to climate
change48
203-1 Infrastructure investments and services supported 22-25206-1 Legal actions for anti-competitive behaviour, anti-trust and monopoly
practices19
115Connections matterSpark New Zealand Annual Report 2020
For
per
sona
l use
onl
y

GRI 300 Environmental Standard Series305-1 Direct (Scope 1) emissions 33305-2 Energy indirect (Scope 2) emissions 33305-3 Other indirect (Scope 3) emissions 33306-2 Management of significant waste-related impacts 34-35306-3 Waste generated 34-35308-1 New suppliers that were screened using environmental criteria 49308-2 Negative environmental impacts in the supply chain and actions taken 49GRI 400 Social Standard Series 401-1 New employee hires and employee turnover 31401-2 Benefits provided to full-time employees that are not provided to
temporary or part-time employees107
401-3 Parental leave 30403-1 (2018)
Occupational health and safety management system 28
403-9 (2018)
Work-related injuries 28 (TRIFR reporting)
404-2 Programmes for upgrading employee skills and transition assistance programmes
17, 26-27
405-1 Diversity of governance bodies and employees 30-31, 43405-2 Ratio of basic salary and remuneration of women to men 30414-1 New suppliers that were screened using social criteria 49414-2 Negative social impacts in the supply chain and actions taken 49417-3 Incidents of non-compliance concerning marketing communications 19418-1 Substantiated complaints concerning breaches of customer privacy and
losses of customer data19
116
Spark New Zealand Annual Report 2020 Corporate governance disclosures
For
per
sona
l use
onl
y

Glossary
3G third-generation mobile network as defined by the International Telecommunications Union.
4G fourth-generation mobile network as defined by the International Telecommunications Union.
5G fifth-generation mobile network as defined by the International Telecommunications Union.
ADR an American Depositary Receipt.
ARMC the Audit and Risk Management Committee.
ARPU Average Revenue per User.
ASX the Australian Securities Exchange.
Burstable able to exceed maximum bandwidths for short periods.
CCL Computer Concepts Limited.
CCN Converged Communications Network.
Company Spark New Zealand Limited.
EBITDAI earnings before finance income and expense, income tax, depreciation, amortisation and net investment income.
EMFs Electromagnetic fields.
eNPS employee Net Promoter Score and is our measure of employee satisfaction.
GRI the Global Reporting Initiative.
Group the Group in relation to these financial statements, which are prepared for Spark New Zealand Limited (the Company) and its subsidiaries (together the Group).
HRCC the Human Resources and Compensation Committee.
IoT the Internet of Things.
IFRS International Financial Reporting Standards.
LTE Long-Term Evolution.
LTI Long-Term Incentive, which is part of Spark Leadership Team and former Managing Director and CEO remuneration.
NOMs the Nominations and Corporate Governance Committee.
NPS Net Promoter Score.
NZ GAAP Generally Accepted Accounting Practice in New Zealand.
NZ IAS New Zealand International Accounting Standard.
NZ IFRS New Zealand Equivalent to International Financial Reporting Standards.
NZX NZX Limited.
OTN Optical Transport Network.
PSTN Public Switched Telephone Network.
QBR Quarterly Business Review.
RWC the 2019 Rugby World Cup.
SME Small and medium enterprise.
Southern Cross Southern Cross Cables group of companies, which consists of two sister companies, Southern Cross Cables Holdings Limited and Pacific Carriage Holdings Limited and their subsidiaries.
SRAN Single Radio Access Network.
STI Short-Term Incentive, which is part of Spark Leadership Team and former Managing Director and CEO remuneration.
TSR Total Shareholder Return and is a measure of share price appreciation and dividends paid over a given period.
117Connections matterSpark New Zealand Annual Report 2020
For
per
sona
l use
onl
y

Contact detailsRegistered office
Level 2Spark City167 Victoria Street WestAuckland 1010New ZealandPh +64 4 471 1638 or 0800 108 010
Company secretary
Silvana Roest
For more information
For inquiries about transactions, changes of address or dividend payments contact the share registries below.
New Zealand registry
Link Market Services Limited Level 11 Deloitte Centre PO Box 91976 80 Queen Street Auckland 1142 Ph +64 9 375 5998 (investor inquiries) Fax +64 9 375 5990
[email protected] www.linkmarketservices.co.nz
Australian registry
Link Market Services Limited Level 12 680 George Street Sydney NSW 2000 Australia Locked Bag A14 Sydney South NSW 1235 Australia
Ph +61 1300 554 484 (investor inquiries) Fax +61 2 9287 0303
[email protected] www.linkmarketservices.com.au
United States registry
Computershare Investor Services P.O. Box 505000 Louisville, KY 40233-5000 United States of America
Ph +1 888 BNY ADRS (+1 888 269 2377) or +1 201 680 6825 (from outside the United States)
[email protected] www.mybnymdr.com
Spark New Zealand Limited
ARBN 050 611 277
For inquiries about Spark’s operating and financial performance contact:
[email protected] Investor Relations Spark New Zealand Limited Private Bag 92028 Auckland 1142 New Zealand investors.sparknz.co.nz
insightcreative.co.nz
SPA
RK04
6
118
Spark New Zealand Annual Report 2020 Corporate governance disclosures
For
per
sona
l use
onl
y

For
per
sona
l use
onl
y

investors.sparknz.co.nzARBN 050 611 277
For
per
sona
l use
onl
y

For
per
sona
l use
onl
y

Results overviewFor
per
sona
l use
onl
y

How we adapted and delivered in FY20
Delivered what we said we would – FY20 results within guidance
Dividend of 25.0c andtotal shareholder return of 19% in FY20
Adapted at pace to COVID-19, supporting our people, customers and New Zealand
Successfully delivered our 3-year plan, and developed a new path to FY23 that builds on our competitive advantage
3
For
per
sona
l use
onl
y

FY20 snapshot
EBITDAI(1)
$1,113mREVENUE(2)
$3,623m
EBITDAI MARGIN
30.7%
MOBILE SERVICEREVENUE MARKET SHARE(3)
40.2%CONSUMER & SMALL BUSINESS iNPS
+33
EMPLOYEE NPS
+66DIGITAL EQUITY
9,559
iNPS score up 10 points from FY192.1% increase from FY19 2.5% increase from FY19
(0.2pp) decrease from FY19
1.0pp increase from FY19
# Skinny Jump connections – up from 3,016 in FY19
People engagement score, up 25 points from FY19
10.8% increase from FY19
$443mCLOUD REVENUE(4)
(1) Earnings before finance income and expense, income tax, depreciation, amortisation and net investment income (EBITDAI) is a non-Generally Accepted Accounting Practice performance measure that is defined and reconciled to Spark New Zealand’s Annual Report(2) Operating revenue and other gains(3) Market share estimates sourced from IDC(4) Cloud, security & service management revenue
4
For
per
sona
l use
onl
y

FY20 guidance delivered
FY19 Actual FY20 Guidance FY20 Actual
EBITDAI $1,090m $1,100m-$1,120m $1,113m
Capital expenditure $417m ~$370m $374m
Dividend per share
Ordinary 22.0c (75% imputed)
Special 3.0c (75% imputed)
Ordinary 25.0c(at least 75% imputed)
Ordinary 25.0cH1 FY20
(75% imputed)H2 FY20(1)
(100% imputed)
(1)Dividend Reinvestment Plan reinstated for H2 FY20 dividend. Shares issued under the Dividend Reinvestment Plan will be issued at a 2% discount to the prevailing market price as determined around the time of issue 5
For
per
sona
l use
onl
y

FY20 highlights
(1) Market share estimates sourced from IDC (2) H1 FY20 service revenue growth of 5.5%. H2 FY20 service revenue growth of 2.4% impacted by loss of roaming revenues due to COVID-19 border closures(3) Endless plans are Spark’s mobile plans with unlimited calling minutes, unlimited SMS and an allowance of data to use at the maximum available speed, after which they are able to continue using mobile data but at a reduced speed(4) Estimated cost savings based on average wireless broadband volumes multiplied by the bundled UBA/UCCL input cost(5) Hewlett Packard Enterprise annual partner awards for the Asia Pacific region
WIRELESS DIGITAL SERVICES
MOBILE BROADBAND CLOUD, SECURITY AND SERVICE MANAGEMENT
Only NZ mobile provider to grow service revenues, connections and total ARPU in FY20(1)
YoY increase of 79k in pay monthly connections
Tripled customer base on Endless(3) mobile propositions
Service revenue growth of 3.9%(2)
driven by Endless upsell, partially offset by COVID-19
Secured 60MHz of critical 5G C-band spectrum
~$74m(4) annualised gross cost reduction in access costs
Total YoY connection growth of 14k
22% of base now on wireless broadband
74% of base now on Unlimited or Unplan, up 9pp YoY
Kept New Zealand working, learning and connecting during lockdown
Cloud, security and service management revenue up $43m or 10.8% YoY
Revera and CCL businesses successfully integrated
Launch of digital transformation consultancy business Leaven
CCL awarded strategic partner and service provider of the year(5)
Announced strategic partnership with Microsoft to drive adoption of Azure cloud technologies
6
For
per
sona
l use
onl
y

FY20 indicators of success
(1) Consumer and business segments only(2) Internet of Things(3) Measured as school aged children 5-18 years who participate in one of the Spark Foundation’s digital inclusion or skills and capability programmes including Jump Digital Native Academy, Code Club, The Electric Garden and Like a Boss(4) Impacted by stop sell in the lead up to RWC and during COVID-19 lockdown
Measures Target30 June 2020
Actual30 June 2020
Build customer intimacyConsumer and small business iNPS 8 point lift Achieved
Growth in mobile and broadband change transactions completed online 30% Exceeded
Create a wireless future
Go-live of 5G for America’s Cup (subject to spectrum) Ready for July 2020 launch Launched
Preparation for commercial launch of 5G (subject to spectrum)5G sites deployed to targeted geographical locations
Launched
Growth in wireless broadband connections +20k +16k(4) - Not achieved
Create New Zealand’s premier sports streaming experience
Rugby World Cup tournamentSuccessfully deliver the RWC tournament with platform availability of 99.9%
Delivered platform availability of 99.8%
Grow key markets
Mobile service revenue growth(1) 4% to 5% Achieved
Cloud, security and service management revenue growth 8% to 10% Achieved
Growth in number of connected IoT(2) devices 60% Achieved
Launch progressive rollout of new concept Spark retail stores By end of September 2019 Completed
Mature Agile leadership Percentage of Agile squads at or above level 3 85% Achieved
Deliver best cost EBITDAI margin At least 31% Achieved
Lead on sustainabilityTransition to integrated reporting For FY20 annual report Achieved
Number of school students participating in one of the Spark Foundation’s programmes(3) 10k Achieved
7
For
per
sona
l use
onl
y

Current 3-year plan successfully delivered
Outstanding customer experience
Significant improvements across most key NPS(1) measures – with many above +30.
Solid progress
Holding market share
Winning in mobile, growing connections and outpacing the market in mobile service revenue share growth. New Zealand’s largest hybrid cloud provider.Return to broadband connection growth with focus on stablising revenues.
Achieved
Lowest cost operator$228m gross cost reduction since FY17. Delivered through Quantum programmefocused on digitisation, automation and simplification and ongoing focus on productivity and efficiency.
Delivered
Growing key markets Sustained growth in mobile, cloud, security and service management.Broadband market remains challenging.
Achieved
Top decile culture Employee NPS +66. Continue to mature Agile ways of working. Strong diversity and inclusion focus.
Achieved
Top 10 global telco ROI
Ranked #1against international peers(2) for Total Shareholder Returns. Compound annual growth rate of 13%(3)
Three-year(3) Return on Invested Capital 16% per annum. Ranked #2 against international peers(2).
(1)Net Promoter Score is an index ranging from -100 to 100 that measures the willingness of an employee or customer to recommend a company to others(2)Pre-tax ROIC and TSR versus international peers: Verizon, BT Group, Telstra, Swisscom, Singapore Telecom, AT&T, Orange, KT Corporation, Vodafone Group, Telecom Malaysia(3)Representing the last three reported years for each peer
Revenue0-2% CAGR
Achieved
EBITDAIat least 31% margin
Achieved
DividendSustainable total dividend of 25cps or above that is not supplemented by debt
Solid progress
8
With strong market outcomes and industry leading returns
For
per
sona
l use
onl
y

Create a Sustainable Spark
Be bold in our business to have a positive impact on our communities and the environment.
• Invest in the capabilities of our people, equipping them to thrive in a digital future
• Reduce our footprint and meet our emissions target of -25% by 2025, investing in our fleet and infrastructure
• Be responsible, transparent and accountable for our social and environmental performance
Economic Recovery and Transformation
Help New Zealand transform to a high productivity, low carbon economy.
• Focus our infrastructure investment on supporting NZ’s recovery and transformation
• Support Kiwi businesses to adapt to become more productive, resilient and sustainable through technology
• Support New Zealanders to upskill and adapt to new ways of working
Champion Digital Equity
Champion digital equity so all New Zealanders have the opportunity to thrive in a digital future.
• Extend the reach of Skinny Jump to benefit more households – 20,000 by June 2021
• Partner alongside the Spark Foundation to address barriers to digital equity, including access, skills, trust and motivation
• Champion diversity and inclusion in our business and our communities
We will work alongside New Zealand to harness the power of technology and create a positive digital future for all.
New Sustainability Framework introduced
9
For
per
sona
l use
onl
y

FY20 – a year characterised by its final quarter
o Increase in demand for collaboration products in support of shift to working from home
o Acceleration of digital transformation as customers looked to modern workplace tools
o Partnered with Ministry of Education to rollout Skinny Jump wireless broadband modems to ensure as many kids could participate in distance learning as possible
The impact of COVID-19 was moderated by the fact it only materialised in New Zealand in the final quarter. Total negative EBITDAI impact of approximately $25m in FY20(1)
COVID-19 OpportunitiesCOVID-19 Impacts
o Loss of higher-margin roaming revenue
o Retail revenue reductions due to store closures
o Removal of overage fees on capped broadband plans
o Waived late payment fees and disconnections as a result of financial hardship
o No live sport globally, resulting in the Spark Sport platform being provided free of charge
Spark will continue to respond and mitigate any COVID-19 impacts and reduce costs across the business while supporting our customers and the community to work, learn and connect
10(1) The negative impact of $25m includes an additional $6 million expected credit loss provision primarily driven by the additional risk arising from uncertain future economic conditions. See note 1.3 of Spark’s 2020 Annual Report
For
per
sona
l use
onl
y

Our new context
For
per
sona
l use
onl
y

COVID-19 impacts will materialise further in FY21• IMF has predicted the largest global economic downturn since the Great Depression of the
1930s, this will have flow on impacts for New Zealand given our dependence on global trade and tourism.
• Tourism unlikely to return to historical levels for some time.
• New Zealand will enter a recession and unemployment is forecast to increase.
• The impact on small-medium businesses, many of whom are our customers, may be significant.
• This creates an environment of volatility and uncertainty, which has been further exacerbated by the resurgence of COVID-19.
• Billing collection risk as customers experience financial hardship and wage subsidies roll off.
• Mobile market growth likely to be slower, particularly roaming and mobile handsets.
• IaaS and SaaS(1) likely to benefit, but potentially some offset in other IT outsourcing programmes.
• Greater confidence to increase caps and drive wireless broadband uptake after strong network performance during lockdown.
• Cost reduction programs require acceleration in FY21.
• 5G rollout and sustainability focus on digital divide even more critical to support New Zealand’s recovery.
12(1) Infrastructure as a Service and Software as a Service
For
per
sona
l use
onl
y

Macro trends are accelerating
A seismic shift of business and society from physical to digital.
Increasing pace of technology disruption and business transformation.
Exponential growth in data –data is the future currency.
Greater emphasis on connectivity as a basic social need.
Explosion of connected devices.
An unprecedented recessionary event requiring a period of nation building and a focus on affordability.
13
For
per
sona
l use
onl
y

The next three yearsFor
per
sona
l use
onl
y
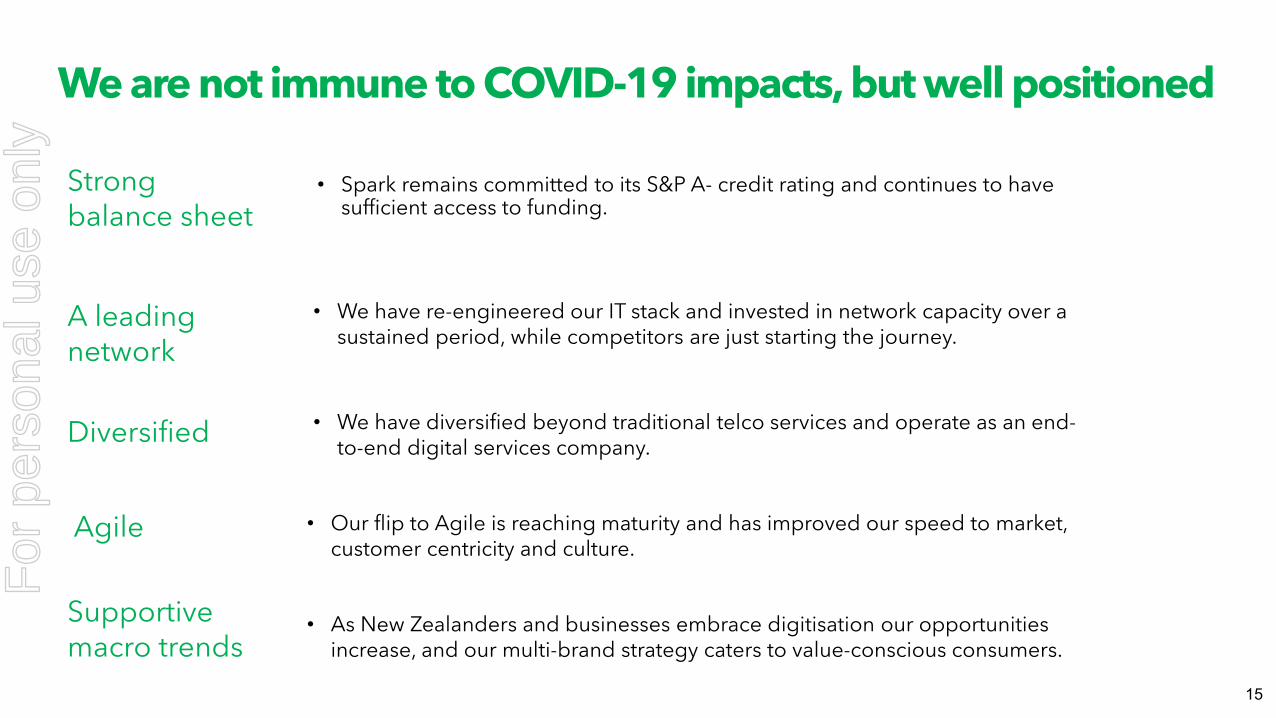
We are not immune to COVID-19 impacts, but well positioned
• Spark remains committed to its S&P A- credit rating and continues to have sufficient access to funding.
A leading network
Strong balance sheet
Diversified
Agile
Supportive macro trends
• We have re-engineered our IT stack and invested in network capacity over a sustained period, while competitors are just starting the journey.
• We have diversified beyond traditional telco services and operate as an end-to-end digital services company.
• Our flip to Agile is reaching maturity and has improved our speed to market, customer centricity and culture.
• As New Zealanders and businesses embrace digitisation our opportunities increase, and our multi-brand strategy caters to value-conscious consumers.
15
For
per
sona
l use
onl
y

The next three years
• Spark will share its next three year strategy at an Investor Briefing on 16 September 2020.
• The new strategy is an evolution – building on the momentum of the prior three years.
• It will be focussed on a set of core capabilities that will underpin growth in our key markets and in new markets.
• As New Zealand recovers from COVID-19, our sustainability strategy will be focussed on improving Spark’s sustainability performance, supporting economic transformation and lifting digital equity.
16
For
per
sona
l use
onl
y

A strategic focus on unconstrained capacity will underpin growth in wireless
1. Simplification and moving off legacy technology will pave the way for technology evolution, new revenue streams, and improved cost base and environmental performance.
2. 5G rollout will cater to customers with high data needs, underpin innovation and free up 4G spectrum to increase capacity in regional and rural areas.
3. Wireless broadband take-up will continue to grow as 5G delivers greater capacity and speeds over time.
4. Big data and AI driving enhanced customer experience, lower cost of acquisition and improving data insights and return on marketing investment.
17
For
per
sona
l use
onl
y

FinancialsFor
per
sona
l use
onl
y

Financial summaryStrong operational and financial results with all guidance metrics met. Impact of COVID-19 occurring in final quarter moderating impact on FY20 performance
(1) Lower tax expense due to depreciation allowances being reintroduced for commercial building as part of the Government COVID-19 assistance package; and a higher proportion of non-taxable gains(2) Net debt at hedged rates as reported in note 4.4 of Spark’s FY20 Annual Report(3)Shares issued under the Dividend Reinvestment Plan will be issued at a 2% discount to the prevailing market price as determined around the time of issue
$23m2.1%
EBITDAI movement
vs. FY19
$18m4.4%
NPAT movement
vs. FY19
19
Return to top line revenue growth, up $90m or 2.5% YoY driven by:• Increase in cloud, security and service management revenue of $43m or 10.8%;• Excellent performance in mobile with growth in high margin service revenue of $32m or 3.9%;• Growth in emerging revenue streams via Spark Sport and Qrious data analytics business.
Operating expenses up $67m or 2.7% YoY with $99m of gross cost-out benefits reinvested in support of revenue growth.
$90m2.5%
Revenue movement
vs. FY19
$67m2.7%
Opexmovement
vs. FY19
EBITDAI of $1,113m, up $23m or 2.1% YoY due to strong performance in key mobile and cloud markets.
NPAT growth of $18m or 4.4% YoY primarily due to:• EBITDAI growth, and lower tax expense(1); partially offset by:• Lower net investment income ($13m) due to no Southern Cross dividends in FY20; and• Increase in net finance expense $10m due to the increase in average debt during the year and growth in
leases.
Free Cash Flow of $438m up $146m YoY, short of $460m aspiration due to a conscious decision to secure 5G mobile network equipment.
Net debt(2) of $1,349m up $33m on FY19, a decrease of $177m during H2 FY20, due to improvement in free cash flow.
H2 FY20 dividend per share of 12.5c to be 100% imputed. Dividend Reinvestment Plan reinstated for H2 FY20 dividend(3).
For
per
sona
l use
onl
y

FinancialsFY19
$mFY20
$mCHANGE
Operating revenues and other gains 3,533 3,623 2.5%
Operating expenses (2,443) (2,510) (2.7%)
EBITDAI 1,090 1,113 2.1%
Finance income 37 36 (2.7%)
Finance expense (85) (94) (10.6%)
Depreciation and amortisation (477) (479) (0.4%)
Net investment income 14 1 (92.9%)
Net earnings before tax expense 579 577 (0.3%)
Tax expense (170) (150) 11.8%
Net earnings after tax expense 409 427 4.4%
Capital expenditure 417 374 (10.3%)
Free cash flow(1) 292 438 50.0%
EBITDAI margin 30.9% 30.7% (0.2pp)
Effective tax rate 29.4% 26.0% (3.4pp)
Capital expenditure to operating revenues 11.8% 10.3% (1.5pp)
Earnings per Share 22.3c 23.2c 4.0%
Total Dividend per Share 25.0c 25.0c -
(1) The calculation of free cash flow is defined within the ‘cash flows’ worksheet of the FY20 detailed financials 20
For
per
sona
l use
onl
y
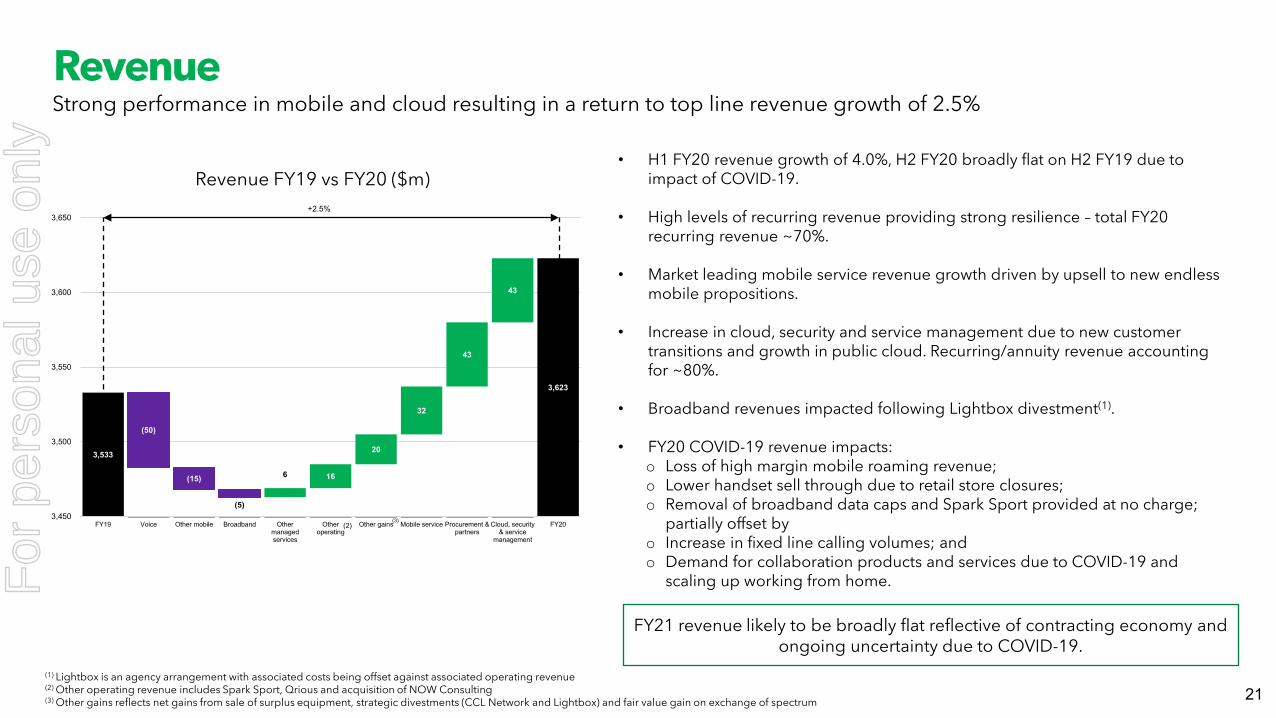
3,533
3,623
6 16
20
32
43
43
(50)
(15)
(5)3,450
3,500
3,550
3,600
3,650
FY19 Voice Other mobile Broadband Othermanagedservices
Otheroperating
Other gains Mobile service Procurement &partners
Cloud, security& service
management
FY20
Revenue FY19 vs FY20 ($m)+2.5%
(2)(3)
RevenueStrong performance in mobile and cloud resulting in a return to top line revenue growth of 2.5%
• H1 FY20 revenue growth of 4.0%, H2 FY20 broadly flat on H2 FY19 due to impact of COVID-19.
• High levels of recurring revenue providing strong resilience – total FY20 recurring revenue ~70%.
• Market leading mobile service revenue growth driven by upsell to new endless mobile propositions.
• Increase in cloud, security and service management due to new customer transitions and growth in public cloud. Recurring/annuity revenue accounting for ~80%.
• Broadband revenues impacted following Lightbox divestment(1).
• FY20 COVID-19 revenue impacts:o Loss of high margin mobile roaming revenue;o Lower handset sell through due to retail store closures; o Removal of broadband data caps and Spark Sport provided at no charge;
partially offset byo Increase in fixed line calling volumes; and o Demand for collaboration products and services due to COVID-19 and
scaling up working from home.
(1) Lightbox is an agency arrangement with associated costs being offset against associated operating revenue(2) Other operating revenue includes Spark Sport, Qrious and acquisition of NOW Consulting(3) Other gains reflects net gains from sale of surplus equipment, strategic divestments (CCL Network and Lightbox) and fair value gain on exchange of spectrum
FY21 revenue likely to be broadly flat reflective of contracting economy and ongoing uncertainty due to COVID-19.
21
For
per
sona
l use
onl
y

Spark’s end-to-end digital services offering is locally unique and creates competitive advantage
Professionals Services and Consulting
Service Management
Procurement
Security
Cloud Services and Data Centres
Managed Data and Networks
Submarine Cables and Transport Network
Spark’s position Market trends
• Growing demand for expertise to deliver cloud solutions• Long term growth opportunities in business
transformation
• Sustained demand for outsourced IT management• Customer needs shifting in response to cloud adoption
• Increased investment in remote working following COVID-19
• Executive cyber risk concerns driving demand for security• Increased focus on security of remote working
environments
• Ongoing shift to the cloud• Public cloud hyperscale providers signalling interest in NZ• Big data, AI and ML(3) enhancing customer experiences
and operational effectiveness
• Growing adoption of SD-WAN• Growth of dedicated cloud connectivity• 5G rollout underway • IoT(1) and explosion of connected devices
• Growth of international traffic, driven by cloud and video• Development of Southern Cross NEXT
• Significant capability in business transformation• Consulting expertise in data/analytics through
Qrious/Leaven
• Support customer environments end-to-end, including growing cloud managed services capability
• Serves customer demand for end-to-end IT outsourcing
• Effective sell through to higher margin managed services
• Strength in Government/Enterprise market segment• Largest Security Operations Centre (SOC) in NZ• Complementary service to connectivity
• A market leader for onshore private cloud services(2)
• Hybrid cloud offering via public cloud partnerships
• A market leader for managed data and networks
• Largest ownership stake in submarine cables• Optical transport network with 800 Gb/s links to
support increasing demand for data
Product
Non-recurringLower margin
Non-recurringLower margin
AnnuityHigher margin
AnnuityHigher margin
AnnuityHigher margin
AnnuityHigher margin
AnnuityHigher margin
Revenue profile
(1)Internet of Things(2)Market estimates sourced from IDC(3) Artificial Intelligence and Machine Learning
22
For
per
sona
l use
onl
y

Operating expenses
• $99m of gross cost-out driven by:o Data insights reducing marketing spend;o Reduction in customer credits due to improved billing processes; ando Reduction in product costs through tight management of rebates and
supplier renegotiation.
• Cost-out reinvested in support of new and emerging revenues mobile, cloud, Spark Sport and Qrious. Cloud and procurement product costs a significant driver of increase.
• Increase in net labour costs of $36m YoY due to:o Investment in support of revenue growth and inflation;o Reduction in capitalisation of labour; ando Offset by ongoing re-balancing of our workforce as legacy business
shrinks and interactions move to digital.
• FY20 COVID-19 operating expense impacts:o Lower mobile product costs due to retail store closures and reduced
handset sell through;o Lower travel, accommodation and advertising expenses; ando Small increase in bad debts.
Total operating expenses up 2.7% with cost efficiencies reinvested to fund growth in key markets
Robust cost out programme in place for FY21, targeting reductions in excess of FY20 which will provide flexibility to respond appropriately to
changing economic conditions.
2,443
2,510 125
27
14
(99)
2,300
2,350
2,400
2,450
2,500
2,550
FY19 Cost out Investment in supportof growth
Reduction in labourcapitalisation
Other movements FY20
Expenses FY19 vs FY20 ($m)+2.7%
475
511
-
27
35
(26)
440
450
460
470
480
490
500
510
520
FY19 Labour cost reduction Reduced capitalisation Investment in support ofrevenue growth
FY20
Net Labour FY19 vs FY20 ($m)
23
For
per
sona
l use
onl
y

EBITDAI
• Ongoing growth in total gross margin due to strong performance in mobile and cloud markets and benefits of cost management activities.
• Portfolio consolidation includes:o Other gains generated by divestment of non-core
assetso Sale of surplus mobile network equipment; and a fair
value gain on exchange of spectrum; partially offset byo Asset write-downs.
• EBITDAI margin in line with aspiration of at least 31%.
EBITDAI growth of 2.1% underpinned by strong momentum across key markets and cost management
• Impact of COVID-19 expected to be more material at ~$75m for FY21:o Preparing for a tougher economic environment which is
likely to result in broadly flat revenue; o Upweighting focus on cost reduction to offset COVID-19
impacts; ando Accelerating growth into 5G, wireless broadband and
modern workplaces.
1,090 1,113
1,128
90
25
(67)
(10)
1,000
1,050
1,100
1,150
1,200
FY19 Revenuegrowth
Operatingexpenses
growth
FY20 Reported Portfolioconsolidation
COVID-19 FY20Underlying
EBITDAI FY19 vs FY20 ($m)
+2.1%
+3.5%
24
For
per
sona
l use
onl
y

Capital investment
Capital expenditure ($m) FY19 FY20
Mobile network 118 116
IT systems 132 129
Core sustain and resiliency 63 65
Cloud(2) 36 24
Converged Communications Network (CCN) 31 18
International cable construction and capacity(3) 12 11
Other(4) 25 11
Total capital expenditure 417 374
Total capital expenditure to operating revenue 11.8% 10.3%
(1) Excluding expenditure on mobile spectrum(2) Reduction in Cloud spend due to shift towards leasing construct(3) International cable includes capacity purchases on Southern Cross cable and investment in Tasman Global Access cable (4) Reductions in other investments due to completion of IoT LoRA WAN network, divestment of Lightbox; and lower retail store fit-out spend
Capital expenditure successfully delivered in support of our business priorities within targeted envelope of ~$370m(1)
• Sustained network investment provided critical connectivity during COVID-19, which saw dramatic increases in usage across Spark’s networks.
• Mobile network investment to support first deployment of 5G technology and increased capacity in support of growth in wireless broadband and introduction of Spark Sport streaming services.
• Investment in IT systems to improve digital customer experience and implementation of Spark Sport platform.
FY21 capital expenditure focussed on supporting New Zealand’s economic recovery, including the rollout of 5G
and investment in rural connectivity.
Prioritised allocation of capex combined with long-term investments in mobile spectrum resulting in greater overall
investment in FY21 versus FY20.
25
For
per
sona
l use
onl
y

Net debt(1)
Total net debt of $1,349m, up $33m YoY. Net debt to EBTIDA ratio within S&P’s A- credit rating
• Reported net debt to EBTIDAI ratio of 1.21x(4).
• Net Debt decreased by $177m during H2 FY20 as expected, due to improvement in free cash flow.
• Portfolio reallocation through divestment of non-core assets to invest in growth and strategic investments.
FY21 Net Debt expected to increase to fund upcoming spectrum renewals for 1800MHz and 2100MHz.
1,316 1,349
459
46 2
(438)
(36)
850
950
1,050
1,150
1,250
1,350
Net debt as at30 June 2019
Free cash flow Dividends paid Businessacquisitions and
minorityinvestments
Proceeds fromasset and
business sales
Othermovements
Net debt as at30 June 2020
Movement in net debt during FY20 ($m)
(2)(3)
(1) Net debt at hedged rates as reported in note 4.4 of Spark’s FY20 Annual Report(2) Business acquisitions and minority invests include acquisition of Now Consulting, Southern Cross Next and Rural Connectivity Group equity contributions(3) Proceeds from asset sales includes sale of surplus mobile network equipment and strategic divestments (CCL Network and Lightbox)(4)Spark’s internal capital management policy is to ensure that on a long-run basis reported net debt to EBITDAI does not exceed 1.4x; which Spark estimates is approximately equivalent to S&P’s 1.7x adjusted debt to EBTIDA threshold. Spark’s internal threshold of 1.4x accounts for S&Ps adjustments in relation to IFRS16, and captive finance operations 26
For
per
sona
l use
onl
y

Funding and liquidity
27
22%
29%
36%
12%
Sources of long term debt as at 30 June 2020
Bank Funding
Domestic Bonds
Offshore Bonds
Standby
(1)
(1)Excludes $200m committed revolving bank facility maturing November 2020(2)Commitment stepdown to NZ$167m for the period 1 May 2022 to 20 April 2023
• Established an additional $150m of committed revolving bank facilities on 2 April 2020 to provide additional funding and liquidity during COVID-19 uncertainty.
• Successfully issued AU$100m, 6-year fixed rate bond in June 2020 to refinance debt maturities.
As at 30 June 2020:
• Committed bank facilities of $575m of which $425m was undrawn.
• Undrawn $200m syndicated standby facility with a maturity of April 2023(2).
• Only debt facility maturity over the next twelve months is the $200m committed revolving bank facility due November 2020.
Remain committed to S&P A- credit rating and continue to have sufficient access to funding
100 100 125 125107165 169
134
0
50100
228
33
200
200
25
0
50
100
150
200
250
300
350
400
450
Jun 21 Jun 22 Jun 23 Jun 24 Jun 25 Jun 26 Jun 27 Jun 28 Jun 29 Jun 30 Jun 31
Gross debt maturity profile (incl. undrawn) as at 30 June 2020
NZD Bonds Offshore Bonds Bank Funding (drawn)Commercial Paper (short term) Standby (undrawn) Bank Funding (undrawn)
167
For
per
sona
l use
onl
y

Free cash flowFree Cash Flow of $438m up $146m YoY, short of $460m aspiration due to a conscious decision to secure 5G mobile network equipment in advance of requirements
EBITDAI
$1,113mCAPEX
$374mWORKING CAPITAL
$17mFREE CASH FLOW
$438m2.1% increase from FY19 10.3% decrease from FY19 Improvement in working capital
from FY1950% increase from FY19
FY20 free cash flow growth driven by:
FY21 free cash flow aspiration $420m-$460m sufficient to fund shareholder distributions of 23-25 cps(1) after taking into account impact of dividend reinvestment plan(2).
FY21 free cashflow driven by:
1 2 3
EBITDAI stabilityPrioritised capital
expenditureOngoing improvement in
working capital
(1) Subject to no adverse change in operating outlook(2) Dividend Reinvestment Plan reinstated for H2 FY20 dividend. Shares issued under the Dividend Reinvestment Plan will be issued at a 2% discount to the prevailing market price as determined around the time of issue 28
For
per
sona
l use
onl
y

FY21 indicators of successStrategic Pillar Focus Area Measure Target 30 June 2021
World Class Capability
Customer Experience Consumer and small business iNPS 8 point lift
Data driven insights 80% of customer base(1) in household view(2) enabling15% efficiency gain in marketing spend
Wireless future Progressive rollout of 5G Live in 5-7locations
Mature Agile Leadership
Percentage of Agile squads at or above level 3.5 85%
Grow key markets
Wireless Mobile service revenue growth 0-3%
Wireless Wireless broadband connections +40k
Cloud Cloud, security and service management revenue growth 5-8%
Accelerate future markets
IoT(3) Growth in number of connected IoT devices 50%
Spark Sport Successfully deliver season 1 of New Zealand cricketPlatform availability of 99.9%
Lowest Cost Provider Deliver best cost EBTIDAI margin 31%
Build a sustainable future
Championing digital equity
Skinny Jump connections +10k
Sustainable SparkSet emissions reductions target aligned to New Zealand being carbon neutral by 2050(4) By 30 June 2021
(1) Spark and Skinny consumer and Spark SME customer base(2)Household view is an insights platform that allows us to better anticipate the needs of New Zealand households to deliver more targeted, relevant and personalised services(3) Internet of Things(4) As part of commitment to Climate Leaders Coalition
29
For
per
sona
l use
onl
y

FY21 Guidance Key Assumptions(1)New Zealand economy to remain subdued for most of the financial year with parts of New Zealand intermittently at different alert levels
Area Key assumptions
MobilePost-paid service margin
No material roaming revenue planned in FY21Changes in mobile data usage as consumers are less mobile and utilise domestic broadband data
Prepaid service margin Base impacted by no incoming or outbound traveller SIMs and reduced consumer spend.
Mobile HandsetsEconomic conditions reduce discretionary consumer spend but some mitigation as early indicators are better than forecast, and Government demonstrates commitment to the rebuild
BroadbandLower consumer spend due to economic conditions, offset by higher subscriptions due to ongoing flexible working. Customer preference for quality experience likely to remain in the short to medium term, reducing potential churn below normal levels
Voice No material impact for FY21 but do not expect repeat of FY20 calling upside during lockdown
Managed Data Increased competitor activity driving down contract re-sign pricing
Managed Services
Cloud growth Moderation in growth rate due to economic uncertainty
Collaboration Growth through increased demand for flexible working
Other managed services
No material impact, although risk from reduced business spend
Labour Targeted rebalancing of the labour workforce to support new strategic capabilities
Opex (including labour)
Robust programme of targeted cost efficiencies providing flexibility and optionality to respond to the COVID-19 impact which in total is estimated to be ~$75m of EBTIDAI
FY21 DividendFY21 dividend range reflects increased uncertainty as a result of COVID-19 and expected spectrum renewal payments(2) Longer term aspiration for a sustainable dividend fully funded by free cashflow remains
(1) Subject to no adverse change in operating outlook(2) 1800MHz and 2100MHz spectrum renewal payment of $50m due January 2021
30
For
per
sona
l use
onl
y

Guidance(1)
FY20 Actual FY21 Guidance FY21 Spectrum Renewals(2)
EBITDAI $1,113m $1,090m to $1,130m
Capital expenditure $374m ~$350m(3) $50m
Dividend per share
Ordinary 25.0cH1 FY20
(75% imputed)H2 FY20(4)
(100% imputed)
Ordinary 23-25c( 100% imputed)
(1)Subject to no adverse change in operating outlook(2)1800MHz and 2100MHz spectrum renewals(3) Includes purchase of property, plant and equipment, intangible assets and capacity (including Southern Cross) but excludes spectrum purchases and leased customer equipment assets(4) Dividend Reinvestment Plan reinstated for H2 FY20 dividend. Shares issued under the Dividend Reinvestment Plan will be issued at a 2% discount to the prevailing market price as determined around the time of issue 31
For
per
sona
l use
onl
y

Disclaimer
This announcement may include forward-looking statements regarding future events and the future financial performance of Spark New Zealand. Such forward-looking statements are based on the beliefs of and assumptions made by management along with information currently available at the time such statements were made.
These forward-looking statements may be identified by words such as ‘guidance’, ‘anticipate’, ‘believe’, ‘estimate’, ‘expect’, ‘intend’, ‘will’, ‘plan’, ‘may’, ‘could’, ‘ambition’, ‘aspiration’ and similar expressions. Any statements in this announcement that are not historical facts are forward-looking statements. These forward-looking statements are not guarantees or predictions of future performance, and involve known and unknown risks, uncertainties and other factors, many of which are beyond Spark New Zealand’s control, and which maycause actual results to differ materially from those projected in the forward-looking statements contained in this announcement.
Factors that could cause actual results or performance to differ materially from those expressed or implied in the forward-looking statements are discussed herein and also include Spark New Zealand's anticipated growth strategies, Spark New Zealand's future results of operations and financial condition, economic conditions and the regulatory environment in New Zealand, competition in the markets in which Spark New Zealand operates, risks related to the sharing arrangements with Chorus, any impacts or risks to Spark’s anticipated growth strategies, future financial condition and operations, economic conditions or the regulatory environment in New Zealand arising from or otherwise with COVID-19, other factors or trends affecting the telecommunications industry generally and Spark New Zealand’s financial condition in particular and risks detailed in Spark New Zealand's filings with NZX and ASX. Except as required by law or the listing rules of the stock exchanges on which Spark New Zealand is listed, Spark New Zealand undertakes no obligation to update any forward-looking statements whether as a result of new information, future events or otherwise. F
or p
erso
nal u
se o
nly

Appendix 3-year TSR(1) Spark vs International Peers(2)
(1)TSR calculated as share price and dividend per share (reinvested at the ex-dividend date) over Spark's FY18 – FY20 period (1 July 2017 to 30 June 2020)(2)Peer group is not exhaustive but is a selected group of primarily integrated telco operators that are deemed the closest peers to Spark in terms of market exposure
Ranked #1against international peers for Total Shareholder Returns. Compound annual growth rate of 13% and Total Shareholder Returns of 46%
46% 41%
23%
14% 9%
(5%)(13%) (13%)
(19%)(26%)
(29%)(33%)
(53%)Spark Verizon Swisscom BCE Deutsche
TelekomAT&T Orange Telstra KT
CorporationSingTel Vodafone
GroupTelecomMalaysia
BT Group
33
For
per
sona
l use
onl
y

Appendix 3-year ROIC(1) Spark vs International Peers(2)
Spark three-year Return on Invested Capital 16% per annum. Ranked #2 against international peers
(1)ROIC: pre-tax ROIC calculated as the average of annual operating EBIT divided by average invested capital, for the last three reporting years for each peer(2)Peer group is not exhaustive but is a selected group of primarily integrated telco operators that are deemed the closest peers to Spark in terms of market exposure
18%
16%15%
13% 13%11%
10% 10%
8%7% 6% 6%
5%
Veriz
on
Spar
k
BT G
roup BC
E
Telst
ra
Swiss
com
Sing
apor
e Te
leco
m
Deut
sche
Tel
ekom
AT&
T
Ora
nge
KT C
orpo
ratio
n
Voda
fone
Gro
up
Tele
kom
Mal
aysia
34
For
per
sona
l use
onl
y

Spark New Zealand
Group result - reported
H1 FY18 H2 FY18 H1 FY19 H2 FY19 H1 FY20 H2 FY20 FY19 FY20
$m $m $m $m $m $m $m $m $m %
Operating revenues and other gains 1,761 1,772 1,754 1,779 1,824 1,799 3,533 3,623 90 2.5%
Operating expenses (1,305) (1,247) (1,265) (1,178) (1,324) (1,186) (2,443) (2,510) (67) (2.7%)
EBITDAI 456 525 489 601 500 613 1,090 1,113 23 2.1%
Finance income 16 19 18 19 18 18 37 36 (1) (2.7%)
Finance expense (37) (40) (40) (45) (46) (48) (85) (94) (9) (10.6%)
Depreciation and amortisation expense (237) (244) (245) (232) (234) (245) (477) (479) (2) (0.4%)
Net investment income 27 20 - 14 (1) 2 14 1 (13) (92.9%)
Net earnings before income tax 225 280 222 357 237 340 579 577 (2) (0.3%)
Tax expense (63) (77) (69) (101) (70) (80) (170) (150) 20 11.8%
Net earnings for the period 162 203 153 256 167 260 409 427 18 4.4%
Capital expenditure 262 151 264 153 247 127 417 374 (43) (10.3%)
Free cash flows 155 144 108 184 50 388 292 438 146 50.0%
Reported EBITDAI margin 25.9% 29.6% 27.9% 33.8% 27.4% 34.1% 30.9% 30.7% (0.2%)
Reported effective tax rate 28.0% 27.5% 31.1% 28.3% 29.5% 23.5% 29.4% 26.0% (3.4%)
Capital expenditure to operating revenues 14.9% 8.5% 15.1% 8.6% 13.5% 7.1% 11.8% 10.3% (1.5%)
Reported basic and diluted earnings per share (cents) 8.8 11.1 8.3 14.0 9.1 14.1 22.3 23.2 0.9 4.0%
Group result - adjusted
H1 FY18 H2 FY18 H1 FY19 H2 FY19 H1 FY20 H2 FY20 FY19 FY20
$m $m $m $m $m $m $m $m $m %
Operating revenues and other gains 1,761 1,772 1,754 1,779 1,824 1,799 3,533 3,623 90 2.5%
Adjusted operating expenses (1,292) (1,211) (1,265) (1,178) (1,324) (1,186) (2,443) (2,510) (67) (2.7%)
Adjusted EBITDAI 469 561 489 601 500 613 1,090 1,113 23 2.1%
Finance income 16 19 18 19 18 18 37 36 (1) (2.7%)
Finance expense (37) (40) (40) (45) (46) (48) (85) (94) (9) (10.6%)
Depreciation and amortisation expense (237) (244) (245) (232) (234) (245) (477) (479) (2) (0.4%)
Net investment income 27 20 - 14 (1) 2 14 1 (13) (92.9%)
Adjusted net earnings before income tax 238 316 222 357 237 340 579 577 (2) (0.3%)
Adjusted tax expense (67) (87) (69) (101) (70) (80) (170) (150) 20 11.8%
Adjusted net earnings for the period 171 229 153 256 167 260 409 427 18 4.4%
Adjusted EBITDAI margin 26.6% 31.7% 27.9% 33.8% 27.4% 34.1% 30.9% 30.7% (0.2%)
Adjusted effective tax rate 28.2% 27.5% 31.1% 28.3% 29.5% 23.5% 29.4% 26.0% (3.4%)
Adjusted basic and diluted earnings per share (cents) 9.3 12.5 8.3 14.0 9.1 14.1 22.3 23.2 0.9 4.0%
FY19 v FY20
Spark presents adjusted EBITDAI and adjusted net earnings when the year includes significant items greater than $25 million. FY18 included $49 million of
costs of change and adjusted EBITDAI and adjusted net earnings are as follows:
FY19 v FY20
The tax effect on costs of change in H1 FY18 is $4m and in H2 FY18 is $10m.
For
per
sona
l use
onl
y

Spark New Zealand
Gross margin by product
H1 FY18 H2 FY18 H1 FY19 H2 FY19 H1 FY20 H2 FY20 FY19 FY20
$m $m $m $m $m $m $m $m $m %
Mobile 356 376 376 399 405 424 775 829 54 7.0%
Voice 176 163 143 139 124 121 282 245 (37) (13.1%)
Broadband 158 157 168 176 175 166 344 341 (3) (0.9%)
Cloud, security and service management 152 163 163 164 176 177 327 353 26 8.0%
Procurement and partners 17 23 18 25 21 25 43 46 3 7.0%
Managed data, network and services 67 74 66 66 65 64 132 129 (3) (2.3%)
Other product 25 24 25 26 15 33 51 48 (3) (5.9%)
Total product gross margin 951 980 959 995 981 1,010 1,954 1,991 37 1.9%
Other gains - 10 - 15 4 31 15 35 20 NM
Total gross margin 951 990 959 1,010 985 1,041 1,969 2,026 57 2.9%
Connections
H1 FY18 H2 FY18 H1 FY19 H2 FY19 H1 FY20 H2 FY20 FY19 FY20
000's 000's 000's 000's 000's 000's 000's 000's 000's %
Mobile connections 1 2,437 2,458 2,464 2,515 2,500 2,519 2,515 2,519 4 0.2%
Voice connections by type 2
POTS & ISDN 491 400 356 329 288 220 329 220 (109) (33.1%)VoIP 47 52 57 62 66 73 62 73 11 17.7%Voice over wireless 14 14 18 26 26 24 26 24 (2) (7.7%)
552 466 431 417 380 317 417 317 (100) (24.0%)
Broadband connections
Copper 384 346 296 249 211 186 249 186 (63) (25.3%)
Fibre 206 238 273 306 340 367 306 367 61 19.9%
Wireless 104 116 129 140 141 156 140 156 16 11.4%
694 700 698 695 692 709 695 709 14 2.0%
1 Mobile connections excluding MVNO connections but including legacy machine to machine and SIM based SmartWatch connections
Group FTE's
FY19 FY20
H1 FY18 H2 FY18 H1 FY19 H2 FY19 H1 FY20 H2 FY20 000's 000's 000's %
FTE permanent 5,384 5,266 5,107 5,109 5,119 4,983 5,109 4,983 (126) (2.5%)
FTE contractors 230 241 212 167 200 146 167 146 (21) (12.6%)
Total FTE 5,614 5,507 5,319 5,276 5,319 5,129 5,276 5,129 (147) (2.8%)
Dividends
FY19 FY20
H1 FY18 H2 FY18 H1 FY19 H2 FY19 H1 FY20 H2 FY20 $ $ $ %
Ordinary dividends (cents per share) 11.00 11.00 11.00 11.00 12.50 12.50 22.00 25.00 3.00 13.6%
Special dividends (cents per share) 1.50 1.50 1.50 1.50 - - 3.00 - (3.00) (100.0%)
12.50 12.50 12.50 12.50 12.50 12.50 25.00 25.00 - -%
2 Voice connections include all voice technology types, including POTS, ISDN, VoIP and wireless voice. Voice connections exclude connections where
Spark also provide a bundled broadband service, but include all wholesale voice connections (including those where the underlying customer has a
bundled broadband service).
FY19 v FY20
FY19 v FY20
FY19 v FY20
FY19 v FY20
For
per
sona
l use
onl
y

Spark New Zealand
Group operating revenues and other gains
H1 FY18 H2 FY18 H1 FY19 H2 FY19 H1 FY20 H2 FY20 FY19 FY20
$m $m $m $m $m $m $m $m $m %
Operating revenues
Mobile
Service revenue 395 400 403 413 425 423 816 848 32 3.9%
Non-service revenue 218 224 219 236 228 212 455 440 (15) (3.3%)
613 624 622 649 653 635 1,271 1,288 17 1.3%
Voice
Access 136 124 109 105 97 88 214 185 (29) (13.6%)
Calling 98 95 87 83 79 81 170 160 (10) (5.9%)
Other voice revenue 33 32 29 28 23 23 57 46 (11) (19.3%)
267 251 225 216 199 192 441 391 (50) (11.3%)
Broadband 331 334 344 341 345 335 685 680 (5) (0.7%)
Cloud, security and service management 179 191 195 205 219 224 400 443 43 10.8%
Procurement and partners 184 173 191 174 208 200 365 408 43 11.8%
Managed data, network and services 130 132 121 121 121 127 242 248 6 2.5%
Other operating revenue 57 57 56 58 75 55 114 130 16 14.0%
Total operating revenues 1,761 1,762 1,754 1,764 1,820 1,768 3,518 3,588 70 2.0%
Other gains - 10 - 15 4 31 15 35 20 NM
Total operating revenues and other gains 1,761 1,772 1,754 1,779 1,824 1,799 3,533 3,623 90 2.5%
Operating revenues includes revenues from Consumer, Business, Wholesale and other customer segments.
Wireless broadband revenues and connections are included in broadband revenues and connections.
Operating revenues and other gains by customer segment
H1 FY18 H2 FY18 H1 FY19 H2 FY19 H1 FY20 H2 FY20 FY19 FY20
Operating revenues and other gains $m $m $m $m $m $m $m $m $m %
Consumer 786 787 790 815 825 757 1,605 1,582 (23) (1.4%)
Business 866 866 867 857 913 927 1,724 1,840 116 6.7%
Wholesale and other 128 142 118 130 112 141 248 253 5 2.0%
Eliminations (19) (23) (21) (23) (26) (26) (44) (52) (8) (18.2%)
1,761 1,772 1,754 1,779 1,824 1,799 3,533 3,623 90 2.5%
Finance income
H1 FY18 H2 FY18 H1 FY19 H2 FY19 H1 FY20 H2 FY20 FY19 FY20
Finance income $m $m $m $m $m $m $m $m $m %
Finance lease interest income 7 7 7 7 7 6 14 13 (1) (7.1%)
Other interest income 9 12 11 12 11 12 23 23 - -%
16 19 18 19 18 18 37 36 (1) (2.7%)
Net investment income
H1 FY18 H2 FY18 H1 FY19 H2 FY19 H1 FY20 H2 FY20 FY19 FY20
Net investment income $m $m $m $m $m $m $m $m $m %
Dividend income 28 22 - 15 - - 15 - (15) (100.0%)
Share of associates' and joint ventures' net losses (1) (2) - (1) (1) 2 (1) 1 2 NM
27 20 - 14 (1) 2 14 1 (13) (92.9%)
FY19 v FY20
FY19 v FY20
FY19 v FY20
FY19 v FY20
For
per
sona
l use
onl
y

Spark New Zealand
Revenue classification changes
Product name Services provided Previous category New category
Videoconferencing Voice Managed data, network and services
As part of the ongoing revision of the Agile business model, the management of certain product lines have been reallocated from one part of the business
to another. The details of the key changes and the associated impact on revenue reporting are as follows:
Provision of videoconferencing and
other collaboration services over an IT
based platform
For
per
sona
l use
onl
y

Spark New Zealand
Group operating expenses
H1 FY18 H2 FY18 H1 FY19 H2 FY19 H1 FY20 H2 FY20 FY19 FY20
$m $m $m $m $m $m $m $m $m %Product costs
Mobile 257 248 246 250 248 211 496 459 (37) (7.5%)
Voice 91 88 82 77 75 71 159 146 (13) (8.2%)
Broadband 173 177 176 165 170 169 341 339 (2) (0.6%)
Cloud, security and service management 27 28 32 41 43 47 73 90 17 23.3%
Procurement and partners 167 150 173 149 187 175 322 362 40 12.4%
Managed data, network and services 63 58 55 55 56 63 110 119 9 8.2%
Other product costs 32 33 31 32 60 22 63 82 19 30.2%
810 782 795 769 839 758 1,564 1,597 33 2.1%
Labour 276 237 250 225 267 244 475 511 36 7.6%
Other operating expenses
Network support costs 31 31 37 24 35 30 61 65 4 6.6%
Computer costs 41 43 46 47 49 49 93 98 5 5.4%
Accommodation costs 32 29 37 30 33 30 67 63 (4) (6.0%)
Advertising, promotions and communication 51 33 47 40 47 31 87 78 (9) (10.3%)
Bad debts 7 9 6 6 7 10 12 17 5 41.7%
Impairment expense 1 6 5 (2) - 2 3 2 (1) (33.3%)
Costs of change 13 36 - - - - - - - NM
Other 43 41 42 39 47 32 81 79 (2) (2.5%)
219 228 220 184 218 184 404 402 (2) (0.5%)
Total operating expenses 1,305 1,247 1,265 1,178 1,324 1,186 2,443 2,510 67 2.7%
Finance expense
Finance expense on debt 25 28 27 32 31 32 59 63 4 6.8%
Other interest and finance expense - - - - 1 1 - 2 2 NM
Lease interest expense 15 14 15 15 15 16 30 31 1 3.3%
Leased customer equipment interest expense 1 2 2 2 3 3 4 6 2 50.0%
41 44 44 49 50 52 93 102 9 9.7%
Capitalised interest (4) (4) (4) (4) (4) (4) (8) (8) - -%
37 40 40 45 46 48 85 94 9 10.6%
Depreciation and amortisation expense
Depreciation - property, plant and equipment 129 134 128 118 119 114 246 233 (13) (5.3%)
Depreciation - right-of-use assets 24 26 25 31 28 36 56 64 8 14.3%
Depreciation - leased customer equipment assets 8 8 9 9 15 12 18 27 9 50.0%
Amortisation of intangibles 76 76 83 74 72 83 157 155 (2) (1.3%)
237 244 245 232 234 245 477 479 2 0.4%
Adjusted operating expenses
H1 FY18 H2 FY18 H1 FY19 H2 FY19 H1 FY20 H2 FY20 FY19 FY20
$m $m $m $m $m $m $m $m $m %
Total operating expenses 1,305 1,247 1,265 1,178 1,324 1,186 2,443 2,510 67 2.7%
Less: costs of change (13) (36) - - - - - - - NM
Adjusted operating expenses 1,292 1,211 1,265 1,178 1,324 1,186 2,443 2,510 67 2.7%
FY19 v FY20
FY19 v FY20
For
per
sona
l use
onl
y

Spark New Zealand
Analysis & KPI's - Mobile
H1 FY18 H2 FY18 H1 FY19 H2 FY19 H1 FY20 H2 FY20 FY19 FY20
Mobile revenue by type (Consumer and Business) $m $m $m $m $m $m $m $m $m %
Mobile service revenue 388 395 398 409 421 419 807 840 33 4.1%Mobile non-service revenue 1 208 210 206 224 216 197 430 413 (17) (4.0%)
596 605 604 633 637 616 1,237 1,253 16 1.3%
17 19 18 16 16 19 34 35 1 2.9%
Total mobile revenue 613 624 622 649 653 635 1,271 1,288 17 1.3%
Mobile product costs3(257) (248) (246) (250) (248) (211) (496) (459) 37 7.5%
Mobile gross margin 356 376 376 399 405 424 775 829 54 7.0%
Mobile gross margin % 58.1% 60.3% 60.5% 61.5% 62.0% 66.8% 61.0% 64.4% 3.4%
H1 FY18 H2 FY18 H1 FY19 H2 FY19 H1 FY20 H2 FY20 FY19 FY20
Total mobile revenue by customer segment $m $m $m $m $m $m $m $m $m %
Consumer 397 409 410 443 443 419 853 862 9 1.1%
Business 199 196 194 190 194 197 384 391 7 1.8%
Wholesale and other 17 19 18 16 16 19 34 35 1 2.9%
613 624 622 649 653 635 1,271 1,288 17 1.3%
Average revenue per user (ARPU) - 6 month active H1 FY18 H2 FY18 H1 FY19 H2 FY19 H1 FY20 H2 FY20 FY19 FY20
Consumer and Business $ per
month
$ per
month
$ per
month
$ per
month
$ per
month
$ per
month
$ per
month
$ per
month
$ per
month %
Total ARPU 27.58 27.25 27.56 27.57 28.48 28.05 27.57 28.27 0.70 2.5%
Pay-monthly ARPU 44.29 43.31 42.82 42.43 42.82 41.19 42.62 42.00 (0.62) (1.5%)
Prepaid ARPU 12.20 12.13 12.29 12.66 13.28 13.37 12.48 13.33 0.85 6.8%
H1 FY18 H2 FY18 H1 FY19 H2 FY19 H1 FY20 H2 FY20 FY19 FY20
000's 000's 000's 000's 000's 000's 000's 000's 000's %
Pay-monthly connections 1,158 1,189 1,225 1,251 1,287 1,330 1,251 1,330 79 6.3%
Prepaid connections 1,245 1,236 1,206 1,232 1,181 1,161 1,232 1,161 (71) (5.8%)
Internal connections 4 4 4 4 4 4 4 4 - -%
Total mobile connections 2,407 2,429 2,435 2,487 2,472 2,495 2,487 2,495 8 0.3%
1 Mobile non-service revenue includes handset sales and mobile interconnect.2 Includes MVNO revenue.3 Includes handset, interconnect and cellphone tower access costs.4 Excludes MVNO connections but includes SIM based SmartWatch connections
FY19 v FY20
Wholesale and other customer segment mobile
revenue2
FY19 v FY20
FY19 v FY20
Number of mobile connections at period end - 6
month active - Consumer and Business 4
FY19 v FY20
For
per
sona
l use
onl
y

Spark New Zealand
Analysis & KPI's - Voice
H1 FY18 H2 FY18 H1 FY19 H2 FY19 H1 FY20 H2 FY20 FY19 FY20
Revenue by type $m $m $m $m $m $m $m $m $m %
Access 136 124 109 105 97 88 214 185 (29) (13.6%)
Calling 98 95 87 83 79 81 170 160 (10) (5.9%)Other voice revenue 33 32 29 28 23 23 57 46 (11) (19.3%)
Total voice revenue 267 251 225 216 199 192 441 391 (50) (11.3%)
Voice product costs1(91) (88) (82) (77) (75) (71) (159) (146) 13 8.2%
Voice gross margin 176 163 143 139 124 121 282 245 (37) (13.1%)
Voice gross margin % 65.9% 64.9% 63.6% 64.4% 62.3% 63.0% 63.9% 62.7% (1.2%)
H1 FY18 H2 FY18 H1 FY19 H2 FY19 H1 FY20 H2 FY20 FY19 FY20
000's 000's 000's 000's 000's 000's 000's 000's 000's %
POTS and ISDN 491 400 356 329 288 220 329 220 (109) (33.1%)
VoIP 47 52 57 62 66 73 62 73 11 17.7%
Voice over wireless 14 14 18 26 26 24 26 24 (2) (7.7%)
Total voice connections 552 466 431 417 380 317 417 317 (100) (24.0%)
H1 FY18 H2 FY18 H1 FY19 H2 FY19 H1 FY20 H2 FY20 FY19 FY20
000's 000's 000's 000's 000's 000's 000's 000's 000's %
Consumer 118 108 104 103 93 49 103 49 (54) (52.4%)
Business 185 180 177 178 173 169 178 169 (9) (5.1%)
Wholesale and other 249 178 150 136 114 99 136 99 (37) (27.2%)
Total voice connections 552 466 431 417 380 317 417 317 (100) (24.0%)
1 Includes voice access (baseband), interconnect, and international calling costs.
Analysis & KPI's - Broadband
H1 FY18 H2 FY18 H1 FY19 H2 FY19 H1 FY20 H2 FY20 FY19 FY20
$m $m $m $m $m $m $m $m $m %
Total broadband revenue 331 334 344 341 345 335 685 680 (5) (0.7%)
Broadband product costs2(173) (177) (176) (165) (170) (169) (341) (339) 2 0.6%
Broadband gross margin 158 157 168 176 175 166 344 341 (3) (0.9%)
Broadband gross margin % 47.7% 47.0% 48.8% 51.6% 50.7% 49.6% 50.2% 50.1% (0.1%)
H1 FY18 H2 FY18 H1 FY19 H2 FY19 H1 FY20 H2 FY20 FY19 FY20
000's 000's 000's 000's 000's 000's 000's 000's 000's %
Copper 384 346 296 249 211 186 249 186 (63) (25.3%)
Fibre 206 238 273 306 340 367 306 367 61 19.9%
Wireless 104 116 129 140 141 156 140 156 16 11.4%
Total broadband connections 694 700 698 695 692 709 695 709 14 2.0%
H1 FY18 H2 FY18 H1 FY19 H2 FY19 H1 FY20 H2 FY20 FY19 FY20
000's 000's 000's 000's 000's 000's 000's 000's 000's %
Consumer 601 604 598 593 587 595 593 595 2 0.3%
Business 92 95 98 99 100 103 99 103 4 4.0%
Wholesale and other 1 1 2 3 5 11 3 11 8 NM
Total broadband connections 694 700 698 695 692 709 695 709 14 2.0%
2 Includes broadband access (UBA/UCLL/Fibre), modem and e-mail platform support costs.
Broadband connections by technology
FY19 v FY20
Broadband connections by segment
FY19 v FY20
FY19 v FY20
Voice connections by type
FY19 v FY20
Voice connections by customer segment
FY19 v FY20
FY19 v FY20
For
per
sona
l use
onl
y

Spark New Zealand
Analysis & KPI's - Cloud, Security and Service management
H1 FY18 H2 FY18 H1 FY19 H2 FY19 H1 FY20 H2 FY20 FY19 FY20
$m $m $m $m $m $m $m $m $m %
Cloud, Security and Service management revenue 179 191 195 205 219 224 400 443 43 10.8%
Cloud, Security and Service management product costs (27) (28) (32) (41) (43) (47) (73) (90) (17) (23.3%)
Cloud, Security and Service management gross margin 152 163 163 164 176 177 327 353 26 8.0%
Cloud, Security and Service management gross margin % 84.9% 85.3% 83.6% 80.0% 80.4% 79.0% 81.8% 79.7% (2.1%)
Contribution margin (approximated) %136.9% 46.6% 36.9% 42.0% 34.2% 37.9% 39.5% 36.1% (3.4%)
Analysis & KPI's - Procurement and Partners
H1 FY18 H2 FY18 H1 FY19 H2 FY19 H1 FY20 H2 FY20 FY19 FY20
$m $m $m $m $m $m $m $m $m %
Procurement and partners revenue 184 173 191 174 208 200 365 408 43 11.8%
Procurement and partners product costs (167) (150) (173) (149) (187) (175) (322) (362) (40) (12.4%)
Procurement and partners gross margin 17 23 18 25 21 25 43 46 3 7.0%
Procurement and partners gross margin % 9.2% 13.3% 9.4% 14.4% 10.1% 12.5% 11.8% 11.3% (0.5%)
Analysis & KPI's - Managed data, network and services
H1 FY18 H2 FY18 H1 FY19 H2 FY19 H1 FY20 H2 FY20 FY19 FY20
$m $m $m $m $m $m $m $m $m %
Videoconferencing 26 29 25 20 24 28 45 52 7 15.6%
Managed data and networks 104 103 96 101 97 99 197 196 (1) (0.5%)
Managed data, network and services revenue 130 132 121 121 121 127 242 248 6 2.5%
Managed data, network and services product costs2(63) (58) (55) (55) (56) (63) (110) (119) (9) (8.2%)
Managed data, network and services gross margin 67 74 66 66 65 64 132 129 (3) (2.3%)
Managed data, network and services gross margin % 51.5% 56.1% 54.5% 54.5% 53.7% 50.4% 54.5% 52.0% (2.5%)
2 Includes wide area network access, international data, network backhaul and videoconferencing platform costs.
FY19 v FY20
1 Contribution margin is defined as reported gross margin less labour and other costs that are directly attributable to the implementation and ongoing
support of specific contract services.
FY19 v FY20
FY19 v FY20
For
per
sona
l use
onl
y

Spark New Zealand
Statement of cash flows
H1 FY18 H2 FY18 H1 FY19 H2 FY19 H1 FY20 H2 FY20 FY19 FY20
$m $m $m $m $m $m $m $m $m %
Cash flows from operating activities
Cash received from customers 1,768 1,721 1,770 1,654 1,861 1,733 3,424 3,594 170 5.0%
Interest receipts 16 18 18 17 17 17 35 34 (1) (2.9%)
Dividend receipts 7 43 - 15 - - 15 - (15) (100.0%)
Payments to suppliers and employees (1,266) (1,252) (1,314) (1,169) (1,396) (1,101) (2,483) (2,497) (14) (0.6%)
Payments for income tax (70) (97) (44) (91) (82) (58) (135) (140) (5) (3.7%)
Payments for interest on debt (14) (23) (22) (23) (26) (26) (45) (52) (7) (15.6%)
Payments for interest on leases (14) (14) (13) (17) (14) (16) (30) (30) - -%
Payments for interest on leased customer equipment
assets (1) (2) (2) (2) (3) (3) (4) (6) (2) (50.0%)
Net cash flows from operating activities 426 394 393 384 357 546 777 903 126 16.2%
Cash flows from investing activities
Proceeds from sale of property, plant and equipment - 1 - 1 13 - 1 13 12 NM
Proceeds from sale of business - 8 - - - 23 - 23 23 NM
Proceeds from long-term investments - - - 2 - 2 - (2) (100.0%)
Payments for purchase of businesses (46) (5) - - (11) - - (11) (11) NM
Payments for, and advances to, long-term investments (6) (14) (6) - (30) (5) (6) (35) (29) NM
Payments for purchase of property, plant and
equipment and intangibles (236) (178) (258) (157) (273) (120) (415) (393) 22 5.3%
Payments for capitalised interest (4) (4) (3) (5) (4) (4) (8) (8) - -%
Net cash flows from investing activities (292) (192) (267) (159) (305) (106) (426) (411) 15 3.5%
Cash flows from financing activities
Net proceeds from debt 184 (10) 182 (28) 207 (177) 154 30 (124) (80.5%)
Receipts from finance leases 2 3 3 3 2 4 6 6 - -%
Payments for dividends (229) (229) (229) (230) (229) (230) (459) (459) - -%
Payments for leases (18) (19) (19) (17) (19) (23) (36) (42) (6) (16.7%)
Payments for leased customer equipment assets (8) (9) (8) (9) (13) (15) (17) (28) (11) (64.7%)
Net cash flows from financing activities (69) (264) (71) (281) (52) (441) (352) (493) (141) (40.1%)
Net cash flow 65 (62) 55 (56) - (1) (1) (1) - -%
Opening cash position 52 117 55 110 54 54 55 54 (1) (1.8%)
Closing cash position 117 55 110 54 54 53 54 53 (1) (1.9%)
FY19 v FY20
For
per
sona
l use
onl
y

Spark New Zealand
Analysis & KPIs - Free cash flows
H1 FY18 H2 FY18 H1 FY19 H2 FY19 H1 FY20 H2 FY20 FY19 FY20
$m $m $m $m $m $m $m $m $m %
Net cash flows from operating activities 426 394 393 384 357 546 777 903 126 16.2%
Payments for purchase of property, plant and
equipment and intangibles(236) (178) (258) (157) (273) (120) (415) (393) 22 5.3%
Payments for capitalised interest (4) (4) (3) (5) (4) (4) (8) (8) - -%
Payments for leases (18) (19) (19) (17) (19) (23) (36) (42) (6) (16.7%)
Payments for leased customer equipment assets (8) (9) (8) (9) (13) (15) (17) (28) (11) (64.7%)
Receipts from finance leases 2 3 3 3 2 4 6 6 - -%
excluding
Dividend receipts (7) (43) - (15) - - (15) - 15 100.0%
Increase/(decrease) in working capital (45) 52 38 99 31 (48) 137 (17) (154) NM
Underlying free cash flow 110 196 146 283 81 340 429 421 (8) (1.9%)
including
(Increase)/decrease in working capital 45 (52) (38) (99) (31) 48 (137) 17 154 NM
Free cashflow 155 144 108 184 50 388 292 438 146 50.0%
Analysis & KPIs - Movement in working capital
H1 FY18 H2 FY18 H1 FY19 H2 FY19 H1 FY20 H2 FY20 FY19 FY20
$m $m $m $m $m $m $m $m $m %
EBITDAI 456 525 489 601 500 613 1,090 1,113 23 2.1%
excluding
Impairments (1) (6) (5) 2 - (2) (3) (2) 1 33.3%
Other gains - 10 - 15 4 31 15 35 20 NM
EBITDAI excluding impairments and other gains 457 521 494 584 496 584 1,078 1,080 2 0.2%
Net cash flows from operating activities 426 394 393 384 357 546 777 903 126 16.2%
excluding
Interest receipts 16 18 18 17 17 17 35 34 (1) (2.9%)
Dividend receipts 7 43 - 15 - - 15 - (15) (100.0%)
Payments for income tax (70) (97) (44) (91) (82) (58) (135) (140) (5) (3.7%)
Payments for interest on debt (14) (23) (22) (23) (26) (26) (45) (52) (7) (15.6%)
Payments for interest on leases (14) (14) (13) (17) (14) (16) (30) (30) - -%
Payments for interest on leased customer equipment
assets (1) (2) (2) (2) (3) (3) (4) (6) (2) (50.0%)
Net cash flows from operating activities excluding
dividends, tax and net interest502 469 456 485 465 632 941 1,097 156 16.6%
EBITDAI excluding impairments and other gains 457 521 494 584 496 584 1,078 1,080 2 0.2%
less
Net cash flows from operating activities excluding
dividends, tax and net interest 502 469 456 485 465 632 941 1,097 156 16.6%
Increase/(decrease) in working capital (45) 52 38 99 31 (48) 137 (17) (154) NM
Cash conversion 110% 90% 92% 83% 94% 108% 87% 102% 14%
FY19 v FY20
FY19 v FY20
For
per
sona
l use
onl
y

Spark New Zealand
Group capital expenditure
H1 FY18 H2 FY18 H1 FY19 H2 FY19 H1 FY20 H2 FY20 FY19 FY20
$m $m $m $m $m $m $m $m $m %
Cloud 19 20 26 10 16 8 36 24 (12) (33.3%)
Converged Communications Network (CCN) 17 15 20 11 11 7 31 18 (13) (41.9%)
International cable construction and capacity purchases 14 - 11 1 - 11 12 11 (1) (8.3%)
IT systems 64 49 70 62 73 56 132 129 (3) (2.3%)
Mobile network 89 26 89 29 92 24 118 116 (2) (1.7%)
Core sustain and resiliency 38 24 36 27 50 15 63 65 2 3.2%
Other 21 17 12 13 5 6 25 11 (14) (56.0%)
Total capital expenditure 262 151 264 153 247 127 417 374 (43) (10.3%)
Analysis & KPI's - Capital expenditure depreciation and amortisation
H1 FY18 H2 FY18 H1 FY19 H2 FY19 H1 FY20 H2 FY20 FY19 FY20
$m $m $m $m $m $m $m $m $m %
Depreciation - property, plant and equipment 129 134 128 118 119 114 246 233 (13) (5.3%)Depreciation - right-of-use assets1
10 10 9 13 10 11 22 21 (1) (4.5%)
Amortisation of intangibles 76 76 83 74 72 83 157 155 (2) (1.3%)
Total capital expenditure depreciation and amortisation 215 220 220 205 201 208 425 409 (16) (3.8%)
1 Includes depreciation on capacity right-of-use assets only as these are included within Spark’s definition of capital expenditure.
FY19 v FY20
Capital expenditure is presented on an accruals basis, and includes purchase of property, plant and equipment and intangible assets, capacity purchases
(including Southern Cross) but excludes leased customer equipment assets.
On adoption of NZ IFRS 16 Leases , assets associated with capacity arrangements which were previously recognised
within intangible assets have been reclassified to right-of-use assets. Payments for capacity purchases remain within
Spark’s definition of capital expenditure. Total depreciation on property plant and equipment, depreciation on
capacity right-of-use assets and amortisation of intangibles is reconciled below:
FY19 v FY20
For
per
sona
l use
onl
y

Principle 1:
Codes of Conduct
Spark has an integrated Company-wide compliance framework. A Code of Ethics (which applies to all employees) and a Directors’ Code of Ethics, together set out the standards by which Spark people are expected to conduct themselves.
The Codes provide guidance on decision-making and set out to instill a culture of acting lawfully, ethically and responsibly. The Code of Ethics contains links to Spark’s core policies and details Spark’s values, expected behaviours and sets out Spark’s approach to conflicts of interest, bribery and corruption, gifts and hospitality, confidentiality, use of assets and information and compliance with laws. The Codes also set out Spark’s compliance escalation procedures that are designed to be used to report breaches of Spark’s legal obligations, the Codes themselves and other Spark policies, either through the Honesty Box confidential whistle-blowing portal or other avenues.
Online training modules during the induction process for new joiners and as part of Spark’s
continuous education programme, are used to educate all staff about the Code of Ethics and how to apply it. We reinforce this training through regular one-on-one sessions and broader internal communication (emails and intranet articles) across the business. Training on the Directors’ Code of Ethics is coordinated by the Company Secretary.
Copies of the Code of Ethics and the Directors’ Code of Ethics can be found at: www.sparknz.co.nz/about/governance
Trading Policies
The Insider Trading Policy and the Disclosure Policy (together with the associated procedures for implementation) are two of Spark’s core policies that address the treatment of material information and trading in Spark and other issuers’ financial products while in possession of material information.
Copies of the Insider Trading Policy and the Disclosure Policy can be found at: www.sparknz.co.nz/about/governance
Code of Ethical Behaviour
“Directors should set high standards of ethical behaviour, model this behaviour and hold management accountable for these standards being followed throughout the organisation.”
The Board and management of Spark New Zealand Limited (Spark) are committed to maintaining high standards of corporate governance. The Board regularly reviews and assesses Spark’s governance structures and processes to ensure that they are consistent with international best practice, in both form and substance.
Spark is required to report against the NZX Corporate Governance Code (NZX Code) and, as part of its commitment to best practice governance, has elected to take into consideration and substantially complies with the ASX Corporate Governance Council’s Principles and Recommendations (the Fourth Edition).
This statement is a snapshot view of Spark’s practices, processes and policies measured against the principles of the NZX Code. It was approved by the Board on 26 August 2020 and is accurate as at that date.
Annual Corporate Governance Statement 2020
1
For
per
sona
l use
onl
y

Spark New Zealand Annual Corporate Governance Statement 2020
2
Principle 2:
Board Composition and Performance
“To ensure an effective board, there should be a balance of independence, skills, knowledge, experience and perspectives.”
Board
A key factor in Spark’s long-term growth framework is strong governance, with focus areas including proactive risk management policies and having a diverse Board.
A biography of each Board member and the Board skills matrix that outlines the qualifications, capabilities, geographical location, tenure and gender of each member of the Board can be found in the Our Board section of the 2020 Annual Report.
The Board of Directors is elected by shareholders to protect and enhance the value of the assets of Spark in the interests of Spark and its shareholders. The Board has statutory responsibility for the affairs and activities of Spark, which in practice is achieved through delegation to the Chief Executive Officer (CEO) and those who are charged with the day-to-day leadership and management of the Company. The CEO has, in some cases, formally delegated certain authorities to direct reports and has established an empowerment framework that sets out decision rights at Spark.
More information regarding the respective roles and responsibilities of the Board and management is set out in the Board Charter, which can be found at: www.sparknz.co.nz/about/governance
The Board regularly reviews and assesses Spark’s governance structures and processes to ensure that they are consistent with international best practice in both form and substance.
Director Appointment
The procedures for the appointment and removal of directors are governed by Spark’s constitution. Each director has a signed letter of appointment or employment agreement setting out the terms of their appointment, including their duties, terms, conditions of appointment, expectations of the role and remuneration. Spark directors have no fixed term of office but are subject to the retirement provisions contained in the relevant stock exchange listing rules.
Recommendations for nominations of new directors are generally made by the NOMs and considered by the Board as a whole. External consultants are from time to time used to access a wide base of potential candidates and to review the suitability of candidates for appointment.
When recommending a candidate to act as director, the NOMs takes into account such factors as it deems appropriate, including the candidate’s independence, experience, professional skills, qualifications and personal qualities. In doing so Spark will undertake appropriate checks, including as to the candidate’s character, education, criminal record and bankruptcy history. The NOMs will review the candidate’s skills and experience relative to the Board skills matrix to determine whether they will augment the existing Board skillset and assess their availability to commit themselves to the role.
If the Board appoints a new director during the year, that person will stand for election by shareholders at the next annual meeting. Shareholders are provided with relevant information on the candidates standing for election in the notice of meeting.
Diversity and Inclusion
Spark’s talented workforce is a representation of gender, ethnicity, culture and experience. We believe that building greater diversity and inclusion among our people speaks to our role as a major New Zealand company that shows leadership in areas important to society. We also believe it will ultimately deliver enhanced customer experiences and business performance. One of Spark’s major initiatives involved inviting all employees to make the Blue Heart Pledge, which is an individual’s personal commitment to support a ‘heart-led’ approach to diversity and inclusion at Spark.
Spark’s Diversity and Inclusion Policy sets out the requirement for the Board to set and review measurable objectives for achieving diversity each year. The HRCC will annually review and report to the Board on the relative proportion of gender diversity that makes up
For
per
sona
l use
onl
y

Spark New Zealand Annual Corporate Governance Statement 2020
3
Principle 2 continued:
Board Composition and Performance
“To ensure an effective board, there should be a balance of independence, skills, knowledge, experience and perspectives.”
Spark’s workforce and recommend objectives to the Board. A copy of Spark’s Diversity and Inclusion policy can be found at: www.sparknz.co.nz/about/governance
For more details on the importance of Diversity and Inclusion at Spark, and reporting on our workforce demographics, please see the Our People section of the 2020 Annual Report.
Director Training
The Board introduces new directors to management and the business through specifically tailored induction programmes, depending on their needs. All directors are regularly updated on relevant industry and Company issues. This may include visits to Spark operations and briefings from key Leadership Squad members or external experts. There is an ongoing programme of presentations to the Board by management from across Spark. From time to time the Board may also undertake educational trips to receive briefings from companies in relevant industries, locally and abroad. The Board expects all directors to undertake continuous education so that they may appropriately and effectively perform their duties.
Board, Committee and Director Performance
The Board regularly discusses governance and performance and annually reviews its own performance as a whole against the Board Charter and each Committee’s performance against its Charter. The Chair meets with directors to discuss the performance of each director individually.
Further, Board evaluations are undertaken annually to seek director and Leadership Squad feedback on a range of matters relating to Board performance, including its role and composition and engagement with management, shareholders and stakeholders. The collective results of the evaluation are then reported to the Board by the Chair and discussed individually with directors. The last Board evaluation survey was undertaken in
July 2019 with the next Board evaluation under way in August 2020.
Director Independence
Spark’s Board Charter requires that a majority of directors be independent. When assessing independence the Board will consider whether a director is free of material relationships with Spark (other than as a director) and other entities and people who could influence, or could reasonably be perceived to influence, the director’s capacity to exercise independent judgement and act in the best interests of Spark and Spark’s shareholders generally. The mere existence of a relationship with Spark, or a customer or supplier, may not necessarily mean that a director is not independent. Rather, the Board will assess each relationship on a case-by-case basis to determine whether it is material and might compromise the independence of the director. The Board will also consider the tenure of each director when assessing independence and succession planning.
Please see the Board’s statement regarding Director independence at page 106 of the 2020 Annual Report.
Board Positions
The Chair is elected by the Board. The Board supports the separation of the roles of Chair and the CEO. The Chair’s role is to manage and provide leadership to the Board and to facilitate the Board’s interface with the CEO. The current Chair Justine Smyth is a non-executive and independent director as required by the Board Charter. The Board does not have a Deputy Chair.
The Company Secretary is responsible for supporting the effectiveness of the Board by ensuring that its policies and procedures are followed and for coordinating the completion and dispatch of the Board agendas and papers. The Company Secretary is accountable to the Board, via the Chair, on all governance matters, as further described in the Board Charter.
For
per
sona
l use
onl
y

Spark New Zealand Annual Corporate Governance Statement 2020
4
Principle 3:
Board Committees
“The board should use committees where this will enhance its effectiveness in key areas, while still retaining board responsibility.”
Spark’s Board establishes committees to assist in the execution of the Board’s responsibilities. Board committees do not act or make decisions on behalf of the Board unless specifically mandated by prior Board authority to do so.
The current committees of the Board are:
• Audit and Risk Management Committee (ARMC);
• Human Resources and Compensation Committee (HRCC); and,
• Nominations and Corporate Governance Committee (NOMs).
Other committees may be established from time to time to consider matters of special importance or to exercise the delegated authority of the Board.
Each Board Committee has a Charter summarising the role, rights, responsibilities and membership requirements for that Committee. The Board annually reviews the charters of the Board committees and their performance against those charters, with the last review conducted in November 2019. The Board committee charters can be found at: www.sparknz.co.nz/about/governance
The Board is responsible for appointing committee members and Chairs according to the skills, experience and other qualities they bring to the Committee. All Spark committees are comprised of a majority of independent directors. A Committee Chair is entitled to invite persons to attend Committee meetings as deemed necessary. Spark management and employees can only attend Committee meetings at the invitation of the Committee.
Specific Committee memberships and attendance information are outlined on pages 103 & 105 of the 2020 Annual Report.
ARMC
The Board has delegated responsibility to the ARMC for reviewing Spark’s principal risks on an annual basis; ensuring that management has established a risk management framework that includes policies and procedures to effectively identify, treat and monitor principal business risks; assessing the effectiveness of the risk management
system and ensuring it is fit for purpose annually; and monitoring compliance with the risk management framework.
The ARMC is tasked with ensuring the quality, credibility and objectivity of Spark’s accounting processes, including financial reporting. The ARMC will discuss interim financial statements and annual reports with management, including whether the reporting is consistent with the Committee members’ information and knowledge and whether it is adequate for shareholder needs.
The ARMC is comprised solely of non-executive directors, and the Chair of the ARMC is independent and is not the Chair of the Board.
HRCC
The HRCC is responsible for reviewing Spark’s remuneration policy and practices, as well as Spark’s overall human resources strategy, structure, policy and practices. The remuneration of directors is reviewed by the HRCC – taking account of the Company’s size and complexity and the responsibilities, skills, performance and experience of the directors – with recommendations made to the Board for approval.
NOMs
The NOMs role is to identify and recommend to the Board individuals for nomination as members of the Board and its committees (taking into account such factors as it deems appropriate, including experience, qualifications, judgement and the ability to work with other directors); and to develop and review Spark’s corporate governance principles and make recommendations to the Board. The NOMs is also responsible for reviewing Board succession planning.
Takeovers
Spark’s Board has put in place Takeover Response Guidelines that set out the procedure to be followed if there is a takeover offer for Spark, including with regards to communication between insiders and the bidder, the preparation of an independent advisor’s report and establishment of a Bid Response Sub-committee.
For
per
sona
l use
onl
y
Spark New Zealand Annual Corporate Governance Statement 2020
5
Principle 4:
Reporting and Disclosure
“The board should demand integrity in financial and non-financial reporting, and in the timeliness and balance of corporate disclosures.”
Continuous Disclosure
Spark is committed to providing material information regarding Spark’s business and operational performance to shareholders and other stakeholders in compliance with applicable laws and securities exchange requirements. Pursuant to its Disclosure Policy, Spark has an appointed Disclosure Officer to authorise all financial market communications. Together with the Company Secretary the Disclosure Officer is responsible for overseeing Spark’s disclosure practices and ensuring that all material information is lodged promptly and without delay with the relevant securities exchanges and ensuring that the Board receives copies of all material market announcements and is kept informed of the nature and quality of the information being disclosed to the market.
Authorised spokespersons are restricted to reduce the risk of inconsistent communications and to ensure that public comments are within the bounds of information already in the public domain and/or information that is not materially price sensitive.
Reporting
Spark’s financial reports are prepared in a manner that is balanced, clear and objective. The financial statements in the Annual Report are prepared in accordance with NZ GAAP and comply with NZ IFRS.
Spark requires that, prior to the approval of financial statements by the Board, its CEO and Finance Director make a declaration that, in their opinion, the financial records of the entity have been properly maintained and that the financial statements comply with the appropriate accounting standards and give a true and fair view of the financial position and performance of Spark; and that their opinion has been formed on the basis of a sound system of risk management and internal control, which is operating effectively.
In addition to the published financial statements Spark’s Annual Report provides information on Spark’s performance on a number of non-financial matters, including
environmental, social and governance commitments, integrating elements of the Global Reporting Initiative Standards.
The 2020 Annual Report is also Spark’s first report to adopt elements of the Integrated Reporting International <IR> Framework. Integrated reporting takes into consideration the creation of value over the short, medium and long term, thinking holistically about the resources and relationships the organisation uses or affects and the dependencies and trade-offs between them as value is created.
Key Governance Documents
Spark’s website has a dedicated governance section that contains Spark’s policies that outline its core governance structures and processes. This includes the Code of Ethics, Board Charter (and the charters of the various committees), Disclosure Policy, Insider Trading Policy, Diversity and Inclusion Policy and other principal corporate governance documents: www.sparknz.co.nz/about/governance
For
per
sona
l use
onl
y

Spark New Zealand Annual Corporate Governance Statement 2020
6
Principle 5:
Remuneration
“The remuneration of directors and executives should be transparent, fair and reasonable.”
Policies and Practices
The HRCC is responsible for Spark’s remuneration policy and practices and is also ultimately responsible for ensuring Spark meets legislative and regulatory requirements as they relate to remuneration matters.
Spark is committed to ensuring that the remuneration of directors is transparent, fair, and reasonable and subject to shareholder approval if required.
For more details on director and executive remuneration please see the Leadership and Board Remuneration section of the 2020 Annual Report.
Directors
Non-executive director remuneration is determined with consideration of the size and complexity of Spark and relative market activity. From time to time independent consultants are engaged for benchmarking purposes to ensure that the remuneration of Spark’s non-executive directors is appropriate and comparable to that of similar companies in New Zealand and, as relevant, Australia. Non-executive directors are also expected to purchase and hold an amount of Spark shares within the first three years of their appointments.
Jolie Hodson, as an executive director, does not receive any director fees.
Further details on non-executive director remuneration can be found at pages 52 & 103 of the 2020 Annual Report.
Further details on directors’ Spark shareholdings can be found at pages 106 & 110 of the 2020 Annual Report.
Executives
The Leadership Squad’s remuneration consists of a fixed remuneration component and at-risk short-term and long-term incentives. Spark’s STI rewards senior leaders for the achievement of annual performance objectives, with payments awarded from a fixed cash pool that is set based on overall Spark performance against financial and/or non-financial annual performance objectives. Spark believes that senior leaders should
have part of their remuneration linked to the long-term performance of the Company. For the Leadership Squad and a select group of senior leaders, a long-term incentive, which vests after three years contingent on continued employment and Spark achieving a performance hurdle, forms part of their remuneration packages.
Further details on Leadership Squad remuneration can be found at page 50 of the 2020 Annual Report.
CEO
The CEO’s remuneration package reflects the scope and complexity of the role and is set by the Board, with reference to the remuneration of CEOs of similarly sized organisations. For FY21 the CEO’s remuneration package comprises a fixed cash component, an at-risk short-term incentive and an at-risk long-term incentive.
The CEO’s annual cash-based short-term incentive is subject to the achievement of specific performance objectives set by the Board based on Spark’s strategy and business plan for the respective financial year. The CEO’s annual long-term incentive will be granted as options under Spark’s LTI, contingent on continued employment and Spark achieving a performance hurdle. The CEO is also expected to purchase and hold an amount of Spark shares.
Further details on CEO remuneration can be found at pages 51 & 104 of the 2020 Annual Report.
For
per
sona
l use
onl
y

Spark New Zealand Annual Corporate Governance Statement 2020
7
Risk Management
“Directors should have a sound understanding of the material risks faced by the issuer and how to manage them. The board should regularly verify that the issuer has appropriate processes that identify and manage potential and material risks.”
Spark’s Agile organisation design and practices empower its people to make decisions and manage the risks associated with achieving Spark’s strategy and business objectives. Strong corporate governance, including a highly effective and integrated risk management framework, helps Spark people to make good business decisions that create stakeholder value. Spark’s Managing Risk Policy and Framework is benchmarked to the COSO ERM 2017, a leading enterprise risk management standard.
Spark’s Managing Risk Policy and Framework is designed on the principles that managing risk creates, protects and enhances value. It is embedded in decision-making processes and accountability structures so that uncertainty and risks can be managed effectively. It is iterative and responsive to change so that it remains effective when external and internal forces require Spark to adapt its priorities and operating models. A copy of Spark’s Managing Risk Policy can be found at the following link:
www.sparknz.co.nz/about/governance
The ARMC plays an important role and is responsible for ensuring that Management has established a risk management framework. Spark’s Risk Team is accountable for designing and managing this framework and provides the ARMC with regular updates about its performance and evolution.
The ARMC reviews Management’s principal risk profile annually. It also receives reports on the effectiveness of the implementation and operation of the policies and systems designed to manage risk. The ARMC receives quarterly reporting from the Risk, Internal Audit and Fraud Lead that discusses progress against the approved Risk, Internal Audit and Fraud Plan. Information reported includes the priorities, updates about the evolution of the Managing Risk Framework, findings from its internal audit reviews, updates about the status of previously raised items and fraud risk management.
The ARMC conducts an annual assessment to confirm the Managing Risk Framework is designed and operating effectively. The last assessment was undertaken in August 2020 as part of year-end procedures. Every three years Spark also has an external review to ensure it continues to be fit for purpose and is operating effectively.
A summary of Spark’s Managing Risk Framework and Spark’s identified principal business risks and mitigations are outlined in the Our Governance and Risk Management & Our Suppliers sections of the 2020 Annual Report.
Health and Safety
The health and safety of people is of the utmost importance to Spark. A safe and healthy workplace is one in which people and suppliers are accountable and empowered to work together to protect and promote the health, safety and wellbeing of all. To achieve this Spark has established four pillars of health and safety: a clearly defined Health and Safety framework; active hazard and risk management; development of an employee-driven safety culture; and the right resources and processes to deliver on the framework. Integral to the framework is the H&S Information System, which shapes and monitors key performance indicators across the business, focusing on Spark’s strategic objectives, targets and managing critical hazards and risks. The Board and Leadership Squad are both integrally involved in health and safety strategic planning, implementation and monitoring.
Further details regarding Spark’s health and safety performance can be found in the Our People section of the 2020 Annual Report.
Principle 6:
For
per
sona
l use
onl
y

Spark New Zealand Annual Corporate Governance Statement 2020
8
Auditors
“The board should ensure the quality and independence of the external audit process.”
External Audit
Oversight of Spark’s external audit arrangements is the responsibility of the ARMC. The External Auditor Independence Policy and ARMC Charter together establish a framework for Spark’s engagement with the external auditor. The objective of this framework is to ensure that audit independence is maintained, both in fact and appearance, such that Spark‘s external financial reporting is viewed as being highly reliable and credible.
The ARMC is responsible for the appointment of Spark’s external auditor, its terms of engagement and the level of fees incurred. The ARMC Charter outlines the nature of the services permitted to be performed and those not permitted to be performed by the external auditor.
The ARMC Charter requires that the Committee annually assesses and confirm to the Board the independence and objectivity of the external auditor after consideration of the External Auditor Independence Policy criteria. Regular rotation of the external audit firm is not mandated, however, rotation of the key audit partner of Spark is required every five years.
Procedures for communication between the ARMC, the external auditor and Management are set out in the ARMC Charter.
Representatives of Spark’s external auditor are available at Spark’s annual meeting to answer shareholder questions about the conduct of the audit and the content of the external auditor’s reports.
KPMG was appointed as Spark’s external auditor effective 1 July 2002. Given the duration of service, the Board considered it was the appropriate time to rotate external auditor.
Following a formal request for proposal process for external audit services, in March 2020 the Spark Board recommended that Deloitte be appointed as its new external auditor, subject to approval by shareholders at Spark’s Annual Meeting to be held in November 2020.
The Audit and Risk Management Committee Charter and the External Auditor Independence Policy can be found at: www.sparknz.co.nz/about/governance
Internal Audit
The Spark Internal Audit Team’s primary objective is to assist the Board and CEO to exercise good governance by providing independent assurance on Spark’s control and risk management processes. The ARMC approves the appointment and oversees the performance of Spark’s Risk, Internal Audit and Fraud Lead, who is accountable for leading Internal Audit and reports directly to the Chair of the ARMC. The Internal Audit Charter defines the Group’s objectives, scope, independence, responsibilities and authority. Internal Audit is independent from the activities and operations it audits and has unrestricted access to Spark’s records and employees.
Internal Audit regularly performs audits across Spark. It works to an annual Risk, Internal Audit and Fraud Plan that outlines the risk themes and engagements it intends to complete over the plan year. The ARMC approves this plan and ensures that the Internal Audit is appropriately staffed and that its scope of work is appropriate for the key risks facing Spark.
Principle 7:
For
per
sona
l use
onl
y

Spark New Zealand Annual Corporate Governance Statement 2020
9
Principle 8:
Shareholder Rights and Relations
“The board should respect the rights of shareholders and foster constructive relationships with shareholders that encourage them to engage with the issuer.”
Shareholder Communications and Disclosure
Spark is committed to promoting a fair, orderly and transparent market through comprehensive continuous disclosure and ensuring shareholders are able to exercise their rights in an informed manner.
Spark’s Disclosure Policy and associated procedures governs communications with shareholders and other stakeholders. All material information is lodged promptly and without delay with the relevant securities exchanges. Once lodged the information will also be published on Spark’s website, with further dissemination through broadcast emails to news agencies and other market commentators where appropriate. Spark may make available on its website any other relevant information made available to investors/analysts (e.g. roadshows and presentation briefing materials).
Spark is committed to maintaining multiple channels of shareholder communications and engagement, which currently includes:
1. Semi-annual earnings announcements via audio conference;
2. Semi-annual post-results briefings with investors in New Zealand and Australia;
3. Regular ad hoc one-on-one and group investor and analyst meetings;
4. An annual meeting;
5. An annual report and corporate governance statement;
6. Semi-annual shareholder newsletters;
7. Investor briefing days (where appropriate); and
8. Regular investor roadshows.
Spark provides shareholders with the option to receive communications from, and send communications to, Spark electronically.
Spark’s Investor Website
Spark’s website is an important avenue of communication with shareholders and other stakeholders. Spark maintains a dedicated investor website (investors.sparknz.co.nz) which contains market releases, periodic financial information, current and past annual reports, investor presentations and webcasts, dividend and share price histories, notices of meeting, biographies of Spark directors and Leadership Squad, investor contacts, important calendar dates and other information about Spark.
Annual Meetings
All Spark shareholders are encouraged to participate in the annual meeting including virtually via an online annual meeting platform, where shareholders can vote, ask questions and watch the meeting via webcast. Shareholders can also electronically appoint and direct proxies to vote on their behalf at the annual meeting.
The annual meeting webcast will be archived on the Spark investor website after the meeting.
The annual shareholders’ notice of meeting is posted on Spark’s website as soon as possible.
Spark is committed to ensuring that each shareholder who invests in Spark has the right to vote on major decisions that may change the nature of the Company. All of Spark’s shareholders have the right to one vote per share and voting at the annual meeting is conducted by poll.
For
per
sona
l use
onl
y

Spark New Zealand Annual Corporate Governance Statement 2020
10
ARMC Audit and Risk Management Committee
HRCC Human Resources and Compensation Committee
LTI Long-Term Incentive Scheme, which is part of Spark Leadership Squad and CEO remuneration
NOMs Nominations and Corporate Governance Committee
NZ GAAP Generally Accepted Accounting Practice in New Zealand
NZ IFRS New Zealand equivalents to International Financial Reporting Standards
Spark Spark New Zealand Limited
STI Short-Term Incentive Scheme, which is part of Spark Leadership Squad and CEO remuneration
There are terms used in this document that may be unfamiliar these are what each mean:
Glossary
For
per
sona
l use
onl
y

1
Offer DocumentThis is an Offer Document in respect of Shares offered under the Spark New Zealand Dividend Reinvestment Plan.
It is updated as at 25 August 2020.
REINVESTMENT DIVIDEND
PLAN
For
per
sona
l use
onl
y

2
Spark New Zealand operates a Dividend Reinvestment Plan which offers Shareholders the opportunity to directly increase their investment in Spark New Zealand.
This booklet explains how the plan works.
Contents From the Chairman ...................................................... 1
Choices available ......................................................... 2
Key features of the plan ............................................... 4
Guide to completing the Participation Notice ......... 6
Terms and Conditions ................................................. 8
Definitions ..................................................................... 20
This document is important.
If you do not understand it or are in any doubt as to how to act you should consult your financial adviser.
For
per
sona
l use
onl
y

1
From the Chair
Shareholders’ interests are paramount for Spark New Zealand and your company’s primary aim is to increase value for Shareholders. This Dividend Reinvestment Plan gives Shareholders a way to structure their investment in Spark New Zealand according to their own investment needs and goals.
The Plan lets Shareholders conveniently increase their investment in Spark New Zealand without incurring brokerage fees. This booklet explains how the Plan works.
Participation in the Plan is entirely optional. If you wish to conveniently increase your investment in Spark New Zealand, you can enrol in the Plan and Spark New Zealand will reinvest your dividends in additional Shares and pay for them with the net proceeds of your cash dividends. Additional Shares in respect of a cash dividend under the Plan will be issued at the prevailing market price, or (at the Spark New Zealand Board’s discretion), at a small discount to the market price.
For the latest dividend information and to see if a discount currently applies go to: investors.sparknz.co.nz
If dividends are an important income source, you can do nothing and you will continue to receive all future dividends as cash without reinvesting the net proceeds or you can choose to receive a mix of both cash dividends and Shares. Please read this booklet thoroughly and consult your own financial adviser if you have any questions.
Justine Smyth Chair
For
per
sona
l use
onl
y

2
Choice 1 Reinvest your dividends in further Spark New Zealand SharesParticipation Notice
You should complete a Participation Notice online or a Participation Notice Form (in a form provided by Spark New Zealand from time to time) if you wish to reinvest your cash dividends on all or any of your Shares in further Shares.
If you participate, promptly after each dividend payment date you will be sent a statement detailing your dividend entitlement and the number of additional Shares issued to you under the Plan.
The Participation Notice Form should be delivered to the Registrar at the address on page 19.Online Participation Notice can be completed as per below:
New Zealand registered holders
Go to: https://investorcentre.linkmarketservices.co.nz
You will need your CSN/Holder number and FIN to complete the investor validation process.
Australian registered holders
Go to: https://investorcentre.linkmarketservices.com.au
You will need your Holder number and Postcode to complete the investor validation process.
Select the ‘Reinvestment Plans’ from the Payment & Tax Menu to complete your Participation Notice
Level of Participation
You can opt for full or partial participation in the Plan. If you tick the Full Participation box in the Participation Notice, this will cover your current shareholding and any future Shares you acquire or which are allocated to you under the Plan.
If you insert a number in the Partial Participation box of the Notice, this will be treated as partial participation for the number of Shares specified.
If the number you insert in the box exceeds the number of Shares held by you, your application will be deemed to be an application for full participation.
Partial participation in the Plan means that the Terms and Conditions of the Plan will apply, both now and in the
For
per
sona
l use
onl
y

3
future, only to the number of Shares nominated by you now, until you notify the Registrar in writing of a variation.
Variation or termination of Participation
If, at a later date, you decide you wish to vary or terminate your participation in the plan, simply complete the Participation Notice online or provide written notice to the Registrar at the address on page 19.
Choice 2 Receive dividends in cashIf you do nothing, you will continue to automatically receive by direct credit the net proceeds of any dividend on your Shares which do not participate in the Plan. There will be no reinvestment of those proceeds.
Accordingly, unless you wish to apply for or vary your participation in the Plan, you do not need to complete a Participation Notice.
If, at a later date, you decide you do wish to participate, simply complete the Participation Notice in accordance with the instructions under Choice 1.
To update your direct credit bank account:
New Zealand registered holders
Go to: https://investorcentre.linkmarketservices.co.nz
You will need your CSN/Holder number and FIN to complete the investor validation process.
Australian registered holders
Go to: https://investorcentre.linkmarketservices.com.au
You will need your Holder number and Postcode to complete the investor validation process.
Select the ‘Update Payment Instructions’ from the Payment & Tax Menu to update your bank account.
You will still receive a dividend statement by mail or email advising the amount credited. Direct crediting is a more secure and immediate way of receiving your dividend.F
or p
erso
nal u
se o
nly

4
Key Features of the Plan Shares acquired with the net proceeds of cash dividends
The Plan provides Shareholders with an opportunity to reinvest the net proceeds of any cash dividends payable or credited on their Shares, in further Shares. This is a convenient method of increasing your investment by acquiring further Shares free of brokerage charges.
Eligibility
Participation in the Plan is optional and is open to all Shareholders except where Spark New Zealand elects not to offer participation under the Plan to Shareholders whose address is outside New Zealand or Australia if Spark New Zealand considers that to do so would:
(i) risk breaching the laws of places outside New Zealand or Australia; or
(ii) be unreasonable having regard to the associated costs of ensuring that the laws of those places are complied with.
Full or Partial Participation
You may elect to participate in the Plan in respect of all or part of your Shares. Participation in the Plan applies to all future dividends on Participating Shares (unless you vary your level of participation).
Dividend Policy
Details of Spark New Zealand’s dividend policy from time to time will be available from: investors.sparknz.co.nz
For
per
sona
l use
onl
y

5
Shares at or around market price
Under the Plan, additional Shares acquired in respect of a cash dividend will be issued at market price as determined around the time of issue, or (at the Spark New Zealand Board’s discretion) at a small discount to the market price.
Details of your entitlement
If you elect to participate in the Plan and you have Participating Shares, details of your total dividend entitlement and the number of additional Shares issued or transferred to you under the Plan will be sent to you promptly after each dividend payment date. Please contact the Registrar if you need to change your contact details.
Shares rank equally and can be sold
Shares issued under the Plan will rank equally in all respects with existing Shares and can be sold at any time.
Flexible joining and withdrawal arrangements
Shareholders can join, vary their participation or withdraw from the Plan. Notice of joining, variation, or withdrawal from the Plan received by the Registrar after 5pm (New Zealand time) on an Election Date will be effective as at the following Election Date.
For
per
sona
l use
onl
y

6
Guide to Completing the Participation Notice
Full Participation Partial Participation
(including any future Spark New Zealand Shares purchased)
(state number of Spark New Zealand
Shares to participate)
Full ParticipationMeans that the Terms and Conditions of the Plan will apply, both now and in the future, to your total holding of Shares, unless you vary the number of participating Shares by providing notice to the Registrar or you sell your total shareholding.
Partial Participation in the PlanMeans that, if you insert a number in the Partial Participation box in the Participation Notice, this will be treated as partial participation for that number of Shares. This means that the Terms and Conditions of the Plan will apply, both now and in the future, only to the number of your Shares nominated by you on this form, unless you vary the number of participating Shares by providing notice to the Registrar or you sell your total shareholding.
For
per
sona
l use
onl
y

7
Online Participation Notice can be completed as per below:
New Zealand registered holders
Go to: https://investorcentre.linkmarketservices.co.nz
You will need your CSN/Holder number and FIN to complete the investor validation process.
Australian registered holders
Go to: https://investorcentre.linkmarketservices.com.au
You will need your Holder number and Postcode to complete the investor validation process.
Select the ‘Reinvestment Plans’ from the Payment & Tax Menu to complete your Participation Notice.
For
per
sona
l use
onl
y

8
Terms and Conditions 1. Introduction
Spark New Zealand’s Board has approved the establishment of the Spark New Zealand Dividend Reinvestment Plan. The Plan enables Shareholders to reinvest the net proceeds of cash dividends payable or credited on all or some of their Shares by acquiring further fully paid Shares. The terms and conditions of the Plan (the “Terms and Conditions”) as determined by the Board are set out below.
Words defined on pages 20 and 21 of this Offer Document have the same meaning in these Terms and Conditions.
2. Participation in the Plan
(a) Subject to these Terms and Conditions, Spark New Zealand offers to all Shareholders the right to elect to participate in the Plan.
(b) Spark New Zealand may, in its absolute discretion, elect not to offer participation under the Plan to Shareholders whose address is outside New Zealand or Australia if Spark New Zealand considers that to do so would (i) risk breaching the laws of places outside New Zealand or Australia; or (ii) be unreasonable having regard to the associated costs of ensuring that the laws of those places are complied with. The Board may, in its sole discretion, elect to amend the jurisdictions in which participation is offered under the Plan at any time.
(c) Shareholders who apply to participate in the Plan and who reside outside New Zealand or Australia will represent and warrant to Spark New Zealand that the offer of the Plan and their participation in it would not breach any laws in their country of residence.
(d) Any person residing outside New Zealand or Australia who holds Shares through a New Zealand or Australian resident nominee should not allow their nominee to participate in the Plan if participation in respect of their Shares would be
For
per
sona
l use
onl
y

9
contrary to the laws of their country of residence.
(e) Any person residing outside New Zealand or Australia who participates in the Plan through a New Zealand or Australian resident nominee will be deemed to represent and warrant to Spark New Zealand that they can lawfully participate through their nominee.
(f) Spark New Zealand accepts no responsibility for determining whether a Shareholder is able to participate in the Plan under laws applicable outside of New Zealand or Australia.
(g) Additional Shares to be issued to a Shareholder under the Plan will be issued on the terms set out in this Offer Document and subject to the same rights as Shares acquired by all other Shareholders who participate in the Plan.
(h) Normal cash dividend payments will be paid out to those Shareholders not participating in the Plan and on a Participant’s Non-Participating Shares, and will not be reinvested in further Shares.
(i) Every shareholder eligible to participate in the Plan shall be given a reasonable opportunity to do so.
3. Participation Notice
(a) Election to participate in the Plan must be made on the prescribed Participation Notice, in a form provided by Spark New Zealand from time to time, or by electronic means specified by Spark New Zealand from time to time.
(b) If a correctly completed Participation Notice is received by the Registrar before 5pm (New Zealand time) on an Election Date, participation in relation to the net proceeds of cash dividends payable or credited will commence on that Election Date, otherwise participation will commence on the first Election Date after receipt, subject to any termination of the Plan becoming effective before then.
(c) A separate Participation Notice must be given by a Shareholder in respect of each holding of Shares
identified by a separate holder number or CSN.
For
per
sona
l use
onl
y

10
4. Degree of participation
(a) Participation may be either full or partial.
(b) In the case of full participation in the Plan, these Terms and Conditions will apply to the cash dividends payable or credited in respect of all the Participant’s Shares from time to time registered in the Participant’s name, until such number of Shares participating in the Plan is varied or participation in the Plan is terminated in accordance with clause 11 of these Terms and Conditions.
(c) Partial participation applies only to the number of Shares nominated by the Participant in a Participation Notice, as varied from time to time in accordance with clause 11 of these Terms and Conditions. However, if at the relevant Record Date the number of Shares held by the Participant is less than the number of Participating Shares, then the provisions of the Plan will only apply to such lesser number of Shares.
(d) If the Participation Notice does not indicate the degree of participation, it will be deemed to be an application for full participation provided it is otherwise correctly completed and signed.
(e) A Participation Notice will not attach to the Shares in respect of which it has been given but will be personal to the Shareholder giving it.
(f) Any Shares over which Spark New Zealand has a lien or charge under the Constitution or otherwise, for a sum which is presently payable, will not be eligible to participate in the Plan.
5. Operation of the Plan
(a) By accepting this offer, each Participant directs Spark New Zealand to apply the net proceeds of every cash dividend payable or credited on the Participating Shares held by the Participant on the relevant dividend’s Record Date as payment for the Shares to be issued to the Participant, in accordance with the Plan.
Such direction shall continue until the Participant or Spark New Zealand terminates the Participant’s
For
per
sona
l use
onl
y

11
participation in the Plan in accordance with these Terms and Conditions and shall not apply while Spark New Zealand suspends the Plan.
Notice of termination of, or variation in, participation in the Plan must be received prior to 5pm on the relevant Election Date (New Zealand time) to be effective for a particular dividend.
The number of Shares to be issued to the Participant in each case will be determined in accordance with clause 7 of these Terms and Conditions.
(b) The Board will, on the day that a Participant would have otherwise received the net proceeds of cash dividends on Participating Shares, either issue new Shares or arrange the transfer of existing Shares to the Participant in accordance with clause 7 of these Terms and Conditions
(c) Additional Shares issued or transferred to the Participant under the Plan will, from the date of allotment, rank equally in all respects with all other fully paid Shares.
(d) Additional Shares acquired by the Participant under the Plan will be registered on the register where the Participant already holds Shares.
6. Compliance with laws, listing rules and Constitution
(a) The Plan will not operate in relation to a dividend to the extent that the allotment, issue or transfer of additional Shares under the Plan would breach any applicable law, the listing rules of any stock exchange on which Shares are listed, or any provision of the Constitution.
(b) If and to the extent that the Plan does not operate for such reason in respect of a Participant’s Participating Shares, the relevant dividend on Participating Shares will, until such time as the issue is resolved, be paid or distributed in the same manner as in respect of Shares which are not Participating Shares.
For
per
sona
l use
onl
y

12
7. Additional Share entitlement
(a) General: the number of Shares to be issued under the Plan as fully paid to a Participant in a return for a cash dividend will be:
(i) based on the net amount of the dividend the shareholder would have otherwise received;
(ii) and calculated on the basis that the issue price of the Additional Shares will be the market price as determined in accordance with the formula set out below less a discount (if any) at the discretion of the Board.
(b) The number of Shares to be issued under the Plan as fully paid to a Participant in return for a cash dividend will be calculated in accordance with the following formula:
N =
PS x D + BP
Where:
N is the number of additional Shares which the Participant will receive;
PS is the number of Participating Shares;
D is the net proceeds per Share from Spark New Zealand (expressed in cents and decimals of cents, including any supplementary dividends in respect of Participating Shares payable to non-resident Shareholders but excluding any tax credits and after deduction of any withholding or other taxes, if any) of cash dividends paid or credited on that Share and which would otherwise have been paid to a Shareholder in cash if the Shareholder had not elected to participate in the Plan; and
B is the amount, if any, held to the order of the Participant under the Plan in accordance with paragraph 7(f) below as a result of rounding Share entitlements when the Plan last operated;
P is the volume weighted average sale price (expressed in cents and decimals of cents) for a Share, calculated on all price setting trades of Shares which took place through the NZX
For
per
sona
l use
onl
y

13
Main Board over a period of five Business Days commencing on the Ex Date (less a discount (if any) at the discretion of the Board, as contemplated by paragraph 13(a)(i) of these Terms and Conditions).
(c) If no sales of Shares occur during such period then the volume weighted average sale price will be deemed to be the sale price for a Share on the first price setting trade of Shares on the NZX Main Board which takes place after such period.
(d) Any volume weighted average sale price so determined may be reasonably adjusted by the Board to allow for any bonus or dividend or other distribution expectation. If, in the opinion of the Board, any exceptional or unusual circumstances have artificially affected the volume weighted average sale price so determined, the Board may make such adjustments to that sale price as it considers reasonable.
(e) Where the number calculated in accordance with the preceding provisions is not a whole number, then the number of Shares a Participant receives will be rounded down to the nearest whole number of Shares.
(f) Any net proceeds per Share as described in the definition of “D” in clause 7(b) above which are not applied to acquire a part of a Share because of clause 7(e) above shall be held to the order of the Participant and applied under the Plan on the Participant’s behalf the next time the Plan operates.
Should the Participant:
(i) terminate his or her participation in the Plan, under clause 11(a)(ii) of these Terms and Conditions; or
(ii) cease to be a Shareholder of Spark New Zealand,any amount, which at the time is held to the order of the Participant under this clause 7(f), shall be forfeited.
8. Statements to Participants
Spark New Zealand will send to each Participant, promptly after each dividend payment date, a statement detailing in respect of that Participant:
For
per
sona
l use
onl
y

14
(a) the number of Participating Shares as at the relevant Record Date;
(b) the amount of cash dividend reinvested in respect of Participating Shares and the amount of dividend paid in cash on the Non-Participating Shares (if applicable);
(c) the amount of any taxation deduction made;
(d) the number of Shares the Participant has received under the Plan and the per unit issue price;
(e) advice as to the amount of any taxation credits;
(f) advice as to the amount held to the order of the Participant under the Plan under clause 7(f); and
(g) such other matters required by law with respect to dividends and/or reinvestment.
Participants should contact the Registrar if they need to change their contact details.
9. No brokerage or commission costs to Participants
No brokerage or commission costs will be payable by Participants in respect of the Shares they receive under the Plan.
10. Source of additional Shares
Additional Shares to be acquired by Participants under the Plan may, at the Board’s discretion, be:
(a) new Shares issued by Spark New Zealand; or
(b) existing Shares acquired by Spark New Zealand or its nominee or agent and transferred to Participants; or
(c) any combination of (a) and (b) above.
11. Variation or termination of participation
(a) A Participant may, at any time, by giving notice to the Registrar:
(i) increase or decrease the number of Participating Shares participating in the Plan; or
For
per
sona
l use
onl
y

15
(ii) terminate participation in the Plan.
(b) Such alteration or termination will take effect immediately upon receipt by the Registrar of the notice, provided that any notice received after 5pm (New Zealand time) on an Election Date will take effect on the day following such dividend payment date.
(c) If a Participant dies, receipt by the Registrar of a notice of death in a form acceptable to Spark New Zealand will be treated as notice under clause 11(a)(ii) of these Terms and Conditions. Death of one of two or more joint holders will not automatically terminate participation.
12. Reduction or termination of participation where no notice given
(a) Where a Participant with partial participation disposes of part of his or her holding of Shares then, unless the Participant advises the Registrar otherwise:
(i) the Shares disposed of will be deemed to be the Participant’s Non-Participating Shares; except
(ii) if the number of Shares disposed of is more than the number of the Participant’s Non-Participating Shares, the balance will be attributed to Participating Shares.
(b) If a Participant with full participation disposes of part of their holding of Shares without giving the Registrar written notice terminating their participation in the Plan, the Participant will be deemed to have terminated their participation in the Plan with respect to the Shares disposed of by them from the date that Spark New Zealand registers a transfer of those Shares.
(c) If a Participant disposes of all of their holding of Shares and ceases to be a Shareholder without giving the Registrar written notice terminating their participation in the Plan, the Participant will deemed to have terminated participation in the Plan from the date that Spark New Zealand registers a transfer of those Shares.
For
per
sona
l use
onl
y

16
13. The Board’s discretion on termination, suspension and modification
(a) In addition to any other clauses in these Terms and Conditions granting the Board discretion, the Board may also in its sole discretion resolve:
(i) that the price at which additional Shares are to be issued under the Plan shall contain a discount to market price;
(ii) that participation in the Plan will not apply to the whole or a part of the net proceeds of any cash dividend and that the applicable part will be paid out in cash and not be reinvested;
(iii) that a Participation Notice will cease to be of any effect;
(iv) that the terms and conditions of the Plan be modified, suspended or terminated;
(v) in the event of the subdivision, consolidation or reclassification of Shares into one or more new classes of Shares, that a Participation Notice will be deemed to be a Participation Notice in respect of the Shares as subdivided, consolidated or reclassified unless such Participation Notice is subsequently changed or withdrawn by the Participants; and
(vi) that the Plan may be underwritten on such terms as agreed between Spark New Zealand and an underwriter.
(b) If the Plan is modified under clause 13(a)(iv) then a Participation Notice will be deemed to be a Participation Notice under the Plan as modified unless such Participation Notice is subsequently changed or withdrawn by the Participant.
(c) Notice of any modification, suspension or termination by Spark New Zealand under clause 13(a) (iv) will be given to all Participants.
(d) However, no such modification or termination by Spark New Zealand under clause 13(a)(iv) will be made during the period commencing on a date
For
per
sona
l use
onl
y
17
21 days before a Record Date for the purposes of determining entitlement to a dividend and ending on the date of payment of that dividend.
(e) Notwithstanding clauses 13(c) and (d), Spark New Zealand may at any time, without the need of any notice:
(i) modify or terminate the Plan to comply with any applicable law, the listing rules of any stock exchange on which Shares are listed, or any provision of the Constitution; and
(ii) make minor amendments to the Plan where such amendments are of an administrative or procedural nature.
14. Stock Exchange Listing
Spark New Zealand will apply for Shares which may be issued under the Plan to be quoted on the NZX Main Board and the Australian Securities Exchange promptly after they have been issued. NZX and ASX accept no responsibility for any statement in this Offer Document.
15. No inside information
At the time the price for the Shares is set under clause 7 of these Terms and Conditions, Spark New Zealand will ensure that it has no information that is not publicly available that would, or would be likely to, have a material adverse effect on the realisable price of the Shares if the information were publicly available.
16. Taxation
The taxation consequences for each Shareholder should they elect to participate in the Plan will differ depending upon their particular circumstances. Accordingly, each Shareholder should consult their own tax adviser as to the taxation implications of the Plan. Spark New Zealand does not accept any responsibility for the financial or taxation effects of a Shareholder’s participation or non-participation in the Plan.
For
per
sona
l use
onl
y

18
17. Information for Australian Shareholders
(a) The offer of Shares under the Plan does not require disclosure for the purposes of section 708 of the Corporations Act 2001 (Cth). Accordingly, this Offer Document will not be lodged with the Australian Securities and Investments Commission.
(b) Australian resident Shareholders should note that Spark New Zealand is not licensed to provide financial product advice in relation to the Shares offered under the Plan. There is no cooling-off regime that applies in respect of the issue of Shares under the Plan. This Offer Document does not take into account your personal objectives, financial situation or needs. You should consider obtaining your own financial product advice in relation to the proposed offer from an independent person who is licensed by Australian Securities and Investments Commission to give such advice.
18. Governing Law
The Plan and its operation and these Terms and Conditions will be governed by the laws of New Zealand.
19. Available information
Copies of Spark New Zealand’s most recent Annual Report, financial statements and auditor’s report are available online at: investors. sparknz.co.nz.
A hard copy is also available free of charge on request from:
Spark New Zealand Limited Spark City 167 Victoria Street West, Auckland 1142, New Zealand
FAX: 09 303 3430EMAIL: [email protected]: investors.sparknz.co.nz
For
per
sona
l use
onl
y

19
20. Registrar’s address
The contact details of the Registrar are as follows:
Registrar in New Zealand
Link Market Services Limited, PO Box 91976, Auckland 1142 Level 11, Deloitte Centre, 80 Queen Street, Auckland 1010, New Zealand
PHONE: 09 375 5998FAX: 09 375 5990EMAIL: [email protected] CALL FREE: 0800 737 100WEBSITE: www.linkmarketservices.co.nz
Registrar in Australia
Link Market Services Limited,Locked Bag A14, Sydney South NSW 1235Level 12, 680 George Street, Sydney NSW 2000
PHONE: +61 2 8280 7100FAX: +61 2 9287 0303EMAIL: [email protected] CALL FREE: 1300 554 474WEBSITE: www.linkmarketservices.com.au
For
per
sona
l use
onl
y

20
Definitions The following words have these meanings in this Offer Document:
ASX: ASX Limited.
Australian Securities Exchange: The equity security market operated by ASX.
Board: Spark New Zealand’s Board of Directors.
Business Day: A day on which the NZX Main Board and the Australian Securities Exchange are open for trading.
Constitution: Spark New Zealand’s constitution.
Election Date: The first Business Day following a Record Date, or such later date as may be set by the Board and advised to NZX and ASX.
Ex Date: The first Business Day before the relevant Record Date, unless NZX determines otherwise.
issue: In the case of existing Shares, includes transfer where the context requires.
Non-Participating Share: A Share registered in the name of a Participant, the dividends on which are not subject to the Plan, and in respect of a particular Election Date, the Non- Participating Shares that are not participating in the Plan on that date.
NZX: NZX Limited.
NZX Main Board: The main board equity security market operated by NZX.
Participant: Any eligible holder of Shares who has completed (and has not withdrawn) a Participation Notice which has been accepted by the Board.
Participating Share: A Share registered in the name of a Participant, the net proceeds of cash dividends on which are subject to the Plan, and in respect of a particular Election Date, the Participating Shares participating in the Plan on that date.
Participation Notice: The Participation Notice for the Plan as approved by Spark New Zealand.
Plan: The Spark New Zealand Dividend Reinvestment Plan established by the Board pursuant to the Constitution on the terms and conditions set out in this Offer Document, as amended from time to time.
For
per
sona
l use
onl
y

21
Record Date: The date and time fixed by the Board for determining entitlement to the relevant dividend.
Registrar: Link Market Services Limited.
Shares: Ordinary Shares in Spark New Zealand. Shareholders: Holders of Shares.
Spark New Zealand: Spark New Zealand Limited.
For
per
sona
l use
onl
y

22
investors.sparknz.co.nzARBN 050 611 277
SPA
5755
For
per
sona
l use
onl
y

Dividend Reinvestment Plan
Do not complete this form if you wish to continue to receive in cash all dividends declared.
Participation Notice to reinvest your dividend. A Dividend Reinvestment Plan operates for your Spark New Zealand Shares.
If you wish to reinvest all or part of the net proceeds of your cash dividends, simply complete this form, and return it in the post-paid envelope provided.
If you already participate in the Plan and wish to vary your participation, then you will need to complete and return this form.
(including any future Spark New Zealand Shares purchased)
(state number of Spark New Zealand
Shares to participate
I/We acknowledge receipt of a copy of the Offer Document.
I/We agree to be bound by the Terms and Conditions of the Dividend Reinvestment Plan set out in the Offer Document dated 25 August 2020.
I/We hereby direct that the net proceeds of all cash dividends I am/we are entitled to be paid or credited in respect of my/our Participating Shares be applied toward the purchase of additional Spark New Zealand Shares in accordance with the Plan.
I/We warrant that if at any time I/we reside outside New Zealand or Australia and accept or continue to participate in the Plan, the offer of the Plan and my/our participation in it does not breach any laws in my/our country of residence.
Name(s)
Shareholder number
Address
Signature of Shareholder(s)
Date Daytime phone number
This notice may be returned at any time to the Share Registrar. This Participation Notice must be received prior to 5pm on the relevant Election Date (New Zealand time) to be effective for a particular dividend.
Link Market Services Limited, PO Box 91976, Auckland 1142, New Zealand
Link Market Services Limited, Locked Bag A14, Sydney South NSW 1235, Australia
For
per
sona
l use
onl
y


