Embed Size (px)
Citation preview

Spatial and temporal variability in thelarval fish assemblage of a warm temperateSouth African estuary, with notes on the
effects of artificial channellingM. Kruger1 & N.A. Strydom2*
1
Department of Ichthyology and Fisheries Science, Rhodes University, P.O. Box 95, Grahamstown, 6140 South Africa
2
South African Institute for Aquatic Biodiversity, Private Bag 1015, Grahamstown, 6140 South Africa
Received 11 February 2010. Accepted 6 May 2010
The composition, abundance, distribution and seasonality of larval fishes was investigated inthe permanently open Kowie Estuary on the temperate southeast coast of South Africa. Larvalfishes were sampled within the estuary and marina for a period of two years. Samples werecollected seasonally at 14 different sampling stations along the main channel and within theartificially-channelled marina by means of boat-based plankton tows. A total of 11 128 larvalfishes were collected, representing 23 families and 38 taxa. Clupeidae and Gobiidae were thedominant fish families, contributing 47.0% and 24.7%, respectively, to the total catch.Common species included Gilchristella aestuaria (Clupeidae), Omobranchus woodii(Blennidae), an unidentified blenniid, Caffrogobius gilchristi, Caffrogobius nudiceps,Glossogobius callidus, Psammogobius knysnaensis (Gobiidae) and Solea turbynei (Soleidae)with the other species contributing <1% to the total catch. Catches varied significantly withseason and were highest in summer. Estuary-resident species dominated the overall catch(91%). A notable absence of postflexion larvae and early juveniles characterized the artificialchannels. This was attributed to the absence of shallow, marginal water habitat, typical of agood estuarine nursery area. The steep walls of the artificial channels reduce refuge areas, in-creasing predation by larger piscivores.
Key words: marina, nursery, recruitment, developmental stage, artificial channels.
INTRODUCTIONNursery areas, such as estuaries and coastal bays,are important for survival during the larval andearly juvenile phase of many estuarine andmarine fish species worldwide (Neira & Potter1994; Whitfield 1998; Strydom et al. 2003;Perez-Ruzafa et al. 2004; Ramos et al. 2006). Thedynamics of this use of estuaries by early develop-mental stage fishes, as well as the mechanisms ofrecruitment and maintenance within these areas,have been the focus of research around the worldfor decades (Neira & Potter 1994; Barletta-Berganet al. 2002; Perez-Ruzafa et al. 2004; Ramos et al.2006; Aceves-Medina et al. 2008).
In South Africa, larval fish assemblages havebeen the focus of numerous studies (Melville-Smith & Baird 1980; Whitfield 1989; Harris& Cyrus 2000; Strydom et al. 2003; Pattrick et al.2007; Montoya-Maya & Strydom 2009). Thesestudies have contributed towards understanding
aspects such as tidal exchange (Beckley 1985;Whitfield 1989; Strydom & Wooldridge 2005),effects of altered freshwater input on speciesoccurrence and success in estuaries (Strydom et al.2002) and habitat use and preference (Whitfield1994; Strydom 2003) in estuarine nurseries. Despitethese efforts, many estuaries and their associatedanthropogenic impacts remain poorly understood.
Occurrence of larval fishes in estuaries is depend-ent on many factors. Larval fishes are eitherspawned within the estuary or recruit into theestuary from the surrounding marine environment(Barletta-Bergan et al. 2002). Estuarine triggers playan important part in assisting the larvae in locatingspecific nursery areas and occupying suitablehabitats within the nursery (Boehlert & Mundy1988; Whitfield & Marais 1999). Of these, salinitygradients, temperature, turbidity, catchmentodours, food and habitat availability have beenidentified, depending on the species (Boehlert &Mundy 1988; Whitfield & Marais 1999; Strydomet al. 2003; Montoya-Maya & Strydom 2009). Oncein the estuary, the recruiting larvae of estuary-
African Zoology 45(2): 195–212 (October 2010)
*Author for correspondence. Present address: Zoology Department,Nelson Mandela Metropolitan University, P.O. Box 77000, PortElizabeth, 6031 South Africa. E-mail: [email protected]

dependent fishes will move to the bottom or estuarymargins to avoid predation and displacement bystrong tidal currents (Beckley 1985; Whitfield1989; Strydom 2003).
Estuarine nursery areas along the South Africancoast are critical to the survival of many endemicfish species, some of which have recreational andcommercial fishing value. Most South Africanestuaries are situated adjacent to urban areas andare subjected to the direct and indirect anthro-pogenic manipulation. The Kowie Estuary is sucha system, situated in the town of Port Alfred.
The larval fish assemblage within the KowieEstuary and the impacts of the artificially channelledmarina are poorly studied. The effects of artificialchannelling on juvenile fish nurseries has receivedlimited attention (Young & Potter 2003a,b), regard-less of the numerous marina developments occur-ring around the world. The Kowie Estuary waspreviously a large estuary with extensive wetlandand mudflat areas in the lower reaches (Heydorn& Grindley 1982). The development of the marinahas removed the wetland area, with the lowerreaches now characterized by steep, packed stonewalls and deep channels.
The objective of this study was to assess thedynamics of the larval fish assemblage in theKowie Estuary and marina. Specific aims of thestudy were to determine the composition, abun-dance, distribution and seasonality of larval fishesin the Kowie Estuary and to assess whether themarina has an effect on the larval fish assemblagein the lower reaches of the estuary compared tosimilar, unaltered estuaries in the region. It ishypothesized that the larval fish abundance anddiversity will follow similar spatial and temporaltrends as have been found in other warm temper-ate systems. However, the steep-walled marinachannels may alter the composition and abun-dance of larvae compared with the rest of thisestuarine system and unaltered neighbouringsystems.
MATERIALS & METHODS
Study areaLarval fishes were collected from the perma-
nently open Kowie Estuary (33°36’11’S, 26°54’10’E)situated in Port Alfred on the southeast coast ofSouth Africa (Fig. 1). The climate in this region isclassified as warm temperate, with mean monthlyrainfall being highest during summer (Whitfield2000). The river is approximately 70 km long, with
an average depth of 2.75 m. The summer watertemperatures range from 21°C to 29°C and wintertemperatures range from 11 to 16 °C (Hill &Allanson 1971).
The lower reaches of the Kowie Estuary areheavily impacted by anthropogenic activities(Whitfield 2000). The mouth is characterized by anartificially-walled entrance, which branches offthe main channel into three smaller, artificialchannels making up the marina. The artificialsides in the estuary entrance, lower reaches andmarina channels are characterized by steep,stone-packed walls sloping at a 60° angle into thesandy-bottomed estuary bed.
Fourteen stations were occupied along thelength of the estuary (Fig. 1). These were coded aslower estuary sites (1A, B, 2C), characterized byartificial walls in the mouth region but also featur-ing some intertidal mud flats and sandbanks;marina channel sites (D, E, F), characterized byartificial walls, with a general absence of intertidalareas; and the remaining sites occurred along themiddle and upper reaches of the estuary to thelimits of the tidal ebb and flow (3–10) and thesewere characterized by natural, marginal areaswith large intertidal areas.
Plankton sampling took place over two years inJanuary (summer), April (autumn), July (winter)and September (spring) along the entire length ofthe Kowie Estuary and marina. All sampling wasconducted after dark on the new moon phase.Plankton tows were conducted in the subsurfacewaters (upper 80 cm of water column) at the14 sampling stations using two modified WP2plankton nets (570 mm mouth diameter and 0.2 mmmesh aperture), which were lowered simulta-neously from a single hulled boat (Strydom et al.2002; Pattrick et al. 2007). Each net was fitted with aKahlsico 005 WA 130 flowmeter. Each tow wasconducted for three minutes at each samplingstation at a towing speed of 1–2 knots (Strydomet al. 2002).
The plankton nets were emptied after each towand samples were preserved in a 10% bufferedformalin solution in the field. Temperature, turbid-ity and salinity were measured at all 14 samplingstations using a YSI water quality meter. Watertransparency was also obtained at every samplingstation using a Secchi disc, for comparison withprevious studies in other estuaries (Strydom et al.2003; Strydom & Neira 2006; Pattrick et al. 2007). Alldepth recordings measured using the Secchi discwere converted to an extinction coefficient (k)
196 African Zoology Vol. 45, No. 2, October 2010

following the method described by Dawes (1981):k = 1.7/D (Secchi depth in cm).
In the laboratory, larval fish were removed fromthe plankton mass, identified, counted andmeasured. All larvae were identified to the lowestpossible taxon using Smith & Heemstra (1986),Neira et al. (1998) and Leis & Carson-Ewart (2000).Larvae were measured to the nearest 0.01 mmusing a stereo microscope fitted with an eye piecemicrometer. For larger specimens (>10 mm)Vernier callipers were used to measure bodylength (BL). BL was defined as notochord lengthin preflexion and flexion stage larvae and standardlength in postflexion larvae and juveniles(Strydom 2003). All larvae that were positivelyidentified were grouped into various estuary-dependence categories (Whitfield 1998). Theseestuary-dependence categories were divided intofive broad categories, which include estuary-resident species, estuary-dependent marinespecies, marine stragglers, freshwater species andcatadromous species. Resident species are speciesthat either breed in estuaries only (category Ia) orspecies that are resident in estuaries but can alsobreed at sea. Euryhaline marine species are split
into three categories. These are euryhaline marinespecies which usually breed at sea but juvenilesare dependent on estuaries for nursery grounds(category IIa). Euryhaline marine species thatusually breed at sea and the juveniles occur in boththe sea and estuary (category IIb). The last groupof euryhaline marine species include species thatbreed at sea, with the juveniles occurring in estu-aries but typically more abundant at sea (categoryIIc). Category III species are fish which are notdependent on estuaries and may occur in estuariesaccidentally or opportunistically. Freshwatermigrants occur typically in the upper reaches, or inareas with low salinities (IV) and lastly catadromousspecies (V) are species that migrate down theestuary to breed in the sea.
Data treatment and analysisLarval fish densities were calculated using a
predetermined calibration value for each flow-meter used, following the formula:
D = (N/V) × 100 m3
where D is the larval fish density; N is the numberof larvae caught in specific tow and V is the
Kruger & Strydom: Larval fish assemblage of a warm temperate South African estuary 197
Fig. 1. Geographical position of the Kowie Estuary, South Africa, indicating location of sampling sites in the study.

volume of water filtered by the WP2 plankton netsin the specific tow. The estuary was split into thevarious salinity zones using the environmentaldata collected in the field following the adaptedVenice system (Strydom et al. 2003).
Physico-chemical and biological data weretested for normality and homogeneity of variance,using a normal probability plot and Levene’s test.All environmental data were nonparametric innature. Larval fish densities were assessed fordifferences between sites, seasons, salinity zonesand years using nonparametric Kruskal-Wallistest. Multiple linear stepwise regressions for para-metric data were used to determine whether anyenvironmental variables had any significantrelationship with larval fish density. A reducedsignificance level of P < 0.01 was used for thisanalysis.
Margalef ’s species richness and Shannon-Wiener diversity indices were determined usingthe DIVERSE application in the PRIMER v. 5.2.9statistical software package (Clarke & Warwick1994). Community analysis was conducted usingPRIMER. Density data were log10 (x + 1) trans-formed due to the high prevalence of zero values.Estuary-resident species (category I) and marine-spawned, estuary-dependent and catadromousspecies (categories II, III, V) were separated andtwo Bray-Curtis similarity matrices were gener-ated for these data. Two clusters in the form ofnon-metric multidimensional scaling (MDS) plotsfor estuary-residents and marine-spawned specieswere generated. ANOSIM and SIMPER were usedto determine the differences and similarities be-tween groups and species comprising thesegroups. A significance level of P < 0.05 was usedfor all analyses unless specified otherwise.
RESULTS
Environmental variability
The physical characteristics of the water columnin the Kowie Estuary varied seasonally. Salinityranged from 25 to 35 in summer, 12.4 to 35 inspring, 16.9 to 35.3 in autumn and 21.2 to 34.7 inwinter. No significant difference was found inaverage salinity between season (H = 4.7, P = 0.19)(Fig. 2a). Water clarity also varied with season anda significant difference in water transparency (k)between spring and summer, spring and winterand summer and autumn was revealed (P << 0.001)(Fig. 2b). However, water temperatures variedwith season. Summer water temperatures in the
Kowie Estuary ranged from 21.7 to 27.6°C, springwater temperatures from 18.0 to 23.2°C, autumntemperatures from 18.2 to 20.9°C and winter watertemperatures from 15.0 to 16.3°C. A significantdifference in average water temperature wasfound among all seasons (H = 168.5, P < 0.01)(Fig. 2c).
Temperature showed a significant relationshipwith larval fish density for the assemblage as awhole in the Kowie Estuary (P < 0.01). However,the relationship with salinity and water clarity wasnot significant at this analysis level. Temperatureand salinity were only found to show a significantrelationship with density of Gilchristella aestuaria(Clupeidae), and gobiids Caffrogobius nudiceps andCaffrogobius gilchristi (P < 0.01). Furthermore, themultiple linear regression analyses showed thattemperature, salinity and water transparency alsoshowed some relationship with Solea turbynei(Soleidae) density (P < 0.01) in the estuary. Tem-perature also had a positive relationship withOmobranchus woodii (Blenniidae) densities andsalinity had a significant relationship withPsammogobius knysnaensis (Blenniidae) densities(P < 0.01) (Table 1).
General species composition and estuary
association
A total of 11 125 larval and early juvenile fisheswas caught in this study, representing 23 fish fami-lies and 38 different species. A small number offamilies dominated the catch in the Kowie Estuary.Gobiidae dominated the overall catch in both themarina (87 ± 8.7%) and mouth (76 ± 14.07%) andcontributed 19% (±24.98) to the middle and upperreaches. Blenniidae contributed 9% (±7.31) towardthe marina catches, 3% (±4.47) to the middleand upper reaches and mouth (17 ± 10.42%).Clupeidae contributed 72% (±29.43) toward themiddle and upper reaches catches. The familySoleidae made the next significant family contri-bution in the estuary sites (8 ± 2.48%), but madean insignificant contribution in the marina. Otherfamilies which made significant contributions toboth regions of the Kowie include Syngnathidae,Clupeidae and Gobiesocidae (Fig. 3).
Gilchristella aestuaria (Clupeidae) contributed47% to the total catch, with Caffrogobius gilchristi(Gobiidae) contributing 24.7%. Other Gobiidaespecies, namely Caffrogobius nudiceps andPsammogobius knysnaensis contributed 10% and3.92%, respectively. The marine-spawned species,Solea turbynei, contributed 2.7% to the total catch
198 African Zoology Vol. 45, No. 2, October 2010

Kruger & Strydom: Larval fish assemblage of a warm temperate South African estuary 199
Fig. 2.a, Mean salinity, b, mean water transparency (k) and c, mean water temperature (°C) for all seasons, at all sitesin the Kowie Estuary recorded between 2004 and 2005. Error bars indicate 95% confidence intervals; 1A, B, 2C =mouth region of estuary; D, E, F = marina channels; 3–10 = middle and upper reaches).

and was primarily found in the upper reaches ofthe estuary (Table 2).
The catch was dominated by estuary-residentspecies (category I), contributing a total of 91% ofthe total catch. Marine-dependent species (cate-gory II) followed, contributing 4% of the totalcatch and marine stragglers (category III) contrib-uted 1% ofthe total catch over the study period.
Spatial and temporal trends in species
composition and estuary association
Species contribution at each site in the KowieEstuary indicated that there is high dominance ofone species within the estuary and a clear switchof this dominance from the lower sites to themiddle and upper reaches. Caffrogobius gilchristi
(category Ib) dominated the lower reaches of theestuary whilst Gilchristella aestuaria (category Ia)dominated in the upper reaches (Fig. 4). Speciesdiversity decreases and dominance by G. aestuariaincreases toward the upper reaches. Marina sites(D, E, F) as well as the artificial mouth area (B, 2C)contained fewer species than the remaining sitesin the estuary.
Estuary residents were (I) present throughoutthe year in both 2004 and 2005 in the Kowie Estu-ary, similarly, estuary-dependent (II) specieswere found throughout the estuary in all seasonsin 2004 and 2005. These species were more abun-dant in the upper estuary sites and almost absentfrom the lower reaches and marina sites. Marinestragglers (III) were confined to the middle and
200 African Zoology Vol. 45, No. 2, October 2010
Table 1. Multiple linear regression statistics for the relationship between larval fish density and environmentalvariables (salinity, temperature and water transparency) for all taxa combined and the dominant species in the KowieEstuary. r 2 = coefficient of determination, r = correlation coefficient, F = F-statistic, Sa = salinity, Te = temperature,Tu = turbidity (water transparency). Significance level = P < 0.01
Taxon r 2 r F Significant variable
All taxa 0.2 0.4 16.3 Te
Dominant speciesGilchristella aestuaria 0.3 0.5 28.3 Te, SaOmobranchus woodii 0.2 0.5 20.4 TeCaffrogobius nudiceps 0.1 0.3 6.4 Te, SaCaffrogobius gilchristi 0.1 0.3 8 Te, SaPsammogobius knysnaensis 0.1 0.3 9.4 SaSolea turbynei 0.3 0.5 26.2 Te, Sa, TuBlenniid 1 0.02 0.1 1.4 –
Fig. 3. Family composition of larval fishes in the mouth (1A, B, 2C), marina channels (D, E, F) and middle and upperreaches of the estuary (3–10) showing percentage contribution of the different family groups represented in theestuary during the study (2004–2005). Families contributing <1% to overall catch are excluded.

Kruger & Strydom: Larval fish assemblage of a warm temperate South African estuary 201
Tab
le2.
Spe
cies
com
posi
tion,
seas
onal
dens
ity,b
ody
leng
th,d
evel
opm
enta
lsta
ge(d
ev.s
tage
)an
des
tuar
yas
soci
atio
n(e
st.a
ssoc
)of
larv
alfis
hes
caug
htin
the
Kow
ieE
stua
ryst
udy.
Pr
=pr
efle
xion
,Fl=
flexi
on,P
o=
post
flexi
on,J
u=
juve
nile
,Le
=le
ptoc
epha
lus.
Fam
ilySp
ecie
sM
ean
dens
ity(r
ange
)Bo
dyle
ngth
(mm
)De
v.st
age
Est.
asso
c.(N
o./1
00m
3 )
Sum
mer
Autu
mn
Win
ter
Sprin
gM
ean
Rang
e
Alls
peci
esco
mbi
ned
938.
8(3
0.8–
2944
1.0)
80.5
(0–7
06.1
)45
(0–3
32.2
)45
1.8
(0–3
925.
8)
Amba
ssid
aeA
mbas
sis
gym
noce
pha
lus
0.0
–0.
5(0
–10.
5)0
–0
–23
.620
.0–2
7.3
PoIIb
Angu
illida
eA
ngui
llam
oss
ambic
us0
–0.
1(0
–4.8
)0
–0.
05(0
–2.9
)43
32.7
–43
LeV
Athe
rinid
aeA
ther
ina
bre
vice
ps
2.7
(0–9
8.8)
0.7
(0–8
.5)
0.1
(0–3
.9)
1.3
(0–1
4.2)
10.9
3.3–
25.7
Pr,F
l,Po
IbBl
enni
idae
Om
obra
nchu
sw
oodii
13.6
(0–8
5.0)
0.2
(0–5
.4)
0–
11.6
(0–6
6.5)
4.1
3.3–
10.1
Pr,F
l,Po
IaBl
enni
id1
30.8
(0–7
09.6
)16
.6(0
–260
.4)
3.6
(0–4
0.5)
0.5
(0–1
1.2)
41.
3–1.
9Pr
,Po
–Cl
inid
aeC
linus
super
cilio
sus
0–
0.38
(0–2
0.7)
0–
0–
17.5
7.1–
17.5
PoIb
Clup
eida
eEtr
umeu
sw
hite
head
i0.
8(0
–26.
2)0.
6(0
–7.2
)0
–0
–23
.79.
4–32
.8Pr
,Fl,
PoIII
Gilc
hris
tella
aest
uari
a68
4.6
(0–2
9243
.4)
43.8
(0–6
30.1
)0.
39(0
–12.
0)18
2.4
(0–3
765.
0)15
.51.
0–70
Pr,F
l,Po
,Ju
IaCy
prin
idae
Cypr
inid
10.
26(0
–6.3
)0
–0
–0
–4
3.3–
4.5
IVEl
opid
aeElo
ps
mac
hnat
a0.
7(0
–15.
7)0.
2(0
–5.8
)0
–0.
2(0
–4.8
)34
.915
.4–4
7.6
IIaEn
grau
lidae
Eng
raul
isja
poni
cus
0.5
(0–1
9.7)
0.5
(0–1
3.0)
0–
0–
18.8
13.0
–26.
0III
Gobi
idae
Caf
frogobiu
sgilc
hris
ti11
8(0
–202
5.8)
2.1
(0–3
1.9)
0.25
(0–5
.6)
168.
8(0
–189
2.6)
3.6
1.4–
25.2
Pr,F
l,Po
IbC
.nu
dic
eps
51.9
(0–1
119.
4)4.
3(0
–38.
3)9.
3(0
–73.
1)42
.8(0
–406
.8)
4.6
1.7–
21.2
Pr,F
l,Po
IbG
loss
ogobiu
sca
llidus
12.4
(0–1
46.3
)0.
7(0
–8.9
)0
–6
(0–1
47.2
)7.
82.
3–19
.6Po
,JIb
Psa
mm
ogobiu
skn
ysna
ensi
s10
(0–1
62.1
)1.
5(0
–42.
1)1.
4(0
–27.
0)29
.8(0
–228
.9)
2.8
1.3–
20.8
Pr,P
oIb
Red
igobiu
sdew
aali
0.3
(0–1
6.5)
0.2
(0–4
.3)
0–
0.5
(0–1
1.7)
3.3
1.9–
8.3
Pr,F
l,Po
IbGo
biid
10
–0
–0
–1
(0–2
3.7)
4.2
1.8–
4.2
Pr–
Gobi
id2
0–
0–
0–
0.1
(0–4
.3)
2.8
3.8
Pr–
Gobi
esoc
idae
Eck
loni
aich
thys
scyl
liorh
inic
eps
2.4
(0–2
5.1)
0.1
(0–4
.4)
0.4
(0–1
8.5)
0.3
(0–7
.4)
5.6
3.1–
11.4
Pr,F
l,Po
IIIHa
emul
idae
Pom
adas
ysoliv
aceu
m0
–0.
5(0
–12.
9)0.
4(0
–12.
1)0
–18
.615
.4–2
4.4
PoIII
Hem
iram
phid
aeH
yporh
amphu
sca
pen
sis
0.6
(0–9
.7)
0.2
(0–4
.4)
0–
0–
21.3
3.4–
33.5
Po,J
uIIc
Mon
odac
tylid
aeM
ono
dac
tylu
sfa
lcifo
rmis
0.3
(0–1
2.3)
1.9
(0–1
2.0)
0.1
(0–4
.0)
0.2
(0–5
.1)
11.1
3.2–
17.4
Po,J
uIIa
Mug
ilidae
Liza
sp.
0.3
(0–1
0.5)
0.2
(0–1
0.0)
0.3
(0–1
1.8)
0.1
(0–4
.2)
17.5
10.6
–21.
1Po
–M
yxus
capen
sis
0.1
(0–5
.2)
0.1
(0–4
.3)
0.5
(0–1
8.5)
0–
21.4
20–2
3.1
PoV
Perc
ophi
dae
Perc
ophi
d1
0–
0.2
(0–9
.2)
0–
0–
5.5
5.5
Po–
Scia
enid
aeA
rgyr
oso
mus
japoni
cus
0.1
(0–5
.3)
0–
0–
0–
4.1
5Pr
IIaSe
rrani
dae
Serra
nid
10
–0.
0(0
–2.2
)0
–0
–8.
99.
3Po
–So
leid
aeH
eter
om
ycte
ris
capen
sis
0–
0–
0.3
(0–9
.2)
1(0
–23.
8)4.
22.
2–25
.7Pr
,Po
IIbS
ole
atu
rbyn
ei0.
1(0
–4.8
)0.
2(0
–8.9
)22
.8(0
–318
.2)
0.5
(0–2
8.4)
8.2
1.9–
18.4
PrIIb
Sole
id1
0.4
(0–7
.3)
0.2
(0–1
1.5)
0–
1.8
(0–5
9.3)
3.5
1.25
–5.2
Pr–
Spar
idae
Dip
lodus
capen
sis
0–
0.2
(0–5
.2)
0.4
(0–9
.9)
0.6
(0–1
6.9)
14.9
9.5–
19.8
Po;J
uIIc
Dip
lodus
cerv
inus
0–
0.1
(0–5
.4)
0.3
(0–1
1.8)
0.1
(0–2
.9)
15.3
10.4
–19.
8Po
;Ju
IIIR
habdosa
rgus
holu
bi
0.1
(0–4
.3)
0.4
(0–5
.2)
0.8
(0–1
1.8)
0.5
(0–1
2.7)
18.3
10.4
–22.
8Po
IIaSy
ngna
thid
aeS
yngna
thus
tem
min
ckii
4.4
(0–6
5.9)
2.8
(0–3
6.3)
0.8
(0–1
8.5)
1.9
(0–1
0.8)
12.8
10–3
4.3
Pr,P
oIb
Tetra
odon
tidae
Am
bly
rhyn
chote
sho
ncke
nii
0.1
(0–3
.4)
0–
0–
0–
4.7
4.7
PrIII
Trip
tery
giid
aeTr
ipte
rygi
id1
3.4
(0–6
4.8)
1(0
–19.
3)0.
1(0
–5)
0–
12.8
3.4–
23.9
Pr,F
l,Po
–Un
iden
tifie
dUn
iden
tifie
d1
0–
0.1
(0–4
.9)
0–
0–
6.2
6.2
Pr–
Unid
entif
ied
20
–0.
2(0
–9.2
)0
–0
–5.
55.
5Pr
–

lower reaches (sites 1A–7) and absent from theupper reaches, except in winter, where their rangewas slightly extended into site 9.
Freshwater migrants (IV) were present in the
upper reaches in all seasons. A small number ofcatadromous species (V) were found in the mouthin spring and summer (Table 3).
Seasonal use of the estuary by individual species
202 African Zoology Vol. 45, No. 2, October 2010
Fig. 4. Percentage contribution of species at all sites in the Kowie Estuary in 2004 and 2005. Only species whichcontributed over 3% individually to the total catch are included, the remaining species are grouped as ‘other’ as theircontribution to overall catch was negligible. Brackets indicate the three zones in the estuary (D, E, F = marina; 1A, B,2C = lower reaches; 3–10 = middle and upper reaches).
Table 3.Seasonal presence (x) or absence ( ) of fishes in various estuary-dependent categories (Whitfield 1998) at allsampling stations in the Kowie Estuary (2004 and 2005). Sp = spring, Su = summer, Au = autumn, Wi = winter.
Site
D E F 1A B 2C 3 4 5 6 7 8 9 10
Estuary residents Sp x x x x x x x x x x x x x xCategory I Su x x x x x x x x x x x x x x
Au x x x x x x x x x x x x x xWi x x x x x x x x x x x x x
Estuary dependents Sp x x x x x x x x xCategory II Su x x x x x x
Au x x x x x x xWi x x x x x x x x x
Marine stragglers Sp xCategory III Su x x x x
Au x x x x x x x xWi x x x x
Freshwater species SpCategory IV Su x x x
AuWi
Catadromous species Sp xCategory V Su x
Au x xWi x x

was evident (Fig. 5). Generally, gobiid specieswere present throughout the year, except forRedigobius dewaali and Glossogobius callidus. Somemarine-spawned species such as Rhabdosargusholubi and Solea turbynei were also present in thesystem in all seasons.
No significant inter-annual difference wasfound in larval fish density in spring or summercatches. However, a significant inter-annualdifference in larval fish catches was found inautumn (H = 14.9, P < 0.05) and winter (H = 22.3,P < 0.05) (Fig. 6) during the two study years.
Significant differences in larval fish densitiesoccurred between different seasons on an inter-annual basis. Summer and winter, summer andautumn, spring and autumn and spring andwinter (P < 0.05) yielded the greatest variability.No significant differences in densities were evi-dent between the warmer months (summer andspring) and between the cooler months (winterand autumn). Mean summer larval fish densitieswere 938.8 larvae per 100 m3 (30.8–29 441.0),followed by spring 451.8 larvae per 100 m3
(0–3925.8), autumn 80.5 larvae per 100 m3 (0–706.0)and winter 45 larvae per 100 m3 (2–332.2).
No significant differences were found in larvalfish densities between different sites along thelength of the estuary (H = 16.3, P = 0.24). Further-more, no significant difference was found whencomparing overall larval fish densities betweenthe lower estuary (1A, B, 2C), marina (D, E, F) andmain channel (3–10) (P > 0.05).
Larval fish densities varied with salinity zones inthe estuary (H = 12.87, P = 0.005). A significantdifference was found to exist in larval fish densitybetween the euhaline and mesohaline salinityzones (P = 0.013). Larval fish density in themesohaline zone was the highest, at 577.7 larvaeper 100 m3 (9.51–3925.8), followed by the oligo-haline zone, with 461.0 larvae per 100 m3 (14.8–1543.0), the euhaline zone, with 211.6 per 100 m3
(0–2245.7) and the polyhaline zone with 181.9larvae per 100 m3 (0–936.6), respectively.
Spatial and temporal variation in
development stage and body length
Preflexion larvae numerically dominated thelarval fish catches in the Kowie Estuary duringthe study period, followed by flexion, post-flexion larvae and early juveniles. Spring andsummer months were characterized by highernumbers of preflexion larvae. Contributions offlexion, postflexion and juveniles typically
Kruger & Strydom: Larval fish assemblage of a warm temperate South African estuary 203
Fig
.5.S
easo
nalp
rese
nce
and
abse
nce
ofal
lspe
cies
caug
htin
the
Kow
ieE
stua
ryin
2004
and
2005
.Som
esp
ecie
sw
ere
pres
entt
hrou
ghou
tthe
year
butm
any
spec
ies
wer
eon
lypr
esen
tsea
sona
lly.

increased in autumn and winter (Fig. 7).Lower estuary sites, particularly the marina sites
(D, E, F) were almost entirely dominated bypreflexion larvae. Post flexion and early juvenilefishes were restricted to upper reaches, and absentor not reflected in mouth and marina site catches(Fig. 8).
There was a large range in mean body length ofthe dominant species in the Kowie Estuary, exceptfor Blenniid 1, where specimens collected rangedfrom 1.3 to 1.9 mm. Of the remaining top sevenspecies, Caffrogobius gilchristi larvae had a meanbody length of 3.6 mm (range 1.4–25.2), Caffro-gobius nudiceps had a mean body length of 4.4 mm(1.7–21.2), Gilchristella aestuaria recorded in theestuary had a mean body length of 15.5 mm(1.0–70.0), Omobranchus woodii mean body lengthwas 4.1 mm (3.3–10.1), Psammogobius knysnaensis
2.8 mm (1.3–20.8) and Solea turbynei had a meanbody length of 8.2 mm (1.9–18.4). A good represen-tation of all larval and juvenile size classes wereevident for all recorded species in the Kowie Estu-ary.
Community analysis
A community analysis approach was used toassess relationships between season, salinity zoneand site in the Kowie Estuary. Upper sites in theKowie Estuary showed least similarity to lowerestuary and marina sites and the similarity in-creased the closer sites were together (SIMPER).Sites 1A to 4 in the lower reaches were dominatedby gobiid Caffrogobius nudiceps. Site 5 had an equalcontribution of C. nudiceps and the estuarineround herring, Gilchristella aestuaria, whereassites 6 to 10 were dominated by G. aestuaria
204 African Zoology Vol. 45, No. 2, October 2010
Fig. 6. Mean (range) larval fish density recorded sequentially per season in 2004 and 2005 in the Kowie Estuary.Sp = spring, Su = summer, Au = autumn, Wi = Winter, 04 = 2004, 05 = 2005. Bars indicate range.
Fig. 7. Temporal trends in development stage in the Kowie Estuary. Sp = spring, Su = summer, Au = autumn, Wi =winter, 04 = 2004, 05 = 2005, e.g. Sp04 = Spring 2004.

(SIMPER). As a result of the overwhelming domi-nance of estuary-resident species, two clusters,based on estuary residents and marine-spawnedspecies were assessed separately and shown in aBray-Curtis similarity dendrogram (Figs 9 & 10).Clusters in the dendrogram were sorted and dif-ference between groups in the clusters wheredetermined using ANOSIM. It was found thatthere were significant differences in upper reachessites and lower artificial mouth and marina sites.The difference reduced the closer the sites were.
The multidimensional scaling plot (MDS)(Fig. 11) indicates that there are clear groupings inresponse to location, especially main channel sites(3–10) versus marina (D, E, F) and lower (1A, B, 2C)channel sites for estuary residents in the KowieEstuary.
The MDS generated for marine-spawned andcatadromous species shows communities are notsignificantly shaped by location (Fig. 11).
Temporal and spatial variation in
species richness and diversity
Species richness and diversity varied with seasonand year in the Kowie Estuary (Table 4). Speciesrichness and species diversity also varied spatiallyin the Kowie Estuary over the study period. Over-all, when the marina channel sites (D, E, F) werecompared to the lower estuary sites (1A, B, 2C) and
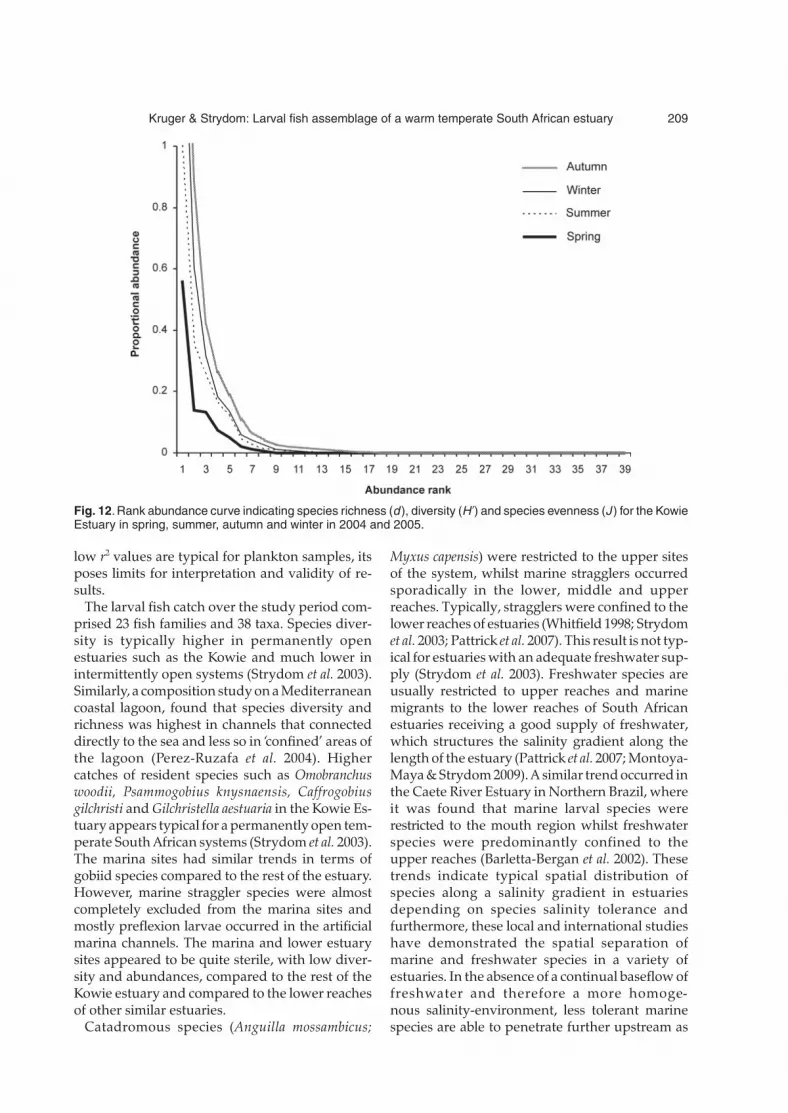
main channel sites (3–10) it was found that themain channel sites had the highest species rich-ness (d = 3.34), followed by the lower channel sites(d = 3.25) and marina channel sites (d = 2.25), re-spectively. Species diversity overall was found tobe highest in the lower channel sites (H’ = 1.46),followed by the marina channel sites (H’ = 1.34)and the main estuary channel sites (H’ = 1.31).More specifically, within the marina, site E, thecentral marina channel site, had the highest rich-ness and diversity (d = 2.35, H’ = 1.51), followedby site D (d = 1.79, H’ = 1.28) and site F (d = 1.73,H’ = 1.15). Within the lower reaches specifically,the first site in the estuary, 1A, had the highestrichness and diversity (d = 2.98, H’ = 1.70). In themain estuary channels, richness and diversity atdifferent sites were similar; however, site 6 had thehighest richness (d = 2.89) followed by sites 7 (d =2.74), 8 (d = 2.70), 4 (d = 2.43), 9 (d = 2.36), 5 (d =2.31) and 3 (d = 2.20), with the upper most site,site 10, having both the lowest richness and sec-ond lowest diversity (d = 1.29, H’ = 1.11). In termsof species diversity, site 4 had the highest (H’ =1.69), followed by 3 (H’ = 1.59), 5 (H’ = 1.40), 6(H’ = 1.38), 8 (H’ = 1.21), 7 (H’ = 1.28), 9 (H’ = 1.02).The Kowie Estuary is characterized by high domi-nance and low evenness (Fig. 12), with C. gilchristiand G. aestuaria dominating the catches in theKowie Estuary in 2004 and 2005. Owing to this
Kruger & Strydom: Larval fish assemblage of a warm temperate South African estuary 205
Fig. 8. Spatial variation of all developmental stages of larval fishes, including early juveniles, at all sites in the KowieEstuary in 2004 and 2005. Brackets indicate marina sites (D, E, F), lower estuary (1A, B, C) and middle and upperreaches (3–10). Marina sites are not continuous with the lower, middle and upper reaches.

206 African Zoology Vol. 45, No. 2, October 2010
Fig
.9.B
ray
Cur
tissi
mila
rity
dend
rogr
amin
dica
ting
perc
enta
gesi
mila
rity
ofsa
mpl
es,m
easu
red
byth
epr
esen
ceor
abse
nce
ofes
tuar
iyre
side
nts
(cat
egor
yI)i
nth
eK
owie
Est
uary
in20
04an
d20
05.R
=0.
178
(sig
nific
ance
leve
l0.1
%).

Kruger & Strydom: Larval fish assemblage of a warm temperate South African estuary 207
Fig
.10
.B
ray
Cur
tissi
mila
rity
dend
rogr
amin
dica
ting
perc
enta
gesi
mila
rity
ofsa
mpl
es,
mea
sure
dby
the
pres
ence
orab
senc
eof
mar
ine-
spaw
ned
spec
ies
and
cata
drom
ous
spec
ies
(cat
egor
ies
II,III
,V)
inth
eK
owie
Est
uary
in20
04an
d20
05.R
=0.
178
(sig
nific
ance
leve
l1.7
%).

high dominance the estuary had an uneven (J)distribution.
DISCUSSIONTemporal and spatial variations in temperature(°C), water clarity (k) and salinity were evident inthe Kowie Estuary during the study period. Peaklarval fish densities occurred in summer andspring, coinciding with warmer water temperatures,seasonal fish spawning and peak recruitment(Whitfield 1998; Whitfield & Marais 1999; Strydomet al. 2003). Multiple linear regression revealed thatsome species had a significant relationship withsome environmental variables (Table 1) but r2
values were low, indicating high variability. Whilst
208 African Zoology Vol. 45, No. 2, October 2010
Fig. 11. a, Multidimensional scaling plot (stress 0.14) and b, multidimensional scaling plot (stress 0.2) of marine-spawned species in the Kowie Estuary for all species.
Table 4. Species richness and diversity in all seasonsand years sampled in the Kowie Estuary in 2004 and2005.
Season Species richness Species diversity(d) (H ’)
Spring 04 0.49 1.32Summer 04 0.48 1.32Autumn 04 0.44 1.31Winter 04 0.43 1.35Spring 05 0.36 1.22Summer 05 0.38 1.30Autumn 05 0.44 1.46Winter 05 0.45 1.29
low r2 values are typical for plankton samples, itsposes limits for interpretation and validity of re-sults.
The larval fish catch over the study period com-prised 23 fish families and 38 taxa. Species diver-sity is typically higher in permanently openestuaries such as the Kowie and much lower inintermittently open systems (Strydom et al. 2003).Similarly, a composition study on a Mediterraneancoastal lagoon, found that species diversity andrichness was highest in channels that connecteddirectly to the sea and less so in ‘confined’ areas ofthe lagoon (Perez-Ruzafa et al. 2004). Highercatches of resident species such as Omobranchuswoodii, Psammogobius knysnaensis, Caffrogobiusgilchristi and Gilchristella aestuaria in the Kowie Es-tuary appears typical for a permanently open tem-perate South African systems (Strydom et al. 2003).The marina sites had similar trends in terms ofgobiid species compared to the rest of the estuary.However, marine straggler species were almostcompletely excluded from the marina sites andmostly preflexion larvae occurred in the artificialmarina channels. The marina and lower estuarysites appeared to be quite sterile, with low diver-sity and abundances, compared to the rest of theKowie estuary and compared to the lower reachesof other similar estuaries.
Catadromous species (Anguilla mossambicus;
Myxus capensis) were restricted to the upper sitesof the system, whilst marine stragglers occurredsporadically in the lower, middle and upperreaches. Typically, stragglers were confined to thelower reaches of estuaries (Whitfield 1998; Strydomet al. 2003; Pattrick et al. 2007). This result is not typ-ical for estuaries with an adequate freshwater sup-ply (Strydom et al. 2003). Freshwater species areusually restricted to upper reaches and marinemigrants to the lower reaches of South Africanestuaries receiving a good supply of freshwater,which structures the salinity gradient along thelength of the estuary (Pattrick et al. 2007; Montoya-Maya & Strydom 2009). A similar trend occurred inthe Caete River Estuary in Northern Brazil, whereit was found that marine larval species wererestricted to the mouth region whilst freshwaterspecies were predominantly confined to theupper reaches (Barletta-Bergan et al. 2002). Thesetrends indicate typical spatial distribution ofspecies along a salinity gradient in estuariesdepending on species salinity tolerance andfurthermore, these local and international studieshave demonstrated the spatial separation ofmarine and freshwater species in a variety ofestuaries. In the absence of a continual baseflow offreshwater and therefore a more homoge-nous salinity-environment, less tolerant marinespecies are able to penetrate further upstream as
Kruger & Strydom: Larval fish assemblage of a warm temperate South African estuary 209
Fig. 12. Rank abundance curve indicating species richness (d), diversity (H’) and species evenness (J ) for the KowieEstuary in spring, summer, autumn and winter in 2004 and 2005.
happened in the Kowie Estuary during restrictedriver flow periods.
Marine straggler species such as Etrumeuswhiteheadi, Engraulis japonicus, Eckloniaichthysscylliorhiniceps, Pomadasys olivaceum, Diploduscapensis, D. cervinus, Syngnathus temminckii andAmblyrhynchotes honckenii were all present in themiddle to upper reaches of the Kowie Estuary. Themarine-spawned Solea turbynei, made a notablecontribution to the overall catch in the estuary.Furthermore, early developmental stages of theseSoleids, occurred persistently in the upper reachesof the system for reasons unclear. These preflexionS. turbynei larvae were probably easily swept fromnearby spawning areas up the estuary through thepermanently open, deep channelled mouth withthe dominant flood tide and so became entrainedin the system.
Estuary-resident species dominated the catchesin the Kowie Estuary (91%), followed by eury-haline marine species which contributed 4% of thetotal catch. The marine contribution to the overallcatch is lower in the Kowie than in neighbouringsystems, such as the Sundays system. A study byStrydom et al. (2003) showed that permanentlyopen estuaries were dominated by estuary-dependent marine species (category II) (47%), andestuary residents (category I) (50%) dominatedthe catches in intermittently open estuaries. Theestuary-resident Gilchristella aestuaria contributed47.6% of the total catch in the Strydom et al. (2003)study. The dominance of G. aestuaria in temperateSouth African estuarine systems is typical as hasbeen found in numerous past studies (Harris et al.2001; Strydom et al. 2002; Pattrick et al. 2007). In thepresent study, peaks in densities of G. aestuaria oc-curred in the summer months. These peaks proba-bly coincide with productivity peaks associatedwith lower salinities and freshwater input whichtrigger spawning of this species (Strydom et al.2002). Past studies have found that G. aestuaria ismost commonly found in high densities in areas oflow salinities and in freshwater-dominated sys-tems (Strydom et al. 2002; Pattrick et al. 2007).
Salinity zones play an important role in structur-ing larval fish abundance and distributionin intemperate South African estuaries. The Oligo-haline salinity zone ranges from 0.5 to 5, themesohaline zone from approximately 5–15, poly-haline ranging from 15 to 35 and euhaline typicallyranging from 30 to 40 (Whitfield 1994). The meso-haline zone was the region of highest mean larvaldensities. Typically, the mesohaline zone in estuar-
ies is associated with the river–estuary interface(REI) and is generally a region of high abundancesand biomass (Wooldridge & Bailey 1982; Snowet al. 2000; Strydom et al. 2003). As in the Kowie Es-tuary, Pattrick et al. (2007) found that the meso-haline zone in the Mngazi Estuary supported thehighest densities of larval fish. Similarly, Strydomet al. (2003) and Montoya-Maya & Strydom (2009)found that the mesohaline zone had significantlyhigher densities of larvae and juveniles. Access tothese regions of high productivity is thought toinfluence the feeding of larval fish (Govoni et al.1985; Strydom et al. 2003). Exposure to this favour-able, food-rich environment influences growthrates, which reduces the pelagic larval durationtherefore, larvae have a greater chance of avoidingpredation, accessing settlement habitats and ulti-mately reaching maturity (Searcy & Sponaugle2000; Bergenius et al. 2005). The REI zone is essen-tially a frontal zone that is created between freshand saline water bodies and in response to highconcentrations of suspended particulate matter(Snow et al. 2000). Thus, food patches are directlyrelated to water stratification and the fact that themesohaline zone is most typically associated withthe REI zone may explain why this salinity zone isa region characteristic of food patches (Govoniet al. 1985; Searcy & Sponaugle 2000). For thesereasons, the REI zone probably forms the basis forecological functioning in estuaries (Snow et al.2000; Strydom et al. 2003) and is vital for the larvalphase of fishes, particularly those of residentspecies and category II marine species relying onestuarine nurseries.
The lower reaches of the Kowie Estuary includ-ing the mouth and marina channels (sites 1A, B,2C, D, E and F), are all sites that have artificialstone-packed walls. Species found in the planktonin this area were almost entirely preflexion larvae,with the switch to flexion, postflexion and earlyjuvenile fish only occurring much further up theestuary. This is not a typical finding for perma-nently open estuaries. The lack of flexion and post-flexion larvae as well as early juveniles may be as aresult of the undesirable habitat that has beencreated by the artificial walling in the mouth regionand marina of the Kowie Estuary or higher preda-tion in these channels as a result of habitat changes.
Refuges such as aquatic plants and shallowmarginal habitats in estuaries are particularlyimportant for larval and juvenile fish to avoid dis-placement and predation by piscivores (Strydom2003; Strydom & Wooldridge 2005). It has been
210 African Zoology Vol. 45, No. 2, October 2010

found that estuaries that contain a variety of sub-strata and aquatic vegetation habitats typicallyhave higher species diversity (Whitfield 1999;Strydom 2003). Additionally, a lack of habitatheterogeneity that comes with artificial channel-ling has been found to reduce species numbers, aswas the case in an Australian estuary with a deep-ened artificial channel (Young & Potter 2003a,b). Itappears that a similar problem occurs in the Kowiemarina with the prevalence of preflexion larvaeand a reduced species diversity compared to thelower reaches of other unaltered estuaries in theregion (Whitfield 1994; Strydom et al. 2003). Addi-tionally, as a result of the steep walled lowerreaches, predation increases significantly due to alack of shallow refuge habitat. This phenomenonis termed ‘deep-water predation’. Typically,shallow, vegetated areas provide refuge, with anincrease in water depth resulting in an increase inpredator size and thus predation pressure(Manderson et al. 2004).
The urban nature of the Kowie Estuary alsomeans that pollution, in and around the waterways, also negatively affect the system (Whitfield1998, 1999). Freshwater abstraction for urban use,loss of nursery habitat in the lower reaches andlocal pollution from town and harbour activitiesall affect the quality of nursery area in the KowieEstuary. As is typical for most fish populations, thesuccess of the larval phase underpins the successof the fish population (Lemberget & McCormick2009). Since estuarine recruitment in temperateSouth Africa occurs at the larval and juvenilestages of development of fishes (Strydom et al.2003), if recruitment and survival at the larvalphase fails as a result of poor habitat availability forrefuge in the lower reaches of a permanently openestuary, this leaves the juvenile fish stock in theestuary reliant on the success of larval and juve-nile movement into the estuary from the ocean.Fishing pressure is a major cause of mortality atthe juvenile stage of development in the KowieEstuary (Lamberth & Turpie 2003). The extent ofthis loss to local fish stocks is as yet, not quantified.
ACKNOWLEDGEMENTS
The authors would like to thank the SouthAfrican Institute of Aquatic Biodiversity (SAIAB)for funding the project. Fieldworkers are thankedfor assistance with the collection of the data.Jessica Escobar-Porras and Phanor Montoya-Mayaare thanked for their laboratory assistance.
REFERENCES
ACEVES-MEDINA, G., SALDIERNA-MARTINEZ, R.,HINOJOSA-MEDINA, A., JIMENEZ-ROSENBERG,S.P.A., HERNANDEZ-RIVAS, M.E., MORALES-VILA, R. 2008. Vertical structure of larval fish assem-blages during diel cycles in summer and winter in thesouthern part of Bahia de la Paz, Mexico. Estuarine,Coastal and Shelf Science 76: 889–901.
BARLETTA-BERGAN, A., BARLETTA, M., SAINT-PAUL,U. 2002. Structure and seasonal dynamics of larvalfish in the Caete River Estuary in North Brazil.Estuarine, Coastal and Shelf Science 54: 193–206.
BECKLEY, L.E. 1985. Tidal exchange of ichthyoplanktonin the Swartkops estuary mouth, South Africa. SouthAfrican Journal of Zoology 20: 15–20.
BERGENIUS, M.A.J., McCORMICK, M.I., MEEKAN,M.G. & ROBERTSON, D.R. 2005. Environmentalinfluences on larval duration, growth and magnitudeof settlement of coral reef fish. Marine Biology 147:291–300.
BOEHLERT, G.W & MUNDY, B.C. 1988. Roles of behav-ioural and physical factors in larval and juvenile fishrecruitment to estuarine nursery areas. AmericanFisheries Society Symposium 3: 51–67.
CLARKE, K.R & WARWICK, R.M. 1994. Change in MarineCommunities: an Approach to Statistical Analysis andInterpretation. Plymouth Marine Laboratory, Plym-outh.
DAWES, C.J. 1981. Marine Botany. John Wiley and Sons,New York.
GOVONI, J. J., CHESTER, A. J., HOSS, D. E & ORTNER,P.B. 1985. An observation of episodic feeding andgrowth of larval Leiostomus xanthurus in the northernGulf of Mexico. Journal of Plankton Research 17(1):137–146.
HARRIS, S.A & CYRUS, D.P. 2000. Comparison of larvalfish assemblages in three large estuarine systems,KwaZulu-Natal, South Africa. Marine Biology 137:527–541.
HARRIS, S.A, CYRUS, D.P. & BECKLEY, L.E. 2001. Hori-zontal trends in larval fish diversity and abundancealong an ocean-estuarine gradient on the northernKwaZulu-Natal Coast, South Africa. Estuarine,Coastal and Shelf Science 53:221–235.
HEYDORN, A.E.F & GRINDLEY, J.R. 1982. Estuaries ofthe Cape: Part II. Synopses of available informationon individual systems: Kowie (CSE10). CSIR Re-search Report No. 409, Stellenbosch.
HILL, B.J. & ALLANSON, B.R. 1971. Temperature toler-ance of the estuarine prawn Upogebia africana(Anomura, Crustacea). Marine Biology 11: 337–343.
LAMBERTH, S.J. & TURPIE, J.L. 2003. The role of estuar-ies in South African Fisheries: Economic Importanceand management implications. African Journal ofMarine Science 25: 131–157.
LEIS, J.M. & CARSON-EWART, B.M. 2000. The Larvae ofIndo-Pacific Coastal Fishes: an Identification Guide toMarine Fish Larvae. Koninklijke Brill, Leiden.
LEMBERGET, T. & McCORMICK, M.I. 2009. Replenish-ment success linked to fluctuating asymmetry inlarval fish. Oecologia 159: 83–93.
NEIRA, F.J., MISKIEWICZ, A.G. & TRNSKI, T. 1998. Lar-val of Temperate Australian Fishes, Laboratory Guide for
Kruger & Strydom: Larval fish assemblage of a warm temperate South African estuary 211

Larval Fish Identification. University of Western Aus-tralia Press, Nedlands.
NEIRA, F.J. & POTTER, I.C. 1994. The larval fish assem-blage of the Nornalup-Wapole Estuary, a perma-nently open estuary on the southern coast of WesternAustralia. Australian Journal of Freshwater Research 45:1193–1207.
MANDERSON, J.P., PESSUTTI, J., HILBERT, J.G. &JUANES, F. 2004. Shallow water predation risk ofjuvenile flatfish (winter flounder; Pseudopleuronectesamericanus, Walbaum) in a northwest Atlantic estu-ary. Journal of Experimental Marine Biology and Ecology304: 137–157.
MELVILLE-SMITH, R. & BAIRD, D. 1980. Abundance,distribution and species composition of fish larvae inthe Swartkops Estuary. South African Journal ofZoology 15: 72–78.
MONTOYA-MAYA, P.H & STRYDOM, N.A. 2009.Description of larval fish composition, abundanceand distribution in nine south and west coastestuaries of South Africa. African Zoology 44: 75–92.
PATTRICK, P., STRYDOM, N.A. & WOOLDRIDGE, T.H.2007. Composition, abundance, distribution andseasonality of larval fishes in the Mngazi Estuary,South Africa. African Journal of Aquatic Science 32:113–123.
PEREZ-RUZAFA, A., QUISPE-BECERRA, J.I., GAR-CIA-CHARTON, J.A. & MARCOS, C. 2004. Composi-tion, structure and distribution of the ichthyplanktonin a Mediterranean coastal lagoon. Journal of Fish Biol-ogy 64: 202–218.
RAMOS, S., COWEN, R.K., RE, P. & BORDALO, A.A.2006. Temporal and spatialdistributions of larval fishassemblages in the Lima Estuary (Portugal). Estua-rine, Coastal and Shelf Science 66: 302–314.
SEARCY, S.P. & SPONAUGLE, S. 2000. Variable larvalgrowth in a coral reef fish. Marine Ecology ProgressSeries 206: 213–226.
SMITH, M.M. & HEEMSTRA, P.C. 1986. Smith’s Sea Fishes.Macmillan South Africa, Johannesburg.
SNOW, G.C., ADAMS, J.B. & BATE, G.C. 2000. Effects ofriver flow on estuarine microalgal biomass anddistribution. Estuarine, Coastal and Shelf Science 51:225–266.
STRYDOM, N.A. 2003. An assessment of habitat use bylarval fishes in a warm temperate estuarine creekusing light traps. Estuaries 26: 1310–1318.
STRYDOM, N.A., WHITFIELD, A.K. & PATERSON, A.W.2002. Influence of altered freshwater flow regimes onabundance of larval and juvenile Gilchristellaaestuaria (Pisces: Clupeidae) in the upper reaches of
two South African estuaries. Marine FreshwaterResearch 53: 431–438.
STRYDOM, N.A., WHITFIELD, A.K. & WOOLDRIDGE,T.H. 2003. The role of estuarine type in characterizingearly stage fish assemblages in warm temperate estu-aries, South Africa. African Zoology 38:29–43.
STRYDOM, N.A. & WOOLDRIDGE, T.H. 2005. Diel andtidal variations in larval fish exchange on a neap andspring tide in the mouth of the Gamtoos Estuary,South Africa. Journal of Aquatic Science 30: 143–152.
STRYDOM, N.A. & NEIRA, F.J. 2006. Description andecology of larvae of Glossogobius callidus andRedigobius dewaali (Gobiidae) from temperate SouthAfrican estuaries. African Zoology 41: 240–251.
WHITFIELD, A.K. 1989. Ichthyoplankton interchangein the mouth region of a southern African estuary.Marine Ecology Progress Series 54: 25–33.
WHITFIELD, A.K. 1994. Abundance of larval and 0+juvenile marine fishes in the lower reaches of threesouthern African estuaries with differing freshwaterinputs. Marine Ecology Progress Series 105: 257–267.
WHITFIELD, A.K. 1998. Biology and ecology of fishes inSouthern African estuaries. Ichthyological Monographsof the J.L.B Smith Institute of Ichthyology No. 2.
WHITFIELD, A.K. 1999. Ichthyofaunal assemblages inestuaries: A South African case study. Reviews in FishBiology 9: 151–186.
WHITFIELD, A.K. 2000. Available scientific informationon individual South African estuarine systems, WRDReport No. 577/3/00. Water Research Commission,Pretoria, South Africa.
WHITFIELD, A.K., PATERSON, A.W., BOK, A.H. & KOK,H.M. 1994. A comparison of the ichthyofaunas in twopermanently open Eastern Cape estuaries. SouthAfrican Journal of Zoology 29: 175–185.
WHITFIELD, A.K. & MARAIS, J.F.K. 1999. TheIchthyofauna. In: Estuaries of South Africa, (eds) B.R.Allanson & D. Baird, pp. 209–233. Cambridge Univer-sity Press, Cambridge.
WOOLDRIDGE, T.H. & BAILEY, C.1982. Euryhalinezooplankton of the Sundays Estuary and notes ontrophic relationships. South African Journal of Zoology17: 151–163.
YOUNG, G.C. & POTTER, I.C. 2003a. Influence of anartificial entrance channel on the ichthyofauna of alarge estuary. Marine Biology 142: 1181–1194.
YOUNG, G.C & POTTER, I.C. 2003b. Do the characteris-tics of the ichthyoplankton in an artificial and anatural entrance channel of a large estuary differ?Estuarine, Coastal and Shelf Science 56: 765–779.
212 African Zoology Vol. 45, No. 2, October 2010
Responsible Editor: O.L.F. Weyl


