Embed Size (px)
Citation preview

Spatial and temporal variation of uranium in a shallowweathered rock aquifer in southern India
K Brindha1, L Elango
1,∗ and R N Nair2
1Department of Geology, Anna University, Chennai 600 025, India.2Environmental Assessment Division, Bhabha Atomic Research Centre, Mumbai 400 085, India.
∗Corresponding author. e-mail: [email protected] [email protected]
Uranium occurs naturally in groundwater and surface water. The objective of this study is to understandthe causes for the occurrence of uranium and its spatio-temporal variation in groundwater in a part ofNalgonda district, Andhra Pradesh, south India. Uranium deposits occur in the southeastern part of thisarea. Groundwater samples were collected from 44 wells every two months from March 2008 to January2009. The samples were analyzed for pH, ORP and uranium concentration. The uranium concentrationin groundwater varies from 0.2 ppb to a maximum of 68 ppb with a mean of 18.5 ppb. About 21.6% of thesamples were above the drinking water limit of 30 ppb set by USEPA. The uranium concentration variedwith fluctuation in groundwater level, pH and ORP. Uranium concentration in groundwater changesdepending on lithology, degree of weathering and rainfall recharge.
1. Introduction
Uranium is a naturally occurring radionuclide insurface and groundwater. Natural uranium is amixture of three isotopes – 238U, 235U and 234U.Its average abundance in the earth’s crust is about2 ppb. It occurs naturally in rocks and mineralssuch as granite, lignite, phosphate deposits and inuranium minerals such as uraninite, carnotite andpitchblende. Uranium also occurs in low concentra-tion in all natural waters. Intake of uranium cancause chemical as well as radiological toxicity whichusually affects the kidneys (through ingestion fromwater or food) and the lungs (through inhalation).Zamora et al (1998) had reported cases of kid-ney disorders due to ingestion of drinking watercontaining uranium as high as 780 ppb. Garshasbiet al (2005) reported the uranium concentrationin seawater of Caspian Sea and Persian Gulf tobe around 6.12 ± 0.18 ppb and 3.53 ± 0.1 ppb.The association of uranium with colloidal andsuspended particulate matter in Arabian Sea was
studied by Singhal et al (2004). The concentra-tion of uranium in various rivers of India suchas Yamuna (0.09–3.61 ppb) and Chambal (0.2–1.74 ppb) (Rengarajan et al 2006), Bhagirathi(2.11–3.96 ppb) and Alakanda (1.86 ppb) (Sarinet al 1992) have been studied earlier. Springs andstreams in Himachal Pradesh, India had 0.07 to4.65 ppb of uranium (Singh et al 1999). Similarlyuranium concentration in groundwater has beenreported in several parts of India – Kumaun andSiwalik (1.08 ± 0.02 to 35.83 ± 0.09 ppb) (Ramolaet al 1988), Punjab (11.71 ± 0.15 to 113.70 ±0.46 ppb) (Singh et al 1995), Kolar district (0.3 to1442.9 ppb) (Babu et al 2008) and Upper Siwa-liks (1.08 ± 0.03 to 19.68 ± 0.12 ppb) (Singh et al2009). The present study was carried out in Nal-gonda district, Andhra Pradesh, southern Indiawhere occurrence of unconformity related uraniumdeposits have been reported (Sinha et al 1995). Thepresence of indoor radon/thoron concentration inthis area was reported by Reddy et al (2003). Singhet al (2002) studied the uranium concentration (0.5
Keywords. Uranium; groundwater; Nalgonda; Andhra Pradesh; India.
J. Earth Syst. Sci. 120, No. 5, October 2011, pp. 911–920c© Indian Academy of Sciences 911
912 K Brindha et al
to 410 ppb) in groundwater in Palnadu sub-basinwhich is located adjacent to the present study area.The causes for the presence of high fluoride concen-tration in groundwater of parts of Nalgonda dis-trict was reported by Brindha et al (2011). However,occurrence of uranium in groundwater in this areaas well as its spatial and temporal variation has notbeen studied. Keeping an account on the impor-tance of public health and considering the fact thatthere is sizable uranium mineralization in this area,this study was aimed to understand the presentstatus of uranium, the causes, spatial and tempo-ral variation in groundwater in Peddagattu regionof Andhra Pradesh, southern India.
2. Materials and methods
2.1 Description of the study area
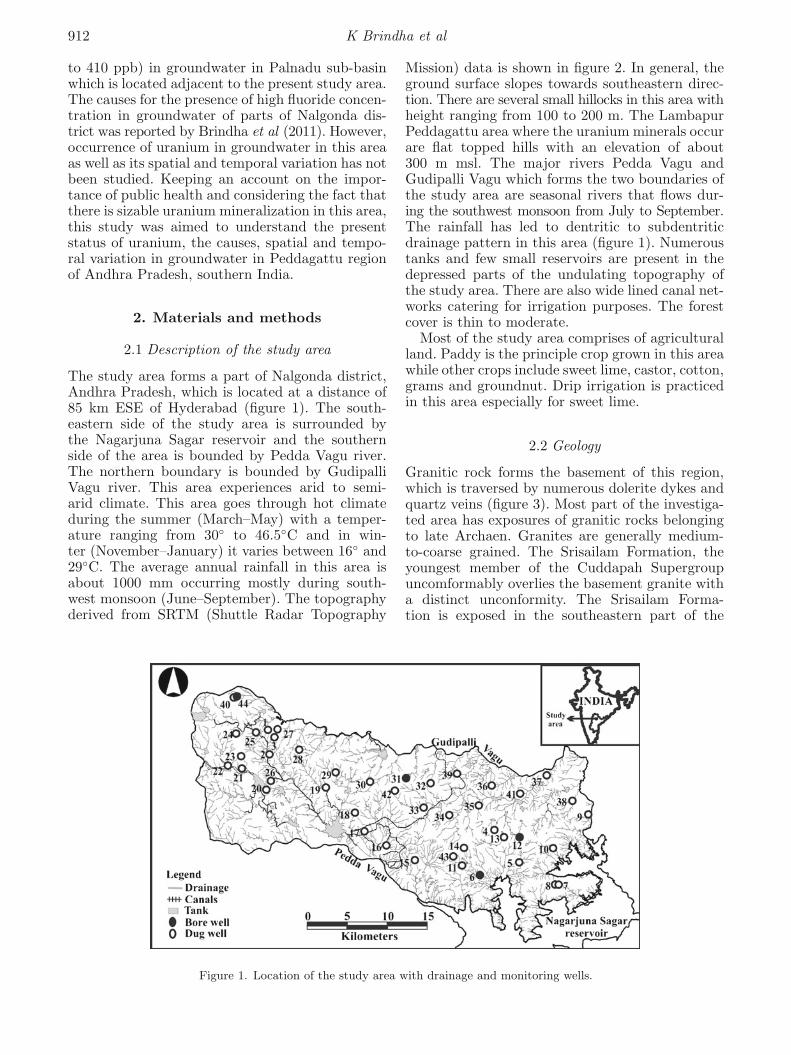
The study area forms a part of Nalgonda district,Andhra Pradesh, which is located at a distance of85 km ESE of Hyderabad (figure 1). The south-eastern side of the study area is surrounded bythe Nagarjuna Sagar reservoir and the southernside of the area is bounded by Pedda Vagu river.The northern boundary is bounded by GudipalliVagu river. This area experiences arid to semi-arid climate. This area goes through hot climateduring the summer (March–May) with a temper-ature ranging from 30◦ to 46.5◦C and in win-ter (November–January) it varies between 16◦ and29◦C. The average annual rainfall in this area isabout 1000 mm occurring mostly during south-west monsoon (June–September). The topographyderived from SRTM (Shuttle Radar Topography
Mission) data is shown in figure 2. In general, theground surface slopes towards southeastern direc-tion. There are several small hillocks in this area withheight ranging from 100 to 200 m. The LambapurPeddagattu area where the uranium minerals occurare flat topped hills with an elevation of about300 m msl. The major rivers Pedda Vagu andGudipalli Vagu which forms the two boundaries ofthe study area are seasonal rivers that flows dur-ing the southwest monsoon from July to September.The rainfall has led to dentritic to subdentriticdrainage pattern in this area (figure 1). Numeroustanks and few small reservoirs are present in thedepressed parts of the undulating topography ofthe study area. There are also wide lined canal net-works catering for irrigation purposes. The forestcover is thin to moderate.
Most of the study area comprises of agriculturalland. Paddy is the principle crop grown in this areawhile other crops include sweet lime, castor, cotton,grams and groundnut. Drip irrigation is practicedin this area especially for sweet lime.
2.2 Geology
Granitic rock forms the basement of this region,which is traversed by numerous dolerite dykes andquartz veins (figure 3). Most part of the investiga-ted area has exposures of granitic rocks belongingto late Archaen. Granites are generally medium-to-coarse grained. The Srisailam Formation, theyoungest member of the Cuddapah Supergroupuncomformably overlies the basement granite witha distinct unconformity. The Srisailam Forma-tion is exposed in the southeastern part of the
Figure 1. Location of the study area with drainage and monitoring wells.

Spatio-temporal variation of uranium in groundwater 913
Figure 2. Topography.
Figure 3. Geology.
study area. The sediments of Srisailam Forma-tion are mainly arenaceous and include pebbly-gritty quartzite shale with dolomitic limestone,intercalated sequence of shale-quartzite and mas-sive quartzite. The litho units of this formation aredipping at an angle ranging from 3◦ to 5◦ towardsSE. The generalized stratigraphic sequence of thisarea is given in table 1 (after GSI 1995). The ura-nium deposit occurs adjacent to the unconformitybetween basement granite and the overlying Pro-terozoic Srisailam quartzite in the northwestern
margin of the Cuddapah basin. Uraninite, pitch-blende, kasolite and uranophane are the main ura-nium minerals present in the deposits of Lambapurand Peddagattu (Sinha et al 1995). The primaryuranium mineralization is of epigenetic hydrother-mal in nature (Singh et al 2002). Lambapur min-eralized zone occurs at shallow depth of about 10–15 m whereas it occurs below 50 m or more inPeddagattu. The granitic rocks of this region con-tain uranium in the range of 10.2–116 ppm with anaverage of 35 ppm (Shrivastava et al 1992).

914 K Brindha et al
2.3 Hydrogeology
Hydrogeology of the study area was arrived basedon field work, monitoring of groundwater levels,pumping tests and infiltration tests. The study areahas four distinct layers which are the soil zone,moderately weathered, highly weathered and mas-sive rock. The thickness of soil zone ranges from0.6 to 12 m. The soil zone is comparatively thickerin the southern and northeastern boundary of thestudy area due to the influence of rivers. The thick-ness of the moderately weathered granite rangesfrom 11 to 77 m and highly weathered granite layerranges from 12 to 33 m. Most of the wells pen-etrate up to the fractured layer. The lithology ofa few wells are shown in figure 4. The groundwa-ter table occur generally from 0 to 12 m belowground level. The annual groundwater level fluc-tuation is around 8 m. The principal source ofgroundwater recharge is rainfall. The groundwaterlevel rises by 1 m after the monsoon rains in themonths of July–September. That is, the ground-water levels before monsoon range from 3 to 7 mbgl, and after monsoon, it varies from 2 to 3 m bgl.
Groundwater generally flows towards the south-eastern direction. Though there are many igneousintrusions in this area, due to the high intensityof weathering and as groundwater occur at shal-low depths they do not act as barriers to ground-water flow. The dug wells of this area range from1.5 to 20 m and dug-cum-bore wells up to 70 m.The yield of the irrigation wells ranges between100 and 150 m3/day whereas in few places it is upto 200 m3/day (CGWB 2007). Most of the wellsin this area are used for irrigation purposes. Thehydraulic conductivity of the study area generallyranges from 0.5 and 18 m/day. Groundwater playsa predominant role in the net irrigated area by con-stituting 57.20%, whereas surface water irrigationaccounts for 38.63% in Nalgonda district (CGWB2007).
2.4 Sampling and instrumentation
An intensive field survey was carried out and nearly240 wells were considered for sampling. The EC(electrical conductivity) (μS/cm) of groundwater
Table 1. Stratigraphic sequence of the study area (after GSI 1995).
Cuddapah Supergroup Massive quartzite
Srisailam Formation Upper shale
Quartzite with shale intercalation
Lower shale with limestone intercalation
Pebbly and gritty quartzite/arenite
Uranium mineralized region- - - - - - - - - - - - - - - - - - - - - - - - - - - Unconformity - - - - - - - - - - - - - - - - - - - - - - - - - - - -
Late Archean/Lower Proterozoic Granite/granitic gneiss with intrusion of
dolorite dykes and quartz veins
Figure 4. Lithologs of few wells.

Spatio-temporal variation of uranium in groundwater 915
Figure 5. Range and median of parameters measured.
Figure 6. Temporal variation in concentration of uranium in groundwater.
was measured in these wells and a representativewell in about every 10 km2 was chosen for regu-lar collection of groundwater samples. In this way,44 wells (figure 1) were chosen for the collectionof representative groundwater samples. Ground-water samples were collected from these wells onceevery two months from March 2008 to January2009. Groundwater level (m), pH and ORP (oxi-dation reduction potential) (mV) were measuredin situ. Groundwater level was recorded by usinga water level indicator (Solinst 101) while pH andORP were measured using Eutech digital portablemeters. The pH meter was calibrated beforehandusing 4.01, 7 and 10.01 buffer solution. Quinhy-drone 86 and 255 standard solutions were used tocalibrate the ORP meter. All the calibrated solu-tions and instruments were procured from EutechInstruments. Groundwater samples were collectedin clean polyethylene bottles of 500 ml capacity.The sampling bottles were soaked in 1:1 diluted
nitric acid solution for 24 hours, washed with dis-tilled water, and were washed again prior to eachsampling with the filtrates of the sample. In thecase of bore wells, the water samples were collectedafter pumping the water for sufficient time so as tocollect the formation water. Five types of fertilis-ers commonly used in this area were also collected.Groundwater samples and fertilisers were analysedfor their uranium concentration using laser fluo-rimeter at Health Physics Unit, Nuclear Fuel Com-plex, Hyderabad, India. Laser fluorimeter worksbasically on the fluorescence of a uranyl complexformed during the addition of inorganic complex-ing regent (sodium pyrophosphate) to the sampleduring the analysis. Nitrogen laser with a wave-length of 337 nm was used as an excitation sourcefor the determination of uranium concentration inthis method (Robbins 1978; Kumar et al 2008).Analysis with a sensitivity of about 0.05 ng/g(Shawky et al 1994) of uranium can be made

916 K Brindha et al
Figure 7. Average uranium concentration (ppb) in groundwater.
without preconcentration or treatment of the sam-ple even in the presence of many potentiallyinterfering species by laser fluorimeter (SintrexUA-3). Present study used the laser fluorimeterfabricated by Laser Applications and Electron-ics Division, R.R. Centre for Advanced Technol-ogy (CAT), Department of Atomic Energy, Indore,India (Rani and Singh 2006; Kumar et al 2008)which has a detection limit of 0.1 ppb. All the ana-lytical reagents used were procured from Merck.Blanks and standards were run simultaneously dur-ing the measurement for ensuring accuracy of theresult. For every 10 samples, three samples wererun in triplicates by varying the concentration ofthe standard and a calibration curve was obtainedto cross check the accuracy of the instrument andto avoid handling errors.
3. Results and discussion
The range of groundwater level and the variousphysical parameters recorded during the samplecollection are shown in figure 5. The statisticalsummary of the uranium concentration obtainedfrom the analysis of groundwater samples duringeach sampling is shown in figure 6.
A total of 236 groundwater samples were col-lected and analysed during this study. The ura-nium concentration during the study period rangedfrom 0.2 to 68 ppb. The average uranium concen-tration recorded in sampling wells and in the reser-voir from March 2008 to January 2009 is shown infigure 7. The average concentration of uranium in
the groundwater samples was 18.5 ppb. The IndianStandards Specifications for drinking water (BIS1993) does not specify any maximum permissiblelimit for uranium. Hence, the USEPA (2003) healthstandard of 30 ppb of uranium in drinking water
Figure 8. Temporal variation in uranium concentration(ppb) and pH.

Spatio-temporal variation of uranium in groundwater 917
Figure 9. Relationship between uranium concentration (ppb) and ORP (mV).
Figure 10. Regional groundwater level (msl in m) and uranium concentration (ppb) in November 2008.
is considered as the limit for this study. Of thetotal 236 groundwater samples collected and ana-lyzed during the duration of this study, 21.6% ofthe groundwater samples had uranium above theUSEPA limit. Uranium concentration generally iscontrolled by the changes in pH and ORP. In this
area the uranium concentration in groundwatervaries as in the case of pH (figure 8). Uranium con-centration in groundwater has to be usually higherin oxidised condition which is evident from figure 9where uranium concentration increases along withORP.

918 K Brindha et al
Figure 11. Temporal variation in groundwater level anduranium concentration.
Studying the spatial and temporal variation helpsus to identify the contribution of various factors forthe excess or low concentration of particular ionsin groundwater. To understand the distribution ofuranium in groundwater of the study area, iso con-centration diagrams were prepared for all months.
Uranium concentration in groundwater of the studyarea varies spatially as well as temporally. Spatialvariation in groundwater level and uranium con-centration of the study area indicate that in gen-eral, the uranium concentration in groundwaterincreases along the flow direction (figure 10). Thecomparison between the uranium concentrationand groundwater level in several wells indicatethat the uranium concentration varies primarilydue to recharge and discharge (figure 11). Therainfall recharge increases the groundwater levelwhich in turn increases the uranium concentrationin groundwater. The recharging water reacts withthe weathered rocks in the unsaturated zone andthe leached out uranium increases uranium concen-tration in groundwater. However, as the rechargecontinues concentration of uranium in groundwaterbegins to reduce due to dilution by comparativelyfresh recharging water.
The granitic rocks which occur in most of thestudy area (figure 4) contain uranium in the rangeof 10.2–116 ppm (Shrivastava et al 1992). Interac-tion between these uranium rich weathered graniticrocks or top soil and groundwater has resulted inincrease in uranium in this study area. The concen-tration of uranium is relatively high in three areas(figure 7). This is probably because of the presenceof comparatively high uranium rich granitic rocksin these places.
In addition to the input derived from uraniumrich rocks, use of phosphatic fertilisers for agri-cultural activity in this area may also add up tothe uranium content in groundwater. Ioannides
Figure 12. Average uranium concentration in groundwater (ppb) in irrigation and domestic wells.

Spatio-temporal variation of uranium in groundwater 919
Table 2. Results of uranium concentrationin fertilizers.
Uranium
Fertiliser (μg/g)
Zinc sulphate 0.95
Potash 0.37
Ammonium sulphate 0.95
Urea 0.40
NPK complex 0.82
et al (1997); Azouazi et al (2001); Papastefanouet al (2006); Roselli et al (2009) have reportedthe natural radioactivity in phosphatic fertilisers.The range of uranium content in the phosphaterock is about 0.005–0.02%. These phosphate rocksserve as a source of phosphatic fertiliser to enhancethe soil productivity in addition to other fertilis-ers. The total uranium resource in phosphate rockis estimated at 9 × 10⁶ metric tonnes of uranium(Ragheb 2008). Hence, the phosphorous fertilisersmanufactured form phosphate rocks may also con-tribute uranium to groundwater in the agriculturalregions. Studies have shown that phosphate fertilis-ers possess uranium concentration ranging from1 mg/kg to 68.5 mg/kg (Kawabata et al 2006).Concentration of fertilisers collected from this areavaried from 0.37 ppb to 0.95 μg/g (table 2). Onan average, about 128 kg/hectare of fertiliser isbeing used in this area (Directorate of Economicsand Statistics 2010). Considering an average ura-nium concentration of 0.7 μg/g of fertiliser willlead to an addition of about 89,600 μg of ura-nium/year/hectare. Hence this also will add upto the uranium concentration in groundwater thatresulted due to uranium rich rocks.
The average uranium concentration in ground-water of irrigation and domestic wells is givenin figure 12. Although the uranium concentrationin groundwater increases along the flow directionthere is a difference between its concentration indomestic wells and irrigation wells. It is seen thatmore number of irrigation wells had uranium con-centration above the permissible limit of 30 ppb.In case of domestic wells only one well had highuranium. Therefore the domestic wells have lessconcentration of uranium and thereby they can beconsidered to be safe for drinking purpose.
4. Conclusion
The uranium concentration in the groundwaterof a part of Nalgonda district ranges from 0.2to 68 ppb with an average of 18.5 ppb. About21.6% of the groundwater samples had uranium
concentration above the limit (30 ppb) set byUSEPA for drinking purpose. The uranium contentin groundwater varies primarily due to rechargeand discharge which would have dissolved orleached the uranium from the weathered soil tothe groundwater zone. The groundwater uraniumconcentration varied similar to the variation inpH. In general, the concentration of uranium ingroundwater is high where the ORP is high.The uranium concentration was above 30 ppb inthree areas during the entire period of study. Inorder to decrease the uranium concentration ingroundwater in this area, artificial groundwaterrecharge techniques such as rainwater harvestingcan be adopted. It is important to continuouslymonitor the groundwater quality in this area tostudy the impact of uranium mineralisation.
Acknowledgements
The authors would like to thank the Board ofResearch in Nuclear Sciences, Department ofAtomic Energy, Government of India for the finan-cial support (Grant No. 2007/36/35). Assistanceprovided by Dr G K Shrivastava, Health PhysicsUnit, Nuclear Fuel Complex, Hyderabad, India forcarrying out uranium analysis is acknowledged.Thanks are also due to Mr R Murugan andMr R Rajesh, Research Fellows, Dept. of Geology,Anna University for their assistance during fieldvisits. First two authors thank the Department ofScience and Technology’s Funds for Improvementin Science and Technology Scheme (Grant No.SR/FST/ESI-106/2010) and University GrantsCommission’s Special Assistance Programme(Grant No. UGC DRS II F.550/10/DRS/2007SAP-1) for the financial support which helped increating facilities to carry out part of this work.
References
Azouazi M, Ouahidi Y, Fakhi S, Andres Y, Ch Abbe Jand Benmansour M 2001 Natural radioactivity in phos-phates, phosphogypsum and natural waters in Morocco;J. Environ. Radioact. 54 231–242.
Babu M N S, Somashekar R K, Kumar A, Shivanna K,Krishnamurthy V and Eappen K P 2008 Concentrationof uranium levels in groundwater; Int. J. Environ. Sci.Technol. 5(2) 263–266.
BIS 1993 Indian Standard Drinking Water–Specification(First Revision) IS 10500: 1991; pp. 1–8.
Brindha K, Rajesh R, Murugan R and Elango L 2011 Fluo-ride contamination in groundwater in parts of Nalgondadistrict Andhra Pradesh India; Environ. Monit. Assess.172 481–492.
CGWB (Central Ground Water Board) 2007 Ground waterinformation Nalgonda district, Andhra Pradesh; availablefrom: http://cgwbgovin/District Profile/AP/Nalgonda.pdf.

920 K Brindha et al
Directorate of Economics and Statistics 2010 All-India Con-sumption of Department of Fertilisers in Terms of Nutri-ents (N, P, K), Agriculture and Cooperation, Ministryof Agriculture, Government of India, available from:http://dacnet.nic.in/eands/latest 2006.htm.
Garshasbi H, Diba J K, Jahanbakhshian M H, Asghari S Kand Heravi G H 2005 Measurements of natural uraniumconcentration in Caspian Sea and Persian Gulf water bylaser flourimetric method; Iranian Journal of RadiationResearch 3(3) 123–127.
GSI (Geological Survey of India) 1995 Geology and mineralsmap of Nalgonda district, Andhra Pradesh, India.
Ioannides K G, Mertzimekis T J, Parachristodoulou C Aand Tzialla C E 1997 Measurements of natural radioac-tivity in phosphate fertilisers; The Science of the TotalEnvironment 196 63–67.
Kawabata Y, Yamamoto M, Aparin V, Ko S, Shiraishi K,Nagai M and Katayama Y 2006 Uranium pollution ofwater in the western part of Uzbekistan; J. Radioanal.Nucl. Chem. 270(1) 137–141.
Kumar S A, Shenoy N S, Pandey S, Sounderajan S andVenkateswaran G 2008 Direct determination of uraniumin seawater by laser fluorimetry; Talanta 77 422–426.
Papastefanou C, Stoulos S, Ioannidou A and ManolopouloM 2006 The application of phosphogypsum in agricul-ture and the radiological impact; J. Environ. Radioact.89 188–198.
Ragheb M 2008 Uranium resources in phosphate rocks, avail-able from: https://netfilesuiucedu/mragheb/www/NPRE%20402%20ME%20405%20Nuclear%20Power%20Engineering/Uranium%20Resources%20in%20Phosphate%20Rocks.pdf.
Ramola R C, Singh S and Virk H S 1988 Uranium andradon estimation in some water samples from Himalayas;Nuclear Tracks and Radiation Measurement 15(1–4)791–793.
Rani A and Singh S 2006 Analysis of uranium in drink-ing water samples using laser induced fluorimetry; HealthPhysics 91(2) 101–107.
Reddy K V K, Reddy B S, Reddy M S, Reddy Ch G,Reddy P Y and Reddy K R 2003 Baseline studies ofradon/thoron concentration levels in and around theLambapur and Peddagattu areas in Nalgonda district,Andhra Pradesh, India; Radiat. Meas. 36 419–423.
Rengarajan R, Sarin M M and Krishnaswami S 2006 Dis-solved uranium and 234U/238U in the Yamuna andthe Chambal rivers, India; Aquatic Geochemistry 1273–101.
Robbins J C 1978 Field technique for the measurementof uranium in natural waters; CIM Bulletin 71(793)61–67.
Roselli C, Desideri D and Meli M A 2009 Radiological char-acterization of phosphate fertilisers: Comparison betweenalpha and gamma spectroscopy; Microchem. J. 91(2)181–186.
Sarin M M, Krishnaswami S, Sharma K K and Trivedi J R1992 Uranium isotopes and radium in the Bhagirathi–Alaknanda river system: Evidence for high uranium mobi-lization in the Himalaya; Curr. Sci. 62(12) 801–805.
Shawky S, Ibrahiem N, Farouk A and Ghods A 1994 Laserfluorimetric determination of uranium in environmentalsamples from Nile delta and adjacent region; AppliedRadiation and Isotopes 45(11) 1079–1084.
Shrivastava V K, Parthasarathy T N and Sinha K K1992 Geochemical study of uraniferous granites fromLambapur area, Nalgonda District, Andhra Pradesh,India; Exploration and Research for Atomic Minerals 541–52.
Singh B, Singh G, Sandhu A S and Singh S 1999 Uraniumestimation in water samples collected from some areas ofHimachal Pradesh, India; Radiat. Meas. 31 683–685.
Singh J, Singh L and Singh G 1995 High U-contents observedin some drinking waters of Punjab, India; J. Environ.Radioact. 26 217–222.
Singh J, Singh H, Singh S and Bajwa B S 2009 Estimation ofuranium and radon concentration in some drinking watersamples of Upper Siwaliks, India; Environ. Monit. Assess.154 15–22.
Singh R V, Sinha R M, Bisht B S and Banerjee D C2002 Hydrogeochemical exploration for unconformity-related uranium mineralization: Example from Palnadusub-basin Cuddapah Basin, Andhra Pradesh, India;J. Geochem. Explor. 76 71–92.
Singhal R K, Joshi S N and Hedge A G 2004 Associationof uranium with colloidal and suspended particulate mat-ter in Arabian Sea near the west coast of Maharashtra(India); J. Radioanal. Nucl. Chem. 2 263–267.
Sinha R M, Shrivastava V K, Sarma G V G andParthasarathy T N 1995 Geological favourability forunconformity-related Uranium deposits in northern partsof the Cuddapah Basin: Evidences from Lambapur ura-nium occurrences, Andhra Pradesh, India; Explorationand Research for Atomic Minerals 8 111–126.
USEPA (United States Environmental Protection Agency)2003 Current drinking water standards; Ground waterand drinking water protection agency: Report preparedby Wade Miller Associates, pp. 1–12.
Zamora M L, Tracy B L, Zielinski J M, Meyerhof D P andMossf M A 1998 Chronic ingestion of uranium in drinkingwater: A study of kidney bioeffects in humans; Toxicol.Sci. 43 68–77.
MS received 26 October 2010; revised 1 April 2011; accepted 26 May 2011


